HAL Id: hal-01358770 https://hal.inria.fr/hal-01358770 Submitted on 1 Sep 2016 HAL is a multi-disciplinary open access archive for the deposit and dissemination of sci- entific research documents, whether they are pub- lished or not. The documents may come from teaching and research institutions in France or abroad, or from public or private research centers. L’archive ouverte pluridisciplinaire HAL, est destinée au dépôt et à la diffusion de documents scientifiques de niveau recherche, publiés ou non, émanant des établissements d’enseignement et de recherche français ou étrangers, des laboratoires publics ou privés. Noise Floor Removal via Phase Correction of Complex Diffusion-Weighted Images: Influence on DTI and q-space Metrics Marco Pizzolato, Rutger Fick, Timothé Boutelier, Rachid Deriche To cite this version: Marco Pizzolato, Rutger Fick, Timothé Boutelier, Rachid Deriche. Noise Floor Removal via Phase Correction of Complex Diffusion-Weighted Images: Influence on DTI and q-space Metrics. Computa- tional Diffusion MRI, Oct 2016, Athens, Greece. hal-01358770

Welcome message from author
This document is posted to help you gain knowledge. Please leave a comment to let me know what you think about it! Share it to your friends and learn new things together.
Transcript

HAL Id: hal-01358770https://hal.inria.fr/hal-01358770
Submitted on 1 Sep 2016
HAL is a multi-disciplinary open accessarchive for the deposit and dissemination of sci-entific research documents, whether they are pub-lished or not. The documents may come fromteaching and research institutions in France orabroad, or from public or private research centers.
L’archive ouverte pluridisciplinaire HAL, estdestinée au dépôt et à la diffusion de documentsscientifiques de niveau recherche, publiés ou non,émanant des établissements d’enseignement et derecherche français ou étrangers, des laboratoirespublics ou privés.
Noise Floor Removal via Phase Correction of ComplexDiffusion-Weighted Images: Influence on DTI and
q-space MetricsMarco Pizzolato, Rutger Fick, Timothé Boutelier, Rachid Deriche
To cite this version:Marco Pizzolato, Rutger Fick, Timothé Boutelier, Rachid Deriche. Noise Floor Removal via PhaseCorrection of Complex Diffusion-Weighted Images: Influence on DTI and q-space Metrics. Computa-tional Diffusion MRI, Oct 2016, Athens, Greece. �hal-01358770�

Noise Floor Removal via Phase Correction ofComplex Diffusion-Weighted Images:Influence on DTI and q-space Metrics
Marco Pizzolato1?, Rutger Fick1, Timothe Boutelier2, and Rachid Deriche1
1 Universite Cote d’Azur, Inria, France2 Olea Medical, La Ciotat, France
Abstract. The non-Gaussian noise distribution in magnitude Diffusion-Weighted Images (DWIs) can severely affect the estimation and recon-struction of the true diffusion signal. As a consequence, also the estimateddiffusion metrics can be biased. We study the effect of phase correction,a procedure that re-establishes the Gaussianity of the noise distributionin DWIs by taking into account the corresponding phase images. Wequantify the debiasing effects of phase correction in terms of diffusionsignal estimation and calculated metrics. We perform in silico experi-ments based on a MGH Human Connectome Project dataset and on adigital phantom, accounting for different acquisition schemes, diffusion-weightings, signal to noise ratios, and for metrics based on DiffusionTensor Imaging and on Mean Apparent Propagator Magnetic ResonanceImaging, i.e. q-space metrics. We show that phase correction is still achallenge, but also an effective tool to debias the estimation of diffusionsignal and metrics from DWIs, especially at high b-values.
1 Introduction
Diffusion-Weighted Magnetic Resonance Imaging (DW-MRI) is inherently a lowSignal to Noise Ratio (SNR) technique [1]. More diffusion weighting – globallyencoded by a larger b-value – leads to lower signal intensities and consequentlyto a poorer SNR. In such a low SNR regime, the magnitude of the complexDW signal can be dominated by a bias, namely noise floor, which is due tothe non-Gaussian distribution of the noise. This generally falls within the non-central χ2 family, depending on the adopted MR acquisition strategy (numberof coils, multi-coil reconstruction, acceleration, etc.) [2]. However, some diffusionMRI techniques require the acquisition of Diffusion-Weighted Images (DWIs) atrelatively high b-values [3–5], where the Noise Floor affects the signal estimationand consequent parameter calculations. A strategy for removing the Noise Floorfrom the magnitude DWIs, is phase correction [6]. This method consists onestimating the true phase from the complex DWIs to transfer the image content– which is split between real (rDWI) and imaginary (iDWI) parts – into the
? The author expresses his thanks to Olea Medical and the Provence-Alpes-Coted’Azur (PACA) Regional Council for providing grant and support for this work.

2 Marco Pizzolato, Rutger Fick, Timothe Boutelier, and Rachid Deriche
real part only, such that the rDWIs contain the signal corrupted by Gaussiandistributed noise. In this work, we quantify the influence of phase correction interms of unbiased signal estimation and reconstruction. In the latter case, wefocus on two popular signal-driven representations of the diffusion process, suchas Diffusion Tensor Imaging (DTI) [7] and Mean Apparent Propagator MagneticResonance Imaging (MAP) [3], and we quantify the effects of phase correction onthe corresponding scalar parameters. We present in silico experiments based ona MGH Human Connectome Project (HCP) dataset and on a digital phantom.
The noise floor causes a signal overestimation that is more important at highb-values and when diffusion is less restricted, i.e. when the signal is low. Thisintroduces a bias that leads to the distortion of the estimated quantitative diffu-sion metrics, such as the underestimation of the Apparent Diffusion Coefficient(ADC) in DTI [1]. This affects the principal diffusivity (PD), i.e. the ampli-tude of the tensor’s eigenvector aligned to the least restricted direction, whichis underestimated. Similar considerations hold for other DTI metrics, such asthe fractional anisotropy (FA). Moreover, since MAP signal reconstruction typ-ically requires high b-values, we also expect some of the derived q-space metricsto be biased. In this scenario, phase correction is a promising tool to calculateunbiased metrics.
Phase correction exploits the phase images associated with the magnitudeDWIs. Some advantages of using the phase of the DW signal, to perform areconstruction directly in the complex domain, have been previously reported[8], while assuming phase coherence among q-space samples. However, in actualDW-MRI acquisitions the phase images are subject shot-wise variations thatare mainly dominated by movements, cardiac pulsation, blood circulation orfield inhomogeneity. Thus, coherent phase contributions related to the diffusionprocess, e.g., asymmetries due to tissue configurations or experimental setups [9–11], are hardly observable and are not explicitly accounted in noise floor removalvia phase correction.
Recent phase corrections for noise floor removal consist on filtering the realand imaginary images, i.e. the rDWI and iDWI, to obtain a low-frequency ver-sion of the DWI’s phase, which is used to complex-rotate the rDWI and iDWIsuch that former contains the signal plus Gaussian distributed noise, and thelatter only noise (which will be discarded). The filtering is typically performedvia a convolution procedure [12, 13] or total variation [14]. However, the cor-rect estimation of the low-frequency phase depends on the correct choice ofthe convolution kernel (and its size) or regularization parameter. Therefore, theeffectiveness of phase correction on signal debiasing and diffusion parametersestimation, such as DTI and MAP metrics, needs to be assessed.
In this work, we implement a phase correction procedure based on total vari-ation [14]. We first apply it to in silico complex DWIs, created by processing aHCP dataset, in order to assess the effectiveness of the phase correction in a re-alistic scenario, for different diffusion weightings, i.e. b-values, and SNRs. At thesame time, we assess the amount of noise floor bias in typical magnitude DWIs(|DWI|) – based on signal probability distribution metrics – and the correspond-

Noise Floor Removal Using the Phase 3
ing improvement after phase correction. In second place, we asses the influenceof phase correction on DTI and q-space metrics. Particularly, we apply phasecorrection to complex DWIs produced by using a modified version of Phantomαs[15], while accounting for different total variation regularizations and for typicalacquisition setups, i.e. single-shell at b ∈ {1000, 2000, 3000} s/mm2 (DTI), andmulti-shell (DTI, MAP).
2 Methods
In this section, we describe the implemented phase correction procedure, andillustrate the generation of the data used for the experiments, such as the acqui-sition setup, the generation of a synthetic phase, and the SNR convention.
The phase correction takes into account a complex DWI
DWIxy = rDWIxy + j · iDWIxy (1)
where x and y represent the pixel coordinates, r and i indicate the real and
imaginary parts, and j is the imaginary unit. If DWIxy is a good estimation ofthe phase, then the phase-corrected image is obtained via complex rotation
DWIpcxy = |DWI|xyej
(DWIxy− DWIxy
)(2)
where DWIxy and |DWI|xy are the original noisy phase and magnitude. Thereal part of the phase-corrected complex DWI, <(DWIpcxy), contains the signal(tissue contrast) plus Gaussian distributed noise, whereas the imaginary part,=(DWIpcxy), only contains noise. Henceforth, any classical diffusion modeling andreconstruction taking into account additive Gaussian noise can be performed on<(DWIpcxy), where the noise floor is absent.
The effectiveness of phase correction clearly depends on the quality of thephase estimation. In this work we implement a total variation method, knownto better preserve discontinuities in the images [14]. Particularly, for each imageu0 ∈ {rDWIxy, iDWIxy} defined on coordinates x ∈ X, y ∈ Y , we find the imageu such that it is the minimizer of
infuλ
∫X,Y
(u0 − u)2dxdy +
∫X,Y
|∇u|dxdy (3)
where λ is the regularization parameter expressing the attachment to the data.The estimates of rDWIxy and iDWIxy obtained with eq. (3) are then used to
compute DWIxy to perform the complex rotation in eq. (2).
2.1 Simulation and Diffusion Signal Reconstruction
The complex DWIs have in all cases been created by generating a syntheticphase image, Φxy, associated with a magnitude image, Mxy. The phase images
4 Marco Pizzolato, Rutger Fick, Timothe Boutelier, and Rachid Deriche
are created in order to mimic the outcome of subject movements. We assumea bi-dimensional sinusoidal wave oriented along the direction v = (vx, vy) withfrequencies fx, fy and initial shifts φx, φy
Φ(x, y) = π · sin(
2πvx||v||
fxx
wx+ φx + 2π
vy||v||
fyy
wy+ φy
)(4)
where wx, wy are scale parameters, i.e. in this case the width of the image alongthe corresponding direction (wx = card(X), wy = card(Y )). Eventually, con-stant phase patches are added. Assuming to have the ground-truth images ofmagnitude Mxy and phase Φxy, the latter resulting from eq. (4), then
rDWIxy = Mxy · cos(Φxy) + ηrxy
iDWIxy = Mxy · sin(Φxy) + ηixy(5)
where ηrxy, ηixy ∈ N(0, σ2). The noise is added with a value of σ calculated accord-
ing to the DW-MRI convention σ =(card[ρ(X × Y )]−1
∑x,y ρ(x, y)M b=0
xy
)/SNR0,
where SNR0 is defined on the magnitude image without diffusion weightingM b=0
xy , and ρ ∈ {0, 1} is a mask defined on the pairs (x, y), e.g., a mask of thetissue-related signal like the brain mask. The Rician magnitude |DWI|xy and thephase DWIxy are calculated from the real and imaginary parts in eq. (5).
The data used for the experiments is a HCP brain dataset corrected foreddy currents where we selected DWIs of interest for b ∈ [0, 1000, 3000] s/mm2.Other experiments use Phantomαs [15] to obtain the ground-truth magnitudeimages, Mxy. This software requires input with a geometrical description oftissue structures and fiber bundles. We used the well known geometry producedfor the HARDI reconstruction challenge 20133. We generated DWIs for a 3-shellsscheme with b ∈ {1000, 2000, 3000} s/mm2, 51 samples per shell, with samplesuniformly distributed within and among shells [16].
The phase-corrected real DWIs can contain negative values: the noise is zero-mean Gaussian and the noise floor is absent. Therefore, the DTI reconstructionis performed non-linearly forcing signal positivity, and MAP is performed withLaplacian regularization imposing positivity on the recovered Ensemble AveragePropagator [17].
3 Experiments and Results
We perform three experiments with two objectives: first, quantifying the effectof phase correction on signal debiasing, by processing real data from a HCPdataset; second, assessing the debiasing on diffusion metrics, calculated with DTIand MAP reconstructions, on a digital dataset generated for typical scenariossuch as DTI at b-value 1000, 2000, 3000 s/mm2 and DTI and MAP multi-shell.
3 http://hardi.epfl.ch/static/events/2013_ISBI/,https://github.com/ecaruyer/phantomas/blob/master/examples/isbi_challenge_2013.txt

Noise Floor Removal Using the Phase 5
SNR Magnitude PC Real
SNR Magnitude PC Real
1.50.4 6.5
8.61.4 49
low (1.4) medium (8.6) high (49)
low (0.4) medium (1.5) high (6.5)
b=
10
00
*b=
30
00
*
Fig. 1. The signal contrast and distributions for synthetic complex DWIs, at b =1000, 3000 s/mm2, created from clustering a real HCP dataset (SNR0 = 10). In therectangular frames from left to right: the SNR map, the Rician magnitude (Mg) andthe phase-corrected estimated real image (Re). Below, the histograms of the signalintensities corresponding to the circles with low, medium, and high signal/SNR, forMg (green) and Re (blue). Background SNR: 21.5 for b = 1000 s/mm2 and 3.2 forb = 1000 s/mm2. *: s/mm2.
In the first experiment, we clustered a HCP dataset to obtain typical signalvalues at b-value 1000 and 3000 s/mm2. Particularly, for each b-value we ap-plied k-means to divide the signal of the DWIs – accounting for all the gradientdirections – into 4 clusters. We used the centroid of each cluster to define respec-tively background, low, medium, and high mean signal values. Based on these,we created a ground-truth synthetic magnitude image – Mxy in eq. (5) – com-posed of three circles each containing, from left to right, low, medium and highsignal respectively. Outside the circles we added background signal. A syntheticphase was generated and the noisy complex DWI was created. After calculatingthe average b = 0 signal (S(0)avg = 758 a.u.) in the HCP dataset, noise wasadded as in eq. (5) in low SNR regime: SNR0 = 10. Figure 1 shows, for each b-value, the noisy magnitude |DWI|xy and the estimated phase-corrected real part<(DWIpcxy) (λ set to 0.75 after visual inspection). In addition, an effective SNRmap is present along with histograms of the magnitude and phase-corrected realsignals for each circle. We conclude that in both cases the phase-corrected realimage presents more contrast with the background compared to the magnitude.This is more evident at low SNR values – left circle at b = 1000 s/mm2, left andcentral circles at b = 3000 s/mm2 – that are more likely with high b-values. The<(DWIpcxy) shows darker colors, i.e. lower signal intensities, as it is highlightedby the histograms: the magnitude (green line) has a Rician distribution for low

6 Marco Pizzolato, Rutger Fick, Timothe Boutelier, and Rachid Deriche
SNRs (typically below SNR = 5) whereas the estimated real part (blue line)always shows a Gaussian distribution, thus including negative signal intensities.We point out that since this is an experiment grounded on real data, the centroidof the clusters – especially at low signal values – are based on Rician data andmight overestimate the actual (noise-free) ones. This means that the Rician biasin histograms (green line) might be an underestimation of the true one.
In the second experiment, we use the HCP dataset to create a mean ground-truth magnitude DWI, Mxy, in order to quantify the Rician bias, i.e. the distancefrom Gaussianity. We calculate the mean b = 0 image S(0)xy, for a slice of inter-est, by averaging the 40 non-diffusion-weighted images in the dataset. Since theSNR is very high, the averaging procedure is not biased. Then, we select all theDWIs corresponding to b = 1000 s/mm2 and perform DTI to obtain the meandiffusivity map, MDxy. At this point, we obtain a ground-truth magnitude DWIat any b-value by extrapolating with Mxy = S(b)xy = S(0)xy exp(−b ·MDxy).Although we assume Gaussian isotropic diffusion, this phantom represents anaverage description of a magnitude DWI. After generating a synthetic phaseimage, as described in section 2, we calculate the noisy complex DWI, for eachb-value, as in eq. (5). Figure 2 shows the b = 0 magnitude and the phase usedfor the phantom (left column). We then calculate the Rician magnitude |DWI|xyand the phase-corrected real part <(DWIpcxy) (λ = 0.75). Additionally, we cal-
culate a magnitude image with Gaussian distributed noise |DWI|Gxy, by addingGaussian noise (with the same SNR0) to Mxy. This will be used as referencefor Gaussianity measures. We generate 1000 noise occurrences and calculate, foreach pixel of the images, the signal intensities histograms of the signal intensi-ties (as in fig. 1). For each pixel we generate 3 histograms, each related to theRician |DWI|xy, the phase-corrected <(DWIpcxy) and the Gaussian |DWI|Gxy. Thehypothesis is that, for each pixel, the phase-corrected signal distribution shouldbe closer to that of the Gaussian magnitude image than the Rician magnitudeone. As a distance from Gaussianity, we use the discrete Hellinger distance [18]
H(P,Q) =1√2||√P −
√Q||2 (6)
where P and Q are two discrete probability distributions, and 0 ≤ H(P,Q) ≤ 1where 1 means maximum distance. In columns 2 to 4, fig. 2 shows the Hellingerdistance maps from the Gaussian magnitude, for the Rician magnitude (firstrow) and the phase-corrected real part (second row), at b-value 1000, 2000 and3000 s/mm2. We see that the Rician magnitude shows more bias (higher H),especially in regions where MD is high. As expected, at higher b-values (fromleft to right) the signal intensity is lower and the bias occurs in a larger numberof pixels. Conversely, the phase-corrected real part does not show a clear change.
In the third experiment, we quantify the bias on the estimated DTI and MAPmetrics for the Rician magnitude, and we quantify the debiasing power of phasecorrection by looking at the change in the distributions of such metrics com-pared to the Gaussian noise case. We generate complex DWIs with Phantomαs[15] as described in section 2. For each gradient direction g = (gx, gy, gz), the

Noise Floor Removal Using the Phase 7
Magnit
ude
PC
Real
b=1000* b=2000* b=3000*
Magn.
b=
0Phase
Phantom Hellinger distance from Gaussian distributed DWI
Fig. 2. The distance from Gaussianity of complex DWIs obtained by processing a HCPdataset and a synthetic phase image. In the first column the b = 0 magnitude imageobtained from real data, and the generated phase. In the columns from the second tothe fourth, the distance from the Gaussianity measured with eq. (6) for the Ricianmagnitude (first row) and the phase-corrected real part (second row), at different b-values (columns). Contrarily to the case of the Rician magnitude, the distance fromGaussianity remains visually unchanged as the diffusion-weighting increases. *: s/mm2.
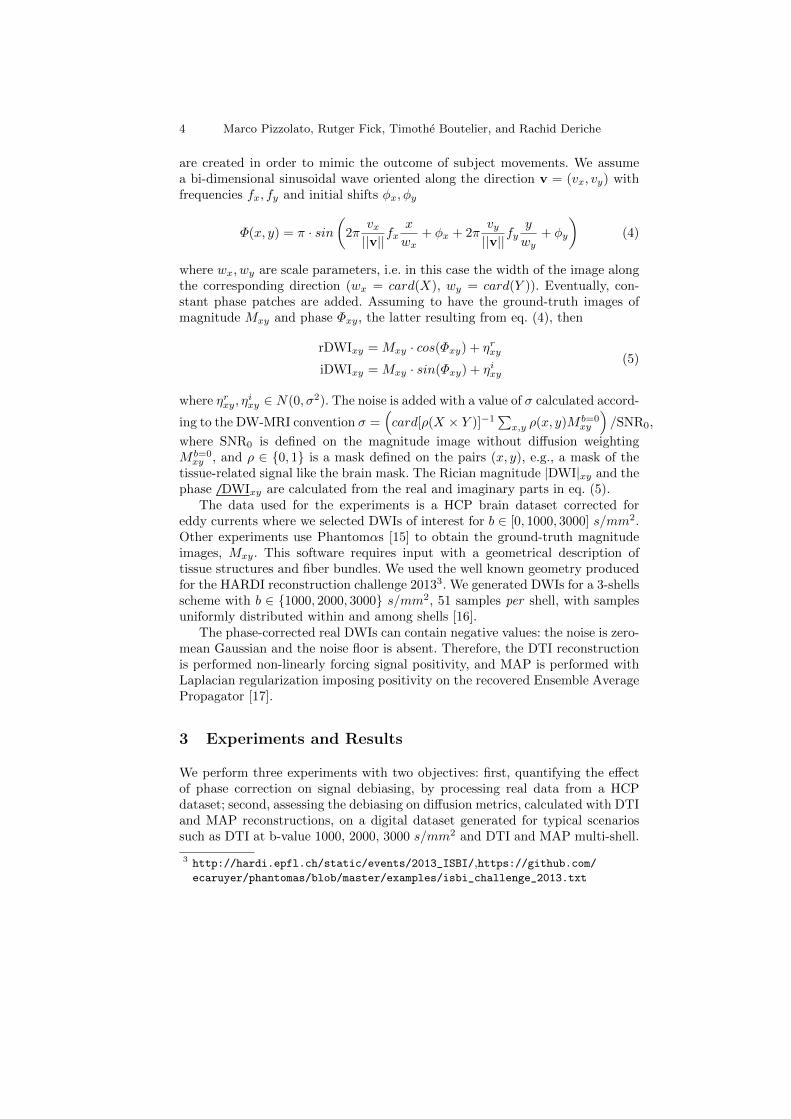
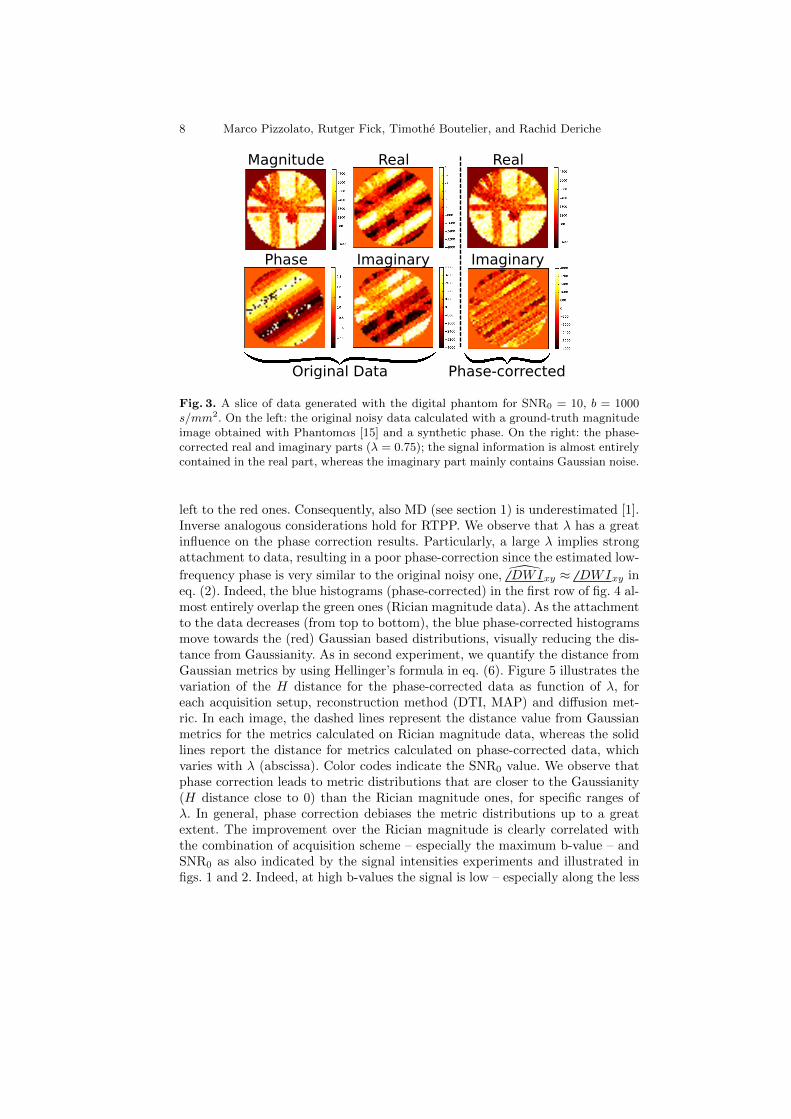
synthetic phase image is oriented towards v = (gx, gy) (see eq. (4)) with con-stant phase shifts between slices (along the z direction). Figure 3 shows theoriginal noisy data (Rician magnitude, phase, noisy real and imaginary parts)and the one after phase correction for a reference slice (b = 1000 s/mm2). Foreach SNR0 ∈ {10, 20, 30} we generate the Rician magnitude data and, as for thesecond experiment, the Gaussian DWI image to be used as reference. In thisexperiment we also investigate the effect of the regularization parameter λ ofthe total variation filtering in eq. (3). Therefore, for each SNR0 we generate sixphase-corrected datasets, for λ ∈ {0.25, 0.5, 0.75, 1, 2, 5}. For each combinationof SNR0 and type of data – Rician, Gaussian and the six phase corrections – wefit DTI with single-shell scheme at b-value 1000, 2000 and 3000 s/mm2, and DTIand MAP with multi-shell scheme. For DTI, we calculate the mean diffusivity(MD), the principal diffusivity (PD), and the fractional anisotropy (FA). Wecalculate q-space metrics based on closed formulas derived for MAP. These arethe return to origin (RTOP), axis (RTAP) and plane (RTPP) probabilities [3],the mean squared displacement (MSD) and the q-space inverse variance (QIV)[17]. We create a mask of voxels within fibers, based on the noise-free dataset, byconsidering only the voxels where RTOP ∈ [0.5e6, 0.7e6] (range chosen based onvisual inspection). For each value of λ and for each calculated DTI and q-spacemetric, we compute the probability distribution inside the mask for the Rician,Gaussian and phase corrected data. Figure 4 illustrates the influence of the reg-ularization parameter λ (decreasing along the rows) on the recovered metricprobability distribution. The figure shows the Gaussian (red line), Rician (greenline) and phase-corrected (blue line) probability distributions (SNR0 = 10) ofPD (DTI at 1000, 2000 s/mm2) and RTPP (MAP). The results confirm the un-derestimation of PD that increases with the b-value, i.e. the green histograms are
8 Marco Pizzolato, Rutger Fick, Timothe Boutelier, and Rachid Deriche
Magnitude
Phase
Real
Imaginary
Real
Imaginary
Original Data Phase-corrected
Fig. 3. A slice of data generated with the digital phantom for SNR0 = 10, b = 1000s/mm2. On the left: the original noisy data calculated with a ground-truth magnitudeimage obtained with Phantomαs [15] and a synthetic phase. On the right: the phase-corrected real and imaginary parts (λ = 0.75); the signal information is almost entirelycontained in the real part, whereas the imaginary part mainly contains Gaussian noise.
left to the red ones. Consequently, also MD (see section 1) is underestimated [1].Inverse analogous considerations hold for RTPP. We observe that λ has a greatinfluence on the phase correction results. Particularly, a large λ implies strongattachment to data, resulting in a poor phase-correction since the estimated low-
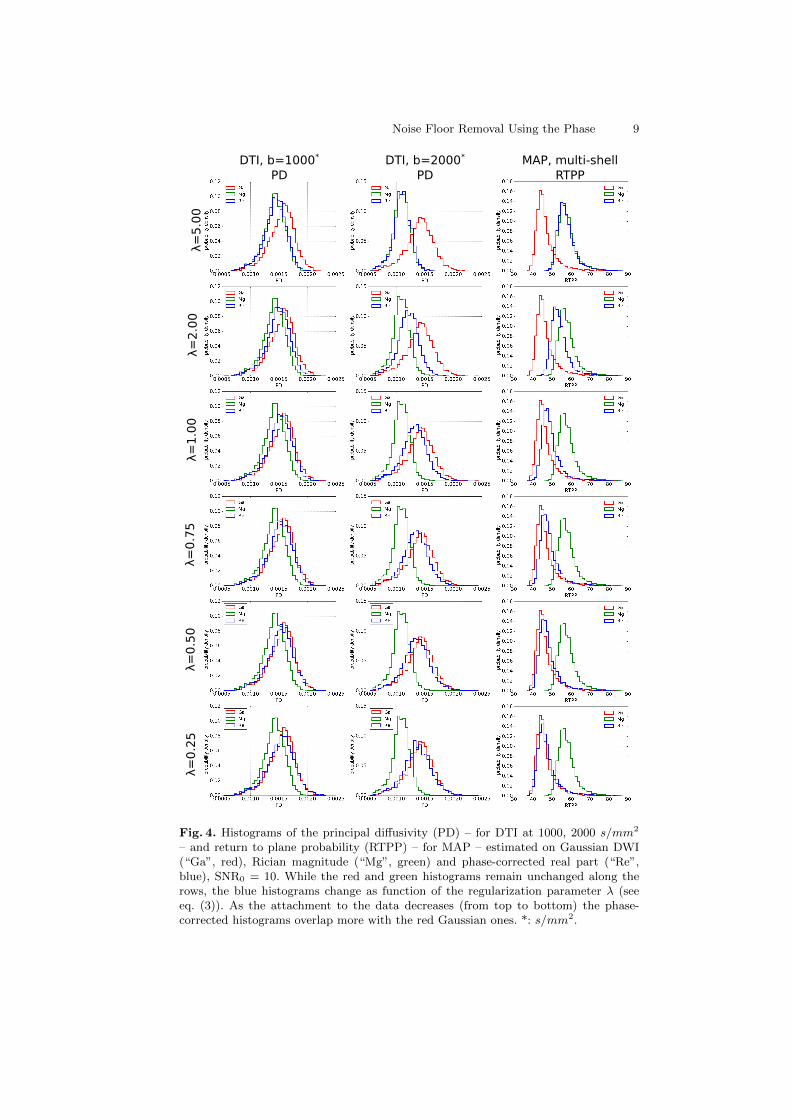
frequency phase is very similar to the original noisy one, DWIxy ≈ DWIxy ineq. (2). Indeed, the blue histograms (phase-corrected) in the first row of fig. 4 al-most entirely overlap the green ones (Rician magnitude data). As the attachmentto the data decreases (from top to bottom), the blue phase-corrected histogramsmove towards the (red) Gaussian based distributions, visually reducing the dis-tance from Gaussianity. As in second experiment, we quantify the distance fromGaussian metrics by using Hellinger’s formula in eq. (6). Figure 5 illustrates thevariation of the H distance for the phase-corrected data as function of λ, foreach acquisition setup, reconstruction method (DTI, MAP) and diffusion met-ric. In each image, the dashed lines represent the distance value from Gaussianmetrics for the metrics calculated on Rician magnitude data, whereas the solidlines report the distance for metrics calculated on phase-corrected data, whichvaries with λ (abscissa). Color codes indicate the SNR0 value. We observe thatphase correction leads to metric distributions that are closer to the Gaussianity(H distance close to 0) than the Rician magnitude ones, for specific ranges ofλ. In general, phase correction debiases the metric distributions up to a greatextent. The improvement over the Rician magnitude is clearly correlated withthe combination of acquisition scheme – especially the maximum b-value – andSNR0 as also indicated by the signal intensities experiments and illustrated infigs. 1 and 2. Indeed, at high b-values the signal is low – especially along the less
Noise Floor Removal Using the Phase 9
λ=
5.0
0λ=
2.0
0λ=
1.0
0λ=
0.7
5λ=
0.5
0λ=
0.2
5
DTI, b=1000*
PDDTI, b=2000*
PDMAP, multi-shell
RTPP
Fig. 4. Histograms of the principal diffusivity (PD) – for DTI at 1000, 2000 s/mm2
– and return to plane probability (RTPP) – for MAP – estimated on Gaussian DWI(“Ga”, red), Rician magnitude (“Mg”, green) and phase-corrected real part (“Re”,blue), SNR0 = 10. While the red and green histograms remain unchanged along therows, the blue histograms change as function of the regularization parameter λ (seeeq. (3)). As the attachment to the data decreases (from top to bottom) the phase-corrected histograms overlap more with the red Gaussian ones. *: s/mm2.
10 Marco Pizzolato, Rutger Fick, Timothe Boutelier, and Rachid Deriche
DTI, b
=1
00
0*
MD PD FA
DTI, b
=2
00
0*
Legend
RTOP
QIVMSD
RTAP RTPP
DTI, b
=3
00
0*
DTI, m
ult
i-sh
ell
MA
P,
mu
lti-
shell
Hellinger distance between parameter distributions w.r.t. Gaussian noise case
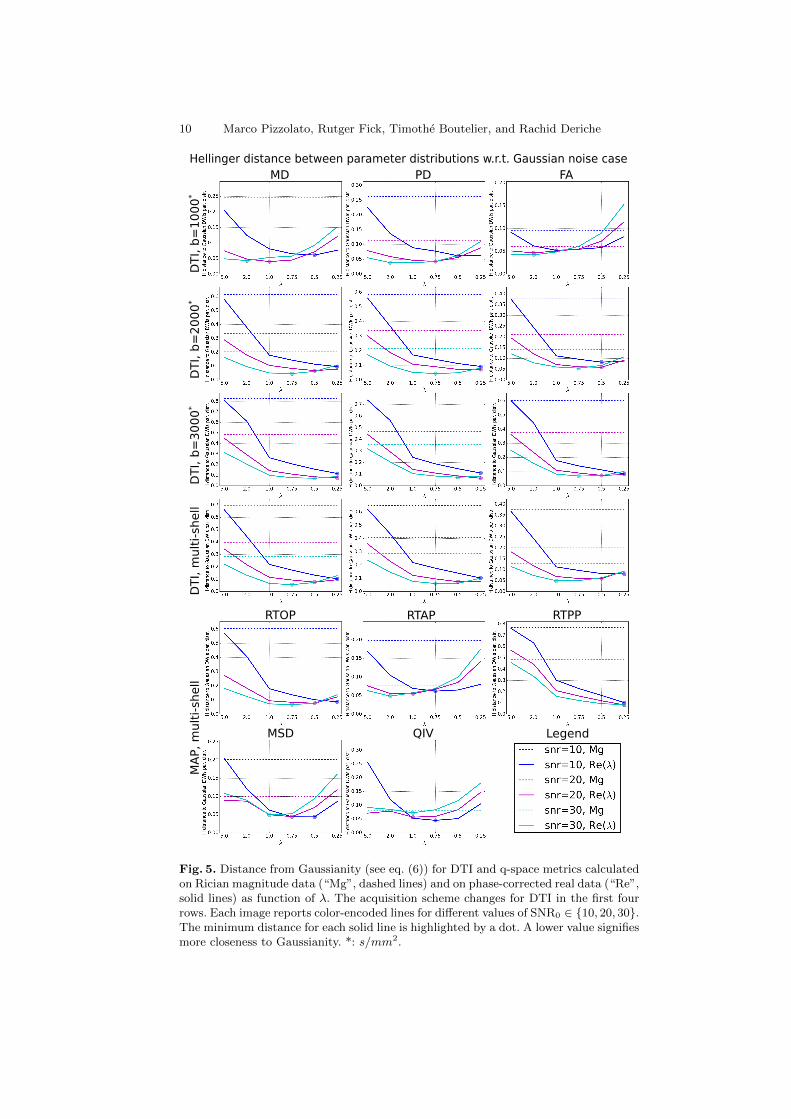
Fig. 5. Distance from Gaussianity (see eq. (6)) for DTI and q-space metrics calculatedon Rician magnitude data (“Mg”, dashed lines) and on phase-corrected real data (“Re”,solid lines) as function of λ. The acquisition scheme changes for DTI in the first fourrows. Each image reports color-encoded lines for different values of SNR0 ∈ {10, 20, 30}.The minimum distance for each solid line is highlighted by a dot. A lower value signifiesmore closeness to Gaussianity. *: s/mm2.
Noise Floor Removal Using the Phase 11
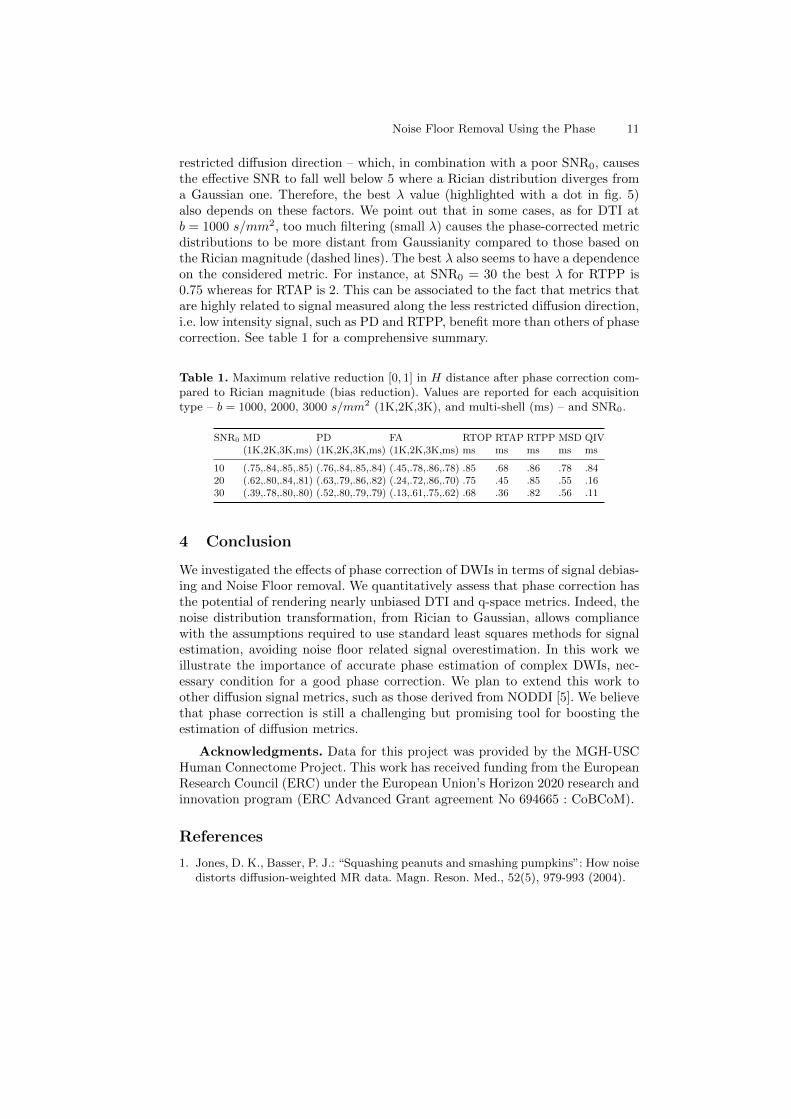
restricted diffusion direction – which, in combination with a poor SNR0, causesthe effective SNR to fall well below 5 where a Rician distribution diverges froma Gaussian one. Therefore, the best λ value (highlighted with a dot in fig. 5)also depends on these factors. We point out that in some cases, as for DTI atb = 1000 s/mm2, too much filtering (small λ) causes the phase-corrected metricdistributions to be more distant from Gaussianity compared to those based onthe Rician magnitude (dashed lines). The best λ also seems to have a dependenceon the considered metric. For instance, at SNR0 = 30 the best λ for RTPP is0.75 whereas for RTAP is 2. This can be associated to the fact that metrics thatare highly related to signal measured along the less restricted diffusion direction,i.e. low intensity signal, such as PD and RTPP, benefit more than others of phasecorrection. See table 1 for a comprehensive summary.
Table 1. Maximum relative reduction [0, 1] in H distance after phase correction com-pared to Rician magnitude (bias reduction). Values are reported for each acquisitiontype – b = 1000, 2000, 3000 s/mm2 (1K,2K,3K), and multi-shell (ms) – and SNR0.
SNR0 MD PD FA RTOP RTAP RTPP MSD QIV(1K,2K,3K,ms) (1K,2K,3K,ms) (1K,2K,3K,ms) ms ms ms ms ms
10 (.75,.84,.85,.85) (.76,.84,.85,.84) (.45,.78,.86,.78) .85 .68 .86 .78 .8420 (.62,.80,.84,.81) (.63,.79,.86,.82) (.24,.72,.86,.70) .75 .45 .85 .55 .1630 (.39,.78,.80,.80) (.52,.80,.79,.79) (.13,.61,.75,.62) .68 .36 .82 .56 .11
4 Conclusion
We investigated the effects of phase correction of DWIs in terms of signal debias-ing and Noise Floor removal. We quantitatively assess that phase correction hasthe potential of rendering nearly unbiased DTI and q-space metrics. Indeed, thenoise distribution transformation, from Rician to Gaussian, allows compliancewith the assumptions required to use standard least squares methods for signalestimation, avoiding noise floor related signal overestimation. In this work weillustrate the importance of accurate phase estimation of complex DWIs, nec-essary condition for a good phase correction. We plan to extend this work toother diffusion signal metrics, such as those derived from NODDI [5]. We believethat phase correction is still a challenging but promising tool for boosting theestimation of diffusion metrics.
Acknowledgments. Data for this project was provided by the MGH-USCHuman Connectome Project. This work has received funding from the EuropeanResearch Council (ERC) under the European Union’s Horizon 2020 research andinnovation program (ERC Advanced Grant agreement No 694665 : CoBCoM).
References
1. Jones, D. K., Basser, P. J.: “Squashing peanuts and smashing pumpkins”: How noisedistorts diffusion-weighted MR data. Magn. Reson. Med., 52(5), 979-993 (2004).

12 Marco Pizzolato, Rutger Fick, Timothe Boutelier, and Rachid Deriche
2. Aja-Fernandez, S., Tristan-Vega, A.: A review on statistical noise models for Mag-netic Resonance Imaging. LPI, ETSI Telecomunicacion, Universidad de Valladolid,Spain, Tech. Rep (2013).
3. Ozarslan, E., Koay, C. G., Shepherd, T. M., Komlosh, M. E., Irfanoglu, M. O.,Pierpaoli, C., Basser, P. J.: Mean apparent propagator (MAP) MRI: a novel diffusionimaging method for mapping tissue microstructure. NeuroImage, 78, 16–32 (2013).
4. Alexander, D.C.: A general framework for experiment design in diffusion MRI andits application in measuring direct tissue-microstructure features. MRN, 60(2), 439–448 (2008).
5. Zhang, H., Schneider, T., Wheeler-Kingshott, C.A., Alexander, D.C.: NODDI: prac-tical in vivo neurite orientation dispersion and density imaging of the human brain.Neuroimage, 61(4), 1000–1016 (2012).
6. Bernstein, M. A., Thomasson, D. M., Perman, W. H.: Improved detectability in lowsignal-to-noise ratio magnetic resonance images by means of a phase-corrected realreconstruction. Medical Physics, 16(5), 813-817 (1989).
7. Basser, P. J., Mattiello, J., LeBihan, D.: MR diffusion tensor spectroscopy andimaging. Biophysical journal, 66(1), 259–267 (1994).
8. Pizzolato, M., Ghosh, A., Boutelier, T., Deriche, R.: Magnitude and complex baseddiffusion signal reconstruction. In CDMRI, 127–140 (2014).
9. Liu, C., Bammer, R., Acar, B., Moseley, M. E.: Characterizing non-gaussian dif-fusion by using generalized diffusion tensors. Magn. Reson. Med., 51(5), 924-937(2004).
10. Pizzolato, M., Wassermann, D., Boutelier, T., Deriche, R.: Exploiting the Phase inDiffusion MRI for Microstructure Recovery: Towards Axonal Tortuosity via Asym-metric Diffusion Processes. In MICCAI (2015).
11. Pizzolato, M., Wassermann, D., Duval, T., Campbell, J. S., Boutelier, T., Cohen-Adad, J., Deriche, R.: A Temperature Phantom to Probe the Ensemble AveragePropagator Asymmetry: An In-Silico Study. In CDMRI, pp. 183–194 (2016).
12. Prah, D. E., Paulson, E. S., Nencka, A. S., Schmainda, K. M.: A simple method forrectified noise floor suppression: Phase-corrected real data reconstruction with ap-plication to diffusion-weighted imaging. Magn. Reson. Med., 64(2), 418–429 (2010).
13. Sprenger, T., Sperl, J. I., Fernandez, B., Haase, A., Menzel, M. I.: Real valueddiffusion-weighted imaging using decorrelated phase filtering. Magn. Reson. Med.,(2016).
14. Eichner, C., Cauley, S. F., Cohen-Adad, J., Moller, H. E., Turner, R., Setsompop,K., Wald, L. L.: Real diffusion-weighted MRI enabling true signal averaging andincreased diffusion contrast. NeuroImage, 122, 373–384 (2015).
15. Caruyer, E., Daducci, A., Descoteaux, M., Houde, J.-C., Thiran J.-P., Verma,R.: Phantomas: a flexible software library to simulate diffusion MR phantoms.ISMRM14, (2014).
16. Caruyer, E., Lenglet, C., Sapiro, G., Deriche, R.: Design of multishell samplingschemes with uniform coverage in diffusion MRI. Magn. Reson. Med., 69(6), 1534–1540 (2013).
17. Fick, R. H., Wassermann, D., Caruyer, E., Deriche, R.: MAPL: Tissue microstruc-ture estimation using Laplacian-regularized MAP-MRI and its application to HCPdata. NeuroImage, 134, 365–385 (2016).
18. Hellinger, E.: Neue Begrundung der Theorie quadratischer Formen von un-endlichvielen Veranderlichen. J Reine Angew Math (1909).
Related Documents