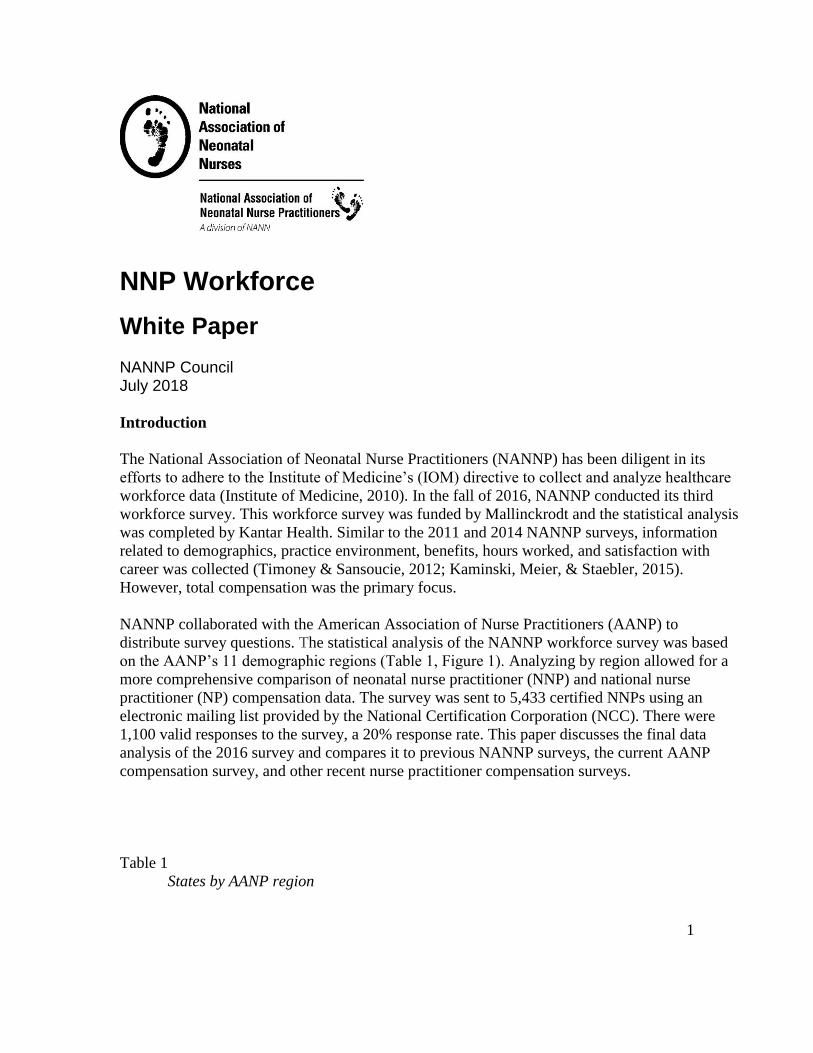
1 NNP Workforce White Paper NANNP Council July 2018 Introduction The National Association of Neonatal Nurse Practitioners (NANNP) has been diligent in its efforts to adhere to the Institute of Medicine’s (IOM) directive to collect and analyze healthcare workforce data (Institute of Medicine, 2010). In the fall of 2016, NANNP conducted its third workforce survey. This workforce survey was funded by Mallinckrodt and the statistical analysis was completed by Kantar Health. Similar to the 2011 and 2014 NANNP surveys, information related to demographics, practice environment, benefits, hours worked, and satisfaction with career was collected (Timoney & Sansoucie, 2012; Kaminski, Meier, & Staebler, 2015). However, total compensation was the primary focus. NANNP collaborated with the American Association of Nurse Practitioners (AANP) to distribute survey questions. The statistical analysis of the NANNP workforce survey was based on the AANP’s 11 demographic regions (Table 1, Figure 1). Analyzing by region allowed for a more comprehensive comparison of neonatal nurse practitioner (NNP) and national nurse practitioner (NP) compensation data. The survey was sent to 5,433 certified NNPs using an electronic mailing list provided by the National Certification Corporation (NCC). There were 1,100 valid responses to the survey, a 20% response rate. This paper discusses the final data analysis of the 2016 survey and compares it to previous NANNP surveys, the current AANP compensation survey, and other recent nurse practitioner compensation surveys. Table 1 States by AANP region

Welcome message from author
This document is posted to help you gain knowledge. Please leave a comment to let me know what you think about it! Share it to your friends and learn new things together.
Transcript
1
NNP Workforce
White Paper
NANNP Council July 2018
Introduction
The National Association of Neonatal Nurse Practitioners (NANNP) has been diligent in its
efforts to adhere to the Institute of Medicine’s (IOM) directive to collect and analyze healthcare
workforce data (Institute of Medicine, 2010). In the fall of 2016, NANNP conducted its third
workforce survey. This workforce survey was funded by Mallinckrodt and the statistical analysis
was completed by Kantar Health. Similar to the 2011 and 2014 NANNP surveys, information
related to demographics, practice environment, benefits, hours worked, and satisfaction with
career was collected (Timoney & Sansoucie, 2012; Kaminski, Meier, & Staebler, 2015).
However, total compensation was the primary focus.
NANNP collaborated with the American Association of Nurse Practitioners (AANP) to
distribute survey questions. The statistical analysis of the NANNP workforce survey was based
on the AANP’s 11 demographic regions (Table 1, Figure 1). Analyzing by region allowed for a
more comprehensive comparison of neonatal nurse practitioner (NNP) and national nurse
practitioner (NP) compensation data. The survey was sent to 5,433 certified NNPs using an
electronic mailing list provided by the National Certification Corporation (NCC). There were
1,100 valid responses to the survey, a 20% response rate. This paper discusses the final data
analysis of the 2016 survey and compares it to previous NANNP surveys, the current AANP
compensation survey, and other recent nurse practitioner compensation surveys.
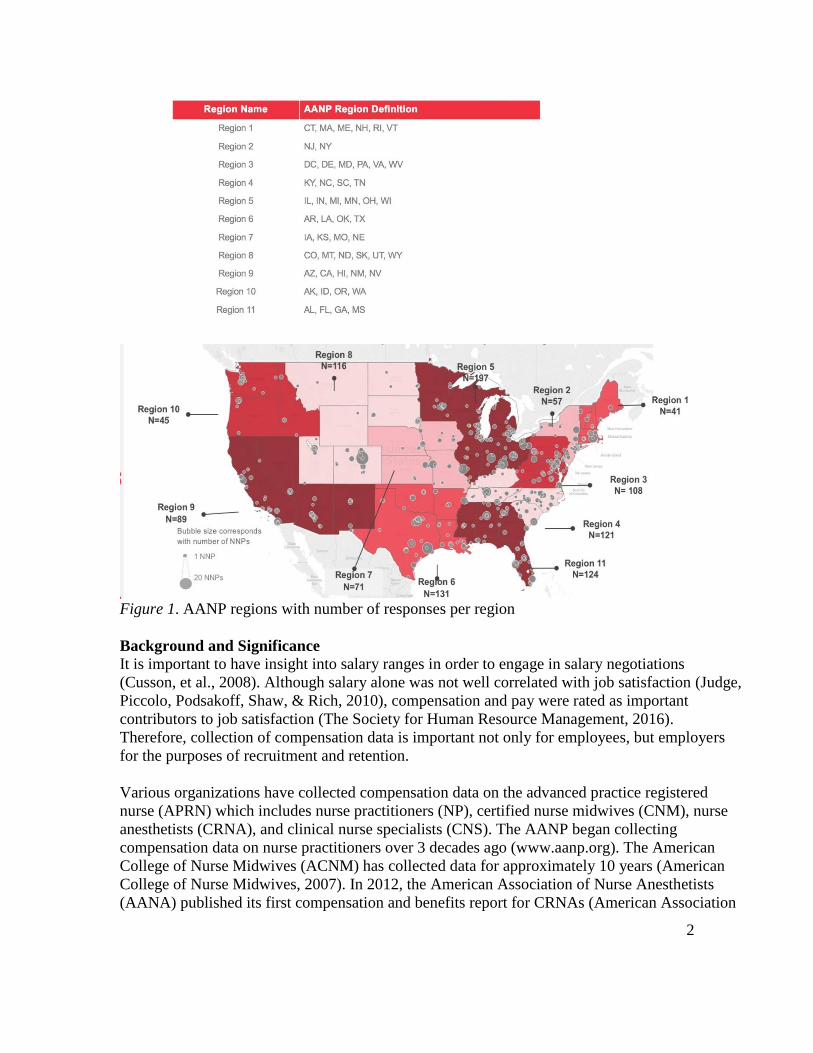
Table 1
States by AANP region
2
Figure 1. AANP regions with number of responses per region
Background and Significance
It is important to have insight into salary ranges in order to engage in salary negotiations
(Cusson, et al., 2008). Although salary alone was not well correlated with job satisfaction (Judge,
Piccolo, Podsakoff, Shaw, & Rich, 2010), compensation and pay were rated as important
contributors to job satisfaction (The Society for Human Resource Management, 2016).
Therefore, collection of compensation data is important not only for employees, but employers
for the purposes of recruitment and retention.
Various organizations have collected compensation data on the advanced practice registered
nurse (APRN) which includes nurse practitioners (NP), certified nurse midwives (CNM), nurse
anesthetists (CRNA), and clinical nurse specialists (CNS). The AANP began collecting
compensation data on nurse practitioners over 3 decades ago (www.aanp.org). The American
College of Nurse Midwives (ACNM) has collected data for approximately 10 years (American
College of Nurse Midwives, 2007). In 2012, the American Association of Nurse Anesthetists
(AANA) published its first compensation and benefits report for CRNAs (American Association
3
of Nurse Anesthetists, 2012). The Clinical Advisor began collecting nurse practitioner and
physician assistant salary data on a yearly basis in 2011 (Clinical Advisor). Medscape published
its first nurse salary report in 2015, which included APRN salary information (Peckham, 2015).
In addition, the Bureau of Labor Statistics provides information about nurse practitioner salaries
on an annual basis.
Despite the data collected from the organizations listed above, there has been limited collection
of NNP specific salary and benefits data. In 2004, AANP emailed a workforce survey to
approximately 24,000 NPs with a response rate of 69% (Goolsby, 2005). Of the respondents,
2.3% were NNPs, which was the approximate percentage of NNPs compared to all NPs
nationally. The 2004 survey included income and benefits data. The mean salary of surveyed
NNPs was reported to be $82,000 which was higher than the mean annual income of $74,000 for
other surveyed NPs (Goolsby, 2006). However, the AANP survey did not differentiate benefits
among the APRN specialties. Follow-up AANP surveys in 2009, 2011, and 2015, reported that
NNP salaries were $102,000, $108,000, and $113,000 respectively which ranged between $3,000
and $15,000 more than other APRNs (AANP.org).
In 2008, Cusson, et al, published the results of a survey of 271 NNPs who attended the Annual
Neonatal Advanced Practice Forum held in Washington, D.C, in 2006. This was the first
workforce survey that focused only on NNPs. The survey included questions about practice
environment, salary, and billing practices and did not include benefits information. The average
mean salary of a NNP was $86,700 which was approximately $10,000 more than the mean salary
for other NPs (Cusson, et al., 2008).
The 2016 NANNP workforce survey focused primarily on NNP compensation, with specific
questions about salary and benefits. There also were questions about NNPs’ satisfaction with
their career and compensation. In order to gain an even deeper understanding of what was
important to practicing NNPs, the survey included questions about what NNPs valued in their
compensation package and their work environment. Findings from this survey provide
employees and employers with a starting point to have better informed negotiations about salary
and total compensation.
In summary, various organizations have collected nurse practitioner salary and benefit
information, however there has not been a comprehensive survey of NNP compensation and no
data regarding NNPs value in a compensation package has been collected.
Demographics
The number of licensed NPs in the United States has more than doubled over the last decade
from 107,000 to 234,000 (American Association of Nurse Practitioners, 2017). Of this,
approximately 5,433 of the 234,000 are NNPs, according to the NCC. Based on the 1,100
responses to the 2016 NANNP workforce survey, the average age of NNPs in the U.S. is 49 and
has not changed since the 2014 workforce survey (Kaminski, Meier, & Staebler, 2015). This is
an increase from the average age of 46 based on the 2006 survey of NNPs (Cusson, et al., 2008).
4
The number of female NNPs has remained steady at 95– 97% since 2006. The majority of
respondents had a master’s degree (78%), and 10% had a doctor of nursing practice (DNP) or a
doctor of philosophy (PhD). Similar to the 2014 NNP workforce survey, the largest number of
respondents were in the South with 41%, while 27% lived in the Midwest, 20% in the West, and
14% in the Northeast. The average number of years in practice was 14.3 with 58%of respondents
having more than 11 years in practice, a percentage that was relatively unchanged from the 2011
workforce survey (Timoney & Sansoucie, 2012).
Seventy-two percent of surveyed NNPs were salaried. According to the NNP administrators who
responded to the 2016 NANNP workforce survey, 73% of NNPs work full-time (35 or more
hours per week). However, 82% of NNPs reported that they worked 35 hours per week or more.
This was true across all age groups. Approximately half of the NNPs responded that they work
more than 40 hours per week. In 2014, the discrepancy between expected hours and actual
worked hours was 22%, whereas in the 2016 survey it was 33% (Kaminski, Meier, & Staebler,
2015) (Figure 3). Ninety percent of NNPs responded that alignment of expected hours to work
with actual hours worked was important or extremely important. Eighty-seven percent of NNPs
reported that 75% or more of their time was spent in direct patient care. This was consistent
across all age groups. Eighty-nine percent of surveyed NNPs work in urban areas and 41% of
those work in areas with populations greater than 1.5 million.
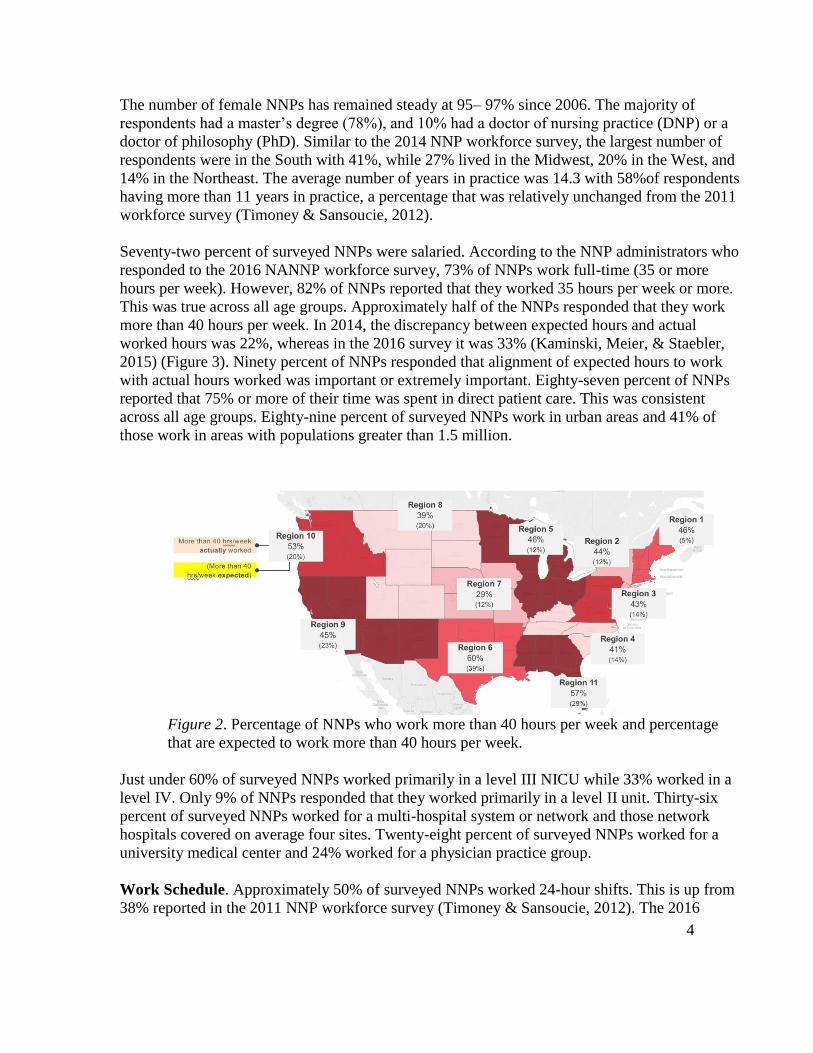
Figure 2. Percentage of NNPs who work more than 40 hours per week and percentage
that are expected to work more than 40 hours per week.
Just under 60% of surveyed NNPs worked primarily in a level III NICU while 33% worked in a
level IV. Only 9% of NNPs responded that they worked primarily in a level II unit. Thirty-six
percent of surveyed NNPs worked for a multi-hospital system or network and those network
hospitals covered on average four sites. Twenty-eight percent of surveyed NNPs worked for a
university medical center and 24% worked for a physician practice group.
Work Schedule. Approximately 50% of surveyed NNPs worked 24-hour shifts. This is up from
38% reported in the 2011 NNP workforce survey (Timoney & Sansoucie, 2012). The 2016
5
NANNP workforce survey reported that 24-hour shifts were more common in level I, II, and III
NICUs. Forty-three percent of NNPs surveyed worked day/night rotations and only 16% work
day shift only. Sixty percent of NNPs who worked in level IV NICUs reported working rotating
shifts. Sixty-three percent of NNPs reported that they worked their preferred shifts. Of note, 42%
of NNPs responded that they preferred the day shift. Another 40% responded that they preferred
24-hour shifts. Individuals 35 to 49 years old preferred 24-hours shifts over day shift shifts.
However, among NNPs who were 60-years old or greater, the preference was the day shift.
NP Demographics. There are some similarities and dissimilarities between NNPs and other
NPs. The average age of a clinically practicing NP was 49 years (American Association of Nurse
Practitioners, 2017) while the age of acute care pediatric nurse practitioners, with whom NNPs
might be most commonly compared, was 40 in 2014 (Reuter-Rice, Madden, & Roerster, 2016).
Only 7% of NPs were certified in acute care while 89% were certified in primary care (American
Association of Nurse Practitioners, 2017). The majority of NPs were female (92%) (American
Association of Nurse Practitioners, 2016) with the exception of certified registered nurse
anethetists (CRNA); only 57% of CRNAs were female (Stokowski, Yox, McBride, & Berry,
2017).
According to the AANP 2017 National Nurse Practitioner Survey, 98% of NPs had graduate
degrees and in 2016 and 13% reported having a doctoral degree (American Association of Nurse
Practitioners, 2016). The average number of years in practice was 11, up from 8.3 years in 2015
(American Association of Nurse Practitioners, 2017; American Association of Nurse
Practitioners, 2015). Approximately 82% of NPs worked full-time (36 hours or greater) and 81%
were salaried (Stokowski, Yox, McBride, & Berry, 2017). Of the 19% of NPs who were paid
hourly, 39% worked overtime (Stokowski, Yox, McBride, & Berry, 2017). Only 17% of NPs
worked in an inpatient hospital setting. The highest paid NPs worked in inpatient and urban
settings (Stokowski, Yox, McBride, & Berry, 2017). Forty percent of NPs worked in urban areas
and 14% worked in rural areas (Stokowski, Yox, McBride, & Berry, 2017).
The average age of NNPs surveyed in the 2016 NANNP workforce survey was 49 years old.
Ninety-six percent of NNPs surveyed are female. Half of NNPs surveyed work 24-hour shifts
and 43% work rotating shifts. Eighty-two percent of NNPs reported that they were expected to
work 35 hours or more each week. Eighty percent have a master’s degree. Seventy-two percent
were salaried. The average number of years of experience was 14.3.
Compensation and Benefits
Total compensation is complex, making it difficult to compare one employer’s compensation
package to another. A total compensation package may include paid time off (PTO), professional
leave, healthcare benefits, tuition assistance or continuing education funding, professional fees,
liabilty insurance, yearly bonus, and several other benefits. Therefore, when employees compare
one employer to another, what they value as an employee may significantly influence their
choice of employer. Some employers pay a lower salary, but provide more continuing education
funding; whereas other employers pay a higher salary, but provide no continuing education
funds. Furthermore, cost of living can make a difference in the total worth of a salary in one city
6
or state compared to another (CNN Money, n.d.). For example, a person who earns $105,000 in
Tampa, FL, would need to earn $204,000 in San Francisco, CA, to maintain the same standard of
living (CNN Money, n.d.).
Salary. In the 2016 NNANP workforce survey, seven hundred and ninety-seven NNPs
responded that they were salaried employees. The 2016 NANNP workforce survey revealed that
the mean base salary for an NNP was approximately $116,000 based on full-time hours of 35
hours per week or greater. Forty-seven percent of salaried NNPs reported earning $110,000 or
more. Survey respondents reported a mean hourly pay for full-time salaried NNPs of $55 per
hour. Three-hundred thirty-three of the NNPs reported they were paid hourly and their mean
wage was slightly less than $60 per hour. When salaried and hourly earners were combined, the
average hourly pay was $56 per hour. The 2016 NANNP workforce survey did not report a
statistically significant diffence in hourly pay between males and females, levels of education,
primary practice site, or shift coverage. There was a reported difference in pay based on years of
experience, region of the country, type of employer, and whether or not an NNP was in an
administrative role.
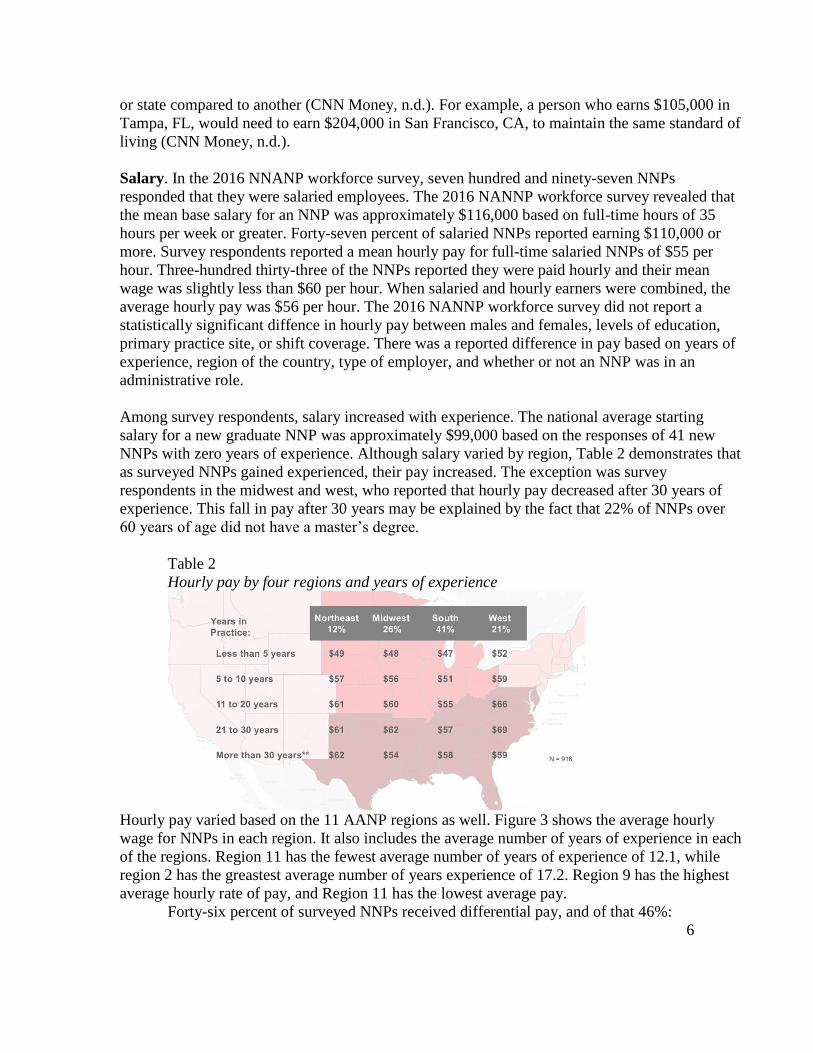
Among survey respondents, salary increased with experience. The national average starting
salary for a new graduate NNP was approximately $99,000 based on the responses of 41 new
NNPs with zero years of experience. Although salary varied by region, Table 2 demonstrates that
as surveyed NNPs gained experienced, their pay increased. The exception was survey
respondents in the midwest and west, who reported that hourly pay decreased after 30 years of
experience. This fall in pay after 30 years may be explained by the fact that 22% of NNPs over
60 years of age did not have a master’s degree.
Table 2
Hourly pay by four regions and years of experience
Hourly pay varied based on the 11 AANP regions as well. Figure 3 shows the average hourly
wage for NNPs in each region. It also includes the average number of years of experience in each
of the regions. Region 11 has the fewest average number of years of experience of 12.1, while
region 2 has the greastest average number of years experience of 17.2. Region 9 has the highest
average hourly rate of pay, and Region 11 has the lowest average pay.
Forty-six percent of surveyed NNPs received differential pay, and of that 46%:
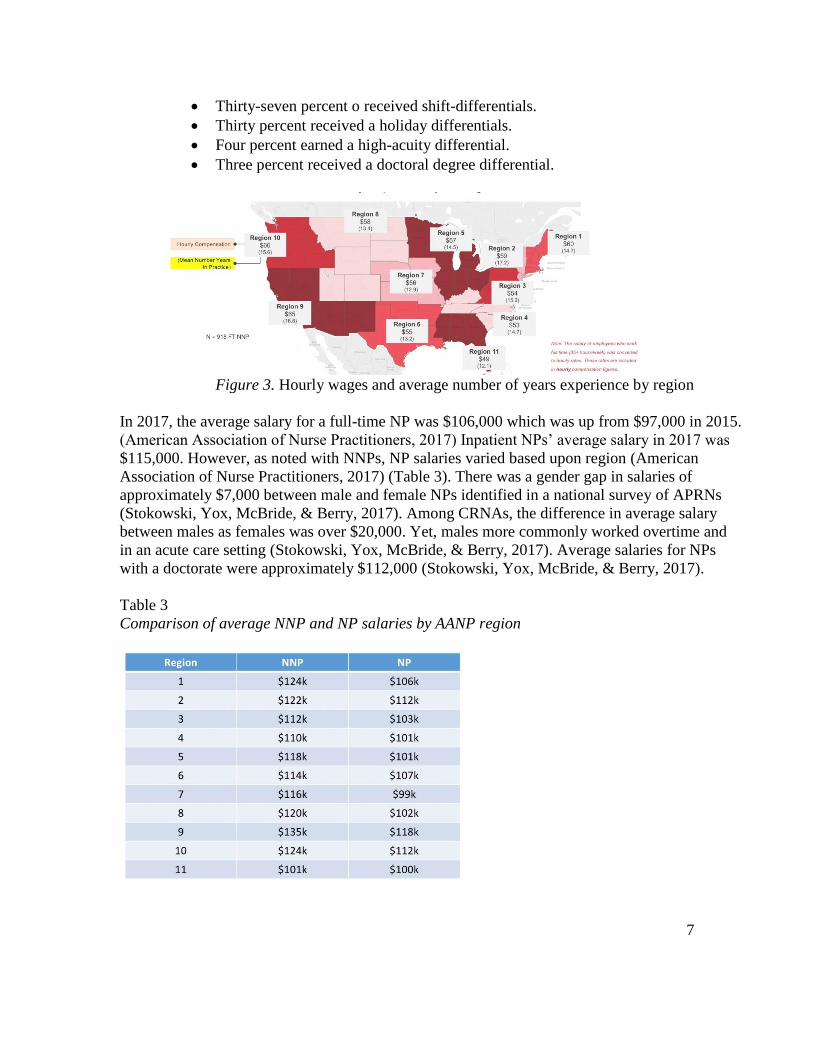
7
Thirty-seven percent o received shift-differentials.
Thirty percent received a holiday differentials.
Four percent earned a high-acuity differential.
Three percent received a doctoral degree differential.
Figure 3. Hourly wages and average number of years experience by region
In 2017, the average salary for a full-time NP was $106,000 which was up from $97,000 in 2015.
(American Association of Nurse Practitioners, 2017) Inpatient NPs’ average salary in 2017 was
$115,000. However, as noted with NNPs, NP salaries varied based upon region (American
Association of Nurse Practitioners, 2017) (Table 3). There was a gender gap in salaries of
approximately $7,000 between male and female NPs identified in a national survey of APRNs
(Stokowski, Yox, McBride, & Berry, 2017). Among CRNAs, the difference in average salary
between males as females was over $20,000. Yet, males more commonly worked overtime and
in an acute care setting (Stokowski, Yox, McBride, & Berry, 2017). Average salaries for NPs
with a doctorate were approximately $112,000 (Stokowski, Yox, McBride, & Berry, 2017).
Table 3
Comparison of average NNP and NP salaries by AANP region
8
Salary by Type of Employer. NNP salaries reported in the 2016 NANNP workforce survey
varied based on employer. The average salary for an NNP employed by a physician group was
the lowest at $110,000 per year. NNPs who worked for an independent or community hospital
had an average salary of $116,000. NNPs employed by multi-system networks or university
centers earned an average salary of $118,000. The highest paid NNPs were employed by “other”
and earned an average salary of $124,000. However, the sample size for this group was only 37
individuals and the category of “other” was undefined. Twenty-five administrators shared their
income data and their average hourly pay was $62, approximately four dollars more per hour
than non-administrative NNPs.
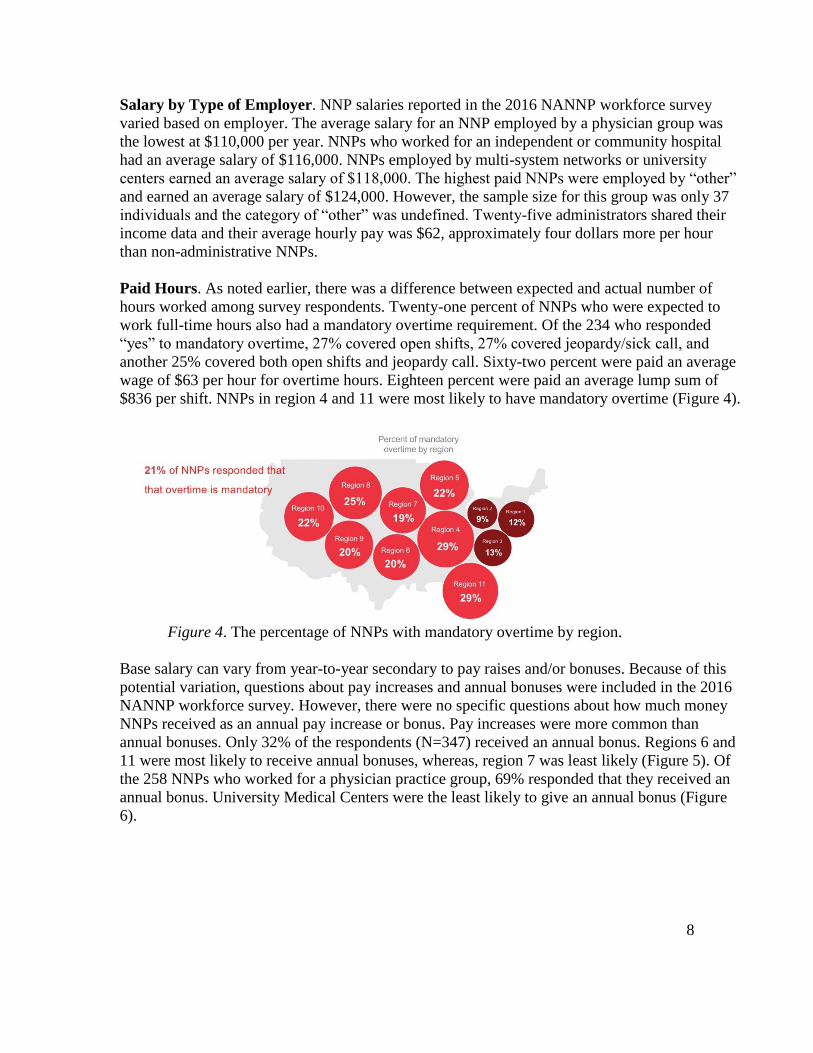
Paid Hours. As noted earlier, there was a difference between expected and actual number of
hours worked among survey respondents. Twenty-one percent of NNPs who were expected to
work full-time hours also had a mandatory overtime requirement. Of the 234 who responded
“yes” to mandatory overtime, 27% covered open shifts, 27% covered jeopardy/sick call, and
another 25% covered both open shifts and jeopardy call. Sixty-two percent were paid an average
wage of $63 per hour for overtime hours. Eighteen percent were paid an average lump sum of
$836 per shift. NNPs in region 4 and 11 were most likely to have mandatory overtime (Figure 4).
Figure 4. The percentage of NNPs with mandatory overtime by region.
Base salary can vary from year-to-year secondary to pay raises and/or bonuses. Because of this
potential variation, questions about pay increases and annual bonuses were included in the 2016
NANNP workforce survey. However, there were no specific questions about how much money
NNPs received as an annual pay increase or bonus. Pay increases were more common than
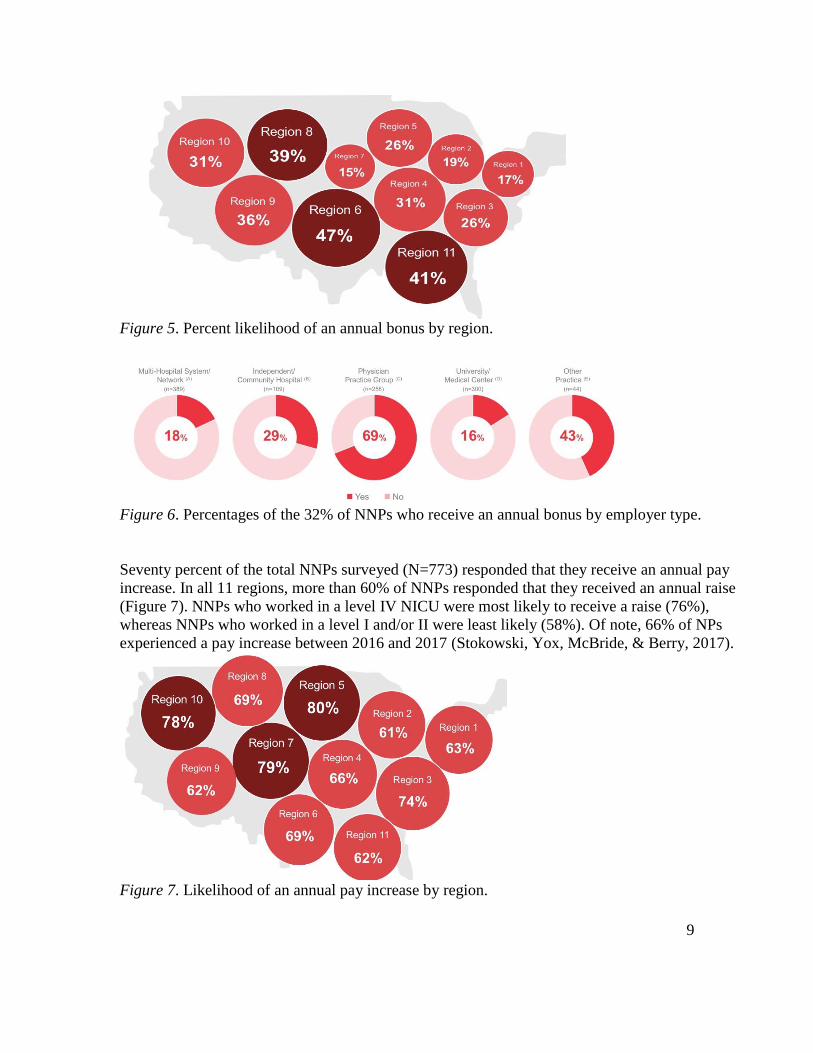
annual bonuses. Only 32% of the respondents (N=347) received an annual bonus. Regions 6 and
11 were most likely to receive annual bonuses, whereas, region 7 was least likely (Figure 5). Of
the 258 NNPs who worked for a physician practice group, 69% responded that they received an
annual bonus. University Medical Centers were the least likely to give an annual bonus (Figure
6).
9
Figure 5. Percent likelihood of an annual bonus by region.
Figure 6. Percentages of the 32% of NNPs who receive an annual bonus by employer type.
Seventy percent of the total NNPs surveyed (N=773) responded that they receive an annual pay
increase. In all 11 regions, more than 60% of NNPs responded that they received an annual raise
(Figure 7). NNPs who worked in a level IV NICU were most likely to receive a raise (76%),
whereas NNPs who worked in a level I and/or II were least likely (58%). Of note, 66% of NPs
experienced a pay increase between 2016 and 2017 (Stokowski, Yox, McBride, & Berry, 2017).
Figure 7. Likelihood of an annual pay increase by region.

10
The factors that contributed to an annual bonus versus a pay increase tended to be different.
Among 2016 NANNP workforce survey respondents, merit increases and market or cost of
living increases were the most common types of annual pay increases. However, annual bonuses
were based on more variables: quality metrics, merit, productivity, revenue volume units, and
practice volume. Among NPs, only 20% responded that their compensation included an
incentive, productivity, or pay for performance program (Stokowski, Yox, McBride, & Berry,
2017).
Figure 8. According to NNP respondents, factors that influence annual bonuses and annual pay
increases.
Other Benefits. Many compensation packages include PTO. PTO typically is defined as a bank
of hours that employees can use for sick time, vacation time, or personal time off. However,
based on the responses in the 2016 NANNP workforce survey, the definitions of PTO, paid
vacation, and paid sick time were likely interchangeable. Ninety percent of NNPs responded that
they received paid vacation time and 80% responded they received paid sick time. However,
75% of NNPs also responded that they earned PTO. On average, NNPs earned 178 hours per
year, but 32% of the survey responders earned 36 hours or less per year. The average number of
hours of PTO used each year was 120. According to NNP administrators surveyed, only 15% of
NNPs use all of their earned PTO, however, 21% of NNPs responded they used all of their PTO.
Forty-three percent of the respondents listed staffing and coverage issues as one of the primary
reasons given for not using earned PTO.
NNPs in region 11 were the most likely to use their PTO, whereas region 7 was least likely to
use PTO. In region 8, NNPs earned the least number of hours of PTO and region 5 earned the
most (Figure 9). Seventeen percent responded that they rearranged shifts so that they did not
need to use PTO and 10% responded that they cashed in their PTO at the end of the year. Most
NNPs (82%) were able to carry PTO from one year to the next. Eighty-seven percent of NNPs
responded that there were restrictions on carrying over PTO. The most common restriction was a
cap on the total number of hours that could be carried from one year to the next.

11
Figure 9. The average number of hours of PTO earned in each region and the percentage of
NNPs who did not use their PTO in each region.
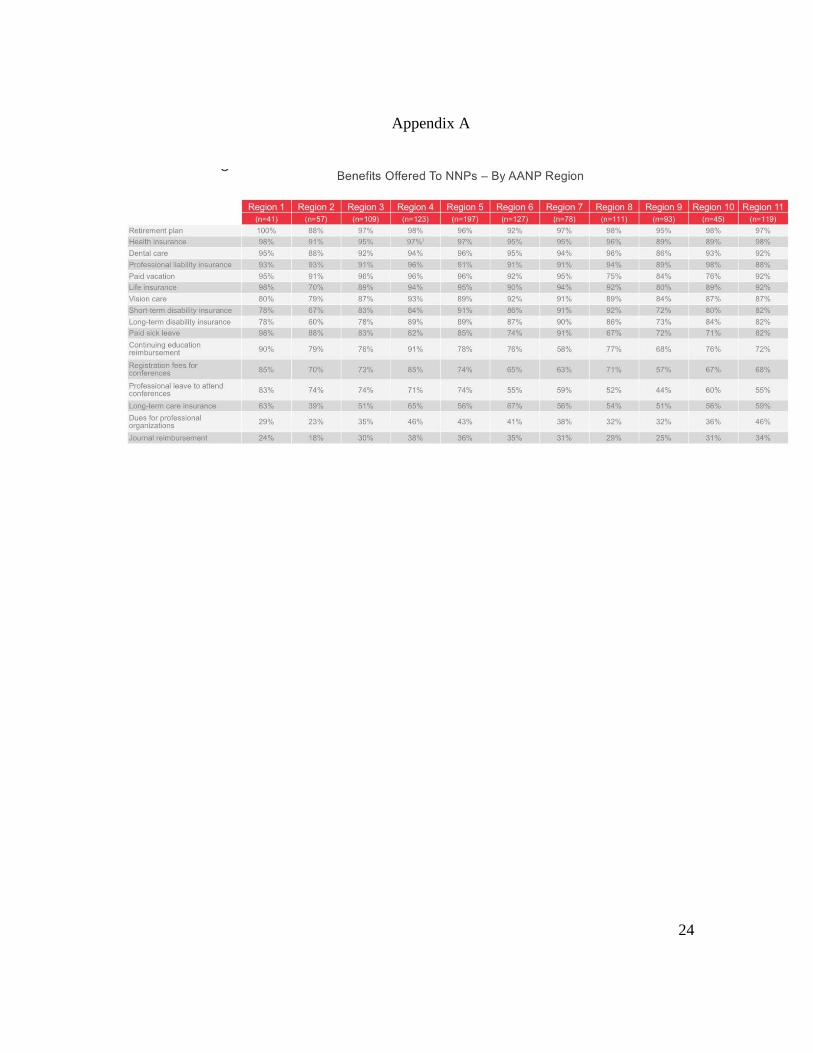
There are several other benefits that are offered to NNPs. Retirement, health insurance, dental
care, professional liability insurance, paid vacation, and life insurance were all offered to
respondents at least 90% of the time. Ninety-six percent of NNPs were offered a retirement plan
and 86% of NNPs paid a portion of that. Health insurance was offered 95% of the time and 87%
of NNPs covered a portion of the cost. NNPs in regions 2 and 9 were more likely to have their
health, vision, and dental insurance covered in full by their employer. Life insurance, short-term
disability, and long-term disability, if offered, were more often coved in full by the employer
than any other health-related benefits (Figure 10). Reimbursement for continuing education and
registration fees for conferences were offered to 76% and 71% of respondents respectively;
although professional leave to attend conferences was only offered 63% of the time. Forty-three
percent of NNPs reported attending one conference per year. Forty-four percent of NNPs
responded that their employers paid for national certification; 45% covered the cost of licensure;
60% paid the state Drug Enforcement Agency (DEA) registration fee; and 53% covered the
federal DEA registration cost. The data indicated that some benefit offerings varied widely
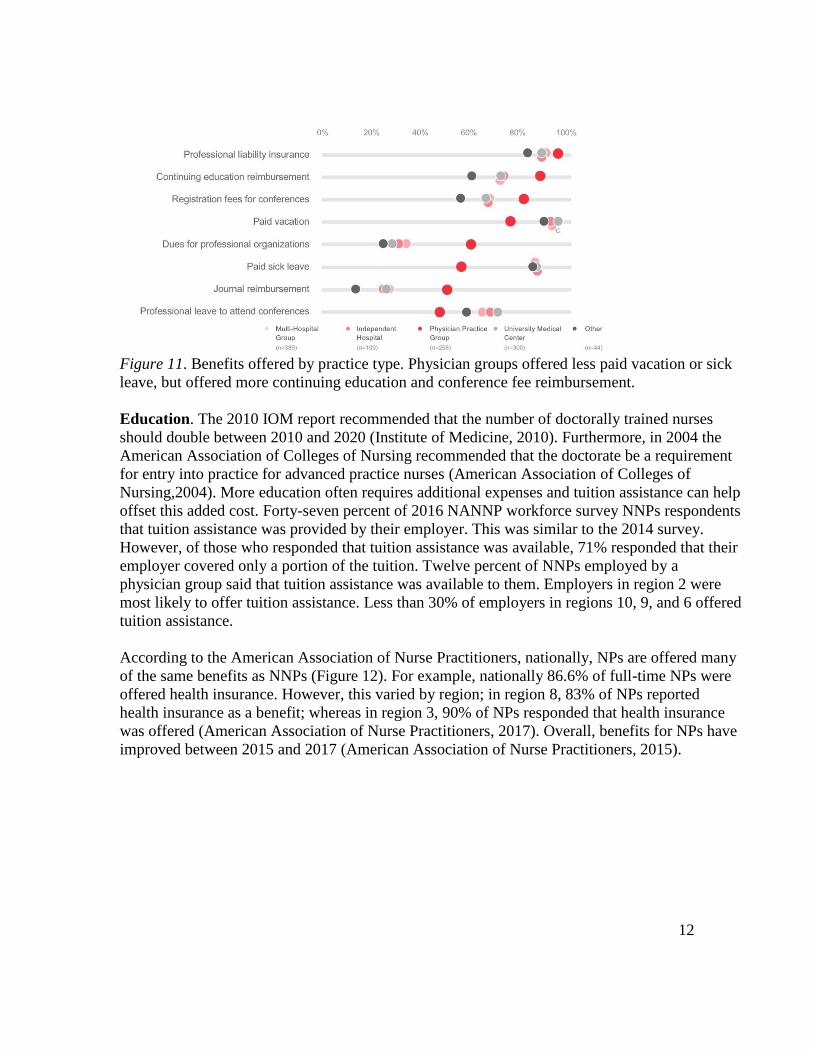
depending on practice type (Figure 11).
Figure 10. Health benefits offered to NNPs—fully paid, partially paid, or offered but not paid by
employer
12
Figure 11. Benefits offered by practice type. Physician groups offered less paid vacation or sick
leave, but offered more continuing education and conference fee reimbursement.
Education. The 2010 IOM report recommended that the number of doctorally trained nurses
should double between 2010 and 2020 (Institute of Medicine, 2010). Furthermore, in 2004 the
American Association of Colleges of Nursing recommended that the doctorate be a requirement
for entry into practice for advanced practice nurses (American Association of Colleges of
Nursing,2004). More education often requires additional expenses and tuition assistance can help
offset this added cost. Forty-seven percent of 2016 NANNP workforce survey NNPs respondents
that tuition assistance was provided by their employer. This was similar to the 2014 survey.
However, of those who responded that tuition assistance was available, 71% responded that their
employer covered only a portion of the tuition. Twelve percent of NNPs employed by a
physician group said that tuition assistance was available to them. Employers in region 2 were
most likely to offer tuition assistance. Less than 30% of employers in regions 10, 9, and 6 offered
tuition assistance.
According to the American Association of Nurse Practitioners, nationally, NPs are offered many
of the same benefits as NNPs (Figure 12). For example, nationally 86.6% of full-time NPs were
offered health insurance. However, this varied by region; in region 8, 83% of NPs reported
health insurance as a benefit; whereas in region 3, 90% of NPs responded that health insurance
was offered (American Association of Nurse Practitioners, 2017). Overall, benefits for NPs have
improved between 2015 and 2017 (American Association of Nurse Practitioners, 2015).

13
Figure 12. Benefits offered nurse practitioners at the national level
Nonclinical hours continued to be minimal. Fifty-four percent of NNPs reported that they do not
receive any paid nonclinical time. This in an increase from 39% in the 2011 workforce survey
(Timoney & Sansoucie, 2012). Similar to the 2015 workforce survey, 20% of NNPs reported in
the 2016 NANNP workforce survey that they received one-to-four hours per week of nonclinical
time. Another 19% reported that the time offered was inconsistent.
In summary, NNPs earned more than most NPs. The average salary reported for an NNP was
$116,000. Salaries varied based on region, experience, and employer. The benefits most
commonly offered were retirement, health insurance, dental insurance, life insurance,
professional liability insurance, and PTO. Other NPs receive many of these same benefits.
Neonatal Nurse Practitioner Satisfaction Measures
The 2016 NANNP workforce survey included several questions to measure NNP satisfaction
regarding career, income, and benefits (Figure 13). Seventy-three percent of NNPs surveyed
responded that they were satisfied or extremely satisfied with their career. This response did not
vary based on unit acuity or age range. This number decreased from 85% in the 2011 workforce
survey (Timoney & Sansoucie, 2012) and 80% in the 2014 survey (Kaminski, Meier, & Staebler,
2015). In the 2016 survey, 85% of NNPs in region 7 answered that they were satisfied or
extremely satisfied. Region 2 and 11 had the lowest career satisfaction with only 66% of NNPs
reporting being satisfied or extremely satisfied with their career. According to AANP, 86% of
NPs were satisfied or very satisfied with their career (American Association of Nurse
Practitioners, 2016). In 2017, Clinician Reviews published a survey in which 83% of NPs and
physician assistants (PA) surveyed would choose the same career again (Clinician Reviews,
2017).

14
Figure 13. Total percentage of NNPs who are satisfied with career, annual income, paid time-off,
health benefits, and retirement benefits.
Salary was rated as important or extremely important for 77% of NNPs surveyed in the 2016
NANNP workforce survey. Yet, just over half of the NNPs felt that they were fairly
compensated. Of the 55% who felt well-compensated, only 13% were extremely satisfied with
their income. Seventy-five percent of NNPs in region 7 responded that they were satisfied or
extremely satisfied with their salary. However, less than 50% of NNPs in regions 2, 10, and 11
reported satisfaction with income. In a 2017 Medscape survey, 66% of NPs felt fairly
compensated (Stokowski, Yox, McBride, & Berry, 2017). Of note, among NPs and PAs, 51%
responded that they would take another job for better pay (Clinician Reviews, 2017).
Additionally, a higher salary was the number one reason that NPs would leave their current
employment for a new job.
Among other benefits, 60% of NNPs surveyed in the 2016 NANNP workforce survey were
satisfied or extremely satisfied with their PTO. Only 51% of NNPs were satisfied with their
health benefits. Although regions 2 and 9 were most likely to have their health, dental, and vision
to be paid fully by their employer, these two regions were not the most satisfied with the health
benefits. If fact, in region 2 only 42% of NNPs were satisfied with their health benefits. Finally,
61% of all surveyed NNPs were satisfied with their retirement benefits (Figure 14). Overall,
region 7 had the highest satisfaction in retirement benefits of any region.

15
Figure 14. Percentage of NNPs satisfied with career, income, PTO, health benefits, and
retirements benefits by each region.
Within the context of NNP satisfaction, shift configuration matters. Thirty-seven percent of
NNPs surveyed in the 2016 NANNP workforce survey responded that they were not working
their preferred shift. Among NNPs who worked day/night rotation, 48% preferred day shift and
24% preferred 24-hour shifts. Forty-five percent of surveyed NNPs who worked in a level IV
NICU would prefer to work days. However, NNPs who worked in level I or II units had a
preference for 24-hour shifts. Among NNPs who worked in level III units, preference between
days only and 24-hour shifts was evenly split. Interestingly, 85% of NNPs responded that all
things being equal, shift configuration would influence where they chose to work. This was true
among all age groups and regions.
Overall, seniority did not provide NNPs with any extra benefits. Only 30% of surveyed NNPs
responded that there were certain benefits related to seniority. The most common benefit (29%)
was additional paid time off. The second most common benefit was fewer night shifts. Fewer
night shifts were only offered to 8% of senior NNPs.
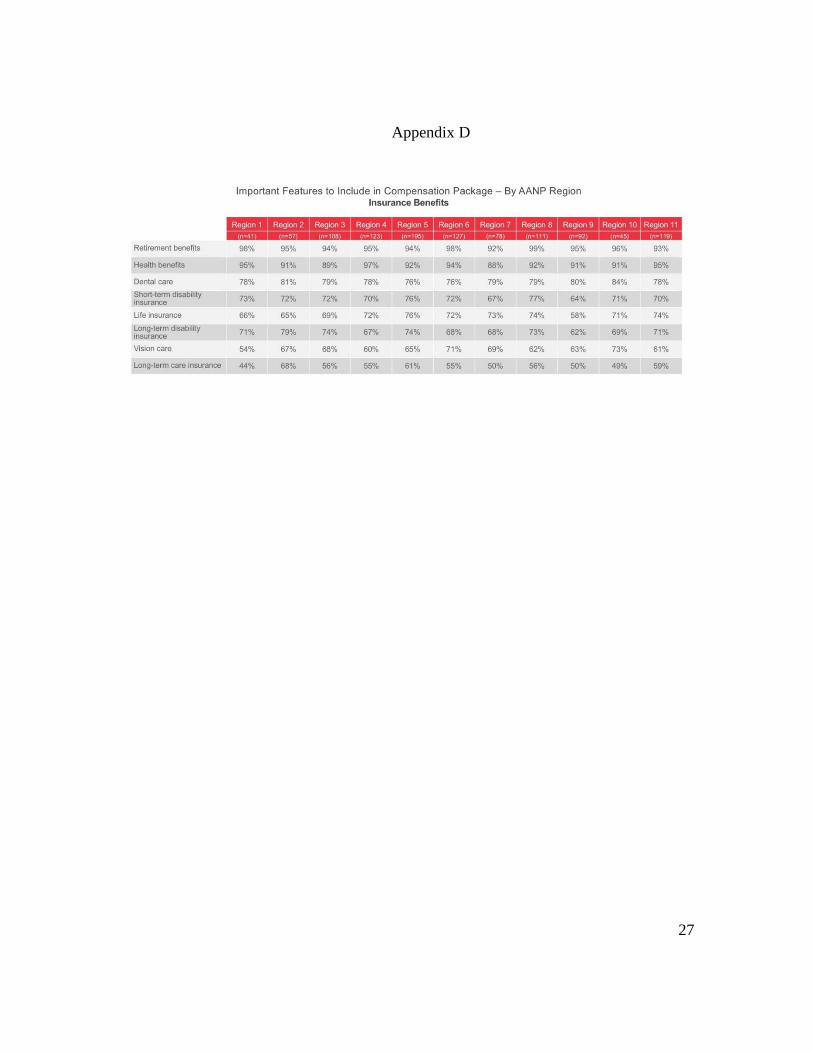
While it is important to know what is included in a total compensation package, it is equally
important to understand which benefits are valued by the staff (Figure 15). Therefore, the 2016
NANNP workforce survey included a question in which respondents ranked their benefits by
importance. A five-point Likert-scale was utilized with a value of 1 being least important and 5
being extremely important. Ninety-seven percent of NNPs surveyed rated work/life balance and
salary as important or extremely important. In fact, 84% of NNPs responded that work/life
balance was extremely important and 78% rated salary as extremely important. Ninety percent of
NNPs younger than 39 years old responded that work/life balance was extremely important.
Among NPs nationally, higher salary and improved work-life balance were the top two reasons
NPs would leave their current job for a new one (Clinician Reviews, 2017).
1 2 3 4 5 6 7 8 9 10 11
Career 73% 67% 71% 80% 73% 71% 85% 73% 76% 71% 66%
Income 61% 44% 58% 50% 58% 51% 76% 57% 63% 40% 45%
PTO 63% 65% 66% 63% 54% 64% 62% 58% 65% 47% 57%
Health 51% 42% 58% 54% 48% 51% 60% 44% 51% 44% 50%
Retirement 56% 47% 61% 67% 57% 65% 69% 60% 58% 47% 63%
0%10%20%30%40%50%60%70%80%90%
% e
xtre
mel
y sa
tisf
ied
/sat
isfi
ed NNP Satisfaction

16
Figure 15. Benefits rated as extremely important on a 5-point Likert-scale score. 1 =
unimportant, 5 = extremely important.
Seventy-two percent of NNPs surveyed in the 2016 NANNP workforce survey rated health
benefits, retirement benefits, and PTO as extremely important. Of note, as respondents ages
increased these three benefits were more likely to be ranked as extremely important. That
phenomenon was particularly apparent with regards to retirement benefits. Sixty-two percent of
surveyed NNPs younger than 35 years old and 82% of surveyed NNPs 60 years and older rated
retirement benefits as extremely. Nationally 77% of NPs rated health benefits, 77% rated
retirement benefits, and 82% rated PTO as important (Clinician Reviews, 2017).
In summary, according to the 2016 NANNP workforce survey, 73% of NNPs were satisfied with
their career while only 55% were satisfied with their salary. Similarly to national surveys of
other NPs, work/life balance and salary were important to NNPs. They also highly valued
retirement, health benefits, and PTO. Furthermore, among survey respondents, shift
configuration would influence job choice if all other benefits were equal.
Neonatal Nurse Practitioner Staff Shortage
The shortage of NNPs has been a constant theme in the literature. In the 2011 workforce survey,
NNPs responded that their workload had increased due to a shortage of NNPs (Timoney &
Sansoucie, 2012). Almost half of the respondents in the 2014 workforce survey perceived their
practice as understaffed (Kaminski, Meier, & Staebler, 2015). In the 2016 survey, 75% of
clinical NNPs and 73% of NNP administrators (N=40) responded that there were not enough
NNPs to cover practice needs. Furthermore, NNP administrators expected that the shortage
would worsen over the next ten years. Fifty-nine percent of administrators answered that they
were not able to find qualified candidates; 52% noted that there was a lack of funding to fill
vacancies. Forty-one percent of administrators responded that the salary offered contributed to
the shortages in staff. Administrators reported an average of four vacant positions and 25% of
administrators reported having six or more openings. Eighty-eight percent of administrators
thought there were not enough NNP faculty to lead NNP programs.

17
A strategic model published in Nursing Outlook suggested that with the current enrollment in
educational programs, NCC examination pass rates, and NNP workforce attrition, it could take
10 years to end the NNP shortage (Schell, et al., 2016). NNPs are not the only provider group
unable to meet demand. The same strategic model noted above was used to examine the shortage
of Pediatric Nurse Practitioners (PNPs). This model concluded it could take 13 years to meet the
demand for PNPs (Schell, et al., 2015).
Lack of enrollment in NNP educational programs was identified as one of the factors that
contributed to the shortage of NNPs (Freed, Moran, Dunham, Nantais-Smith, & Martyn, 2015).
Fortunately, the number of NNP graduates increased from 290 in 2016 to 323 in 2017. The most
recent survey assessed that there were 727 NNP students enrolled in an accredited program
(Mattis, 2018). This number is an increase from 513 students in 2013 (Bellini, 2013). This data
aligns with the AANP national survey which showed a 15% increase in the number of NP
graduates between the 2014–2015 academic year and the 2015–2016 academic year. A study
published in 2013 determined that the best means to increase enrollment in NNP programs was
to recruit from current registered nurses in NICUs (Freed, et al., 2013).
Attrition also has been identified as a contributor to the NNP shortage. The attrition rate, which
includes retirement, has been estimated to be 1.5% (Schell, et al., 2016). In the 2016 NANNP
workforce survey the average age of NNPs was 49 and 52% of NNPs were older than 50.
However, there is no specific data about NNPs’ age and intent to retire has been collected to
date. A national study of NPs’ intent to retire, based on the 2012 National Sample Survey of
Nurse Practitioners, concluded that only 15% of NPs between the ages of 55 to 59 planned to
retire in the next 5 years. That number increased to 59% for NPs 60 years or older (Falk, Chapa,
& Greene, 2017). NPs who were working part-time and were less satisfied with their career were
more likely to retire. Additionally, NPs between the ages of 55 and 59, who worked in primary
care rather than a specialty area, were more likely to retire within five years.
In 2014, 54% of open NNP positions were not being filled by other healthcare providers. In spite
of this, according to the 2016 NANNP workforce survey, 60% of administrators responded that
they have filled positions with non-NNP providers:
28% neonatologists.
23% other APRNs.
20% PAs
13% hospitalists.
Eighty-eight percent of administrators responded that they intend to hire NNPs in the future.
Forty-one percent responded that they will hire PAs, use per diem staff, or increase workload;
32% would hire other APRNs; and 24% responded that neonatologists would be hired to fill
existing gaps.
Some incentives were being offered to try to improve NNP staffing. The most common offerings
were included within the benefits package (70%) which is unchanged from 2014. Relocation

18
packages were offered more frequently in the 2016 NANNP workforce survey (68%) than in
2014 (38%). Forty-percent of employers offered continuing education reimbursement which was
down from 52% in 2014. Thirty-seven percent of employers offered higher than market salary as
an incentive which was an increase from 26% in 2014. Twenty-three percent of the
administrators responded that sign-on bonuses were available and only 18% offered loan
repayment which was relatively unchanged from 2014 (Kaminski, Meier, & Staebler, 2015).
Career and professional development support for NNPs remained unchanged from 2014 to 2016
(Kaminski, Meier, & Staebler, 2015). Fifty-percent of surveyed NNP administrators reported that
their practice had a new graduate orientation program that lasted three to six months. Only 20%
had an orientation program that was longer than six months. Similar to the 2014 survey only
about 45% of practices had a mentoring program, although another 35% had plans in place to
create a mentoring program.
In summary, the large majority of NNPs and NNP administrators responded that the supply of
NNPs was not meeting demand. A strategic model of NNP staffing suggested it will be 10 years
before NNP supply can meet demand based on current NNP graduation rates, NCC pass rates,
and attrition. Some incentives were being offered to attract NNPs to fill positions. In addition,
while some open positions were filled by other healthcare providers, NNP administrators
responded that their intention was to fill open positions with NNPs.
Discussion
The 2016 NANNP workforce survey was the first NANNP sponsored survey in which the
primary purpose was to collect compensation data. Furthermore, for the first time, an assessment
of what NNPs valued most in their compensation package was measured. The objective
compensation data provides a starting point for employees and employers to discuss salary and
benefits. For example, ninety percent of NNPs responded that alignment of expected hours to
work with actual hours worked was important or extremely important. The subjective data
related to what NNPs value may assist in tailoring the creation of recruitment and retention
packages that are enticing to individual NNPs.
The survey objectively demonstrated that compensation varied based on region, employer, and
years of experience. It also became clear that the benefits offered to NNPs varied widely, making
it difficult to compare one compensation package to another. For example, NNPs employed by
physician groups typically were paid less than NNPs employed by other groups. However, NNPs
within physician groups received conference funding and bonuses more often than NNP
employed by other entities.
Cost of living was not included in the survey data. Yet, when considering employment options, it
is important to compare cost of living in one region versus another. While region 11 had the
lowest salaries and region 9 had the highest, region 9 included California. California is one of the
most-costly states in which to reside thus, salaries in California were higher (CNN, nd).

19
The shortage of NNPs continues to be an ongoing issue. Fortunately, the number of NNP
graduates in 2017 was greater than in 2016. Moreover, there were more NNP students enrolled in
accredited programs in 2017 than in 2016. According to the survey, the majority of NNPs
worked full-time and continued to do so even when they were 60 years old or greater, yet, most
administrators responded that they had vacancies and they believed this would continue to be a
problem in the future.
Two trends may have contributed to the shortage of NNPs. First, there has been an increase in
the number of NICUs and NICU beds in the U.S. The number of hospitals with NICUs increased
from 806 to 983 between 2000 and 2013 and there was an increase of 7,000 NICU beds during
that time period. Second, the number of NICU admissions increased 23% between 2007 and
2012 (Harrision & Goodman, 2015).
There are similarities between NNPs and other NPs. The average age of NPs and NNPs
nationally was 49 years old, although the average age of acute care PNPs was only 39 (Schell, et
al., 2015). NPs who work in an inpatient setting tended to have higher salaries than those who
did not. This may explain in part the reason NNPs tend to be higher paid than other NPs as
almost all NNPs work within inpatient settings. NPs benefits packages were similar to NNPs.
NPs were primarily female and the majority worked full-time. There were also other NP groups
that had significant supply shortages, such as acute care PNPs (Schell, et al., 2015).
The decreasing satisfaction with career is a topic that needs further investigation because it could
potentially contribute to attrition. NNPs career satisfaction fell from a high of 85% in 2011 to
73% in 2016. In particular, regions 2 and 11 were least satisfied with their career. In comparison
at the national level, 85% of NPs were satisfied with their career (Clinician Reviews, 2017).
Salary may be a contributor to dissatisfaction. Only 55% of surveyed NNPs were satisfied with
their salary. Nationally 66% of NPs were satisfied with their salary. In reality, it is more likely a
combination of factors that contribute to satisfaction with one’s career as can be seen in Figure
14. In region 4, 80% of the surveyed NNPs were satisfied or extremely satisfied with their
career, but only 50% of the NNPs in that same region were satisfied or extremely satisfied with
their income.
Work/life balance was valued highly by NNPs. However, the survey did not include questions
that defined what constituted a positive work/life balance. In light of the fact that 75% of NNPs
and administrators responded that their team was short staffed, NNPs responded that they did not
use all of their PTO. When there is a greater discrepancy between actual work hours and
expected work hours, work/life balance may not meet individual needs. If work/life balance is
practiced less than desired, it could contribute to career dissatisfaction.
Insights and Recommendations 1. Salary was highly valued by NNPs but only 55% or respondents were satisfied with
compensation.
20
Administrators should ensure that salaries remain competitive in the current
market.
2. Work/life balance was highly valued.
Schedule requirements should be discussed and solutions such as shift
configurations might be included in overall compensation packages.
3. NNPs valued having expected work hours match actual worked hours.
Consider options to meet this need.
4. Some specific benefits are valued more by different age groups.
For recruitment and retention, it would be worthwhile to consider age-specific
needs when creating compensation packages.
5. Increase employer contribution to retirement plans as a retention tool to retain senior (60
years or older) NNPs.
Ensure long-term disability insurance for more senior NNPs.
6. Rotating shifts were the least preferred shift configuration.
Consider reinstating differentials if differentials are no longer paid for rotating
night shifts.
Discuss with NNP team how to better configure shifts while recognizing the need
for continuous coverage of units.
7. Other surveys revealed a shortage of other NP providers.
Keep conversations about shortage of NNPs within the context of national
shortage of providers.
8. Focus on recruiting new NNP students from NICU nurses.
Develop mentoring programs for new NNPs.
9. Satisfaction with career decreased since the 2011 NNP workforce survey.
Future research should focus on contributors to decreasing satisfaction with
career.
Limitations of the Study
The response rate for the survey was only 20%. Furthermore, the response rate for each region
was unknown. Thus, the data may not be generalizable, particularly for any given region.
Conclusion
For the first time, comprehensive data about NNP compensation packages, satisfaction with
career and benefits, and what NNPs value as a benefit was collected and analyzed. Based on the
analysis, proposals have been made. In keeping with the IOM recommendations, continued
collection of data related to the NNP workforce is important. Moving forward, it will be vital to
investigate the specific contributors that decrease career. Lack of career satisfaction could
influence recruitment and retention of NNPs which could worsen the NNP shortage. Continuing
to monitor trends around the country will describe current NNP demographics and define
compensation packages leading the way to maintaining a strong NNP workforce.
References

21
American Association of Colleges of Nursing. (n.d.). DNP fact sheets. Retrieved:
http://www.aacnnursing.org/News-Information/Fact-Sheets/DNP-Fact-Sheet
American Association of Colleges of Nursing. (2004). AACN position statement on the practice
of doctorate in nursing. Retrieved: http://www.aacnnursing.org/Portals/42/News/Position-
Statements/DNP.pdf
American Association of Nurse Anesthetists. (2012). AANA publishes first-ever CRNA
compensation and benefits report. Retrieved:
http://sharepoint.aana.com/newsandjournal/News/Pages/022312-AANA-Publishes-First-
Ever-CRNA-Compensation-and-Benefits-Report.aspx
American Association of Nurse Practitioners. (2016). 2016 National Nurse Practitioner Sample
Survey: An overview June 2016. Retrieved from: www.aanp.org
American Association of Nurse Practitioners. (2017). NP Facts. Retrieved from American
Association of Nurse Practitioners : https://www.aanp.org/all-about-nps/np-fact-sheet
American Association of Nurse Practitioners. (2015). 2015 National Nurse Practitioner
Compensation Survey: An overview June 2015. Retrieved from American Association of
Nurse Practitioners: www.aanp.org
American College of Nurse Midwives. (2007). ACNM compensation and benefits survey 2007.
Retrieved from American College of Nurse Midwives:
http://www.midwife.org/ACNM/files/ccLibraryFiles/Filename/000000001683/ACNM_S
alary_Survey_2007.pdf
Bellini, S. (2013). State of the state: NNP program update 2013. Advances in Neonatal Care,
13(5), 346–348.
Clinical Advisor. (n.d.). Salary search. Retrieved from Clinical Advisor:
http://www.clinicaladvisor.com/search/salary/
Clinician Reviews. (2017). Job satisfaction. Clinician Reviews, pp. 25–30.
CNN Money. (n.d.). Cost of living: How far will my salary go in another city? Retrieved from
www.cnn.com: http://money.cnn.com/calculator/pf/cost-of-living/index.html
Cusson, R., Buus-Frank, M., Flanagan, V., Miller, S., Zukowsky, K., & Rasmussin, L. (2008). A
survey of the current neonatal nurse practitioner workforce. Journal of Perinatology, 28,
830–836.

22
Falk, N., Chapa, D., & Greene, J. (2017). Nurse practitioners and intent to retire. Journal of the
American Association of Nurse Practitioners, 29, 130-135.
Freed, G., Dunham, K., Martyn, K., Nantais-Smith, L., Moran, L., & Spera, L. (2013). Neonatal
nurse practitioners: Influence on career choice. The Journal For Nurse Practitioners,
9(2), 82–86.
Freed, G., Moran, L., Dunham, K., Nantais-Smith, L., & Martyn, K. (2015). Capacity of, and
demand for, neonatal nurse practitioner educational programs: A missing piece of the
puzzle. Journal of Professional Nursing, 31(4), pp. 318–322.
Goolsby, M. (2005, September). 2004 AANP national nurse practitioner sample survey part I:
An overview. Journal of the American Academy of Nurse Practitioners, 17(9), 337–341.
Goolsby, M. (2006). 2004 AANP national nurse practitioner sample survey part III: NP income
and benefits. Journal of the American Academy of Nurse Practitioners, 18, 2–5.
Harrison, W., & Goodman, D. (2015). Epidemiologic trends in neontal intensie care, 2007–2012.
JAMA Pediatrics, 169(9), 855–862.
Institute of Medicine. (2010). The Future of nursing:l change, advancing health. Washington,
D.C.: Institute of Medicine.
Judge, T., Piccolo, R., Podsakoff, N., Shaw, J., & Rich, B. (2010). The relationship betweeen pay
and job satisfaction: A meta-analysis of the literature. Journal of Vocational Behavior,
77(2), 157–167.
Kaminski, M. M., Meier, S., & Staebler, S. (2015). National association of neonatal nurse
practitioners (NANNP) workforce survey. Advances in Neonatal Care, 15(3), 182–190.
Mattis, T. (2018, January 16). (E. Welch-Carre, Interviewer)
Meier, S., & Staebler, S. (2014). 2014 neonatal nurse practitioner workforce survey executive
summary. Retrieved from National Association of Neonatal Nurses:
http://nann.org/uploads/Membership/NANNP_Pubs/NNP_Workforce_Survey_Executive
_Summary-FINAL_01-13-15.pdf
Peckham, C. (2015, November 18). Medscape nurse salary report 2015. Retrieved from
Medscape: https://www.medscape.com/features/slideshow/public/nurse-salary-report-
2015#page=1
Reuter-Rice, K., Madden, M. G., & Roerster, A. (2016). Acute care pediatric nurse practitioner:
The 2014 practice analysis. Journal of Pediatric Health Care, 30(3), 341–51.

23
Schell, G., Lavieri, M., Jankovic, F., Xiang, L., Toriello, A., Martyn, K. K., & Freed, G. (2016).
Strategic modeling of the neonatal nurse practitioner workforce. Nursing Outlook, 64,
385–394.
Schell, G., Lavieri, M., Xiang, L., Toriello, A., Martyn, K., & Freedman, G. (2015). Strategic
modeling of the pediatric nurse practitioner workforce. Pediatrics, 135(298–306).
Stokowski, L., Yox, S., McBride, M., & Berry, E. (2017, November 1). Medscape APRN
compensation report 2017. Retrieved from www.medscape.com:
https://www.medscape.com/slideshow/2017-aprn-compensation-report-6009192#1
The Society for Human Resource Management. (2016). Employee job satisfaction and
engagement: Revitalizing a changing workforce. Retrieved from The Society for Human
Resource Management: https://www.shrm.org/hr-today/trends-and-forecasting/research-
and-surveys/Documents/2016-Employee-Job-Satisfaction-and-Engagement-Report.pdf
Timoney, P., & Sansoucie, D. (2012). Neonatal nurse practitioner workforce survey executive
summary. Advances in Neontal Care, 12(3), 176–178.
24
Appendix A

25
Appendix B

26
Appendix C
27
Appendix D

28
Drafted by Elizabeth Welch-Carre, EdD MSN APRN NNP-BC. Approved by the National Association of Neonatal Nurse Practitioners Council.
Copyright © 2018 by the National Association of Neonatal Nurses. No part of this statement may be reproduced without the written consent of the National Association of Neonatal Nurses.
8735 W. Higgins Road, Suite 300, Chicago, IL 60631 800.451.3795 • 847.375.3660 • Fax 866.927.5321 www.nann.org
Related Documents