Sandia is a multiprogram laboratory operated by Sandia Corporation, a Lockheed Martin Company for the United States Department of Energy’s National Nuclear Security Administration under contract DE-AC04-94AL85000 NEXUS of Water and Energy Issues, Trends, and Challenges Toyota Sustainable Mobility Seminar- Sept. 22 – 25, 2008 John A. Merson Sandia National Laboratories

Welcome message from author
This document is posted to help you gain knowledge. Please leave a comment to let me know what you think about it! Share it to your friends and learn new things together.
Transcript
Sandia is a multiprogram laboratory operated by Sandia Corporation, a Lockheed Martin Company for the United States Department of Energy’s National Nuclear Security Administration under contract DE-AC04-94AL85000
NEXUS of Water and EnergyIssues, Trends, and Challenges
Toyota Sustainable Mobility Seminar- Sept. 22 – 25, 2008
John A. MersonSandia National Laboratories

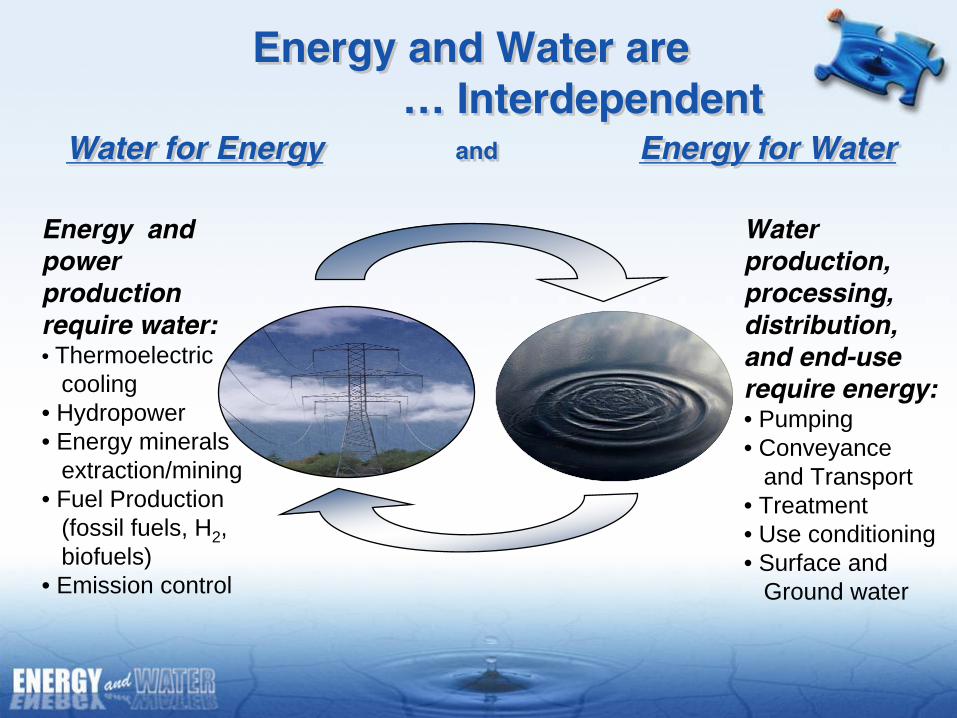
Energy and Water are … Interdependent
Water for Energy
and
Energy for Water
Energy and Water are … Interdependent
Water for Energy
and
Energy for Water
Energy and power production require water:• Thermoelectric
cooling• Hydropower• Energy minerals
extraction/mining• Fuel Production
(fossil fuels, H2 , biofuels)
• Emission control
Water production, processing, distribution, and end-use require energy:• Pumping• Conveyance
and Transport• Treatment• Use conditioning• Surface and
Ground water
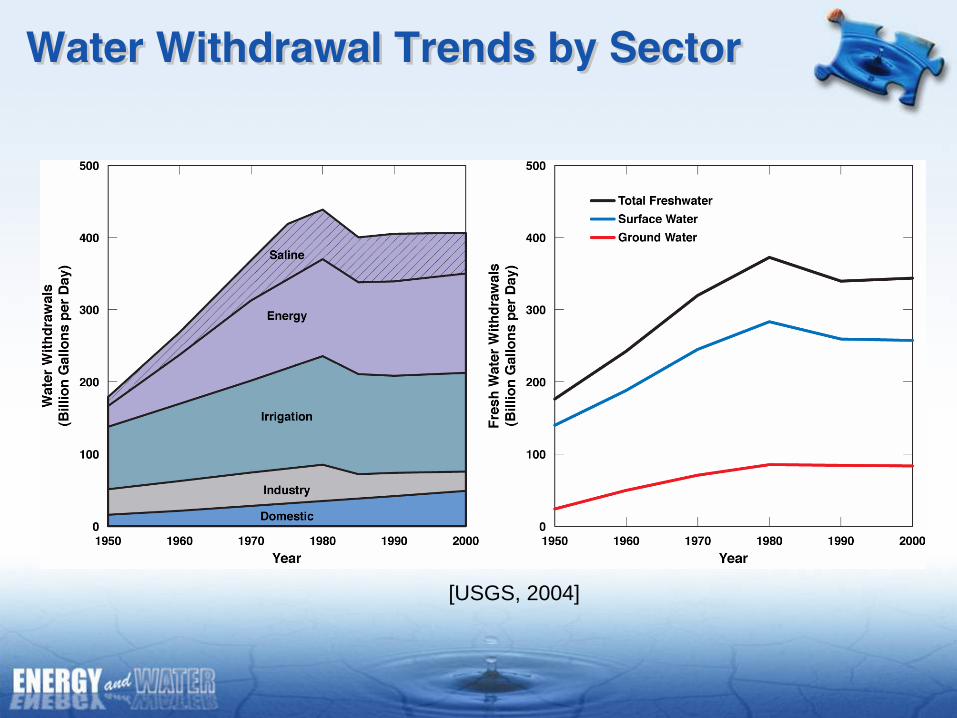
Water Withdrawal Trends by Sector Water Withdrawal Trends by Sector
[USGS, 2004]
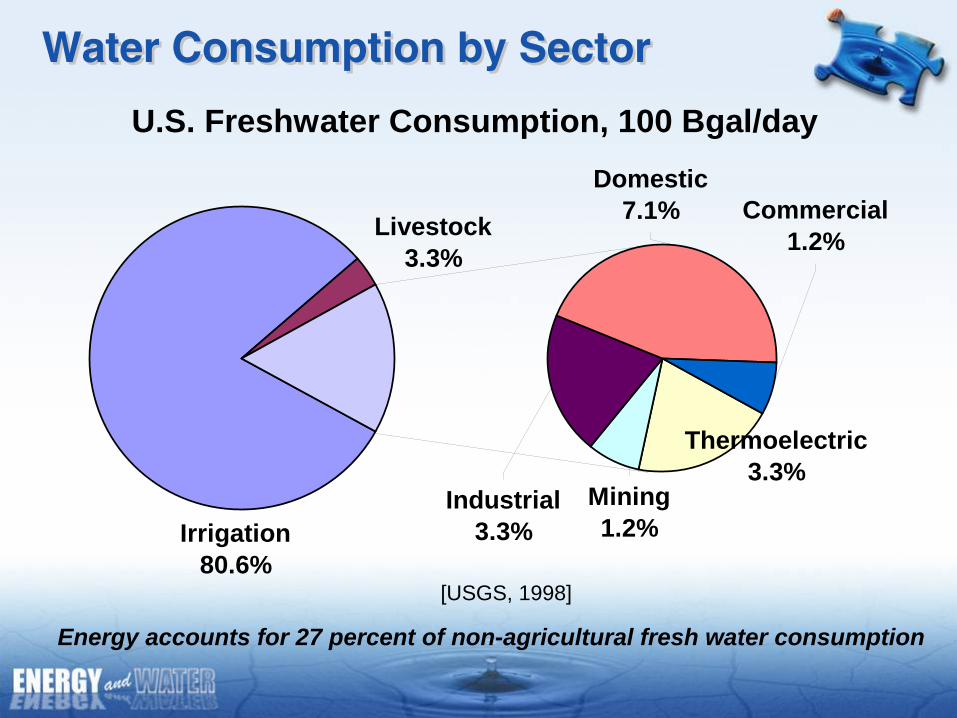
Water Consumption by SectorWater Consumption by Sector
U.S. Freshwater Consumption, 100 Bgal/day
Livestock3.3%
Thermoelectric3.3%
Commercial1.2%
Domestic7.1%
Industrial3.3%
Mining1.2%Irrigation
80.6%
Energy accounts for 27 percent of non-agricultural fresh water consumption
[USGS, 1998]

Growing Limitations on Fresh Surface and Ground Water Availability
Growing Limitations on Fresh Surface and Ground Water Availability
• Little increase in surface water storage capacity since 1980
• Concerns over climate impacts on surface water supplies
• Many major ground water aquifers seeing reductions in water quality and yield
( Based on USGS WSP-2250 1984 and Alley 2007)
(Shannon 2007)
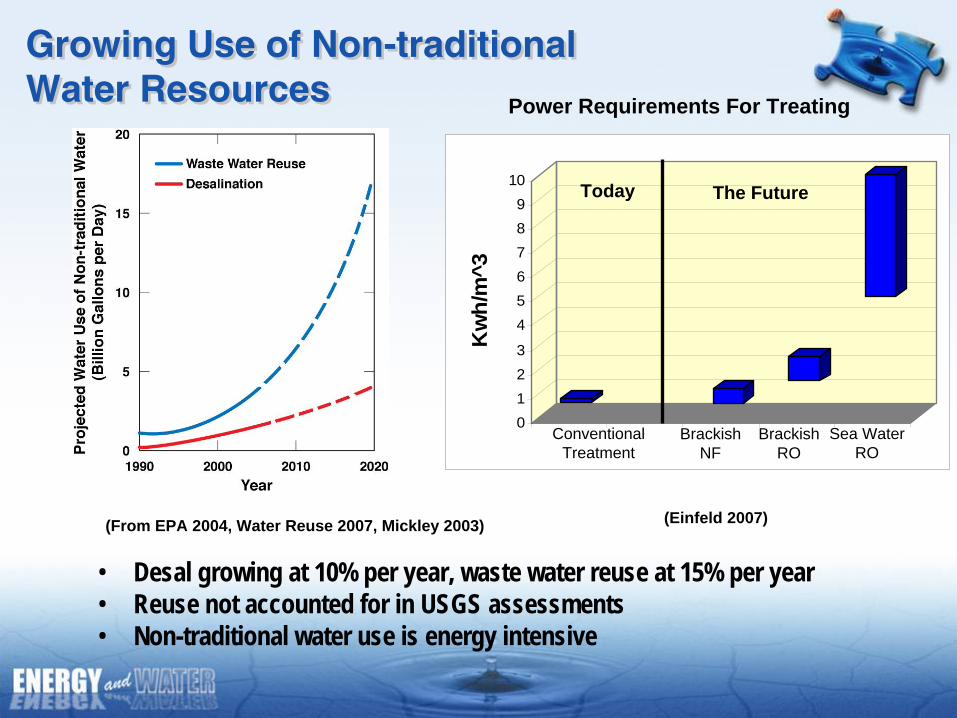
Growing Use of Non-traditional Water Resources Growing Use of Non-traditional Water Resources
• Desal growing at 10% per year, waste water reuse at 15% per year• Reuse not accounted for in USGS assessments• Non-traditional water use is energy intensive
(From EPA 2004, Water Reuse 2007, Mickley 2003)
0123
456789
10
Kw
h/m
^3
1 2 3 4 5Sea WaterRO
Today The Future
ConventionalTreatment
BrackishRO
BrackishNF
Power Requirements For Treating
(Einfeld 2007)
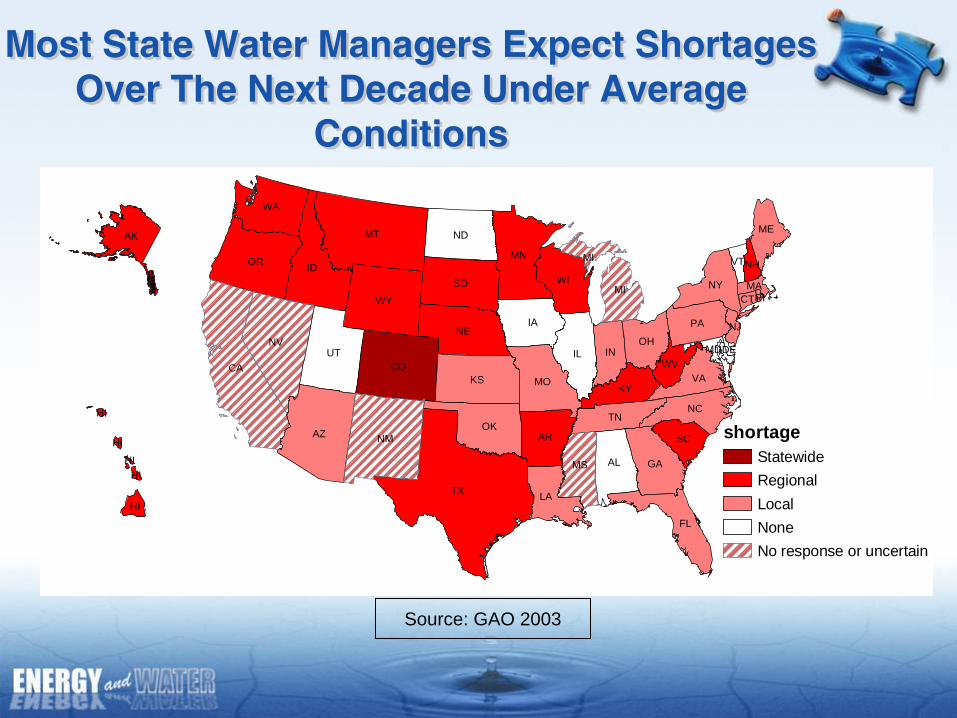
Most State Water Managers Expect Shortages Over The Next Decade Under Average
Conditions
Most State Water Managers Expect Shortages Over The Next Decade Under Average
Conditions
TX
CA
MT
AZ
ID
NV
NM
COIL
OR
UT
KS
WY
IANE
SD
MN
ND
OK
FL
WI
MO
AL
WA
GA
AR
LA
MI
IN
PA
NY
NC
MS
TN
KYVA
OH
SC
ME
WV
MI VTNH
MD
NJ
MACT
DE
RI
g
AK
AK
HI
HI
HI
HI
HI
shortageStatewideRegionalLocalNoneNo response or uncertain
Source: GAO 2003
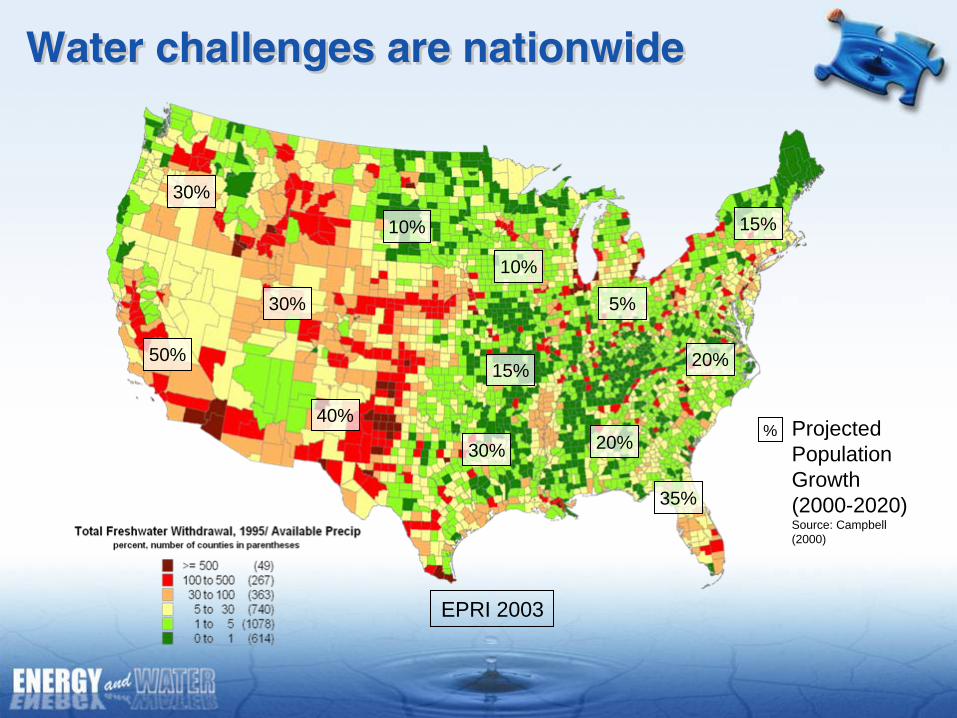
Water challenges are nationwideWater challenges are nationwide
Projected Population Growth (2000-2020)Source: Campbell (2000)
50%
%
30%
30%
40%
10%
10%
30%
15%
5%
15%
20%
35%
20%
EPRI 2003
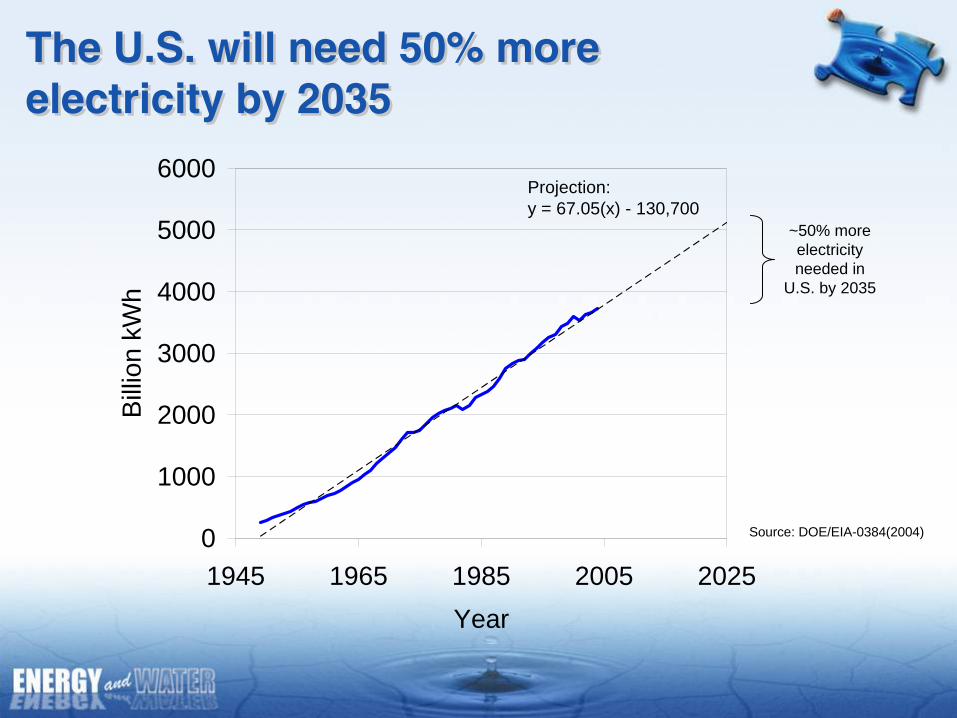
The U.S. will need 50% more electricity by 2035
The U.S. will need 50% more electricity by 2035
Source: DOE/EIA-0384(2004)
Projection:y = 67.05(x) - 130,700
0
1000
2000
3000
4000
5000
6000
1945 1965 1985 2005 2025Year
Billio
n kW
h
~50% more electricity needed in
U.S. by 2035
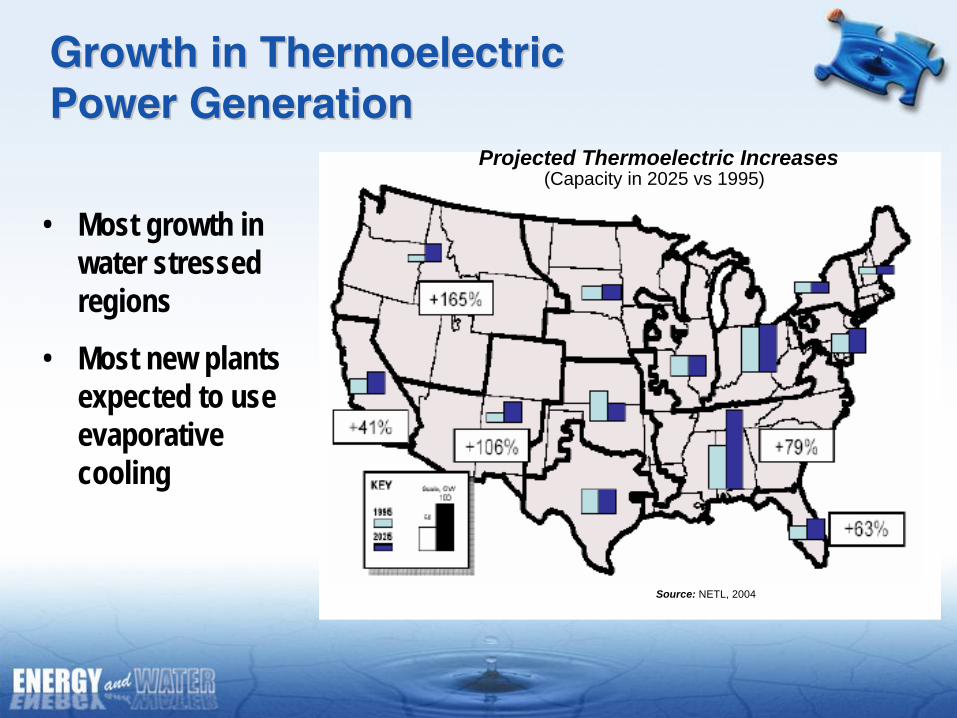
• Most growth in water stressed regions
• Most new plants expected to use evaporative cooling
Growth in Thermoelectric Growth in Thermoelectric Power GenerationPower Generation
Source: NETL, 2004
Projected Thermoelectric Increases(Capacity in 2025 vs 1995)
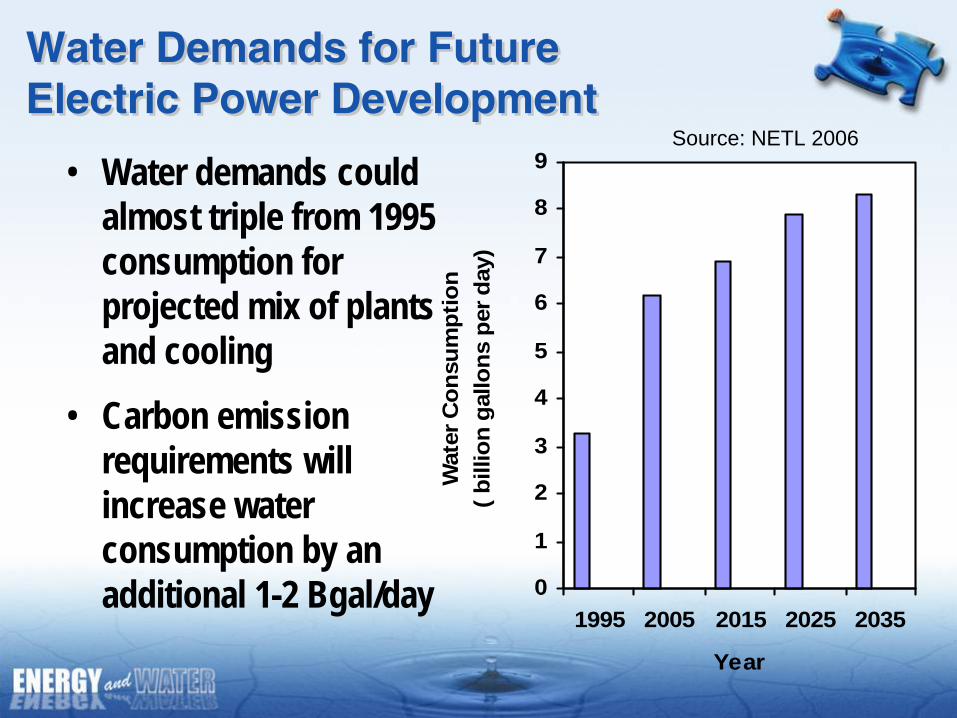
Water Demands for Future Electric Power Development
Water Demands for Future Electric Power Development
• Water demands could almost triple from 1995 consumption for projected mix of plants and cooling
• Carbon emission requirements will increase water consumption by an additional 1-2 Bgal/day 0
1
2
3
4
5
6
7
8
9
1995 2005 2015 2025 2035
Year
Wat
er C
onsu
mpt
ion
( bill
ion
gallo
ns p
er d
ay)
Source: NETL 2006

Water Use and Consumption for Electric Power Generation
Water Use and Consumption for Electric Power Generation
Plant-type Cooling Process
Water Use Intensity (gal/MWhe )
Steam Condensing Other Uses
Withdrawal Consumption Consumption
Fossil/ biomass steam turbineOpen-loop 20,000–50,000 ~200-300
15-36Closed-loop 300–900 300–714
Nuclear steam turbine
Open-loop 25,000–60,000 ~40036
Closed-loop 800–1,100 ~720
Natural Gas Combined- Cycle
Open-loop 7,500–20,000 10010-20
Closed-loop 230 408
Integrated Gasification Combined-Cycle Closed-loop 360-540 200-510 130
Carbon sequestration for fossil energy generation ~25% increase in water withdrawal and consumption
Geothermal Steam Closed-loop 2190 1640-1750 50
Concentrating Solar Closed-loop 850-1125 750-920 10-53
Wind and Solar Photovoltaic N/A 0 0 1

The U.S. will need 33% more Transportation Fuels by 2030
The U.S. will need 33% more Transportation Fuels by 2030
• Fuel use will increase despite gains in efficiency
• Current initiatives for domestic alternatives like oil shale and biofuels
• Major hydrogen use will be post 2030 0
5
10
15
20
25
30
1960
1980
2000
2020
Year
Fuel
Dem
and
(mill
ion
barr
els
per d
ay)
Imports
Oil Shale
Biofuels
TraditionalSupplies

Emerging Water Demands for Alternative Fuels Development
Emerging Water Demands for Alternative Fuels Development
• Irrigation of even small percentage of biofuel acreage will increase water consumption by an additional 5 Bgal/day
0
0.5
1
1.5
2
2.5
3
1995 2005 2015 2025 2035
Year
Wat
er C
onsu
mpt
ion
(bill
ion
gallo
ns p
er d
ay)
Oil Shale
Biofuels
TraditionalRefining
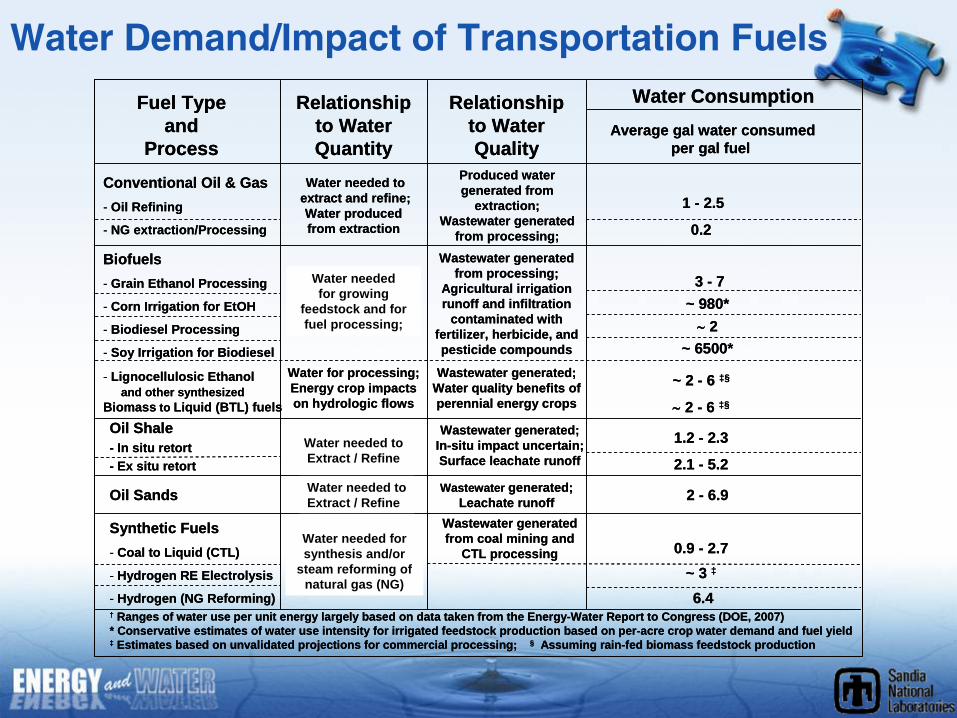
Water Demand/Impact of Transportation Fuels
Fuel Type and
Process
Relationship to Water Quantity
Relationship to Water Quality
Water Consumption
† Ranges of water use per unit energy largely based on data taken from the Energy-Water Report to Congress (DOE, 2007)* Conservative estimates of water use intensity for irrigated feedstock production based on per-acre crop water demand and fuel yield‡ Estimates based on unvalidated projections for commercial processing; § Assuming rain-fed biomass feedstock production
Conventional Oil & Gas- Oil Refining
- NG extraction/Processing
Water needed to extract and refine;Water produced from extraction
Produced water generated from
extraction;Wastewater generated
from processing;
Biofuels- Grain Ethanol Processing
- Corn Irrigation for EtOH
- Biodiesel Processing
- Soy Irrigation for Biodiesel
Oil Shale- In situ retort- Ex situ retort
Oil Sands
Synthetic Fuels- Coal to Liquid (CTL)
- Hydrogen RE Electrolysis
- Hydrogen (NG Reforming)
Water needed to Extract / Refine
Water needed for growing
feedstock and for fuel processing;
Wastewater generated from processing;
Agricultural irrigation runoff and infiltration
contaminated with fertilizer, herbicide, and pesticide compounds
Wastewater generated; Leachate runoff
Water needed for synthesis and/or
steam reforming of natural gas (NG)
Wastewater generatedfrom coal mining and
CTL processing
Water needed to Extract / Refine
Wastewater generated;In-situ impact uncertain; Surface leachate runoff
Average gal water consumed per gal fuel
1 - 2.5
0.2
3 - 7~ 980*∼ 2
~ 6500*
1.2 - 2.3
2.1 - 5.2
2 - 6.9
0.9 - 2.7 ~ 3 ‡
6.4
Water for processing; Energy crop impacts on hydrologic flows
- Lignocellulosic Ethanoland other synthesized
Biomass to Liquid (BTL) fuels
Wastewater generated;Water quality benefits of perennial energy crops
~ 2 - 6 ‡§
∼ 2 - 6 ‡§
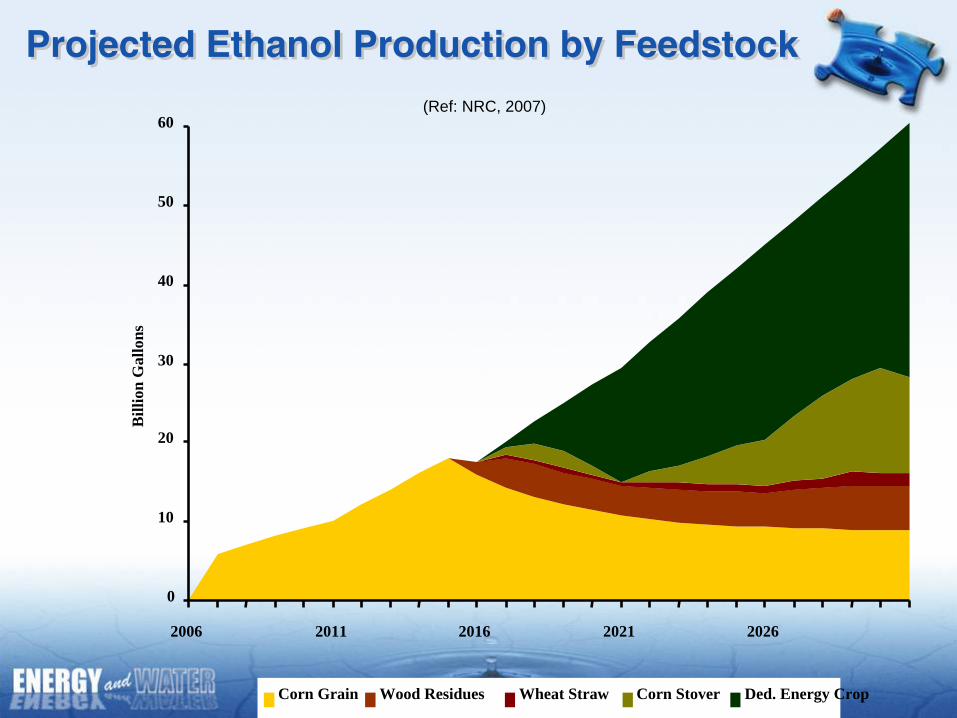
Projected Ethanol Production by FeedstockProjected Ethanol Production by Feedstock
0
10
20
30
40
50
60
2006 2011 2016 2021 2026
Corn Grain Wood Residues Wheat Straw Corn Stover Ded. Energy Crop
Bill
ion
Gal
lons
(Ref: NRC, 2007)
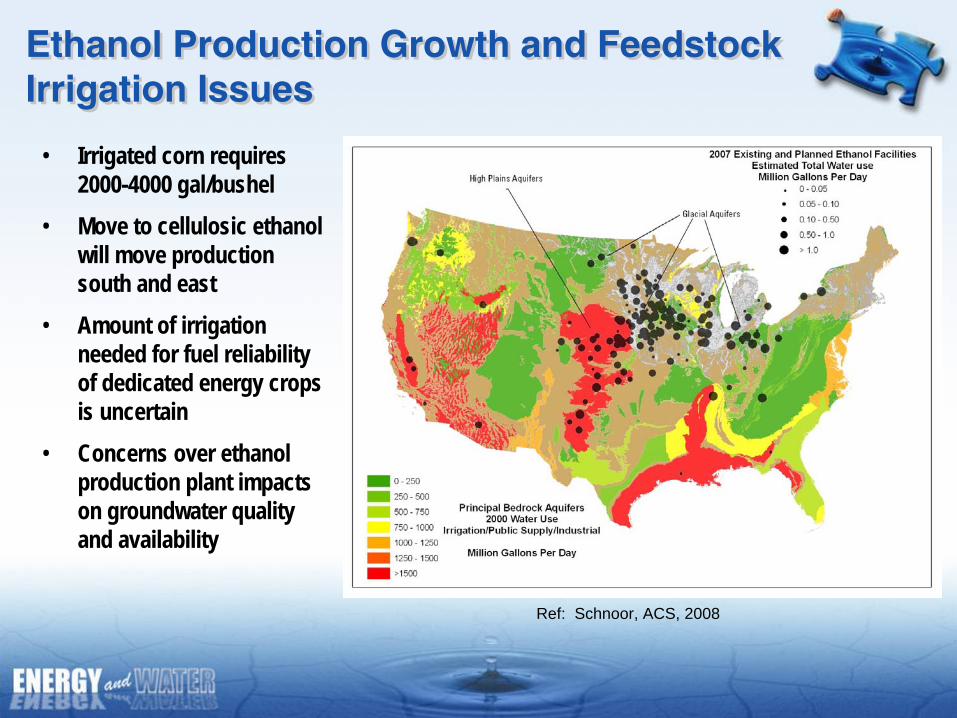
Ethanol Production Growth and Feedstock Irrigation Issues
Ethanol Production Growth and Feedstock Irrigation Issues
Ref: Schnoor, ACS, 2008
• Irrigated corn requires 2000-4000 gal/bushel
• Move to cellulosic ethanol will move production south and east
• Amount of irrigation needed for fuel reliability of dedicated energy crops is uncertain
• Concerns over ethanol production plant impacts on groundwater quality and availability
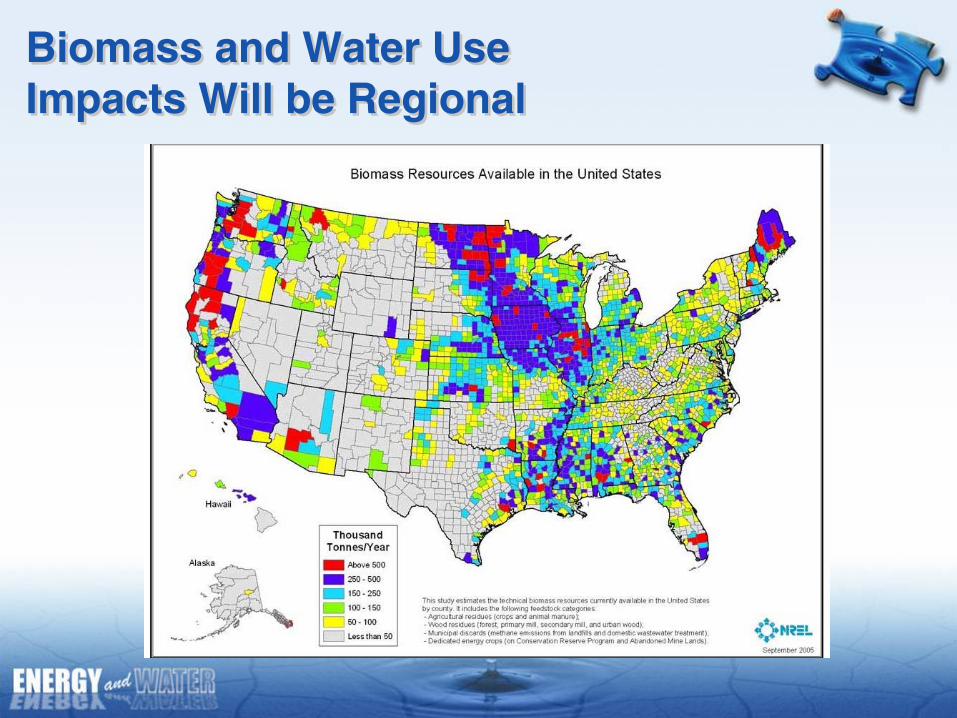
Biomass and Water Use Impacts Will be Regional
Biomass and Water Use Impacts Will be Regional

Oil Shale development will be regional and impact water availability and quality
Oil Shale development will be regional and impact water availability and quality
• Reserves are in areas of limited water resources
• Water needed for retorting, steam flushing, and cooling up to 2-5 gallons per gallon of fuel
• Concerns over in situ migration of retort by- products and impact on ground water quality

QUESTIONSQUESTIONS
Related Documents