Accepted Article 1 This article is protected by copyright. All rights reserved Original Research Article Nexavar/Stivarga and Viagra interact to kill tumor cells. † Mehrad Tavallai *1 , Hossein A. Hamed *1 , Jane L. Roberts *1 , Nichola Cruickshanks 1 , John Chuckalovcak 3 , Andrew Poklepovic 2 , Laurence Booth 1 , and Paul Dent 1# Departments of Biochemistry and Molecular Biology 1 , Medicine 2 , Virginia Commonwealth University, 401 College St., Richmond, VA 23298; Bio-Rad Laboratories 3 , 2000 Alfred Nobel Drive, Hercules CA 94547. Running Title: `rafenibs and sildenafil Key Words: Sorafenib, Sildenafil, Autophagy, Hepatoma, Colorectal, CD95, PDE5. Abbreviations: CMV: empty vector plasmid or virus; si: small interfering; SCR: scrambled; Ad: adenovirus; VEH: vehicle; SOR: sorafenib; REGO: regorafenib; SIL: sildenafil. Support for the present study was funded from PHS grants from the National Institutes of Health [R01-CA141704, R01- CA150214, R01-DK52825]. PD is the Universal Inc. Chair in Signal Transduction Research. The authors have no conflicts of interest. *co-first authorship #Correspondence to: Paul Dent 401 College Street Massey Cancer Center, Box 980035 Department of Biochemistry and Molecular Biology Virginia Commonwealth University Richmond VA 23298-0035. Tel: 804 628 0861 Fax: 804 827 1014 [email protected] † This article has been accepted for publication and undergone full peer review but has not been through the copyediting, typesetting, pagination and proofreading process, which may lead to differences between this version and the Version of Record. Please cite this article as doi: [10.1002/jcp.24961] Received 11 February 2015; Revised; Accepted 12 February 2015 Journal of Cellular Physiology This article is protected by copyright. All rights reserved DOI 10.1002/jcp.24961

Welcome message from author
This document is posted to help you gain knowledge. Please leave a comment to let me know what you think about it! Share it to your friends and learn new things together.
Transcript

Acc
epte
d A
rtic
le1
This article is protected by copyright. All rights reserved
Original Research Article
Nexavar/Stivarga and Viagra interact to kill tumor cells. †
Mehrad Tavallai
*1, Hossein A. Hamed
*1, Jane L. Roberts
*1, Nichola Cruickshanks
1,
John Chuckalovcak3, Andrew Poklepovic
2, Laurence Booth
1, and Paul Dent
1#
Departments of Biochemistry and Molecular Biology1, Medicine
2, Virginia Commonwealth University, 401 College St.,
Richmond, VA 23298; Bio-Rad Laboratories3, 2000 Alfred Nobel Drive, Hercules CA 94547.
Running Title: `rafenibs and sildenafil
Key Words: Sorafenib, Sildenafil, Autophagy, Hepatoma, Colorectal, CD95, PDE5.
Abbreviations: CMV: empty vector plasmid or virus; si: small interfering; SCR: scrambled; Ad: adenovirus; VEH:
vehicle; SOR: sorafenib; REGO: regorafenib; SIL: sildenafil.
Support for the present study was funded from PHS grants from the National Institutes of Health [R01-CA141704, R01-
CA150214, R01-DK52825]. PD is the Universal Inc. Chair in Signal Transduction Research. The authors have no
conflicts of interest.
*co-first authorship
#Correspondence to:
Paul Dent
401 College Street
Massey Cancer Center, Box 980035
Department of Biochemistry and Molecular Biology
Virginia Commonwealth University
Richmond VA 23298-0035.
Tel: 804 628 0861
Fax: 804 827 1014
†This article has been accepted for publication and undergone full peer review but has not been through the
copyediting, typesetting, pagination and proofreading process, which may lead to differences between this
version and the Version of Record. Please cite this article as doi: [10.1002/jcp.24961]
Received 11 February 2015; Revised; Accepted 12 February 2015
Journal of Cellular Physiology
This article is protected by copyright. All rights reserved
DOI 10.1002/jcp.24961
Acc
epte
d A
rtic
le2
This article is protected by copyright. All rights reserved
Abstract
We determined whether the multi-kinase inhibitor sorafenib or its derivative regorafenib interacted with
phosphodiesterase 5 (PDE5) inhibitors such as Viagra (sildenafil) to kill tumor cells. PDE5 and PDGFR
were over-expressed in liver tumors compared to normal liver tissue. In multiple cell types in vitro
sorafenib/regorafenib and PDE5 inhibitors interacted in a greater than additive fashion to cause tumor cell
death, regardless of whether cells were grown in 10% or 100% human serum. Knock down of PDE5 or of
PDGFR / recapitulated the effects of the individual drugs. The drug combination increased ROS/RNS levels
that were causal in cell killing. Inhibition of CD95 / FADD / caspase 8 signaling suppressed drug combination
toxicity. Knock down of ULK-1, Beclin1 or ATG5 suppressed drug combination lethality. The drug
combination inactivated ERK, AKT, p70 S6K and mTOR and activated JNK. The drug combination also
reduced mTOR protein expression. Activation of ERK or AKT was modestly protective whereas re-expression
of an activated mTOR protein or inhibition of JNK signaling almost abolished drug combination toxicity.
Sildenafil and sorafenib / regorafenib interacted in vivo to suppress xenograft tumor growth using liver and
colon cancer cells. From multiplex assays on tumor tissue and plasma we discovered that increased FGF levels
and ERBB1 and AKT phosphorylation were biomarkers that were directly associated with lower levels of cell
killing by „rafenib + sildenafil. Our data is now being translated into the clinic for further determination as to
whether this drug combination is a useful anti-tumor therapy for solid tumor patients. This article is protected
by copyright. All rights reserved
Acc
epte
d A
rtic
le3
This article is protected by copyright. All rights reserved
Introduction
Phosphodiesterase 5 (PDE5) inhibitors were originally developed as agents to manipulate cardio-vascular
biology that were in parallel noted to treat erectile dysfunction (Watanabe et al, 2002; Benavides et al, 2013).
Inhibition of PDE5 suppresses the degradation of cyclic GMP resulting in the activation of PKG (Francis et al,
2010). cGMP/PKG, through its stimulatory actions upon the ERK, p38 MAPK, JNK and NF B pathways can
increase the expression of inducible nitric oxide synthase (iNOS), resulting in the production of nitric oxide
(NO) (Komalavilas et al, 1999; Das et al, 2008; Choi et al, 2007; Musicki et al, 2014). NO and cGMP/PKG
have multiple cellular targets including (to name but a few) ion channels, receptors, phospholipases, Rho A,
altered protein nitrosylation, ceramide generation and death receptor signaling (Choi et al, 2007; Musicki et al,
2014; Florio et al, 2003; Russwurm et al, 2013; Kots et al, 2011; Hayden et al, 2001).
Prior studies from our laboratories have demonstrated that PDE5 inhibitors enhance the toxicities of multiple
well established cytotoxic chemotherapies (Booth et al, 2014; Booth et al, 2015; Das et al, 2010; Roberts et al,
2014). In these studies PDE5 inhibitors, in an NOS-dependent fashion, were show to enhance chemotherapy
killing through activation of the CD95 death receptor pathway, the generation of reactive oxygen species and
mitochondrial dysfunction. The mechanism(s) by which PDE5 inhibitors and chemotherapies interacted to
activate CD95 were not further explored.
Sorafenib and regorafenib are multi-kinase inhibitors approved for the treatment of liver and kidney, and colon
cancers, respectively (Carr et al, 2013). Sorafenib was originally developed as an inhibitor of RAF-1 in the
ERK1/2 pathway. The steady state (7 day) Cmax for sorafenib is ~21 M in plasma, with ~99% of the drug
protein bound based on in vitro human serum binding assays; though it is known that the drug is also rapidly
Acc
epte
d A
rtic
le4
This article is protected by copyright. All rights reserved
taken up into tissues, and in addition patient data from clinical trials would argue that a significant amount of
the drug has to be bioavailable, at least in the low micro-molar range, in a tumor based on its single agent
effects by decreasing both ERK1/2 phosphorylation and reducing MCL-1 protein expression in tumor cells that
are not specifically oncogene addicted (Elser et al, 2007; Hotte and Hirte, 2007). Indeed, it has been shown that
some sorafenib metabolites such as M2, M4 and M5 can have up to 10-fold greater activity than the parent drug
(Li et al, 2010; Inaba et al, 2011; Pratz et al, 2010). Our prior in vitro and in vivo data have tended to argue
using several sorafenib + “drug” combinations that PDGFR is a major target of sorafenib for its interactions
with other agents e.g. with histone deacetylase inhibitors (Park et al, 2010a; Park et al, 2010b, Martin et al,
2009).
A major biological effect of sorafenib is the induction of an endoplasmic stress (ER) / unfolded protein response
(UPR), with reduced expression of proteins that have short half-lives such as MCL-1 and BCL-XL (e.g. Martin
et al, 2009; Rahmani et al, 2007; Rahmani et al, 2005). Reduced MCL-1 levels due to sorafenib exposure have
been linked in many tumor types to increased levels of apoptosis. Studies by our group have also linked high
dose single agent sorafenib exposure to an increase in the levels of autophagic markers including increased
numbers of LC3-GFP vesicles and elevated expression of Beclin1 and ATG5; however lower sorafenib
concentrations only caused a modest transient alteration in autophagy flux (Park et al, 2010a; Park et al, 2010b;
Martin et al, 2009). Other studies from our groups have shown that based on the sorafenib dose the induction of
ER stress may be a “protective” or a “toxic” event in the cellular response to the drug (e.g. Rahmani et al,
2005).
The present studies determined whether the clinically relevant PDE5 inhibitors interacted with the multi-kinase
inhibitors sorafenib / regorafenib to kill tumor cells. Our data demonstrate a strong interaction between these
Acc
epte
d A
rtic
le5
This article is protected by copyright. All rights reserved
drugs in multiple tumor cell types with killing that is due to both death receptor activation and a toxic form of
autophagy. Biomarker studies reveal ERBB1/AKT signaling as a compensatory survival response.
Materials and Methods.
Materials.
Phospho-/total- antibodies were purchased from Cell Signaling Technologies (Danvers, MA) and Santa Cruz
Biotech. (Santa Cruz, CA). All drugs were purchased from Selleckchem (Houston, TX). Commercially
available validated short hairpin RNA molecules to knock down RNA / protein levels were from Qiagen
(Valencia, CA). Antibody reagents, other kinase inhibitors, caspase inhibitors cell culture reagents, and non-
commercial recombinant adenoviruses have been previously described (Park et al, 2010a; Park et al, 2010b;
Martin et al, 2009; Cruickshanks et al, 2013; Tang et al, 2012; Park et al, 2008). Cell lines were obtained from
the ATCC (Bethesda, MD) and were not further validated beyond the validation statements of the ATCC.
Tissue microarray and immunostaining. Human HCC tissue microarrays were purchased from Imgenex Corp.
Two tissue microarrays were used: one containing 40 primary HCC, 10 metastatic HCC and 9 normal adjacent
liver samples (Imgenex; IMH-360), the other containing 46 primary HCC and 13 metastatic HCC (Imgenex;
IMH-318). Antigen retrieval was performed by The Department of Pathology, VCU (with thanks to Dr. George
Alemara). Immuno-staining was performed using anti-PDE5 antibody (1:50) or using a mixture of anti-
PDGFR and anti-PDGFR antibodies (1:50, each). After immuno-staining, slides were H&E stained and
slides examined using a confocal microscope (X10).
Methods.
Cell culture and in vitro exposure of cells to drugs. All fully established cancer lines were cultured at 37 oC
(5% (v/v CO2) in vitro using RPMI supplemented with 10% (v/v) fetal calf serum and 10% (v/v) Non-
essential amino acids. For short-term cell killing assays and immunoblotting, cells were plated at a density
Acc
epte
d A
rtic
le6
This article is protected by copyright. All rights reserved
of 3 x 10³ per cm
2 and 24h after plating were treated with various drugs, as indicated. In vitro small
molecule inhibitor treatments were from a 100 mM stock solution of each drug and the maximal
concentration of Vehicle (DMSO) in media was 0.02% (v/v). Cells were not cultured in reduced serum
media during any study.
Cell treatments, SDS-PAGE and Western blot analysis. Cells were treated with various drug concentrations,
as indicated in the figure legends. SDS-PAGE and immunoblotting was performed as described in
references (Park et al, 2010a; Martin et al, 2009; Cruickshanks et al, 2013; Tang et al, 2012; Park et al,
2008). For SDS-PAGE and immunoblotting, cells were plated at 5 × 10⁵ cells/cm
2 and treated with drugs at
the indicated concentrations and after the indicated time of treatment, lysed in whole-cell lysis buffer (0.5 M
Tris-HCl, pH 6.8, 2% SDS, 10% glycerol, 1% β-mercaptoethanol, 0.02% bromophenol blue), and the
samples were boiled for 30 minutes. The boiled samples were loaded onto 10–14% SDS-PAGE and
electrophoresis was run overnight (10–100 μg/lane based on the gel size). Proteins were electrophoretically
transferred onto 0.22-μm nitrocellulose, and immunoblotted with various primary antibodies against
different proteins. All immunoblots were visualized using an Odyssey infrared imager (Li-Cor, Lincoln,
NE). For presentation, immunoblots were digitally assessed using the provided Odyssey imager software.
Images have their color removed and figures generated in Microsoft PowerPoint.
Recombinant adenoviral vectors; infection in vitro. We generated and purchased previously noted
recombinant adenoviruses as per refs. Cells were infected with these adenoviruses at an approximate m.o.i.
as indicated in the Figure / Legend (usually 50 m.o.i.). Cells were incubated for 24 h to ensure adequate
expression of transduced gene products prior to drug exposures.
Acc
epte
d A
rtic
le7
This article is protected by copyright. All rights reserved
Analysis of ROS levels ROS levels were determined in a vector 3 plate reader (PerkinElmer Life and
Analytical Sciences). In brief, cancer cells were plated in 96-well plates. Cells were loaded for 30 min with
either dihydro-DCF (10 M) which is sensitive to oxidation by hydroxyl radicals and peroxynitrite directly
and hydrogen peroxide; or 3-amino,4-aminomethyl-2',7'-difluorescein (DAF-FM DA, 4 M) which is
sensitive to oxidation by NO. Cells were treated with drugs and fluorescence measured 2h and 6h
afterwards. Data are presented corrected for basal fluorescence of vehicle-treated cells at each time point.
Detection of cell death by Trypan Blue and live/dead assays. For trypan blue assays floating cells were isolated
along with attached cells that were harvested by trypsinization with Trypsin/EDTA for ~10 min at 37 oC. For
live/dead assays in 96 well plates, plates were gently spun to sediment detached dead cells onto the plate. Cells
were then incubated with green-fluorescent calcein-AM to indicate intracellular esterase activity and red-
fluorescent di-ethidium bromide to detect cells with disrupted plasma membranes. Cells are visualized using a
Hermes Wiscan microscope with integrated imaging software to permit total cell counting and thus
determination of the percentage dead cells (5 fields per well; Green = alive; Yellow = dying; Red = dead).
Assessment of autophagy. Cells were transfected with a plasmid to express a green fluorescent protein (GFP)
and red fluorescent protein (RFP) tagged form of LC3 (ATG8). For analysis of cells transfected with the GFP-
RFP-LC3 construct, the GFP/RFP -positive vesicularized cells were examined under the X40 objective of a
Zeiss Axiovert fluorescent microscope.
Plasmid transfection.
Acc
epte
d A
rtic
le8
This article is protected by copyright. All rights reserved
Plasmids: Cells were plated as described above and 24 h after plating, transfected. Plasmids (0.5 g)
expressing a specific mRNA or appropriate vector control plasmid DNA was diluted in 50 l serum-free and
antibiotic-free medium (1 portion for each sample). Concurrently, 2 l Lipofectamine 2000 (Invitrogen), was
diluted into 50 l of serum-free and antibiotic-free medium. Diluted DNA was added to the diluted
Lipofectamine 2000 for each sample and incubated at room temperature for 30 min. This mixture was
added to each well / dish of cells containing 200 l serum-free and antibiotic-free medium for a total
volume of 300 l and the cells were incubated for 4h at 37oC. An equal volume of 2X medium was then
added to each well. Cells were incubated for 48h, then treated with drugs. To assess transfection efficiency
of plasmids we used a plasmid to express GFP and defined the percentage of cells being infected as the
percentage of GFP+ cells. For all cell lines the infection efficiency was > 70%.
siRNA: Cells were plated in 60 mm dishes from a fresh culture growing in log phase as described above, and
24h after plating transfected. Prior to transfection, the medium was aspirated and 1 ml serum-free medium was
added to each plate. For transfection, 10 nM of the annealed siRNA, the positive sense control doubled stranded
siRNA targeting GAPDH or the negative control (a “scrambled” sequence with no significant homology to any
known gene sequences from mouse, rat or human cell lines) were used (predominantly Qiagen, Valencia, CA;
occasional alternate siRNA molecules were purchased from Ambion, Inc., Austin, Texas). Ten nM siRNA
(scrambled or experimental) was diluted in serum-free media. Four μl Hiperfect (Qiagen) was added to this
mixture and the solution was mixed by pipetting up and down several times. This solution was incubated at
room temp for 10 min, then added drop-wise to each dish. The medium in each dish was swirled gently to mix,
then incubated at 37 oC for 2h. One ml of 10% (v/v) serum-containing medium was added to each plate, and
cells were incubated at 37 oC for 24-48h before re-plating (50 x 10
3 cells each) onto 12-well plates. Cells were
allowed to attach overnight, then treated with drugs (0-48h). Trypan blue exclusion assays and SDS PAGE /
immunoblotting analyses were then performed at the indicated time points.
Acc
epte
d A
rtic
le9
This article is protected by copyright. All rights reserved
Mass spectrometry measurements. Equal numbers of cells (5.98 +/- 0.02 x 10⁶) cells were treated for 6h and
lipids were extracted. Bioactive lipid levels were quantified by liquid chromatography–electrospray ionization–
tandem mass spectrometry (LC-ESI-MS/MS) with a Shimadzu LC-20AD binary pump HPLC system
(Shimadzu, Kyoto, Japan) and an Applied Biosystems 4000 QTRAP operating in a triple quadrupole mode, as
described previously (see Hait et al, 2009 for additional Methodological details).
Tumor growth studies. Athymic female NCr-nu/nu mice (National Cancer Institute) weighing 20 g were used
for human tumor xenograft studies. Mice were maintained under pathogen-free conditions in facilities approved
by the American Association for Accreditation of Laboratory Animal Care and in accordance with current
regulations and standards of the US Department of Agriculture, the US Department of Health and Human
Services, and the National Institutes of Health. Mice were injected with 0.5 × 10⁷ HuH7/HT29 cells unless
otherwise indicated (∼40 mice per separate experiment to obtain at least four usable tumors per group) in 10 μl
of growth medium. HuH7/HT29 cells were in the flank. Seven days after tumor cell implantation mice were PO
administered drugs or the drug combination QD for 3 days (HuH7 tumors) or 7 days (HT29 tumors). Animals
were monitored daily and tumor volume determined as indicated in the Figures. When the volume of the tumor
reached >1,500 mm3, animals were humanely sacrificed and the tumor and blood removed for further studies.
Animal survival was plotted on a Kaplan Meier graph and longitudinal statistical assays performed.
Multiplex assays for cytokine expression. A MAGPIX multiplex instrument with associated software was
purchased from Bio-Rad. The following Bio-Plex assay plates were used in our assays of mouse plasma for
human cytokines: Bio-Plex Pro Human Cytokine Group I 4-plex (Y500023JM2); Human CYTO STD GRP II
23-PLEX (171D60001); Human CYTO HGF set (171B6008M); Human CYTO SDF-1a set (171B6019M); Pro
Human Cancer 2 18-plex (171AC600M); BP Pro TGF-B 3-PLEX (171W4001M). Mouse plasma was assayed
Acc
epte
d A
rtic
le10
This article is protected by copyright. All rights reserved
according to the instructions provided by Bio-Rad and with Bio-Rad technical assistance to assess human
cytokine levels derived from the HT29 and HuH7 tumors.
Multiplex assays for signal transduction protein phosphorylation and expression. The following Bio-Plex assay
plates were used in our assays for tumor cell signal transduction proteins: Bio-Plex Bio-Plex Pro
Phosphoprotein magnetic 8-plex Assay (LQ00004IXUYDC4); Bio-Plex Pro Phosphoprotein magnetic 15-plex
Assay (LQ000064Q3MJ1). Tumor lysates were assayed according to the instructions provided by Bio-Rad and
with Bio-Rad technical assistance to assess human signaling changes derived from the HT29 and HuH7 tumors.
Ex vivo manipulation of tumors Animals were euthanized by CO2 and placed in a BL2 cell culture hood on a
sterile barrier mat. The bodies of the mice were soaked with 70% (v/v) EtOH and the abdominal skin around the
tumor removed using small scissors, forceps and a disposable scalpel. These implements were flame sterilized
between removal of the outer and inner layers of skin. The tumor was removed and placed in a 10 cm dish
containing 5 ml of RPMI cell culture media, on ice. The tumor sample that had been placed in RPMI was
minced with a sterile disposable scalpel into the smallest possible pieces then placed in a sterile disposable
flask. The dish was rinsed with 6.5 ml of RPMI medium which was then added to the flask. A 10x solution of
collagenase (Sigma, St. Louis MO; 2.5 ml, 28 U/ml final concentration) and 10x of enzyme mixture containing
DNAse (Sigma, St. Louis MO; 308 U/ml final concentration) and pronase (EMD Sciences, San Diego CA;
22,500 U/ml final concentration) in a volume of 1 ml was added to the flask. The flasks were placed into an
orbital shaking incubator at 37°C for 1.5 hours at 150 rpm. Following digestion, the solution was passed
through a 0.4 μM filter into a 50 ml conical tube. After mixing, a sample was removed for viable and total cell
counting using a hemacytometer. Cells were centrifuged at 500 x g for 4 min, the supernatant removed, and
fresh RPMI media containing 10% (v/v) fetal calf serum was added to give a final resuspended cell
Acc
epte
d A
rtic
le11
This article is protected by copyright. All rights reserved
concentration of 1 × 10⁶ cells / ml. Cells were diluted and plated in 6 well dishes in triplicate at a concentration
of 0.1-10.0 × 10³ cells / well.
Data analysis. Comparison of the effects of various treatments was performed using one way analysis of
variance and a two tailed Student‟s t-test. Median dose effect isobologram analyses to determine synergism
of drug interaction were done according to the methods of Chou and Talalay using the CalcuSyn program
for Windows (Biosoft). Cells are treated with agents at a fixed concentration dose. A combination index
(CI) value of <1.00 indicates synergy of interaction between the drugs, a value of 1.00 indicates additivity,
and a value of >1.00 equates to antagonism of action between the agents. Statistical examination of in vivo
animal survival data utilized log rank statistical analyses between the different treatment groups. Differences
with a p-value of < 0.05 were considered statistically significant. Experiments shown are the means of
multiple individual points from multiple experiments (± SEM).
Acc
epte
d A
rtic
le12
This article is protected by copyright. All rights reserved
Results
Initial studies examined the dose-response of death receptor CD95 expressing HEP3B tumor cells to increasing
concentrations of sorafenib and the PDE5 inhibitor Viagra (sildenafil). Sildenafil enhanced sorafenib toxicity in
a dose-dependent fashion (Figure 1A). Sildenafil interacted with sorafenib to kill hepatoma cells, regardless of
whether the tumor cell expressed CD95, i.e. HuH7 are CD95 null (Figure 1B). Regorafenib is a derivative of
sorafenib with greater solubility and potency in vitro and in vivo that the parent compound sorafenib. Similar
data to that with sorafenib was obtained using regorafenib in combination with sildenafil (Figure 1C). Sildenafil
interacted with regorafenib to kill hepatoma cells, regardless of whether the tumor cell expressed CD95 (Figure
1D). Similar data were obtained using other PDE5 inhibitors such as Cialis and Levitra (data not shown).
Sildenafil and sorafenib also interacted with sildenafil to kill multiple other tumor cell types (Figure 1E). Of
particular note, when tumor cells were cultured in 100% heat inactivated human serum, concentrations of
sorafenib / regorafenib at one quarter of their steady state C max values were still capable of interacting with
sildenafil to rapidly kill tumor cells (Figure 1F). This data strongly argues that the hypothesis of Houghton and
Smith regarding low levels of active free sorafenib concentrations in patient plasma is very probably incorrect
(Smith and Houghton, 2013). In colony formation assays sildenafil and sorafenib / regorafenib interacted in a
synergistic fashion to kill tumor cells, with combination index (CI) values of less than ~0.70 (Table 1).
We next determined the relative expression of PDE5 and PDGFR in normal liver and in hepatoma, as
well as on- and off-target effects of our drugs in promoting drug combination killing. PDE5 was over-
expressed in hepatocellular carcinoma tissues but not in normal liver from the same patient (Figure 2A;
similar data were obtained in multiple other samples, Figure 2B). Knock down of PDE5 expression
enhanced regorafenib toxicity in CD95 null HuH7 cells (Figure 2C). In prior studies we have shown that
PDGFR / play an important role in the biology of sorafenib in terms of its toxic combination with other
therapeutic agents such as histone deacetylase inhibitors (Park et al, 2010; Martin et al, 2009; Cruickshanks
et al, 2013). PDGFR was over-expressed in hepatocellular carcinoma tissues but not in normal liver
Acc
epte
d A
rtic
le13
This article is protected by copyright. All rights reserved
tissue from the same patient (Figure 2D). Knock down of PDGFR / expression enhanced the toxicity
sildenafil in tumor cells (Figure 2E).
We next attempted to define whether biomarkers of regorafenib and sildenafil i.e. physiologic effects, could
be observed in tumor cells. Sildenafil treatment increased phosphorylation of VASP-1 (S239), which is a
known cGMP dependent kinase (PKG) site (Figures 3A-3E). Identical data were obtained when cells were
treated with dibutyrl-cGMP (data not shown). Prior studies using sorafenib had shown that the drug could
cause a modest endoplasmic reticulum stress response, with increased phosphorylation of eIF2 (S51) (Park
et al, 2008). Regorafenib treatment increased eIF2 (S51) phosphorylation (Figures 3A-3E). Studies in
future Figures make use of the drug FTY720 (Gilenya, Fingolimod) which is a histone deacetylase inhibitor;
an inhibitor of sphingosine-1-phosphate production and also down-regulates expression of sphingosine-1-
phosphate receptors, e.g. EDG-1. Treatment of tumor cells for 6h with FTY720 abolished expression of
EDG-1 (Figure 3F). Of additional note, combined treatment of cells with regorafenib and sildenafil also
abolished EDG-1 expression within 6h. Expression of a dominant negative eIF2 (S51A) protein abolished
the ability of [regorafenib + sildenafil] treatment to reduce EDG-1 expression within 6h (Figure 3G).
Inhibition of the PERK-eIF2 -ATF4-CHOP pathway protected cells from combination treatment lethality
(Figure 3H).
Treatment of cells with regorafenib and sildenafil reduced the expression of HSP70, GRP78 and GRP58,
but weakly modulated GRP94 levels (Figure 3I). Sildenafil increased the nitration of HSP90, indicative of
reduced HSP90 chaperone function (Figure 3J). Over-expression of GRP78 protected cells against
regorafenib and sildenafil toxicity (Figure 3K). Treatment of tumor cells with [regorafenib + sildenafil]
treatment also rapidly reduced the expression of multiple other growth factor receptors (Figures 3L-3N).
Acc
epte
d A
rtic
le14
This article is protected by copyright. All rights reserved
Over-expression of the chaperone protein GRP78 reduced the ability of [regorafenib + sildenafil] treatment
to reduce expression of growth factor receptors and plasma membrane transporters (Figure 3O). Compared
to changes in the expression of many other growth factor receptors, the expression of c-MET was more
modestly down-regulated by regorafenib and sildenafil treatment, however, use of the potent clinically
relevant c-MET inhibitor crizotinib at a supra-physiologic concentration did not noticeably enhance
[regorafenib + sildenafil] lethality in liver or colon cancer cells (Figure 3P).
PDE5 inhibitors are known to enhance the levels of reactive oxygen and reactive nitrogen species in cells
(e.g. Das et al, 2010; Musicki et al, 2014). Treatment of tumor cells with sildenafil and regorafenib rapidly
increased the levels of ROS and RNS (Figure 4A). Inhibition of nitric oxide synthase enzymes using L-NG-
Nitroarginine Methyl Ester (L-NAME) inhibited cell killing by sildenafil and sorafenib, as did quenching of
ROS production by incubation with N-acetyl cysteine (NAC) or by expression of thioredoxin (TRX) (Figure
4B). Knock down of inducible nitric oxide synthase (iNOS) or endothelial nitric oxide synthase (eNOS)
expression suppressed killing by the drug combination (Figure 4C). Of note, knock down of iNOS abolished
the drug combination interaction but did not alter sorafenib toxicity as a single agent, whereas knock down
of eNOS modestly but significantly reduced sorafenib toxicity. Sorafenib and sildenafil were still capable of
interacting to kill in cells lacking eNOS expression. The combination of sildenafil and sorafenib surprisingly
increased iNOS expression (Figure 4D).
In prior studies we have shown that sorafenib as a single agent can modestly promote increased numbers of
autophagosomes (Park et al, 2010a; Park et al, 2010b; Martin et al, 2009; Cruickshanks et al, 2013; Park et
al, 2008). Treatment of cells with sildenafil and sorafenib increased the numbers of autophagosomes and
autolysosomes in a greater than additive fashion (Figures 5A and 5B). The increase in the numbers of
autophagosomes and autolysosomes was suppressed by incubation of cells with either L-NAME or NAC.
Acc
epte
d A
rtic
le15
This article is protected by copyright. All rights reserved
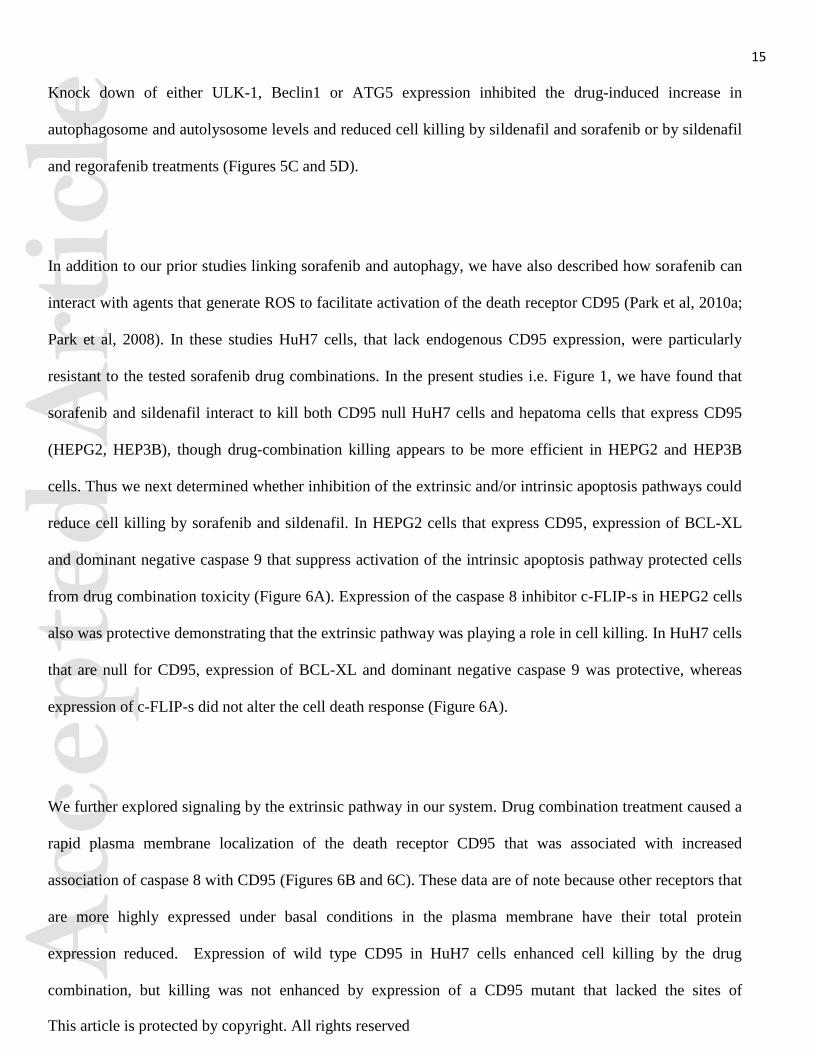
Knock down of either ULK-1, Beclin1 or ATG5 expression inhibited the drug-induced increase in
autophagosome and autolysosome levels and reduced cell killing by sildenafil and sorafenib or by sildenafil
and regorafenib treatments (Figures 5C and 5D).
In addition to our prior studies linking sorafenib and autophagy, we have also described how sorafenib can
interact with agents that generate ROS to facilitate activation of the death receptor CD95 (Park et al, 2010a;
Park et al, 2008). In these studies HuH7 cells, that lack endogenous CD95 expression, were particularly
resistant to the tested sorafenib drug combinations. In the present studies i.e. Figure 1, we have found that
sorafenib and sildenafil interact to kill both CD95 null HuH7 cells and hepatoma cells that express CD95
(HEPG2, HEP3B), though drug-combination killing appears to be more efficient in HEPG2 and HEP3B
cells. Thus we next determined whether inhibition of the extrinsic and/or intrinsic apoptosis pathways could
reduce cell killing by sorafenib and sildenafil. In HEPG2 cells that express CD95, expression of BCL-XL
and dominant negative caspase 9 that suppress activation of the intrinsic apoptosis pathway protected cells
from drug combination toxicity (Figure 6A). Expression of the caspase 8 inhibitor c-FLIP-s in HEPG2 cells
also was protective demonstrating that the extrinsic pathway was playing a role in cell killing. In HuH7 cells
that are null for CD95, expression of BCL-XL and dominant negative caspase 9 was protective, whereas
expression of c-FLIP-s did not alter the cell death response (Figure 6A).
We further explored signaling by the extrinsic pathway in our system. Drug combination treatment caused a
rapid plasma membrane localization of the death receptor CD95 that was associated with increased
association of caspase 8 with CD95 (Figures 6B and 6C). These data are of note because other receptors that
are more highly expressed under basal conditions in the plasma membrane have their total protein
expression reduced. Expression of wild type CD95 in HuH7 cells enhanced cell killing by the drug
combination, but killing was not enhanced by expression of a CD95 mutant that lacked the sites of
Acc
epte
d A
rtic
le16
This article is protected by copyright. All rights reserved
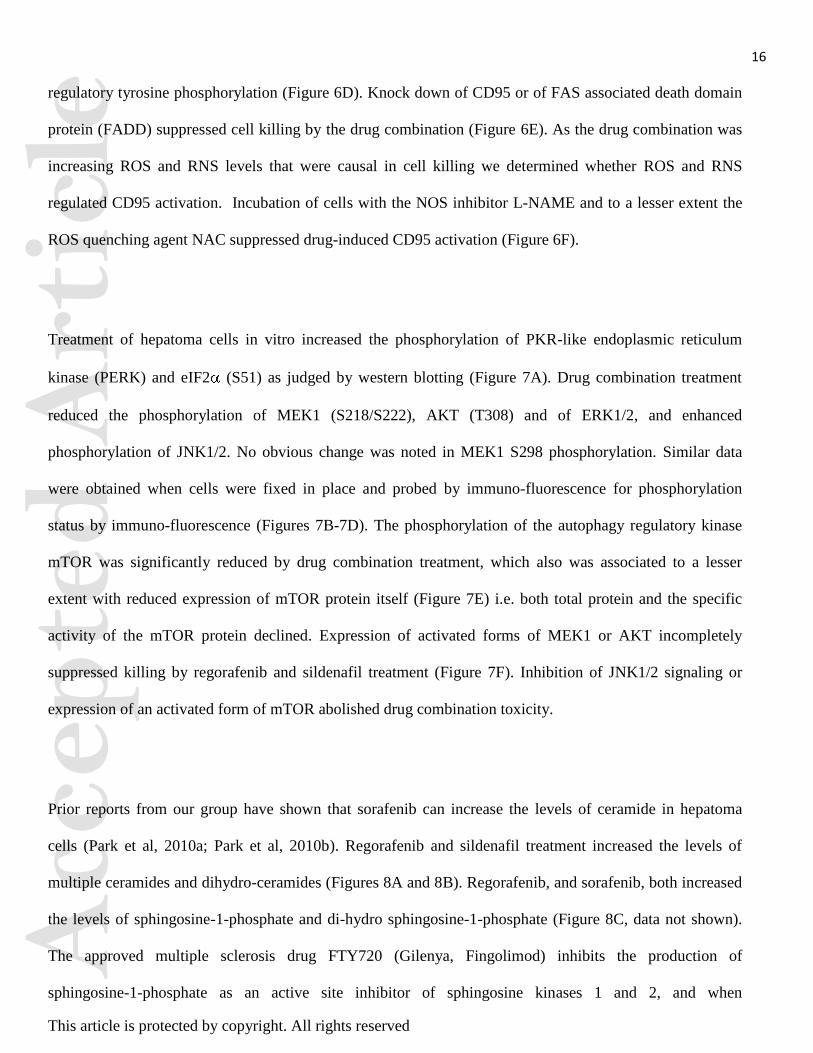
regulatory tyrosine phosphorylation (Figure 6D). Knock down of CD95 or of FAS associated death domain
protein (FADD) suppressed cell killing by the drug combination (Figure 6E). As the drug combination was
increasing ROS and RNS levels that were causal in cell killing we determined whether ROS and RNS
regulated CD95 activation. Incubation of cells with the NOS inhibitor L-NAME and to a lesser extent the
ROS quenching agent NAC suppressed drug-induced CD95 activation (Figure 6F).
Treatment of hepatoma cells in vitro increased the phosphorylation of PKR-like endoplasmic reticulum
kinase (PERK) and eIF2 (S51) as judged by western blotting (Figure 7A). Drug combination treatment
reduced the phosphorylation of MEK1 (S218/S222), AKT (T308) and of ERK1/2, and enhanced
phosphorylation of JNK1/2. No obvious change was noted in MEK1 S298 phosphorylation. Similar data
were obtained when cells were fixed in place and probed by immuno-fluorescence for phosphorylation
status by immuno-fluorescence (Figures 7B-7D). The phosphorylation of the autophagy regulatory kinase
mTOR was significantly reduced by drug combination treatment, which also was associated to a lesser
extent with reduced expression of mTOR protein itself (Figure 7E) i.e. both total protein and the specific
activity of the mTOR protein declined. Expression of activated forms of MEK1 or AKT incompletely
suppressed killing by regorafenib and sildenafil treatment (Figure 7F). Inhibition of JNK1/2 signaling or
expression of an activated form of mTOR abolished drug combination toxicity.
Prior reports from our group have shown that sorafenib can increase the levels of ceramide in hepatoma
cells (Park et al, 2010a; Park et al, 2010b). Regorafenib and sildenafil treatment increased the levels of
multiple ceramides and dihydro-ceramides (Figures 8A and 8B). Regorafenib, and sorafenib, both increased
the levels of sphingosine-1-phosphate and di-hydro sphingosine-1-phosphate (Figure 8C, data not shown).
The approved multiple sclerosis drug FTY720 (Gilenya, Fingolimod) inhibits the production of
sphingosine-1-phosphate as an active site inhibitor of sphingosine kinases 1 and 2, and when

Acc
epte
d A
rtic
le17
This article is protected by copyright. All rights reserved
phosphorylated by these kinases also down-regulates the expression of the S1P receptor 1 (EDG-1, see
Figure 2). Treatment of cells with low clinically relevant concentrations of FTY720 suppressed the ability of
regorafenib to increase sphingosine-1-phosphate levels, and also increased the production of ceramide
species by regorafenib (Figure 8C). Furthermore, at early time points, prior to evident toxicity caused by
[regorafenib + sildenafil], or by FTY720 treatment as a single agent, the combination of [regorafenib +
sildenafil + FTY720] caused tumor cell killing (Figures 8D and 8E). Similar data to that generated using
FTY720 were obtained using histone deacetylase inhibitors; the well-established chemotherapy drug all-
trans retinoic acid (ATRA); and ionizing radiation (Figures 8F-8I). The effect of vorinostat is in
concordance with our pre-clinical and clinical findings that some hepatocellular tumors are effectively
inhibited in their growth and radiosensitized by sorafenib and vorinostat treatment (see our on-going phase I
trial NCT01075113, Dent and Poklepovic, unpublished observations).
FTY720 is an HDAC inhibitor and we discovered, similar to our prior data with vorinostat and valproate,
that FTY720 treatment increased the expression of CD95 and FAS ligand (Figure 8J). We also discovered
that sildenafil treatment of cells increased the nitrosylation and inactivation of I B and that expression of a
dominant negative I B S32A S36A protein abolished the induction of CD95 (Figure 8K). Of note: HT29
colon cancer cells express a mutant p53, CD95 and a wild type K-RAS; HCT116 colon cancer cells express
a wild type p53, CD95 and a mutant K-RAS; HEPG2 hepatoma cells express a wild type p53, CD95 and a
mutant N-RAS; HEP3B hepatoma cells express a mutant p53, CD95, wild type RAS proteins and a variety
of proteins associated with stable infection by Hepatitis B virus; HuH7 hepatoma cells express a mutant
p53, lack CD95 expression and have wild type RAS proteins.
FTY720, in addition to its regulatory role in S1P metabolism and biology, has also been shown to act as a
histone deacetylase inhibitor (HDAC inhibitor) and in a recent manuscript was shown to increase VEGF-D
Acc
epte
d A
rtic
le18
This article is protected by copyright. All rights reserved
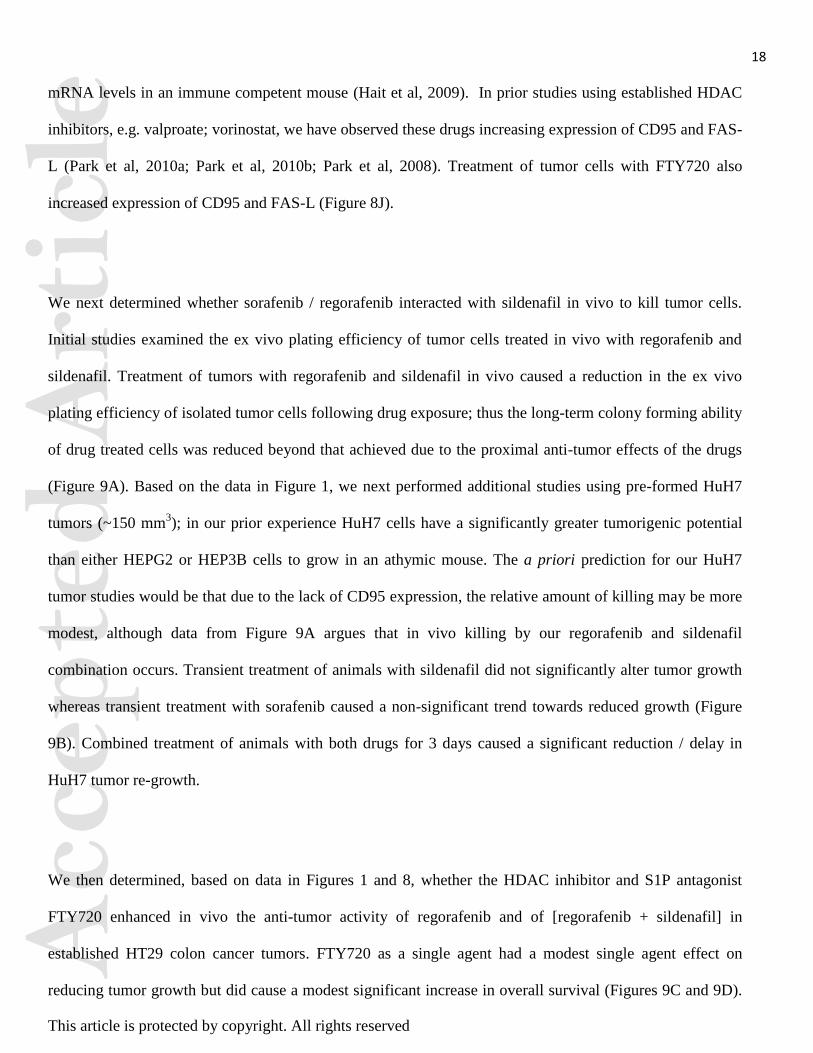
mRNA levels in an immune competent mouse (Hait et al, 2009). In prior studies using established HDAC
inhibitors, e.g. valproate; vorinostat, we have observed these drugs increasing expression of CD95 and FAS-
L (Park et al, 2010a; Park et al, 2010b; Park et al, 2008). Treatment of tumor cells with FTY720 also
increased expression of CD95 and FAS-L (Figure 8J).
We next determined whether sorafenib / regorafenib interacted with sildenafil in vivo to kill tumor cells.
Initial studies examined the ex vivo plating efficiency of tumor cells treated in vivo with regorafenib and
sildenafil. Treatment of tumors with regorafenib and sildenafil in vivo caused a reduction in the ex vivo
plating efficiency of isolated tumor cells following drug exposure; thus the long-term colony forming ability
of drug treated cells was reduced beyond that achieved due to the proximal anti-tumor effects of the drugs
(Figure 9A). Based on the data in Figure 1, we next performed additional studies using pre-formed HuH7
tumors (~150 mm3); in our prior experience HuH7 cells have a significantly greater tumorigenic potential
than either HEPG2 or HEP3B cells to grow in an athymic mouse. The a priori prediction for our HuH7
tumor studies would be that due to the lack of CD95 expression, the relative amount of killing may be more
modest, although data from Figure 9A argues that in vivo killing by our regorafenib and sildenafil
combination occurs. Transient treatment of animals with sildenafil did not significantly alter tumor growth
whereas transient treatment with sorafenib caused a non-significant trend towards reduced growth (Figure
9B). Combined treatment of animals with both drugs for 3 days caused a significant reduction / delay in
HuH7 tumor re-growth.
We then determined, based on data in Figures 1 and 8, whether the HDAC inhibitor and S1P antagonist
FTY720 enhanced in vivo the anti-tumor activity of regorafenib and of [regorafenib + sildenafil] in
established HT29 colon cancer tumors. FTY720 as a single agent had a modest single agent effect on
reducing tumor growth but did cause a modest significant increase in overall survival (Figures 9C and 9D).
Acc
epte
d A
rtic
le19
This article is protected by copyright. All rights reserved
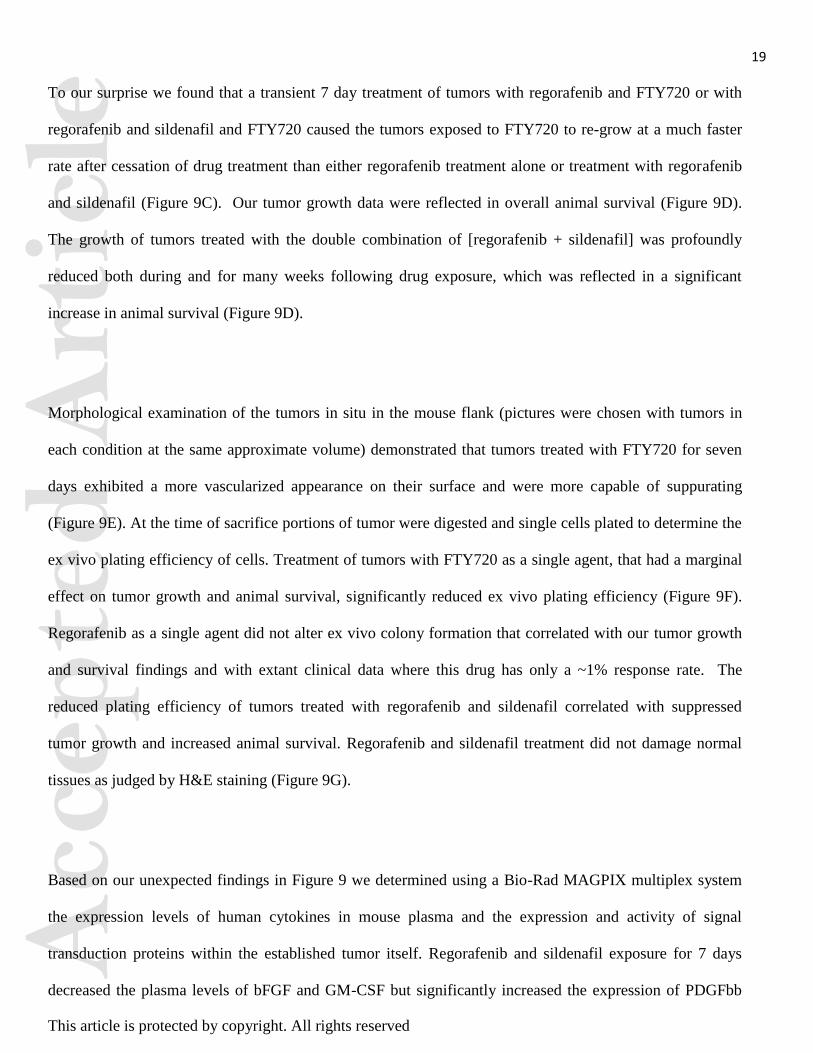
To our surprise we found that a transient 7 day treatment of tumors with regorafenib and FTY720 or with
regorafenib and sildenafil and FTY720 caused the tumors exposed to FTY720 to re-grow at a much faster
rate after cessation of drug treatment than either regorafenib treatment alone or treatment with regorafenib
and sildenafil (Figure 9C). Our tumor growth data were reflected in overall animal survival (Figure 9D).
The growth of tumors treated with the double combination of [regorafenib + sildenafil] was profoundly
reduced both during and for many weeks following drug exposure, which was reflected in a significant
increase in animal survival (Figure 9D).
Morphological examination of the tumors in situ in the mouse flank (pictures were chosen with tumors in
each condition at the same approximate volume) demonstrated that tumors treated with FTY720 for seven
days exhibited a more vascularized appearance on their surface and were more capable of suppurating
(Figure 9E). At the time of sacrifice portions of tumor were digested and single cells plated to determine the
ex vivo plating efficiency of cells. Treatment of tumors with FTY720 as a single agent, that had a marginal
effect on tumor growth and animal survival, significantly reduced ex vivo plating efficiency (Figure 9F).
Regorafenib as a single agent did not alter ex vivo colony formation that correlated with our tumor growth
and survival findings and with extant clinical data where this drug has only a ~1% response rate. The
reduced plating efficiency of tumors treated with regorafenib and sildenafil correlated with suppressed
tumor growth and increased animal survival. Regorafenib and sildenafil treatment did not damage normal
tissues as judged by H&E staining (Figure 9G).
Based on our unexpected findings in Figure 9 we determined using a Bio-Rad MAGPIX multiplex system
the expression levels of human cytokines in mouse plasma and the expression and activity of signal
transduction proteins within the established tumor itself. Regorafenib and sildenafil exposure for 7 days
decreased the plasma levels of bFGF and GM-CSF but significantly increased the expression of PDGFbb
Acc
epte
d A
rtic
le20
This article is protected by copyright. All rights reserved
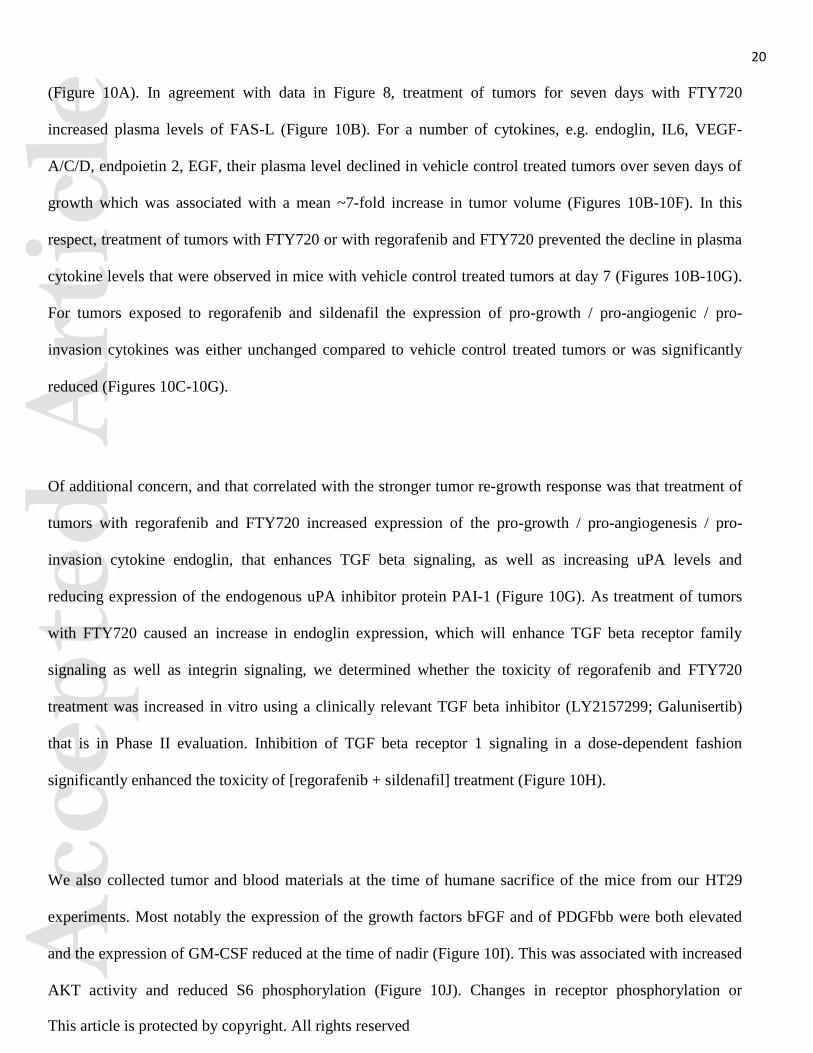
(Figure 10A). In agreement with data in Figure 8, treatment of tumors for seven days with FTY720
increased plasma levels of FAS-L (Figure 10B). For a number of cytokines, e.g. endoglin, IL6, VEGF-
A/C/D, endpoietin 2, EGF, their plasma level declined in vehicle control treated tumors over seven days of
growth which was associated with a mean ~7-fold increase in tumor volume (Figures 10B-10F). In this
respect, treatment of tumors with FTY720 or with regorafenib and FTY720 prevented the decline in plasma
cytokine levels that were observed in mice with vehicle control treated tumors at day 7 (Figures 10B-10G).
For tumors exposed to regorafenib and sildenafil the expression of pro-growth / pro-angiogenic / pro-
invasion cytokines was either unchanged compared to vehicle control treated tumors or was significantly
reduced (Figures 10C-10G).
Of additional concern, and that correlated with the stronger tumor re-growth response was that treatment of
tumors with regorafenib and FTY720 increased expression of the pro-growth / pro-angiogenesis / pro-
invasion cytokine endoglin, that enhances TGF beta signaling, as well as increasing uPA levels and
reducing expression of the endogenous uPA inhibitor protein PAI-1 (Figure 10G). As treatment of tumors
with FTY720 caused an increase in endoglin expression, which will enhance TGF beta receptor family
signaling as well as integrin signaling, we determined whether the toxicity of regorafenib and FTY720
treatment was increased in vitro using a clinically relevant TGF beta inhibitor (LY2157299; Galunisertib)
that is in Phase II evaluation. Inhibition of TGF beta receptor 1 signaling in a dose-dependent fashion
significantly enhanced the toxicity of [regorafenib + sildenafil] treatment (Figure 10H).
We also collected tumor and blood materials at the time of humane sacrifice of the mice from our HT29
experiments. Most notably the expression of the growth factors bFGF and of PDGFbb were both elevated
and the expression of GM-CSF reduced at the time of nadir (Figure 10I). This was associated with increased
AKT activity and reduced S6 phosphorylation (Figure 10J). Changes in receptor phosphorylation or
Acc
epte
d A
rtic
le21
This article is protected by copyright. All rights reserved
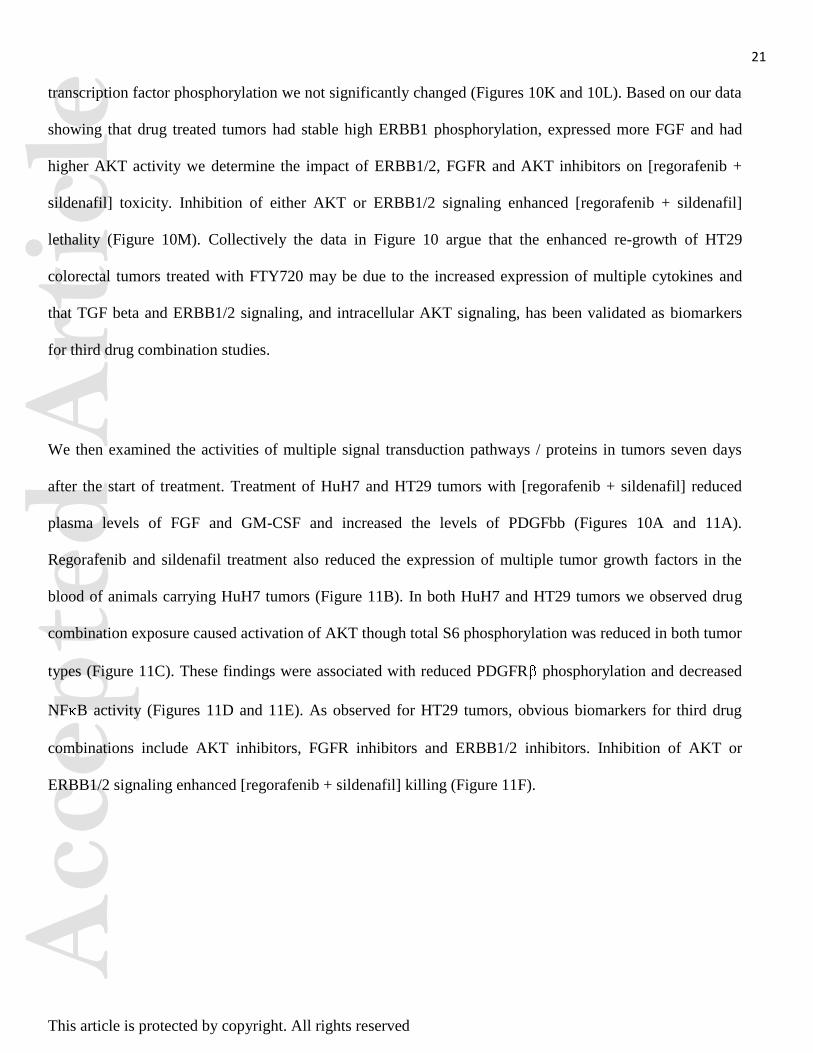
transcription factor phosphorylation we not significantly changed (Figures 10K and 10L). Based on our data
showing that drug treated tumors had stable high ERBB1 phosphorylation, expressed more FGF and had
higher AKT activity we determine the impact of ERBB1/2, FGFR and AKT inhibitors on [regorafenib +
sildenafil] toxicity. Inhibition of either AKT or ERBB1/2 signaling enhanced [regorafenib + sildenafil]
lethality (Figure 10M). Collectively the data in Figure 10 argue that the enhanced re-growth of HT29
colorectal tumors treated with FTY720 may be due to the increased expression of multiple cytokines and
that TGF beta and ERBB1/2 signaling, and intracellular AKT signaling, has been validated as biomarkers
for third drug combination studies.
We then examined the activities of multiple signal transduction pathways / proteins in tumors seven days
after the start of treatment. Treatment of HuH7 and HT29 tumors with [regorafenib + sildenafil] reduced
plasma levels of FGF and GM-CSF and increased the levels of PDGFbb (Figures 10A and 11A).
Regorafenib and sildenafil treatment also reduced the expression of multiple tumor growth factors in the
blood of animals carrying HuH7 tumors (Figure 11B). In both HuH7 and HT29 tumors we observed drug
combination exposure caused activation of AKT though total S6 phosphorylation was reduced in both tumor
types (Figure 11C). These findings were associated with reduced PDGFR phosphorylation and decreased
NF B activity (Figures 11D and 11E). As observed for HT29 tumors, obvious biomarkers for third drug
combinations include AKT inhibitors, FGFR inhibitors and ERBB1/2 inhibitors. Inhibition of AKT or
ERBB1/2 signaling enhanced [regorafenib + sildenafil] killing (Figure 11F).

Acc
epte
d A
rtic
le22
This article is protected by copyright. All rights reserved
Discussion
Our data demonstrated that PDE5 inhibitors and sorafenib/regorafenib interact in a greater than additive
fashion to kill a genetically diverse set of hepatoma / colon cancer cells in vitro and in vivo. Knock down of
PDE5 recapitulated the combinatorial effect of a PDE5 inhibitor when combined with sorafenib. And, knock
down of PDGFR / recapitulated the combinatorial effect of sorafenib when combined with a PDE5
inhibitor. PDE5 inhibitors are known to enhance cGMP and NO levels; inhibition of NOS enzymes by L-
NAME prevented the killing interaction between sildenafil and sorafenib.
Hepatoma cells which lack CD95 expression, e.g. HuH7, are more resistant to sorafenib in combination
with histone deacetylase inhibitors. In the present studies HuH7 cells were readily killed by the combination
of sorafenib and PDE5 inhibitors. In cells expressing CD95, inhibition of the extrinsic / CD95 pathway
blocked cell killing whereas in HuH7 cells killing was due to activation of the mitochondrial / intrinsic
pathway. Activation of CD95 was suppressed by inhibition of NOS enzymes. Studies by others have shown
that nitrosylation of CD95 at its regulatory tyrosine residues inhibits CD95 signaling (Reinehr et al, 2004).
Others however have argued that NO signaling and CD95 activation can cooperate to induce cell death
(Gandelman et al, 2013; Gonzalez et al, 2013).
In addition to activating the extrinsic apoptosis pathway, the drug combination also increased the numbers
of autophagosomes and autolysosomes, i.e. “autophagy,” in a time dependent fashion that was inhibited by
incubation of the cells with L-NAME. Inhibition of autophagy suppressed cell killing. Nitric oxide signaling
has been linked by others to the regulation of autophagy; in some primary non-transformed cells NO can
inhibit autophagy by inhibiting JNK signaling (Shen et al, 2014; Benavides et al, 2013). In some
transformed cells NO signaling can promote autophagy in an mTOR-dependent fashion which seems to play
a role in tumor cell killing (Tripathi et al, 2013; Yu et al, 2012). We discovered that the drug combination
Acc
epte
d A
rtic
le23
This article is protected by copyright. All rights reserved
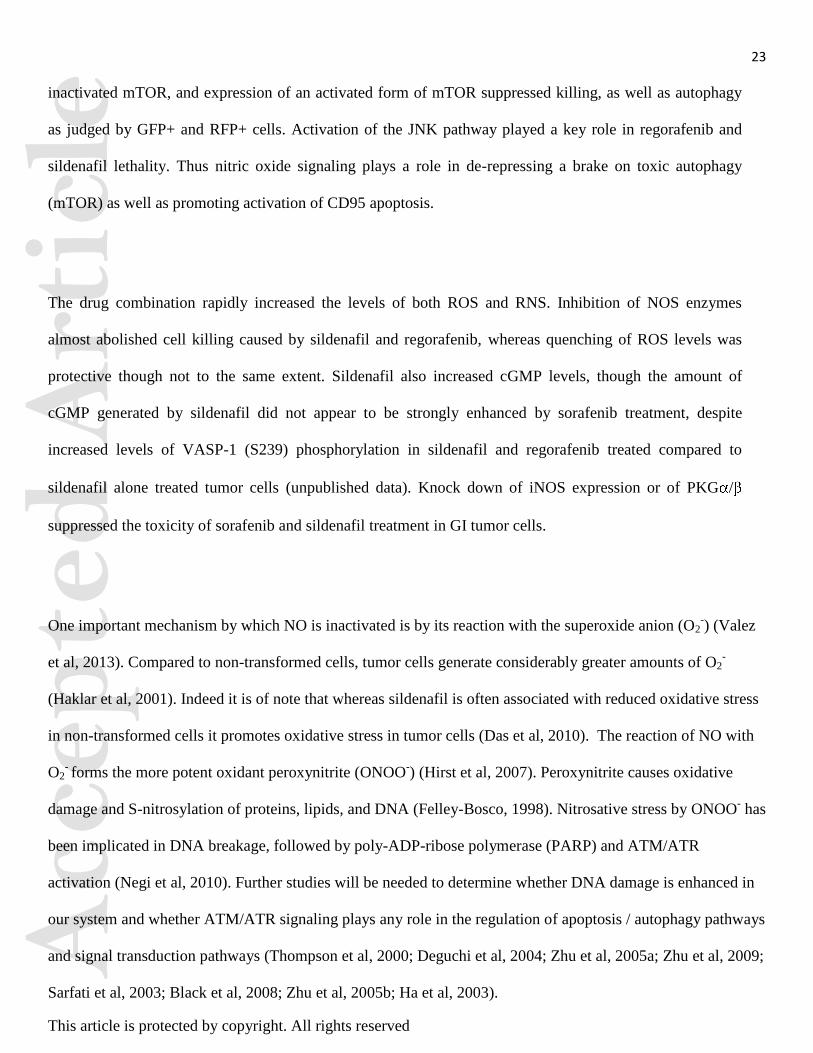
inactivated mTOR, and expression of an activated form of mTOR suppressed killing, as well as autophagy
as judged by GFP+ and RFP+ cells. Activation of the JNK pathway played a key role in regorafenib and
sildenafil lethality. Thus nitric oxide signaling plays a role in de-repressing a brake on toxic autophagy
(mTOR) as well as promoting activation of CD95 apoptosis.
The drug combination rapidly increased the levels of both ROS and RNS. Inhibition of NOS enzymes
almost abolished cell killing caused by sildenafil and regorafenib, whereas quenching of ROS levels was
protective though not to the same extent. Sildenafil also increased cGMP levels, though the amount of
cGMP generated by sildenafil did not appear to be strongly enhanced by sorafenib treatment, despite
increased levels of VASP-1 (S239) phosphorylation in sildenafil and regorafenib treated compared to
sildenafil alone treated tumor cells (unpublished data). Knock down of iNOS expression or of PKG /
suppressed the toxicity of sorafenib and sildenafil treatment in GI tumor cells.
One important mechanism by which NO is inactivated is by its reaction with the superoxide anion (O2-) (Valez
et al, 2013). Compared to non-transformed cells, tumor cells generate considerably greater amounts of O2-
(Haklar et al, 2001). Indeed it is of note that whereas sildenafil is often associated with reduced oxidative stress
in non-transformed cells it promotes oxidative stress in tumor cells (Das et al, 2010). The reaction of NO with
O2- forms the more potent oxidant peroxynitrite (ONOO
-) (Hirst et al, 2007). Peroxynitrite causes oxidative
damage and S-nitrosylation of proteins, lipids, and DNA (Felley-Bosco, 1998). Nitrosative stress by ONOO- has
been implicated in DNA breakage, followed by poly-ADP-ribose polymerase (PARP) and ATM/ATR
activation (Negi et al, 2010). Further studies will be needed to determine whether DNA damage is enhanced in
our system and whether ATM/ATR signaling plays any role in the regulation of apoptosis / autophagy pathways
and signal transduction pathways (Thompson et al, 2000; Deguchi et al, 2004; Zhu et al, 2005a; Zhu et al, 2009;
Sarfati et al, 2003; Black et al, 2008; Zhu et al, 2005b; Ha et al, 2003).
Acc
epte
d A
rtic
le24
This article is protected by copyright. All rights reserved
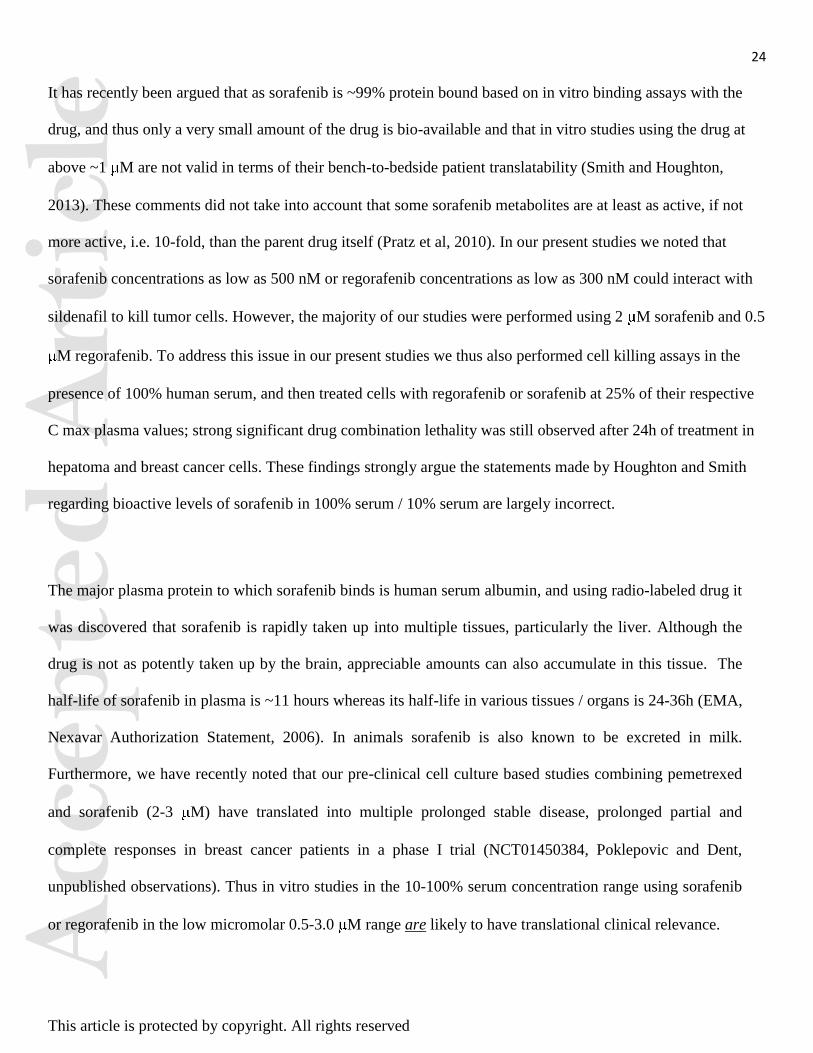
It has recently been argued that as sorafenib is ~99% protein bound based on in vitro binding assays with the
drug, and thus only a very small amount of the drug is bio-available and that in vitro studies using the drug at
above ~1 M are not valid in terms of their bench-to-bedside patient translatability (Smith and Houghton,
2013). These comments did not take into account that some sorafenib metabolites are at least as active, if not
more active, i.e. 10-fold, than the parent drug itself (Pratz et al, 2010). In our present studies we noted that
sorafenib concentrations as low as 500 nM or regorafenib concentrations as low as 300 nM could interact with
sildenafil to kill tumor cells. However, the majority of our studies were performed using 2 M sorafenib and 0.5
M regorafenib. To address this issue in our present studies we thus also performed cell killing assays in the
presence of 100% human serum, and then treated cells with regorafenib or sorafenib at 25% of their respective
C max plasma values; strong significant drug combination lethality was still observed after 24h of treatment in
hepatoma and breast cancer cells. These findings strongly argue the statements made by Houghton and Smith
regarding bioactive levels of sorafenib in 100% serum / 10% serum are largely incorrect.
The major plasma protein to which sorafenib binds is human serum albumin, and using radio-labeled drug it
was discovered that sorafenib is rapidly taken up into multiple tissues, particularly the liver. Although the
drug is not as potently taken up by the brain, appreciable amounts can also accumulate in this tissue. The
half-life of sorafenib in plasma is ~11 hours whereas its half-life in various tissues / organs is 24-36h (EMA,
Nexavar Authorization Statement, 2006). In animals sorafenib is also known to be excreted in milk.
Furthermore, we have recently noted that our pre-clinical cell culture based studies combining pemetrexed
and sorafenib (2-3 M) have translated into multiple prolonged stable disease, prolonged partial and
complete responses in breast cancer patients in a phase I trial (NCT01450384, Poklepovic and Dent,
unpublished observations). Thus in vitro studies in the 10-100% serum concentration range using sorafenib
or regorafenib in the low micromolar 0.5-3.0 M range are likely to have translational clinical relevance.

Acc
epte
d A
rtic
le25
This article is protected by copyright. All rights reserved
Based on our encouraging in vitro data we moved our studies forward using several animal model systems
in athymic mice. Short-term exposure to sildenafil and regorafenib killed tumor cells in vivo as judged in ex
vivo colony formation assays. Longer-term exposure to sildenafil and sorafenib suppressed HuH7 tumor
growth over several weeks, as was also observed using HT29 colon cancer tumors. This is of note as HuH7
cells, which lack CD95, would be predicted based on in vitro data to respond relatively poorly to the
[regorafenib + sildenafil] combination. Our in vivo anti-tumor data is likely an amalgamation of a direct
anti-tumor cell killing effect by the drug combination and increased tumor vasculature permeability caused
by the actions of sildenafil on endothelial cells (Black et al, 2008). We determined whether FTY720 and
other HDAC inhibitors could enhance the lethality of [regorafenib + sildenafil] treatment in our HT29
model of colon cancer n.b. regorafenib is an approved third line treatment for colorectal cancer. Combined
exposure of HT29 colon cancer tumors to [regorafenib + FTY720] or to [regorafenib + sildenafil +
FTY720] resulted unexpectedly in a stronger re-growth of tumors after cessation of drug exposure than was
observed in tumors treated with regorafenib or with [regorafenib + sildenafil] but NOT treated with
FTY720. Indeed, tumor growth was reduced and animal survival was increased in tumors treated with
[regorafenib + sildenafil] compared to [regorafenib + sildenafil + FTY720] (Booth et al, 2015).
We discovered that treatment of tumors with FTY720 in general caused increased expression of multiple
growth / angiogenic / invasion regulatory cytokines, including FAS ligand. And, that inhibition of the CD95
/ FAS-L pathway prevented the enhanced tumor re-growth of [regorafenib + FTY720] treated tumors. As
FTY720 inhibits S1P signaling, the drug has been examined for anti-cancer properties and has recently been
shown to suppress colon cancer development and growth in an inflammatory model of colitis (Liang et al,
2013). More recently, we have shown that FTY720 strongly enhances the anti-tumor properties of
[celecoxib + sildenafil] treatment in breast and brain cancer cells in vitro and in vivo (Booth et al, 2015).
Acc
epte
d A
rtic
le26
This article is protected by copyright. All rights reserved
In conclusion, we have demonstrated that sorafenib / regorafenib in combination with PDE5 inhibitors kills
tumor cells in a greater than additive manner in a process that involves autophagy, and intrinsic and
extrinsic apoptotic pathways. In vivo, regorafenib/sorafenib strongly interacted with sildenafil to suppress
tumor growth. By applying multiplex technology we were able to predict and validate various signaling
biomarkers as compensatory responses of tumor cells mediating survival.
Acc
epte
d A
rtic
le27
This article is protected by copyright. All rights reserved
References
Benavides GA, Liang Q, Dodson M, Darley-Usmar V, Zhang J. 2013. Inhibition of autophagy and glycolysis by
nitric oxide during hypoxia-reoxygenation impairs cellular bioenergetics and promotes cell death in primary
neurons. Free Radic Biol Med. 65:1215-28.
Black KL, Yin D, Ong JM, Hu J, Konda BM, Wang X, Ko MK, Bayan JA, Sacapano MR, Espinoza A, Irvin
DK, Shu Y. 2008. PDE5 inhibitors enhance tumor permeability and efficacy of chemotherapy in a rat brain
tumor model. Brain Res. 1230:290-302.
Booth L, Roberts JL, Cruickshanks N, Conley A, Durrant DE, Das A, Fisher PB, Kukreja RC, Grant S,
Poklepovic A, Dent P. 2014. Phosphodiesterase 5 inhibitors enhance chemotherapy killing in gastrointestinal /
genitourinary cancer cells. Mol Pharmacol. 85:408-19.
Booth L, Roberts JL, Cruickshanks N, Tavallai S, Webb T, Samuel P, Conley A, Binion B, Young HF,
Poklepovic A, Spiegel S, Dent P. 2015. PDE5 inhibitors enhance Celecoxib killing in multiple tumor types. J.
Cell. Physiol. 230: 1115-27.
Carr BI, D'Alessandro R, Refolo MG, Iacovazzi PA, Lippolis C, Messa C, Cavallini A, Correale M, Di Carlo A.
2013: Effects of low concentrations of regorafenib and sorafenib on human HCC cell AFP, migration, invasion,
and growth in vitro. J Cell Physiol. 228:1344-50.
Choi CY, Park KR, Lee JH, Jeon YJ, Liu KH, Oh S, Kim DE, Yea SS. 2007. Isoeugenol suppression of
inducible nitric oxide synthase expression is mediated by down-regulation of NF-kappaB, ERK1/2, and p38
kinase. Eur J Pharmacol. 576:151-9.
Acc
epte
d A
rtic
le28
This article is protected by copyright. All rights reserved
Cruickshanks N, Hamed HA, Booth L, Tavallai S, Syed J, Sajithlal GB, Grant S, Poklepovic A, Dent P. 2013.
Histone deacetylase inhibitors restore toxic BH3 domain protein expression in anoikis-resistant mammary and
brain cancer stem cells, thereby enhancing the response to anti-ERBB1/ERBB2 therapy. Cancer Biol Ther.
14:982-96.
Das A, Xi L, Kukreja RC. Protein kinase G-dependent cardioprotective mechanism of phosphodiesterase-5
inhibition involves phosphorylation of ERK and GSK3beta. 2008. J Biol Chem. 283:29572-85.
Das A, Durrant D, Mitchell C, Mayton E, Hoke NN, Salloum FN, Park MA, Qureshi I, Lee R, Dent P, Kukreja
RC. 2010. Sildenafil increases chemotherapeutic efficacy of doxorubicin in prostate cancer and ameliorates
cardiac dysfunction. Proc Natl Acad Sci U S A. 107:18202-7.
Deguchi A, Thompson WJ, Weinstein IB. 2004. Activation of protein kinase G is sufficient to induce apoptosis
and inhibit cell migration in colon cancer cells. Cancer Res. 64:3966-73.
Elser C, Siu LL, Winquist E, Agulnik M, Pond GR, Chin SF, Francis P, Cheiken R, Elting J, McNabola A,
Wilkie D, Petrenciuc O, Chen EX. 2007. Phase II trial of sorafenib in patients with recurrent or metastatic
squamous cell carcinoma of the head and neck or nasopharyngeal carcinoma. J Clin Oncol. 25:3766-73.
Felley-Bosco E. 1998. Role of nitric oxide in genotoxicity: implication for carcinogenesis. Cancer Metastasis
Rev. 17:25-37.
http://www.ncbi.nlm.nih.gov/pubmed?term=Weinstein%20IB%5BAuthor%5D&cauthor=true&cauthor_uid=15173009
Acc
epte
d A
rtic
le29
This article is protected by copyright. All rights reserved
Florio T, Arena S, Pattarozzi A, Thellung S, Corsaro A, Villa V, Massa A, Diana F, Spoto G, Forcella S,
Damonte G, Filocamo M, Benatti U, Schettini G. 2003. Basic fibroblast growth factor activates endothelial
nitric-oxide synthase in CHO-K1 cells via the activation of ceramide synthesis. Mol Pharmacol. 63:297-310.
Francis SH, Busch JL, Corbin JD, Sibley D. 2010. cGMP-dependent protein kinases and cGMP
phosphodiesterases in nitric oxide and cGMP action. Pharmacol Rev. 62:525-63.
Gandelman M, Levy M, Cassina P, Barbeito L, Beckman JS. 2013. P2X7 receptor-induced death of motor
neurons by a peroxynitrite/FAS-dependent pathway. J Neurochem. 126:382-8.
González R, Ferrín G, Aguilar-Melero P, Ranchal I, Linares CI, Bello RI, De la Mata M, Gogvadze V, Bárcena
JA, Alamo JM, Orrenius S, Padillo FJ, Zhivotovsky B, Muntané J. 2013. Targeting hepatoma using nitric oxide
donor strategies. Antioxid Redox Signal. 18:491-506.
Ha KS, Kim KM, Kwon YG, Bai SK, Nam WD, Yoo YM, Kim PK, Chung HT, Billiar TR, Kim YM. 2003.
Nitric oxide prevents 6-hydroxydopamine-induced apoptosis in PC12 cells through cGMP-dependent PI3
kinase/Akt activation. FASEB J. 17:1036-47.
Hait NC, Allegood J, Maceyka M, Strub GM, Harikumar KB, Singh SK, Luo C, Marmorstein R, Kordula T,
Milstien S, Spiegel S. 2009. Regulation of histone acetylation in the nucleus by sphingosine-1-phosphate.
Science. 325:1254-7.
Hait NC, Wise LE, Allegood JC, O'Brien M, Avni D, Reeves TM, Knapp PE, Lu J, Luo C, Miles MF, Milstien
S, Lichtman AH, Spiegel S. 2014. Active, phosphorylated fingolimod inhibits histone deacetylases and
facilitates fear extinction memory. Nat Neurosci. 17:971-80.
Acc
epte
d A
rtic
le30
This article is protected by copyright. All rights reserved
Haklar G, Sayin-Ozveri E, Yüksel M, Aktan AO, Yalçin AS. 2001. Different kinds of reactive oxygen and
nitrogen species were detected in colon and breast tumors. Cancer Lett. 165:219-24.
Hayden MA, Lange PA, Nakayama DK. 2001. Nitric oxide and cyclic guanosine monophosphate stimulate
apoptosis via activation of the Fas-FasL pathway. J Surg Res. 101:183-9.
Hirst DG, Robson T. 2007. Nitrosative stress in cancer therapy. Front Biosci. 12:3406-18.
Hotte SJ, Hirte HW. 2002. BAY 43-9006: early clinical data in patients with advanced solid malignancies. Curr
Pharm Des. 8:2249-53.
Inaba H, Rubnitz JE, Coustan-Smith E, Li L, Furmanski BD, Mascara GP, Heym KM, Christensen R, Onciu M,
Shurtleff SA, Pounds SB, Pui CH, Ribeiro RC, Campana D, Baker SD. 2001. Phase I pharmacokinetic and
pharmacodynamics study of the multi-kinase inhibitor sorafenib in combination with clofarabine and cytarabine
in pediatric relapsed/refractory leukemia. J Clin Oncol. 29: 3293–300.
Komalavilas P, Shah PK, Jo H, Lincoln TM. 1999. Activation of mitogen-activated protein kinase pathways by
cyclic GMP and cyclic GMP-dependent protein kinase in contractile vascular smooth muscle cells. J Biol
Chem. 274:34301-9.
Kots AY, Bian K, Murad F. 2011. Nitric oxide and cyclic GMP signaling pathway as a focus for drug
development. Curr Med Chem. 18:3299-305.
Acc
epte
d A
rtic
le31
This article is protected by copyright. All rights reserved
Li L, Zhao M, Navid F, Pratz K, Smith BD, Rudek MA, Baker SD. 2010. Quantitation of sorafenib and its
active metabolite sorafenib N-oxide in human plasma by liquid chromatography-tandem mass spectrometry. J
Chromatogr B Analyt Technol Biomed Life Sci. 878: 3033-8.
Liang J, Nagahashi M, Kim EY, Harikumar KB, Yamada A, Huang WC, Hait NC, Allegood JC, Price MM,
Avni D, Takabe K, Kordula T, Milstien S, Spiegel S. 2013. Sphingosine-1-phosphate links persistent STAT3
activation, chronic intestinal inflammation, and development of colitis-associated cancer. Cancer Cell. 23:107-
20.
Martin AP, Park MA, Mitchell C, Walker T, Rahmani M, Thorburn A, Häussinger D, Reinehr R, Grant S, Dent
P. 2009. BCL-2 family inhibitors enhance histone deacetylase inhibitor and sorafenib lethality via autophagy
and overcome blockade of the extrinsic pathway to facilitate killing. Mol Pharmacol. 76:327-41.
Musicki B, Bivalacqua TJ, Champion HC, Burnett AL. 2014. Sildenafil promotes eNOS activation and inhibits
NADPH oxidase in the transgenic sickle cell mouse penis. J Sex Med. 11:424-30.
Negi G, Kumar A, Sharma SS. 2010. Concurrent targeting of nitrosative stress-PARP pathway corrects
functional, behavioral and biochemical deficits in experimental diabetic neuropathy. Biochem Biophys Res
Commun. 391:102-6.
Park MA, Zhang G, Martin AP, Hamed H, Mitchell C, Hylemon PB, Graf M, Rahmani M, Ryan K, Liu X,
Spiegel S, Norris J, Fisher PB, Grant S, Dent P. 2008. Vorinostat and sorafenib increase ER stress, autophagy
and apoptosis via ceramide-dependent CD95 and PERK activation. Cancer Biol Ther. 7:1648-62.
Acc
epte
d A
rtic
le32
This article is protected by copyright. All rights reserved
Park MA, Reinehr R, Häussinger D, Voelkel-Johnson C, Ogretmen B, Yacoub A, Grant S, Dent P. 2010a.
Sorafenib activates CD95 and promotes autophagy and cell death via Src family kinases in gastrointestinal
tumor cells. Mol Cancer Ther. 9:2220-31.
Park MA, Mitchell C, Zhang G, Yacoub A, Allegood J, Häussinger D, Reinehr R, Larner A, Spiegel S, Fisher
PB, Voelkel-Johnson C, Ogretmen B, Grant S, Dent P. 2010b. Vorinostat and sorafenib increase CD95
activation in gastrointestinal tumor cells through a Ca(2+)-de novo ceramide-PP2A-reactive oxygen species-
dependent signaling pathway. Cancer Res. 70:6313-24.
Pratz KW, Cho E, Levis MJ, Karp JE, Gore SD, McDevitt M, Stine A, Zhao M, Baker SD, Carducci MA,
Wright JJ, Rudek MA, Smith BD. 2010. A pharmacodynamic study of sorafenib in patients with relapsed and
refractory acute leukemias. Leukemia. 24:1437-44.
Rahmani M, Davis EM, Crabtree TR, Habibi JR, Nguyen TK, Dent P, Grant S. 2007. The kinase inhibitor
sorafenib induces cell death through a process involving induction of endoplasmic reticulum stress. Mol Cell
Biol. 27:5499-513.
Rahmani M, Davis EM, Bauer C, Dent P, Grant S. Apoptosis induced by the kinase inhibitor BAY 43-9006 in
human leukemia cells involves down-regulation of Mcl-1 through inhibition of translation. 2005. J Biol Chem.
280:35217-27.
Reinehr R, Görg B, Höngen A, Häussinger D. 2004. CD95-tyrosine nitration inhibits hyperosmotic and CD95
ligand-induced CD95 activation in rat hepatocytes. J Biol Chem. 279:10364-73.
Acc
epte
d A
rtic
le33
This article is protected by copyright. All rights reserved
Roberts JL, Conley A, Booth L, Cruickshanks N, Malkin M, Kukreja RC, Grant S, Poklepovic A, Dent P.
2014. PDE5 inhibitors enhance the lethality of standard of care chemotherapy in pediatric CNS tumor cells.
Cancer Biol. Ther. 15: 758-67.
Russwurm M, Russwurm C, Koesling D, Mergia E. 2013. NO/cGMP: the past, the present, and the future.
Methods Mol Biol. 1020:1-16.
Sarfati M, Mateo V, Baudet S, Rubio M, Fernandez C, Davi F, Binet JL, Delic J, Merle-Beral H. 2003.
Sildenafil and vardenafil, types 5 and 6 phosphodiesterase inhibitors, induce caspase-dependent apoptosis of B-
chronic lymphocytic leukemia cells. Blood. 101:265-9.
Shen C, Yan J, Erkocak OF, Zheng XF, Chen XD. 2014. Nitric oxide inhibits autophagy via suppression of
JNK in meniscal cells. Rheumatology (Oxford). 53: 1022-33.
Smith MA, Houghton P. 2013. A proposal regarding reporting of in vitro testing results. Clin Cancer Res. 19:
2828-33.
Tang Y, Hamed HA, Cruickshanks N, Fisher PB, Grant S, Dent P. 2012. Obatoclax and lapatinib interact to
induce toxic autophagy through NOXA. Mol Pharmacol. 81:527-40.
Thompson WJ, Piazza GA, Li H, Liu L, Fetter J, Zhu B, Sperl G, Ahnen D, Pamukcu R. 2000. Exisulind
induction of apoptosis involves guanosine 3',5'-cyclic monophosphate phosphodiesterase inhibition, protein
kinase G activation, and attenuated beta-catenin. Cancer Res. 60:3338-42.
Acc
epte
d A
rtic
le34
This article is protected by copyright. All rights reserved
Tripathi DN, Chowdhury R, Trudel LJ, Tee AR, Slack RS, Walker CL, Wogan GN. 2013. Reactive nitrogen
species regulate autophagy through ATM-AMPK-TSC2-mediated suppression of mTORC1. Proc Natl Acad Sci
U S A. 110:E2950-7.
Valez V, Cassina A, Batinic-Haberle I, Kalyanaraman B, Ferrer-Sueta G, Radi R. 2013. Peroxynitrite formation
in nitric oxide-exposed submitochondrial particles: detection, oxidative damage and catalytic removal by Mn-
porphyrins. Arch Biochem Biophys. 529:45-54.
Watanabe H, Ohashi K, Takeuchi K, Yamashita K, Yokoyama T, Tran QK, Satoh H, Terada H, Ohashi H,
Hayashi H. 2002. Sildenafil for primary and secondary pulmonary hypertension. Clin Pharmacol Ther. 71: 398-
402.
Yu Y, Fan SM, Yuan SJ, Tashiro S, Onodera S, Ikejima T. 2012. Nitric oxide (•NO) generation but not ROS
plays a major role in silibinin-induced autophagic and apoptotic death in human epidermoid carcinoma A431
cells. Free Radic Res. 46:1346-60.
Zhu B, Strada S, Stevens T. 2005a. Cyclic GMP-specific phosphodiesterase 5 regulates growth and apoptosis in
pulmonary endothelial cells. Am J Physiol Lung Cell Mol Physiol. 289:L196-206.
Zhu B, Vemavarapu L, Thompson WJ, Strada SJ. 2005b. Suppression of cyclic GMP-specific
phosphodiesterase 5 promotes apoptosis and inhibits growth in HT29 cells. J Cell Biochem. 94:336-50.
Zhu B, Zhang L, Alexeyev M, Alvarez DF, Strada SJ, Stevens T. 2009. Type 5 phosphodiesterase expression is
a critical determinant of the endothelial cell angiogenic phenotype. Am J Physiol Lung Cell Mol Physiol. 296:
L220-8.
Acc
epte
d A
rtic
le35
This article is protected by copyright. All rights reserved
Footnotes
Support for the present study was funded from PHS grants from the National Institutes of Health [R01-
CA141704, R01-CA150214, R01-DK52825, R01-CA61774]. Thanks to Mrs. Grizzard for her support to the
Dent lab and to the Betts family fund for support in the purchase of the Hermes Wiscan instrument. Thanks to
Dr. G. Almera for performing immuno-fluorescence studies. We gratefully acknowledge the assistance of the
VCU lipidomics / Metabolomics core in performing our ceramide and S1P analyses, which is supported in part
by funding from the NIH-NCI Massey Cancer Center support grant CA016059. PD is the holder of the
Universal Inc. Chair in Signal Transduction Research. The authors have no conflicts of interest to report.

Acc
epte
d A
rtic
le36
This article is protected by copyright. All rights reserved
Figure Legends
Figure 1. Sorafenib and PDE5 inhibitors interact to kill multiple tumor cell types. (A) HEP3B cells were
treated with vehicle (DMSO), sorafenib (SOR, 500 nM - 2.0 M) and/or sildenafil (2.0 M) as indicated. Cells
were isolated 24h after exposure and viability determined by trypan blue exclusion (n = 3, +/- SEM) * p 0.05 <
greater than vehicle control. (B) Hepatoma cells 24h after plating were treated with vehicle (DMSO), sorafenib
(SOR, 2.0 M), PDE5 inhibitor (sildenafil, 2 M); or the drugs in combination. Twenty four h after treatment
cells were isolated and viability determine by trypan blue (n = 3, +/- SEM). * p 0.05 < greater than vehicle
control. Upper images were generated using a live / dead assay using a Hermes WiScan instrument. (C) HuH7
cells were treated with vehicle (DMSO), regorafenib (REGO, 300 - 1,500 nM) and/or sildenafil (2.0 M) as
indicated. Cells were isolated 24h after exposure and viability determined by trypan blue exclusion (n = 3, +/-
SEM) * p 0.05 < greater than vehicle control. (D) Hepatoma cells 24h after plating were treated with vehicle
(DMSO), regorafenib (REGO, 0.5 M), PDE5 inhibitor (sildenafil, 2 M); or the drugs in combination. Twenty
four h after treatment cells were isolated and viability determine by trypan blue (n = 3, +/- SEM). * p 0.05 <
greater than vehicle control. Upper images were generated using a live / dead assay using a Hermes WiScan
instrument. (E) Tumor cells 24h after plating were treated with vehicle (DMSO), regorafenib (REGO, 0.5 M),
sildenafil (2 M) or the drugs in combination. Twenty four h after treatment cells were isolated and viability
determine by trypan blue (n = 3, +/- SEM). * p 0.05 < greater than vehicle control. (F) Tumor cells were
cultured in 100% heat inactivated human serum. Cells were treated with vehicle; sorafenib (5 M) and
sildenafil (2 M); or with regorafenib (2 M) and sildenafil (0-0.75 M). Cells were isolated 24h after drug
exposure and viability determined using a live / dead assay using a Hermes WiScan instrument. Studies were
performed in triplicate in 96 well plates with the percentage numbers of live / dead cells being determined in
three images per well (n = 3, +/- SEM). * p 0.05 < greater than vehicle control.
Acc
epte
d A
rtic
le37
This article is protected by copyright. All rights reserved
Figure 2. Molecular manipulation of regorafenib and sildenafil targets recapitulates the effects of drug
combination treatment. (A) Tissue microarrays of normal and tumor tissue matched from the same patients
were stained for expression of PDE5 followed by H&E. The panels show five matched normal liver and
hepatocellular tumor sections, each from the same patient (5 patients). (B) Further normal liver and liver tumor
sections stained to determine the expression of PDE5. (C) HuH7 cells were transfected with a control scrambled
siRNA (siSCR) or three different siRNA molecules to knock down expression of PDE5 (siPDE5 #1, #2, #3).
Thirty six h after transfection were treated with vehicle (DMSO) or regorafenib (REG, 0.5 M) or with
sorafenib (SOR, 2.0 M). Twenty four h after treatment cells were isolated and viability determine by trypan
blue (n = 3, +/- SEM). * p < 0.05 greater than corresponding value in siSCR cells. (D) Tissue microarrays were
stained for expression of PDGFR followed by H&E. The panels show six matched normal liver and
hepatocellular tumor sections, each from the same patient (6 patients). (E) HEP3B cells were transfected with a
control scrambled siRNA (siSCR) or siRNA molecules to knock down expression of PDGFR and PDGFR .
Thirty six h after transfection were treated with vehicle (DMSO) or sildenafil (SIL, 1.0-2.0 M). Twenty four h
after treatment cells were isolated and viability determine by trypan blue (n = 3, +/- SEM). * p < 0.05 greater
than corresponding value in siSCR cells.
Acc
epte
d A
rtic
le38
This article is protected by copyright. All rights reserved
Figure 3. Identification of tumor cell biomarkers that respond to regorafenib and sildenafil treatment.
(A)-(D). Cells were grown in 96 well plates and treated for the indicated amounts of time with regorafenib (0.5
M), sildenafil (2 M), FTY720 (50 nM) and the drugs in combination as indicated in each Panel. Cells were
gently fixed in situ using 2% (v/v) para-formaldehyde with Triton X100 for permeabilization and probed for the
phosphorylation of VASP-1 (S239); eIF2 (S51); and the expression of the sphingosine-1-phosphate receptor
(EDG-1). (G) HuH7 and HT29 cells were transfected with empty vector plasmid (CMV) or to express dominant
negative eIF2 (S51A). Twenty four h after transfection cells were treated with regorafenib (0.5 M) and
sildenafil (2 M) for 6h. Cells were gently fixed in situ using 2% (v/v) para-formaldehyde with Triton X100 for
permeabilization and probed for the expression of the sphingosine-1-phosphate receptor (EDG-1). (E) and (F).
Cells were grown in 96 well plates and treated for the indicated amounts of time with regorafenib (0.5 M),
sildenafil (2 M), FTY720 (50 nM) and the drugs in combination as indicated in each Panel. Cells were gently
fixed in situ using 2% (v/v) para-formaldehyde with Triton X100 for permeabilization and probed for the
phosphorylation of VASP-1 (S239); eIF2 (S51); and the expression of the sphingosine-1-phosphate receptor
(EDG-1). (G) HuH7 and HT29 cells were transfected with empty vector plasmid (CMV) or to express dominant
negative eIF2 (S51A). Twenty four h after transfection cells were treated with regorafenib (0.5 M) and
sildenafil (2 M) for 6h. Cells were gently fixed in situ using 2% (v/v) para-formaldehyde with Triton X100 for
permeabilization and probed for the expression of the sphingosine-1-phosphate receptor (EDG-1). (H) Tumor
cells were transfected with scrambled siRNA (siSCR) or siRNA molecules to knock down expression of ATF4
or CHOP (siATF4, siCHOP); or tumor cells were transfected with plasmids to express dominant negative
PERK or eIF2 S51A. Thirty six h after transfection cells were treated with regorafenib (0.5 M) and sildenafil
(2 M) for 6h. Cells were gently fixed in situ using 2% (v/v) para-formaldehyde with Triton X100 for
permeabilization and probed for the expression of the sphingosine-1-phosphate receptor (EDG-1). (I) Cells
were treated with vehicle; regorafenib (0.5 M) and sildenafil (2.0 M) for 6h. Cells were then fixed and the
Acc
epte
d A
rtic
le39
This article is protected by copyright. All rights reserved
expression levels of HSP70+HSC70, GRP78, GRP94 and GRP58 determined. (J) HuH7 cells were treated with
vehicle; regorafenib (0.5 M) and sildenafil (2.0 M) for 3h. HSP90 was immuno-precipitated and the levels of
total and nitrosylated HSP90 in the precipitates determined. (K) Cells were transfected with empty vector
CMV or with a plasmid to express GRP78. Twenty four h later cells were treated with vehicle or with
[regorafenib (0.5 M) + sildenafil (2.0 M)] for a further 24h. Cells were isolated and viability determine by a
live / dead assay (n = 3, +/- SEM). # p < 0.05 lower than corresponding value in CMV transfected cells. (L)
Tumor cells as indicated in each panel were treated with regorafenib (0.5 M) and sildenafil (2 M) together for
6h. Cells were gently fixed in situ using 2% (v/v) para-formaldehyde with Triton X100 for permeabilization and
probed for the total expression of each of the indicated growth factor receptors. (M) and (N) Tumor cells as
indicated in each panel were treated with regorafenib (0.5 M) and sildenafil (2 M) together for 6h. Cells were
gently fixed in situ using 2% (v/v) para-formaldehyde with Triton X100 for permeabilization and probed for the
total expression of each of the indicated growth factor receptors. (O) Cells were transfected with empty vector
plasmid or a plasmid to express GRP78. Twenty four h after transfection cells were treated with vehicle or with
regorafenib (0.5 M) and sildenafil (2 M) together for 6h. Cells were gently fixed in situ using 2% (v/v) para-
formaldehyde with Triton X100 for permeabilization and probed for the total expression of each of the indicated
growth factor receptors and plasma membrane pumps. (P) Cells were treated with vehicle or with [regorafenib
(0.5 M) + sildenafil (2.0 M)] and crizotinib (1.5 M), as indicated. Cell death was assessed 12h later using
live/dead assays.
.
Acc
epte
d A
rtic
le40
This article is protected by copyright. All rights reserved
Figure 4. The generation of ROS / RNS following regorafenib and sildenafil treatment is a key mediator
of tumor cell killing. (A) HEPG2 cells in 96 well plates were loaded for 30 min with either dihydro-DCF (10
M) which is sensitive to oxidation by hydroxyl radicals and peroxynitrite directly and hydrogen peroxide (i.e.
reactive oxygen species, ROS); or 3-amino,4-aminomethyl-2',7'-difluorescein (DAF-FM DA, 4 M) which is
sensitive to oxidation by NO (i.e. reactive nitrogen species, RNS). Cells were treated with vehicle (DMSO),
regorafenib (1 M), sildenafil (2 M); or the drugs in combination. Cells - ROS/RNS measurements - were
made in a Vector 3 plate reader at the indicated times after drug treatment (n=3,+/- SEM). * p 0.05 < greater
than vehicle control. (B) Left portion of the graph: HEPG2 cells were pre-treated with vehicle, the NOS
inhibitor L-NAME (1 M) or the ROS quenching agent N-acetyl cysteine (10 mM). Cells were then treated
with vehicle or with sildenafil (2 M), and sorafenib (2 M) in combination. Twenty four h after treatment cells
were isolated and viability determine by trypan blue (n = 3, +/- SEM). Right portion of the graph: HEPG2 cells
were transfected with either an empty vector plasmid (CMV) or a plasmid to express thioredoxin (TRX).
Twenty four h after transfection cells were treated with vehicle or with sildenafil (2 M), and sorafenib (2 M)
in combination. Twenty four h after treatment cells were isolated and viability determine by trypan blue (n = 3,
+/- SEM). # p < 0.05 less than corresponding value in VEH / CMV cells; ## p < 0.05 less than corresponding
value in NAC cells. (C) HEPG2 cells were transfected with a control scrambled siRNA (siSCR) or siRNA
molecules to knock down expression of eNOS or iNOS. Thirty six h after transfection were treated with vehicle
or with sildenafil (2 M), and sorafenib (2 M) in combination. Twenty four h after treatment cells were
isolated and viability determine by trypan blue (n = 3, +/- SEM). # p < 0.05 less than corresponding value in
siSCR cells. (D) HEPG2 cells were treated with vehicle or with sildenafil (2 M), and/or sorafenib (2 M) in
combination. Cells were isolated at the indicated time points and western immunoblotting performed to
determine the expression of iNOS.
Acc
epte
d A
rtic
le41
This article is protected by copyright. All rights reserved
Figure 5. ROS/RNS regulate the induction of autophagy by drug treatment. (A) and (B) HEPG2 cells were
transfected with a plasmid to express LC3-GFP-RFP. Twenty four h after transfection cells were, as indicated
pre-treated with L-NAME (1 M) or NAC (10 mM), then treated with vehicle (DMSO), sorafenib (2 M),
sildenafil (2 M); or the drugs in combination. The number of GFP vesicles (early autophagosomes) and RFP
vesicles (late autolysosomes) were determined 6h and 24h after drug treatment (n = 3 +/- SEM). # p < 0.05 less
than corresponding value in cells not treated with L-NAME or NAC. (C) HEP3B and HuH7 cells were
transfected with a control scrambled siRNA (siSCR) or siRNA molecules to knock down expression of Beclin1
or ATG5. Thirty six h after transfection were treated with vehicle or with sildenafil (2 M), and/or sorafenib (2
M). Twenty four h after treatment cells were isolated and viability determine by trypan blue (n = 3, +/- SEM).
# p < 0.05 less than corresponding value in siSCR cells. (D) Lower graph: HEPG2 cells were transfected with a
control scrambled siRNA (siSCR) or siRNA molecules to knock down expression of Beclin1, ULK1 or ATG5.
Thirty six h after transfection were treated with vehicle or with sildenafil (2 M), and/or regorafenib (0.5 M).
Twenty four h after treatment cells were isolated and viability determine by trypan blue (n = 3, +/- SEM);
Middle images: cells expressing LC3-GFP were treated with vehicle or with sildenafil (2 M), and/or
regorafenib (0.5 M) and the number of intense GFP+ vesicles counted in 40 cells and the mean number of
vesicles per cell is presented (n = 3 +/- SEM); Upper blots: Cells were treated with vehicle or with sildenafil (2
M), and/or regorafenib (0.5 M) and isolated after 6h. Cell lysates were western blotted for the expression of
the indicated proteins (n = 3).
Acc
epte
d A
rtic
le42
This article is protected by copyright. All rights reserved
Figure 6. Death receptor –dependent and –independent induction of cell death by sorafenib and sildenafil
treatment. (A) HuH7 and HEPG2 cells were infected with recombinant adenoviruses to express empty vector
(CMV); dominant negative caspase 9; BCL-XL; or c-FLIP-s. Twenty four h after infection cells were then
treated with sorafenib (SOR 2.0 M) and/or sildenafil (SIL, 2.0 M). Twenty four h after drug treatment cells
were isolated and viability determined by trypan blue exclusion assay (n = 3 +/- SEM). # p < 0.05 less than
corresponding value in CMV infected cells. (B) HEPG2 cells were treated with sorafenib (SOR 2.0 M) and/or
sildenafil (SIL, 2.0 M). Six h after treatment cells were lysed and prepared for immunoprecipitation of CD95.
After immunoprecipitation, immunoblotting was performed to determine the levels of caspase 8 and FADD in
the immunoprecipitate. Total levels of CD95 and GAPDH in the lysate are also presented. (C) HEPG2 cells
grown on microscope slides were treated with vehicle (DMSO), regorafenib (0.5 M), sildenafil (2 M); or the
drugs in combination. Cells were fixed (but not permeabilized) 6h and 24h after drug exposure. IHC was
performed to determine the plasma membrane levels of CD95 and death by DAPI staining. (D) HuH7 cells were
transfected with either an empty vector plasmid (CMV); a plasmid to express CD95-GFP or a plasmid to
express CD95-GFP-Y232F Y291F. Twenty four h after transfection cells were then treated with sorafenib (SOR
2.0 M) and/or sildenafil (SIL, 2.0 M). Twenty four h after drug treatment cells were isolated and viability
determined by using a live / dead viability assay (n = 3 +/- SEM). * p < 0.05 greater than corresponding value in
CMV transfected cells. (E) HEP3B cells were transfected with a control scrambled siRNA (siSCR) or siRNA
molecules to knock down expression of CD95 or FADD. Thirty six h after transfection were treated with
vehicle or with sildenafil (2 M), and/or sorafenib (2 M). Twenty four h after treatment cells were isolated and
viability determine by trypan blue (n = 3, +/- SEM). # p < 0.05 less than corresponding value in siSCR
transfected cells. (F) HEP3B cells grown on microscope slides were pre-treated with L-NAME (1 M) or NAC
(10 mM), then treated with vehicle (DMSO), sorafenib (2 M), sildenafil (2 M); or the drugs in combination.
Cells were fixed (but not permeabilized) 6h after drug exposure. IHC was performed to determine the plasma
membrane levels of CD95.
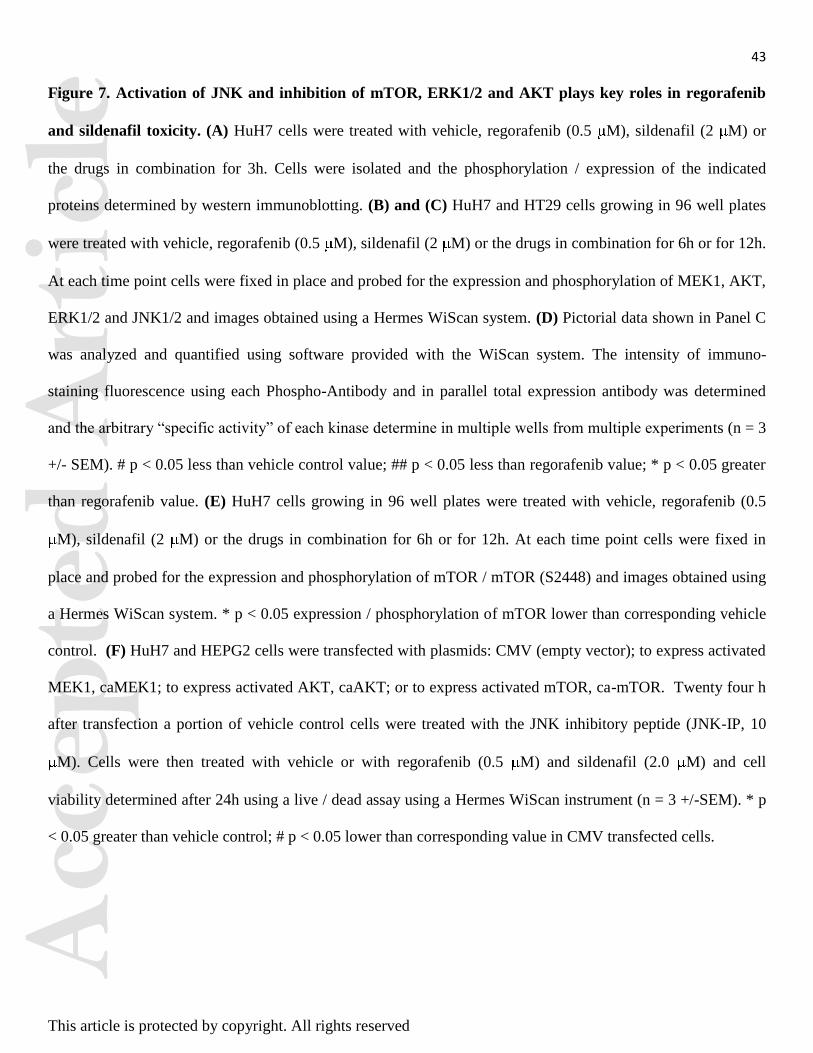
Acc
epte
d A
rtic
le43
This article is protected by copyright. All rights reserved
Figure 7. Activation of JNK and inhibition of mTOR, ERK1/2 and AKT plays key roles in regorafenib
and sildenafil toxicity. (A) HuH7 cells were treated with vehicle, regorafenib (0.5 M), sildenafil (2 M) or
the drugs in combination for 3h. Cells were isolated and the phosphorylation / expression of the indicated
proteins determined by western immunoblotting. (B) and (C) HuH7 and HT29 cells growing in 96 well plates
were treated with vehicle, regorafenib (0.5 M), sildenafil (2 M) or the drugs in combination for 6h or for 12h.
At each time point cells were fixed in place and probed for the expression and phosphorylation of MEK1, AKT,
ERK1/2 and JNK1/2 and images obtained using a Hermes WiScan system. (D) Pictorial data shown in Panel C
was analyzed and quantified using software provided with the WiScan system. The intensity of immuno-
staining fluorescence using each Phospho-Antibody and in parallel total expression antibody was determined
and the arbitrary “specific activity” of each kinase determine in multiple wells from multiple experiments (n = 3
+/- SEM). # p < 0.05 less than vehicle control value; ## p < 0.05 less than regorafenib value; * p < 0.05 greater
than regorafenib value. (E) HuH7 cells growing in 96 well plates were treated with vehicle, regorafenib (0.5
M), sildenafil (2 M) or the drugs in combination for 6h or for 12h. At each time point cells were fixed in
place and probed for the expression and phosphorylation of mTOR / mTOR (S2448) and images obtained using
a Hermes WiScan system. * p < 0.05 expression / phosphorylation of mTOR lower than corresponding vehicle
control. (F) HuH7 and HEPG2 cells were transfected with plasmids: CMV (empty vector); to express activated
MEK1, caMEK1; to express activated AKT, caAKT; or to express activated mTOR, ca-mTOR. Twenty four h
after transfection a portion of vehicle control cells were treated with the JNK inhibitory peptide (JNK-IP, 10
M). Cells were then treated with vehicle or with regorafenib (0.5 M) and sildenafil (2.0 M) and cell
viability determined after 24h using a live / dead assay using a Hermes WiScan instrument (n = 3 +/-SEM). * p
< 0.05 greater than vehicle control; # p < 0.05 lower than corresponding value in CMV transfected cells.

Acc
epte
d A
rtic
le44
This article is protected by copyright. All rights reserved
Figure 8. Regorafenib and sildenafil interact to increase ceramide levels. (A) – (B) HuH7 cells were treated
with vehicle control or with regorafenib (REGO 0.5 M) and/or sildenafil (SIL, 2.0 M). Six h after treatment
cells were isolated and bioactive lipids extracted. Multiple bioactive lipid species were analyzed using GC/MS
techniques (n = 2 in triplicate +/- SEM). * p < 0.05 greater than corresponding value in VEH cells; # p < 0.05
less than corresponding value in VEH treatment; % p < 0.05 greater than value in regorafenib alone treatment.
Panel A, upper inset panel: Treatment of cells with sildenafil (2 M) for 3h increases nitro-tyrosine (Y) levels
in ceramide synthase 6 (LASS6). (C) HuH7 cells were treated with vehicle control or with regorafenib (REGO
0.5 M) and/or Fumonisin B1 (FB1, 25.0 M) or FTY720 (50 nM). Six h after treatment cells were isolated and
bioactive lipids extracted. Multiple bioactive lipid species were analyzed using GC/MS techniques (n = 2 in
triplicate +/- SEM). (D) and (E) Tumor cells were treated with vehicle control or with regorafenib (REGO 0.5
M) and/or sildenafil (SIL, 2.0 M) and/or FTY720 (50 nM). Cells were examined 9h after treatment using a
live / dead assay in a Hermes WiScan instrument (n = 3 +/- SEM). (F) and (G) Tumor cells were treated with
vehicle, [regorafenib (0.5 M) + sildenafil (2.0 M)], the HDAC inhibitors vorinostat (500 nM), AR-42 (250
nM), Valproate (0.1 mM), or regorafenib + sildenafil + HDAC inhibitor. Cells were examined 9h after
treatment using a live / dead assay in a Hermes WiScan instrument (n = 3 +/- SEM). (H) Tumor cells were
treated with vehicle control or with regorafenib (REGO 0.5 M) and/or sildenafil (SIL, 2.0 M) and/or ATRA
(150 nM). Cells were examined 18h after treatment using a live / dead assay in a Hermes WiScan instrument (n
= 3 +/- SEM). (I) Tumor cells were treated with vehicle control or with regorafenib (REGO 0.5 M) and/or
sildenafil (SIL, 2.0 M) followed 30 min later by exposure to ionizing radiation. Cells were examined 12h after
treatment using a live / dead assay in a Hermes WiScan instrument (n = 3 +/- SEM). (J) Upper blots: Tumor
cells were treated with 50 nM FTY720 for the indicated times and cell lysates western blotted to determine
expression of the death receptor CD95 (n = 3); Lower IHC: Tumor cells in situ in a 96 well plate were treated
with FTY720 (50 nM) for the indicated times, and cells fixed and probed for expression of FAS ligand (FAS-L)
Acc
epte
d A
rtic
le45
This article is protected by copyright. All rights reserved
(n = 3). (K) HEPG2 cells were treated with vehicle (DMSO), sorafenib (2 M), sildenafil (2 M); or the drugs
in combination. Left: Cells were isolated after 30 min and immuno-precipitation of I B was performed in
duplicate. On separate blots assessment of I B nitro-tyrosine and total I B was performed. Center: Cells were
isolated after 6h and the expression of FAS-L and CD95 determined. Right. HEPG2 cells were transfected with
empty vector plasmid or plasmid to express dominant negative I B S32A S36A. Twenty four h after
transfection cells were treated with vehicle (DMSO), sorafenib (2 M), sildenafil (2 M); or the drugs in
combination. Cells were isolated after 6h and the expression of CD95 determined.
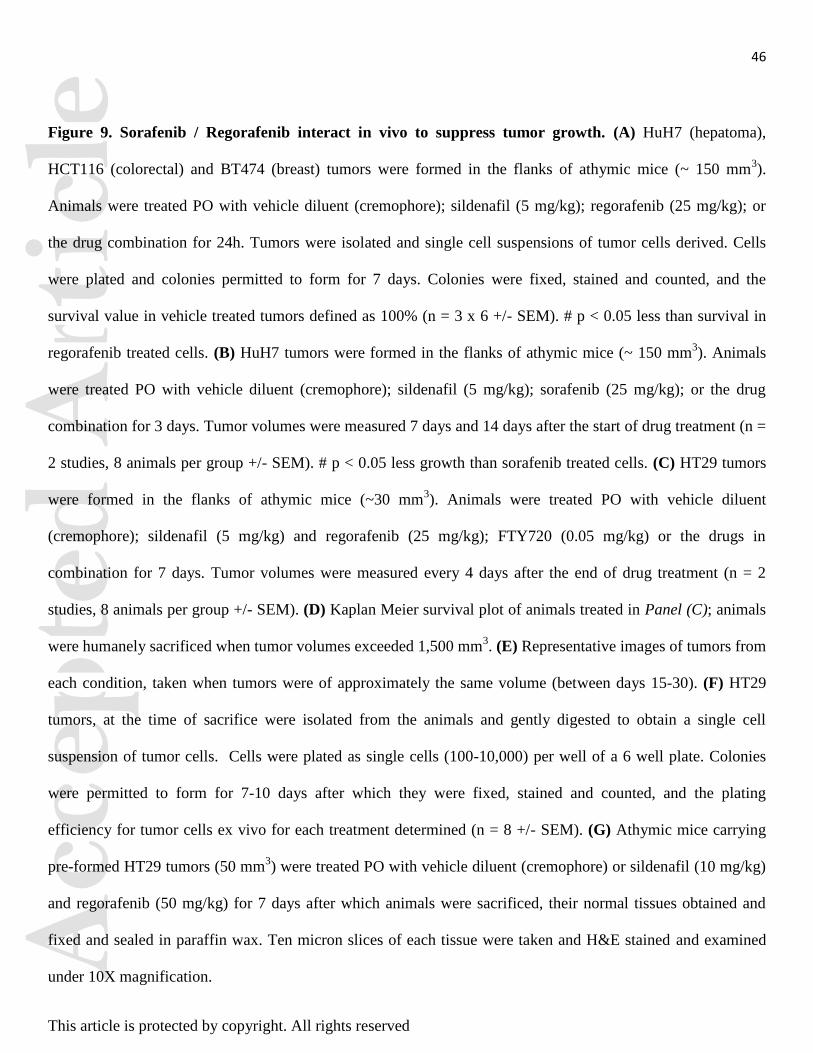
Acc
epte
d A
rtic
le46
This article is protected by copyright. All rights reserved
Figure 9. Sorafenib / Regorafenib interact in vivo to suppress tumor growth. (A) HuH7 (hepatoma),
HCT116 (colorectal) and BT474 (breast) tumors were formed in the flanks of athymic mice (~ 150 mm3).
Animals were treated PO with vehicle diluent (cremophore); sildenafil (5 mg/kg); regorafenib (25 mg/kg); or
the drug combination for 24h. Tumors were isolated and single cell suspensions of tumor cells derived. Cells
were plated and colonies permitted to form for 7 days. Colonies were fixed, stained and counted, and the
survival value in vehicle treated tumors defined as 100% (n = 3 x 6 +/- SEM). # p < 0.05 less than survival in
regorafenib treated cells. (B) HuH7 tumors were formed in the flanks of athymic mice (~ 150 mm3). Animals
were treated PO with vehicle diluent (cremophore); sildenafil (5 mg/kg); sorafenib (25 mg/kg); or the drug
combination for 3 days. Tumor volumes were measured 7 days and 14 days after the start of drug treatment (n =
2 studies, 8 animals per group +/- SEM). # p < 0.05 less growth than sorafenib treated cells. (C) HT29 tumors
were formed in the flanks of athymic mice (~30 mm3). Animals were treated PO with vehicle diluent
(cremophore); sildenafil (5 mg/kg) and regorafenib (25 mg/kg); FTY720 (0.05 mg/kg) or the drugs in
combination for 7 days. Tumor volumes were measured every 4 days after the end of drug treatment (n = 2
studies, 8 animals per group +/- SEM). (D) Kaplan Meier survival plot of animals treated in Panel (C); animals
were humanely sacrificed when tumor volumes exceeded 1,500 mm3. (E) Representative images of tumors from
each condition, taken when tumors were of approximately the same volume (between days 15-30). (F) HT29
tumors, at the time of sacrifice were isolated from the animals and gently digested to obtain a single cell
suspension of tumor cells. Cells were plated as single cells (100-10,000) per well of a 6 well plate. Colonies
were permitted to form for 7-10 days after which they were fixed, stained and counted, and the plating
efficiency for tumor cells ex vivo for each treatment determined (n = 8 +/- SEM). (G) Athymic mice carrying
pre-formed HT29 tumors (50 mm3) were treated PO with vehicle diluent (cremophore) or sildenafil (10 mg/kg)
and regorafenib (50 mg/kg) for 7 days after which animals were sacrificed, their normal tissues obtained and
fixed and sealed in paraffin wax. Ten micron slices of each tissue were taken and H&E stained and examined
under 10X magnification.
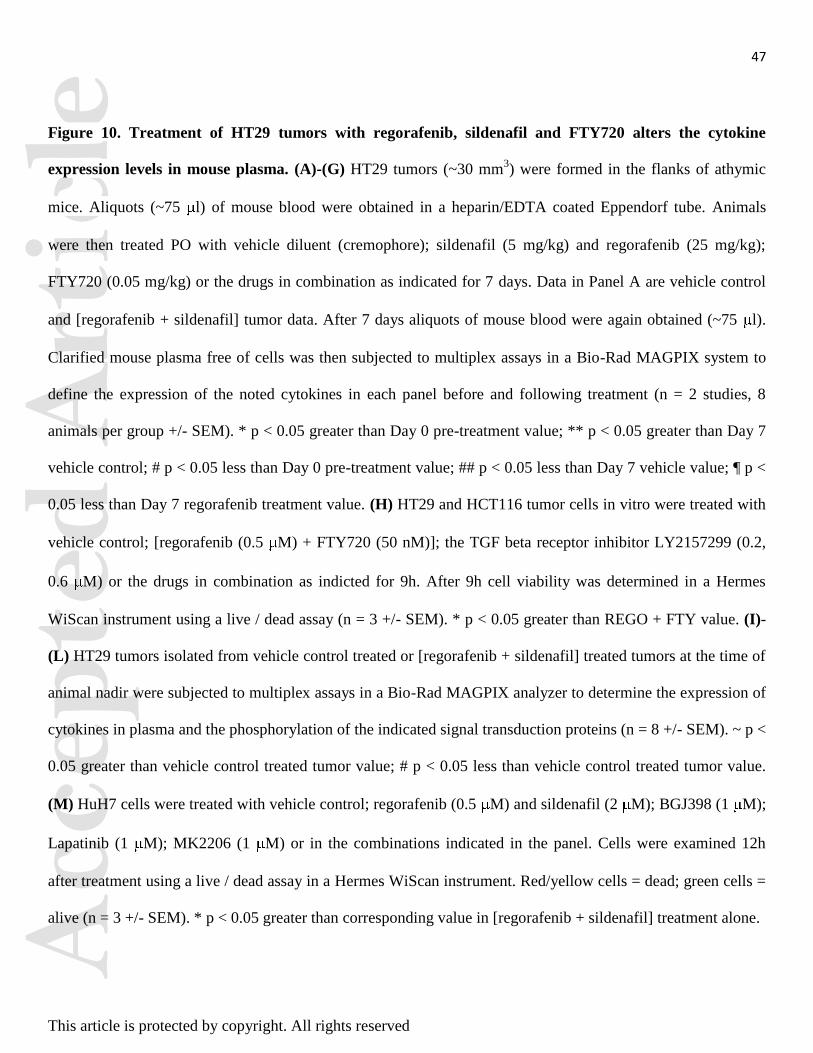
Acc
epte
d A
rtic
le47
This article is protected by copyright. All rights reserved
Figure 10. Treatment of HT29 tumors with regorafenib, sildenafil and FTY720 alters the cytokine
expression levels in mouse plasma. (A)-(G) HT29 tumors (~30 mm3) were formed in the flanks of athymic
mice. Aliquots (~75 l) of mouse blood were obtained in a heparin/EDTA coated Eppendorf tube. Animals
were then treated PO with vehicle diluent (cremophore); sildenafil (5 mg/kg) and regorafenib (25 mg/kg);
FTY720 (0.05 mg/kg) or the drugs in combination as indicated for 7 days. Data in Panel A are vehicle control
and [regorafenib + sildenafil] tumor data. After 7 days aliquots of mouse blood were again obtained (~75 l).
Clarified mouse plasma free of cells was then subjected to multiplex assays in a Bio-Rad MAGPIX system to
define the expression of the noted cytokines in each panel before and following treatment (n = 2 studies, 8
animals per group +/- SEM). * p < 0.05 greater than Day 0 pre-treatment value; ** p < 0.05 greater than Day 7
vehicle control; # p < 0.05 less than Day 0 pre-treatment value; ## p < 0.05 less than Day 7 vehicle value; ¶ p <
0.05 less than Day 7 regorafenib treatment value. (H) HT29 and HCT116 tumor cells in vitro were treated with
vehicle control; [regorafenib (0.5 M) + FTY720 (50 nM)]; the TGF beta receptor inhibitor LY2157299 (0.2,
0.6 M) or the drugs in combination as indicted for 9h. After 9h cell viability was determined in a Hermes
WiScan instrument using a live / dead assay (n = 3 +/- SEM). * p < 0.05 greater than REGO + FTY value. (I)-
(L) HT29 tumors isolated from vehicle control treated or [regorafenib + sildenafil] treated tumors at the time of
animal nadir were subjected to multiplex assays in a Bio-Rad MAGPIX analyzer to determine the expression of
cytokines in plasma and the phosphorylation of the indicated signal transduction proteins (n = 8 +/- SEM). ~ p <
0.05 greater than vehicle control treated tumor value; # p < 0.05 less than vehicle control treated tumor value.
(M) HuH7 cells were treated with vehicle control; regorafenib (0.5 M) and sildenafil (2 M); BGJ398 (1 M);
Lapatinib (1 M); MK2206 (1 M) or in the combinations indicated in the panel. Cells were examined 12h
after treatment using a live / dead assay in a Hermes WiScan instrument. Red/yellow cells = dead; green cells =
alive (n = 3 +/- SEM). * p < 0.05 greater than corresponding value in [regorafenib + sildenafil] treatment alone.
Acc
epte
d A
rtic
le48
This article is protected by copyright. All rights reserved
Figure 11. Regorafenib / Sildenafil treatment alter multiple cell signaling processes in drug treated
tumors at cessation of drug treatment. Panels (A)-(E) HuH7 and HT29 tumors, treated as described in
Figures 9 and 10, were isolated 7 days after the start of drug exposure or were isolated at the time of sacrifice,
when tumor volume was > 1,500 mm3 (n.b. tumor mass for REGO + SIL treated tumors was only ~500 mm
3).
Tumors were freeze-thawed and lysed according to established procedures / manufacturer instructions. Tumors
were subjected to multiplex assays to determine the levels of plasma cytokines / growth factors and the
phosphorylation / expression of multiple membrane and intracellular signal transduction proteins (n = 8 +/-
SEM). # p < 0.05 lower value than vehicle control treated tumors; ~ p < 0.05 greater value than in vehicle
control treated tumors. (F) HuH7 cells were treated with vehicle control; regorafenib (0.5 M) and sildenafil (2
M); BGJ398 (1 M); Lapatinib (1 M); MK2206 (1 M) or in the combinations indicated in the panel. Cells
were examined 12h after treatment using a live / dead assay in a Hermes WiScan instrument. Red/yellow cells =
dead; green cells = alive (n = 3 +/- SEM). * p < 0.05 greater than corresponding value in [regorafenib +
sildenafil] treatment alone.
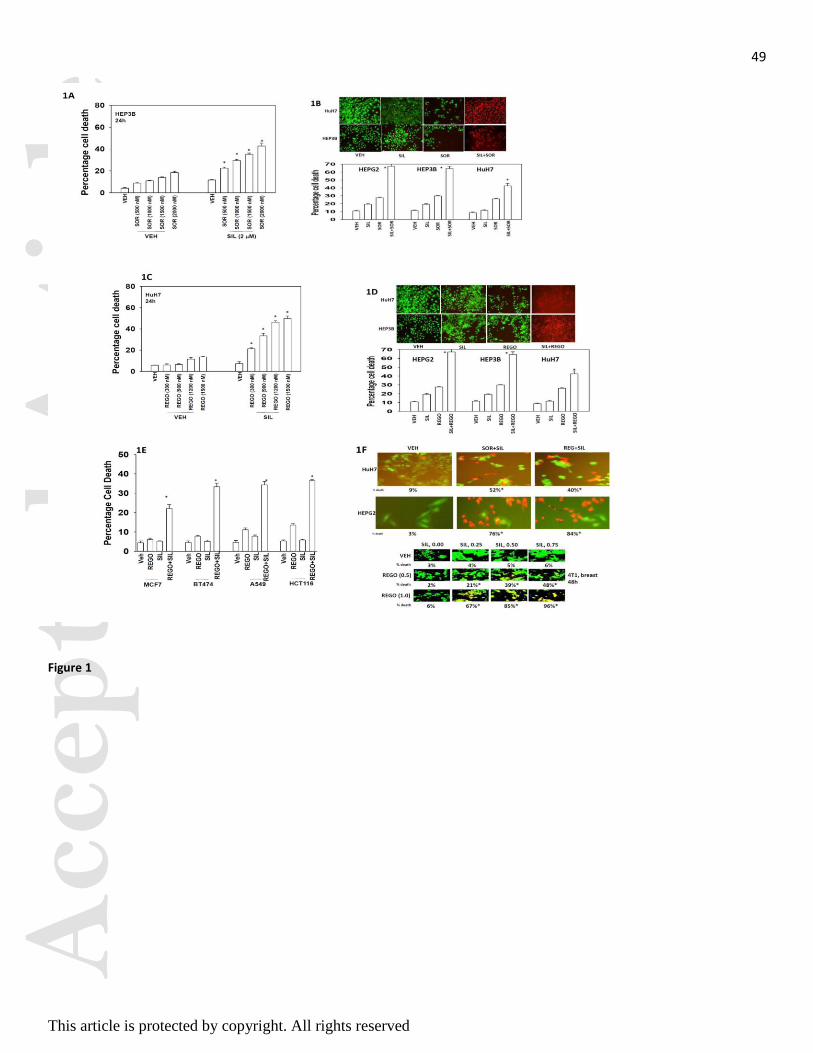
Acc
epte
d A
rtic
le49
This article is protected by copyright. All rights reserved
Figure 1
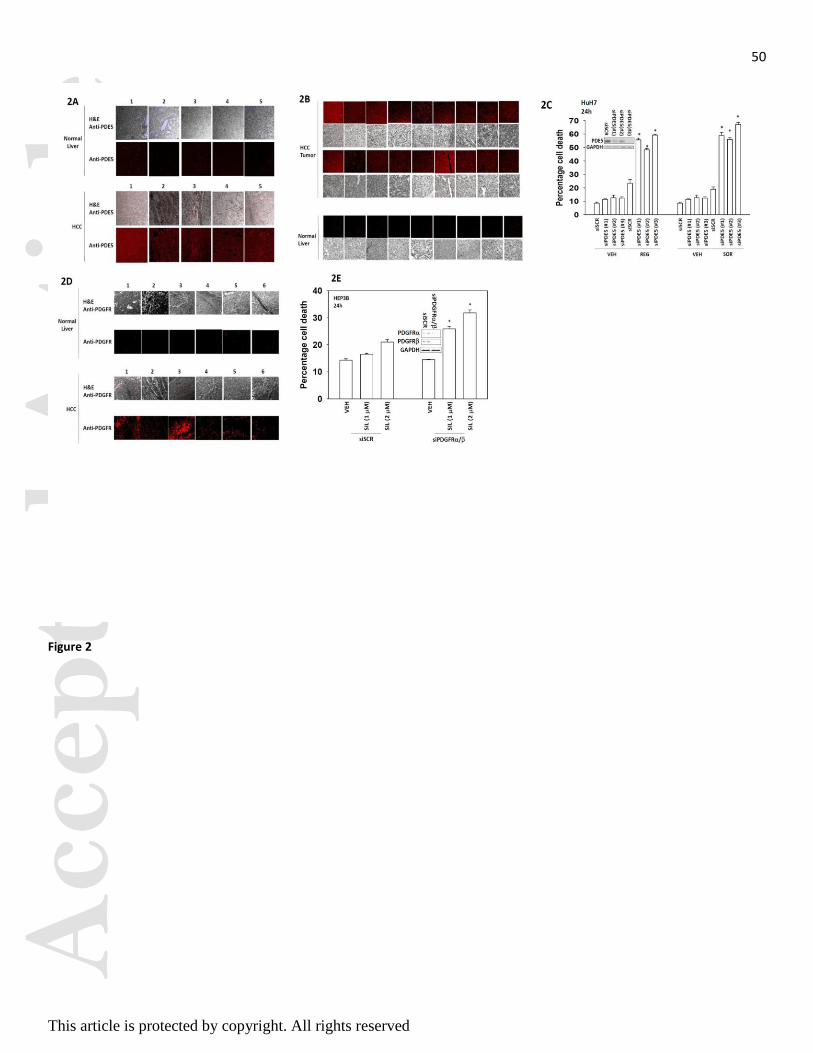
Acc
epte
d A
rtic
le50
This article is protected by copyright. All rights reserved
Figure 2
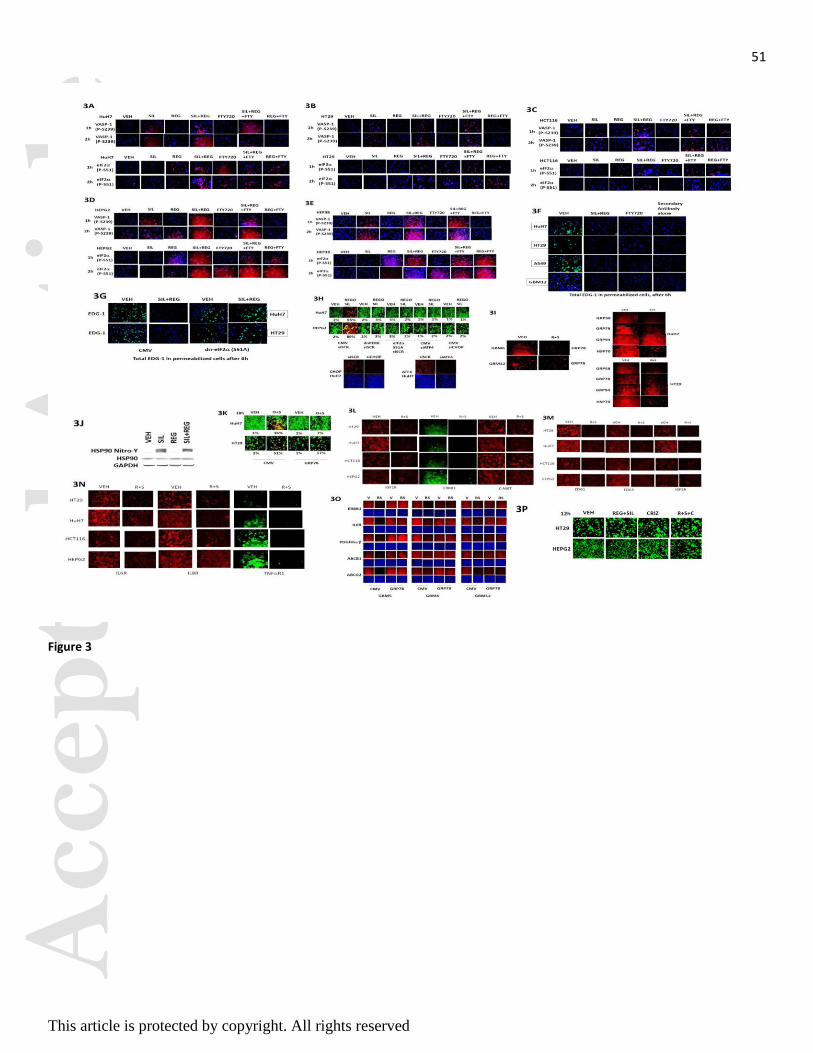
Acc
epte
d A
rtic
le51
This article is protected by copyright. All rights reserved
Figure 3
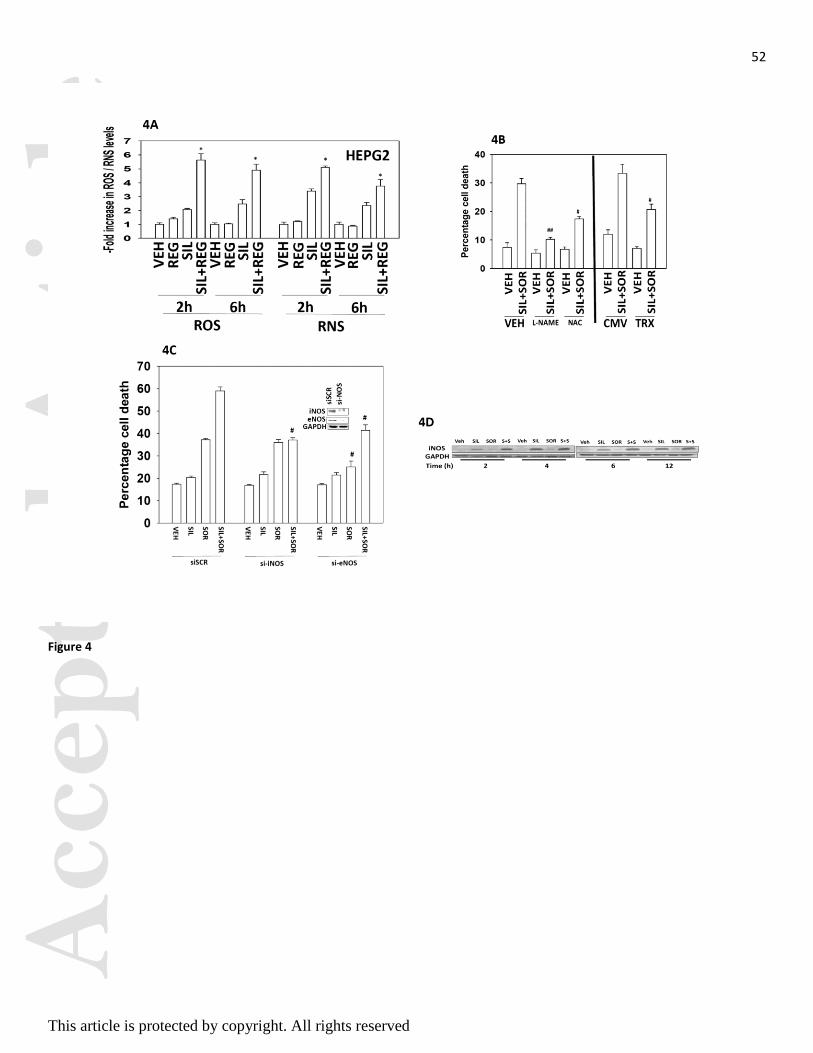
Acc
epte
d A
rtic
le52
This article is protected by copyright. All rights reserved
Figure 4
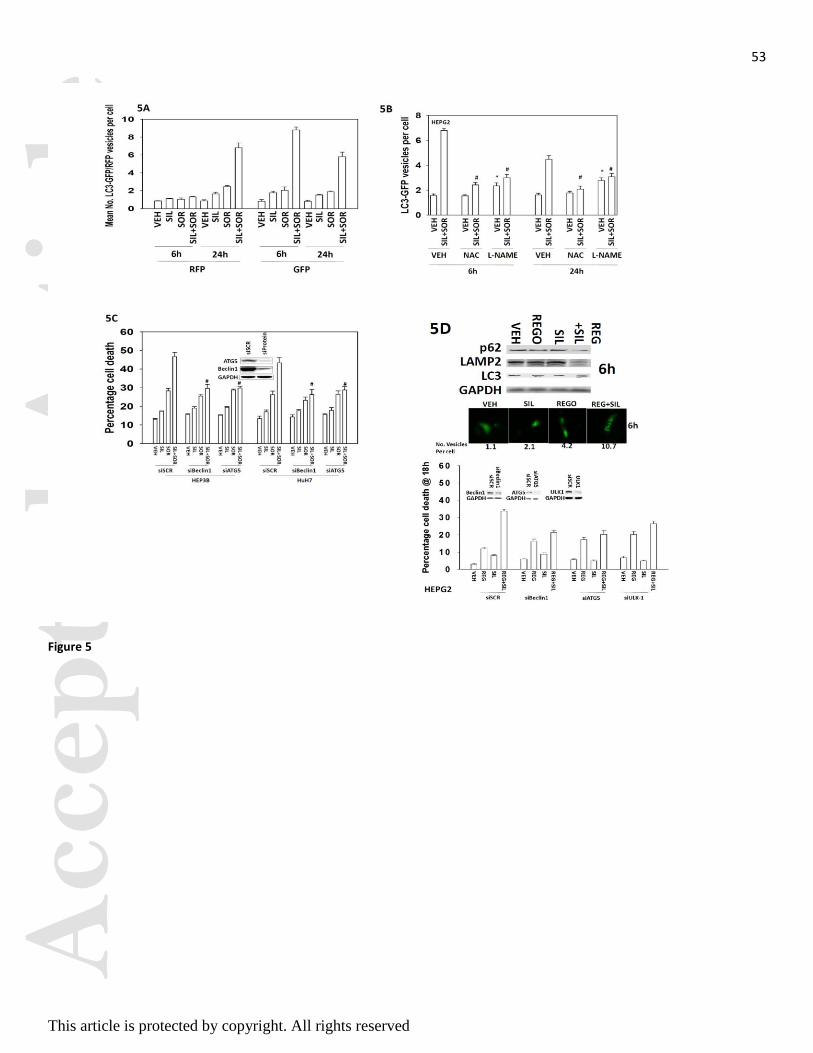
Acc
epte
d A
rtic
le53
This article is protected by copyright. All rights reserved
Figure 5
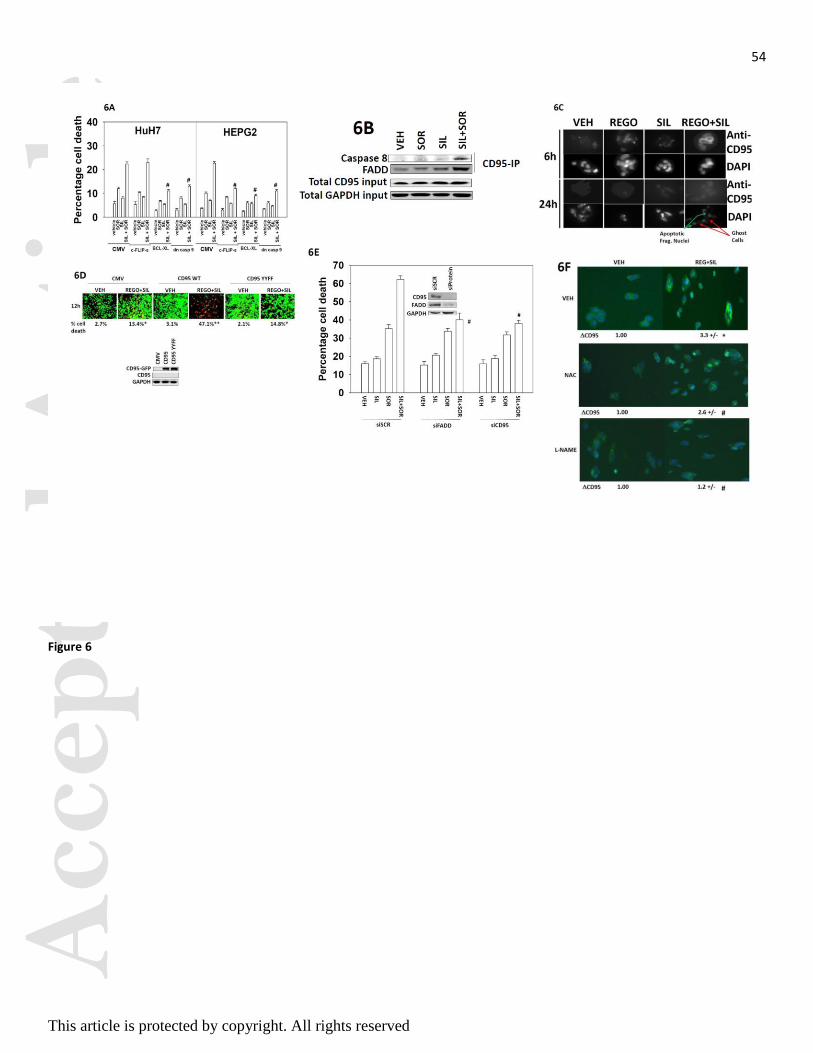
Acc
epte
d A
rtic
le54
This article is protected by copyright. All rights reserved
Figure 6
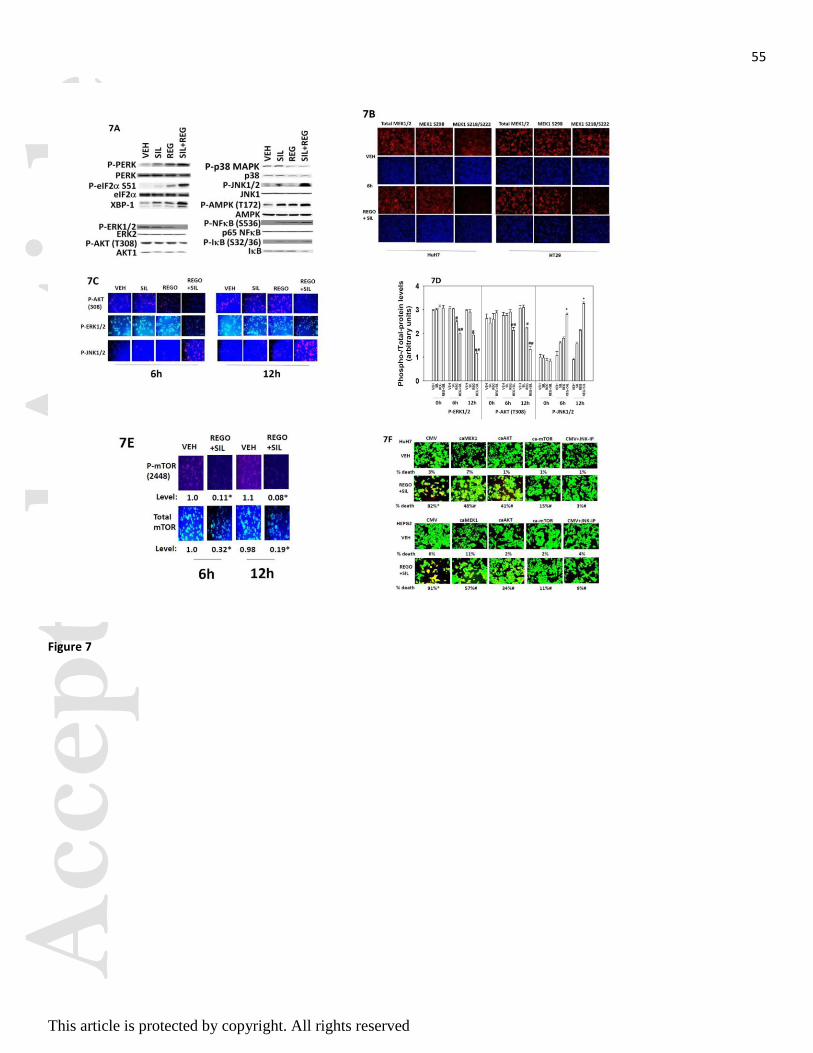
Acc
epte
d A
rtic
le55
This article is protected by copyright. All rights reserved
Figure 7
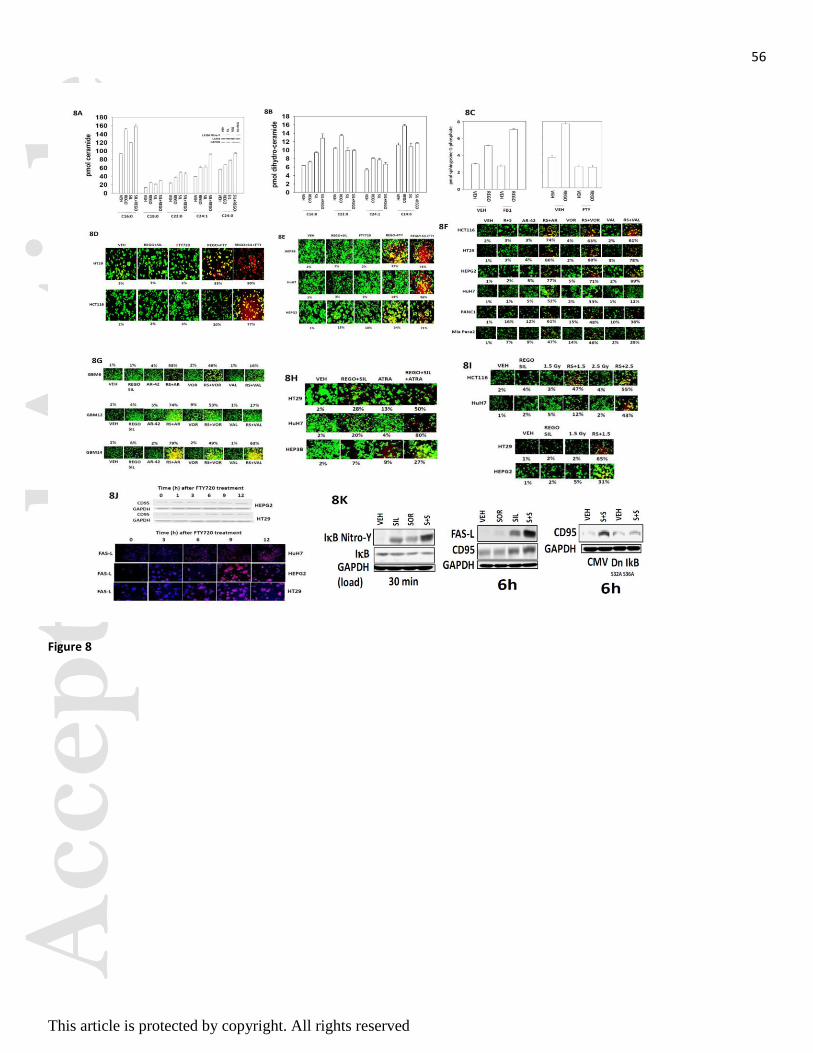
Acc
epte
d A
rtic
le56
This article is protected by copyright. All rights reserved
Figure 8
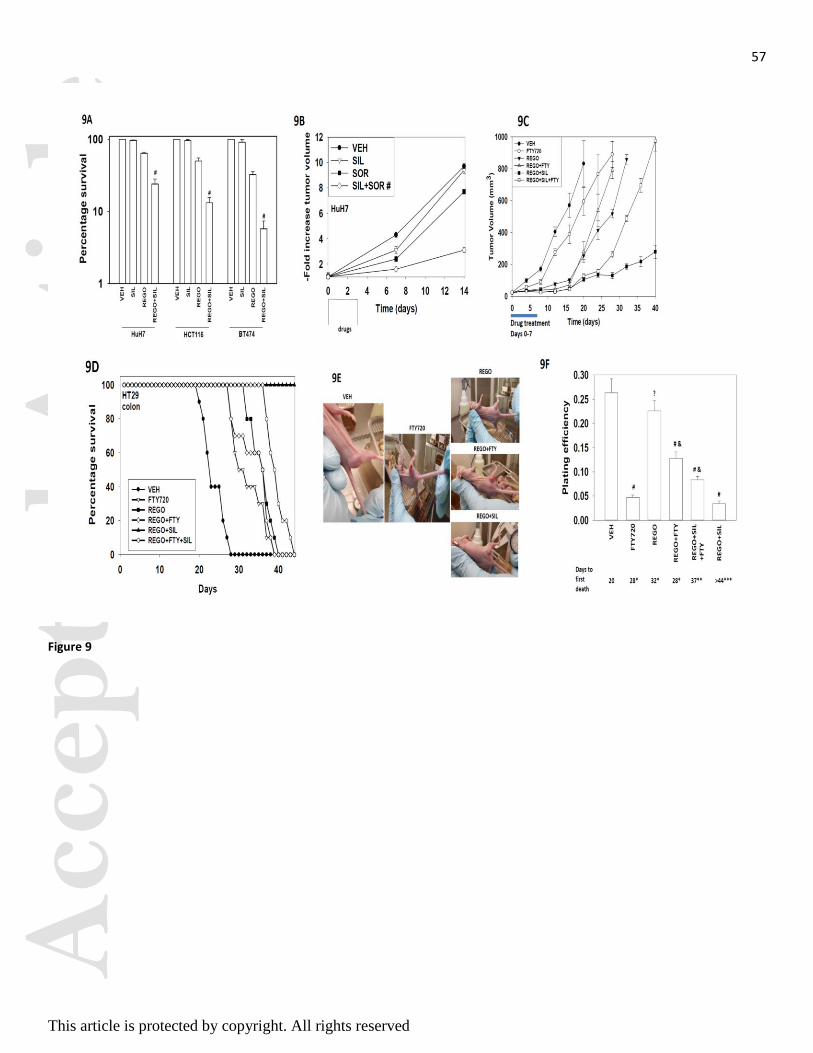
Acc
epte
d A
rtic
le57
This article is protected by copyright. All rights reserved
Figure 9
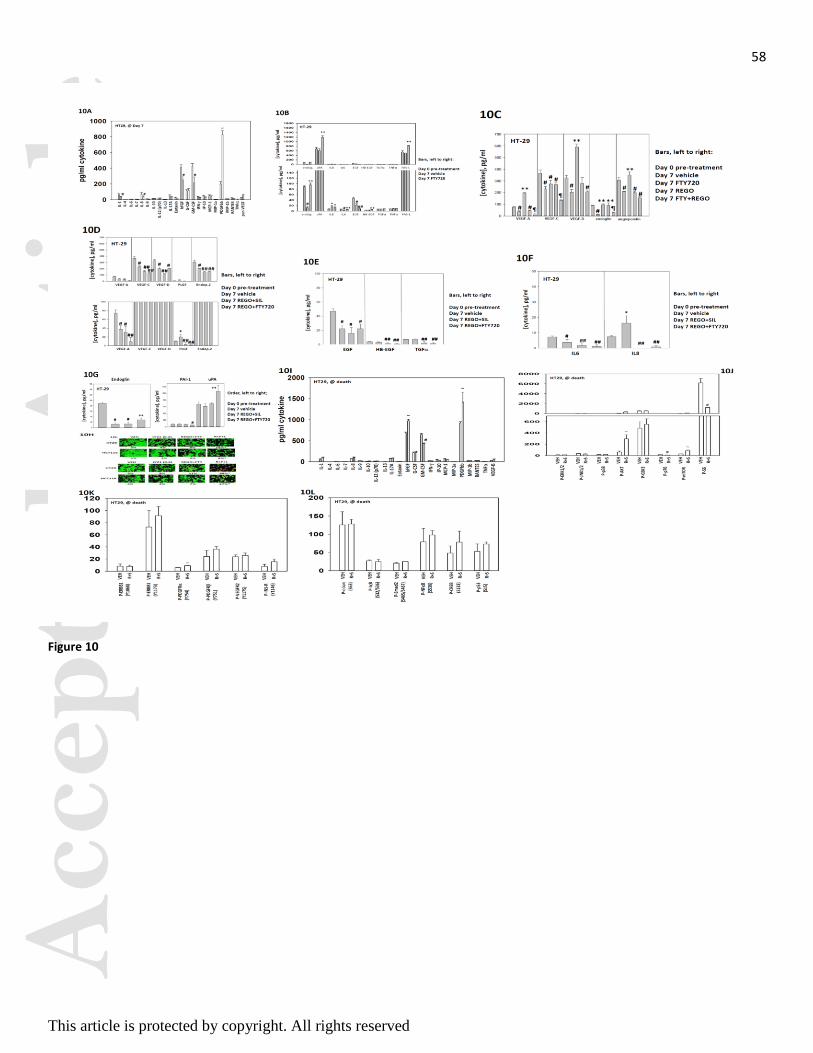
Acc
epte
d A
rtic
le58
This article is protected by copyright. All rights reserved
Figure 10
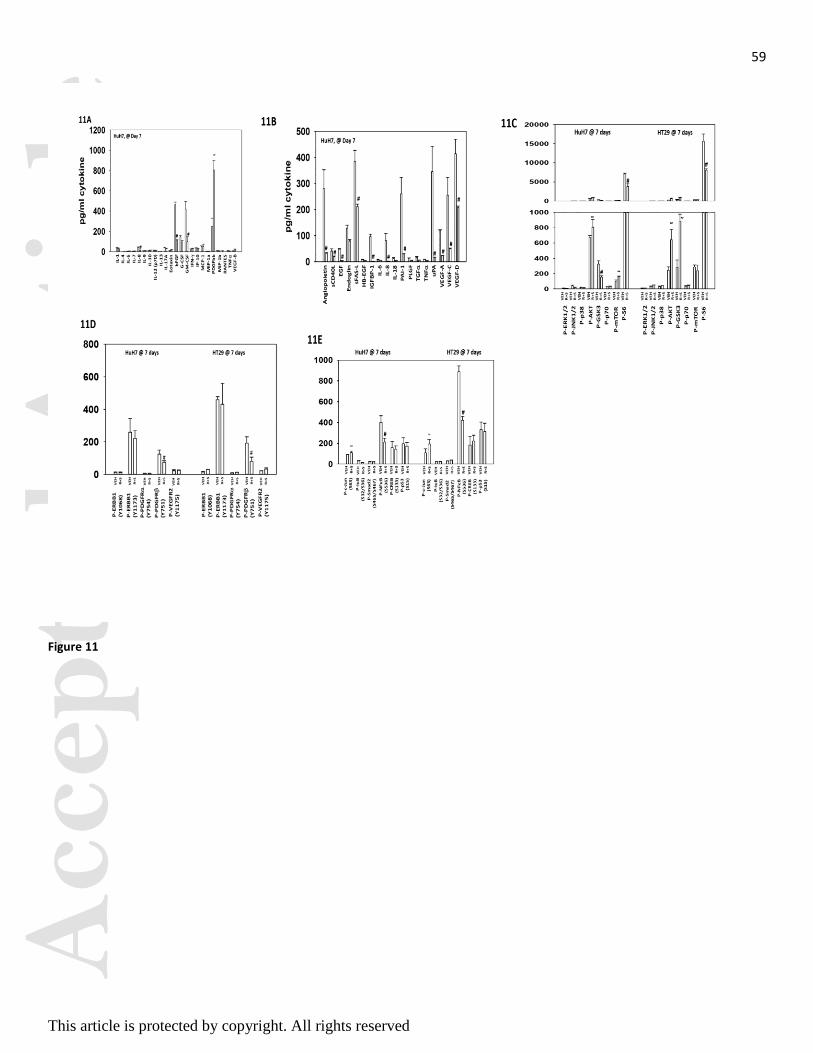
Acc
epte
d A
rtic
le59
This article is protected by copyright. All rights reserved
Figure 11
Related Documents