NEW PALTZ CENTRAL SCHOOL DISTRICT ENROLLMENT PROJECTION 2010-2019 DECEMBER 2009 PREPARED BY F ACT S 200 Turk Hill Park Fairport, NY 14450 1-800-22FACTS

Welcome message from author
This document is posted to help you gain knowledge. Please leave a comment to let me know what you think about it! Share it to your friends and learn new things together.
Transcript

NEW PALTZCENTRAL SCHOOL DISTRICT
ENROLLMENT PROJECTION2010-2019
DECEMBER 2009
PREPARED BY F ACT S200 Turk Hill ParkFairport, NY 14450
1-800-22FACTS
SECTION
TABLE OF CONTENTS
PAGE
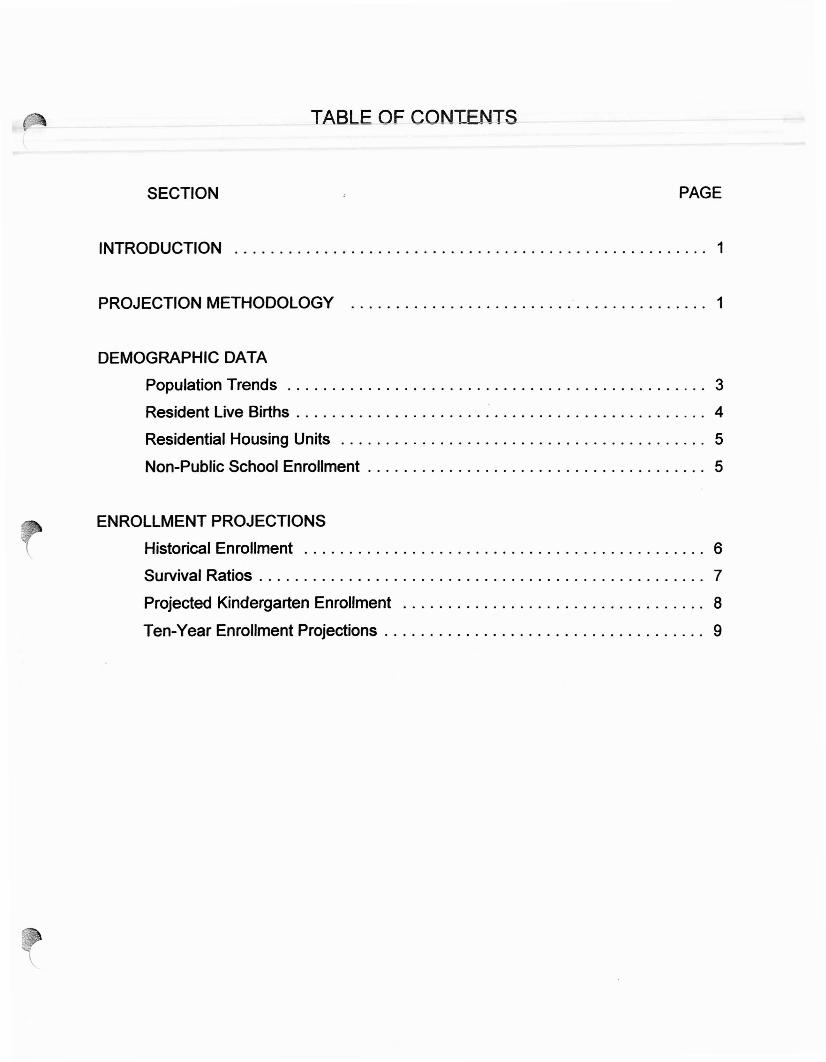
INTRODUCTION 1
PROJECTION METHODOLOGY 1
DEMOGRAPHIC DATA
Population Trends 3
Resident Live Births . . . . . . . . . . . . . . . . . . . . . .. . . . . . . . . . . . . . . . . . . . . . . .. 4
Residential Housing Units 5
Non-Public School Enrollment . . . . . . . . . . . . . . . . . . . . . . . . . . . . . . . . . . . . .. 5
ENROLLMENT PROJECTIONS
Historical Enrollment 6
Survival Ratios . . . . . . . . . . . . . . . . . . . . . . . . . . . . . . . . . . . . . . . . . . . . . . . . .. 7
Projected Kindergarten Enrollment 8
Ten-Year Enrollment Projections 9

TABLE
TABLES
PAGE
I Population Trends 3
II Resident Live Births . . . . . . . . . . . . . . . . . . . . . . . . . . . . . . . . . . . . . . . . . . . . .. 4
III Residential Housing Units 5
IV Non-Public School Enrollment . . . . . . . . . . . . . . . . . . . . . . . . . . . . . . . . . . . . .. 5
V Historical Enrollment 6
VI Survival Ratios 7
VII Projected Kindergarten Enrollment - Live Births 8
VIII Enrollment Projection Summary 9
IX Ten-Year Enrollment Projection - Live Births 10
GRAPHS
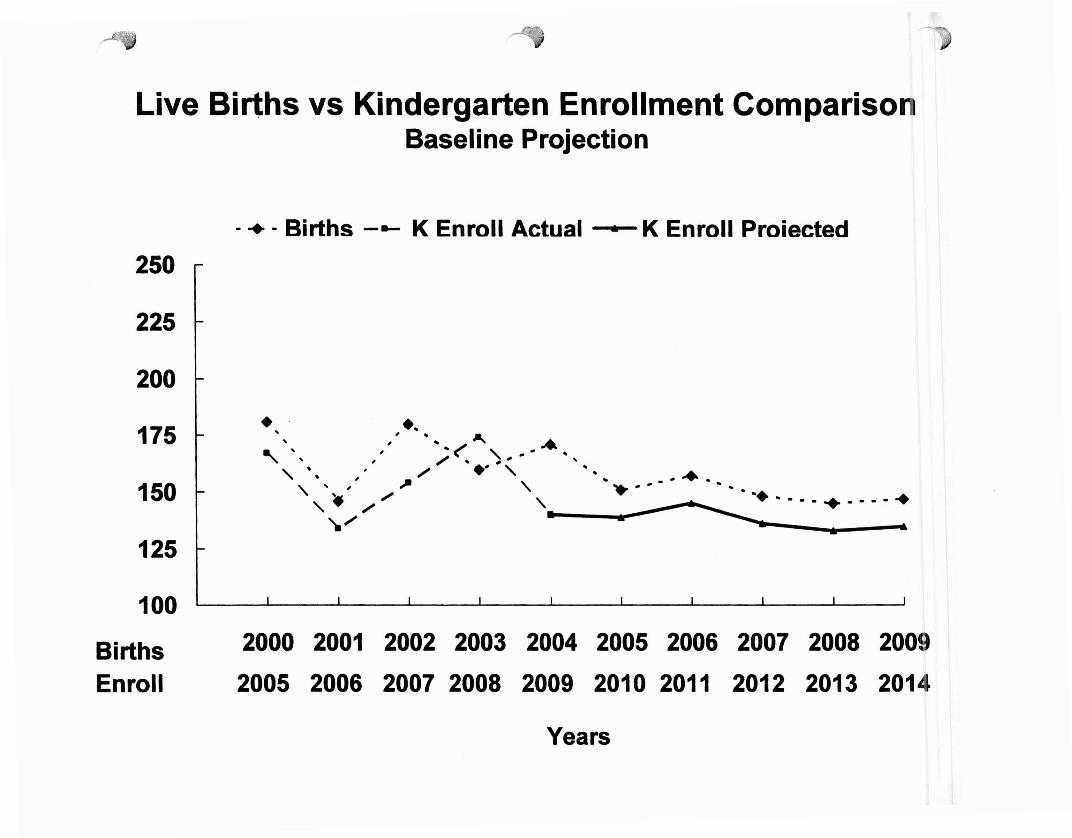
Live Births vs Kindergarten Enrollment
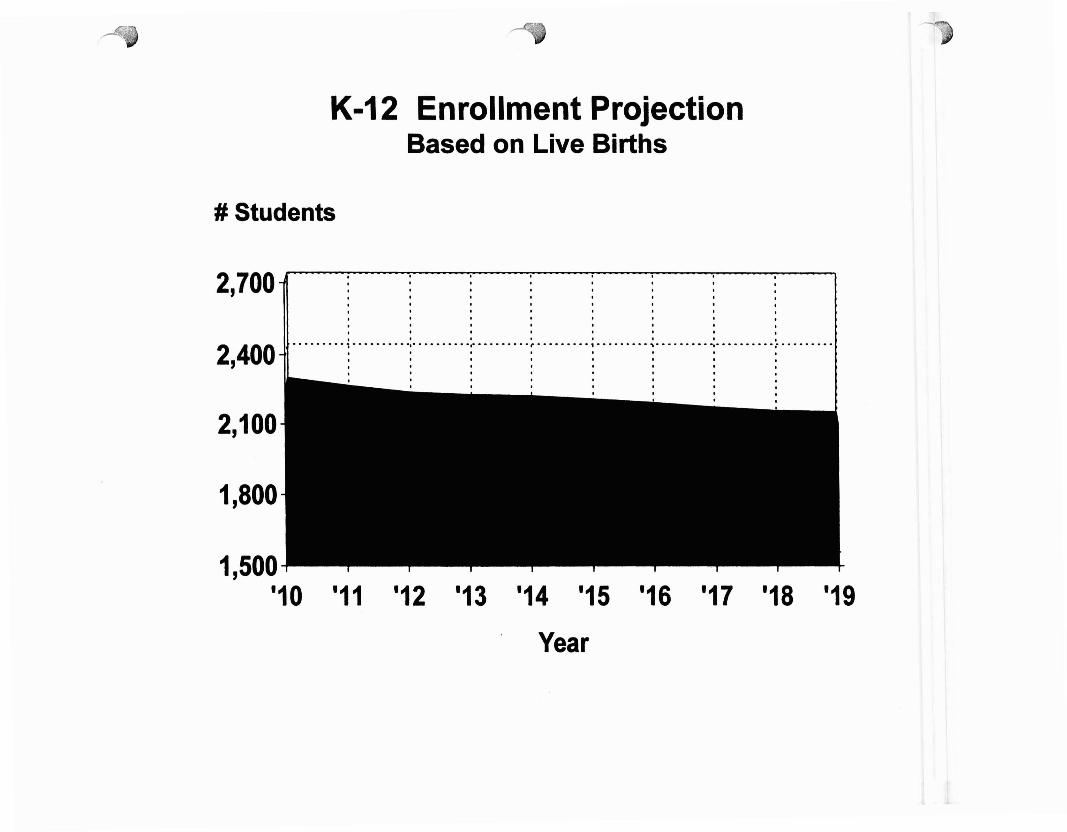
Ten-Year Enrollment Projection
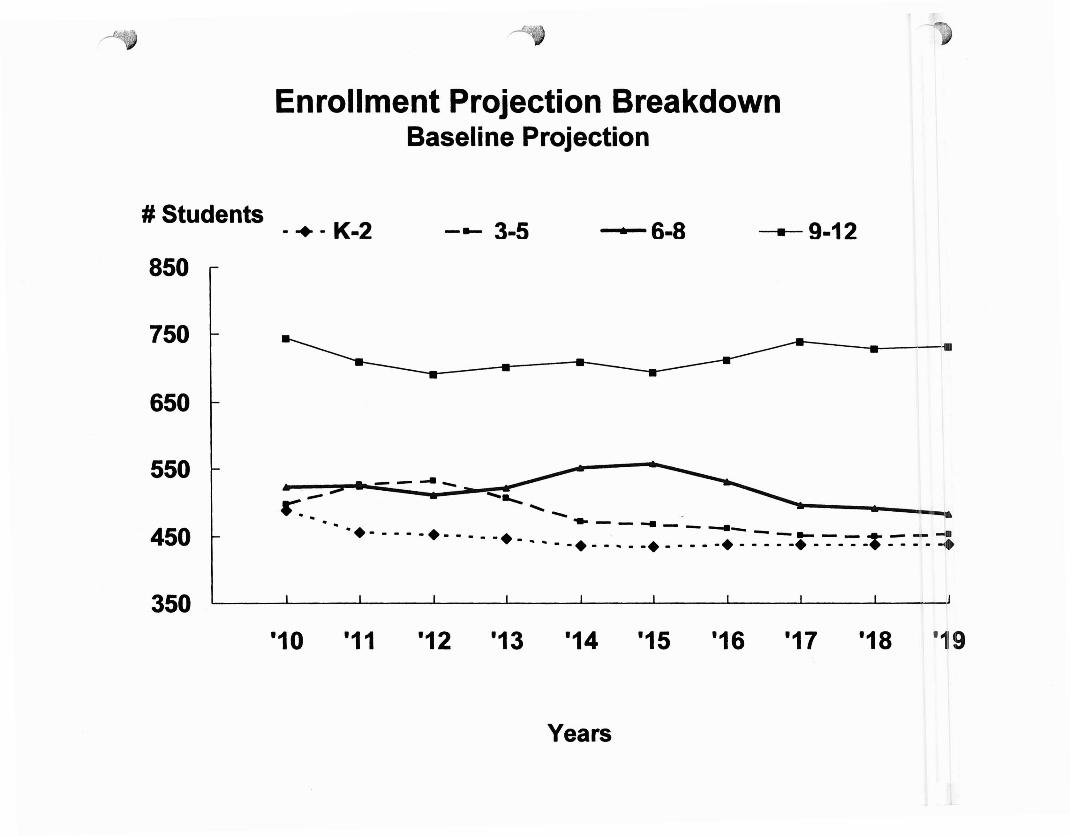
Enrollment Projection Breakdown
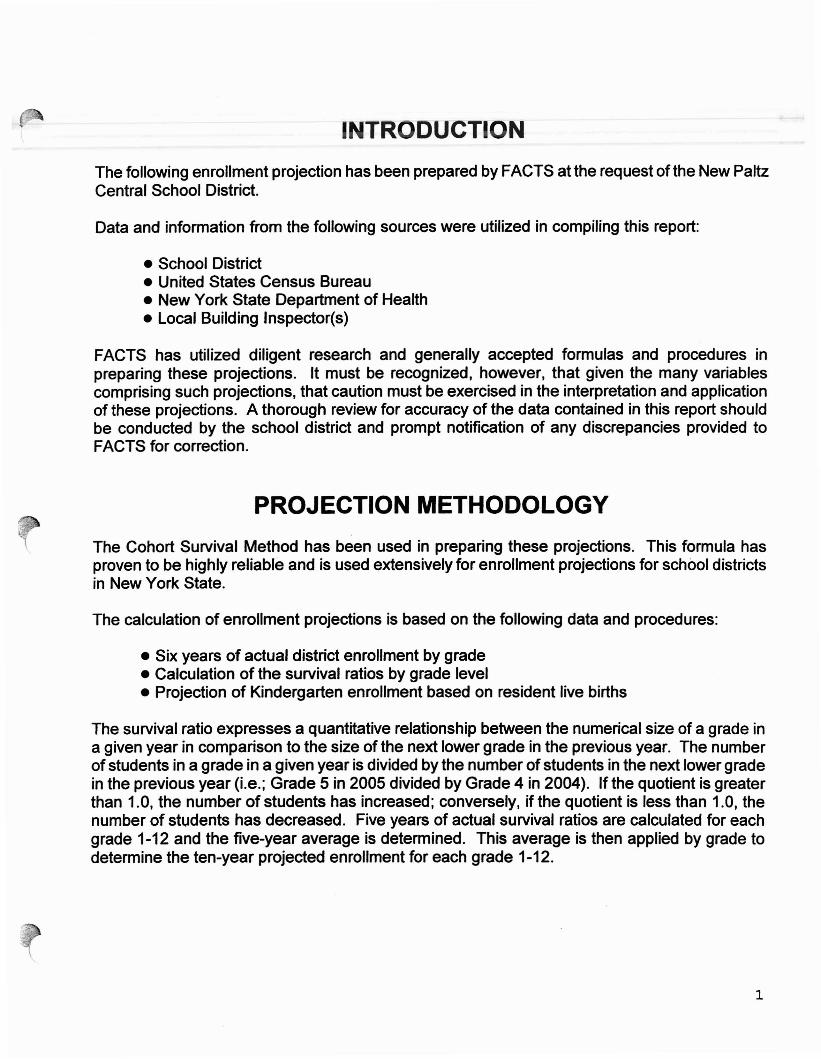
INTRODUCTION
The following enrollment projection has been prepared by FACTS at the request of the New PaltzCentral School District.
Data and information from the following sources were utilized in compiling this report:
• School District• United States Census Bureau• New York State Department of Health• Local Building Inspector(s)
FACTS has utilized diligent research and generally accepted formulas and procedures inpreparing these projections. It must be recognized, however, that given the many variablescomprising such projections, that caution must be exercised in the interpretation and applicationof these projections. A thorough review for accuracy of the data contained in this report shouldbe conducted by the school district and prompt notification of any discrepancies provided toFACTS for correction.
PROJECTION METHODOLOGY
The Cohort Survival Method has been used in preparing these projections. This formula hasproven to be highly reliable and is used extensively for enrollment projections for school districtsin New York State.
The calculation of enrollment projections is based on the following data and procedures:
• Six years of actual district enrollment by grade• Calculation of the survival ratios by grade level• Projection of Kindergarten enrollment based on resident live births
The survival ratio expresses a quantitative relationship between the numerical size of a grade ina given year in comparison to the size of the next lower grade in the previous year. The numberof students in a grade in a given year is divided by the number of students in the next lower gradein the previous year (Le.; Grade 5 in 2005 divided by Grade 4 in 2004). If the quotient is greaterthan 1.0, the number of students has increased; conversely, if the quotient is less than 1.0, thenumber of students has decreased. Five years of actual survival ratios are calculated for eachgrade 1-12 and the five-year average is determined. This average is then applied by grade todetermine the ten-year projected enrollment for each grade 1-12.
1
The calculation of projected kindergarten enrollment is based on the analysis of resident live birthdata:-A tefl--yea; history-oHrre-birth data is cotlected. Each oftiTe first five years ot-tive b"irth datais compared to the actual kindergarten enrollment fiv· years e ce and the surviva~ raro iscalculated (Le.; 2000 live births to 2005 kindergarten enrollment, etc.). The five annual survivalratios are averaged and that average is applied to the next five years of live birth data to obtainthe first five years of annual projected kindergarten enrollment (Le.; 2005-2009 live births toproject 2010-2014 kindergarten enrollments). For purposes of providing a ten-year enrollmentprojection, the kindergarten enrollment is projected for the last five years of the projection at thesame number appearing in the fifth year.
In addition, the following factors which could potentially impact these projections are alsoresearched and analyzed:
• Significant changes in residential construction• Major changes in the local employment base• Shifts in the non-public school population
The reliability of any enrollment projection must clearly be understood. Projections based oncurrent and historical actual enrollments are the most reliable. Those based on historical live birthdata are somewhat less reliable. In addition, the time frame and subset of the projections alsoplay an important part in the reliability. Projections for the immediate future will be more reliablethan those in later years, for example. Projections for the total K-12 district enrollment will alsobe more reliable than those for any particular grade in any given year. Therefore, theseprojections should be updated annually to reflect the latest live birth and actual enrollment data.
For the purposes of this study, data for the Towns of Gardiner and New Paltz, and the Village ofNew Paltz have been researched.
As a result of the lack of district census data, the enrollment projection based on census cannotbe provided.
Annual Updates: Annual updates of original projections prepared by FACTS are limited to thecollection and research of the following information:
District censusLive birthsDistrict enrollmentDistrict non-public school enrollment
The collection of information regarding future residential construction programs are not includedin the Annual Update pricing fee.
2
DEMOGRAPHIC DATA
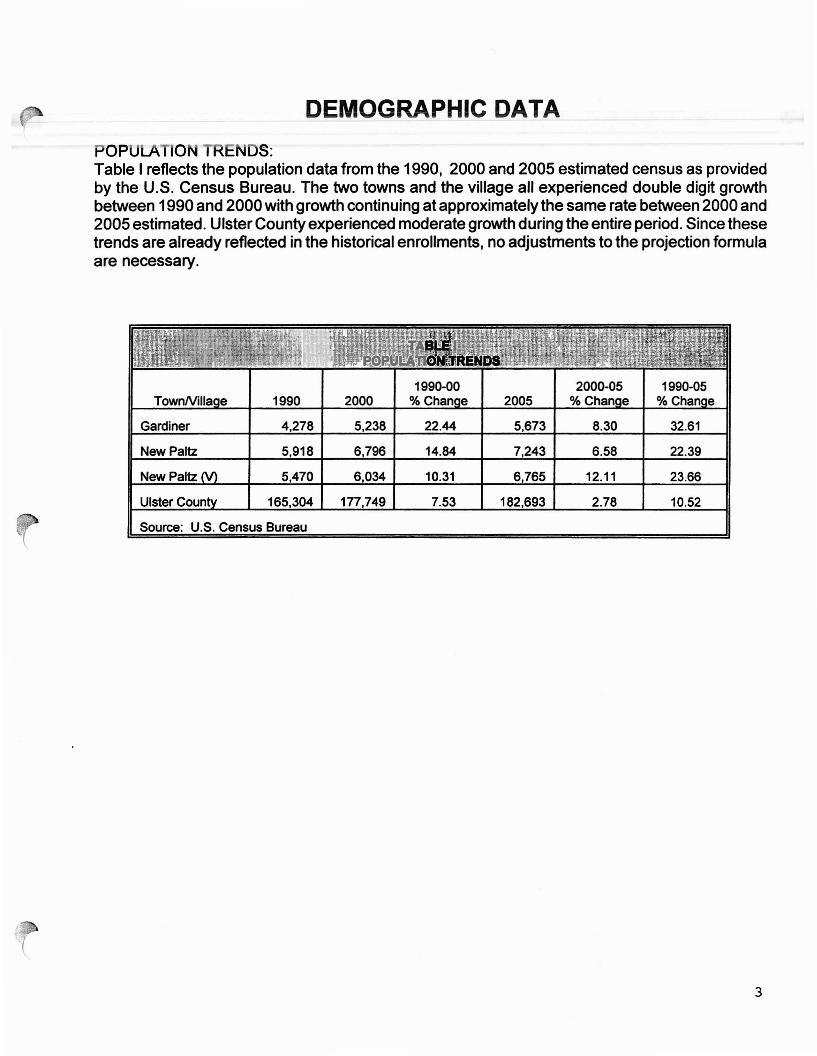
OPULA 0 N 5:Table I reflects the population data from the 1990, 2000 and 2005 estimated census as providedby the U.S. Census Bureau. The two towns and the village all experienced double digit growthbetween 1990 and 2000 with growth continuing at approximately the same rate between 2000 and2005 estimated. Ulster County experienced moderate growth during the entire period. Since thesetrends are already reflected in the historical enrollments, no adjustments to the projection formulaare necessary.
1990-00 2000-05 1990-05TownNilla e 1990 2000 % Chan e 2005 % Chan e % Chan e
Gardiner 4,278 5,238 22.44 5,673 8.30 32.61
New Paltz 5,918 6,796 14.84 7,243 6.58 22.39
New Paltz 5,470 6,034 10.31 6,765 12.11 23.66
UlsterCoun 165,304 177,749 7.53 182,693 2.78 10.52
Source: U.S. Census Bureau
3

RESIDENT LIVE BIRTHS:Table'" shows the actual number of live births for a nine-year period for the Zip Codes includedin this study. For purposes of this study, 2009 has been estimated at the average for 2007-08 of147. "Htis iftfemnatior.-has-been-used incaleulating-the-ten=year-projected kindergarte enroUmentas shown in Table VIII.
Zi Code 2000 2001 2002 2003 2004 2005 2006 2007 2008 2009*
12525
12561
TOTAL
35
146
181
35
111
146
49
131
180
42
118
160
42
129
171
32
119
151
47
110
157
24
124
148
37
108
145 147
* EstimatedSource: New York State De artment of Health
4
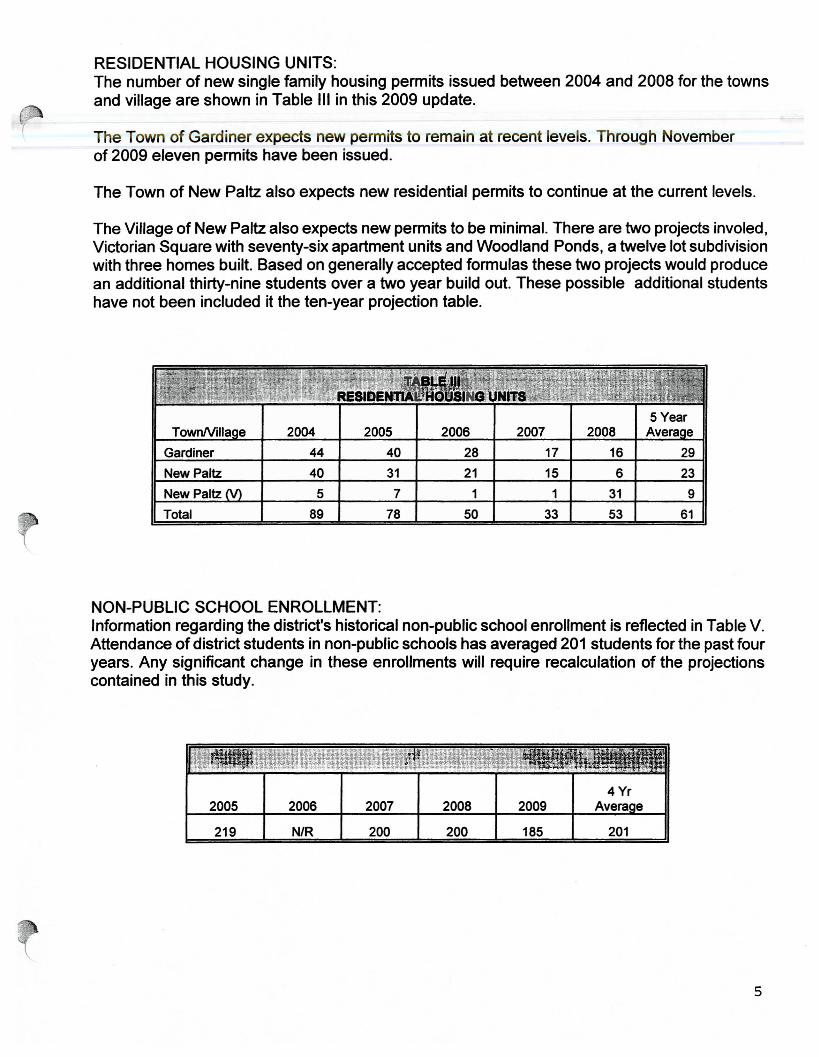
RESIDENTIAL HOUSING UNITS:The number of new single family housing permits issued between 2004 and 2008 for the townsand village are shown in Table III in this 2009 update.
The Town of Gardiner expects new permits to remain at recent levels. Through Novemberof 2009 eleven permits have been issued.
The Town of New Paltz also expects new residential permits to continue at the current levels.
The Village of New Paltz also expects new permits to be minimal. There are two projects involed I
Victorian Square with seventy-six apartment units and Woodland Ponds, a twelve lot subdivisionwith three homes built. Based on generally accepted formulas these two projects would producean additional thirty-nine students over a two year build out. These possible additional studentshave not been included it the ten-year projection table.
5 YearTownNilla e 2004 2005 2006 2007 2008 Avera e
Gardiner 44 40 28 17 16 29New Paltz 40 31 21 15 6 23New Paltz 5 7 1 1 31 9Total 89 78 50 33 53 61'.
NON-PUBLIC SCHOOL ENROLLMENT:Information regarding the district's historical non-pUblic school enrollment is reflected in Table V.Attendance of district students in non-public schools has averaged 201 students for the past fouryears. Any significant change in these enrollments will require recalculation of the projectionscontained in this study.
2005
219
2006
N/R
2007
200
2008
200
2009
185
4 YrAvera e
201
5
ENROLLMENT PROJECTIONS
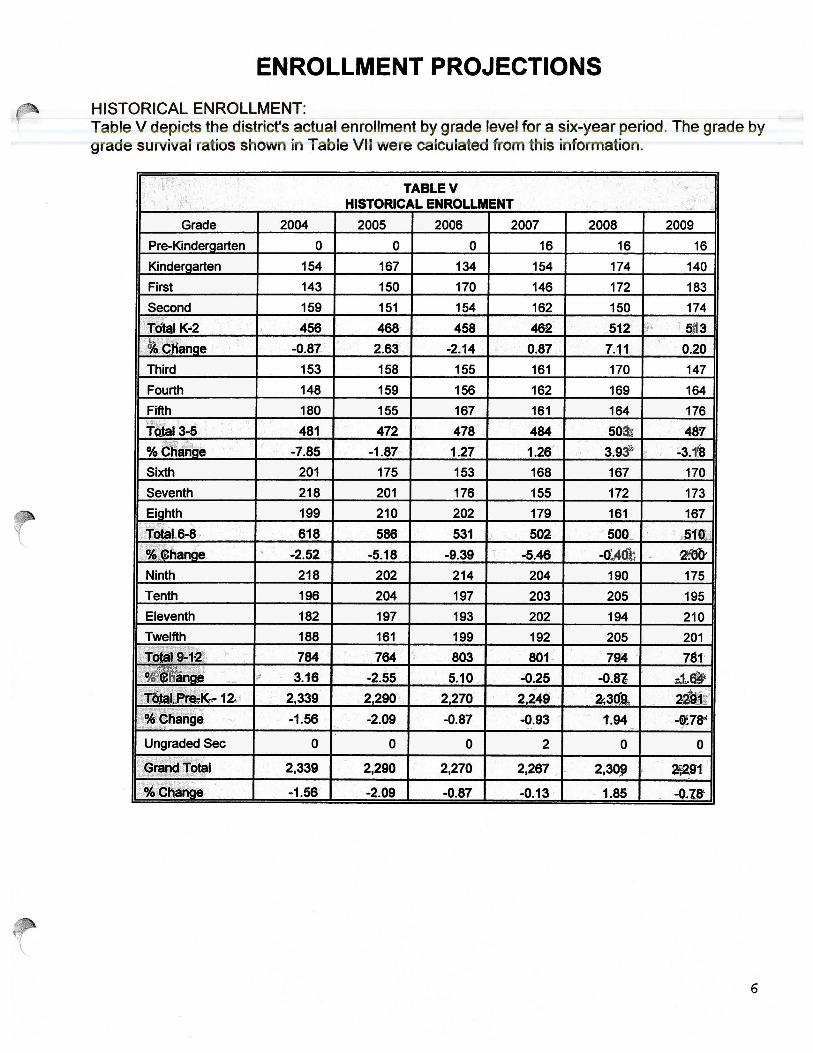
HISTORICAL ENROLLMENT:Table V depicts the district's actual enrollment by grade level for a six-year period. The grade by9 ade su ivai atios show in Table VII were calculated from this information.
. "." TASLEV .,.
HISTORICAL ENROLLMENT . ~
Grade 2004 2005 2006 2007 2008 2009
Pre-Kinden::larten 0 0 0 16 16 16
Kinderaarten 154 167 134 154 174 140
First 143 150 170 146 172 183
Second 159 151 154 162 150 174
'Tolal K..2 , 456 468· 458 462 512 ~. j 5.f:l3.l,'!'·~
% C.Hange -0.87 2.63 -2.14 0.87 7.11 0.20
Third 153 158 155 161 170 147
Fourth 148 159 156 162 169 164
Fifth 180 155 167 161 164 176"'!~:.r
481 472,
478 484 50~ 487ToJaI3-5 .
%c1ia"tlbe,
-7.85 -1.87 1.27 1.26 3.9Y' • -3.1:8
Sixth 201 175 153 168 167 170
Seventh 218 201 176 155 172 173
Eighth 199 210 202 179 161 167
.1J6ia'.6r8 ...
618 586 531 502 500_ ..51«,;;~".c]:;''' , • -2.52 -5.18 -9.39 " -5.46 -O,,4Qt 2fEfO'I~?A»",ehanae .Ninth 218 202 214 204 190 175
Tenth 196 204 197 203 205 195
Eleventh 182 197 193 202 194 210
Twelfth 188 161 199 192 205 201~~.; :I,"(,~~~Jo~%.1l;." ~
784 761-{}ffQtal*9M~ 764 803 801· 7~
~~~liff<} ft 3.16 -2.55 5.10 -0.25 -0,,81 ~t.§~L. an e -~ii1i~~;~;
~
2d'9.:t:Jili· f.1R(e;K,;- 12.' 2339 2290. 2270 2.249 2:3<1..9.."e ~ -1.56 -2.09 -0.87 -0.93 t.94 -f7SG
'. .. .Ungraded Sec 0 0 0 2 0 0
• 2,339 2.290 2.270 2,267 2.309 , ~,2.91
-1.56 -2.09 -0.87 -0.13 . . 1.85 -0.18':ri:- ~:i.GliaDa.e,
6
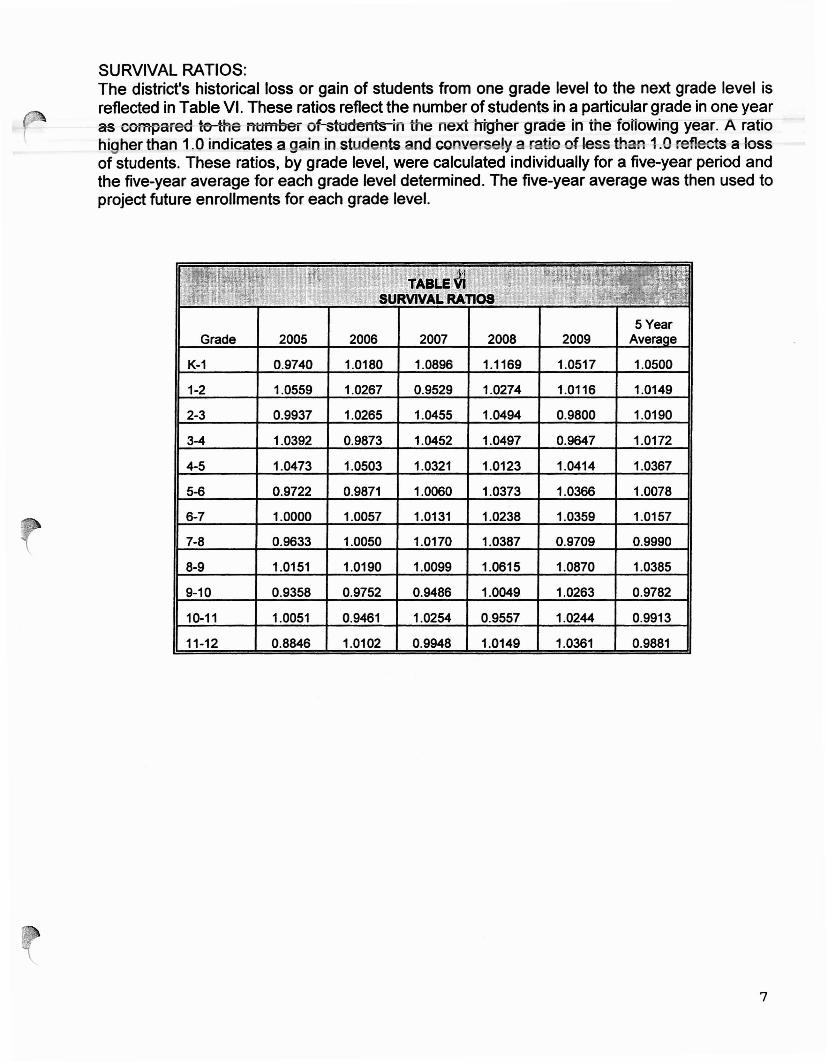
SURVIVAL RATIOS:The district's historical loss or gain of students from one grade level to the next grade level isreflected in Table VI. These ratios reflect the number of students in a particular grade in one yearas COffif}ai'e6- te-the- ni1fflber of-sttjdei Its in the next higher grade in the fofrowing year. A ratiohigher than 1.0 indicates a gain in stud nts nd co v r ely a rat~o of less than 1.0 reflects a lossof students. These ratios, by grade level, were calculated individually for a five-year period andthe five-year average for each grade level determined. The five-year average was then used toproject future enrollments for each grade level.
5 YearGrade 2005 2006 2007 2008 2009 Avera e
K-1 0.9740 1.0180 1.0896 1.1169 1.0517 1.0500
1-2 1.0559 1.0267 0.9529 1.0274 1.0116 1.0149
2-3 0.9937 1.0265 1.0455 1.0494 0.9800 1.0190
3-4 1.0392 0.9873 1.0452 1.0497 0.9647 1.0172
4-5 1.0473 1.0503 1.0321 1.0123 1.0414 1.0367
5-6 0.9722 0.9871 1.0060 1.0373 1.0366 1.0078
6-7 1.0000 1.0057 1.0131 1.0238 1.0359 1.0157
7-8 0.9633 1.0050 1.0170 1.0387 0.9709 0.9990
8-9 1.0151 1.0190 1.0099 1.0615 1.0870 1.0385
9-10 0.9358 0.9752 0.9486 1.0049 1.0263 0.9782
10-11 1.0051 0.9461 1.0254 0.9557 1.0244 0.9913
11-12 0.8846 1.0102 0.9948 1.0149 1.0361 0.9881
7
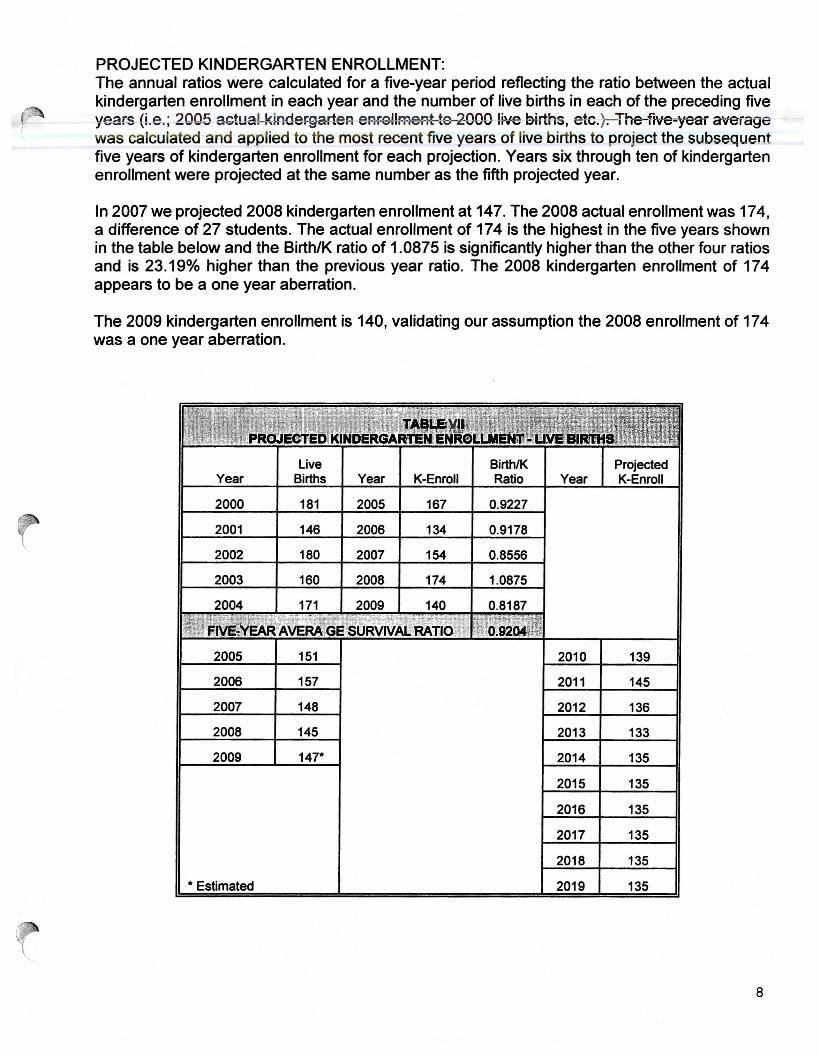
PROJECTED KINDERGARTEN ENROLLMENT:The annual ratios were calculated for a five-year period reflecting the ratio between the actualkindergarten enrollment in each year and the number of live births in each of the preceding fiveyears {Le.; 200~ astual-ki-RdeJ=ga,:tep, ep,.~lmeAt-te-2000 ~ive ektAs, etc.}.-The-f~yeai aveiagewas calculated and applied to the most recent five years of live births to project the subsequentfive years of kindergarten enrollment for each projection. Years six through ten of kindergartenenrollment were projected at the same number as the fifth projected year.
In 2007 we projected 2008 kindergarten enrollment at 147. The 2008 actual enrollment was 174,a difference of 27 students. The actual enrollment of 174 is the highest in the five years shownin the table below and the Birth/K ratio of 1.0875 is significantly higher than the other four ratiosand is 23.19% higher than the previous year ratio. The 2008 kindergarten enrollment of 174appears to be a one year aberration.
The 2009 kindergarten enrollment is 140, validating our assumption the 2008 enrollment of 174was a one year aberration.
Live BirthlK ProjectedYear Births Year K-Enroll Ratio Year K-Enroll
2000 181 2005 167 0.9227
2001 146 2006 134 0.9178
2002 180 2007 154 0.8556
2003 160 2008 174 1.0875
2004 171 2009 140 0.8187
2005 151 2010 139
2006 157 2011 145
2007 148 2012 136
2008 145 2013 133
2009 147* 2014 135
2015 135
2016 135
2017 135
2018 135
*Estimated 2019 135
8
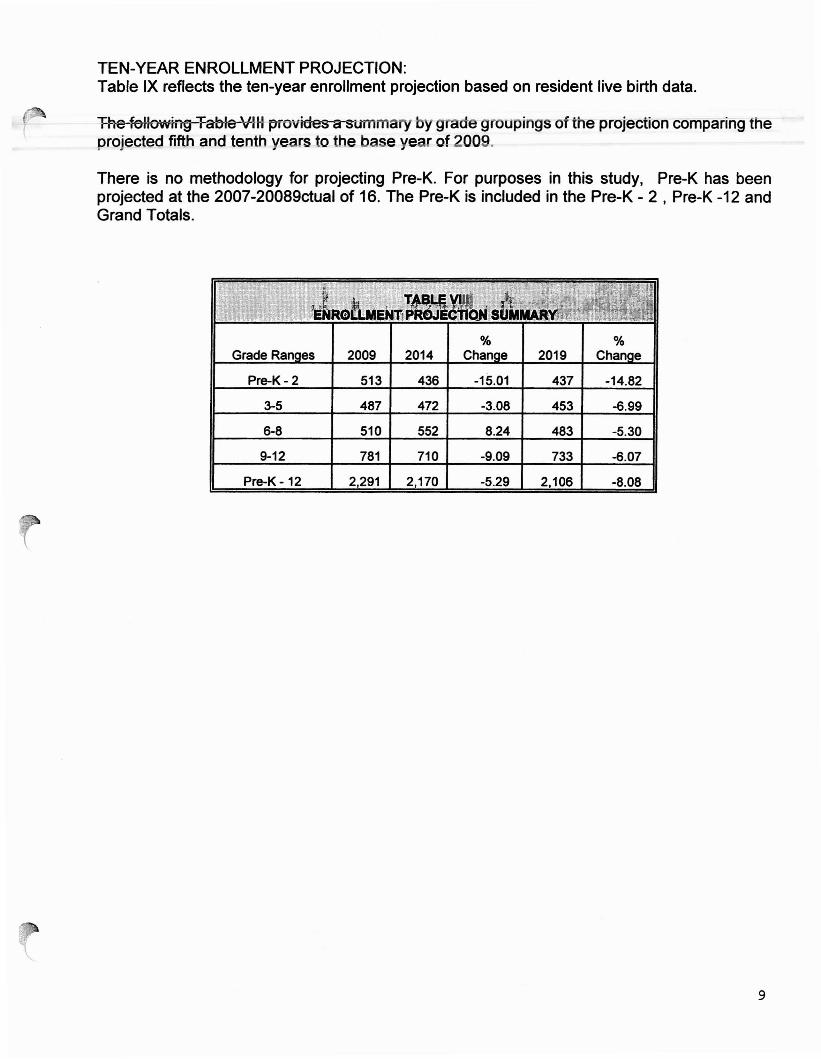
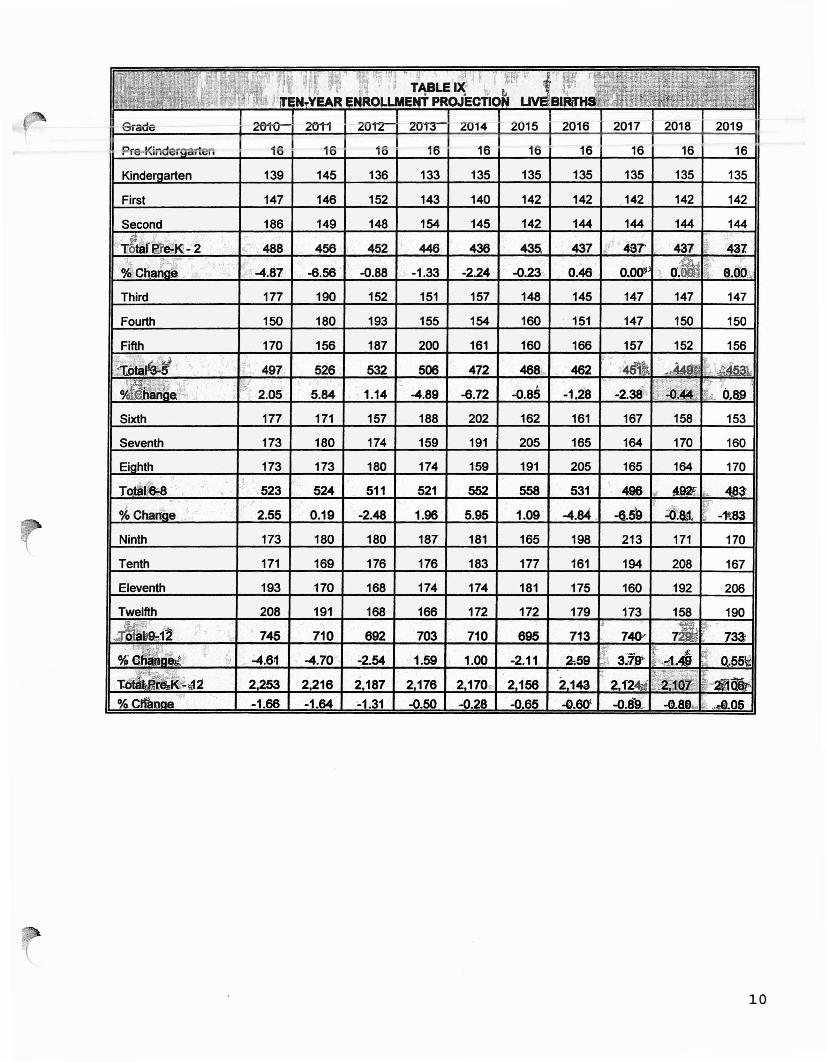
TEN-YEAR ENROLLMENT PROJECTION:Table IX reflects the ten-year enrollment projection based on resident live birth data.
"Fhe-feHowhrg-"F-able-Vm pmvides a summary bygrade groupings of the projection comparing theprojected fifth and tenth years to the ba e year of 200 .
There is no methodology for projecting Pre-K. For purposes in this study, Pre-K has beenprojected at the 2007-20089ctual of 16. The Pre-K is included in the Pre-K - 2 I Pre-K -12 andGrand Totals.
% %Grade Ran es 2009 2014 Chan e 2019 Chan e
Pre-K·2 513 436 -15.01 437 -14.82
3-5 487 472 -3.08 453 -6.99
6-8 510 552 8.24 483 -5.30
9-12 781 710 -9.09 733 -6.07
Pre-K - 12 2,291 2,170 -5.29 2,106 -8.08
9
~ l'W 'It":i "." ", " '0- ., ~~f~"':¥ c.:' I~ ;, hi" ~~ '/ T¥LEI~~, . 0 t<P 1
. ;~1, ) lifEN,.YEAR ENROLLMENT PROJECnO~ "BIM
Sicrue- 26tQ- 26t1 20'1'2- 2O'fr 2014 2015 2016 2017 2018 2019
Pre-Kindergarten 16 16 16 16 16 16 16 16 16 16
Kindergarten 139 145 136 133 135 135 135 135 135 135
First 147 146 152 143 140 142 142 142 142 142
Second 186 149 148 154 145 142 144 144 144 144. §i: J
'". 488 456 452 446 436 435. 437 , 467' , 431 ~ 43.1tOlafgr~~- 2 -,'1.. {'-.o,
~~"
-6.56 . 0.46 OW 0., ~ ~j!\.J%:ChaJiae 0/' -4.87. -0.88 -1.33 -2.24 -0.23 .' a.QOJ
Third 177 190 152 151 157 148 145 147 147 147
Fourth 150 180 193 155 154 160 . 151 147 150 150
Fifth 170 156 187 200 161 160 166 157 152 156
I~'I,'~ ~t::~~'of. 497 526 532 506 472 468lr, 462
i ;:; 2.05• 0
~~~;d~ ~. j[O,8.9"0."-' 5.84 o1.14 -4.89 -6.72 -0.85 -1.2'8 -2.38~
Sixth 177 171 157 188 202 162 161 167 158 153
Seventh 173 180 174 159 191 205 165 164 170 160
Eighth 173 173 180 174 159 191 205 165 164 170
TQ~~ , 523 524 511 521 552 558 531 49.& l>l,a-~ 1&0.. "t8~
j "'.,
:6'.&1. f -1':83%Change 2.55 0.19 -2.48 1.96 5.95 1.09 -4.84 -6.59Ninth 173 180 180 187 181 165 198 213 171 170
Tenth 171 169 176 176 183 177 161 194 208 167
Eleventh 193 170 168 174 174 181 175 160 192 206
Ii208 191 168 166 172 172 179 173 158 190, ,. $
'".
. , "~12. .. 745 710 692 703 710 695 713 740-' 7 .73a
% '~1i;~' . -4.61 -4.70 -2.54 1.59 1.00 -2.11 .2:59 $ 3}t~ ~ B O..~~Co, '''ct1A "
:~~2 2253 2,216 2.187 2176 2.170" 2.156 2143 2,f2.w ~'~
% ctiatJoe -1.66 -1.64 -1.31 -0.50 -0.28 .:0.65 -0.6QI -0.8'9_ -0.88." ", ..d!l.05
10
-"
Live Births vs Kindergarten Enrollment ComparisoBaseline Projection
.... Births -a- K Enroll Actual • K Enroll Proiected
250
225
•.. ............
200
175
150
125
100
BirthsEnroll
...'" A.. ...' .... (",... ..
, / ... ,," '-~ ... , .. .. .... " ... ..,.. , ~ , . .' .. , , ,.,- // .. ~ ..
')./
2000 2001 2002 2003 2004 2005 2006 2007 2008 2009
2005 2006 2007 2008 2009 2010 2011 2012 2013 201
Years
Enrollment Projection BreakdownBaseline Projection
# Students .... K-2
850
750
--- 3-5 ~6-8 -9-12
--- . ..650
550
450
.----- . ..-- ..oil > • ........... ,- - - ....- .. --------------+-:._ .•.. . . .. . ,. -.- . . . .. . . . .. . ...•.....•.....•. _- ..•.. _..•.350
'10 '11 '12 '13 '14 '15 '16 '17 '18 '19
Years
2,700
K-12 Enrollment ProjectionBased on Live Births
# Students
········· . .2 400 1r
·········~··········:··········:··········~········.; ~ : : .· . . . . . . .,
.,. I , • • •
• • • • I , • •
I • • I • I • •
• • • , , I I •
" • I • •
I • • •. .2,100
1,800
1,500'10 '11 '12 '13 '14 '15 '16 '17 '18 '19
. Year
Related Documents