New International Formulation for the Viscosity of H 2 O M. L. Huber, R. A. Perkins, A. Laesecke, D. G. Friend, J. V. Sengers, M. J. Assael, I. N. Metaxa, E. Vogel, R. Mareš, and K. Miyagawa Citation: Journal of Physical and Chemical Reference Data 38, 101 (2009); doi: 10.1063/1.3088050 View online: http://dx.doi.org/10.1063/1.3088050 View Table of Contents: http://scitation.aip.org/content/aip/journal/jpcrd/38/2?ver=pdfcov Published by the AIP Publishing Articles you may be interested in A New Reference Correlation for the Viscosity of Methanol J. Phys. Chem. Ref. Data 35, 1597 (2006); 10.1063/1.2360605 Viscosity, Second p V T -Virial Coefficient, and Diffusion of Pure and Mixed Small Alkanes C H 4 , C 2 H 6 , C 3 H 8 , n - C 4 H 10 , i - C 4 H 10 , n - C 5 H 12 , i - C 5 H 12 , and C ( C H 3 ) 4 Calculated by Means of an Isotropic Temperature-Dependent Potential. I. Pure Alkanes J. Phys. Chem. Ref. Data 35, 1331 (2006); 10.1063/1.2201308 IUPAC-NIST Solubility Data Series. 81. Hydrocarbons with Water and Seawater—Revised and Updated. Part 2. Benzene with Water and Heavy Water J. Phys. Chem. Ref. Data 34, 477 (2005); 10.1063/1.1790006 Experimental Data for the Viscosity and Thermal Conductivity of Water and Steam J. Phys. Chem. Ref. Data 29, 141 (2000); 10.1063/1.556056 Reference Correlation of the Viscosity of Propane J. Phys. Chem. Ref. Data 27, 947 (1998); 10.1063/1.556025 This article is copyrighted as indicated in the article. Reuse of AIP content is subject to the terms at: http://scitation.aip.org/termsconditions. Downloaded to IP: 155.207.48.196 On: Thu, 12 Feb 2015 08:51:57

Welcome message from author
This document is posted to help you gain knowledge. Please leave a comment to let me know what you think about it! Share it to your friends and learn new things together.
Transcript
New International Formulation for the Viscosity of H 2 OM. L. Huber, R. A. Perkins, A. Laesecke, D. G. Friend, J. V. Sengers, M. J. Assael, I. N. Metaxa, E. Vogel, R.Mareš, and K. Miyagawa Citation: Journal of Physical and Chemical Reference Data 38, 101 (2009); doi: 10.1063/1.3088050 View online: http://dx.doi.org/10.1063/1.3088050 View Table of Contents: http://scitation.aip.org/content/aip/journal/jpcrd/38/2?ver=pdfcov Published by the AIP Publishing Articles you may be interested in A New Reference Correlation for the Viscosity of Methanol J. Phys. Chem. Ref. Data 35, 1597 (2006); 10.1063/1.2360605 Viscosity, Second p V T -Virial Coefficient, and Diffusion of Pure and Mixed Small Alkanes C H 4 , C 2 H 6 , C 3H 8 , n - C 4 H 10 , i - C 4 H 10 , n - C 5 H 12 , i - C 5 H 12 , and C ( C H 3 ) 4 Calculated by Means of anIsotropic Temperature-Dependent Potential. I. Pure Alkanes J. Phys. Chem. Ref. Data 35, 1331 (2006); 10.1063/1.2201308 IUPAC-NIST Solubility Data Series. 81. Hydrocarbons with Water and Seawater—Revised and Updated. Part 2.Benzene with Water and Heavy Water J. Phys. Chem. Ref. Data 34, 477 (2005); 10.1063/1.1790006 Experimental Data for the Viscosity and Thermal Conductivity of Water and Steam J. Phys. Chem. Ref. Data 29, 141 (2000); 10.1063/1.556056 Reference Correlation of the Viscosity of Propane J. Phys. Chem. Ref. Data 27, 947 (1998); 10.1063/1.556025
This article is copyrighted as indicated in the article. Reuse of AIP content is subject to the terms at: http://scitation.aip.org/termsconditions. Downloaded to IP:
155.207.48.196 On: Thu, 12 Feb 2015 08:51:57
New International Formulation for the Viscosity of H2O
M. L. Huber,a… R. A. Perkins, A. Laesecke, and D. G. FriendThermophysical Properties Division, NIST, Boulder, Colorado 80305, USA
J. V. SengersInstitute for Physical Science and Technology, University of Maryland, College Park, Maryland 20742, USA and Thermophysical
Properties Division, NIST, Boulder, Colorado 80305, USA
M. J. Assael and I. N. MetaxaFaculty of Chemical Engineering, Aristotle University, GR-54006 Thessaloniki, Greece
E. VogelInstitut für Chemie, Universität Rostock, D-18059 Rostock, Germany
R. MarešDepartment of Thermodynamics, University of West Bohemia, CZ-30614 Plzen, Czech Republic
K. Miyagawa4-12-11-628 Nishiogu, Arakawa Ku, Tokyo 116-0011, Japan
�Received 28 January 2009; accepted 4 February 2009; published online 21 April 2009; publisher error corrected 24 April 2009�
The International Association for the Properties of Water and Steam �IAPWS� encour-aged an extensive research effort to update the IAPS Formulation 1985 for the Viscosityof Ordinary Water Substance, leading to the adoption of a Release on the IAPWS For-mulation 2008 for the Viscosity of Ordinary Water Substance. This manuscript describesthe development and evaluation of the 2008 formulation, which provides a correlatingequation for the viscosity of water for fluid states up to 1173 K and 1000 MPa withuncertainties from less than 1% to 7% depending on the state point. © 2009 by the U.S.Secretary of Commerce on behalf of the United States. All rights reserved.�DOI: 10.1063/1.3088050�Key words: IAPWS; kinematic viscosity; steam; viscosity; water.
CONTENTS
1. Introduction. . . . . . . . . . . . . . . . . . . . . . . . . . . . . . 102
2. Experimental Data. . . . . . . . . . . . . . . . . . . . . . . . . 104
3. Development of the Correlation. . . . . . . . . . . . . . 1043.1. Viscosity in the Limit of Zero Density. . . . 1043.2. Residual Contribution. . . . . . . . . . . . . . . . . . 1093.3. Critical Region. . . . . . . . . . . . . . . . . . . . . . . 111
3.3.1. Theory. . . . . . . . . . . . . . . . . . . . . . . . . 1113.3.2. Application to H2O. . . . . . . . . . . . . . 112
3.4. Simplified Correlation. . . . . . . . . . . . . . . . . . 1153.5. Computer-Program Verification. . . . . . . . . . 1153.6. Recommendation for Industrial
Applications. . . . . . . . . . . . . . . . . . . . . . . . . . 1153.7. Liquid H2O at 0.1 MPa. . . . . . . . . . . . . . . . 116
4. Evaluation. . . . . . . . . . . . . . . . . . . . . . . . . . . . . . . 1174.1. Comparisons with Experimental Data and
Previous IAPWS Formulation. . . . . . . . . . . 1174.2. Range and Uncertainty Estimates for the
Correlation. . . . . . . . . . . . . . . . . . . . . . . . . . . 1195. Discussion. . . . . . . . . . . . . . . . . . . . . . . . . . . . . . . 1236. Acknowledgments. . . . . . . . . . . . . . . . . . . . . . . . . 1237. References. . . . . . . . . . . . . . . . . . . . . . . . . . . . . . . 123
List of Tables
1. Summary of experimental data for theviscosity of water. . . . . . . . . . . . . . . . . . . . . . . . . 105
2. Coefficients Hi in Eq. �11� for �̄0�T̄�. . . . . . . . . . 1093. Coefficients Hij in Eq. �12� for �̄1�T̄ , �̄�.. . . . . . . 111
a�Electronic mail: [email protected].© 2009 by the U.S. Secretary of Commerce on behalf of the United States.All rights reserved.
0047-2689/2009/38„2…/101/25/$45.00 J. Phys. Chem. Ref. Data, Vol. 38, No. 2, 2009101 This article is copyrighted as indicated in the article. Reuse of AIP content is subject to the terms at: http://scitation.aip.org/termsconditions. Downloaded to IP:
155.207.48.196 On: Thu, 12 Feb 2015 08:51:57
4. Reanalyzed viscosity data in the critical regionbased on the capillary measurements ofkinematic viscosity � /� by Rivkin et al.46. . . . . 114
5. Critical-region constants. . . . . . . . . . . . . . . . . . . . 1156. Sample points for computer-program
verification of the correlating equation, Eq.�2�, with �̄2=1. . . . . . . . . . . . . . . . . . . . . . . . . . . 116
7. Sample points for computer-programverification of the correlating equation, Eq.�2�, in the region near the critical point. . . . . . . . 116
8. Coefficients ai and bi in Eq. �37� for theviscosity of liquid water at 0.1 MPa. . . . . . . . . . 116
9. Summary of comparisons of Eq. �2� withexperimental data and of the previous IAPWSformulation for the viscosity with experimentaldata. . . . . . . . . . . . . . . . . . . . . . . . . . . . . . . . . . . . 118
List of Figures
1. Distribution of experimental viscosity data inthe temperature-pressure plane.. . . . . . . . . . . . . . 107
2. Distribution of density for nominaltemperature isotherms.. . . . . . . . . . . . . . . . . . . . . 107
3. Distribution of density for nominaltemperature isotherms, low-density region.. . . . . 107
4. Nominal isotherm at 523.6 K.. . . . . . . . . . . . . . . 1085. Values of �0 for the 103 nominal isotherms as
a function of temperature.. . . . . . . . . . . . . . . . . . . 1096. Percentage deviations of the zero-density
viscosity for each isotherm from predictedvalues obtained with Eq. �11�.. . . . . . . . . . . . . . . 109
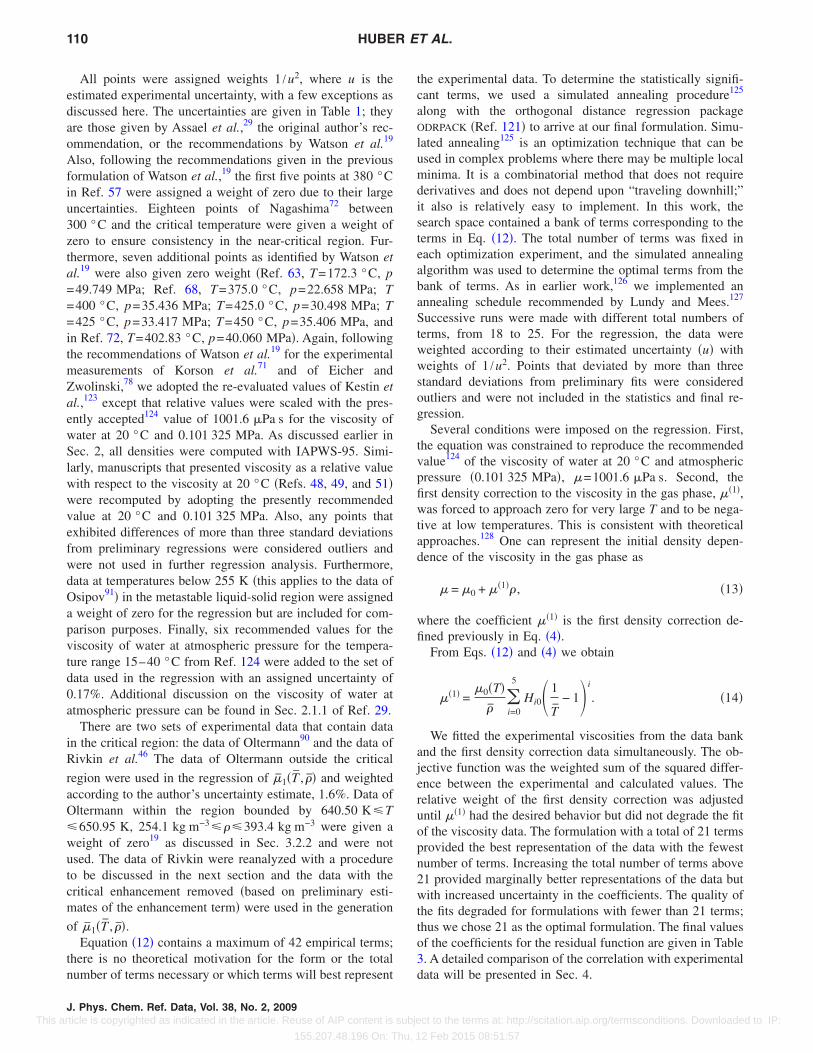
7. The viscosity data obtained by Rivkin et al.46
as a function of density with the densitycalculated from the IAPWS-95 equation ofstate and the temperatures converted toITS-90.. . . . . . . . . . . . . . . . . . . . . . . . . . . . . . . . . . 113
8. The viscosity data obtained by Rivkin et al.46
as a function of density with the densitycalculated from the IAPWS-95 equation andthe temperatures converted to ITS-90 andshifted by 0.051 K.. . . . . . . . . . . . . . . . . . . . . . . . 114
9. Logarithm of the multiplicative criticalviscosity enhancement � /�b plotted as afunction of the correlation length �.. . . . . . . . . . . 115
10. Temperature and density regions where theviscosity enhancement �̄2 exceeds 1.000 051and 1.02.. . . . . . . . . . . . . . . . . . . . . . . . . . . . . . . . 115
11. Deviations ���Eq. �36�−��Eq. �2�� /��Eq. �2� alongselected isotherms.. . . . . . . . . . . . . . . . . . . . . . . . 116
12. Percentage deviations of the experimental datafrom the previous IAPWS formulation for theviscosity27 for low-density water vapor as afunction of density.. . . . . . . . . . . . . . . . . . . . . . . . 119
13. Percentage deviations of the experimental datafrom the present correlation for low-densitywater vapor as a function of density.. . . . . . . . . . 119
14. Percentage deviations of the experimental data
from the previous IAPWS formulation for theviscosity27 for low-density water vapor as afunction of temperature.. . . . . . . . . . . . . . . . . . . . 120
15. Percentage deviations of the experimental datafrom the present correlation for low-densitywater vapor as a function of temperature.. . . . . . 120
16. Temperature dependence of the initial-densityviscosity coefficient ��1�, Eq. �4�.. . . . . . . . . . . . 120
17. Comparison of extrapolation behavior at hightemperatures of the proposed equation, of theprevious IAPWS formulation for theviscosity,27 and of the correlations ofAlexandrov et al.,159 and Quiñones-Cisnerosand Deiters160 with the recommended data ofFokin and Kalashnikov161 and with newcalculations of Hellmann et al.162. . . . . . . . . . . . 120
18. Percentage deviations of the experimental datafrom the previous IAPWS formulation for theviscosity27 for elevated pressures as a functionof pressure.. . . . . . . . . . . . . . . . . . . . . . . . . . . . . . 121
19. Percentage deviations of the experimental datafrom the present correlation for elevatedpressures as a function of pressure.. . . . . . . . . . . 121
20. Percentage deviations of the experimental datafrom the previous IAPWS formulation for theviscosity27 for liquid water at atmosphericpressure as a function of density.. . . . . . . . . . . . . 121
21. Percentage deviations of the experimental datafrom the present correlation for liquid water atatmospheric pressure as a function of density.. . 121
22. Percentage deviations of the experimental datafrom the previous IAPWS formulation for theviscosity27 for steam, as a function of density... 122
23. Percentage deviations of the experimental datafrom the present correlation for steam as afunction of density.. . . . . . . . . . . . . . . . . . . . . . . . 122
24. Estimated uncertainties for Eq. �2�.. . . . . . . . . . . 122
1. Introduction
The viscosity of water over broad ranges of pressure andtemperature is often needed for scientific and industrial ap-plications. Water is often used as a calibration or referencefluid for various instruments to measure the viscosity ofother substances.1 Accurate consensus values for the viscos-ity of water are desirable for a variety of research and prac-tical efforts including reservoir engineering, electric powergeneration, and industrial process design to optimally sizeequipment. Additionally, there are other applications includ-ing quality control and for dimensionless parameters in heattransfer. The formulation described in this paper provides aninternationally agreed-upon equation to describe the viscos-ity of water up to 1173 K and 1 GPa with state-dependentuncertainties commensurate with the experimental and theo-retical information currently available.
Starting with the first International Conference on theProperties of Steam in London in 1929, there have been ef-
102 HUBER ET AL.
J. Phys. Chem. Ref. Data, Vol. 38, No. 2, 2009 This article is copyrighted as indicated in the article. Reuse of AIP content is subject to the terms at: http://scitation.aip.org/termsconditions. Downloaded to IP:
155.207.48.196 On: Thu, 12 Feb 2015 08:51:57

forts to arrive at recommendations for calculating the ther-mophysical properties of water and steam �“water sub-stance”�. Since 1972, research and standardization of theproperties of water substance have been coordinated by theInternational Association for the Properties of Steam �IAPS�,which in 1989 became the International Association for theProperties of Water and Steam �IAPWS�.2 While the originalemphasis was on the thermodynamic properties of water andsteam, the first set of skeleton tables for the transport prop-erties of water substance, together with some recommendedinterpolation equations, was issued in 1964 upon the instruc-tion of the sixth International Conference on the Propertiesof Steam.3,4 However, the eighth International Conference onthe Properties of Steam, held in Giens, France, in 1974, de-cided that the 1964 skeleton tables for the transport proper-ties were not sufficiently accurate, a decision that led IAPSto issue a Release on the Dynamic Viscosity of Water Sub-stance in 1975 �Refs. 5–9� and a Release on the ThermalConductivity of Water Substance in 1977.9–12 The presentpaper is concerned with updated recommendations for thecalculation of the viscosity of water and steam.
The 1975 release on the dynamic viscosity contained atable of critically evaluated experimental data and a recom-mended interpolating equation for the viscosity as a functionof temperature and density, originally developed by Aleksan-drov et al.13 for temperatures from 0 to 800 °C and densitiesfrom 0 to 1050 kg m−3. To obtain the viscosity as a functionof pressure, it was recommended that the pressures be con-verted to densities with the aid of the 1968 InternationalFormulation Committee �IFC� Formulation for Scientific andGeneral Use.14,15 However, the 1968 IFC Formulation wasseldom used in actual practice. Another problem was that the1968 IFC Formulation was a composite of separate equationsfor a number of subregions. Hence, the ninth InternationalConference held in Munich in 1979 empowered IAPS todevelop a new formulation for the thermodynamic propertiesto replace the 1968 IFC Formulation for General and Scien-tific Use. This led to the adoption of a Provisional IAPSFormulation in 1982, which was subsequently recast in di-mensionless form as the IAPS 1984 Formulation for theThermodynamic Properties of Ordinary Water Substance16
based on an equation of state developed by Haar et al.17 Theinterpolating correlation equation for the viscosity adopted in1975 was based on the International Practical TemperatureScale of 1948 �IPTS-48�, while the new IAPS Formulationwas based on IPTS-68. It was verified that the earlier viscos-ity equation could also be used in conjunction with the newIAPS Formulation for the thermodynamic properties and theRelease on the Dynamic Viscosity was amendedaccordingly.18 Nevertheless, it became desirable to recon-sider the correlating equation for the viscosity for a numberof reasons. First, the 1975 equation for viscosity was re-stricted to the range of validity of the IFC 1968 Formulation,namely, up to 800 °C in temperature and up to 100 MPa inpressure. Since the IAPS Formulation 1984 for the thermo-dynamic properties was valid over a wider range of tempera-tures and densities, it became possible to check to what ex-
tent the equation for the viscosity could be extrapolatedoutside the range for which it was originally developed. Sec-ond, using improved methods for statistical analysis, Watsonet al. noticed that the number of terms in the viscosity equa-tion could be reduced significantly while at the same timeobtaining improved agreement with the experimental data.19
Finally, it had become possible to estimate the asymptoticdivergent behavior of the viscosity near the critical point,19,20
a phenomenon that had not been incorporated in the earlierviscosity equation. Accordingly, IAPS subsequently issuedan IAPS Formulation 1985 for the Viscosity of Ordinary Wa-ter Substance incorporating the features mentioned above.21
While the IAPS Formulation 1984, in contrast to the 1968IFC Formulation, provided a single fundamental equation inthe form of a Helmholtz function as a function of density andtemperature for the thermodynamic properties of water sub-stance, it had some less satisfactory features requiring furtherresearch.22 Moreover, the International Practical TemperatureScale of 1968 was replaced by the International TemperatureScale of 1990 �ITS-90�,23 making it desirable to have a ther-modynamic property formulation consistent with the newtemperature standard. This led IAPWS to issue the IAPWSFormulation 1995 for the Thermodynamic Properties of Or-dinary Water Substance for General and Scientific Use�IAPWS-95�.24–26 For the viscosity, one continued to use theIAPS Formulation 1985, issued by IAPS in September 1984,except for some minor revisions to make the viscosity for-mulation consistent with the IAPWS-95 formulation for thethermodynamic properties and with the international tem-perature scale of 1990.26,27 Hence, this most recent historicalformulation �Revised Release on the IAPS Formulation 1985for the Viscosity of Ordinary Water Substance27� will be thebasis for some of the comparisons shown below.
A problem was that the IAPWS formulations for the trans-port properties26,27 do not cover the higher temperatures andpressures included in the IAPWS-95 formulation for the ther-modynamic properties. Hence, IAPWS encouraged an exten-sive research effort to develop updated releases for the trans-port properties, leading to the adoption of a Release on theIAPWS Formulation 2008 for the Viscosity of Ordinary Wa-ter Substance.26,28 The goal of the present paper is to providethe scientific and technical documentation for the IAPWSFormulation 2008 on the viscosity. Work on a new release onthe thermal conductivity of water substance is in progress.
We shall proceed as follows. The correlating equation rec-ommended by the IAPS Formulation 1985 for the Viscosityof Ordinary Water Substance was originally developed byWatson et al. based on experimental data for the viscosity ofH2O available prior to 1980.19 An update on the availableexperimental data for water and steam is presented in Sec. 2.An analysis of the temperature dependence of the viscosityof water vapor and of steam in the limit of zero density ispresented in Sec. 3.1. Section 3.2 deals with the temperatureand density dependence of the viscosity at elevated pres-sures. The theoretical and experimental information for thesingular behavior of the viscosity in the region near the criti-cal point is reviewed in Sec. 3.3. A simplified version for use
VISCOSITY OF H2O 103
J. Phys. Chem. Ref. Data, Vol. 38, No. 2, 2009 This article is copyrighted as indicated in the article. Reuse of AIP content is subject to the terms at: http://scitation.aip.org/termsconditions. Downloaded to IP:
155.207.48.196 On: Thu, 12 Feb 2015 08:51:57

outside the critical region is presented in Sec. 3.4. Informa-tion for computer-program verification is provided in Sec.3.5, and recommendations for industrial applications aregiven in Sec. 3.6. The special case of liquid water at atmo-spheric pressure is treated in Sec. 3.7. Section 4 presentscomparisons of the new viscosity formulation with experi-mental data, as well as a comparative evaluation of the pre-vious IAPWS formulation for viscosity,27 and discusses therange of validity and uncertainties of the new correlatingequation.
2. Experimental Data
As part of a joint project between IAPWS and the Inter-national Association for Transport Properties �formerly theSubcommittee on Transport Properties of the InternationalUnion of Pure and Applied Chemistry �IUPAC� CommissionI.2 on Thermodynamics�, experimental data on the viscosityand thermal conductivity of water and steam were collected,converted to the ITS-90 temperature scale and a common setof units, and evaluated.29 Unless the temperature scale wasexplicitly stated in a publication or additional informationwas available, the year of publication was used to determinethe appropriate temperature scale for the conversion. Thiswork resulted in a database for the viscosity of water thatcontained 4090 points covering the range of temperaturesfrom 238 to 1346 K with pressures to 346 MPa, described indetail in Ref. 29. This database contains data collectedthrough bibliographic efforts under the auspices of IAPWSand documented in unpublished reports to 1988, as well aslater data to the year 2000. In addition, it includes someearlier data that were not considered in previous compila-tions. In the work reported here, we used the database de-scribed in Ref. 29 as a starting point.
To the database, we added several data sets30–36 publishedafter the compilation of Ref. 29. In addition, we includedselected experimental data for viscosity37–43 at higher pres-sures than were considered in the previous formulation forviscosity, since the IAPWS-95 equation of state is valid topressures of 1 GPa. There are two additional very recentpublications44,45 that present data at high pressures, whichare not included in our compilation. Table 1 gives a compi-lation of all experimental data sources30–113 used in the de-velopment of the viscosity formulation, including an esti-mate of the uncertainty, the temperature and pressure rangesof the data, the experimental method, and the number ofindividual data points. It is difficult to assess the uncertaintyof some of these data; often the value claimed by the originalauthors is quite optimistic. The viscosity data of Rivkin etal.46 for water in the critical region have been re-evaluated.The computer database contains the original46 as well as re-evaluated data, although only the re-evaluated data havebeen used in the development of the correlation. This will bediscussed further in Sec. 3.3. The resulting data set used forregression comprises 5006 individual points covering tem-peratures from 238 to 1346 K and pressures up to 1 GPa,providing coverage over a wider range of temperatures and
pressures than the formulation developed in 1980,19 asshown in Fig. 1. All densities in the database were calculatedfrom the experimental pressures and temperatures withIAPWS-95.
3. Development of the Correlation
In order to provide consistency with the conventionsadopted by IAPWS in their releases on the transport proper-ties of water, we use the following dimensionless variablesfor temperature T, mass density �, pressure p, and viscosity�:
T̄ =T
T*, �̄ =
�
�*, p̄ =
p
p*, �̄ =
�
�*, �1�
where the reference constants are T*=647.096 K, �*
=322.0 kg m−3, p*=22.064 MPa, and �*=1�10−6 Pa s.The reference values for temperature, pressure, and densityare in agreement with the presently accepted critical param-eters recommended by IAPWS.114 All temperatures are ex-pressed in terms of the ITS-90 temperature scale.
The formulation for the viscosity of water has the samegeneral form as the previous formulations,19,21,27 namely,
�̄ = �̄0�T̄� � �̄1�T̄, �̄� � �̄2�T̄, �̄� . �2�
The first factor �̄0 of the product represents the viscosity inthe zero-density limit and is a function of temperature only.The second factor �̄1 represents the contribution to viscositydue to increasing density, while the third factor �̄2 representsan enhancement of the viscosity near the critical point. Thedetermination of each of these contributions will be consid-ered in the following sections.
3.1. Viscosity in the Limit of Zero Density
Because measurements at zero pressure, i.e., the dilute-gaslimit, are not feasible, the data considered for the estimationof the viscosity of water vapor and steam in the limit of zerodensity include all data in the experimental database at allavailable temperatures up to a maximum density of50 kg m−3. This maximizes the number of data to be exam-ined while staying within the low-density region. Since thepublication of the manuscript on the database for the trans-port properties of water,29 there has been one significant newset of measurements in the dilute-gas region36 that we haveincluded in our analysis. The resulting data set includes ex-perimental viscosity measurements from 14 individualsources �indicated by italics in Table1�,36,55,56,58,61,62,64,68,69,76,77,84,87,90 thus increasing signifi-cantly the number of data considered for the generation of anequation for the viscosity in the limit of zero density com-pared to the development of the previous IAPWS formula-tion for the viscosity.27 The ranges of all the data used for�0�T� are as follows. Temperature, 279.88–1346.24 K; pres-sure, 0.0008–15.779 MPa; and density, 0.006–50 kg m−3.
In order to use the data to derive a new equation for �0�T�,it was necessary to group them according to temperature. To
104 HUBER ET AL.
J. Phys. Chem. Ref. Data, Vol. 38, No. 2, 2009 This article is copyrighted as indicated in the article. Reuse of AIP content is subject to the terms at: http://scitation.aip.org/termsconditions. Downloaded to IP:
155.207.48.196 On: Thu, 12 Feb 2015 08:51:57
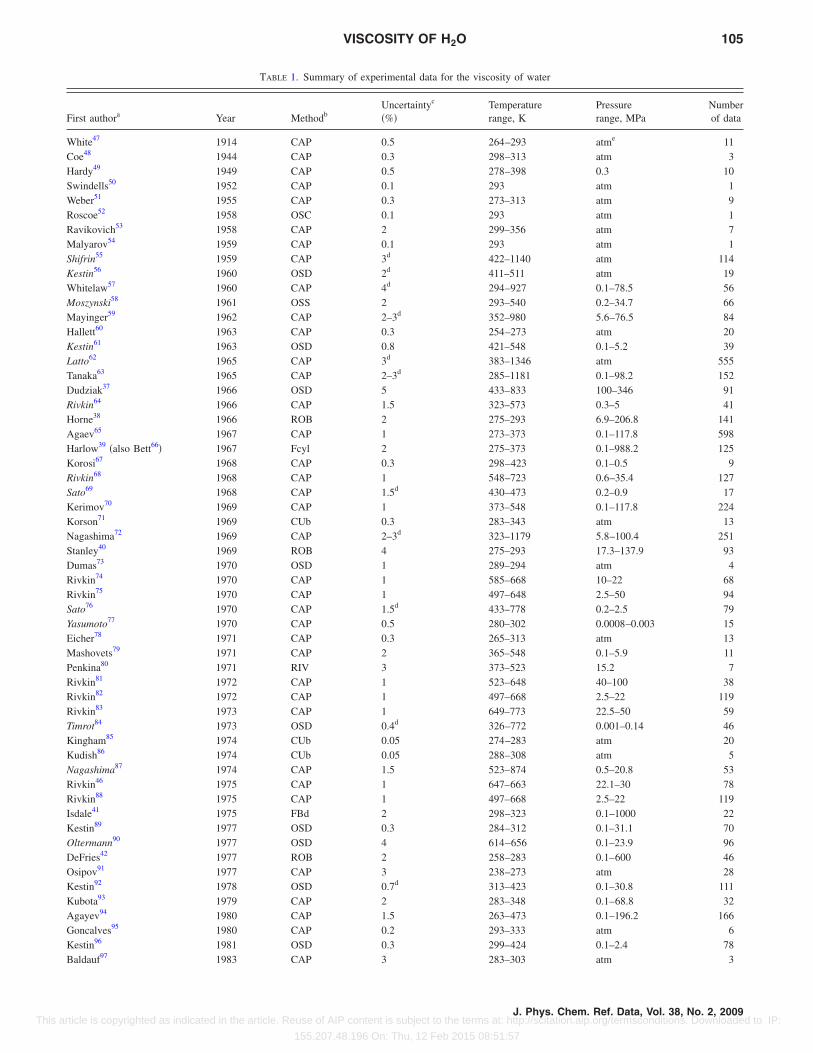
TABLE 1. Summary of experimental data for the viscosity of water
First authora Year MethodbUncertaintyc
�%�Temperaturerange, K
Pressurerange, MPa
Numberof data
White47 1914 CAP 0.5 264–293 atme 11Coe48 1944 CAP 0.3 298–313 atm 3Hardy49 1949 CAP 0.5 278–398 0.3 10Swindells50 1952 CAP 0.1 293 atm 1Weber51 1955 CAP 0.3 273–313 atm 9Roscoe52 1958 OSC 0.1 293 atm 1Ravikovich53 1958 CAP 2 299–356 atm 7Malyarov54 1959 CAP 0.1 293 atm 1Shifrin55 1959 CAP 3d 422–1140 atm 114Kestin56 1960 OSD 2d 411–511 atm 19Whitelaw57 1960 CAP 4d 294–927 0.1–78.5 56Moszynski58 1961 OSS 2 293–540 0.2–34.7 66Mayinger59 1962 CAP 2–3d 352–980 5.6–76.5 84Hallett60 1963 CAP 0.3 254–273 atm 20Kestin61 1963 OSD 0.8 421–548 0.1–5.2 39Latto62 1965 CAP 3d 383–1346 atm 555Tanaka63 1965 CAP 2–3d 285–1181 0.1–98.2 152Dudziak37 1966 OSD 5 433–833 100–346 91Rivkin64 1966 CAP 1.5 323–573 0.3–5 41Horne38 1966 ROB 2 275–293 6.9–206.8 141Agaev65 1967 CAP 1 273–373 0.1–117.8 598Harlow39 �also Bett66� 1967 Fcyl 2 275–373 0.1–988.2 125Korosi67 1968 CAP 0.3 298–423 0.1–0.5 9Rivkin68 1968 CAP 1 548–723 0.6–35.4 127Sato69 1968 CAP 1.5d 430–473 0.2–0.9 17Kerimov70 1969 CAP 1 373–548 0.1–117.8 224Korson71 1969 CUb 0.3 283–343 atm 13Nagashima72 1969 CAP 2–3d 323–1179 5.8–100.4 251Stanley40 1969 ROB 4 275–293 17.3–137.9 93Dumas73 1970 OSD 1 289–294 atm 4Rivkin74 1970 CAP 1 585–668 10–22 68Rivkin75 1970 CAP 1 497–648 2.5–50 94Sato76 1970 CAP 1.5d 433–778 0.2–2.5 79Yasumoto77 1970 CAP 0.5 280–302 0.0008–0.003 15Eicher78 1971 CAP 0.3 265–313 atm 13Mashovets79 1971 CAP 2 365–548 0.1–5.9 11Penkina80 1971 RIV 3 373–523 15.2 7Rivkin81 1972 CAP 1 523–648 40–100 38Rivkin82 1972 CAP 1 497–668 2.5–22 119Rivkin83 1973 CAP 1 649–773 22.5–50 59Timrot84 1973 OSD 0.4d 326–772 0.001–0.14 46Kingham85 1974 CUb 0.05 274–283 atm 20Kudish86 1974 CUb 0.05 288–308 atm 5Nagashima87 1974 CAP 1.5 523–874 0.5–20.8 53Rivkin46 1975 CAP 1 647–663 22.1–30 78Rivkin88 1975 CAP 1 497–668 2.5–22 119Isdale41 1975 FBd 2 298–323 0.1–1000 22Kestin89 1977 OSD 0.3 284–312 0.1–31.1 70Oltermann90 1977 OSD 4 614–656 0.1–23.9 96DeFries42 1977 ROB 2 258–283 0.1–600 46Osipov91 1977 CAP 3 238–273 atm 28Kestin92 1978 OSD 0.7d 313–423 0.1–30.8 111Kubota93 1979 CAP 2 283–348 0.1–68.8 32Agayev94 1980 CAP 1.5 263–473 0.1–196.2 166Goncalves95 1980 CAP 0.2 293–333 atm 6Kestin96 1981 OSD 0.3 299–424 0.1–2.4 78Baldauf97 1983 CAP 3 283–303 atm 3
VISCOSITY OF H2O 105
J. Phys. Chem. Ref. Data, Vol. 38, No. 2, 2009 This article is copyrighted as indicated in the article. Reuse of AIP content is subject to the terms at: http://scitation.aip.org/termsconditions. Downloaded to IP:
155.207.48.196 On: Thu, 12 Feb 2015 08:51:57

obtain isothermal data, 103 approximate isotherms having atemperature range of 5 K were organized. This range is flex-ible �the maximum used was 6.91 K�, so that the number ofgrouped data is as large as possible when there are no otherdata for a particular temperature region. The data formingthese nominal isotherms �Tnom� can then be extrapolated tothe dilute-gas limit. Furthermore, the data were arranged intonearly isothermal groups in such a way that for each groupthere was not more than one measured isotherm of the rawdata included in the group. It should be noted that in order toconsider a “measured isotherm,” we required at least threeviscosity values. Additionally, the data must include thelower-density region; this means that all nominal isothermsinclude data with at least one point having a density of lessthan 12 kg m−3.
The experimental viscosity values must first be correctedto the nominal temperature of the isotherm. Note that thenominal temperature is the mean temperature of all pointswithin the grouping. The correction involved two stages. Thefirst stage incorporated a density correction. The density wasrecalculated at Tnom, pexp with the IAPWS-95 thermody-namic formulation24,115 �Tnom=nominal temperature of theapproximate isotherm, pexp=experimental pressure, as in the
data bank�. It should be emphasized that the density valuesof the experimental points are those calculated at Texp, pexp,in accordance with the IAPWS-95 formulation, since densityis rarely measured in a viscosity experiment. The secondstage consisted of applying a temperature correction for theviscosity, which was approximated by applying the currentlyavailable information for the temperature dependence of theviscosity.116 Thus, we first calculated �calc�Texp , pexp� usingthe previous IAPWS formulation for the viscosity.27 We thenalso calculated with the same formulation �calc�Tnom, pexp�.The value of the viscosity �corr�Tnom, pexp� was then adjustedinto a nominal isotherm by use of the following formula:
�corr�Tnom,pexp� = �exp�Texp,pexp� + �calc�Tnom,pexp�
− �calc�Texp,pexp� . �3�
The temperature correction was always less than 1% of theexperimental viscosity for all data points considered in thisanalysis.
In some cases, the nominal isotherms consisted of pointsonly at a single �constant� pressure. This was the case forisotherms containing data from the following sources:Latto62 and Shifrin.55 After the correction, the density for all
TABLE 1. Summary of experimental data for the viscosity of water—Continued
First authora Year MethodbUncertaintyc
�%�Temperaturerange, K
Pressurerange, MPa
Numberof data
Collings98 1983 CAP 0.2 274–343 atm 12James99 1984 CAP 1 273–333 atm 8Naake100 1984 OSD 1 291–479 10–100 18Kestin101 1985 OSD 0.5 298–492 0.003–30 74Kozlov102 1985 NMR n.p. 283–338 atm 6Tanaka103 1987 FBd 2 283–348 0.1–117.8 47Berstad104 1988 OSC 0.05 293–299 atm 18Melzer105 1989 CAP 1 283–303 atm 3Ramkumar106 1989 CUb 0.1 303–343 atm 5Mazurkiewicz107 1990 ROT 1 298 atm 1Lee108 1992 FBd 1 303–323 atm 3Rosenberger109 1992 CAP 1 297 atm 1Assael110 1994 VbW 0.5 293–328 0.1–32.0 19Olivé111 1994 CUb 0.5 303 atm 1Wode112 1994 CUb 0.5 293–313 atm 5Lee113 1995 FBd 1.5 303–323 atm 3Först43 2000 ROB 2 260–313 0.1–700 95Abdulagatov30 2003 CAP 1.5 298–574 10–30 27Abdulagatov33 2004 CAP 1.5 294–598 1–50 25Harris31,32 2004 FBd 1 256–298 0.1–389 109Abdulagatov34 2005 CAP 1.5 297–574 5–40 28Abdulagatov35 2005 CAP 1.5 295–598 1–50 25Teske36 2005 OSD 0.2–0.3 297–440 0.003–0.05 109Deguchi45 2006f DLS n.p. 301–656 0.1–35 46Abramson44 2007f ROB n.p. 294–573 220–5650 69
aPrimary data sources used in the analysis of the zero-density function are indicated by italic font.bCAP: capillary; CUb: Cannon-Ubbelohde; DLS: dynamic light scattering; FBd: falling body; Fcyl: falling cylinder; NMR: NMR method; OSC: oscillatingcylinder; OSD: oscillating disk; OSS: oscillating sphere; OSV: oscillating vessel; RIV: radioisotope; ROB: rolling ball; ROT: rotary; VbW: vibrating wire.
cn.p.: uncertainty not provided in the source reference.dUncertainty as recommended by Watson et al.19
eDenotes atmospheric pressure, approximately 0.1 MPa.fNot included in the development of the correlation.
106 HUBER ET AL.
J. Phys. Chem. Ref. Data, Vol. 38, No. 2, 2009 This article is copyrighted as indicated in the article. Reuse of AIP content is subject to the terms at: http://scitation.aip.org/termsconditions. Downloaded to IP:
155.207.48.196 On: Thu, 12 Feb 2015 08:51:57
points was identical, making it impossible to extrapolate tothe dilute-gas limit. Thus, these nominal isotherms weretreated in a different way. Data with pressures up to 0.1 MPa�as is the case for the two sources involved� were used toobtain the �0�T� as follows. The corrected viscosity valueswere extrapolated to the zero-density limit by subtracting theinitial density dependence ��1��=B��kBT /���. The func-tional form of B� was taken from Eq. �11� in Ref. 117. Thevalue of � /kB was taken as 471.53 K. In all cases, the cor-rection for the initial density dependence was less than 0.2%of the ��T ,�� value. The initial uncertainty estimate for thevalues of �0�T� established this way is the sum of the quoteduncertainty of the experimental data plus the value of thecorrection. This is essentially equivalent to simply using theexperimental uncertainty of the data. In addition, the originalexperimental data of Yasumoto77 were at sufficiently lowdensities to allow them to be approximated as zero-densitypoints, and the only correction necessary was a temperaturecorrection to the nominal isotherm.
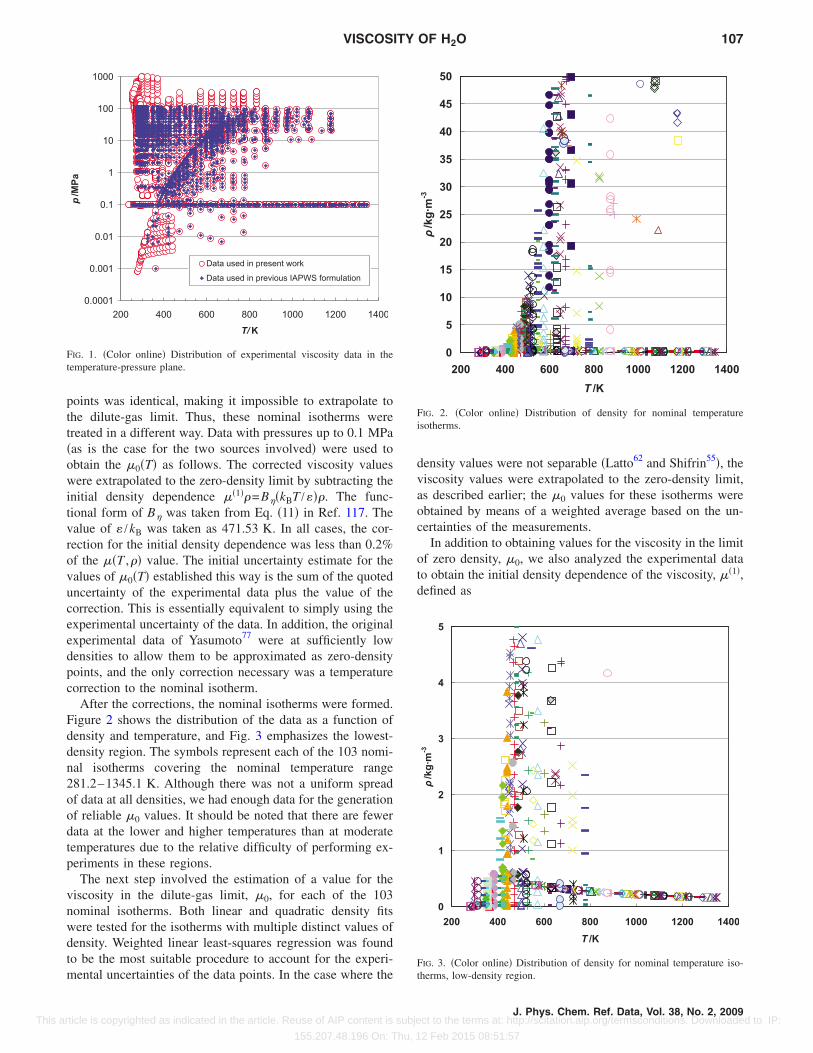
After the corrections, the nominal isotherms were formed.Figure 2 shows the distribution of the data as a function ofdensity and temperature, and Fig. 3 emphasizes the lowest-density region. The symbols represent each of the 103 nomi-nal isotherms covering the nominal temperature range281.2–1345.1 K. Although there was not a uniform spreadof data at all densities, we had enough data for the generationof reliable �0 values. It should be noted that there are fewerdata at the lower and higher temperatures than at moderatetemperatures due to the relative difficulty of performing ex-periments in these regions.
The next step involved the estimation of a value for theviscosity in the dilute-gas limit, �0, for each of the 103nominal isotherms. Both linear and quadratic density fitswere tested for the isotherms with multiple distinct values ofdensity. Weighted linear least-squares regression was foundto be the most suitable procedure to account for the experi-mental uncertainties of the data points. In the case where the
density values were not separable �Latto62 and Shifrin55�, theviscosity values were extrapolated to the zero-density limit,as described earlier; the �0 values for these isotherms wereobtained by means of a weighted average based on the un-certainties of the measurements.
In addition to obtaining values for the viscosity in the limitof zero density, �0, we also analyzed the experimental datato obtain the initial density dependence of the viscosity, ��1�,defined as
0.0001
0.001
0.01
0.1
1
10
100
1000
200 400 600 800 1000 1200 1400
T/K
p/MPa
Data used in present work
Data used in previous IAPWS formulation
FIG. 1. �Color online� Distribution of experimental viscosity data in thetemperature-pressure plane.
0
5
10
15
20
25
30
35
40
45
50
200 400 600 800 1000 1200 1400T /K
ρ/kg·m-3
FIG. 2. �Color online� Distribution of density for nominal temperatureisotherms.
0
1
2
3
4
5
200 400 600 800 1000 1200 1400T /K
ρ/kg·m-3
FIG. 3. �Color online� Distribution of density for nominal temperature iso-therms, low-density region.
VISCOSITY OF H2O 107
J. Phys. Chem. Ref. Data, Vol. 38, No. 2, 2009 This article is copyrighted as indicated in the article. Reuse of AIP content is subject to the terms at: http://scitation.aip.org/termsconditions. Downloaded to IP:
155.207.48.196 On: Thu, 12 Feb 2015 08:51:57
��1� = lim�→0� ��
���
T. �4�
This function changes sign with temperature; at some tem-peratures the viscosity decreases with increasing density. Forthe data reported by Latto62 and Shiffrin,55 values for ��1�
were obtained with the aforementioned calculation steps. Inthe case where the data were structured in isotherms withmultiple distinct density values, a different procedure wasadopted. The corrected, nominal temperatures Tnom and vis-cosities �nom along with the experimental uncertainties wereused. For each isotherm, a statistical-analysis code118 wasexecuted to perform a weighted linear least-squares analysis,and the generated slope was obtained as the ��1� value, alongwith its standard deviation. Finally, when an isotherm con-tained more than one individual set, the Key ComparisonReference Value119 �KCRV� procedure was adopted to getthe weighted mean of the ��1� value along with its standarddeviation. The data for ��1� were used in the development ofthe dense-fluid contribution to viscosity and will be consid-ered later in Secs. 3.2 and 4.1.
A set of equations that expresses the relations that existbetween the measured �“observed”� values and the unknownparameters is a set of observational equations. For thestraight-line case, the form is
yi = � + �xi + �i, �5�
where yi is the dependent variable, xi is the independent vari-able, � and � are the unknown parameters, and �i is the error�because the measurements are subject to experimental er-ror�. Hence, the assumption is made that the errors �i belongto statistical populations of zero mean and with standard de-viations i. If we assume that we have succeeded in deriving
estimates �̄ and �̄ for the unknown parameters � and �, thenthe equations are written in the form
yi = �̄ + �̄xi. �6�
The values defined by these equations may be considered asthe “theoretical estimates,” corresponding to the observedvalues yi. We can consider the weighted sum of squares ofthe residuals,
S = �i=1
n
widi2, �7�
where each weight wi is defined as the reciprocal of thecorresponding variance: wi=1 /i
2 and the residuals di are thedifferences between the observed and the estimated values:
di = yi − yi = yi − ��̄ + �̄xi� . �8�
The principle by which we obtain the estimates of �̄ and �̄ isthat of minimizing the sum of squares of the residuals.120
The weighted linear least-squares regression has been usedin order to account for the different experimental uncertain-ties of the data. Furthermore, statistical tests show that ourdata are better described by a linear rather than a quadratic
fit. This method provides as many �0 values for each iso-therm as the number of different primary data sources used.
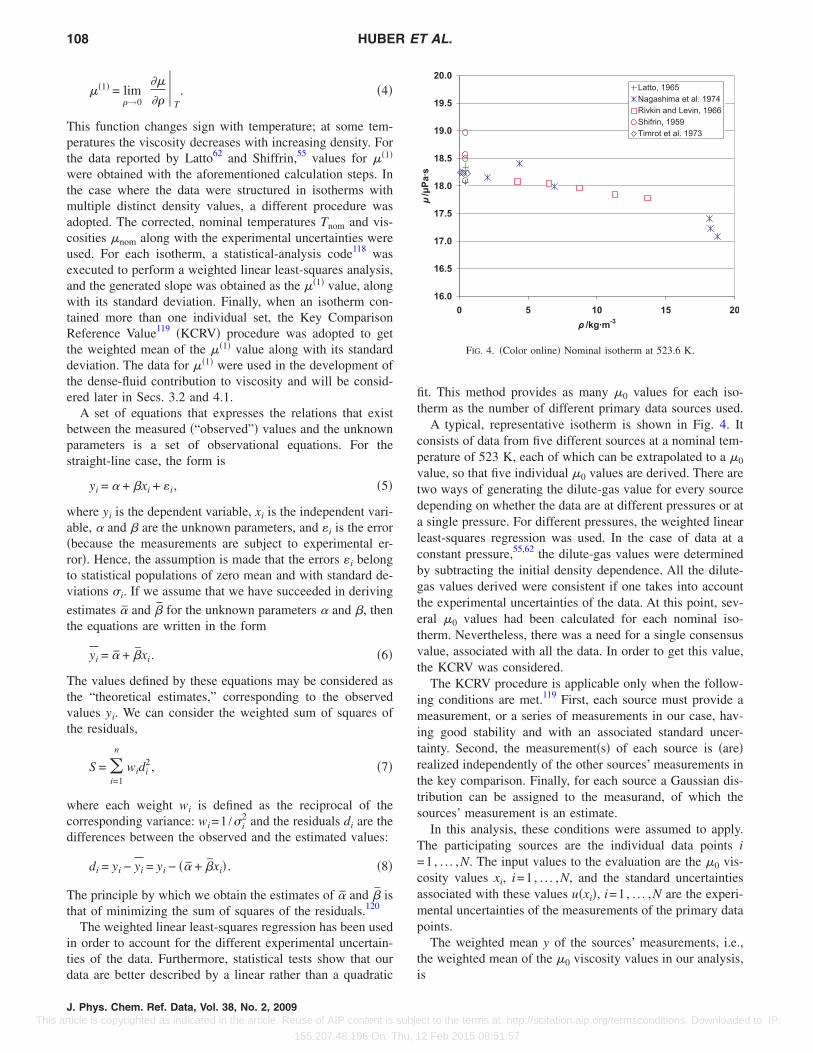
A typical, representative isotherm is shown in Fig. 4. Itconsists of data from five different sources at a nominal tem-perature of 523 K, each of which can be extrapolated to a �0
value, so that five individual �0 values are derived. There aretwo ways of generating the dilute-gas value for every sourcedepending on whether the data are at different pressures or ata single pressure. For different pressures, the weighted linearleast-squares regression was used. In the case of data at aconstant pressure,55,62 the dilute-gas values were determinedby subtracting the initial density dependence. All the dilute-gas values derived were consistent if one takes into accountthe experimental uncertainties of the data. At this point, sev-eral �0 values had been calculated for each nominal iso-therm. Nevertheless, there was a need for a single consensusvalue, associated with all the data. In order to get this value,the KCRV was considered.
The KCRV procedure is applicable only when the follow-ing conditions are met.119 First, each source must provide ameasurement, or a series of measurements in our case, hav-ing good stability and with an associated standard uncer-tainty. Second, the measurement�s� of each source is �are�realized independently of the other sources’ measurements inthe key comparison. Finally, for each source a Gaussian dis-tribution can be assigned to the measurand, of which thesources’ measurement is an estimate.
In this analysis, these conditions were assumed to apply.The participating sources are the individual data points i=1, . . . ,N. The input values to the evaluation are the �0 vis-cosity values xi, i=1, . . . ,N, and the standard uncertaintiesassociated with these values u�xi�, i=1, . . . ,N are the experi-mental uncertainties of the measurements of the primary datapoints.
The weighted mean y of the sources’ measurements, i.e.,the weighted mean of the �0 viscosity values in our analysis,is
16.0
16.5
17.0
17.5
18.0
18.5
19.0
19.5
20.0
0 5 10 15 20ρ /kg·m-3
μ/μPa·s
Latto, 1965Nagashima et al. 1974Rivkin and Levin, 1966Shifrin, 1959Timrot et al. 1973
FIG. 4. �Color online� Nominal isotherm at 523.6 K.
108 HUBER ET AL.
J. Phys. Chem. Ref. Data, Vol. 38, No. 2, 2009 This article is copyrighted as indicated in the article. Reuse of AIP content is subject to the terms at: http://scitation.aip.org/termsconditions. Downloaded to IP:
155.207.48.196 On: Thu, 12 Feb 2015 08:51:57
y =x1/u2�x1� + ¯ + xN/u2�xN�1/u2�x1� + ¯ + 1/u2�xN�
, �9�
and the standard deviation u�y� associated with y is
1
u2�y�=
1
u2�x1�+ ¯ +
1
u2�xN�. �10�
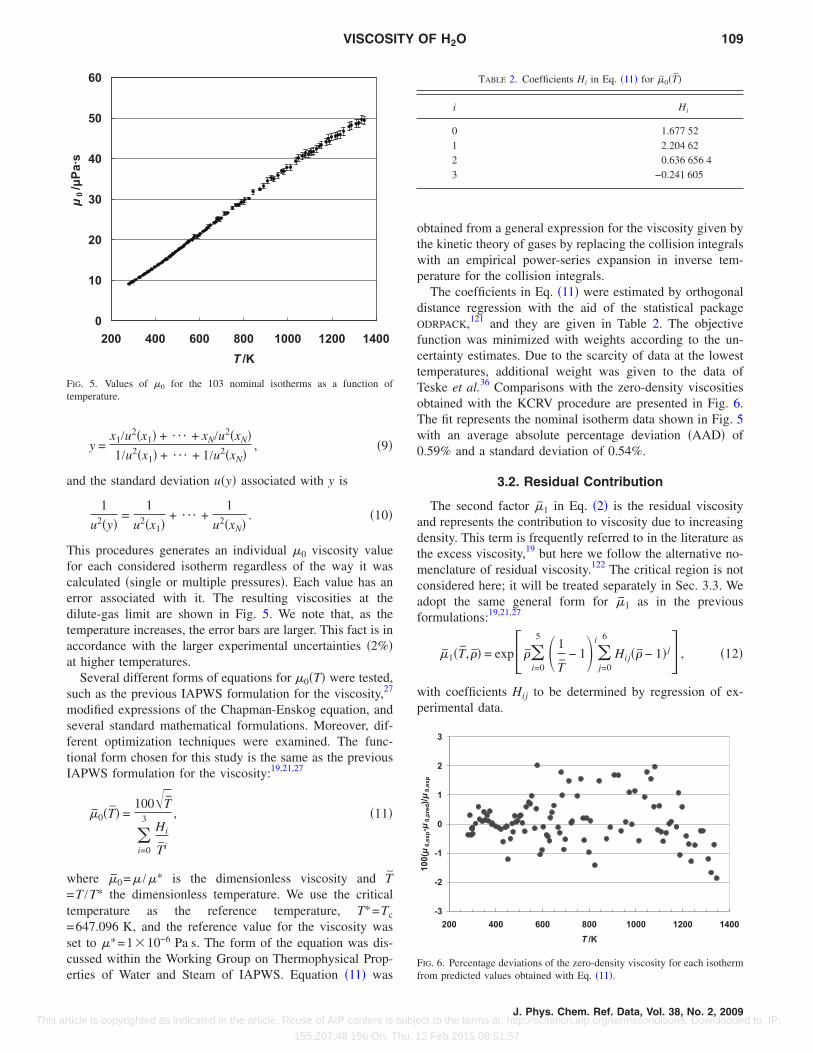
This procedures generates an individual �0 viscosity valuefor each considered isotherm regardless of the way it wascalculated �single or multiple pressures�. Each value has anerror associated with it. The resulting viscosities at thedilute-gas limit are shown in Fig. 5. We note that, as thetemperature increases, the error bars are larger. This fact is inaccordance with the larger experimental uncertainties �2%�at higher temperatures.
Several different forms of equations for �0�T� were tested,such as the previous IAPWS formulation for the viscosity,27
modified expressions of the Chapman-Enskog equation, andseveral standard mathematical formulations. Moreover, dif-ferent optimization techniques were examined. The func-tional form chosen for this study is the same as the previousIAPWS formulation for the viscosity:19,21,27
�̄0�T̄� =100�T̄
�i=0
3Hi
T̄i
, �11�
where �̄0=� /�* is the dimensionless viscosity and T̄=T /T* the dimensionless temperature. We use the criticaltemperature as the reference temperature, T*=Tc
=647.096 K, and the reference value for the viscosity wasset to �*=1�10−6 Pa s. The form of the equation was dis-cussed within the Working Group on Thermophysical Prop-erties of Water and Steam of IAPWS. Equation �11� was
obtained from a general expression for the viscosity given bythe kinetic theory of gases by replacing the collision integralswith an empirical power-series expansion in inverse tem-perature for the collision integrals.
The coefficients in Eq. �11� were estimated by orthogonaldistance regression with the aid of the statistical packageODRPACK,121 and they are given in Table 2. The objectivefunction was minimized with weights according to the un-certainty estimates. Due to the scarcity of data at the lowesttemperatures, additional weight was given to the data ofTeske et al.36 Comparisons with the zero-density viscositiesobtained with the KCRV procedure are presented in Fig. 6.The fit represents the nominal isotherm data shown in Fig. 5with an average absolute percentage deviation �AAD� of0.59% and a standard deviation of 0.54%.
3.2. Residual Contribution
The second factor �̄1 in Eq. �2� is the residual viscosityand represents the contribution to viscosity due to increasingdensity. This term is frequently referred to in the literature asthe excess viscosity,19 but here we follow the alternative no-menclature of residual viscosity.122 The critical region is notconsidered here; it will be treated separately in Sec. 3.3. Weadopt the same general form for �̄1 as in the previousformulations:19,21,27
�̄1�T̄, �̄� = exp��̄�i=0
5 1
T̄− 1i
�j=0
6
Hij��̄ − 1� j� , �12�
with coefficients Hij to be determined by regression of ex-perimental data.
0
10
20
30
40
50
60
200 400 600 800 1000 1200 1400T /K
μ0/μPa·s
FIG. 5. Values of �0 for the 103 nominal isotherms as a function oftemperature.
TABLE 2. Coefficients Hi in Eq. �11� for �̄0�T̄�
i Hi
0 1.677 521 2.204 622 0.636 656 43 −0.241 605
-3
-2
-1
0
1
2
3
200 400 600 800 1000 1200 1400T /K
100(μ0,exp-μ0,pred)/μ
0,exp
FIG. 6. Percentage deviations of the zero-density viscosity for each isothermfrom predicted values obtained with Eq. �11�.
VISCOSITY OF H2O 109
J. Phys. Chem. Ref. Data, Vol. 38, No. 2, 2009 This article is copyrighted as indicated in the article. Reuse of AIP content is subject to the terms at: http://scitation.aip.org/termsconditions. Downloaded to IP:
155.207.48.196 On: Thu, 12 Feb 2015 08:51:57
All points were assigned weights 1 /u2, where u is theestimated experimental uncertainty, with a few exceptions asdiscussed here. The uncertainties are given in Table 1; theyare those given by Assael et al.,29 the original author’s rec-ommendation, or the recommendations by Watson et al.19
Also, following the recommendations given in the previousformulation of Watson et al.,19 the first five points at 380 °Cin Ref. 57 were assigned a weight of zero due to their largeuncertainties. Eighteen points of Nagashima72 between300 °C and the critical temperature were given a weight ofzero to ensure consistency in the near-critical region. Fur-thermore, seven additional points as identified by Watson etal.19 were also given zero weight �Ref. 63, T=172.3 °C, p=49.749 MPa; Ref. 68, T=375.0 °C, p=22.658 MPa; T=400 °C, p=35.436 MPa; T=425.0 °C, p=30.498 MPa; T=425 °C, p=33.417 MPa; T=450 °C, p=35.406 MPa, andin Ref. 72, T=402.83 °C, p=40.060 MPa�. Again, followingthe recommendations of Watson et al.19 for the experimentalmeasurements of Korson et al.71 and of Eicher andZwolinski,78 we adopted the re-evaluated values of Kestin etal.,123 except that relative values were scaled with the pres-ently accepted124 value of 1001.6 �Pa s for the viscosity ofwater at 20 °C and 0.101 325 MPa. As discussed earlier inSec. 2, all densities were computed with IAPWS-95. Simi-larly, manuscripts that presented viscosity as a relative valuewith respect to the viscosity at 20 °C �Refs. 48, 49, and 51�were recomputed by adopting the presently recommendedvalue at 20 °C and 0.101 325 MPa. Also, any points thatexhibited differences of more than three standard deviationsfrom preliminary regressions were considered outliers andwere not used in further regression analysis. Furthermore,data at temperatures below 255 K �this applies to the data ofOsipov91� in the metastable liquid-solid region were assigneda weight of zero for the regression but are included for com-parison purposes. Finally, six recommended values for theviscosity of water at atmospheric pressure for the tempera-ture range 15–40 °C from Ref. 124 were added to the set ofdata used in the regression with an assigned uncertainty of0.17%. Additional discussion on the viscosity of water atatmospheric pressure can be found in Sec. 2.1.1 of Ref. 29.
There are two sets of experimental data that contain datain the critical region: the data of Oltermann90 and the data ofRivkin et al.46 The data of Oltermann outside the critical
region were used in the regression of �̄1�T̄ , �̄� and weightedaccording to the author’s uncertainty estimate, 1.6%. Data ofOltermann within the region bounded by 640.50 KT650.95 K, 254.1 kg m−3�393.4 kg m−3 were given aweight of zero19 as discussed in Sec. 3.2.2 and were notused. The data of Rivkin were reanalyzed with a procedureto be discussed in the next section and the data with thecritical enhancement removed �based on preliminary esti-mates of the enhancement term� were used in the generation
of �̄1�T̄ , �̄�.Equation �12� contains a maximum of 42 empirical terms;
there is no theoretical motivation for the form or the totalnumber of terms necessary or which terms will best represent
the experimental data. To determine the statistically signifi-cant terms, we used a simulated annealing procedure125
along with the orthogonal distance regression packageODRPACK �Ref. 121� to arrive at our final formulation. Simu-lated annealing125 is an optimization technique that can beused in complex problems where there may be multiple localminima. It is a combinatorial method that does not requirederivatives and does not depend upon “traveling downhill;”it also is relatively easy to implement. In this work, thesearch space contained a bank of terms corresponding to theterms in Eq. �12�. The total number of terms was fixed ineach optimization experiment, and the simulated annealingalgorithm was used to determine the optimal terms from thebank of terms. As in earlier work,126 we implemented anannealing schedule recommended by Lundy and Mees.127
Successive runs were made with different total numbers ofterms, from 18 to 25. For the regression, the data wereweighted according to their estimated uncertainty �u� withweights of 1 /u2. Points that deviated by more than threestandard deviations from preliminary fits were consideredoutliers and were not included in the statistics and final re-gression.
Several conditions were imposed on the regression. First,the equation was constrained to reproduce the recommendedvalue124 of the viscosity of water at 20 °C and atmosphericpressure �0.101 325 MPa�, �=1001.6 �Pa s. Second, thefirst density correction to the viscosity in the gas phase, ��1�,was forced to approach zero for very large T and to be nega-tive at low temperatures. This is consistent with theoreticalapproaches.128 One can represent the initial density depen-dence of the viscosity in the gas phase as
� = �0 + ��1�� , �13�
where the coefficient ��1� is the first density correction de-fined previously in Eq. �4�.
From Eqs. �12� and �4� we obtain
��1� =�0�T�
�̄�i=0
5
Hi0 1
T̄− 1i
. �14�
We fitted the experimental viscosities from the data bankand the first density correction data simultaneously. The ob-jective function was the weighted sum of the squared differ-ence between the experimental and calculated values. Therelative weight of the first density correction was adjusteduntil ��1� had the desired behavior but did not degrade the fitof the viscosity data. The formulation with a total of 21 termsprovided the best representation of the data with the fewestnumber of terms. Increasing the total number of terms above21 provided marginally better representations of the data butwith increased uncertainty in the coefficients. The quality ofthe fits degraded for formulations with fewer than 21 terms;thus we chose 21 as the optimal formulation. The final valuesof the coefficients for the residual function are given in Table3. A detailed comparison of the correlation with experimentaldata will be presented in Sec. 4.
110 HUBER ET AL.
J. Phys. Chem. Ref. Data, Vol. 38, No. 2, 2009 This article is copyrighted as indicated in the article. Reuse of AIP content is subject to the terms at: http://scitation.aip.org/termsconditions. Downloaded to IP:
155.207.48.196 On: Thu, 12 Feb 2015 08:51:57
3.3. Critical Region3.3.1. Theory
The critical region is a region where reliable theoreticalpredictions are available for the thermodynamic and trans-port properties of H2O.129 In the vicinity of a critical point,fluids exhibit large fluctuations in the order parameter asso-ciated with the critical phase transition. For fluids near thevapor-liquid critical point, the order parameter can be as-ymptotically identified with the density �. The correspondingsusceptibility �, defined as the derivative of the order param-eter with respect to the ordering field �chemical potential�, isrelated to the isothermal compressibility such that ������ /�p�T.129 The spatial extent of the density fluctuationsis characterized by a correlation length �. Along the criticalisochore, �=�c=�*, the correlation length � and the dimen-sionless susceptibility �̄� �̄���̄ /�p̄�T̄ diverge as a function of
t= �T̄−1� / T̄ asymptotically close to the critical point accord-ing to power laws of the form
� �0t−� and �̄ 0t−�. �15�
The reference temperature T* equals the critical temperature
Tc, so that T̄=T /Tc. In these power laws, �0 and 0 aresystem-dependent amplitudes and � and � are universal criti-cal exponents. Fluids belong to the universality class ofIsing-like systems for which �=0.630 and �=1.239.130 FromEq. �15�, it follows that
� �0��̄/ 0��/�. �16�
Although Eq. �16� is strictly valid only for �=�c, it is alsoused as an approximation for ���c.
20,131
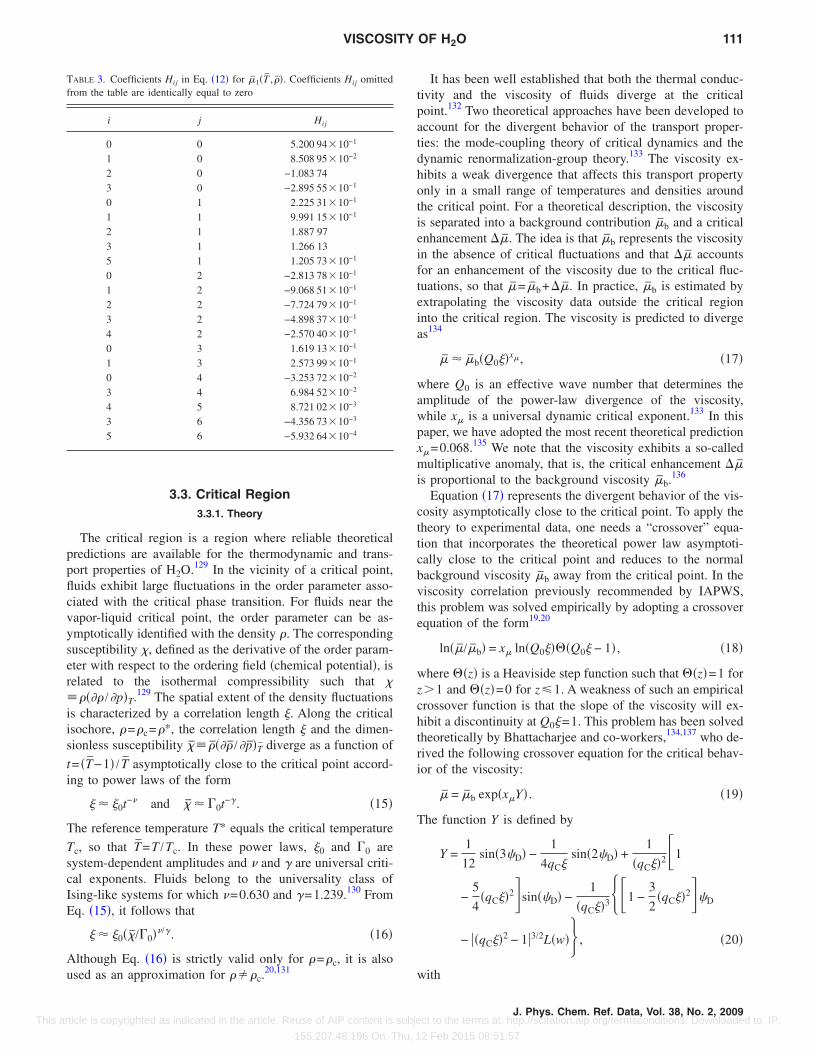
It has been well established that both the thermal conduc-tivity and the viscosity of fluids diverge at the criticalpoint.132 Two theoretical approaches have been developed toaccount for the divergent behavior of the transport proper-ties: the mode-coupling theory of critical dynamics and thedynamic renormalization-group theory.133 The viscosity ex-hibits a weak divergence that affects this transport propertyonly in a small range of temperatures and densities aroundthe critical point. For a theoretical description, the viscosityis separated into a background contribution �̄b and a criticalenhancement ��̄. The idea is that �̄b represents the viscosityin the absence of critical fluctuations and that ��̄ accountsfor an enhancement of the viscosity due to the critical fluc-tuations, so that �̄= �̄b+��̄. In practice, �̄b is estimated byextrapolating the viscosity data outside the critical regioninto the critical region. The viscosity is predicted to divergeas134
�̄ �̄b�Q0��x�, �17�
where Q0 is an effective wave number that determines theamplitude of the power-law divergence of the viscosity,while x� is a universal dynamic critical exponent.133 In thispaper, we have adopted the most recent theoretical predictionx�=0.068.135 We note that the viscosity exhibits a so-calledmultiplicative anomaly, that is, the critical enhancement ��̄is proportional to the background viscosity �̄b.136
Equation �17� represents the divergent behavior of the vis-cosity asymptotically close to the critical point. To apply thetheory to experimental data, one needs a “crossover” equa-tion that incorporates the theoretical power law asymptoti-cally close to the critical point and reduces to the normalbackground viscosity �̄b away from the critical point. In theviscosity correlation previously recommended by IAPWS,this problem was solved empirically by adopting a crossoverequation of the form19,20
ln��̄/�̄b� = x� ln�Q0����Q0� − 1� , �18�
where ��z� is a Heaviside step function such that ��z�=1 forz�1 and ��z�=0 for z1. A weakness of such an empiricalcrossover function is that the slope of the viscosity will ex-hibit a discontinuity at Q0�=1. This problem has been solvedtheoretically by Bhattacharjee and co-workers,134,137 who de-rived the following crossover equation for the critical behav-ior of the viscosity:
�̄ = �̄b exp�x�Y� . �19�
The function Y is defined by
Y =1
12sin�3�D� −
1
4qC�sin�2�D� +
1
�qC��2�1
−5
4�qC��2�sin��D� −
1
�qC��3��1 −3
2�qC��2��D
− ��qC��2 − 1�3/2L�w�� , �20�
with
TABLE 3. Coefficients Hij in Eq. �12� for �̄1�T̄ , �̄�. Coefficients Hij omittedfrom the table are identically equal to zero
i j Hij
0 0 5.200 94�10−1
1 0 8.508 95�10−2
2 0 −1.083 743 0 −2.895 55�10−1
0 1 2.225 31�10−1
1 1 9.991 15�10−1
2 1 1.887 973 1 1.266 135 1 1.205 73�10−1
0 2 −2.813 78�10−1
1 2 −9.068 51�10−1
2 2 −7.724 79�10−1
3 2 −4.898 37�10−1
4 2 −2.570 40�10−1
0 3 1.619 13�10−1
1 3 2.573 99�10−1
0 4 −3.253 72�10−2
3 4 6.984 52�10−2
4 5 8.721 02�10−3
3 6 −4.356 73�10−3
5 6 −5.932 64�10−4
VISCOSITY OF H2O 111
J. Phys. Chem. Ref. Data, Vol. 38, No. 2, 2009 This article is copyrighted as indicated in the article. Reuse of AIP content is subject to the terms at: http://scitation.aip.org/termsconditions. Downloaded to IP:
155.207.48.196 On: Thu, 12 Feb 2015 08:51:57

�D = arccos�1 + qD2 �2�−1/2 �21�
and with the function L�w� given by
L�w� = �ln1 + w
1 − wfor qC� � 1
2 arctan�w� for qC� 1.� �22�
The variable w is defined by
w = �qC� − 1
qC� + 1�1/2
tan�D
2 . �23�
The function Y contains two system-dependent constants,namely, the wave numbers qC and qD. Asymptotically closeto the critical point, i.e., in the limit of large �, Eq. �19�reproduces Eq. �17� with an amplitude Q0 that is related toqC and qD such that134,137
Q0−1 = �qC
−1 + qD−1�e4/3/2. �24�
The wave number qC is related to a background contributionto the decay rate of the critical fluctuations and is given by
qC =kBTc
2
16�bc�b
cpc2
0
�02 �p
�T
�=�c
2
, �25�
where kB is Boltzmann’s constant, �bc and �b
c are the valuesof the background viscosity and background thermal conduc-tivity, respectively, at the critical point, while ��p /�T��=�c
isthe slope of the critical isochore at the critical temperature.The wave number qD represents a “Debye” cutoff of themode-coupling integrals for critical dynamics and is the onlyadjustable parameter in the theory.
For small �, the function Y approaches zero, so that �̄approaches �̄b in this limit. Around �=0, the function Y hasa Taylor expansion of the form
Y =1
5qC��qD��51 − qC� + �qC��2 −
765
504�qD��2 . �26�
The approximations in the derivation of Eq. �19� for the criti-cal enhancement of the viscosity have been discussed byLuettmer-Strathmann et al.138 One of the approximations isthat the isobaric specific heat capacity cp in the mode-coupling integral for the viscosity has been replaced by thedifference cp−cV, where cV is the isochoric specific heat ca-pacity. The approximations are well justified in the smallregion around the critical point where a critical viscosity en-hancement is observed.
Equation �16� represents the behavior of the correlationlength � near the critical point. In the theory of critical phe-nomena, � is to be interpreted as that part of the actual cor-relation length associated with the long-range critical fluc-tuations. Hence, the correlation length � in Eq. �20� shouldvanish far away from the critical point. To accomplish thisgoal, we have adopted a procedure proposed by Olchowyand co-workers138,139 by generalizing Eq. �16� to
� = �0��̄
0�/�
�27�
in terms of ��̄ ��0� which is defined by
��̄ = �̄� ��̄�T̄, �̄��p̄
T̄
− ��̄�T̄R, �̄��p̄
T̄
T̄R
T̄� . �28�
In Eq. �28�, T̄R is a reference temperature sufficiently highabove the critical temperature that the critical fluctuations
can be assumed to be small. In practice, one may select T̄R
=1.5.138–140 Furthermore, ��̄ is to be taken to be zero whenthe left-hand side of Eq. �28� becomes negative. This proce-dure assures that the correlation length � in Eqs. �20� and�26� will vanish far away from the critical point.
An accurate experimental determination of the viscosityclose to the critical point is hampered by the presence ofgravitationally induced density profiles.141 To avoid thiscomplication, the viscosity of xenon near the critical densityand critical temperature has been measured by Berg et al. atlow-gravity conditions in the Space Shuttle.142–144 In the hy-drodynamic limit of zero frequency, the experimental viscos-ity data are well represented by Eq. �19� with an experimen-tal value for the critical exponent x� that agrees within itsuncertainty with the theoretical value of 0.068.135 We con-clude that the crossover Eq. �19� for the critical behavior hasa sound theoretical basis and has been validated experimen-tally.
3.3.2. Application to H2O
Basu and co-workers showed that Eq. �19� yields a satis-factory description of the critical behavior of the viscosity ofH2O.134,145 For the present project, we have performed acomplete reanalysis of the experimental data for the viscosityof H2O in the critical region, adopting the IAPWS-95formulation24,25 for the representation of the equilibriumthermodynamic properties.
The background viscosity �̄b is represented by
�̄b = �̄0�T̄� � �̄1�T̄, �̄� �29�
from Eq. �2�, as specified in Secs. 3.1 and 3.2. The ampli-tudes of the power laws, Eq. �15�, for the susceptibility andthe correlation length of H2O are129,146,147
0 = 0.06, �0 = 0.13 nm. �30�
With ��p /�T��=�c=0.267 MPa K−1, with �b
c =39.3 �Pa s ascalculated from Eq. �29� at T=Tc and �=�c and with �b
c
=0.197 W m−1 K−1 as estimated from the current interpolat-ing equation for the thermal conductivity of H2O,26,148 wefind from Eq. �25�:
qC−1 = 1.9 nm. �31�
The equation for the critical enhancement of the viscosity ofH2O is now completely specified except for one system-dependent constant, namely, the wave number qD.
112 HUBER ET AL.
J. Phys. Chem. Ref. Data, Vol. 38, No. 2, 2009 This article is copyrighted as indicated in the article. Reuse of AIP content is subject to the terms at: http://scitation.aip.org/termsconditions. Downloaded to IP:
155.207.48.196 On: Thu, 12 Feb 2015 08:51:57
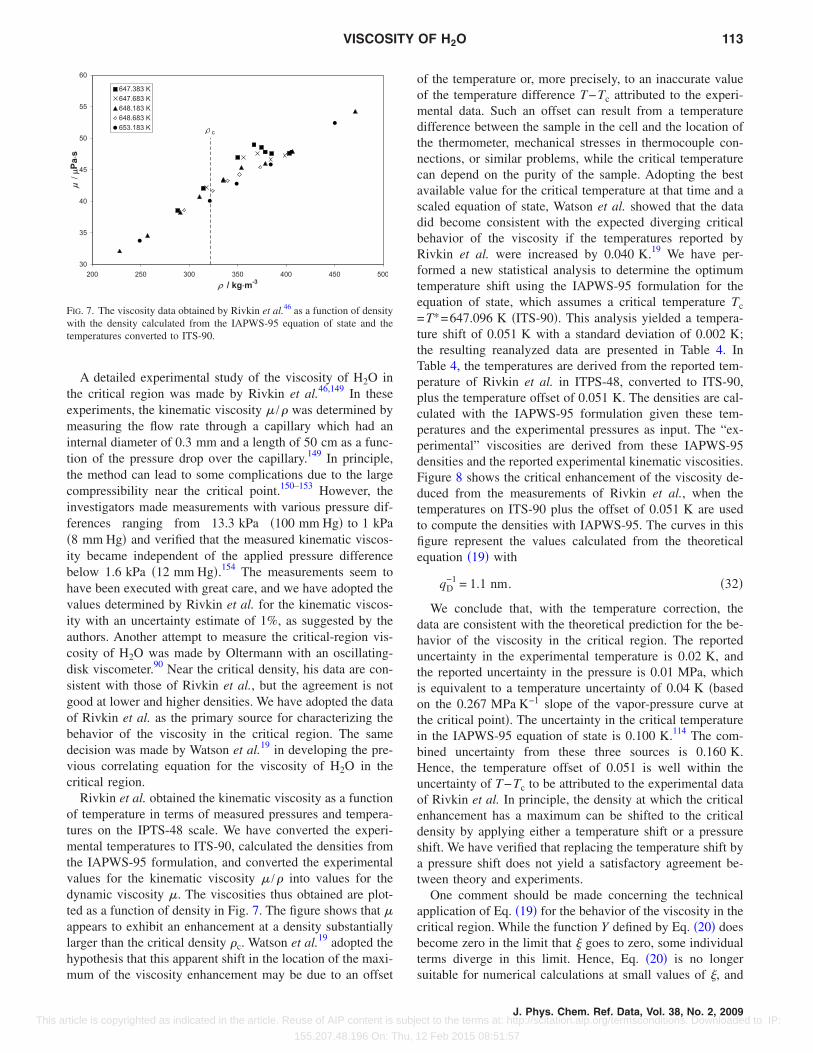
A detailed experimental study of the viscosity of H2O inthe critical region was made by Rivkin et al.46,149 In theseexperiments, the kinematic viscosity � /� was determined bymeasuring the flow rate through a capillary which had aninternal diameter of 0.3 mm and a length of 50 cm as a func-tion of the pressure drop over the capillary.149 In principle,the method can lead to some complications due to the largecompressibility near the critical point.150–153 However, theinvestigators made measurements with various pressure dif-ferences ranging from 13.3 kPa �100 mm Hg� to 1 kPa�8 mm Hg� and verified that the measured kinematic viscos-ity became independent of the applied pressure differencebelow 1.6 kPa �12 mm Hg�.154 The measurements seem tohave been executed with great care, and we have adopted thevalues determined by Rivkin et al. for the kinematic viscos-ity with an uncertainty estimate of 1%, as suggested by theauthors. Another attempt to measure the critical-region vis-cosity of H2O was made by Oltermann with an oscillating-disk viscometer.90 Near the critical density, his data are con-sistent with those of Rivkin et al., but the agreement is notgood at lower and higher densities. We have adopted the dataof Rivkin et al. as the primary source for characterizing thebehavior of the viscosity in the critical region. The samedecision was made by Watson et al.19 in developing the pre-vious correlating equation for the viscosity of H2O in thecritical region.
Rivkin et al. obtained the kinematic viscosity as a functionof temperature in terms of measured pressures and tempera-tures on the IPTS-48 scale. We have converted the experi-mental temperatures to ITS-90, calculated the densities fromthe IAPWS-95 formulation, and converted the experimentalvalues for the kinematic viscosity � /� into values for thedynamic viscosity �. The viscosities thus obtained are plot-ted as a function of density in Fig. 7. The figure shows that �appears to exhibit an enhancement at a density substantiallylarger than the critical density �c. Watson et al.19 adopted thehypothesis that this apparent shift in the location of the maxi-mum of the viscosity enhancement may be due to an offset
of the temperature or, more precisely, to an inaccurate valueof the temperature difference T−Tc attributed to the experi-mental data. Such an offset can result from a temperaturedifference between the sample in the cell and the location ofthe thermometer, mechanical stresses in thermocouple con-nections, or similar problems, while the critical temperaturecan depend on the purity of the sample. Adopting the bestavailable value for the critical temperature at that time and ascaled equation of state, Watson et al. showed that the datadid become consistent with the expected diverging criticalbehavior of the viscosity if the temperatures reported byRivkin et al. were increased by 0.040 K.19 We have per-formed a new statistical analysis to determine the optimumtemperature shift using the IAPWS-95 formulation for theequation of state, which assumes a critical temperature Tc
=T*=647.096 K �ITS-90�. This analysis yielded a tempera-ture shift of 0.051 K with a standard deviation of 0.002 K;the resulting reanalyzed data are presented in Table 4. InTable 4, the temperatures are derived from the reported tem-perature of Rivkin et al. in ITPS-48, converted to ITS-90,plus the temperature offset of 0.051 K. The densities are cal-culated with the IAPWS-95 formulation given these tem-peratures and the experimental pressures as input. The “ex-perimental” viscosities are derived from these IAPWS-95densities and the reported experimental kinematic viscosities.Figure 8 shows the critical enhancement of the viscosity de-duced from the measurements of Rivkin et al., when thetemperatures on ITS-90 plus the offset of 0.051 K are usedto compute the densities with IAPWS-95. The curves in thisfigure represent the values calculated from the theoreticalequation �19� with
qD−1 = 1.1 nm. �32�
We conclude that, with the temperature correction, thedata are consistent with the theoretical prediction for the be-havior of the viscosity in the critical region. The reporteduncertainty in the experimental temperature is 0.02 K, andthe reported uncertainty in the pressure is 0.01 MPa, whichis equivalent to a temperature uncertainty of 0.04 K �basedon the 0.267 MPa K−1 slope of the vapor-pressure curve atthe critical point�. The uncertainty in the critical temperaturein the IAPWS-95 equation of state is 0.100 K.114 The com-bined uncertainty from these three sources is 0.160 K.Hence, the temperature offset of 0.051 is well within theuncertainty of T−Tc to be attributed to the experimental dataof Rivkin et al. In principle, the density at which the criticalenhancement has a maximum can be shifted to the criticaldensity by applying either a temperature shift or a pressureshift. We have verified that replacing the temperature shift bya pressure shift does not yield a satisfactory agreement be-tween theory and experiments.
One comment should be made concerning the technicalapplication of Eq. �19� for the behavior of the viscosity in thecritical region. While the function Y defined by Eq. �20� doesbecome zero in the limit that � goes to zero, some individualterms diverge in this limit. Hence, Eq. �20� is no longersuitable for numerical calculations at small values of �, and
30
35
40
45
50
55
60
200 250 300 350 400 450 500ρ / kg⋅m-3
μ/μ/μPa
⋅s647.383 K647.683 K648.183 K648.683 K653.183 K ρ c
FIG. 7. The viscosity data obtained by Rivkin et al.46 as a function of densitywith the density calculated from the IAPWS-95 equation of state and thetemperatures converted to ITS-90.
VISCOSITY OF H2O 113
J. Phys. Chem. Ref. Data, Vol. 38, No. 2, 2009 This article is copyrighted as indicated in the article. Reuse of AIP content is subject to the terms at: http://scitation.aip.org/termsconditions. Downloaded to IP:
155.207.48.196 On: Thu, 12 Feb 2015 08:51:57

for �0.381 701 641 6 nm the function Y should be evalu-ated by using its truncated Taylor expansion given by Eq.�26�.
Figure 9 shows a plot of the logarithm of the multiplica-tive critical viscosity enhancement � /�b calculated with Eq.�19� and the parameters summarized in Table 5 as a functionof the correlation length �. The symbols represent the experi-mental data of Rivkin et al.46 with densities calculated fromthe IAPWS-95 equation and the temperatures converted toITS-90 and shifted by 0.051 K. The curve represents the the-oretical expression for this viscosity enhancement. The criti-
TABLE 4. Reanalyzed viscosity data in the critical region based on the cap-illary measurements of kinematic viscosity � /� by Rivkin et al.46
T �K� p �MPa� � /� �10−10 m2 s−1� � �kg m−3� � ��Pa s�
647.434 22.136 1336 265.9 35.5647.434 22.140 1338 270.4 36.2647.434 22.144 1341 276.4 37.1647.434 22.150 1334 292.4 39.0647.434 22.156 1296 336.6 43.6647.434 22.160 1264 356.9 45.1647.434 22.170 1235 373.7 46.1647.434 22.220 1181 398.8 47.1647.734 22.220 1330 279.2 37.1647.734 22.230 1319 302.9 40.0647.734 22.240 1285 344.7 44.3647.734 22.260 1214 375.0 45.5647.734 22.300 1185 394.0 46.7648.234 22.200 1407 226.4 31.9648.234 22.300 1345 251.9 33.9648.234 22.340 1316 275.5 36.3648.234 22.350 1311 286.6 37.6648.234 22.360 1294 303.3 39.3648.234 22.360 1298 303.3 39.4648.234 22.370 1282 325.9 41.8648.234 22.400 1216 369.3 44.9648.234 22.500 1179 403.4 47.6648.234 23.500 1152 470.5 54.2648.734 22.470 1309 281.6 36.9648.734 22.490 1284 303.8 39.0648.734 22.500 1274 318.6 40.6648.734 22.510 1258 333.7 42.0648.734 22.540 1217 364.6 44.4648.734 22.640 1183 398.6 47.2649.234 22.600 1297 286.1 37.1649.234 22.620 1276 304.2 38.8649.234 22.630 1274 315.0 40.1649.234 22.650 1238 336.8 41.7649.234 22.700 1205 370.8 44.7649.234 22.800 1181 397.8 47.0650.234 22.300 1503 197.1 29.6650.234 22.700 1366 240.1 32.8650.234 22.840 1294 281.3 36.4650.234 22.890 1256 311.5 39.1650.234 22.940 1227 344.7 42.3650.234 23.000 1203 370.2 44.5650.234 23.200 1175 407.3 47.9653.234 23.400 1355 247.3 33.5653.234 23.700 1247 317.1 39.5653.234 23.800 1226 345.4 42.3653.234 24.000 1193 382.0 45.6653.234 24.200 1180 403.8 47.6653.234 25.000 1164 449.5 52.3653.234 30.000 1147 533.5 61.2663.232 25.000 1466 214.4 31.4663.232 26.100 1289 287.8 37.1663.232 26.600 1233 333.6 41.1663.232 27.000 1207 364.5 44.0663.232 27.500 1188 393.4 46.7646.935 22.100 1174 409.8 48.1647.114 22.100 1194 391.7 46.8647.174 22.100 1213 380.2 46.1
TABLE 4. Reanalyzed viscosity data in the critical region based on the cap-illary measurements of kinematic viscosity � /� by Rivkin etal.46—Continued
T �K� p �MPa� � /� �10−10 m2 s−1� � �kg m−3� � ��Pa s�
647.204 22.100 1262 369.6 46.6647.204 22.100 1262 369.6 46.6647.234 22.100 1346 304.4 41.0647.234 22.100 1347 304.4 41.0647.264 22.100 1342 272.6 36.6647.264 22.100 1342 272.6 36.6647.234 22.200 1181 409.9 48.4647.534 22.200 1226 374.2 45.9647.584 22.200 1299 350.4 45.5647.634 22.200 1326 289.3 38.4647.654 22.200 1325 279.0 37.0647.674 22.200 1327 272.3 36.1648.234 22.200 1407 226.4 31.9647.234 22.300 1164 425.3 49.5647.734 22.300 1185 394.0 46.7647.934 22.300 1255 354.5 44.5647.984 22.300 1301 317.6 41.3648.034 22.300 1315 287.1 37.8648.084 22.300 1325 272.4 36.1648.234 22.300 1345 251.9 33.9650.234 22.300 1503 197.1 29.6
30
35
40
45
50
55
60
200 250 300 350 400 450 500
ρ / kg⋅m-3
μ/μ/μPa
⋅s
647.434 K647.734 K648.234 K648.734 K653.234 KCorrelation ρ c
FIG. 8. The viscosity data obtained by Rivkin et al.46 as a function of densitywith the density calculated from the IAPWS-95 equation and the tempera-tures converted to ITS-90 and shifted by 0.051 K. The curves represent thepresent correlation equation for the viscosity in the critical region.
114 HUBER ET AL.
J. Phys. Chem. Ref. Data, Vol. 38, No. 2, 2009 This article is copyrighted as indicated in the article. Reuse of AIP content is subject to the terms at: http://scitation.aip.org/termsconditions. Downloaded to IP:
155.207.48.196 On: Thu, 12 Feb 2015 08:51:57
cal enhancement of the viscosity is significant only in a verysmall region of temperatures and densities around the criticalpoint. Although the viscosity is infinite exactly at the criticalpoint, the enhancement term,
�̄2 = exp�x�Y� �33�
in Eq. �19�, contributes an amount greater than the uncer-tainty of 2% of our correlating equation only at values of �larger than �=3.51 nm. This condition is satisfied only attemperatures and densities within the following boundaries:
645.91 K � T � 650.77 K,
245.8 kg m−3 � � � 405.3 kg m−3. �34�
Both the curve where �̄2=1.02 and the region given byEq. �34� are shown in Fig. 10. Note that the function Y isdefined for two different ranges of correlation length �: for0�0.381 701 641 6 nm, Eq. �26� should be used, whilefor ��0.381 701 641 6 nm, Eq. �20� applies. In addition,when ��̄ calculated by Eq. �28� is less than zero, it must beset to zero for calculations to proceed. Furthermore, due tothe numerical implementation of the equation of state, thecalculated singularity in the first derivative in Eq. �28� maynot occur exactly at Tc and �c, as it should. Therefore, de-pending on the software used, calculated values of �̄2 maybehave unphysically at points extremely close to the critical
point �approximately within 0.01 kg m−3 of �c on the criticalisotherm�. The formulation should be used with caution inthis very small region.
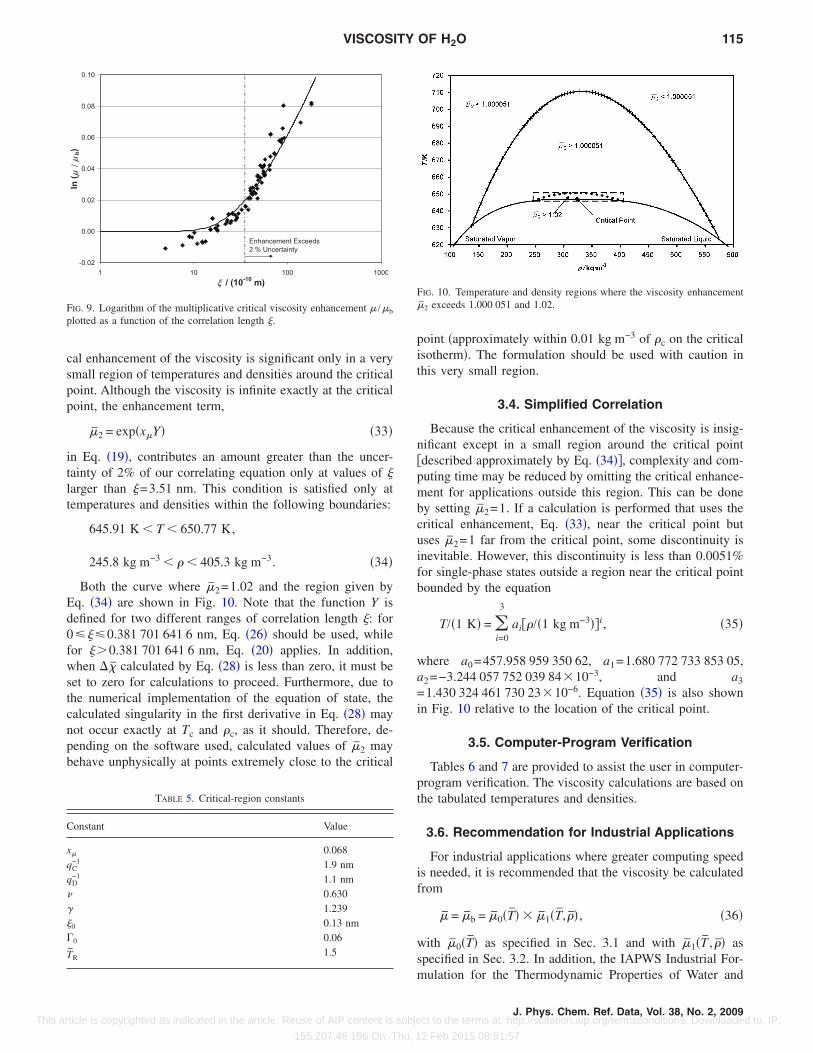
3.4. Simplified Correlation
Because the critical enhancement of the viscosity is insig-nificant except in a small region around the critical point�described approximately by Eq. �34��, complexity and com-puting time may be reduced by omitting the critical enhance-ment for applications outside this region. This can be doneby setting �̄2=1. If a calculation is performed that uses thecritical enhancement, Eq. �33�, near the critical point butuses �̄2=1 far from the critical point, some discontinuity isinevitable. However, this discontinuity is less than 0.0051%for single-phase states outside a region near the critical pointbounded by the equation
T/�1 K� = �i=0
3
ai��/�1 kg m−3��i, �35�
where a0=457.958 959 350 62, a1=1.680 772 733 853 05,a2=−3.244 057 752 039 84�10−3, and a3
=1.430 324 461 730 23�10−6. Equation �35� is also shownin Fig. 10 relative to the location of the critical point.
3.5. Computer-Program Verification
Tables 6 and 7 are provided to assist the user in computer-program verification. The viscosity calculations are based onthe tabulated temperatures and densities.
3.6. Recommendation for Industrial Applications
For industrial applications where greater computing speedis needed, it is recommended that the viscosity be calculatedfrom
�̄ = �̄b = �̄0�T̄� � �̄1�T̄, �̄� , �36�
with �̄0�T̄� as specified in Sec. 3.1 and with �̄1�T̄ , �̄� asspecified in Sec. 3.2. In addition, the IAPWS Industrial For-mulation for the Thermodynamic Properties of Water and
-0.02
0.00
0.02
0.04
0.06
0.08
0.10
1 10 100 1000ξξ / (10-10 m)
ln( μμ
/μμb)
Enhancement Exceeds2 % Uncertainty
FIG. 9. Logarithm of the multiplicative critical viscosity enhancement � /�b
plotted as a function of the correlation length �.
TABLE 5. Critical-region constants
Constant Value
x� 0.068qC
−1 1.9 nmqD
−1 1.1 nm� 0.630� 1.239�0 0.13 nm 0 0.06
T̄R1.5
FIG. 10. Temperature and density regions where the viscosity enhancement�̄2 exceeds 1.000 051 and 1.02.
VISCOSITY OF H2O 115
J. Phys. Chem. Ref. Data, Vol. 38, No. 2, 2009 This article is copyrighted as indicated in the article. Reuse of AIP content is subject to the terms at: http://scitation.aip.org/termsconditions. Downloaded to IP:
155.207.48.196 On: Thu, 12 Feb 2015 08:51:57

Steam,155,156 known as IAPWS-IF97, should be used to de-termine the density for use in Eq. �36� when the state point isdefined by the temperature and pressure or other state vari-ables. Physically, this means that for industrial applicationsthe critical viscosity enhancement can be neglected and theviscosity � can be identified with the background viscosity�b, defined by Eq. �29�, everywhere including in the near-critical region.
With this recommended industrial formulation for the vis-cosity of H2O, the error introduced is smaller than the uncer-tainty of the full viscosity formulation, given by Eq. �2�,provided the point is within the range of validity of IAPWS-IF97, except for points close to and inside the near-criticalregion described by Eq. �34�. Deviations between the vis-cosities calculated from the industrial viscosity formulationand the complete viscosity formulation are shown in Fig. 11.The region of densities and temperatures where the devia-tions exceed 2% is very small and may in practice be ignoredfor industrial applications. Although it would be possible, inprinciple, to get an estimate for the critical-viscosity-enhancement factor in Eq. �2� by calculating the thermody-namic properties in Eq. �33� for �̄2 with IAPWS-IF97, forapplications where an accurate estimate of the critical en-hancement of the viscosity is needed, it is recommended thatthe IAPWS-95 formulation for the thermodynamic propertiesof H2O be used.
3.7. Liquid H2O at 0.1 MPa
It is useful to have simplified correlating equations for theproperties of liquid water at atmospheric pressure with un-
certainties no greater than those of the more complex formu-lations that cover wide ranges of temperature and pressure.To this end, Pátek et al.157,158 provided formulations for theproperties, including viscosity, of liquid water as a functionof absolute temperature T at a standard pressure of 0.1 MPa.Details on the background, development, and validation ofthese correlations are presented in Ref. 157; we present onlythe viscosity correlation here.
The dimensionless viscosity �̄ of liquid water at 0.1 MPais described by
�̄ = �i=1
4
ai�T̃�bi, �37�
where T̃=T / �300 K� and ai and bi are coefficients and expo-nents given in Table 8. Equation �37� is recommended foruse in the following temperature range:
253.15 K T 383.15 K, �38�
and should not be extrapolated outside these limits. At sometemperatures within this range, the equilibrium phase at0.1 MPa is a solid or a vapor, and at these conditions Eq.�37� describes the viscosity of the metastable liquid phase.The uncertainty of Eq. �37� is 1% for the stable liquid region.No uncertainty estimate is given for the metastable regions,but the agreement with available data for the subcooled re-gion is within 5% as discussed in Sec 4.2 of this paper.Equation �37� also reproduces the International Organizationfor Standardization �ISO� recommended value of the viscos-ity at 20 °C �293.15 K� and standard atmospheric pressurewithin the number of digits given in Ref. 124; it also agrees
TABLE 6. Sample points for computer-program verification of the correlatingequation, Eq. �2�, with �̄2=1
T �K� � �kg m−3� � ��Pa s�
298.15 998 889.735 100298.15 1200 1437.649 467373.15 1000 307.883 622433.15 1 14.538 324433.15 1000 217.685 358873.15 1 32.619 287873.15 100 35.802 262873.15 600 77.430 195
1173.15 1 44.217 2451173.15 100 47.640 4331173.15 400 64.154 608
TABLE 7. Sample points for computer-program verification of the correlatingequation, Eq. �2�, in the region near the critical point
T �K� � �kg m−3� � �nm� �̄2 � ��Pa s�
647.35 122 0.309 247 1.000 002 89a 25.520 677647.35 222 1.571 405 1.003 751 20 31.337 589647.35 272 5.266 522 1.034 167 89 36.228 143647.35 322 16.590 209 1.091 904 40 42.961 579647.35 372 5.603 768 1.036 658 71 45.688 204647.35 422 1.876 244 1.005 963 32 49.436 256
aCorrelation length ��0.381 701 641 6 nm so Y is evaluated from Eq. �26�.
-9
-8
-7
-6
-5
-4
-3
-2
-1
0
230 280 330 380
ρ /kg·m-3
Deviation/%
650 K646 K
647 K
648 K
649 K
651 K
647 K
646 K
647.5 K
FIG. 11. Deviations ���Eq. �36�−��Eq. �2�� /��Eq. �2� along selected isotherms.
TABLE 8. Coefficients ai and bi in Eq. �37� for the viscosity of liquid waterat 0.1 MPa
i ai bi
1 280.68 −1.92 511.45 −7.73 61.131 −19.64 0.459 03 −40.0
116 HUBER ET AL.
J. Phys. Chem. Ref. Data, Vol. 38, No. 2, 2009 This article is copyrighted as indicated in the article. Reuse of AIP content is subject to the terms at: http://scitation.aip.org/termsconditions. Downloaded to IP:
155.207.48.196 On: Thu, 12 Feb 2015 08:51:57

with all values from 288.15 K to 313.15 K at atmosphericpressure in Ref. 124 within the stated uncertainty of 0.17% at293.15 K.
4. Evaluation
In summary, the recommended formulation for the viscos-ity is given by Eq. �2�:
�̄ = �̄0�T̄� � �̄1�T̄, �̄� � �̄2�T̄, �̄� .
The function �̄0�T̄� is given by Eq. �11� with coefficients in
Table 2. The function �̄1�T̄ , �̄� is given by Eq. �12� with
coefficients in Table 3. The function �̄2�T̄ , �̄� is givenby Eq. �33� as a function of Y��� defined by Eq. �26�for 0� 0.381 701 641 6 nm and by Eq. �23� for ��0.381 701 641 6 nm with parameters in Table 5.
4.1. Comparisons with Experimental Data andPrevious IAPWS Formulation
In order to evaluate performance, we compare the resultsof the new formulation, Eq. �2�, as well as the previousIAPWS formulation for the viscosity,27 with the experimen-tal database. Comparisons with all sources in the experimen-tal database are presented in Table 9, which gives the numberof data points, estimated uncertainty of the data, average per-centage deviation, AAD, standard deviation, and the maxi-mum percentage deviation of each data source. Some pointsare extrapolations of the previous IAPWS correlation,27 be-cause they are outside of the recommended range of tem-peratures and densities. We define the percentage deviationas P=100� ��exp−�calc� /�exp, where �exp is the experimen-tal value of the viscosity, and �calc is the value calculatedfrom the present correlation, Eq. �2�. The AAD is found withthe expression AAD= ���P�� /n, where the summation is overall n points; the average percentage deviation is AVG= ��P� /n, and the standard deviation is STDEV= ��n�P2
− ��P�2� /n2�1/2. As indicated in Table 9, the results of thenew formulation and the previous IAPWS formulation forthe viscosity27 are in most cases comparable, with significantdifferences observed in only a few cases.
The first region where there are differences in the perfor-mance of the previous IAPWS formulation for the viscosity27
and this work is in the low-density gas phase, especially atdensities below 0.25 kg m−3 and temperatures below 400 K.This is illustrated in Figs. 12–15. As pointed out by Teske etal.,36 the previous IAPWS formulation for the viscosity27 didnot include the data set of Yasumoto77 in the analysis, andthe recent data of Teske et al.36 were not available at thetime, thus leaving room for improvement in this region. Thepresent correlation was developed with both of these datasets and offers significant improvement in the representationof the data in this region. The availability of new dilute-gasdata also allowed for some improvement in the representa-tion of the initial-density viscosity coefficient ��1�; this isshown in Fig. 16. The experimental values obtained by the
procedure discussed in Sec. 3.1 are shown in Fig. 16 alongwith the previous IAPWS correlation, the present work, andthe correlation of Teske et al.36
In both the correlation of Teske et al.36 and in the presentcorrelation, ��1� approaches zero in the high-temperaturelimit; the previous IAPWS formulation for the viscosity27
incorrectly yields ��1� diverging to negative infinity.It also is interesting to compare the high-temperature ex-
trapolation behavior of the present equation with other for-mulations for the viscosity of water substance in the limit ofzero density, such as the previous IAPWS formulation for theviscosity,27 the equation proposed by Alexandrov et al.,159
and the recent formulation of Quiñones-Cisneros andDeiters.160 The correlation of Teske et al.36 is not consideredhere since it is for use in the temperature range 273–1350 Kand was not intended for extrapolation. Figure 17 displaysthe zero-density viscosity from 255 to 2500 K. The empiri-cal equations presented in this work and in the work ofQuiñones-Cisneros and Deiters160 are in close agreement�and are indistinguishable in Fig. 17� and both agree with thehigh-temperature recommended values of Fokin andKalashnikov161 to within the estimated uncertainty of the val-ues. However, very recently new calculations have becomeavailable162 based on the potential hypersurface of Bukowskiet al.163 that show somewhat lower viscosities. In the ab-sence of experimental data, we recognize that there is sig-nificant uncertainty in the very-high-temperature extrapola-tion behavior of the correlation.
A second region where differences between the perfor-mance of previous IAPWS formulation for the viscosity27
and the present correlation are observed is in the liquid phaseat low temperatures and elevated pressures, as shown in Figs.18 and 19. The previous IAPWS formulation for theviscosity27 shows significant deviations in this region, espe-cially for the data of Harris and Woolf,31,32 Harlow,39,66 andIsdale and Spence.41 When the correlation of Watson et al.19
was formulated, data at high pressures were not incorporatedinto the development of the equation, and the range of valid-ity for temperatures less than 150 °C extended only to500 MPa. In this work, we included data up to 1 GPa in ouranalysis, allowing an improvement over the previous formu-lation in this region, as shown in Fig. 19. We note here thatwe became aware of new measurements at very highpressures,44,45 up to 25 GPa, after the development of ourequation, and comparisons indicate that the present work isnot applicable to pressures above 1 GPa. Future work on thisregion is needed.
The viscosity of liquid water at ambient conditions is ofsignificant interest. The ISO �Ref. 124� has published recom-mended values for the viscosity of liquid water at referencetemperatures from 15 to 40 °C. Figures 20 and 21 showcomparisons of the two formulations for water at atmo-spheric pressure. ISO �Ref. 124� gives an estimated relativeuncertainty for the viscosity of water at 20 °C and0.101 325 MPa �1.0016 mPa s� of 0.17%. Both the previousIAPWS formulation for the viscosity27 and the present cor-relation represent the reference value to within this uncer-
VISCOSITY OF H2O 117
J. Phys. Chem. Ref. Data, Vol. 38, No. 2, 2009 This article is copyrighted as indicated in the article. Reuse of AIP content is subject to the terms at: http://scitation.aip.org/termsconditions. Downloaded to IP:
155.207.48.196 On: Thu, 12 Feb 2015 08:51:57
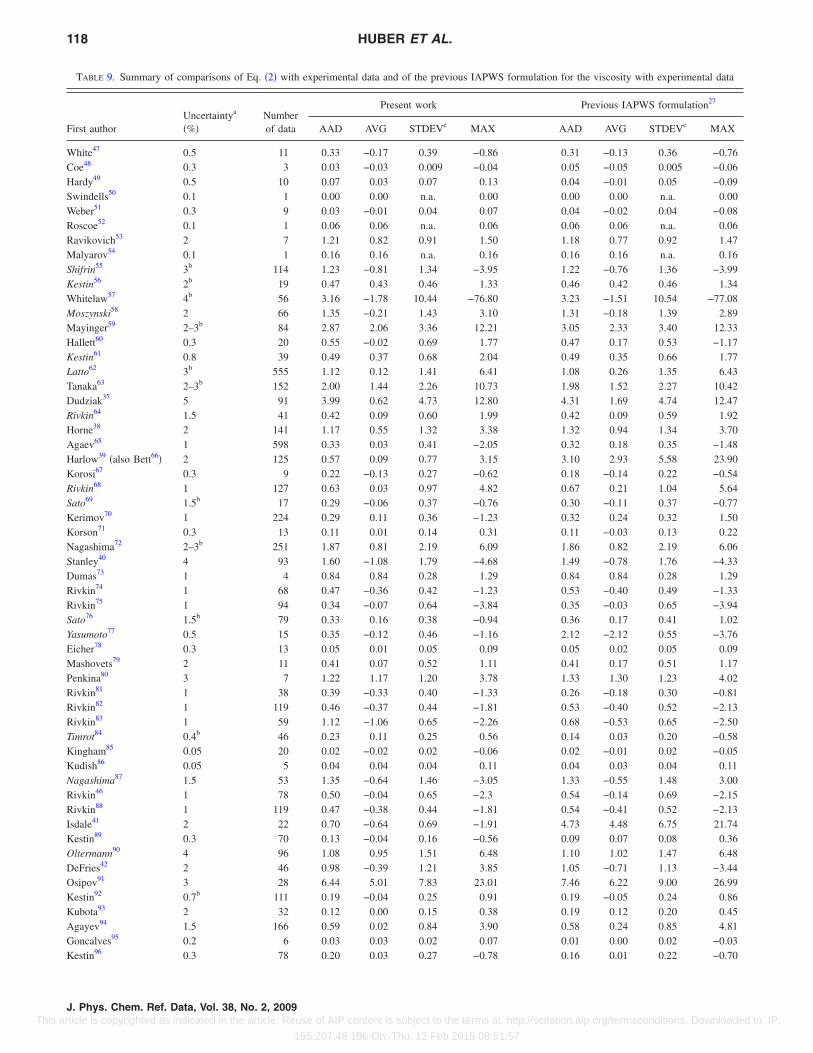
TABLE 9. Summary of comparisons of Eq. �2� with experimental data and of the previous IAPWS formulation for the viscosity with experimental data
First authorUncertaintya
�%�Numberof data
Present work Previous IAPWS formulation27
AAD AVG STDEVc MAX AAD AVG STDEVc MAX
White47 0.5 11 0.33 −0.17 0.39 −0.86 0.31 −0.13 0.36 −0.76Coe48 0.3 3 0.03 −0.03 0.009 −0.04 0.05 −0.05 0.005 −0.06Hardy49 0.5 10 0.07 0.03 0.07 0.13 0.04 −0.01 0.05 −0.09Swindells50 0.1 1 0.00 0.00 n.a. 0.00 0.00 0.00 n.a. 0.00Weber51 0.3 9 0.03 −0.01 0.04 0.07 0.04 −0.02 0.04 −0.08Roscoe52 0.1 1 0.06 0.06 n.a. 0.06 0.06 0.06 n.a. 0.06Ravikovich53 2 7 1.21 0.82 0.91 1.50 1.18 0.77 0.92 1.47Malyarov54 0.1 1 0.16 0.16 n.a. 0.16 0.16 0.16 n.a. 0.16Shifrin55 3b 114 1.23 −0.81 1.34 −3.95 1.22 −0.76 1.36 −3.99Kestin56 2b 19 0.47 0.43 0.46 1.33 0.46 0.42 0.46 1.34Whitelaw57 4b 56 3.16 −1.78 10.44 −76.80 3.23 −1.51 10.54 −77.08Moszynski58 2 66 1.35 −0.21 1.43 3.10 1.31 −0.18 1.39 2.89Mayinger59 2–3b 84 2.87 2.06 3.36 12.21 3.05 2.33 3.40 12.33Hallett60 0.3 20 0.55 −0.02 0.69 1.77 0.47 0.17 0.53 −1.17Kestin61 0.8 39 0.49 0.37 0.68 2.04 0.49 0.35 0.66 1.77Latto62 3b 555 1.12 0.12 1.41 6.41 1.08 0.26 1.35 6.43Tanaka63 2–3b 152 2.00 1.44 2.26 10.73 1.98 1.52 2.27 10.42Dudziak37 5 91 3.99 0.62 4.73 12.80 4.31 1.69 4.74 12.47Rivkin64 1.5 41 0.42 0.09 0.60 1.99 0.42 0.09 0.59 1.92Horne38 2 141 1.17 0.55 1.32 3.38 1.32 0.94 1.34 3.70Agaev65 1 598 0.33 0.03 0.41 −2.05 0.32 0.18 0.35 −1.48Harlow39 �also Bett66� 2 125 0.57 0.09 0.77 3.15 3.10 2.93 5.58 23.90Korosi67 0.3 9 0.22 −0.13 0.27 −0.62 0.18 −0.14 0.22 −0.54Rivkin68 1 127 0.63 0.03 0.97 4.82 0.67 0.21 1.04 5.64Sato69 1.5b 17 0.29 −0.06 0.37 −0.76 0.30 −0.11 0.37 −0.77Kerimov70 1 224 0.29 0.11 0.36 −1.23 0.32 0.24 0.32 1.50Korson71 0.3 13 0.11 0.01 0.14 0.31 0.11 −0.03 0.13 0.22Nagashima72 2–3b 251 1.87 0.81 2.19 6.09 1.86 0.82 2.19 6.06Stanley40 4 93 1.60 −1.08 1.79 −4.68 1.49 −0.78 1.76 −4.33Dumas73 1 4 0.84 0.84 0.28 1.29 0.84 0.84 0.28 1.29Rivkin74 1 68 0.47 −0.36 0.42 −1.23 0.53 −0.40 0.49 −1.33Rivkin75 1 94 0.34 −0.07 0.64 −3.84 0.35 −0.03 0.65 −3.94Sato76 1.5b 79 0.33 0.16 0.38 −0.94 0.36 0.17 0.41 1.02Yasumoto77 0.5 15 0.35 −0.12 0.46 −1.16 2.12 −2.12 0.55 −3.76Eicher78 0.3 13 0.05 0.01 0.05 0.09 0.05 0.02 0.05 0.09Mashovets79 2 11 0.41 0.07 0.52 1.11 0.41 0.17 0.51 1.17Penkina80 3 7 1.22 1.17 1.20 3.78 1.33 1.30 1.23 4.02Rivkin81 1 38 0.39 −0.33 0.40 −1.33 0.26 −0.18 0.30 −0.81Rivkin82 1 119 0.46 −0.37 0.44 −1.81 0.53 −0.40 0.52 −2.13Rivkin83 1 59 1.12 −1.06 0.65 −2.26 0.68 −0.53 0.65 −2.50Timrot84 0.4b 46 0.23 0.11 0.25 0.56 0.14 0.03 0.20 −0.58Kingham85 0.05 20 0.02 −0.02 0.02 −0.06 0.02 −0.01 0.02 −0.05Kudish86 0.05 5 0.04 0.04 0.04 0.11 0.04 0.03 0.04 0.11Nagashima87 1.5 53 1.35 −0.64 1.46 −3.05 1.33 −0.55 1.48 3.00Rivkin46 1 78 0.50 −0.04 0.65 −2.3 0.54 −0.14 0.69 −2.15Rivkin88 1 119 0.47 −0.38 0.44 −1.81 0.54 −0.41 0.52 −2.13Isdale41 2 22 0.70 −0.64 0.69 −1.91 4.73 4.48 6.75 21.74Kestin89 0.3 70 0.13 −0.04 0.16 −0.56 0.09 0.07 0.08 0.36Oltermann90 4 96 1.08 0.95 1.51 6.48 1.10 1.02 1.47 6.48DeFries42 2 46 0.98 −0.39 1.21 3.85 1.05 −0.71 1.13 −3.44Osipov91 3 28 6.44 5.01 7.83 23.01 7.46 6.22 9.00 26.99Kestin92 0.7b 111 0.19 −0.04 0.25 0.91 0.19 −0.05 0.24 0.86Kubota93 2 32 0.12 0.00 0.15 0.38 0.19 0.12 0.20 0.45Agayev94 1.5 166 0.59 0.02 0.84 3.90 0.58 0.24 0.85 4.81Goncalves95 0.2 6 0.03 0.03 0.02 0.07 0.01 0.00 0.02 −0.03Kestin96 0.3 78 0.20 0.03 0.27 −0.78 0.16 0.01 0.22 −0.70
118 HUBER ET AL.
J. Phys. Chem. Ref. Data, Vol. 38, No. 2, 2009 This article is copyrighted as indicated in the article. Reuse of AIP content is subject to the terms at: http://scitation.aip.org/termsconditions. Downloaded to IP:
155.207.48.196 On: Thu, 12 Feb 2015 08:51:57
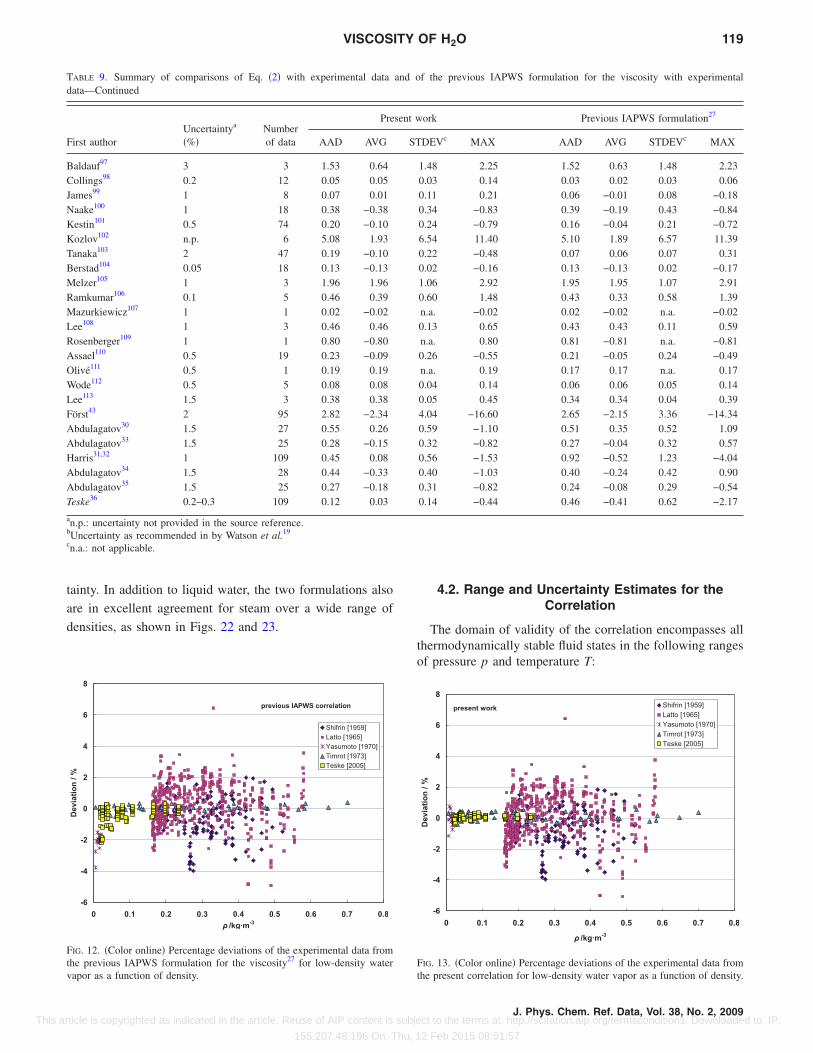
tainty. In addition to liquid water, the two formulations also
are in excellent agreement for steam over a wide range of
densities, as shown in Figs. 22 and 23.
4.2. Range and Uncertainty Estimates for theCorrelation
The domain of validity of the correlation encompasses allthermodynamically stable fluid states in the following rangesof pressure p and temperature T:
TABLE 9. Summary of comparisons of Eq. �2� with experimental data and of the previous IAPWS formulation for the viscosity with experimentaldata—Continued
First authorUncertaintya
�%�Numberof data
Present work Previous IAPWS formulation27
AAD AVG STDEVc MAX AAD AVG STDEVc MAX
Baldauf97 3 3 1.53 0.64 1.48 2.25 1.52 0.63 1.48 2.23Collings98 0.2 12 0.05 0.05 0.03 0.14 0.03 0.02 0.03 0.06James99 1 8 0.07 0.01 0.11 0.21 0.06 −0.01 0.08 −0.18Naake100 1 18 0.38 −0.38 0.34 −0.83 0.39 −0.19 0.43 −0.84Kestin101 0.5 74 0.20 −0.10 0.24 −0.79 0.16 −0.04 0.21 −0.72Kozlov102 n.p. 6 5.08 1.93 6.54 11.40 5.10 1.89 6.57 11.39Tanaka103 2 47 0.19 −0.10 0.22 −0.48 0.07 0.06 0.07 0.31Berstad104 0.05 18 0.13 −0.13 0.02 −0.16 0.13 −0.13 0.02 −0.17Melzer105 1 3 1.96 1.96 1.06 2.92 1.95 1.95 1.07 2.91Ramkumar106 0.1 5 0.46 0.39 0.60 1.48 0.43 0.33 0.58 1.39Mazurkiewicz107 1 1 0.02 −0.02 n.a. −0.02 0.02 −0.02 n.a. −0.02Lee108 1 3 0.46 0.46 0.13 0.65 0.43 0.43 0.11 0.59Rosenberger109 1 1 0.80 −0.80 n.a. 0.80 0.81 −0.81 n.a. −0.81Assael110 0.5 19 0.23 −0.09 0.26 −0.55 0.21 −0.05 0.24 −0.49Olivé111 0.5 1 0.19 0.19 n.a. 0.19 0.17 0.17 n.a. 0.17Wode112 0.5 5 0.08 0.08 0.04 0.14 0.06 0.06 0.05 0.14Lee113 1.5 3 0.38 0.38 0.05 0.45 0.34 0.34 0.04 0.39Först43 2 95 2.82 −2.34 4.04 −16.60 2.65 −2.15 3.36 −14.34Abdulagatov30 1.5 27 0.55 0.26 0.59 −1.10 0.51 0.35 0.52 1.09Abdulagatov33 1.5 25 0.28 −0.15 0.32 −0.82 0.27 −0.04 0.32 0.57Harris31,32 1 109 0.45 0.08 0.56 −1.53 0.92 −0.52 1.23 −4.04Abdulagatov34 1.5 28 0.44 −0.33 0.40 −1.03 0.40 −0.24 0.42 0.90Abdulagatov35 1.5 25 0.27 −0.18 0.31 −0.82 0.24 −0.08 0.29 −0.54Teske36 0.2–0.3 109 0.12 0.03 0.14 −0.44 0.46 −0.41 0.62 −2.17
an.p.: uncertainty not provided in the source reference.bUncertainty as recommended in by Watson et al.19
cn.a.: not applicable.
previous IAPWS correlation
-6
-4
-2
0
2
4
6
8
0 0.1 0.2 0.3 0.4 0.5 0.6 0.7 0.8ρ /kg·m-3
Deviation/%
Shifrin [1959]Latto [1965]Yasumoto [1970]Timrot [1973]Teske [2005]
FIG. 12. �Color online� Percentage deviations of the experimental data fromthe previous IAPWS formulation for the viscosity27 for low-density watervapor as a function of density.
present work
-6
-4
-2
0
2
4
6
8
0 0.1 0.2 0.3 0.4 0.5 0.6 0.7 0.8
ρ /kg·m-3
Deviation/%
Shifrin [1959]Latto [1965]Yasumoto [1970]Timrot [1973]Teske [2005]
FIG. 13. �Color online� Percentage deviations of the experimental data fromthe present correlation for low-density water vapor as a function of density.
VISCOSITY OF H2O 119
J. Phys. Chem. Ref. Data, Vol. 38, No. 2, 2009 This article is copyrighted as indicated in the article. Reuse of AIP content is subject to the terms at: http://scitation.aip.org/termsconditions. Downloaded to IP:
155.207.48.196 On: Thu, 12 Feb 2015 08:51:57
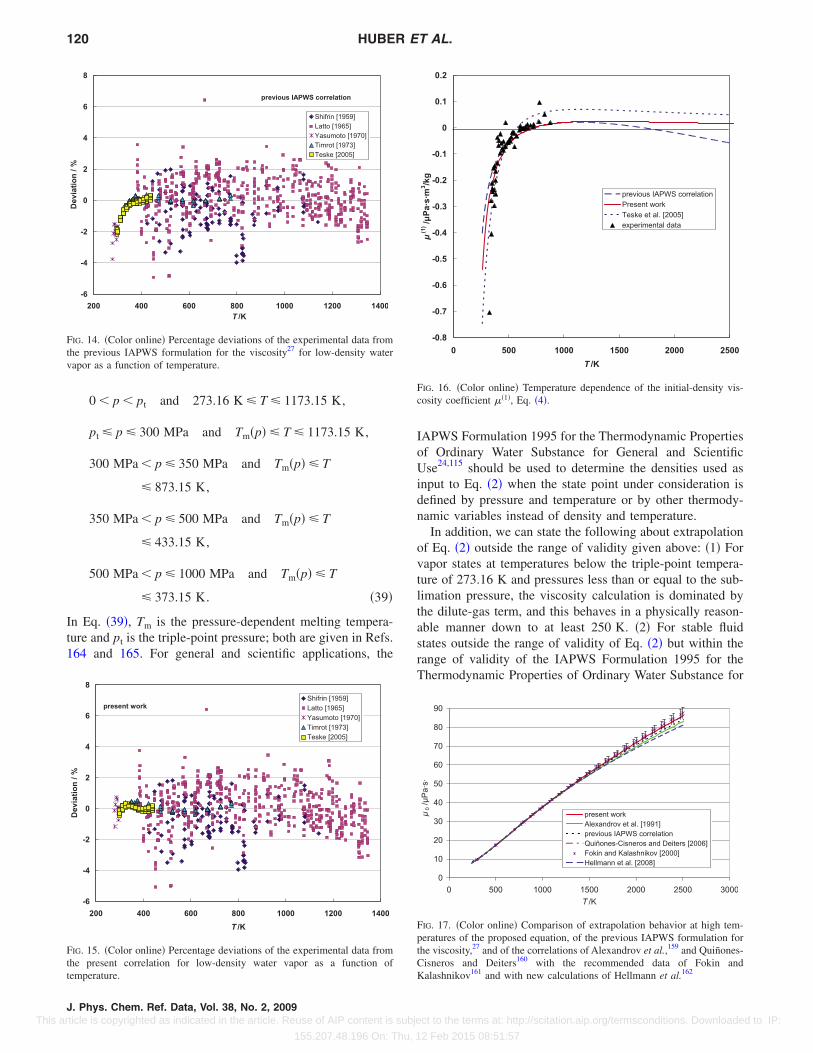
0 � p � pt and 273.16 K T 1173.15 K,
pt p 300 MPa and Tm�p� T 1173.15 K,
300 MPa � p 350 MPa and Tm�p� T
873.15 K,
350 MPa � p 500 MPa and Tm�p� T
433.15 K,
500 MPa � p 1000 MPa and Tm�p� T
373.15 K. �39�
In Eq. �39�, Tm is the pressure-dependent melting tempera-ture and pt is the triple-point pressure; both are given in Refs.164 and 165. For general and scientific applications, the
IAPWS Formulation 1995 for the Thermodynamic Propertiesof Ordinary Water Substance for General and ScientificUse24,115 should be used to determine the densities used asinput to Eq. �2� when the state point under consideration isdefined by pressure and temperature or by other thermody-namic variables instead of density and temperature.
In addition, we can state the following about extrapolationof Eq. �2� outside the range of validity given above: �1� Forvapor states at temperatures below the triple-point tempera-ture of 273.16 K and pressures less than or equal to the sub-limation pressure, the viscosity calculation is dominated bythe dilute-gas term, and this behaves in a physically reason-able manner down to at least 250 K. �2� For stable fluidstates outside the range of validity of Eq. �2� but within therange of validity of the IAPWS Formulation 1995 for theThermodynamic Properties of Ordinary Water Substance for
previous IAPWS correlation
-6
-4
-2
0
2
4
6
8
200 400 600 800 1000 1200 1400T /K
Deviation/%
Shifrin [1959]Latto [1965]Yasumoto [1970]Timrot [1973]Teske [2005]
FIG. 14. �Color online� Percentage deviations of the experimental data fromthe previous IAPWS formulation for the viscosity27 for low-density watervapor as a function of temperature.
present work
-6
-4
-2
0
2
4
6
8
200 400 600 800 1000 1200 1400T /K
Deviation/%
Shifrin [1959]Latto [1965]Yasumoto [1970]Timrot [1973]Teske [2005]
FIG. 15. �Color online� Percentage deviations of the experimental data fromthe present correlation for low-density water vapor as a function oftemperature.
-0.8
-0.7
-0.6
-0.5
-0.4
-0.3
-0.2
-0.1
0
0.1
0.2
0 500 1000 1500 2000 2500T /K
μ(1)/μPa·s·m
3 /kg
previous IAPWS correlationPresent workTeske et al. [2005]experimental data
FIG. 16. �Color online� Temperature dependence of the initial-density vis-cosity coefficient ��1�, Eq. �4�.
0
10
20
30
40
50
60
70
80
90
0 500 1000 1500 2000 2500 3000T /K
μ0/μPa·s·
present workAlexandrov et al. [1991]previous IAPWS correlationQuiñones-Cisneros and Deiters [2006]Fokin and Kalashnikov [2000]Hellmann et al. [2008]
FIG. 17. �Color online� Comparison of extrapolation behavior at high tem-peratures of the proposed equation, of the previous IAPWS formulation forthe viscosity,27 and of the correlations of Alexandrov et al.,159 and Quiñones-Cisneros and Deiters160 with the recommended data of Fokin andKalashnikov161 and with new calculations of Hellmann et al.162
120 HUBER ET AL.
J. Phys. Chem. Ref. Data, Vol. 38, No. 2, 2009 This article is copyrighted as indicated in the article. Reuse of AIP content is subject to the terms at: http://scitation.aip.org/termsconditions. Downloaded to IP:
155.207.48.196 On: Thu, 12 Feb 2015 08:51:57
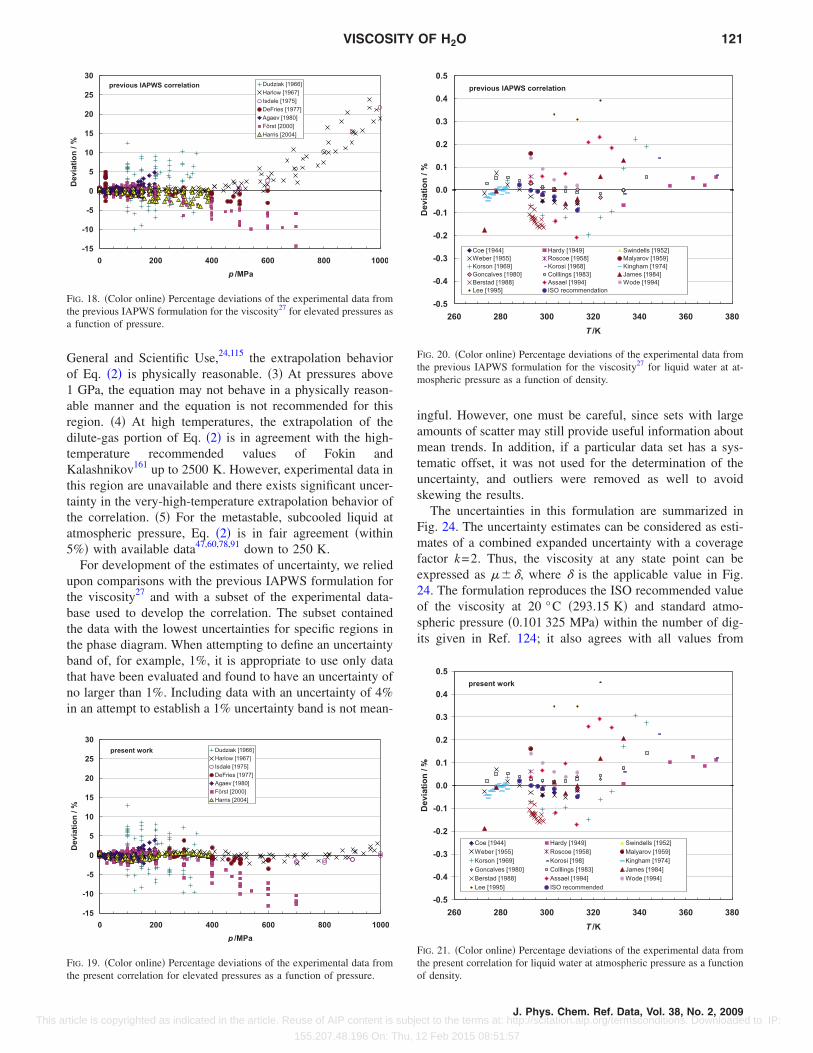
General and Scientific Use,24,115 the extrapolation behaviorof Eq. �2� is physically reasonable. �3� At pressures above1 GPa, the equation may not behave in a physically reason-able manner and the equation is not recommended for thisregion. �4� At high temperatures, the extrapolation of thedilute-gas portion of Eq. �2� is in agreement with the high-temperature recommended values of Fokin andKalashnikov161 up to 2500 K. However, experimental data inthis region are unavailable and there exists significant uncer-tainty in the very-high-temperature extrapolation behavior ofthe correlation. �5� For the metastable, subcooled liquid atatmospheric pressure, Eq. �2� is in fair agreement �within5%� with available data47,60,78,91 down to 250 K.
For development of the estimates of uncertainty, we reliedupon comparisons with the previous IAPWS formulation forthe viscosity27 and with a subset of the experimental data-base used to develop the correlation. The subset containedthe data with the lowest uncertainties for specific regions inthe phase diagram. When attempting to define an uncertaintyband of, for example, 1%, it is appropriate to use only datathat have been evaluated and found to have an uncertainty ofno larger than 1%. Including data with an uncertainty of 4%in an attempt to establish a 1% uncertainty band is not mean-
ingful. However, one must be careful, since sets with largeamounts of scatter may still provide useful information aboutmean trends. In addition, if a particular data set has a sys-tematic offset, it was not used for the determination of theuncertainty, and outliers were removed as well to avoidskewing the results.
The uncertainties in this formulation are summarized inFig. 24. The uncertainty estimates can be considered as esti-mates of a combined expanded uncertainty with a coveragefactor k=2. Thus, the viscosity at any state point can beexpressed as ���, where � is the applicable value in Fig.24. The formulation reproduces the ISO recommended valueof the viscosity at 20 °C �293.15 K� and standard atmo-spheric pressure �0.101 325 MPa� within the number of dig-its given in Ref. 124; it also agrees with all values from
present work
-15
-10
-5
0
5
10
15
20
25
30
0 200 400 600 800 1000p /MPa
Deviation/%
Dudziak [1966]Harlow [1967]Isdale [1975]DeFries [1977]Agaev [1980]Först [2000]Harris [2004]
FIG. 19. �Color online� Percentage deviations of the experimental data fromthe present correlation for elevated pressures as a function of pressure.
previous IAPWS correlation
-0.5
-0.4
-0.3
-0.2
-0.1
0.0
0.1
0.2
0.3
0.4
0.5
260 280 300 320 340 360 380T /K
Deviation/%
Coe [1944] Hardy [1949] Swindells [1952]Weber [1955] Roscoe [1958] Malyarov [1959]Korson [1969] Korosi [1968] Kingham [1974]Goncalves [1980] Colllings [1983] James [1984]Berstad [1988] Assael [1994] Wode [1994]Lee [1995] ISO recommendation
FIG. 20. �Color online� Percentage deviations of the experimental data fromthe previous IAPWS formulation for the viscosity27 for liquid water at at-mospheric pressure as a function of density.
present work
-0.5
-0.4
-0.3
-0.2
-0.1
0.0
0.1
0.2
0.3
0.4
0.5
260 280 300 320 340 360 380T /K
Deviation/%
Coe [1944] Hardy [1949] Swindells [1952]Weber [1955] Roscoe [1958] Malyarov [1959]Korson [1969] Korosi [198] Kingham [1974]Goncalves [1980] Colllings [1983] James [1984]Berstad [1988] Assael [1994] Wode [1994]Lee [1995] ISO recommended
FIG. 21. �Color online� Percentage deviations of the experimental data fromthe present correlation for liquid water at atmospheric pressure as a functionof density.
previous IAPWS correlation
-15
-10
-5
0
5
10
15
20
25
30
0 200 400 600 800 1000p /MPa
Deviation/%
Dudziak [1966]Harlow [1967]Isdale [1975]DeFries [1977]Agaev [1980]Först [2000]Harris [2004]
FIG. 18. �Color online� Percentage deviations of the experimental data fromthe previous IAPWS formulation for the viscosity27 for elevated pressures asa function of pressure.
VISCOSITY OF H2O 121
J. Phys. Chem. Ref. Data, Vol. 38, No. 2, 2009 This article is copyrighted as indicated in the article. Reuse of AIP content is subject to the terms at: http://scitation.aip.org/termsconditions. Downloaded to IP:
155.207.48.196 On: Thu, 12 Feb 2015 08:51:57
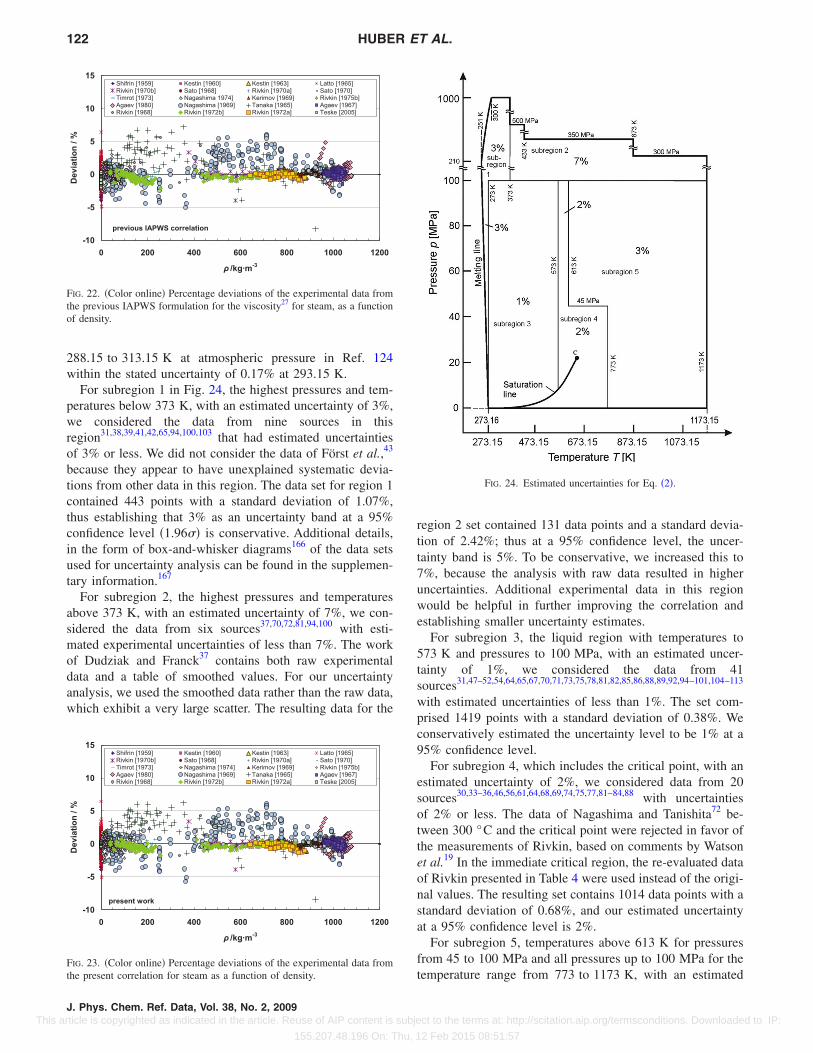
288.15 to 313.15 K at atmospheric pressure in Ref. 124within the stated uncertainty of 0.17% at 293.15 K.
For subregion 1 in Fig. 24, the highest pressures and tem-peratures below 373 K, with an estimated uncertainty of 3%,we considered the data from nine sources in thisregion31,38,39,41,42,65,94,100,103 that had estimated uncertaintiesof 3% or less. We did not consider the data of Först et al.,43
because they appear to have unexplained systematic devia-tions from other data in this region. The data set for region 1contained 443 points with a standard deviation of 1.07%,thus establishing that 3% as an uncertainty band at a 95%confidence level �1.96� is conservative. Additional details,in the form of box-and-whisker diagrams166 of the data setsused for uncertainty analysis can be found in the supplemen-tary information.167
For subregion 2, the highest pressures and temperaturesabove 373 K, with an estimated uncertainty of 7%, we con-sidered the data from six sources37,70,72,81,94,100 with esti-mated experimental uncertainties of less than 7%. The workof Dudziak and Franck37 contains both raw experimentaldata and a table of smoothed values. For our uncertaintyanalysis, we used the smoothed data rather than the raw data,which exhibit a very large scatter. The resulting data for the
region 2 set contained 131 data points and a standard devia-tion of 2.42%; thus at a 95% confidence level, the uncer-tainty band is 5%. To be conservative, we increased this to7%, because the analysis with raw data resulted in higheruncertainties. Additional experimental data in this regionwould be helpful in further improving the correlation andestablishing smaller uncertainty estimates.
For subregion 3, the liquid region with temperatures to573 K and pressures to 100 MPa, with an estimated uncer-tainty of 1%, we considered the data from 41sources31,47–52,54,64,65,67,70,71,73,75,78,81,82,85,86,88,89,92,94–101,104–113
with estimated uncertainties of less than 1%. The set com-prised 1419 points with a standard deviation of 0.38%. Weconservatively estimated the uncertainty level to be 1% at a95% confidence level.
For subregion 4, which includes the critical point, with anestimated uncertainty of 2%, we considered data from 20sources30,33–36,46,56,61,64,68,69,74,75,77,81–84,88 with uncertaintiesof 2% or less. The data of Nagashima and Tanishita72 be-tween 300 °C and the critical point were rejected in favor ofthe measurements of Rivkin, based on comments by Watsonet al.19 In the immediate critical region, the re-evaluated dataof Rivkin presented in Table 4 were used instead of the origi-nal values. The resulting set contains 1014 data points with astandard deviation of 0.68%, and our estimated uncertaintyat a 95% confidence level is 2%.
For subregion 5, temperatures above 613 K for pressuresfrom 45 to 100 MPa and all pressures up to 100 MPa for thetemperature range from 773 to 1173 K, with an estimated
previous IAPWS correlation
-10
-5
0
5
10
15
0 200 400 600 800 1000 1200
ρ /kg·m-3
Deviation/%
Shifrin [1959] Kestin [1960] Kestin [1963] Latto [1965]Rivkin [1970b] Sato [1968] Rivkin [1970a] Sato [1970]Timrot [1973] Nagashima 1974] Kerimov [1969] Rivkin [1975b]Agaev [1980] Nagashima [1969] Tanaka [1965] Agaev [1967]Rivkin [1968] Rivkin [1972b] Rivkin [1972a] Teske [2005]
FIG. 22. �Color online� Percentage deviations of the experimental data fromthe previous IAPWS formulation for the viscosity27 for steam, as a functionof density.
present work-10
-5
0
5
10
15
0 200 400 600 800 1000 1200
ρ /kg·m-3
Deviation/%
Shifrin [1959] Kestin [1960] Kestin [1963] Latto [1965]Rivkin [1970b] Sato [1968] Rivkin [1970a] Sato [1970]Timrot [1973] Nagashima [1974] Kerimov [1969] Rivkin [1975b]Agaev [1980] Nagashima [1969] Tanaka [1965] Agaev [1967]Rivkin [1968] Rivkin [1972b] Rivkin [1972a] Teske [2005]
FIG. 23. �Color online� Percentage deviations of the experimental data fromthe present correlation for steam as a function of density.
FIG. 24. Estimated uncertainties for Eq. �2�.
122 HUBER ET AL.
J. Phys. Chem. Ref. Data, Vol. 38, No. 2, 2009 This article is copyrighted as indicated in the article. Reuse of AIP content is subject to the terms at: http://scitation.aip.org/termsconditions. Downloaded to IP:
155.207.48.196 On: Thu, 12 Feb 2015 08:51:57
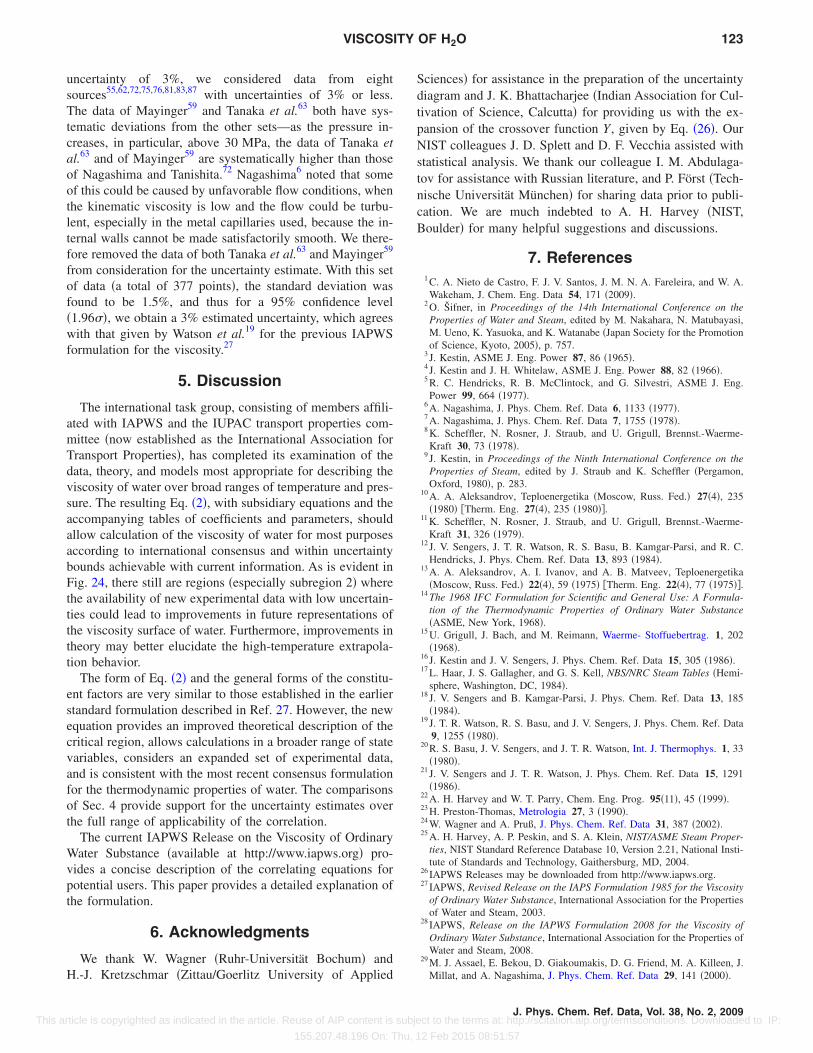
uncertainty of 3%, we considered data from eightsources55,62,72,75,76,81,83,87 with uncertainties of 3% or less.The data of Mayinger59 and Tanaka et al.63 both have sys-tematic deviations from the other sets—as the pressure in-creases, in particular, above 30 MPa, the data of Tanaka etal.63 and of Mayinger59 are systematically higher than thoseof Nagashima and Tanishita.72 Nagashima6 noted that someof this could be caused by unfavorable flow conditions, whenthe kinematic viscosity is low and the flow could be turbu-lent, especially in the metal capillaries used, because the in-ternal walls cannot be made satisfactorily smooth. We there-fore removed the data of both Tanaka et al.63 and Mayinger59
from consideration for the uncertainty estimate. With this setof data �a total of 377 points�, the standard deviation wasfound to be 1.5%, and thus for a 95% confidence level�1.96�, we obtain a 3% estimated uncertainty, which agreeswith that given by Watson et al.19 for the previous IAPWSformulation for the viscosity.27
5. Discussion
The international task group, consisting of members affili-ated with IAPWS and the IUPAC transport properties com-mittee �now established as the International Association forTransport Properties�, has completed its examination of thedata, theory, and models most appropriate for describing theviscosity of water over broad ranges of temperature and pres-sure. The resulting Eq. �2�, with subsidiary equations and theaccompanying tables of coefficients and parameters, shouldallow calculation of the viscosity of water for most purposesaccording to international consensus and within uncertaintybounds achievable with current information. As is evident inFig. 24, there still are regions �especially subregion 2� wherethe availability of new experimental data with low uncertain-ties could lead to improvements in future representations ofthe viscosity surface of water. Furthermore, improvements intheory may better elucidate the high-temperature extrapola-tion behavior.
The form of Eq. �2� and the general forms of the constitu-ent factors are very similar to those established in the earlierstandard formulation described in Ref. 27. However, the newequation provides an improved theoretical description of thecritical region, allows calculations in a broader range of statevariables, considers an expanded set of experimental data,and is consistent with the most recent consensus formulationfor the thermodynamic properties of water. The comparisonsof Sec. 4 provide support for the uncertainty estimates overthe full range of applicability of the correlation.
The current IAPWS Release on the Viscosity of OrdinaryWater Substance �available at http://www.iapws.org� pro-vides a concise description of the correlating equations forpotential users. This paper provides a detailed explanation ofthe formulation.
6. Acknowledgments
We thank W. Wagner �Ruhr-Universität Bochum� andH.-J. Kretzschmar �Zittau/Goerlitz University of Applied
Sciences� for assistance in the preparation of the uncertaintydiagram and J. K. Bhattacharjee �Indian Association for Cul-tivation of Science, Calcutta� for providing us with the ex-pansion of the crossover function Y, given by Eq. �26�. OurNIST colleagues J. D. Splett and D. F. Vecchia assisted withstatistical analysis. We thank our colleague I. M. Abdulaga-tov for assistance with Russian literature, and P. Först �Tech-nische Universität München� for sharing data prior to publi-cation. We are much indebted to A. H. Harvey �NIST,Boulder� for many helpful suggestions and discussions.
7. References1 C. A. Nieto de Castro, F. J. V. Santos, J. M. N. A. Fareleira, and W. A.Wakeham, J. Chem. Eng. Data 54, 171 �2009�.
2 O. Šifner, in Proceedings of the 14th International Conference on theProperties of Water and Steam, edited by M. Nakahara, N. Matubayasi,M. Ueno, K. Yasuoka, and K. Watanabe �Japan Society for the Promotionof Science, Kyoto, 2005�, p. 757.
3 J. Kestin, ASME J. Eng. Power 87, 86 �1965�.4 J. Kestin and J. H. Whitelaw, ASME J. Eng. Power 88, 82 �1966�.5 R. C. Hendricks, R. B. McClintock, and G. Silvestri, ASME J. Eng.Power 99, 664 �1977�.
6 A. Nagashima, J. Phys. Chem. Ref. Data 6, 1133 �1977�.7 A. Nagashima, J. Phys. Chem. Ref. Data 7, 1755 �1978�.8 K. Scheffler, N. Rosner, J. Straub, and U. Grigull, Brennst.-Waerme-Kraft 30, 73 �1978�.
9 J. Kestin, in Proceedings of the Ninth International Conference on theProperties of Steam, edited by J. Straub and K. Scheffler �Pergamon,Oxford, 1980�, p. 283.
10 A. A. Aleksandrov, Teploenergetika �Moscow, Russ. Fed.� 27�4�, 235�1980� �Therm. Eng. 27�4�, 235 �1980��.
11 K. Scheffler, N. Rosner, J. Straub, and U. Grigull, Brennst.-Waerme-Kraft 31, 326 �1979�.
12 J. V. Sengers, J. T. R. Watson, R. S. Basu, B. Kamgar-Parsi, and R. C.Hendricks, J. Phys. Chem. Ref. Data 13, 893 �1984�.
13 A. A. Aleksandrov, A. I. Ivanov, and A. B. Matveev, Teploenergetika�Moscow, Russ. Fed.� 22�4�, 59 �1975� �Therm. Eng. 22�4�, 77 �1975��.
14 The 1968 IFC Formulation for Scientific and General Use: A Formula-tion of the Thermodynamic Properties of Ordinary Water Substance�ASME, New York, 1968�.
15 U. Grigull, J. Bach, and M. Reimann, Waerme- Stoffuebertrag. 1, 202�1968�.
16 J. Kestin and J. V. Sengers, J. Phys. Chem. Ref. Data 15, 305 �1986�.17 L. Haar, J. S. Gallagher, and G. S. Kell, NBS/NRC Steam Tables �Hemi-
sphere, Washington, DC, 1984�.18 J. V. Sengers and B. Kamgar-Parsi, J. Phys. Chem. Ref. Data 13, 185
�1984�.19 J. T. R. Watson, R. S. Basu, and J. V. Sengers, J. Phys. Chem. Ref. Data
9, 1255 �1980�.20 R. S. Basu, J. V. Sengers, and J. T. R. Watson, Int. J. Thermophys. 1, 33
�1980�.21 J. V. Sengers and J. T. R. Watson, J. Phys. Chem. Ref. Data 15, 1291
�1986�.22 A. H. Harvey and W. T. Parry, Chem. Eng. Prog. 95�11�, 45 �1999�.23 H. Preston-Thomas, Metrologia 27, 3 �1990�.24 W. Wagner and A. Pruß, J. Phys. Chem. Ref. Data 31, 387 �2002�.25 A. H. Harvey, A. P. Peskin, and S. A. Klein, NIST/ASME Steam Proper-
ties, NIST Standard Reference Database 10, Version 2.21, National Insti-tute of Standards and Technology, Gaithersburg, MD, 2004.
26 IAPWS Releases may be downloaded from http://www.iapws.org.27 IAPWS, Revised Release on the IAPS Formulation 1985 for the Viscosity
of Ordinary Water Substance, International Association for the Propertiesof Water and Steam, 2003.
28 IAPWS, Release on the IAPWS Formulation 2008 for the Viscosity ofOrdinary Water Substance, International Association for the Properties ofWater and Steam, 2008.
29 M. J. Assael, E. Bekou, D. Giakoumakis, D. G. Friend, M. A. Killeen, J.Millat, and A. Nagashima, J. Phys. Chem. Ref. Data 29, 141 �2000�.
VISCOSITY OF H2O 123
J. Phys. Chem. Ref. Data, Vol. 38, No. 2, 2009 This article is copyrighted as indicated in the article. Reuse of AIP content is subject to the terms at: http://scitation.aip.org/termsconditions. Downloaded to IP:
155.207.48.196 On: Thu, 12 Feb 2015 08:51:57
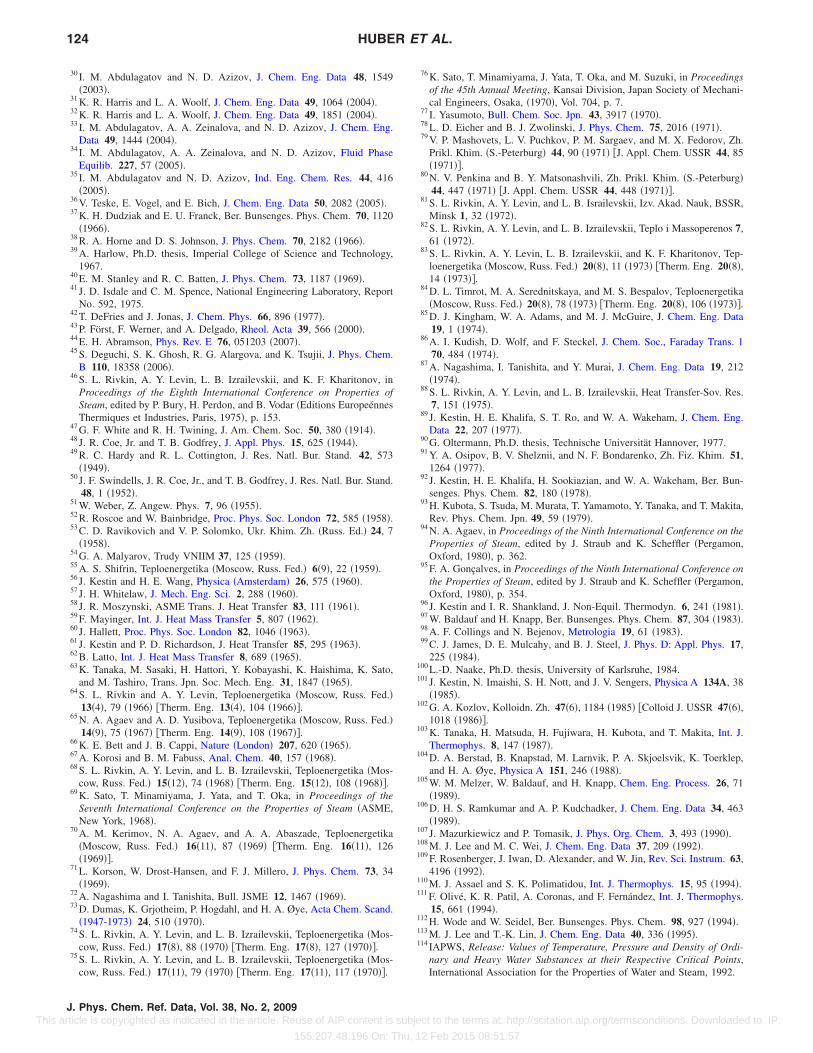
30 I. M. Abdulagatov and N. D. Azizov, J. Chem. Eng. Data 48, 1549�2003�.
31 K. R. Harris and L. A. Woolf, J. Chem. Eng. Data 49, 1064 �2004�.32 K. R. Harris and L. A. Woolf, J. Chem. Eng. Data 49, 1851 �2004�.33 I. M. Abdulagatov, A. A. Zeinalova, and N. D. Azizov, J. Chem. Eng.
Data 49, 1444 �2004�.34 I. M. Abdulagatov, A. A. Zeinalova, and N. D. Azizov, Fluid Phase
Equilib. 227, 57 �2005�.35 I. M. Abdulagatov and N. D. Azizov, Ind. Eng. Chem. Res. 44, 416
�2005�.36 V. Teske, E. Vogel, and E. Bich, J. Chem. Eng. Data 50, 2082 �2005�.37 K. H. Dudziak and E. U. Franck, Ber. Bunsenges. Phys. Chem. 70, 1120
�1966�.38 R. A. Horne and D. S. Johnson, J. Phys. Chem. 70, 2182 �1966�.39 A. Harlow, Ph.D. thesis, Imperial College of Science and Technology,
1967.40 E. M. Stanley and R. C. Batten, J. Phys. Chem. 73, 1187 �1969�.41 J. D. Isdale and C. M. Spence, National Engineering Laboratory, Report
No. 592, 1975.42 T. DeFries and J. Jonas, J. Chem. Phys. 66, 896 �1977�.43 P. Först, F. Werner, and A. Delgado, Rheol. Acta 39, 566 �2000�.44 E. H. Abramson, Phys. Rev. E 76, 051203 �2007�.45 S. Deguchi, S. K. Ghosh, R. G. Alargova, and K. Tsujii, J. Phys. Chem.
B 110, 18358 �2006�.46 S. L. Rivkin, A. Y. Levin, L. B. Izrailevskii, and K. F. Kharitonov, in
Proceedings of the Eighth International Conference on Properties ofSteam, edited by P. Bury, H. Perdon, and B. Vodar �Editions EuropeénnesThermiques et Industries, Paris, 1975�, p. 153.
47 G. F. White and R. H. Twining, J. Am. Chem. Soc. 50, 380 �1914�.48 J. R. Coe, Jr. and T. B. Godfrey, J. Appl. Phys. 15, 625 �1944�.49 R. C. Hardy and R. L. Cottington, J. Res. Natl. Bur. Stand. 42, 573
�1949�.50 J. F. Swindells, J. R. Coe, Jr., and T. B. Godfrey, J. Res. Natl. Bur. Stand.
48, 1 �1952�.51 W. Weber, Z. Angew. Phys. 7, 96 �1955�.52 R. Roscoe and W. Bainbridge, Proc. Phys. Soc. London 72, 585 �1958�.53 C. D. Ravikovich and V. P. Solomko, Ukr. Khim. Zh. �Russ. Ed.� 24, 7
�1958�.54 G. A. Malyarov, Trudy VNIIM 37, 125 �1959�.55 A. S. Shifrin, Teploenergetika �Moscow, Russ. Fed.� 6�9�, 22 �1959�.56 J. Kestin and H. E. Wang, Physica �Amsterdam� 26, 575 �1960�.57 J. H. Whitelaw, J. Mech. Eng. Sci. 2, 288 �1960�.58 J. R. Moszynski, ASME Trans. J. Heat Transfer 83, 111 �1961�.59 F. Mayinger, Int. J. Heat Mass Transfer 5, 807 �1962�.60 J. Hallett, Proc. Phys. Soc. London 82, 1046 �1963�.61 J. Kestin and P. D. Richardson, J. Heat Transfer 85, 295 �1963�.62 B. Latto, Int. J. Heat Mass Transfer 8, 689 �1965�.63 K. Tanaka, M. Sasaki, H. Hattori, Y. Kobayashi, K. Haishima, K. Sato,
and M. Tashiro, Trans. Jpn. Soc. Mech. Eng. 31, 1847 �1965�.64 S. L. Rivkin and A. Y. Levin, Teploenergetika �Moscow, Russ. Fed.�
13�4�, 79 �1966� �Therm. Eng. 13�4�, 104 �1966��.65 N. A. Agaev and A. D. Yusibova, Teploenergetika �Moscow, Russ. Fed.�
14�9�, 75 �1967� �Therm. Eng. 14�9�, 108 �1967��.66 K. E. Bett and J. B. Cappi, Nature �London� 207, 620 �1965�.67 A. Korosi and B. M. Fabuss, Anal. Chem. 40, 157 �1968�.68 S. L. Rivkin, A. Y. Levin, and L. B. Izrailevskii, Teploenergetika �Mos-
cow, Russ. Fed.� 15�12�, 74 �1968� �Therm. Eng. 15�12�, 108 �1968��.69 K. Sato, T. Minamiyama, J. Yata, and T. Oka, in Proceedings of the
Seventh International Conference on the Properties of Steam �ASME,New York, 1968�.
70 A. M. Kerimov, N. A. Agaev, and A. A. Abaszade, Teploenergetika�Moscow, Russ. Fed.� 16�11�, 87 �1969� �Therm. Eng. 16�11�, 126�1969��.
71 L. Korson, W. Drost-Hansen, and F. J. Millero, J. Phys. Chem. 73, 34�1969�.
72 A. Nagashima and I. Tanishita, Bull. JSME 12, 1467 �1969�.73 D. Dumas, K. Grjotheim, P. Hogdahl, and H. A. Øye, Acta Chem. Scand.
�1947-1973� 24, 510 �1970�.74 S. L. Rivkin, A. Y. Levin, and L. B. Izrailevskii, Teploenergetika �Mos-
cow, Russ. Fed.� 17�8�, 88 �1970� �Therm. Eng. 17�8�, 127 �1970��.75 S. L. Rivkin, A. Y. Levin, and L. B. Izrailevskii, Teploenergetika �Mos-
cow, Russ. Fed.� 17�11�, 79 �1970� �Therm. Eng. 17�11�, 117 �1970��.
76 K. Sato, T. Minamiyama, J. Yata, T. Oka, and M. Suzuki, in Proceedingsof the 45th Annual Meeting, Kansai Division, Japan Society of Mechani-cal Engineers, Osaka, �1970�, Vol. 704, p. 7.
77 I. Yasumoto, Bull. Chem. Soc. Jpn. 43, 3917 �1970�.78 L. D. Eicher and B. J. Zwolinski, J. Phys. Chem. 75, 2016 �1971�.79 V. P. Mashovets, L. V. Puchkov, P. M. Sargaev, and M. X. Fedorov, Zh.
Prikl. Khim. �S.-Peterburg� 44, 90 �1971� �J. Appl. Chem. USSR 44, 85�1971��.
80 N. V. Penkina and B. Y. Matsonashvili, Zh. Prikl. Khim. �S.-Peterburg�44, 447 �1971� �J. Appl. Chem. USSR 44, 448 �1971��.
81 S. L. Rivkin, A. Y. Levin, and L. B. Israilevskii, Izv. Akad. Nauk, BSSR,Minsk 1, 32 �1972�.
82 S. L. Rivkin, A. Y. Levin, and L. B. Izrailevskii, Teplo i Massoperenos 7,61 �1972�.
83 S. L. Rivkin, A. Y. Levin, L. B. Izrailevskii, and K. F. Kharitonov, Tep-loenergetika �Moscow, Russ. Fed.� 20�8�, 11 �1973� �Therm. Eng. 20�8�,14 �1973��.
84 D. L. Timrot, M. A. Serednitskaya, and M. S. Bespalov, Teploenergetika�Moscow, Russ. Fed.� 20�8�, 78 �1973� �Therm. Eng. 20�8�, 106 �1973��.
85 D. J. Kingham, W. A. Adams, and M. J. McGuire, J. Chem. Eng. Data19, 1 �1974�.
86 A. I. Kudish, D. Wolf, and F. Steckel, J. Chem. Soc., Faraday Trans. 170, 484 �1974�.
87 A. Nagashima, I. Tanishita, and Y. Murai, J. Chem. Eng. Data 19, 212�1974�.
88 S. L. Rivkin, A. Y. Levin, and L. B. Izrailevskii, Heat Transfer-Sov. Res.7, 151 �1975�.
89 J. Kestin, H. E. Khalifa, S. T. Ro, and W. A. Wakeham, J. Chem. Eng.Data 22, 207 �1977�.
90 G. Oltermann, Ph.D. thesis, Technische Universität Hannover, 1977.91 Y. A. Osipov, B. V. Shelznii, and N. F. Bondarenko, Zh. Fiz. Khim. 51,
1264 �1977�.92 J. Kestin, H. E. Khalifa, H. Sookiazian, and W. A. Wakeham, Ber. Bun-
senges. Phys. Chem. 82, 180 �1978�.93 H. Kubota, S. Tsuda, M. Murata, T. Yamamoto, Y. Tanaka, and T. Makita,
Rev. Phys. Chem. Jpn. 49, 59 �1979�.94 N. A. Agaev, in Proceedings of the Ninth International Conference on the
Properties of Steam, edited by J. Straub and K. Scheffler �Pergamon,Oxford, 1980�, p. 362.
95 F. A. Gonçalves, in Proceedings of the Ninth International Conference onthe Properties of Steam, edited by J. Straub and K. Scheffler �Pergamon,Oxford, 1980�, p. 354.
96 J. Kestin and I. R. Shankland, J. Non-Equil. Thermodyn. 6, 241 �1981�.97 W. Baldauf and H. Knapp, Ber. Bunsenges. Phys. Chem. 87, 304 �1983�.98 A. F. Collings and N. Bejenov, Metrologia 19, 61 �1983�.99 C. J. James, D. E. Mulcahy, and B. J. Steel, J. Phys. D: Appl. Phys. 17,
225 �1984�.100 L.-D. Naake, Ph.D. thesis, University of Karlsruhe, 1984.101 J. Kestin, N. Imaishi, S. H. Nott, and J. V. Sengers, Physica A 134A, 38
�1985�.102 G. A. Kozlov, Kolloidn. Zh. 47�6�, 1184 �1985� �Colloid J. USSR 47�6�,
1018 �1986��.103 K. Tanaka, H. Matsuda, H. Fujiwara, H. Kubota, and T. Makita, Int. J.
Thermophys. 8, 147 �1987�.104 D. A. Berstad, B. Knapstad, M. Larnvik, P. A. Skjoelsvik, K. Toerklep,
and H. A. Øye, Physica A 151, 246 �1988�.105 W. M. Melzer, W. Baldauf, and H. Knapp, Chem. Eng. Process. 26, 71
�1989�.106 D. H. S. Ramkumar and A. P. Kudchadker, J. Chem. Eng. Data 34, 463
�1989�.107 J. Mazurkiewicz and P. Tomasik, J. Phys. Org. Chem. 3, 493 �1990�.108 M. J. Lee and M. C. Wei, J. Chem. Eng. Data 37, 209 �1992�.109 F. Rosenberger, J. Iwan, D. Alexander, and W. Jin, Rev. Sci. Instrum. 63,
4196 �1992�.110 M. J. Assael and S. K. Polimatidou, Int. J. Thermophys. 15, 95 �1994�.111 F. Olivé, K. R. Patil, A. Coronas, and F. Fernández, Int. J. Thermophys.
15, 661 �1994�.112 H. Wode and W. Seidel, Ber. Bunsenges. Phys. Chem. 98, 927 �1994�.113 M. J. Lee and T.-K. Lin, J. Chem. Eng. Data 40, 336 �1995�.114 IAPWS, Release: Values of Temperature, Pressure and Density of Ordi-
nary and Heavy Water Substances at their Respective Critical Points,International Association for the Properties of Water and Steam, 1992.
124 HUBER ET AL.
J. Phys. Chem. Ref. Data, Vol. 38, No. 2, 2009 This article is copyrighted as indicated in the article. Reuse of AIP content is subject to the terms at: http://scitation.aip.org/termsconditions. Downloaded to IP:
155.207.48.196 On: Thu, 12 Feb 2015 08:51:57
115 IAPWS, Release on the IAPWS Formulation 1995 for the Thermody-namic Properties of Ordinary Water Substance for General and ScientificUse, International Association for the Properties of Water and Steam,1996.
116 I. N. Metaxa, D. G. Friend, and M. J. Assael, IAPWS Annual Meeting,Vejle, Denmark, 2003 �unpublished�.
117 E. Vogel, C. Küchenmeister, E. Bich, and A. Laesecke, J. Phys. Chem.Ref. Data 27, 947 �1998�.
118 J. R. Donaldson and P. V. Tryon, STARPAC, standards time series andregression package �http://gams.nist.gov/serve.cgi/Package/STARPAC�.National Institute of Standards and Technology, Boulder CO, 1990.
119 M. G. Cox, Metrologia 39, 589 �2002�.120 J. Mandel, The Statistical Analysis of Experimental Data �Wiley, New
York, 1964�.121 P. T. Boggs, R. H. Byrd, J. E. Rogers, and R. B. Schnabel, ODRPACK,
software for orthogonal distance regression, NISTIR 4834, National In-stitute of Standards and Technology, Gaithersburg, MD, 1992.
122 R. Krauss, J. Luettmer-Strathmann, J. V. Sengers, and K. Stephan, Int. J.Thermophys. 14, 951 �1993�.
123 J. Kestin, M. Sokolov, and W. A. Wakeham, J. Phys. Chem. Ref. Data 7,941 �1978�.
124 International Organization for Standardization ISO/TR Technical ReportNo. 3666, 1998.
125 S. Kirkpatrick, C. D. Gelatt, and M. P. Vecchi, Science 220, 671 �1983�.126 M. L. Huber, Comput. Chem. Eng. 18, 929 �1994�.127 M. Lundy and A. Mees, Math. Program. 34, 111 �1986�.128 D. G. Friend and J. C. Rainwater, Chem. Phys. Lett. 107, 590 �1984�.129 M. A. Anisimov, J. V. Sengers, and J. M. H. Levelt Sengers, in Aqueous
Systems at Elevated Temperatures and Pressures: Physical Chemistry inWater, Steam and Hydrothermal Solutions, edited by D. A. Palmer, R.Fernández-Prini, and A. H. Harvey �Elsevier, Amsterdam, 2004�, p. 29.
130 A. Pelissetto and E. Vicari, Phys. Rep. 368, 549 �2002�.131 J. V. Sengers and J. M. H. Levelt Sengers, in Progress in Liquid Physics,
edited by C. A. Croxton �Wiley, New York, 1978�, p. 103.132 J. V. Sengers, Int. J. Thermophys. 6, 203 �1985�.133 P. C. Hohenberg and B. I. Halperin, Rev. Mod. Phys. 49, 435 �1977�.134 J. K. Bhattacharjee, R. A. Ferrell, R. S. Basu, and J. V. Sengers, Phys.
Rev. A 24, 1469 �1981�.135 H. Hao, R. A. Ferrell, and J. K. Bhattacharjee, Phys. Rev. E 71, 021201
�2005�.136 T. Ohta, J. Phys. C 10, 791 �1977�.137 H. C. Burstyn, J. V. Sengers, J. K. Bhattacharjee, and R. A. Ferrell, Phys.
Rev. A 28, 1567 �1983�.138 J. Luettmer-Strathmann, J. V. Sengers, and G. A. Olchowy, J. Chem.
Phys. 103, 7482 �1995�.139 G. A. Olchowy and J. V. Sengers, Phys. Rev. Lett. 61, 15 �1988�.140 E. P. Sakonidou, H. R. van den Berg, C. A. ten Seldam, and J. V. Sengers,
J. Chem. Phys. 105, 10535 �1996�.141 M. R. Moldover, J. V. Sengers, R. W. Gammon, and R. J. Hocken, Rev.
Mod. Phys. 51, 79 �1979�.142 R. F. Berg, M. R. Moldover, and G. A. Zimmerli, Phys. Rev. Lett. 82,
920 �1999�.143 R. F. Berg, M. R. Moldover, and G. A. Zimmerli, Phys. Rev. E 60, 4079
�1999�.144 R. F. Berg, M. R. Moldover, M. W. Yao, and G. A. Zimmerli, Phys. Rev.
E 77, 041116 �2008�.145 R. S. Basu and J. V. Sengers, in Proceedings of the Eighth Symposium on
Thermophysical Properties, edited by J. V. Sengers �ASME, New York,1982�, Vol. 8�1�, p. 434.
146 M. A. Anisimov, A. A. Povodyrev, J. P. Roseli, J. V. Sengers, S. B.Kiselev, and D. G. Friend, in Proceedings of the 13th International Con-ference on the Properties of Water and Steam, edited by P. R. Tremaine,P. G. Hill, D. E. Irish, and P. V. Balakrishnan �NRC Research, Ottawa,2000�, p. 339.
147 A. Kostrowicka Wyczalkowska, K. S. Abdulkadirova, M. A. Anisimov,and J. V. Sengers, J. Chem. Phys. 113, 4985 �2000�.
148 IAPWS, Revised Release on the IAPS Formulation 1985 for the ThermalConductivity of Ordinary Water Substance, Appendix C, International As-sociation for the Properties of Water and Steam, 1998.
149 S. L. Rivkin, A. Y. Levin, and L. B. Israilevskii, Teplofiz. Svoistva Vesh-chestv Materialov 10, 232 �1976�.
150 H. R. van den Berg, C. A. ten Seldam, and P. S. van der Gulik, PhysicaA 167, 457 �1990�.
151 H. R. van den Berg, C. A. ten Seldam, and P. S. van der Gulik, J. FluidMech. 246, 1 �1993�.
152 H. R. van den Berg, C. A. ten Seldam, and P. S. van der Gulik, Int. J.Thermophys. 14, 865 �1993�.
153 M. R. Mustafaev, High Temp. 34, 130 �1996�.154 S. L. Rivkin �private communication�.155 IAPWS, Revised Release on the IAPWS Industrial Formulation 1997 for
the Thermodynamic Properties of Water and Steam, International Asso-ciation for the Properties of Water and Steam, 2007.
156 W. Wagner, J. R. Cooper, A. Dittman, J. Kijima, H.-J. Kretzschmar, A.Kruse, R. Mareš, K. Oguchi, H. Sato, I. Stöcker, O. Šifner, Y. Takaishi, I.Tanishita, J. Trübenbach, and Th. Willkommen, Trans. ASME: J. Eng.Gas Turbines Power 120, 150 �2000�.
157 J. Pátek, J. Hrubý, J. Klomfar, M. Součková, and A. H. Harvey, J. Phys.Chem. Ref. Data 38, 21 �2009�.
158 IAPWS, Supplementary Release on Properties of Liquid Water at0.1 MPa, International Association for the Properties of Water and Steam,2008.
159 A. A. Aleksandrov, A. B. Matveev, and I. V. Tsarev, in Symposium onChemistry of Water and Steam in Power Plants �Tokyo, Japan, 1991�.
160 S. E. Quiñones-Cisneros and U. K. Deiters, J. Phys. Chem. B 110, 12820�2006�.
161 L. R. Fokin and A. N. Kalashnikov, High Temp. 38, 224 �2000�.162 R. Hellmann, E. Bich, E. Vogel, A. S. Dickinson, and V. Vesovic �unpub-
lished�.163 R. Bukowski, K. Szalewicz, G. C. Groenenboom, and A. van der Avoird,
Science 315, 1249 �2007�.164 IAPWS, Revised Release on the Pressure along the Melting and Subli-
mation Curves of Ordinary Water Substance, International Associationfor the Properties of Water and Steam, 2008.
165 W. Wagner, R. Feistel, and T. Riethmann, J. Phys. Chem. Ref. Data�unpublished�.
166 J. W. Tukey, Exploratory Data Analysis �Addison-Wesley, Reading, MA,1977�.
167 See EPAPS Document No. E-JPCRBU-38-002902 for box-and-whiskerdiagrams of data sets used for uncertainty analysis. For more informationon EPAPS, see http://www.aip.org/pubservs/epaps.html.
VISCOSITY OF H2O 125
J. Phys. Chem. Ref. Data, Vol. 38, No. 2, 2009 This article is copyrighted as indicated in the article. Reuse of AIP content is subject to the terms at: http://scitation.aip.org/termsconditions. Downloaded to IP:
155.207.48.196 On: Thu, 12 Feb 2015 08:51:57
Related Documents