symmetry S S Article New Design of Composite Structures Used in Automotive Engineering Vasile Gheorghe, Maria Luminita Scutaru *, Virgil Barbu Ungureanu, Eliza Chircan and Mihai Ulea Citation: Gheorghe, V.; Scutaru, M.L.; Ungureanu, V.B.; Chircan, E.; Ulea, M. New Design of Composite Structures Used in Automotive Engineering. Symmetry 2021, 13, 383. https://doi.org/10.3390/sym13030383 Academic Editor: Dumitru Baleanu and Marin Marin Received: 31 January 2021 Accepted: 24 February 2021 Published: 27 February 2021 Publisher’s Note: MDPI stays neutral with regard to jurisdictional claims in published maps and institutional affil- iations. Copyright: © 2021 by the authors. Licensee MDPI, Basel, Switzerland. This article is an open access article distributed under the terms and conditions of the Creative Commons Attribution (CC BY) license (https:// creativecommons.org/licenses/by/ 4.0/). Department of Mechanical Engineering, Transilvania University of Brasov, B-dul Eroilor 29, 500036 Brasov, Romania; [email protected] (V.G.); [email protected] (V.B.U.); [email protected] (E.C.); [email protected] (M.U.) * Correspondence: [email protected] Abstract: The paper proposes composite materials for the manufacturing of parts of the car body structure, namely a door. This work aims to analyze the possibility of replacing the metal door of a vehicle with a door made of composite materials. Specific issues related to this replacement are analyzed in the paper. Test specimens were made of composite materials of different sizes, using several types of constituents to determine which material might be most suitable to replace metal in the manufacturing of the door. The choice of materials for the car door was made starting from the characteristics of the analyzed composite materials, but also taking into account the manufacturing possibilities and other engineering limitations. The behavior of the automotive structure as analyzed, using the finite element method for determining the stresses in the structure. Experimental verifica- tions were performed on an experimental stand which has been specially designed for this purpose, to validate the proposed model. Keywords: vehicles; composite materials; metal materials; plastics; impact 1. Introduction The replacement of metal materials used so far in the automotive industry with plastics and composites has led to increased service life, increased noise and vibration absorption, and intercompartmental insulation of vehicles to absorb the kinetic energy of shocks in the case of accidents in an environmentally friendly way. The use of composite materials in the automotive industry has increased significantly in recent decades so that, at present, automotive models incorporate in their construction up to 50% plastics and composite materials. Many parts of today’s vehicles are made of composite materials. The composite materials from which these parts are made are chosen depending on the role that these components have in the whole vehicle. The technology of obtaining these components also has an important role in choosing the material used to make the car parts. The parts can be made of one or more subassemblies, of the same type of composite material, or of different materials, removable or non-removable. Many parts of today’s vehicles are made of composite materials. The technology of obtaining these components also has an important role in choosing the material used to make the car parts. The parts can be made of one or more subassemblies, of the same type of composite material or of different materials, removable or non-removable. In most cases, the design of devices or composite parts is a challenge due to the demands that the structure must meet, the need for a low weight, and ensuring low production costs. In order to achieve the optimal structure, strategies are developed regarding the limits of the compromise in the design process, the selection of materials, the geometric design, and the possibilities of realization. Such cases are studied in [1] where monolithic, U-beam, sandwich-insert, and sandwich-stiffened plates are analyzed. SMART textiles, through their multifunctionality, low energy required in manufac- turing, small size and weight, ease of processing, and low costs offer diversified uses in Symmetry 2021, 13, 383. https://doi.org/10.3390/sym13030383 https://www.mdpi.com/journal/symmetry

Welcome message from author
This document is posted to help you gain knowledge. Please leave a comment to let me know what you think about it! Share it to your friends and learn new things together.
Transcript
symmetryS S
Article
New Design of Composite Structures Used inAutomotive Engineering
Vasile Gheorghe, Maria Luminita Scutaru *, Virgil Barbu Ungureanu, Eliza Chircan and Mihai Ulea
�����������������
Citation: Gheorghe, V.; Scutaru,
M.L.; Ungureanu, V.B.; Chircan, E.;
Ulea, M. New Design of Composite
Structures Used in Automotive
Engineering. Symmetry 2021, 13, 383.
https://doi.org/10.3390/sym13030383
Academic Editor: Dumitru Baleanu
and Marin Marin
Received: 31 January 2021
Accepted: 24 February 2021
Published: 27 February 2021
Publisher’s Note: MDPI stays neutral
with regard to jurisdictional claims in
published maps and institutional affil-
iations.
Copyright: © 2021 by the authors.
Licensee MDPI, Basel, Switzerland.
This article is an open access article
distributed under the terms and
conditions of the Creative Commons
Attribution (CC BY) license (https://
creativecommons.org/licenses/by/
4.0/).
Department of Mechanical Engineering, Transilvania University of Brasov, B-dul Eroilor 29, 500036Brasov, Romania; [email protected] (V.G.); [email protected] (V.B.U.); [email protected] (E.C.);[email protected] (M.U.)* Correspondence: [email protected]
Abstract: The paper proposes composite materials for the manufacturing of parts of the car bodystructure, namely a door. This work aims to analyze the possibility of replacing the metal door ofa vehicle with a door made of composite materials. Specific issues related to this replacement areanalyzed in the paper. Test specimens were made of composite materials of different sizes, usingseveral types of constituents to determine which material might be most suitable to replace metal inthe manufacturing of the door. The choice of materials for the car door was made starting from thecharacteristics of the analyzed composite materials, but also taking into account the manufacturingpossibilities and other engineering limitations. The behavior of the automotive structure as analyzed,using the finite element method for determining the stresses in the structure. Experimental verifica-tions were performed on an experimental stand which has been specially designed for this purpose,to validate the proposed model.
Keywords: vehicles; composite materials; metal materials; plastics; impact
1. Introduction
The replacement of metal materials used so far in the automotive industry with plasticsand composites has led to increased service life, increased noise and vibration absorption,and intercompartmental insulation of vehicles to absorb the kinetic energy of shocks in thecase of accidents in an environmentally friendly way.
The use of composite materials in the automotive industry has increased significantlyin recent decades so that, at present, automotive models incorporate in their constructionup to 50% plastics and composite materials. Many parts of today’s vehicles are made ofcomposite materials. The composite materials from which these parts are made are chosendepending on the role that these components have in the whole vehicle. The technologyof obtaining these components also has an important role in choosing the material usedto make the car parts. The parts can be made of one or more subassemblies, of the sametype of composite material, or of different materials, removable or non-removable. Manyparts of today’s vehicles are made of composite materials. The technology of obtainingthese components also has an important role in choosing the material used to make the carparts. The parts can be made of one or more subassemblies, of the same type of compositematerial or of different materials, removable or non-removable.
In most cases, the design of devices or composite parts is a challenge due to thedemands that the structure must meet, the need for a low weight, and ensuring lowproduction costs. In order to achieve the optimal structure, strategies are developedregarding the limits of the compromise in the design process, the selection of materials, thegeometric design, and the possibilities of realization. Such cases are studied in [1] wheremonolithic, U-beam, sandwich-insert, and sandwich-stiffened plates are analyzed.
SMART textiles, through their multifunctionality, low energy required in manufac-turing, small size and weight, ease of processing, and low costs offer diversified uses in
Symmetry 2021, 13, 383. https://doi.org/10.3390/sym13030383 https://www.mdpi.com/journal/symmetry
Symmetry 2021, 13, 383 2 of 21
very different fields such as the automotive industry, aerospace engineering, military, med-ical, sports equipment industry, civil engineering, energy industry, etc. The developmentof textile-based composite materials is done quickly and with important consequences,which redefine the design and engineering of material science and improve the qualityof life and the environment [2]. Composite materials manufactured for applications inthe automotive industry are presented in [3]. The advantage of the proposed materialsis the low weight and low costs. The materials are manufactured using scraps of freshlyrecycled rubber, epoxy resin, and graphene nanoparticles (GnPs). The Halpin–Tsai methodis used to estimate the engineering constants of the manufactured materials. The finiteelement method is used to verify the in-service behavior of manufactured components.The rigidity of these materials is high enough and are very suitable for applications in theautomotive industry. Natural fibers are a realistic and environmentally friendly solution asa reinforcing element for polymeric composites thanks to their mechanical properties, lowmanufacturing cost, environmental friendliness, easy procurement, biodegradable nature,and good weight resistance ratio [4]. According to the mentioned study, the potential ofnatural fibers is enormous for a series of applications in automotive engineering, sports,electrical and electronic articles, civil engineering, etc. Modern computational methodscan also be applied for the calculation of natural fiber composites (NFC) which offer agood alternative to synthetic fiber composites. In [5], the properties of NFC for their usein automotive construction, aviation, marine equipment, sports equipment, and otherengineering fields are analyzed. Thus, the finite element method proves to be a powerfultool in the analysis of such types of composites.
In the context of the diversification of reinforcement components from compositematerials, wood can become a promising choice and the automotive industry is one of themain beneficiaries of these new types of materials. Wood composites offer a number ofvery useful properties in practice such as high rigidity, good strength, very good dampingproperties, high fatigue resistance, low density, and low manufacturing costs. They thusbecome competitive compared to metals or other materials if they are properly designedand used. In order to apply these composites in automotive engineering, data on materialsare needed, necessary to establish the composition of the material following numericalcalculations. A detailed study of this problem is done in [6]. Following the studies, adatabase is compiled for three species of hardwood. The results demonstrate a very goodbehavior of these composites in the manufacturing of automotive components.
Many papers study various aspects of the use of composites in the automotive industry.The rubber compound that has been used for the engine housing has thermal and soundinsulation properties within acceptable limits, as well as superior properties when it comesto impact and tensile strength compared to plain polypropylene [7]. The compound basedon rubber powder as a reinforcing element has a positive impact on the environment,reducing material waste by using old rubbers from car tires. At the same time, the mass ofthe product is significantly reduced, having at the same time properties within the allowedlimits, such as products made of conventional materials. Different types of compositematerials made from plastic and natural fibers show a new way to improve the automotiveindustry, by reducing weight and increasing performance [8]. To improve the compositestructure of automotive bumpers, a study that proposed a new structure, with lighterweight and improved impact resistance was presented in [9]. Due to the high costs ofobtaining carbon fibers used in various industries such as aerospace and automotive, thetransition from metallic materials to carbon fiber-based composites is difficult. For thisreason, polyacrylonitrile is used as a precursor for the manufacture of carbon fibers [10].New solutions for the composite materials used in automotive engineering are presentedin [11,12]. Different numerical procedures and modeling methods were used for the studyof composites. To determine the mechanical characteristics of a two-component compositematerial with homogeneous and transversely isotropic reinforcing fibers, the Mori–Tanakafield method in the viscoelastic domain was applied. The method gave significant errors inthe 45-degree test. To increase the calculation accuracy, fluorescence tests were performed
Symmetry 2021, 13, 383 3 of 21
for carbon fiber reinforced polyether-ether-ketone epoxy resin laminates, thus determiningthe nonlinear behavior of the material [13,14]. Theoretical problems of numerical calculusin such cases are presented in [15]. Interesting applications of the composite in the field ofautomotive engineering and experimental results and procedures are studied in [16–18].
This paper proposes composite materials for the manufacturing of parts of the carbody structure, namely a door. Test specimens were made of composite materials ofdifferent sizes, using several types of constituents to determine which material might bemost suitable for making the door. The materials used to reinforce the plates are fiberglassand carbon fiber. From these plates the specimens necessary for the tests on the stand werecut to establish the characteristics of the composite materials studied. The data recordedduring the tests allowed the choice of appropriate materials for the manufacturing of acar structure. The car structure studied in the paper is a car door. The door is made oftwo parts, an outer face and an inner frame. Both parts were made of composite materials.The outer face was made of carbon fiber, and the inner frame was made of fiberglass. Thechoice of materials from which the two parts of the car door were made was made startingfrom the characteristics of the analyzed composite materials, but also taking into accountthe manufacturing possibilities. The behavior of the automotive structure made of thechosen composite materials was analyzed, using the finite element method for determiningthe stresses in the structure. Experimental verifications were performed in order to validatethe proposed model.
2. Materials and Methods
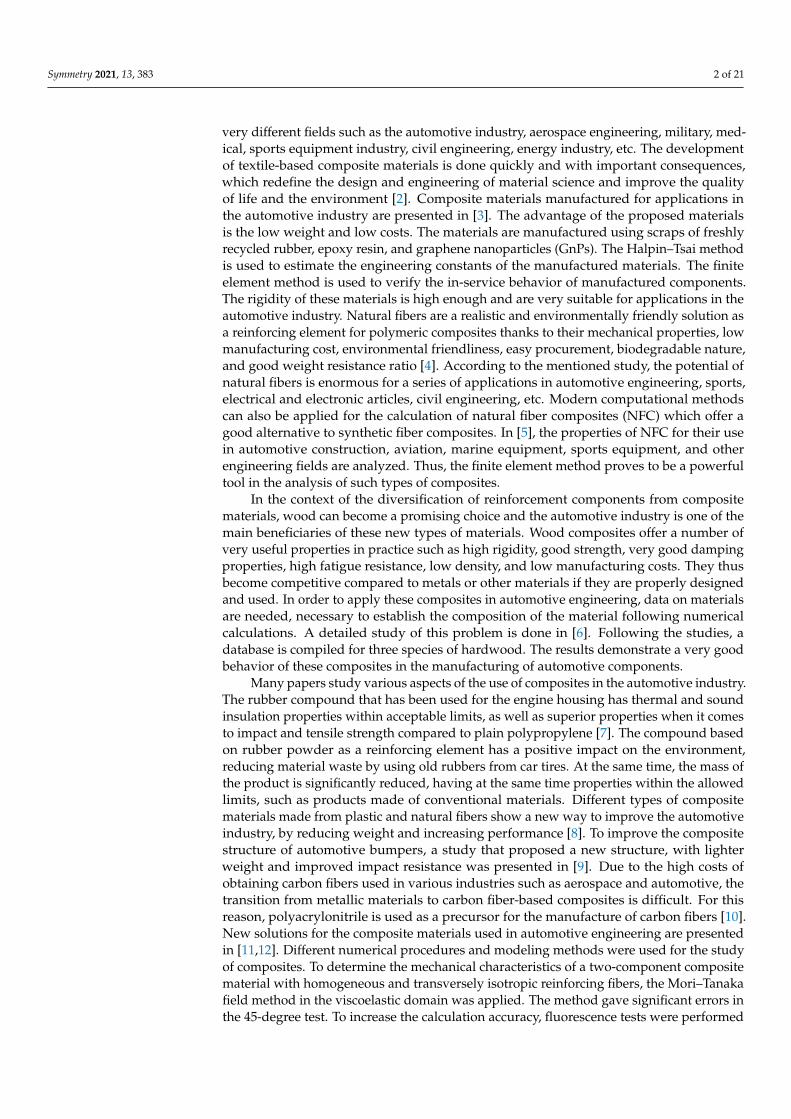
In order to achieve the design of the door it is necessary to use some appropriatematerials and to know the characteristics of these materials, which will be determinedexperimentally. For the materials used, the bending tests are the most suitable for theanalysis, using standard tests specimen. The specimen is not clamped at either end,allowing pure bending. The three-point bending stress scheme of the specimen is shownin Figure 1. As a result that only bending stress tests were performed, the specimenswere made in the form of a rectangular parallelepiped with the dimensions: the lengthof the specimen (A) is 100 mm; the width of the test piece (B) is between 10 and 15 mm;the thickness of the specimen (C) depends on the thickness of the plate from which thespecimens were obtained. The test piece rests on two supports and is subjected to bendingat a constant speed until it breaks. During the test, the force applied to the specimen andits deformation (displacement of a point in the middle of the distance between the supportpoints) shall be measured. The test piece is considered broken at the first drop of theforce–displacement chart.
Symmetry 2021, 13, x FOR PEER REVIEW 3 of 20
Tanaka field method in the viscoelastic domain was applied. The method gave significant errors in the 45-degree test. To increase the calculation accuracy, fluorescence tests were performed for carbon fiber reinforced polyether-ether-ketone epoxy resin laminates, thus determining the nonlinear behavior of the material [13,14]. Theoretical problems of nu-merical calculus in such cases are presented in [15]. Interesting applications of the compo-site in the field of automotive engineering and experimental results and procedures are studied in [16–18].
This paper proposes composite materials for the manufacturing of parts of the car body structure, namely a door. Test specimens were made of composite materials of dif-ferent sizes, using several types of constituents to determine which material might be most suitable for making the door. The materials used to reinforce the plates are fiberglass and carbon fiber. From these plates the specimens necessary for the tests on the stand were cut to establish the characteristics of the composite materials studied. The data recorded dur-ing the tests allowed the choice of appropriate materials for the manufacturing of a car structure. The car structure studied in the paper is a car door. The door is made of two parts, an outer face and an inner frame. Both parts were made of composite materials. The outer face was made of carbon fiber, and the inner frame was made of fiberglass. The choice of materials from which the two parts of the car door were made was made starting from the characteristics of the analyzed composite materials, but also taking into account the manufacturing possibilities. The behavior of the automotive structure made of the chosen composite materials was analyzed, using the finite element method for determin-ing the stresses in the structure. Experimental verifications were performed in order to validate the proposed model.
2. Materials and Methods In order to achieve the design of the door it is necessary to use some appropriate
materials and to know the characteristics of these materials, which will be determined experimentally. For the materials used, the bending tests are the most suitable for the analysis, using standard tests specimen. The specimen is not clamped at either end, allow-ing pure bending. The three-point bending stress scheme of the specimen is shown in Fig-ure 1. As a result that only bending stress tests were performed, the specimens were made in the form of a rectangular parallelepiped with the dimensions: the length of the speci-men (A) is 100 mm; the width of the test piece (B) is between 10 and 15 mm; the thickness of the specimen (C) depends on the thickness of the plate from which the specimens were obtained. The test piece rests on two supports and is subjected to bending at a constant speed until it breaks. During the test, the force applied to the specimen and its defor-mation (displacement of a point in the middle of the distance between the support points) shall be measured. The test piece is considered broken at the first drop of the force–dis-placement chart.
Figure 1. Three-point bending stress scheme of the test piece.
The following five types of materials were studied:
Figure 1. Three-point bending stress scheme of the test piece.
The following five types of materials were studied:
1. The first class of composite test specimens are made of polyester resin, reinforcedwith 5 layers of fiberglass fabric, which we call RT-800, with a specific mass of845g/m2. After deposition of the five layers, the material was allowed to polymerize
Symmetry 2021, 13, 383 4 of 21
at ambient temperature. From the first material, specimens with a thickness of 4.5 mmwere made.
2. The second material tested was also made of polyester resin, reinforced with 7 layersof fiberglass fabric with a specific mass of 845g/m2. These two types of materials weremade of the same constituents, differing only in the number of layers of fiberglassfabric used. The specimens made of the second material had a thickness of 6 mm.
3. The third material subjected to bending tests was a material made of polyester resin,of the “sandwich” type, made of layers of fiberglass fabric, but also composed ofcoremat. The specimens obtained from this material have a thickness of 8 mm.
4. The fourth material is fiberglass in the form of mat was used to reinforce a plate ofpolyester resin. Fifteen layers of mat were used to make this composite.
5. The fifth material tested was made of epoxy resin, reinforced with five layers of carbonfiber fabrics and one layer of polyester. These specimens suffered total ruptures, onlyone showing detachments between the layers. It could rather be said that thesespecimens were broken during the bending tests.
There are two methods to test the composite material to determine the bendingproperties. The three-point bending flexural test help us to obtain the bending modulusof elasticity, flexural stress, and strain and the material flexural stress–strain response.To realize the test is a three-point bend fixture. The main advantage of this method isdetermined by the ease of preparation of the experiment and testing. The disadvantagesare that the results are sensitive to loading, strain rate, and specimen. The other methodis the four-point flexural test, very similar to the three-point bending flexural test. Inthe paper, the three-point bending flexural test has been used, due to the ease of testing.The tests have been made considering the recommendations presented in the standardsASTM D790, ASTM D7264, ASTM C1161, ASTM D6272, ASTM C393, ASTM D7249, ASTMD7250 [19–26].
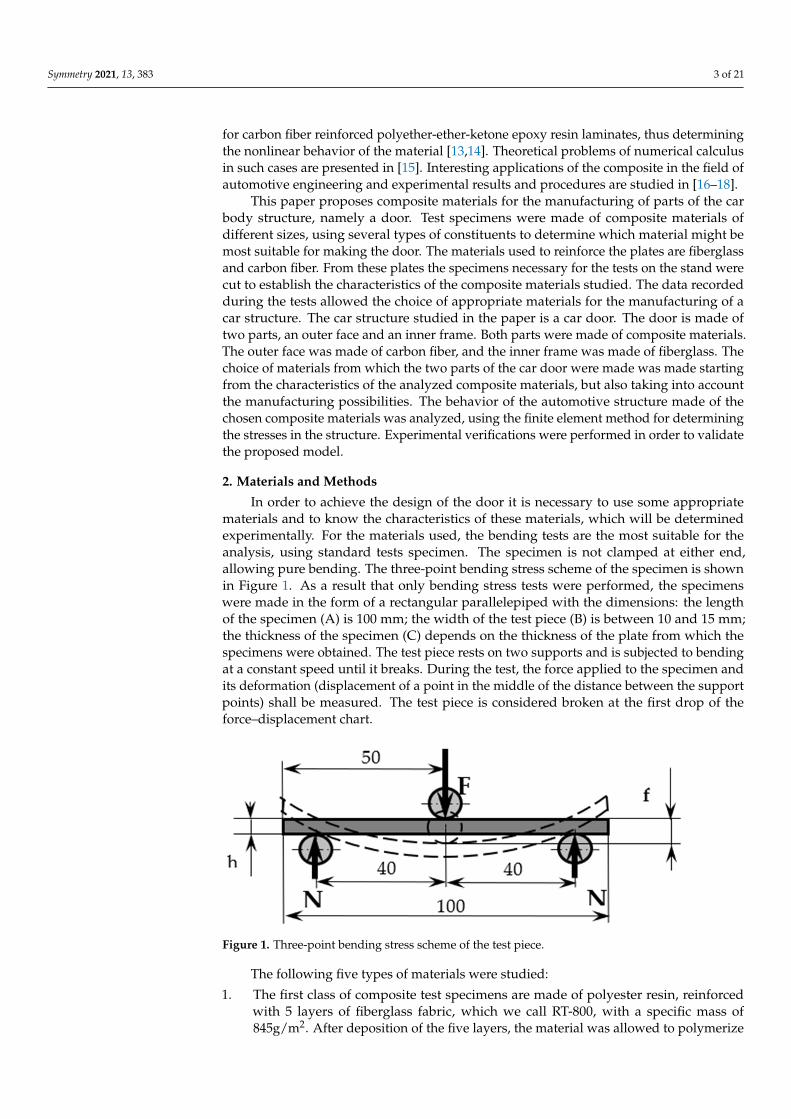
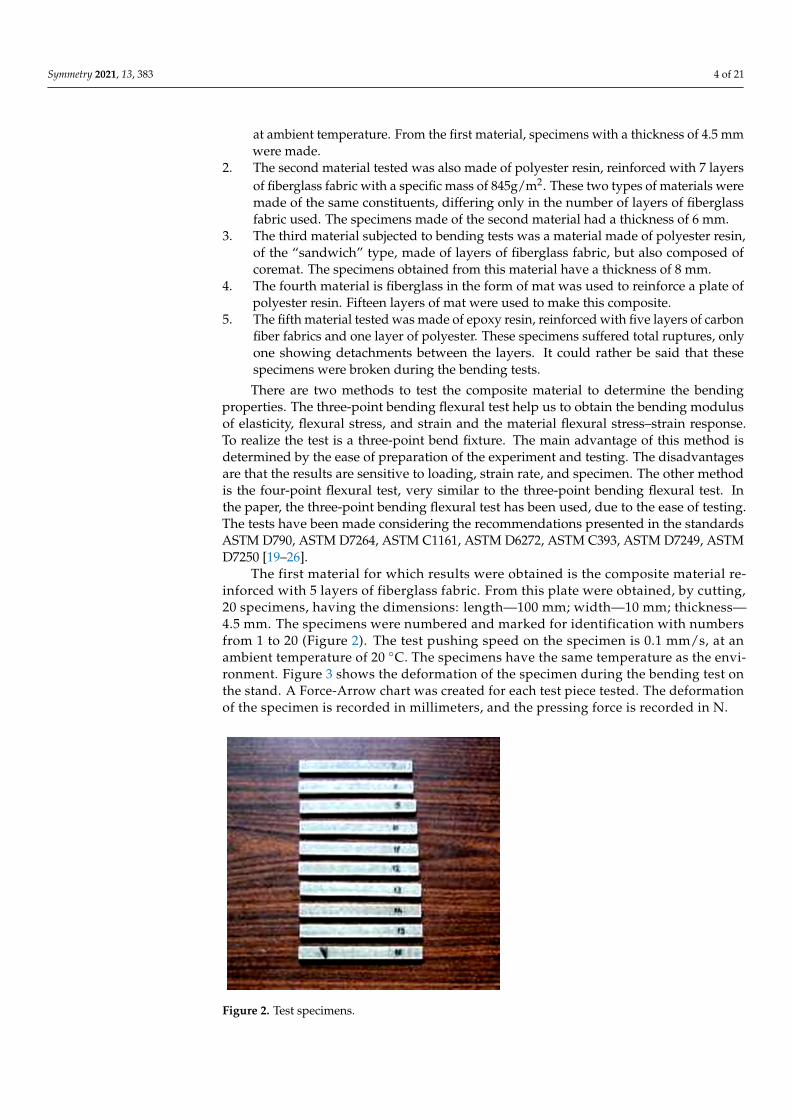
The first material for which results were obtained is the composite material re-inforced with 5 layers of fiberglass fabric. From this plate were obtained, by cutting,20 specimens, having the dimensions: length—100 mm; width—10 mm; thickness—4.5 mm. The specimens were numbered and marked for identification with numbersfrom 1 to 20 (Figure 2). The test pushing speed on the specimen is 0.1 mm/s, at anambient temperature of 20 ◦C. The specimens have the same temperature as the envi-ronment. Figure 3 shows the deformation of the specimen during the bending test onthe stand. A Force-Arrow chart was created for each test piece tested. The deformationof the specimen is recorded in millimeters, and the pressing force is recorded in N.
Symmetry 2021, 13, x FOR PEER REVIEW 4 of 20
1. The first class of composite test specimens are made of polyester resin, reinforced with 5 layers of fiberglass fabric, which we call RT-800, with a specific mass of 845g/m2. After deposition of the five layers, the material was allowed to polymerize at ambient temperature. From the first material, specimens with a thickness of 4.5 mm were made.
2. The second material tested was also made of polyester resin, reinforced with 7 layers of fiberglass fabric with a specific mass of 845g/m2. These two types of materials were made of the same constituents, differing only in the number of layers of fiberglass fabric used. The specimens made of the second material had a thickness of 6 mm.
3. The third material subjected to bending tests was a material made of polyester resin, of the “sandwich” type, made of layers of fiberglass fabric, but also composed of coremat. The specimens obtained from this material have a thickness of 8 mm.
4. The fourth material is fiberglass in the form of mat was used to reinforce a plate of polyester resin. Fifteen layers of mat were used to make this composite.
5. The fifth material tested was made of epoxy resin, reinforced with five layers of car-bon fiber fabrics and one layer of polyester. These specimens suffered total ruptures, only one showing detachments between the layers. It could rather be said that these specimens were broken during the bending tests. There are two methods to test the composite material to determine the bending prop-
erties. The three-point bending flexural test help us to obtain the bending modulus of elasticity, flexural stress, and strain and the material flexural stress–strain response. To realize the test is a three-point bend fixture. The main advantage of this method is deter-mined by the ease of preparation of the experiment and testing. The disadvantages are that the results are sensitive to loading, strain rate, and specimen. The other method is the four-point flexural test, very similar to the three-point bending flexural test. In the paper, the three-point bending flexural test has been used, due to the ease of testing. The tests have been made considering the recommendations presented in the standards ASTM D790, ASTM D7264, ASTM C1161, ASTM D6272, ASTM C393, ASTM D7249, ASTM D7250 [19–26].
The first material for which results were obtained is the composite material rein-forced with 5 layers of fiberglass fabric. From this plate were obtained, by cutting, 20 spec-imens, having the dimensions: length—100 mm; width—10 mm; thickness—4.5 mm. The specimens were numbered and marked for identification with numbers from 1 to 20 (Fig-ure 2). The test pushing speed on the specimen is 0.1 mm/s, at an ambient temperature of 20 °C. The specimens have the same temperature as the environment. Figure 3 shows the deformation of the specimen during the bending test on the stand. A Force-Arrow chart was created for each test piece tested. The deformation of the specimen is recorded in millimeters, and the pressing force is recorded in N.
Figure 2. Test specimens. Figure 2. Test specimens.
Symmetry 2021, 13, 383 5 of 21Symmetry 2021, 13, x FOR PEER REVIEW 5 of 20
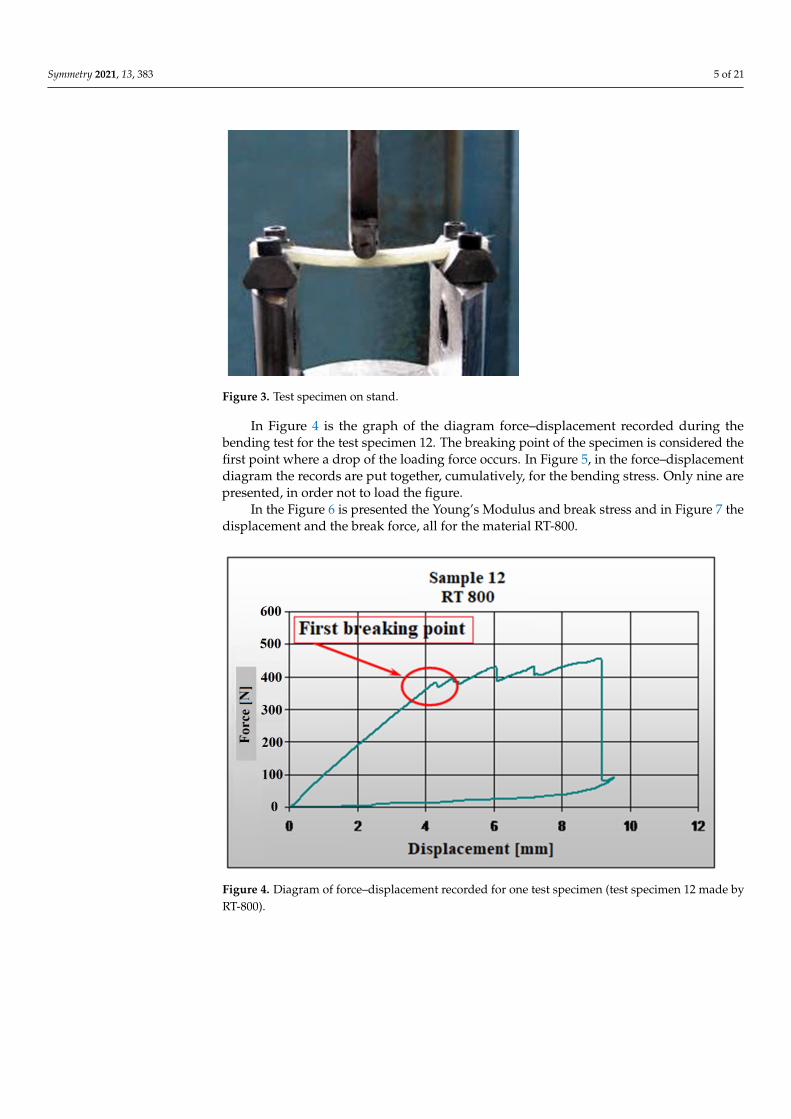
Figure 3. Test specimen on stand.
In Figure 4 is the graph of the diagram force–displacement recorded during the bend-ing test for the test specimen 12. The breaking point of the specimen is considered the first point where a drop of the loading force occurs. In Figure 5, in the force–displacement diagram the records are put together, cumulatively, for the bending stress. Only nine are presented, in order not to load the figure.
Figure 4. Diagram of force–displacement recorded for one test specimen (test specimen 12 made by RT-800).
Figure 3. Test specimen on stand.
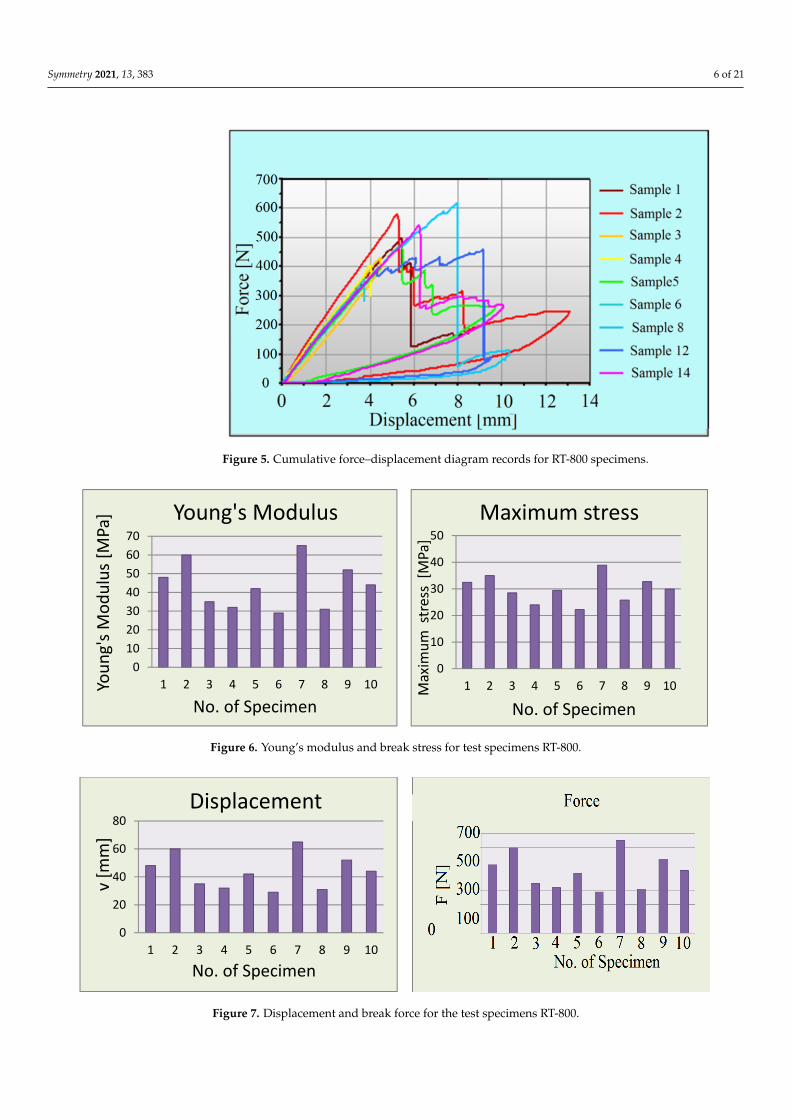
In Figure 4 is the graph of the diagram force–displacement recorded during thebending test for the test specimen 12. The breaking point of the specimen is considered thefirst point where a drop of the loading force occurs. In Figure 5, in the force–displacementdiagram the records are put together, cumulatively, for the bending stress. Only nine arepresented, in order not to load the figure.
In the Figure 6 is presented the Young’s Modulus and break stress and in Figure 7 thedisplacement and the break force, all for the material RT-800.
Symmetry 2021, 13, x FOR PEER REVIEW 5 of 20
Figure 3. Test specimen on stand.
In Figure 4 is the graph of the diagram force–displacement recorded during the bend-ing test for the test specimen 12. The breaking point of the specimen is considered the first point where a drop of the loading force occurs. In Figure 5, in the force–displacement diagram the records are put together, cumulatively, for the bending stress. Only nine are presented, in order not to load the figure.
Figure 4. Diagram of force–displacement recorded for one test specimen (test specimen 12 made by RT-800).
Figure 4. Diagram of force–displacement recorded for one test specimen (test specimen 12 made byRT-800).
Symmetry 2021, 13, 383 6 of 21
Symmetry 2021, 13, x FOR PEER REVIEW 5 of 20
Figure 3. Test specimen on stand.
In Figure 4 is the graph of the diagram force–displacement recorded during the bend-ing test for the test specimen 12. The breaking point of the specimen is considered the first point where a drop of the loading force occurs. In Figure 5, in the force–displacement diagram the records are put together, cumulatively, for the bending stress. Only nine are presented, in order not to load the figure.
Figure 4. Diagram of force–displacement recorded for one test specimen (test specimen 12 made by RT-800).
Figure 5. Cumulative force–displacement diagram records for RT-800 specimens.
Symmetry 2021, 13, x FOR PEER REVIEW 6 of 20
In the Figure 6 is presented the Young’s Modulus and break stress and in Figure 7 the displacement and the break force, all for the material RT-800.
Figure 6. Young’s modulus and break stress for test specimens RT-800.
Figure 7. Displacement and break force for the test specimens RT-800.
Based on these tests, several conclusions can be drawn. A few layers, of those re-quired for stretching, were completely torn. Detachment did not appear between the lay-ers of any sample, except for the median area, where the rupture occurred. Bending stress at break, σ, ranged from 22.23 to 38.90 [MPa].
In material type no. 3, the breaking bending stress for these specimens had lower values than that of the samples that did not contain coremat, and ranged from 5.85 to 8.81 [MPa]. This was a material made of polyester resin, of the “sandwich” type, made of layers of fiberglass fabric, but also having of coremat in the middle of the sandwich. The speci-mens obtained from this material have a thickness of 8 mm. These specimens suffered damage to the coremat layer before the rupture occurred. Absolutely all specimens have suffered detachments between the constituent layers due to the built-in coremat layer, the coremat core does not provide good properties to the composite.
Sample with material no. 4. The fourth material is composed by 15 layers of fiberglass in the form of mat, used to reinforce a plate of polyester resin, from which were cut spec-imens with a thickness of 12 mm. Those tested at bending, at ambient temperature (20 °C), showed ruptures of the layers subjected to stretching. Bending stress at rupture varied between 22.15 and 23.69 [MPa], values comparable to those obtained for samples without coremat. The samples of this material, tested at a temperature of 50 °C, also suffered rup-tures of the layers subjected to stretching. The breaking bending load for the samples tested at 50 °C had values lower than the values recorded for breaking the specimens at
010203040506070
1 2 3 4 5 6 7 8 9 10Youn
g's M
odul
us [M
Pa]
No. of Specimen
Young's Modulus
0
10
20
30
40
50
1 2 3 4 5 6 7 8 9 10Max
imum
str
ess
[MPa
]
No. of Specimen
Maximum stress
0
20
40
60
80
1 2 3 4 5 6 7 8 9 10
v [m
m]
No. of Specimen
Displacement
Figure 6. Young’s modulus and break stress for test specimens RT-800.
Symmetry 2021, 13, x FOR PEER REVIEW 6 of 20
Figure 5. Cumulative force–displacement diagram records for RT-800 specimens.
In the Figure 6 is presented the Young’s Modulus and break stress and in Figure 7 the displacement and the break force, all for the material RT-800
Figure 6. Young’s modulus and break stress for test specimens RT-800.
Figure 7. Displacement and break force for the test specimens RT-800.
Based on these tests, several conclusions can be drawn. A few layers, of those re-quired for stretching, were completely torn. Detachment did not appear between the lay-ers of any sample, except for the median area, where the rupture occurred. Bending stress at break, σ, ranged from 22.23 to 38.90 [MPa].
In material type no. 3, the breaking bending stress for these specimens had lower values than that of the samples that did not contain coremat, and ranged from 5.85 to 8.81 [MPa]. This was a material made of polyester resin, of the “sandwich” type, made of layers of fiberglass fabric, but also having of coremat in the middle of the sandwich. The speci-mens obtained from this material have a thickness of 8 mm. These specimens suffered damage to the coremat layer before the rupture occurred. Absolutely all specimens have suffered detachments between the constituent layers due to the built-in coremat layer, the coremat core does not provide good properties to the composite.
Sample with material no. 4. The fourth material is composed by 15 layers of fiberglass in the form of mat, used to reinforce a plate of polyester resin, from which were cut spec-imens with a thickness of 12 mm. Those tested at bending, at ambient temperature (20 °C), showed ruptures of the layers subjected to stretching. Bending stress at rupture varied between 22.15 and 23.69 [MPa], values comparable to those obtained for samples without coremat. The samples of this material, tested at a temperature of 50 °C, also suffered rup-tures of the layers subjected to stretching. The breaking bending load for the samples
010203040506070
1 2 3 4 5 6 7 8 9 10Youn
g's M
odul
us [M
Pa]
No. of Specimen
Young's Modulus
0
10
20
30
40
50
1 2 3 4 5 6 7 8 9 10Max
imum
str
ess
[MPa
]
No. of Specimen
Maximum stress
0
20
40
60
80
1 2 3 4 5 6 7 8 9 10
v [m
m]
No. of Specimen
Displacement
Figure 7. Displacement and break force for the test specimens RT-800.
Symmetry 2021, 13, 383 7 of 21
Based on these tests, several conclusions can be drawn. A few layers, of those requiredfor stretching, were completely torn. Detachment did not appear between the layers of anysample, except for the median area, where the rupture occurred. Bending stress at break, σ,ranged from 22.23 to 38.90 [MPa].
In material type no. 3, the breaking bending stress for these specimens had lowervalues than that of the samples that did not contain coremat, and ranged from 5.85 to8.81 [MPa]. This was a material made of polyester resin, of the “sandwich” type, made oflayers of fiberglass fabric, but also having of coremat in the middle of the sandwich. Thespecimens obtained from this material have a thickness of 8 mm. These specimens suffereddamage to the coremat layer before the rupture occurred. Absolutely all specimens havesuffered detachments between the constituent layers due to the built-in coremat layer, thecoremat core does not provide good properties to the composite.
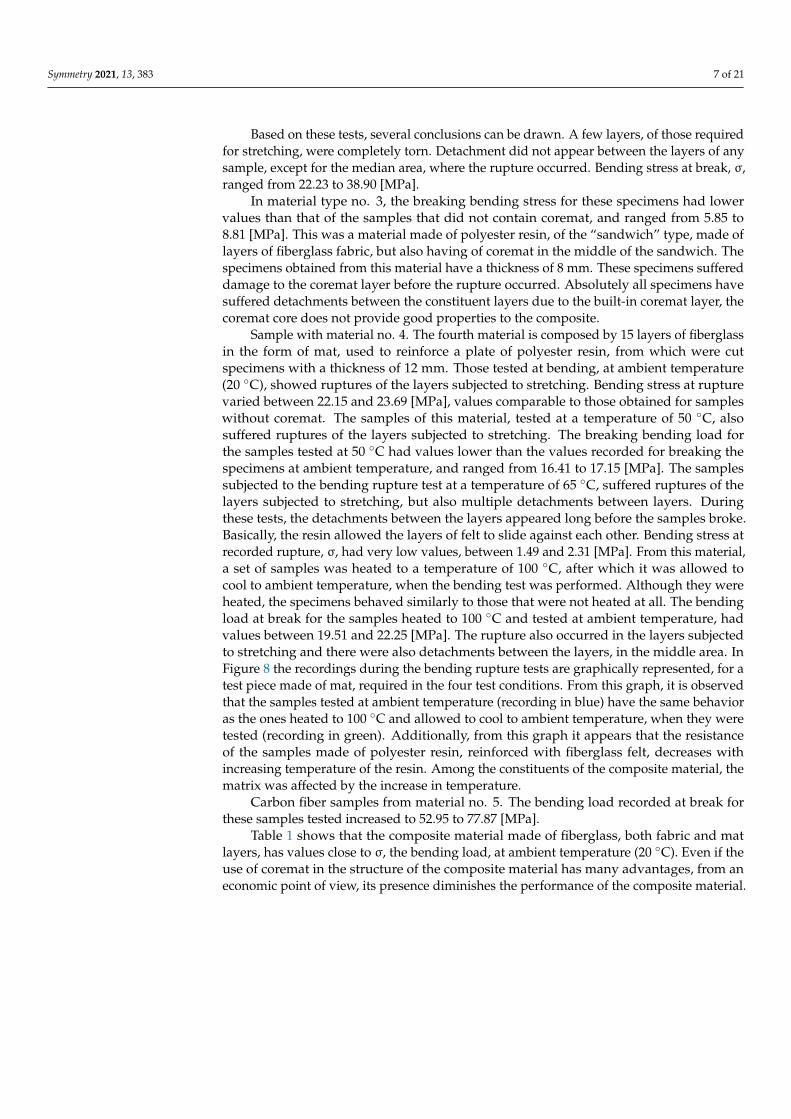
Sample with material no. 4. The fourth material is composed by 15 layers of fiberglassin the form of mat, used to reinforce a plate of polyester resin, from which were cutspecimens with a thickness of 12 mm. Those tested at bending, at ambient temperature(20 ◦C), showed ruptures of the layers subjected to stretching. Bending stress at rupturevaried between 22.15 and 23.69 [MPa], values comparable to those obtained for sampleswithout coremat. The samples of this material, tested at a temperature of 50 ◦C, alsosuffered ruptures of the layers subjected to stretching. The breaking bending load forthe samples tested at 50 ◦C had values lower than the values recorded for breaking thespecimens at ambient temperature, and ranged from 16.41 to 17.15 [MPa]. The samplessubjected to the bending rupture test at a temperature of 65 ◦C, suffered ruptures of thelayers subjected to stretching, but also multiple detachments between layers. Duringthese tests, the detachments between the layers appeared long before the samples broke.Basically, the resin allowed the layers of felt to slide against each other. Bending stress atrecorded rupture, σ, had very low values, between 1.49 and 2.31 [MPa]. From this material,a set of samples was heated to a temperature of 100 ◦C, after which it was allowed tocool to ambient temperature, when the bending test was performed. Although they wereheated, the specimens behaved similarly to those that were not heated at all. The bendingload at break for the samples heated to 100 ◦C and tested at ambient temperature, hadvalues between 19.51 and 22.25 [MPa]. The rupture also occurred in the layers subjectedto stretching and there were also detachments between the layers, in the middle area. InFigure 8 the recordings during the bending rupture tests are graphically represented, for atest piece made of mat, required in the four test conditions. From this graph, it is observedthat the samples tested at ambient temperature (recording in blue) have the same behavioras the ones heated to 100 ◦C and allowed to cool to ambient temperature, when they weretested (recording in green). Additionally, from this graph it appears that the resistanceof the samples made of polyester resin, reinforced with fiberglass felt, decreases withincreasing temperature of the resin. Among the constituents of the composite material, thematrix was affected by the increase in temperature.
Carbon fiber samples from material no. 5. The bending load recorded at break forthese samples tested increased to 52.95 to 77.87 [MPa].
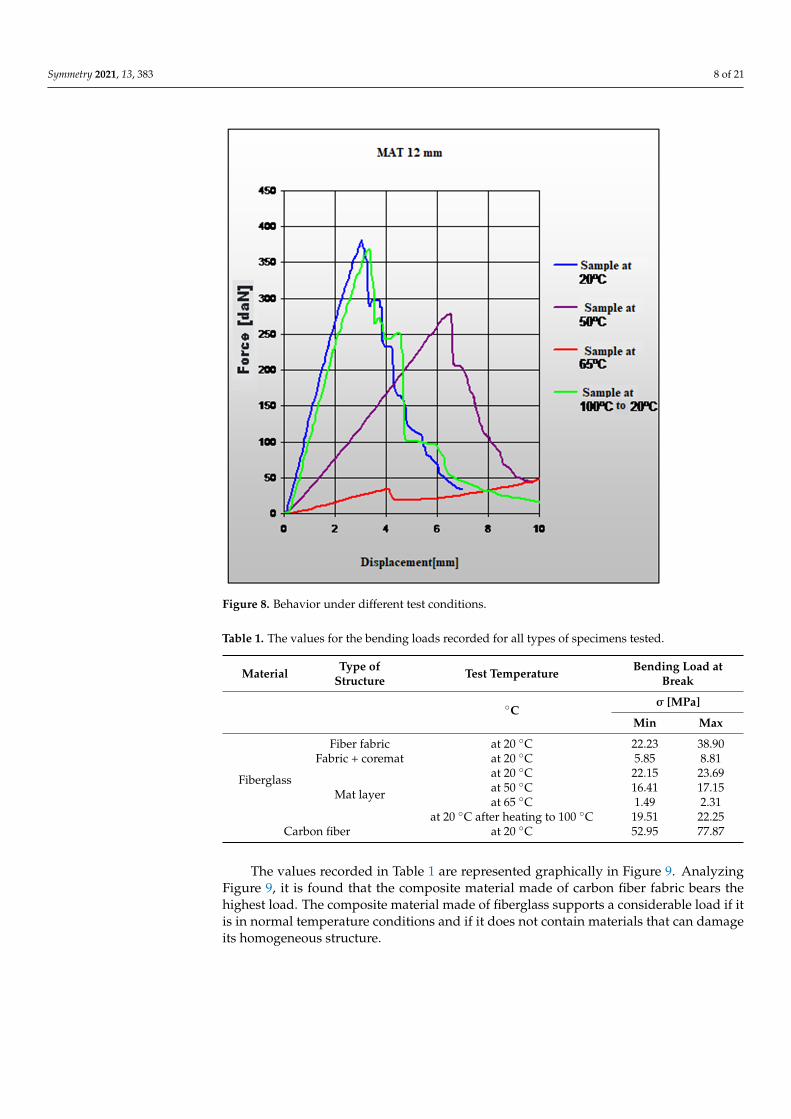
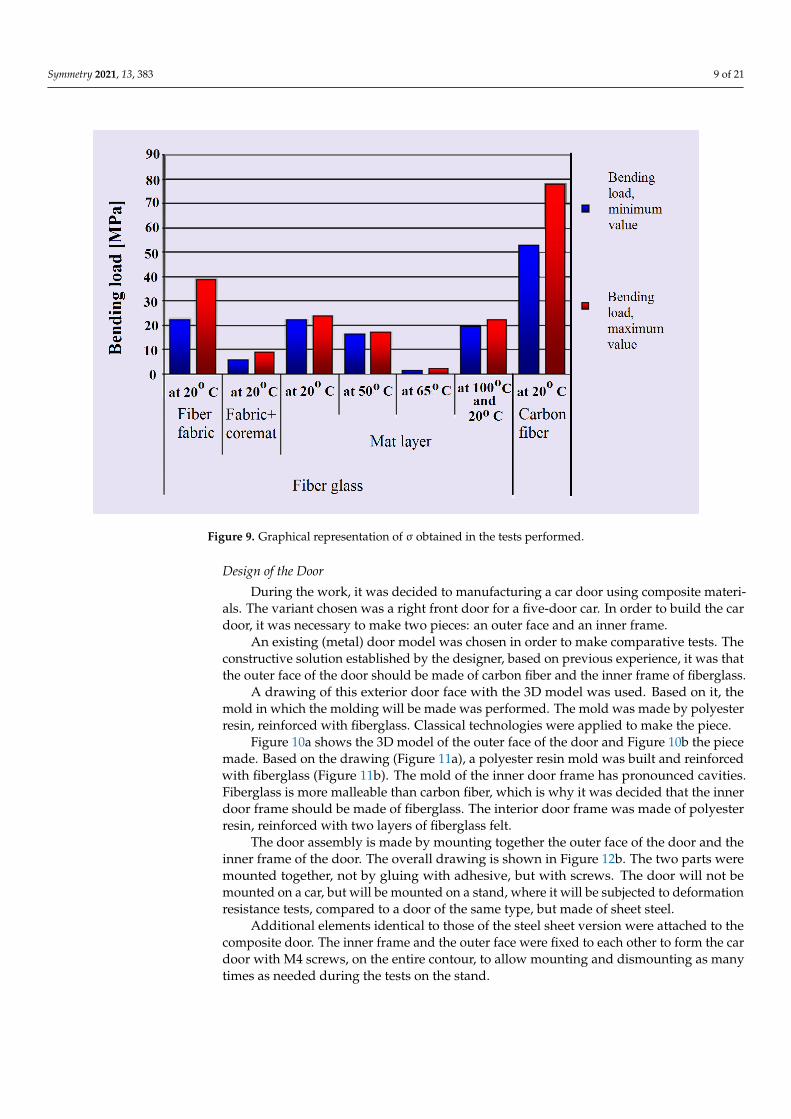
Table 1 shows that the composite material made of fiberglass, both fabric and matlayers, has values close to σ, the bending load, at ambient temperature (20 ◦C). Even if theuse of coremat in the structure of the composite material has many advantages, from aneconomic point of view, its presence diminishes the performance of the composite material.
Symmetry 2021, 13, 383 8 of 21
Symmetry 2021, 13, x FOR PEER REVIEW 7 of 20
tested at 50 °C had values lower than the values recorded for breaking the specimens at ambient temperature, and ranged from 16.41 to 17.15 [MPa]. The samples subjected to the bending rupture test at a temperature of 65 °C, suffered ruptures of the layers subjected to stretching, but also multiple detachments between layers. During these tests, the de-tachments between the layers appeared long before the samples broke. Basically, the resin allowed the layers of felt to slide against each other. Bending stress at recorded rupture, σ, had very low values, between 1.49 and 2.31 [MPa]. From this material, a set of samples was heated to a temperature of 100 °C, after which it was allowed to cool to ambient tem-perature, when the bending test was performed. Although they were heated, the speci-mens behaved similarly to those that were not heated at all. The bending load at break for the samples heated to 100 °C and tested at ambient temperature, had values between 19.51 and 22.25 [MPa]. The rupture also occurred in the layers subjected to stretching and there were also detachments between the layers, in the middle area. In Figure 8 the recordings during the bending rupture tests are graphically represented, for a test piece made of mat, required in the four test conditions. From this graph, it is observed that the samples tested at ambient temperature (recording in blue) have the same behavior as the ones heated to 100 °C and allowed to cool to ambient temperature, when they were tested (recording in green). Additionally, from this graph it appears that the resistance of the samples made of polyester resin, reinforced with fiberglass felt, decreases with increasing temperature of the resin. Among the constituents of the composite material, the matrix was affected by the increase in temperature.
Figure 8. Behavior under different test conditions.
Carbon fiber samples from material no. 5. The bending load recorded at break for these samples tested increased to 52.95 to 77.87 [MPa].
Table 1 shows that the composite material made of fiberglass, both fabric and mat layers, has values close to σ, the bending load, at ambient temperature (20 °C). Even if the use of coremat in the structure of the composite material has many advantages, from an economic point of view, its presence diminishes the performance of the composite mate-rial.
Figure 8. Behavior under different test conditions.
Table 1. The values for the bending loads recorded for all types of specimens tested.
Material Type ofStructure Test Temperature Bending Load at
Break
◦Cσ [MPa]
Min Max
Fiberglass
Fiber fabric at 20 ◦C 22.23 38.90Fabric + coremat at 20 ◦C 5.85 8.81
Mat layer
at 20 ◦C 22.15 23.69at 50 ◦C 16.41 17.15at 65 ◦C 1.49 2.31
at 20 ◦C after heating to 100 ◦C 19.51 22.25Carbon fiber at 20 ◦C 52.95 77.87
The values recorded in Table 1 are represented graphically in Figure 9. AnalyzingFigure 9, it is found that the composite material made of carbon fiber fabric bears thehighest load. The composite material made of fiberglass supports a considerable load if itis in normal temperature conditions and if it does not contain materials that can damageits homogeneous structure.
Symmetry 2021, 13, 383 9 of 21
Symmetry 2021, 13, x FOR PEER REVIEW 8 of 20
Table 1. The values for the bending loads recorded for all types of specimens tested.
Material Type of Structure Test Temperature Bending Load at Break
°C σ[MPa]
Min Max
Fiberglass
Fiber fabric at 20 °C 22.23 38.90 Fabric + coremat at 20 °C 5.85 8.81
Mat layer
at 20 °C 22.15 23.69 at 50 °C 16.41 17.15 at 65 °C 1.49 2.31
at 20 °C after heating to 100 °C 19.51 22.25
Carbon fiber at 20 °C 52.95 77.87
The values recorded in Table 1 are represented graphically in Figure 9. Analyzing Figure 9, it is found that the composite material made of carbon fiber fabric bears the high-est load. The composite material made of fiberglass supports a considerable load if it is in normal temperature conditions and if it does not contain materials that can damage its homogeneous structure.
Figure 9. Graphical representation of σ obtained in the tests performed.
Design of the Door During the work, it was decided to manufacturing a car door using composite mate-
rials. The variant chosen was a right front door for a five-door car. In order to build the car door, it was necessary to make two pieces: an outer face and an inner frame.
An existing (metal) door model was chosen in order to make comparative tests. The constructive solution established by the designer, based on previous experience, it was that the outer face of the door should be made of carbon fiber and the inner frame of fiberglass.
A drawing of this exterior door face with the 3D model was used. Based on it, the mold in which the molding will be made was performed. The mold was made by polyes-ter resin, reinforced with fiberglass. Classical technologies were applied to make the piece.
Figure 9. Graphical representation of σ obtained in the tests performed.
Design of the Door
During the work, it was decided to manufacturing a car door using composite materi-als. The variant chosen was a right front door for a five-door car. In order to build the cardoor, it was necessary to make two pieces: an outer face and an inner frame.
An existing (metal) door model was chosen in order to make comparative tests. Theconstructive solution established by the designer, based on previous experience, it was thatthe outer face of the door should be made of carbon fiber and the inner frame of fiberglass.
A drawing of this exterior door face with the 3D model was used. Based on it, themold in which the molding will be made was performed. The mold was made by polyesterresin, reinforced with fiberglass. Classical technologies were applied to make the piece.
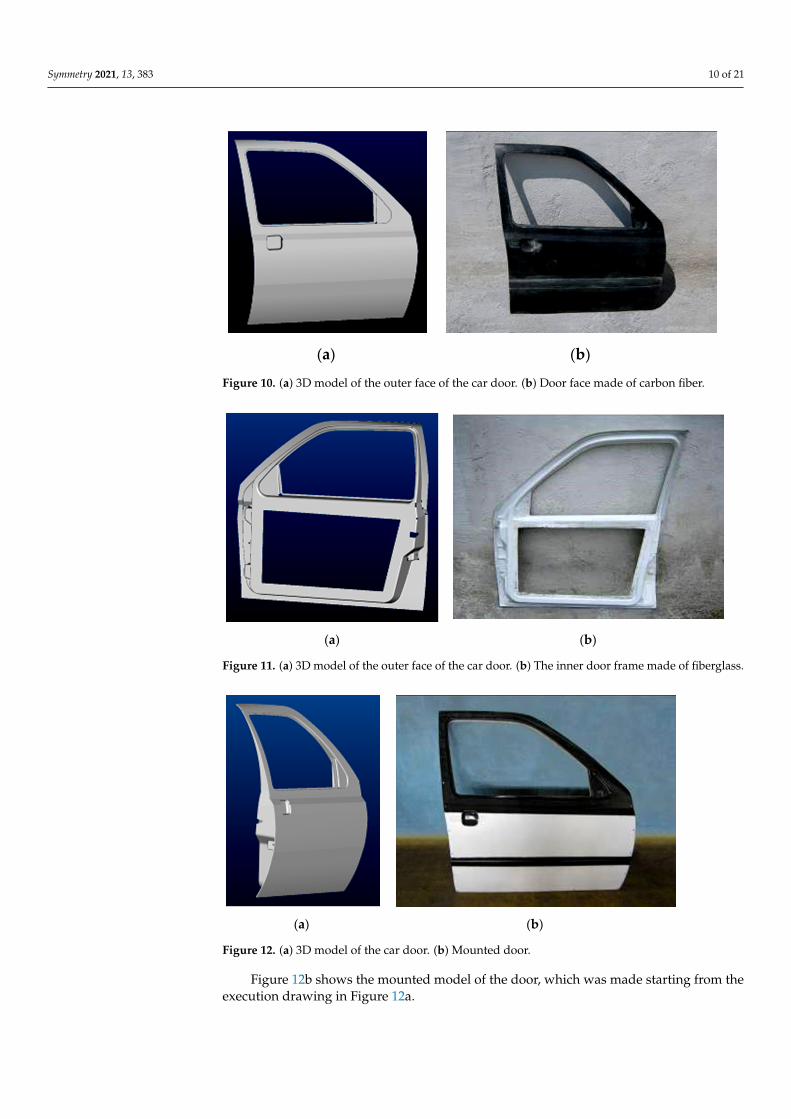
Figure 10a shows the 3D model of the outer face of the door and Figure 10b the piecemade. Based on the drawing (Figure 11a), a polyester resin mold was built and reinforcedwith fiberglass (Figure 11b). The mold of the inner door frame has pronounced cavities.Fiberglass is more malleable than carbon fiber, which is why it was decided that the innerdoor frame should be made of fiberglass. The interior door frame was made of polyesterresin, reinforced with two layers of fiberglass felt.
The door assembly is made by mounting together the outer face of the door and theinner frame of the door. The overall drawing is shown in Figure 12b. The two parts weremounted together, not by gluing with adhesive, but with screws. The door will not bemounted on a car, but will be mounted on a stand, where it will be subjected to deformationresistance tests, compared to a door of the same type, but made of sheet steel.
Additional elements identical to those of the steel sheet version were attached to thecomposite door. The inner frame and the outer face were fixed to each other to form the cardoor with M4 screws, on the entire contour, to allow mounting and dismounting as manytimes as needed during the tests on the stand.
Symmetry 2021, 13, 383 10 of 21
Symmetry 2021, 13, x FOR PEER REVIEW 9 of 20
Figure 10a shows the 3D model of the outer face of the door and Figure 10b the piece made. Based on the drawing (Figure 11a), a polyester resin mold was built and reinforced with fiberglass (Figure 11b). The mold of the inner door frame has pronounced cavities. Fiberglass is more malleable than carbon fiber, which is why it was decided that the inner door frame should be made of fiberglass. The interior door frame was made of polyester resin, reinforced with two layers of fiberglass felt.
(a) (b)
Figure 10. (a) 3D model of the outer face of the car door. (b) Door face made of carbon fiber.
(a) (b)
Figure 11. (a) 3D model of the outer face of the car door. (b) The inner door frame made of fiber-glass.
The door assembly is made by mounting together the outer face of the door and the inner frame of the door. The overall drawing is shown in Figure 12b. The two parts were mounted together, not by gluing with adhesive, but with screws. The door will not be mounted on a car, but will be mounted on a stand, where it will be subjected to defor-mation resistance tests, compared to a door of the same type, but made of sheet steel.
Figure 10. (a) 3D model of the outer face of the car door. (b) Door face made of carbon fiber.
Symmetry 2021, 13, x FOR PEER REVIEW 9 of 20
Figure 10a shows the 3D model of the outer face of the door and Figure 10b the piece made. Based on the drawing (Figure 11a), a polyester resin mold was built and reinforced with fiberglass (Figure 11b). The mold of the inner door frame has pronounced cavities. Fiberglass is more malleable than carbon fiber, which is why it was decided that the inner door frame should be made of fiberglass. The interior door frame was made of polyester resin, reinforced with two layers of fiberglass felt.
(a) (b)
Figure 10. (a) 3D model of the outer face of the car door. (b) Door face made of carbon fiber.
(a) (b)
Figure 11. (a) 3D model of the outer face of the car door. (b) The inner door frame made of fiber-glass.
The door assembly is made by mounting together the outer face of the door and the inner frame of the door. The overall drawing is shown in Figure 12b. The two parts were mounted together, not by gluing with adhesive, but with screws. The door will not be mounted on a car, but will be mounted on a stand, where it will be subjected to defor-mation resistance tests, compared to a door of the same type, but made of sheet steel.
Figure 11. (a) 3D model of the outer face of the car door. (b) The inner door frame made of fiberglass.
Symmetry 2021, 13, x FOR PEER REVIEW 10 of 20
(a) (b)
Figure 12. (a). 3D model of the car door. (b). Mounted door.
Additional elements identical to those of the steel sheet version were attached to the composite door. The inner frame and the outer face were fixed to each other to form the car door with M4 screws, on the entire contour, to allow mounting and dismounting as many times as needed during the tests on the stand.
Figure 12b shows the mounted model of the door, which was made starting from the execution drawing in Figure 12a.
3. Modeling and Experimental Research of the Car Door In order to be able to perform a finite element analysis the model of the structure
must be elaborated. The assumptions considered are the following: - each sheet is shaped in the form of a continuous, linear elastic medium. The theory
does not include cracks, air gaps, etc; - the laminates are orthotropic, parallel, and perfectly glued to each other; - the fibers are not examined in isolation from the matrix or the adhesive layer (inter-
face effects are neglected); - the individual layers are ideally glued to each other. In case of application of loads,
no relative slips appear; - the materials behave linearly, ideally elastic, i.e., for each individual layer the laws of
linear elasticity are valid; - the connections between the components of a mechanical assembly are relatively dif-
ficult to make; - the damping of the mechanical system is generally ignored.
The 3D models made of the door elements were used to perform the analysis with a finite element. The Hyperworks/Hypermesh software suite was used to discretize the CAD model.
3.1. Test Stand for Car Structure The experimental research of the car door was carried out on a stand specially de-
signed for this type of test. The stand must reproduce, as accurately as possible, the way the door is attached to the car. For this reason, a five-door body was used to make the stand, on which the door made of composite materials could be mounted. The doors, hood, rear tailgate, windshield are not mounted on the body. The body does not have the suspension system, steering or power group.
The body was fixed, with the help of clamps, on the laboratory platform. In order for the door to be mounted exactly like on a car, the door sealing gasket (cheddar), the door hinges, its locking system were kept on the body.
Figure 12. (a) 3D model of the car door. (b) Mounted door.
Figure 12b shows the mounted model of the door, which was made starting from theexecution drawing in Figure 12a.
Symmetry 2021, 13, 383 11 of 21
3. Modeling and Experimental Research of the Car Door
In order to be able to perform a finite element analysis the model of the structure mustbe elaborated. The assumptions considered are the following:
- each sheet is shaped in the form of a continuous, linear elastic medium. The theorydoes not include cracks, air gaps, etc;
- the laminates are orthotropic, parallel, and perfectly glued to each other;- the fibers are not examined in isolation from the matrix or the adhesive layer (interface
effects are neglected);- the individual layers are ideally glued to each other. In case of application of loads,
no relative slips appear;- the materials behave linearly, ideally elastic, i.e., for each individual layer the laws of
linear elasticity are valid;- the connections between the components of a mechanical assembly are relatively
difficult to make;- the damping of the mechanical system is generally ignored.
The 3D models made of the door elements were used to perform the analysis witha finite element. The Hyperworks/Hypermesh software suite was used to discretize theCAD model.
3.1. Test Stand for Car Structure
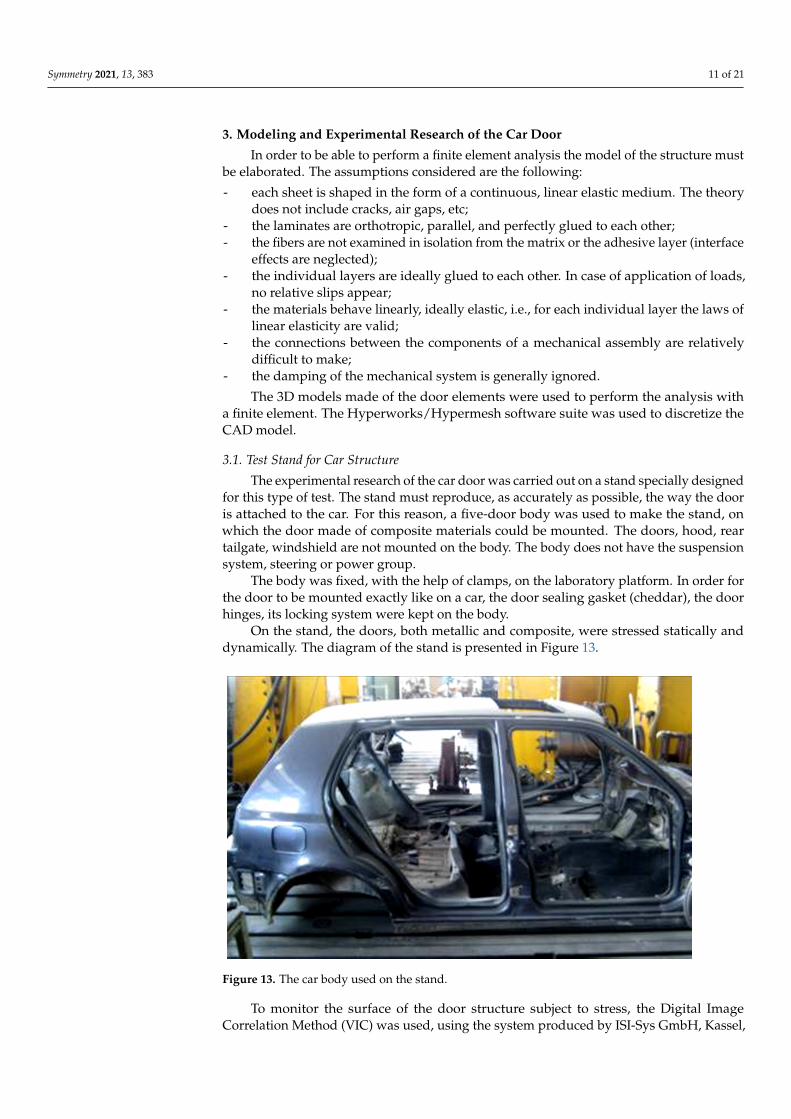
The experimental research of the car door was carried out on a stand specially designedfor this type of test. The stand must reproduce, as accurately as possible, the way the dooris attached to the car. For this reason, a five-door body was used to make the stand, onwhich the door made of composite materials could be mounted. The doors, hood, reartailgate, windshield are not mounted on the body. The body does not have the suspensionsystem, steering or power group.
The body was fixed, with the help of clamps, on the laboratory platform. In order forthe door to be mounted exactly like on a car, the door sealing gasket (cheddar), the doorhinges, its locking system were kept on the body.
On the stand, the doors, both metallic and composite, were stressed statically anddynamically. The diagram of the stand is presented in Figure 13.
Symmetry 2021, 13, x FOR PEER REVIEW 11 of 20
On the stand, the doors, both metallic and composite, were stressed statically and dynamically. The diagram of the stand is presented in Figure 13.
Figure 13. The car body used on the stand.
To monitor the surface of the door structure subject to stress, the Digital Image Cor-relation Method (VIC) was used, using the system produced by ISI-Sys GmbH, Kassel, Germany. The system is made with the help of two digital cameras, mounted on a tripod, whose high-fidelity images are processed using software.
The door test was made with a static charging device. The device is made of an up-right, also fixed on the metal platform of the laboratory, on which is mounted a mecha-nism by means of which the door is operated and its request is recorded. The device is made of an upright, also fixed on the metal platform of the laboratory, on which is mounted a mechanism by means of which the door is operated and the force is recorded. On the upright (3) of Figure 14, a support (4) is fixed in which the loading mechanism is located. The loading mechanism of the door (8), which is mounted on the vehicle body (2), by means of the rod (6), on which the force transducer (7) follows. The support can be moved vertically with respect to the upright, by means of a screw–nut mechanism. The door loading mechanism is also made on the nut–nut principle. Thus, turning the nut (5) produces a controlled, horizontal movement of the mechanism rod (6), which in turn acts on the door, by means of the force transducer (8).
Figure 14. Stand diagram. 1. Metal platform; 2. car body; 3.mount; 4. support loading mechanism; 5. nut; 6. rod loading mechanism; 7. force transducer; 8. door; 9. speaker without membrane; 10. sound level meter; 11. cameras of the Video Image Correlation (VIC) system; 12. tripod; 13. com-puter.
For this test, the car doors, both metallic and composite, were covered on the outside with a layer of matte white paint. Over this layer of white paint, in the monitored area, will be applied, by spraying, stains with random dimensions, shape, and distribution, which will ensure a good contrast and an easy subsequent identification for the cameras of the VIC system.
Figure 13. The car body used on the stand.
To monitor the surface of the door structure subject to stress, the Digital ImageCorrelation Method (VIC) was used, using the system produced by ISI-Sys GmbH, Kassel,
Symmetry 2021, 13, 383 12 of 21
Germany. The system is made with the help of two digital cameras, mounted on a tripod,whose high-fidelity images are processed using software.
The door test was made with a static charging device. The device is made of an upright,also fixed on the metal platform of the laboratory, on which is mounted a mechanism bymeans of which the door is operated and its request is recorded. The device is madeof an upright, also fixed on the metal platform of the laboratory, on which is mounteda mechanism by means of which the door is operated and the force is recorded. Onthe upright (3) of Figure 14, a support (4) is fixed in which the loading mechanism islocated. The loading mechanism of the door (8), which is mounted on the vehicle body(2), by means of the rod (6), on which the force transducer (7) follows. The support can bemoved vertically with respect to the upright, by means of a screw–nut mechanism. Thedoor loading mechanism is also made on the nut–nut principle. Thus, turning the nut (5)produces a controlled, horizontal movement of the mechanism rod (6), which in turn actson the door, by means of the force transducer (8).
Symmetry 2021, 13, x FOR PEER REVIEW 11 of 20
On the stand, the doors, both metallic and composite, were stressed statically and dynamically. The diagram of the stand is presented in Figure 13.
Figure 13. The car body used on the stand.
To monitor the surface of the door structure subject to stress, the Digital Image Cor-relation Method (VIC) was used, using the system produced by ISI-Sys GmbH, Kassel, Germany. The system is made with the help of two digital cameras, mounted on a tripod, whose high-fidelity images are processed using software.
The door test was made with a static charging device. The device is made of an up-right, also fixed on the metal platform of the laboratory, on which is mounted a mecha-nism by means of which the door is operated and its request is recorded. The device is made of an upright, also fixed on the metal platform of the laboratory, on which is mounted a mechanism by means of which the door is operated and the force is recorded. On the upright (3) of Figure 14, a support (4) is fixed in which the loading mechanism is located. The loading mechanism of the door (8), which is mounted on the vehicle body (2), by means of the rod (6), on which the force transducer (7) follows. The support can be moved vertically with respect to the upright, by means of a screw–nut mechanism. The door loading mechanism is also made on the nut–nut principle. Thus, turning the nut (5) produces a controlled, horizontal movement of the mechanism rod (6), which in turn acts on the door, by means of the force transducer (8).
Figure 14. Stand diagram. 1. Metal platform; 2. car body; 3.mount; 4. support loading mechanism; 5. nut; 6. rod loading mechanism; 7. force transducer; 8. door; 9. speaker without membrane; 10. sound level meter; 11. cameras of the Video Image Correlation (VIC) system; 12. tripod; 13. com-puter.
For this test, the car doors, both metallic and composite, were covered on the outside with a layer of matte white paint. Over this layer of white paint, in the monitored area, will be applied, by spraying, stains with random dimensions, shape, and distribution, which will ensure a good contrast and an easy subsequent identification for the cameras of the VIC system.
Figure 14. Stand diagram. 1. Metal platform; 2. car body; 3.mount; 4. support loading mechanism;5. nut; 6. rod loading mechanism; 7. force transducer; 8. door; 9. speaker without membrane;10. sound level meter; 11. cameras of the Video Image Correlation (VIC) system; 12. tripod;13. computer.
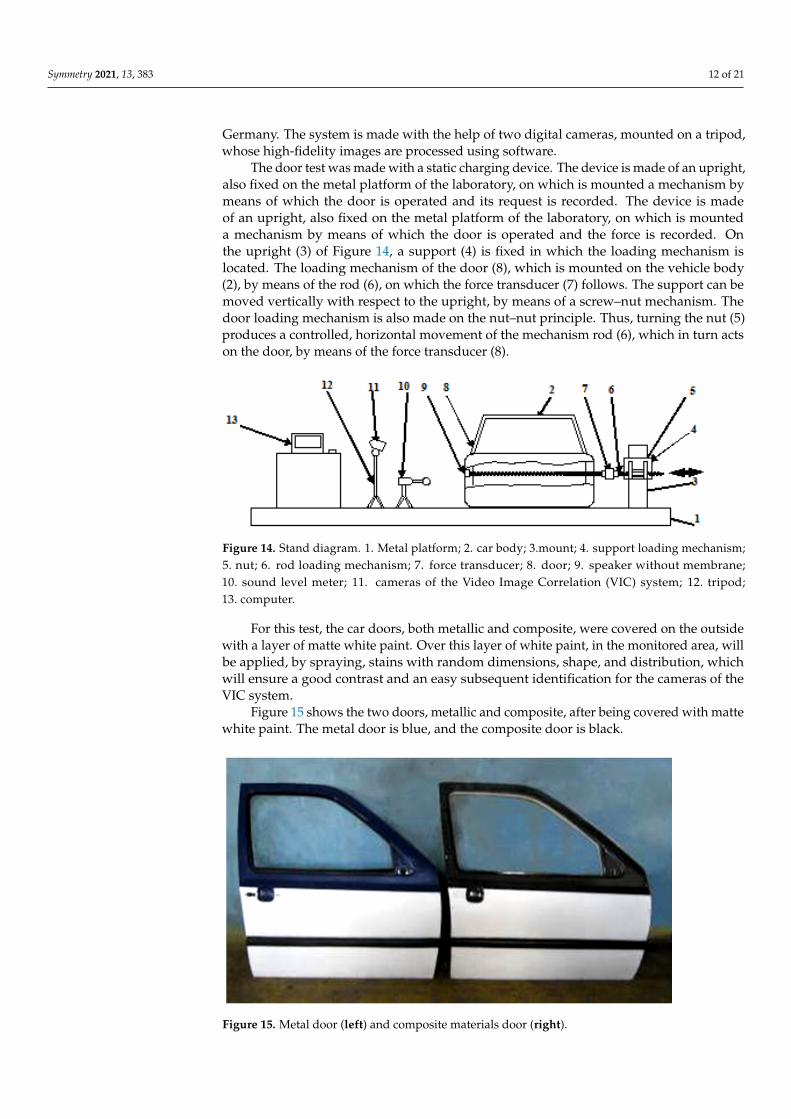
For this test, the car doors, both metallic and composite, were covered on the outsidewith a layer of matte white paint. Over this layer of white paint, in the monitored area, willbe applied, by spraying, stains with random dimensions, shape, and distribution, whichwill ensure a good contrast and an easy subsequent identification for the cameras of theVIC system.
Figure 15 shows the two doors, metallic and composite, after being covered with mattewhite paint. The metal door is blue, and the composite door is black.
Symmetry 2021, 13, x FOR PEER REVIEW 12 of 20
Figure 15 shows the two doors, metallic and composite, after being covered with matte white paint. The metal door is blue, and the composite door is black.
Figure 15. Metal door (left) and composite materials door (right).
On the car body, fixed on the laboratory platform, will be mounted, in turn, the metal door and the composite door to be loaded both statically and dynamically.
To monitor the surface of the door subjected to static load, the Digital Image Corre-lation Method (VIC) (Video Image Correlation) is used, which allows high-precision ex-perimental investigations (of the order of microns, μm). This is an optical method of in-vestigation, without direct contact with the surface of the analyzed part and is not de-pendent on its material either. It does not intervene in the intimate process of changing the field of displacements and deformations of the structure under the action of external influencing factors, to which the piece would be subjected.
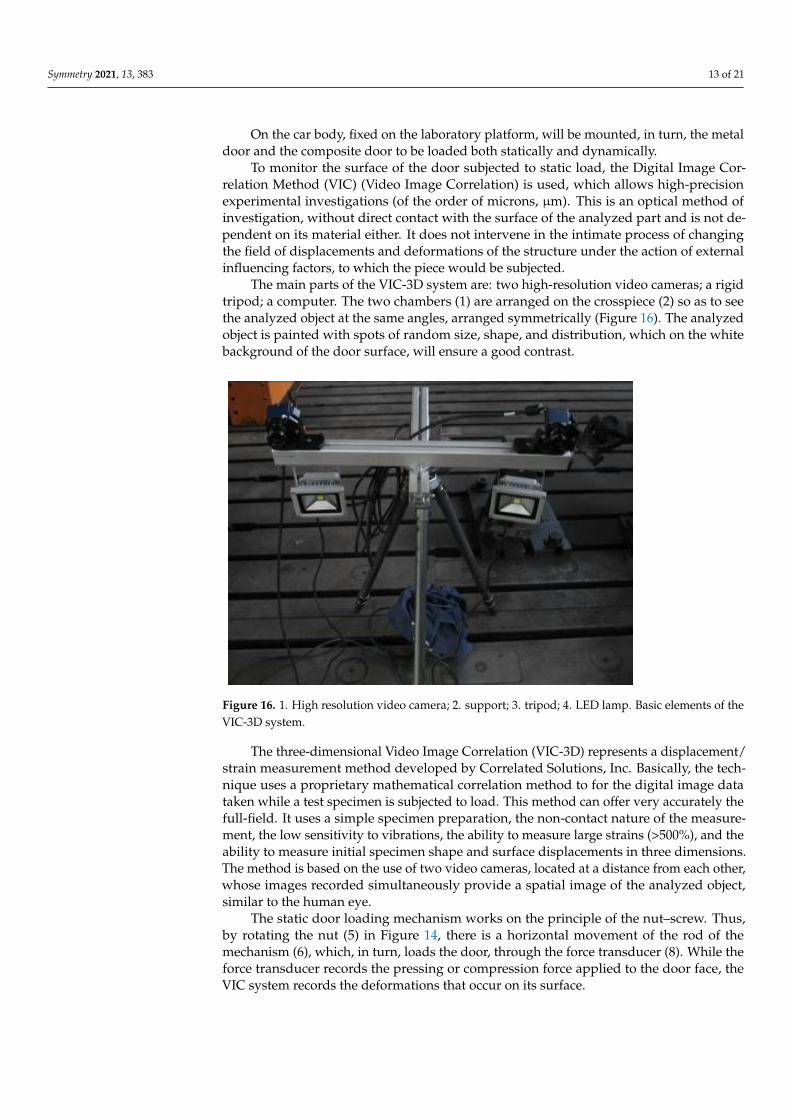
The main parts of the VIC-3D system are: two high-resolution video cameras; a rigid tripod; a computer. The two chambers (1) are arranged on the crosspiece (2) so as to see the analyzed object at the same angles, arranged symmetrically (Figure 16). The analyzed object is painted with spots of random size, shape, and distribution, which on the white background of the door surface, will ensure a good contrast.
Figure 16. 1. High resolution video camera; 2. support; 3. tripod; 4. LED lamp. Basic elements of the VIC-3D system.
The three-dimensional Video Image Correlation (VIC-3D) represents a displace-ment/strain measurement method developed by Correlated Solutions, Inc. Basically, the technique uses a proprietary mathematical correlation method to for the digital image data taken while a test specimen is subjected to load. This method can offer very accu-rately the full-field. It uses a simple specimen preparation, the non-contact nature of the measurement, the low sensitivity to vibrations, the ability to measure large strains (>500%), and the ability to measure initial specimen shape and surface displacements in
Figure 15. Metal door (left) and composite materials door (right).
Symmetry 2021, 13, 383 13 of 21
On the car body, fixed on the laboratory platform, will be mounted, in turn, the metaldoor and the composite door to be loaded both statically and dynamically.
To monitor the surface of the door subjected to static load, the Digital Image Cor-relation Method (VIC) (Video Image Correlation) is used, which allows high-precisionexperimental investigations (of the order of microns, µm). This is an optical method ofinvestigation, without direct contact with the surface of the analyzed part and is not de-pendent on its material either. It does not intervene in the intimate process of changingthe field of displacements and deformations of the structure under the action of externalinfluencing factors, to which the piece would be subjected.
The main parts of the VIC-3D system are: two high-resolution video cameras; a rigidtripod; a computer. The two chambers (1) are arranged on the crosspiece (2) so as to seethe analyzed object at the same angles, arranged symmetrically (Figure 16). The analyzedobject is painted with spots of random size, shape, and distribution, which on the whitebackground of the door surface, will ensure a good contrast.
Symmetry 2021, 13, x FOR PEER REVIEW 12 of 20
Figure 15 shows the two doors, metallic and composite, after being covered with matte white paint. The metal door is blue, and the composite door is black.
Figure 15. Metal door (left) and composite materials door (right).
On the car body, fixed on the laboratory platform, will be mounted, in turn, the metal door and the composite door to be loaded both statically and dynamically.
To monitor the surface of the door subjected to static load, the Digital Image Corre-lation Method (VIC) (Video Image Correlation) is used, which allows high-precision ex-perimental investigations (of the order of microns, μm). This is an optical method of in-vestigation, without direct contact with the surface of the analyzed part and is not de-pendent on its material either. It does not intervene in the intimate process of changing the field of displacements and deformations of the structure under the action of external influencing factors, to which the piece would be subjected.
The main parts of the VIC-3D system are: two high-resolution video cameras; a rigid tripod; a computer. The two chambers (1) are arranged on the crosspiece (2) so as to see the analyzed object at the same angles, arranged symmetrically (Figure 16). The analyzed object is painted with spots of random size, shape, and distribution, which on the white background of the door surface, will ensure a good contrast.
Figure 16. 1. High resolution video camera; 2. support; 3. tripod; 4. LED lamp. Basic elements of the VIC-3D system.
The three-dimensional Video Image Correlation (VIC-3D) represents a displace-ment/strain measurement method developed by Correlated Solutions, Inc. Basically, the technique uses a proprietary mathematical correlation method to for the digital image data taken while a test specimen is subjected to load. This method can offer very accu-rately the full-field. It uses a simple specimen preparation, the non-contact nature of the measurement, the low sensitivity to vibrations, the ability to measure large strains (>500%), and the ability to measure initial specimen shape and surface displacements in
Figure 16. 1. High resolution video camera; 2. support; 3. tripod; 4. LED lamp. Basic elements of theVIC-3D system.
The three-dimensional Video Image Correlation (VIC-3D) represents a displacement/strain measurement method developed by Correlated Solutions, Inc. Basically, the tech-nique uses a proprietary mathematical correlation method to for the digital image datataken while a test specimen is subjected to load. This method can offer very accurately thefull-field. It uses a simple specimen preparation, the non-contact nature of the measure-ment, the low sensitivity to vibrations, the ability to measure large strains (>500%), and theability to measure initial specimen shape and surface displacements in three dimensions.The method is based on the use of two video cameras, located at a distance from each other,whose images recorded simultaneously provide a spatial image of the analyzed object,similar to the human eye.
The static door loading mechanism works on the principle of the nut–screw. Thus,by rotating the nut (5) in Figure 14, there is a horizontal movement of the rod of themechanism (6), which, in turn, loads the door, through the force transducer (8). While theforce transducer records the pressing or compression force applied to the door face, theVIC system records the deformations that occur on its surface.
Symmetry 2021, 13, 383 14 of 21
3.2. Experimental Research of a Classical Metal Structure
The metal door was mounted on the body (Figure 17). It is fastened in hinges and restson the sealing gasket (cheder). The static door loading mechanism works on the principleof the nut–screw. When the mechanism presses on the power transducer, the door panel isapplied from the inside of the vehicle to the outside (we call this experiment traction), andwhen the mechanism pulls the force transducer, the door panel is applied from the outsideto the inside of the vehicle (we call this experiment compression).
Symmetry 2021, 13, x FOR PEER REVIEW 13 of 20
three dimensions. The method is based on the use of two video cameras, located at a dis-tance from each other, whose images recorded simultaneously provide a spatial image of the analyzed object, similar to the human eye.
The static door loading mechanism works on the principle of the nut–screw. Thus, by rotating the nut (5) in Figure 14, there is a horizontal movement of the rod of the mech-anism (6), which, in turn, loads the door, through the force transducer (8). While the force transducer records the pressing or compression force applied to the door face, the VIC system records the deformations that occur on its surface.
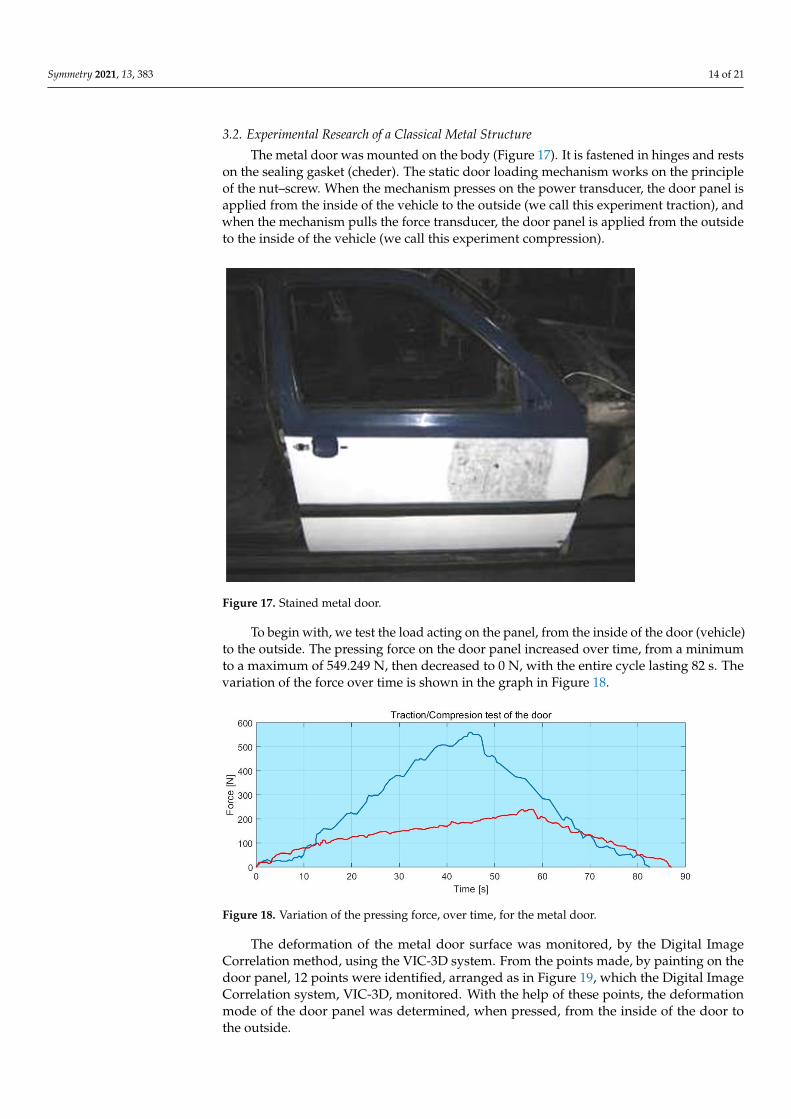
3.2. Experimental Research of a Classical Metal Structure The metal door was mounted on the body (Figure 17). It is fastened in hinges and
rests on the sealing gasket (cheder). The static door loading mechanism works on the prin-ciple of the nut–screw. When the mechanism presses on the power transducer, the door panel is applied from the inside of the vehicle to the outside (we call this experiment trac-tion), and when the mechanism pulls the force transducer, the door panel is applied from the outside to the inside of the vehicle (we call this experiment compression).
Figure 17. Stained metal door.
To begin with, we test the load acting on the panel, from the inside of the door (vehi-cle) to the outside. The pressing force on the door panel increased over time, from a min-imum to a maximum of 549.249 N, then decreased to 0 N, with the entire cycle lasting 82 s. The variation of the force over time is shown in the graph in Figure 18.
Figure 18. Variation of the pressing force, over time, for the metal door.
The deformation of the metal door surface was monitored, by the Digital Image Cor-relation method, using the VIC-3D system. From the points made, by painting on the door panel, 12 points were identified, arranged as in Figure 19, which the Digital Image Corre-lation system, VIC-3D, monitored. With the help of these points, the deformation mode of the door panel was determined, when pressed, from the inside of the door to the outside.
Figure 17. Stained metal door.
To begin with, we test the load acting on the panel, from the inside of the door (vehicle)to the outside. The pressing force on the door panel increased over time, from a minimumto a maximum of 549.249 N, then decreased to 0 N, with the entire cycle lasting 82 s. Thevariation of the force over time is shown in the graph in Figure 18.
Symmetry 2021, 13, x FOR PEER REVIEW 13 of 20
three dimensions. The method is based on the use of two video cameras, located at a dis-tance from each other, whose images recorded simultaneously provide a spatial image of the analyzed object, similar to the human eye.
The static door loading mechanism works on the principle of the nut–screw. Thus, by rotating the nut (5) in Figure 14, there is a horizontal movement of the rod of the mech-anism (6), which, in turn, loads the door, through the force transducer (8). While the force transducer records the pressing or compression force applied to the door face, the VIC system records the deformations that occur on its surface.
3.2. Experimental Research of a Classical Metal Structure The metal door was mounted on the body (Figure 17). It is fastened in hinges and
rests on the sealing gasket (cheder). The static door loading mechanism works on the prin-ciple of the nut–screw. When the mechanism presses on the power transducer, the door panel is applied from the inside of the vehicle to the outside (we call this experiment trac-tion), and when the mechanism pulls the force transducer, the door panel is applied from the outside to the inside of the vehicle (we call this experiment compression).
Figure 17. Stained metal door.
To begin with, we test the load acting on the panel, from the inside of the door (vehi-cle) to the outside. The pressing force on the door panel increased over time, from a min-imum to a maximum of 549.249 N, then decreased to 0 N, with the entire cycle lasting 82 s. The variation of the force over time is shown in the graph in Figure 18.
Figure 18. Variation of the pressing force, over time, for the metal door.
The deformation of the metal door surface was monitored, by the Digital Image Cor-relation method, using the VIC-3D system. From the points made, by painting on the door panel, 12 points were identified, arranged as in Figure 19, which the Digital Image Corre-lation system, VIC-3D, monitored. With the help of these points, the deformation mode of the door panel was determined, when pressed, from the inside of the door to the outside.
Figure 18. Variation of the pressing force, over time, for the metal door.
The deformation of the metal door surface was monitored, by the Digital ImageCorrelation method, using the VIC-3D system. From the points made, by painting on thedoor panel, 12 points were identified, arranged as in Figure 19, which the Digital ImageCorrelation system, VIC-3D, monitored. With the help of these points, the deformationmode of the door panel was determined, when pressed, from the inside of the door tothe outside.
Symmetry 2021, 13, 383 15 of 21Symmetry 2021, 13, x FOR PEER REVIEW 14 of 20
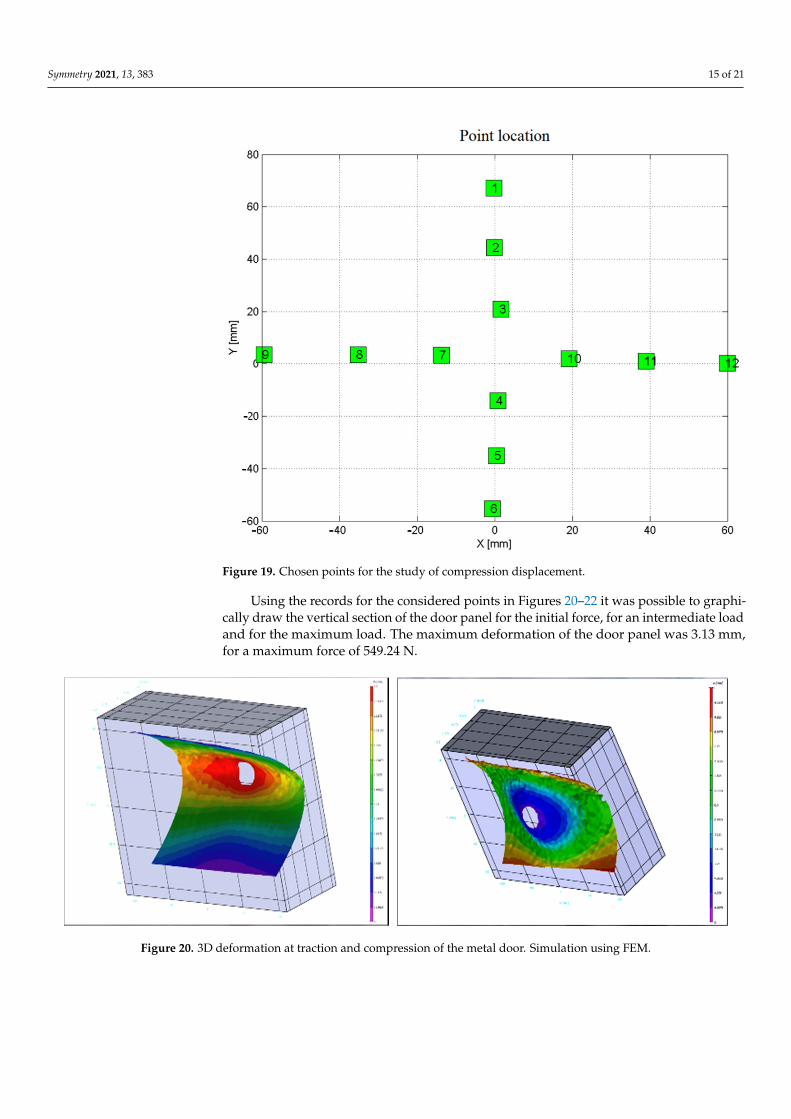
Figure 19. Chosen points for the study of compression displacement.
Using the records for the considered points in Figures 20–22 it was possible to graph-ically draw the vertical section of the door panel for the initial force, for an intermediate load and for the maximum load. The maximum deformation of the door panel was 3.13 mm, for a maximum force of 549.24 N.
Figure 20. 3D deformation at traction and compression of the metal door. Simulation using FEM.
Figure 19. Chosen points for the study of compression displacement.
Using the records for the considered points in Figures 20–22 it was possible to graphi-cally draw the vertical section of the door panel for the initial force, for an intermediate loadand for the maximum load. The maximum deformation of the door panel was 3.13 mm,for a maximum force of 549.24 N.
Symmetry 2021, 13, x FOR PEER REVIEW 14 of 20
Figure 19. Chosen points for the study of compression displacement.
Using the records for the considered points in Figures 20–22 it was possible to graph-ically draw the vertical section of the door panel for the initial force, for an intermediate load and for the maximum load. The maximum deformation of the door panel was 3.13 mm, for a maximum force of 549.24 N.
Figure 20. 3D deformation at traction and compression of the metal door. Simulation using FEM. Figure 20. 3D deformation at traction and compression of the metal door. Simulation using FEM.
Symmetry 2021, 13, 383 16 of 21Symmetry 2021, 13, x FOR PEER REVIEW 15 of 20
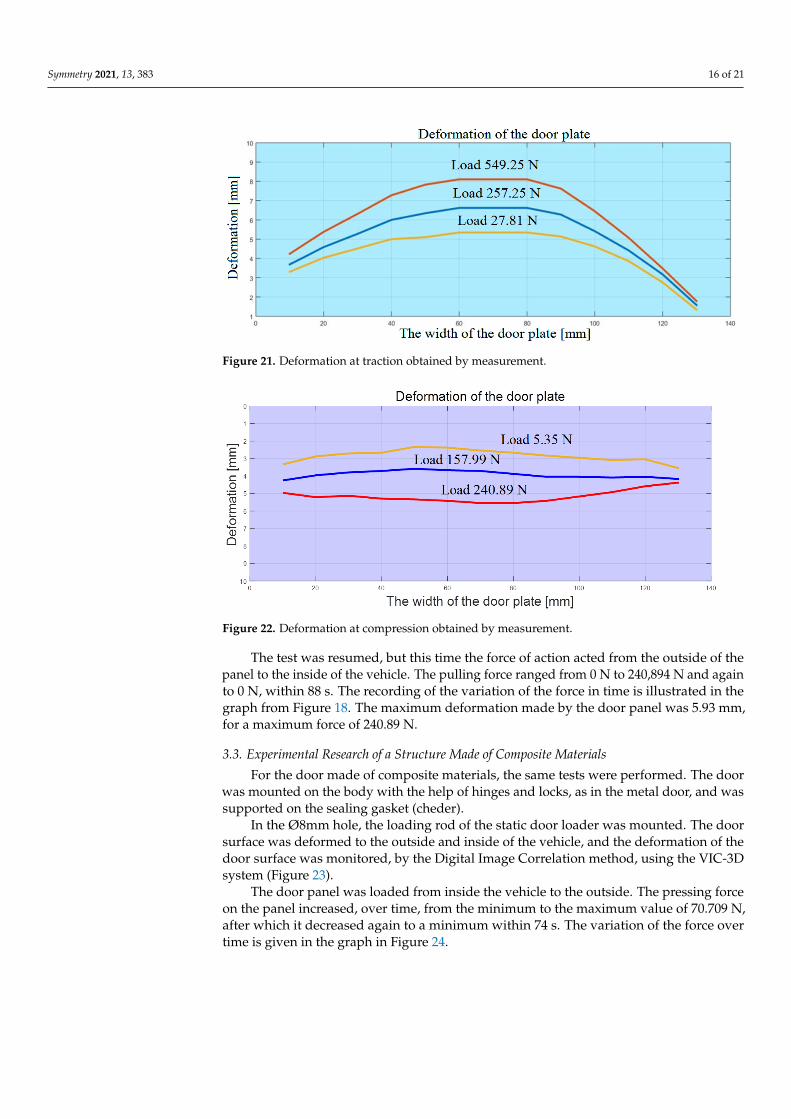
Figure 21. Deformation at traction obtained by measurement.
Figure 22. Deformation at compression obtained by measurement.
The test was resumed, but this time the force of action acted from the outside of the panel to the inside of the vehicle. The pulling force ranged from 0 N to 240,894 N and again to 0 N, within 88 s. The recording of the variation of the force in time is illustrated in the graph from Figure 18. The maximum deformation made by the door panel was 5.93 mm, for a maximum force of 240.89 N.
3.3. Experimental Research of a Structure Made of Composite Materials For the door made of composite materials, the same tests were performed. The door
was mounted on the body with the help of hinges and locks, as in the metal door, and was supported on the sealing gasket (cheder).
In the Ø8mm hole, the loading rod of the static door loader was mounted. The door surface was deformed to the outside and inside of the vehicle, and the deformation of the door surface was monitored, by the Digital Image Correlation method, using the VIC-3D system (Figure 23).
Figure 21. Deformation at traction obtained by measurement.
Symmetry 2021, 13, x FOR PEER REVIEW 15 of 20
Figure 21. Deformation at traction obtained by measurement.
Figure 22. Deformation at compression obtained by measurement.
The test was resumed, but this time the force of action acted from the outside of the panel to the inside of the vehicle. The pulling force ranged from 0 N to 240,894 N and again to 0 N, within 88 s. The recording of the variation of the force in time is illustrated in the graph from Figure 18. The maximum deformation made by the door panel was 5.93 mm, for a maximum force of 240.89 N.
3.3. Experimental Research of a Structure Made of Composite Materials For the door made of composite materials, the same tests were performed. The door
was mounted on the body with the help of hinges and locks, as in the metal door, and was supported on the sealing gasket (cheder).
In the Ø8mm hole, the loading rod of the static door loader was mounted. The door surface was deformed to the outside and inside of the vehicle, and the deformation of the door surface was monitored, by the Digital Image Correlation method, using the VIC-3D system (Figure 23).
Figure 22. Deformation at compression obtained by measurement.
The test was resumed, but this time the force of action acted from the outside of thepanel to the inside of the vehicle. The pulling force ranged from 0 N to 240,894 N and againto 0 N, within 88 s. The recording of the variation of the force in time is illustrated in thegraph from Figure 18. The maximum deformation made by the door panel was 5.93 mm,for a maximum force of 240.89 N.
3.3. Experimental Research of a Structure Made of Composite Materials
For the door made of composite materials, the same tests were performed. The doorwas mounted on the body with the help of hinges and locks, as in the metal door, and wassupported on the sealing gasket (cheder).
In the Ø8mm hole, the loading rod of the static door loader was mounted. The doorsurface was deformed to the outside and inside of the vehicle, and the deformation of thedoor surface was monitored, by the Digital Image Correlation method, using the VIC-3Dsystem (Figure 23).
The door panel was loaded from inside the vehicle to the outside. The pressing forceon the panel increased, over time, from the minimum to the maximum value of 70.709 N,after which it decreased again to a minimum within 74 s. The variation of the force overtime is given in the graph in Figure 24.
Symmetry 2021, 13, 383 17 of 21Symmetry 2021, 13, x FOR PEER REVIEW 16 of 20
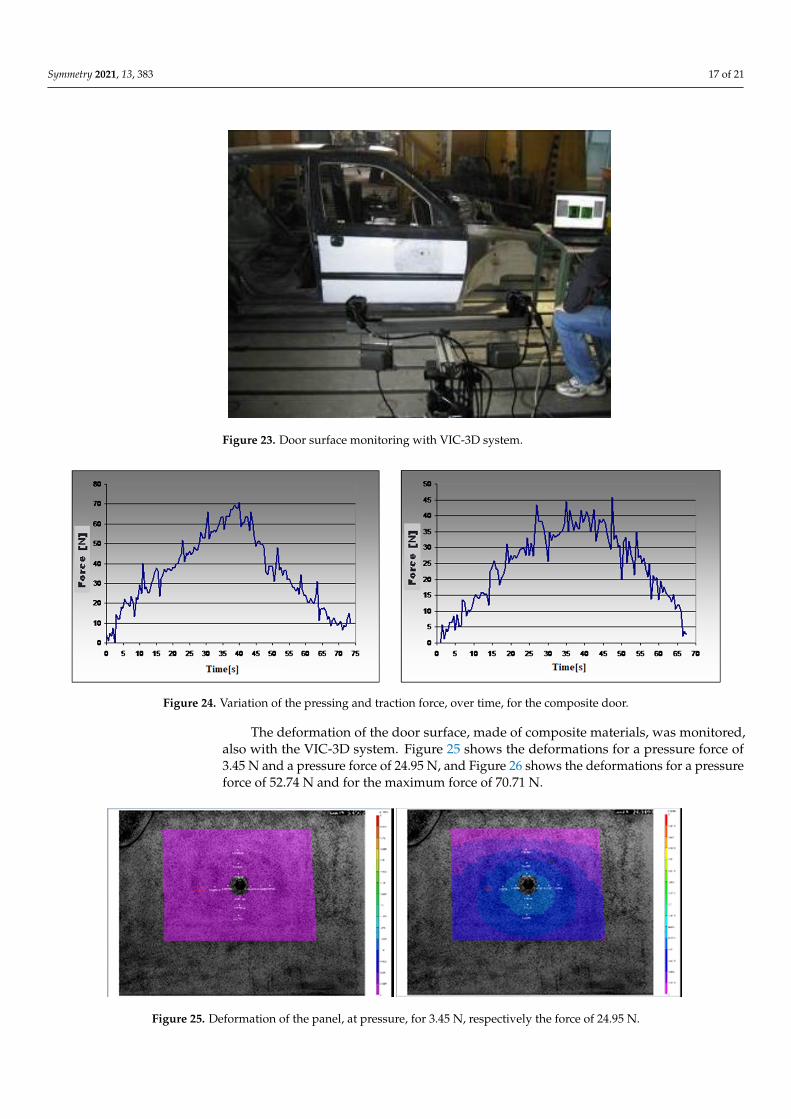
Figure 23. Door surface monitoring with VIC-3D system.
The door panel was loaded from inside the vehicle to the outside. The pressing force on the panel increased, over time, from the minimum to the maximum value of 70.709 N, after which it decreased again to a minimum within 74 s. The variation of the force over time is given in the graph in Figure 24.
Figure 24. Variation of the pressing and traction force, over time, for the composite door.
The deformation of the door surface, made of composite materials, was monitored, also with the VIC-3D system. Figure 25 shows the deformations for a pressure force of 3.45 N and a pressure force of 24.95 N, and Figure 26 shows the deformations for a pres-sure force of 52.74 N and for the maximum force of 70.71N.
Figure 25. Deformation of the panel, at pressure, for 3.45 N, respectively the force of 24.95 N.
Figure 23. Door surface monitoring with VIC-3D system.
Symmetry 2021, 13, x FOR PEER REVIEW 16 of 20
Figure 23. Door surface monitoring with VIC-3D system.
The door panel was loaded from inside the vehicle to the outside. The pressing force on the panel increased, over time, from the minimum to the maximum value of 70.709 N, after which it decreased again to a minimum within 74 s. The variation of the force over time is given in the graph in Figure 24.
Figure 24. Variation of the pressing and traction force, over time, for the composite door.
The deformation of the door surface, made of composite materials, was monitored, also with the VIC-3D system. Figure 25 shows the deformations for a pressure force of 3.45 N and a pressure force of 24.95 N, and Figure 26 shows the deformations for a pres-sure force of 52.74 N and for the maximum force of 70.71N.
Figure 25. Deformation of the panel, at pressure, for 3.45 N, respectively the force of 24.95 N.
Figure 24. Variation of the pressing and traction force, over time, for the composite door.
The deformation of the door surface, made of composite materials, was monitored,also with the VIC-3D system. Figure 25 shows the deformations for a pressure force of3.45 N and a pressure force of 24.95 N, and Figure 26 shows the deformations for a pressureforce of 52.74 N and for the maximum force of 70.71 N.
Symmetry 2021, 13, x FOR PEER REVIEW 16 of 20
Figure 23. Door surface monitoring with VIC-3D system.
The door panel was loaded from inside the vehicle to the outside. The pressing force on the panel increased, over time, from the minimum to the maximum value of 70.709 N, after which it decreased again to a minimum within 74 s. The variation of the force over time is given in the graph in Figure 24.
Figure 24. Variation of the pressing and traction force, over time, for the composite door.
The deformation of the door surface, made of composite materials, was monitored, also with the VIC-3D system. Figure 25 shows the deformations for a pressure force of 3.45 N and a pressure force of 24.95 N, and Figure 26 shows the deformations for a pres-sure force of 52.74 N and for the maximum force of 70.71N.
Figure 25. Deformation of the panel, at pressure, for 3.45 N, respectively the force of 24.95 N. Figure 25. Deformation of the panel, at pressure, for 3.45 N, respectively the force of 24.95 N.
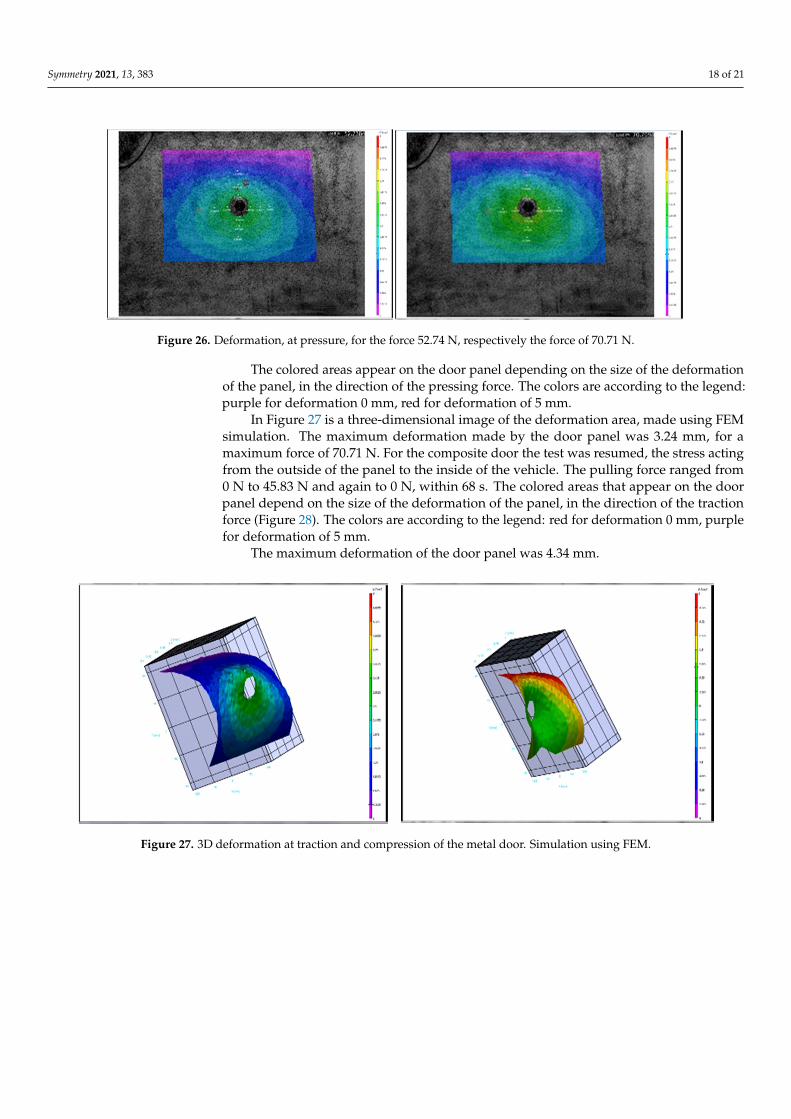
Symmetry 2021, 13, 383 18 of 21Symmetry 2021, 13, x FOR PEER REVIEW 17 of 20
Figure 26. Deformation, at pressure, for the force 52.74 N, respectively the force of 70.71 N.
The colored areas appear on the door panel depending on the size of the deformation of the panel, in the direction of the pressing force. The colors are according to the legend: purple for deformation 0 mm, red for deformation of 5 mm.
In Figure 27 is a three-dimensional image of the deformation area, made using FEM simulation. The maximum deformation made by the door panel was 3.24 mm, for a max-imum force of 70.71 N. For the composite door the test was resumed, the stress acting from the outside of the panel to the inside of the vehicle. The pulling force ranged from 0 N to 45.83 N and again to 0 N, within 68 seconds. The colored areas that appear on the door panel depend on the size of the deformation of the panel, in the direction of the traction force (Figure 28). The colors are according to the legend: red for deformation 0 mm, purple for deformation of 5 mm.
Figure 27. 3D deformation at traction and compression of the metal door. Simulation using FEM.
Figure 26. Deformation, at pressure, for the force 52.74 N, respectively the force of 70.71 N.
The colored areas appear on the door panel depending on the size of the deformationof the panel, in the direction of the pressing force. The colors are according to the legend:purple for deformation 0 mm, red for deformation of 5 mm.
In Figure 27 is a three-dimensional image of the deformation area, made using FEMsimulation. The maximum deformation made by the door panel was 3.24 mm, for amaximum force of 70.71 N. For the composite door the test was resumed, the stress actingfrom the outside of the panel to the inside of the vehicle. The pulling force ranged from0 N to 45.83 N and again to 0 N, within 68 s. The colored areas that appear on the doorpanel depend on the size of the deformation of the panel, in the direction of the tractionforce (Figure 28). The colors are according to the legend: red for deformation 0 mm, purplefor deformation of 5 mm.
The maximum deformation of the door panel was 4.34 mm.
Symmetry 2021, 13, x FOR PEER REVIEW 17 of 20
Figure 26. Deformation, at pressure, for the force 52.74 N, respectively the force of 70.71 N.
The colored areas appear on the door panel depending on the size of the deformation of the panel, in the direction of the pressing force. The colors are according to the legend: purple for deformation 0 mm, red for deformation of 5 mm.
In Figure 27 is a three-dimensional image of the deformation area, made using FEM simulation. The maximum deformation made by the door panel was 3.24 mm, for a max-imum force of 70.71 N. For the composite door the test was resumed, the stress acting from the outside of the panel to the inside of the vehicle. The pulling force ranged from 0 N to 45.83 N and again to 0 N, within 68 seconds. The colored areas that appear on the door panel depend on the size of the deformation of the panel, in the direction of the traction force (Figure 28). The colors are according to the legend: red for deformation 0 mm, purple for deformation of 5 mm.
Figure 27. 3D deformation at traction and compression of the metal door. Simulation using FEM.
Figure 27. 3D deformation at traction and compression of the metal door. Simulation using FEM.
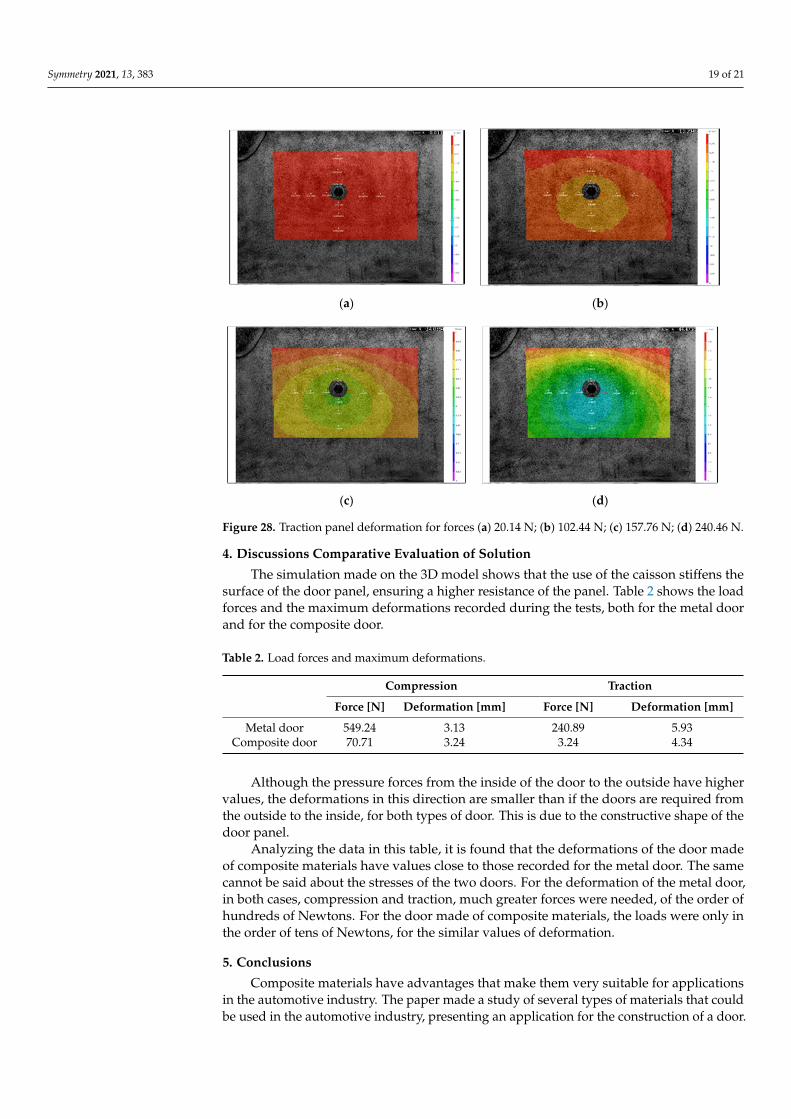
Symmetry 2021, 13, 383 19 of 21Symmetry 2021, 13, x FOR PEER REVIEW 18 of 20
(a) (b)
(c) (d)
Figure 28. Traction panel deformation for forces (a) 20.14 N; (b) 102.44 N; (c) 157.76 N; (d) 240.46 N.
The maximum deformation of the door panel was 4.34 mm.
4. Discussions Comparative Evaluation of Solution The simulation made on the 3D model shows that the use of the caisson stiffens the
surface of the door panel, ensuring a higher resistance of the panel. Table 2 shows the load forces and the maximum deformations recorded during the tests, both for the metal door and for the composite door.
Table 2. Load forces and maximum deformations.
Compression Traction
Force [N] Deformation [mm]
Force [N] Deformation [mm]
Metal door 549.24 3.13 240.89 5.93 Composite door 70.71 3.24 3.24 4.34
Although the pressure forces from the inside of the door to the outside have higher values, the deformations in this direction are smaller than if the doors are required from the outside to the inside, for both types of door. This is due to the constructive shape of the door panel.
Analyzing the data in this table, it is found that the deformations of the door made of composite materials have values close to those recorded for the metal door. The same cannot be said about the stresses of the two doors. For the deformation of the metal door, in both cases, compression and traction, much greater forces were needed, of the order of
Figure 28. Traction panel deformation for forces (a) 20.14 N; (b) 102.44 N; (c) 157.76 N; (d) 240.46 N.
4. Discussions Comparative Evaluation of Solution
The simulation made on the 3D model shows that the use of the caisson stiffens thesurface of the door panel, ensuring a higher resistance of the panel. Table 2 shows the loadforces and the maximum deformations recorded during the tests, both for the metal doorand for the composite door.
Table 2. Load forces and maximum deformations.
Compression Traction
Force [N] Deformation [mm] Force [N] Deformation [mm]
Metal door 549.24 3.13 240.89 5.93Composite door 70.71 3.24 3.24 4.34
Although the pressure forces from the inside of the door to the outside have highervalues, the deformations in this direction are smaller than if the doors are required fromthe outside to the inside, for both types of door. This is due to the constructive shape of thedoor panel.
Analyzing the data in this table, it is found that the deformations of the door madeof composite materials have values close to those recorded for the metal door. The samecannot be said about the stresses of the two doors. For the deformation of the metal door,in both cases, compression and traction, much greater forces were needed, of the order ofhundreds of Newtons. For the door made of composite materials, the loads were only inthe order of tens of Newtons, for the similar values of deformation.
5. Conclusions
Composite materials have advantages that make them very suitable for applicationsin the automotive industry. The paper made a study of several types of materials that couldbe used in the automotive industry, presenting an application for the construction of a door.
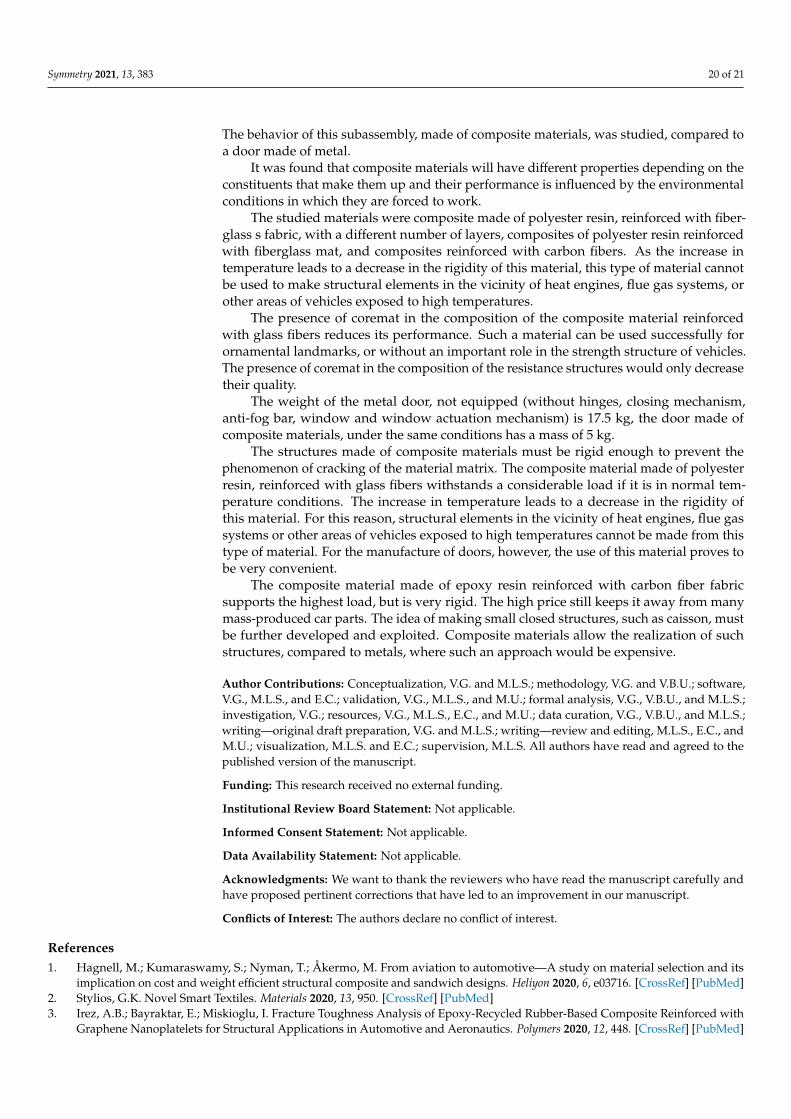
Symmetry 2021, 13, 383 20 of 21
The behavior of this subassembly, made of composite materials, was studied, compared toa door made of metal.
It was found that composite materials will have different properties depending on theconstituents that make them up and their performance is influenced by the environmentalconditions in which they are forced to work.
The studied materials were composite made of polyester resin, reinforced with fiber-glass s fabric, with a different number of layers, composites of polyester resin reinforcedwith fiberglass mat, and composites reinforced with carbon fibers. As the increase intemperature leads to a decrease in the rigidity of this material, this type of material cannotbe used to make structural elements in the vicinity of heat engines, flue gas systems, orother areas of vehicles exposed to high temperatures.
The presence of coremat in the composition of the composite material reinforcedwith glass fibers reduces its performance. Such a material can be used successfully forornamental landmarks, or without an important role in the strength structure of vehicles.The presence of coremat in the composition of the resistance structures would only decreasetheir quality.
The weight of the metal door, not equipped (without hinges, closing mechanism,anti-fog bar, window and window actuation mechanism) is 17.5 kg, the door made ofcomposite materials, under the same conditions has a mass of 5 kg.
The structures made of composite materials must be rigid enough to prevent thephenomenon of cracking of the material matrix. The composite material made of polyesterresin, reinforced with glass fibers withstands a considerable load if it is in normal tem-perature conditions. The increase in temperature leads to a decrease in the rigidity ofthis material. For this reason, structural elements in the vicinity of heat engines, flue gassystems or other areas of vehicles exposed to high temperatures cannot be made from thistype of material. For the manufacture of doors, however, the use of this material proves tobe very convenient.
The composite material made of epoxy resin reinforced with carbon fiber fabricsupports the highest load, but is very rigid. The high price still keeps it away from manymass-produced car parts. The idea of making small closed structures, such as caisson, mustbe further developed and exploited. Composite materials allow the realization of suchstructures, compared to metals, where such an approach would be expensive.
Author Contributions: Conceptualization, V.G. and M.L.S.; methodology, V.G. and V.B.U.; software,V.G., M.L.S., and E.C.; validation, V.G., M.L.S., and M.U.; formal analysis, V.G., V.B.U., and M.L.S.;investigation, V.G.; resources, V.G., M.L.S., E.C., and M.U.; data curation, V.G., V.B.U., and M.L.S.;writing—original draft preparation, V.G. and M.L.S.; writing—review and editing, M.L.S., E.C., andM.U.; visualization, M.L.S. and E.C.; supervision, M.L.S. All authors have read and agreed to thepublished version of the manuscript.
Funding: This research received no external funding.
Institutional Review Board Statement: Not applicable.
Informed Consent Statement: Not applicable.
Data Availability Statement: Not applicable.
Acknowledgments: We want to thank the reviewers who have read the manuscript carefully andhave proposed pertinent corrections that have led to an improvement in our manuscript.
Conflicts of Interest: The authors declare no conflict of interest.
References1. Hagnell, M.; Kumaraswamy, S.; Nyman, T.; Åkermo, M. From aviation to automotive—A study on material selection and its
implication on cost and weight efficient structural composite and sandwich designs. Heliyon 2020, 6, e03716. [CrossRef] [PubMed]2. Stylios, G.K. Novel Smart Textiles. Materials 2020, 13, 950. [CrossRef] [PubMed]3. Irez, A.B.; Bayraktar, E.; Miskioglu, I. Fracture Toughness Analysis of Epoxy-Recycled Rubber-Based Composite Reinforced with
Graphene Nanoplatelets for Structural Applications in Automotive and Aeronautics. Polymers 2020, 12, 448. [CrossRef] [PubMed]
Symmetry 2021, 13, 383 21 of 21
4. Sharma, S.; Sudhakara, P.; Misra, S.; Singh, J. A comprehensive review of current developments on the waste-reinforced polymer-matrix composites for automotive, sports goods and construction applications: Materials, processes and properties. Mater. TodayProc. 2020, 33, 1671–1679. [CrossRef]
5. Alhijazi, M.; Zeeshan, Q.; Qin, Z.; Safaei, B.; Asmael, M. Finite element analysis of natural fibers composites: A review. Nanotechnol.Rev. 2020, 9, 853–875. [CrossRef]
6. Müller, U.; Jost, T.; Kurzböck, C.; Stadlmann, A.; Wagner, W.; Kirschbichler, S.; Baumann, G.; Pramreiter, M.; Feist, F. Crashsimulation of wood and composite wood for future automotive engineering. Wood Mater. Sci. Eng. 2019, 15, 312–324. [CrossRef]
7. Lixandrão, K.C.D.L.; Ferreira, F.F. Polypropylene and tire powder composite for use in automotive industry. Heliyon 2019, 5,e02405. [CrossRef]
8. Chauhan, V.; Kärki, T.; Varis, J. Review of natural fiber-reinforced engineering plastic composites, their applications in thetransportation sector and processing techniques. J. Thermoplast. Compos. Mater. 2019. [CrossRef]
9. Duan, S.Y.; Han, X.; Liu, G.R. Structural Optimization and Reliability Analysis of Automotive Composite Bumper AgainstLow-Velocity Longitudinal and Corner Pendulum Impacts. Int. J. Comput. Methods 2019, 16. [CrossRef]
10. Nunna, S.; Blanchard, P.; Buckmaster, D.; Davis, S.; Naebe, M. Development of a cost model for the production of carbon fibres.Heliyon 2019, 5, e02698. [CrossRef] [PubMed]
11. Khodadadian, A.; Parvizi, M.; Abbaszadeh, M.; Dehghan, M.; Heitzinger, C. A multilevel Monte Carlo finite element method forthe stochastic Cahn–Hilliard–Cook equation. Comput. Mech. 2019, 64, 937–949. [CrossRef] [PubMed]
12. Katouzian, M.; Vlase, S.; Calin, R. Experimental procedures to determine the viscoelastic parameters of laminated composites. J.Optoelectron. Adv. Mater. 2011, 13, 1185–1188.
13. Sadeghpour, E.; Guo, Y.; Chua, D.; Shim, V.P. A modified Mori–Tanaka approach incorporating filler-matrix interface failure tomodel graphene/polymer nanocomposites. Int. J. Mech. Sci. 2020, 180, 105699. [CrossRef]
14. Song, Z.; Peng, X.; Tang, S.; Fu, T. A homogenization scheme for elastoplastic composites using concept of Mori-Tanaka methodand average deformation power rate density. Int. J. Plast. 2020, 128, 102652. [CrossRef]
15. Marin, M.; Vlase, S.; Paun, M. Considerations on double porosity structure for micropolar bodies. AIP Adv. 2015, 5, 037113.[CrossRef]
16. Teodorescu-Draghicescu, H.; Stanciu, A.; Vlase, S.; Scutaru, L.; Calin, M.R.; Serbina, L. Finite Element Method Analysis of SomeFibre-Reinforced Composite Laminates. Optoelectron. Adv. Mater. Rapid Commun. 2011, 5, 782–785.
17. Teodorescu-Draghicescu, H.; Vlase, S.; Stanciu, M.D.; Curtu, I.; Mihalcica, M. Advanced Pultruded Glass Fibers-ReinforcedIsophtalic Polyester Resin. Mater. Plast. 2015, 52, 62–64.
18. Vlase, S.; Scutaru, L.; Serbina, L.; Calin, M.R. Hysteresis effect in a three-phase polymer matrix composite subjected to static cyclicloadings. Optoelectron. Adv. Mater Rapid Commun. 2011, 5, 273–277.
19. ISO 178: Plastics—Determination of Flexural Properties. Available online: www.iso.org/standard/70513 (accessed on 26December 2020).
20. ASTM D790: Standard Test Methods for Flexural Properties of Unreinforced and Reinforced Plastics and Electrical InsulatingMaterials. Available online: www.astm.org/Standards/D790 (accessed on 26 December 2020).
21. ASTM D7264: Standard Test Method for Flexural Properties of Polymer Matrix Composite Materials. Available online: www.astm.org/Standards/D7264 (accessed on 26 December 2020).
22. ASTM C1161: Standard Test Method for Flexural Strength of Advanced Ceramics at Ambient Temperature. Available online:www.astm.org/Standards/C1161 (accessed on 26 December 2020).
23. ASTM D6272: Standard Test Method for Flexural Properties of Unreinforced and Reinforced Plastics and Electrical InsulatingMaterials by Four-Point Bending. Available online: www.astm.org/Standards/D6272 (accessed on 26 December 2020).
24. ASTM C393: Standard Test Method for Core Shear Properties of Sandwich Constructions by Beam Flexure. Available online:www.astm.org/Standards/C393 (accessed on 26 December 2020).
25. ASTM D7249: Standard Test Method for Facing Properties of Sandwich Constructions by Long Beam Flexure. Available online:www.astm.org/Standards/D7249 (accessed on 26 December 2020).
26. ASTM D7250: Standard Practice for Determining Sandwich Beam Flexural and Shear Stiffness. Available online: www.astm.org/Standards/D7250 (accessed on 26 December 2020).
Related Documents


