Information The American Psychiatric Publishing Textbook of Neuropsychiatry and Behavioral Neurosciences, Fifth Edition Edited by Yudofsky SC, Hales RE. © 2008 American Psychiatric Publishing, Inc. All rights reserved. www.appi.org 1 Slide Show Topic headings and reading list Tables and figures Highlights for the clinician Main menu (Contents, Contributors, Publishing facts, Help) About the CD-ROM Slide Shows by Chapter Volume Table of Contents Publishing Facts Contributors Links to Resources for Neuropsychiatry

Neuropsiquiatría y Neurociencias de la Conducta
Jun 23, 2015
Welcome message from author
This document is posted to help you gain knowledge. Please leave a comment to let me know what you think about it! Share it to your friends and learn new things together.
Transcript
Information
The American Psychiatric Publishing Textbook of Neuropsychiatry and Behavioral Neurosciences, Fifth EditionEdited by Yudofsky SC, Hales RE. © 2008 American Psychiatric Publishing, Inc. All rights reserved. www.appi.org
1
Slide Show
Topic headings and reading list
Tables and figures
Highlights for the clinician
Main menu
(Contents, Contributors, Publishing facts, Help)
Information
About the CD-ROM
Slide Shows by Chapter
Volume Table of Contents
Publishing Facts
Contributors
Links to Resources for Neuropsychiatry
About the Slide Shows
This CD-ROM contains all of the tables, figures, and clinical highlights from The American Psychiatric Publishing Textbook of Neuropsychiatry and Behavioral Neurosciences,Fifth Edition.
Each chapter show begins with lists of the topic headings from the textbook, recommended readings, and tables and figures. The tables and figures themselves follow, each with its title and legend and a brief headnote based on the discussion in the chapter. At the end of each show is a summary, in display format, of the chapter’s key clinical points.
Technical Requirements
This CD-ROM is compatible with PC or Macintosh systems running Microsoft Office PowerPoint 2003 or higher. For your convenience, PowerPoint Viewer 2007 has been included in case you do not have a full version of Microsoft PowerPoint.
Supported operating systems for PowerPoint Viewer 2007 are Windows 2000 Service Pack 4, Windows Server 2003, Windows XP Service Pack 1, and Windows Vista.
Customer Service
About the CD-ROM
The American Psychiatric Publishing Textbook of Neuropsychiatry and Behavioral Neurosciences, Fifth EditionEdited by Yudofsky SC, Hales RE. © 2008 American Psychiatric Publishing, Inc. All rights reserved. www.appi.org
2
display format, of the chapter’s key clinical points.
To reach any of the 33 chapter files, click on the links in Slide Shows by Chapter. Within each chapter, the items can be viewed as a continuous slide show or opened individually from the side panel in Normal View or by right-clicking to reach Go–Slide Navigator in the slide show. For some items, an enlarged view follows the main slide. To return to the Main Menu and the link to the list of chapters, click the Main Menu link on the title page of any chapter.
For assistance with purchase of APPI materials and for information about this product, please e-mail [email protected] phone APPI Customer Service toll free (M–F 9:00 am–5:30 pm) at 1-800-368-5777.
Your Comments
Please let us know what you think of the textbook and CD-ROM. Go to www.surveymonkey.com/s.aspx?sm=v2zBHZpsSECVVat7kOS90A_3d_3d, or, with the CD-ROM inserted, click on this link to the survey.
Slide Shows by Chapter
Chapter 1 biology of the neuron
Chapter 2 functional neuroanatomy
Chapter 3 system interactions
Chapter 4 bedside neuropsychiatry
Chapter 5 neuropsychological evaluation
Chapter 6 electrodiagnostic evaluation
Chapter 7 neuroimaging
Chapter 8 epidemiology and genetics
Tables, Figures, and Highlights
Each chapter has a separate slide show. To go to the slide shows, click on the links below.(Keywords appear on this page. See the following slides for full chapter titles and authors.)
Chapter 18 cerebrovascular disorders
Chapter 19 brain tumors
Chapter 20 HIV infection
Chapter 21 endocrine disorders
Chapter 22 poisons and toxins
Chapter 23 dependencies
Chapter 24 dementias/motor dysfunction
Chapter 25 dementias
The American Psychiatric Publishing Textbook of Neuropsychiatry and Behavioral Neurosciences, Fifth EditionEdited by Yudofsky SC, Hales RE. © 2008 American Psychiatric Publishing, Inc. All rights reserved. www.appi.org
3
Chapter 8 epidemiology and genetics
Chapter 9 pain management
Chapter 10 attention disorders
Chapter 11 delirium
Chapter 12 aphasia
Chapter 13 aggression and impulsivity
Chapter 14 memory and amnesia
Chapter 15 traumatic brain injury
Chapter 16 seizure disorders
Chapter 17 sleep disorders
Chapter 25 dementias
Chapter 26 schizophrenia
Chapter 27 mood disorders
Chapter 28 anxiety disorders
Chapter 29 childhood/adolescence
Chapter 30 pharmacological principles
Chapter 31 pharmacological treatments
Chapter 32 psychotherapy
Chapter 33 cognitive/behavioral therapies

Volume Table of Contents
PART I BASIC PRINCIPLES OF NEUROSCIENCECHAPTER 1 Cellular and Molecular Biology of the Neuron
A. Kimberley McAllister, Ph.D., W. Martin Usrey, Ph.D., Stephen C. Noctor, Ph.D., Stephen Rayport, M.D., Ph.D.
CHAPTER 2 Functional Neuroanatomy: Neuropsychological Correlates of Cortical and Subcortical DamageBrian T. Harel, Ph.D., Daniel Tranel, Ph.D.
CHAPTER 3 Nervous, Endocrine, and Immune System Interactions in PsychiatryOyetunde O. Alagbe, M.D., Dwight L. Evans, M.D., Andrew H. Miller, M.D.
PART II NEUROPSYCHIATRIC ASSESSMENTCHAPTER 4 Bedside Neuropsychiatry: Eliciting the Clinical Phenomena of Neuropsychiatric Illness
The American Psychiatric Publishing Textbook of Neuropsychiatry and Behavioral Neurosciences, Fifth EditionEdited by Yudofsky SC, Hales RE. © 2008 American Psychiatric Publishing, Inc. All rights reserved. www.appi.org
4
CHAPTER 4 Bedside Neuropsychiatry: Eliciting the Clinical Phenomena of Neuropsychiatric IllnessFred Ovsiew, M.D.
CHAPTER 5 Electrodiagnostic Techniques in NeuropsychiatryNash N. Boutros, M.D., Robert Thatcher, Ph.D., Silvana Galderisi, M.D.
CHAPTER 6 The Neuropsychological EvaluationDiane B. Howieson, Ph.D., Muriel D. Lezak, Ph.D.
CHAPTER 7 Clinical and Functional Imaging in NeuropsychiatryRobin A. Hurley, M.D., Katherine H. Taber, Ph.D.
CHAPTER 8 Epidemiological and Genetic Aspects of Neuropsychiatric DisordersDolores Malaspina, M.D., M.S.P.H., Cheryl Corcoran, M.D., Steven P. Hamilton, M.D., Ph.D.
(continued)
Volume Table of Contents (continued)
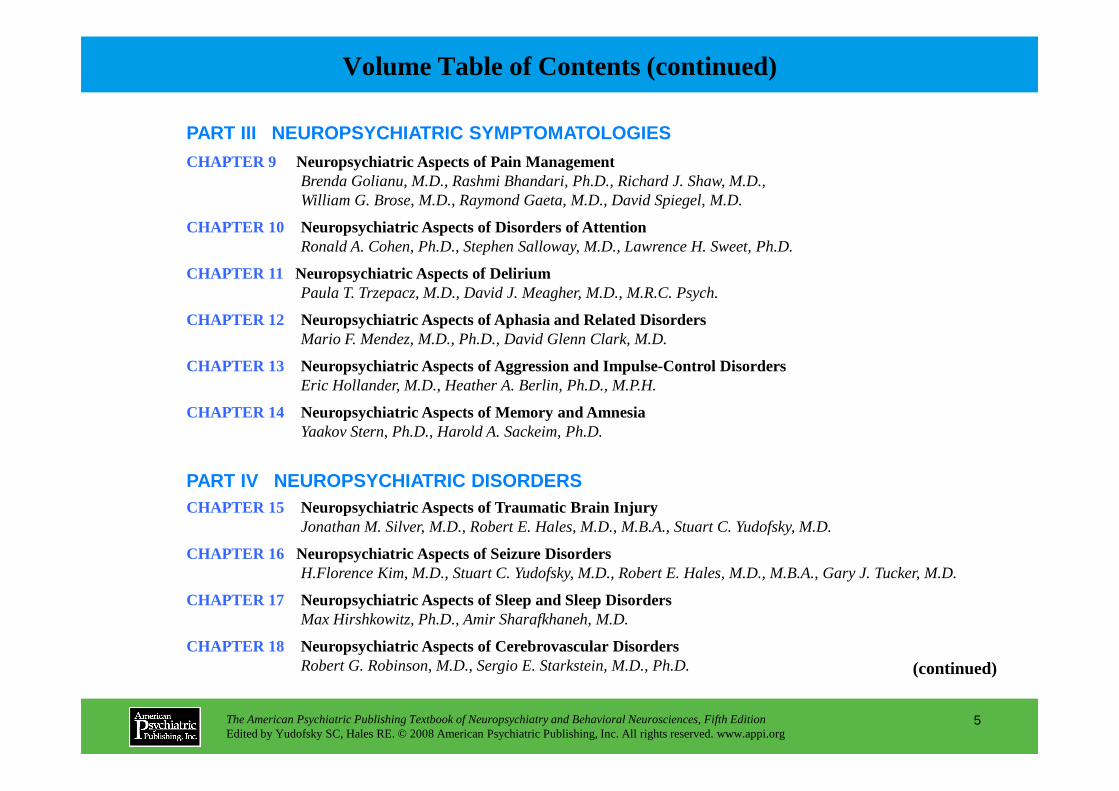
PART III NEUROPSYCHIATRIC SYMPTOMATOLOGIESCHAPTER 9 Neuropsychiatric Aspects of Pain Management
Brenda Golianu, M.D., Rashmi Bhandari, Ph.D., Richard J. Shaw, M.D., William G. Brose, M.D., Raymond Gaeta, M.D., David Spiegel, M.D.
CHAPTER 10 Neuropsychiatric Aspects of Disorders of AttentionRonald A. Cohen, Ph.D., Stephen Salloway, M.D., Lawrence H. Sweet, Ph.D.
CHAPTER 11 Neuropsychiatric Aspects of DeliriumPaula T. Trzepacz, M.D., David J. Meagher, M.D., M.R.C. Psych.
CHAPTER 12 Neuropsychiatric Aspects of Aphasia and Related DisordersMario F. Mendez, M.D., Ph.D., David Glenn Clark, M.D.
CHAPTER 13 Neuropsychiatric Aspects of Aggression and Impulse-Control DisordersEric Hollander, M.D., Heather A. Berlin, Ph.D., M.P.H.
The American Psychiatric Publishing Textbook of Neuropsychiatry and Behavioral Neurosciences, Fifth EditionEdited by Yudofsky SC, Hales RE. © 2008 American Psychiatric Publishing, Inc. All rights reserved. www.appi.org
5
CHAPTER 14 Neuropsychiatric Aspects of Memory and AmnesiaYaakov Stern, Ph.D., Harold A. Sackeim, Ph.D.
PART IV NEUROPSYCHIATRIC DISORDERSCHAPTER 15 Neuropsychiatric Aspects of Traumatic Brain Injury
Jonathan M. Silver, M.D., Robert E. Hales, M.D., M.B.A., Stuart C. Yudofsky, M.D.
CHAPTER 16 Neuropsychiatric Aspects of Seizure DisordersH.Florence Kim, M.D., Stuart C. Yudofsky, M.D., Robert E. Hales, M.D., M.B.A., Gary J. Tucker, M.D.
CHAPTER 17 Neuropsychiatric Aspects of Sleep and Sleep DisordersMax Hirshkowitz, Ph.D., Amir Sharafkhaneh, M.D.
CHAPTER 18 Neuropsychiatric Aspects of Cerebrovascular DisordersRobert G. Robinson, M.D., Sergio E. Starkstein, M.D., Ph.D. (continued)
Volume Table of Contents (continued)
CHAPTER 19 Neuropsychiatric Aspects of Brain TumorsTrevor R. P. Price, M.D., Kenneth L. Goetz, M.D., Mark R. Lovell, Ph.D.
CHAPTER 20 Neuropsychiatric Aspects of HIV Infection of the Central Nervous SystemFrancisco Fernandez, M.D., Jun Tan, M.D., Ph.D.
CHAPTER 21 Neuropsychiatric Aspects of Endocrine DisordersMonica Kelly Cowles, M.D., Elizabeth B. Boswell, M.D., Theodore J. Anfinson, M.D., Charles B. Nemeroff, M.D., Ph.D.
CHAPTER 22 Neuropsychiatric Aspects of Poisons and ToxinsShreenath V. Doctor, M.D., Ph.D.
CHAPTER 23 Neuropsychiatric Aspects of Ethanol and Other Chemical DependenciesEric J. Nestler, M.D., Ph.D., David W. Self, Ph.D.
CHAPTER 24 Neuropsychiatric Aspects of Dementias Associated With Motor DysfunctionAlan J. Lerner, M.D., David Riley, M.D.
The American Psychiatric Publishing Textbook of Neuropsychiatry and Behavioral Neurosciences, Fifth EditionEdited by Yudofsky SC, Hales RE. © 2008 American Psychiatric Publishing, Inc. All rights reserved. www.appi.org
6
Alan J. Lerner, M.D., David Riley, M.D.
CHAPTER 25 Neuropsychiatric Aspects of Alzheimer’s Disease and Other Dementing IllnessesLiana G. Apostolova, M.D., Jeffrey L. Cummings, M.D.
CHAPTER 26 Neuropsychiatric Aspects of SchizophreniaCarol A. Tamminga, M.D., Mujeeb U. Shad, M.D., Subroto Ghose, M.D., Ph.D.
CHAPTER 27 Neuropsychiatric Aspects of Mood DisordersPaul E. Holtzheimer III, M.D., Helen S. Mayberg, M.D.
CHAPTER 28 Neuropsychiatric Aspects of Anxiety DisordersDan J. Stein, M.D., Ph.D., Scott R. Rauch, M.D.
CHAPTER 29 Neuropsychiatric Disorders of Childhood and AdolescenceMartin H. Teicher, M.D., Ph.D., Susan L. Andersen, Ph.D., Carryl P. Navalta, Ph.D., Akemi Tomoda, M.D., Ph.D., Ann Polcari, Ph.D., R.N., Dennis Kim, M.D.
(continued)
Volume Table of Contents (continued)
PART V NEUROPSYCHIATRIC TREATMENTSCHAPTER 30 Intracellular and Intercellular Principles of Pharmacotherapy for Neuropsychiatric Disorders
W. Dale Horst, Ph.D., Michael J. Burke, M.D., Ph.D.
CHAPTER 31 Psychopharmacological Treatments for Patients With Neuropsychiatric DisordersPaul E. Holtzheimer III, M.D., Mark Snowden, M.D. M.P.H., Peter P. Roy-Byrne, M.D.
CHAPTER 32 Psychotherapy for Patients With Neuropsychiatric DisordersDavid V. Forrest, M.D.
CHAPTER 33 Cognitive Rehabilitation and Behavior Therapy for Patients With Neuropsychiatric DisordersMichael D. Franzen, Ph.D., Mark R. Lovell, Ph.D.
The American Psychiatric Publishing Textbook of Neuropsychiatry and Behavioral Neurosciences, Fifth EditionEdited by Yudofsky SC, Hales RE. © 2008 American Psychiatric Publishing, Inc. All rights reserved. www.appi.org
7

Publishing Facts
Note: The authors have worked to ensure that all information in the textbook and the accompanying CD-ROM are accurate at the time of publication and consistent with general psychiatric and medical standards, and that information concerning drug dosages, schedules, and routes of administration is accurate at the time of publication and consistent with standards set by the U.S. Food and Drug Administration and the general medical community. As medical research and practice continue to advance, however, therapeutic standards may change. Moreover, specific situations may require a specific therapeutic response not included in this book. For these reasons and because human and mechanical errors sometimes occur, we recommend that readers follow the advice of physicians directly involved in their care or the care of a member of their family.
Books published by American Psychiatric Publishing, Inc., represent the views and opinions of the individual authors and do not necessarily
Library of Congress Cataloging-in-Publication DataThe American Psychiatric Publishing textbook of neuropsychiatry and behavioral neurosciences / edited by Stuart C. Yudofsky, Robert E. Hales. — 5th ed.
p. ; cm.Rev. ed. of The American Psychiatric Press textbook of neuropsychiatry
and clinical neurosciences. 4th ed. ©2002.Includes bibliographical references and index.ISBN 978-1-58562-239-9 (hardcover : alk. paper)1. Neuropsychiatry. I. Yudofsky, Stuart C. II. Hales, Robert E. III. American Psychiatric Publishing. IV. American Psychiatric Press textbook of neuropsychiatry and clinical neurosciences. V. Title: Textbook of neuropsychiatry and behavioral neurosciences. VI. Title: Neuropsychiatry and behavioral neurosciences. [DNLM: 1. Delirium, Dementia, Amnestic, Cognitive Disorders. 2.
The American Psychiatric Publishing Textbook of Neuropsychiatry and Behavioral Neurosciences, Fifth EditionEdited by Yudofsky SC, Hales RE. © 2008 American Psychiatric Publishing, Inc. All rights reserved. www.appi.org
8
views and opinions of the individual authors and do not necessarily represent the policies and opinions of APPI or the American Psychiatric Association.
Copyright © 2008 American Psychiatric Publishing, Inc.ALL RIGHTS RESERVED
Manufactured in the United States of AmericaFifth Edition of Textbook
American Psychiatric Publishing, Inc.1000 Wilson BoulevardArlington, VA 22209-3901www.appi.org
[DNLM: 1. Delirium, Dementia, Amnestic, Cognitive Disorders. 2. Nervous System Diseases. 3. Neuropsychology. WM 140 A51277 2008]RC341.A44 2008616.8—dc22
2007007102
British Library Cataloguing in Publication DataA CIP record is available from the British Library.
Contributors
Oyetunde O. Alagbe, M.D.Postdoctoral Fellow, Department of Psychiatry and Behavioral Sciences, Emory University School of Medicine, Atlanta, Georgia
Susan L. Andersen, Ph.D.Associate Professor, Department of Psychiatry, Harvard Medical School, Laboratory of Developmental Psychopharmacology and Developmental Biopsychiatry Research Program, McLean Hospital, Belmont, Massachusetts
Theodore J. Anfinson, M.D.Associate Professor, Department of Psychiatry and Behavioral Sciences, Emory University School of Medicine, Atlanta, Georgia
Liana G. Apostolova, M.D.Assistant Professor, Department of Neurology, David
William G. Brose, M.D.Adjunct Clinical Professor of Anesthesia, Stanford University School of Medicine, Stanford, California
Michael J. Burke, M.D., Ph.D.Associate Professor, Department of Psychiatry and Behavioral Health Sciences, Director, Medical Student Education, and Director, Inpatient Psychiatry Services, University of Kansas School of Medicine, Wichita, Kansas
David Glenn Clark, M.D.Assistant Professor of Neurology, University of Alabama School of Medicine, Birmingham, Alabama
Ronald A. Cohen, Ph.D.Professor, Department of Psychiatry and Human Behavior, Brown University, and Director of Neuropsychology, Centers for Behavioral Medicine,
Shreenath V. Doctor, M.D., Ph.D.Private practice of neuropsychiatry, Bellaire, Texas
Dwight L. Evans, M.D.Ruth Meltzer Professor and Chairman of Psychiatry, Professor of Medicine, Professor of Neuroscience, University of Pennsylvania School of Medicine, Philadelphia, Pennsylvania
Francisco Fernandez, M.D.Professor and Chair, Department of Psychiatry and Behavioral Medicine, University of South Florida, Tampa, Florida
Ronald E. Fisher, M.D., Ph.D.Assistant Professor, Departments of Radiology and Neuroscience, Baylor College of Medicine, Houston, Texas; Director of Nuclear Medicine, The Methodist Hospital, Houston, Texas
David V. Forrest, M.D.
The American Psychiatric Publishing Textbook of Neuropsychiatry and Behavioral Neurosciences, Fifth EditionEdited by Yudofsky SC, Hales RE. © 2008 American Psychiatric Publishing, Inc. All rights reserved. www.appi.org
9
Assistant Professor, Department of Neurology, David Geffen School of Medicine, University of California at Los Angeles, Los Angeles, California
Heather A. Berlin, Ph.D., M.P.H.Postdoctoral Fellow, Department. of Psychiatry, Mount Sinai School of Medicine, New York, New York
Rashmi Bhandari, Ph.D.Clinical Assistant Professor of Anesthesia, Stanford University School of Medicine, Stanford, California
Elizabeth B. Boswell, M.D.Private practice of psychiatry, Atlanta, Georgia
Nash N. Boutros, M.D.Professor of Psychiatry and Neurology, Wayne State University, School of Medicine, Detroit, Michigan
Neuropsychology, Centers for Behavioral Medicine, the Miriam Hospital, Providence, Rhode Island
Cheryl Corcoran, M.D., M.S.P.H.Assistant Professor of Clinical Psychiatry, Department of Psychiatry, Columbia University College of Physicians and Surgeons, New York, New York
Monica Kelly Cowles, M.D., M.S.Psychiatry Resident, Department of Psychiatry and Behavioral Sciences, Emory University School of Medicine, Atlanta, Georgia
Jeffrey L. Cummings, M.D.Augustus S. Rose Professor, Departments of Neurology, Psychiatry, and Biobehavioral Neurosciences, David Geffen School of Medicine, University of California at Los Angeles, Los Angeles, California
David V. Forrest, M.D.Clinical Professor of Psychiatry, Consultation-Liaison Psychiatrist in Neurology, and Faculty, Psychoanalytic Center, Columbia University College of Physicians and Surgeons, New York, New York
Michael D. Franzen, Ph.D.Associate Professor of Psychiatry, Drexel University College of Medicine, Allegheny General Hospital, Pittsburgh, Pennsylvania
Raymond Gaeta, M.D.Associate Professor of Anesthesia, Stanford University School of Medicine, Stanford, California
Silvana Galderisi, M.D.Professor of Psychiatry, University of Naples SUN, Naples, Italy
(continued)
Contributors (continued)
Subroto Ghose, M.D., Ph.D.Assistant Professor of Psychiatry, University of Texas Southwestern Medical Center, Dallas, Texas
Kenneth L. Goetz, M.D.Associate Professor, Department of Psychiatry, Drexel University School of Medicine, Pittsburgh, Pennsylvania
Brenda Golianu, M.D.Assistant Professor of Anesthesia (Pediatric Anesthesia), Stanford University School of Medicine, Stanford, California
Robert E. Hales, M.D., M.B.A.Joe P. Tupin Professor and Chair, Department of Psychiatry and Behavioral Sciences, University of California, Davis School of Medicine, Sacramento, California; Medical Director, Sacramento County Mental Health Services, Sacramento, California; Editor-in-Chief,
Eric Hollander, M.D.Professor of Psychiatry; Director, Seaver and New York Autism Center of Excellence; Director, Clinical Psychopharmacology and Director, Compulsive, Impulsive and Anxiety Disorders Program, Department of Psychiatry, Mount Sinai School of Medicine, New York, New York
Paul E. Holtzheimer III, M.D.Assistant Professor, Department of Psychiatry and Behavioral Sciences, Emory University School of Medicine, Atlanta, Georgia
W. Dale Horst, Ph.D.Director Emeritus, Psychiatric Research Institute, and Research Professor, Department of Psychiatry and Behavioral Health Sciences, University of Kansas School of Medicine, Wichita, Kansas
Dennis Kim, M.D.Instructor, Department of Psychiatry, Harvard Medical School, Developmental Biopsychiatry Research Program, McLean Hospital, Belmont, Massachusetts
H. Florence Kim, M.D.Assistant Professor, Menninger Department of Psychiatry and Behavioral Sciences, Baylor College of Medicine, and Medical Director, Diagnostic Assessment Unit, The Menninger Clinic, Houston, Texas
Alan J. Lerner, M.D.Associate Professor of Neurology, Case Western Reserve University, and Director, Memory and Cognition Center, Neurological Institute, University Hospitals Case Medical Center, Cleveland, Ohio
Muriel D. Lezak, Ph.D.Professor Emerita, Neurology, Oregon Health and
The American Psychiatric Publishing Textbook of Neuropsychiatry and Behavioral Neurosciences, Fifth EditionEdited by Yudofsky SC, Hales RE. © 2008 American Psychiatric Publishing, Inc. All rights reserved. www.appi.org
10
Health Services, Sacramento, California; Editor-in-Chief, American Psychiatric Publishing, Inc., Arlington, Virginia
Steven P. Hamilton, M.D., Ph.D.Associate Professor, Department of Psychiatry, University of California–San Francisco, San Francisco, California
Brian T. Harel, Ph.D.Postdoctoral Resident, Department of Neurology, Uni-versity of Iowa Hospitals and Clinics, Iowa City, Iowa
Max Hirshkowitz, Ph.D.Associate Professor, Department of Psychiatry and Department of Medicine, Baylor College of Medicine; Michael E. DeBakey VAMC Sleep Disorders and Research Center, Houston, Texas
Diane B. Howieson, Ph.D.Associate Professor of Neurology and Psychiatry, Oregon Health and Science University, Portland, Oregon
Robin A. Hurley, M.D., FANPAAssociate Professor, Departments of Psychiatry and Radiology, Wake Forest University School of Medicine, Winston-Salem, North Carolina; Clinical Associate Professor, Department of Psychiatry, Baylor College of Medicine, Houston, Texas; Acting Chief of Staff and Associate Chief of Staff for Mental Health, W. G. “Bill ” Hefner VAMC, Salisbury, North Carolina; Co-Director for Education, Mid Atlantic MIRECC, Salisbury, North Carolina
Professor Emerita, Neurology, Oregon Health and Science University, Portland, Oregon
Mark R. Lovell, Ph.D.Assistant Professor, Department of Orthopedic Surgery, University of Pittsburgh School of Medicine, and Director, Sports Medicine Concussion Program, UPMC Center for Sports Medicine, Pittsburgh, Pennsylvania
Dolores Malaspina, M.D., M.S.P.H.Professor and Chairman of Psychiatry, New York University Medical Center, New York, New York
(continued)

Contributors (continued)
Helen S. Mayberg, M.D.Professor, Department of Psychiatry and Behavioral Sciences, Department of Neurology, Emory University School of Medicine, Atlanta, Georgia
A. Kimberley McAllister, Ph.D.Associate Professor of Neuroscience, Center for Neuroscience, University of California–Davis, Davis, California
David J. Meagher, M.D., M.R.C.Psych.Consultant Psychiatrist and Director of Clinical Research, Department of Psychiatry, Midwestern Regional Hospital, Dooradoyle, Limerick, Ireland
Mario F. Mendez, M.D., Ph.D.Professor of Neurology and of Psychiatry and Biobehavioral Sciences, David Geffen School of Medicine, University of California at Los Angeles, Los
Eric J. Nestler, M.D., Ph.D.Professor and Chair, Department of Psychiatry and Center for Basic Neuroscience, The University of Texas Southwestern Medical Center, Dallas, Texas
Stephen C. Noctor, Ph.D.Research Scientist, Institute for Regenerative Medicine, Department of Neurology, University of California–San Francisco, San Francisco, California
Fred Ovsiew, M.D., FANPAProfessor of Psychiatry, University of Chicago; Chief, Clinical Neuropsychiatry Service, and Medical Director, Adult Inpatient Psychiatry, University of Chicago Hospitals, Chicago, Illinois. Diplomate in Behavioral Neurology and Neuropsychiatry.
Ann Polcari, Ph.D., R.N.Instructor, Department of Psychiatry, Harvard Medical
David Riley, M.D.Professor of Neurology, Case Western Reserve University, and Director, Movement Disorders Center, Neurological Institute, University Hospitals Case Medical Center, Cleveland, Ohio
Robert G. Robinson, M.D.Paul W. Penningroth Chair, Professor and Head, Department of Psychiatry, University of Iowa College of Medicine, Iowa City, Iowa
Peter P. Roy-Byrne, M.D.Professor and Vice-Chair, Department of Psychiatry and Behavioral Sciences, University of Washington, Seattle, Washington
Harold A. Sackeim, Ph.D.Professor of Clinical Psychology in Psychiatry and Radiology, Columbia University College of Physicians
The American Psychiatric Publishing Textbook of Neuropsychiatry and Behavioral Neurosciences, Fifth EditionEdited by Yudofsky SC, Hales RE. © 2008 American Psychiatric Publishing, Inc. All rights reserved. www.appi.org
11
Medicine, University of California at Los Angeles, Los Angeles, California
Andrew H. Miller, M.D.William P. Timmie Professor of Psychiatry and Behavioral Sciences and Director, Psychiatric Oncology/Winship Cancer Institute, Emory University School of Medicine, Atlanta, Georgia
Carryl P. Navalta, Ph.D.Instructor, Department of Psychiatry, Harvard Medical School, Developmental Biopsychiatry Research Program and Child Outpatient Program, McLean Hospital, Belmont, Massachusetts
Charles B. Nemeroff, M.D., Ph.D.Reunette W. Harris Professor and Chairman, Department of Psychiatry and Behavioral Sciences, Emory University School of Medicine, Atlanta, Georgia
Instructor, Department of Psychiatry, Harvard Medical School, Developmental Biopsychiatry Research Program, McLean Hospital, Belmont, Massachusetts
Trevor R. P. Price, M.D.Private practice of psychiatry, Bryn Mawr, Pennsylvania
Scott L. Rauch, M.D.Professor of Psychiatry, Harvard Medical School, Boston, Massachusetts; Chair, Partners Psychiatry and Mental Health, and President and Psychiatrist-in-Chief, McLean Hospital, Belmont, Massachusetts
Stephen Rayport, M.D., Ph.D.Associate Professor of Clinical Neuroscience, Department of Psychiatry, Columbia University, New York, New York
Radiology, Columbia University College of Physicians and Surgeons; Chief, Department of Biological Psychiatry, New York State Psychiatric Institute, New York, New York
Stephen Salloway, M.D.Professor, Departments of Clinical Neurosciences and Psychiatry, Brown Medical School, and Director of Neurology and the Memory and Aging Program, Butler Hospital, Providence, Rhode Island
Scott Schobel, M.D.Postdoctoral Clinical Fellow, Department of Psychiatry, Columbia University Medical Center, Columbia University College of Physicians and Surgeons, New York, New York
(continued)
Contributors (continued)
David W. Self, Ph.D.Associate Professor, Department of Psychiatry and Center for Basic Neuroscience, The University of Texas Southwestern Medical Center, Dallas, Texas
Mujeeb U. Shad, M.D.Assistant Professor of Psychiatry, University of Texas Southwestern Medical Center, Dallas, Texas
Amir Sharafkhaneh, M.D.Assistant Professor, Department of Medicine, Baylor College of Medicine, and Medical Director, Michael E. DeBakey VAMC Sleep Disorders and Research Center, Houston, Texas
Richard J. Shaw, M.B., B.S.Associate Professor of Psychiatry and Behavioral Sciences (Child and Adolescent Psychiatry), Stanford University School of Medicine, Stanford, California
David Spiegel, M.D.Jack, Samuel and Lulu Willson Professor in Medicine, Department of Psychiatry and Behavioral Sciences, Stanford University School of Medicine, Stanford, California
Sergio E. Starkstein, M.D., Ph.D.Professor of Psychiatry and Clinical Neurosciences, University of Western Australia, Fremantle, Australia
Dan J. Stein, M.D., Ph.D.Professor, Department of Psychiatry, University of Cape Town, Groote Schuur Hospital, Cape Town, South Africa; Mount Sinai School of Medicine, New York, New York
Yaakov Stern, Ph.D.Professor of Clinical Neuropsychology in Departments of Neurology, Psychiatry, and the Sergievsky Center,
Katherine H. Taber, Ph.D., FANPAResearch Professor, Division of Biomedical Sciences, Virginia College of Osteopathic Medicine, Blacksburg, Virginia; Adjunct Associate Professor, Department of Physical Medicine and Rehabilitation, Baylor College of Medicine, Houston, Texas; Assistant Co-Director for Education, Mid Atlantic MIRECC, Salisbury, North Carolina; Research Scientist, W. G. “Bill ” Hefner Veterans Affairs Medical Center, Salisbury, North Carolina
Carol A. Tamminga, M.D.Professor and Vice Chair of Clinical Research, Department of Psychiatry, University of Texas Southwestern Medical Center, Dallas, Texas
Jun Tan, M.D., Ph.D.Associate Professor, Department of Psychiatry and Behavioral Medicine, University of South Florida, Tampa, Florida
The American Psychiatric Publishing Textbook of Neuropsychiatry and Behavioral Neurosciences, Fifth EditionEdited by Yudofsky SC, Hales RE. © 2008 American Psychiatric Publishing, Inc. All rights reserved. www.appi.org
12
University School of Medicine, Stanford, California
Jonathan M. Silver, M.D.Clinical Professor of Psychiatry, New York University School of Medicine, New York, New York
Mark Snowden, M.D., M.P.H.Associate Professor, Department of Psychiatry and Behavioral Sciences, University of Washington, Seattle, Washington
Solomon H. Snyder, M.D.University Distinguished Service Professor of Neuroscience, Pharmacology, and Psychiatry and Director, Department of Neuroscience, Johns Hopkins University School of Medicine, Baltimore, Maryland
of Neurology, Psychiatry, and the Sergievsky Center, Columbia University College of Physicians and Surgeons; Director of Neuropsychology, Memory Disorders Clinic, Department of Biological Psychiatry, New York State Psychiatric Institute, New York, New York
Lawrence H. Sweet, Ph.D.Assistant Professor, Psychiatry and Human Behavior, Brown Medical School, and Research Psychologist, Butler Hospital, Providence, Rhode Island
Florida
Martin H. Teicher, M.D., Ph.D.Associate Professor, Department of Psychiatry, Harvard Medical School, Developmental Biopsychiatry Research Program and Laboratory of Developmental Psychopharmacology, McLean Hospital, Belmont, Massachusetts
Robert W. Thatcher, Ph.D.Professor, Department of Neurology, University of South Florida College of Medicine, and Director, NeuroImaging Laboratory, Bay Pines VAMC, Bay Pines, Florida
(continued)

Contributors (continued)
Akemi Tomoda, M.D., Ph.D.Associate Professor, Department of Child Developmental Sociology, Kumamoto University Hospital, Kumamoto, Japan
Daniel Tranel, Ph.D.Professor of Neurology and Psychology, Division of Behavioral Neurology and Cognitive Neuroscience, Department of Neurology, University of Iowa Hospitals and Clinics, Iowa City, Iowa
Paula T. Trzepacz, M.D.Medical Fellow, II, Neurosciences Research, Eli Lilly and Company, Indianapolis, Indiana; Clinical Professor of Psychiatry, University of Mississippi Medical School, Jackson, Mississippi; Adjunct Professor of Psychiatry, Tufts University School of Medicine, Boston, Massachusetts; Clinical Professor of Psychiatry, Indiana
About the Cover Image
This image was created by Elisabeth Wilde, Ph.D. (Department of Physical Medicine and Rehabilitation,
Baylor College of Medicine, Houston, Texas), with the assistance of Jill V. Hunter, M.D. (Texas Children’s
Hospital, Houston), Zili Chu, Ph.D. (Texas Children’s Hospital, Houston), Marco Ramos, B.S. (Baylor
College of Medicine), and Jon Chis, M.S. (Phillips Medical Systems). The image portrays fibers emanating
from the corpus callosum of a healthy individual, using diffusion tensor imaging (DTI) with fiber
tractography generated by utilizing a 30-direction protocol on a 3-tesla Philips magnet (Philips; best, The
Netherlands). Philips PRIDE software was employed to generate the tractographic image. Consistent with
convention, red color indicates fibers coursing in a left-right orientation; green, an anterior-posterior
direction; and blue, an inferior-superior direction. Though currently considered a research tool, DTI is
rapidly evolving and is likely to gain widespread clinical application in the coming years. Because of its
sensitivity to alteration in white matter microstructure, DTI has shown remarkable promise in diagnosis,
observation of the natural history of disease/recovery, and evaluation of treatment and intervention in
several psychiatric and neurological disorders that affect white matter. Several studies have suggested that
DTI is capable of detecting clinically relevant changes that may not be as evident using conventional
The American Psychiatric Publishing Textbook of Neuropsychiatry and Behavioral Neurosciences, Fifth EditionEdited by Yudofsky SC, Hales RE. © 2008 American Psychiatric Publishing, Inc. All rights reserved. www.appi.org
13
Massachusetts; Clinical Professor of Psychiatry, Indiana University School of Medicine, Indianapolis, Indiana
Gary J. Tucker, M.D. (deceased)Department of Psychiatry and Behavioral Sciences, University of Washington, Seattle, Washington
W. Martin Usrey, Ph.D.Associate Professor of Neurology, Center for Neuroscience, University of California–Davis, Davis, California
Stuart C. Yudofsky, M.D.D.C. and Irene Ellwood Professor and Chairman, Menninger Department of Psychiatry and Behavioral Sciences, Baylor College of Medicine; Chairman, Department of Psychiatry, The Methodist Hospital, Houston, Texas
DTI is capable of detecting clinically relevant changes that may not be as evident using conventional
structural imaging sequences.
Disclosure of Interests
The contributors have declared all forms of support received within
the 12 months prior to manuscript submittal that could present a
competing interest in relation to their work published in this volume,
as follows:
None—Alagbe, Andersen, Apostolova, Berlin, Bhandari, Boswell, Boutros, Brose, Burke, Clark, Cohen, Corcoran, Cowles, Doctor, Fisher, Forrest, Franzen, Gaeta, Galderisi, Ghose, Goetz, Golianu, Hamilton, Harel, Horst, Howieson, Hurley, D. Kim, H. F. Kim, Lezak, Lovell, Malaspina, McAllister, Mendez, Navalta, Noctor, Ovsiew, Polcari, Price, Rayport, Robinson, Salloway, Schobel, Self, Shad, Shaw, Spiegel, Starkstein, Stern, Sweet, Taber, Tan, Tomoda, Tranel, Usrey.
Theodore J. Anfinson, M.D. Speakers’ Bureau: Bristol-Myers Squibb, GlaxoSmithKline, Janssen, Pfizer.
Robert E. Hales, M.D. Symposium chair, American Psychiatric
Association Annual Meeting CME program supported by Bristol-Myers
Squibb. Teleconference program on poster presentation involving
aripiprazole, supported by Bristol-Myers Squibb.
Max Hirshkowitz, Ph.D. Grants/research support: Sleep center has federally funded research protocols and foundation support. Consultant:Cephalon, Takeda, Sanofi-Synthelabo. Contracts: Sleep center has contracts with Cephalon, GlaxoSmithKline, Merck, NBI, ResMed, Respironics, Sanofi-Aventis, Sepracor, Takeda. Speakers’ Bureau: Cephalon, Sanofi, Takeda. Other: Sleep center has received free use of equipment for test purposes from Fisher-Paykel, Itamar, Nasal Aire, Puritan Bennett, ResMed, Respironics, Sunrise.
Eric Hollander, M.D. Grants/research support: National Institute on Drug Abuse (NIDA), NIMH, National Institute on Neurological Disorders and Stroke (NINDS), U.S. Food and Drug Administration Office of Orphan
The American Psychiatric Publishing Textbook of Neuropsychiatry and Behavioral Neurosciences, Fifth EditionEdited by Yudofsky SC, Hales RE. © 2008 American Psychiatric Publishing, Inc. All rights reserved. www.appi.org
14
Jeffrey L. Cummings, M.D. Grants/research support: Janssen. Consultant: Avanir, Eisai, Eli Lilly, EnVivo, Forest, Janssen, Lundbeck, Merz, Myriad, Neurochem, Novartis, Ono, Pfizer, Sanofi-Aventis, Sepracor, Takeda. Speakers’ Bureau: Eisai, Forest, Janssen, Lundbeck, Merz, Novartis, Pfizer. Honoraria: Avanir, Eisai, Janssen, Forest, Lundbeck, Merz, Myriad, Neurochem, Novartis, Ono, Pfizer, Sanofi-Aventis, Sepracor, Takeda. Board member: EnVivo, Myriad, Pfizer.
Dwight L. Evans, M.D. Grants/research support: National Institute of Mental Health (NIMH). Consultant: Abbott, AstraZeneca, Bristol-Myers Squibb/Otsuka, Cephalon, Eli Lilly, Forest, Janssen/Johnson & Johnson, Neuronetics, Pamlab, LLC, Wyeth-Ayerst.
Francisco Fernandez, M.D.Grants/research support: Cyberonics. Speakers’ Bureau: Wyeth-Ayerst.
Stroke (NINDS), U.S. Food and Drug Administration Office of Orphan Products Development (OPD-FDA), Abbott, Ortho-McNeil, Somaxon.
Paul E. Holtzheimer III, M.D. Grants/research support/honoraria:Abbott, American Psychiatric Association, American Federation for Aging Research, Cyberonics, GlaxoSmithKline, National Center for Research Resources, National Institutes of Health Loan Repayment Program, Neuronetics.
Alan J. Lerner, M.D. Speakers’ Bureau: Forest, Novartis, Pfizer.
Helen S. Mayberg, M.D. Grants/research support: Canadian Institutes of
Health Research, NIMH, National Alliance for Research on Schizophrenia
and Depression (NARSAD). Consultant: Advanced Neuromodulation
Systems, AstraZeneca, Cyberonics, GlaxoSmithKline, Lilly, Novartis. Other:
Patent application filed for deep brain stimulation for treatment-resistant
depression.
(continued)
Disclosure of Interests (continued)
David J. Meagher, M.D., M.R.C.Psych. Grants/research support:
Unrestricted educational grant, AstraZeneca.
Andrew H. Miller, M.D. Grants/research support: NIMH, National Heart,
Lung and Blood Institute (NHLBI), GlaxoSmithKline, Janssen, Schering-
Plough. Consultant: Centecor, Schering-Plough.
Charles B. Nemeroff, M.D., Ph.D.Grants/research support: NARSAD,
NIMH, American Foundation for Suicide Prevention (AFSP), AstraZeneca,
Bristol-Myers Squibb, Forest, Janssen, Pfizer, Wyeth-Ayerst. Consultant:
Abbott, Acadia, Bristol-Myers Squibb, Corcept, Cypress Biosciences,
Cyberonics, Lilly, Entrepreneur’s Fund, Forest, GlaxoSmithKline, i3 DLN,
Janssen, Lundbeck, Otsuka, Pfizer, Quintiles, UCB Pharma, Wyeth-Ayerst.
Speakers’ Bureau: Abbott, GlaxoSmithKline, Janssen, Pfizer. Board of
Directors: AFSP, American Psychiatric Institute for Research and Education
(APIRE), George West Mental Health Foundation, Novel Pharma, National
Peter P. Roy-Byrne, M.D. Grants/research support: Forest,
GlaxoSmithKline, Pfizer. Consultant/advisor: Alza, Cephalon,
GlaxoSmithKline, Eli Lilly, Forest, Janssen, Jazz, Pfizer, Pharmacia, Roche,
Wyeth-Ayerst. Speaker’s honoraria: Forest, GlaxoSmithKline, Novartis,
Pfizer, Pharmacia, Wyeth-Ayerst.
Harold A. Sackeim, Ph.D. Consultant: Cyberonics, MECTA Lab Corp.,
Neuronetics, NeuroPace, Pfizer.
Amir Sharafkhaneh, M.D. Consultant: Avanir Pharmaceuticals, Hamilton
Pharmaceuticals. Speakers’ Bureau: Forest, Pfizer.
Jonathan M. Silver, M.D. Consultant: Novartis. Speaker: Avanir.
Mark Snowden, M.D., M.P.H. Speakers’ Bureau: Pfizer.
The American Psychiatric Publishing Textbook of Neuropsychiatry and Behavioral Neurosciences, Fifth EditionEdited by Yudofsky SC, Hales RE. © 2008 American Psychiatric Publishing, Inc. All rights reserved. www.appi.org
15
(APIRE), George West Mental Health Foundation, Novel Pharma, National
Foundation for Mental Health. Stockholder: Acadia, Corcept, Cypress
Biosciences, NovaDel. Equity: BMC-JR LLC, CeNeRx, Reevax. Patents:
Method and devices for transdermal delivery of lithium (US 6,375,990 B1);
method to estimate serotonin and norepinephrine transporter occupancy after
drug treatment using patient or animal serum (provisional filing, April 2001).
Eric J. Nestler, M.D., Ph.D. Scientific Advisory Board: Eli Lilly (chair),
Helicon, Intra-Cellular Therapies, Neurogen, Neurologix, Neuro-Molecular,
Predix Pharmaceuticals, Psychogenics (founder and chair), RxGen.
Scott L. Rauch, M.D. Grants/research support: Cephalon, Cyberonics,
Medtronic Inc, Northstar. Fellowship support: Pfizer. Consultant:
Cyberonics, Novartis.
David Riley, M.D. Honoraria: Boehringer Ingelheim, GlaxoSmithKline.
Dan J. Stein, M.D., Ph.D.Grants/research support or consultancy
honoraria: AstraZeneca, Eli Lilly, GlaxoSmithKline, Lundbeck, Orion,
Pfizer, Pharmacia, Roche, Servier, Solvay, Sumitomo, Wyeth-Ayerst.
Carol A. Tamminga, M.D. Grants/research support: Bristol-Myers Squibb
for Physicians Postgraduate Press monograph. Speaker: AstraZeneca (once).
Consultant, ad hoc: Abbott, ARYx Therapeutics, Becker Pharma, Organon,
Patterson, Balknap, Webb & Tyler for Johnson & Johnson (once), Saegis,
Sumitomo. Consultant, drug development: Nupathe. Advisory board, drug
development: Acadia, Avera, Intracellular Therapies, Neurogen.
(continued)
Disclosure of Interests (continued)
Martin H. Teicher, M.D., Ph.D. Grants/research support: NIDA, NIMH,
NARSAD, Kodak Inc., Simches family. Sponsored research: Federally
sponsored research on a nonpharmacological treatment for ADHD developed
by Ambulatory Monitoring, Inc. Patents: M.H.T. largely developed the
M-MAT technology used in this report for assessing activity and attention
disturbances in ADHD and is the holder of six patents relating to assessment
of ADHD involving this technology or T2 relaxometry. M-MAT is owned by
McLean Hospital and has been licensed to BioBehavioral Diagnostics, Inc,
for commercial development, with the potential for M.H.T. to profit in
accordance with conflict of interest policies established by Harvard Medical
School. M.H.T. also holds four patents on the use of pharmaceutical agents,
including l-threomethylphenidate for treatment of depression, and for the
delivery of methylphenidate, along with a second central nervous system
stimulant, for treatment of ADHD. Other: M.H.T. has not signed any
agreement that would prevent a) publishing both positive and negative
results, b) collaborating with other investigators to pool data across sites, or
The American Psychiatric Publishing Textbook of Neuropsychiatry and Behavioral Neurosciences, Fifth EditionEdited by Yudofsky SC, Hales RE. © 2008 American Psychiatric Publishing, Inc. All rights reserved. www.appi.org
16
results, b) collaborating with other investigators to pool data across sites, or
c) publishing without the approval of the sponsor.
Robert W. Thatcher, Ph.D. R.W.T. is an officer in and is affiliated with
Applied Neuroscience, Inc, but received no financial or other support from
that firm while writing or contributing to this chapter.
Paula T. Trzepacz, M.D. P.T.T. is a full-time salaried employee of and
shareholder in Eli Lilly and Company.
Stuart C. Yudofsky, M.D. Co-chairman, Psychopharmacology Update
Breakfast Symposium, sponsored by Bristol-Myers Squibb, at the American
Psychiatric Association Annual Meeting. Vice President, Diamond
Healthcare Corporation, a private company that specializes in providing
inpatient psychiatric, alcoholism, and substance use disorders treatment
services.
Links to Resources for Neuropsychiatry
American Academy of Neurology – http://www.aan.com
American Association for Geriatric Psychiatry – http://www.aagponline.org
American Epilepsy Society – http://www.aesnet.org
American Neuropsychiatric Association – http://www.anpaonline.org
American Psychiatric Association – http://www.psych.org, http://www.psych.org/public_info/resourcelinks.cfm
American Psychiatric Publishing, Inc. – http://www.appi.org; http://www.psychiatryonline.org
British Neuropsychiatric Association – http://www.bnpa.org.uk
The American Psychiatric Publishing Textbook of Neuropsychiatry and Behavioral Neurosciences, Fifth EditionEdited by Yudofsky SC, Hales RE. © 2008 American Psychiatric Publishing, Inc. All rights reserved. www.appi.org
17
Cognitive Neuroscience Society – http://www.cogneurosociety.org
Highwire Press – http://highwire.stanford.edu
International Neuropsychological Society – http://www.the-ins.org
International Neuropsychiatric Association – http://www.inaweb.org
Society for Behavioral and Cognitive Neurology – http://the-sbcn.org
United Council for Neurologic Subspecialties – http://www.ucns.org

CHAPTER 1
CELLULAR AND MOLECULAR BIOLOGY OF THE NEURON
A. Kimberley McAllister, Ph.D.W. Martin Usrey, Ph.D.
Stephen C. Noctor, Ph.D.Stephen Rayport, M.D., Ph.D.
The American Psychiatric Publishing Textbook of Neuropsychiatry and Behavioral Neurosciences, Fifth EditionEdited by Yudofsky SC, Hales RE. © 2008 American Psychiatric Publishing, Inc. All rights reserved. www.appi.org
18
Slide Show
Topic headings and reading list
Figures
Highlights for the clinician
Main menu
(About, Contents, Contributors, Publishing facts)

Cellular Function of NeuronsCellular Composition of the BrainNeuronal Shape
Neuronal Excitability
Signaling Between NeuronsRapid Postsynaptic ResponsesGlutamate ReceptorsGABA ReceptorsMetabotropic ReceptorsGases as Transcellular ModulatorsOrganization of Postsynaptic Receptors at Synapses
Synaptic Modulation in Learning and MemorySensitization in Aplysia
Synapse Formation
Neuronal Maturation and Survival
Experience-Dependent Synaptic Refinement
Neurotrophic and Neurotoxic Actions of Neurotransmitters
Perspectives
RECOMMENDED READINGSCummings JL: Toward a molecular neuropsychiatry
of neurodegenerative diseases. Ann Neurol 54:147–154, 2003
Graham D, Lantos P: Greenfield’s Neuropathology,
CHAPTER 1 • Topics and Readings
The American Psychiatric Publishing Textbook of Neuropsychiatry and Behavioral Neurosciences, Fifth EditionEdited by Yudofsky SC, Hales RE. © 2008 American Psychiatric Publishing, Inc. All rights reserved. www.appi.org
19
Sensitization in AplysiaLong-Term Potentiation
Development of NeuronsBirth and MigrationIdentification of Neuronal Progenitor CellsRegulation of ProliferationDetermination of Cell FateMigration
Graham D, Lantos P: Greenfield’s Neuropathology,7th Edition. London, Arnold, 2002
Kandel ER, Schwartz JH, Jessell TM: Principles of Neural Science, 4th Edition. New York: McGraw-Hill, 2000
Siegel GJ, Albers RW, Brady S, et al: Basic Neurochemistry: Molecular, Cellular and Medical Aspects, 7th Edition. New York, Elsevier, 2006
CHAPTER 1 • Figures
Figure 1–12. Molecular mechanisms of short-term and long-term memory storage
Figure 1–13. Long-term potentiation (LTP) in the hippocampus
Figure 1–14. Molecular basis for long-term potentiation in the postsynaptic membrane of a CA1 pyramidal neuron
Figure 1–15. Scheme depicting key events in the generation of cortical neurons during embryogenesis
Figure 1–1. Functional organization of the neuron
Figure 1–2. Opening of ion channels gives rise to the action potential
Figure 1–3. Action potential conduction in myelinated axon
Figure 1–4. Intrinsic properties determine neuronal responses
Figure 1–5. Modes of interneuronal communication
Figure 1–6. Synaptic ultrastructure
The American Psychiatric Publishing Textbook of Neuropsychiatry and Behavioral Neurosciences, Fifth EditionEdited by Yudofsky SC, Hales RE. © 2008 American Psychiatric Publishing, Inc. All rights reserved. www.appi.org
20
during embryogenesis
Figure 1–16. During development, neocortical neurons exhibit four distinct phases in migration
Figure 1–17. Synapse formation of the neuromuscular junction (NMJ)
Figure 1–18. Neurotrophins exert their effects through binding to two types of receptors
Figure 1–19. Ocular dominance columns in visual cortex
Summary Highlights for the Clinician
Figure 1–6. Synaptic ultrastructure
Figure 1–7. Steps in synaptic transmission at a chemical synapse
Figure 1–8. Molecular events in synaptic vesicle docking and fusion
Figure 1–9. Neurotransmitter transporters
Figure 1–10. Major intracellular signaling pathways in neurons
Figure 1–11. Some of the molecular components of a typical CNS glutamatergic synapse
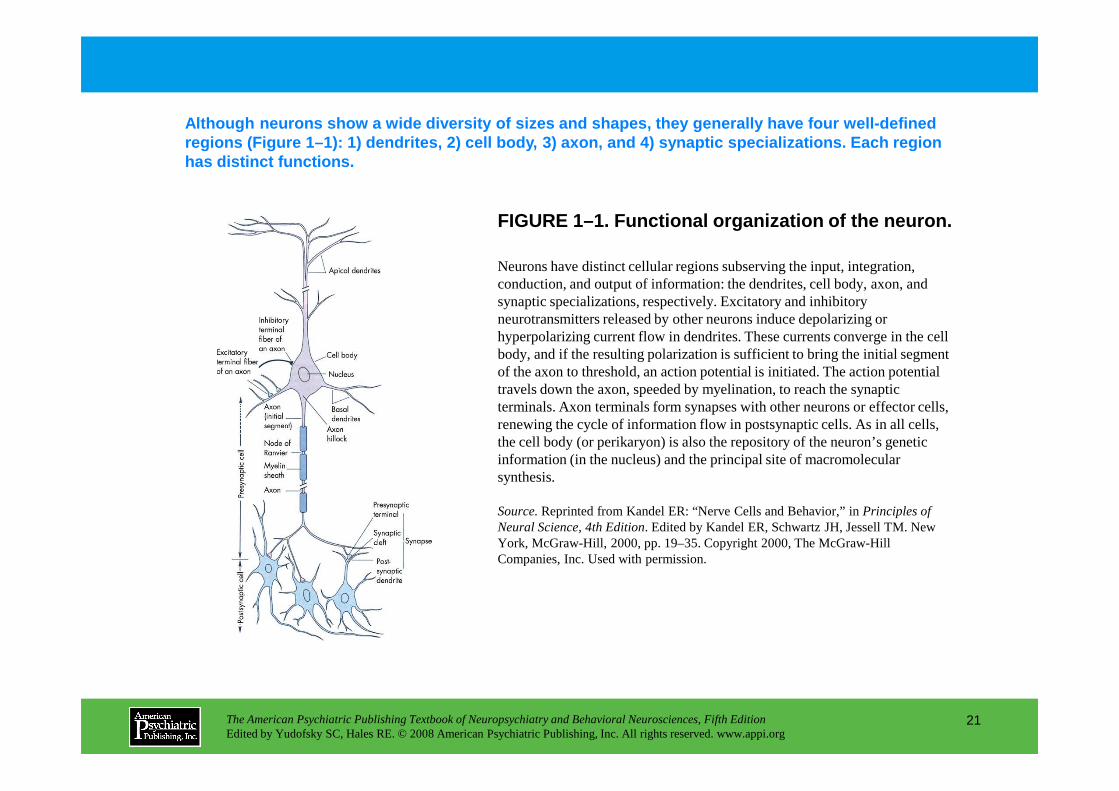
FIGURE 1–1. Functional organization of the neuron.
Although neurons show a wide diversity of sizes and shapes, they generally have four well-defined regions (Figure 1–1): 1) dendrites, 2) cell body, 3 ) axon, and 4) synaptic specializations. Each region has distinct functions.
Neurons have distinct cellular regions subserving the input, integration, conduction, and output of information: the dendrites, cell body, axon, and synaptic specializations, respectively. Excitatory and inhibitory neurotransmitters released by other neurons induce depolarizing or hyperpolarizing current flow in dendrites. These currents converge in the cell body, and if the resulting polarization is sufficient to bring the initial segment of the axon to threshold, an action potential is initiated. The action potential travels down the axon, speeded by myelination, to reach the synaptic
The American Psychiatric Publishing Textbook of Neuropsychiatry and Behavioral Neurosciences, Fifth EditionEdited by Yudofsky SC, Hales RE. © 2008 American Psychiatric Publishing, Inc. All rights reserved. www.appi.org
21
travels down the axon, speeded by myelination, to reach the synaptic terminals. Axon terminals form synapses with other neurons or effector cells, renewing the cycle of information flow in postsynaptic cells. As in all cells, the cell body (or perikaryon) is also the repository of the neuron’s genetic information (in the nucleus) and the principal site of macromolecular synthesis.
Source.Reprinted from Kandel ER: “Nerve Cells and Behavior,” in Principles of Neural Science, 4th Edition. Edited by Kandel ER, Schwartz JH, Jessell TM. New York, McGraw-Hill, 2000, pp. 19–35. Copyright 2000, The McGraw-Hill Companies, Inc. Used with permission.
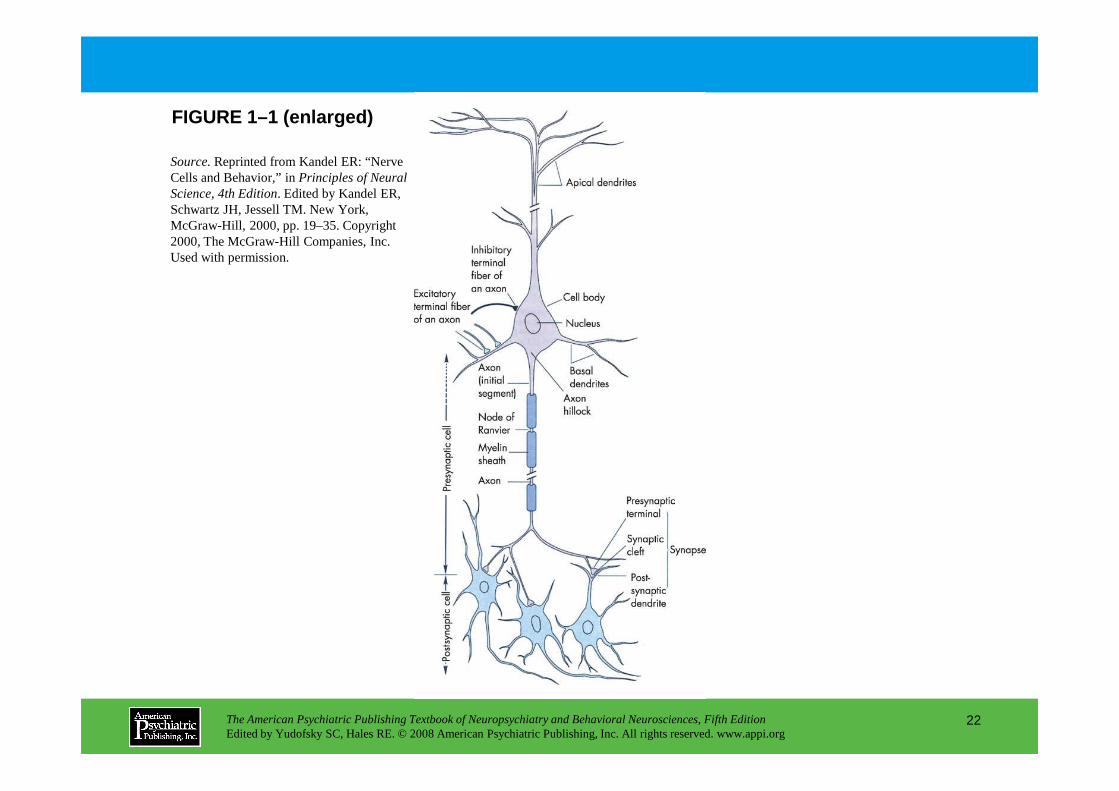
FIGURE 1–1 (enlarged)
Source.Reprinted from Kandel ER: “Nerve Cells and Behavior,” in Principles of Neural Science, 4th Edition. Edited by Kandel ER, Schwartz JH, Jessell TM. New York, McGraw-Hill, 2000, pp. 19–35. Copyright 2000, The McGraw-Hill Companies, Inc. Used with permission.
The American Psychiatric Publishing Textbook of Neuropsychiatry and Behavioral Neurosciences, Fifth EditionEdited by Yudofsky SC, Hales RE. © 2008 American Psychiatric Publishing, Inc. All rights reserved. www.appi.org
22
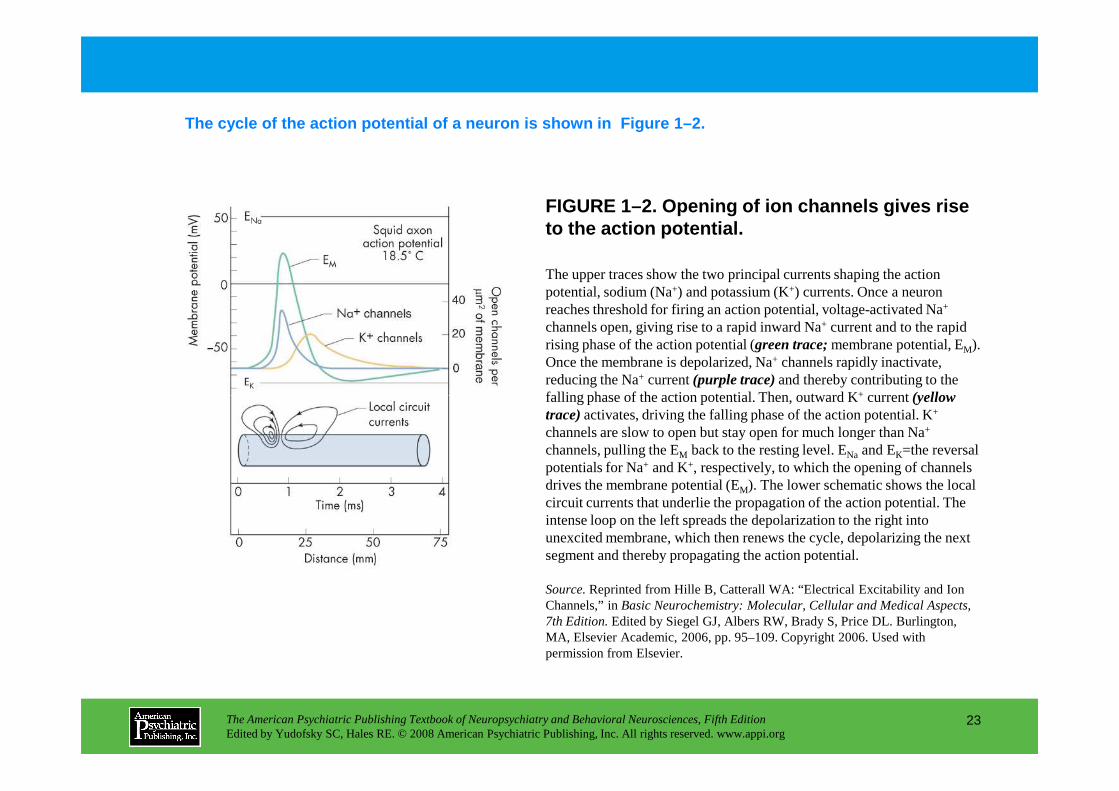
FIGURE 1–2. Opening of ion channels gives rise to the action potential.
The cycle of the action potential of a neuron is sh own in Figure 1–2.
The upper traces show the two principal currents shaping the action potential, sodium (Na+) and potassium (K+) currents. Once a neuron reaches threshold for firing an action potential, voltage-activated Na+
channels open, giving rise to a rapid inward Na+ current and to the rapid rising phase of the action potential (green trace;membrane potential, EM). Once the membrane is depolarized, Na+ channels rapidly inactivate, reducing the Na+ current (purple trace)and thereby contributing to the falling phase of the action potential. Then, outward K+ current (yellow
The American Psychiatric Publishing Textbook of Neuropsychiatry and Behavioral Neurosciences, Fifth EditionEdited by Yudofsky SC, Hales RE. © 2008 American Psychiatric Publishing, Inc. All rights reserved. www.appi.org
23
falling phase of the action potential. Then, outward K+ current (yellow trace)activates, driving the falling phase of the action potential. K+
channels are slow to open but stay open for much longer than Na+
channels, pulling the EM back to the resting level. ENa and EK=the reversal potentials for Na+ and K+, respectively, to which the opening of channels drives the membrane potential (EM). The lower schematic shows the local circuit currents that underlie the propagation of the action potential. The intense loop on the left spreads the depolarization to the right into unexcited membrane, which then renews the cycle, depolarizing the next segment and thereby propagating the action potential.
Source.Reprinted from Hille B, Catterall WA: “Electrical Excitability and Ion Channels,” in Basic Neurochemistry: Molecular, Cellular and Medical Aspects, 7th Edition.Edited by Siegel GJ, Albers RW, Brady S, Price DL. Burlington, MA, Elsevier Academic, 2006, pp. 95–109. Copyright 2006. Used with permission from Elsevier.

FIGURE 1–3. Action potential conduction in myelinated axon.
The action potential provides a high-quality digita l signaling mechanism in neurons (Figure 1–3). Speed is enhanced by myelination, which restricts c urrent flow to the gaps between myelin segments.
Panel A.Schematic of a myelinated axon. Oligodendrocytes produce the insulating myelin sheath that surrounds the axon in segments. Myelination restricts current flow to the gaps between myelin segments, the nodes of Ranvier, where Na+ channels are concentrated. The result is a dramatic enhancement of the conduction velocity of the action potential. Panel B.Because sodium channels are activated by membrane depolarization and also cause depolarization, they have regenerative properties. This underlies the “all-or-nothing” properties
The American Psychiatric Publishing Textbook of Neuropsychiatry and Behavioral Neurosciences, Fifth EditionEdited by Yudofsky SC, Hales RE. © 2008 American Psychiatric Publishing, Inc. All rights reserved. www.appi.org
24
regenerative properties. This underlies the “all-or-nothing” properties of the action potential and also explains its rapid spread down the axon. The action potential is an electrical wave; as each node of Ranvier is depolarized, it in turn depolarizes the subsequent node. Panel C.The Na+ current underlying the action potential is shown in three successive images at 0.5-millisecond intervals and corresponds to the current traces in Panel B. As the action potential (red shading)travels to the right, Na+ channels go from closed to open to inactivated to closed. In this way, an action potential initiated at the initial segment of the axon conducts reliably to the axon terminals. Because Na+ channels temporarily inactivate after depolarization, there is a brief refractory period following the action potential that blocks backward spread of the action potential and thus ensures reliable forward conduction.
Source.Reprinted from Purves D, Augustine GJ, Fitzpatrick D, et al. (eds): Neuroscience, 3rd Edition. Sunderland, MA, Sinauer Associates, 2004, p. 64. Used with permission.
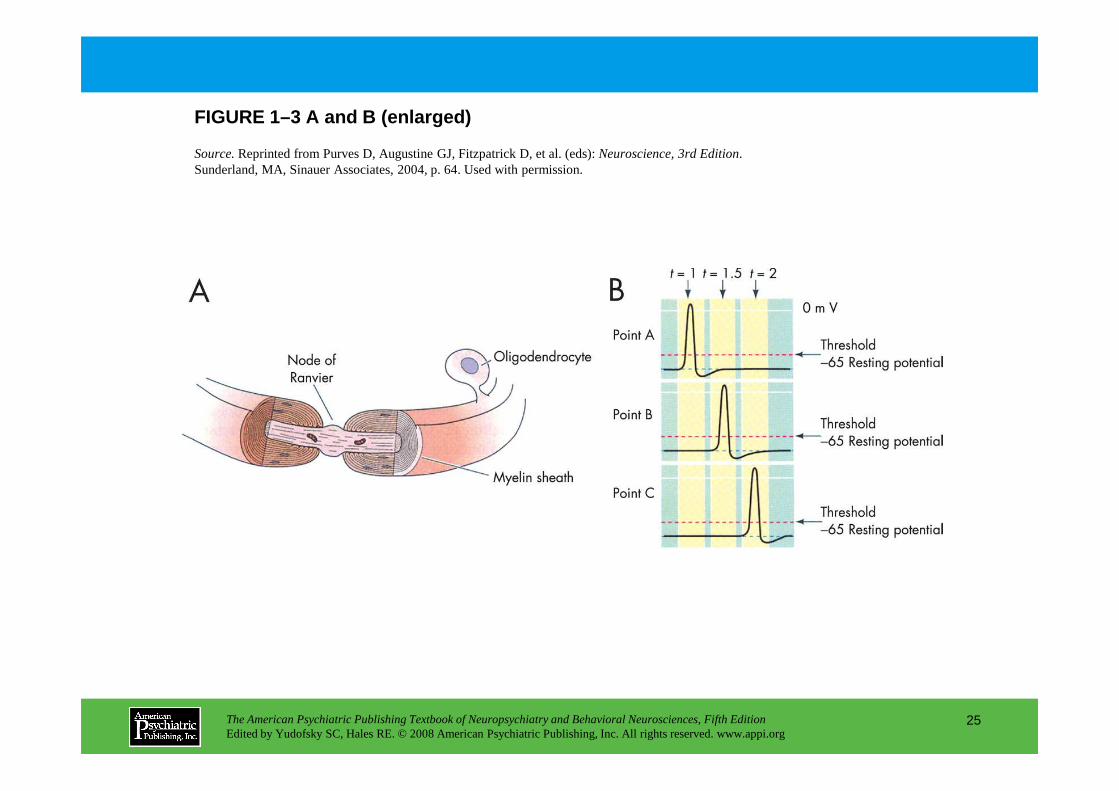
FIGURE 1–3 A and B (enlarged)
Source.Reprinted from Purves D, Augustine GJ, Fitzpatrick D, et al. (eds): Neuroscience, 3rd Edition. Sunderland, MA, Sinauer Associates, 2004, p. 64. Used with permission.
The American Psychiatric Publishing Textbook of Neuropsychiatry and Behavioral Neurosciences, Fifth EditionEdited by Yudofsky SC, Hales RE. © 2008 American Psychiatric Publishing, Inc. All rights reserved. www.appi.org
25
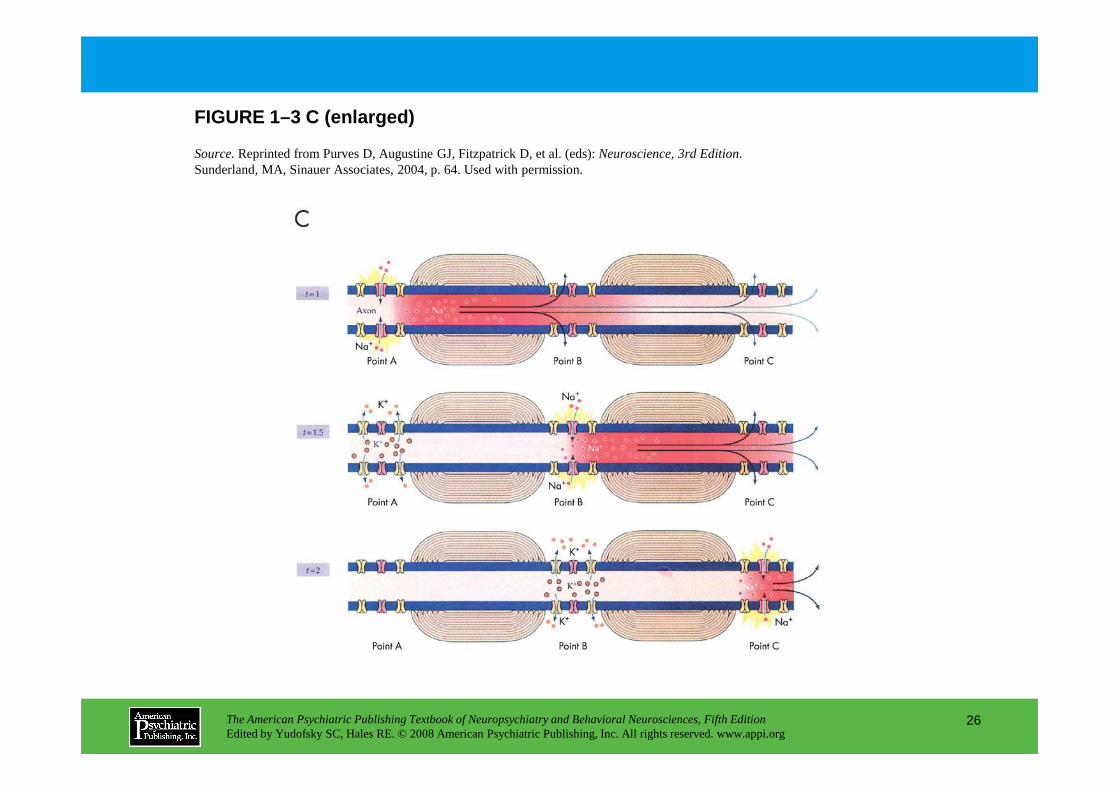
FIGURE 1–3 C (enlarged)
Source.Reprinted from Purves D, Augustine GJ, Fitzpatrick D, et al. (eds): Neuroscience, 3rd Edition. Sunderland, MA, Sinauer Associates, 2004, p. 64. Used with permission.
The American Psychiatric Publishing Textbook of Neuropsychiatry and Behavioral Neurosciences, Fifth EditionEdited by Yudofsky SC, Hales RE. © 2008 American Psychiatric Publishing, Inc. All rights reserved. www.appi.org
26
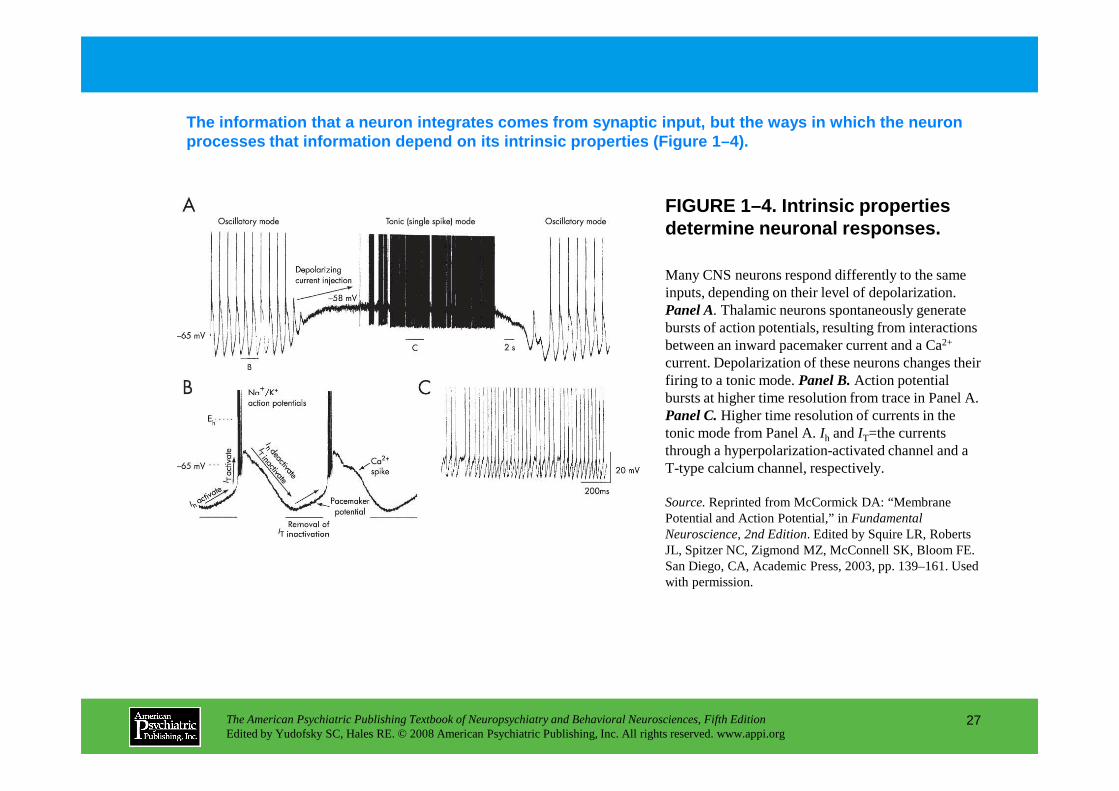
FIGURE 1–4. Intrinsic properties determine neuronal responses.
The information that a neuron integrates comes from synaptic input, but the ways in which the neuron processes that information depend on its intrinsic properties (Figure 1–4).
Many CNS neurons respond differently to the same inputs, depending on their level of depolarization. Panel A. Thalamic neurons spontaneously generate bursts of action potentials, resulting from interactions between an inward pacemaker current and a Ca2+
current. Depolarization of these neurons changes their firing to a tonic mode. Panel B.Action potential bursts at higher time resolution from trace in Panel A.
The American Psychiatric Publishing Textbook of Neuropsychiatry and Behavioral Neurosciences, Fifth EditionEdited by Yudofsky SC, Hales RE. © 2008 American Psychiatric Publishing, Inc. All rights reserved. www.appi.org
27
bursts at higher time resolution from trace in Panel A. Panel C.Higher time resolution of currents in the tonic mode from Panel A. Ih and IT=the currents through a hyperpolarization-activated channel and a T-type calcium channel, respectively.
Source.Reprinted from McCormick DA: “Membrane Potential and Action Potential,” in Fundamental Neuroscience, 2nd Edition. Edited by Squire LR, Roberts JL, Spitzer NC, Zigmond MZ, McConnell SK, Bloom FE. San Diego, CA, Academic Press, 2003, pp. 139–161. Used with permission.

FIGURE 1–4 (enlarged)Source.Reprinted from McCormick DA: “Membrane Potential and Action Potential,” in Fundamental Neuroscience, 2nd Edition. Edited by Squire LR, Roberts JL, Spitzer NC, Zigmond MZ, McConnell SK, Bloom FE. San Diego, CA, Academic Press, 2003, pp. 139–161. Used with permission.
The American Psychiatric Publishing Textbook of Neuropsychiatry and Behavioral Neurosciences, Fifth EditionEdited by Yudofsky SC, Hales RE. © 2008 American Psychiatric Publishing, Inc. All rights reserved. www.appi.org
28
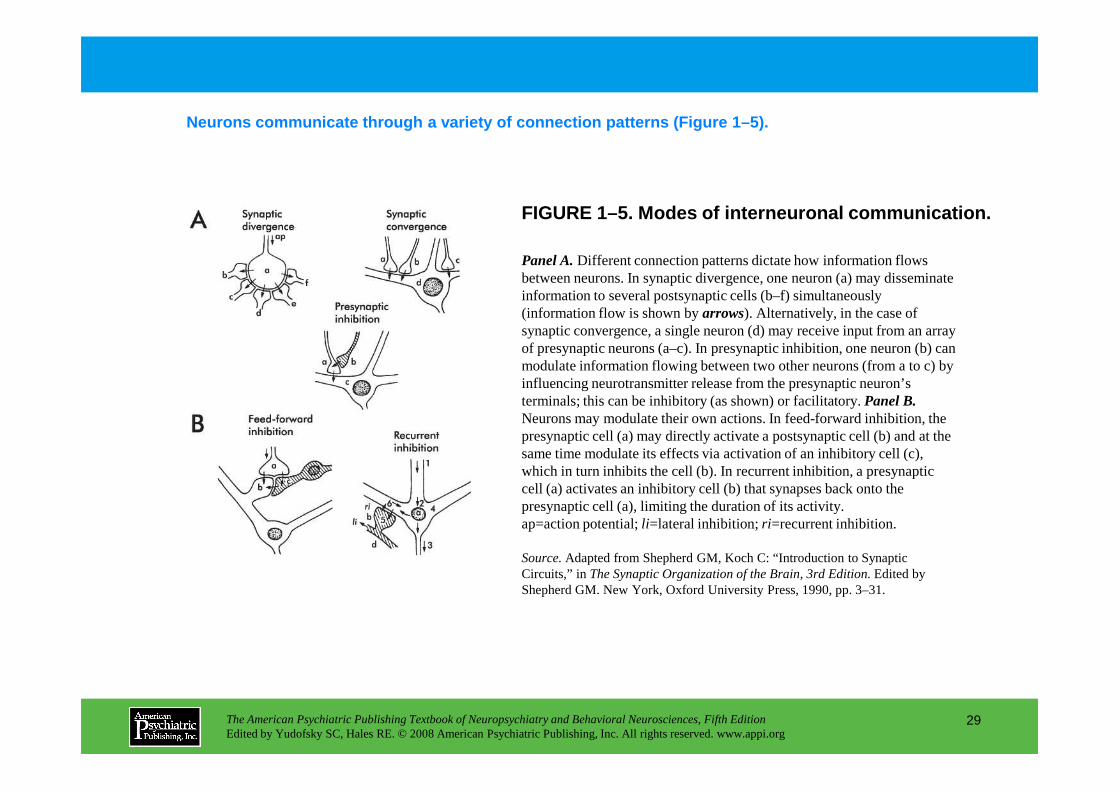
FIGURE 1–5. Modes of interneuronal communication.
Neurons communicate through a variety of connection patterns (Figure 1–5).
Panel A.Different connection patterns dictate how information flows between neurons. In synaptic divergence, one neuron (a) may disseminate information to several postsynaptic cells (b–f) simultaneously (information flow is shown by arrows). Alternatively, in the case of synaptic convergence, a single neuron (d) may receive input from an array of presynaptic neurons (a–c). In presynaptic inhibition, one neuron (b) can modulate information flowing between two other neurons (from a to c) by influencing neurotransmitter release from the presynaptic neuron’s terminals; this can be inhibitory (as shown) or facilitatory. Panel B.
The American Psychiatric Publishing Textbook of Neuropsychiatry and Behavioral Neurosciences, Fifth EditionEdited by Yudofsky SC, Hales RE. © 2008 American Psychiatric Publishing, Inc. All rights reserved. www.appi.org
29
terminals; this can be inhibitory (as shown) or facilitatory. Panel B.Neurons may modulate their own actions. In feed-forward inhibition, the presynaptic cell (a) may directly activate a postsynaptic cell (b) and at the same time modulate its effects via activation of an inhibitory cell (c), which in turn inhibits the cell (b). In recurrent inhibition, a presynaptic cell (a) activates an inhibitory cell (b) that synapses back onto the presynaptic cell (a), limiting the duration of its activity.ap=action potential; li=lateral inhibition; ri=recurrent inhibition.
Source.Adapted from Shepherd GM, Koch C: “Introduction to Synaptic Circuits,” in The Synaptic Organization of the Brain, 3rd Edition. Edited by Shepherd GM. New York, Oxford University Press, 1990, pp. 3–31.

FIGURE 1–5 (enlarged)
Source.Adapted from Shepherd GM, Koch C: “Introduction to Synaptic Circuits,” in The Synaptic Organization of the Brain, 3rd Edition.Edited by Shepherd GM. New York, Oxford University Press, 1990, pp. 3–31.
The American Psychiatric Publishing Textbook of Neuropsychiatry and Behavioral Neurosciences, Fifth EditionEdited by Yudofsky SC, Hales RE. © 2008 American Psychiatric Publishing, Inc. All rights reserved. www.appi.org
30
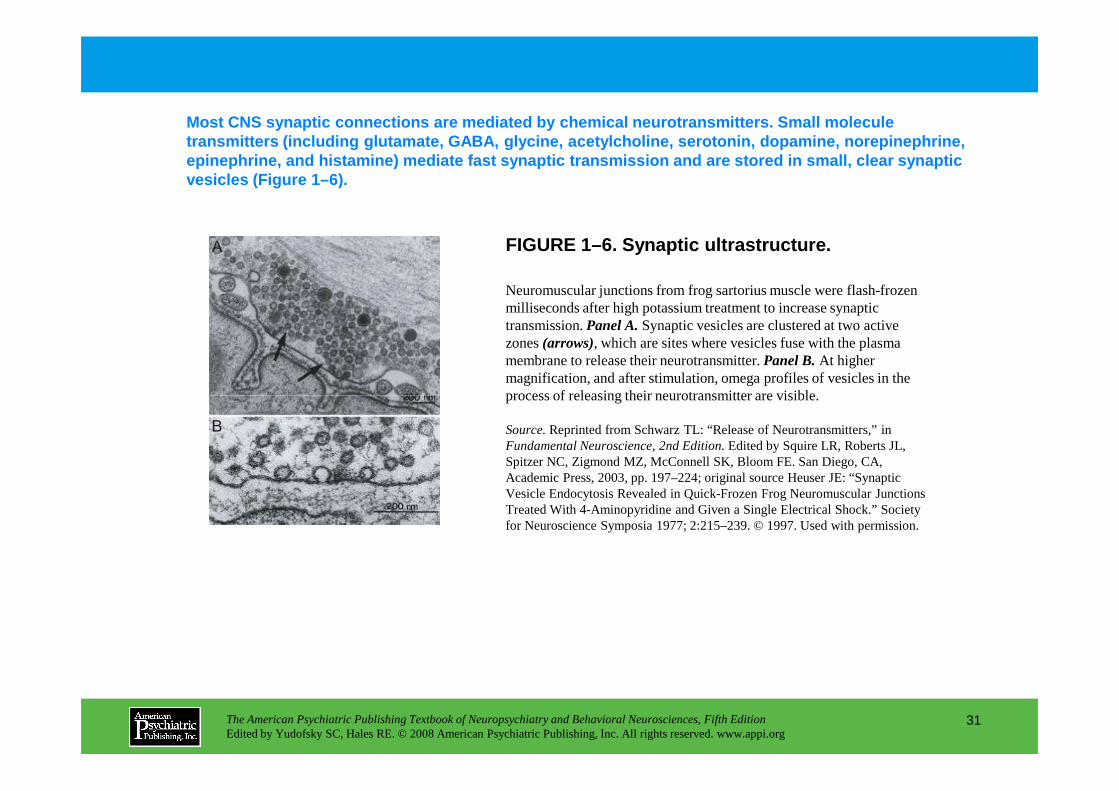
Most CNS synaptic connections are mediated by chemi cal neurotransmitters. Small molecule transmitters (including glutamate, GABA, glycine, a cetylcholine, serotonin, dopamine, norepinephrine, epinephrine, and histamine) mediate fast synaptic t ransmission and are stored in small, clear synaptic vesicles (Figure 1–6).
FIGURE 1–6. Synaptic ultrastructure.
Neuromuscular junctions from frog sartorius muscle were flash-frozen milliseconds after high potassium treatment to increase synaptic transmission. Panel A.Synaptic vesicles are clustered at two active zones (arrows), which are sites where vesicles fuse with the plasma membrane to release their neurotransmitter. Panel B.At higher magnification, and after stimulation, omega profiles of vesicles in the process of releasing their neurotransmitter are visible.
The American Psychiatric Publishing Textbook of Neuropsychiatry and Behavioral Neurosciences, Fifth EditionEdited by Yudofsky SC, Hales RE. © 2008 American Psychiatric Publishing, Inc. All rights reserved. www.appi.org
31
process of releasing their neurotransmitter are visible.
Source.Reprinted from Schwarz TL: “Release of Neurotransmitters,” in Fundamental Neuroscience, 2nd Edition.Edited by Squire LR, Roberts JL, Spitzer NC, Zigmond MZ, McConnell SK, Bloom FE. San Diego, CA, Academic Press, 2003, pp. 197–224; original source Heuser JE: “Synaptic Vesicle Endocytosis Revealed in Quick-Frozen Frog Neuromuscular Junctions Treated With 4-Aminopyridine and Given a Single Electrical Shock.” Society for Neuroscience Symposia 1977; 2:215–239. © 1997. Used with permission.
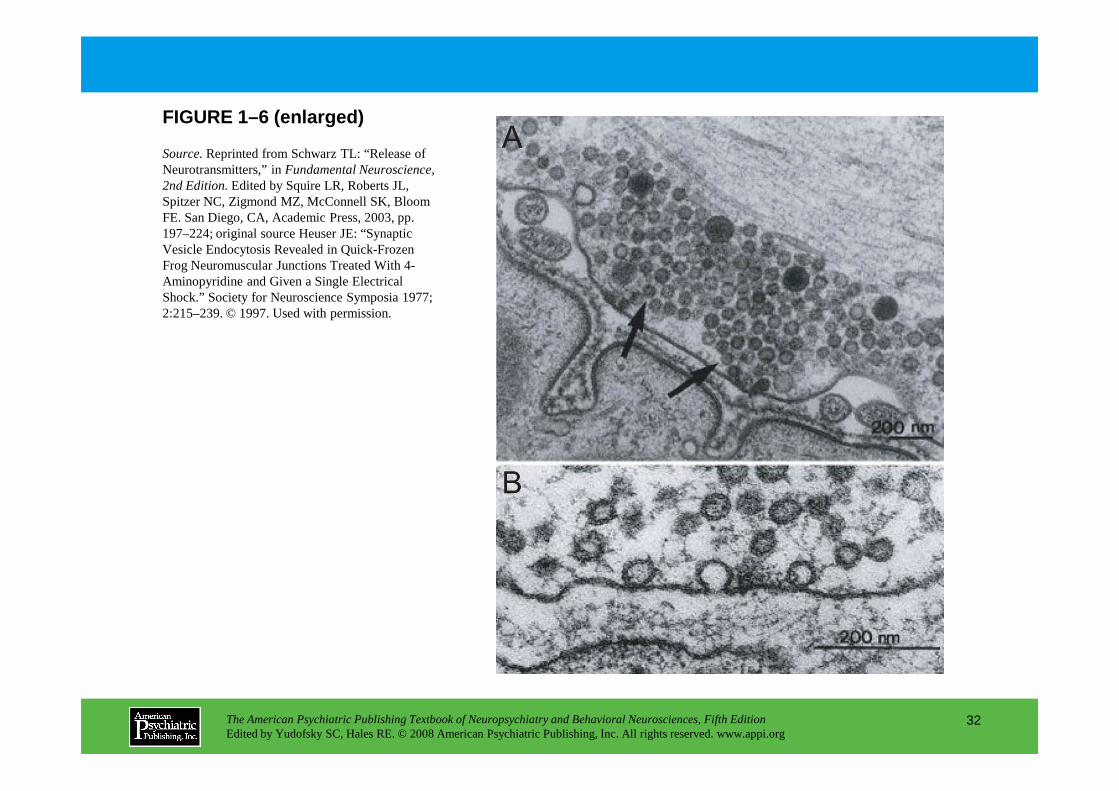
FIGURE 1–6 (enlarged)
Source.Reprinted from Schwarz TL: “Release of Neurotransmitters,” in Fundamental Neuroscience, 2nd Edition.Edited by Squire LR, Roberts JL, Spitzer NC, Zigmond MZ, McConnell SK, Bloom FE. San Diego, CA, Academic Press, 2003, pp. 197–224; original source Heuser JE: “Synaptic Vesicle Endocytosis Revealed in Quick-Frozen Frog Neuromuscular Junctions Treated With 4-Aminopyridine and Given a Single Electrical Shock.” Society for Neuroscience Symposia 1977; 2:215–239. © 1997. Used with permission.
The American Psychiatric Publishing Textbook of Neuropsychiatry and Behavioral Neurosciences, Fifth EditionEdited by Yudofsky SC, Hales RE. © 2008 American Psychiatric Publishing, Inc. All rights reserved. www.appi.org
32
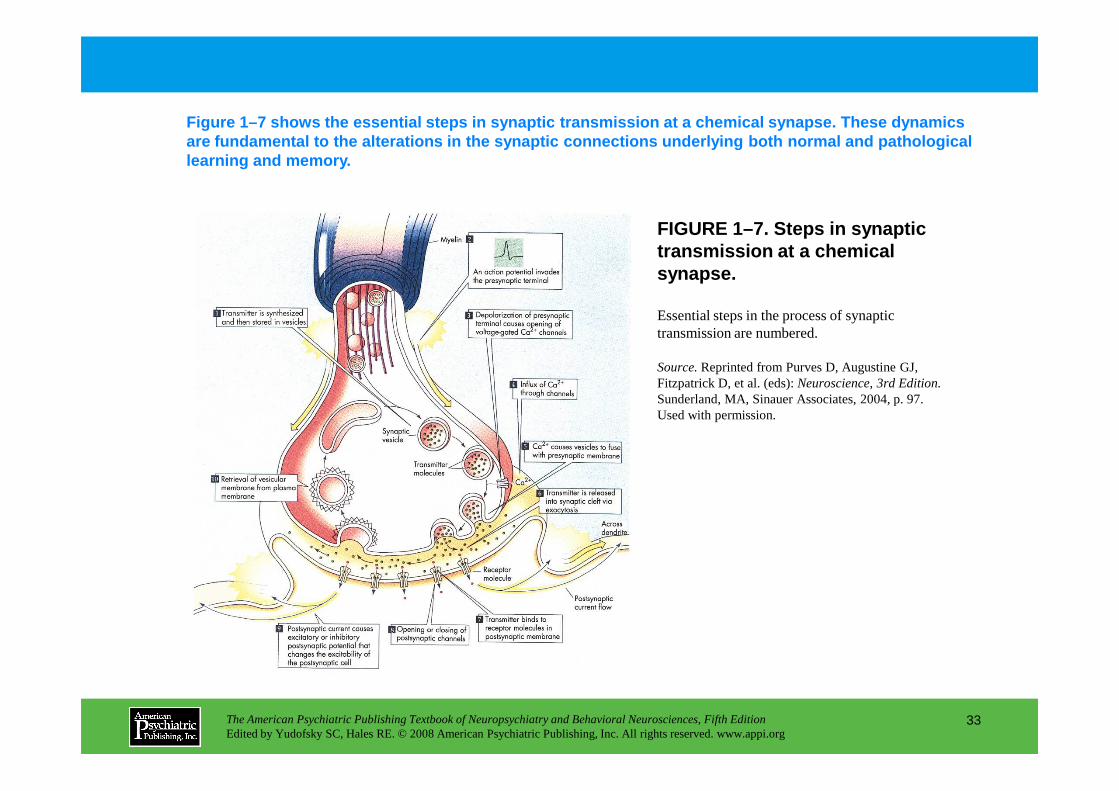
FIGURE 1–7. Steps in synaptic transmission at a chemical synapse.
Figure 1–7 shows the essential steps in synaptic tr ansmission at a chemical synapse. These dynamics are fundamental to the alterations in the synaptic connections underlying both normal and pathological learning and memory.
Essential steps in the process of synaptic transmission are numbered.
Source.Reprinted from Purves D, Augustine GJ, Fitzpatrick D, et al. (eds): Neuroscience, 3rd Edition. Sunderland, MA, Sinauer Associates, 2004, p. 97.
The American Psychiatric Publishing Textbook of Neuropsychiatry and Behavioral Neurosciences, Fifth EditionEdited by Yudofsky SC, Hales RE. © 2008 American Psychiatric Publishing, Inc. All rights reserved. www.appi.org
33
Sunderland, MA, Sinauer Associates, 2004, p. 97. Used with permission.

FIGURE 1–7 (enlarged)
Source.Reprinted from Purves D, Augustine GJ, Fitzpatrick D, et al. (eds): Neuroscience, 3rd Edition. Sunderland, MA, Sinauer Associates, 2004, p 97. Used with permission.
The American Psychiatric Publishing Textbook of Neuropsychiatry and Behavioral Neurosciences, Fifth EditionEdited by Yudofsky SC, Hales RE. © 2008 American Psychiatric Publishing, Inc. All rights reserved. www.appi.org
34
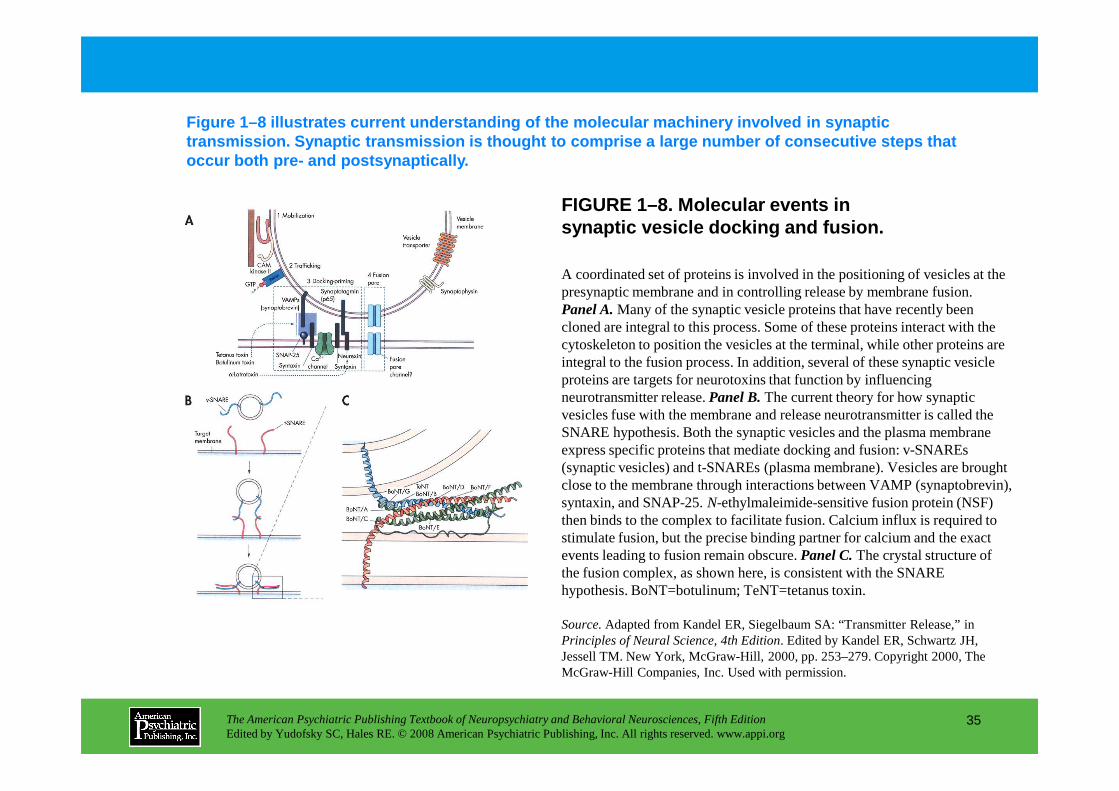
FIGURE 1–8. Molecular events in synaptic vesicle docking and fusion.
Figure 1–8 illustrates current understanding of the molecular machinery involved in synaptic transmission. Synaptic transmission is thought to c omprise a large number of consecutive steps that occur both pre- and postsynaptically.
A coordinated set of proteins is involved in the positioning of vesicles at the presynaptic membrane and in controlling release by membrane fusion. Panel A.Many of the synaptic vesicle proteins that have recently been cloned are integral to this process. Some of these proteins interact with the cytoskeleton to position the vesicles at the terminal, while other proteins are integral to the fusion process. In addition, several of these synaptic vesicle proteins are targets for neurotoxins that function by influencing neurotransmitter release. PanelB. The current theory for how synaptic
The American Psychiatric Publishing Textbook of Neuropsychiatry and Behavioral Neurosciences, Fifth EditionEdited by Yudofsky SC, Hales RE. © 2008 American Psychiatric Publishing, Inc. All rights reserved. www.appi.org
35
neurotransmitter release. PanelB. The current theory for how synaptic vesicles fuse with the membrane and release neurotransmitter is called the SNARE hypothesis. Both the synaptic vesicles and the plasma membrane express specific proteins that mediate docking and fusion: v-SNAREs (synaptic vesicles) and t-SNAREs (plasma membrane). Vesicles are brought close to the membrane through interactions between VAMP (synaptobrevin), syntaxin, and SNAP-25. N-ethylmaleimide-sensitive fusion protein (NSF) then binds to the complex to facilitate fusion. Calcium influx is required to stimulate fusion, but the precise binding partner for calcium and the exact events leading to fusion remain obscure. Panel C.The crystal structure of the fusion complex, as shown here, is consistent with the SNARE hypothesis. BoNT=botulinum; TeNT=tetanus toxin.
Source.Adapted from Kandel ER, Siegelbaum SA: “Transmitter Release,” in Principles of Neural Science, 4th Edition. Edited by Kandel ER, Schwartz JH, Jessell TM. New York, McGraw-Hill, 2000, pp. 253–279. Copyright 2000, The McGraw-Hill Companies, Inc. Used with permission.
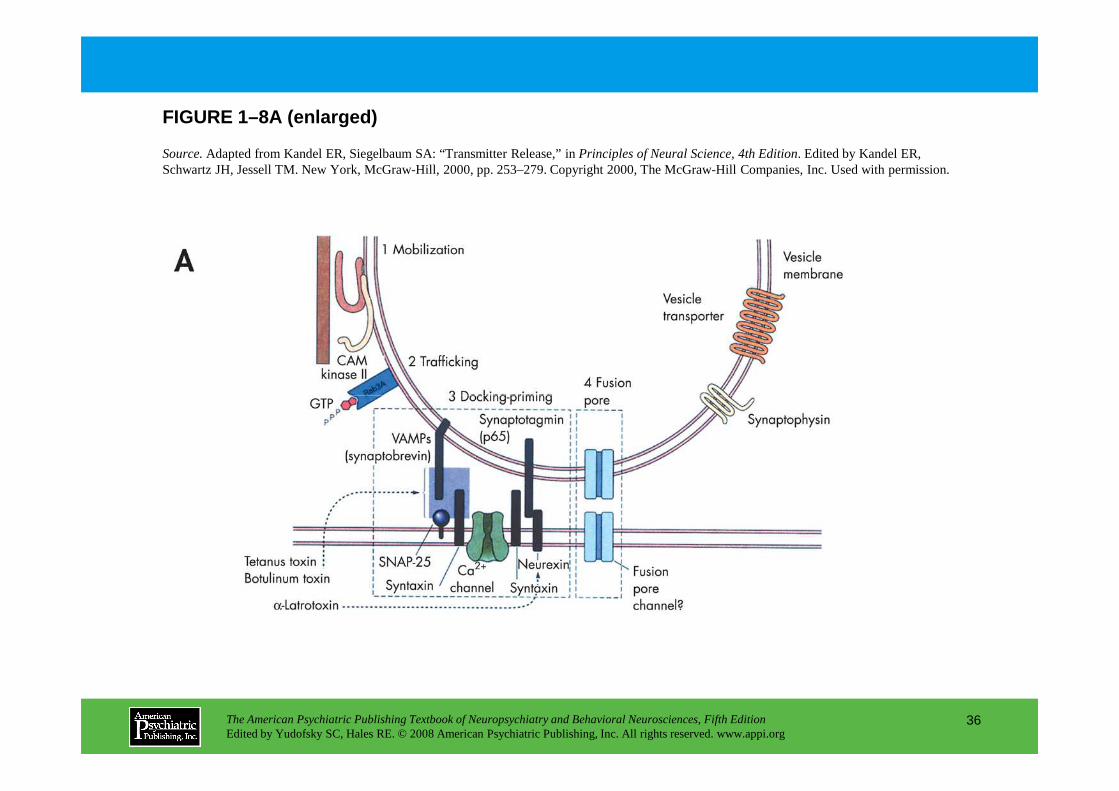
FIGURE 1–8A (enlarged)
Source.Adapted from Kandel ER, Siegelbaum SA: “Transmitter Release,” in Principles of Neural Science, 4th Edition. Edited by Kandel ER, Schwartz JH, Jessell TM. New York, McGraw-Hill, 2000, pp. 253–279. Copyright 2000, The McGraw-Hill Companies, Inc. Used with permission.
The American Psychiatric Publishing Textbook of Neuropsychiatry and Behavioral Neurosciences, Fifth EditionEdited by Yudofsky SC, Hales RE. © 2008 American Psychiatric Publishing, Inc. All rights reserved. www.appi.org
36

FIGURE 1–8 B and C (enlarged)
Source.Adapted from Kandel ER, Siegelbaum SA: “Transmitter Release,” in Principles of Neural Science, 4th Edition. Edited by Kandel ER, Schwartz JH, Jessell TM. New York, McGraw-Hill, 2000, pp. 253–279. Copyright 2000, The McGraw-Hill Companies, Inc. Used with permission.
The American Psychiatric Publishing Textbook of Neuropsychiatry and Behavioral Neurosciences, Fifth EditionEdited by Yudofsky SC, Hales RE. © 2008 American Psychiatric Publishing, Inc. All rights reserved. www.appi.org
37
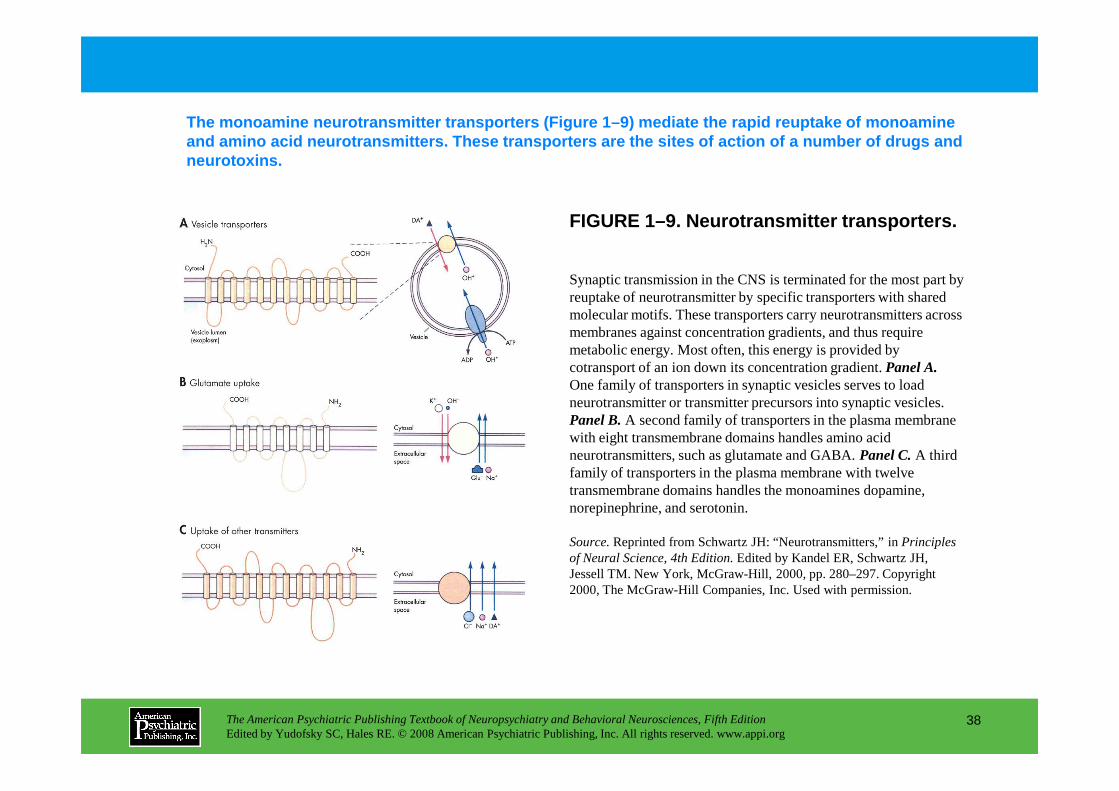
FIGURE 1–9. Neurotransmitter transporters.
The monoamine neurotransmitter transporters (Figure 1–9) mediate the rapid reuptake of monoamine and amino acid neurotransmitters. These transporter s are the sites of action of a number of drugs and neurotoxins.
Synaptic transmission in the CNS is terminated for the most part by reuptake of neurotransmitter by specific transporters with shared molecular motifs. These transporters carry neurotransmitters across membranes against concentration gradients, and thus require metabolic energy. Most often, this energy is provided by cotransport of an ion down its concentration gradient. Panel A.One family of transporters in synaptic vesicles serves to load neurotransmitter or transmitter precursors into synaptic vesicles.
The American Psychiatric Publishing Textbook of Neuropsychiatry and Behavioral Neurosciences, Fifth EditionEdited by Yudofsky SC, Hales RE. © 2008 American Psychiatric Publishing, Inc. All rights reserved. www.appi.org
38
neurotransmitter or transmitter precursors into synaptic vesicles. Panel B.A second family of transporters in the plasma membrane with eight transmembrane domains handles amino acid neurotransmitters, such as glutamate and GABA. Panel C.A third family of transporters in the plasma membrane with twelve transmembrane domains handles the monoamines dopamine, norepinephrine, and serotonin.
Source.Reprinted from Schwartz JH: “Neurotransmitters,” in Principles of Neural Science, 4th Edition.Edited by Kandel ER, Schwartz JH, Jessell TM. New York, McGraw-Hill, 2000, pp. 280–297. Copyright 2000, The McGraw-Hill Companies, Inc. Used with permission.
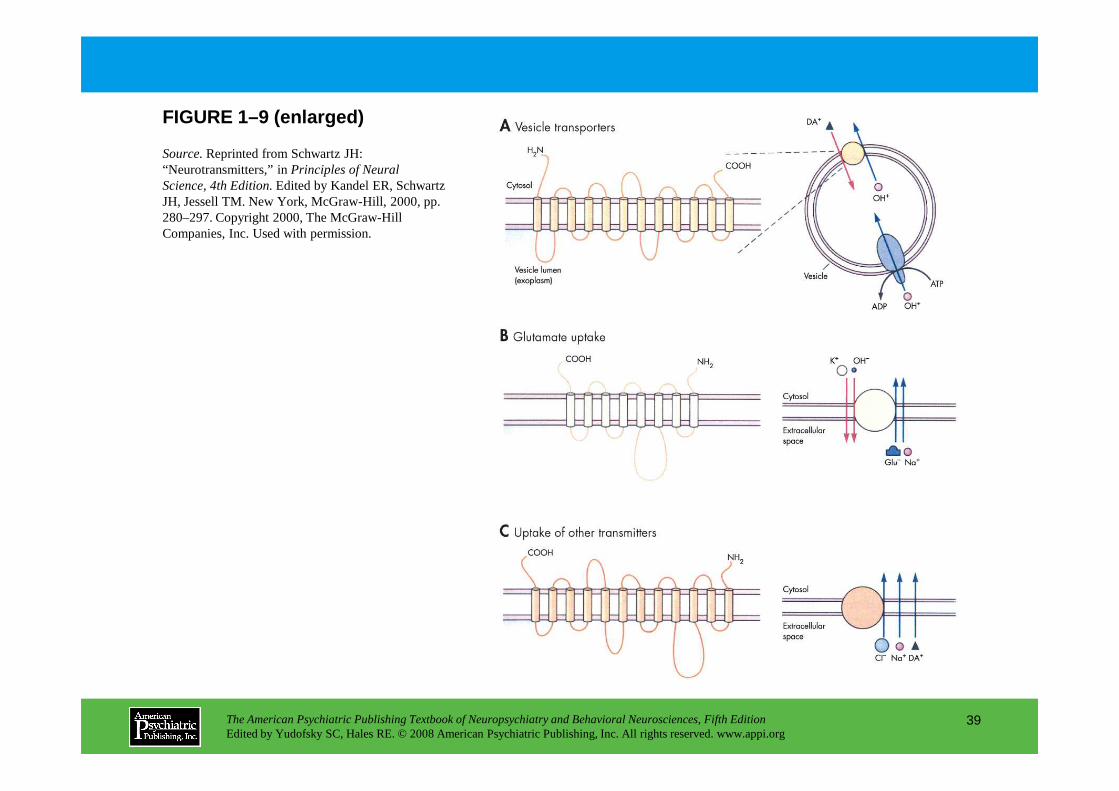
FIGURE 1–9 (enlarged)
Source.Reprinted from Schwartz JH: “Neurotransmitters,” in Principles of Neural Science, 4th Edition.Edited by Kandel ER, Schwartz JH, Jessell TM. New York, McGraw-Hill, 2000, pp. 280–297. Copyright 2000, The McGraw-Hill Companies, Inc. Used with permission.
The American Psychiatric Publishing Textbook of Neuropsychiatry and Behavioral Neurosciences, Fifth EditionEdited by Yudofsky SC, Hales RE. © 2008 American Psychiatric Publishing, Inc. All rights reserved. www.appi.org
39
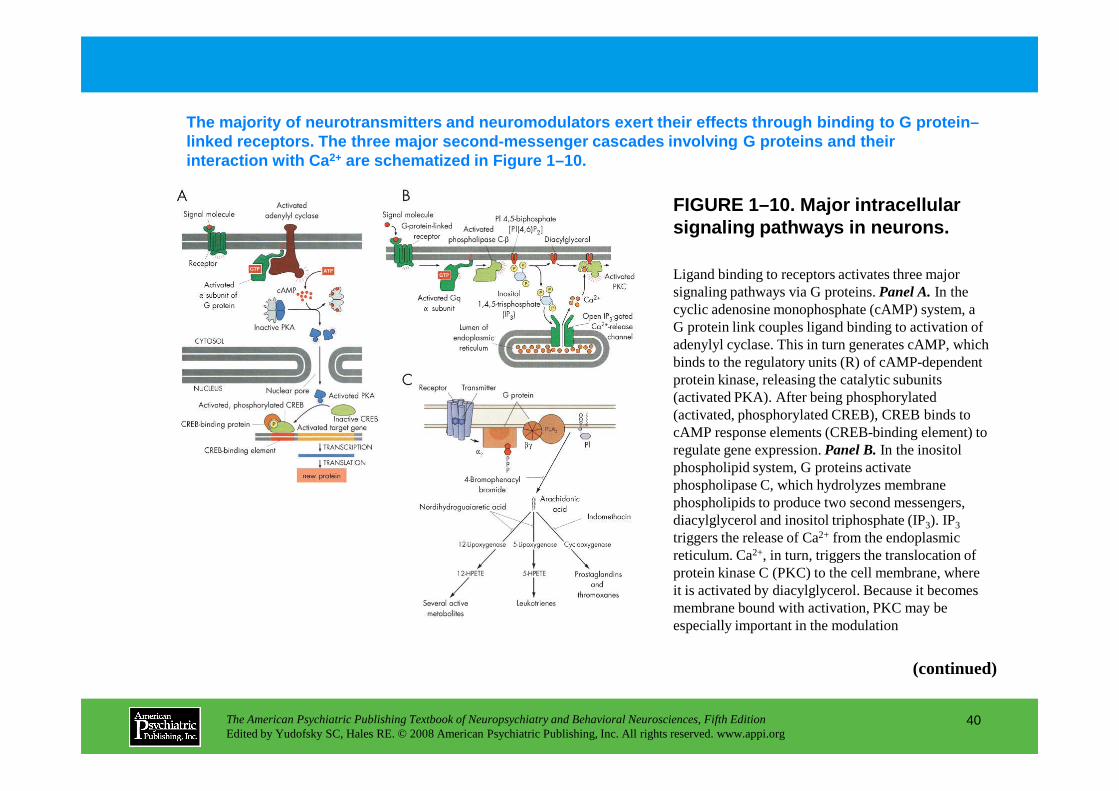
FIGURE 1–10. Major intracellular signaling pathways in neurons.
The majority of neurotransmitters and neuromodulato rs exert their effects through binding to G protein –linked receptors. The three major second-messenger cascades involving G proteins and their interaction with Ca 2+ are schematized in Figure 1–10.
Ligand binding to receptors activates three major signaling pathways via G proteins. Panel A.In the cyclic adenosine monophosphate (cAMP) system, a G protein link couples ligand binding to activation of adenylyl cyclase. This in turn generates cAMP, which binds to the regulatory units (R) of cAMP-dependent protein kinase, releasing the catalytic subunits (activated PKA). After being phosphorylated
The American Psychiatric Publishing Textbook of Neuropsychiatry and Behavioral Neurosciences, Fifth EditionEdited by Yudofsky SC, Hales RE. © 2008 American Psychiatric Publishing, Inc. All rights reserved. www.appi.org
40
(activated PKA). After being phosphorylated (activated, phosphorylated CREB), CREB binds to cAMP response elements (CREB-binding element) to regulate gene expression. Panel B.In the inositol phospholipid system, G proteins activate phospholipase C, which hydrolyzes membrane phospholipids to produce two second messengers, diacylglycerol and inositol triphosphate (IP3). IP3
triggers the release of Ca2+ from the endoplasmic reticulum. Ca2+, in turn, triggers the translocation of protein kinase C (PKC) to the cell membrane, where it is activated by diacylglycerol. Because it becomes membrane bound with activation, PKC may be especially important in the modulation
(continued)

FIGURE 1–10. Major intracellular signaling pathways in neurons (continued).
of membrane channels. Ca2+ released from intracellular stores may act similarly to Ca2+ that enters from outside the cell (not shown), allowing temporal coincidence through activation of voltage-dependent Ca2+ channels. Panel C.In the arachidonic acid system, G proteins may couple to phospholipase A2 (PLA2), forming arachidonic acid by hydrolysis of membrane phospholipids. Arachidonic acid is either a second messenger in its own right or a precursor of the lipoxygenase pathway giving
The American Psychiatric Publishing Textbook of Neuropsychiatry and Behavioral Neurosciences, Fifth EditionEdited by Yudofsky SC, Hales RE. © 2008 American Psychiatric Publishing, Inc. All rights reserved. www.appi.org
41
right or a precursor of the lipoxygenase pathway giving rise to a family of membrane-permeant second messengers. The cyclooxygenase pathway is principally important outside the brain in prostaglandin production. HPETE=hydroperoxyeicosatetraenoic acid; PI=phosphatidylinositol.
Source.Panels A and B reprinted from Alberts B, Johnson A, Lewis J, Raff M, Roberts K, Walter P: Molecular Biology of the Cell.New York, Garland Science, 2002. Used with permission. Panel C reprinted from Siegelbaum SA, Schwartz JH, Kandel ER: “Modulation of Synaptic Transmission: Second Messengers,” in Principles of Neural Science, 4th Edition.Edited by Kandel ER, Schwartz JH, Jessell TM. New York, McGraw-Hill, 2000, pp. 229–252. Copyright 2000 The McGraw-Hill Companies, Inc. Used with permission.

FIGURE 1–10A (enlarged)
Source.Panels A and B reprinted from Alberts B, Johnson A, Lewis J, Raff M, Roberts K, Walter P: Molecular Biology of the Cell. New York, Garland Science, 2002. Used with permission. Panel C reprinted from Siegelbaum SA, Schwartz JH, Kandel ER: “Modulation of Synaptic Transmission: Second Messengers,” in Principles of Neural Science, 4th Edition.Edited by Kandel ER, Schwartz JH, Jessell TM. New York, McGraw-Hill, 2000, pp. 229–252. Copyright 2000 The McGraw-Hill Companies, Inc. Used with permission.
The American Psychiatric Publishing Textbook of Neuropsychiatry and Behavioral Neurosciences, Fifth EditionEdited by Yudofsky SC, Hales RE. © 2008 American Psychiatric Publishing, Inc. All rights reserved. www.appi.org
42

FIGURE 1–10B (enlarged)
Source.Panels A and B reprinted from Alberts B, Johnson A, Lewis J, Raff M, Roberts K, Walter P: Molecular Biology of the Cell.New York, Garland Science, 2002. Used with permission. Panel C reprinted from Siegelbaum SA, Schwartz JH, Kandel ER: “Modulation of Synaptic Transmission: Second Messengers,” in Principles of Neural Science, 4th Edition.Edited by Kandel ER, Schwartz JH, Jessell TM. New York, McGraw-Hill, 2000, pp. 229–252. Copyright 2000 The McGraw-Hill Companies, Inc. Used with permission.
The American Psychiatric Publishing Textbook of Neuropsychiatry and Behavioral Neurosciences, Fifth EditionEdited by Yudofsky SC, Hales RE. © 2008 American Psychiatric Publishing, Inc. All rights reserved. www.appi.org
43
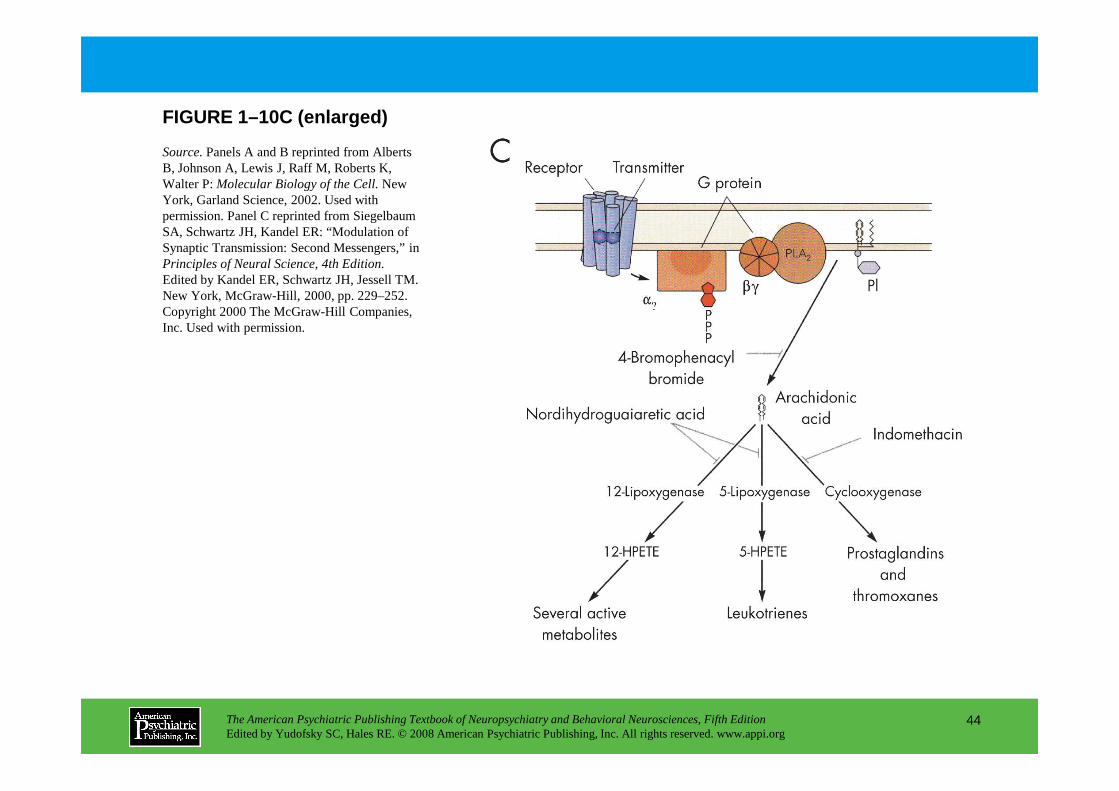
FIGURE 1–10C (enlarged)
Source.Panels A and B reprinted from Alberts B, Johnson A, Lewis J, Raff M, Roberts K, Walter P: Molecular Biology of the Cell.New York, Garland Science, 2002. Used with permission. Panel C reprinted from Siegelbaum SA, Schwartz JH, Kandel ER: “Modulation of Synaptic Transmission: Second Messengers,” in Principles of Neural Science, 4th Edition.Edited by Kandel ER, Schwartz JH, Jessell TM. New York, McGraw-Hill, 2000, pp. 229–252. Copyright 2000 The McGraw-Hill Companies, Inc. Used with permission.
The American Psychiatric Publishing Textbook of Neuropsychiatry and Behavioral Neurosciences, Fifth EditionEdited by Yudofsky SC, Hales RE. © 2008 American Psychiatric Publishing, Inc. All rights reserved. www.appi.org
44
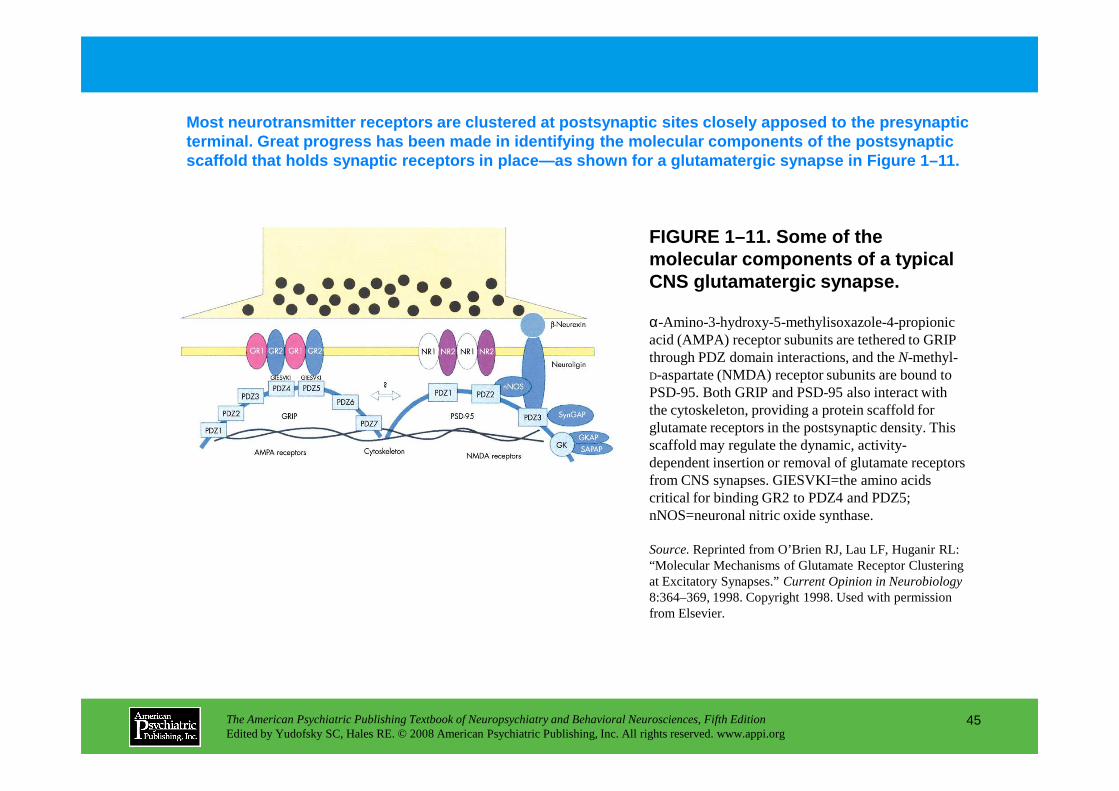
FIGURE 1–11. Some of the molecular components of a typical CNS glutamatergic synapse.
Most neurotransmitter receptors are clustered at po stsynaptic sites closely apposed to the presynaptic terminal. Great progress has been made in identifyi ng the molecular components of the postsynaptic scaffold that holds synaptic receptors in place—as s hown for a glutamatergic synapse in Figure 1–11.
α-Amino-3-hydroxy-5-methylisoxazole-4-propionic acid (AMPA) receptor subunits are tethered to GRIP through PDZ domain interactions, and the N-methyl-D-aspartate (NMDA) receptor subunits are bound to PSD-95. Both GRIP and PSD-95 also interact with
The American Psychiatric Publishing Textbook of Neuropsychiatry and Behavioral Neurosciences, Fifth EditionEdited by Yudofsky SC, Hales RE. © 2008 American Psychiatric Publishing, Inc. All rights reserved. www.appi.org
45
PSD-95. Both GRIP and PSD-95 also interact with the cytoskeleton, providing a protein scaffold for glutamate receptors in the postsynaptic density. This scaffold may regulate the dynamic, activity-dependent insertion or removal of glutamate receptors from CNS synapses. GIESVKI=the amino acids critical for binding GR2 to PDZ4 and PDZ5; nNOS=neuronal nitric oxide synthase.
Source.Reprinted from O’Brien RJ, Lau LF, Huganir RL: “Molecular Mechanisms of Glutamate Receptor Clustering at Excitatory Synapses.” Current Opinion in Neurobiology8:364–369, 1998. Copyright 1998. Used with permission from Elsevier.
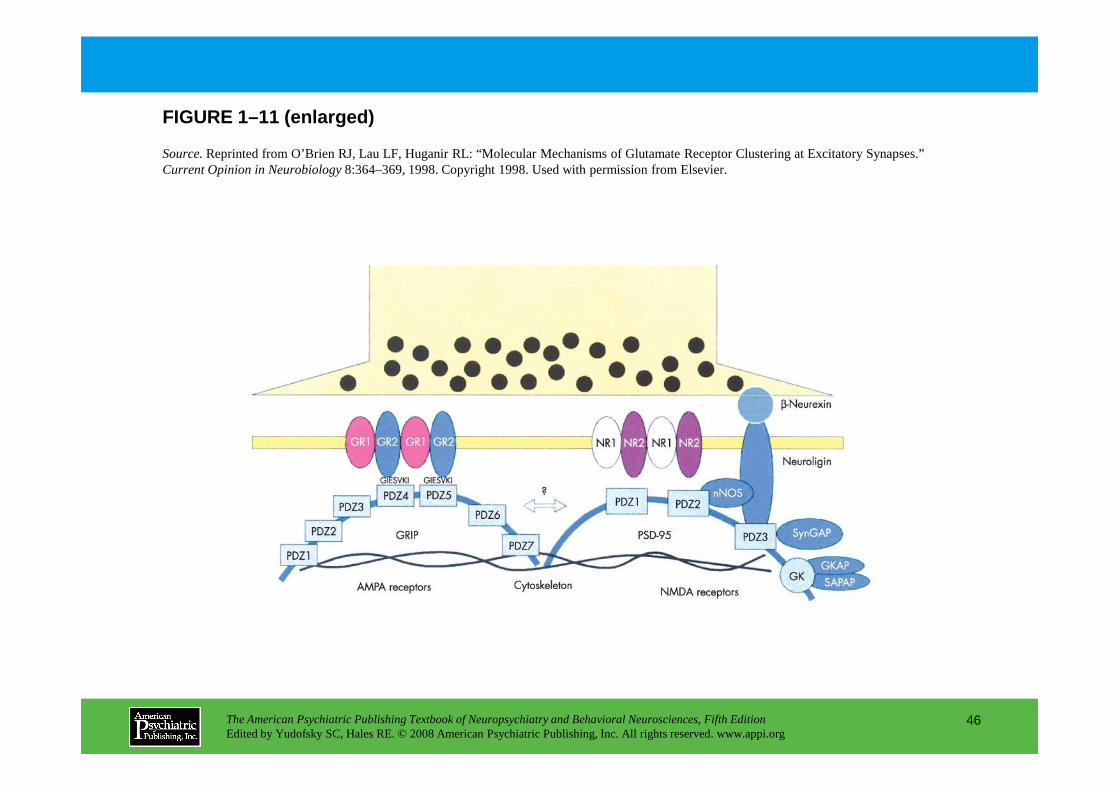
FIGURE 1–11 (enlarged)
Source.Reprinted from O’Brien RJ, Lau LF, Huganir RL: “Molecular Mechanisms of Glutamate Receptor Clustering at Excitatory Synapses.” Current Opinion in Neurobiology8:364–369, 1998. Copyright 1998. Used with permission from Elsevier.
The American Psychiatric Publishing Textbook of Neuropsychiatry and Behavioral Neurosciences, Fifth EditionEdited by Yudofsky SC, Hales RE. © 2008 American Psychiatric Publishing, Inc. All rights reserved. www.appi.org
46

FIGURE 1–12. Molecular mechanisms of short-term and long-term memory storage.
Learning and memory require both short-term and lon g-term changes at synapses. Studies using the marine snail Aplysia californica have been fundamental to current understanding of t he cellular mechanisms of learning and memory (Figure 1–12).
Panel A.Schematic shows a single synaptic connection between a sensory and motor neuron in the neural circuit mediating defensive gill-withdrawal reflex in the marine snail Aplysia californica.Serotonin (5HT) triggers an increase in synaptic strength, which underlies the animal’s heightened reflex withdrawal response when stressed. In short-term
The American Psychiatric Publishing Textbook of Neuropsychiatry and Behavioral Neurosciences, Fifth EditionEdited by Yudofsky SC, Hales RE. © 2008 American Psychiatric Publishing, Inc. All rights reserved. www.appi.org
47
response when stressed. In short-term sensitization (lasting on the order of an hour), one electric shock to the tail activates serotonin interneurons (blue), activating serotonin
receptors (also in blue) that activate protein kinase A (PKA), which phosphorylates existing proteins, leading to a short-term enhancement of synaptic transmission. With repeated stress, persistent elevation of cyclic adenosine monophosphate (cAMP) levels engages nuclear regulatory pathways. PKA in turn activates another kinase (MAPK), and together they phosphorylate CREB-2, releasing active CREB-1. CREB-1 then activates directly and indirectly a series of genes in temporal sequence, locking in the activation of PKA via ubiquitin hydrolase and encoding proteins necessary for synaptic growth. One example is Aplysia cell-adhesion molecule (apCAM), a molecule important in synaptic development, which plays a similar role in the further growth of synaptic connections with learning. Panel B.The signaling mechanisms involved in sensitization are summarized in broader strokes in this schematic: 1) sensory neurons activate motor neurons via exocytic release of the excitatory transmitter glutamate; 2) stress stimuli activate protein kinase, which both enhances transmitter release locally and 3) translocates to the nucleus to orchestrate long-term changes. The proteins for growth are utilized at synapses marked by serotonin stimulation, leading to long-term strengthening of stressed synapses.
Source.Reprinted from Kandel ER: “The Molecular Biology of Memory Storage: A Dialogue Between Genes and Synapses.” Science 294:1030–1038, 2001, with permission from AAAS and the Nobel Foundation. Copyright Nobel Foundation 2000.

FIGURE 1–12 (enlarged)
Source.Reprinted from Kandel ER: “The Molecular Biology of Memory Storage: A Dialogue Between Genes and Synapses.” Science 294:1030–1038, 2001, with permission from AAAS and the Nobel Foundation. Copyright Nobel Foundation 2000.
The American Psychiatric Publishing Textbook of Neuropsychiatry and Behavioral Neurosciences, Fifth EditionEdited by Yudofsky SC, Hales RE. © 2008 American Psychiatric Publishing, Inc. All rights reserved. www.appi.org
48
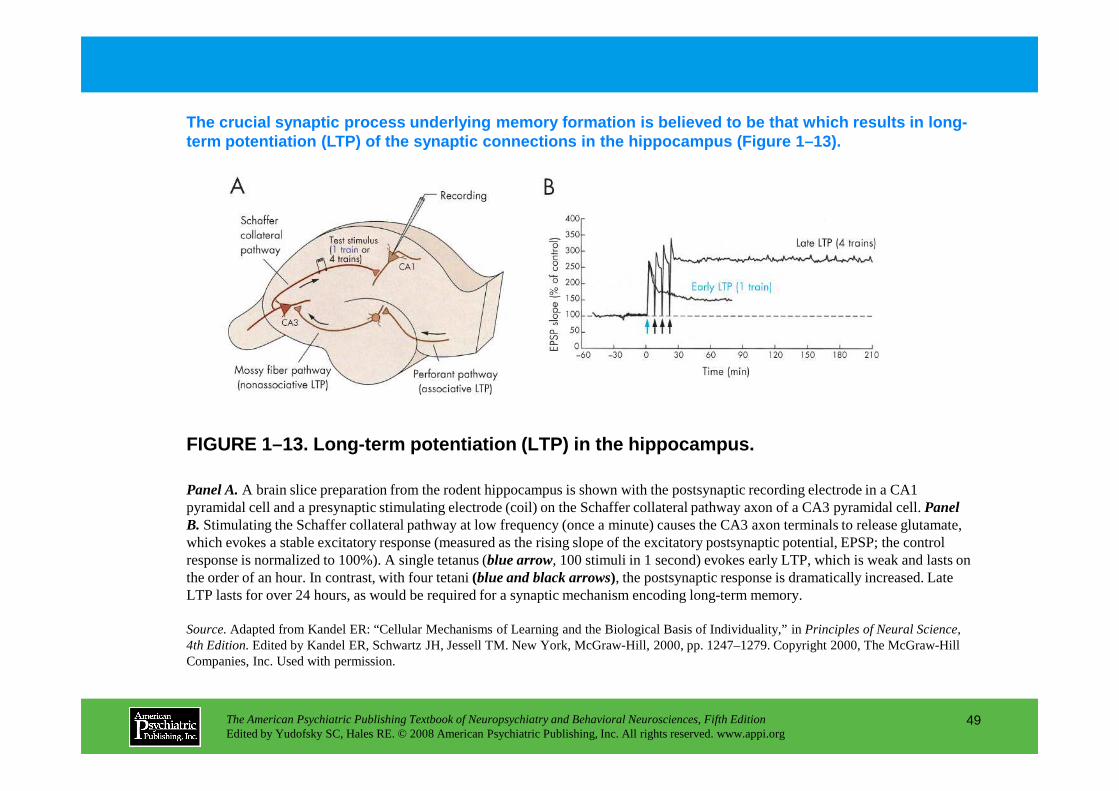
The crucial synaptic process underlying memory form ation is believed to be that which results in long-term potentiation (LTP) of the synaptic connections in the hippocampus (Figure 1–13).
The American Psychiatric Publishing Textbook of Neuropsychiatry and Behavioral Neurosciences, Fifth EditionEdited by Yudofsky SC, Hales RE. © 2008 American Psychiatric Publishing, Inc. All rights reserved. www.appi.org
49
FIGURE 1–13. Long-term potentiation (LTP) in the hi ppocampus.
Panel A.A brain slice preparation from the rodent hippocampus is shown with the postsynaptic recording electrode in a CA1 pyramidal cell and a presynaptic stimulating electrode (coil) on the Schaffer collateral pathway axon of a CA3 pyramidal cell. Panel B. Stimulating the Schaffer collateral pathway at low frequency (once a minute) causes the CA3 axon terminals to release glutamate,which evokes a stable excitatory response (measured as the rising slope of the excitatory postsynaptic potential, EPSP; the control response is normalized to 100%). A single tetanus (blue arrow, 100 stimuli in 1 second) evokes early LTP, which is weak and lasts on the order of an hour. In contrast, with four tetani (blue and black arrows), the postsynaptic response is dramatically increased. Late LTP lasts for over 24 hours, as would be required for a synaptic mechanism encoding long-term memory.
Source.Adapted from Kandel ER: “Cellular Mechanisms of Learning and the Biological Basis of Individuality,” in Principles of Neural Science, 4th Edition.Edited by Kandel ER, Schwartz JH, Jessell TM. New York, McGraw-Hill, 2000, pp. 1247–1279. Copyright 2000, The McGraw-Hill Companies, Inc. Used with permission.
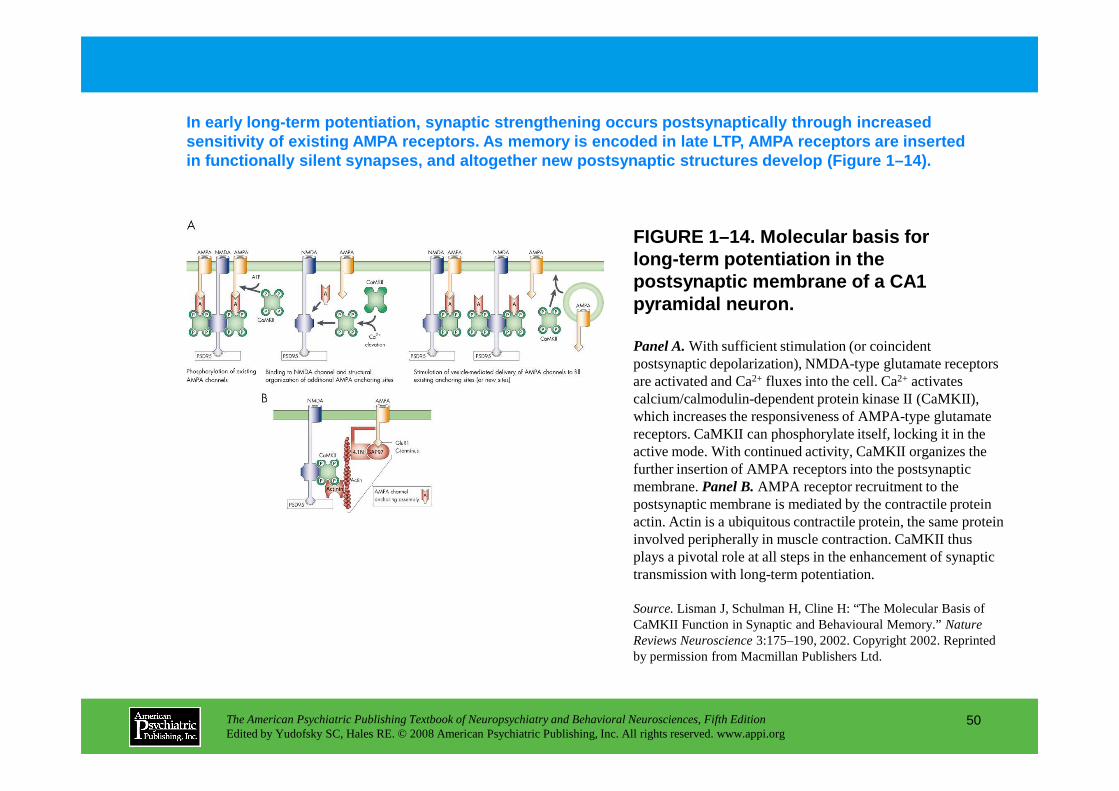
In early long-term potentiation, synaptic strengthe ning occurs postsynaptically through increased sensitivity of existing AMPA receptors. As memory i s encoded in late LTP, AMPA receptors are inserted in functionally silent synapses, and altogether new postsynaptic structures develop (Figure 1–14).
Panel A.With sufficient stimulation (or coincident postsynaptic depolarization), NMDA-type glutamate receptors are activated and Ca2+ fluxes into the cell. Ca2+ activates calcium/calmodulin-dependent protein kinase II (CaMKII),
FIGURE 1–14. Molecular basis for long-term potentiation in the postsynaptic membrane of a CA1 pyramidal neuron.
The American Psychiatric Publishing Textbook of Neuropsychiatry and Behavioral Neurosciences, Fifth EditionEdited by Yudofsky SC, Hales RE. © 2008 American Psychiatric Publishing, Inc. All rights reserved. www.appi.org
50
calcium/calmodulin-dependent protein kinase II (CaMKII), which increases the responsiveness of AMPA-type glutamate receptors. CaMKII can phosphorylate itself, locking it in the active mode. With continued activity, CaMKII organizes the further insertion of AMPA receptors into the postsynaptic membrane. Panel B.AMPA receptor recruitment to the postsynaptic membrane is mediated by the contractile protein actin. Actin is a ubiquitous contractile protein, the same protein involved peripherally in muscle contraction. CaMKII thus plays a pivotal role at all steps in the enhancement of synaptic transmission with long-term potentiation.
Source.Lisman J, Schulman H, Cline H: “The Molecular Basis of CaMKII Function in Synaptic and Behavioural Memory.” Nature Reviews Neuroscience 3:175–190, 2002. Copyright 2002. Reprinted by permission from Macmillan Publishers Ltd.

FIGURE 1–14 (enlarged)
Source.Lisman J, Schulman H, Cline H: “The Molecular Basis of CaMKII Function in Synaptic and Behavioural Memory.” Nature Reviews Neuroscience 3:175–190, 2002. Copyright 2002. Reprinted by permission from Macmillan Publishers Ltd.
The American Psychiatric Publishing Textbook of Neuropsychiatry and Behavioral Neurosciences, Fifth EditionEdited by Yudofsky SC, Hales RE. © 2008 American Psychiatric Publishing, Inc. All rights reserved. www.appi.org
51
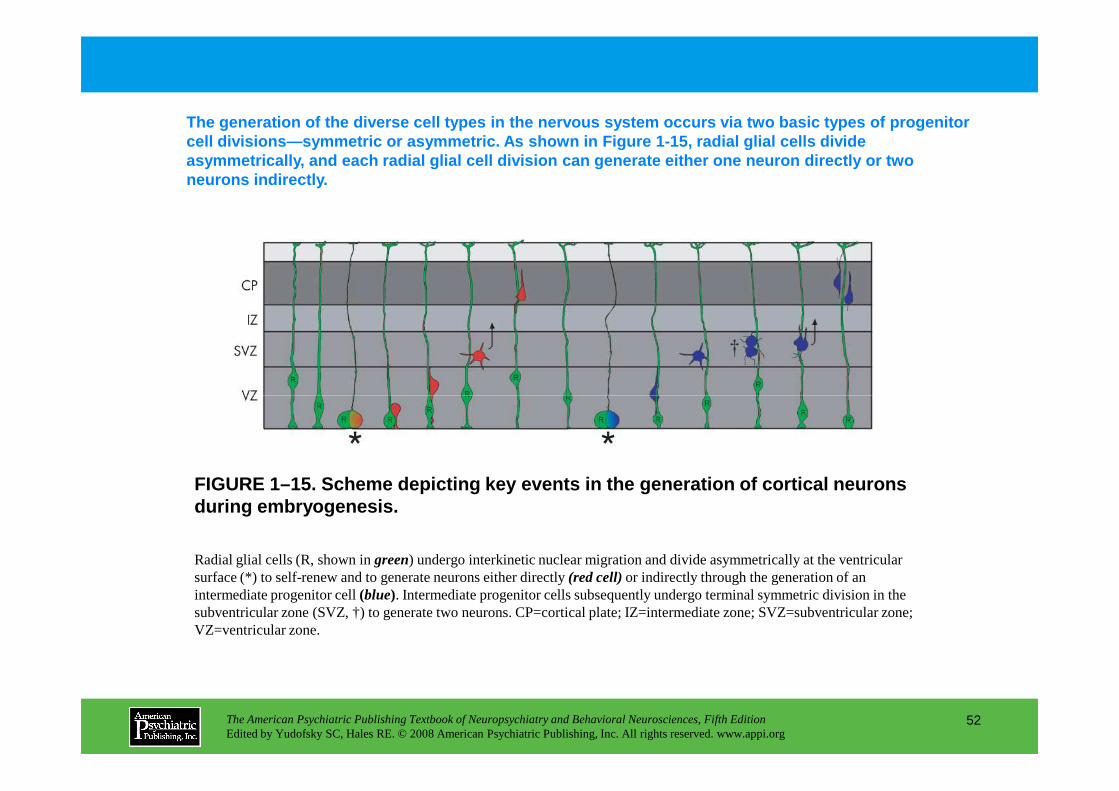
The generation of the diverse cell types in the ner vous system occurs via two basic types of progenito r cell divisions—symmetric or asymmetric. As shown in Figure 1-15, radial glial cells divide asymmetrically, and each radial glial cell division can generate either one neuron directly or two neurons indirectly.
The American Psychiatric Publishing Textbook of Neuropsychiatry and Behavioral Neurosciences, Fifth EditionEdited by Yudofsky SC, Hales RE. © 2008 American Psychiatric Publishing, Inc. All rights reserved. www.appi.org
52
FIGURE 1–15. Scheme depicting key events in the gen eration of cortical neurons during embryogenesis.
Radial glial cells (R, shown in green) undergo interkinetic nuclear migration and divide asymmetrically at the ventricular surface (*) to self-renew and to generate neurons either directly (red cell)or indirectly through the generation of an intermediate progenitor cell (blue). Intermediate progenitor cells subsequently undergo terminal symmetric division in the subventricular zone (SVZ, †) to generate two neurons. CP=cortical plate; IZ=intermediate zone; SVZ=subventricular zone; VZ=ventricular zone.

FIGURE 1–16. During development, neocortical neurons exhibit four distinct phases in migration.
A remarkable aspect of brain development is that ne urons are not born in their final locations, but ar e generated in proliferative zones surrounding the ven tricular lumen and then must migrate substantial distances to reach their destination. Neurons under go several distinct stages of migration (Figure 1–1 6).
Panel A. A time-lapse sequence of a retrovirally labeled neuron expressing the reporter protein green fluorescent protein (GFP) undergoing migration from the proliferative zone to the cortical plate in a cultured brain slice. The sequence begins when the neuron is in the second phase, which consists of migratory arrest for 24 hours or more
The American Psychiatric Publishing Textbook of Neuropsychiatry and Behavioral Neurosciences, Fifth EditionEdited by Yudofsky SC, Hales RE. © 2008 American Psychiatric Publishing, Inc. All rights reserved. www.appi.org
53
second phase, which consists of migratory arrest for 24 hours or more (shown here at the end of phase two, t=0 h), followed by a third phase of retrograde migration toward the ventricle (t=14-18 h) and a final phase of polarity reversal and migration toward the cortical plate (CP) (t=24–96 h). Before initiating the final phase of radial migration, the neuron develops a leading process oriented toward the CP (white arrowhead).After 96 hours in culture, the migrating neuron had reached its destination at the top of the cortical plate. These neurons often leave a trailing axon in the ventricular zone (VZ,red arrowheads). Panel B.Schematic depicting a neuron (shown in dark green) undergoing the four phases of migration: 1) After being generated by its mother radial glial cell (R, shown inlight green), the neuron commences initial radial migration, 2) migratory arrest in the SVZ, 3) retrograde migration, and 4) secondary radial migration. IZ=intermediate zone; SVZ=subventricular zone; VZ=ventricular zone.

FIGURE 1–16 (enlarged)
The American Psychiatric Publishing Textbook of Neuropsychiatry and Behavioral Neurosciences, Fifth EditionEdited by Yudofsky SC, Hales RE. © 2008 American Psychiatric Publishing, Inc. All rights reserved. www.appi.org
54
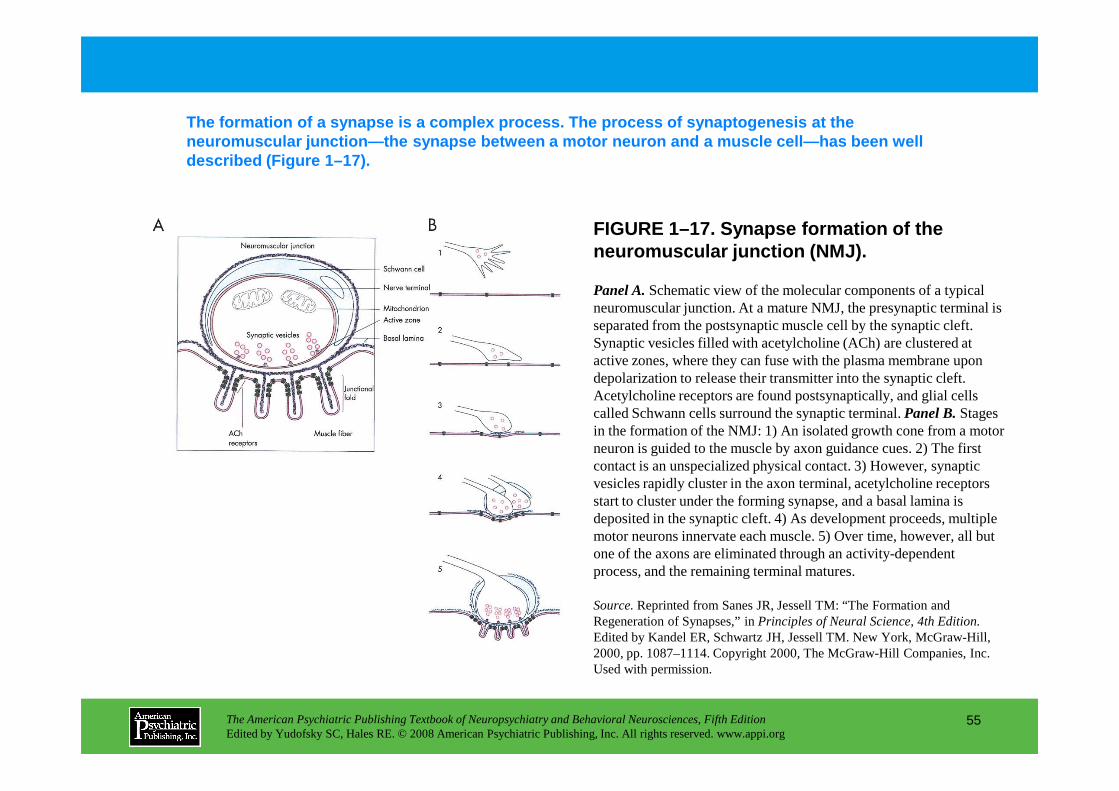
FIGURE 1–17. Synapse formation of the neuromuscular junction (NMJ).
The formation of a synapse is a complex process. Th e process of synaptogenesis at the neuromuscular junction—the synapse between a motor n euron and a muscle cell—has been well described (Figure 1–17).
Panel A.Schematic view of the molecular components of a typical neuromuscular junction. At a mature NMJ, the presynaptic terminal is separated from the postsynaptic muscle cell by the synaptic cleft. Synaptic vesicles filled with acetylcholine (ACh) are clustered at active zones, where they can fuse with the plasma membrane upon depolarization to release their transmitter into the synaptic cleft. Acetylcholine receptors are found postsynaptically, and glial cells
The American Psychiatric Publishing Textbook of Neuropsychiatry and Behavioral Neurosciences, Fifth EditionEdited by Yudofsky SC, Hales RE. © 2008 American Psychiatric Publishing, Inc. All rights reserved. www.appi.org
55
Acetylcholine receptors are found postsynaptically, and glial cells called Schwann cells surround the synaptic terminal. Panel B.Stages in the formation of the NMJ: 1) An isolated growth cone from a motor neuron is guided to the muscle by axon guidance cues. 2) The first contact is an unspecialized physical contact. 3) However, synaptic vesicles rapidly cluster in the axon terminal, acetylcholine receptors start to cluster under the forming synapse, and a basal lamina is deposited in the synaptic cleft. 4) As development proceeds, multiple motor neurons innervate each muscle. 5) Over time, however, all but one of the axons are eliminated through an activity-dependent process, and the remaining terminal matures.
Source.Reprinted from Sanes JR, Jessell TM: “The Formation and Regeneration of Synapses,” in Principles of Neural Science, 4th Edition.Edited by Kandel ER, Schwartz JH, Jessell TM. New York, McGraw-Hill, 2000, pp. 1087–1114. Copyright 2000, The McGraw-Hill Companies, Inc. Used with permission.

FIGURE 1–17 (enlarged)
Source.Reprinted from Sanes JR, Jessell TM: “The Formation and Regeneration of Synapses,” in Principles of Neural Science, 4th Edition.Edited by Kandel ER, Schwartz JH, Jessell TM. New York, McGraw-Hill, 2000, pp. 1087–1114. Copyright 2000, The McGraw-Hill Companies, Inc. Used with permission.
The American Psychiatric Publishing Textbook of Neuropsychiatry and Behavioral Neurosciences, Fifth EditionEdited by Yudofsky SC, Hales RE. © 2008 American Psychiatric Publishing, Inc. All rights reserved. www.appi.org
56
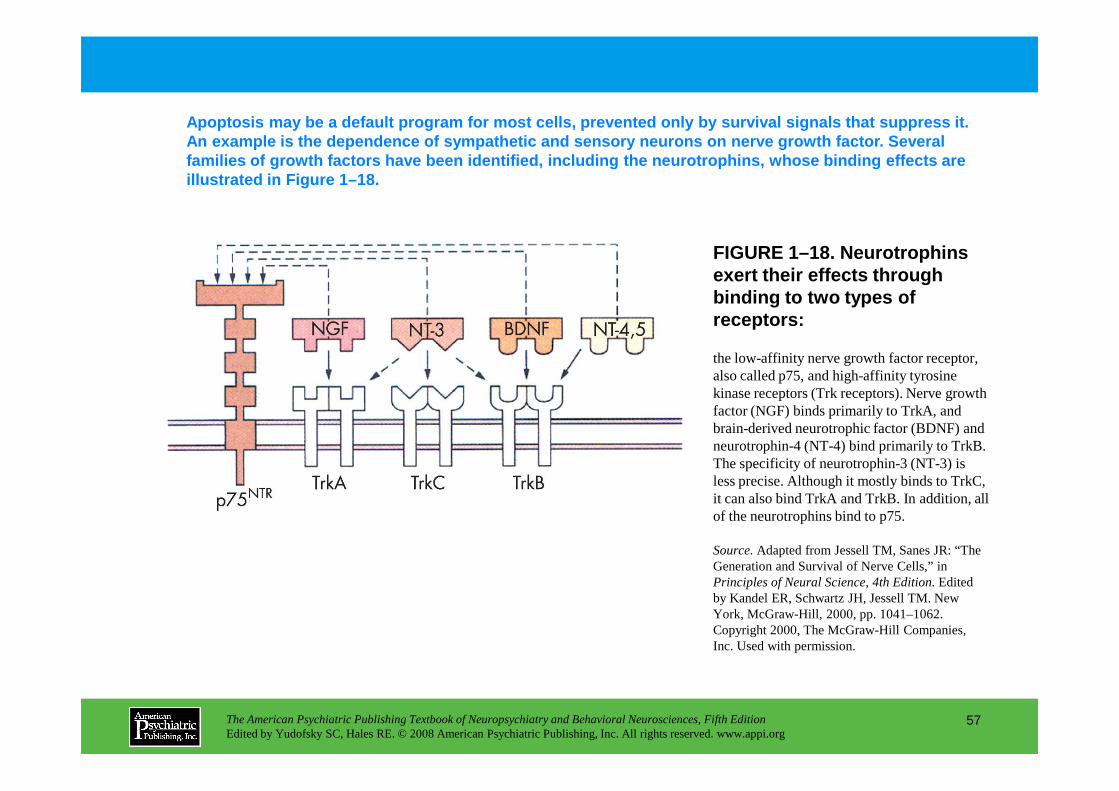
FIGURE 1–18. Neurotrophins exert their effects through binding to two types of receptors:
Apoptosis may be a default program for most cells, prevented only by survival signals that suppress it . An example is the dependence of sympathetic and sen sory neurons on nerve growth factor. Several families of growth factors have been identified, in cluding the neurotrophins, whose binding effects ar e illustrated in Figure 1–18.
the low-affinity nerve growth factor receptor, also called p75, and high-affinity tyrosine kinase receptors (Trk receptors). Nerve growth
The American Psychiatric Publishing Textbook of Neuropsychiatry and Behavioral Neurosciences, Fifth EditionEdited by Yudofsky SC, Hales RE. © 2008 American Psychiatric Publishing, Inc. All rights reserved. www.appi.org
57
kinase receptors (Trk receptors). Nerve growth factor (NGF) binds primarily to TrkA, and brain-derived neurotrophic factor (BDNF) and neurotrophin-4 (NT-4) bind primarily to TrkB. The specificity of neurotrophin-3 (NT-3) is less precise. Although it mostly binds to TrkC, it can also bind TrkA and TrkB. In addition, all of the neurotrophins bind to p75.
Source.Adapted from Jessell TM, Sanes JR: “The Generation and Survival of Nerve Cells,” in Principles of Neural Science, 4th Edition.Edited by Kandel ER, Schwartz JH, Jessell TM. New York, McGraw-Hill, 2000, pp. 1041–1062. Copyright 2000, The McGraw-Hill Companies, Inc. Used with permission.
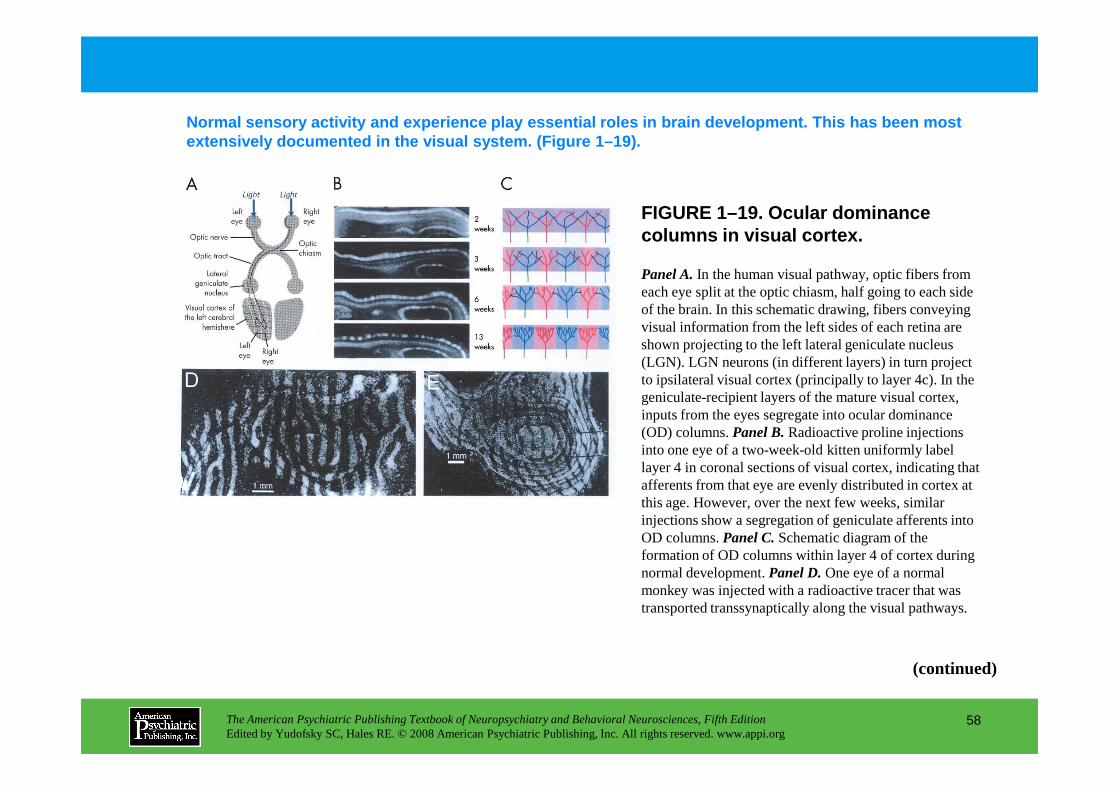
FIGURE 1–19. Ocular dominance columns in visual cortex.
Normal sensory activity and experience play essenti al roles in brain development. This has been most extensively documented in the visual system. (Figur e 1–19).
Panel A.In the human visual pathway, optic fibers from each eye split at the optic chiasm, half going to each side of the brain. In this schematic drawing, fibers conveying visual information from the left sides of each retina are shown projecting to the left lateral geniculate nucleus (LGN). LGN neurons (in different layers) in turn project to ipsilateral visual cortex (principally to layer 4c). In the geniculate-recipient layers of the mature visual cortex,
The American Psychiatric Publishing Textbook of Neuropsychiatry and Behavioral Neurosciences, Fifth EditionEdited by Yudofsky SC, Hales RE. © 2008 American Psychiatric Publishing, Inc. All rights reserved. www.appi.org
58
geniculate-recipient layers of the mature visual cortex, inputs from the eyes segregate into ocular dominance (OD) columns. Panel B.Radioactive proline injections into one eye of a two-week-old kitten uniformly label layer 4 in coronal sections of visual cortex, indicating that afferents from that eye are evenly distributed in cortex at this age. However, over the next few weeks, similar injections show a segregation of geniculate afferents into OD columns. Panel C.Schematic diagram of the formation of OD columns within layer 4 of cortex during normal development. Panel D.One eye of a normal monkey was injected with a radioactive tracer that was transported transsynaptically along the visual pathways.
(continued)
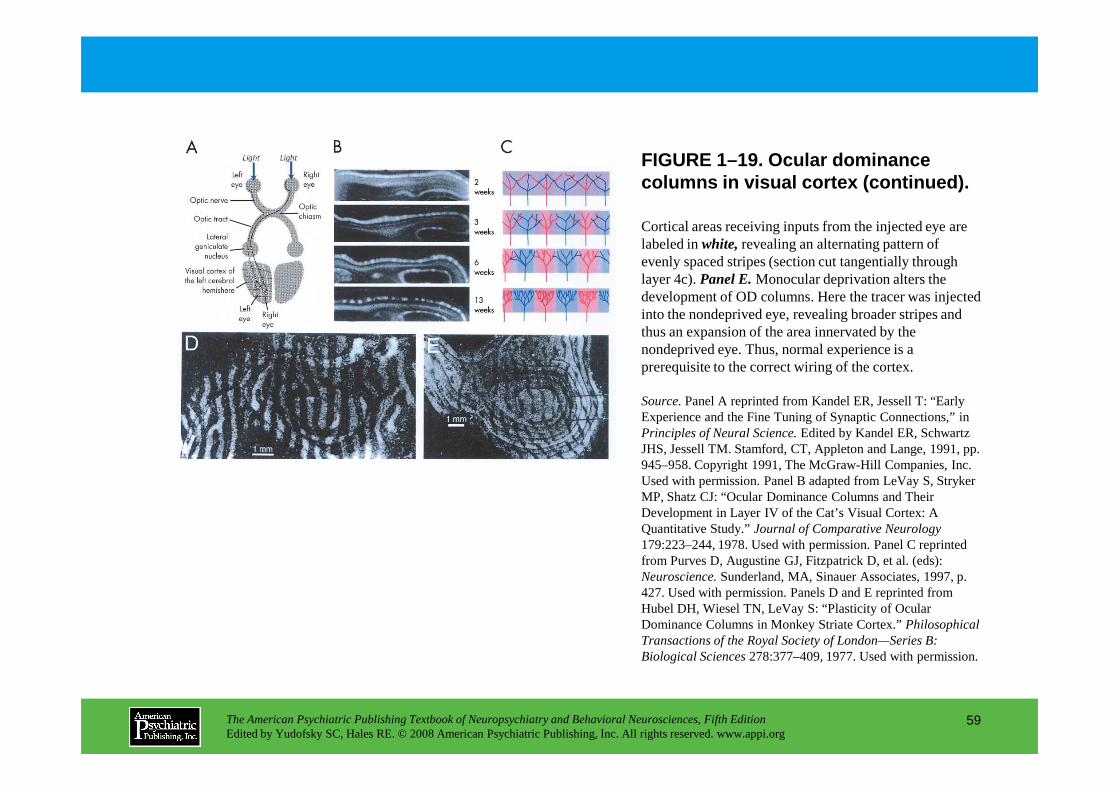
Cortical areas receiving inputs from the injected eye are labeled in white,revealing an alternating pattern of evenly spaced stripes (section cut tangentially through layer 4c). Panel E.Monocular deprivation alters the development of OD columns. Here the tracer was injected into the nondeprived eye, revealing broader stripes and thus an expansion of the area innervated by the nondeprived eye. Thus, normal experience is a prerequisite to the correct wiring of the cortex.
Source.Panel A reprinted from Kandel ER, Jessell T: “Early
FIGURE 1–19. Ocular dominance columns in visual cortex (continued).
The American Psychiatric Publishing Textbook of Neuropsychiatry and Behavioral Neurosciences, Fifth EditionEdited by Yudofsky SC, Hales RE. © 2008 American Psychiatric Publishing, Inc. All rights reserved. www.appi.org
59
Source.Panel A reprinted from Kandel ER, Jessell T: “Early Experience and the Fine Tuning of Synaptic Connections,” in Principles of Neural Science.Edited by Kandel ER, Schwartz JHS, Jessell TM. Stamford, CT, Appleton and Lange, 1991, pp. 945–958. Copyright 1991, The McGraw-Hill Companies, Inc. Used with permission. Panel B adapted from LeVay S, Stryker MP, Shatz CJ: “Ocular Dominance Columns and Their Development in Layer IV of the Cat’s Visual Cortex: A Quantitative Study.” Journal of Comparative Neurology179:223–244, 1978. Used with permission. Panel C reprinted from Purves D, Augustine GJ, Fitzpatrick D, et al. (eds): Neuroscience.Sunderland, MA, Sinauer Associates, 1997, p. 427. Used with permission. Panels D and E reprinted from Hubel DH, Wiesel TN, LeVay S: “Plasticity of Ocular Dominance Columns in Monkey Striate Cortex.” Philosophical Transactions of the Royal Society of London—Series B: Biological Sciences278:377–409, 1977. Used with permission.

FIGURE 1–19 A, B, and C (enlarged)
Source.Panel A reprinted from Kandel ER, Jessell T: “Early Experience and the Fine Tuning of Synaptic Connections,” in Principles of Neural Science.Edited by Kandel ER, Schwartz JHS, Jessell TM. Stamford, CT, Appleton and Lange, 1991, pp. 945–958. Copyright 1991, The McGraw-Hill Companies, Inc. Used with permission. Panel B adapted from LeVay S, Stryker MP, Shatz CJ: “Ocular Dominance Columns and Their Development in Layer IV of the Cat’s Visual Cortex: A Quantitative Study.” Journal of Comparative Neurology179:223–244, 1978. Used with permission. Panel C reprinted from Purves D, Augustine GJ, Fitzpatrick D, et al. (eds): Neuroscience.Sunderland, MA, Sinauer Associates, 1997, p. 427. Used with permission. Panels D and E reprinted from Hubel DH, Wiesel TN, LeVay S: “Plasticity of Ocular Dominance Columns in Monkey Striate Cortex.” Philosophical Transactions of the Royal Society of London—Series B: Biological Sciences278:377–409, 1977. Used with permission.
The American Psychiatric Publishing Textbook of Neuropsychiatry and Behavioral Neurosciences, Fifth EditionEdited by Yudofsky SC, Hales RE. © 2008 American Psychiatric Publishing, Inc. All rights reserved. www.appi.org
60

FIGURE 1–19 D and E (enlarged)
Source.Panel A reprinted from Kandel ER, Jessell T: “Early Experience and the Fine Tuning of Synaptic Connections,” in Principles of Neural Science.Edited by Kandel ER, Schwartz JHS, Jessell TM. Stamford, CT, Appleton and Lange, 1991, pp. 945–958. Copyright 1991, The McGraw-Hill Companies, Inc. Used with permission. Panel B adapted from LeVay S, Stryker MP, Shatz CJ: “Ocular Dominance Columns and Their Development in Layer IV of the Cat’s Visual Cortex: A Quantitative Study.” Journal of Comparative Neurology179:223–244, 1978. Used with permission. Panel C reprinted from Purves D, Augustine GJ, Fitzpatrick D, et al. (eds): Neuroscience.Sunderland, MA, Sinauer Associates, 1997, p. 427. Used with permission. Panels D and E reprinted from Hubel DH, Wiesel TN, LeVay S: “Plasticity of Ocular Dominance Columns in Monkey Striate Cortex.” Philosophical Transactions of the Royal Society of London—Series B: Biological Sciences278:377–409, 1977. Used with permission.
The American Psychiatric Publishing Textbook of Neuropsychiatry and Behavioral Neurosciences, Fifth EditionEdited by Yudofsky SC, Hales RE. © 2008 American Psychiatric Publishing, Inc. All rights reserved. www.appi.org
61
Chapter 1 • Highlights for the Clinician
• Neuropsychiatric disorders result from disordered functioning of neurons, and in particular their synapses.
• Individual neurons in the brain receive synaptic input from thousands of neurons and, in turn, send information to thousands of others.
• Learning and memory involve both short-term and long-term changes at synapses; for example, high-frequency stimulation of hippocampal pathways leads to long-term potentiation (LTP).
• Neurotransmitters activate second messenger systems that profoundly increase the range of responses a neuron shows to synaptic input,
The American Psychiatric Publishing Textbook of Neuropsychiatry and Behavioral Neurosciences, Fifth EditionEdited by Yudofsky SC, Hales RE. © 2008 American Psychiatric Publishing, Inc. All rights reserved. www.appi.org
62
increase the range of responses a neuron shows to synaptic input, extending to changes in gene transcription.
• During development, neurons and glia are generated in proliferative zones lining the ventricular system and then migrate into the overlying cortical mantle.
• The determination of cell fate occurs at regional, local, and cellular levels.
• Neurotransmitters themselves may have trophic or toxic roles in the shaping of neurons and their interconnections.
(continued)
• Neurons are initially produced in excess; their survival depends on trophic factors produced by their targets.
• Normal sensory experience is essential to the maturation of neural connections.
• The adult brain retains a significant degree of plasticity; changes in cortical organization can be induced by behaviorally important, temporally coincident sensory input.
• In both learning and development, the key molecular coincidence detector is the NMDA receptor, which requires both neurotransmitter
The American Psychiatric Publishing Textbook of Neuropsychiatry and Behavioral Neurosciences, Fifth EditionEdited by Yudofsky SC, Hales RE. © 2008 American Psychiatric Publishing, Inc. All rights reserved. www.appi.org
63
detector is the NMDA receptor, which requires both neurotransmitter binding and depolarization for activation.
• Ca2+ influx mediated by the NMDA receptor triggers changes in the strength of synapses, in time leading to changes in synapse number.
• Ca2+ regulates the growth or retraction of neurites, programmed cell death.
• The discovery of neurogenesis in the adult brain suggests that the adult brain may have intrinsic mechanisms for repair that could be manipulated to treat neurodegenerative disorders.

CHAPTER 2
FUNCTIONAL NEUROANATOMY: NEUROPSYCHOLOGICAL CORRELATES OF
CORTICAL AND SUBCORTICAL DAMAGE
Brian T. Harel, Ph.D.
Daniel Tranel, Ph.D.
The American Psychiatric Publishing Textbook of Neuropsychiatry and Behavioral Neurosciences, Fifth EditionEdited by Yudofsky SC, Hales RE. © 2008 American Psychiatric Publishing, Inc. All rights reserved. www.appi.org
64
Slide Show
Topic headings and reading list
Tables and figures
Highlights for the clinician
Main menu
(About, Contents, Contributors, Publishing facts)
Daniel Tranel, Ph.D.

Brain-Behavior RelationsLateral Specialization: Left Versus RightLongitudinal Specialization: Anterior Versus Posterior
The Temporal LobesMesial Temporal Region
Hippocampal ComplexAmygdala
Anterior, Lateral, and Inferior Temporal RegionsRetrograde MemoryLexical RetrievalVisual Recognition
The Occipital LobesDorsal Component
Visual Disorientation
Inferior Mesial RegionBasal ForebrainVentromedial Region
Dorsolateral Prefrontal Region
Subcortical StructuresBasal GangliaThalamus
Conclusion
RECOMMENDED READINGSDamasio H: Human Brain Anatomy in Computerized Images,
2nd Edition. New York, Oxford University Press, 2005Feinberg TE, Farah MJ (eds): Behavioral Neurology and
Neuropsychology, 2nd Edition. New York, McGraw-Hill, 2003
CHAPTER 2 • Topics and Readings
The American Psychiatric Publishing Textbook of Neuropsychiatry and Behavioral Neurosciences, Fifth EditionEdited by Yudofsky SC, Hales RE. © 2008 American Psychiatric Publishing, Inc. All rights reserved. www.appi.org
65
Visual DisorientationOcular ApraxiaOptic Ataxia
Ventral ComponentAcquired (Central) AchromatopsiaApperceptive Visual AgnosiaAcquired (Pure) Alexia
The Parietal LobesTemporoparietal JunctionInferior Parietal Lobule
The Frontal LobesFrontal OperculumSuperior Mesial Region
Neuropsychology, 2nd Edition. New York, McGraw-Hill, 2003Heilman KM, Valenstein E (eds): Clinical Neuropsychology,
4th Edition. New York, Oxford University Press, 2003Kopelman MD: Disorders of memory. Brain 125:2152–2190, 2002Mesulam MM (ed): Principles of Behavioral Neurology.
Philadelphia, PA, FA Davis, 1985Rizzo M, Eslinger PJ (eds): Principles and Practice of Behavioral
Neurology and Neuropsychology. Philadelphia, PA, Elsevier, 2004Squire LR, Stark CEL, Clark RE: The medial temporal lobe. Annu
Rev Neurosci 27:279–306, 2004Tranel D: The Iowa-Benton school of neuropsychological
assessment, in Neuropsychological Assessment of Neuropsychiatric Disorders, 2nd Edition. Edited by Grant I, Adams KM. New York, Oxford University Press, 1996, pp 81–101

CHAPTER 2 • Tables and Figures
Figure 2–9. Contrast-enhanced computed tomographic (CT) scan of a 74-year-old right-handed man, showing bilateral lesions in the superior occipital region corresponding to the supracalcarine visual association cortices
Figure 2–10. CT scan of a 67-year-old right-handed man, showing a lesion in the left infracalcarine visual association cortices
Figure 2–11. Depiction of the lesion of a 68-year-old right-handed man who had an
Figure 2–1. Lateral view of left hemisphere
Figure 2–2. Lateral view of right hemisphere
Table 2–1. Functional dichotomies of left and right hemispheric dominance
Figure 2–3. Lateral, mesial, superior, and inferior views of the brain, depicting major demarcation points, including the rolandic sulcus and the sylvian fissure
Figure 2–4. Three major subdivisions of the temporal lobe
Figure 2–5. T1-weighted magnetic resonance (MR)
The American Psychiatric Publishing Textbook of Neuropsychiatry and Behavioral Neurosciences, Fifth EditionEdited by Yudofsky SC, Hales RE. © 2008 American Psychiatric Publishing, Inc. All rights reserved. www.appi.org
66
old right-handed man who had an infarction that destroyed the right posterior parietal and occipital cortices
Figure 2–12. Subdivisions of the parietal lobe and nearby regions
Figure 2–13. CT scan of a 56-year-old right-handed man who developed Wernicke’s aphasia after sustaining a left middle cerebral artery infarction
Figure 2–14. CT scan of a 35-year-old right-handed woman, showing a lesion in the left supramarginal gyrus (area 40)
T1-weighted magnetic resonance (MR) images of patient Boswell, who developed severe global amnesia after having herpes simplex encephalitis
Figure 2–6. Regions in the left temporal lobe that are important for lexical retrieval
Figure 2–7. T2-weighted MR image of a 67-year-old right-handed woman, which shows bilateral occipitotemporal lesions
Figure 2–8. Two major subdivisions of the occipital lobe: dorsal (superior) component and ventral (inferior) component
(continued)
CHAPTER 2 • Tables and Figures (continued)
Figure 2–15. T1-weighted MR images of a 34-year-old right-handed woman, showing a large right middle cerebral artery infarction
Figure 2–16. Major subdivisions of the frontal lobe
Figure 2–17. CT scan of a 76-year-old right-handed man who developed Broca’s aphasia after a left frontal infarction
Figure 2–18. Three-dimensional reconstruction of the brain of a patient with a lesion in the left premotor or prefrontal region
Figure 2–19. Depiction of the lesion in a 40-year-old right-handed man, marked in black on transverse
The American Psychiatric Publishing Textbook of Neuropsychiatry and Behavioral Neurosciences, Fifth EditionEdited by Yudofsky SC, Hales RE. © 2008 American Psychiatric Publishing, Inc. All rights reserved. www.appi.org
67
handed man, marked in black on transverse templates and on the mesial brain
Figure 2–20. Depiction of the lesion in a 32-year-old right-handed man who experienced rupture of an anterior communicating artery aneurysm
Figure 2–21. CT scan of a 44-year-old right-handed man who underwent resection of a large orbitofrontal meningioma
Figure 2–22. T1-weighted MR image of a 35-year-old right-handed woman who sustained a subcortical hemorrhage
Summary Highlights for the Clinician

FIGURE 2–1. Lateral view of left hemisphere.
In the vast majority of adults, the left side of th e brain is specialized for language and for processi ng verbally coded information. Figure 2–1 illustrates the typical arrangement of language in the left hemisphere.
The principal language-related regions are highlighted, including Broca’s area and Wernicke’s area. The “perisylvian” zone includes Broca’s and Wernicke’s areas and the zone marked with dots. Broca’s area is dedicated to speech output, that is, language expression, whereas Wernicke’s area is responsible for language comprehension. Other language-related regions highlighted include the supramarginal gyrus (area 40), the angular gyrus (area
The American Psychiatric Publishing Textbook of Neuropsychiatry and Behavioral Neurosciences, Fifth EditionEdited by Yudofsky SC, Hales RE. © 2008 American Psychiatric Publishing, Inc. All rights reserved. www.appi.org
68
include the supramarginal gyrus (area 40), the angular gyrus (area 39), part of area 37, and the region immediately above and anterior to Broca’s area. Not pictured are left-sided subcortical structures (basal ganglia, thalamus) that also participate in speech and language functions.
Source. Reprinted from Tranel D: “Higher Brain Function,” in Neuroscience in Medicine. Edited by Conn PM. Philadelphia, PA, JB Lippincott, 1995a, pp. 555–580. Used with permission.
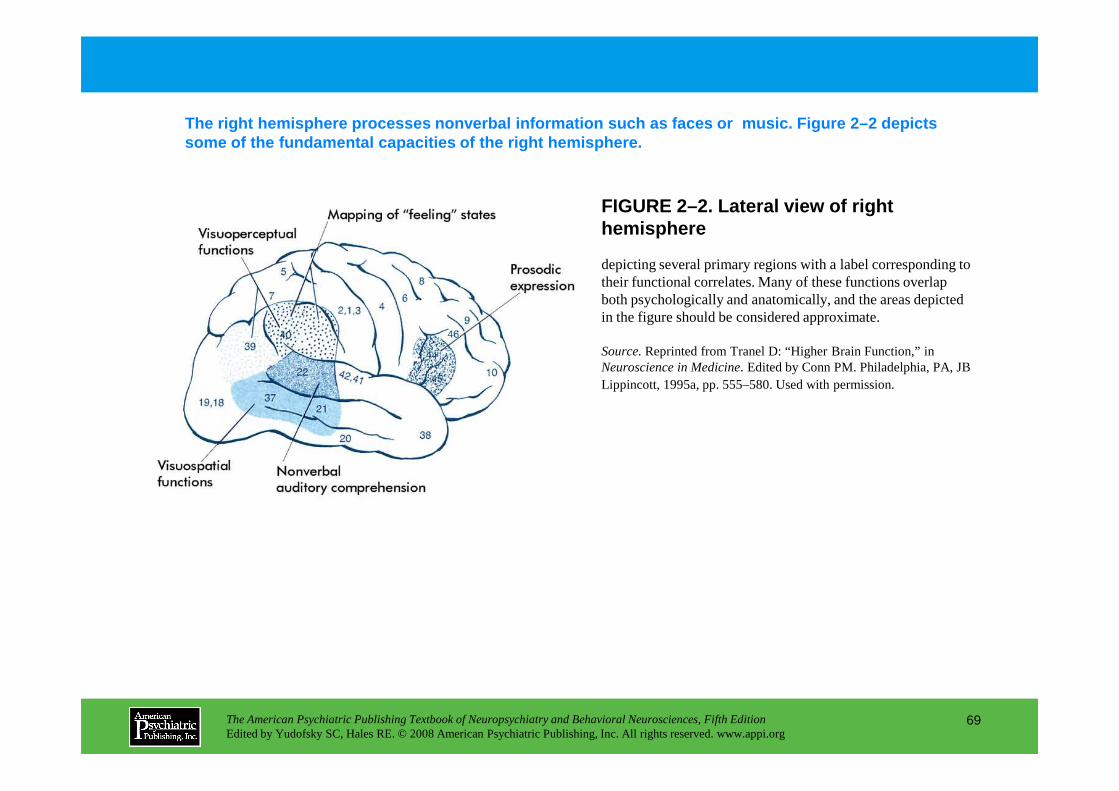
FIGURE 2–2. Lateral view of right hemisphere
The right hemisphere processes nonverbal informatio n such as faces or music. Figure 2–2 depicts some of the fundamental capacities of the right hem isphere.
depicting several primary regions with a label corresponding to their functional correlates. Many of these functions overlap both psychologically and anatomically, and the areas depicted in the figure should be considered approximate.
Source.Reprinted from Tranel D: “Higher Brain Function,” in Neuroscience in Medicine. Edited by Conn PM. Philadelphia, PA, JB Lippincott, 1995a, pp. 555–580. Used with permission.
The American Psychiatric Publishing Textbook of Neuropsychiatry and Behavioral Neurosciences, Fifth EditionEdited by Yudofsky SC, Hales RE. © 2008 American Psychiatric Publishing, Inc. All rights reserved. www.appi.org
69
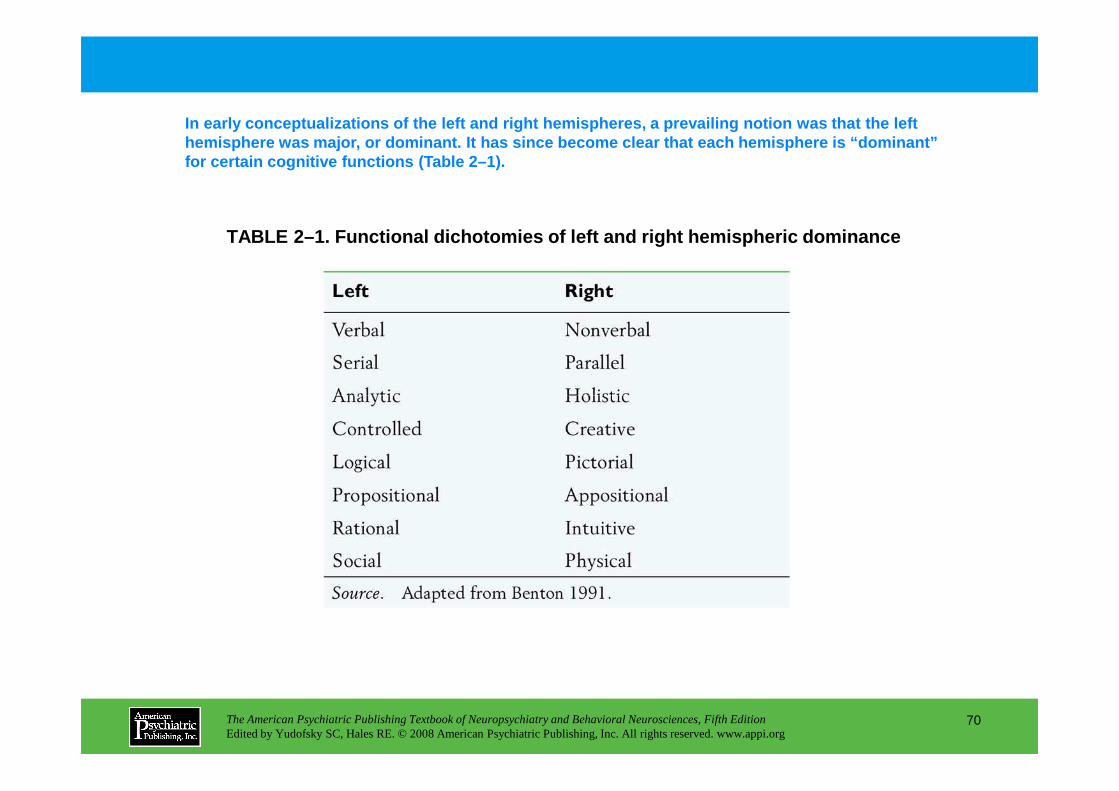
TABLE 2–1. Functional dichotomies of left and right hemispheric dominance
In early conceptualizations of the left and right he mispheres, a prevailing notion was that the left hemisphere was major, or dominant. It has since bec ome clear that each hemisphere is “dominant” for certain cognitive functions (Table 2–1).
The American Psychiatric Publishing Textbook of Neuropsychiatry and Behavioral Neurosciences, Fifth EditionEdited by Yudofsky SC, Hales RE. © 2008 American Psychiatric Publishing, Inc. All rights reserved. www.appi.org
70
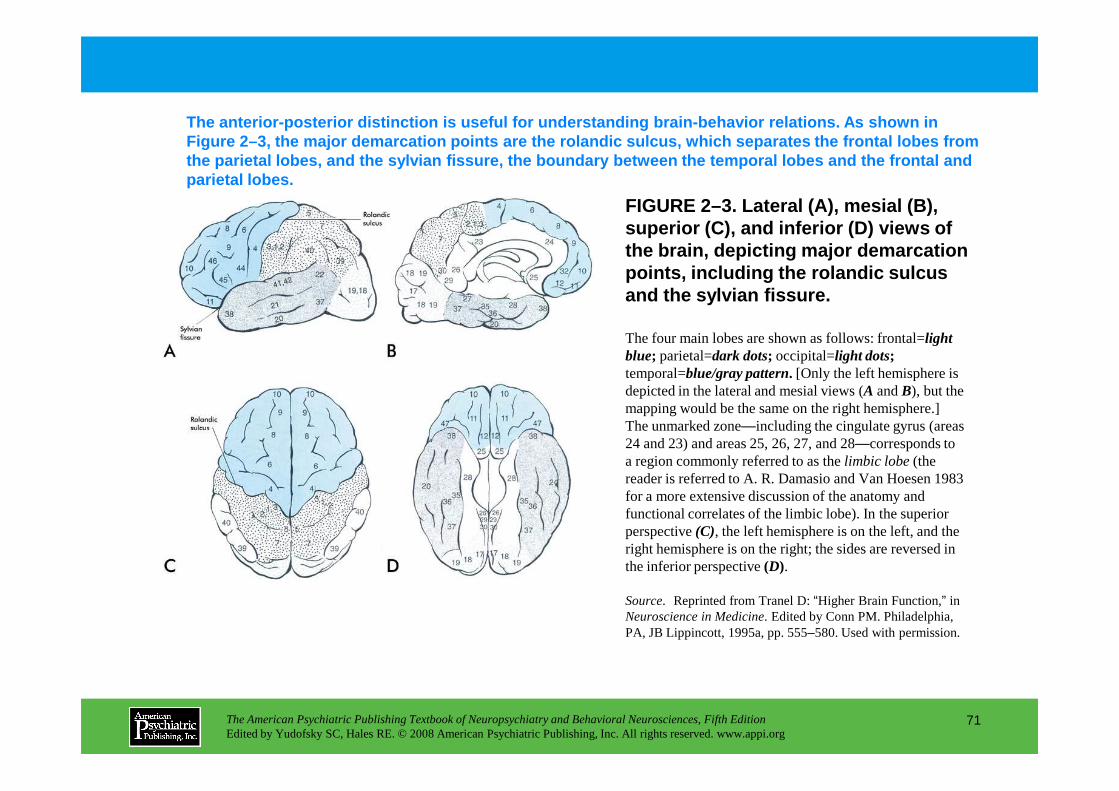
FIGURE 2–3. Lateral ( A), mesial ( B), superior ( C), and inferior ( D) views of the brain, depicting major demarcation points, including the rolandic sulcus and the sylvian fissure.
The anterior-posterior distinction is useful for un derstanding brain-behavior relations. As shown in Figure 2–3, the major demarcation points are the ro landic sulcus, which separates the frontal lobes fr om the parietal lobes, and the sylvian fissure, the bo undary between the temporal lobes and the frontal a nd parietal lobes.
The four main lobes are shown as follows: frontal=light blue; parietal=dark dots; occipital=light dots;temporal=blue/gray pattern. [Only the left hemisphere is depicted in the lateral and mesial views (A and B), but the
The American Psychiatric Publishing Textbook of Neuropsychiatry and Behavioral Neurosciences, Fifth EditionEdited by Yudofsky SC, Hales RE. © 2008 American Psychiatric Publishing, Inc. All rights reserved. www.appi.org
71
depicted in the lateral and mesial views (A and B), but the mapping would be the same on the right hemisphere.] The unmarked zone—including the cingulate gyrus (areas 24 and 23) and areas 25, 26, 27, and 28—corresponds to a region commonly referred to as the limbic lobe (the reader is referred to A. R. Damasio and Van Hoesen 1983 for a more extensive discussion of the anatomy and functional correlates of the limbic lobe). In the superior perspective (C), the left hemisphere is on the left, and the right hemisphere is on the right; the sides are reversed in the inferior perspective (D).
Source. Reprinted from Tranel D: “Higher Brain Function,” in Neuroscience in Medicine. Edited by Conn PM. Philadelphia, PA, JB Lippincott, 1995a, pp. 555–580. Used with permission.

FIGURE 2–3 (enlarged)
Source. Reprinted from Tranel D: “Higher Brain Function,” in Neuroscience in Medicine. Edited by Conn PM. Philadelphia, PA, JB Lippincott, 1995a, pp. 555–580. Used with permission.
The American Psychiatric Publishing Textbook of Neuropsychiatry and Behavioral Neurosciences, Fifth EditionEdited by Yudofsky SC, Hales RE. © 2008 American Psychiatric Publishing, Inc. All rights reserved. www.appi.org
72
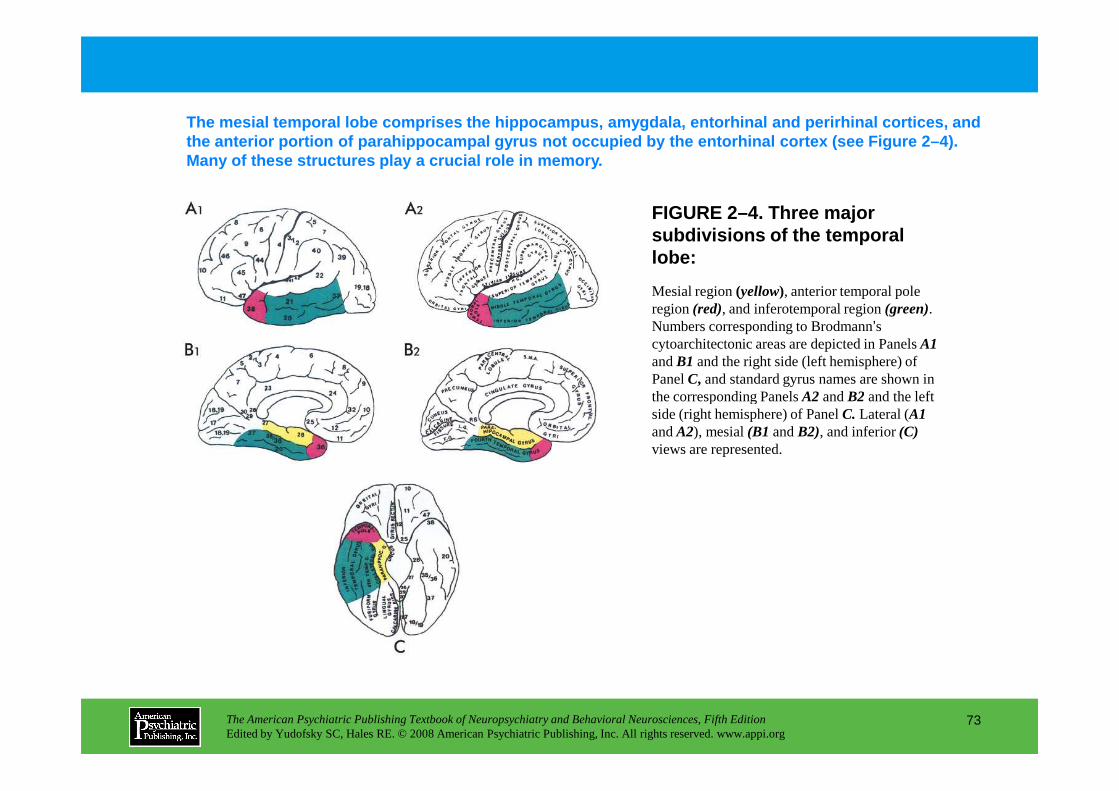
FIGURE 2–4. Three major subdivisions of the temporal lobe:
The mesial temporal lobe comprises the hippocampus, amygdala, entorhinal and perirhinal cortices, and the anterior portion of parahippocampal gyrus not o ccupied by the entorhinal cortex (see Figure 2–4). Many of these structures play a crucial role in mem ory.
Mesial region (yellow), anterior temporal pole region (red), and inferotemporal region(green). Numbers corresponding to Brodmann’s cytoarchitectonic areas are depicted in Panels A1and B1 and the right side (left hemisphere) of Panel C, and standard gyrus names are shown in the corresponding PanelsA2 and B2 and the left
The American Psychiatric Publishing Textbook of Neuropsychiatry and Behavioral Neurosciences, Fifth EditionEdited by Yudofsky SC, Hales RE. © 2008 American Psychiatric Publishing, Inc. All rights reserved. www.appi.org
73
the corresponding PanelsA2 and B2 and the left side (right hemisphere) of PanelC. Lateral (A1and A2), mesial (B1 and B2), and inferior (C)views are represented.

FIGURE 2–4 (enlarged)
The American Psychiatric Publishing Textbook of Neuropsychiatry and Behavioral Neurosciences, Fifth EditionEdited by Yudofsky SC, Hales RE. © 2008 American Psychiatric Publishing, Inc. All rights reserved. www.appi.org
74

The mesial temporal lobes—particularly the hippocamp us—are linked to acquisition of new information (anterograde memory). Patient Boswell, with bilater al damage to mesial temporal lobes and also nonmesial temporal damage (Figure 2–5), developed b oth anterograde and retrograde amnesia.
FIGURE 2–5. T1-weighted magnetic resonance images of patient Boswell,
who developed severe global amnesia after having herpes simplex encephalitis. In these coronal sectional images, the left hemisphere is on the right, and the most anterior image is in the upper left corner of
The American Psychiatric Publishing Textbook of Neuropsychiatry and Behavioral Neurosciences, Fifth EditionEdited by Yudofsky SC, Hales RE. © 2008 American Psychiatric Publishing, Inc. All rights reserved. www.appi.org
75
anterior image is in the upper left corner of the figure. The lesions, which show as black areas,include the anterior temporal regions (amygdala, hippocampus, parahippocampal gyrus, and temporal pole [area 38]) and the anterior portion of the inferior, middle, and superior temporal gyri (areas 20, 21, and anterior 22).

FIGURE 2–5 (enlarged)
The American Psychiatric Publishing Textbook of Neuropsychiatry and Behavioral Neurosciences, Fifth EditionEdited by Yudofsky SC, Hales RE. © 2008 American Psychiatric Publishing, Inc. All rights reserved. www.appi.org
76
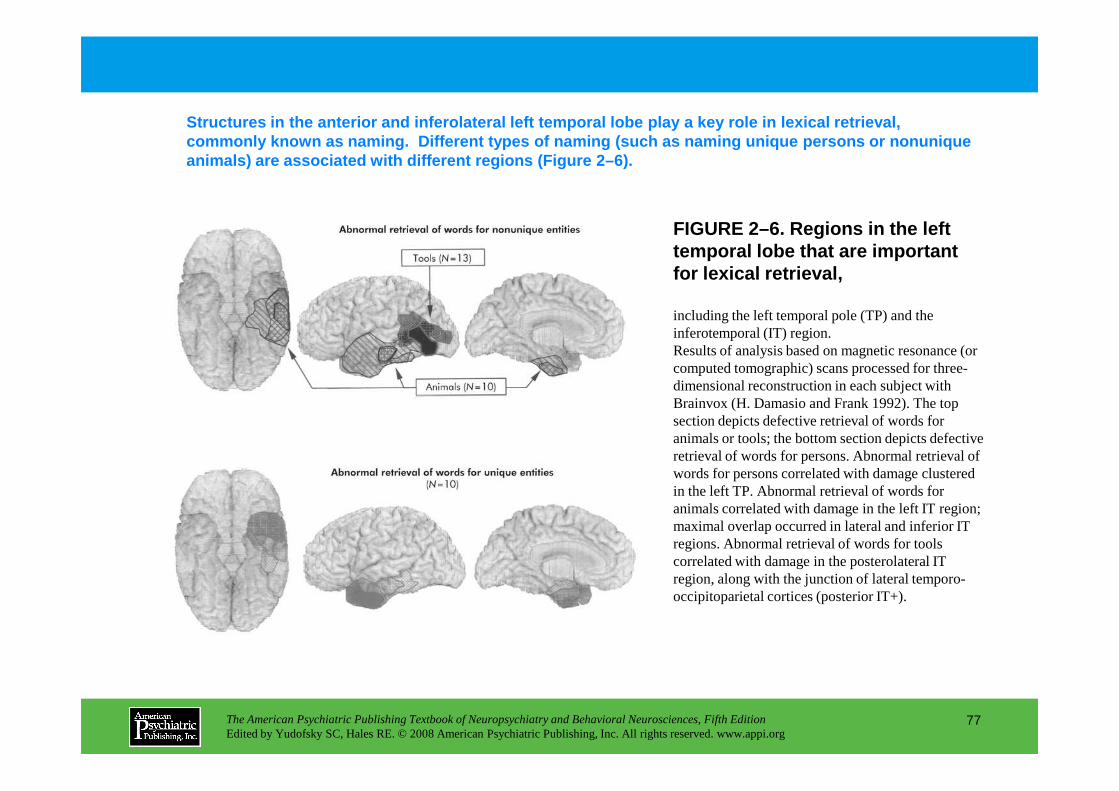
FIGURE 2–6. Regions in the left temporal lobe that are important for lexical retrieval,
Structures in the anterior and inferolateral left t emporal lobe play a key role in lexical retrieval, commonly known as naming . Different types of naming (such as naming unique persons or nonunique animals) are associated with different regions (Fig ure 2–6).
including the left temporal pole (TP) and the inferotemporal (IT) region.Results of analysis based on magnetic resonance (or computed tomographic) scans processed for three-dimensional reconstruction in each subject with Brainvox (H. Damasio and Frank 1992). The top
The American Psychiatric Publishing Textbook of Neuropsychiatry and Behavioral Neurosciences, Fifth EditionEdited by Yudofsky SC, Hales RE. © 2008 American Psychiatric Publishing, Inc. All rights reserved. www.appi.org
77
Brainvox (H. Damasio and Frank 1992). The top section depicts defective retrieval of words for animals or tools; the bottom section depicts defective retrieval of words for persons. Abnormal retrieval of words for persons correlated with damage clustered in the left TP. Abnormal retrieval of words for animals correlated with damage in the left IT region; maximal overlap occurred in lateral and inferior IT regions. Abnormal retrieval of words for tools correlated with damage in the posterolateral IT region, along with the junction of lateral temporo-occipitoparietal cortices (posterior IT+).
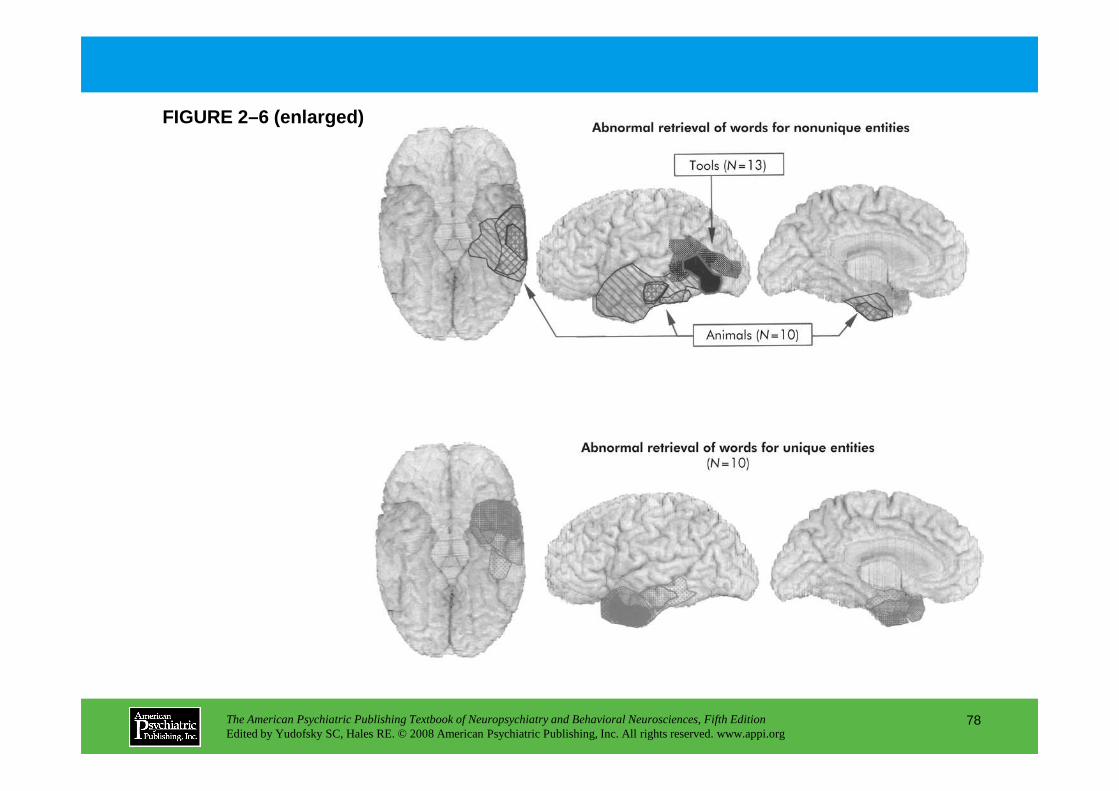
FIGURE 2–6 (enlarged)
The American Psychiatric Publishing Textbook of Neuropsychiatry and Behavioral Neurosciences, Fifth EditionEdited by Yudofsky SC, Hales RE. © 2008 American Psychiatric Publishing, Inc. All rights reserved. www.appi.org
78
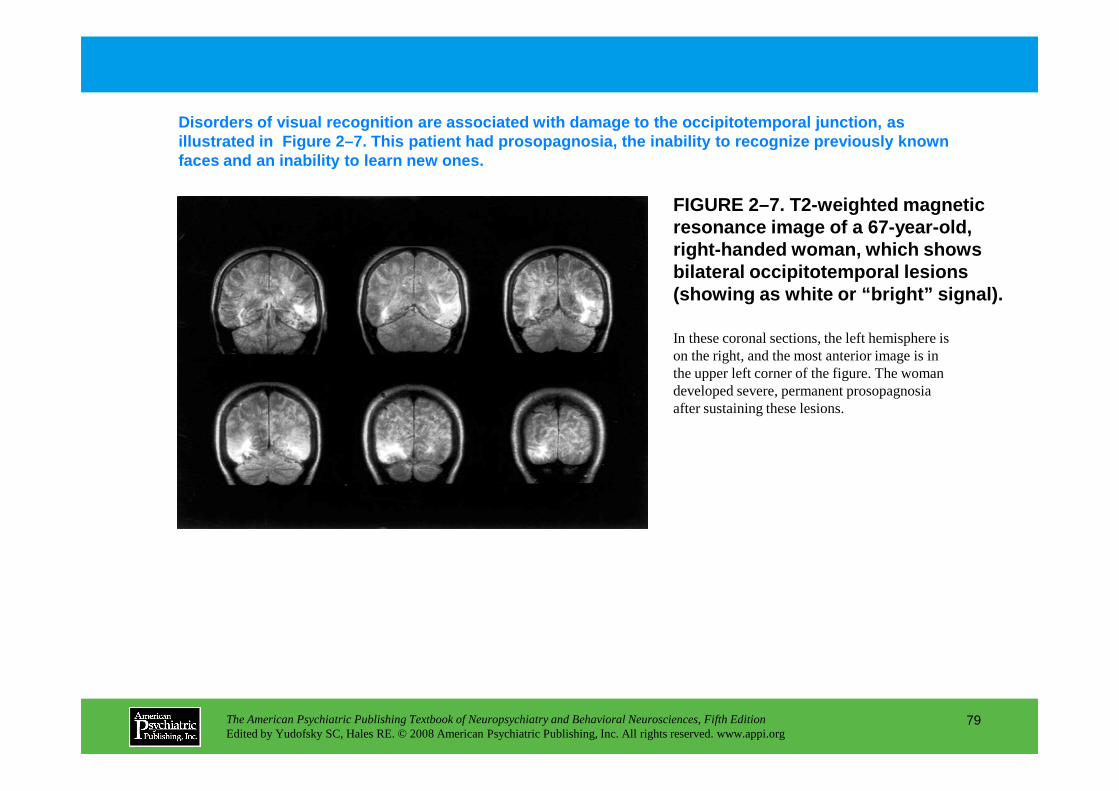
FIGURE 2–7. T2-weighted magnetic resonance image of a 67-year-old, right-handed woman, which shows bilateral occipitotemporal lesions (showing as white or “bright” signal).
Disorders of visual recognition are associated with damage to the occipitotemporal junction, as illustrated in Figure 2–7. This patient had prosop agnosia, the inability to recognize previously known faces and an inability to learn new ones.
In these coronal sections, the left hemisphere is on the right, and the most anterior image is in the upper left corner of the figure. The woman developed severe, permanent prosopagnosia
The American Psychiatric Publishing Textbook of Neuropsychiatry and Behavioral Neurosciences, Fifth EditionEdited by Yudofsky SC, Hales RE. © 2008 American Psychiatric Publishing, Inc. All rights reserved. www.appi.org
79
developed severe, permanent prosopagnosia after sustaining these lesions.
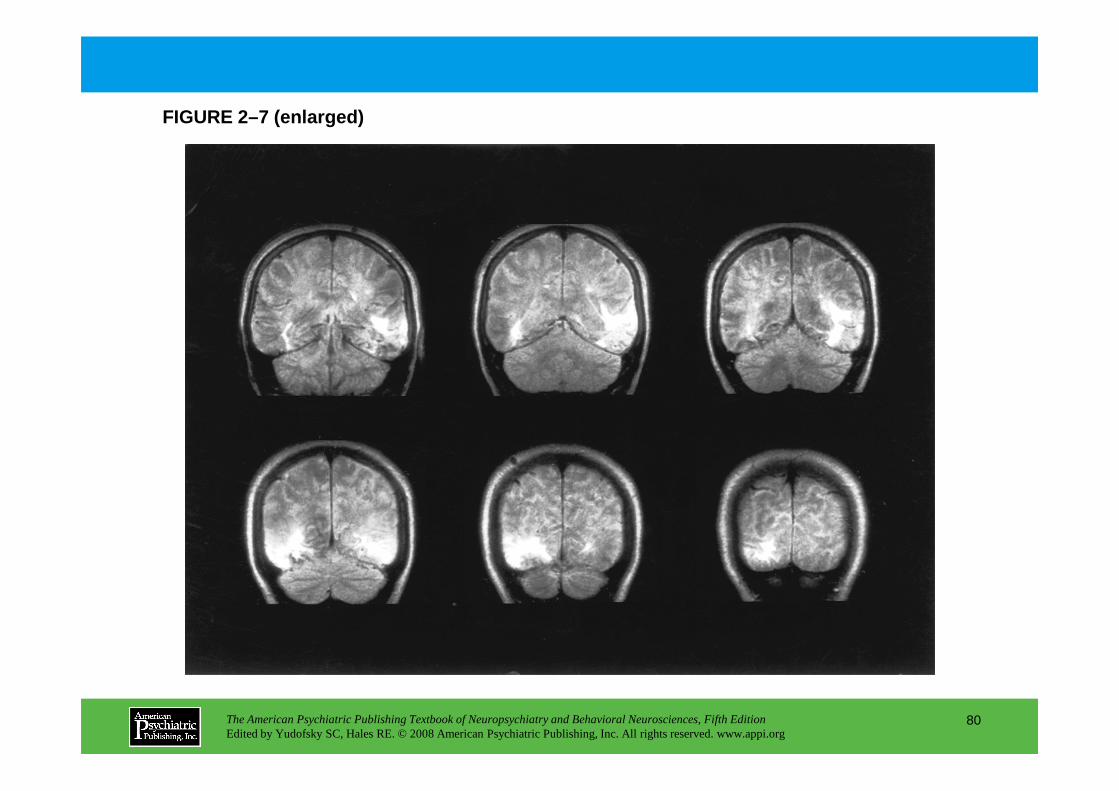
FIGURE 2–7 (enlarged)
The American Psychiatric Publishing Textbook of Neuropsychiatry and Behavioral Neurosciences, Fifth EditionEdited by Yudofsky SC, Hales RE. © 2008 American Psychiatric Publishing, Inc. All rights reserved. www.appi.org
80

FIGURE 2–8. Two major subdivisions of the occipital lobe: dorsal (superior) component (red) and ventral (inferior) component (green) .
Structures in and near the occipital lobes are depi cted in Figure 2–8. Dorsal and ventral components c an be designated for purposes of establishing neuropsy chological correlates (as outlined in the Highlight s table for this chapter).
Numbers corresponding to Brodmann’s cytoarchitectonic areas are depicted in Panels A1and B1 and the right side (left hemisphere) of Panels C and D; standard gyrus names are shown on corresponding Panels A2 and B2 and the left side
The American Psychiatric Publishing Textbook of Neuropsychiatry and Behavioral Neurosciences, Fifth EditionEdited by Yudofsky SC, Hales RE. © 2008 American Psychiatric Publishing, Inc. All rights reserved. www.appi.org
81
corresponding Panels A2 and B2 and the left side (right hemisphere) of Panels C and D. Lateral (A1and A2), mesial (B1 and B2), inferior (C), and superior (D) views are represented.

FIGURE 2–9. Contrast-enhanced computed tomographic scan of a 74-year-old right-handed man, showing bilateral lesions (areas of increased density) in the superior occipital region corresponding to the supracalcarine visual association cortices.
A CT scan of a patient with Balint’s syndrome is sh own in Figure 2–9. Lesions that spare the primary visual cortex but involve the association cortices and the adjacent parietal region can produce this syndrome of visual disorientation.
The man developed a complex visual disturbance (Balint’s syndrome) in connection with these lesions.
The American Psychiatric Publishing Textbook of Neuropsychiatry and Behavioral Neurosciences, Fifth EditionEdited by Yudofsky SC, Hales RE. © 2008 American Psychiatric Publishing, Inc. All rights reserved. www.appi.org
82
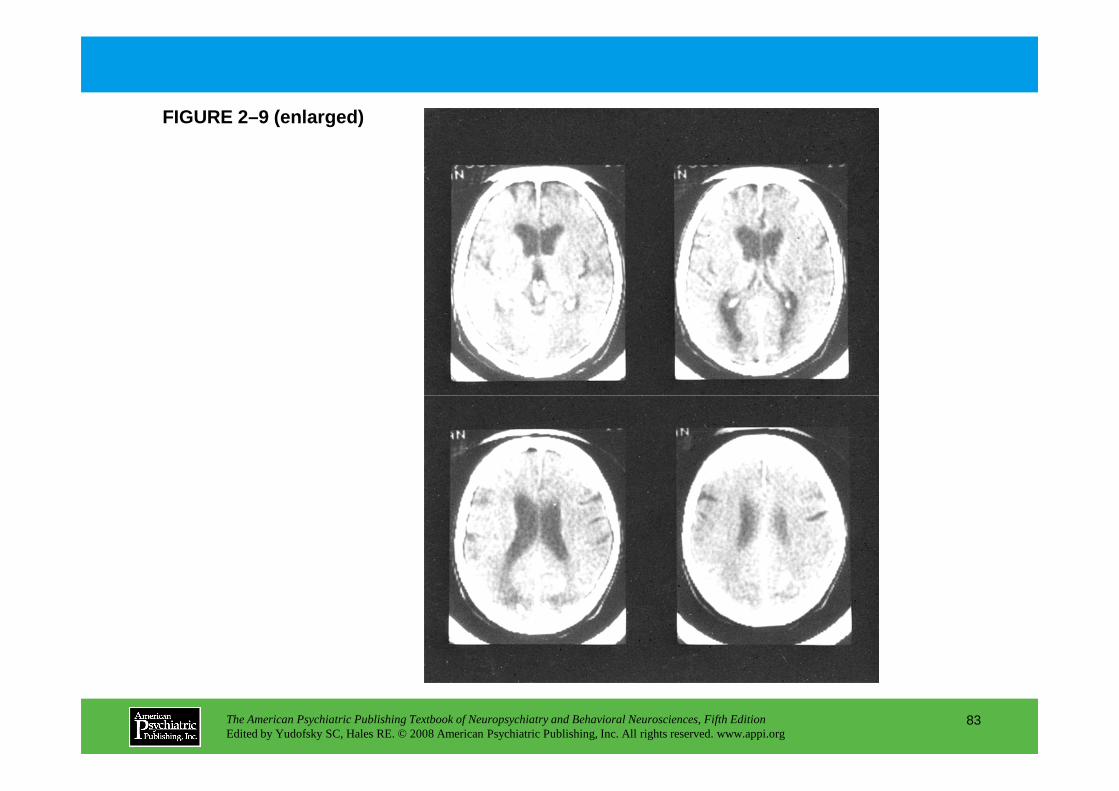
FIGURE 2–9 (enlarged)
The American Psychiatric Publishing Textbook of Neuropsychiatry and Behavioral Neurosciences, Fifth EditionEdited by Yudofsky SC, Hales RE. © 2008 American Psychiatric Publishing, Inc. All rights reserved. www.appi.org
83
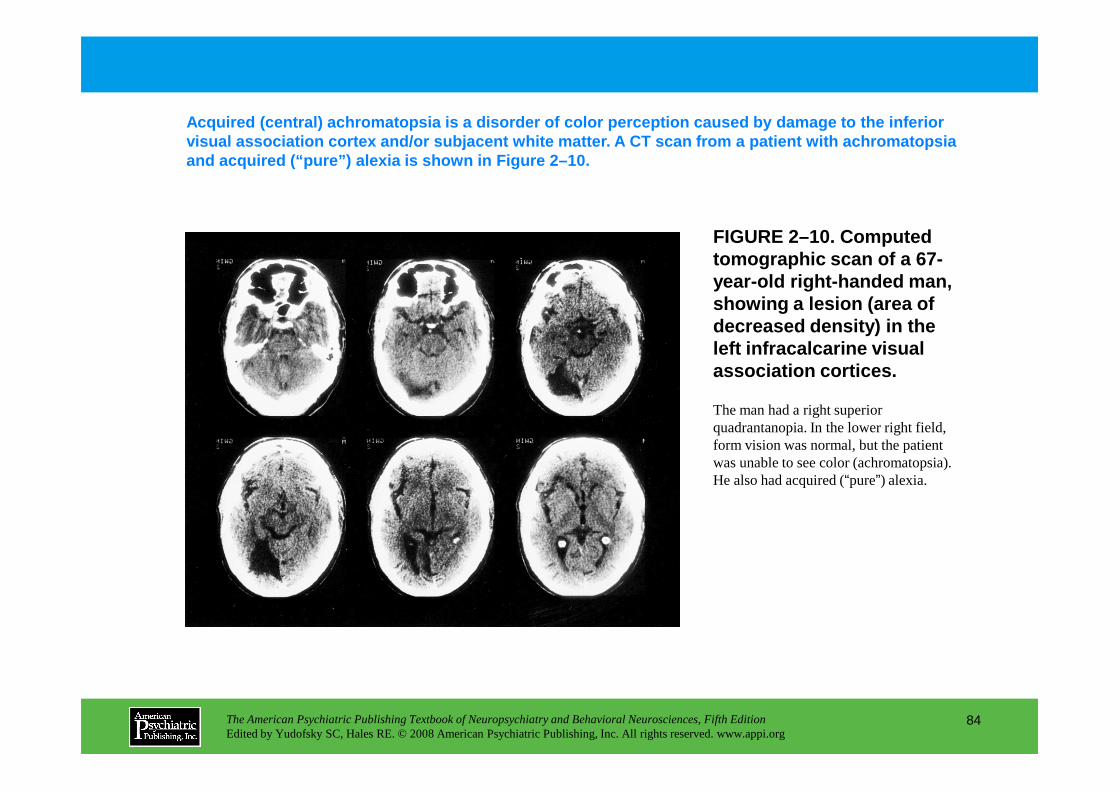
FIGURE 2–10. Computed tomographic scan of a 67-year-old right-handed man, showing a lesion (area of decreased density) in the left infracalcarine visual association cortices.
Acquired (central) achromatopsia is a disorder of c olor perception caused by damage to the inferior visual association cortex and/or subjacent white ma tter. A CT scan from a patient with achromatopsia and acquired (“pure”) alexia is shown in Figure 2–10.
The American Psychiatric Publishing Textbook of Neuropsychiatry and Behavioral Neurosciences, Fifth EditionEdited by Yudofsky SC, Hales RE. © 2008 American Psychiatric Publishing, Inc. All rights reserved. www.appi.org
84
The man had a right superior quadrantanopia. In the lower right field, form vision was normal, but the patient was unable to see color (achromatopsia). He also had acquired (“pure”) alexia.

FIGURE 2–10 (enlarged)
The American Psychiatric Publishing Textbook of Neuropsychiatry and Behavioral Neurosciences, Fifth EditionEdited by Yudofsky SC, Hales RE. © 2008 American Psychiatric Publishing, Inc. All rights reserved. www.appi.org
85
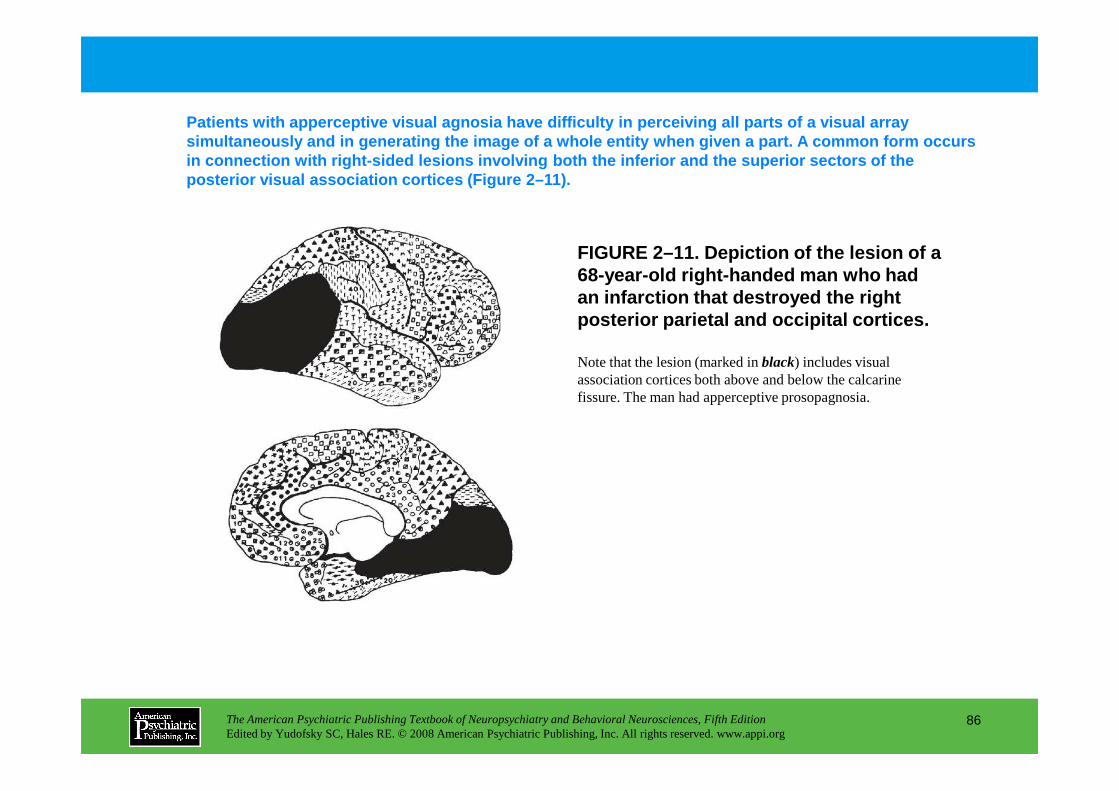
FIGURE 2–11. Depiction of the lesion of a 68-year-old right-handed man who had an infarction that destroyed the right posterior parietal and occipital cortices.
Patients with apperceptive visual agnosia have diff iculty in perceiving all parts of a visual array simultaneously and in generating the image of a who le entity when given a part. A common form occurs in connection with right-sided lesions involving bo th the inferior and the superior sectors of the posterior visual association cortices (Figure 2–11) .
Note that the lesion (marked in black) includes visual association cortices both above and below the calcarine fissure. The man had apperceptive prosopagnosia.
The American Psychiatric Publishing Textbook of Neuropsychiatry and Behavioral Neurosciences, Fifth EditionEdited by Yudofsky SC, Hales RE. © 2008 American Psychiatric Publishing, Inc. All rights reserved. www.appi.org
86
fissure. The man had apperceptive prosopagnosia.
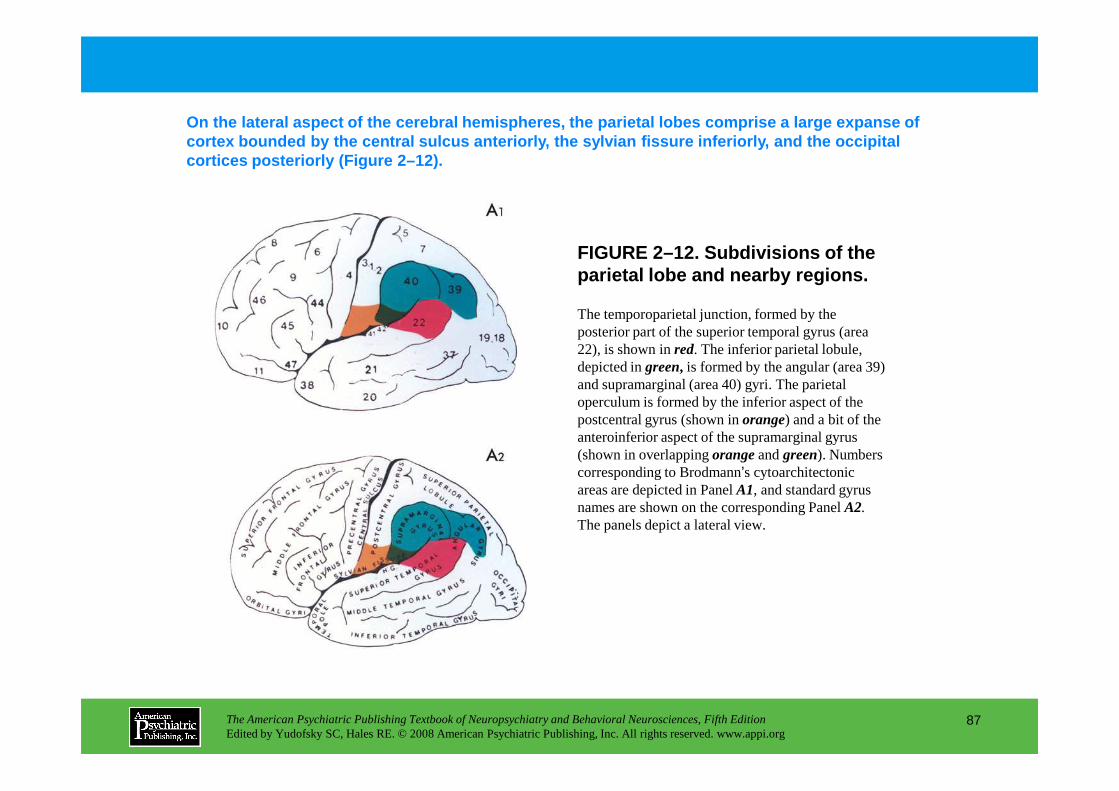
FIGURE 2–12. Subdivisions of the parietal lobe and nearby regions.
On the lateral aspect of the cerebral hemispheres, the parietal lobes comprise a large expanse of cortex bounded by the central sulcus anteriorly, th e sylvian fissure inferiorly, and the occipital cortices posteriorly (Figure 2–12).
The temporoparietal junction, formed by the posterior part of the superior temporal gyrus (area 22), is shown in red. The inferior parietal lobule, depicted in green, is formed by the angular (area 39) and supramarginal (area 40) gyri. The parietal operculum is formed by the inferior aspect of the
The American Psychiatric Publishing Textbook of Neuropsychiatry and Behavioral Neurosciences, Fifth EditionEdited by Yudofsky SC, Hales RE. © 2008 American Psychiatric Publishing, Inc. All rights reserved. www.appi.org
87
operculum is formed by the inferior aspect of the postcentral gyrus (shown in orange) and a bit of the anteroinferior aspect of the supramarginal gyrus (shown in overlapping orangeand green). Numbers corresponding to Brodmann’s cytoarchitectonic areas are depicted in Panel A1, and standard gyrus names are shown on the corresponding PanelA2. The panels depict a lateral view.

Wernicke’s aphasia is characterized by fluent, parap hasic speech, impaired repetition, and defective aural comprehension, often for both aural and writt en language. The typical lesion associated with Wernicke’s aphasia is depicted in Figure 2–13.
The lesion (area of low density) is centered squarely in Wernicke’s area, including the
FIGURE 2–13. Computed tomographic scan of a 56-year-old right-handed man who developed Wernicke’s aphasia after sustaining a left middle cerebral artery infarction.
The American Psychiatric Publishing Textbook of Neuropsychiatry and Behavioral Neurosciences, Fifth EditionEdited by Yudofsky SC, Hales RE. © 2008 American Psychiatric Publishing, Inc. All rights reserved. www.appi.org
88
squarely in Wernicke’s area, including the posterior superior temporal gyrus (top row) and part of the inferior parietal lobule (bottom row).
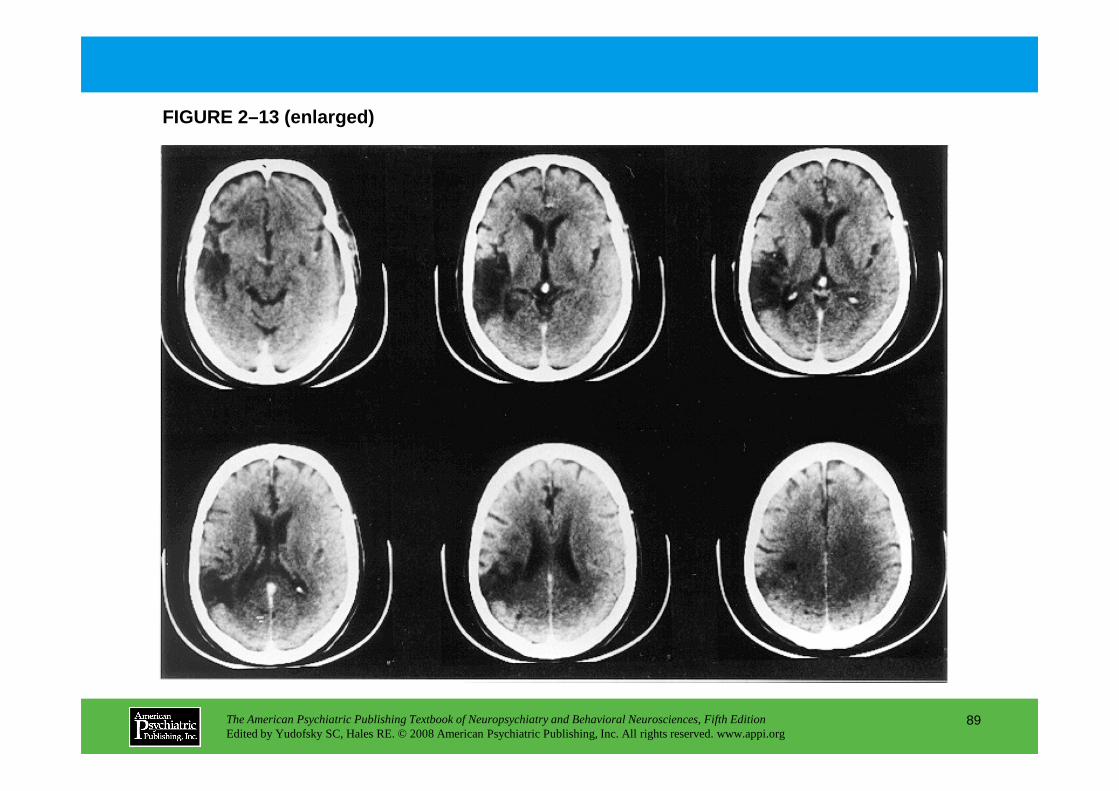
FIGURE 2–13 (enlarged)
The American Psychiatric Publishing Textbook of Neuropsychiatry and Behavioral Neurosciences, Fifth EditionEdited by Yudofsky SC, Hales RE. © 2008 American Psychiatric Publishing, Inc. All rights reserved. www.appi.org
89
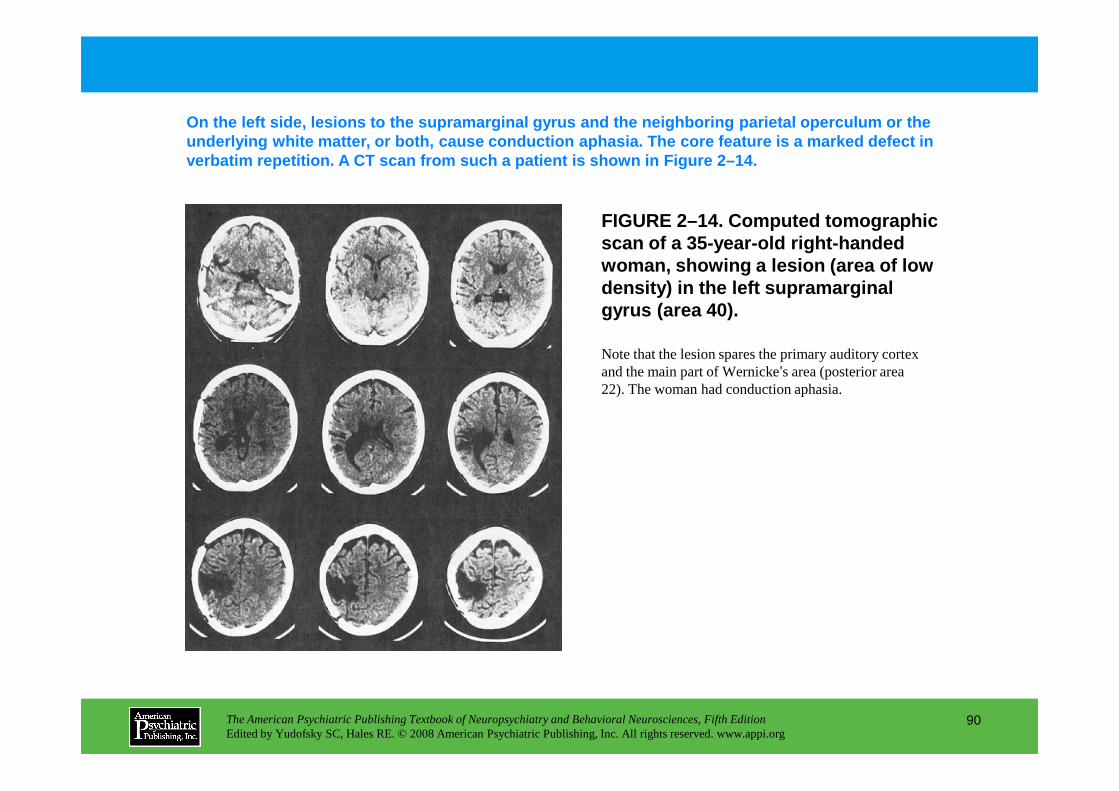
FIGURE 2–14. Computed tomographic scan of a 35-year-old right-handed woman, showing a lesion (area of low density) in the left supramarginal gyrus (area 40).
On the left side, lesions to the supramarginal gyru s and the neighboring parietal operculum or the underlying white matter, or both, cause conduction aphasia . The core feature is a marked defect in verbatim repetition. A CT scan from such a patient is shown in Figure 2–14.
Note that the lesion spares the primary auditory cortex and the main part of Wernicke’s area (posterior area 22). The woman had conduction aphasia.
The American Psychiatric Publishing Textbook of Neuropsychiatry and Behavioral Neurosciences, Fifth EditionEdited by Yudofsky SC, Hales RE. © 2008 American Psychiatric Publishing, Inc. All rights reserved. www.appi.org
90
22). The woman had conduction aphasia.

FIGURE 2–14 (enlarged)
The American Psychiatric Publishing Textbook of Neuropsychiatry and Behavioral Neurosciences, Fifth EditionEdited by Yudofsky SC, Hales RE. © 2008 American Psychiatric Publishing, Inc. All rights reserved. www.appi.org
91
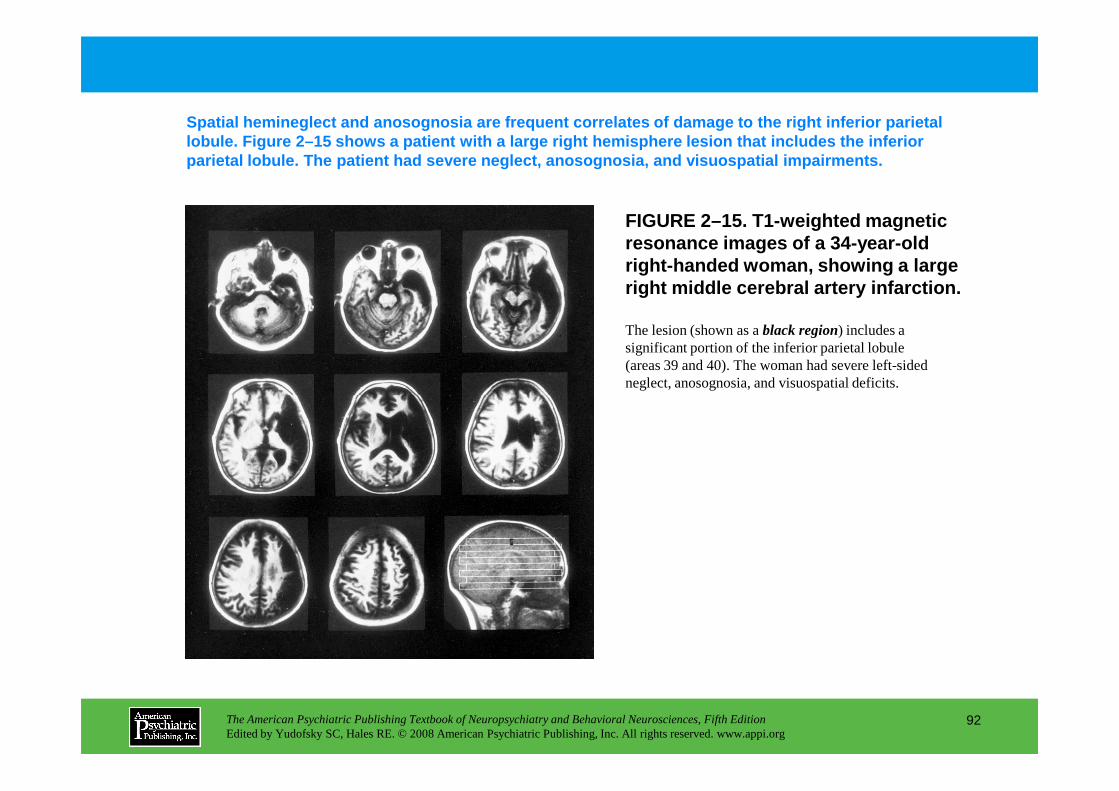
FIGURE 2–15. T1-weighted magnetic resonance images of a 34-year-old right-handed woman, showing a large right middle cerebral artery infarction.
Spatial hemineglect and anosognosia are frequent co rrelates of damage to the right inferior parietal lobule. Figure 2–15 shows a patient with a large ri ght hemisphere lesion that includes the inferior parietal lobule. The patient had severe neglect, an osognosia, and visuospatial impairments.
The lesion (shown as a black region) includes a significant portion of the inferior parietal lobule (areas 39 and 40). The woman had severe left-sided neglect, anosognosia, and visuospatial deficits.
The American Psychiatric Publishing Textbook of Neuropsychiatry and Behavioral Neurosciences, Fifth EditionEdited by Yudofsky SC, Hales RE. © 2008 American Psychiatric Publishing, Inc. All rights reserved. www.appi.org
92
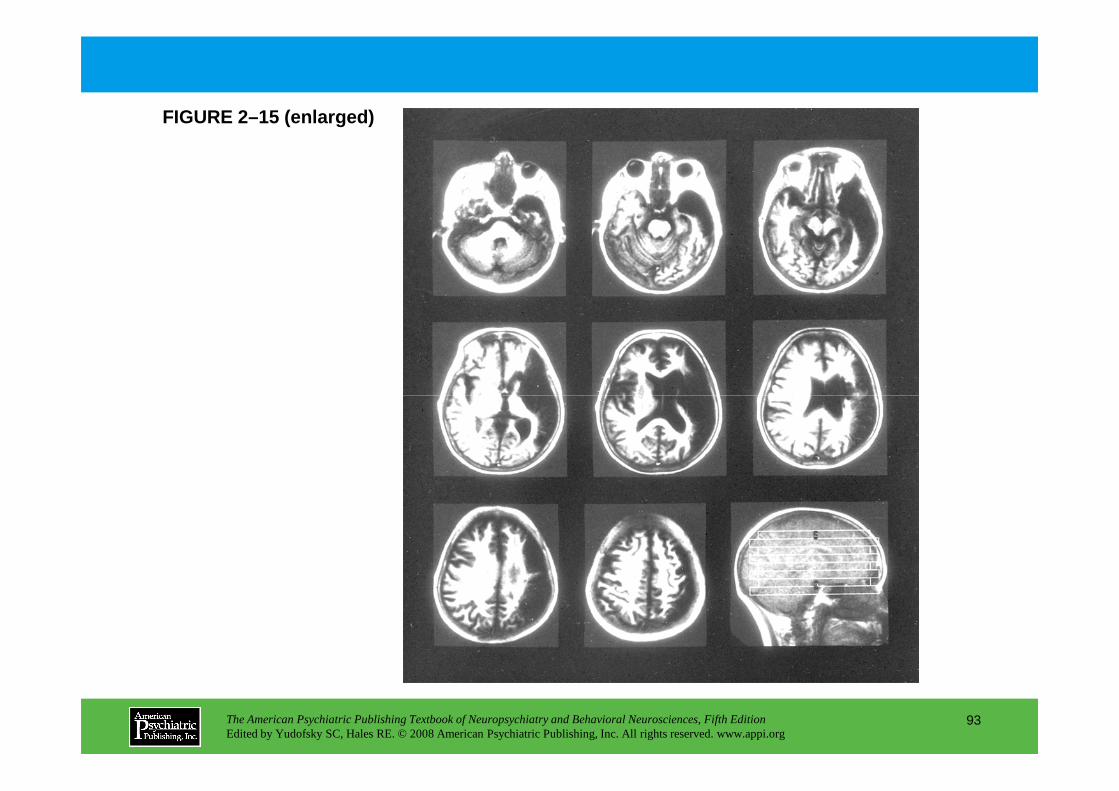
FIGURE 2–15 (enlarged)
The American Psychiatric Publishing Textbook of Neuropsychiatry and Behavioral Neurosciences, Fifth EditionEdited by Yudofsky SC, Hales RE. © 2008 American Psychiatric Publishing, Inc. All rights reserved. www.appi.org
93
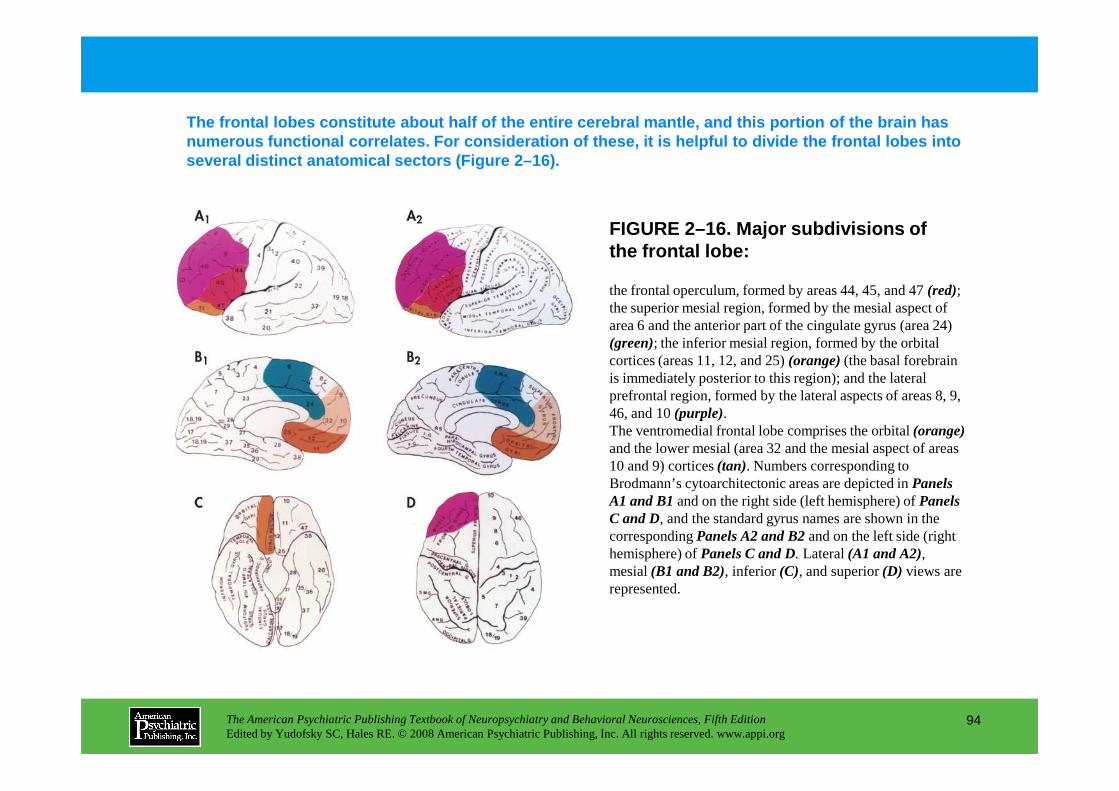
FIGURE 2–16. Major subdivisions of the frontal lobe:
The frontal lobes constitute about half of the enti re cerebral mantle, and this portion of the brain h as numerous functional correlates. For consideration o f these, it is helpful to divide the frontal lobes into several distinct anatomical sectors (Figure 2–16).
the frontal operculum, formed by areas 44, 45, and 47 (red); the superior mesial region, formed by the mesial aspect of area 6 and the anterior part of the cingulate gyrus (area 24) (green); the inferior mesial region, formed by the orbital cortices (areas 11, 12, and 25) (orange)(the basal forebrain is immediately posterior to this region); and the lateral prefrontal region, formed by the lateral aspects of areas 8, 9,
The American Psychiatric Publishing Textbook of Neuropsychiatry and Behavioral Neurosciences, Fifth EditionEdited by Yudofsky SC, Hales RE. © 2008 American Psychiatric Publishing, Inc. All rights reserved. www.appi.org
94
prefrontal region, formed by the lateral aspects of areas 8, 9, 46, and 10 (purple).The ventromedial frontal lobe comprises the orbital (orange)and the lower mesial (area 32 and the mesial aspect of areas 10 and 9) cortices (tan). Numbers corresponding to Brodmann’s cytoarchitectonic areas are depicted in Panels A1 and B1and on the right side (left hemisphere) of Panels C and D, and the standard gyrus names are shown in the corresponding Panels A2 and B2and on the left side (right hemisphere) of Panels C and D. Lateral (A1 and A2), mesial (B1 and B2), inferior (C), and superior (D) views are represented.
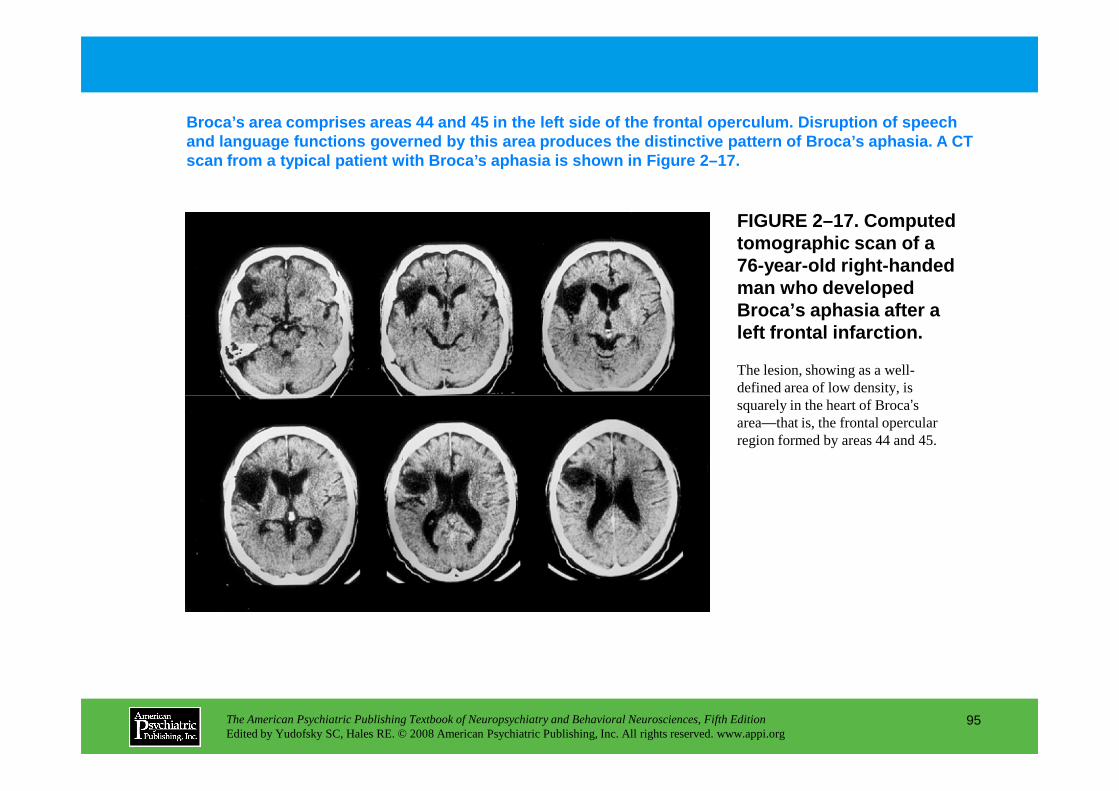
FIGURE 2–17. Computed tomographic scan of a 76-year-old right-handed man who developed Broca’s aphasia after a left frontal infarction.
Broca’s area comprises areas 44 and 45 in the left side of the f rontal operculum. Disruption of speech and language functions governed by this area produc es the distinctive pattern of Broca’s aphasia . A CT scan from a typical patient with Broca’s aphasia is shown in Figure 2–17.
The lesion, showing as a well-defined area of low density, is
The American Psychiatric Publishing Textbook of Neuropsychiatry and Behavioral Neurosciences, Fifth EditionEdited by Yudofsky SC, Hales RE. © 2008 American Psychiatric Publishing, Inc. All rights reserved. www.appi.org
95
defined area of low density, is squarely in the heart of Broca’s area—that is, the frontal opercular region formed by areas 44 and 45.

FIGURE 2–17 (enlarged)
The American Psychiatric Publishing Textbook of Neuropsychiatry and Behavioral Neurosciences, Fifth EditionEdited by Yudofsky SC, Hales RE. © 2008 American Psychiatric Publishing, Inc. All rights reserved. www.appi.org
96
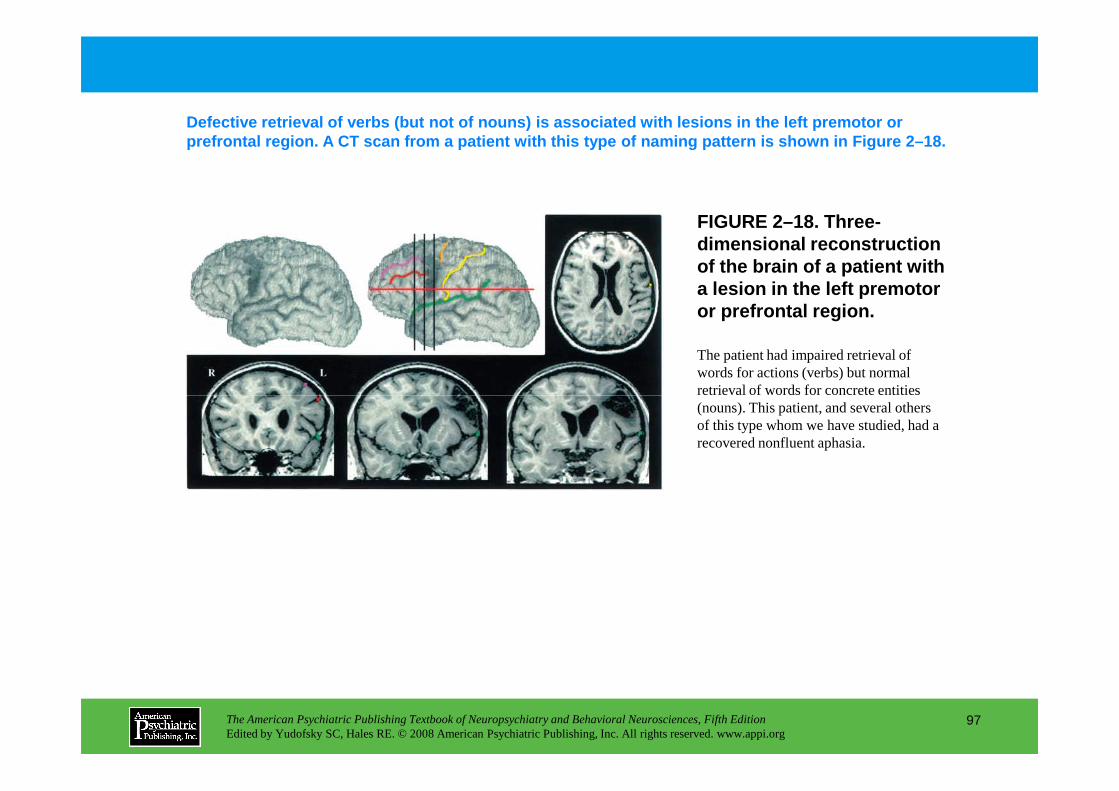
FIGURE 2–18. Three-dimensional reconstruction of the brain of a patient with a lesion in the left premotor or prefrontal region.
Defective retrieval of verbs (but not of nouns) is associated with lesions in the left premotor or prefrontal region. A CT scan from a patient with th is type of naming pattern is shown in Figure 2–18.
The patient had impaired retrieval of words for actions (verbs) but normal retrieval of words for concrete entities
The American Psychiatric Publishing Textbook of Neuropsychiatry and Behavioral Neurosciences, Fifth EditionEdited by Yudofsky SC, Hales RE. © 2008 American Psychiatric Publishing, Inc. All rights reserved. www.appi.org
97
retrieval of words for concrete entities (nouns). This patient, and several others of this type whom we have studied, had a recovered nonfluent aphasia.

FIGURE 2–18 (enlarged)
The American Psychiatric Publishing Textbook of Neuropsychiatry and Behavioral Neurosciences, Fifth EditionEdited by Yudofsky SC, Hales RE. © 2008 American Psychiatric Publishing, Inc. All rights reserved. www.appi.org
98

The lesion is in the left hemisphere and involves the mesial aspect of area 6 and the anterior part of the cingulate gyrus (area 24). Initially, the man had severe
FIGURE 2–19. Depiction of the lesion in a 40-year-old right-handed man, marked in black on transverse templates and on the mesial brain.
Lesions to the structures of the superior mesial as pect of the frontal lobes produce akinetic mutism, in which the patient makes no effort to communicate by language or gesture and maintains a blank facial expression. Figure 2–19 illustrates the lesion in a patient with this syndrome.
The American Psychiatric Publishing Textbook of Neuropsychiatry and Behavioral Neurosciences, Fifth EditionEdited by Yudofsky SC, Hales RE. © 2008 American Psychiatric Publishing, Inc. All rights reserved. www.appi.org
99
cingulate gyrus (area 24). Initially, the man had severe akinetic mutism, but by 3 months after onset, he had excellent recovery.
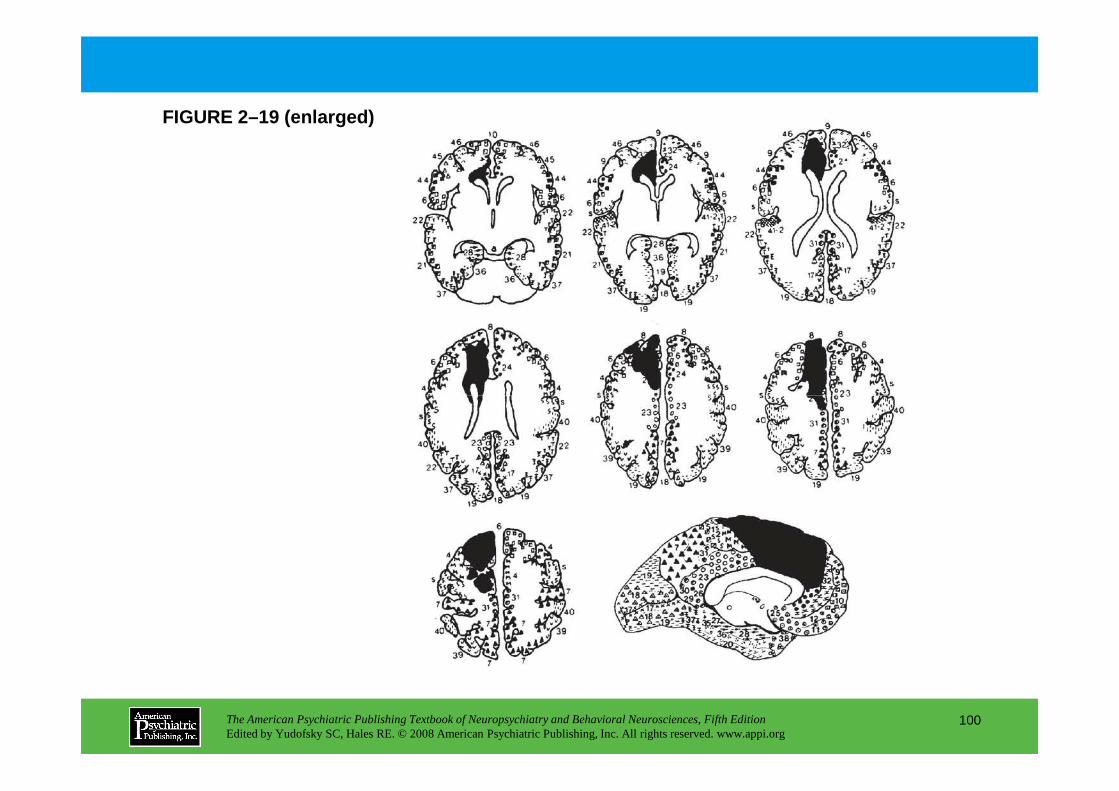
FIGURE 2–19 (enlarged)
The American Psychiatric Publishing Textbook of Neuropsychiatry and Behavioral Neurosciences, Fifth EditionEdited by Yudofsky SC, Hales RE. © 2008 American Psychiatric Publishing, Inc. All rights reserved. www.appi.org
100
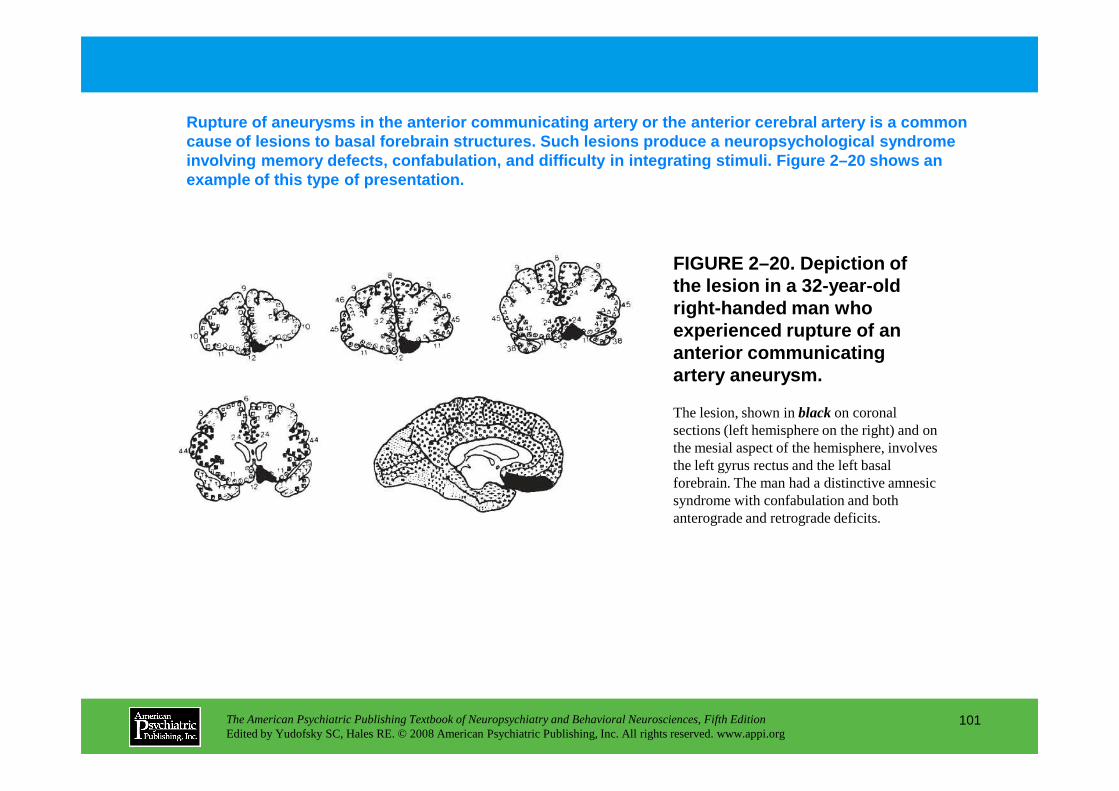
FIGURE 2–20. Depiction of the lesion in a 32-year-old right-handed man who experienced rupture of an anterior communicating artery aneurysm.
Rupture of aneurysms in the anterior communicating artery or the anterior cerebral artery is a common cause of lesions to basal forebrain structures. Suc h lesions produce a neuropsychological syndrome involving memory defects, confabulation, and diffic ulty in integrating stimuli. Figure 2–20 shows an example of this type of presentation.
The American Psychiatric Publishing Textbook of Neuropsychiatry and Behavioral Neurosciences, Fifth EditionEdited by Yudofsky SC, Hales RE. © 2008 American Psychiatric Publishing, Inc. All rights reserved. www.appi.org
101
The lesion, shown in blackon coronal sections (left hemisphere on the right) and on the mesial aspect of the hemisphere, involves the left gyrus rectus and the left basal forebrain. The man had a distinctive amnesic syndrome with confabulation and both anterograde and retrograde deficits.
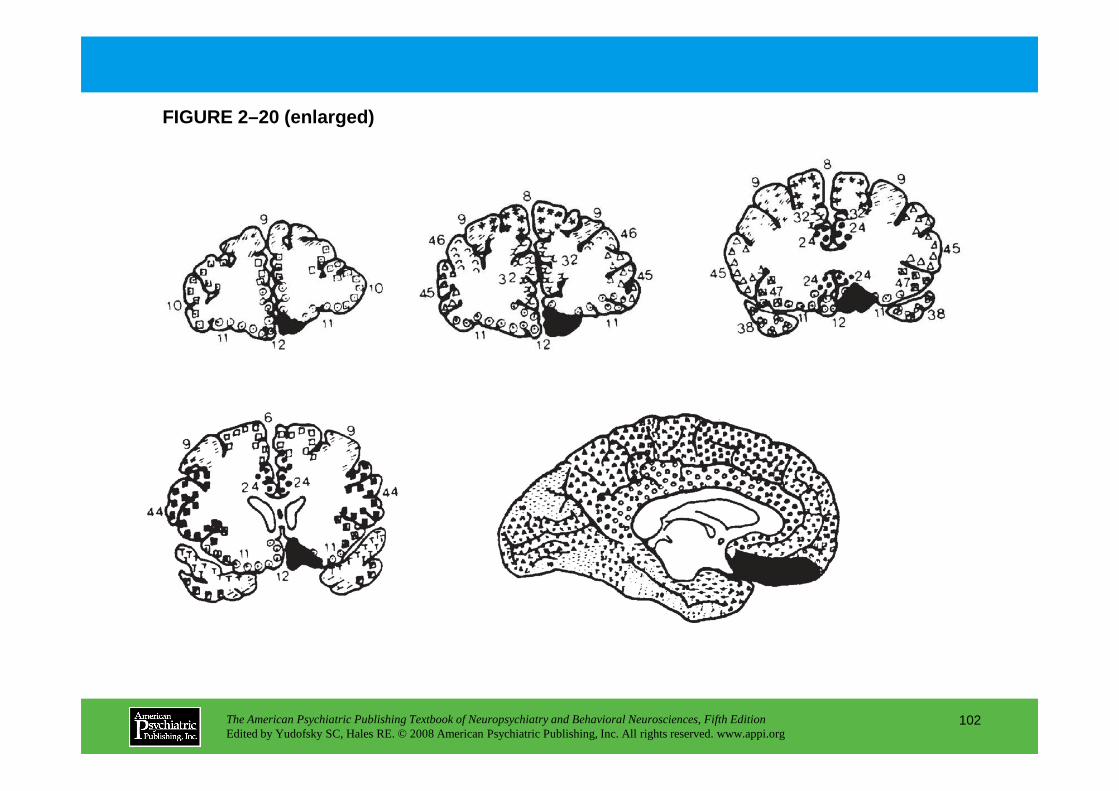
FIGURE 2–20 (enlarged)
The American Psychiatric Publishing Textbook of Neuropsychiatry and Behavioral Neurosciences, Fifth EditionEdited by Yudofsky SC, Hales RE. © 2008 American Psychiatric Publishing, Inc. All rights reserved. www.appi.org
102
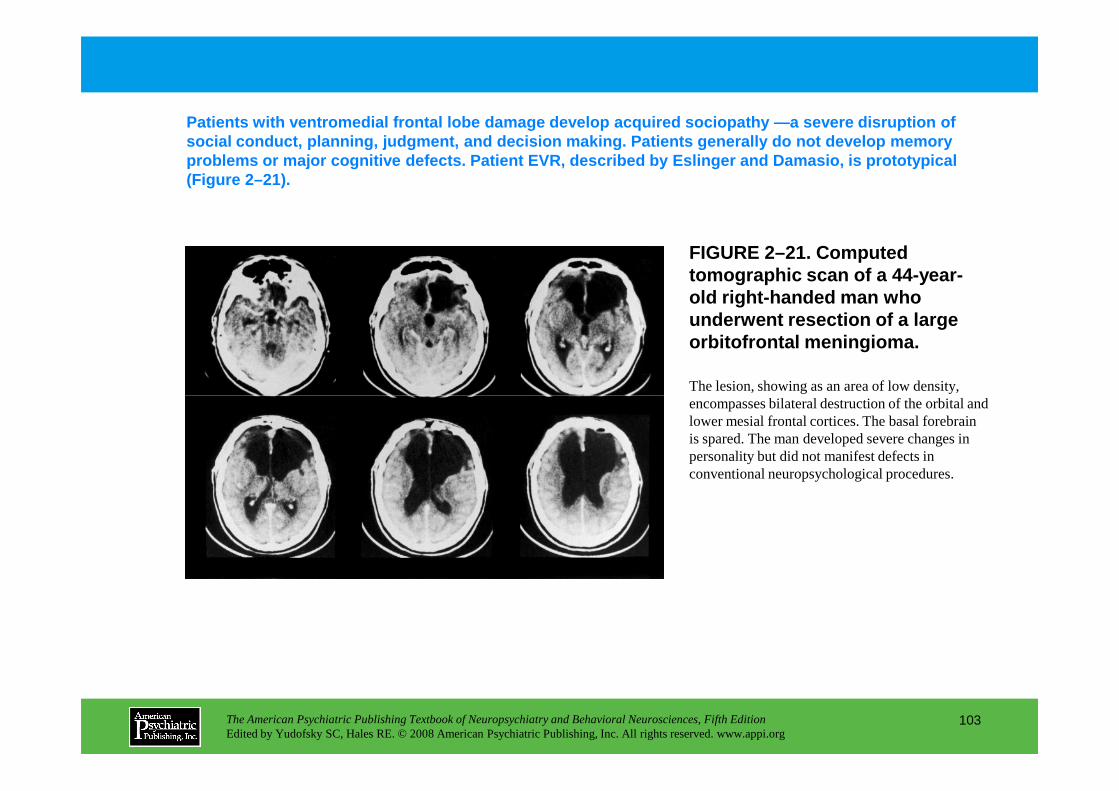
FIGURE 2–21. Computed tomographic scan of a 44-year-old right-handed man who underwent resection of a large orbitofrontal meningioma.
The lesion, showing as an area of low density, encompasses bilateral destruction of the orbital and
Patients with ventromedial frontal lobe damage deve lop acquired sociopathy —a severe disruption of social conduct, planning, judgment, and decision ma king. Patients generally do not develop memory problems or major cognitive defects. Patient EVR, d escribed by Eslinger and Damasio, is prototypical (Figure 2–21).
The American Psychiatric Publishing Textbook of Neuropsychiatry and Behavioral Neurosciences, Fifth EditionEdited by Yudofsky SC, Hales RE. © 2008 American Psychiatric Publishing, Inc. All rights reserved. www.appi.org
103
encompasses bilateral destruction of the orbital and lower mesial frontal cortices. The basal forebrain is spared. The man developed severe changes in personality but did not manifest defects in conventional neuropsychological procedures.

FIGURE 2–21 (enlarged)
The American Psychiatric Publishing Textbook of Neuropsychiatry and Behavioral Neurosciences, Fifth EditionEdited by Yudofsky SC, Hales RE. © 2008 American Psychiatric Publishing, Inc. All rights reserved. www.appi.org
104

FIGURE 2–22. T1-weighted magnetic resonance image of a 35-year-old right-handed woman who sustained a subcortical hemorrhage.
The lesion, showing as an area of black on these transverse sectional images, involves
Left-sided lesions to the structures of the basal g anglia produce a variable syndrome called atypical aphasia . Right hemiparesis is a common accompanying manife station. An MR image from a patient with a basal ganglia lesion and atypical aphasia is show n in Figure 2–22.
The American Psychiatric Publishing Textbook of Neuropsychiatry and Behavioral Neurosciences, Fifth EditionEdited by Yudofsky SC, Hales RE. © 2008 American Psychiatric Publishing, Inc. All rights reserved. www.appi.org
105
these transverse sectional images, involves the left basal ganglia, including the head and body of the caudate nucleus, and part of the putamen. The woman had a characteristic basal ganglia type of aphasia, with marked dysarthria and mixed linguistic impairments.
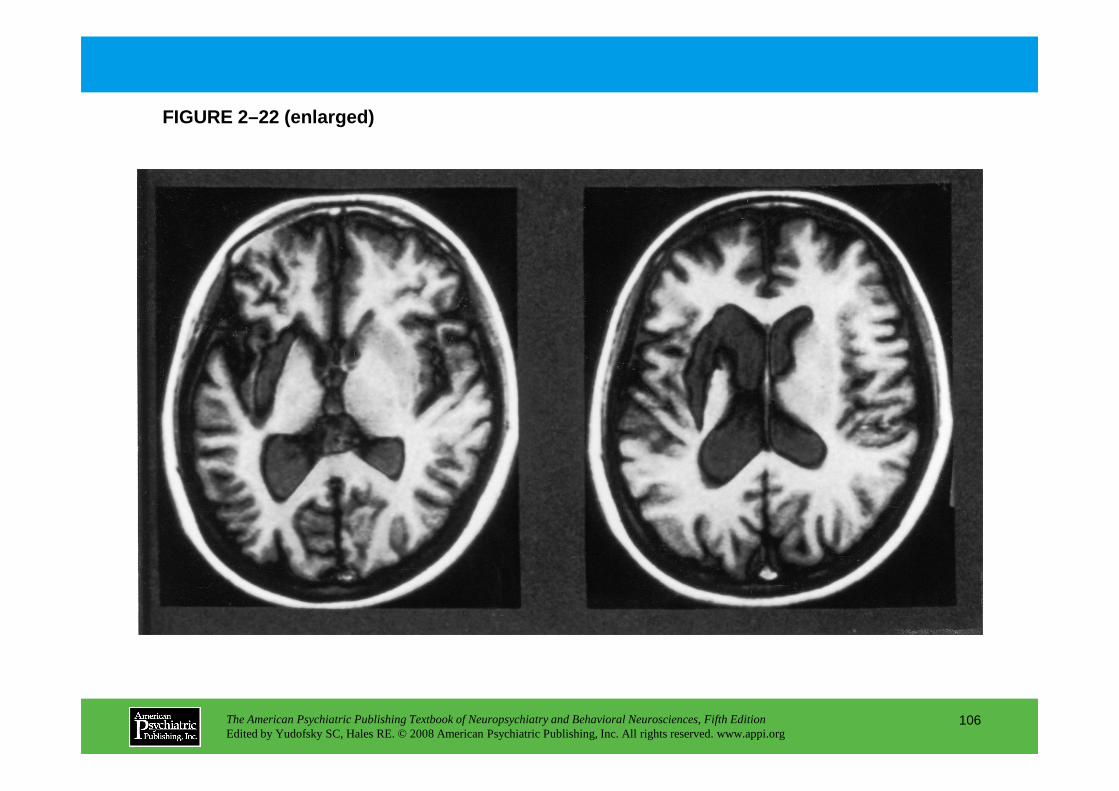
FIGURE 2–22 (enlarged)
The American Psychiatric Publishing Textbook of Neuropsychiatry and Behavioral Neurosciences, Fifth EditionEdited by Yudofsky SC, Hales RE. © 2008 American Psychiatric Publishing, Inc. All rights reserved. www.appi.org
106
Chapter 2 • Highlights for the Clinician
Neuropsychological Manifestations of Brain LesionsStructures, major subdivisions, and hemispheric side of lesion
TEMPORAL LOBES
Mesial
Left: • Anterograde amnesia for verbal material
Right: • Anterograde amnesia for nonverbal material
Bilateral: • Severe anterograde amnesia for verbal and nonverbal material
Temporal pole
Left: • Impaired retrieval of proper nouns
Right: • Impaired retrieval of concepts for unique entities
The American Psychiatric Publishing Textbook of Neuropsychiatry and Behavioral Neurosciences, Fifth EditionEdited by Yudofsky SC, Hales RE. © 2008 American Psychiatric Publishing, Inc. All rights reserved. www.appi.org
107
Right: • Impaired retrieval of concepts for unique entities
• Impaired memory for episodic and declarative knowledge
Bilateral: • Impaired retrieval of concepts and names for unique entities
• Impaired episodic memory
Inferotemporal
Left: • Impaired retrieval of common nouns
Right: • Impaired retrieval of concepts for some nonunique entities
Bilateral: • Impaired retrieval of concepts and names for some nonunique entities
(continued)

Occipitotemporal junctionLeft: • “Deep” prosopagnosia
• Impaired retrieval of concepts for some nonunique entitiesRight: • Transient or mild prosopagnosia
• Impaired retrieval of concepts for some nonunique entitiesBilateral: • Severe, permanent prosopagnosia
• Visual object agnosia
OCCIPITAL LOBESDorsalLeft: • Partial or mild Balint’s syndromeRight: • Partial or mild Balint’s syndrome
The American Psychiatric Publishing Textbook of Neuropsychiatry and Behavioral Neurosciences, Fifth EditionEdited by Yudofsky SC, Hales RE. © 2008 American Psychiatric Publishing, Inc. All rights reserved. www.appi.org
108
Right: • Partial or mild Balint’s syndromeBilateral: • Balint’s syndrome (visual disorientation, ocular apraxia, optic ataxia)
• Defective motion perception• Astereopsis
VentralLeft: • Right hemiachromatopsia
• “Pure” alexia• Impaired mental imagery
Right: • Left hemiachromatopsia• Apperceptive visual agnosia• Defective facial imagery
(continued)
Bilateral: • Full-field achromatopsia• Visual object agnosia• Impaired mental imagery• Prosopagnosia
PARIETAL LOBESTemporoparietal junction Left: • Wernicke’s aphasiaRight: • Amusia
• Defective music recognition• “Phonagnosia”
The American Psychiatric Publishing Textbook of Neuropsychiatry and Behavioral Neurosciences, Fifth EditionEdited by Yudofsky SC, Hales RE. © 2008 American Psychiatric Publishing, Inc. All rights reserved. www.appi.org
109
• “Phonagnosia”Bilateral: • Auditory agnosia
Inferior parietal lobuleLeft: • Conduction aphasia
• Tactile object agnosia• Acalculia
Right: • Neglect• Anosognosia• Anosodiaphoria• Tactile object agnosia
(continued)

Bilateral: • Body schema disturbances• Anosognosia• Anosodiaphoria
FRONTAL LOBESFrontal operculumLeft: • Broca's aphasia
• Defective retrieval of words for actions (verbs)Right: • “Expressive” aprosodyBilateral: • Broca’s aphasia
• Defective retrieval of words for actions (verbs)
The American Psychiatric Publishing Textbook of Neuropsychiatry and Behavioral Neurosciences, Fifth EditionEdited by Yudofsky SC, Hales RE. © 2008 American Psychiatric Publishing, Inc. All rights reserved. www.appi.org
110
• Defective retrieval of words for actions (verbs)
Superior mesial regionLeft: • Akinetic mutismRight: • Akinetic mutismBilateral: • Severe akinetic mutism
Basal forebrain (inferior mesial region)Left: • Anterograde and retrograde amnesia with confabulation (worse for verbal stimuli)Right: • Anterograde and retrograde amnesia with confabulation (worse for nonverbal stimuli)Bilateral: • Anterograde and retrograde amnesia with confabulation for verbal and nonverbal stimuli
(continued)
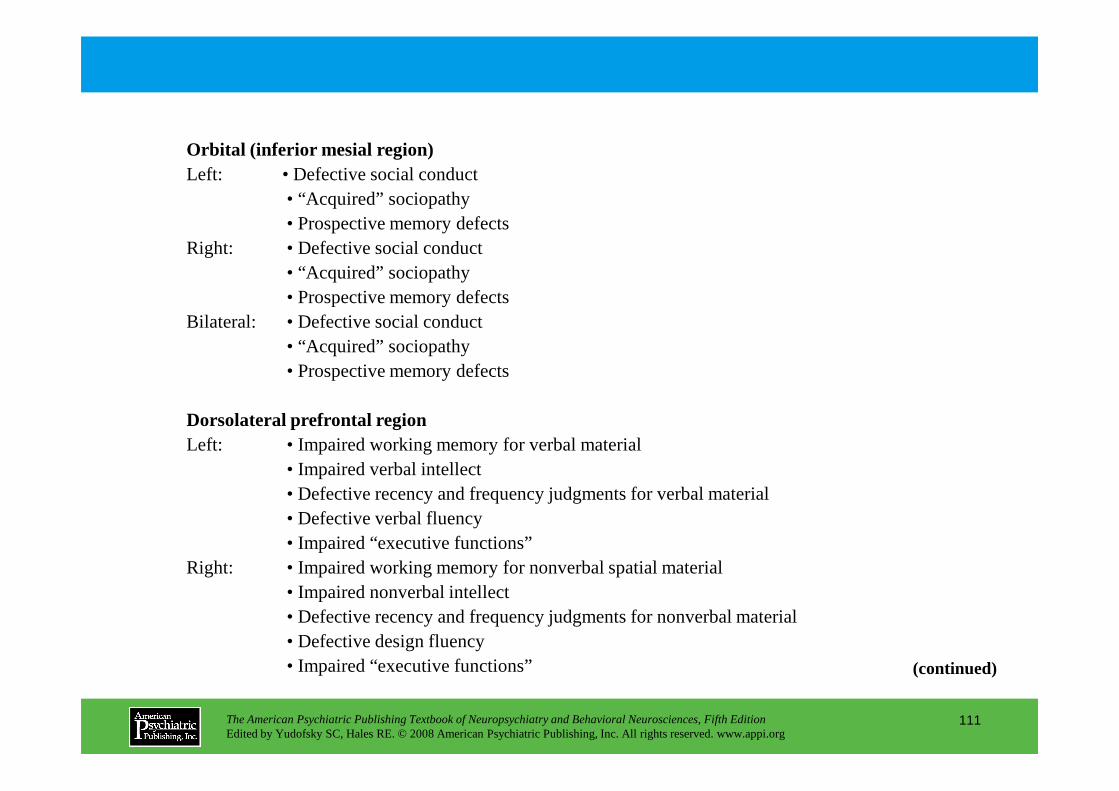
Orbital (inferior mesial region)Left: • Defective social conduct
• “Acquired” sociopathy• Prospective memory defects
Right: • Defective social conduct• “Acquired” sociopathy• Prospective memory defects
Bilateral: • Defective social conduct• “Acquired” sociopathy• Prospective memory defects
The American Psychiatric Publishing Textbook of Neuropsychiatry and Behavioral Neurosciences, Fifth EditionEdited by Yudofsky SC, Hales RE. © 2008 American Psychiatric Publishing, Inc. All rights reserved. www.appi.org
111
Dorsolateral prefrontal regionLeft: • Impaired working memory for verbal material
• Impaired verbal intellect• Defective recency and frequency judgments for verbal material• Defective verbal fluency• Impaired “executive functions”
Right: • Impaired working memory for nonverbal spatial material• Impaired nonverbal intellect• Defective recency and frequency judgments for nonverbal material• Defective design fluency• Impaired “executive functions” (continued)
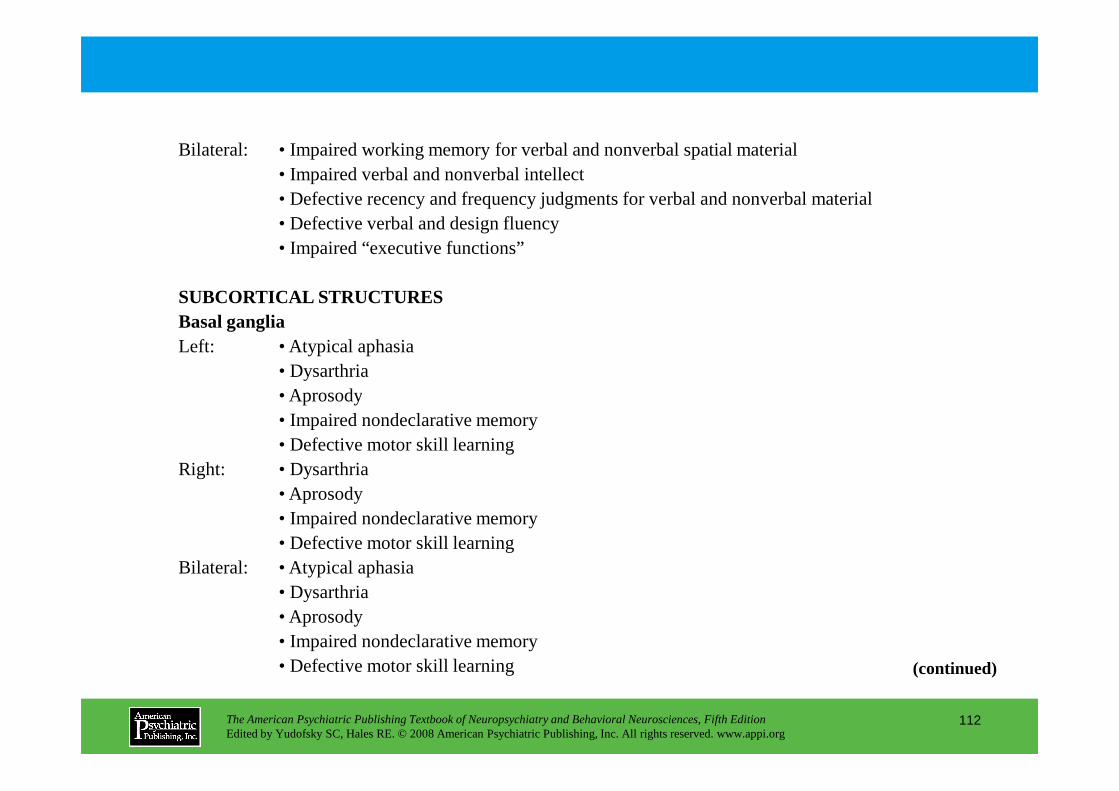
Bilateral: • Impaired working memory for verbal and nonverbal spatial material• Impaired verbal and nonverbal intellect• Defective recency and frequency judgments for verbal and nonverbal material• Defective verbal and design fluency• Impaired “executive functions”
SUBCORTICAL STRUCTURESBasal gangliaLeft: • Atypical aphasia
• Dysarthria• Aprosody
The American Psychiatric Publishing Textbook of Neuropsychiatry and Behavioral Neurosciences, Fifth EditionEdited by Yudofsky SC, Hales RE. © 2008 American Psychiatric Publishing, Inc. All rights reserved. www.appi.org
112
• Aprosody• Impaired nondeclarative memory• Defective motor skill learning
Right: • Dysarthria• Aprosody• Impaired nondeclarative memory• Defective motor skill learning
Bilateral: • Atypical aphasia• Dysarthria• Aprosody• Impaired nondeclarative memory• Defective motor skill learning (continued)

ThalamusLeft: • Thalamic aphasia
• Anterograde amnesia with confabulation• Retrograde amnesia with temporal gradient• Impairments in “executive functions”• Attention or concentration defects
Right: • Anterograde amnesia with confabulation• Retrograde amnesia with temporal gradient• Impairments in “executive functions”• Attention or concentration defects
Bilateral: • Thalamic aphasia
The American Psychiatric Publishing Textbook of Neuropsychiatry and Behavioral Neurosciences, Fifth EditionEdited by Yudofsky SC, Hales RE. © 2008 American Psychiatric Publishing, Inc. All rights reserved. www.appi.org
113
Bilateral: • Thalamic aphasia• Anterograde amnesia with confabulation• Retrograde amnesia with temporal gradient• Impairments in “executive functions”• Attention or concentration defects
CHAPTER 3
NERVOUS, ENDOCRINE, AND IMMUNE SYSTEM INTERACTIONS
IN PSYCHIATRY
Oyetunde O. Alagbe, M.D.Dwight L. Evans, M.D.Andrew H. Miller, M.D.
The American Psychiatric Publishing Textbook of Neuropsychiatry and Behavioral Neurosciences, Fifth EditionEdited by Yudofsky SC, Hales RE. © 2008 American Psychiatric Publishing, Inc. All rights reserved. www.appi.org
114
Slide Show
Topic headings and reading list
Tables and figures
Highlights for the clinician
Main menu
(About, Contents, Contributors, Publishing facts)
Andrew H. Miller, M.D.
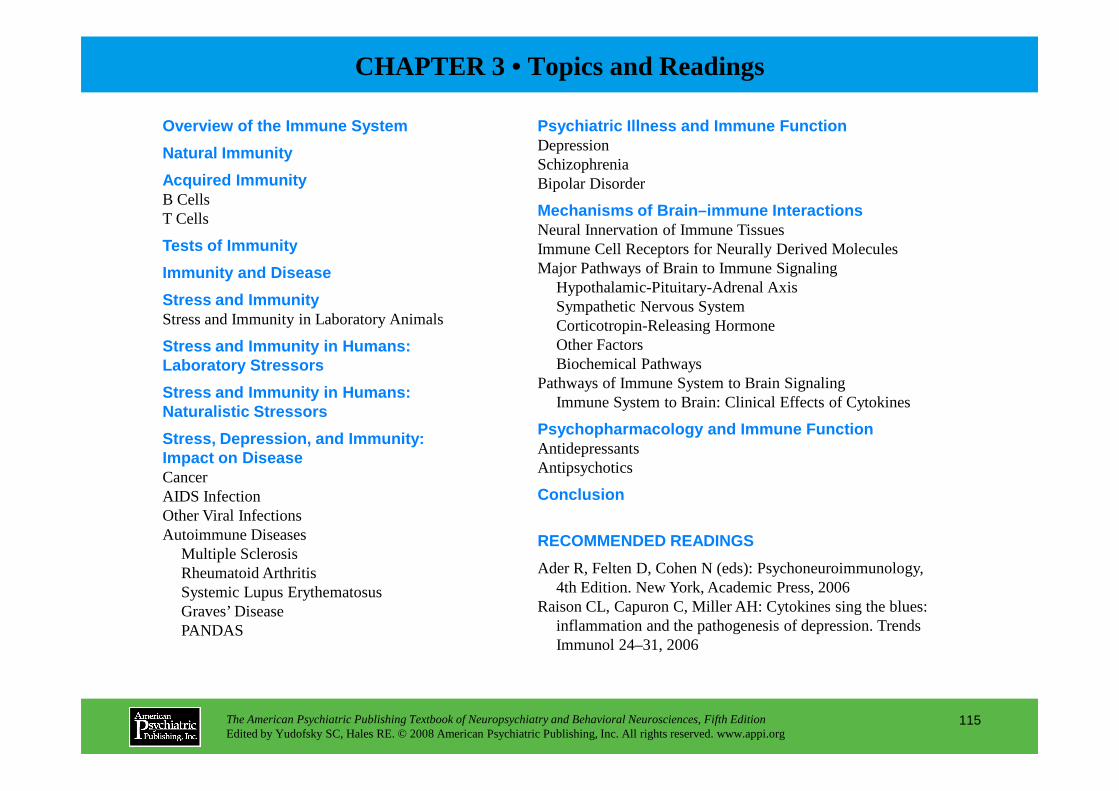
Overview of the Immune System
Natural Immunity
Acquired ImmunityB CellsT Cells
Tests of Immunity
Immunity and Disease
Stress and ImmunityStress and Immunity in Laboratory Animals
Stress and Immunity in Humans: Laboratory Stressors
Stress and Immunity in Humans:
Psychiatric Illness and Immune FunctionDepressionSchizophreniaBipolar Disorder
Mechanisms of Brain–immune InteractionsNeural Innervation of Immune TissuesImmune Cell Receptors for Neurally Derived MoleculesMajor Pathways of Brain to Immune Signaling
Hypothalamic-Pituitary-Adrenal AxisSympathetic Nervous SystemCorticotropin-Releasing HormoneOther FactorsBiochemical Pathways
Pathways of Immune System to Brain SignalingImmune System to Brain: Clinical Effects of Cytokines
CHAPTER 3 • Topics and Readings
The American Psychiatric Publishing Textbook of Neuropsychiatry and Behavioral Neurosciences, Fifth EditionEdited by Yudofsky SC, Hales RE. © 2008 American Psychiatric Publishing, Inc. All rights reserved. www.appi.org
115
Stress and Immunity in Humans: Naturalistic Stressors
Stress, Depression, and Immunity: Impact on DiseaseCancerAIDS InfectionOther Viral InfectionsAutoimmune Diseases
Multiple SclerosisRheumatoid ArthritisSystemic Lupus ErythematosusGraves’ DiseasePANDAS
Immune System to Brain: Clinical Effects of Cytokines
Psychopharmacology and Immune FunctionAntidepressantsAntipsychotics
Conclusion
RECOMMENDED READINGS
Ader R, Felten D, Cohen N (eds): Psychoneuroimmunology, 4th Edition. New York, Academic Press, 2006
Raison CL, Capuron C, Miller AH: Cytokines sing the blues: inflammation and the pathogenesis of depression. Trends Immunol 24–31, 2006
CHAPTER 3 • Tables and Figures
Table 3–1. Representative cytokines and their function
Table 3–2. Features of innate and acquired immunity
Figure 3–1. Innate immunity
Figure 3–2. Processes of acquired immunity
Table 3–3. Stress-induced changes in immune function: studies in laboratory animals
Table 3–4. Stress-induced changes in immune function: human studies
Table 3–5. Summary of immune changes in major depression
Table 3–6. Summary of immune changes in schizophrenia
Figure 3–3. Sympathetic nervous system innervation of lymphoid tissue
The American Psychiatric Publishing Textbook of Neuropsychiatry and Behavioral Neurosciences, Fifth EditionEdited by Yudofsky SC, Hales RE. © 2008 American Psychiatric Publishing, Inc. All rights reserved. www.appi.org
116
Figure 3–3. Sympathetic nervous system innervation of lymphoid tissue
Table 3–7. Receptors expressed on immune cells for neurotransmitters, hormones, and peptides
Figure 3–4. Neuroendocrine mechanisms by which the brain influences the immune system
Figure 3–5. Bidirectional interactions between the immune system and brain
Table 3–8. Mechanisms by which cytokines signal the brain
Figure 3–6. Potential mechanisms by which cytokines cause sickness behavior/depression
Table 3–9. Therapeutic uses of cytokines
Summary Highlights for the Clinician
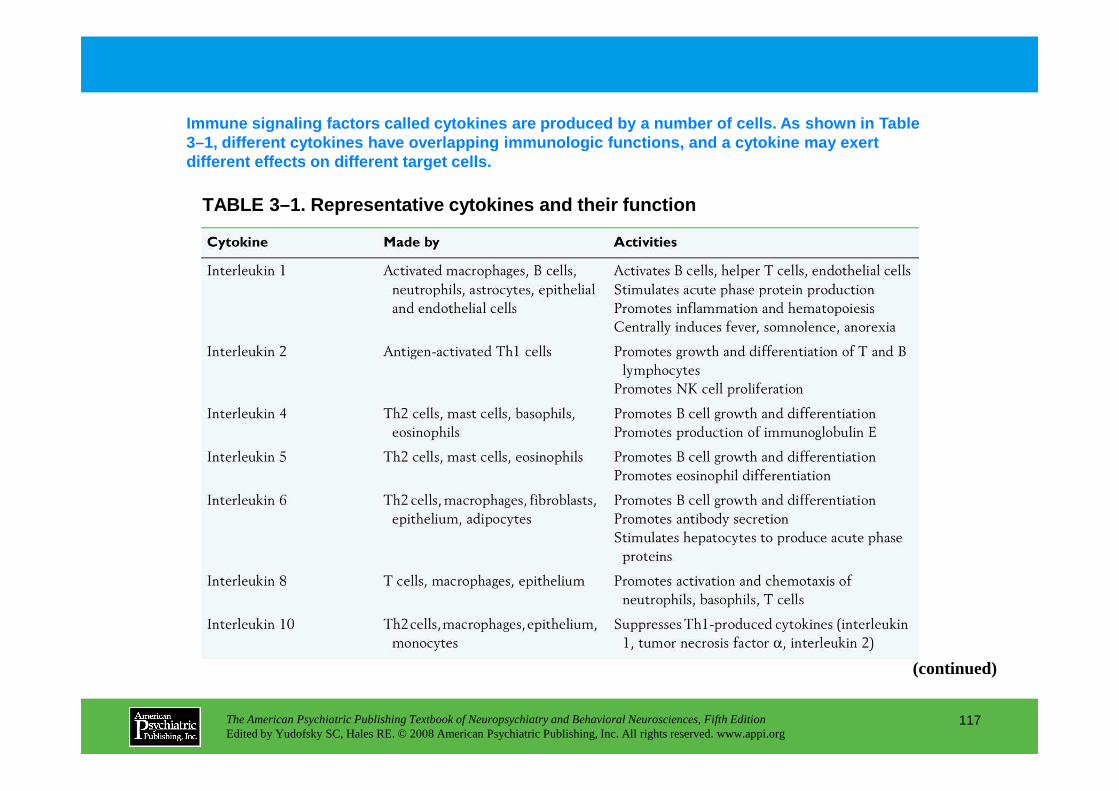
TABLE 3–1. Representative cytokines and their funct ion
Immune signaling factors called cytokines are produ ced by a number of cells. As shown in Table 3–1, different cytokines have overlapping immunolog ic functions, and a cytokine may exert different effects on different target cells.
The American Psychiatric Publishing Textbook of Neuropsychiatry and Behavioral Neurosciences, Fifth EditionEdited by Yudofsky SC, Hales RE. © 2008 American Psychiatric Publishing, Inc. All rights reserved. www.appi.org
117
(continued)

TABLE 3–1 (continued)
The American Psychiatric Publishing Textbook of Neuropsychiatry and Behavioral Neurosciences, Fifth EditionEdited by Yudofsky SC, Hales RE. © 2008 American Psychiatric Publishing, Inc. All rights reserved. www.appi.org
118

TABLE 3–2. Features of innate and acquired immunity
The immune system may be divided into two functiona l arms: natural (innate) immunity and specific (acquired) immunity. Their features are summarized i n Table 3–2.
The American Psychiatric Publishing Textbook of Neuropsychiatry and Behavioral Neurosciences, Fifth EditionEdited by Yudofsky SC, Hales RE. © 2008 American Psychiatric Publishing, Inc. All rights reserved. www.appi.org
119

FIGURE 3–1. Innate immunity.
Early in the process of infection or inflammation, proinflammatory cytokines are produced, along with chemokines that attract other cell types. All of th ese cell types are involved in amplifying early inn ate immune responses, as shown in Figure 3–1.
Activated macrophages release cytokines at the site of tissue injury or infection. Locally, these cytokines act on endothelial and tissue stromal cells. Tissue stromal cells produce chemotactic factors, recruiting other immune cells to the site of injury. The endothelial cells produce adhesion molecules, enhancing immune cell margination and diapedesis. In the brain, proinflammatory cytokines—including interleukin 1 (IL-1), IL-6, and tumor necrosis factor α (TNF-α)—activate the hypothalamic-pituitary-
The American Psychiatric Publishing Textbook of Neuropsychiatry and Behavioral Neurosciences, Fifth EditionEdited by Yudofsky SC, Hales RE. © 2008 American Psychiatric Publishing, Inc. All rights reserved. www.appi.org
120
factor α (TNF-α)—activate the hypothalamic-pituitary-adrenal (HPA) axis and induce sickness behavior and fever. The proinflammatory cytokines also induce the liver to produce acute-phase proteins.
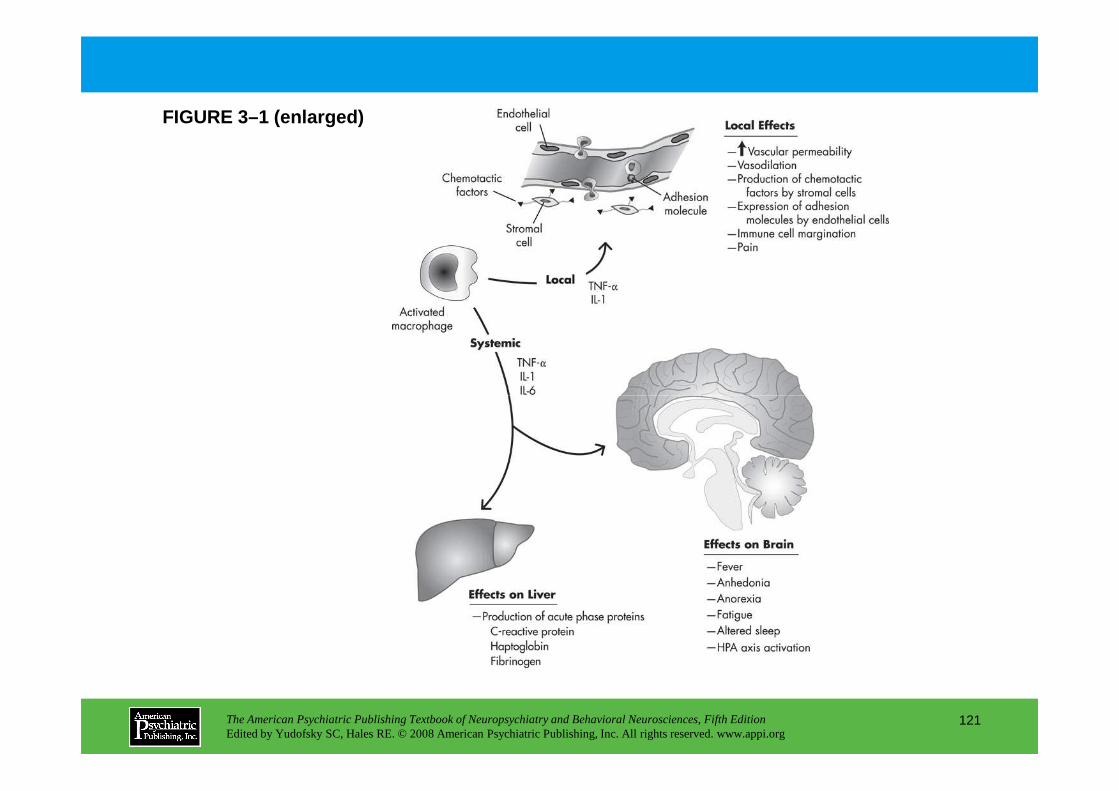
FIGURE 3–1 (enlarged)
The American Psychiatric Publishing Textbook of Neuropsychiatry and Behavioral Neurosciences, Fifth EditionEdited by Yudofsky SC, Hales RE. © 2008 American Psychiatric Publishing, Inc. All rights reserved. www.appi.org
121
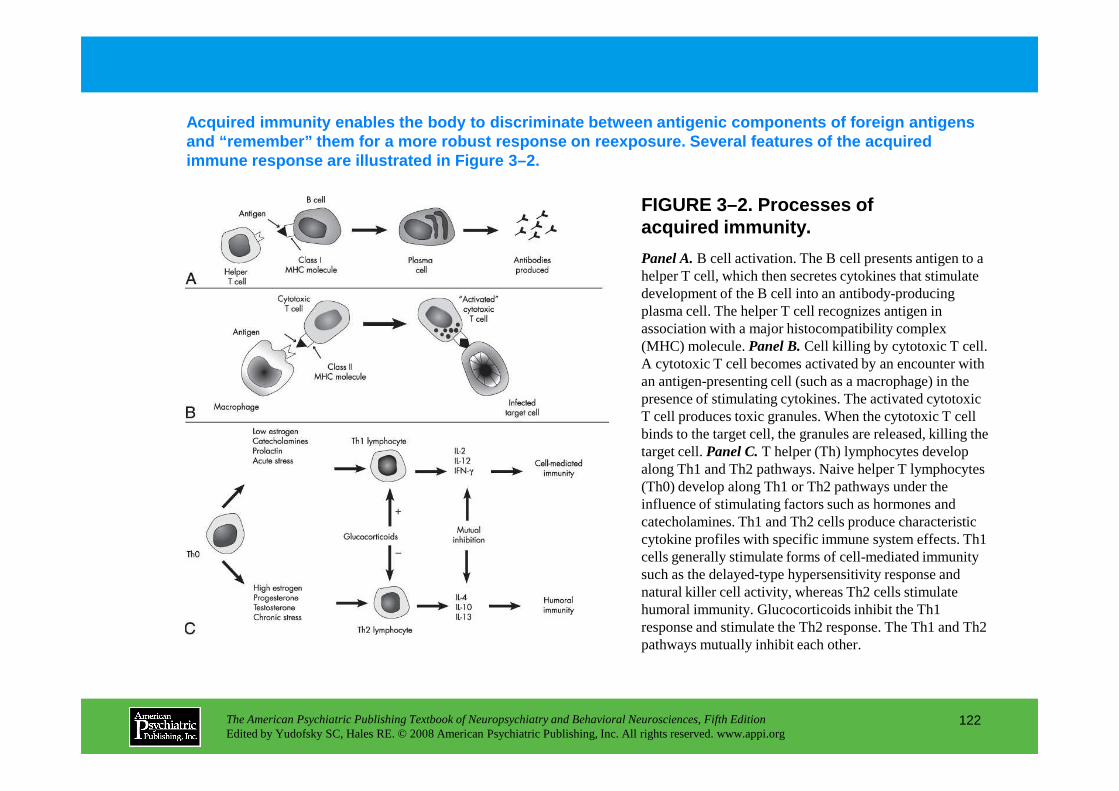
FIGURE 3–2. Processes of acquired immunity.
Acquired immunity enables the body to discriminate between antigenic components of foreign antigens and “remember” them for a more robust response on ree xposure. Several features of the acquired immune response are illustrated in Figure 3–2.
Panel A.B cell activation. The B cell presents antigen to a helper T cell, which then secretes cytokines that stimulate development of the B cell into an antibody-producing plasma cell. The helper T cell recognizes antigen in association with a major histocompatibility complex (MHC) molecule. Panel B.Cell killing by cytotoxic T cell. A cytotoxic T cell becomes activated by an encounter with an antigen-presenting cell (such as a macrophage) in the presence of stimulating cytokines. The activated cytotoxic
The American Psychiatric Publishing Textbook of Neuropsychiatry and Behavioral Neurosciences, Fifth EditionEdited by Yudofsky SC, Hales RE. © 2008 American Psychiatric Publishing, Inc. All rights reserved. www.appi.org
122
presence of stimulating cytokines. The activated cytotoxic T cell produces toxic granules. When the cytotoxic T cell binds to the target cell, the granules are released, killing the target cell. Panel C.T helper (Th) lymphocytes develop along Th1 and Th2 pathways. Naive helper T lymphocytes (Th0) develop along Th1 or Th2 pathways under the influence of stimulating factors such as hormones and catecholamines. Th1 and Th2 cells produce characteristic cytokine profiles with specific immune system effects. Th1 cells generally stimulate forms of cell-mediated immunity such as the delayed-type hypersensitivity response and natural killer cell activity, whereas Th2 cells stimulate humoral immunity. Glucocorticoids inhibit the Th1 response and stimulate the Th2 response. The Th1 and Th2 pathways mutually inhibit each other.

FIGURE 3–2 (enlarged)
The American Psychiatric Publishing Textbook of Neuropsychiatry and Behavioral Neurosciences, Fifth EditionEdited by Yudofsky SC, Hales RE. © 2008 American Psychiatric Publishing, Inc. All rights reserved. www.appi.org
123

Table 3–3 summarizes immune changes in laboratory animals in response to stress. Early studies exposed laboratory animals to various stressors and measured disease susceptibility. More recent work suggests that innate immune responses may be activated by both acute and chronic stress.
TABLE 3–3. Stress-induced changes in immune function: studies in laboratory animals
The American Psychiatric Publishing Textbook of Neuropsychiatry and Behavioral Neurosciences, Fifth EditionEdited by Yudofsky SC, Hales RE. © 2008 American Psychiatric Publishing, Inc. All rights reserved. www.appi.org
124
(continued)
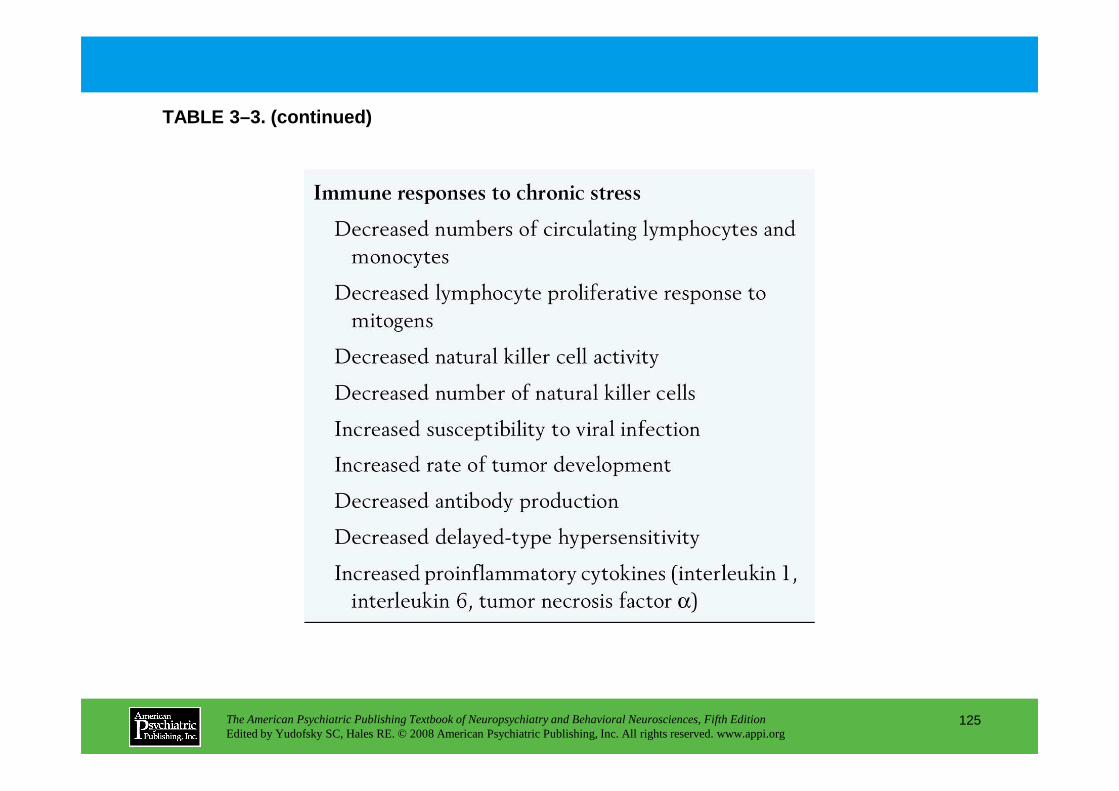
TABLE 3–3. (continued)
The American Psychiatric Publishing Textbook of Neuropsychiatry and Behavioral Neurosciences, Fifth EditionEdited by Yudofsky SC, Hales RE. © 2008 American Psychiatric Publishing, Inc. All rights reserved. www.appi.org
125
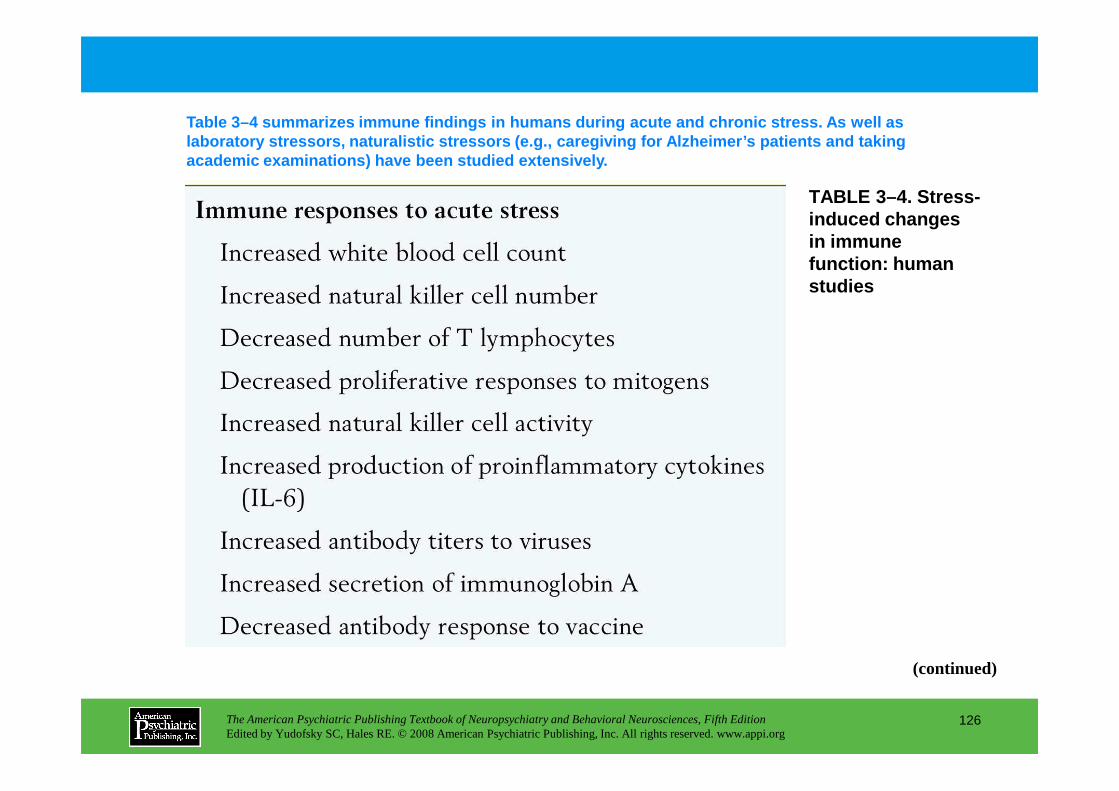
TABLE 3–4. Stress-induced changes in immune function: human studies
Table 3–4 summarizes immune findings in humans durin g acute and chronic stress. As well as laboratory stressors, naturalistic stressors (e.g., caregiving for Alzheimer’s patients and taking academic examinations) have been studied extensivel y.
The American Psychiatric Publishing Textbook of Neuropsychiatry and Behavioral Neurosciences, Fifth EditionEdited by Yudofsky SC, Hales RE. © 2008 American Psychiatric Publishing, Inc. All rights reserved. www.appi.org
126
(continued)
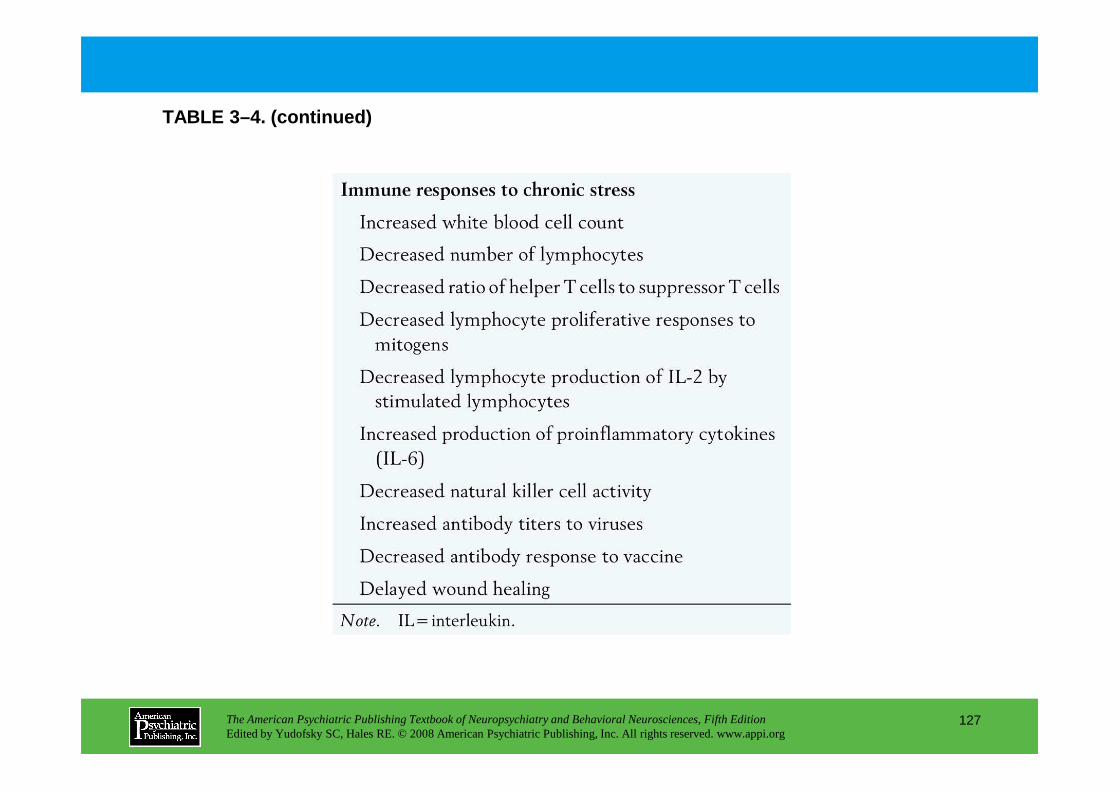
TABLE 3–4. (continued)
The American Psychiatric Publishing Textbook of Neuropsychiatry and Behavioral Neurosciences, Fifth EditionEdited by Yudofsky SC, Hales RE. © 2008 American Psychiatric Publishing, Inc. All rights reserved. www.appi.org
127
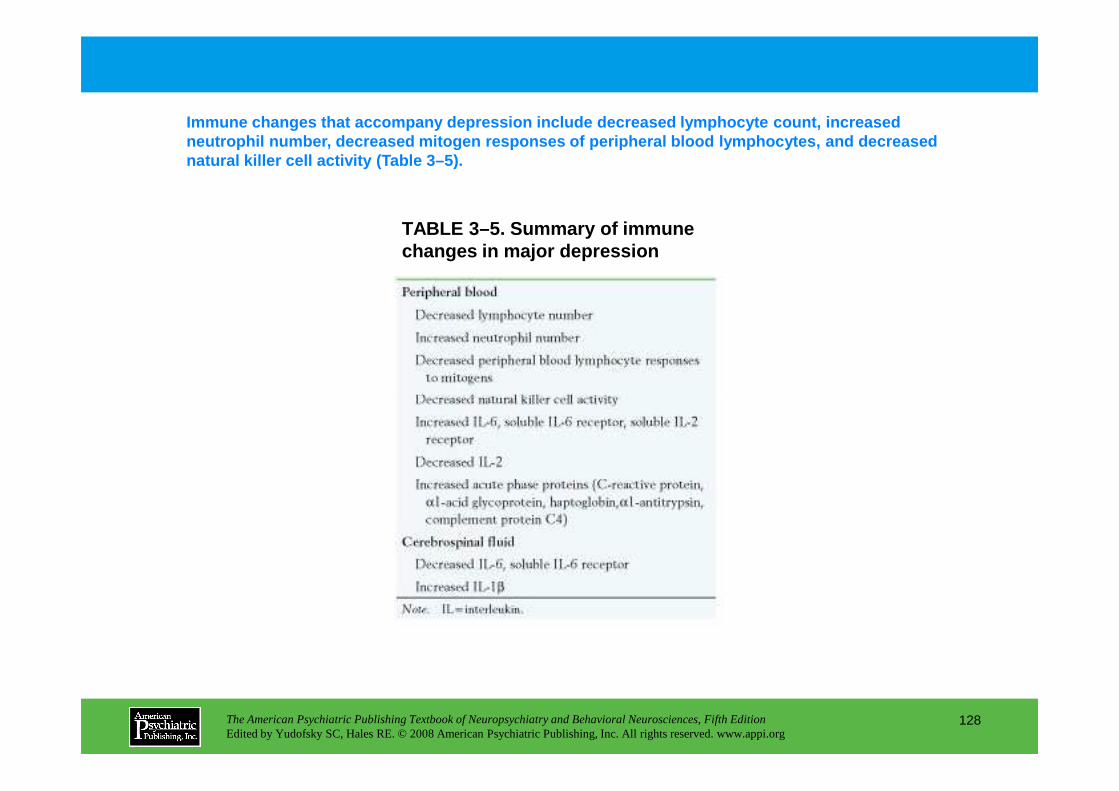
TABLE 3–5. Summary of immune changes in major depression
Immune changes that accompany depression include de creased lymphocyte count, increased neutrophil number, decreased mitogen responses of p eripheral blood lymphocytes, and decreased natural killer cell activity (Table 3–5).
The American Psychiatric Publishing Textbook of Neuropsychiatry and Behavioral Neurosciences, Fifth EditionEdited by Yudofsky SC, Hales RE. © 2008 American Psychiatric Publishing, Inc. All rights reserved. www.appi.org
128
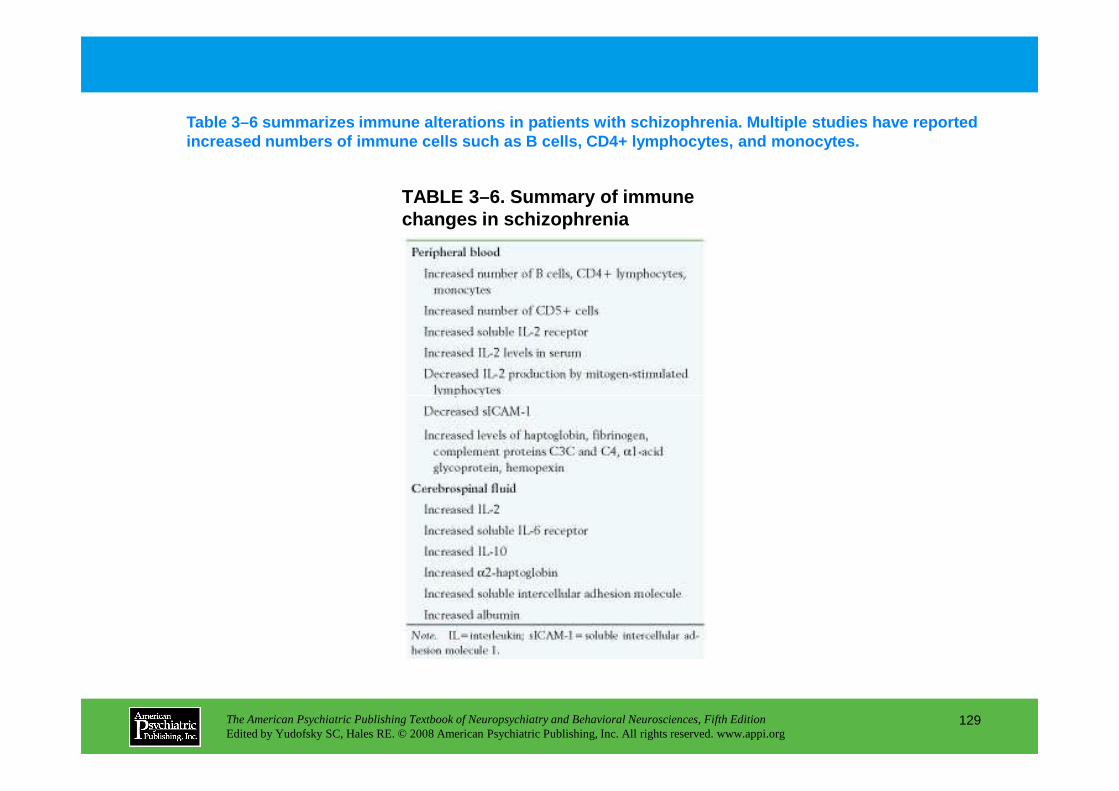
TABLE 3–6. Summary of immune changes in schizophrenia
Table 3–6 summarizes immune alterations in patients with schizophrenia. Multiple studies have reported increased numbers of immune cells such as B cells, CD4+ lymphocytes, and monocytes.
The American Psychiatric Publishing Textbook of Neuropsychiatry and Behavioral Neurosciences, Fifth EditionEdited by Yudofsky SC, Hales RE. © 2008 American Psychiatric Publishing, Inc. All rights reserved. www.appi.org
129
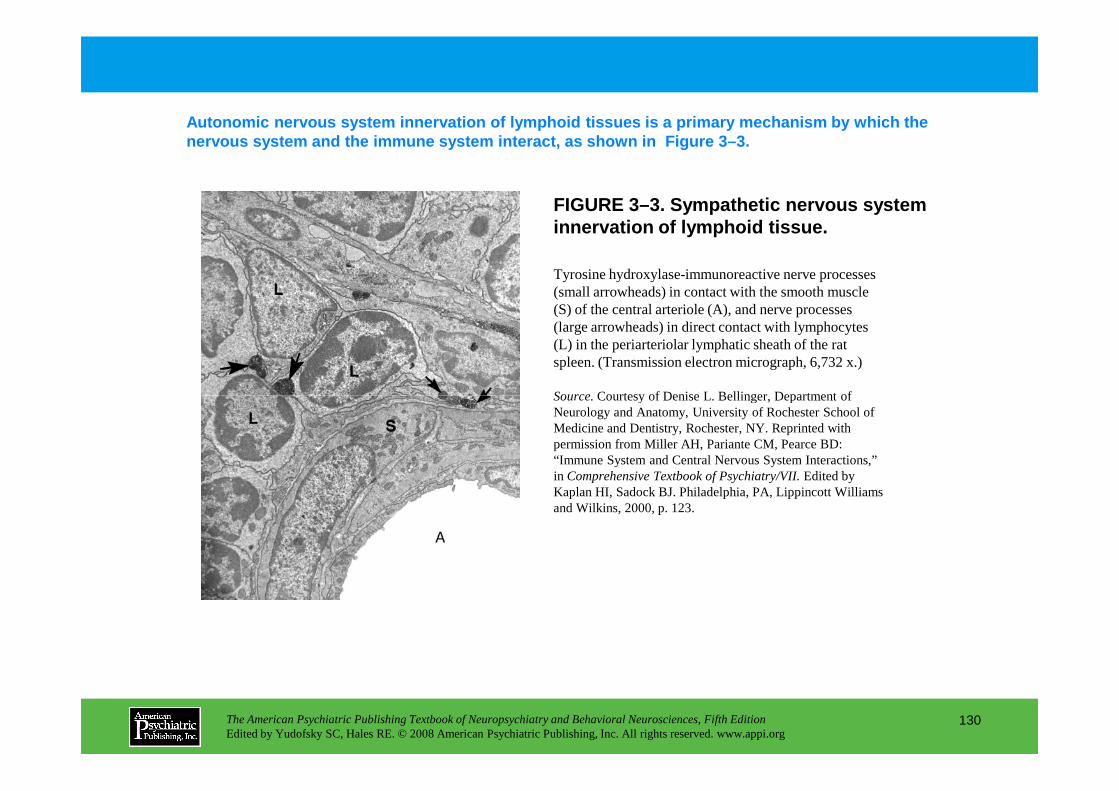
FIGURE 3–3. Sympathetic nervous system innervation of lymphoid tissue.
Autonomic nervous system innervation of lymphoid ti ssues is a primary mechanism by which the nervous system and the immune system interact, as s hown in Figure 3–3.
Tyrosine hydroxylase-immunoreactive nerve processes (small arrowheads) in contact with the smooth muscle (S) of the central arteriole (A), and nerve processes (large arrowheads) in direct contact with lymphocytes (L) in the periarteriolar lymphatic sheath of the rat spleen. (Transmission electron micrograph, 6,732 x.)
Source.Courtesy of Denise L. Bellinger, Department of
The American Psychiatric Publishing Textbook of Neuropsychiatry and Behavioral Neurosciences, Fifth EditionEdited by Yudofsky SC, Hales RE. © 2008 American Psychiatric Publishing, Inc. All rights reserved. www.appi.org
130
Source.Courtesy of Denise L. Bellinger, Department of Neurology and Anatomy, University of Rochester School of Medicine and Dentistry, Rochester, NY. Reprinted with permission from Miller AH, Pariante CM, Pearce BD: “Immune System and Central Nervous System Interactions,” in Comprehensive Textbook of Psychiatry/VII.Edited by Kaplan HI, Sadock BJ. Philadelphia, PA, Lippincott Williams and Wilkins, 2000, p. 123.

TABLE 3–7. Receptors expressed on immune cells for neurotransmitters, hormones, and peptides
Cells of the immune system express receptors for va rious molecules regulated or produced by the nervous system. Receptors for virtually all of the major neurotransmitters, hormones, and neuropeptides have been characterized on immune cell s (Table 3–7).
The American Psychiatric Publishing Textbook of Neuropsychiatry and Behavioral Neurosciences, Fifth EditionEdited by Yudofsky SC, Hales RE. © 2008 American Psychiatric Publishing, Inc. All rights reserved. www.appi.org
131
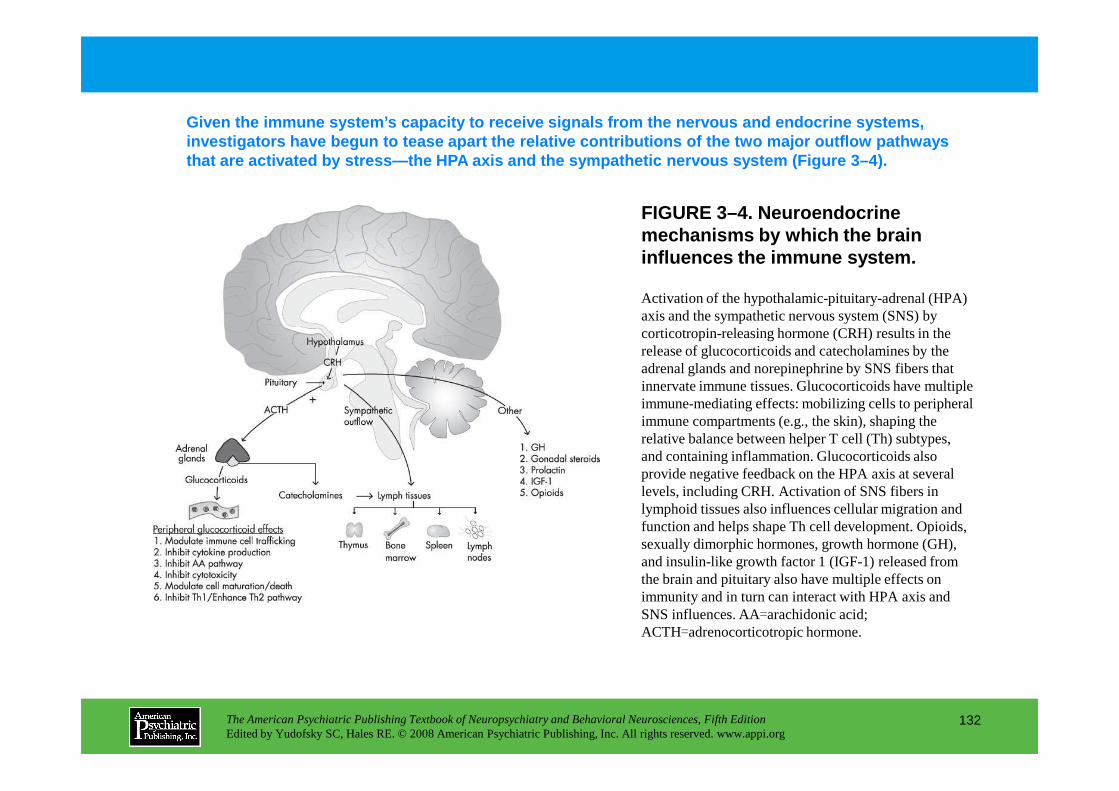
FIGURE 3–4. Neuroendocrine mechanisms by which the brain influences the immune system.
Given the immune system’s capacity to receive signa ls from the nervous and endocrine systems, investigators have begun to tease apart the relativ e contributions of the two major outflow pathways that are activated by stress—the HPA axis and the sy mpathetic nervous system (Figure 3–4).
Activation of the hypothalamic-pituitary-adrenal (HPA) axis and the sympathetic nervous system (SNS) by corticotropin-releasing hormone (CRH) results in the release of glucocorticoids and catecholamines by the adrenal glands and norepinephrine by SNS fibers that innervate immune tissues. Glucocorticoids have multiple immune-mediating effects: mobilizing cells to peripheral
The American Psychiatric Publishing Textbook of Neuropsychiatry and Behavioral Neurosciences, Fifth EditionEdited by Yudofsky SC, Hales RE. © 2008 American Psychiatric Publishing, Inc. All rights reserved. www.appi.org
132
immune-mediating effects: mobilizing cells to peripheral immune compartments (e.g., the skin), shaping the relative balance between helper T cell (Th) subtypes, and containing inflammation. Glucocorticoids also provide negative feedback on the HPA axis at several levels, including CRH. Activation of SNS fibers in lymphoid tissues also influences cellular migration and function and helps shape Th cell development. Opioids, sexually dimorphic hormones, growth hormone (GH), and insulin-like growth factor 1 (IGF-1) released from the brain and pituitary also have multiple effects on immunity and in turn can interact with HPA axis and SNS influences. AA=arachidonic acid; ACTH=adrenocorticotropic hormone.
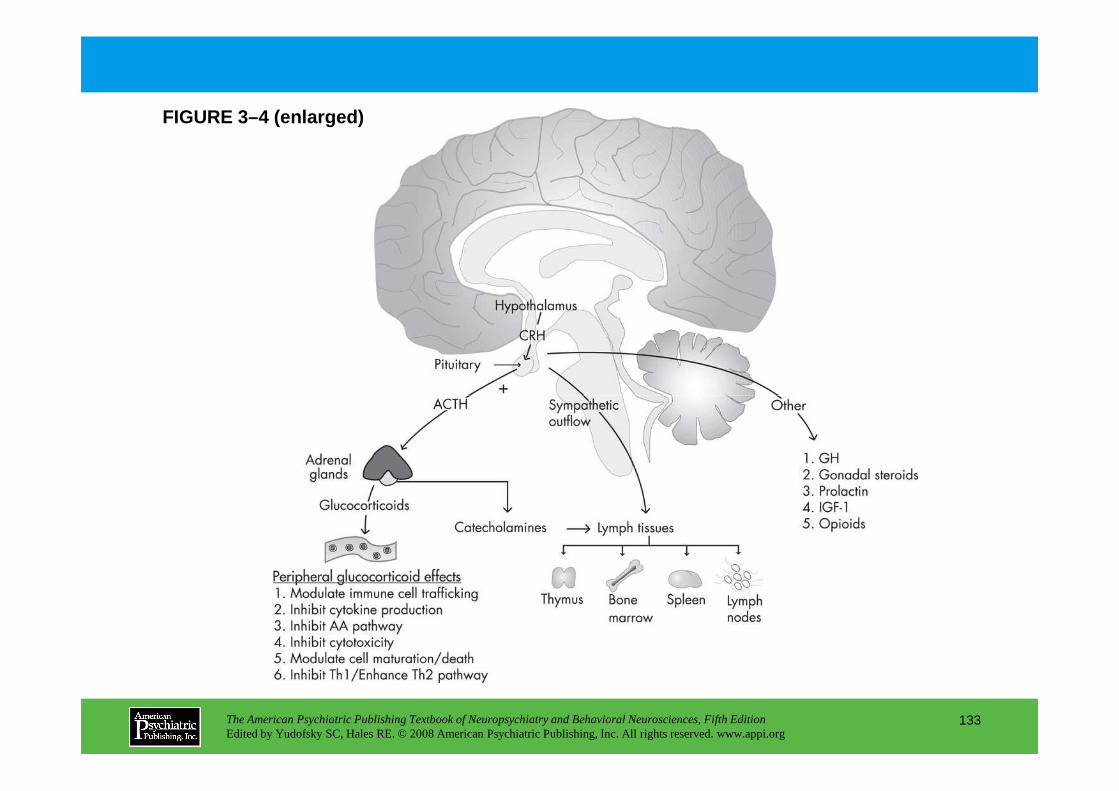
FIGURE 3–4 (enlarged)
The American Psychiatric Publishing Textbook of Neuropsychiatry and Behavioral Neurosciences, Fifth EditionEdited by Yudofsky SC, Hales RE. © 2008 American Psychiatric Publishing, Inc. All rights reserved. www.appi.org
133

FIGURE 3–5. Bidirectional interactions between the immune system and brain.
Figure 3–5 presents an overview of feedback pathway s among the HPA axis, the sympathetic nervous system, and the immune system.
Immune cells produce cytokines, which stimulate the hypothalamic-pituitary-adrenal (HPA) axis at both the hypothalamus and pituitary. HPA activation results in glucocorticoid release by the adrenal glands via stimulation of pituitary adrenocorticotropic hormone
The American Psychiatric Publishing Textbook of Neuropsychiatry and Behavioral Neurosciences, Fifth EditionEdited by Yudofsky SC, Hales RE. © 2008 American Psychiatric Publishing, Inc. All rights reserved. www.appi.org
134
pituitary adrenocorticotropic hormone (ACTH). Glucocorticoids, in turn, provide negative feedback to the HPA axis and generally inhibit inflammation. Sympathetic nervous system (SNS) outflow—particularly to lymph tissues such as spleen, bone marrow, and lymph nodes—has a variety of effects on immune cell trafficking and function.
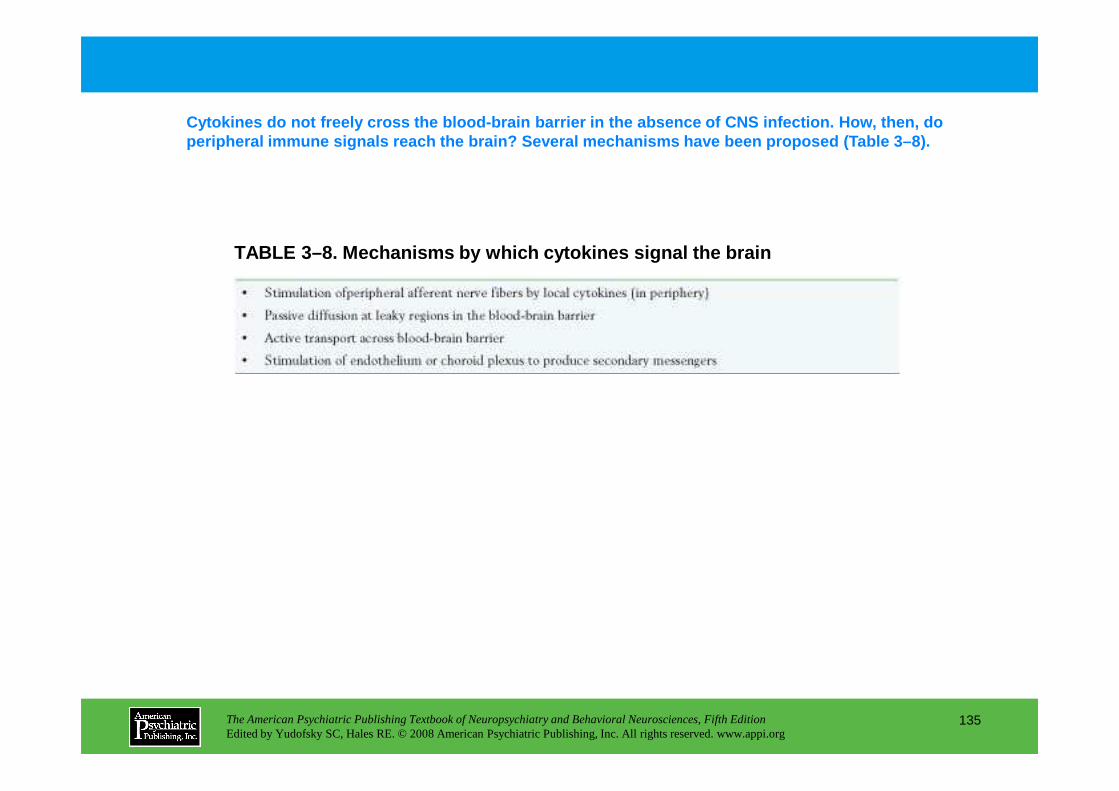
Cytokines do not freely cross the blood-brain barri er in the absence of CNS infection. How, then, do peripheral immune signals reach the brain? Several mechanisms have been proposed (Table 3–8).
TABLE 3–8. Mechanisms by which cytokines signal the brain
The American Psychiatric Publishing Textbook of Neuropsychiatry and Behavioral Neurosciences, Fifth EditionEdited by Yudofsky SC, Hales RE. © 2008 American Psychiatric Publishing, Inc. All rights reserved. www.appi.org
135
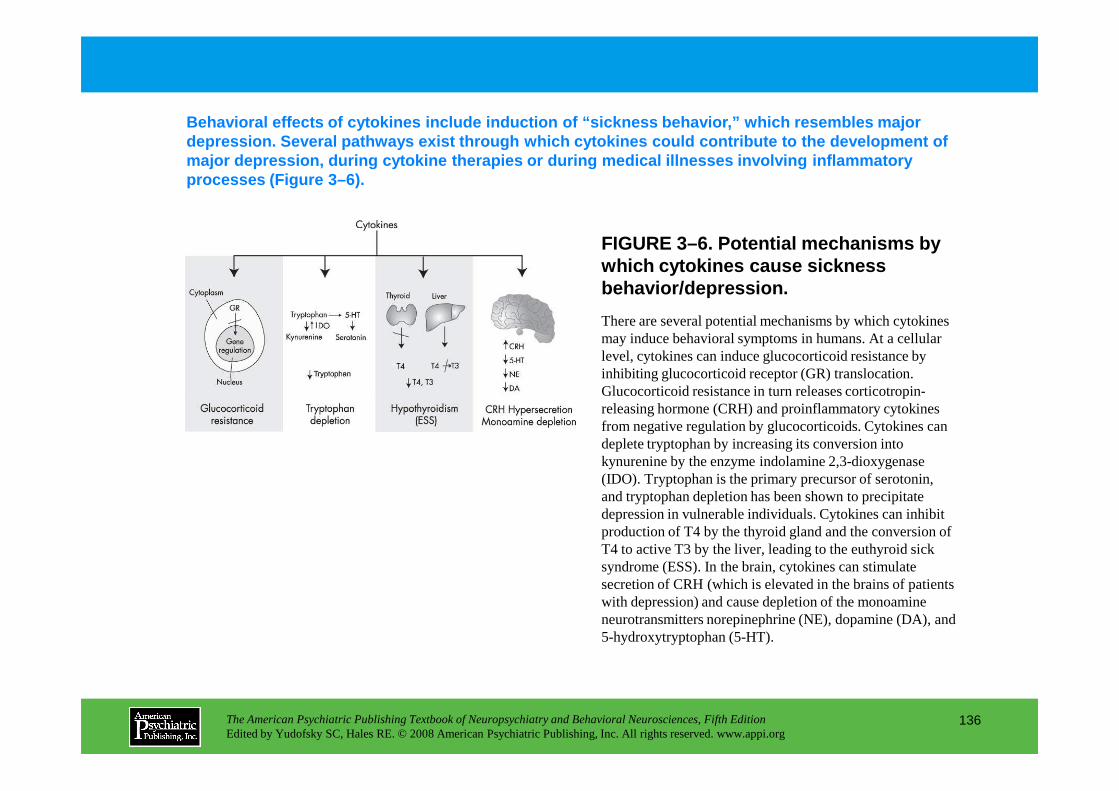
FIGURE 3–6. Potential mechanisms by which cytokines cause sickness behavior/depression.
Behavioral effects of cytokines include induction o f “sickness behavior,” which resembles major depression. Several pathways exist through which cy tokines could contribute to the development of major depression, during cytokine therapies or duri ng medical illnesses involving inflammatory processes (Figure 3–6).
There are several potential mechanisms by which cytokines may induce behavioral symptoms in humans. At a cellular level, cytokines can induce glucocorticoid resistance by inhibiting glucocorticoid receptor (GR) translocation. Glucocorticoid resistance in turn releases corticotropin-
The American Psychiatric Publishing Textbook of Neuropsychiatry and Behavioral Neurosciences, Fifth EditionEdited by Yudofsky SC, Hales RE. © 2008 American Psychiatric Publishing, Inc. All rights reserved. www.appi.org
136
Glucocorticoid resistance in turn releases corticotropin-releasing hormone (CRH) and proinflammatory cytokines from negative regulation by glucocorticoids. Cytokines can deplete tryptophan by increasing its conversion into kynurenine by the enzyme indolamine 2,3-dioxygenase (IDO). Tryptophan is the primary precursor of serotonin, and tryptophan depletion has been shown to precipitate depression in vulnerable individuals. Cytokines can inhibit production of T4 by the thyroid gland and the conversion of T4 to active T3 by the liver, leading to the euthyroid sick syndrome (ESS). In the brain, cytokines can stimulate secretion of CRH (which is elevated in the brains of patients with depression) and cause depletion of the monoamine neurotransmitters norepinephrine (NE), dopamine (DA), and 5-hydroxytryptophan (5-HT).
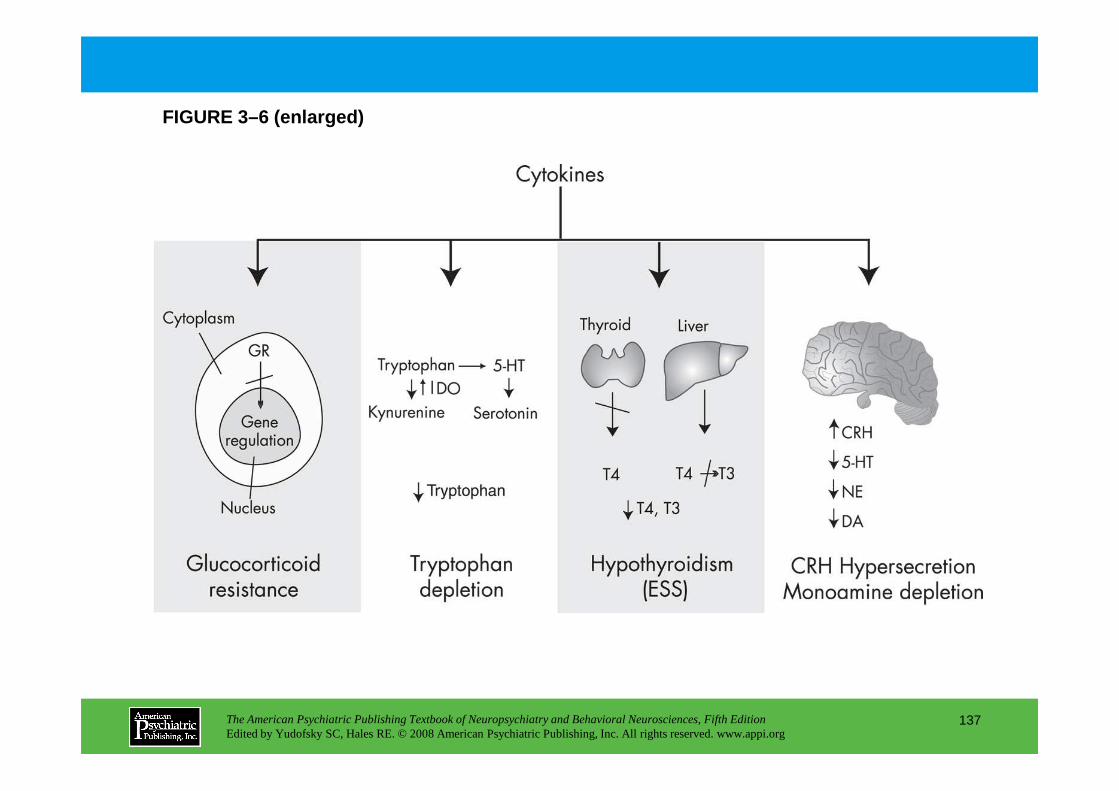
FIGURE 3–6 (enlarged)
The American Psychiatric Publishing Textbook of Neuropsychiatry and Behavioral Neurosciences, Fifth EditionEdited by Yudofsky SC, Hales RE. © 2008 American Psychiatric Publishing, Inc. All rights reserved. www.appi.org
137

TABLE 3–9. Therapeutic uses of cytokines
Cytokines such as IFN- αααα, IFN-ββββ, and IL-2 are used to treat viral illnesses, inclu ding chronic hepatitis B and C, and malignancies, such as malignant melanoma and renal cell carcinoma (Table 3–9).
The American Psychiatric Publishing Textbook of Neuropsychiatry and Behavioral Neurosciences, Fifth EditionEdited by Yudofsky SC, Hales RE. © 2008 American Psychiatric Publishing, Inc. All rights reserved. www.appi.org
138
Chapter 3 • Highlights for the Clinician
• A bidirectional communication network exists between the immune system and the nervous system.
• Chronic stress and depression have been associated with altered immune responses, including decreased NK cell activity and T cell proliferation, as well as activation of innate inflammatory immune responses.
• Chronic stress and depression have been associated with a worse outcome in infectious diseases, cancer, and autoimmune disorders—as well as impaired responses to vaccination and delayed wound healing, possibly due to direct effects on the immune response.
The American Psychiatric Publishing Textbook of Neuropsychiatry and Behavioral Neurosciences, Fifth EditionEdited by Yudofsky SC, Hales RE. © 2008 American Psychiatric Publishing, Inc. All rights reserved. www.appi.org
139
healing, possibly due to direct effects on the immune response.
• Cytokines released during activation of the immune system (especially during innate inflammatory immune responses) can access the brain and alter monoamine metabolism, neuroendocrine function, synaptic plasticity, and behavior.
• Through their effects on the brain, cytokines may contribute to behavioral comorbidities in medically ill individuals and may play a role in the pathophysiology of neuropsychiatric disorders, including depression and schizophrenia.
CHAPTER 4
BEDSIDE NEUROPSYCHIATRY:ELICITING THE CLINICAL PHENOMENA
OF NEUROPSYCHIATRIC ILLNESS
Fred Ovsiew, M.D.
The American Psychiatric Publishing Textbook of Neuropsychiatry and Behavioral Neurosciences, Fifth EditionEdited by Yudofsky SC, Hales RE. © 2008 American Psychiatric Publishing, Inc. All rights reserved. www.appi.org
140
Slide Show
Topic headings and reading list
Tables and figures
Highlights for the clinician
Main menu
(About, Contents, Contributors, Publishing facts)

Taking the HistoryBirthDevelopmentHandednessIctal EventsHead InjuryAlcohol and Drug UseMild Cognitive ImpairmentAppetitive FunctionsAggressionPersonality ChangeOccupationFamily History
Examining the Patient
Palilalia “Blurting”Mutism
Abnormalities of MovementWeaknessDisordered GaitAkinesiaAgitationAkathisiaHypertonusDystoniaTremorChoreaMyoclonusAsterixis
CHAPTER 4 • Topics and Readings
The American Psychiatric Publishing Textbook of Neuropsychiatry and Behavioral Neurosciences, Fifth EditionEdited by Yudofsky SC, Hales RE. © 2008 American Psychiatric Publishing, Inc. All rights reserved. www.appi.org
141
Examining the PatientAsymmetry and Minor Physical AnomaliesOlfactionEyesVisual FieldsBlinkingEye MovementsFacial MovementSpeech
DysarthriaStuttering and ClutteringForeign Accent SyndromeAprosodiaEcholalia
(continued)
AsterixisStartleTics and CompulsionsStereotypy and Mannerisms CatatoniaSynkinesia and Mirror Movements
Primitive ReflexesSoft SignsSigns of Callosal DisconnectionOrientationAttention
NeglectHypermetamorphosis
Memory
Language and PraxisAphasia
Spontaneous speechRepetitionNamingComprehensionReadingWriting
Ideomotor ApraxiaVisuospatial Function
Visuospatial AnalysisVisual AgnosiaDisorders of Complex Visual ProcessingDisordered Reaching and Simultanagnosia
Form of Thought
Environment-Driven ResponsesAnarchic Hand
Awareness of Deficit
Psychological Management in the Neuropsychiatric Examination
Screening Batteries and Rating Scales
Conclusion
RECOMMENDED READINGSCutting J: Principles of Psychopathology: Two Worlds, Two
Minds, Two Hemispheres. New York, Oxford University
CHAPTER 4 • Topics and Readings (continued)
The American Psychiatric Publishing Textbook of Neuropsychiatry and Behavioral Neurosciences, Fifth EditionEdited by Yudofsky SC, Hales RE. © 2008 American Psychiatric Publishing, Inc. All rights reserved. www.appi.org
142
Form of ThoughtThought DisorderConfabulationVorbeireden(Vorbeigehen)Narrative Process in the Interview Setting
Content of ThoughtDelusionsHallucinations
EmotionInitiation and Organization of Action
AbuliaPerseverationDisinhibitionIdeational ApraxiaImpersistence
Minds, Two Hemispheres. New York, Oxford University Press, 1997
Ovsiew F: Neuropsychiatric approach to the patient, in Comprehensive Textbook of Psychiatry, Vol 1. Edited by Sadock BJ, Sadock VA. Philadelphia, PA, Lippincott Williams & Wilkins, 2005, pp 323–349
Sanders RD, Keshavan MS: Physical and neurologic examinations in neuropsychiatry. Semin Clin Neuropsychiatry 7:18–29, 2002
CHAPTER 4 • Tables and Figures
Table 4–1. Selected minor physical anomalies
Table 4–2. Selected catatonic signs
Table 4–3. Primitive reflexes
Table 4–4. Comparison of batteries of soft signs
Figure 4–1. Interlocking finger positions
Figure 4–2. Perseveration
Table 4–5. Behavioral Dyscontrol Scale
Figure 4–3. Frontal Assessment Battery
The American Psychiatric Publishing Textbook of Neuropsychiatry and Behavioral Neurosciences, Fifth EditionEdited by Yudofsky SC, Hales RE. © 2008 American Psychiatric Publishing, Inc. All rights reserved. www.appi.org
143
Frontal Assessment Battery
Summary Highlights for the Clinician
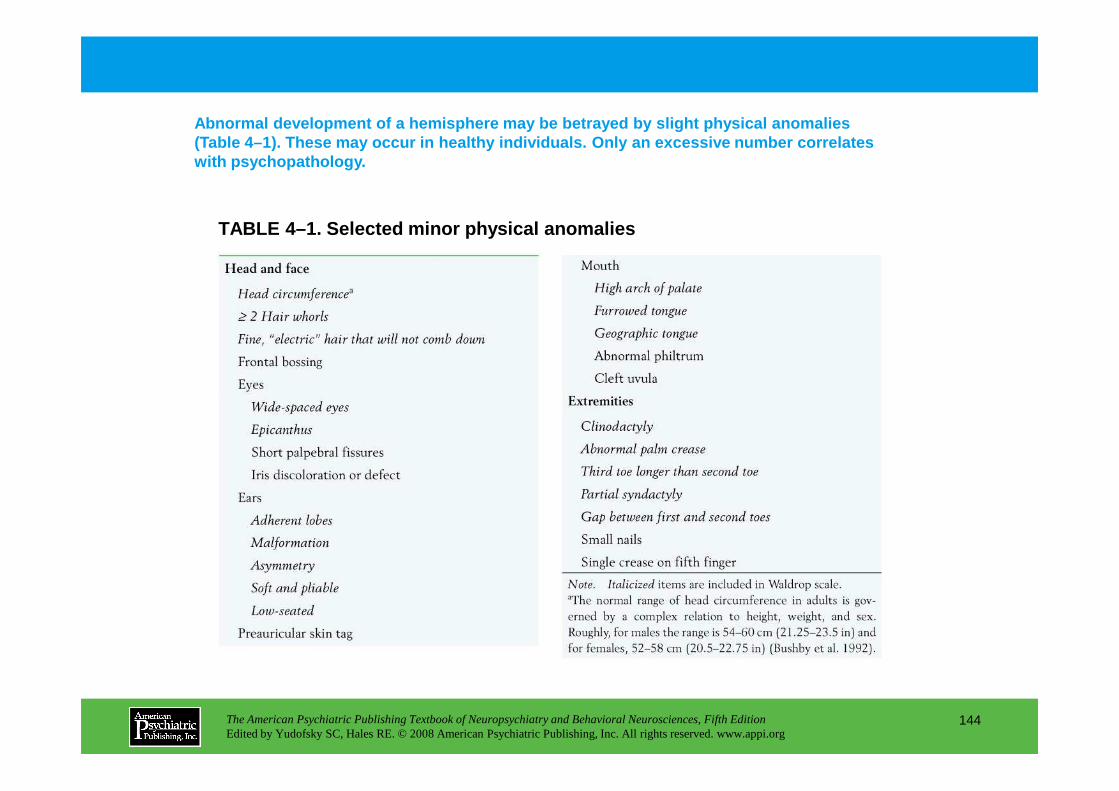
Abnormal development of a hemisphere may be betraye d by slight physical anomalies (Table 4–1). These may occur in healthy individuals . Only an excessive number correlates with psychopathology.
TABLE 4–1. Selected minor physical anomalies
The American Psychiatric Publishing Textbook of Neuropsychiatry and Behavioral Neurosciences, Fifth EditionEdited by Yudofsky SC, Hales RE. © 2008 American Psychiatric Publishing, Inc. All rights reserved. www.appi.org
144
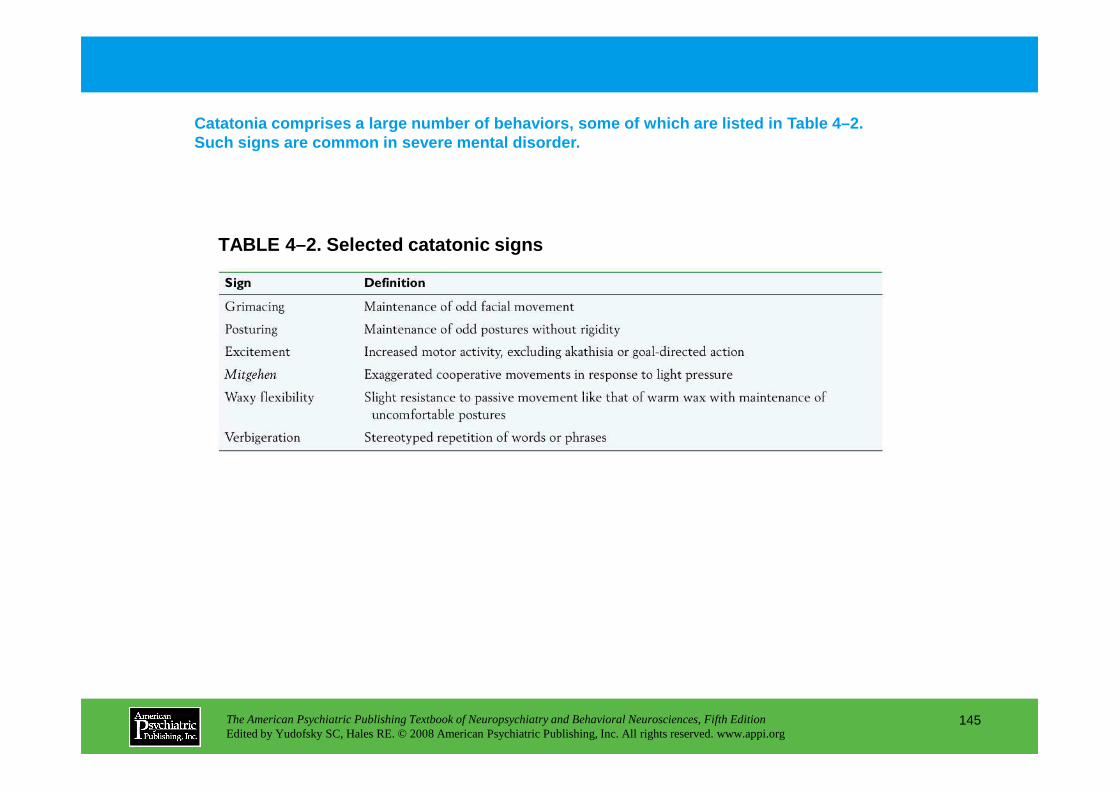
TABLE 4–2. Selected catatonic signs
Catatonia comprises a large number of behaviors, so me of which are listed in Table 4–2. Such signs are common in severe mental disorder.
The American Psychiatric Publishing Textbook of Neuropsychiatry and Behavioral Neurosciences, Fifth EditionEdited by Yudofsky SC, Hales RE. © 2008 American Psychiatric Publishing, Inc. All rights reserved. www.appi.org
145
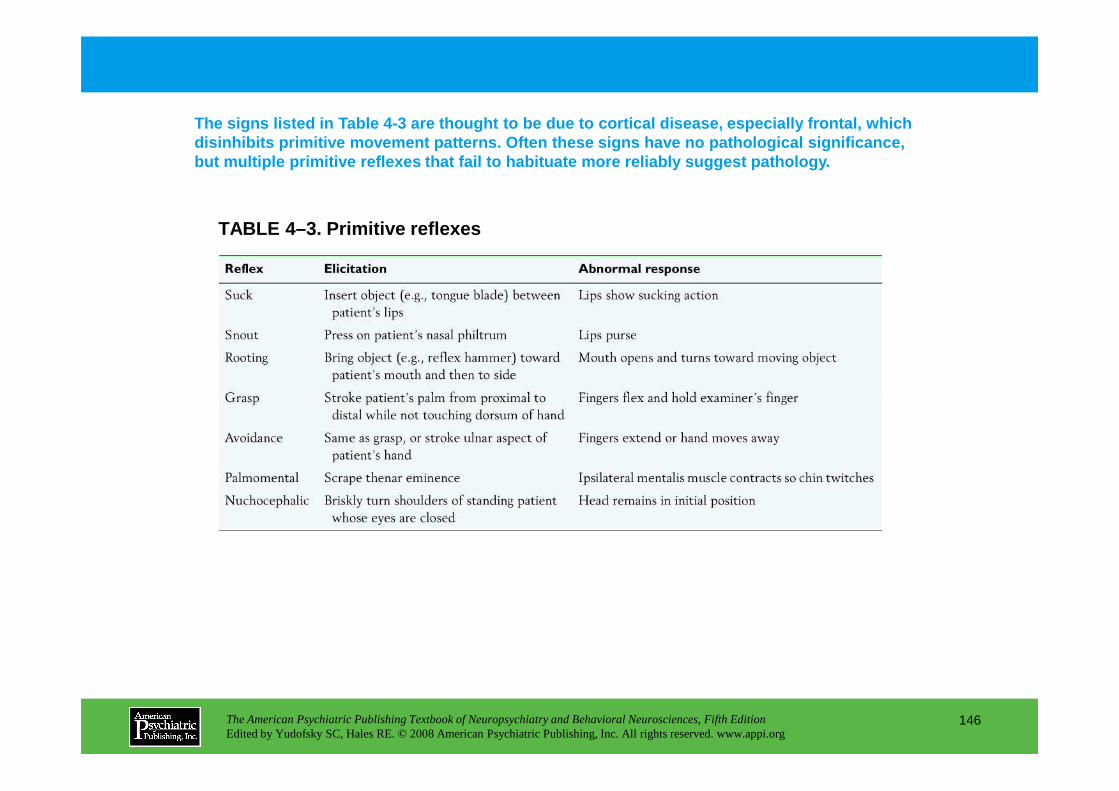
TABLE 4–3. Primitive reflexes
The signs listed in Table 4-3 are thought to be due to cortical disease, especially frontal, which disinhibits primitive movement patterns. Often thes e signs have no pathological significance, but multiple primitive reflexes that fail to habitu ate more reliably suggest pathology.
The American Psychiatric Publishing Textbook of Neuropsychiatry and Behavioral Neurosciences, Fifth EditionEdited by Yudofsky SC, Hales RE. © 2008 American Psychiatric Publishing, Inc. All rights reserved. www.appi.org
146
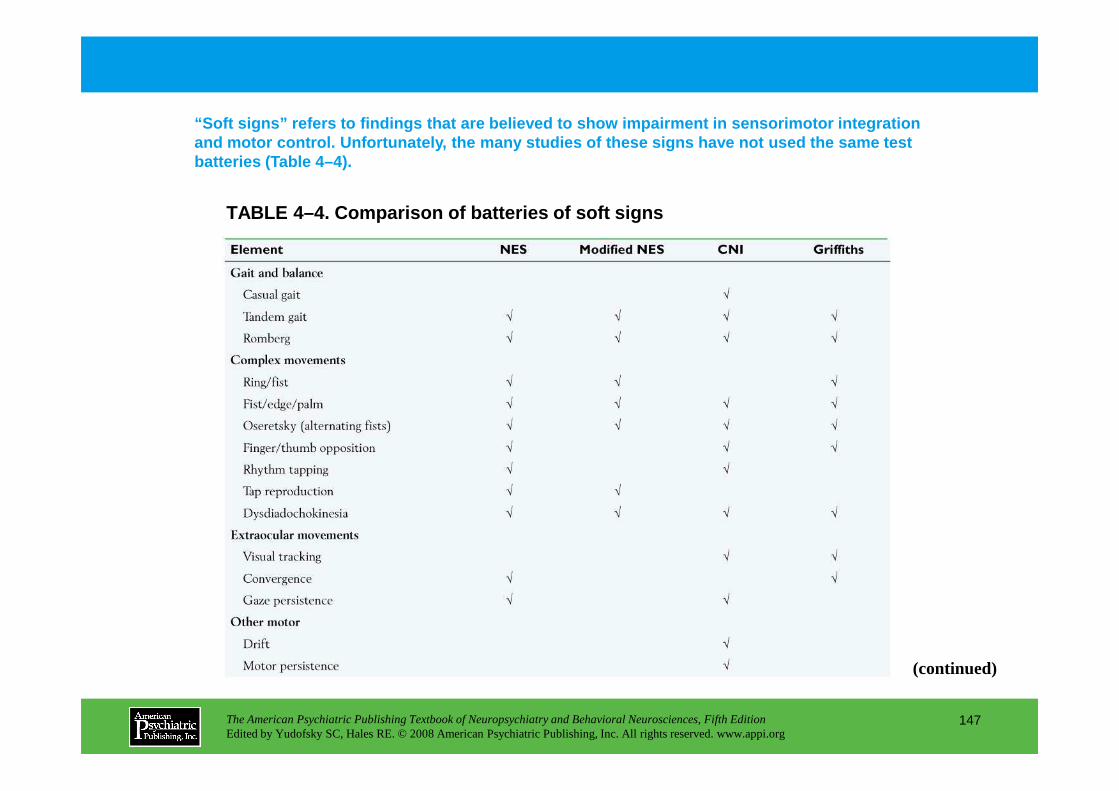
TABLE 4–4. Comparison of batteries of soft signs
“Soft signs” refers to findings that are believed to show impairment in sensorimotor integration and motor control. Unfortunately, the many studies of these signs have not used the same test batteries (Table 4–4).
The American Psychiatric Publishing Textbook of Neuropsychiatry and Behavioral Neurosciences, Fifth EditionEdited by Yudofsky SC, Hales RE. © 2008 American Psychiatric Publishing, Inc. All rights reserved. www.appi.org
147
(continued)

TABLE 4–4. Comparison of batteries of soft signs (c ontinued)
The American Psychiatric Publishing Textbook of Neuropsychiatry and Behavioral Neurosciences, Fifth EditionEdited by Yudofsky SC, Hales RE. © 2008 American Psychiatric Publishing, Inc. All rights reserved. www.appi.org
148
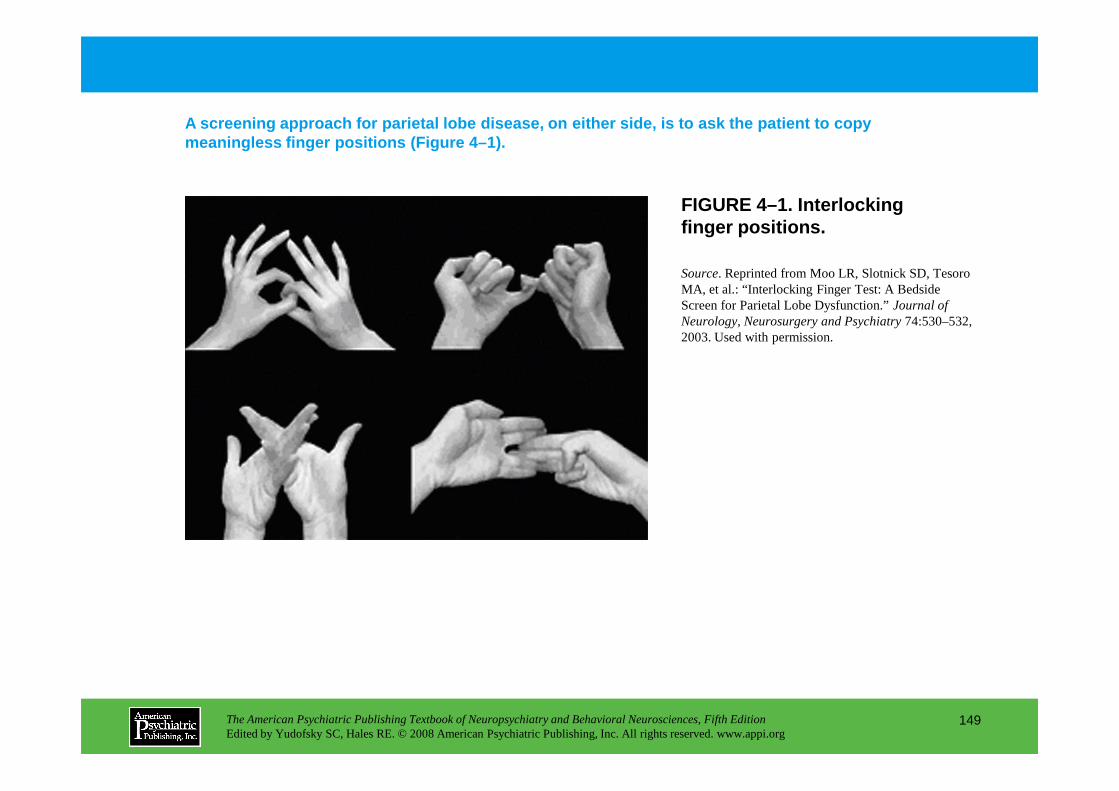
FIGURE 4–1. Interlocking finger positions.
A screening approach for parietal lobe disease, on either side, is to ask the patient to copy meaningless finger positions (Figure 4–1).
Source. Reprinted from Moo LR, Slotnick SD, Tesoro MA, et al.: “Interlocking Finger Test: A Bedside Screen for Parietal Lobe Dysfunction.” Journal of Neurology, Neurosurgery and Psychiatry 74:530–532, 2003. Used with permission.
The American Psychiatric Publishing Textbook of Neuropsychiatry and Behavioral Neurosciences, Fifth EditionEdited by Yudofsky SC, Hales RE. © 2008 American Psychiatric Publishing, Inc. All rights reserved. www.appi.org
149

FIGURE 4–2. Perseveration
Perseveration refers to continuing into present activity the elem ents of previous actions. Simply obtaining a writing sample often elicits perseveration (Figure 4–2). Other tasks include asking for repeated seque nces of two crosses and a circle or three triangles and two squares.
The patient was asked to write a note to a family member. She wrote the first line, wondered aloud why she hadn’t gotten it right, then tried again on the second line.
The American Psychiatric Publishing Textbook of Neuropsychiatry and Behavioral Neurosciences, Fifth EditionEdited by Yudofsky SC, Hales RE. © 2008 American Psychiatric Publishing, Inc. All rights reserved. www.appi.org
150
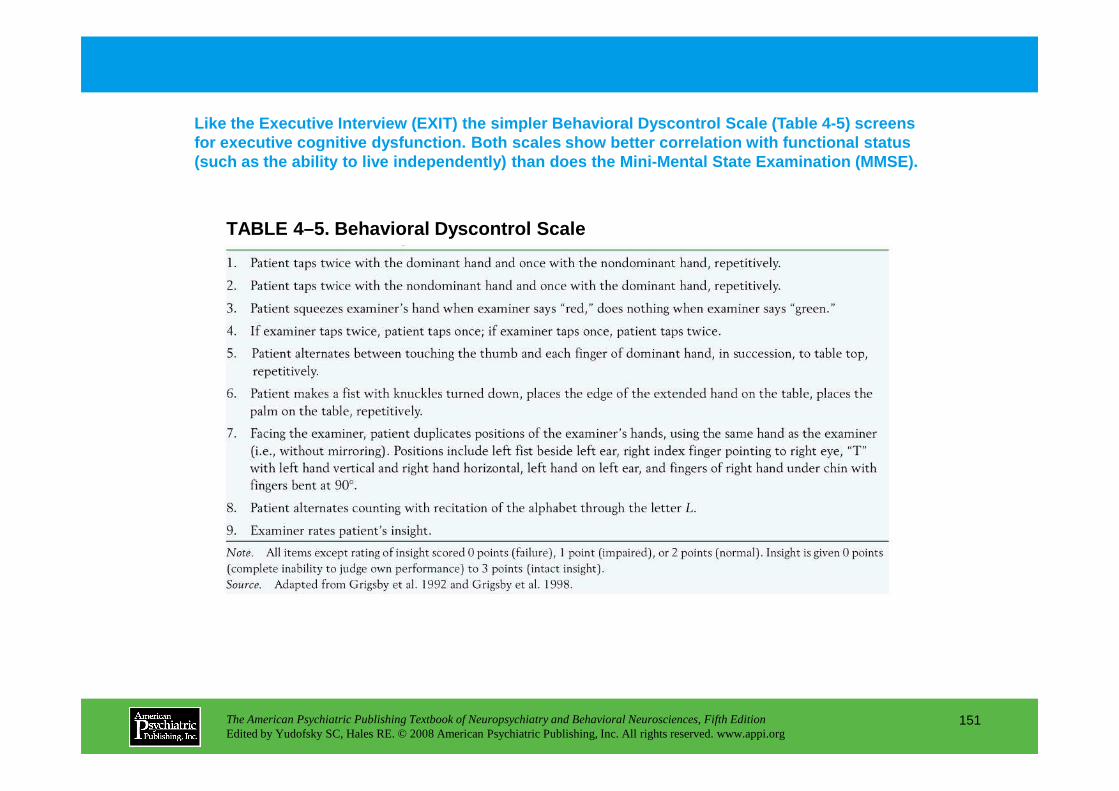
TABLE 4–5. Behavioral Dyscontrol Scale
Like the Executive Interview (EXIT) the simpler Beh avioral Dyscontrol Scale (Table 4-5) screens for executive cognitive dysfunction. Both scales sh ow better correlation with functional status (such as the ability to live independently) than do es the Mini-Mental State Examination (MMSE).
The American Psychiatric Publishing Textbook of Neuropsychiatry and Behavioral Neurosciences, Fifth EditionEdited by Yudofsky SC, Hales RE. © 2008 American Psychiatric Publishing, Inc. All rights reserved. www.appi.org
151

The Frontal Assessment Battery (Figure 4–3) is used to identify executive dysfunction at the bedside i n patients with extrapyramidal disorders. Taking less than 5 minutes to administer, it addresses motor sequencing, verbal fluency, response inhibition, an d other executive functions.
FIGURE 4–3. Frontal Assessment Battery
Source.Reprinted with permission from Dubois B, Slachevsky A, Litvan I, et al.: “The FAB: A Frontal Assessment Battery at Bedside.” Neurology55:1621–1626, 2000. Used with permission from Lippincott Williams & Wilkins. http://lww.com.
The American Psychiatric Publishing Textbook of Neuropsychiatry and Behavioral Neurosciences, Fifth EditionEdited by Yudofsky SC, Hales RE. © 2008 American Psychiatric Publishing, Inc. All rights reserved. www.appi.org
152
(continued)
Williams & Wilkins. http://lww.com.

FIGURE 4–3. Frontal Assessment Battery (continued)
The American Psychiatric Publishing Textbook of Neuropsychiatry and Behavioral Neurosciences, Fifth EditionEdited by Yudofsky SC, Hales RE. © 2008 American Psychiatric Publishing, Inc. All rights reserved. www.appi.org
153
Chapter 4 • Highlights for the Clinician
• Organic contributors to psychopathology can be recognized at the bedside through skillful history-taking and examination.
• Only knowledge of the psychiatric features of epilepsy, traumatic brain injury, and other common pathologies allows the clinician to know what questions to ask and what findings to look for. These features may differ from the characteristic phenomena of idiopathic psychiatric illness.
• Listening to the patient tell the story of the illness is part of the examination (because narrative skills may be subtly altered by
The American Psychiatric Publishing Textbook of Neuropsychiatry and Behavioral Neurosciences, Fifth EditionEdited by Yudofsky SC, Hales RE. © 2008 American Psychiatric Publishing, Inc. All rights reserved. www.appi.org
154
examination (because narrative skills may be subtly altered by brain disease) and is also part of the psychological management of a brain-injured patient.
• Similarly, physical examination plays both an irreplaceable practical role in eliciting clinical information and a helpful psychological role in establishing the medical context of the clinical encounter.
CHAPTER 5
ELECTRODIAGNOSTIC TECHNIQUES IN NEUROPSYCHIATRY
Nash N. Boutros, M.D.Robert W. Thatcher, Ph.D.
Silvana Galderisi, M.D.
The American Psychiatric Publishing Textbook of Neuropsychiatry and Behavioral Neurosciences, Fifth EditionEdited by Yudofsky SC, Hales RE. © 2008 American Psychiatric Publishing, Inc. All rights reserved. www.appi.org
155
Slide Show
Topic headings and reading list
Tables and figures
Highlights for the clinician
Main menu
(About, Contents, Contributors, Publishing facts)

ElectroencephalographyHistoryTheoretical OverviewClinical Electroencephalography
Panic DisorderEpisodic AggressionAttention-Deficit/Hyperactivity DisorderAge, Dementia, and DeliriumEpilepsy and Epileptiform ActivityControversial WaveformsScreening Electroencephalograms
Quantitative ElectroencephalographySchizophreniaMood Disorders
Polysomnography
Activity Monitoring
Magnetoencephalography
Conclusion
RECOMMENDED READINGSCoburn KL, Lauterbach EC, Boutros NN, et al: The value of
quantitative electroencephalography in clinical psychiatry: a report by the committee on research of the American Neuropsychiatric Association. J Neuropsychiatry Clin Neurosci 18:460–500, 2006
Duffy FH: Long latency evoked potential database for clinical applications: justification and examples. Clin EEG Neurosci
CHAPTER 5 • Topics and Readings
The American Psychiatric Publishing Textbook of Neuropsychiatry and Behavioral Neurosciences, Fifth EditionEdited by Yudofsky SC, Hales RE. © 2008 American Psychiatric Publishing, Inc. All rights reserved. www.appi.org
156
Mood DisordersAnxiety DisordersMild Head Injury or Postconcussion Syndrome
Pharmaco-electroencephalographyDrug DevelopmentClinical ApplicationsOther Applications
Evoked PotentialsP300
applications: justification and examples. Clin EEG Neurosci 36:88–98, 2005
Niedermeyer E, Lopes da Silva F: Electroencephalography: Basic Principles, Clinical Applications and Related Fields. Baltimore, MD, Lippincott Williams & Wilkins, 2005
CHAPTER 5 • Tables and Figures
Table 5–1. History of electroencephalography in neuropsychiatry
Figure 5–1. Standard 10–20 clinical electroencephalogram montage
Table 5–2. Electroencephalographic findings in a sample of neuropsychiatric disorders
Table 5–3. The accuracy of QEEG in classifying neuropsychiatric disorders
Table 5–4. Physiological variables frequently recorded during polysomnography
Summary Highlights for the Clinician
The American Psychiatric Publishing Textbook of Neuropsychiatry and Behavioral Neurosciences, Fifth EditionEdited by Yudofsky SC, Hales RE. © 2008 American Psychiatric Publishing, Inc. All rights reserved. www.appi.org
157

TABLE 5–1. History of electroencephalography in neu ropsychiatry
Electrical brain signals were first discovered in 1 875. In the 1930s, spike and wave discharges were described in epileptic patients—heralding the r apid growth of epileptology and the wide use of EEG in clinical practice (Table 5–1).
The American Psychiatric Publishing Textbook of Neuropsychiatry and Behavioral Neurosciences, Fifth EditionEdited by Yudofsky SC, Hales RE. © 2008 American Psychiatric Publishing, Inc. All rights reserved. www.appi.org
158
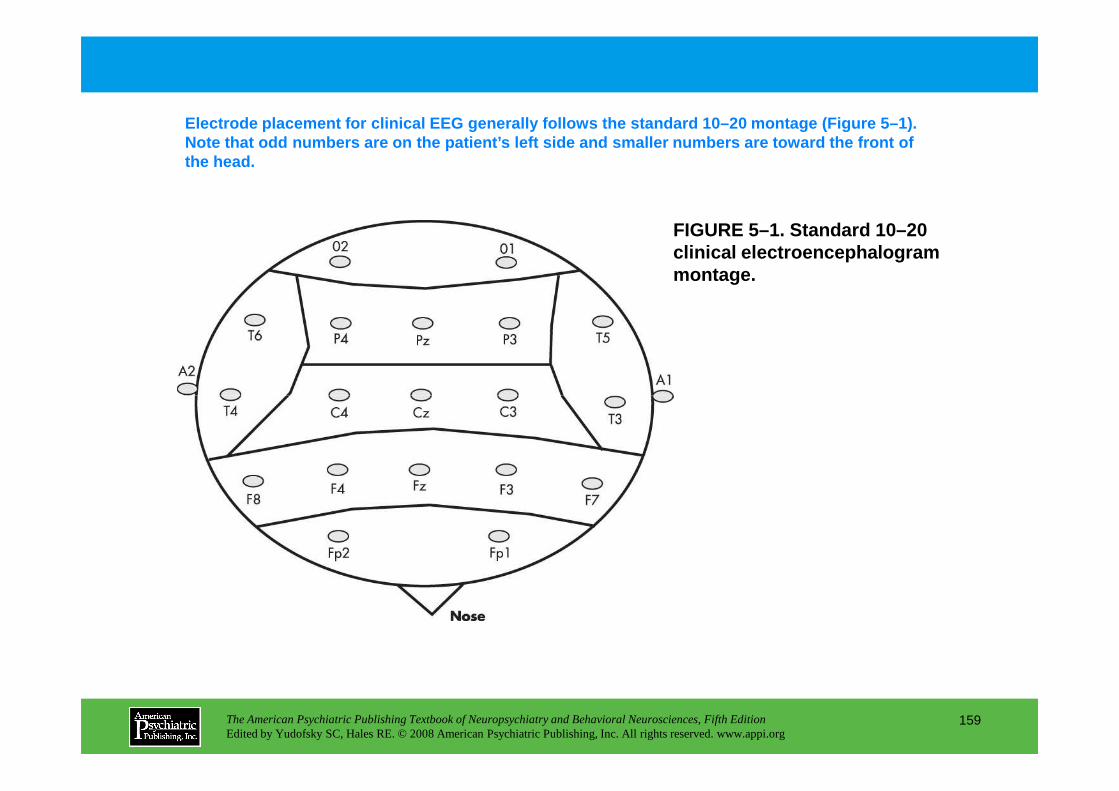
FIGURE 5–1. Standard 10–20 clinical electroencephalogram montage.
Electrode placement for clinical EEG generally foll ows the standard 10–20 montage (Figure 5–1). Note that odd numbers are on the patient’s left sid e and smaller numbers are toward the front of the head.
The American Psychiatric Publishing Textbook of Neuropsychiatry and Behavioral Neurosciences, Fifth EditionEdited by Yudofsky SC, Hales RE. © 2008 American Psychiatric Publishing, Inc. All rights reserved. www.appi.org
159
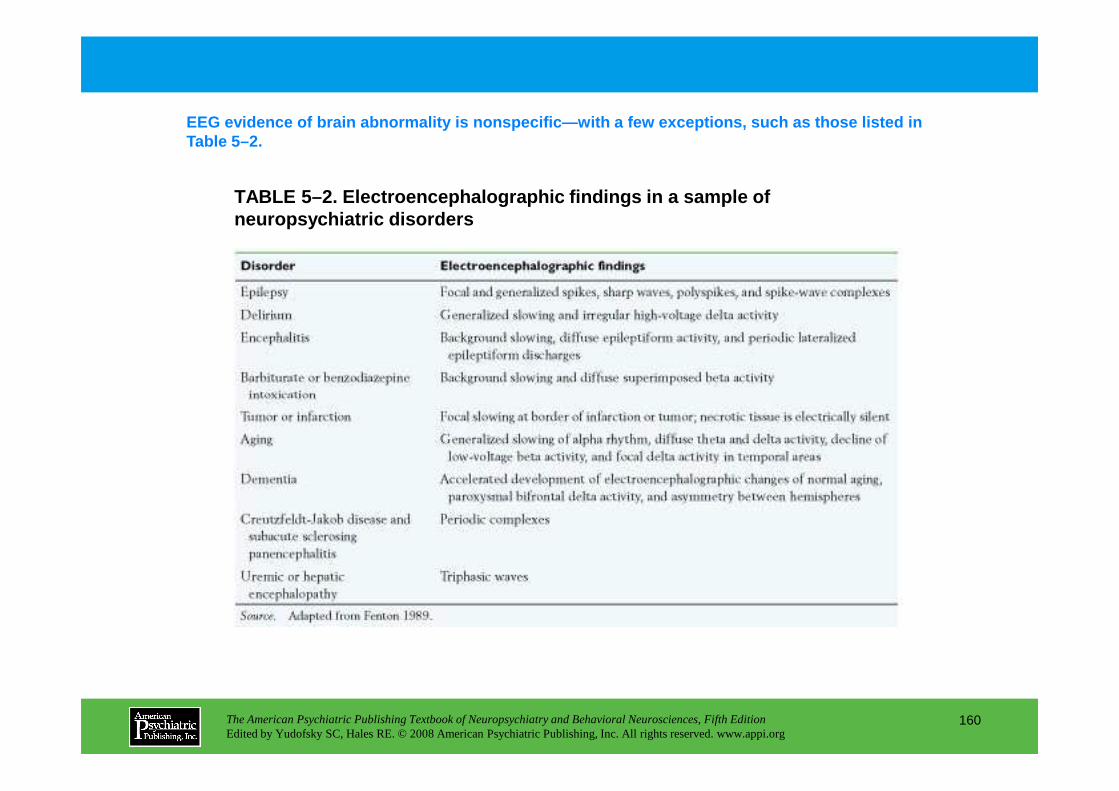
TABLE 5–2. Electroencephalographic findings in a sa mple of neuropsychiatric disorders
EEG evidence of brain abnormality is nonspecific—wit h a few exceptions, such as those listed in Table 5–2.
The American Psychiatric Publishing Textbook of Neuropsychiatry and Behavioral Neurosciences, Fifth EditionEdited by Yudofsky SC, Hales RE. © 2008 American Psychiatric Publishing, Inc. All rights reserved. www.appi.org
160
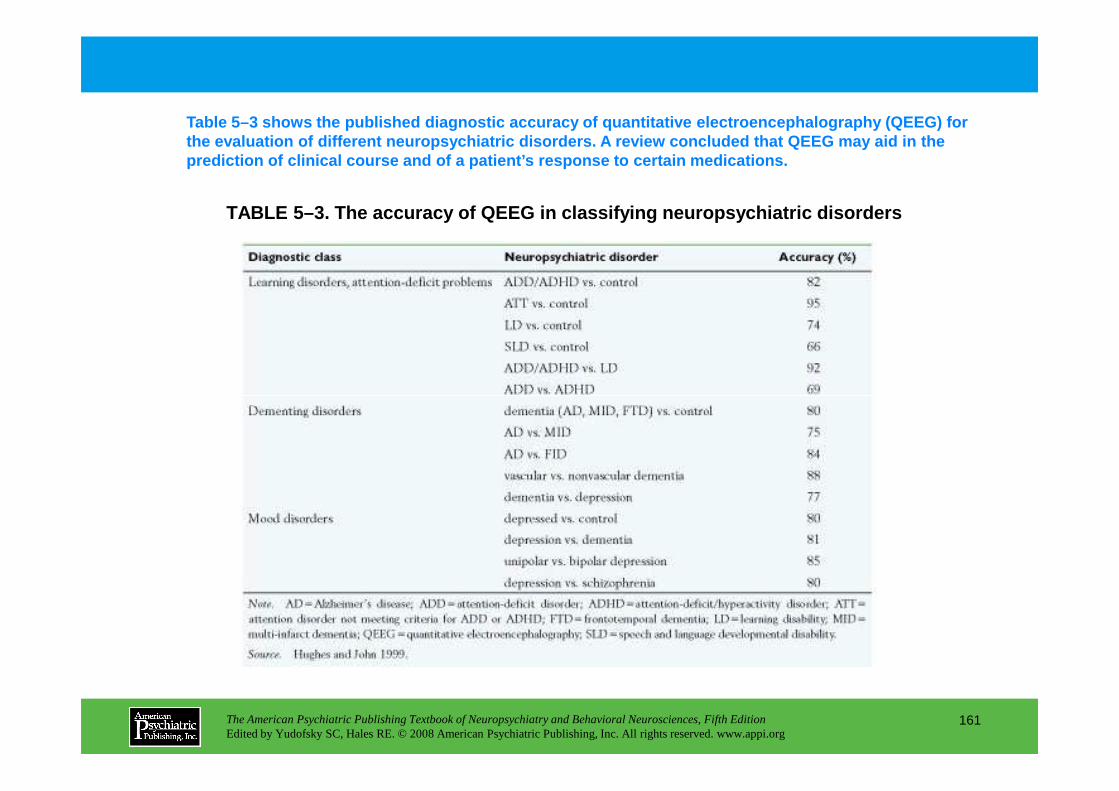
TABLE 5–3. The accuracy of QEEG in classifying neur opsychiatric disorders
Table 5–3 shows the published diagnostic accuracy o f quantitative electroencephalography (QEEG) for the evaluation of different neuropsychiatric disord ers. A review concluded that QEEG may aid in the prediction of clinical course and of a patient’s re sponse to certain medications.
The American Psychiatric Publishing Textbook of Neuropsychiatry and Behavioral Neurosciences, Fifth EditionEdited by Yudofsky SC, Hales RE. © 2008 American Psychiatric Publishing, Inc. All rights reserved. www.appi.org
161
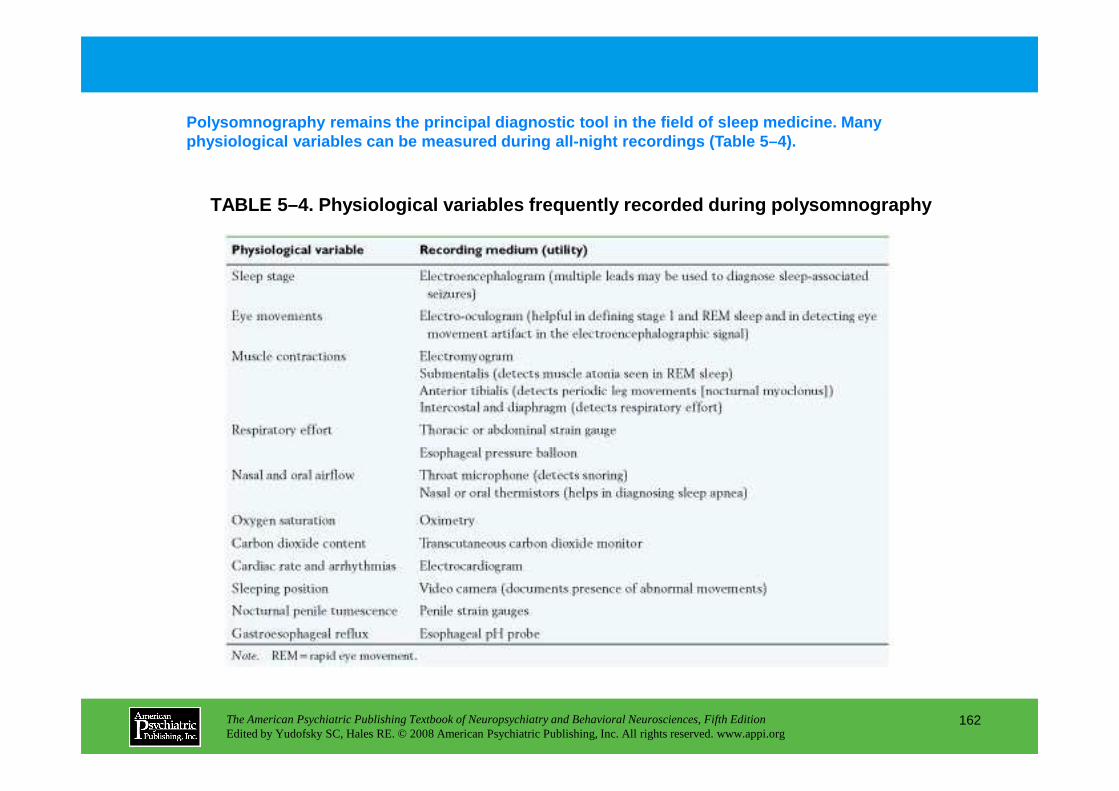
TABLE 5–4. Physiological variables frequently recor ded during polysomnography
Polysomnography remains the principal diagnostic to ol in the field of sleep medicine. Many physiological variables can be measured during all- night recordings (Table 5–4).
The American Psychiatric Publishing Textbook of Neuropsychiatry and Behavioral Neurosciences, Fifth EditionEdited by Yudofsky SC, Hales RE. © 2008 American Psychiatric Publishing, Inc. All rights reserved. www.appi.org
162
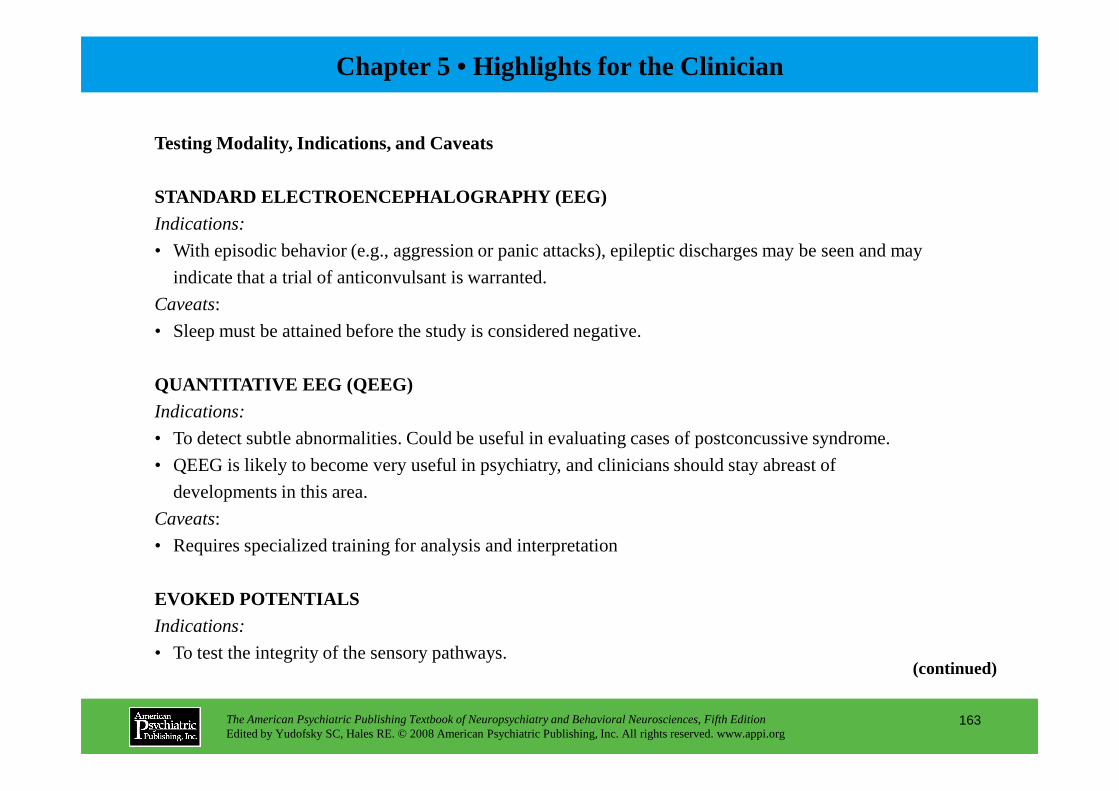
Chapter 5 • Highlights for the Clinician
Testing Modality, Indications, and Caveats
STANDARD ELECTROENCEPHALOGRAPHY (EEG)Indications:
• With episodic behavior (e.g., aggression or panic attacks), epileptic discharges may be seen and may
indicate that a trial of anticonvulsant is warranted.
Caveats:
• Sleep must be attained before the study is considered negative.
QUANTITATIVE EEG (QEEG)
The American Psychiatric Publishing Textbook of Neuropsychiatry and Behavioral Neurosciences, Fifth EditionEdited by Yudofsky SC, Hales RE. © 2008 American Psychiatric Publishing, Inc. All rights reserved. www.appi.org
163
Indications:
• To detect subtle abnormalities. Could be useful in evaluating cases of postconcussive syndrome.
• QEEG is likely to become very useful in psychiatry, and clinicians should stay abreast of
developments in this area.
Caveats:
• Requires specialized training for analysis and interpretation
EVOKED POTENTIALSIndications:
• To test the integrity of the sensory pathways.(continued)

COGNITIVE EVOKED POTENTIALSIndications:
• Could be used to assess attentional and cognitive capacity.
Caveats:
• Requires specialized laboratories
ALL-NIGHT EEGIndications:
• Could be used to assess nocturnal episodes (to differentiate panic from epileptic attacks).
The American Psychiatric Publishing Textbook of Neuropsychiatry and Behavioral Neurosciences, Fifth EditionEdited by Yudofsky SC, Hales RE. © 2008 American Psychiatric Publishing, Inc. All rights reserved. www.appi.org
164
PHARMACO-EEGIndications:
• To predict clinical response using a test dose of a psychotropic medication.
Caveats:
• An evolving field; clinicians should stay abreast of developments.
CHAPTER 6
THE NEUROPSYCHOLOGICALEVALUATION
Diane B. Howieson, Ph.D.Muriel D. Lezak, Ph.D.
The American Psychiatric Publishing Textbook of Neuropsychiatry and Behavioral Neurosciences, Fifth EditionEdited by Yudofsky SC, Hales RE. © 2008 American Psychiatric Publishing, Inc. All rights reserved. www.appi.org
165
Slide Show
Topic headings and reading list
Tables and figures
Highlights for the clinician
Main menu
(About, Contents, Contributors, Publishing facts)

Indications for a Neuropsychological Evaluation
Role of the Referring Psychiatrist
Assessment Process
The Nature of Neuropsychological Tests
Interpretation: Principles and Cautions
Major Test CategoriesMental AbilityLanguageAttention and Mental TrackingMemoryPerceptionPraxis
Special Assessment ToolsBatteriesScreening TestsCompetency
Treatment And Planning
Qualifications For Performing Neuropsychological Evaluations
RECOMMENDED READINGSHeilman K, Valenstein E (eds): Clinical
Neuropsychology, 4th Edition. New York, Oxford University Press, 2003
Lezak M, Howieson D, Loring D: Neuropsychological
CHAPTER 6 • Topics and Readings
The American Psychiatric Publishing Textbook of Neuropsychiatry and Behavioral Neurosciences, Fifth EditionEdited by Yudofsky SC, Hales RE. © 2008 American Psychiatric Publishing, Inc. All rights reserved. www.appi.org
166
PraxisConstructional AbilityConceptual FunctionsExecutive FunctionsMotor FunctionsPersonality and Emotional Status
Lezak M, Howieson D, Loring D: Neuropsychological Assessment, 4th Edition. New York, Oxford University Press, 2004
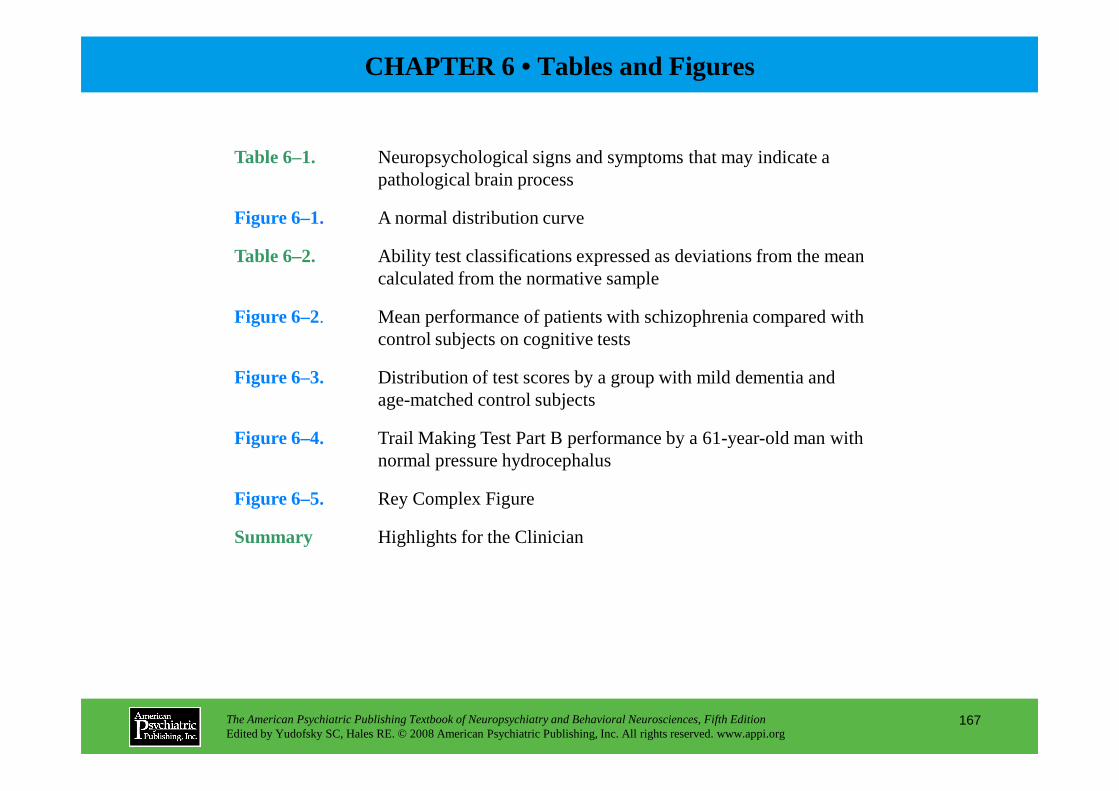
CHAPTER 6 • Tables and Figures
Table 6–1. Neuropsychological signs and symptoms that may indicate a pathological brain process
Figure 6–1. A normal distribution curve
Table 6–2. Ability test classifications expressed as deviations from the mean calculated from the normative sample
Figure 6–2. Mean performance of patients with schizophrenia compared with control subjects on cognitive tests
Figure 6–3. Distribution of test scores by a group with mild dementia and age-matched control subjects
The American Psychiatric Publishing Textbook of Neuropsychiatry and Behavioral Neurosciences, Fifth EditionEdited by Yudofsky SC, Hales RE. © 2008 American Psychiatric Publishing, Inc. All rights reserved. www.appi.org
167
age-matched control subjects
Figure 6–4. Trail Making Test Part B performance by a 61-year-old man with normal pressure hydrocephalus
Figure 6–5. Rey Complex Figure
Summary Highlights for the Clinician
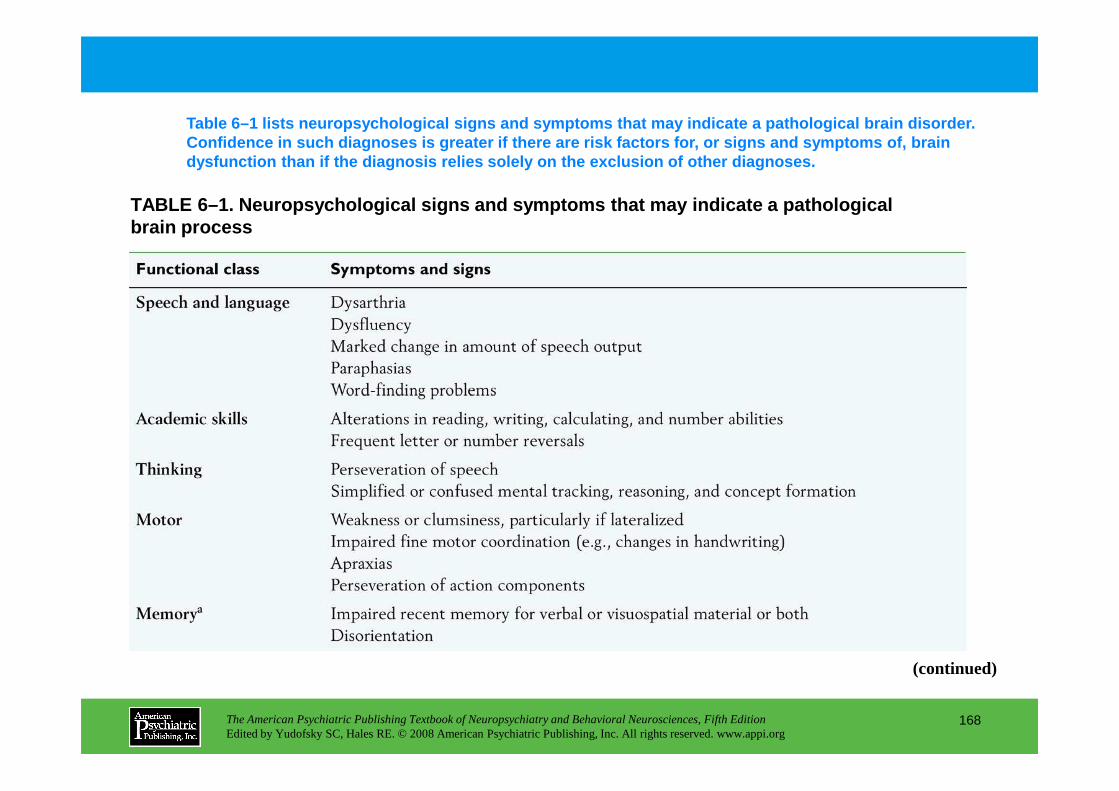
Table 6–1 lists neuropsychological signs and sympto ms that may indicate a pathological brain disorder. Confidence in such diagnoses is greater if there ar e risk factors for, or signs and symptoms of, brain dysfunction than if the diagnosis relies solely on the exclusion of other diagnoses.
TABLE 6–1. Neuropsychological signs and symptoms th at may indicate a pathological brain process
The American Psychiatric Publishing Textbook of Neuropsychiatry and Behavioral Neurosciences, Fifth EditionEdited by Yudofsky SC, Hales RE. © 2008 American Psychiatric Publishing, Inc. All rights reserved. www.appi.org
168
(continued)
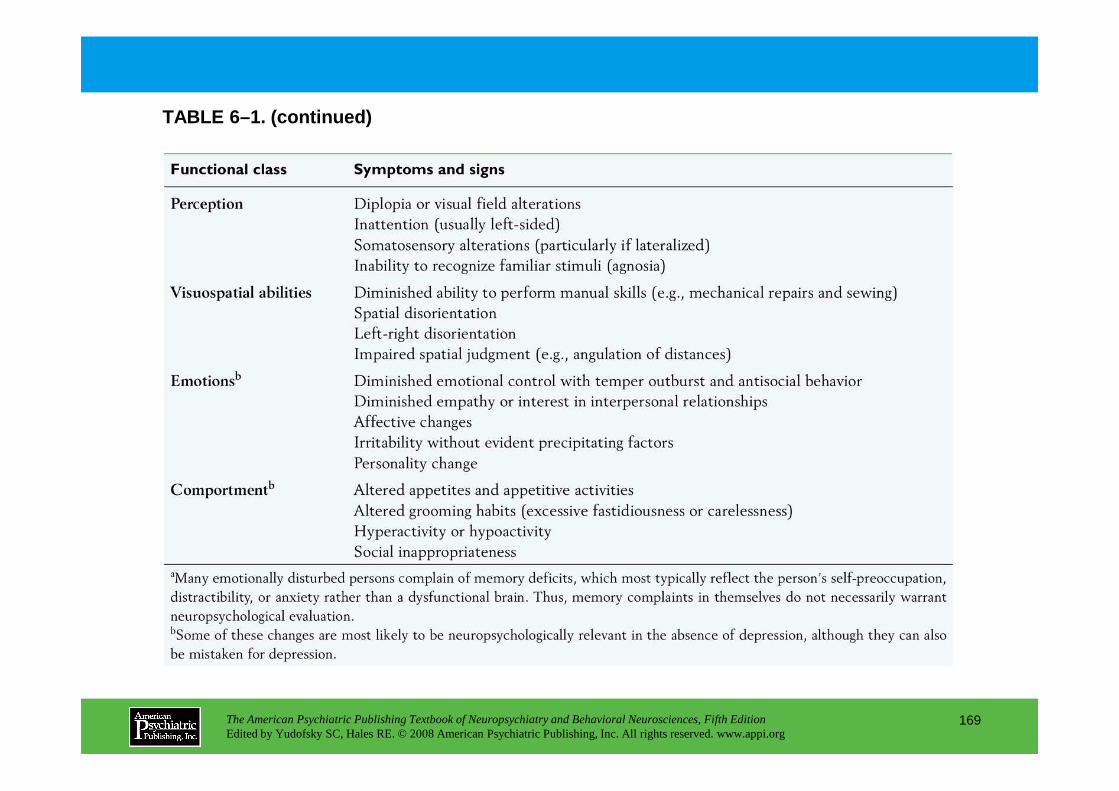
TABLE 6–1. (continued)
The American Psychiatric Publishing Textbook of Neuropsychiatry and Behavioral Neurosciences, Fifth EditionEdited by Yudofsky SC, Hales RE. © 2008 American Psychiatric Publishing, Inc. All rights reserved. www.appi.org
169
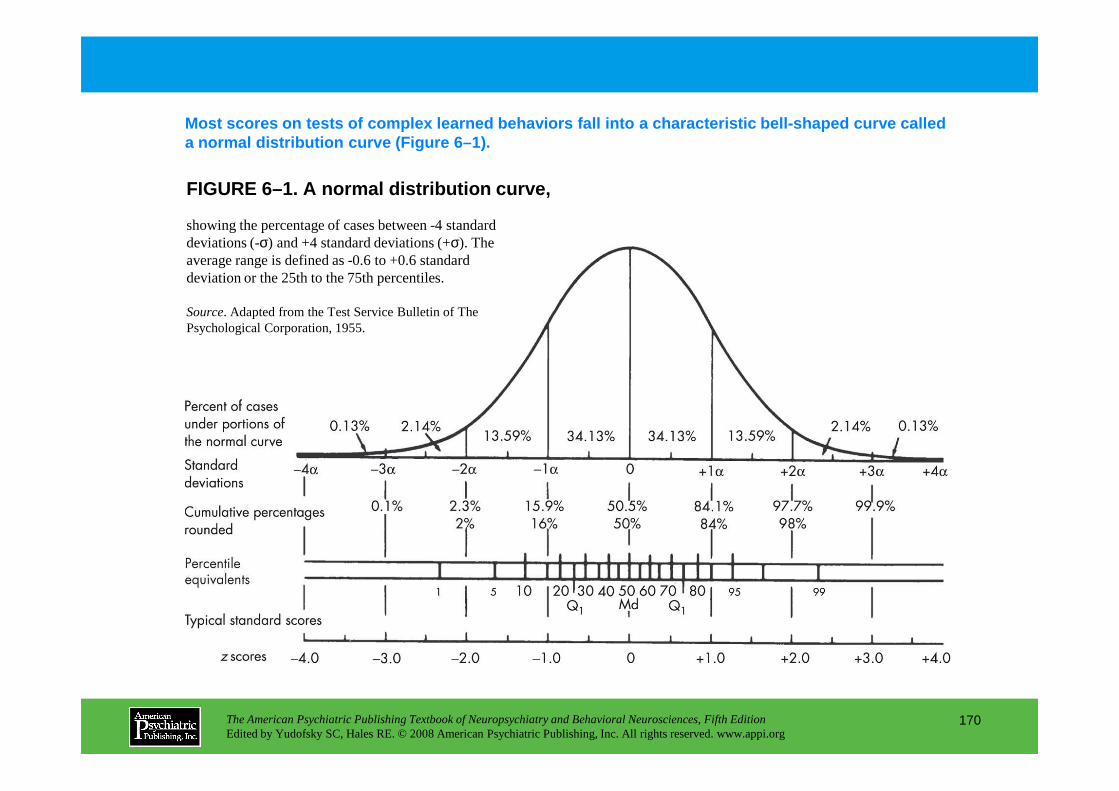
FIGURE 6–1. A normal distribution curve,
Most scores on tests of complex learned behaviors f all into a characteristic bell-shaped curve called a normal distribution curve (Figure 6–1).
showing the percentage of cases between -4 standard deviations (-σ) and +4 standard deviations (+σ). The average range is defined as -0.6 to +0.6 standard deviation or the 25th to the 75th percentiles.
Source. Adapted from the Test Service Bulletin of The Psychological Corporation, 1955.
The American Psychiatric Publishing Textbook of Neuropsychiatry and Behavioral Neurosciences, Fifth EditionEdited by Yudofsky SC, Hales RE. © 2008 American Psychiatric Publishing, Inc. All rights reserved. www.appi.org
170

TABLE 6–2. Ability test classifications expressed a s deviations from the mean calculated from the normative sample
Competence levels in different domains vary between individuals and vary also within the same individual at different times. For this reason, man y neuropsychologists prefer to describe ability lev els rather than scores. Table 6–2 shows interpretations of ability levels expressed as deviations from the mean of the normative sample.
The American Psychiatric Publishing Textbook of Neuropsychiatry and Behavioral Neurosciences, Fifth EditionEdited by Yudofsky SC, Hales RE. © 2008 American Psychiatric Publishing, Inc. All rights reserved. www.appi.org
171

FIGURE 6–2. Mean performance of patients with schizophrenia compared with control subjects on cognitive tests:
Figure 6–2 exemplifies a comparison using z scores. The performance of 34 men with schizophrenia on a set of neuropsychological tests is shown as compa red with the performance of a control group (the 0 line). The patient group had poorer performance th an the control group on all measures.
delayed recall of words and stories (Recall); recognition of
The American Psychiatric Publishing Textbook of Neuropsychiatry and Behavioral Neurosciences, Fifth EditionEdited by Yudofsky SC, Hales RE. © 2008 American Psychiatric Publishing, Inc. All rights reserved. www.appi.org
172
stories (Recall); recognition of words when targets were mixed with distractors (Recog); short-term memory (STM) measured by the Brown-Peterson technique; verbal fluency (VF); and Wisconsin Card Sorting Test (WCST) categories achieved.
Source. Adapted from Sullivan et al. 1994.
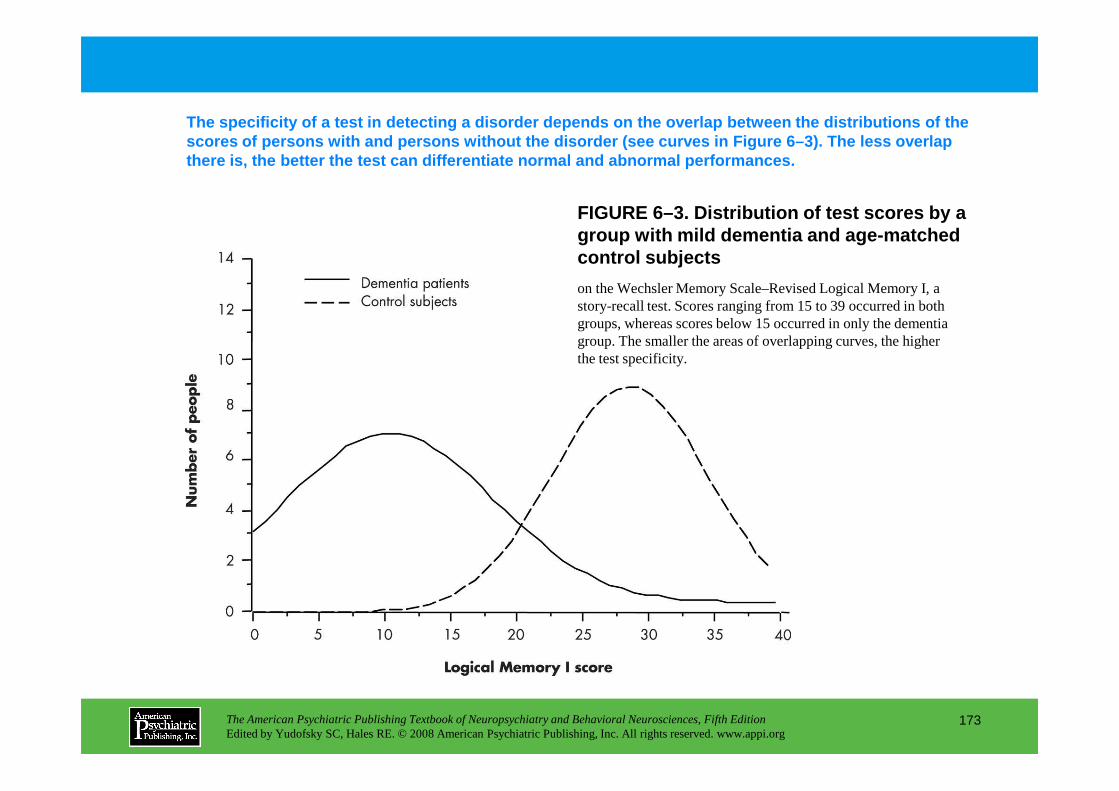
FIGURE 6–3. Distribution of test scores by a group with mild dementia and age-matched control subjects
The specificity of a test in detecting a disorder d epends on the overlap between the distributions of the scores of persons with and persons without the diso rder (see curves in Figure 6–3). The less overlap there is, the better the test can differentiate nor mal and abnormal performances.
on the Wechsler Memory Scale–Revised Logical Memory I, a story-recall test. Scores ranging from 15 to 39 occurred in both groups, whereas scores below 15 occurred in only the dementia group. The smaller the areas of overlapping curves, the higher the test specificity.
The American Psychiatric Publishing Textbook of Neuropsychiatry and Behavioral Neurosciences, Fifth EditionEdited by Yudofsky SC, Hales RE. © 2008 American Psychiatric Publishing, Inc. All rights reserved. www.appi.org
173
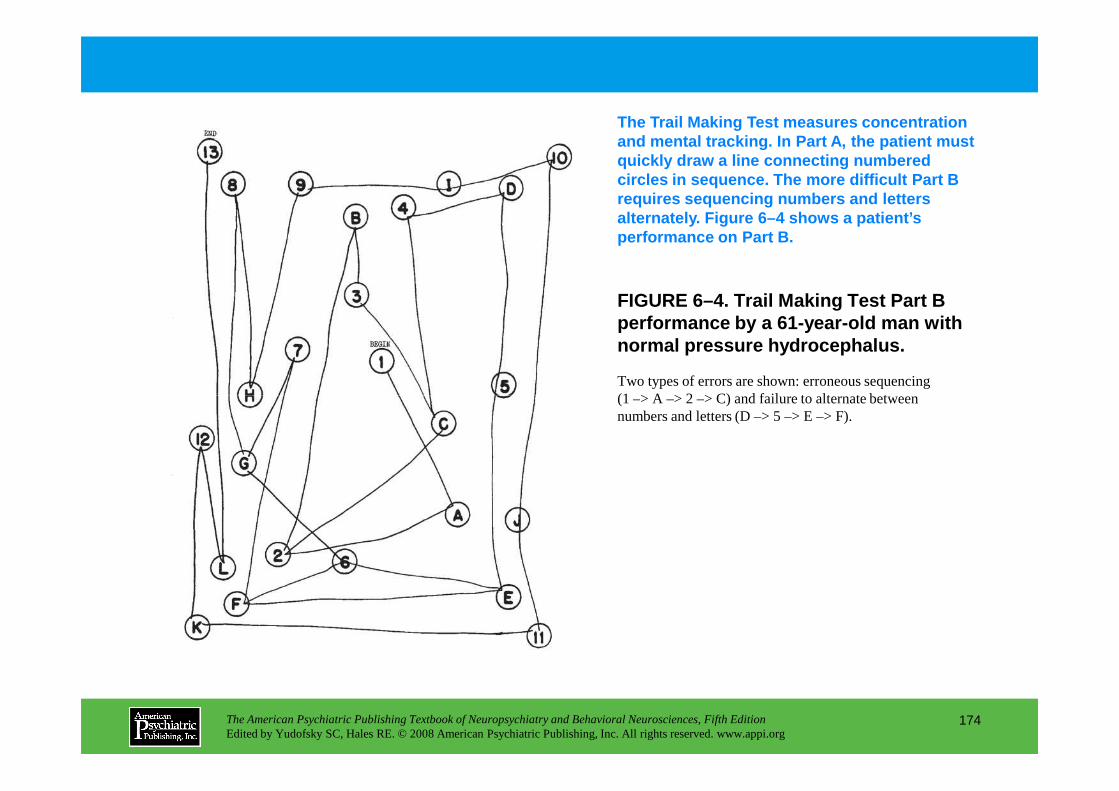
The Trail Making Test measures concentration and mental tracking. In Part A, the patient must quickly draw a line connecting numbered circles in sequence. The more difficult Part B requires sequencing numbers and letters alternately. Figure 6–4 shows a patient’s performance on Part B.
FIGURE 6–4. Trail Making Test Part B performance by a 61-year-old man with normal pressure hydrocephalus.
Two types of errors are shown: erroneous sequencing (1 –> A –> 2 –> C) and failure to alternate between
The American Psychiatric Publishing Textbook of Neuropsychiatry and Behavioral Neurosciences, Fifth EditionEdited by Yudofsky SC, Hales RE. © 2008 American Psychiatric Publishing, Inc. All rights reserved. www.appi.org
174
(1 –> A –> 2 –> C) and failure to alternate between numbers and letters (D –> 5 –> E –> F).

FIGURE 6–5. Rey Complex Figure.
Constructional problems reflect deficits in spatial relationships. Neuropsychological assessment may include a visuospatial processing measure such as t he Rey Complex Figure (Figure 6–5), in which the patient is asked to copy a geometric design.
Rey Complex Figure (Panel A)and copy (Panel B)drawn by a 77-year-old man who had a right hemisphere stroke 2 days before, which produced left-sided neglect and delayed recall. Panel Cwas drawn by a 72-year-old man with strong perseverative tendencies.
The American Psychiatric Publishing Textbook of Neuropsychiatry and Behavioral Neurosciences, Fifth EditionEdited by Yudofsky SC, Hales RE. © 2008 American Psychiatric Publishing, Inc. All rights reserved. www.appi.org
175
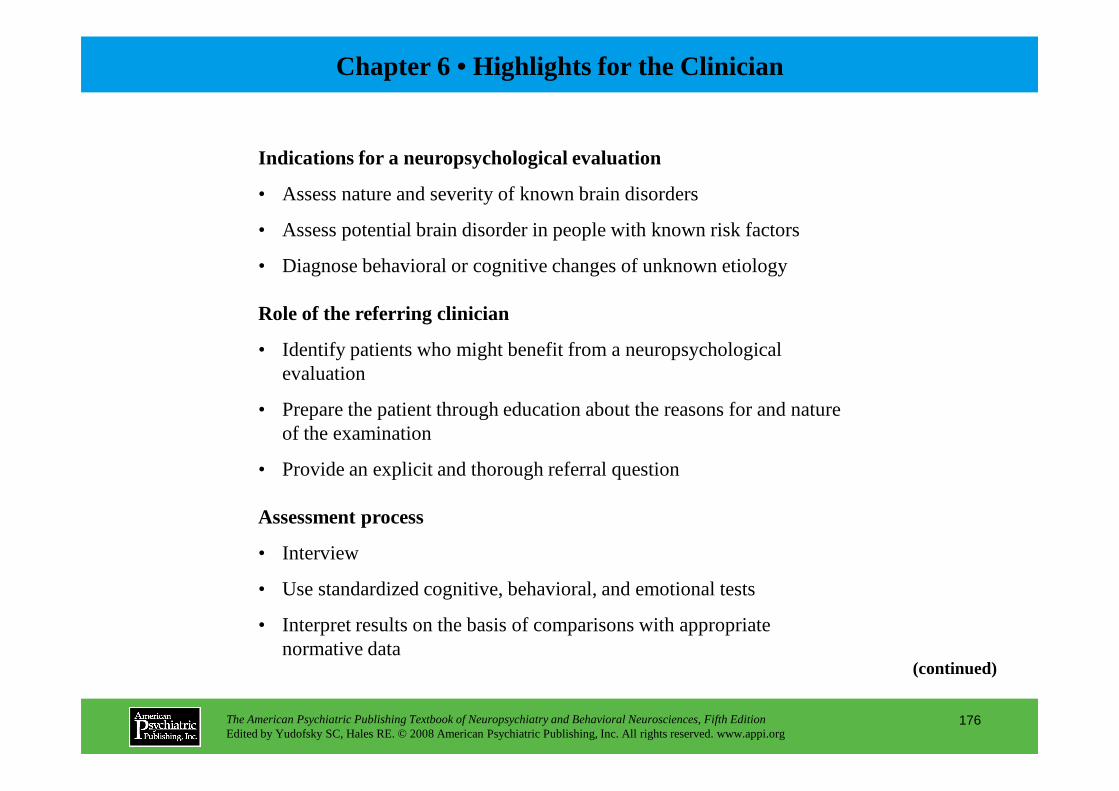
Chapter 6 • Highlights for the Clinician
Indications for a neuropsychological evaluation
• Assess nature and severity of known brain disorders
• Assess potential brain disorder in people with known risk factors
• Diagnose behavioral or cognitive changes of unknown etiology
Role of the referring clinician
• Identify patients who might benefit from a neuropsychologicalevaluation
The American Psychiatric Publishing Textbook of Neuropsychiatry and Behavioral Neurosciences, Fifth EditionEdited by Yudofsky SC, Hales RE. © 2008 American Psychiatric Publishing, Inc. All rights reserved. www.appi.org
176
• Prepare the patient through education about the reasons for and nature of the examination
• Provide an explicit and thorough referral question
Assessment process
• Interview
• Use standardized cognitive, behavioral, and emotional tests
• Interpret results on the basis of comparisons with appropriate normative data
(continued)
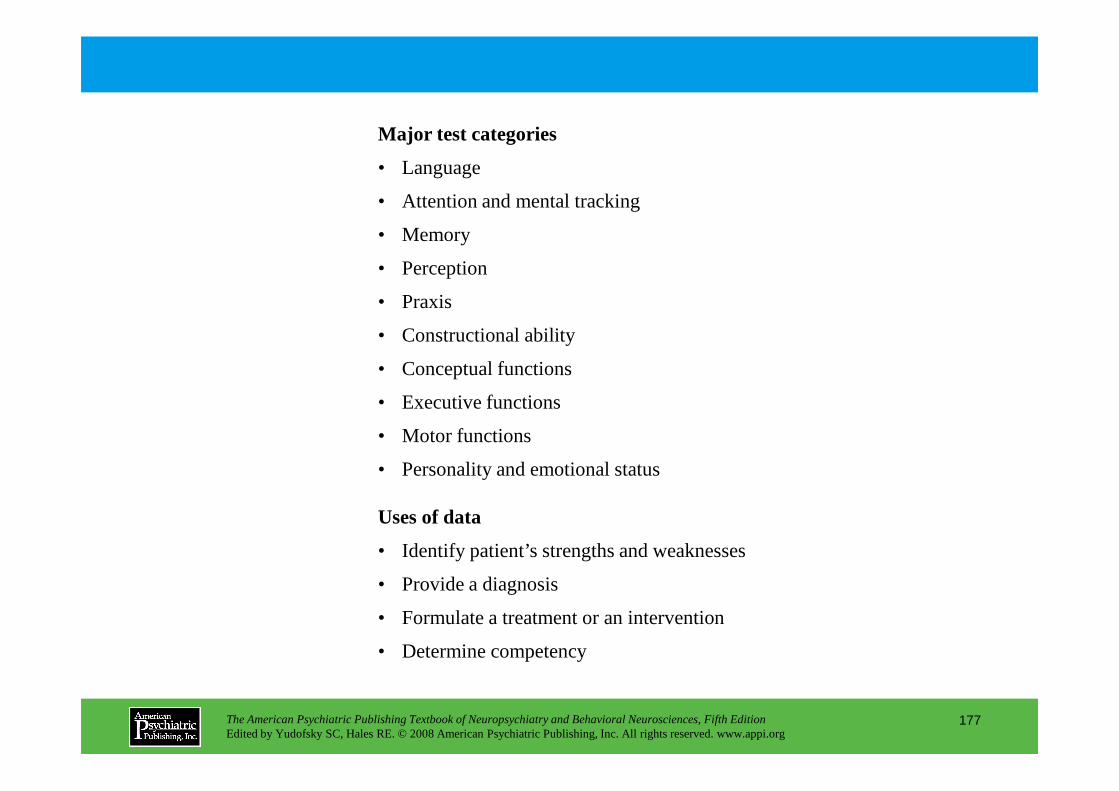
Major test categories
• Language
• Attention and mental tracking
• Memory
• Perception
• Praxis
• Constructional ability
• Conceptual functions
• Executive functions
The American Psychiatric Publishing Textbook of Neuropsychiatry and Behavioral Neurosciences, Fifth EditionEdited by Yudofsky SC, Hales RE. © 2008 American Psychiatric Publishing, Inc. All rights reserved. www.appi.org
177
• Executive functions
• Motor functions
• Personality and emotional status
Uses of data
• Identify patient’s strengths and weaknesses
• Provide a diagnosis
• Formulate a treatment or an intervention
• Determine competency
CHAPTER 7
CLINICAL AND FUNCTIONALIMAGING IN NEUROPSYCHIATRY
Robin A. Hurley, M.D.Ronald E. Fisher, M.D., Ph.D.
Katherine H. Taber, Ph.D.
The American Psychiatric Publishing Textbook of Neuropsychiatry and Behavioral Neurosciences, Fifth EditionEdited by Yudofsky SC, Hales RE. © 2008 American Psychiatric Publishing, Inc. All rights reserved. www.appi.org
178
Slide Show
Topic headings and reading list
Tables and figures
Highlights for the clinician
Main menu
(About, Contents, Contributors, Publishing facts)
General Principles of Structural Imaging
Practical ConsiderationsOrdering the ExaminationContrast-Enhanced StudiesPatient PreparationUnderstanding the Scan
What Can Be Learned From Structural Imaging?
Computed Tomographic ImagingTechnical Considerations
Standard Two-Dimensional CTThree-Dimensional CT (Single-Slice and
Multislice Helical CT)Contrast Agents
Nuclear Brain Imaging: Positron Emission Tomography and Single-Photon Emission Computed TomographyPractical Considerations
Ordering the ExaminationPatient PreparationUnderstanding the Scan
Single-Photon Emission Computed Tomographic ImagingTechnical ConsiderationsSafety and Contraindications
Positron Emission Tomographic ImagingTechnical ConsiderationsSafety and Contraindications
CHAPTER 7 • Topics and Readings
The American Psychiatric Publishing Textbook of Neuropsychiatry and Behavioral Neurosciences, Fifth EditionEdited by Yudofsky SC, Hales RE. © 2008 American Psychiatric Publishing, Inc. All rights reserved. www.appi.org
179
Contrast Agents
Magnetic Resonance ImagingPhysical Principles
Reconstructing an ImageCommon Pulse SequencesNew Pulse Sequences
Contrast AgentsSafety and Contraindications
MRI Versus CT
General Principles of Functional Imaging
Safety and Contraindications
Clinical ApplicationsSPECT Versus PETPrimary DementiasEpilepsyVascular DiseaseTraumatic Brain Injury
SPECT and PET: Imaging Neurotransmitter Systems
Conclusion: SPECT and PET in Neuropsychiatry
Xenon-Enhanced Computed Tomography (Xe/CT)
(continued)
CHAPTER 7 • Topics and Readings (continued)
Functional Magnetic Resonance Imaging
Magnetic Resonance Spectroscopy
Magnetoencephalographic Imaging
Normal Imaging AnatomyCerebral CortexBasal Ganglia
Caudate NucleusPutamenGlobus PallidusSubstantia Nigra
Limbic SystemHippocampal Formation and
Parahippocampal CortexAmygdala
RECOMMENDED READINGSAnderson KE, Taber KH, Hurley RA: Functional
imaging, in Textbook of Traumatic Brain Injury. Edited by Silver JM, McAllister TW, Yudofsky SC. Washington, DC, American Psychiatric Publishing, 2005, pp 107–133
Dalgleish T: The emotional brain. Nat Rev Neurosci 5:583–589, 2004
Erhart SM, Young AS, Marder SR, et al: Clinical utility of magnetic resonance imaging radiographs for suspected organic syndromes in adult psychiatry. J Clin Psychiatry 66:968–973, 2005
Gupta A, Elheis M, Pansari K: Imaging in psychiatric illness. Int J Clin Pract 58:850–858, 2004
Schmahmann JD: Disorders of the cerebellum: ataxia,
The American Psychiatric Publishing Textbook of Neuropsychiatry and Behavioral Neurosciences, Fifth EditionEdited by Yudofsky SC, Hales RE. © 2008 American Psychiatric Publishing, Inc. All rights reserved. www.appi.org
180
AmygdalaMamillary BodyThalamus
HypothalamusPonsCerebellum
Schmahmann JD: Disorders of the cerebellum: ataxia, dysmetria of thought, and the cerebellar cognitive affective syndrome. J Neuropsychiatry Clin Neurosci 16:367–378, 2004
Tekin S, Cummings JL: Frontal-subcortical neuronal circuits and clinical neuropsychiatry—an update. J Psychosom Res 53:647–654, 2002

CHAPTER 7 • Tables and Figures
Table 7–1. Brain imaging modalities
Table 7–2. Indications for imaging
Figure 7–1. The head coil used in magnetic resonance imaging fits rather snugly.
Figure 7–2. A first-generation computed tomography scanner
Table 7–3. Relative gray-scale appearance on a noncontrast computed tomography scan
Figure 7–3. Schematic of a conventional computed tomography X-ray tube and detector
Figure 7–4. Computed tomography header information and arbitrary gray scale
Figure 7–5. Three-dimensional reconstruction from helical (spiral) computed tomography allows viewing of data sets from any desired angle.
Figure 7–6. Contrast agents, when administered as a fast bolus, can be used to measure several aspects of cerebral perfusion.
The American Psychiatric Publishing Textbook of Neuropsychiatry and Behavioral Neurosciences, Fifth EditionEdited by Yudofsky SC, Hales RE. © 2008 American Psychiatric Publishing, Inc. All rights reserved. www.appi.org
181
of cerebral perfusion.
Figure 7–7. Higher-field (>1.5 T) magnetic resonance scanners are becoming increasingly available.
Figure 7–8. Magnetic resonance scanners come in a variety of magnetic field strengths.
Figure 7–9. The traditional magnetic resonance scanner is an enclosing tunnel.
Figure 7–10. Magnetic resonance imaging header information and arbitrary gray scale
Table 7–4. Relative gray-scale values present in tissues visible on magnetic resonance imaging scans (non-contrast-enhanced)
Figure 7–11. Comparison of axial T2-weighted and fluid-attenuated inversion recovery magnetic resonance imaging . . .
Figure 7–12. Gray matter contains cell bodies and processes and is quite heterogeneous.
Figure 7–13. Some types of pathology are much more easily visualized following administration of a contrast agent. (continued)

CHAPTER 7 • Tables and Figures (continued)
Table 7–5. Factors considered when choosing computed tomography or magnetic resonance imaging examination
Figure 7–14. Computed tomography is the preferred imaging method for acute head injury.
Figure 7–15. Many types of pathology are more easily seen on magnetic resonance imaging than on computed tomographic imaging.
Figure 7–16. Magnetic resonance imaging has many clinical applications.
Table 7–6. Radiotracers for functional brain imaging
Figure 7–17. Two of the three cameras of this multidetector single-photon emission computedtomography system . . .
Figure 7–18. Three-dimensional reconstructions provide another way to view functional images.
Figure 7–19. A ring of detectors is used to acquire a positron emission tomography image.
Figure 7–20. Positron emission tomographic imaging of cerebral metabolism is quite useful in diagnosis
The American Psychiatric Publishing Textbook of Neuropsychiatry and Behavioral Neurosciences, Fifth EditionEdited by Yudofsky SC, Hales RE. © 2008 American Psychiatric Publishing, Inc. All rights reserved. www.appi.org
182
Figure 7–20. Positron emission tomographic imaging of cerebral metabolism is quite useful in diagnosis of Alzheimer’s disease.
Figure 7–21. Regional cerebral blood flow in Alzheimer’s disease
Figure 7–22. A common finding in dementia with Lewy bodies is decreased perfusion in occipital cortex.
Figure 7–23. The dopamine transporter is a presynaptic receptor that ferries dopamine back into the presynaptic terminal.
Figure 7–24. A common finding in frontotemporal dementia (e.g., Pick’s disease) is decreased perfusion in frontal and temporal cortex.
Figure 7–25. A common finding in Creutzfeldt-Jakob disease is large asymmetrical areas of decreased perfusion in cortex.
Figure 7–26. A characteristic finding early in Huntington’s disease is decreased perfusion in the basal ganglia.
Figure 7–27. Nuclear medicine imaging is useful for visualizing the area of an epileptic focus.
Figure 7–28. Areas that are compromised but still functional in acute stroke can be identified . . . (continued)
CHAPTER 7 • Tables and Figures (continued)
Figure 7–29. This schematic diagram of a dopamine synapse in the striatum illustrates the functionof presynaptic DA transporters.
Figure 7–30. The primary clinical use of dopamine transporter imaging is in the diagnostic evaluation of early Parkinson’s disease.
Figure 7–31. Positron emission tomography can be used to image nigrostriatal dopaminergic function.
Figure 7–32. A standard computed tomography scanner is used for xenon-enhanced computed tomographic imaging of cerebral blood flow.
Figure 7–33. Areas at risk for ischemic injury are not always obvious on baseline xenon-enhanced computed tomographic images.
Figure 7–34. This cartoon of a lateral view of the brain and skull shows the approximate positions and configurations of the major subcortical structures.
Figure 7–35. T1-weighted axial magnetic resonance image with major tracts and brain regions labeled
Figure 7–36. T1-weighted axial magnetic resonance image with major tracts and brain regions labeled
The American Psychiatric Publishing Textbook of Neuropsychiatry and Behavioral Neurosciences, Fifth EditionEdited by Yudofsky SC, Hales RE. © 2008 American Psychiatric Publishing, Inc. All rights reserved. www.appi.org
183
Figure 7–36. T1-weighted axial magnetic resonance image with major tracts and brain regions labeled
Figure 7–37. T1-weighted axial magnetic resonance image with major tracts and brain regions labeled
Figure 7–38. T1-weighted axial magnetic resonance image with major tracts and brain regions labeled
Figure 7–39. T1-weighted axial magnetic resonance image with major tracts and brain regions labeled
Figure 7–40. T1-weighted axial magnetic resonance image with major tracts and brain regions labeled
Figure 7–41. T1-weighted axial magnetic resonance image with major tracts and brain regions labeled
Figure 7–42. T1-weighted sagittal magnetic resonance images with major brain regions labeled
Figure 7–43. T1-weighted sagittal magnetic resonance images with major brain regions labeled
Figure 7–44. Schematic diagram of the emotion and memory circuit of Papez
Figure 7–45. Schematic diagrams of the medial surface of the right cerebral hemisphere showing the outer and inner limbic lobes
Summary Highlights for the Clinician
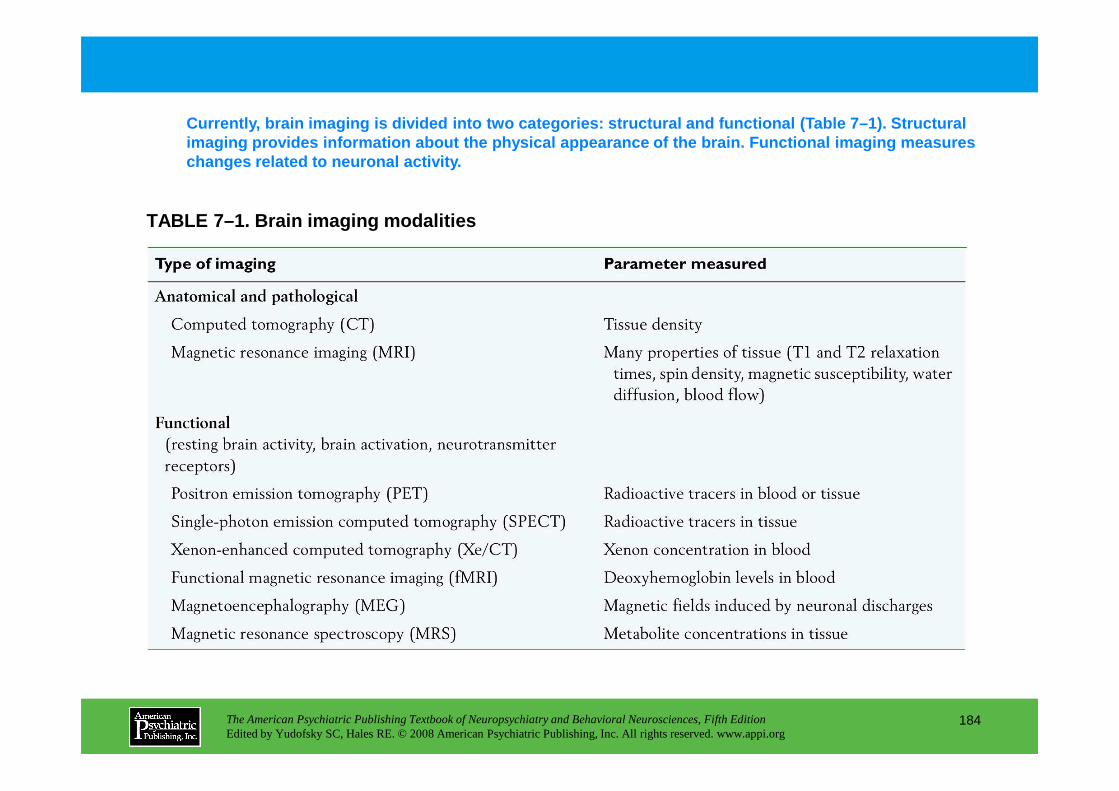
Currently, brain imaging is divided into two catego ries: structural and functional (Table 7–1). Struct ural imaging provides information about the physical app earance of the brain. Functional imaging measures changes related to neuronal activity.
TABLE 7–1. Brain imaging modalities
The American Psychiatric Publishing Textbook of Neuropsychiatry and Behavioral Neurosciences, Fifth EditionEdited by Yudofsky SC, Hales RE. © 2008 American Psychiatric Publishing, Inc. All rights reserved. www.appi.org
184
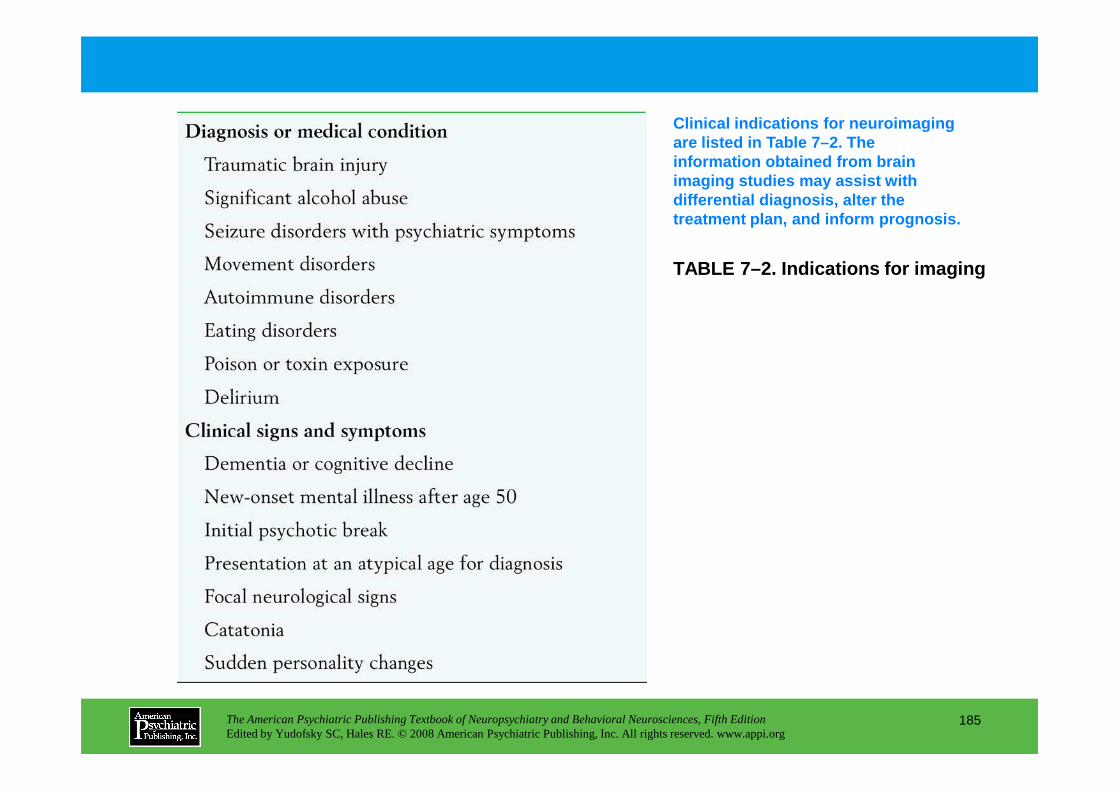
TABLE 7–2. Indications for imaging
Clinical indications for neuroimaging are listed in Table 7–2. The information obtained from brain imaging studies may assist with differential diagnosis, alter the treatment plan, and inform prognosis.
The American Psychiatric Publishing Textbook of Neuropsychiatry and Behavioral Neurosciences, Fifth EditionEdited by Yudofsky SC, Hales RE. © 2008 American Psychiatric Publishing, Inc. All rights reserved. www.appi.org
185

FIGURE 7–1. The head coil used in magnetic resonance imaging fits rather snugly, which can be difficult for some patients.
The psychiatrist should explain the scanning proced ure to the patient shortly beforehand, mentioning the loud noises (MRI), the tightly enclosing coil ( MRI— see Figure 7–1), and the need for absolute immobility during the test (MRI and CT).
Openings have been included in modern head coils to
The American Psychiatric Publishing Textbook of Neuropsychiatry and Behavioral Neurosciences, Fifth EditionEdited by Yudofsky SC, Hales RE. © 2008 American Psychiatric Publishing, Inc. All rights reserved. www.appi.org
186
in modern head coils to improve patient tolerance.
Source.Pictures courtesy of Phillips Medical Systems.
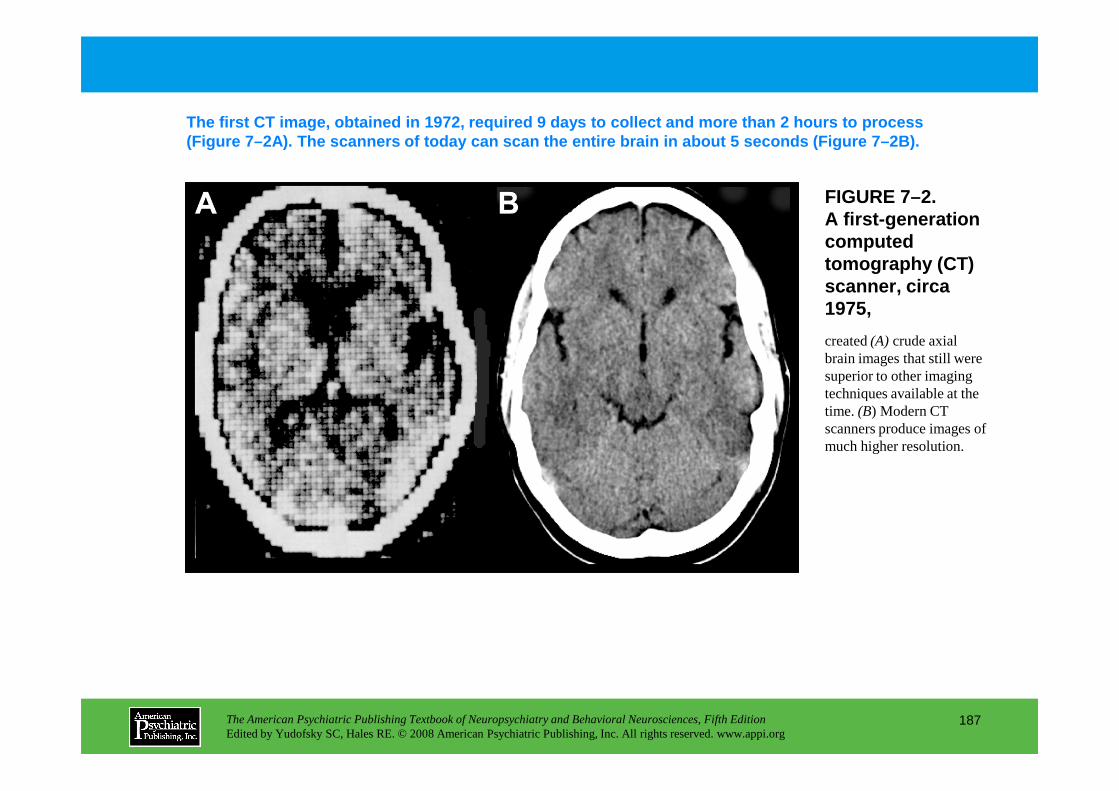
created (A) crude axial brain images that still were superior to other imaging techniques available at the
FIGURE 7–2. A first-generation computed tomography (CT) scanner, circa 1975,
The first CT image, obtained in 1972, required 9 da ys to collect and more than 2 hours to process (Figure 7–2A). The scanners of today can scan the e ntire brain in about 5 seconds (Figure 7–2B).
The American Psychiatric Publishing Textbook of Neuropsychiatry and Behavioral Neurosciences, Fifth EditionEdited by Yudofsky SC, Hales RE. © 2008 American Psychiatric Publishing, Inc. All rights reserved. www.appi.org
187
techniques available at the time. (B) Modern CT scanners produce images of much higher resolution.
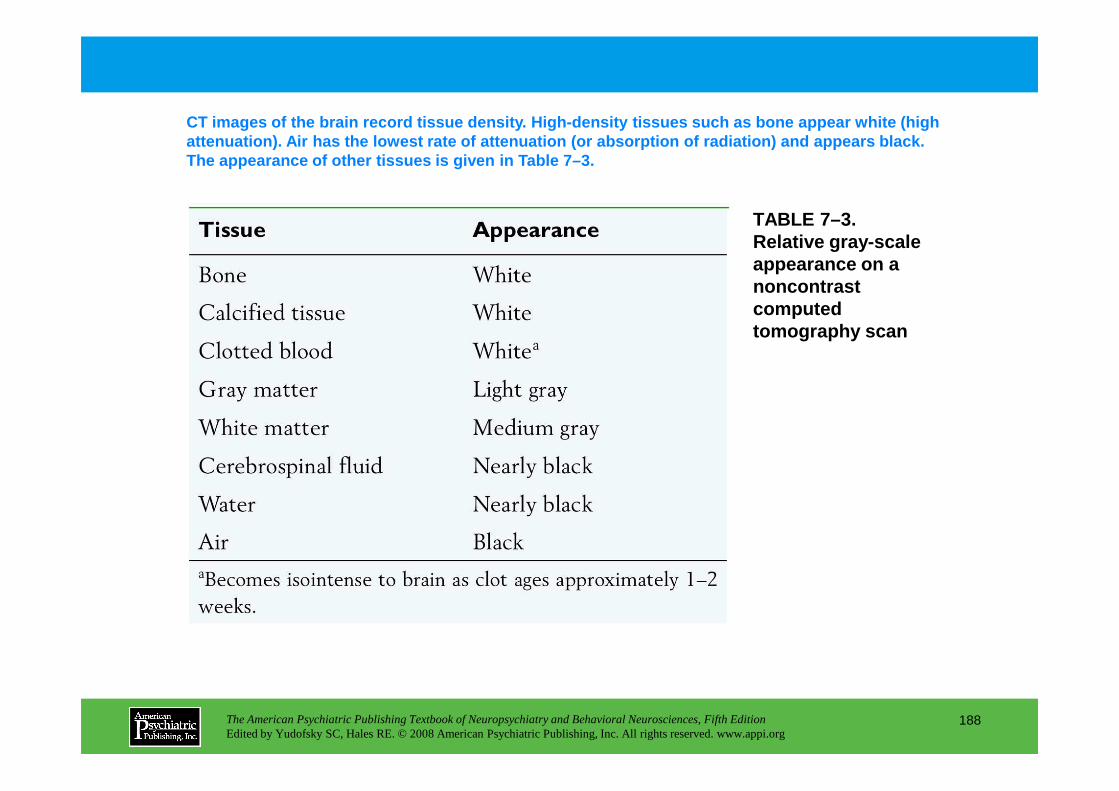
TABLE 7–3. Relative gray-scale appearance on a noncontrast computed tomography scan
CT images of the brain record tissue density. High- density tissues such as bone appear white (high attenuation). Air has the lowest rate of attenuatio n (or absorption of radiation) and appears black. The appearance of other tissues is given in Table 7 –3.
The American Psychiatric Publishing Textbook of Neuropsychiatry and Behavioral Neurosciences, Fifth EditionEdited by Yudofsky SC, Hales RE. © 2008 American Psychiatric Publishing, Inc. All rights reserved. www.appi.org
188
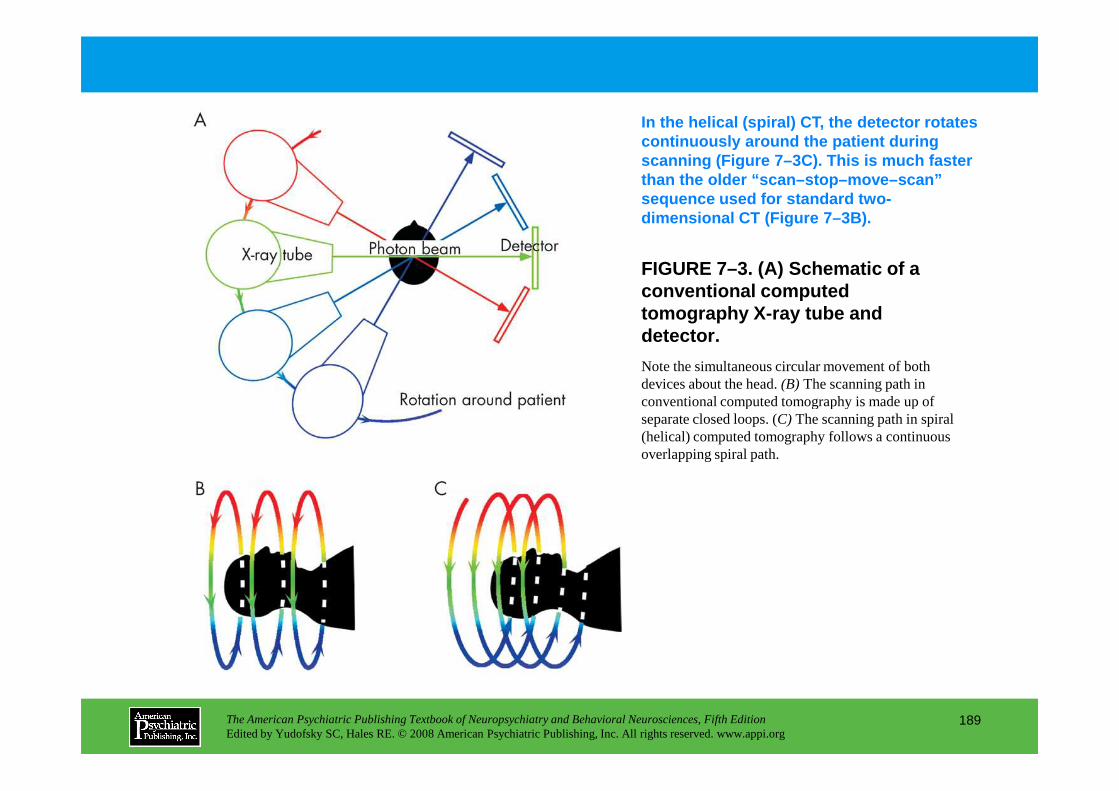
FIGURE 7–3. (A) Schematic of a conventional computed tomography X-ray tube and detector.
In the helical (spiral) CT, the detector rotates continuously around the patient during scanning (Figure 7–3C). This is much faster than the older “scan–stop–move–scan” sequence used for standard two-dimensional CT (Figure 7–3B).
Note the simultaneous circular movement of both devices about the head. (B) The scanning path in conventional computed tomography is made up of
The American Psychiatric Publishing Textbook of Neuropsychiatry and Behavioral Neurosciences, Fifth EditionEdited by Yudofsky SC, Hales RE. © 2008 American Psychiatric Publishing, Inc. All rights reserved. www.appi.org
189
conventional computed tomography is made up of separate closed loops. (C) The scanning path in spiral (helical) computed tomography follows a continuous overlapping spiral path.
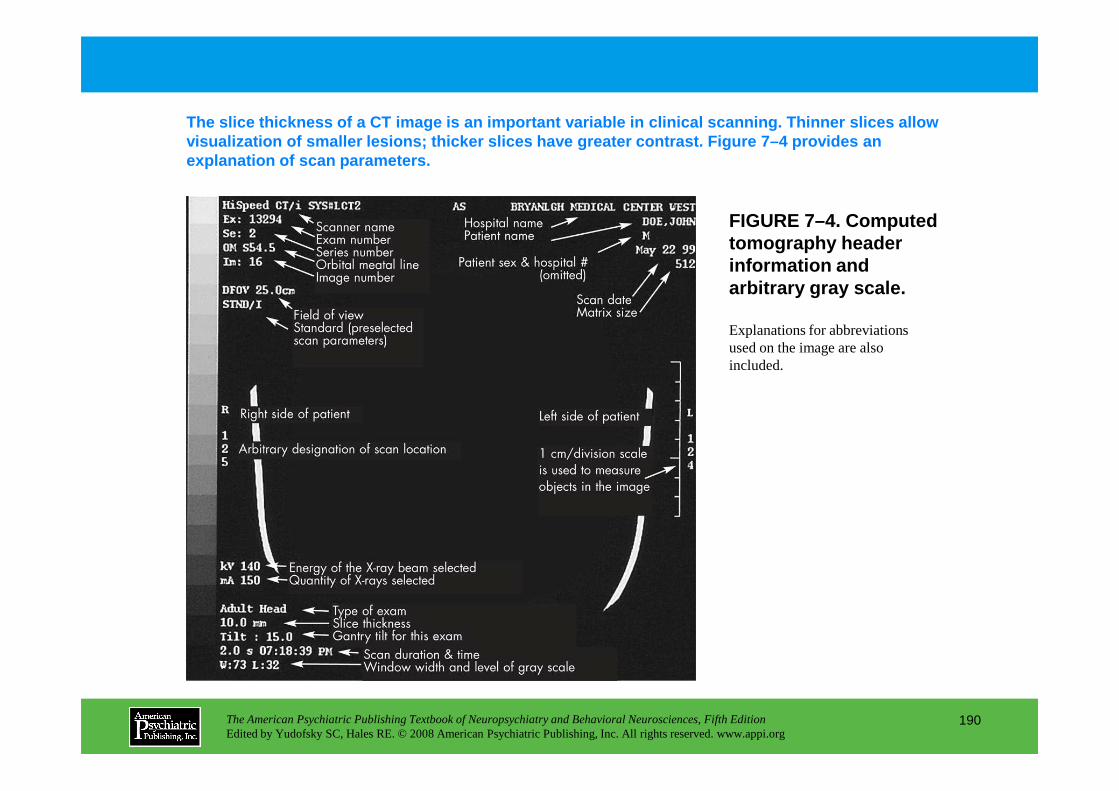
FIGURE 7–4. Computed tomography header information and arbitrary gray scale.
The slice thickness of a CT image is an important v ariable in clinical scanning. Thinner slices allow visualization of smaller lesions; thicker slices hav e greater contrast. Figure 7–4 provides an explanation of scan parameters.
Explanations for abbreviations used on the image are also included.
The American Psychiatric Publishing Textbook of Neuropsychiatry and Behavioral Neurosciences, Fifth EditionEdited by Yudofsky SC, Hales RE. © 2008 American Psychiatric Publishing, Inc. All rights reserved. www.appi.org
190
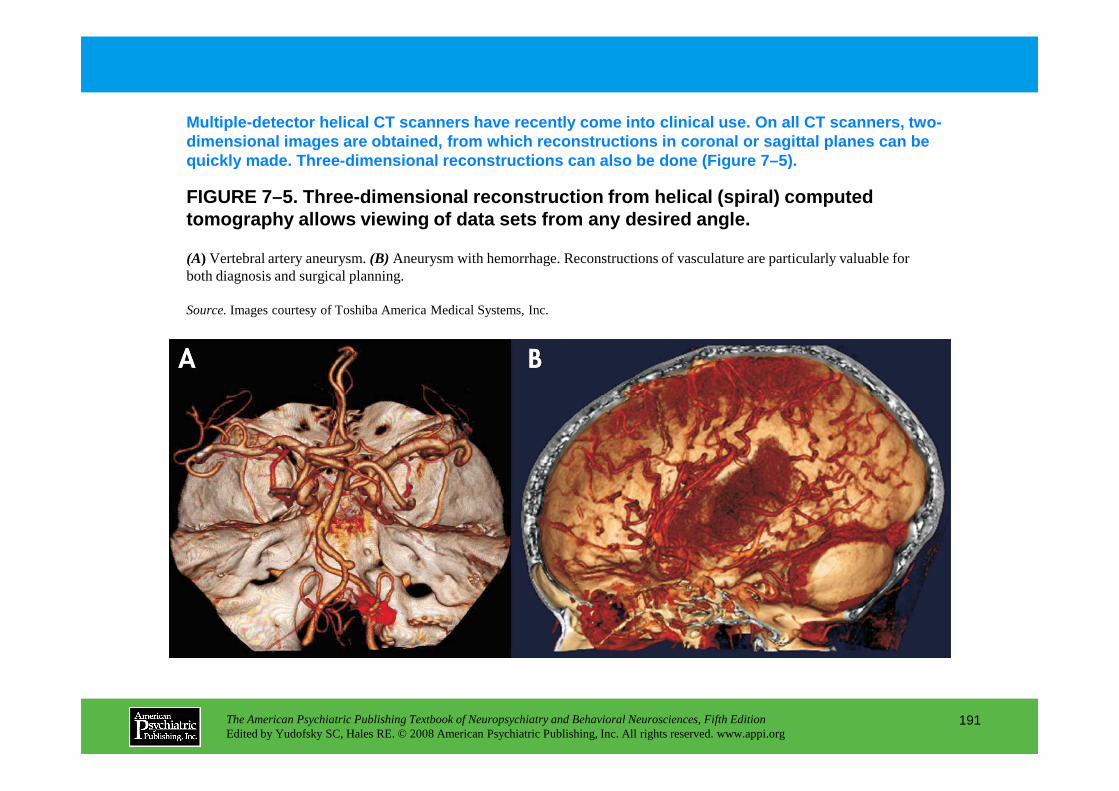
FIGURE 7–5. Three-dimensional reconstruction from h elical (spiral) computed tomography allows viewing of data sets from any des ired angle.
(A) Vertebral artery aneurysm. (B) Aneurysm with hemorrhage. Reconstructions of vasculature are particularly valuable for both diagnosis and surgical planning.
Source.Images courtesy of Toshiba America Medical Systems, Inc.
Multiple-detector helical CT scanners have recently come into clinical use. On all CT scanners, two-dimensional images are obtained, from which reconst ructions in coronal or sagittal planes can be quickly made. Three-dimensional reconstructions can also be done (Figure 7–5).
The American Psychiatric Publishing Textbook of Neuropsychiatry and Behavioral Neurosciences, Fifth EditionEdited by Yudofsky SC, Hales RE. © 2008 American Psychiatric Publishing, Inc. All rights reserved. www.appi.org
191
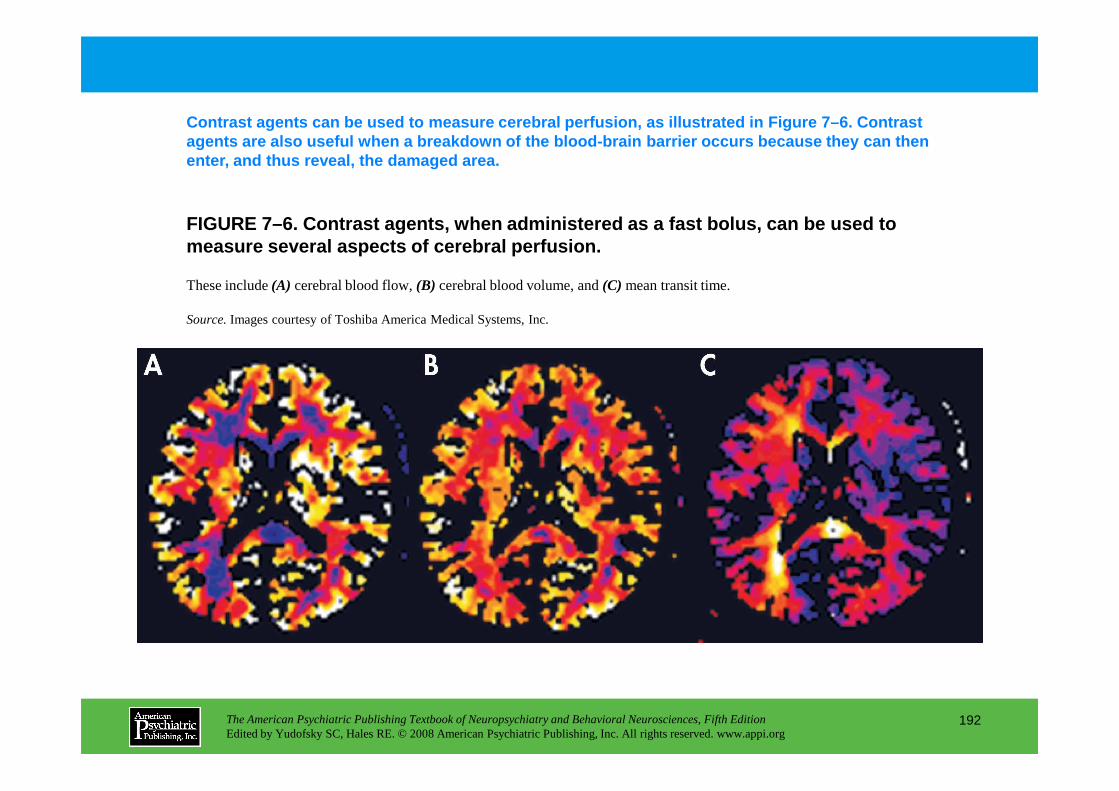
FIGURE 7–6. Contrast agents, when administered as a fast bolus, can be used to measure several aspects of cerebral perfusion.
Contrast agents can be used to measure cerebral per fusion, as illustrated in Figure 7–6. Contrast agents are also useful when a breakdown of the bloo d-brain barrier occurs because they can then enter, and thus reveal, the damaged area.
These include (A) cerebral blood flow, (B) cerebral blood volume, and (C) mean transit time.
Source.Images courtesy of Toshiba America Medical Systems, Inc.
The American Psychiatric Publishing Textbook of Neuropsychiatry and Behavioral Neurosciences, Fifth EditionEdited by Yudofsky SC, Hales RE. © 2008 American Psychiatric Publishing, Inc. All rights reserved. www.appi.org
192

FIGURE 7–7. Higher-field (>1.5 T) magnetic resonance scanners are becoming increasingly available.
A high-field clinical MRI system has a magnetic field strength of 1.5 or 3.0 tesla and can produce images such as those shown in Figure 7–7.
The higher magnetic field strength provides more signal, making higher-resolution structural imaging (left) and chemical shift imaging (right) practical.
Source.Pictures courtesy of Phillips Medical Systems.
The American Psychiatric Publishing Textbook of Neuropsychiatry and Behavioral Neurosciences, Fifth EditionEdited by Yudofsky SC, Hales RE. © 2008 American Psychiatric Publishing, Inc. All rights reserved. www.appi.org
193
Source.Pictures courtesy of Phillips Medical Systems.
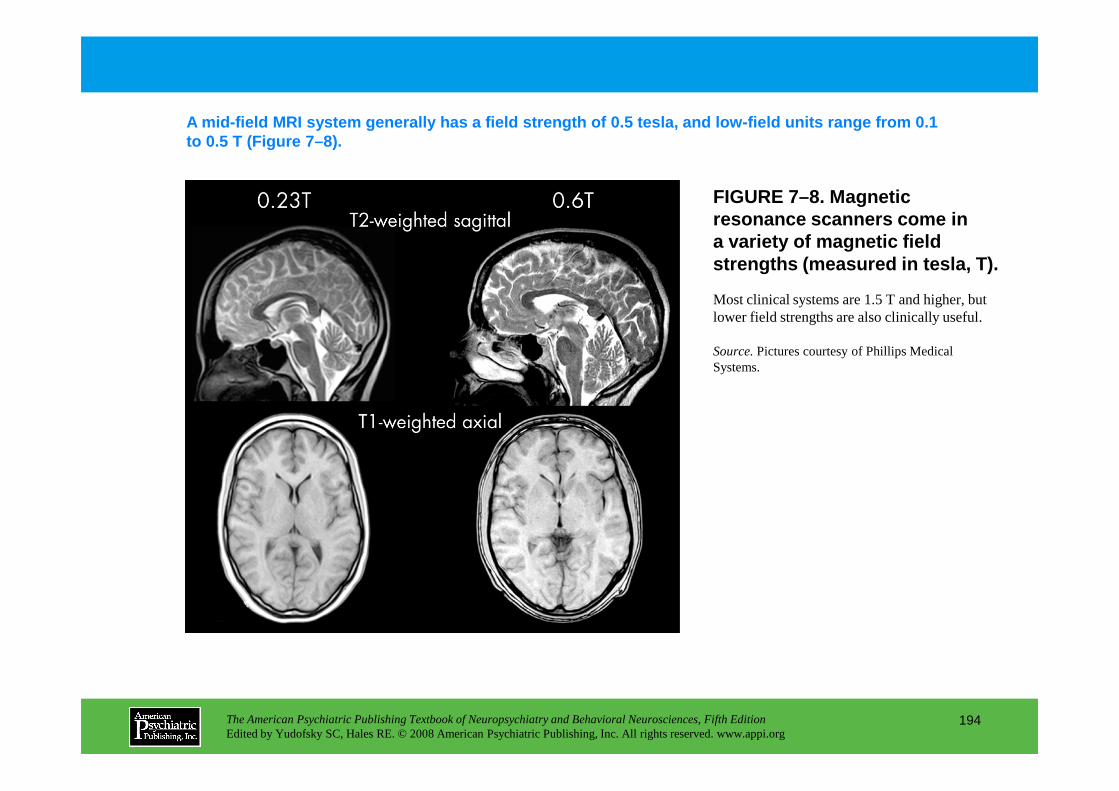
FIGURE 7–8. Magnetic resonance scanners come ina variety of magnetic field strengths (measured in tesla, T).
A mid-field MRI system generally has a field streng th of 0.5 tesla, and low-field units range from 0.1 to 0.5 T (Figure 7–8).
Most clinical systems are 1.5 T and higher, but lower field strengths are also clinically useful.
Source.Pictures courtesy of Phillips Medical Systems.
The American Psychiatric Publishing Textbook of Neuropsychiatry and Behavioral Neurosciences, Fifth EditionEdited by Yudofsky SC, Hales RE. © 2008 American Psychiatric Publishing, Inc. All rights reserved. www.appi.org
194
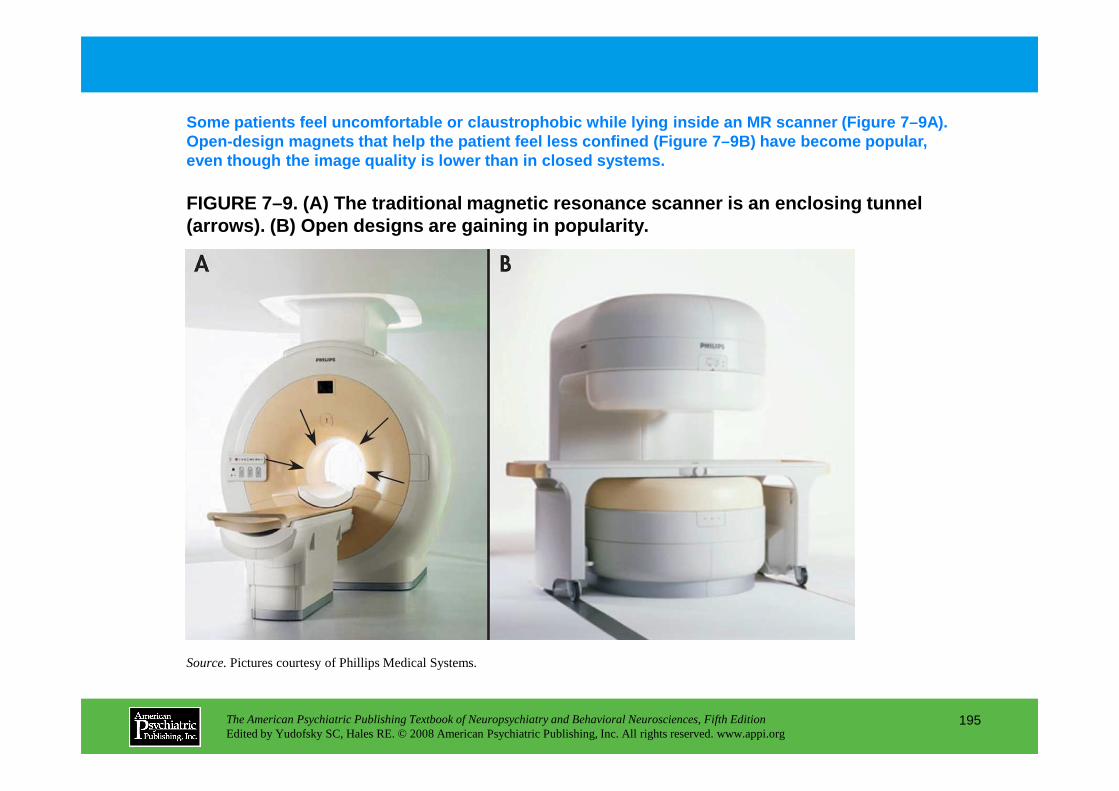
FIGURE 7–9. (A) The traditional magnetic resonance scanner is an en closing tunnel (arrows ). (B) Open designs are gaining in popularity.
Some patients feel uncomfortable or claustrophobic while lying inside an MR scanner (Figure 7–9A). Open-design magnets that help the patient feel less confined (Figure 7–9B) have become popular, even though the image quality is lower than in clos ed systems.
The American Psychiatric Publishing Textbook of Neuropsychiatry and Behavioral Neurosciences, Fifth EditionEdited by Yudofsky SC, Hales RE. © 2008 American Psychiatric Publishing, Inc. All rights reserved. www.appi.org
195
Source.Pictures courtesy of Phillips Medical Systems.
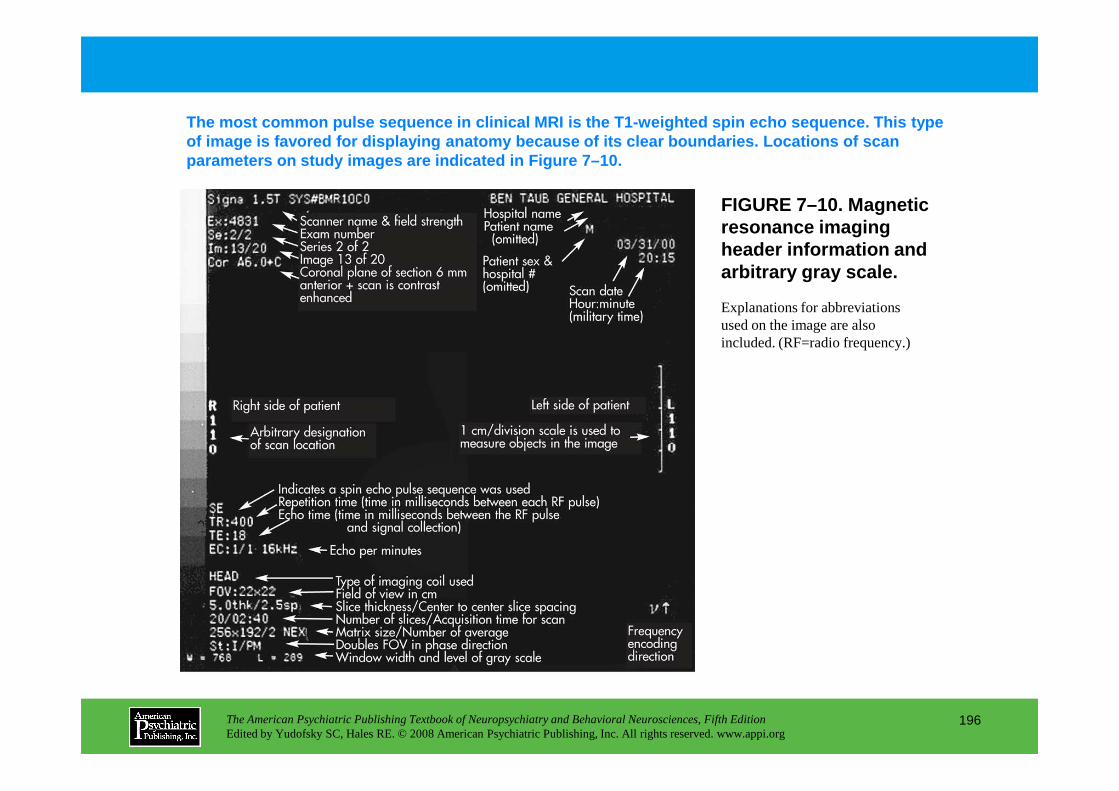
FIGURE 7–10. Magnetic resonance imaging header information and arbitrary gray scale.
The most common pulse sequence in clinical MRI is t he T1-weighted spin echo sequence. This type of image is favored for displaying anatomy because of its clear boundaries. Locations of scan parameters on study images are indicated in Figure 7–10.
Explanations for abbreviations used on the image are also included. (RF=radio frequency.)
The American Psychiatric Publishing Textbook of Neuropsychiatry and Behavioral Neurosciences, Fifth EditionEdited by Yudofsky SC, Hales RE. © 2008 American Psychiatric Publishing, Inc. All rights reserved. www.appi.org
196
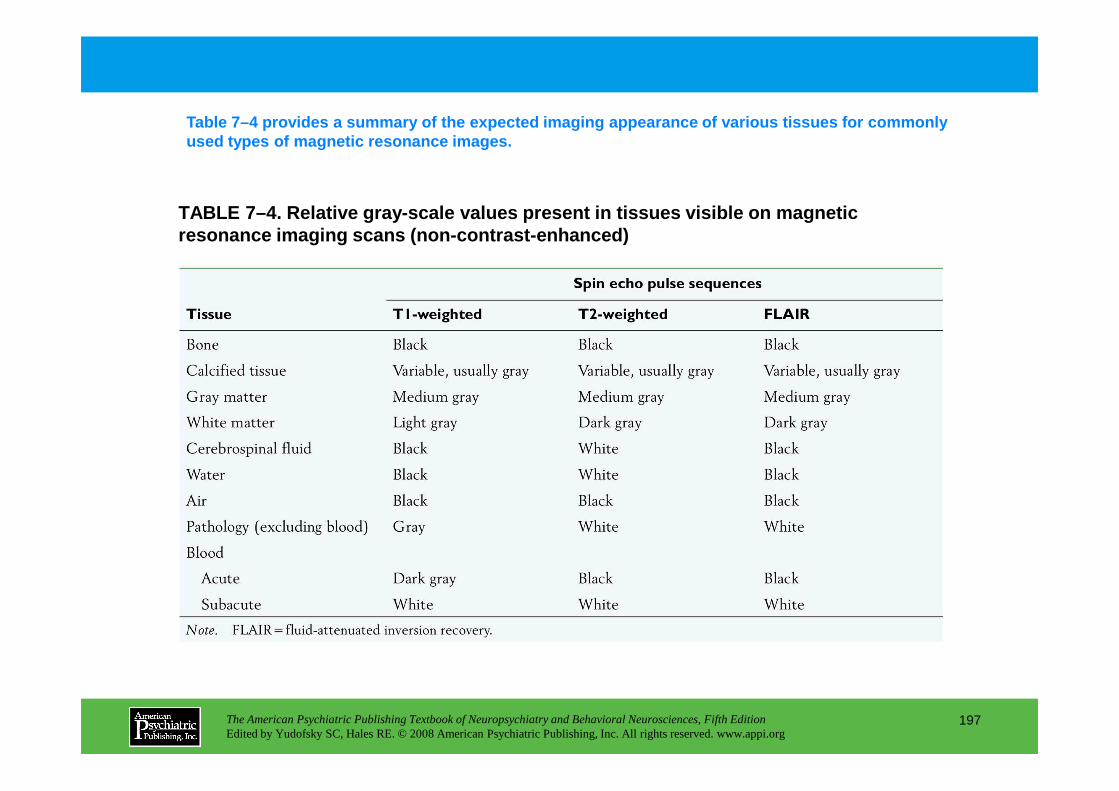
TABLE 7–4. Relative gray-scale values present in ti ssues visible on magnetic resonance imaging scans (non-contrast-enhanced)
Table 7–4 provides a summary of the expected imagin g appearance of various tissues for commonly used types of magnetic resonance images.
The American Psychiatric Publishing Textbook of Neuropsychiatry and Behavioral Neurosciences, Fifth EditionEdited by Yudofsky SC, Hales RE. © 2008 American Psychiatric Publishing, Inc. All rights reserved. www.appi.org
197
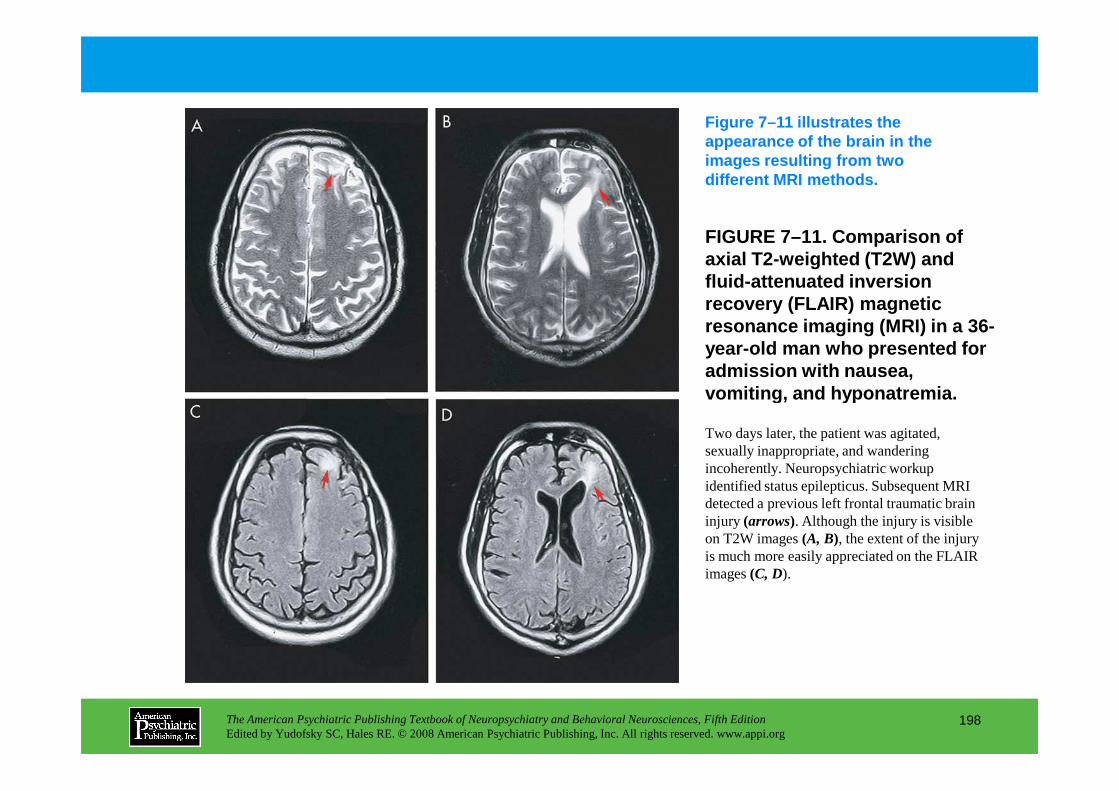
FIGURE 7–11. Comparison of axial T2-weighted (T2W) and fluid-attenuated inversion recovery (FLAIR) magnetic resonance imaging (MRI) in a 36-year-old man who presented for admission with nausea, vomiting, and hyponatremia.
Figure 7–11 illustrates the appearance of the brain in the images resulting from two different MRI methods.
The American Psychiatric Publishing Textbook of Neuropsychiatry and Behavioral Neurosciences, Fifth EditionEdited by Yudofsky SC, Hales RE. © 2008 American Psychiatric Publishing, Inc. All rights reserved. www.appi.org
198
vomiting, and hyponatremia.
Two days later, the patient was agitated, sexually inappropriate, and wandering incoherently. Neuropsychiatric workup identified status epilepticus. Subsequent MRI detected a previous left frontal traumatic brain injury (arrows). Although the injury is visible on T2W images (A, B), the extent of the injury is much more easily appreciated on the FLAIR images (C, D).

Diffusion tensor imaging allows calculation of diff usional speed (which is the same in all directions in gray matter but faster parallel to axons in whit e matter; Figure 7–12). DTI is sensitive to many diffusion-altering processes, including ischemia an d gliosis.
FIGURE 7–12. Gray matter contains cell bodies and p rocesses and is quite heterogeneous.
Water diffusion is the same in all directions (isotropic), as indicated by (A) the similar length of the green and pink arrows. White matter contains tightly packed axons. Water diffusion is faster (B, green arrows)along the length of (parallel to) axons than it is (B, pink arrows) across axons.
The American Psychiatric Publishing Textbook of Neuropsychiatry and Behavioral Neurosciences, Fifth EditionEdited by Yudofsky SC, Hales RE. © 2008 American Psychiatric Publishing, Inc. All rights reserved. www.appi.org
199
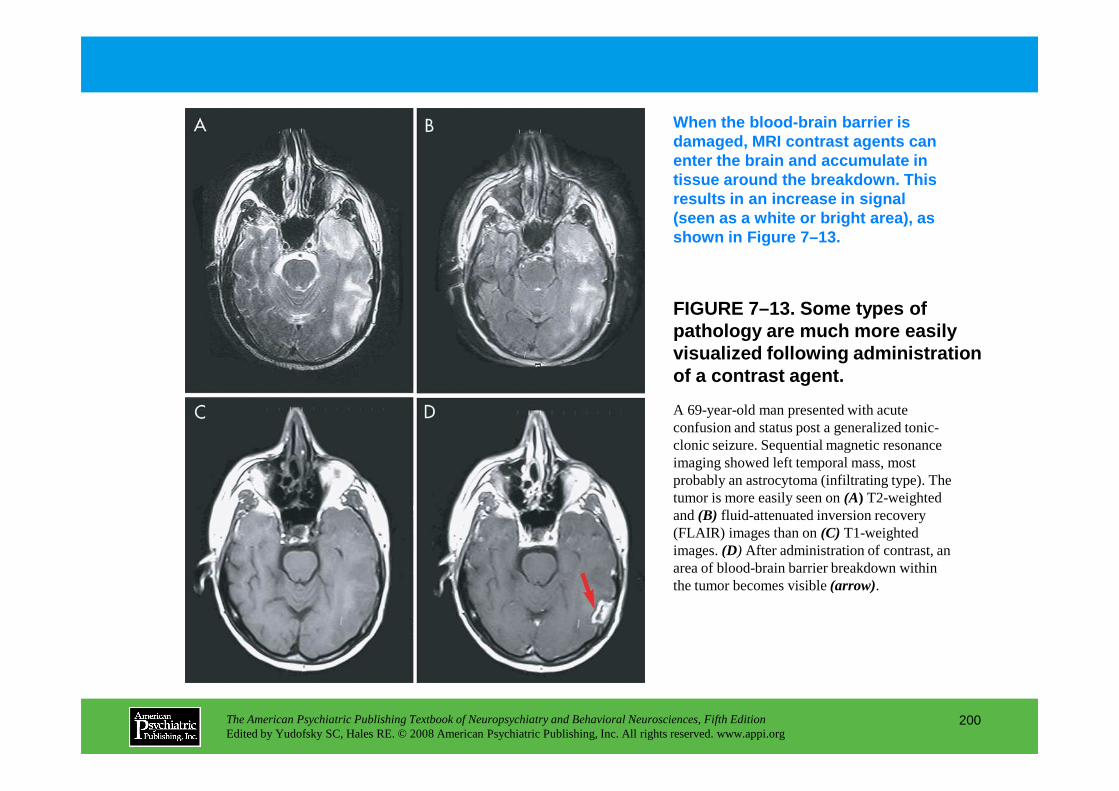
FIGURE 7–13. Some types of pathology are much more easily visualized following administration of a contrast agent.
When the blood-brain barrier is damaged, MRI contrast agents can enter the brain and accumulate in tissue around the breakdown. This results in an increase in signal (seen as a white or bright area), as shown in Figure 7–13.
The American Psychiatric Publishing Textbook of Neuropsychiatry and Behavioral Neurosciences, Fifth EditionEdited by Yudofsky SC, Hales RE. © 2008 American Psychiatric Publishing, Inc. All rights reserved. www.appi.org
200
A 69-year-old man presented with acute confusion and status post a generalized tonic-clonic seizure. Sequential magnetic resonance imaging showed left temporal mass, most probably an astrocytoma (infiltrating type). The tumor is more easily seen on (A) T2-weighted and (B) fluid-attenuated inversion recovery (FLAIR) images than on (C) T1-weighted images. (D) After administration of contrast, an area of blood-brain barrier breakdown within the tumor becomes visible (arrow).

TABLE 7–5. Factors considered when choosing compute d tomography (CT) or magnetic resonance imaging (MRI) examinatio n
The choice of imaging modality should be based on t he anatomy and/or type of pathology that one desires to view. Table 7–5 shows a comparison of CT and MRI for several clinical factors.
The American Psychiatric Publishing Textbook of Neuropsychiatry and Behavioral Neurosciences, Fifth EditionEdited by Yudofsky SC, Hales RE. © 2008 American Psychiatric Publishing, Inc. All rights reserved. www.appi.org
201
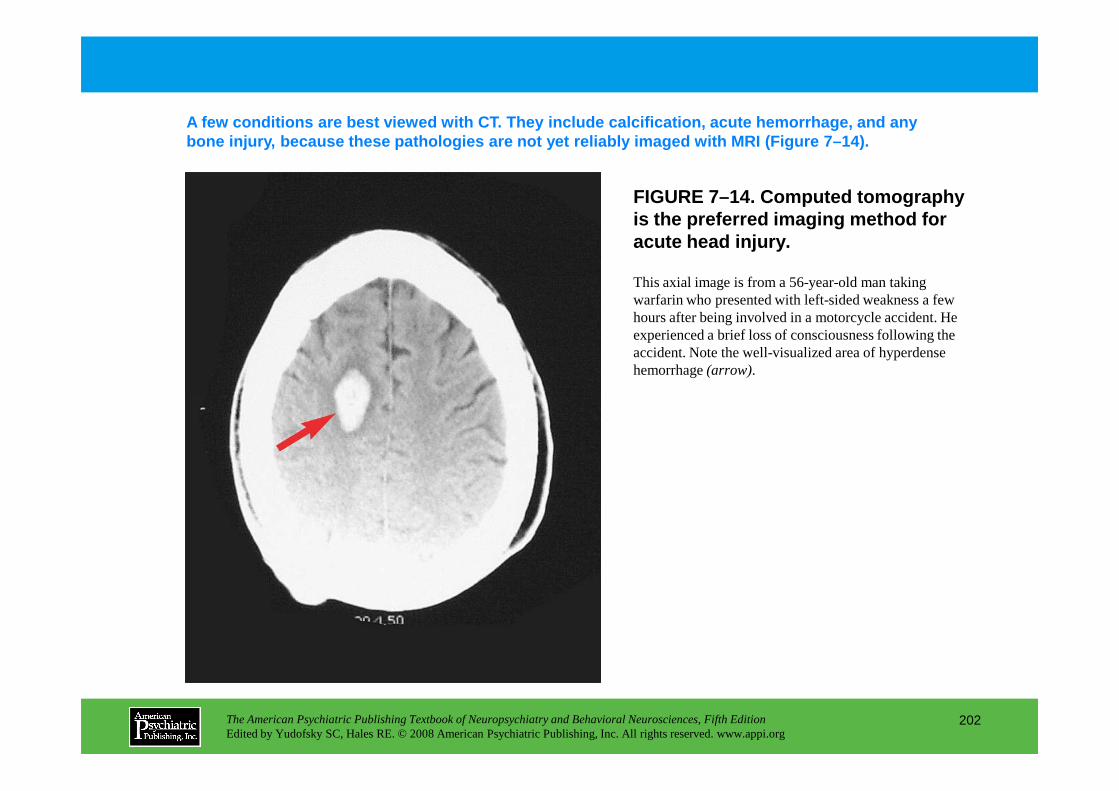
FIGURE 7–14. Computed tomography is the preferred imaging method for acute head injury.
A few conditions are best viewed with CT. They incl ude calcification, acute hemorrhage, and any bone injury, because these pathologies are not yet reliably imaged with MRI (Figure 7–14).
This axial image is from a 56-year-old man taking warfarin who presented with left-sided weakness a few hours after being involved in a motorcycle accident. He experienced a brief loss of consciousness following the accident. Note the well-visualized area of hyperdense hemorrhage (arrow).
The American Psychiatric Publishing Textbook of Neuropsychiatry and Behavioral Neurosciences, Fifth EditionEdited by Yudofsky SC, Hales RE. © 2008 American Psychiatric Publishing, Inc. All rights reserved. www.appi.org
202
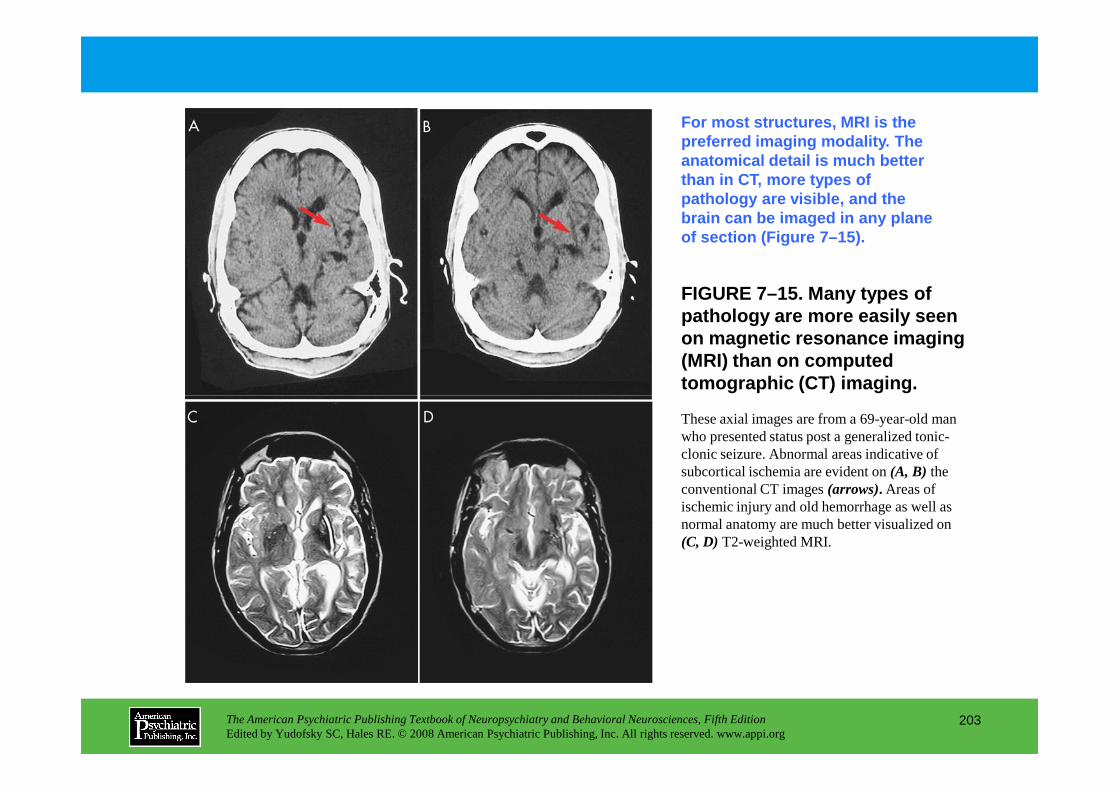
FIGURE 7–15. Many types of pathology are more easily seen on magnetic resonance imaging (MRI) than on computed tomographic (CT) imaging.
For most structures, MRI is the preferred imaging modality. The anatomical detail is much better than in CT, more types of pathology are visible, and the brain can be imaged in any plane of section (Figure 7–15).
The American Psychiatric Publishing Textbook of Neuropsychiatry and Behavioral Neurosciences, Fifth EditionEdited by Yudofsky SC, Hales RE. © 2008 American Psychiatric Publishing, Inc. All rights reserved. www.appi.org
203
These axial images are from a 69-year-old man who presented status post a generalized tonic-clonic seizure. Abnormal areas indicative of subcortical ischemia are evident on (A, B) the conventional CT images(arrows). Areas of ischemic injury and old hemorrhage as well as normal anatomy are much better visualized on (C, D) T2-weighted MRI.
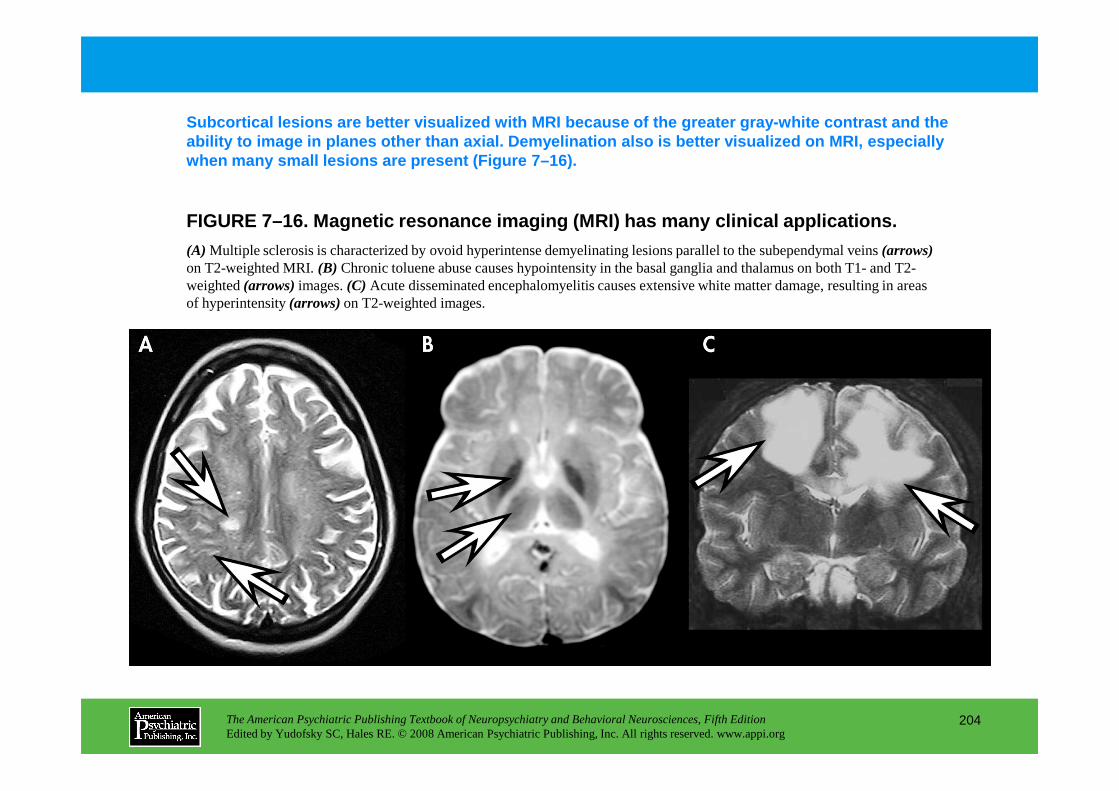
FIGURE 7–16. Magnetic resonance imaging (MRI) has m any clinical applications.
Subcortical lesions are better visualized with MRI b ecause of the greater gray-white contrast and the ability to image in planes other than axial. Demyel ination also is better visualized on MRI, especially when many small lesions are present (Figure 7–16).
(A) Multiple sclerosis is characterized by ovoid hyperintense demyelinating lesions parallel to the subependymal veins (arrows)on T2-weighted MRI. (B) Chronic toluene abuse causes hypointensity in the basal ganglia and thalamus on both T1- and T2-weighted (arrows)images. (C) Acute disseminated encephalomyelitis causes extensive white matter damage, resulting in areas of hyperintensity (arrows)on T2-weighted images.
The American Psychiatric Publishing Textbook of Neuropsychiatry and Behavioral Neurosciences, Fifth EditionEdited by Yudofsky SC, Hales RE. © 2008 American Psychiatric Publishing, Inc. All rights reserved. www.appi.org
204
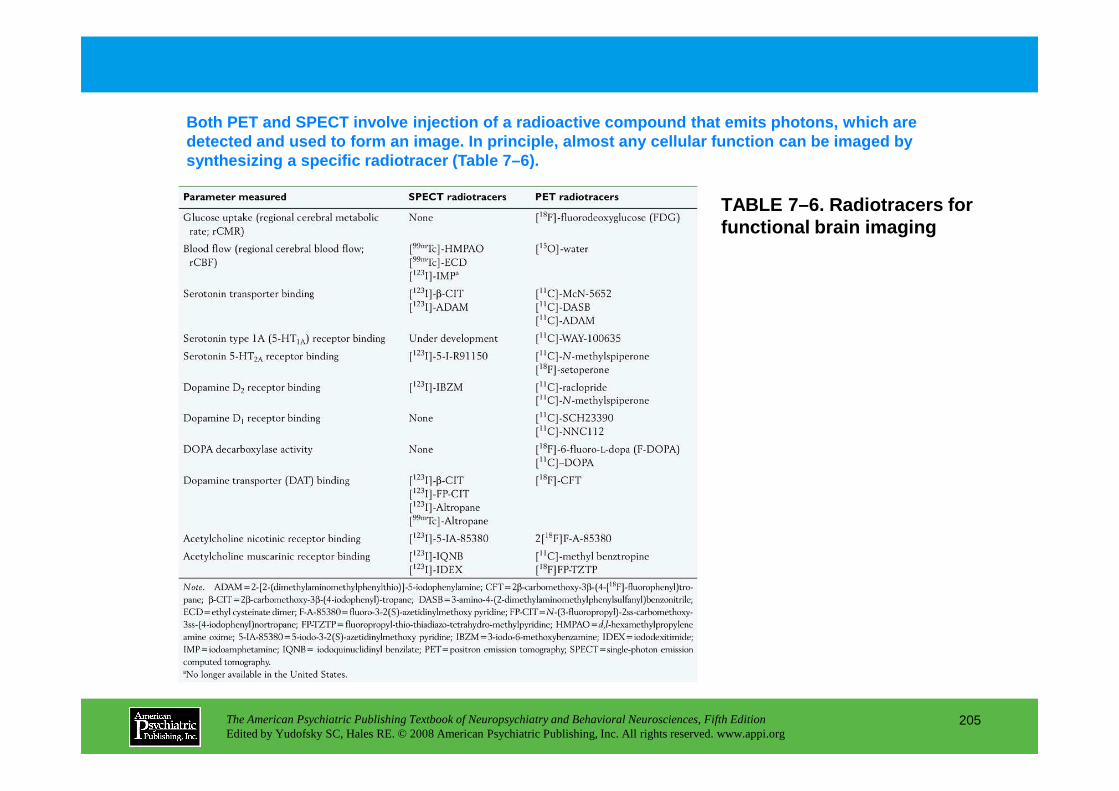
TABLE 7–6. Radiotracers for functional brain imaging
Both PET and SPECT involve injection of a radioacti ve compound that emits photons, which are detected and used to form an image. In principle, a lmost any cellular function can be imaged by synthesizing a specific radiotracer (Table 7–6).
The American Psychiatric Publishing Textbook of Neuropsychiatry and Behavioral Neurosciences, Fifth EditionEdited by Yudofsky SC, Hales RE. © 2008 American Psychiatric Publishing, Inc. All rights reserved. www.appi.org
205

FIGURE 7–17. Two of the three cameras of this multi detector single-photon emission computed tomography (SPECT) system are indicated by arrows.
Nuclear cameras are not nearly as confining as magn etic resonance scanners are and very rarely cause claustrophobic reactions (Figure 7–17).
The cameras rotate around the patient’s head during the imaging examination. Data are collected from multiple positions as the cameras rotate around the patient’s head.
Source.Pictures courtesy of Phillips Medical Systems.
The American Psychiatric Publishing Textbook of Neuropsychiatry and Behavioral Neurosciences, Fifth EditionEdited by Yudofsky SC, Hales RE. © 2008 American Psychiatric Publishing, Inc. All rights reserved. www.appi.org
206
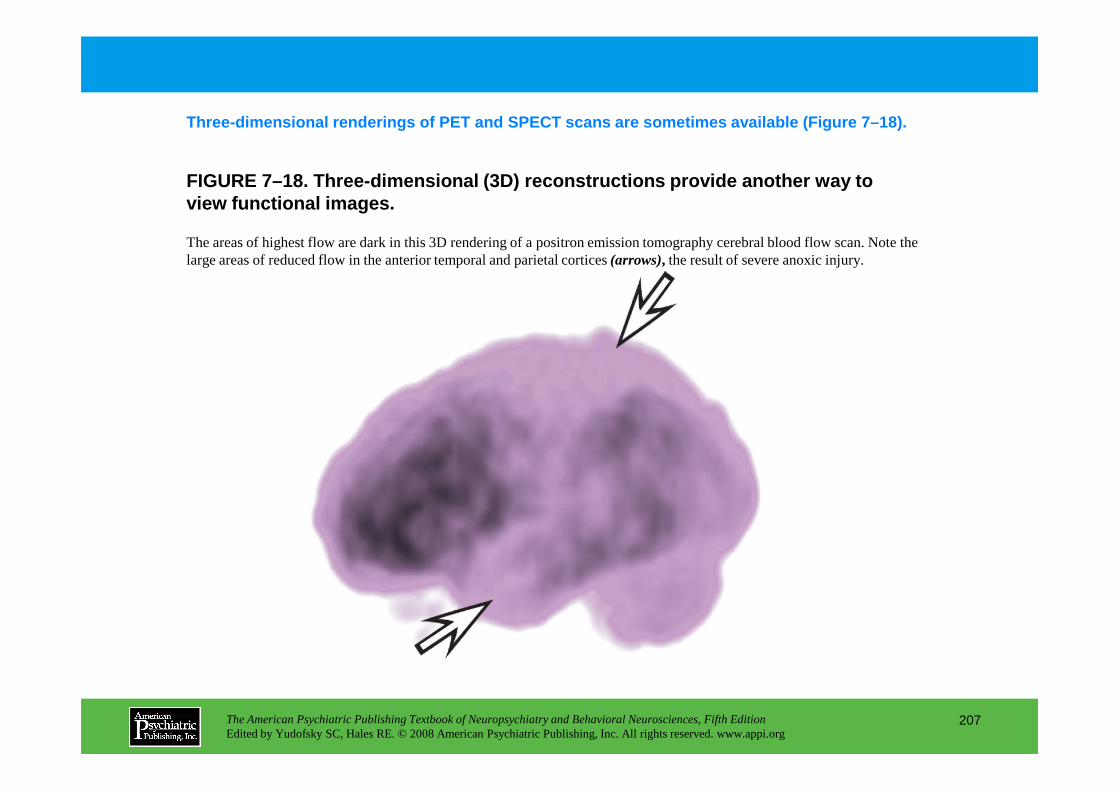
FIGURE 7–18. Three-dimensional (3D) reconstructions provide another way to view functional images.
Three-dimensional renderings of PET and SPECT scans are sometimes available (Figure 7–18).
The areas of highest flow are dark in this 3D rendering of a positron emission tomography cerebral blood flow scan. Note the large areas of reduced flow in the anterior temporal and parietal cortices (arrows), the result of severe anoxic injury.
The American Psychiatric Publishing Textbook of Neuropsychiatry and Behavioral Neurosciences, Fifth EditionEdited by Yudofsky SC, Hales RE. © 2008 American Psychiatric Publishing, Inc. All rights reserved. www.appi.org
207

FIGURE 7–19. PET image acquisiton.
Image acquisition for PET is illustrated in Figure 7–19. A ring of detectors collects data from the emission of photon pairs resulting from the decay o f the injected radiotracer. These data are processed to create an image.
(A) A ring of detectors (numbered blocks) is used to acquire a positron emission tomography (PET) image. A 16-detector ring is illustrated. The detectors are arranged in pairs on opposite sides of the ring to allow simultaneous detection of the photon pair (annihilation coincidence detection). (B)The curved nature of the detector ring results in closer spacing of the lines of
The American Psychiatric Publishing Textbook of Neuropsychiatry and Behavioral Neurosciences, Fifth EditionEdited by Yudofsky SC, Hales RE. © 2008 American Psychiatric Publishing, Inc. All rights reserved. www.appi.org
208
results in closer spacing of the lines of coincidence detection toward the periphery (arrowheads)compared with the center (arrows). Arc correction is applied before reconstruction to make spacing uniform in the image. (C) The number of image slices and the image resolution can be increased by combining detections from within a detector ring (dark gray lines,direct coincidences) with detections between adjacent detector rings (light gray lines,cross coincidences).
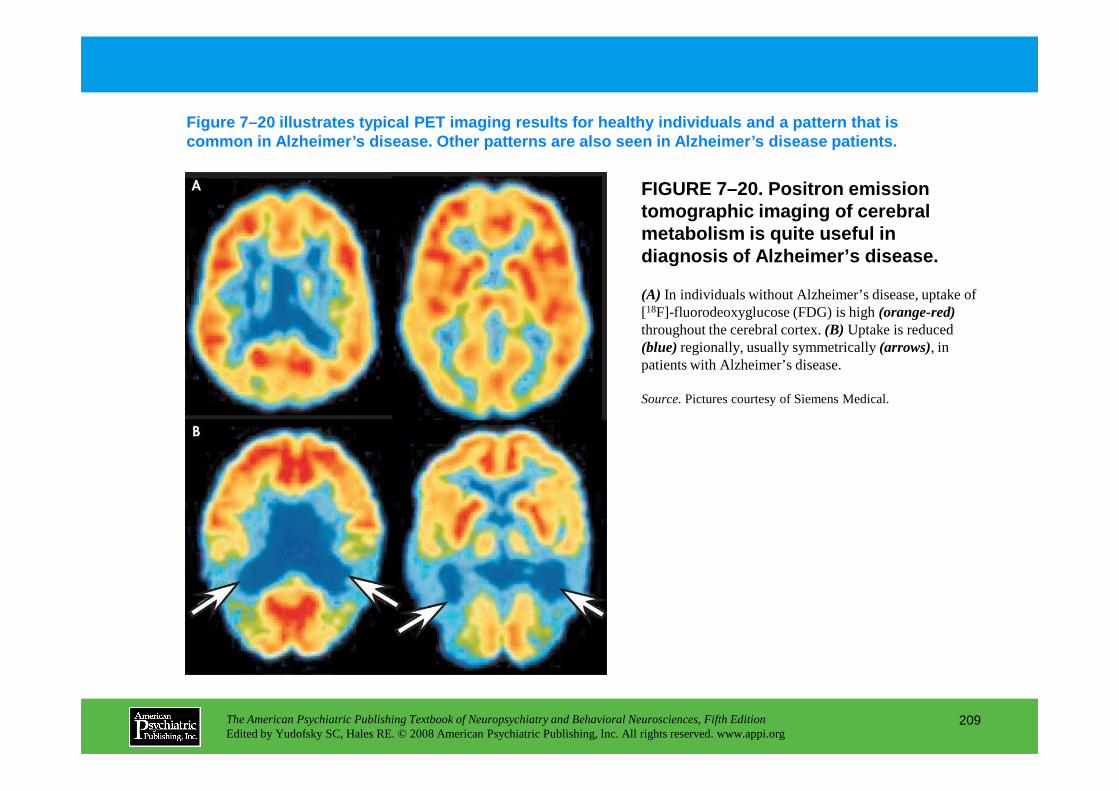
FIGURE 7–20. Positron emission tomographic imaging of cerebral metabolism is quite useful in diagnosis of Alzheimer’s disease.
Figure 7–20 illustrates typical PET imaging results for healthy individuals and a pattern that is common in Alzheimer’s disease. Other patterns are al so seen in Alzheimer’s disease patients.
(A) In individuals without Alzheimer’s disease, uptake of [18F]-fluorodeoxyglucose (FDG) is high (orange-red)throughout the cerebral cortex. (B) Uptake is reduced (blue)regionally, usually symmetrically (arrows), in patients with Alzheimer’s disease.
Source.Pictures courtesy of Siemens Medical.
The American Psychiatric Publishing Textbook of Neuropsychiatry and Behavioral Neurosciences, Fifth EditionEdited by Yudofsky SC, Hales RE. © 2008 American Psychiatric Publishing, Inc. All rights reserved. www.appi.org
209
Source.Pictures courtesy of Siemens Medical.
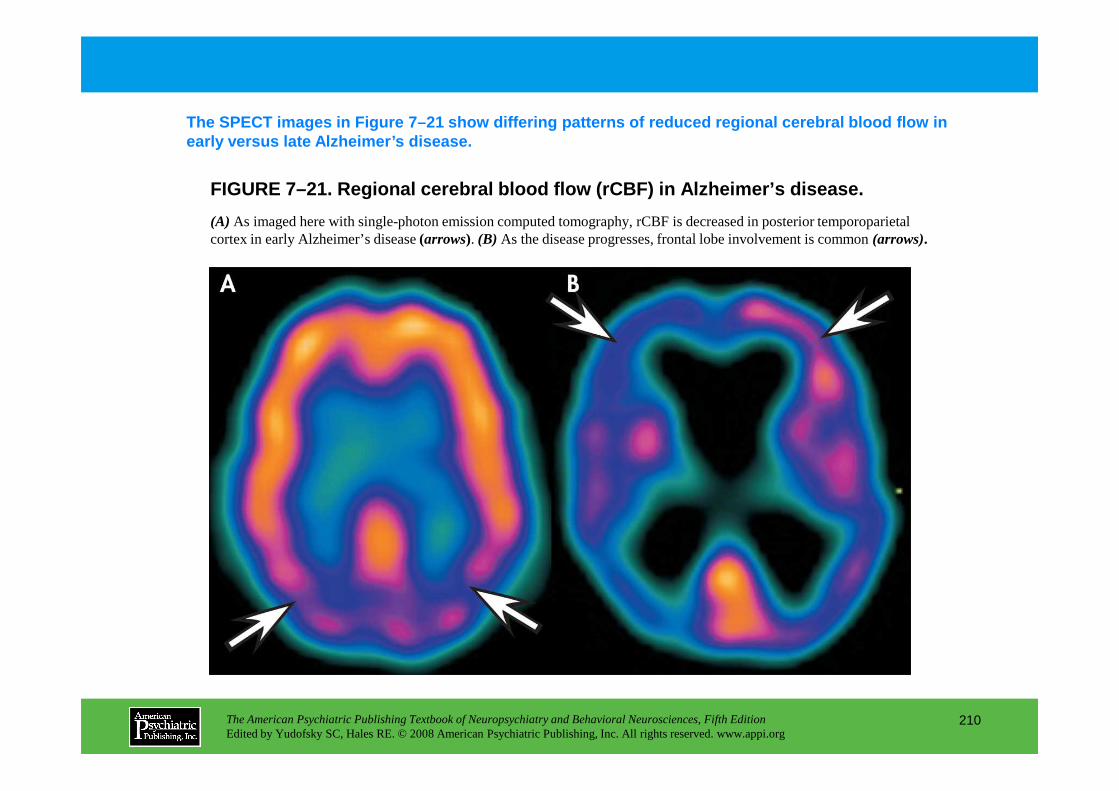
FIGURE 7–21. Regional cerebral blood flow (rCBF) in Alzheimer’s disease.
The SPECT images in Figure 7–21 show differing patt erns of reduced regional cerebral blood flow in early versus late Alzheimer’s disease.
(A) As imaged here with single-photon emission computed tomography, rCBF is decreased in posterior temporoparietal cortex in early Alzheimer’s disease (arrows). (B) As the disease progresses, frontal lobe involvement is common (arrows).
The American Psychiatric Publishing Textbook of Neuropsychiatry and Behavioral Neurosciences, Fifth EditionEdited by Yudofsky SC, Hales RE. © 2008 American Psychiatric Publishing, Inc. All rights reserved. www.appi.org
210

FIGURE 7–22. A common finding in dementia with Lewy bodies is decreased perfusion in occipital cortex (arrows) , here imaged with single-photon emission computed tomography.
Clinical SPECT and PET findings in dementia with Le wy bodies overlap those of Alzheimer’s disease—although the abnormalities are more likely t o be asymmetrical and to involve the occipital cortex (Figure 7–22).
The American Psychiatric Publishing Textbook of Neuropsychiatry and Behavioral Neurosciences, Fifth EditionEdited by Yudofsky SC, Hales RE. © 2008 American Psychiatric Publishing, Inc. All rights reserved. www.appi.org
211
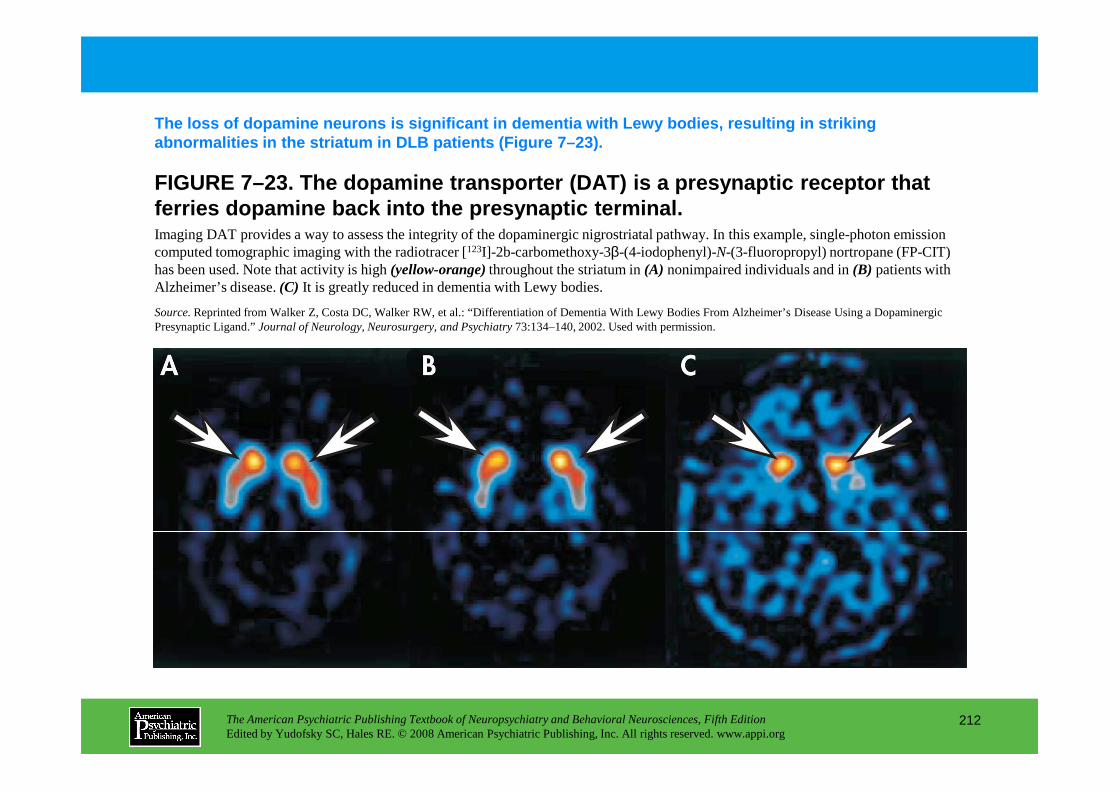
FIGURE 7–23. The dopamine transporter (DAT) is a pr esynaptic receptor that ferries dopamine back into the presynaptic terminal .
The loss of dopamine neurons is significant in deme ntia with Lewy bodies, resulting in striking abnormalities in the striatum in DLB patients (Figu re 7–23).
Imaging DAT provides a way to assess the integrity of the dopaminergic nigrostriatal pathway. In this example, single-photon emission computed tomographic imaging with the radiotracer [123I]-2b-carbomethoxy-3β-(4-iodophenyl)-N-(3-fluoropropyl) nortropane (FP-CIT) has been used. Note that activity is high (yellow-orange)throughout the striatum in (A) nonimpaired individuals and in (B) patients with Alzheimer’s disease. (C) It is greatly reduced in dementia with Lewy bodies.
Source.Reprinted from Walker Z, Costa DC, Walker RW, et al.: “Differentiation of Dementia With Lewy Bodies From Alzheimer’s Disease Using a Dopaminergic Presynaptic Ligand.” Journal of Neurology, Neurosurgery, and Psychiatry73:134–140, 2002. Used with permission.
The American Psychiatric Publishing Textbook of Neuropsychiatry and Behavioral Neurosciences, Fifth EditionEdited by Yudofsky SC, Hales RE. © 2008 American Psychiatric Publishing, Inc. All rights reserved. www.appi.org
212

FIGURE 7–24. A common finding in frontotemporal dem entia (e.g., Pick’s disease) is decreased perfusion in frontal and temporal cortex (arrows) , here imaged with single-photon emission computed tomography.
SPECT or PET scanning usually can distinguish front otemporal dementia (such as Pick’s disease) from Alzheimer’s disease and dementia with Lewy bodi es (Figure 7–24).
The American Psychiatric Publishing Textbook of Neuropsychiatry and Behavioral Neurosciences, Fifth EditionEdited by Yudofsky SC, Hales RE. © 2008 American Psychiatric Publishing, Inc. All rights reserved. www.appi.org
213

FIGURE 7–25. A common finding in Creutzfeldt-Jakob disease is large asymmetrical areas of decreased perfusion in cortex (arrows) , here imaged with single-photon emission computed tomography.
Clinical SPECT and PET imaging in Creutzfeldt-Jakob disease identifies large areas of reduced perfusion (Figure 7–25). However, clinical correlat ion is needed because of overlap with the imaging appearance of other dementias.
The American Psychiatric Publishing Textbook of Neuropsychiatry and Behavioral Neurosciences, Fifth EditionEdited by Yudofsky SC, Hales RE. © 2008 American Psychiatric Publishing, Inc. All rights reserved. www.appi.org
214

FIGURE 7–26. A characteristic finding early in Hunt ington’s disease
In Huntington’s disease, SPECT and PET imaging show characteristic reduced perfusion to the basal ganglia, especially the head of the caudate, often early in the course of the illness (Figure 7–26).
is decreased perfusion in the basal ganglia, particularly caudate (arrows), here imaged with single-photon emission computed tomography.
The American Psychiatric Publishing Textbook of Neuropsychiatry and Behavioral Neurosciences, Fifth EditionEdited by Yudofsky SC, Hales RE. © 2008 American Psychiatric Publishing, Inc. All rights reserved. www.appi.org
215
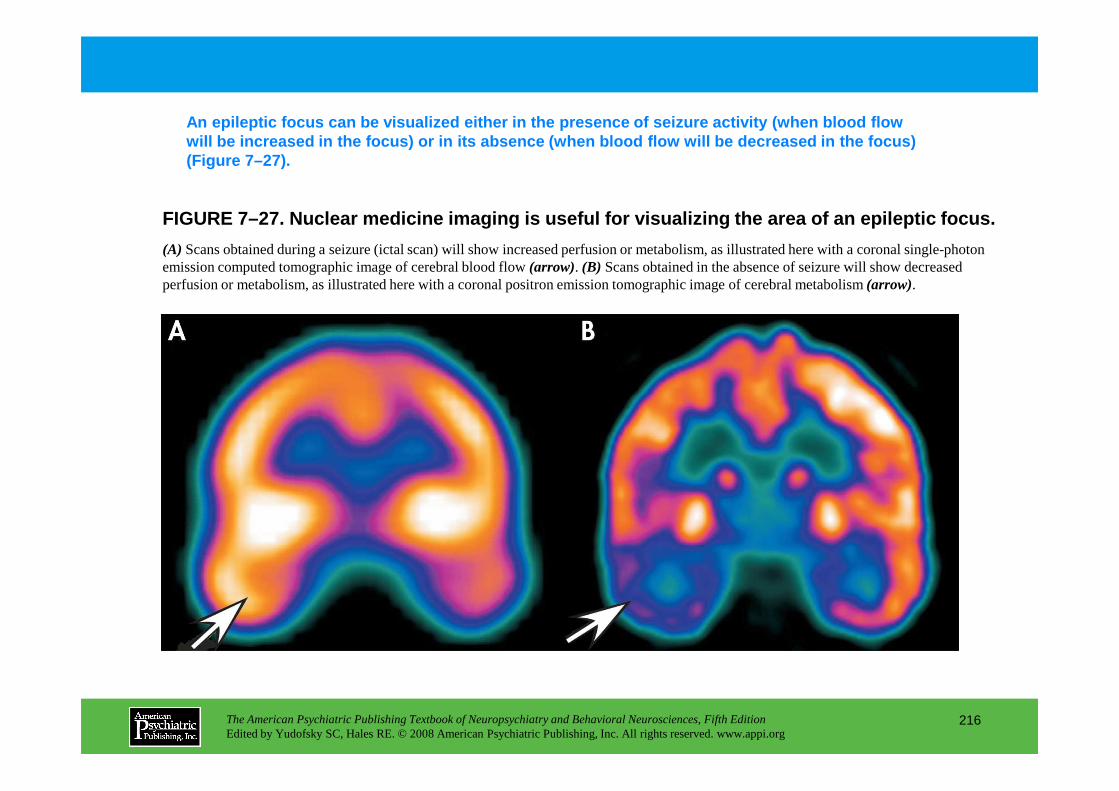
FIGURE 7–27. Nuclear medicine imaging is useful for visualizing the area of an epileptic focus.
An epileptic focus can be visualized either in the p resence of seizure activity (when blood flow will be increased in the focus) or in its absence ( when blood flow will be decreased in the focus) (Figure 7–27).
(A) Scans obtained during a seizure (ictal scan) will show increased perfusion or metabolism, as illustrated here with a coronal single-photon emission computed tomographic image of cerebral blood flow (arrow). (B) Scans obtained in the absence of seizure will show decreased perfusion or metabolism, as illustrated here with a coronal positron emission tomographic image of cerebral metabolism (arrow).
The American Psychiatric Publishing Textbook of Neuropsychiatry and Behavioral Neurosciences, Fifth EditionEdited by Yudofsky SC, Hales RE. © 2008 American Psychiatric Publishing, Inc. All rights reserved. www.appi.org
216

FIGURE 7–28. Areas that are compromised but still f unctional in acute stroke can be identified by comparing (A) resting single-photon emission computed tomography cerebral blood flow images with (B) those obtained following administration of acetazol amide.
It is thought that a comparison of resting SPECT im ages with those taken after acetazolamide injection (Figure 7–28) can be used to predict impe nding ischemic events.
Blood flow will not increase in areas in which arterioles were already fully dilated at baseline (arrows).
The American Psychiatric Publishing Textbook of Neuropsychiatry and Behavioral Neurosciences, Fifth EditionEdited by Yudofsky SC, Hales RE. © 2008 American Psychiatric Publishing, Inc. All rights reserved. www.appi.org
217

FIGURE 7–29. This schematic diagram of a dopamine (DA) synapse in the striatum illustrates the function of presynaptic DA transporters (DATs).
Radioligands for SPECT and PET imaging can be devel oped for almost any type of synapse in the brain. For example, many ligands have been develope d that bind to dopamine transporters (Figure 7–29). All are analogues of cocaine.
DAT carries DA back into the
The American Psychiatric Publishing Textbook of Neuropsychiatry and Behavioral Neurosciences, Fifth EditionEdited by Yudofsky SC, Hales RE. © 2008 American Psychiatric Publishing, Inc. All rights reserved. www.appi.org
218
DAT carries DA back into the presynaptic terminal. Here it is immediately degraded (by monoamine oxidase) into 3,4-dihydroxyphenylacetic acid (DOPAC) prior to recycling.
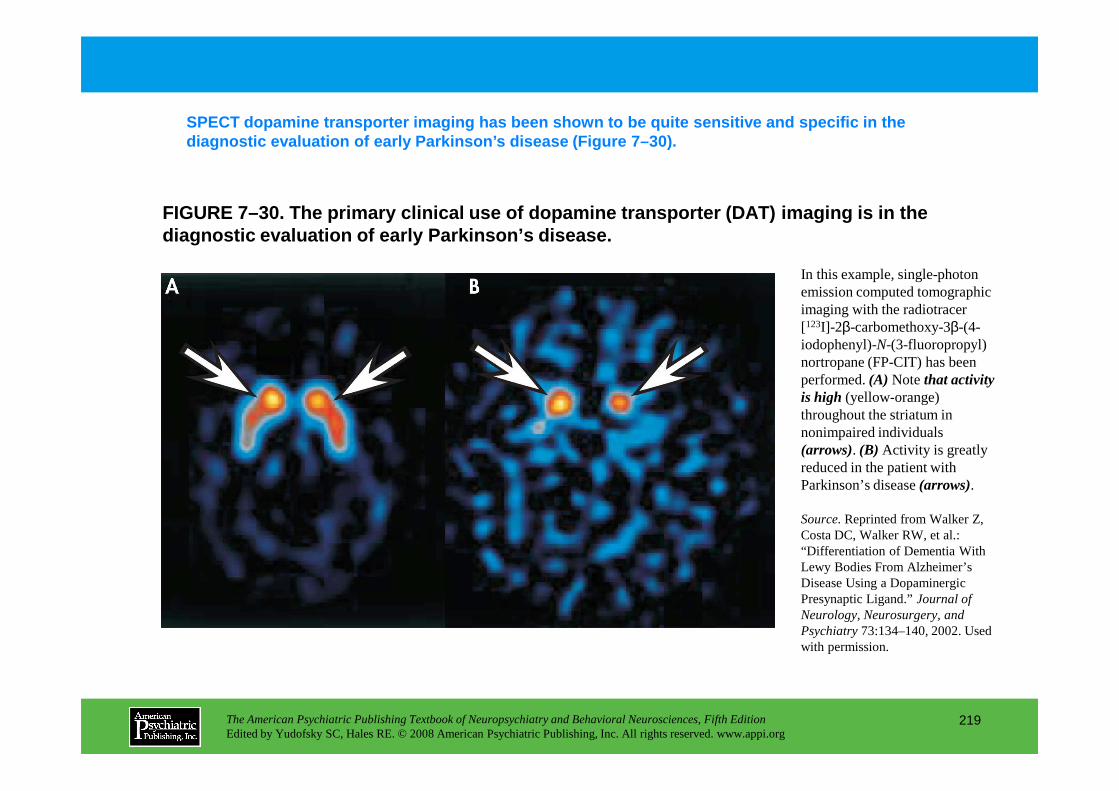
FIGURE 7–30. The primary clinical use of dopamine t ransporter (DAT) imaging is in the diagnostic evaluation of early Parkinson’s disease.
SPECT dopamine transporter imaging has been shown t o be quite sensitive and specific in the diagnostic evaluation of early Parkinson’s disease (Figure 7–30).
In this example, single-photon emission computed tomographic imaging with the radiotracer [123I]-2β-carbomethoxy-3β-(4-iodophenyl)-N-(3-fluoropropyl) nortropane (FP-CIT) has been performed. (A) Note that activity is high (yellow-orange)
The American Psychiatric Publishing Textbook of Neuropsychiatry and Behavioral Neurosciences, Fifth EditionEdited by Yudofsky SC, Hales RE. © 2008 American Psychiatric Publishing, Inc. All rights reserved. www.appi.org
219
is high (yellow-orange) throughout the striatum in nonimpaired individuals (arrows). (B) Activity is greatly reduced in the patient with Parkinson’s disease (arrows).
Source.Reprinted from Walker Z, Costa DC, Walker RW, et al.: “Differentiation of Dementia With Lewy Bodies From Alzheimer’s Disease Using a Dopaminergic Presynaptic Ligand.” Journal of Neurology, Neurosurgery, and Psychiatry73:134–140, 2002. Used with permission.
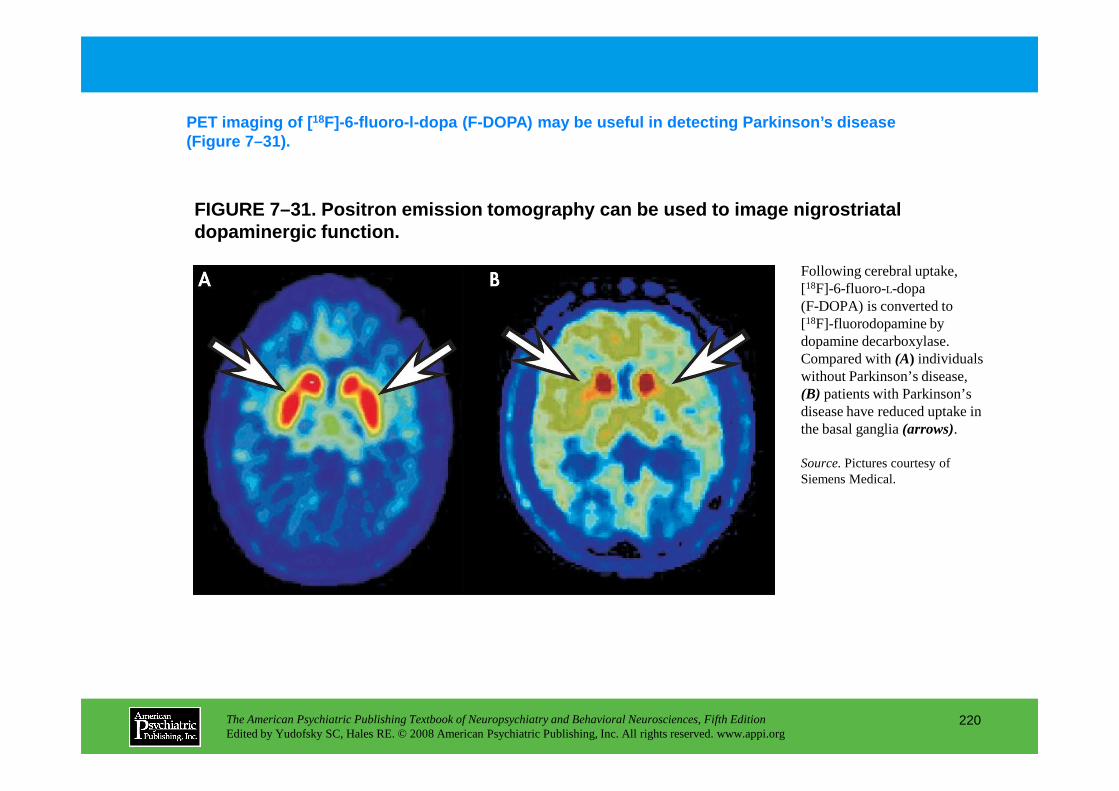
FIGURE 7–31. Positron emission tomography can be us ed to image nigrostriatal dopaminergic function.
PET imaging of [ 18F]-6-fluoro-l-dopa (F-DOPA) may be useful in detect ing Parkinson’s disease (Figure 7–31).
Following cerebral uptake, [18F]-6-fluoro-L-dopa (F-DOPA) is converted to [18F]-fluorodopamine by dopamine decarboxylase. Compared with (A) individuals without Parkinson’s disease, (B) patients with Parkinson’s
The American Psychiatric Publishing Textbook of Neuropsychiatry and Behavioral Neurosciences, Fifth EditionEdited by Yudofsky SC, Hales RE. © 2008 American Psychiatric Publishing, Inc. All rights reserved. www.appi.org
220
(B) patients with Parkinson’s disease have reduced uptake in the basal ganglia (arrows).
Source.Pictures courtesy of Siemens Medical.

FIGURE 7–32. Xe/CT.
Features of xenon-enhanced computed tomography (Xe/CT) are illustrated in Figure 7–32. In Xe/CT, standard CT images and postinhalation CT images are collected and compared, allowing areas of abnormality to be identified.
(A) A standard computed tomography (CT) scanner is used for xenon-enhanced computed tomographic (Xe/CT) imaging of cerebral blood flow. (B) Accessory equipment is used
The American Psychiatric Publishing Textbook of Neuropsychiatry and Behavioral Neurosciences, Fifth EditionEdited by Yudofsky SC, Hales RE. © 2008 American Psychiatric Publishing, Inc. All rights reserved. www.appi.org
221
blood flow. (B) Accessory equipment is used to blend xenon gas (28%) with oxygen (40%) for the patient to breathe. The gas enters the blood and acts as a contrast agent. Xe/CT provides quantitative images of cerebral blood flow. (C) In a healthy individual, cerebral blood flow is high (yellow-red)throughout cerebral cortex. Following stroke (D), Xe/CT allows differentiation of areas of irreversible ischemia (flow<8 cc/100 g/min=core, purple arrow) from areas in which ischemia is still reversible (flow between 8 and 20 cc/100 g/min=penumbra, blue arrow).
Source.Pictures courtesy of Diversified Diagnostic Products, Inc.
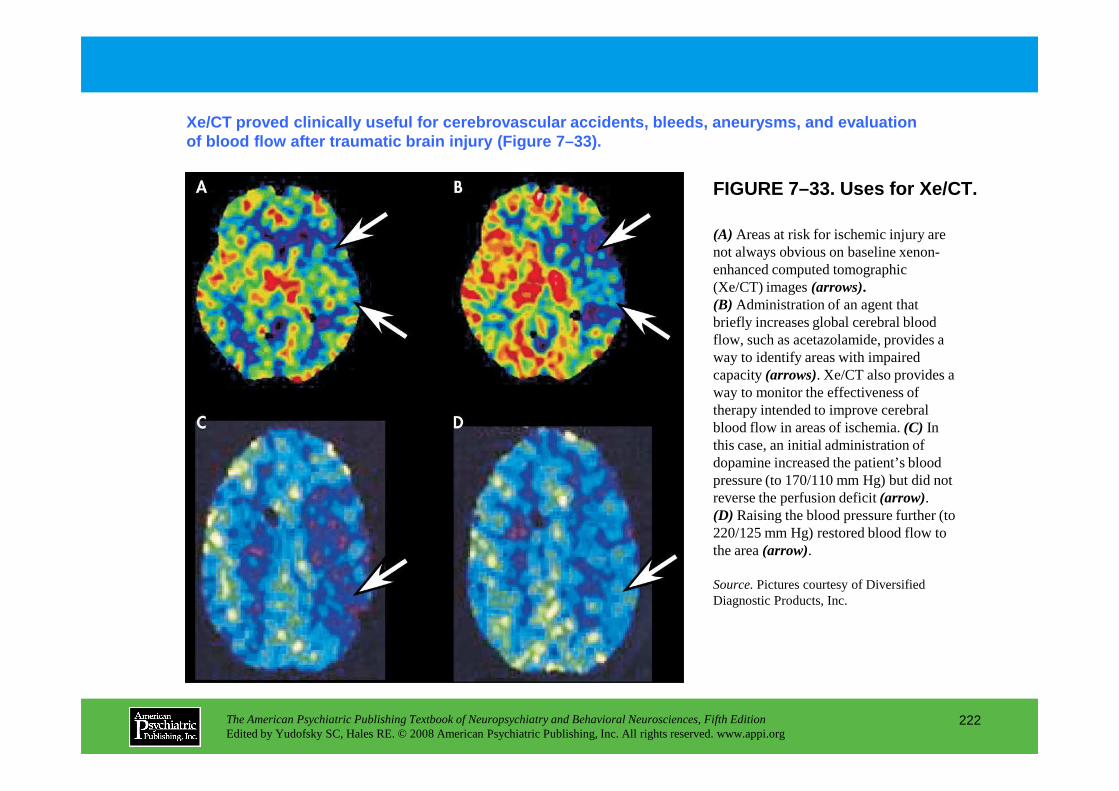
FIGURE 7–33. Uses for Xe/CT.
Xe/CT proved clinically useful for cerebrovascular accidents, bleeds, aneurysms, and evaluation of blood flow after traumatic brain injury (Figure 7–33).
(A) Areas at risk for ischemic injury are not always obvious on baseline xenon-enhanced computed tomographic (Xe/CT) images (arrows).(B) Administration of an agent that briefly increases global cerebral blood flow, such as acetazolamide, provides a way to identify areas with impaired capacity (arrows). Xe/CT also provides a way to monitor the effectiveness of
The American Psychiatric Publishing Textbook of Neuropsychiatry and Behavioral Neurosciences, Fifth EditionEdited by Yudofsky SC, Hales RE. © 2008 American Psychiatric Publishing, Inc. All rights reserved. www.appi.org
222
way to monitor the effectiveness of therapy intended to improve cerebral blood flow in areas of ischemia. (C) In this case, an initial administration of dopamine increased the patient’s blood pressure (to 170/110 mm Hg) but did not reverse the perfusion deficit (arrow). (D) Raising the blood pressure further (to 220/125 mm Hg) restored blood flow to the area (arrow).
Source.Pictures courtesy of Diversified Diagnostic Products, Inc.
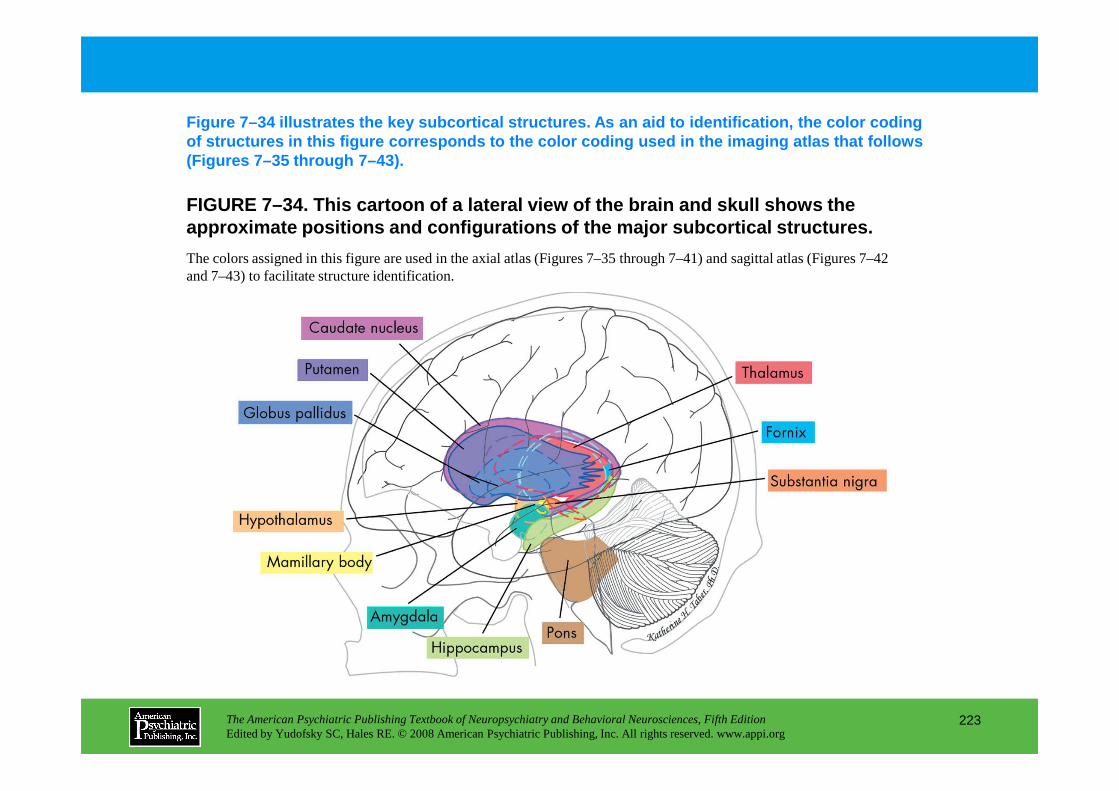
FIGURE 7–34. This cartoon of a lateral view of the brain and skull shows the approximate positions and configurations of the maj or subcortical structures.
Figure 7–34 illustrates the key subcortical structu res. As an aid to identification, the color coding of structures in this figure corresponds to the col or coding used in the imaging atlas that follows (Figures 7–35 through 7–43).
The colors assigned in this figure are used in the axial atlas (Figures 7–35 through 7–41) and sagittal atlas (Figures 7–42 and 7–43) to facilitate structure identification.
The American Psychiatric Publishing Textbook of Neuropsychiatry and Behavioral Neurosciences, Fifth EditionEdited by Yudofsky SC, Hales RE. © 2008 American Psychiatric Publishing, Inc. All rights reserved. www.appi.org
223

Figure 7–35. T1-weighted axial magnetic resonance image (MRI) with major tracts (right side) and brain regions (left side) labeled.
Figures 7–35 through 7–41 comprise an axial imaging atlas. See the text for a discussion of these images.
Major subcortical structures are color-coded to match Figure 7–34. Vascular territories (right side)and lobes (left side)are color-coded to match the key.
The American Psychiatric Publishing Textbook of Neuropsychiatry and Behavioral Neurosciences, Fifth EditionEdited by Yudofsky SC, Hales RE. © 2008 American Psychiatric Publishing, Inc. All rights reserved. www.appi.org
224
match the key.
Source.MRI courtesy of Phillips Medical Systems. Atlas section used with permission of Veterans Health Administration Mid-Atlantic Mental Illness Research, Education, and Clinical Center.

FIGURE 7–36. T1-weighted axial magnetic resonance image (MRI) with major tracts (right side) and brain regions (left side) labeled.
Axial imaging atlas (continued)
Major subcortical structures are color-coded to match Figure 7–34. Vascular territories (right side)and lobes (left side)are color-coded to match the key.
Source.MRI courtesy of Phillips Medical Systems.
The American Psychiatric Publishing Textbook of Neuropsychiatry and Behavioral Neurosciences, Fifth EditionEdited by Yudofsky SC, Hales RE. © 2008 American Psychiatric Publishing, Inc. All rights reserved. www.appi.org
225
Source.MRI courtesy of Phillips Medical Systems. Atlas section used with permission of Veterans Health Administration Mid-Atlantic Mental Illness Research, Education, and Clinical Center.
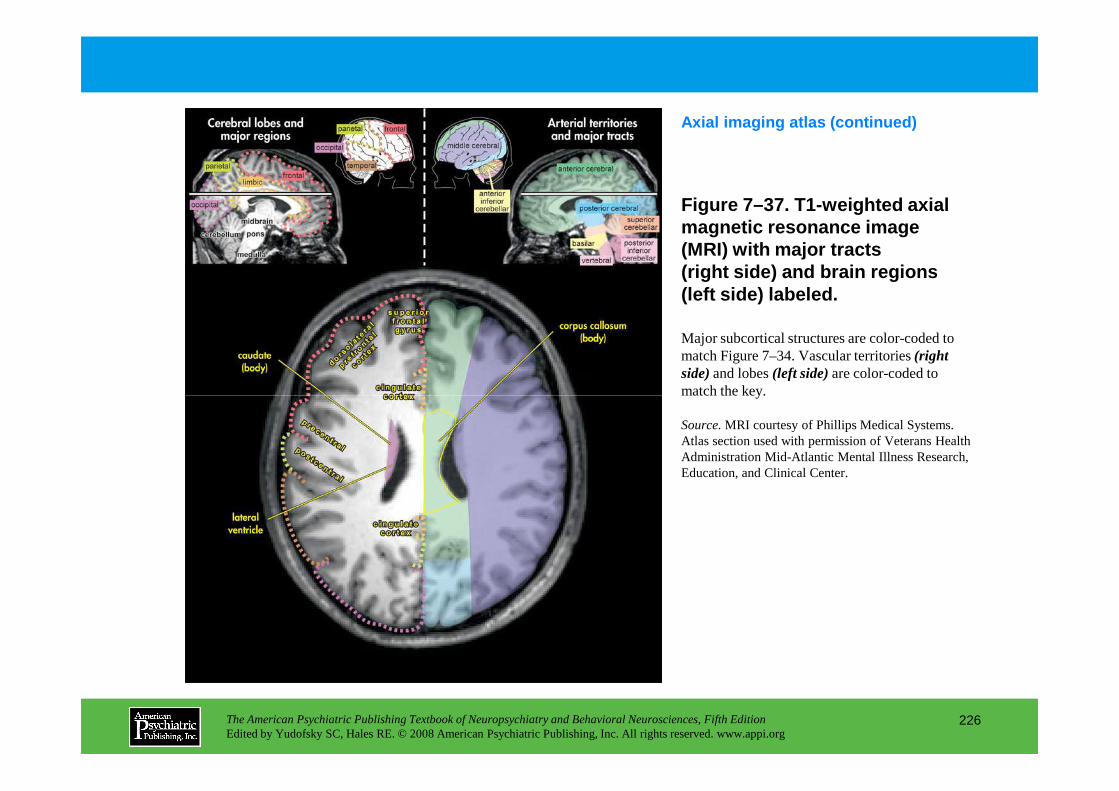
Figure 7–37. T1-weighted axial magnetic resonance image (MRI) with major tracts (right side) and brain regions (left side) labeled.
Axial imaging atlas (continued)
Major subcortical structures are color-coded to match Figure 7–34. Vascular territories (right side)and lobes (left side)are color-coded to match the key.
The American Psychiatric Publishing Textbook of Neuropsychiatry and Behavioral Neurosciences, Fifth EditionEdited by Yudofsky SC, Hales RE. © 2008 American Psychiatric Publishing, Inc. All rights reserved. www.appi.org
226
match the key.
Source.MRI courtesy of Phillips Medical Systems. Atlas section used with permission of Veterans Health Administration Mid-Atlantic Mental Illness Research, Education, and Clinical Center.

FIGURE 7–38. T1-weighted axial magnetic resonance image (MRI) with major tracts (right side) and brain regions (left side) labeled.
Axial imaging atlas (continued)
Major subcortical structures are color-coded to match Figure 7–34. Vascular territories (right side)and lobes (left side)are color-coded to match the key.
The American Psychiatric Publishing Textbook of Neuropsychiatry and Behavioral Neurosciences, Fifth EditionEdited by Yudofsky SC, Hales RE. © 2008 American Psychiatric Publishing, Inc. All rights reserved. www.appi.org
227
Source.MRI courtesy of Phillips Medical Systems. Atlas section used with permission of Veterans Health Administration Mid-Atlantic Mental Illness Research, Education, and Clinical Center.
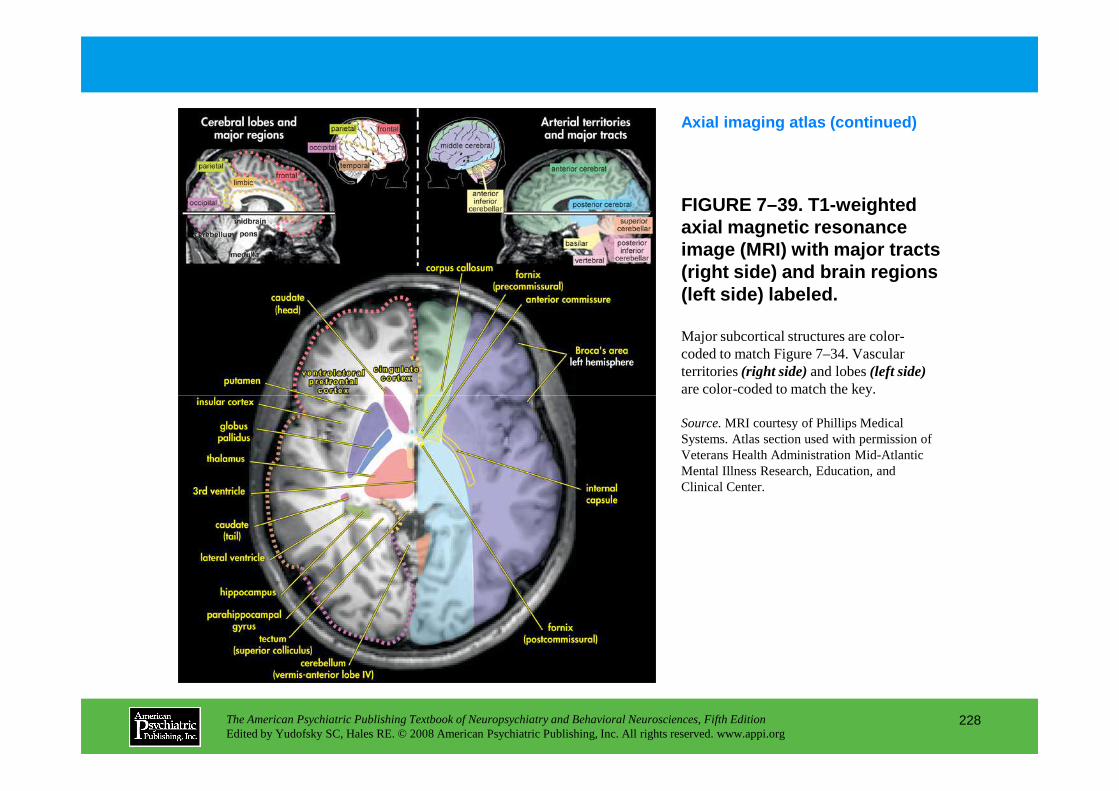
FIGURE 7–39. T1-weighted axial magnetic resonance image (MRI) with major tracts (right side) and brain regions (left side) labeled.
Axial imaging atlas (continued)
Major subcortical structures are color-coded to match Figure 7–34. Vascular territories (right side)and lobes (left side)are color-coded to match the key.
The American Psychiatric Publishing Textbook of Neuropsychiatry and Behavioral Neurosciences, Fifth EditionEdited by Yudofsky SC, Hales RE. © 2008 American Psychiatric Publishing, Inc. All rights reserved. www.appi.org
228
are color-coded to match the key.
Source.MRI courtesy of Phillips Medical Systems. Atlas section used with permission of Veterans Health Administration Mid-Atlantic Mental Illness Research, Education, and Clinical Center.
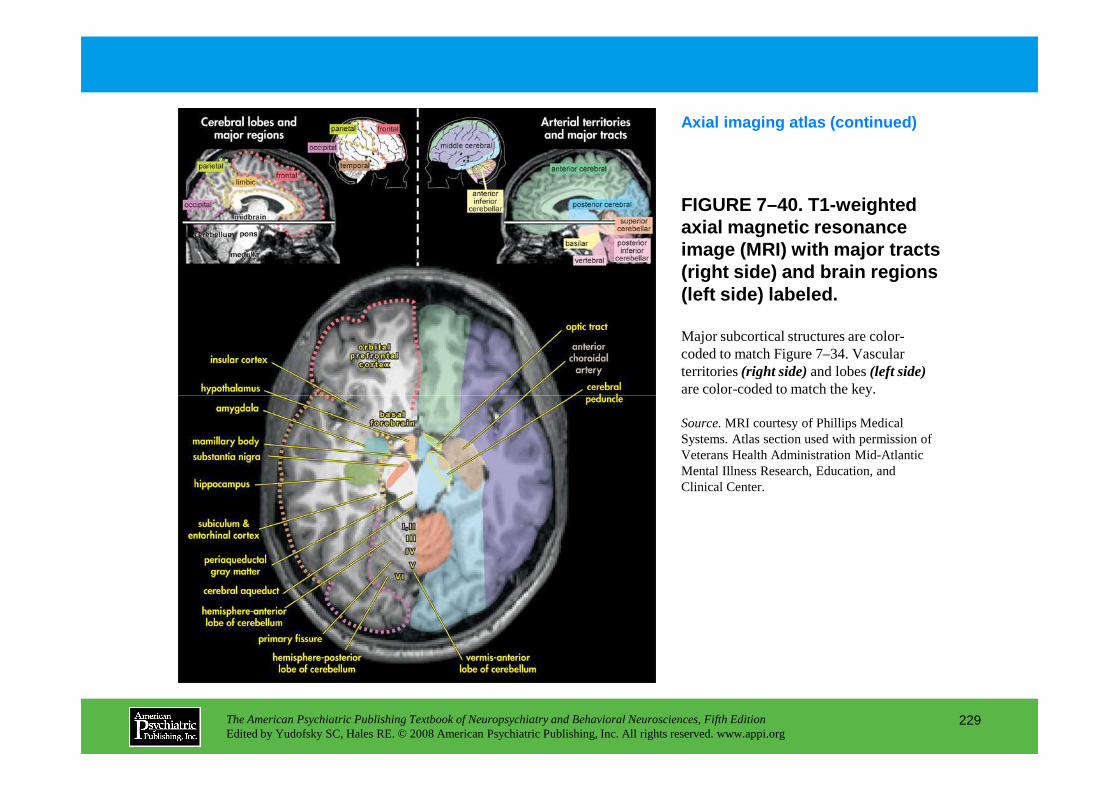
FIGURE 7–40. T1-weighted axial magnetic resonance image (MRI) with major tracts (right side) and brain regions (left side) labeled.
Axial imaging atlas (continued)
Major subcortical structures are color-coded to match Figure 7–34. Vascular territories (right side)and lobes (left side)are color-coded to match the key.
The American Psychiatric Publishing Textbook of Neuropsychiatry and Behavioral Neurosciences, Fifth EditionEdited by Yudofsky SC, Hales RE. © 2008 American Psychiatric Publishing, Inc. All rights reserved. www.appi.org
229
are color-coded to match the key.
Source.MRI courtesy of Phillips Medical Systems. Atlas section used with permission of Veterans Health Administration Mid-Atlantic Mental Illness Research, Education, and Clinical Center.
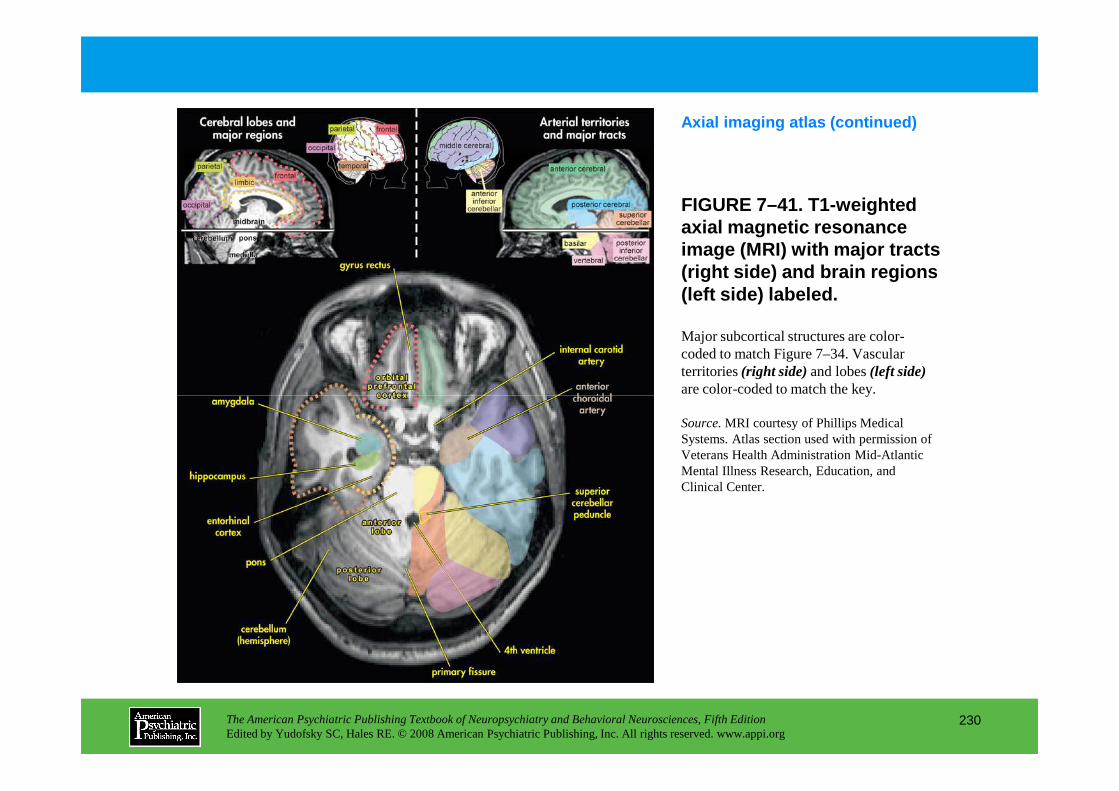
FIGURE 7–41. T1-weighted axial magnetic resonance image (MRI) with major tracts (right side) and brain regions (left side) labeled.
Axial imaging atlas (continued)
Major subcortical structures are color-coded to match Figure 7–34. Vascular territories (right side)and lobes (left side)are color-coded to match the key.
The American Psychiatric Publishing Textbook of Neuropsychiatry and Behavioral Neurosciences, Fifth EditionEdited by Yudofsky SC, Hales RE. © 2008 American Psychiatric Publishing, Inc. All rights reserved. www.appi.org
230
are color-coded to match the key.
Source.MRI courtesy of Phillips Medical Systems. Atlas section used with permission of Veterans Health Administration Mid-Atlantic Mental Illness Research, Education, and Clinical Center.

FIGURE 7–42. T1-weighted sagittal magnetic resonance images (MRIs) with major brain regions labeled.
It is important to realize that in many cases, lesions are best viewed in the coronal and sagittal planes of section—thus, MRI is often preferable to CT. Figures 7–42 and 7–43 comprise a sagittal atlas.
Source.MRI courtesy of Phillips Medical Systems. Atlas section used with permission of Veterans Health Administration Mid-Atlantic Mental Illness Research,
The American Psychiatric Publishing Textbook of Neuropsychiatry and Behavioral Neurosciences, Fifth EditionEdited by Yudofsky SC, Hales RE. © 2008 American Psychiatric Publishing, Inc. All rights reserved. www.appi.org
231
Administration Mid-Atlantic Mental Illness Research, Education, and Clinical Center.

FIGURE 7–43. T1-weighted sagittal magnetic resonance images (MRIs) with major brain regions labeled.
Sagittal imaging atlas (continued)
Source.MRI courtesy of Phillips Medical Systems. Atlas section used with permission of Veterans Health
The American Psychiatric Publishing Textbook of Neuropsychiatry and Behavioral Neurosciences, Fifth EditionEdited by Yudofsky SC, Hales RE. © 2008 American Psychiatric Publishing, Inc. All rights reserved. www.appi.org
232
Atlas section used with permission of Veterans Health Administration Mid-Atlantic Mental Illness Research, Education, and Clinical Center.

FIGURE 7–44. Schematic diagram of the emotion and m emory circuit of Papez.
The term limbic system refers to brain areas involved in emotion, memory, or aggression. MacLean applied the term to the circuit of Papez—reas oning that these structures integrate signals from the external and internal worlds (Figu re 7–44).
The American Psychiatric Publishing Textbook of Neuropsychiatry and Behavioral Neurosciences, Fifth EditionEdited by Yudofsky SC, Hales RE. © 2008 American Psychiatric Publishing, Inc. All rights reserved. www.appi.org
233

FIGURE 7–45. Schematic diagrams of the medial surface of the right cerebral hemisphere showing the (A) outer and (B) inner limbic lobes.
Commonly, limbic structures are divided into an out er lobe (the cingulate, subcallosal, parahippocampal, and uncal cortices) and an inner l obe (the paraterminal gyrus, supracallosal gyrus, and hippocampal complex (Figure 7–45).
The American Psychiatric Publishing Textbook of Neuropsychiatry and Behavioral Neurosciences, Fifth EditionEdited by Yudofsky SC, Hales RE. © 2008 American Psychiatric Publishing, Inc. All rights reserved. www.appi.org
234
Chapter 7 • Highlights for the Clinician
Testing Modality, Indications, Contraindications, and Caveats
STRUCTURAL NEUROIMAGINGComputed Tomography (CT)Indications:• Screening examination• Acute hemorrhage• Calcified lesions• Bone injuryContraindications for use of contrast enhancement: • History of anaphylaxis or severe allergic reaction• Creatinine level >15 mg/dL
The American Psychiatric Publishing Textbook of Neuropsychiatry and Behavioral Neurosciences, Fifth EditionEdited by Yudofsky SC, Hales RE. © 2008 American Psychiatric Publishing, Inc. All rights reserved. www.appi.org
235
(continued)
• Creatinine level >15 mg/dL• Metformin administration on day of scan
Magnetic Resonance Imaging (MRI) Indications:• Sustained confusion/delirium• Subtle cognitive deficits• Unusual age at symptom onset or evolution• Atypical clinical findings• Abrupt personality changes with accompanying neurological signs/symptoms• Following poison or toxin exposures (including significant alcohol abuse)• Following brain injuries of any kind (traumatic or “organic”)
Contraindications for use of MRI:• Any magnetic metal in the body, including surgical clips and sutures• Implanted electrical, mechanical, or magnetic devices• Claustrophobia• History of welding (requires skull films before MRI)• Pregnancy (legal contraindication)
FUNCTIONAL NEUROIMAGINGPositron Emission Tomography (PET)Indications:• Particularly useful for identification of “hidden” lesions (areas that are dysfunctional but do not look
abnormal on structural imaging)
The American Psychiatric Publishing Textbook of Neuropsychiatry and Behavioral Neurosciences, Fifth EditionEdited by Yudofsky SC, Hales RE. © 2008 American Psychiatric Publishing, Inc. All rights reserved. www.appi.org
236
abnormal on structural imaging)• Particularly useful also for patients whose clinical symptoms do not fit the classic historical picture for
the working diagnosis• Evaluation of resting state has shown potential for prediction of treatment response in some conditions• PET has the advantages of higher spatial resolution than SPECT and true attenuaton correction (nearly
eliminating attenuation artifacts)Contraindications:• Reimbursement limited to dementia, presurgical evaluation of epilepsy, and distinguishing radiation
necrosis from recurrent brain tumors
(continued)

Single-Photon Emission Computed Tomography (SPECT)Indications:• Same indications as for PET• SPECT has the advantages of being more widely available than PET, less expensive, and reimbursable
for most conditions.Contraindications:• Lower spatial resolution, more artifacts
The American Psychiatric Publishing Textbook of Neuropsychiatry and Behavioral Neurosciences, Fifth EditionEdited by Yudofsky SC, Hales RE. © 2008 American Psychiatric Publishing, Inc. All rights reserved. www.appi.org
237
CHAPTER 8
EPIDEMIOLOGICAL ANDGENETIC ASPECTS OF
NEUROPSYCHIATRIC DISORDERS
Dolores Malaspina, M.D., M.S.P.H.; Cheryl Corcoran, M.D., M.S.P.H.;Scott Schobel, M.D.; Steven P. Hamilton, M.D., Ph.D.
The American Psychiatric Publishing Textbook of Neuropsychiatry and Behavioral Neurosciences, Fifth EditionEdited by Yudofsky SC, Hales RE. © 2008 American Psychiatric Publishing, Inc. All rights reserved. www.appi.org
238
Slide Show
Topic headings and reading list
Tables and figures
Highlights for the clinician
Main menu
(About, Contents, Contributors, Publishing facts)
CHAPTER 8 • Topics and Readings
Epidemiological StudiesMeasures of disease frequencyDescriptive studiesAnalytic studiesBirth cohort studies
Genetic StudiesFamily, twin, and adoption studiesHigh-risk studiesIdentifying mode of inheritanceComplex disordersLinkage analysisNonparametric approachesAnticipation, imprinting, and
mitochondrial inheritance
Wilson’s diseaseGeneticsIdentification and diagnosis
Illnesses of ChildhoodAutism
Family studiesTwin studiesAdoption studiesHigh-risk studiesMode of inheritanceLinkage analysisChromosomal abnormalitiesCandidate genes
The American Psychiatric Publishing Textbook of Neuropsychiatry and Behavioral Neurosciences, Fifth EditionEdited by Yudofsky SC, Hales RE. © 2008 American Psychiatric Publishing, Inc. All rights reserved. www.appi.org
239
mitochondrial inheritanceMolecular approachesHuman genome
Basal Ganglia DiseaseHuntington’s disease
GeneticsHuntingtin
Potential treatmentParkinson’s disease
Epidemiological studiesFamily studiesEnvironmental exposuresSusceptibility genesMolecular mechanisms
DementiaAlzheimer’s disease
Epidemiological studiesFamily and twin studiesMolecular genetic studies
Prion diseasesEpidemiological studies
Sporadic Creutzfeldt-Jakob diseaseFamilial CJDGerstmann-Sträussler-Sheinker syndromeFatal familial insomnia
Acquired prion diseasesMolecular studies
(continued)
CHAPTER 8 • Topics and Readings (continued)
Psychiatric DisordersBipolar disorder
Epidemiological studiesFamily studiesTwin studiesAdoption studiesHigh-risk studiesLinkage analysisMolecular approaches
Candidate genesAnticipation
Panic disorderEpidemiological studiesFamily studiesTwin studies
SchizophreniaPathophysiologyGenetics and mode of inheritance
Chromosome 1: DISC1RGS4Chromosome 6: dysbindin or DTNBP1Chromosome 8: NRG1Chromosomes 12 (DAO) and 13 (DAOA)Chromosome 15: α7 nicotinic receptorChromosome 22: COMT
EnvironmentGene-environment interaction
NarcolepsyEpidemiological studiesFamily studies
The American Psychiatric Publishing Textbook of Neuropsychiatry and Behavioral Neurosciences, Fifth EditionEdited by Yudofsky SC, Hales RE. © 2008 American Psychiatric Publishing, Inc. All rights reserved. www.appi.org
240
Twin studiesAdoption studiesHigh-risk studiesMode of inheritanceLinkage analysisMolecular approaches
Obsessive-compulsive disorderEpidemiological studiesFamily studiesTwin studiesAdoption studiesHigh-risk studiesMode of inheritanceLinkage analysisMolecular approaches
Family studiesLinkage analysisMolecular approaches
RECOMMENDED READINGS
McGuffin P, Owen M, Gottesman I: Psychiatric Genetics and Genomics. Oxford, UK, Oxford University Press, 2002
Zorumski C, Rubin E: Psychopathology in the Genome and Neuroscience Era. Washington, DC, American Psychiatric Publishing, 2005

CHAPTER 8 • Tables and Figures
Table 8–1. Relative risk for neuropsychiatric disorders
Figure 8–1. Complex genetic risk
Figure 8–2. Genetic linkage and recombination
Figure 8–3. The common disease/common variant model
Figure 8–4. Family rates of schizophrenia
Figure 8–5. Alzheimer’s disease genetic research strategy
Figure 8–6. CAG repeats in Huntington’s disease
Figure 8–7. Model for cellular pathogenesis in Huntington’s disease
Figure 8–8. Processing of α-synuclein, the major component of Lewy bodies,
The American Psychiatric Publishing Textbook of Neuropsychiatry and Behavioral Neurosciences, Fifth EditionEdited by Yudofsky SC, Hales RE. © 2008 American Psychiatric Publishing, Inc. All rights reserved. www.appi.org
241
Figure 8–8. Processing of α-synuclein, the major component of Lewy bodies,
in Parkinson’s disease
Figure 8–9. P-type adenosine triphosphatase (ATPase) in Wilson’s disease
Table 8–2. Schizophrenia susceptibility genes
Summary Highlights for the Clinician
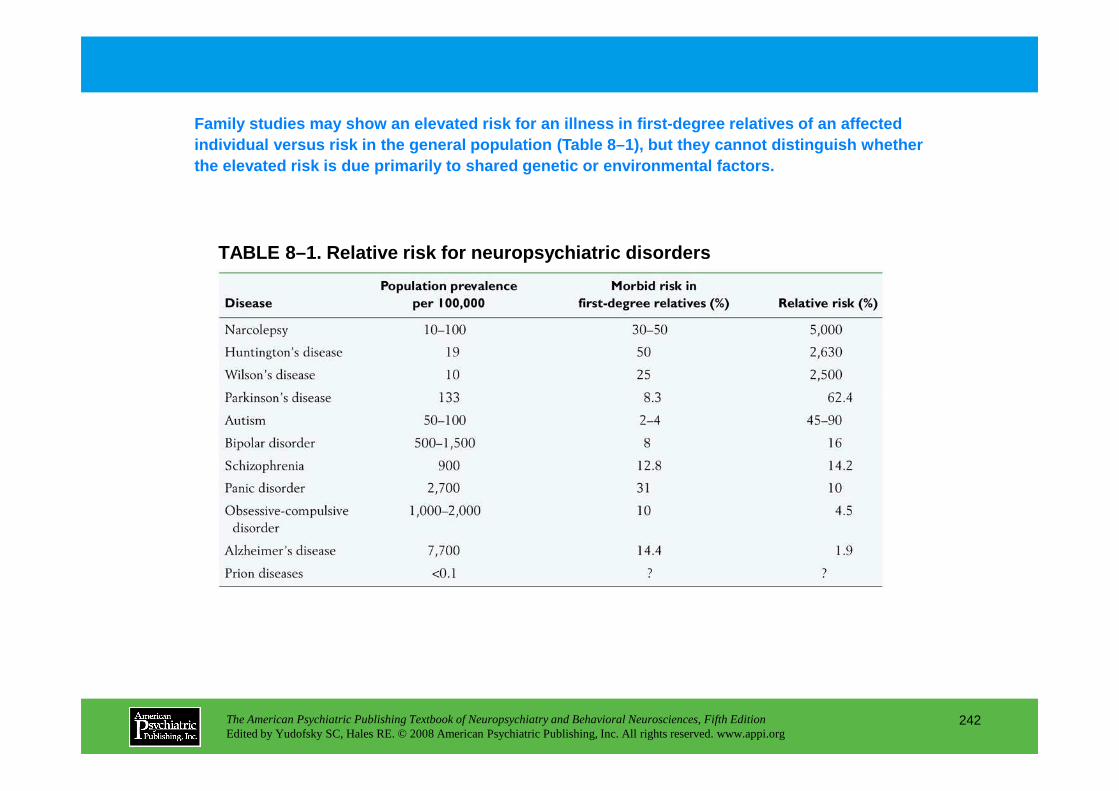
TABLE 8–1. Relative risk for neuropsychiatric disor ders
Family studies may show an elevated risk for an ill ness in first-degree relatives of an affected individual versus risk in the general population (T able 8–1), but they cannot distinguish whether the elevated risk is due primarily to shared geneti c or environmental factors.
The American Psychiatric Publishing Textbook of Neuropsychiatry and Behavioral Neurosciences, Fifth EditionEdited by Yudofsky SC, Hales RE. © 2008 American Psychiatric Publishing, Inc. All rights reserved. www.appi.org
242
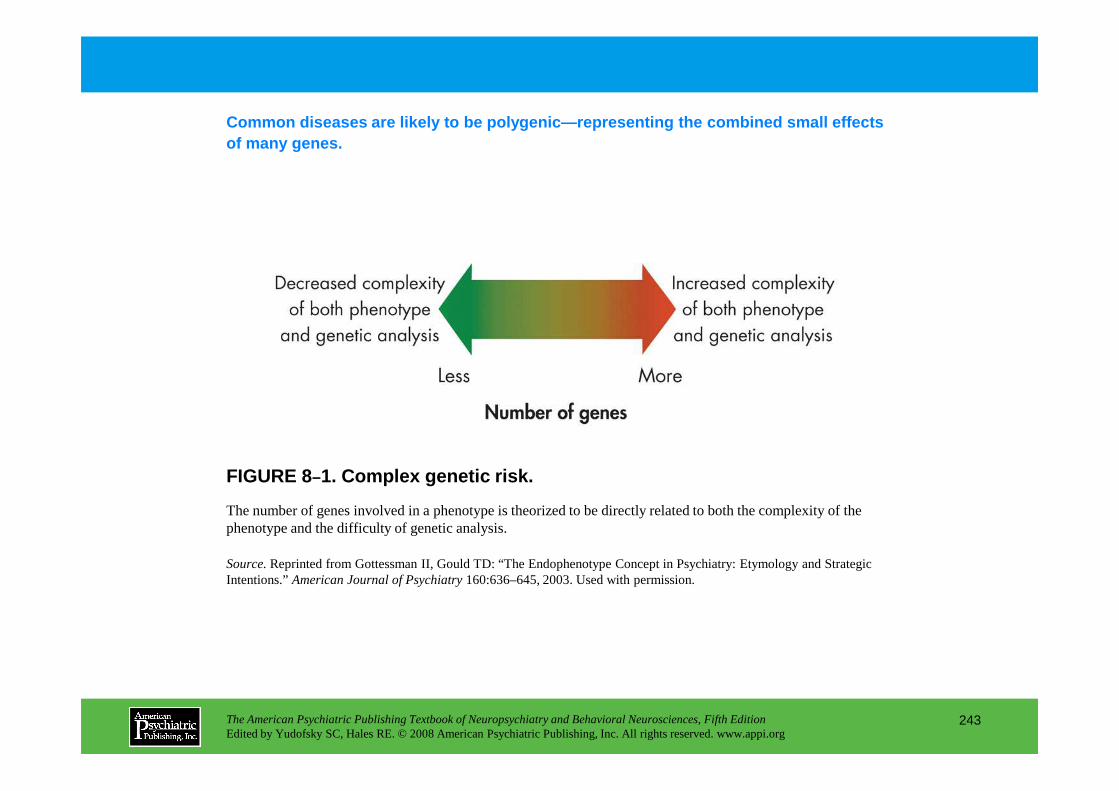
Common diseases are likely to be polygenic—represent ing the combined small effects of many genes.
The American Psychiatric Publishing Textbook of Neuropsychiatry and Behavioral Neurosciences, Fifth EditionEdited by Yudofsky SC, Hales RE. © 2008 American Psychiatric Publishing, Inc. All rights reserved. www.appi.org
243
FIGURE 8–1. Complex genetic risk.
The number of genes involved in a phenotype is theorized to be directly related to both the complexity of the phenotype and the difficulty of genetic analysis.
Source. Reprinted from Gottessman II, Gould TD: “The Endophenotype Concept in Psychiatry: Etymology and Strategic Intentions.” American Journal of Psychiatry 160:636–645, 2003. Used with permission.

FIGURE 8–2. Genetic linkage and recombination.
Depicted is a hypothetical family (circles=females; squares=males) segregating an autosomal dominant disease. The disease locus a (containing either the defective allele a1 or its normal counterpart a2) lies close to a polymorphic marker locus b (containing marker alleles b1 and b2). The father is affected by the disease (top filled square)and is heterozygous at both the disease and the marker loci. The mother is unaffected (top unfilled circle)and is homozygous at both loci.
Linkage analysis is a strategy for isolating a gene of unknown structure or function based on its chromosomal location.
The American Psychiatric Publishing Textbook of Neuropsychiatry and Behavioral Neurosciences, Fifth EditionEdited by Yudofsky SC, Hales RE. © 2008 American Psychiatric Publishing, Inc. All rights reserved. www.appi.org
244
(top unfilled circle)and is homozygous at both loci. Because the disease and marker loci are genetically linked (i.e., they lie near one another), crossing over rarely occurs between them. Most children who inherit the disease allele, a1, will also receive the b1 allele from their mothers. Occasionally, a recombination event will occur in the father, and he will transfer a chromosome bearing the b2 marker allele along with the disease allele (as has occurred in the daughter represented by the circle labeled “recombinant”).
Source.Adapted from Rieder RO, Kaufmann CA: “Genetics,” in The American Psychiatric Press Textbook of Psychiatry, 2nd Edition.Edited by Talbott JA, Hales RE, Yudofsky SC. Washington, DC, American Psychiatric Press, 1994, pp. 35–79. Used with permission.

FIGURE 8–3. The common disease/common variant model.The risk of disease as a function of genetic relatedness to affected individuals is shown. Two hypothetical common diseases are considered (blue and black lines), each having the same monozygotic risk and the same underlying risk in the population (red dashed line). For the disease represented by the blue line,the risk of disease falls linearly with decreased genetic relatedness, consistent with disease heterogeneity, owing to the
Figure 8–3 shows the theoretical risk of disease co nferred by the assumption of allelic heterogeneity with additive effect of rare alleles versus the assumpti on of multiple common interacting alleles.
The American Psychiatric Publishing Textbook of Neuropsychiatry and Behavioral Neurosciences, Fifth EditionEdited by Yudofsky SC, Hales RE. © 2008 American Psychiatric Publishing, Inc. All rights reserved. www.appi.org
245
consistent with disease heterogeneity, owing to the reduction in the number of shared rare alleles—the disease heterogeneity model. For the disease indicated by the black line,the fall in risk as a function of genetic relatedness is more rapid, as can occur when multiple common interacting alleles contribute to disease—an example of the common disease/common variant (CDCV) model.
Source.Reprinted from Wang WY, Barratt BJ, Clayton DG, et al: “Genome-Wide Association Studies: Theoretical and Practical Concerns.” Nature Reviews Genetics 6:109–118, 2005. Copyright 2005, Macmillan Magazines, Ltd. Used with permission.
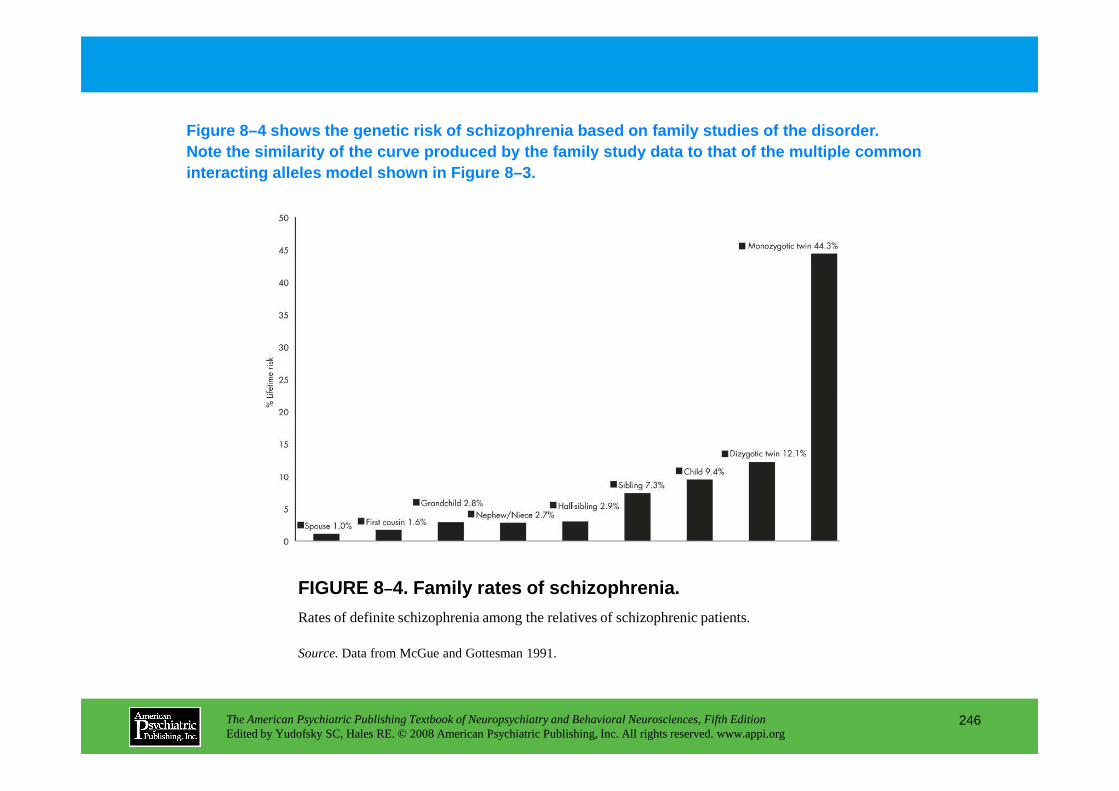
Figure 8–4 shows the genetic risk of schizophrenia b ased on family studies of the disorder. Note the similarity of the curve produced by the fa mily study data to that of the multiple common interacting alleles model shown in Figure 8–3.
The American Psychiatric Publishing Textbook of Neuropsychiatry and Behavioral Neurosciences, Fifth EditionEdited by Yudofsky SC, Hales RE. © 2008 American Psychiatric Publishing, Inc. All rights reserved. www.appi.org
246
FIGURE 8–4. Family rates of schizophrenia.
Rates of definite schizophrenia among the relatives of schizophrenic patients.
Source.Data from McGue and Gottesman 1991.
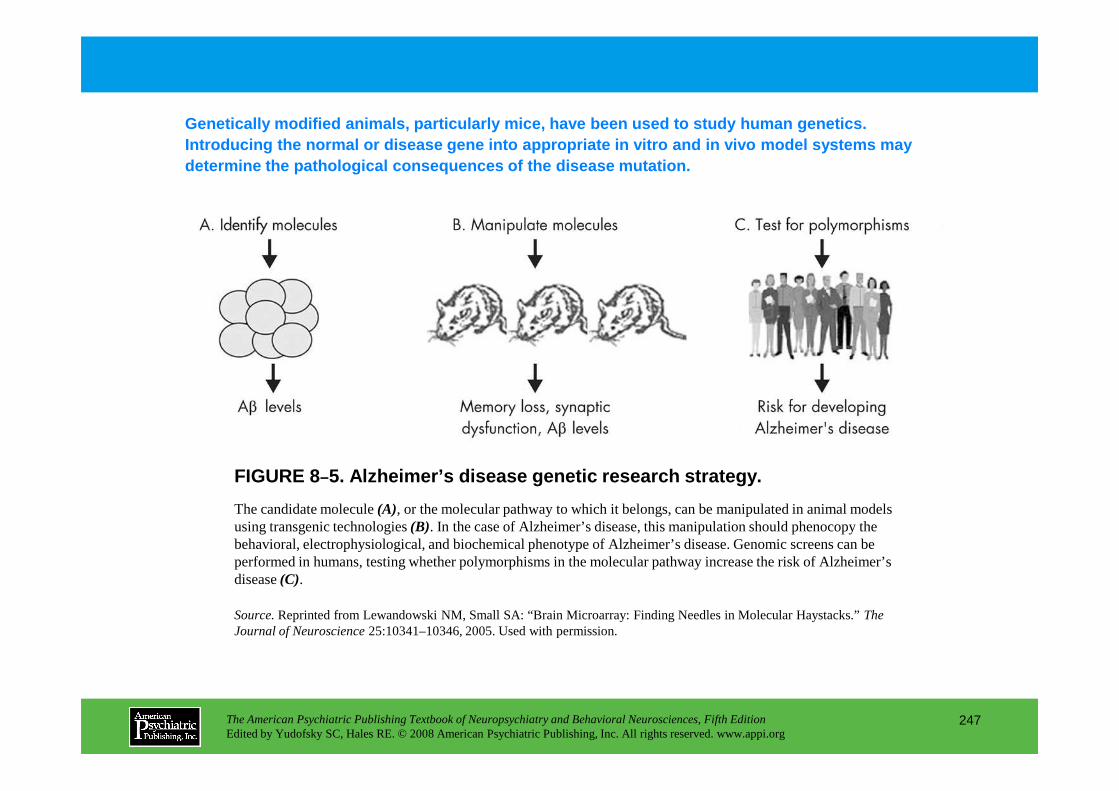
Genetically modified animals, particularly mice, ha ve been used to study human genetics. Introducing the normal or disease gene into appropr iate in vitro and in vivo model systems may determine the pathological consequences of the dise ase mutation.
The American Psychiatric Publishing Textbook of Neuropsychiatry and Behavioral Neurosciences, Fifth EditionEdited by Yudofsky SC, Hales RE. © 2008 American Psychiatric Publishing, Inc. All rights reserved. www.appi.org
247
FIGURE 8–5. Alzheimer’s disease genetic research strategy.
The candidate molecule (A), or the molecular pathway to which it belongs, can be manipulated in animal models using transgenic technologies (B). In the case of Alzheimer’s disease, this manipulation should phenocopy the behavioral, electrophysiological, and biochemical phenotype of Alzheimer’s disease. Genomic screens can be performed in humans, testing whether polymorphisms in the molecular pathway increase the risk of Alzheimer’s disease (C).
Source.Reprinted from Lewandowski NM, Small SA: “Brain Microarray: Finding Needles in Molecular Haystacks.” The Journal of Neuroscience 25:10341–10346, 2005. Used with permission.

FIGURE 8–6. CAG repeats in Huntington’s disease (HD).(A) Relationship between CAG repeat length and age at onset of HD. CAG repeat length is inversely correlated with age at onset of HD; r = –0.77. (B) Relationship between CAG repeat length and age at nursing home admission. CAG repeat length is inversely correlated with age at nursing home admission; r = –0.81. (C) Relationship between CAG repeat length and age at percutaneous endoscopic gastrostomy (PEG)
The explanation for the “parental origin effect” beca me clear when the HD gene was identified and cloned. Age at onset was found to be inversely rela ted to the length of trinucleotide repeats in the g ene (Margolis and Ross 2003).
The American Psychiatric Publishing Textbook of Neuropsychiatry and Behavioral Neurosciences, Fifth EditionEdited by Yudofsky SC, Hales RE. © 2008 American Psychiatric Publishing, Inc. All rights reserved. www.appi.org
248
at percutaneous endoscopic gastrostomy (PEG) placement. CAG repeat length is inversely correlated with age at PEG placement; r = –0.91. (D) Relationship between age at onset of HD and age at PEG, stratified by the median CAG repeat length. Boxes represent individuals with CAG repeat length >46. Filled circles represent individuals with CAG repeat length <46. In a regression model, both age at onset (P = 0.001) and CAG repeat length (P = 0.001) were associated with age at PEG placement.
Source.Reprinted from Marder K, Sandler S, Lechich A, et al.: “Relationship Between CAG Repeat Length and Late-Stage Outcomes in Huntington’s Disease.” Neurology 59:1622–1624. Used with permission.
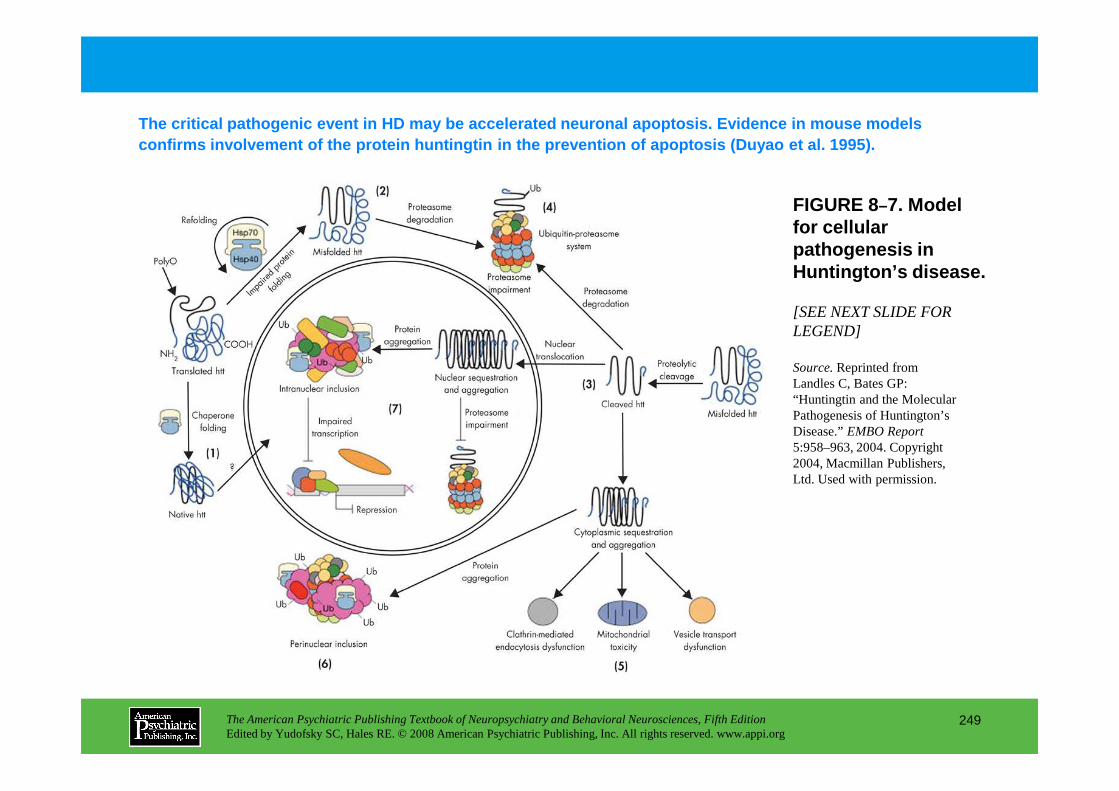
FIGURE 8–7. Model for cellular pathogenesis in Huntington’s disease.
[SEE NEXT SLIDE FOR LEGEND]
Source.Reprinted from Landles C, Bates GP: “Huntingtin and the Molecular
The critical pathogenic event in HD may be accelera ted neuronal apoptosis. Evidence in mouse models confirms involvement of the protein huntingtin in t he prevention of apoptosis (Duyao et al. 1995).
The American Psychiatric Publishing Textbook of Neuropsychiatry and Behavioral Neurosciences, Fifth EditionEdited by Yudofsky SC, Hales RE. © 2008 American Psychiatric Publishing, Inc. All rights reserved. www.appi.org
249
“Huntingtin and the Molecular Pathogenesis of Huntington’s Disease.” EMBO Report 5:958–963, 2004. Copyright 2004, Macmillan Publishers, Ltd. Used with permission.

FIGURE 8–7. Model for cellular pathogenesis in Huntington’s disease (continued).
The molecular chaperones Hsp70 and Hsp40 promote the folding of newly synthesized huntingtin (htt) into a native structure. Wild-type htt is predominantly cytoplasmic and probably functions in vesicle transport, cytoskeletal anchoring, clathrin-mediated endocytosis, neuronal transport, or postsynaptic signaling. htt may be transported into the nucleus and have a role in transcriptional regulation (1). Chaperones can facilitate the recognition of abnormal proteins, promoting either their refolding or ubiquitination (Ub) and subsequent degradation by the 26S proteasome. The HD mutation induces conformational changes and is likely to cause the abnormal folding of htt, which, if not corrected by chaperones, leads to the accumulation of misfolded htt in the cytoplasm (2). Alternatively, mutant htt might also be proteolytically cleaved, giving rise to amino-terminal fragments that form sheet structures (3). Ultimately, toxicity might be elicited by mutant full-length htt or by cleaved N-terminal fragments, which may form soluble monomers, oligomers, or large insoluble aggregates. In the cytoplasm, mutant forms of htt may impair the ubiquitin-proteasome system (UPS), leading to the accumulation of more
The American Psychiatric Publishing Textbook of Neuropsychiatry and Behavioral Neurosciences, Fifth EditionEdited by Yudofsky SC, Hales RE. © 2008 American Psychiatric Publishing, Inc. All rights reserved. www.appi.org
250
cytoplasm, mutant forms of htt may impair the ubiquitin-proteasome system (UPS), leading to the accumulation of more proteins that are misfolded (4). These toxic proteins might also impair normal vesicle transport and clathrin-mediated endocytosis. Also, the presence of mutant htt could activate proapoptotic proteins directly or indirectly by mitochondrial damage, leading to greater cellular toxicity and other deleterious effects (5). In an effort to protect itself, the cell accumulates toxic fragments into ubiquitinated cytoplasmic perinuclear aggregates (6). In addition, mutant htt can be translocated into the nucleus to form nuclear inclusions, which may disrupt transcription and the UPS (7).
Source.Reprinted from Landles C, Bates GP: “Huntingtin and the Molecular Pathogenesis of Huntington’s Disease.” EMBO Report 5:958–963, 2004. Copyright 2004, Macmillan Publishers, Ltd. Used with permission.
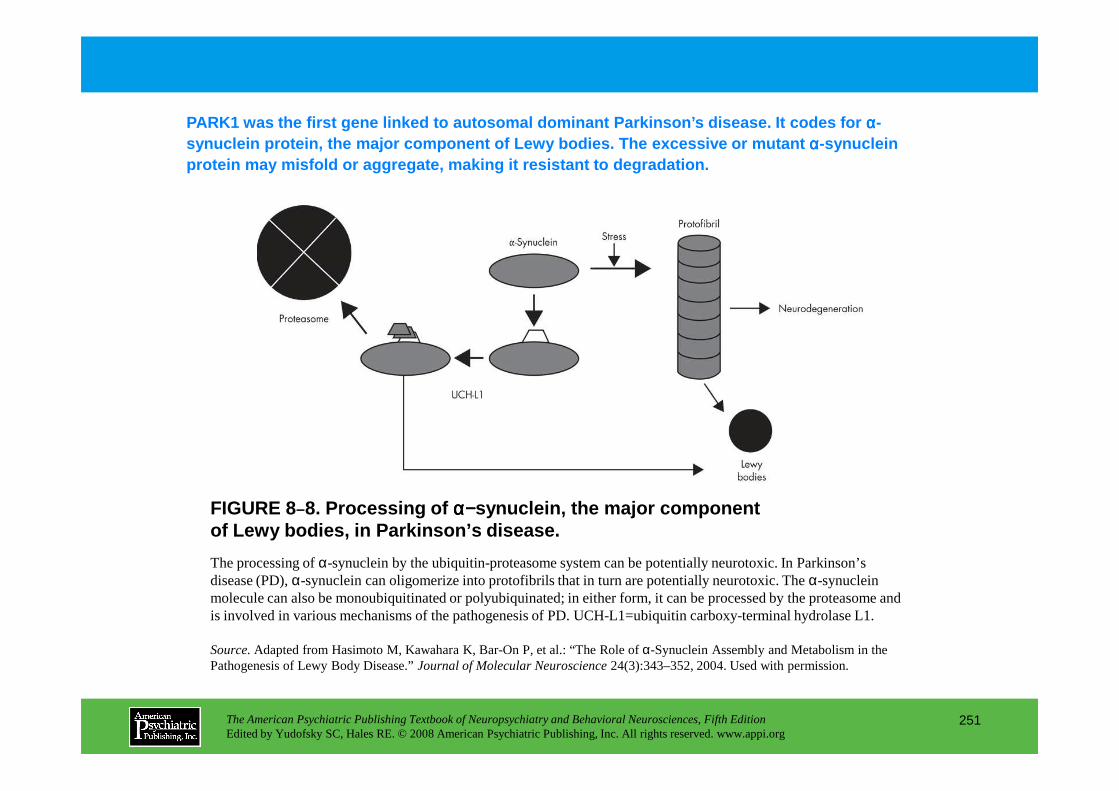
PARK1 was the first gene linked to autosomal dominant Par kinson’s disease. It codes for αααα-synuclein protein, the major component of Lewy bodi es. The excessive or mutant αααα-synuclein protein may misfold or aggregate, making it resista nt to degradation.
The American Psychiatric Publishing Textbook of Neuropsychiatry and Behavioral Neurosciences, Fifth EditionEdited by Yudofsky SC, Hales RE. © 2008 American Psychiatric Publishing, Inc. All rights reserved. www.appi.org
251
FIGURE 8–8. Processing of αααα−−−−synuclein, the major component of Lewy bodies, in Parkinson’s disease.
The processing of α-synuclein by the ubiquitin-proteasome system can be potentially neurotoxic. In Parkinson’s disease (PD), α-synuclein can oligomerize into protofibrils that in turn are potentially neurotoxic. The α-synuclein molecule can also be monoubiquitinated or polyubiquinated; in either form, it can be processed by the proteasome and is involved in various mechanisms of the pathogenesis of PD. UCH-L1=ubiquitin carboxy-terminal hydrolase L1.
Source.Adapted from Hasimoto M, Kawahara K, Bar-On P, et al.: “The Role of α-Synuclein Assembly and Metabolism in the Pathogenesis of Lewy Body Disease.” Journal of Molecular Neuroscience24(3):343–352, 2004. Used with permission.

FIGURE 8–9. P-type adenosine triphosphatase (ATPase) in Wilson’s disease.P-type adenosine triphosphatase (ATPase) is responsible for the binding and transport of copper. Note the six copper-binding domains, the adenosine triphosphate (ATP)-binding domain, the phosphorylation domain, and the channel domain. ATP = adenosine triphosphate; Pro-Cys-Pro = proline-cysteine-proline.
Wilson’s disease, an autosomal recessive disorder, occurs as a result of excessive copper accumulation and failure of copper excretion. The g ene ATP7B has been found to encode a putative copper-transporting P-type ATPase.
The American Psychiatric Publishing Textbook of Neuropsychiatry and Behavioral Neurosciences, Fifth EditionEdited by Yudofsky SC, Hales RE. © 2008 American Psychiatric Publishing, Inc. All rights reserved. www.appi.org
252
Pro = proline-cysteine-proline.
Source.Reprinted from El Youssof M: “Wilson Disease.” Mayo Clinic Proceedings78(9):1126–1136, 2003. Used with permission.
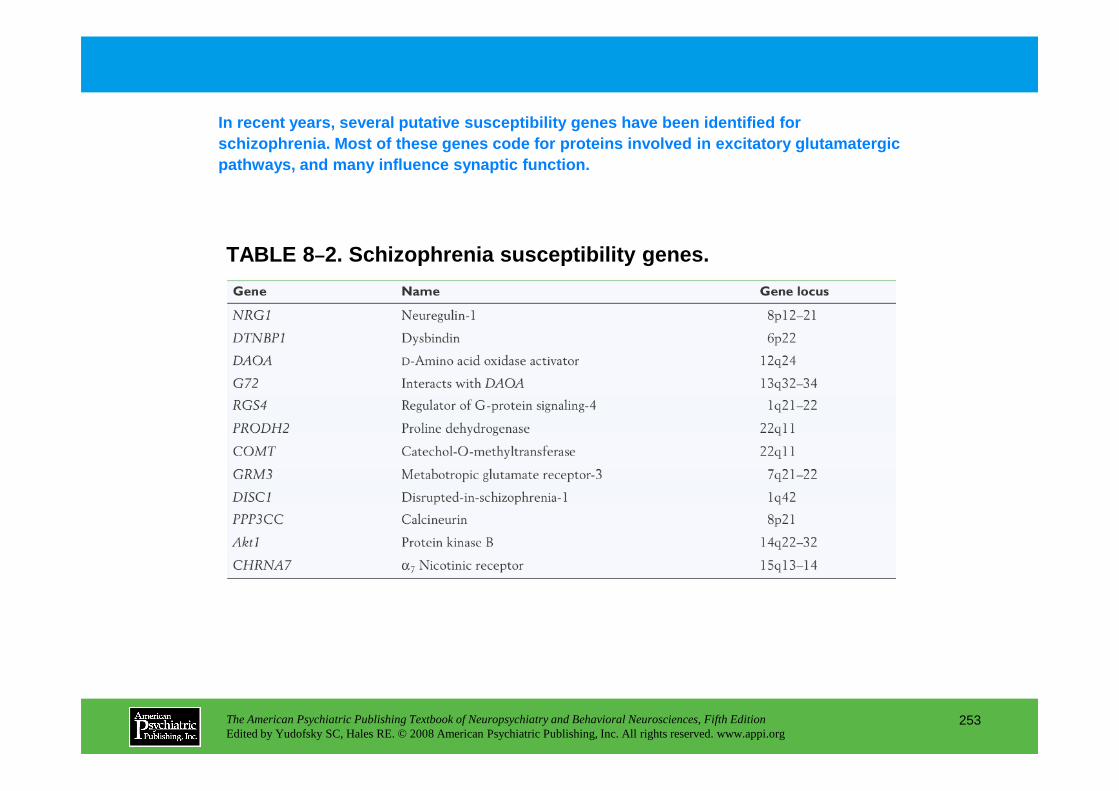
TABLE 8 –2. Schizophrenia susceptibility genes.
In recent years, several putative susceptibility ge nes have been identified for schizophrenia. Most of these genes code for proteins involved in excitatory glutamatergic pathways, and many influence synaptic function.
The American Psychiatric Publishing Textbook of Neuropsychiatry and Behavioral Neurosciences, Fifth EditionEdited by Yudofsky SC, Hales RE. © 2008 American Psychiatric Publishing, Inc. All rights reserved. www.appi.org
253
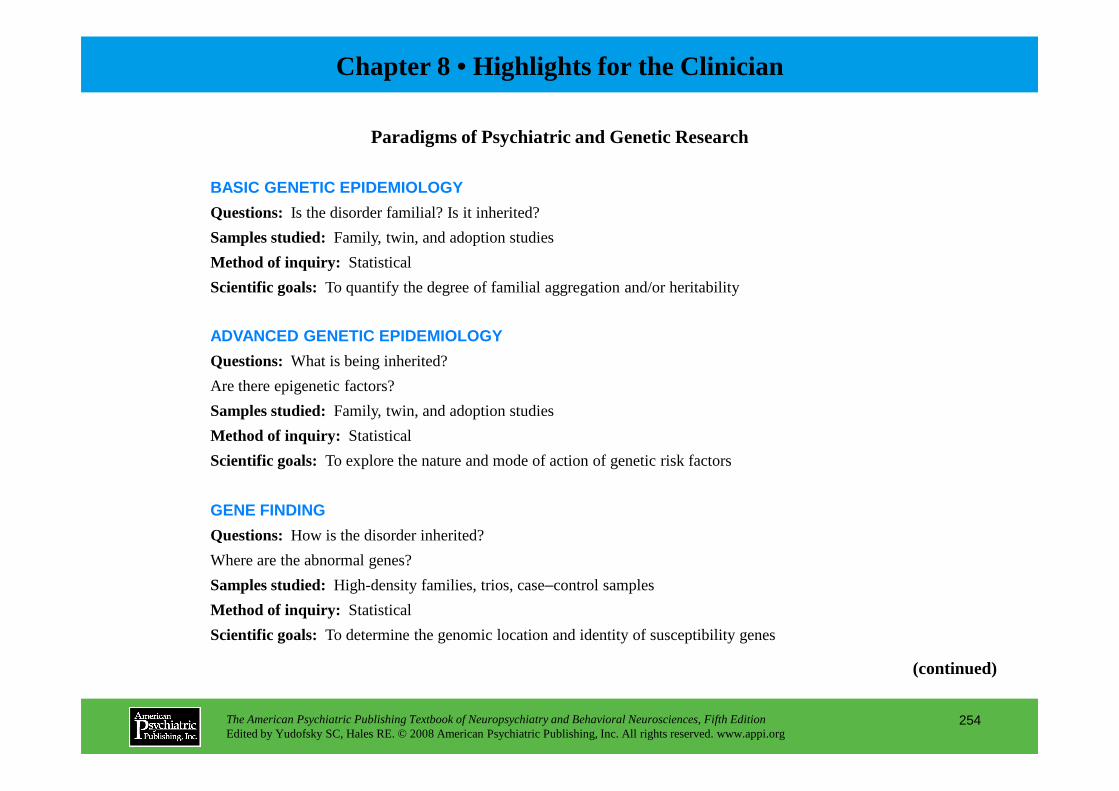
Chapter 8 • Highlights for the Clinician
Paradigms of Psychiatric and Genetic Research
BASIC GENETIC EPIDEMIOLOGY
Questions: Is the disorder familial? Is it inherited?
Samples studied: Family, twin, and adoption studies
Method of inquiry: Statistical
Scientific goals: To quantify the degree of familial aggregation and/or heritability
ADVANCED GENETIC EPIDEMIOLOGY
Questions: What is being inherited?
Are there epigenetic factors?
The American Psychiatric Publishing Textbook of Neuropsychiatry and Behavioral Neurosciences, Fifth EditionEdited by Yudofsky SC, Hales RE. © 2008 American Psychiatric Publishing, Inc. All rights reserved. www.appi.org
254
Samples studied: Family, twin, and adoption studies
Method of inquiry: Statistical
Scientific goals: To explore the nature and mode of action of genetic risk factors
GENE FINDING
Questions: How is the disorder inherited?
Where are the abnormal genes?
Samples studied: High-density families, trios, case–control samples
Method of inquiry: Statistical
Scientific goals: To determine the genomic location and identity of susceptibility genes
(continued)

MOLECULAR GENETICS
Questions: What are the molecular and pathological effects?
Samples studied: Humans, animals
Method of inquiry: Biological
Scientific goals: To identify critical DNA variants and trace the biological pathways from DNA to disorder
Source:Adapted from Kendler KS: “Psychiatric Genetics: A Methodologic Critique.” American Journal of Psychiatry 162:3–11, 2005.
The American Psychiatric Publishing Textbook of Neuropsychiatry and Behavioral Neurosciences, Fifth EditionEdited by Yudofsky SC, Hales RE. © 2008 American Psychiatric Publishing, Inc. All rights reserved. www.appi.org
255
CHAPTER 9
NEUROPSYCHIATRIC ASPECTS OF PAIN MANAGEMENT
Brenda Golianu, M.D. • Rashmi Bhandari, Ph.D.Richard J. Shaw, M.D. • William G. Brose, M.D.
Raymond Gaeta, M.D. • David Spiegel, M.D.
The American Psychiatric Publishing Textbook of Neuropsychiatry and Behavioral Neurosciences, Fifth EditionEdited by Yudofsky SC, Hales RE. © 2008 American Psychiatric Publishing, Inc. All rights reserved. www.appi.org
256
Slide Show
Topic headings and reading list
Tables and figures
Highlights for the clinician
Main menu
(About, Contents, Contributors, Publishing facts)
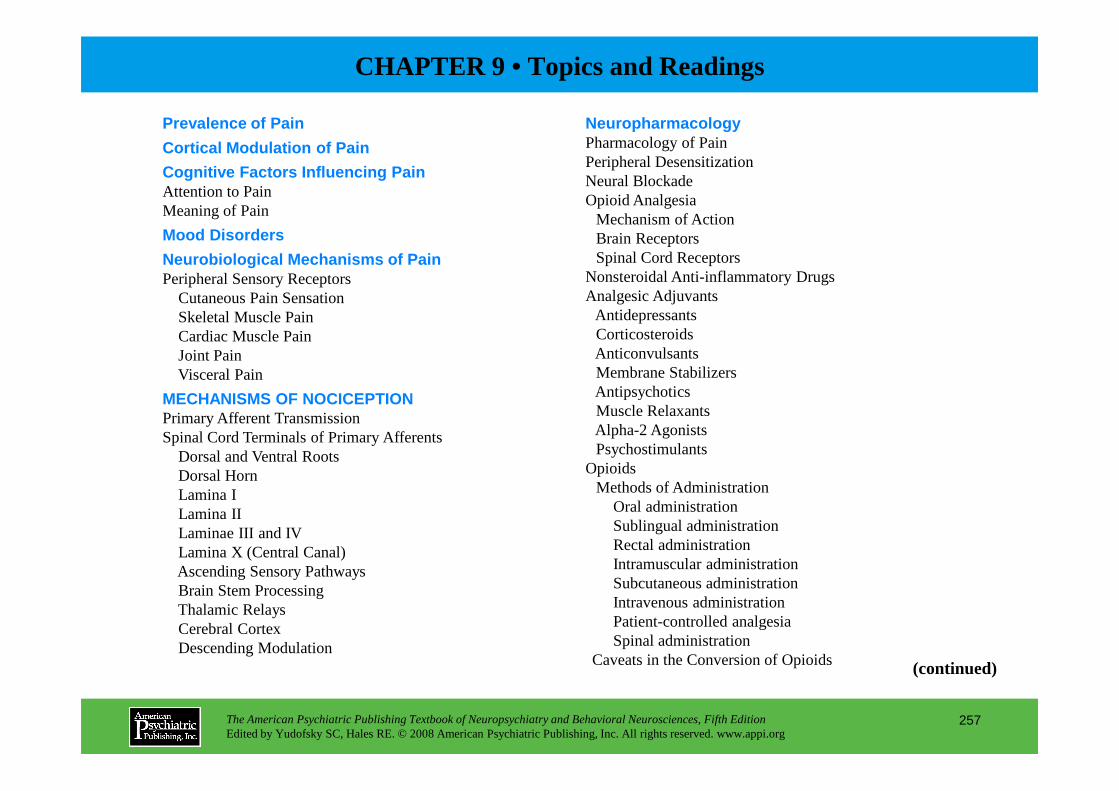
Prevalence of Pain
Cortical Modulation of Pain
Cognitive Factors Influencing PainAttention to PainMeaning of Pain
Mood Disorders
Neurobiological Mechanisms of PainPeripheral Sensory Receptors
Cutaneous Pain SensationSkeletal Muscle PainCardiac Muscle PainJoint PainVisceral Pain
MECHANISMS OF NOCICEPTION
NeuropharmacologyPharmacology of PainPeripheral DesensitizationNeural BlockadeOpioid Analgesia
Mechanism of ActionBrain ReceptorsSpinal Cord Receptors
Nonsteroidal Anti-inflammatory DrugsAnalgesic Adjuvants
AntidepressantsCorticosteroidsAnticonvulsantsMembrane StabilizersAntipsychotics
CHAPTER 9 • Topics and Readings
The American Psychiatric Publishing Textbook of Neuropsychiatry and Behavioral Neurosciences, Fifth EditionEdited by Yudofsky SC, Hales RE. © 2008 American Psychiatric Publishing, Inc. All rights reserved. www.appi.org
257
MECHANISMS OF NOCICEPTIONPrimary Afferent TransmissionSpinal Cord Terminals of Primary Afferents
Dorsal and Ventral RootsDorsal HornLamina ILamina IILaminae III and IVLamina X (Central Canal)Ascending Sensory PathwaysBrain Stem ProcessingThalamic RelaysCerebral CortexDescending Modulation
AntipsychoticsMuscle RelaxantsAlpha-2 AgonistsPsychostimulants
OpioidsMethods of Administration
Oral administrationSublingual administrationRectal administrationIntramuscular administrationSubcutaneous administrationIntravenous administrationPatient-controlled analgesiaSpinal administration
Caveats in the Conversion of Opioids (continued)

CHAPTER 9 • Topics and Readings (continued)
Nonpharmacological TreatmentsCognitive-Behavioral TreatmentStress Management/ Relaxation Training/ Guided
ImageryBiofeedback TrainingSleep EducationParenting TrainingDecreasing Secondary ReinforcementsElectrical Stimulation
Transcutaneous Electrical Nerve StimulationDorsal Column StimulationSpinal Cord Stimulation
AcupunctureNeural BlockadeNeurodestructive Procedures
Casey KL, Lorenz J, Minoshima S: Insights into the pathophysiology of neuropathic pain through functional brain imaging. Exp Neurol 184 (suppl 1):S80–S88, 2003
Fishbain DA, Cutler R, Rosomoff HL, et al: Do antidepressants have an analgesic effect in psychogenic pain and somatoform pain disorder? A meta-analysis. Psychosom Med 60:503–509, 1998
Melzack R: From the gate to the neuromatrix. Pain(suppl 6):S121–S126, 1999
Posner MI, Petersen SE: The attention system of the human brain. Annu Rev Neurosci 13:125–142, 1990
The American Psychiatric Publishing Textbook of Neuropsychiatry and Behavioral Neurosciences, Fifth EditionEdited by Yudofsky SC, Hales RE. © 2008 American Psychiatric Publishing, Inc. All rights reserved. www.appi.org
258
Neurodestructive ProceduresHypnosis
Conclusion
1990Price DD: Psychological and neural mechanisms of the
affective dimension of pain. Science 288:1769–1772, 2000
Price DD, Zhou QQ, Moshiree B, et al: Peripheral and central contributions to hyperalgesia in irritable bowel syndrome. J Pain 7:529–535, 2006
Spiegel H, Spiegel D: Trance and Treatment: Clinical Uses of Hypnosis. Washington, DC, American Psychiatric Press, 2004
Wilson KG, Eriksson MY, D’Eon JL, et al: Major depression and insomnia in chronic pain. Clin J Pain 18 (suppl 2):77–83, 2002
RECOMMENDED READINGSBodnar RJ, Klein GE: Endogenous opiates and behavior:
2005. Peptides (2006), doi:10.1016/j.peptides.2006 .07.011, 2006
Borsook D, Becerra LR: Breaking down the barriers: fMRI applications in pain, analgesia and analgesics. Mol Pain 2:30, 2006. Available at: http://www.molecularpain.com.
Butler AC, Chapman JE, Forman EM, et al: The empirical status of cognitive-behavioral therapy: a review of meta-analyses. Clin Psychol Rev 26:17–31, 2006
CHAPTER 9 • Tables and Figures
Figure 9–1. The circuitous, mutually reinforcing nature of the pain experienceFigure 9–2. Sensitivity range of the polymodal C fiber nociceptorFigure 9–3. Events leading to activation, sensitization, and spread of sensitization of
primary afferent nociceptor terminalsFigure 9–4. First and second pain fibersFigure 9–5. Schematic drawing of the lamination of the ventral cell column of the
seventh lumbar spinal cord segment in the full-grown catFigure 9–6. Visceral pain: convergence of visceral and somatic nociceptive afferentsFigure 9–7. Schematic drawing of nociceptive processing, outlining ascending (left side
of diagram) and descending (right side of diagram) pathwaysFigure 9–8. Rostral projections of nociceptive processingFigure 9–9. Dorsal horn processingFigure 9–10. Local tissue factors and peripheral pain receptorsTable 9–1. Pharmacodynamic effects obtained when an opioid agonist interacts with
The American Psychiatric Publishing Textbook of Neuropsychiatry and Behavioral Neurosciences, Fifth EditionEdited by Yudofsky SC, Hales RE. © 2008 American Psychiatric Publishing, Inc. All rights reserved. www.appi.org
259
Table 9–1. Pharmacodynamic effects obtained when an opioid agonist interacts with the various types of opioid receptors
Table 9–2. Spinal neurotransmitters, receptors, and ligandsTable 9–3. Terminal half-life, recommended dosage, influence of food on absorption,
and incidence of gastric erosion from nonsteroidal anti-inflammatory drugs (NSAIDs)
Table 9–4. Coanalgesic medicationsTable 9–5. Anticonvulsants in common useTable 9–6. Doses, pharmacokinetic parameters, minimum effective concentration,
and duration of pain relief for various opioid drugsFigure 9–11. Pharmacokinetic model of an epidural injection of a hydrophilic opioid
such as morphineSummary Highlights for the Clinician
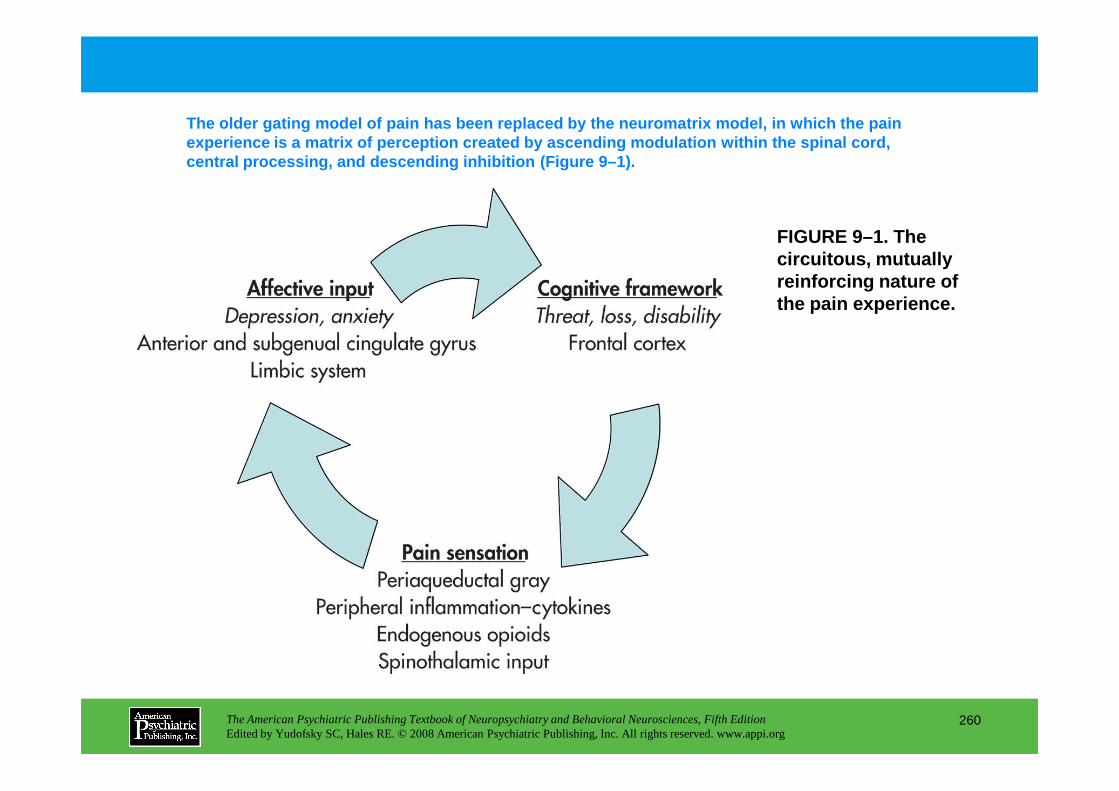
FIGURE 9–1. The circuitous, mutually reinforcing nature of the pain experience.
The older gating model of pain has been replaced by the neuromatrix model, in which the pain experience is a matrix of perception created by asc ending modulation within the spinal cord, central processing, and descending inhibition (Figu re 9–1).
The American Psychiatric Publishing Textbook of Neuropsychiatry and Behavioral Neurosciences, Fifth EditionEdited by Yudofsky SC, Hales RE. © 2008 American Psychiatric Publishing, Inc. All rights reserved. www.appi.org
260
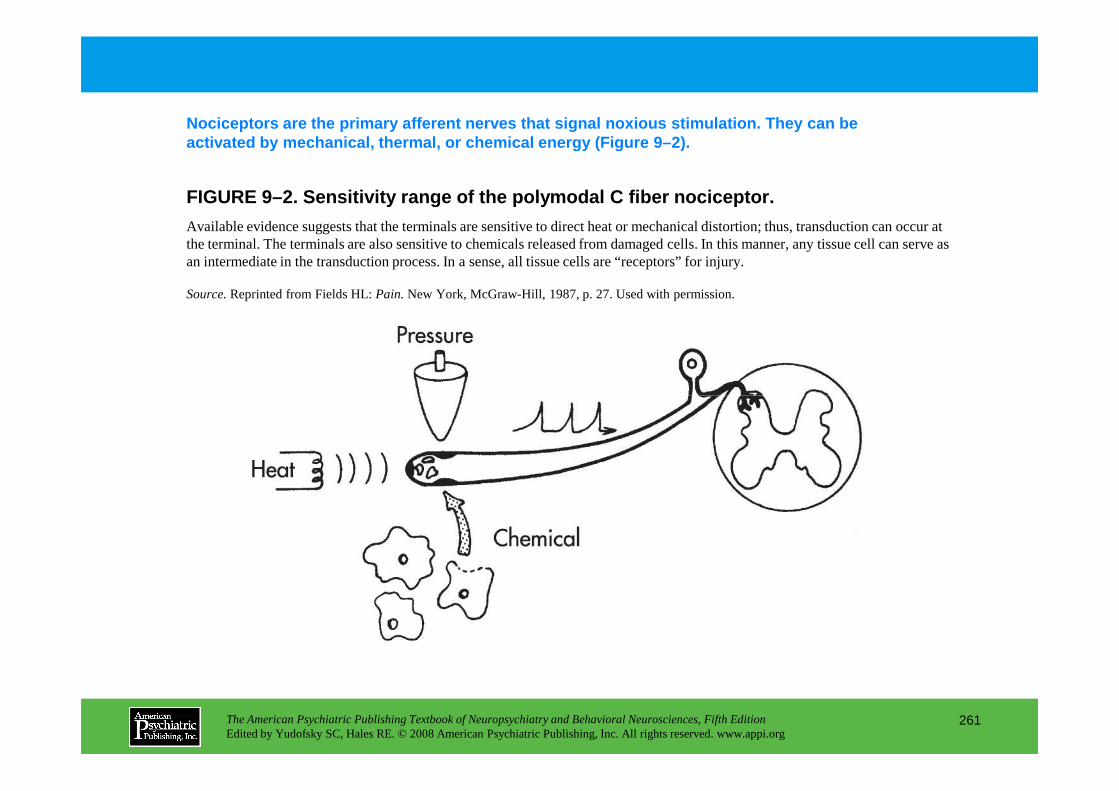
FIGURE 9–2. Sensitivity range of the polymodal C fi ber nociceptor.
Nociceptors are the primary afferent nerves that si gnal noxious stimulation. They can be activated by mechanical, thermal, or chemical energ y (Figure 9–2).
Available evidence suggests that the terminals are sensitive to direct heat or mechanical distortion; thus, transduction can occur at the terminal. The terminals are also sensitive to chemicals released from damaged cells. In this manner, any tissue cell can serve as an intermediate in the transduction process. In a sense, all tissue cells are “receptors” for injury.
Source.Reprinted from Fields HL: Pain.New York, McGraw-Hill, 1987, p. 27. Used with permission.
The American Psychiatric Publishing Textbook of Neuropsychiatry and Behavioral Neurosciences, Fifth EditionEdited by Yudofsky SC, Hales RE. © 2008 American Psychiatric Publishing, Inc. All rights reserved. www.appi.org
261
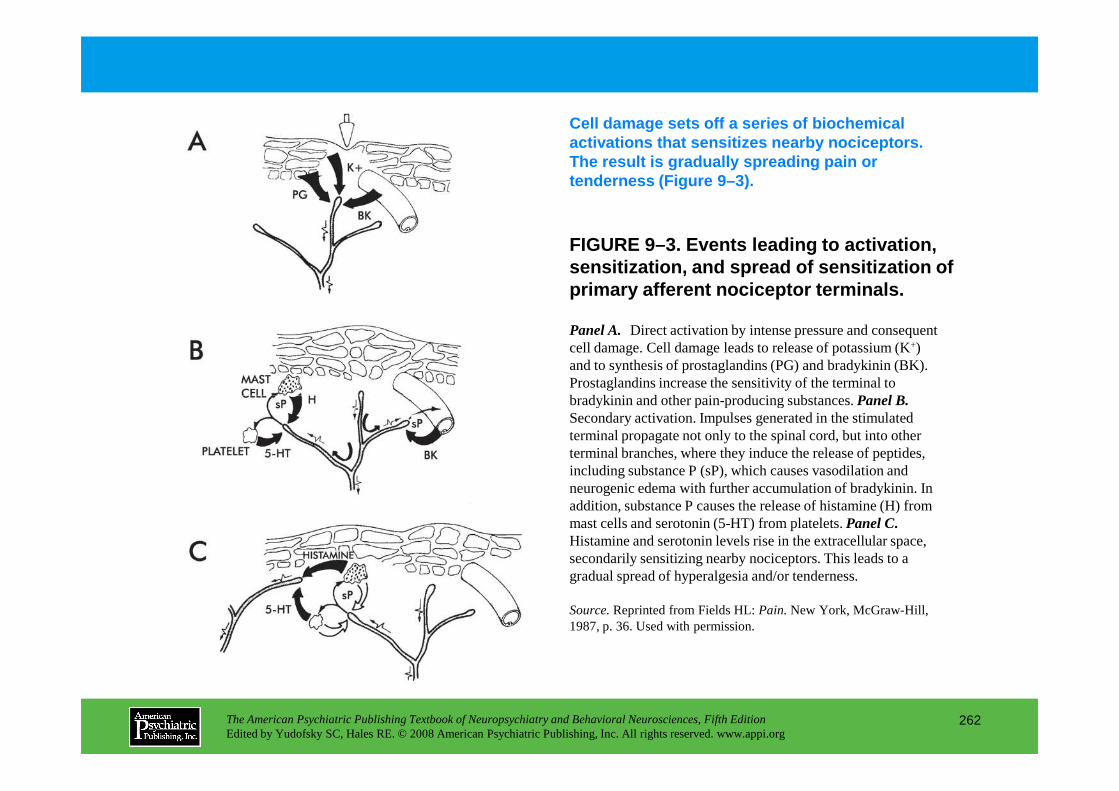
FIGURE 9–3. Events leading to activation, sensitization, and spread of sensitization of primary afferent nociceptor terminals.
Cell damage sets off a series of biochemical activations that sensitizes nearby nociceptors. The result is gradually spreading pain or tenderness (Figure 9–3).
Panel A. Direct activation by intense pressure and consequent cell damage. Cell damage leads to release of potassium (K+) and to synthesis of prostaglandins (PG) and bradykinin (BK). Prostaglandins increase the sensitivity of the terminal to bradykinin and other pain-producing substances. Panel B.
The American Psychiatric Publishing Textbook of Neuropsychiatry and Behavioral Neurosciences, Fifth EditionEdited by Yudofsky SC, Hales RE. © 2008 American Psychiatric Publishing, Inc. All rights reserved. www.appi.org
262
bradykinin and other pain-producing substances. Panel B.Secondary activation. Impulses generated in the stimulated terminal propagate not only to the spinal cord, but into other terminal branches, where they induce the release of peptides, including substance P (sP), which causes vasodilation and neurogenic edema with further accumulation of bradykinin. In addition, substance P causes the release of histamine (H) from mast cells and serotonin (5-HT) from platelets. Panel C.Histamine and serotonin levels rise in the extracellular space, secondarily sensitizing nearby nociceptors. This leads to a gradual spread of hyperalgesia and/or tenderness.
Source.Reprinted from Fields HL: Pain.New York, McGraw-Hill, 1987, p. 36. Used with permission.
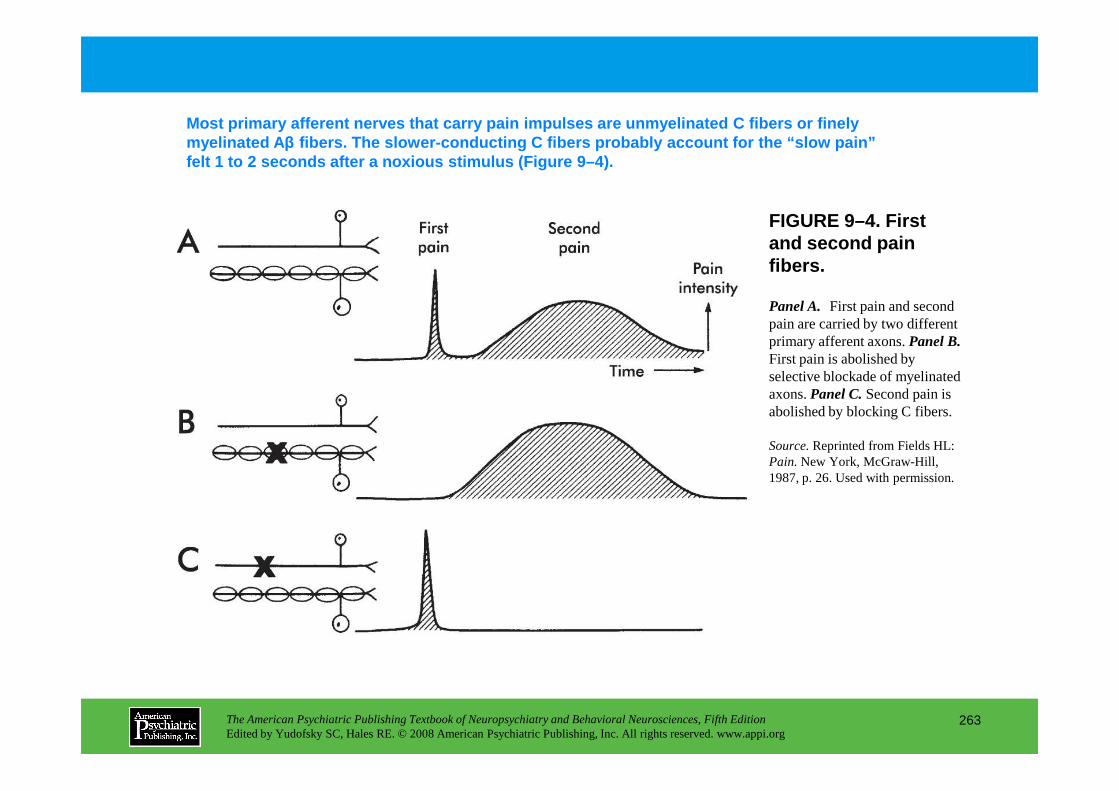
FIGURE 9–4. First and second pain fibers.
Most primary afferent nerves that carry pain impuls es are unmyelinated C fibers or finely myelinated A β fibers. The slower-conducting C fibers probably ac count for the “slow pain” felt 1 to 2 seconds after a noxious stimulus (Figure 9 –4).
Panel A. First pain and second pain are carried by two different primary afferent axons. Panel B.First pain is abolished by selective blockade of myelinated axons. PanelC. Second pain is
The American Psychiatric Publishing Textbook of Neuropsychiatry and Behavioral Neurosciences, Fifth EditionEdited by Yudofsky SC, Hales RE. © 2008 American Psychiatric Publishing, Inc. All rights reserved. www.appi.org
263
axons. PanelC. Second pain is abolished by blocking C fibers.
Source.Reprinted from Fields HL: Pain.New York, McGraw-Hill, 1987, p. 26. Used with permission.
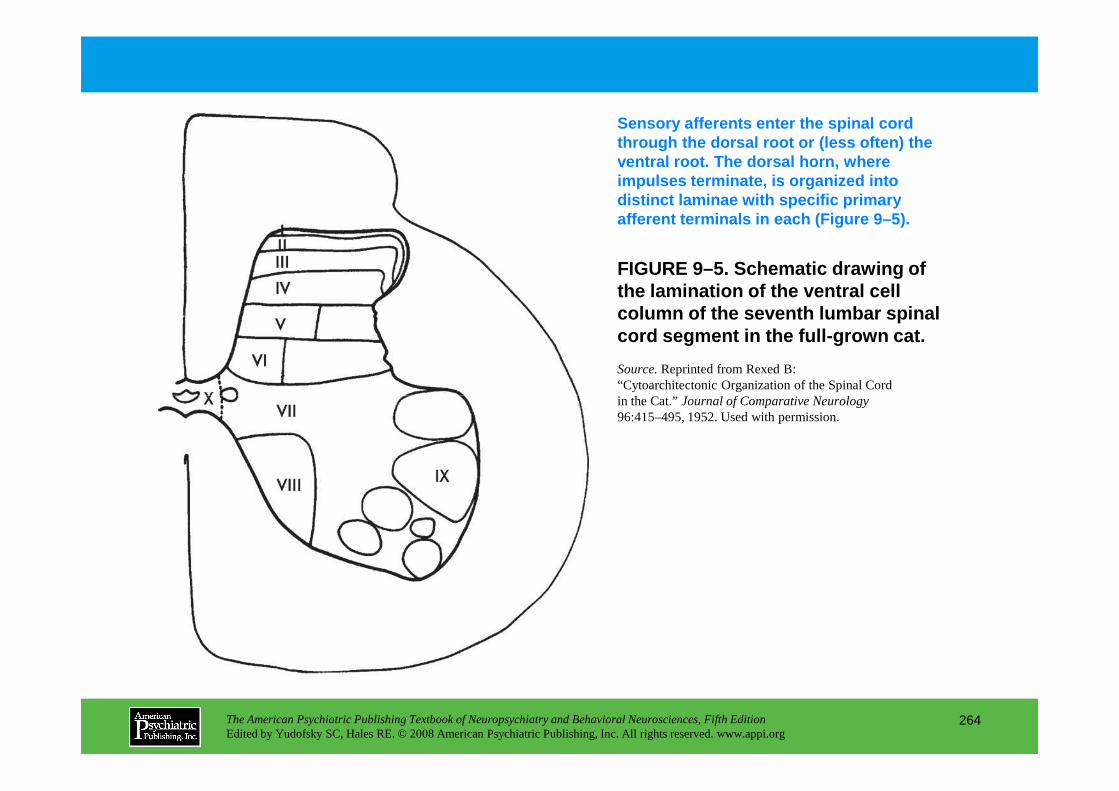
FIGURE 9–5. Schematic drawing of the lamination of the ventral cell column of the seventh lumbar spinal cord segment in the full-grown cat.
Sensory afferents enter the spinal cord through the dorsal root or (less often) the ventral root. The dorsal horn, where impulses terminate, is organized into distinct laminae with specific primary afferent terminals in each (Figure 9–5).
Source.Reprinted from Rexed B: “Cytoarchitectonic Organization of the Spinal Cord in the Cat.” Journal of Comparative Neurology
The American Psychiatric Publishing Textbook of Neuropsychiatry and Behavioral Neurosciences, Fifth EditionEdited by Yudofsky SC, Hales RE. © 2008 American Psychiatric Publishing, Inc. All rights reserved. www.appi.org
264
in the Cat.” Journal of Comparative Neurology 96:415–495, 1952. Used with permission.
FIGURE 9–6. (next slide) Visceral pain: convergence of visceral and somatic nociceptive afferents.
The convergence of somatic and visceral nociceptive afferents on the same neuron in the dorsal horn probably explains the phenomenon of “ref erred pain” (Figure 9–6).
Visceral sympathetic afferents converge on the same dorsal horn neuron as do somatic nociceptive afferents. Visceral noxious stimuli are then conveyed, together with somatic noxious stimuli, via the spinothalamic pathways to the brain.Note. 1) Referred pain is felt in the cutaneous area corresponding to the dorsal horn neurons on which visceral afferents converge; this is accompanied by allodynia and hyperalgesia in this skin area. 2) Reflex somatic motor activity results in muscle spasm, which may stimulate parietal peritoneum and initiate somatic noxious input to the dorsal horn. 3) Reflex sympathetic efferent activity may result in spasm of sphincters of viscera over a wide area, causing pain remote from the original stimulus. 4)Reflex sympathetic efferent activity may result in visceral ischemia and further noxious stimulation; also,
The American Psychiatric Publishing Textbook of Neuropsychiatry and Behavioral Neurosciences, Fifth EditionEdited by Yudofsky SC, Hales RE. © 2008 American Psychiatric Publishing, Inc. All rights reserved. www.appi.org
265
original stimulus. 4)Reflex sympathetic efferent activity may result in visceral ischemia and further noxious stimulation; also, visceral nociceptors may be sensitized by norepinephrine release and microcirculatory changes. 5) Increased sympathetic activity may influence cutaneous nociceptors, which may be at least partly responsible for referred pain. 6) Peripheral visceralafferents branch considerably, causing much overlap in the territory of individual dorsal roots; only a small number of visceralafferent fibers converge on dorsal horn neurons compared with somatic nociceptive fibers. Also, visceral afferents converge on the dorsal horn over a large number of segments. This dull, vague visceral pain is very poorly localized and is often called deep visceral pain.
Source.Reprinted from Cousins MJ, Bridenbaugh PO (eds.): Neural Blockade in Clinical Anesthesia and Management of Pain,2nd Edition. Philadelphia, PA, JB Lippincott, 1988, p. 743. Used with permission.

FIGURE 9–6. Visceral pain: convergence of visceral and somatic nociceptive afferents.
The American Psychiatric Publishing Textbook of Neuropsychiatry and Behavioral Neurosciences, Fifth EditionEdited by Yudofsky SC, Hales RE. © 2008 American Psychiatric Publishing, Inc. All rights reserved. www.appi.org
266
FIGURE 9–7. (next slide) Schematic drawing of nocic eptive processing, outlining ascending (left side of diagram) and descending (right side of diagram) pathways.
Stimulation of nociceptors in the skin surface leads to impulse generation in the primary afferent. Concomitant with this impulse generation, increased levels of various endogenous algesic agents (substance P [sP], prostaglandins, histamine, serotonin, and bradykinin) are detected near the area of stimulation in the periphery. The noxious impulse is conducted to the dorsal horn of the spinal cord, where it is subjected to local factors and descending modulation. The endogenous neurochemical mediators of this interaction at the dorsal horn that have been characterized are listed in the figure. Primarynociceptive afferents relay to projection neurons in the dorsal horn that ascend in the anterolateral funiculus to end in thethalamus. En route, collaterals of the projection neurons activate the nucleus reticularis gigantocellularis, whose neurons project to the thalamus and also activate the periaqueductal gray matter of the midbrain. Enkephalinergic neurons from the
The second-order neurons that arise in the laminae of the dorsal horn of the spinal cord use several specific routes to carry their messages to higher brain centers (Figure 9–7).
The American Psychiatric Publishing Textbook of Neuropsychiatry and Behavioral Neurosciences, Fifth EditionEdited by Yudofsky SC, Hales RE. © 2008 American Psychiatric Publishing, Inc. All rights reserved. www.appi.org
267
project to the thalamus and also activate the periaqueductal gray matter of the midbrain. Enkephalinergic neurons from the periaqueductal gray matter and noradrenergic neurons from the nucleus reticularis gigantocellularis activate descending serotonergic neurons of the nucleus raphe magnus. These fibers join with noradrenergic fibers from the locus coeruleus reticularis lateralis to project descending modulatory impulses to the dorsal horn via the dorsolateral funiculus. GABA=γ-aminobutyric acid.
Source. Reprinted from Brose WG, Cousins MJ: “Gynecologic Pain,” in Gynecologic Oncology. Edited by Coppelson M. Edinburgh, Churchill Livingstone, 1992, p. 1439. Used with permission of Elsevier.

FIGURE 9–7. Schematic drawing of nociceptive processing, outlining ascending (left side of diagram) and descending (right side of diagram)pathways.
The American Psychiatric Publishing Textbook of Neuropsychiatry and Behavioral Neurosciences, Fifth EditionEdited by Yudofsky SC, Hales RE. © 2008 American Psychiatric Publishing, Inc. All rights reserved. www.appi.org
268

FIGURE 9–8. (next slide) Rostral projections of noc iceptive processing.
Several nuclear groups of the thalamus are involved in the relay of nociceptive afferent impulses (Figure 9–8).
Ascending stimuli (left side of diagram)traveling in the anterolateral funiculus—as well as impulses relayed from the medulla, pons, and midbrain—are projected to the thalamic nuclear complex. The centromedian, submedius, and ventroposterolateral nuclei receive nociceptive information. The ventroposterolateral nucleus projects discretely to the cortex. The centromedian nucleus projects more diffusely, particularly to the limbic region. The descending fibers(right side of diagram)inhibit the transmission of nociceptive information between primary afferents and the projection neurons in the dorsal horn. The periaqueductal gray matter is controlled by projections from the anterior caudate nucleus, the midline limbic nuclei, and the arcuate nucleus of the hypothalamus. In addition to direct neural connection, endorphins synthesized in the pituitary are released
The American Psychiatric Publishing Textbook of Neuropsychiatry and Behavioral Neurosciences, Fifth EditionEdited by Yudofsky SC, Hales RE. © 2008 American Psychiatric Publishing, Inc. All rights reserved. www.appi.org
269
into the cerebrospinal fluid and the blood, where they can exert an inhibitory effect at multiple centers, including the periaqueductal gray matter.
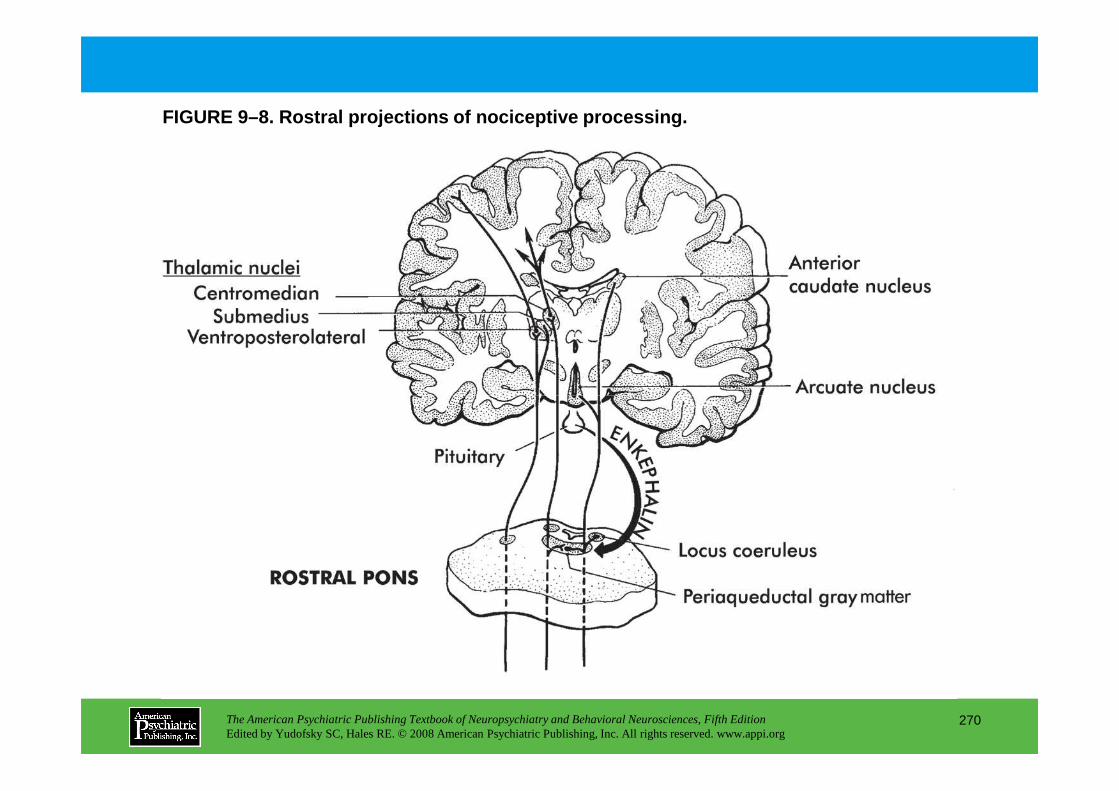
FIGURE 9–8. Rostral projections of nociceptive proc essing.
The American Psychiatric Publishing Textbook of Neuropsychiatry and Behavioral Neurosciences, Fifth EditionEdited by Yudofsky SC, Hales RE. © 2008 American Psychiatric Publishing, Inc. All rights reserved. www.appi.org
270

FIGURE 9–9. (next slide) Dorsal horn processing.
Some pathways in dorsal horn processing have been c haracterized (Figure 9–9).
Large- and small-diameter primary neurons have their cell bodies in the dorsal root ganglia. These fibers segregate as they approach the spinal cord. Large-diameter afferents (thick solid lines) travel in the medial portion, whereas small-diameter afferents (thin solid lines: C and Aδ) segregate to the lateral portions of the entry zone. The spinal terminals of the small fibers enter the cord, where they may ascend or descend for several segments in the dorsolateral tract (Lissauer’s tract) and subsequently terminate throughout the dorsal horn of the spinal cord. Aδ fiber afferents terminate primarily in lamina I (marginal zone), whereas C fiber afferents terminate in lamina II (substantia gelatinosa). In lamina I, nociceptive fibers synapse on dendrites of the large marginal (M) neurons. Smaller neurons in lamina I may exert presynapse inhibition of the marginal neuron. Other nociceptive fibers (Aδ) synapse with stalked (S) neurons in lamina II. These S neurons stimulate M neurons in lamina I. The relay between primary afferent fibers and S neurons is also
The American Psychiatric Publishing Textbook of Neuropsychiatry and Behavioral Neurosciences, Fifth EditionEdited by Yudofsky SC, Hales RE. © 2008 American Psychiatric Publishing, Inc. All rights reserved. www.appi.org
271
II. These S neurons stimulate M neurons in lamina I. The relay between primary afferent fibers and S neurons is also subject to modulation by inhibitory islet (I) neurons in lamina II. Central transmission is accomplished by M neurons directly, wide dynamic range neurons (WDRs) directly, or S neurons indirectly. M neurons are subject to inhibition by neurons in lamina II. Descending serotonergic neurons from the nucleus raphe magnus, which travel in the dorsolateral funiculus, are also shown. These neurons terminate throughout the spinal cord on interneurons (γ-aminobutyric acid [GABA] and enkephalins [ENK]) to provide inhibition of nociceptive transmission.DYN=dynorphin.
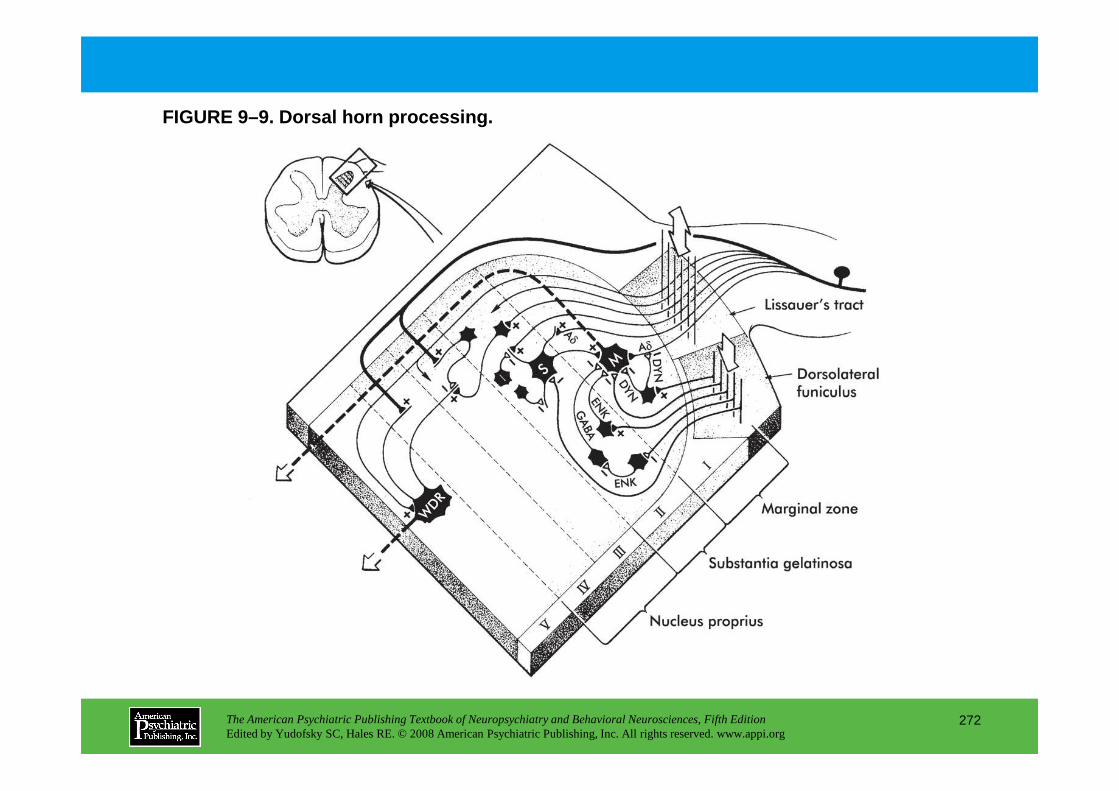
FIGURE 9–9. Dorsal horn processing.
The American Psychiatric Publishing Textbook of Neuropsychiatry and Behavioral Neurosciences, Fifth EditionEdited by Yudofsky SC, Hales RE. © 2008 American Psychiatric Publishing, Inc. All rights reserved. www.appi.org
272

FIGURE 9–10. Local tissue factors and peripheral pa in receptors.
This rough schematic drawing shows the local circui try involved in detecting a noxious stimulus from the periphery (Figure 9–10).
The physical stimuli of “trauma,” the chemical environment (e.g., H+), algesic substances (e.g., serotonin [5-HT] and bradykinin [BK]), and microcirculatory changes may all modify peripheral receptor activity. Efferent sympathetic activity may increase the sensitivity of receptors by means of noradrenaline (NA) (norepinephrine) release.
The American Psychiatric Publishing Textbook of Neuropsychiatry and Behavioral Neurosciences, Fifth EditionEdited by Yudofsky SC, Hales RE. © 2008 American Psychiatric Publishing, Inc. All rights reserved. www.appi.org
273
(norepinephrine) release. Substance P (sP) may be the peripheral pain transmitter. Points of potential blockade of nociception are shown as “Blocker”; other potential sites involve bradykinin, serotonin, noradrenaline, and substance P.PgE=prostaglandin E.
Source.Reprinted from Cousins MJ, Phillips GD (eds): Acute Pain Management. London, Churchill Livingstone, 1986, p. 742. Used with permission of Elsevier.
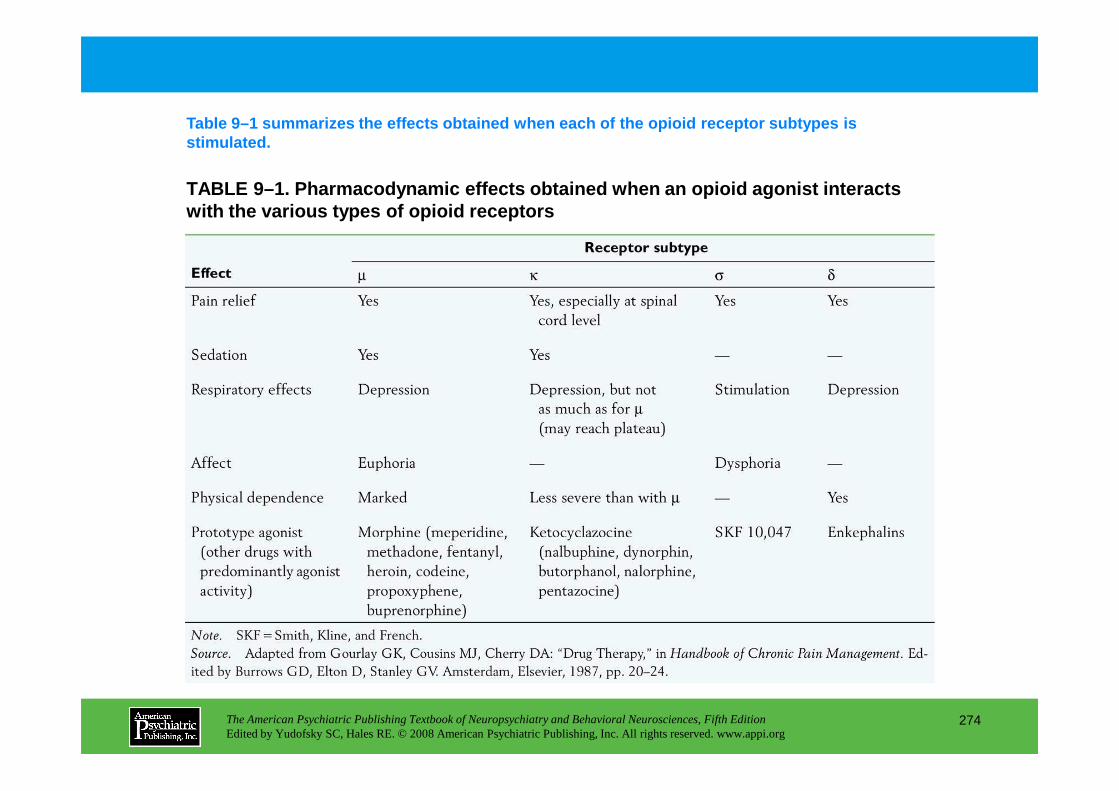
TABLE 9–1. Pharmacodynamic effects obtained when an opioid agonist interacts with the various types of opioid receptors
Table 9–1 summarizes the effects obtained when each of the opioid receptor subtypes is stimulated.
The American Psychiatric Publishing Textbook of Neuropsychiatry and Behavioral Neurosciences, Fifth EditionEdited by Yudofsky SC, Hales RE. © 2008 American Psychiatric Publishing, Inc. All rights reserved. www.appi.org
274
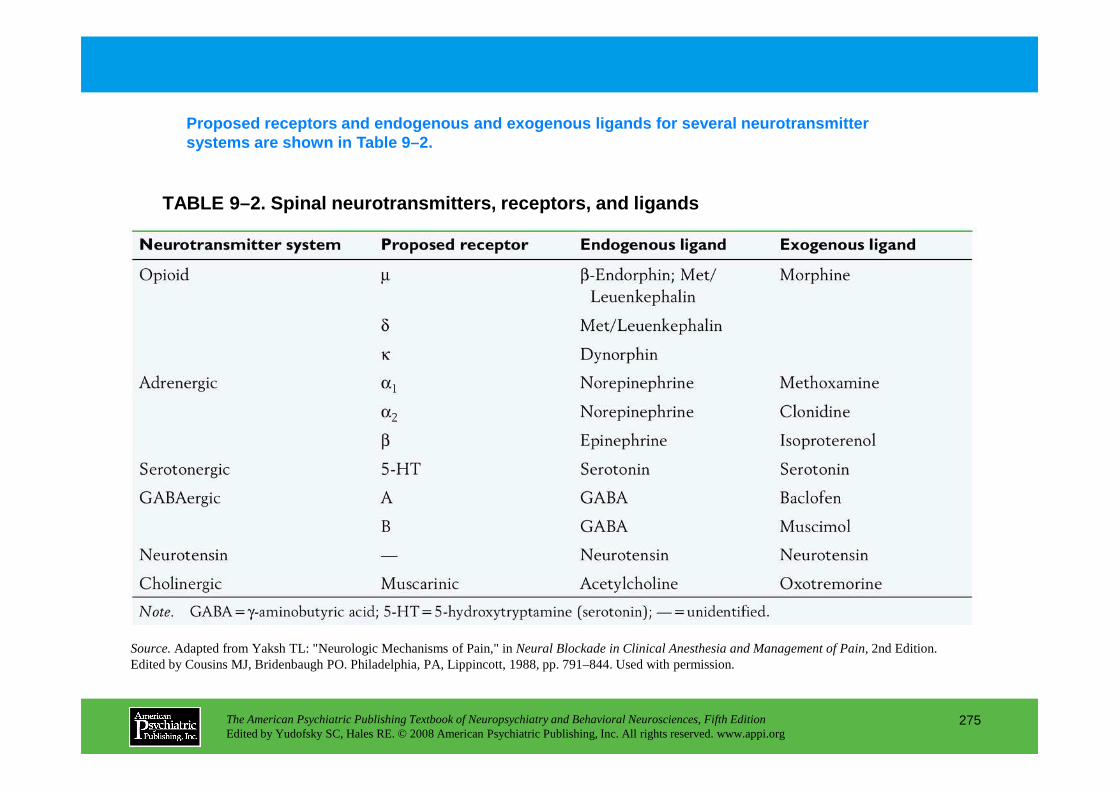
TABLE 9–2. Spinal neurotransmitters, receptors, and ligands
Proposed receptors and endogenous and exogenous lig ands for several neurotransmitter systems are shown in Table 9–2.
The American Psychiatric Publishing Textbook of Neuropsychiatry and Behavioral Neurosciences, Fifth EditionEdited by Yudofsky SC, Hales RE. © 2008 American Psychiatric Publishing, Inc. All rights reserved. www.appi.org
275
Source.Adapted from Yaksh TL: "Neurologic Mechanisms of Pain," in Neural Blockade in Clinical Anesthesia and Management of Pain,2nd Edition. Edited by Cousins MJ, Bridenbaugh PO. Philadelphia, PA, Lippincott, 1988, pp. 791–844. Used with permission.
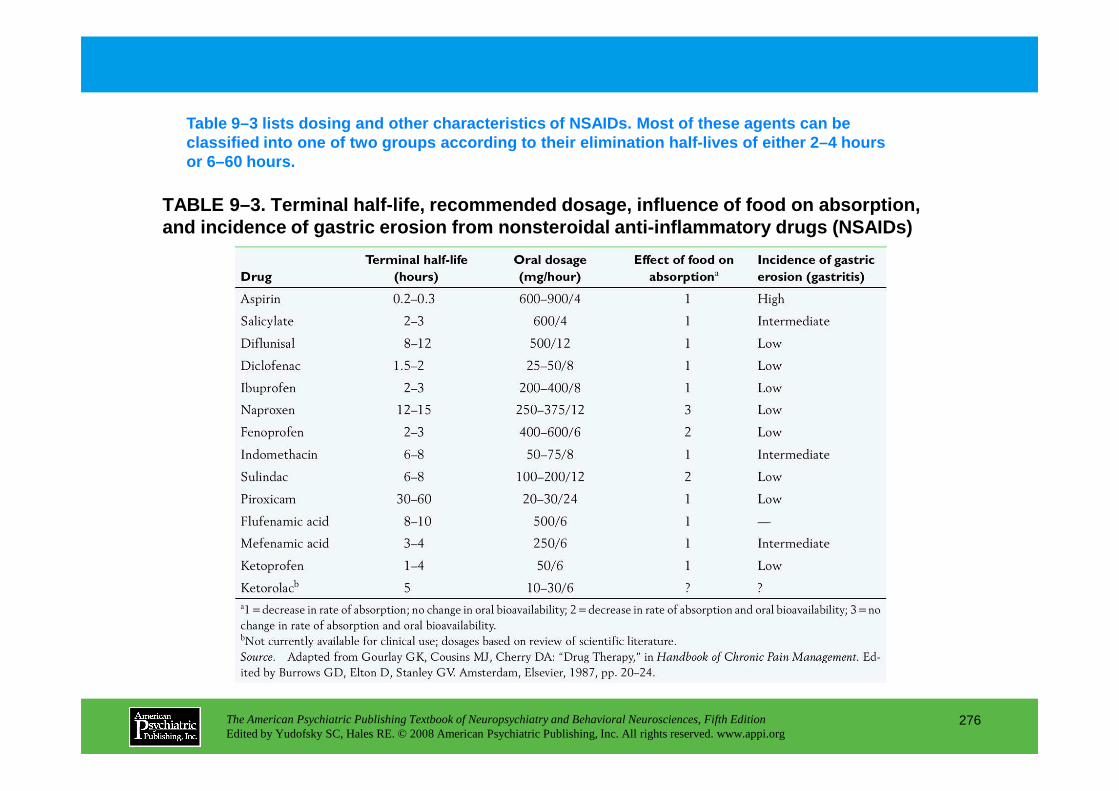
TABLE 9–3. Terminal half-life, recommended dosage, influence of food on absorption, and incidence of gastric erosion from nonsteroidal anti-inflammatory drugs (NSAIDs)
Table 9–3 lists dosing and other characteristics of NSAIDs. Most of these agents can be classified into one of two groups according to thei r elimination half-lives of either 2–4 hours or 6–60 hours.
The American Psychiatric Publishing Textbook of Neuropsychiatry and Behavioral Neurosciences, Fifth EditionEdited by Yudofsky SC, Hales RE. © 2008 American Psychiatric Publishing, Inc. All rights reserved. www.appi.org
276
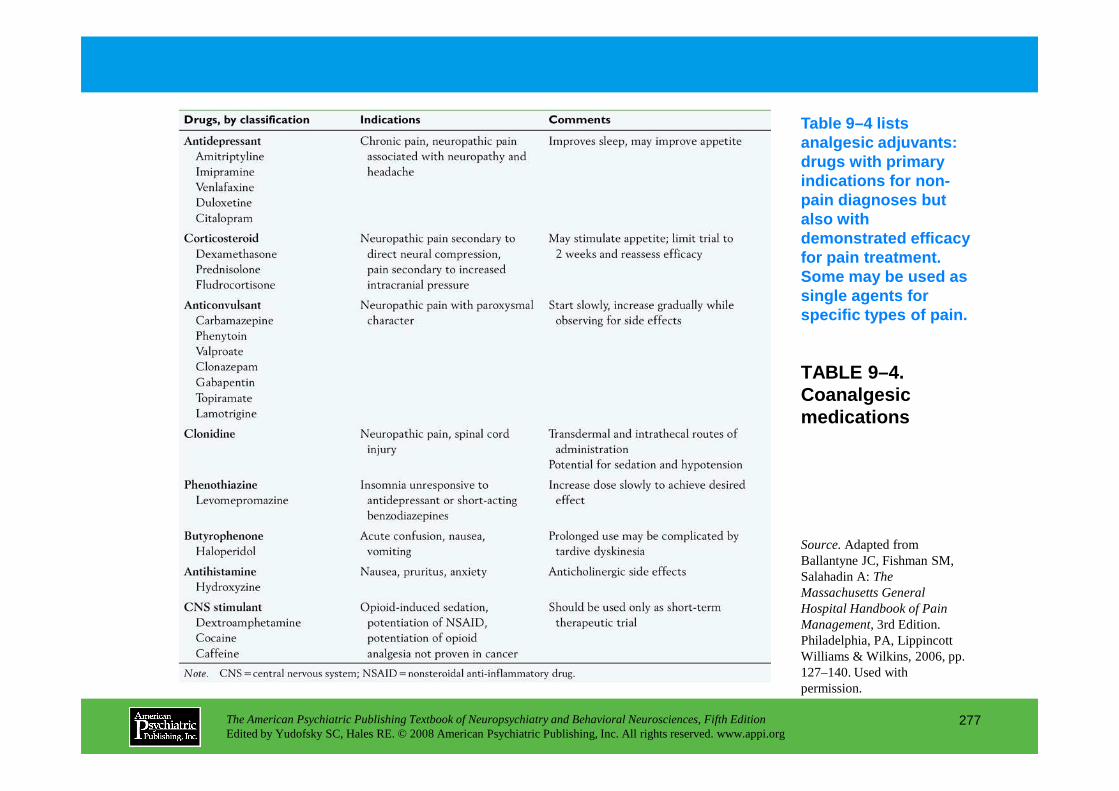
TABLE 9–4. Coanalgesic
Table 9–4 lists analgesic adjuvants: drugs with primary indications for non-pain diagnoses but also with demonstrated efficacy for pain treatment. Some may be used as single agents for specific types of pain.
The American Psychiatric Publishing Textbook of Neuropsychiatry and Behavioral Neurosciences, Fifth EditionEdited by Yudofsky SC, Hales RE. © 2008 American Psychiatric Publishing, Inc. All rights reserved. www.appi.org
277
Coanalgesic medications
Source.Adapted from Ballantyne JC, Fishman SM, Salahadin A:The Massachusetts General Hospital Handbook of Pain Management,3rd Edition. Philadelphia, PA, Lippincott Williams & Wilkins, 2006, pp. 127–140. Used with permission.

TABLE 9–5. Anticonvulsants in common use
The use of anticonvulsants as analgesic adjuvants h as often been advocated. Common anticonvulsant drugs are listed in Table 9–5.
The American Psychiatric Publishing Textbook of Neuropsychiatry and Behavioral Neurosciences, Fifth EditionEdited by Yudofsky SC, Hales RE. © 2008 American Psychiatric Publishing, Inc. All rights reserved. www.appi.org
278
(continued)
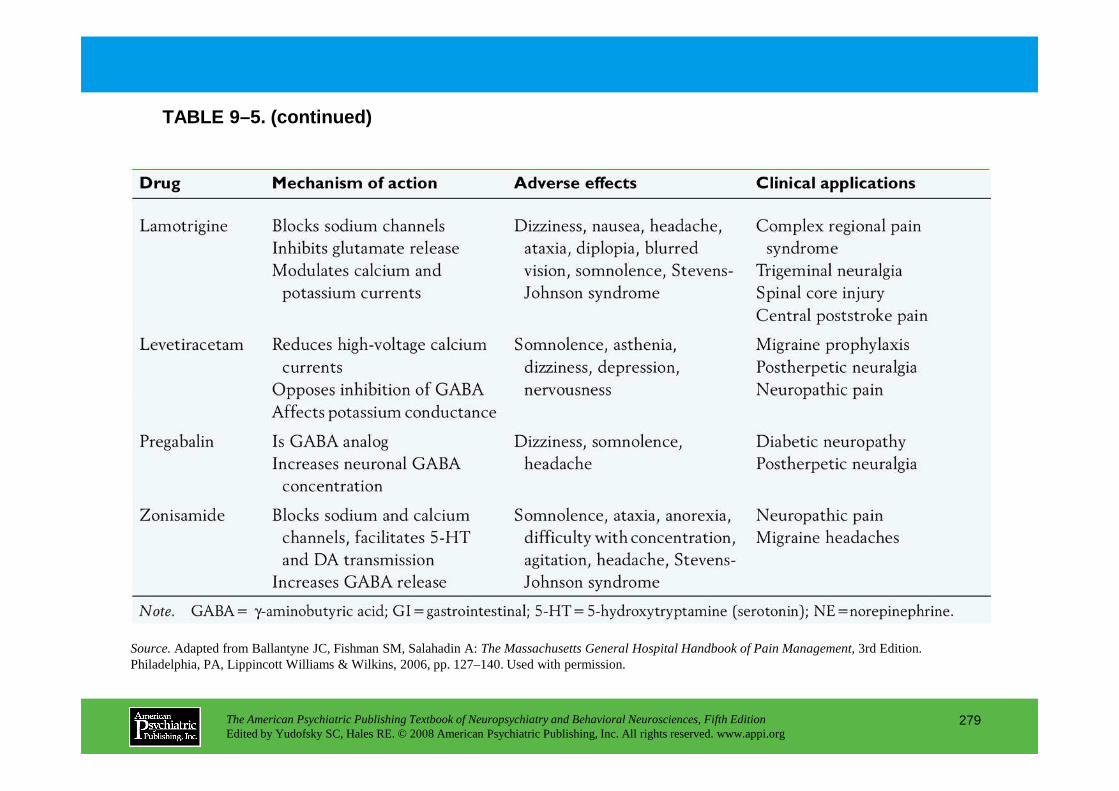
TABLE 9–5. (continued)
The American Psychiatric Publishing Textbook of Neuropsychiatry and Behavioral Neurosciences, Fifth EditionEdited by Yudofsky SC, Hales RE. © 2008 American Psychiatric Publishing, Inc. All rights reserved. www.appi.org
279
Source.Adapted from Ballantyne JC, Fishman SM, Salahadin A: The Massachusetts General Hospital Handbook of Pain Management,3rd Edition. Philadelphia, PA, Lippincott Williams & Wilkins, 2006, pp. 127–140. Used with permission.
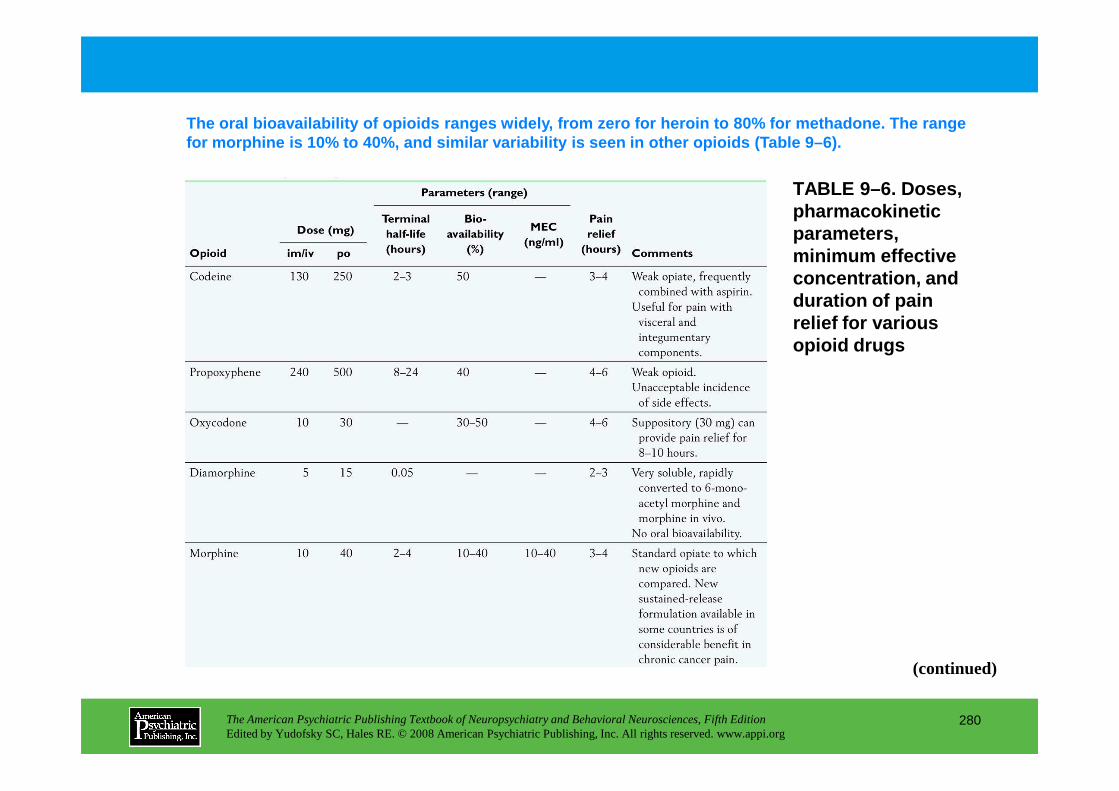
TABLE 9–6. Doses, pharmacokinetic parameters, minimum effective concentration, and duration of pain relief for various opioid drugs
The oral bioavailability of opioids ranges widely, from zero for heroin to 80% for methadone. The range for morphine is 10% to 40%, and similar variability is seen in other opioids (Table 9–6).
The American Psychiatric Publishing Textbook of Neuropsychiatry and Behavioral Neurosciences, Fifth EditionEdited by Yudofsky SC, Hales RE. © 2008 American Psychiatric Publishing, Inc. All rights reserved. www.appi.org
280
(continued)
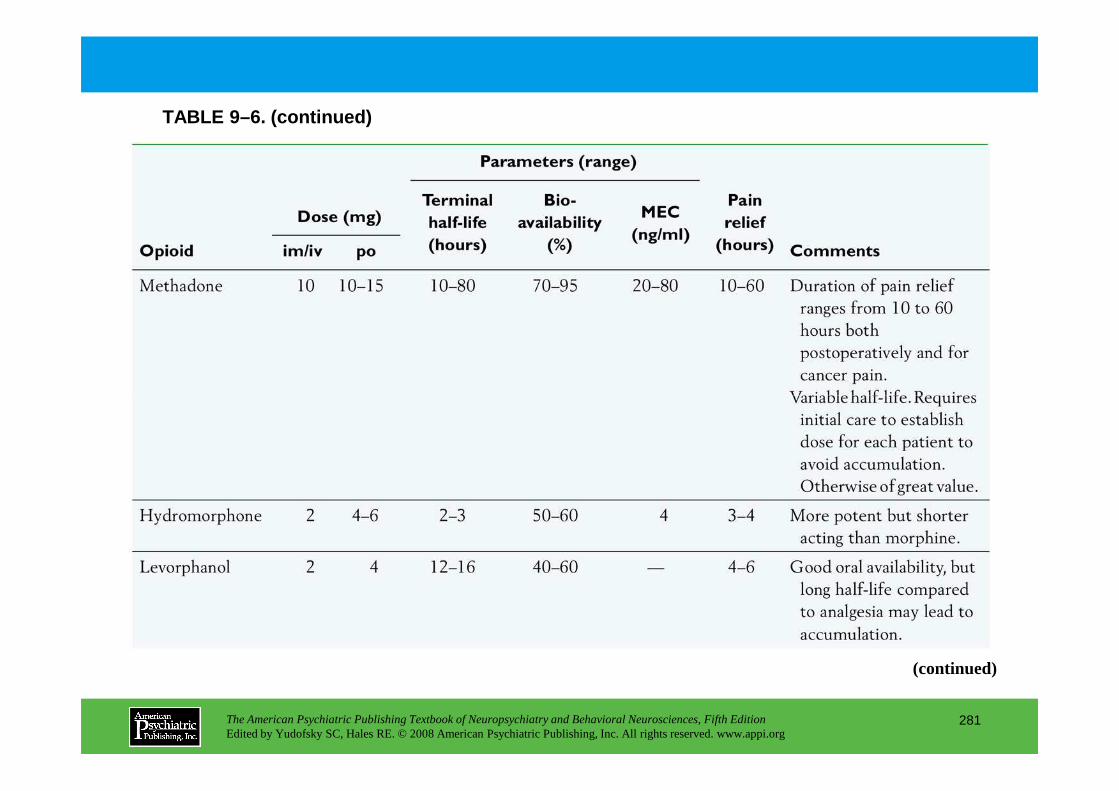
TABLE 9–6. (continued)
The American Psychiatric Publishing Textbook of Neuropsychiatry and Behavioral Neurosciences, Fifth EditionEdited by Yudofsky SC, Hales RE. © 2008 American Psychiatric Publishing, Inc. All rights reserved. www.appi.org
281
(continued)

TABLE 9–6. (continued)
The American Psychiatric Publishing Textbook of Neuropsychiatry and Behavioral Neurosciences, Fifth EditionEdited by Yudofsky SC, Hales RE. © 2008 American Psychiatric Publishing, Inc. All rights reserved. www.appi.org
282
(continued)
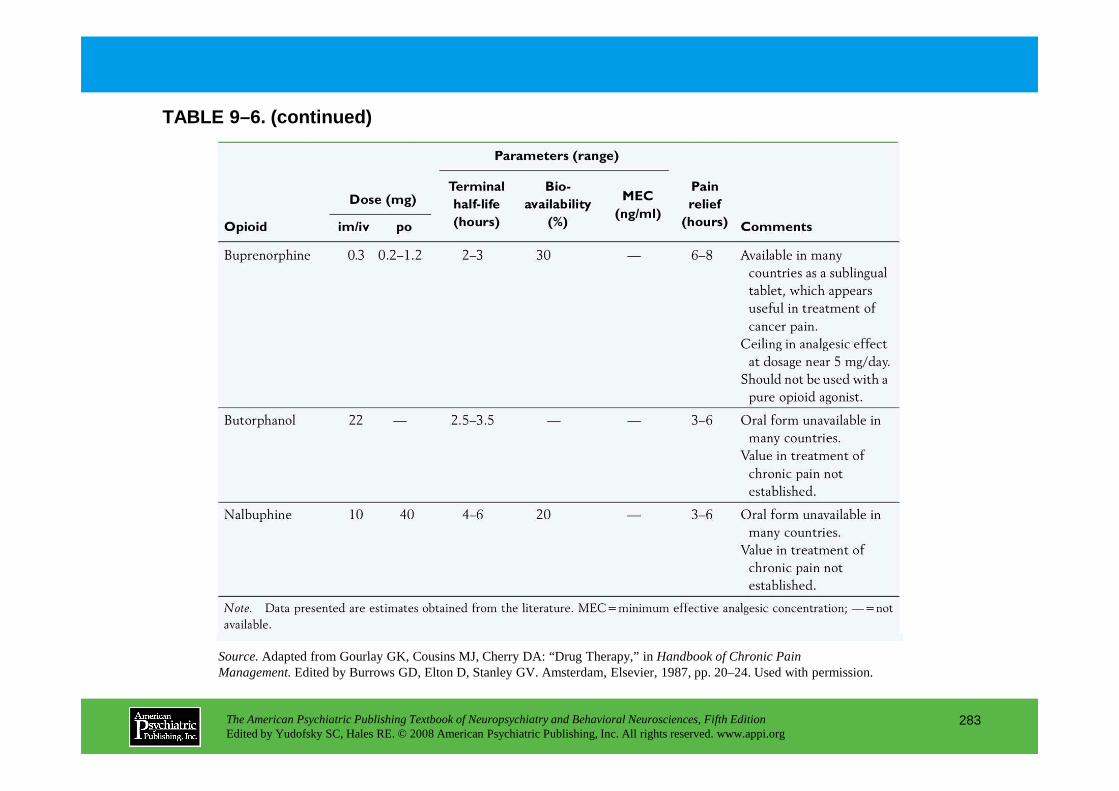
TABLE 9–6. (continued)
The American Psychiatric Publishing Textbook of Neuropsychiatry and Behavioral Neurosciences, Fifth EditionEdited by Yudofsky SC, Hales RE. © 2008 American Psychiatric Publishing, Inc. All rights reserved. www.appi.org
283
Source.Adapted from Gourlay GK, Cousins MJ, Cherry DA: “Drug Therapy,” inHandbook of Chronic Pain Management.Edited by Burrows GD, Elton D, Stanley GV. Amsterdam, Elsevier, 1987, pp. 20–24. Used with permission.
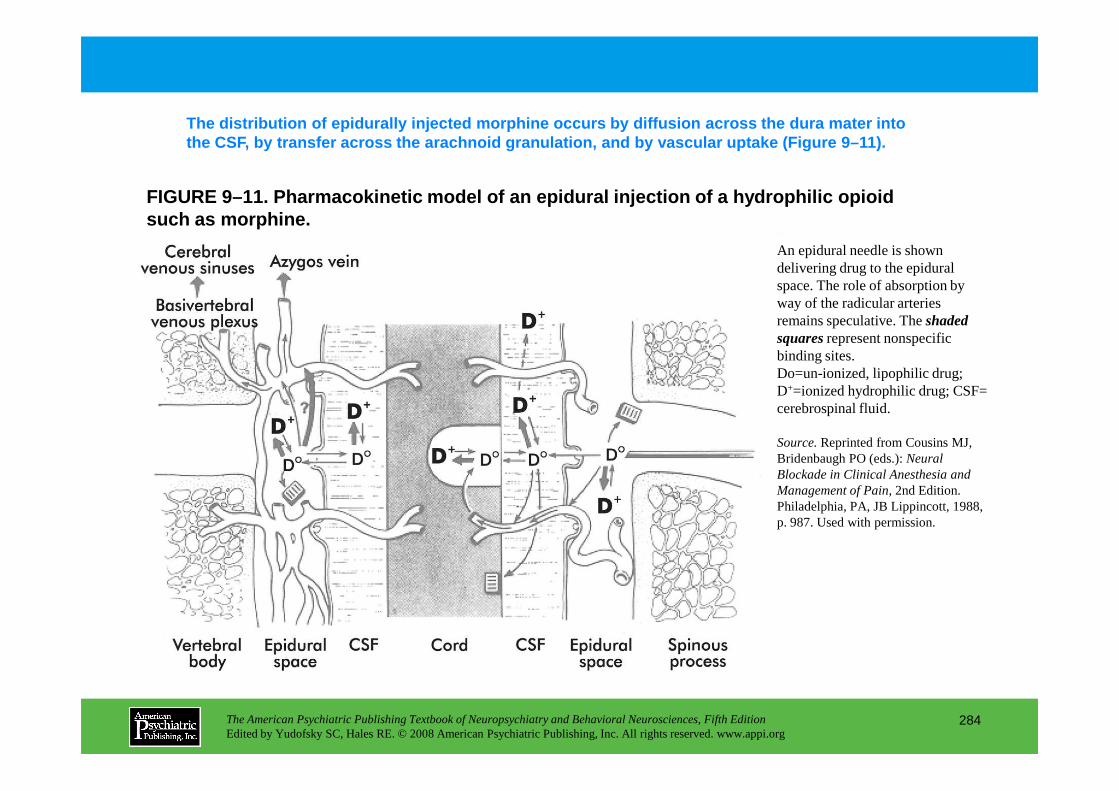
FIGURE 9–11. Pharmacokinetic model of an epidural i njection of a hydrophilic opioid such as morphine.
The distribution of epidurally injected morphine oc curs by diffusion across the dura mater into the CSF, by transfer across the arachnoid granulati on, and by vascular uptake (Figure 9–11).
An epidural needle is shown delivering drug to the epidural space. The role of absorption by way of the radicular arteries remains speculative. The shaded squaresrepresent nonspecific binding sites.Do=un-ionized, lipophilic drug; D+=ionized hydrophilic drug; CSF=
The American Psychiatric Publishing Textbook of Neuropsychiatry and Behavioral Neurosciences, Fifth EditionEdited by Yudofsky SC, Hales RE. © 2008 American Psychiatric Publishing, Inc. All rights reserved. www.appi.org
284
D =ionized hydrophilic drug; CSF= cerebrospinal fluid.
Source.Reprinted from Cousins MJ, Bridenbaugh PO (eds.): Neural Blockade in Clinical Anesthesia and Management of Pain, 2nd Edition. Philadelphia, PA, JB Lippincott, 1988, p. 987. Used with permission.
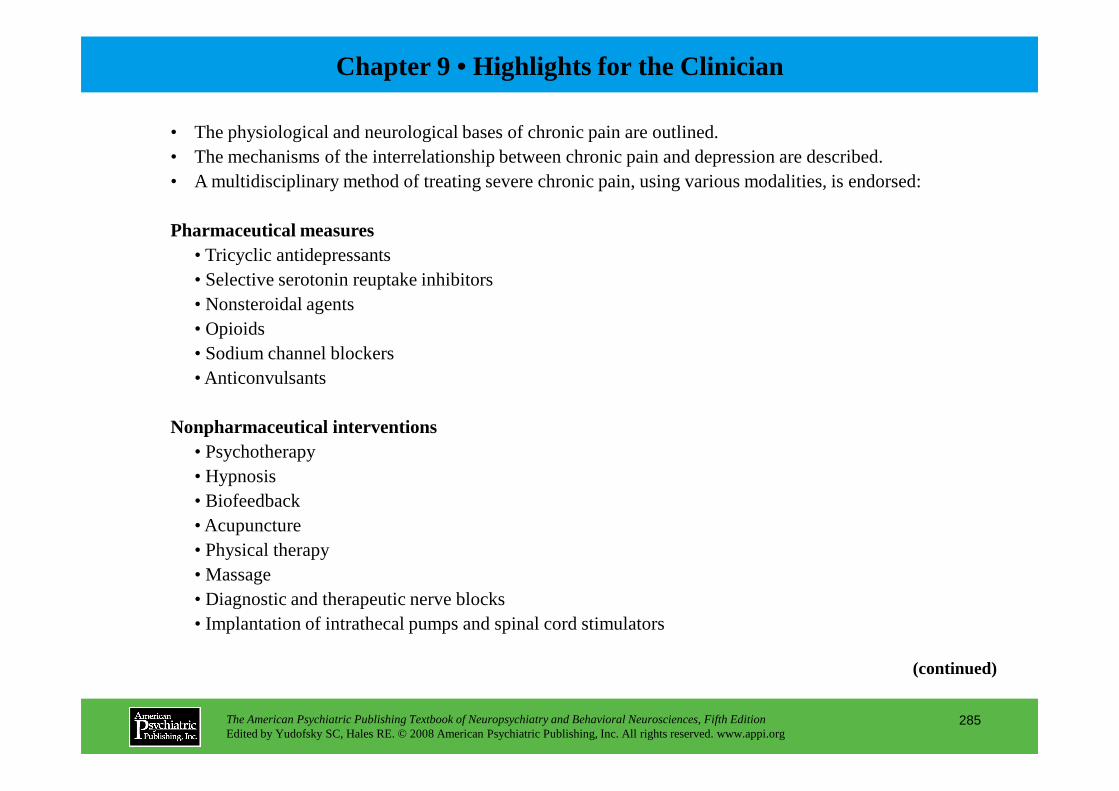
Chapter 9 • Highlights for the Clinician
• The physiological and neurological bases of chronic pain are outlined.• The mechanisms of the interrelationship between chronic pain and depression are described.• A multidisciplinary method of treating severe chronic pain, using various modalities, is endorsed:
Pharmaceutical measures• Tricyclic antidepressants• Selective serotonin reuptake inhibitors• Nonsteroidal agents• Opioids• Sodium channel blockers• Anticonvulsants
The American Psychiatric Publishing Textbook of Neuropsychiatry and Behavioral Neurosciences, Fifth EditionEdited by Yudofsky SC, Hales RE. © 2008 American Psychiatric Publishing, Inc. All rights reserved. www.appi.org
285
(continued)
Nonpharmaceutical interventions• Psychotherapy• Hypnosis• Biofeedback• Acupuncture• Physical therapy• Massage • Diagnostic and therapeutic nerve blocks• Implantation of intrathecal pumps and spinal cord stimulators
• Wherever possible, several of these therapies should be integrated as necessary to assist the patient in maximizing level of functioning while minimizing the painful experience.
• Care needs to be taken to ensure that all necessary diagnostic and therapeutic options have been pursued for the specific problem and an exact diagnostic is established.
• Pain and mood disorders co-occur, and therefore the treatment of pain from a neuropsychiatric point of view must include appropriate treatment of depression and anxiety.
The American Psychiatric Publishing Textbook of Neuropsychiatry and Behavioral Neurosciences, Fifth EditionEdited by Yudofsky SC, Hales RE. © 2008 American Psychiatric Publishing, Inc. All rights reserved. www.appi.org
286
CHAPTER 10
NEUROPSYCHIATRIC ASPECTS OFDISORDERS OF ATTENTION
Ronald A. Cohen, Ph.D.Stephen Salloway, M.D.
Lawrence H. Sweet, Ph.D.
The American Psychiatric Publishing Textbook of Neuropsychiatry and Behavioral Neurosciences, Fifth EditionEdited by Yudofsky SC, Hales RE. © 2008 American Psychiatric Publishing, Inc. All rights reserved. www.appi.org
287
Slide Show
Topic headings and reading list
Tables and figures
Highlights for the clinician
Main menu
(About, Contents, Contributors, Publishing facts)
Importance of Attention in the Practice of Neuropsychiatry
Elements of AttentionAttentional Capacity and FocusSelective AttentionResponse Selection and Executive ControlSustained Attention
Models of Attention
Assessing Disorders of AttentionNeuropsychological Tests of Attention
Attentional Capacity and FocusSensory Selective AttentionResponse Selection and Executive ControlSustained Attention and Vigilance
EpilepsyAlzheimer’s Disease
Attentional Disturbance Associated With Psychiatric IllnessAffective DisordersSchizophreniaAttention-Deficit/Hyperactivity Disorder
RECOMMENDED READINGSBiederman J: New developments in the treatment of attention
deficit/hyperactivity disorder. J Clin Psychiatry 67 (suppl 8):3–6, 2006
Cohen RA: Neuropsychology of Attention. New York, Plenum, 1993
Faraone SV, Perlis RH, Doyle AE, et al: Molecular genetics of attention-deficit/hyperactivity disorder. Biol Psychiatry
CHAPTER 10 • Topics and Readings
The American Psychiatric Publishing Textbook of Neuropsychiatry and Behavioral Neurosciences, Fifth EditionEdited by Yudofsky SC, Hales RE. © 2008 American Psychiatric Publishing, Inc. All rights reserved. www.appi.org
288
Sustained Attention and VigilanceSteps in Decision Making When Assessing AttentionCurrent Assessment Trends
Psychophysiological MethodsNeuroimaging Techniques
Functional Magnetic Resonance ImagingDiffusion Tensor Imaging
Clinical Disorders of AttentionLevels of ConsciousnessMetabolic EncephalopathyAttentional Disturbance in Neurological Disorders
StrokeMultiple SclerosisClosed Head Injury
of attention-deficit/hyperactivity disorder. Biol Psychiatry 57:1313–1323, 2005
Nissen SE: Perspective: ADHD drugs and cardiovascular risks. N Engl J Med 354:1445–1448, 2006
Salloway S, Malloy P, Duffy J: The Frontal Lobes and Neuropsychiatric Illness. Washington, DC, American Psychiatric Press, 2001
Sweet LH, Rao SM, Primeau M, et al: Functional magnetic resonance imaging of working memory among multiple sclerosis patients. J Neuroimaging 14:150–157, 2004
CHAPTER 10 • Tables and Figures
Figure 10–1. Primary factors underlying attention
Figure 10–2. A network involved in the distribution of attention to extrapersonal targets
Figure 10–3. Schematic representation of pathways important in sensory attention and tonic arousal
Figure 10–4. Positron emission tomographic imaging of visual versus auditory presentation of a semantic association task
Table 10–1. Neuropsychological measures of attentional domains
Figure 10–5. Symbol Digit Modalities Test
Figure 10–6. Stroop task-interference trial
Figure 10–7. Letter cancellation
Figure 10–8. Trail Making Test
The American Psychiatric Publishing Textbook of Neuropsychiatry and Behavioral Neurosciences, Fifth EditionEdited by Yudofsky SC, Hales RE. © 2008 American Psychiatric Publishing, Inc. All rights reserved. www.appi.org
289
Figure 10–8. Trail Making Test
Figure 10–9. Brain activity associated with attentional demands
Figure 10–10. Diffusion tensor imaging (DTI) tractography among four individuals who differ by age and HIV status
Figure 10–11. T2-weighted axial magnetic resonance imaging scan above the level of the lateral ventricles
Table 10–2. Criteria for attention-deficit/hyperactivity disorder
Table 10–3. Academic recommendations for patients with attention deficit disorder andlearning disabilities
Table 10–4. Office evaluation of attention-deficit/hyperactivity disorder (ADHD)
Summary Highlights for the Clinician
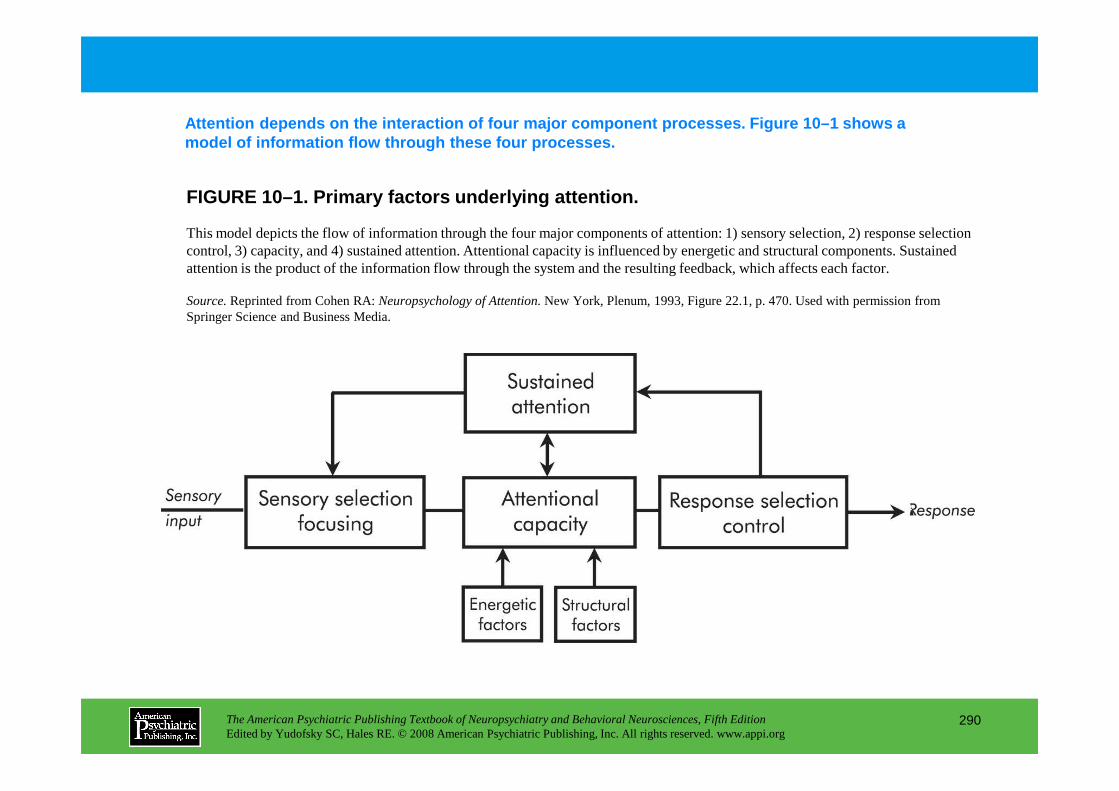
FIGURE 10–1. Primary factors underlying attention.
Attention depends on the interaction of four major component processes. Figure 10–1 shows a model of information flow through these four proces ses.
This model depicts the flow of information through the four major components of attention: 1) sensory selection, 2) response selection control, 3) capacity, and 4) sustained attention. Attentional capacity is influenced by energetic and structural components. Sustained attention is the product of the information flow through the system and the resulting feedback, which affects each factor.
Source.Reprinted from Cohen RA: Neuropsychology of Attention. New York, Plenum, 1993, Figure 22.1, p. 470. Used with permission from Springer Science and Business Media.
The American Psychiatric Publishing Textbook of Neuropsychiatry and Behavioral Neurosciences, Fifth EditionEdited by Yudofsky SC, Hales RE. © 2008 American Psychiatric Publishing, Inc. All rights reserved. www.appi.org
290

FIGURE 10–2. A network involved in the distribution of attention to extrapersonal targets.
Attention spans multiple psychological domains and neural systems. One model subdivides attention into two categories: an overall matrix function and a target-related vector or channel function. In practice, these two systems are integrated (Figure 10–2).
Source.From Mesulam M-M: Principles of Behavioral
The American Psychiatric Publishing Textbook of Neuropsychiatry and Behavioral Neurosciences, Fifth EditionEdited by Yudofsky SC, Hales RE. © 2008 American Psychiatric Publishing, Inc. All rights reserved. www.appi.org
291
Source.From Mesulam M-M: Principles of Behavioral Neurology. Philadelphia, PA, F.A. Davis, 1985, p. 157. Reprinted by permission of Oxford University Press.

FIGURE 10–3. Schematic representation of pathways important in sensory attention and tonic arousal.
Figure 10–3 depicts a model of a corticolimbic-reti cular formation network. In this model, selective attention depends on arousal and sensory attention—and neglect is considered to be an arousal-attentional disorder created by dysfunct ion of this network.
MRF=mesencephalic reticular formation; VIS=visual; AUD=auditory; SOM=somasthetic. Thalamic sensory relay nuclei: VPL=ventralis posterolateralis; MG=medial geniculate; LG=lateral geniculate.
The American Psychiatric Publishing Textbook of Neuropsychiatry and Behavioral Neurosciences, Fifth EditionEdited by Yudofsky SC, Hales RE. © 2008 American Psychiatric Publishing, Inc. All rights reserved. www.appi.org
292
LG=lateral geniculate.
Source.From Heilman KM, Watson RT, Valenstein E: “Neglect and Related Disorders,” in Clinical Neuropsychology, 3rd Edition. Edited by Heilman KM, Valenstein E. New York, Oxford University Press, 1993, pp. 279–336. Reprinted by permission of Oxford University Press.

FIGURE 10–4. Positron emission tomographic imaging of visual (A, C, F) versus auditory (B, D, G)presentation of a semantic association task.
In PET studies , the anterior cingulate region was found to activate during tasks that involved scrutinizing stimuli and selecting the correct respo nse. Results for a semantic activation task are illustrated in Figure 10–4.
These slices (except E) represent blood flow changes when blood flow response during repetition of presented words is subtracted from blood flow response during the subject’s verbal statement of a use for the presented word (e.g., “cake”—“eat”). Slices A and B show activation
The American Psychiatric Publishing Textbook of Neuropsychiatry and Behavioral Neurosciences, Fifth EditionEdited by Yudofsky SC, Hales RE. © 2008 American Psychiatric Publishing, Inc. All rights reserved. www.appi.org
293
(e.g., “cake”—“eat”). Slices A and B show activation near the midline in anterior cingulate cortex. Slices C and D show activation in right lateral cerebellum. Slices E, F,and G show activation in left anterior, inferior frontal cortex. Slices F and G are from the vocalize use association task; slice E is from a different semantic association task, in which subjects were asked to silently monitor a list of words for members of a semantic category. These findings demonstrate the role of anterior brain systems on tasks requiring focused semantic processing and increased attentional demands.
Source.Reprinted by permission from Macmillan Publishers Ltd, from Pardo JV, Fox PT, Raichle ME: “Localization of a Human System for Sustained Attention by Positron Emission Tomography.” Nature 349:61–64, 1991. Copyright 1991.

TABLE 10–1. Neuropsychological measures of attentional domains
It is important for clinicians to be familiar with neuropsychological tests of attention and the specific features that each is designed to measure. Table 10–1 lists the domains that should be evaluated in a comprehensive assessment of attention.
The American Psychiatric Publishing Textbook of Neuropsychiatry and Behavioral Neurosciences, Fifth EditionEdited by Yudofsky SC, Hales RE. © 2008 American Psychiatric Publishing, Inc. All rights reserved. www.appi.org
294
(continued)
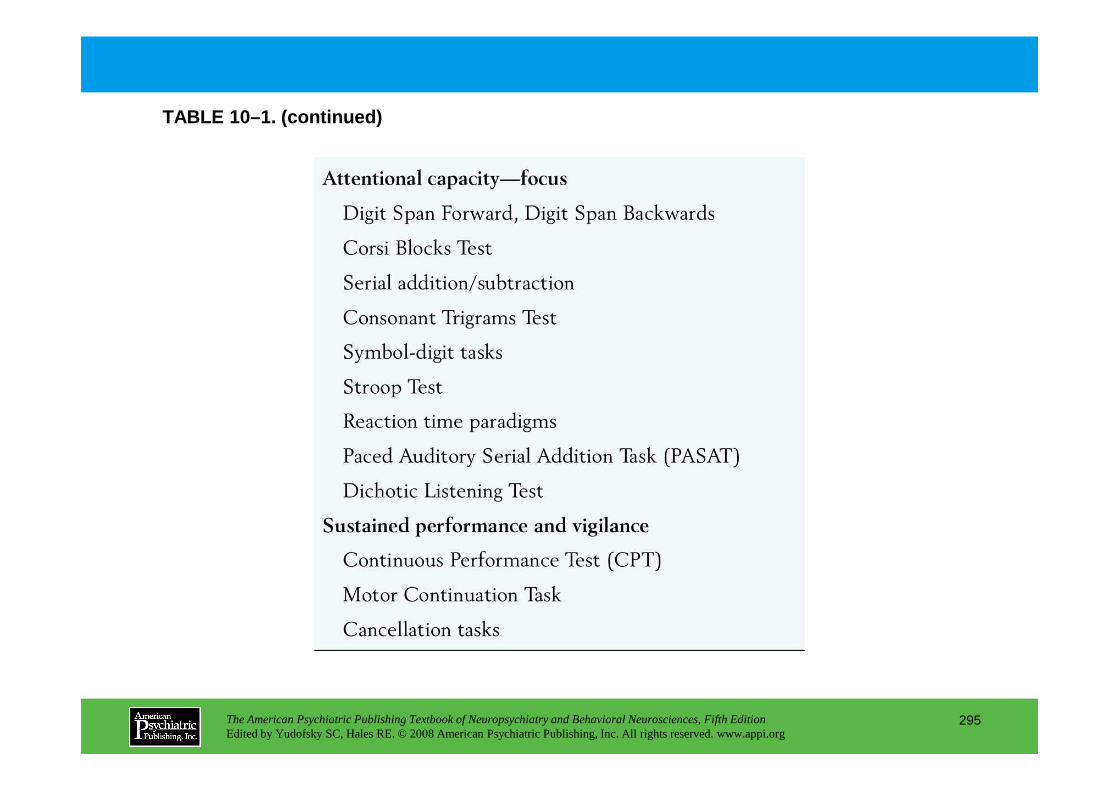
TABLE 10–1. (continued)
The American Psychiatric Publishing Textbook of Neuropsychiatry and Behavioral Neurosciences, Fifth EditionEdited by Yudofsky SC, Hales RE. © 2008 American Psychiatric Publishing, Inc. All rights reserved. www.appi.org
295

FIGURE 10–5. Symbol Digit Modalities Test.
The Symbol Digit Modalities Test (SDMT), shown in F igure 10–5, is a measure of focused attentional capacity. Subjects are presented with n umber-symbol pairs in a template and then must number a random array of the symbols correctly , using the template as a guide.
Source.SDMT sample material copyright 1973 by Western Psychological Services. Reprinted for reference by permission WPS, 12031 WilshireBoulevard, Los Angeles, CA 90025, U.S.A., www.wpspublish.com. Not to be reprinted in whole or in part for any additional purpose without the expressed written permission of the publisher. All rights reserved.
The American Psychiatric Publishing Textbook of Neuropsychiatry and Behavioral Neurosciences, Fifth EditionEdited by Yudofsky SC, Hales RE. © 2008 American Psychiatric Publishing, Inc. All rights reserved. www.appi.org
296
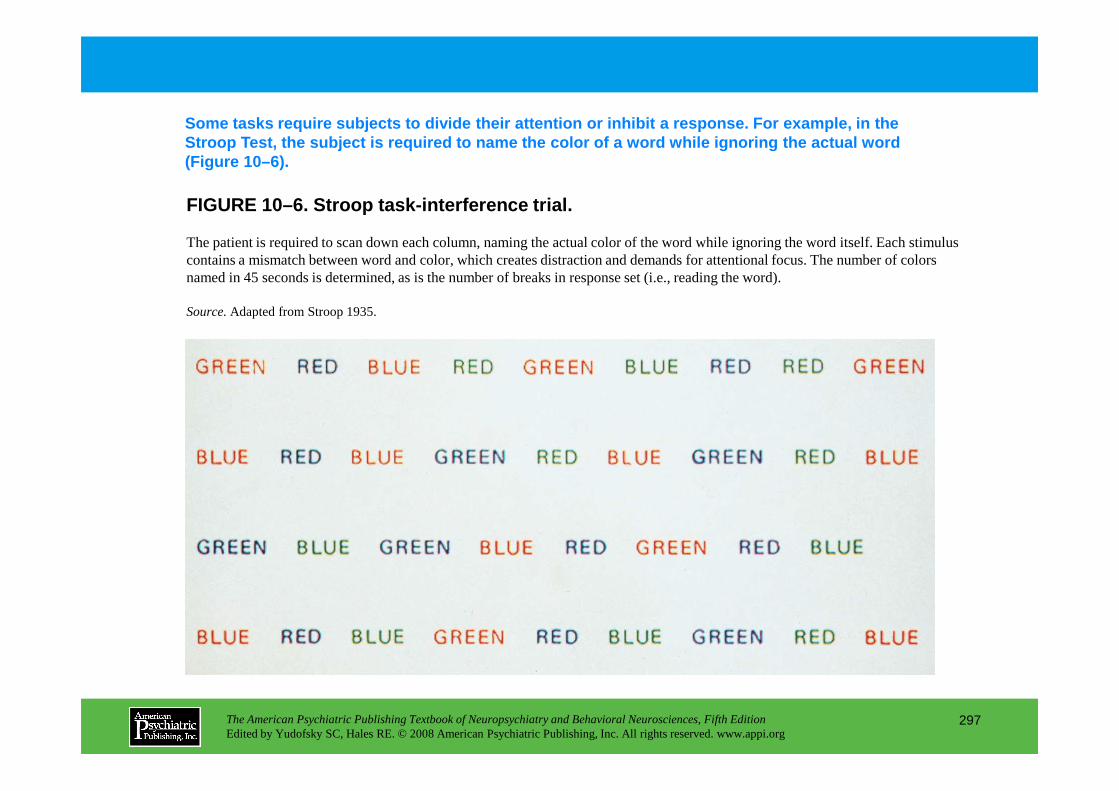
FIGURE 10–6. Stroop task-interference trial.
Some tasks require subjects to divide their attenti on or inhibit a response. For example, in the Stroop Test, the subject is required to name the co lor of a word while ignoring the actual word (Figure 10–6).
The patient is required to scan down each column, naming the actual color of the word while ignoring the word itself. Each stimulus contains a mismatch between word and color, which creates distraction and demands for attentional focus. The number of colorsnamed in 45 seconds is determined, as is the number of breaks in response set (i.e., reading the word).
Source.Adapted from Stroop 1935.
The American Psychiatric Publishing Textbook of Neuropsychiatry and Behavioral Neurosciences, Fifth EditionEdited by Yudofsky SC, Hales RE. © 2008 American Psychiatric Publishing, Inc. All rights reserved. www.appi.org
297
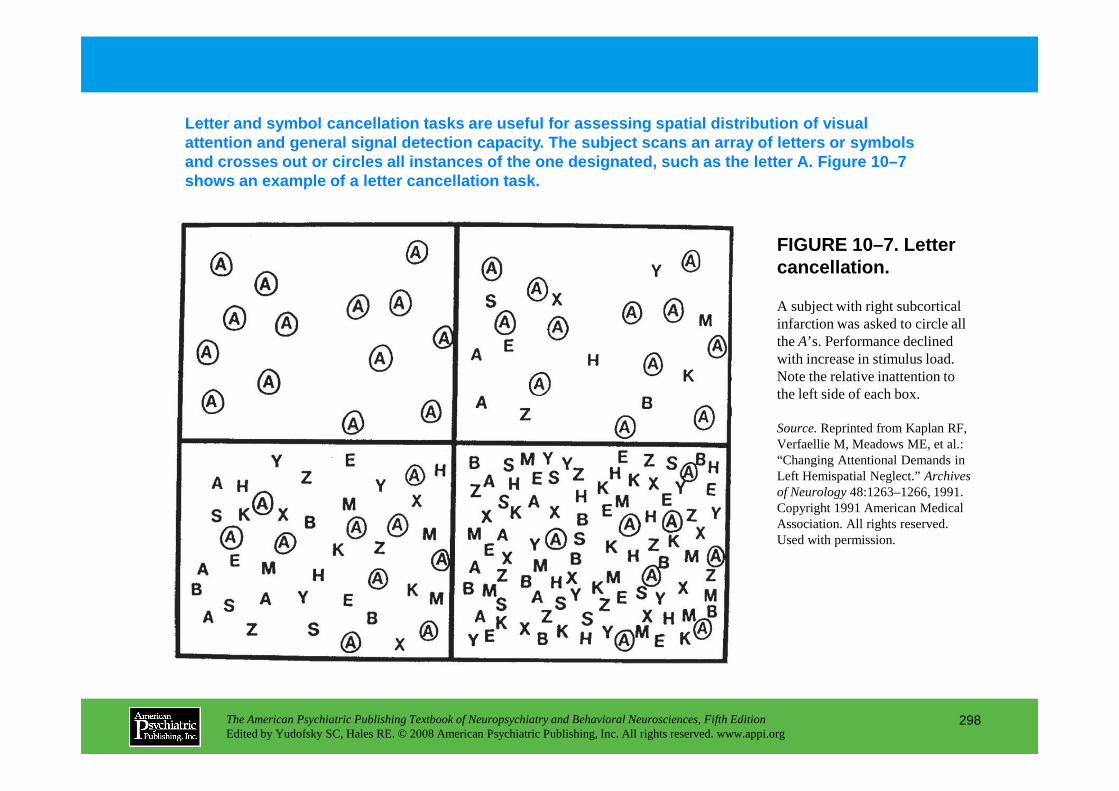
FIGURE 10–7. Letter cancellation.
Letter and symbol cancellation tasks are useful for assessing spatial distribution of visual attention and general signal detection capacity. Th e subject scans an array of letters or symbols and crosses out or circles all instances of the one designated, such as the letter A. Figure 10–7 shows an example of a letter cancellation task.
A subject with right subcortical infarction was asked to circle all the A’s. Performance declined with increase in stimulus load. Note the relative inattention to the left side of each box.
The American Psychiatric Publishing Textbook of Neuropsychiatry and Behavioral Neurosciences, Fifth EditionEdited by Yudofsky SC, Hales RE. © 2008 American Psychiatric Publishing, Inc. All rights reserved. www.appi.org
298
the left side of each box.
Source.Reprinted from Kaplan RF, Verfaellie M, Meadows ME, et al.: “Changing Attentional Demands in Left Hemispatial Neglect.” Archives of Neurology48:1263–1266, 1991. Copyright 1991 American Medical Association. All rights reserved. Used with permission.

FIGURE 10–8. Trail Making Test.
The Trail Making Test is a commonly used test of response switching ability and mental control. Subjects connect randomly placed numbers in sequence by drawing a line between them (Trails A). On Trails B (Figure 10–8), subjects alternate between numbers and letters.
This test requires the patient to connect the numbers and letters in alternating sequence. In this example, the patient, a 52-year-old man with a right thalamic stroke, failed to maintain the sequence (at numbers 2 and 3), indicating breaks
The American Psychiatric Publishing Textbook of Neuropsychiatry and Behavioral Neurosciences, Fifth EditionEdited by Yudofsky SC, Hales RE. © 2008 American Psychiatric Publishing, Inc. All rights reserved. www.appi.org
299
maintain the sequence (at numbers 2 and 3), indicating breaks in response set. Impersistence, with neglect of the left side of the page, is also evident.
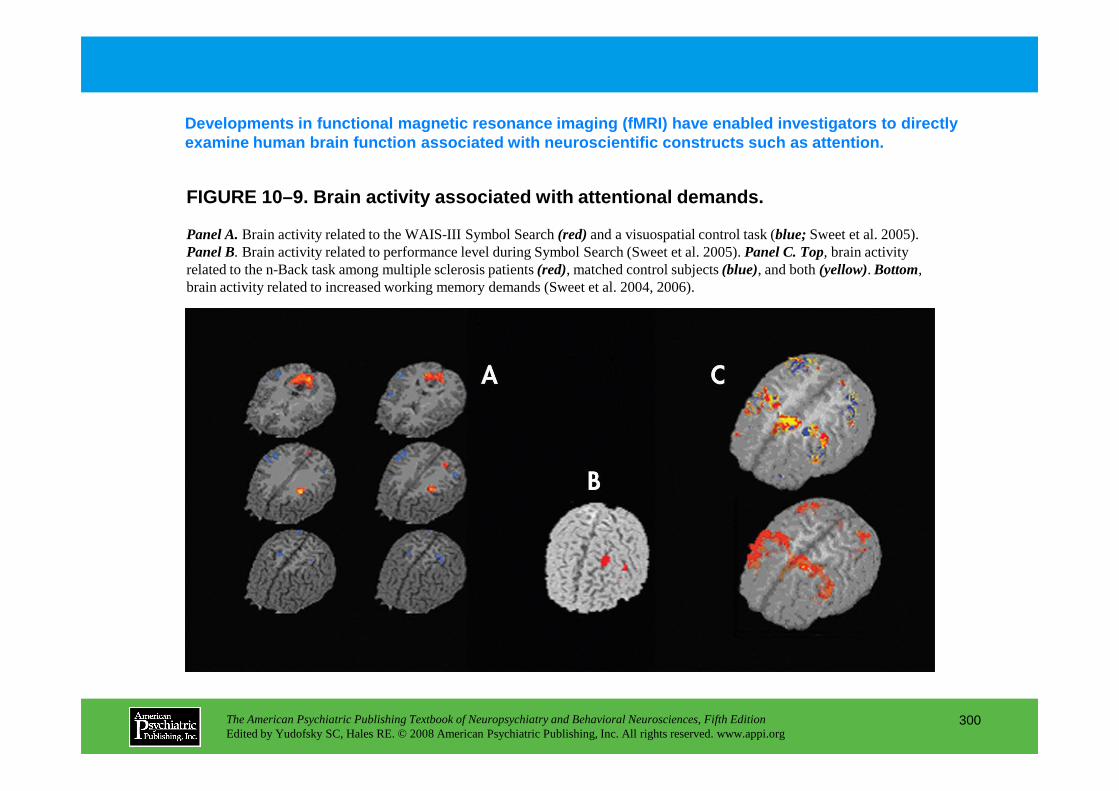
FIGURE 10–9. Brain activity associated with attenti onal demands.
Developments in functional magnetic resonance imagi ng (fMRI) have enabled investigators to directly examine human brain function associated with neuros cientific constructs such as attention.
Panel A.Brain activity related to the WAIS-III Symbol Search (red)and a visuospatial control task (blue; Sweet et al. 2005). Panel B. Brain activity related to performance level during Symbol Search (Sweet et al. 2005). Panel C. Top, brain activity related to the n-Back task among multiple sclerosis patients (red), matched control subjects (blue), and both (yellow). Bottom,brain activity related to increased working memory demands (Sweet et al. 2004, 2006).
The American Psychiatric Publishing Textbook of Neuropsychiatry and Behavioral Neurosciences, Fifth EditionEdited by Yudofsky SC, Hales RE. © 2008 American Psychiatric Publishing, Inc. All rights reserved. www.appi.org
300
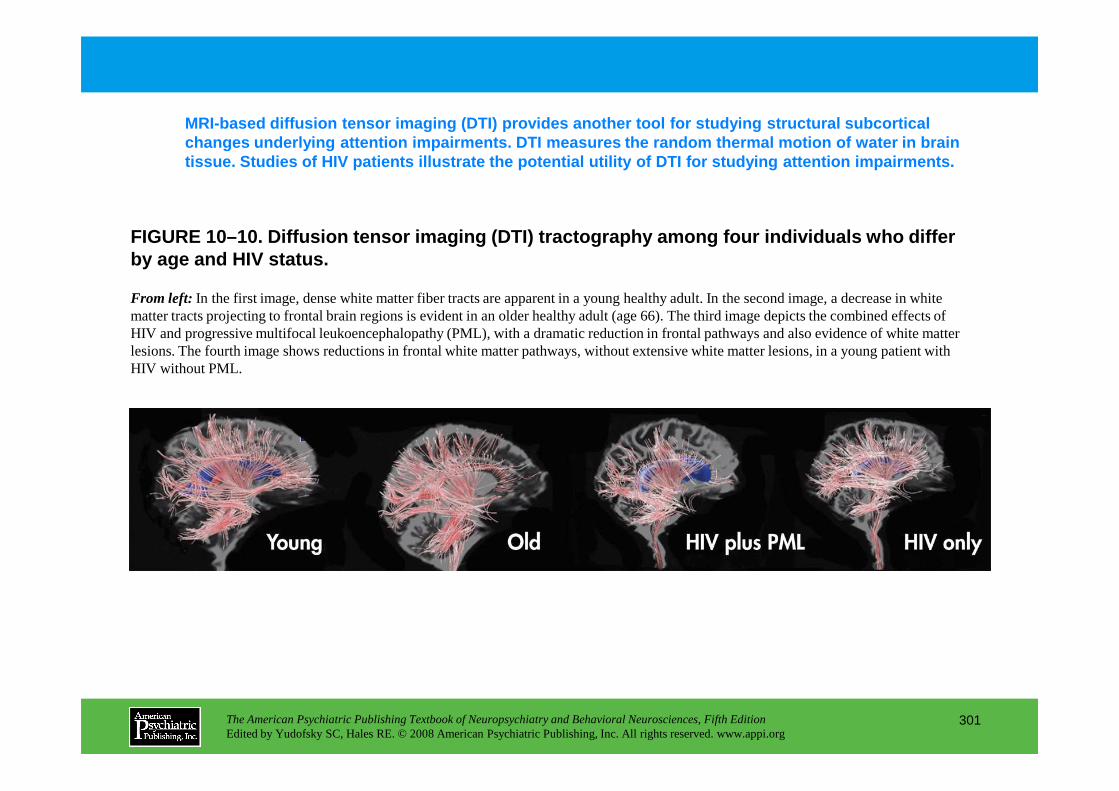
FIGURE 10–10. Diffusion tensor imaging (DTI) tracto graphy among four individuals who differ by age and HIV status.
MRI-based diffusion tensor imaging (DTI) provides a nother tool for studying structural subcortical changes underlying attention impairments. DTI measu res the random thermal motion of water in brain tissue. Studies of HIV patients illustrate the pote ntial utility of DTI for studying attention impairm ents.
From left: In the first image, dense white matter fiber tracts are apparent in a young healthy adult. In the second image, a decrease in white matter tracts projecting to frontal brain regions is evident in an older healthy adult (age 66). The third image depicts the combined effects of HIV and progressive multifocal leukoencephalopathy (PML), with a dramatic reduction in frontal pathways and also evidence of white matter lesions. The fourth image shows reductions in frontal white matter pathways, without extensive white matter lesions, in a young patient with HIV without PML.
The American Psychiatric Publishing Textbook of Neuropsychiatry and Behavioral Neurosciences, Fifth EditionEdited by Yudofsky SC, Hales RE. © 2008 American Psychiatric Publishing, Inc. All rights reserved. www.appi.org
301

FIGURE 10–11. T2-weighted axial magnetic resonance imaging scan above the level of the lateral ventricles
MRI reveals extensive high signal areas on T2-weighted scans in the midline frontal lobe white matter of a 40-year-old man with multiple sclerosis (Figure 10–11). Pathways involved in speed of processing, focusing, and sustaining attention are affected, along with mood and impulse regulation systems.
The American Psychiatric Publishing Textbook of Neuropsychiatry and Behavioral Neurosciences, Fifth EditionEdited by Yudofsky SC, Hales RE. © 2008 American Psychiatric Publishing, Inc. All rights reserved. www.appi.org
302
demonstrates multiple areas of high signal in the frontal subcortical white matter in a 40-year-old with multiple sclerosis and attentional disturbance.
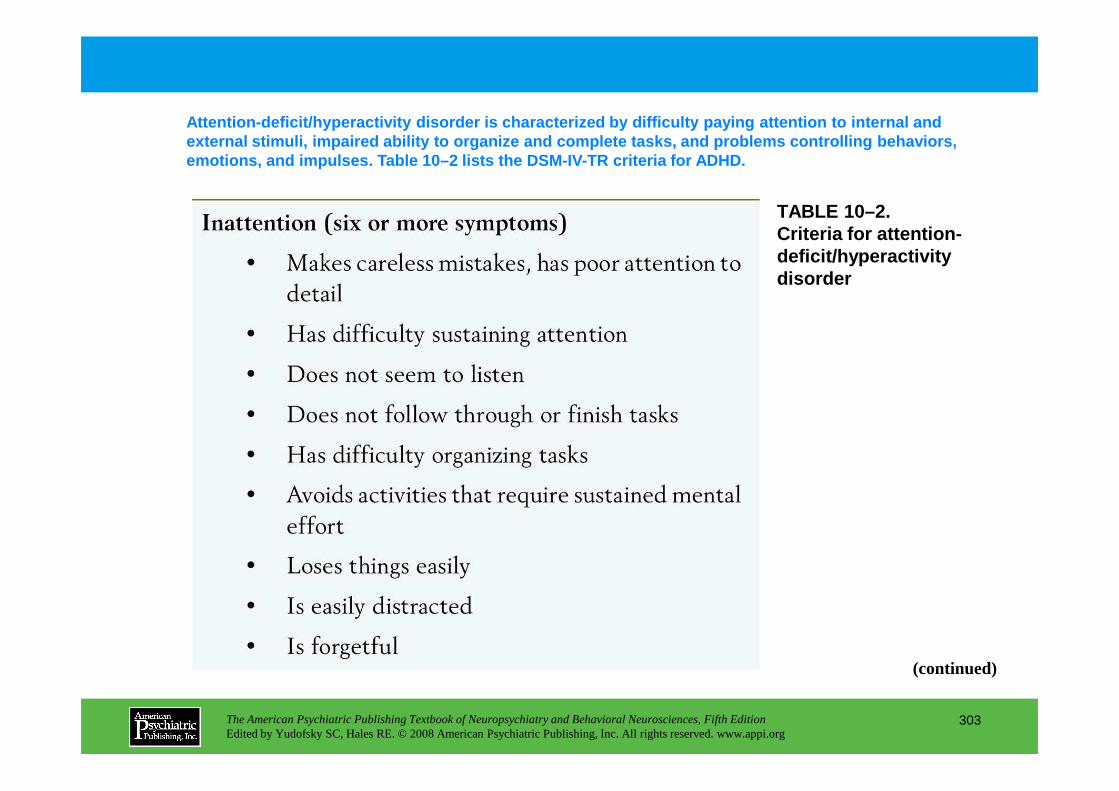
TABLE 10–2. Criteria for attention-deficit/hyperactivity disorder
Attention-deficit/hyperactivity disorder is charact erized by difficulty paying attention to internal an d external stimuli, impaired ability to organize and c omplete tasks, and problems controlling behaviors, emotions, and impulses. Table 10–2 lists the DSM-IV -TR criteria for ADHD.
The American Psychiatric Publishing Textbook of Neuropsychiatry and Behavioral Neurosciences, Fifth EditionEdited by Yudofsky SC, Hales RE. © 2008 American Psychiatric Publishing, Inc. All rights reserved. www.appi.org
303
(continued)
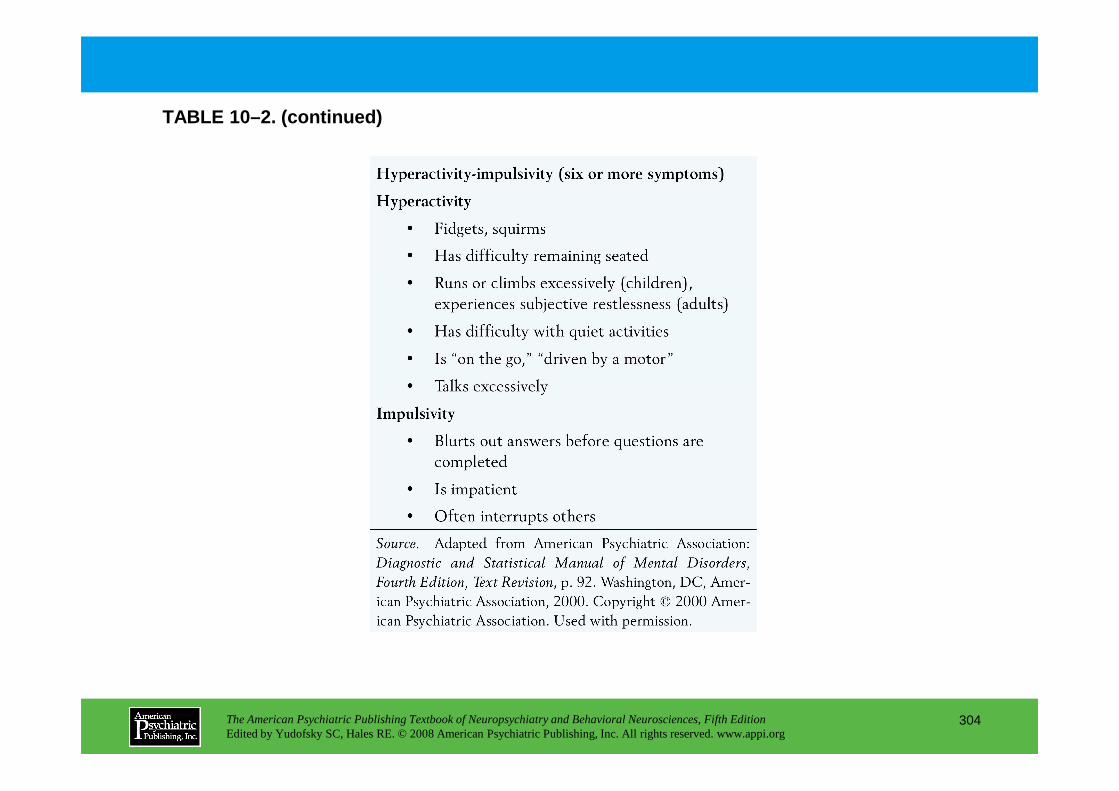
TABLE 10–2. (continued)
The American Psychiatric Publishing Textbook of Neuropsychiatry and Behavioral Neurosciences, Fifth EditionEdited by Yudofsky SC, Hales RE. © 2008 American Psychiatric Publishing, Inc. All rights reserved. www.appi.org
304

TABLE 10–3. Academic recommendations for patients w ith attention deficit disorder and learning disabilities
Modifications to the academic environment, as outli ned in Table 10–3, can provide significant benefits to people with ADHD and learning disabilities.
The American Psychiatric Publishing Textbook of Neuropsychiatry and Behavioral Neurosciences, Fifth EditionEdited by Yudofsky SC, Hales RE. © 2008 American Psychiatric Publishing, Inc. All rights reserved. www.appi.org
305
(continued)

TABLE 10–3. (continued)
The American Psychiatric Publishing Textbook of Neuropsychiatry and Behavioral Neurosciences, Fifth EditionEdited by Yudofsky SC, Hales RE. © 2008 American Psychiatric Publishing, Inc. All rights reserved. www.appi.org
306
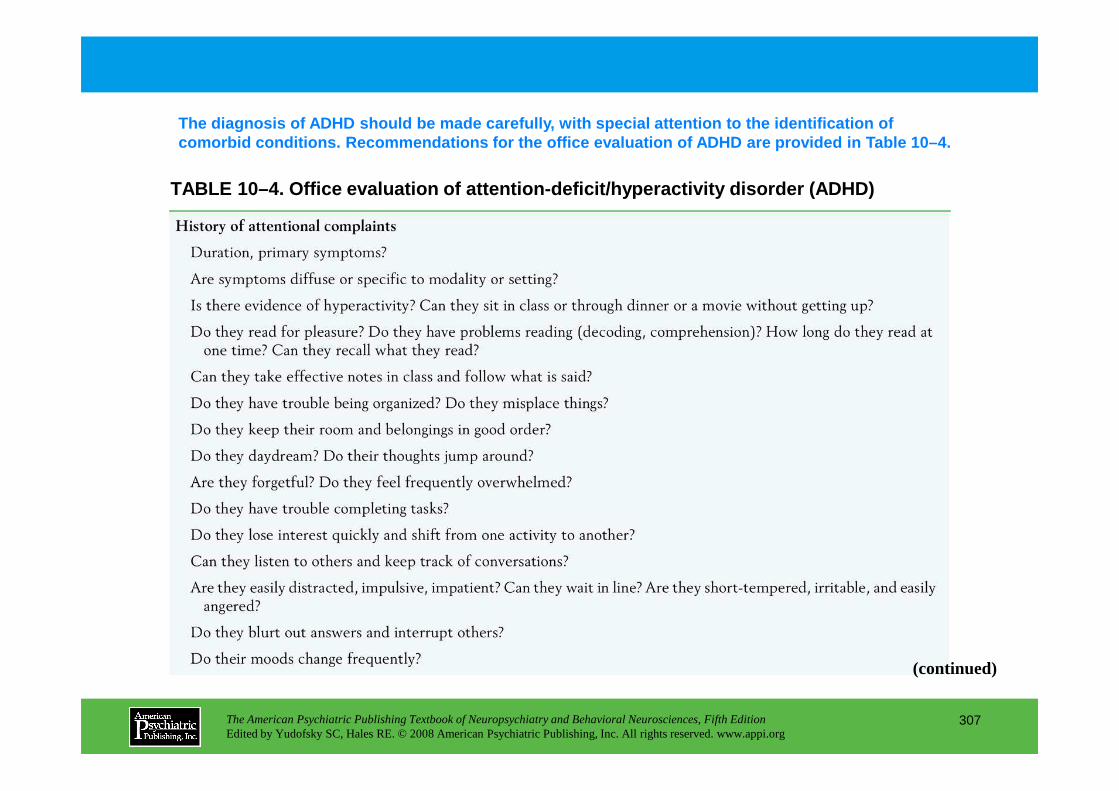
TABLE 10–4. Office evaluation of attention-deficit/ hyperactivity disorder (ADHD)
The diagnosis of ADHD should be made carefully, wit h special attention to the identification of comorbid conditions. Recommendations for the office evaluation of ADHD are provided in Table 10–4.
The American Psychiatric Publishing Textbook of Neuropsychiatry and Behavioral Neurosciences, Fifth EditionEdited by Yudofsky SC, Hales RE. © 2008 American Psychiatric Publishing, Inc. All rights reserved. www.appi.org
307
(continued)
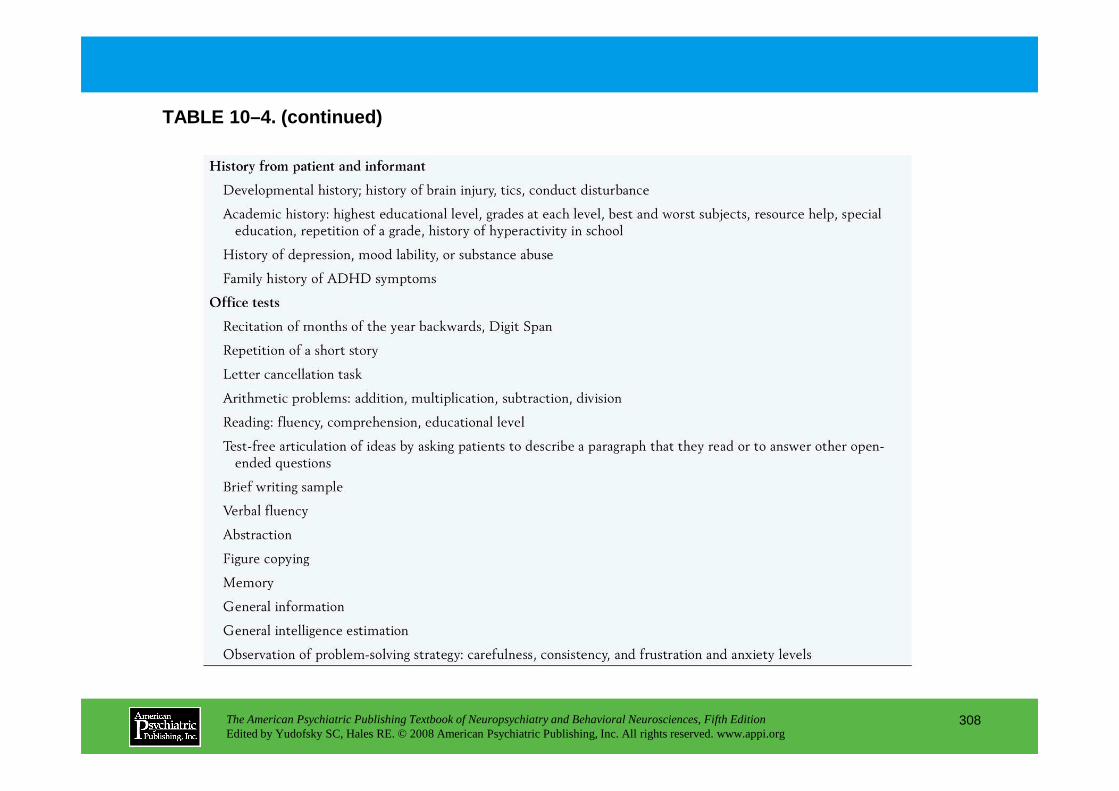
TABLE 10–4. (continued)
The American Psychiatric Publishing Textbook of Neuropsychiatry and Behavioral Neurosciences, Fifth EditionEdited by Yudofsky SC, Hales RE. © 2008 American Psychiatric Publishing, Inc. All rights reserved. www.appi.org
308

Chapter 10 • Highlights for the Clinician
• The multidimensional process of attention, broken down into its key functional components
• Cognitive tests used to assess each component
• Recent advances in understanding the neural pathways mediating attention in the brain
• Advances in structural and functional brain imaging techniques, such as diffusion tensor imaging, functional magnetic resonance imaging, and positron emission tomography, that have fueled new
The American Psychiatric Publishing Textbook of Neuropsychiatry and Behavioral Neurosciences, Fifth EditionEdited by Yudofsky SC, Hales RE. © 2008 American Psychiatric Publishing, Inc. All rights reserved. www.appi.org
309
understanding of neural pathways
• Clinical impacts of dysregulated attention in common neurological conditions
• The latest developments in understanding the genetic underpinnings, diagnosis, and treatment of attention-deficit/hyperactivity disorder in children and adults
CHAPTER 11
NEUROPSYCHIATRIC ASPECTS OF DELIRIUM
Paula T. Trzepacz, M.D.David J. Meagher, M.D., M.R.C.Psych.
The American Psychiatric Publishing Textbook of Neuropsychiatry and Behavioral Neurosciences, Fifth EditionEdited by Yudofsky SC, Hales RE. © 2008 American Psychiatric Publishing, Inc. All rights reserved. www.appi.org
310
Slide Show
Topic headings and reading list
Tables and figures
Highlights for the clinician
Main menu
(About, Contents, Contributors, Publishing facts)

DiagnosisDiagnostic Criteria SystemsProdromal SymptomsSubsyndromal DeliriumMisdiagnosisDifferential Diagnosis
Delirium Versus DementiaDelirium Versus Mood DisordersDelirium Versus Psychotic Disorders
EpidemiologyIncidence and PrevalenceMorbidity and MortalityLength of StayReduced IndependenceCost of Care
Delirium Detection, Screening, And AssessmentCognitive AssessmentDelirium Assessment InstrumentsElectroencephalography
Phenomenology Of DeliriumCore SymptomsAssociated SymptomsMotor Subtypes
Treatment Of DeliriumPrevention StrategiesPharmacological ProphylaxisTreatment of a Delirium EpisodePharmacological Treatment of Delirium
CHAPTER 11 • Topics and Readings
The American Psychiatric Publishing Textbook of Neuropsychiatry and Behavioral Neurosciences, Fifth EditionEdited by Yudofsky SC, Hales RE. © 2008 American Psychiatric Publishing, Inc. All rights reserved. www.appi.org
311
Cost of CareDistress and Psychological SequelaeReversibility of a Delirium EpisodePersistent Cognitive Deficits
Risk Factors for DeliriumOld AgePreexisting Cognitive ImpairmentMedicationsNeurological InsultsPain Control MedicationsNutritional FactorsSmoking and Nicotine WithdrawalPerioperative FactorsGenetic FactorsEtiologies of Delirium
Pharmacological Treatment of DeliriumBenzodiazepinesCholinergic Enhancer DrugsNeurolepticsAtypical Antipsychotic AgentsPsychostimulantsAnticonvulsant AgentsAgents With Serotonergic Actions
Postdelirium Management
Neuropathophysiology Of DeliriumNeuroanatomical ConsiderationsNeurotransmissionCytokines and Inflammatory Response
Conclusion(continued)
CHAPTER 11 • Topics and Readings (continued)
RECOMMENDED READINGS
Breitbart W, Gibson C, Tremblay A: The delirium experience: delirium recall and delirium-related distress in hospitalized patients with cancer, their spouses/caregivers, and their nurses. Psychosomatics 43:183–194, 2002
Engel GL, Romano J: Delirium, a syndrome of cerebral insufficiency. J Chronic Dis 9:260–277, 1959
Kalisvaart KJ, de Jonghe JFM, Bogaards MJ, et al: Haloperidol prophylaxis for elderly hip surgery patients at risk for delirium: a randomized, placebo-controlled study. J Am Geriatr Soc 53:1658–1666, 2005
Marcantonio ER, Flacker JM, Wright RJ, et al: Reducing delirium after hip fracture: a randomized trial. J Am Geriatr Soc 49:516–522, 2001
Meagher D: Delirium: optimizing management. BMJ 322:144–149, 2001
The American Psychiatric Publishing Textbook of Neuropsychiatry and Behavioral Neurosciences, Fifth EditionEdited by Yudofsky SC, Hales RE. © 2008 American Psychiatric Publishing, Inc. All rights reserved. www.appi.org
312
Meagher D: Delirium: optimizing management. BMJ 322:144–149, 2001
Trzepacz PT: Is there a final common neural pathway in delirium? Focus on acetylcholine and dopamine. Semin Clin Neuropsychiatry 5:132–148, 2000

CHAPTER 11 • Tables and Figures
Figure 11–1. Continuum of level of consciousness
Table 11–1. Signs and symptoms of delirium
Table 11–2. DSM-IV-TR criteria for diagnosis of delirium due to a general medical condition
Table 11–3. Differential diagnosis of delirium
Figure 11–2. Possible reasons for persistent cognitive impairment in patients after an episode of delirium
Table 11–4. Studies of cognitive performance after an episode of delirium
Figure 11–3. Risk factors for delirium
Figure 11–4. Relation between an individual person’s health status and the effects of insults determines the threshold for the occurrence of delirium
Table 11–5. Studies of genetic factors in delirium
Figure 11–5. Delirium Etiology Checklist worksheet
Figure 11–6. Delirium severity as a function of an individual’s baseline delirium vulnerability interacting with multiple overlapping or serial etiologies
Table 11–6. Factors relevant to choice of delirium assessment instrument
The American Psychiatric Publishing Textbook of Neuropsychiatry and Behavioral Neurosciences, Fifth EditionEdited by Yudofsky SC, Hales RE. © 2008 American Psychiatric Publishing, Inc. All rights reserved. www.appi.org
313
Table 11–6. Factors relevant to choice of delirium assessment instrument
Table 11–7. Recommended delirium assessment instruments
Figure 11–7. Quantitative electroencephalogram (QEEG) brain map in delirium
Table 11–8. Electroencephalographic patterns in patients with delirium
Table 11–9. Studies of delirium phenomenology
Figure 11–8. Delirium final common pathway
Figure 11–9. Ability to recall an episode of delirium worsens with more severe delirium symptoms
Table 11–10. Studies of frequency of motor subtypes in delirium
Table 11–11. Prospective studies of drug treatment in delirium
Table 11–12. Lesions associated with delirium in structural neuroimaging studies
Figure 11–10. Rat model for delirium
Figure 11–11. Cholinergic hypofunction after traumatic brain injury
Summary Highlights for the Clinician

FIGURE 11–1. Continuum of level of consciousness.
Delirium is a state of consciousness between normal alertness or awakeness and stupor or coma, chiefly characterized as a “confusional state.” Figure 11–1 shows the continuum of level of consciousness.
The American Psychiatric Publishing Textbook of Neuropsychiatry and Behavioral Neurosciences, Fifth EditionEdited by Yudofsky SC, Hales RE. © 2008 American Psychiatric Publishing, Inc. All rights reserved. www.appi.org
314
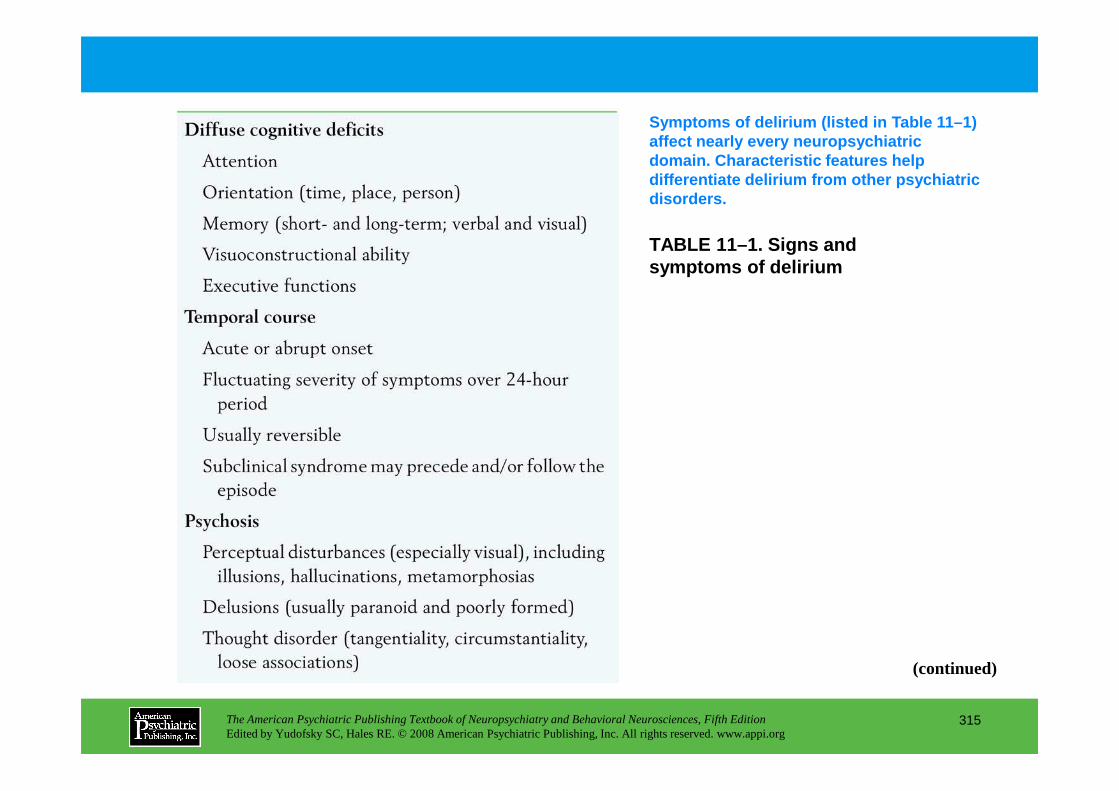
TABLE 11–1. Signs and symptoms of delirium
Symptoms of delirium (listed in Table 11–1) affect nearly every neuropsychiatric domain. Characteristic features help differentiate delirium from other psychiatric disorders.
The American Psychiatric Publishing Textbook of Neuropsychiatry and Behavioral Neurosciences, Fifth EditionEdited by Yudofsky SC, Hales RE. © 2008 American Psychiatric Publishing, Inc. All rights reserved. www.appi.org
315
(continued)

TABLE 11–1. (continued)
The American Psychiatric Publishing Textbook of Neuropsychiatry and Behavioral Neurosciences, Fifth EditionEdited by Yudofsky SC, Hales RE. © 2008 American Psychiatric Publishing, Inc. All rights reserved. www.appi.org
316

TABLE 11–2. DSM-IV-TR criteria for diagnosis of delirium due to a general medical condition
The DSM-IV-TR criteria for delirium due to a genera l medical condition are shown in Table 11–2. (Except for the difference in etiology, delirium du e to substance intoxication, substance withdrawal, multiple etiologies, and “not otherwise specified” have these same criteria.)
The American Psychiatric Publishing Textbook of Neuropsychiatry and Behavioral Neurosciences, Fifth EditionEdited by Yudofsky SC, Hales RE. © 2008 American Psychiatric Publishing, Inc. All rights reserved. www.appi.org
317

TABLE 11–3. Differential diagnosis of delirium
The differential diagnosis of delirium is broad. De lirium can be mistaken for dementia, depression, primary or secondary psychosis, anxiety and somatoform disorders, and, particularly in children, behavioral disturbance (T able 11–3).
The American Psychiatric Publishing Textbook of Neuropsychiatry and Behavioral Neurosciences, Fifth EditionEdited by Yudofsky SC, Hales RE. © 2008 American Psychiatric Publishing, Inc. All rights reserved. www.appi.org
318
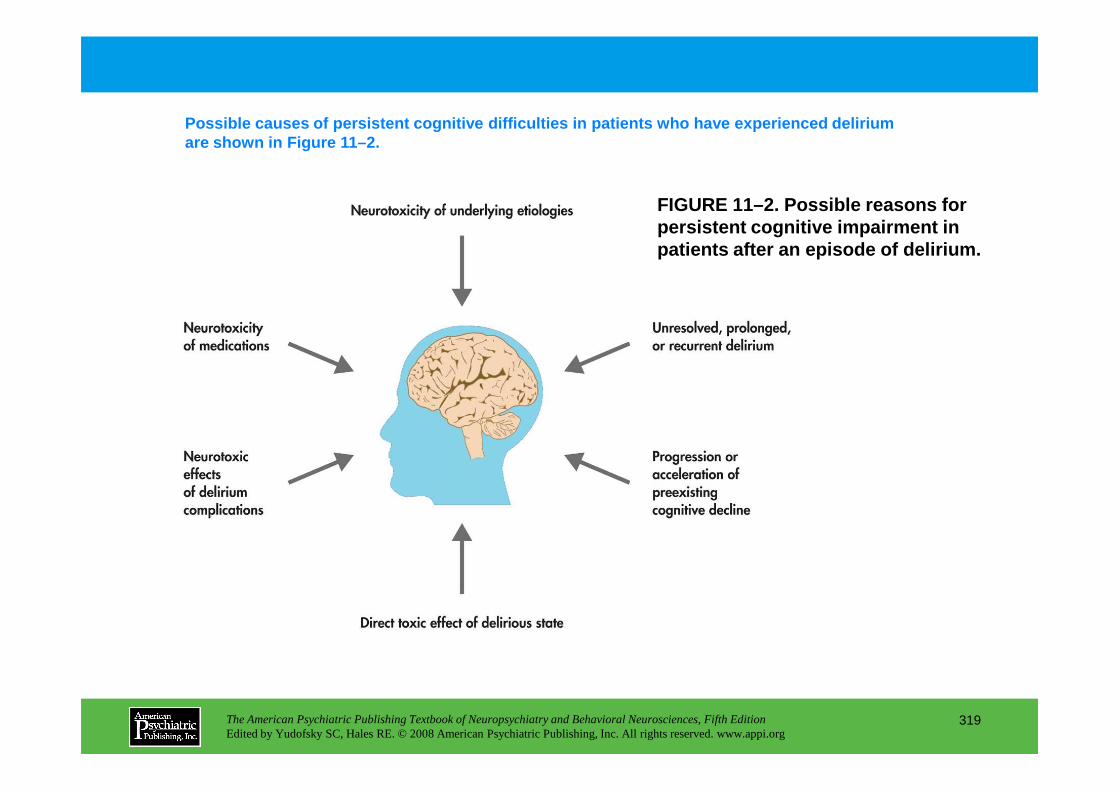
FIGURE 11–2. Possible reasons for persistent cognitive impairment in patients after an episode of delirium.
Possible causes of persistent cognitive difficultie s in patients who have experienced delirium are shown in Figure 11–2.
The American Psychiatric Publishing Textbook of Neuropsychiatry and Behavioral Neurosciences, Fifth EditionEdited by Yudofsky SC, Hales RE. © 2008 American Psychiatric Publishing, Inc. All rights reserved. www.appi.org
319

TABLE 11–4. Studies of cognitive performance after an episode of delirium
Studies of cognitive performance after a delirium e pisode are described in Table 11–4. Factors that may account for the development of dementia after a delirium episode have been difficult to identify.
The American Psychiatric Publishing Textbook of Neuropsychiatry and Behavioral Neurosciences, Fifth EditionEdited by Yudofsky SC, Hales RE. © 2008 American Psychiatric Publishing, Inc. All rights reserved. www.appi.org
320
(continued)

TABLE 11–4. Studies of cognitive performance after an episode of delirium (continued)
The American Psychiatric Publishing Textbook of Neuropsychiatry and Behavioral Neurosciences, Fifth EditionEdited by Yudofsky SC, Hales RE. © 2008 American Psychiatric Publishing, Inc. All rights reserved. www.appi.org
321
(continued)
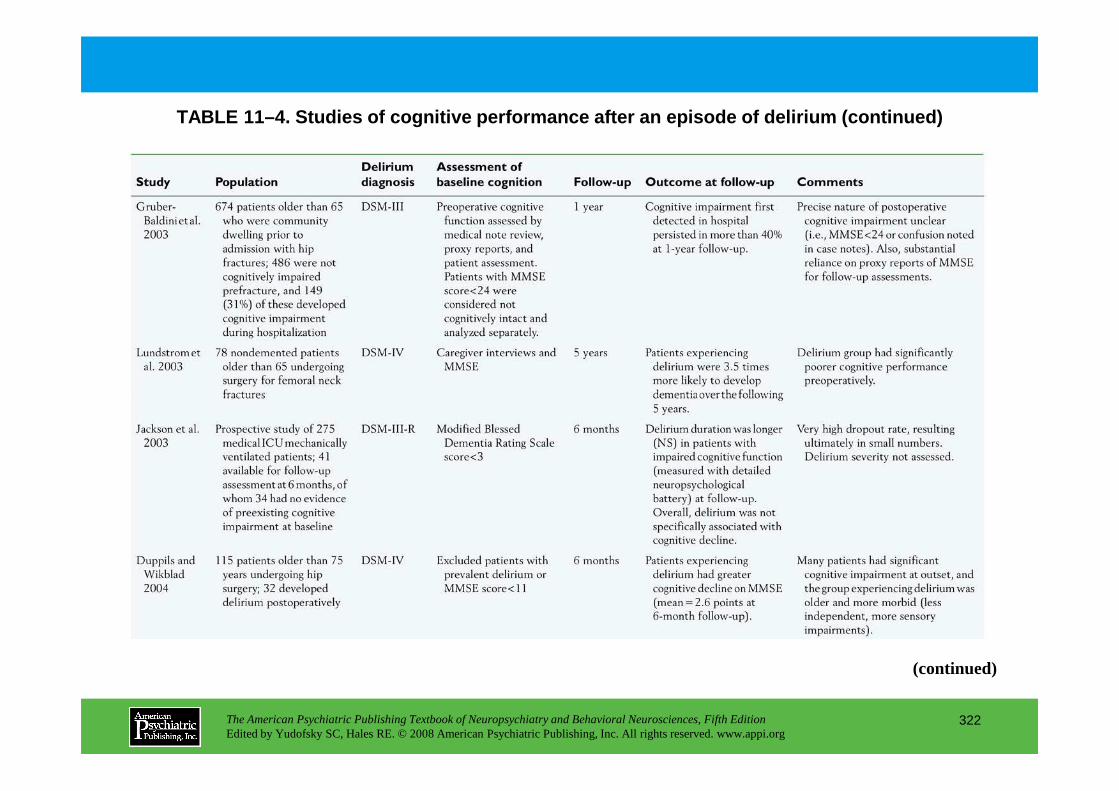
TABLE 11–4. Studies of cognitive performance after an episode of delirium (continued)
The American Psychiatric Publishing Textbook of Neuropsychiatry and Behavioral Neurosciences, Fifth EditionEdited by Yudofsky SC, Hales RE. © 2008 American Psychiatric Publishing, Inc. All rights reserved. www.appi.org
322
(continued)

TABLE 11–4. Studies of cognitive performance after an episode of delirium (continued)
The American Psychiatric Publishing Textbook of Neuropsychiatry and Behavioral Neurosciences, Fifth EditionEdited by Yudofsky SC, Hales RE. © 2008 American Psychiatric Publishing, Inc. All rights reserved. www.appi.org
323
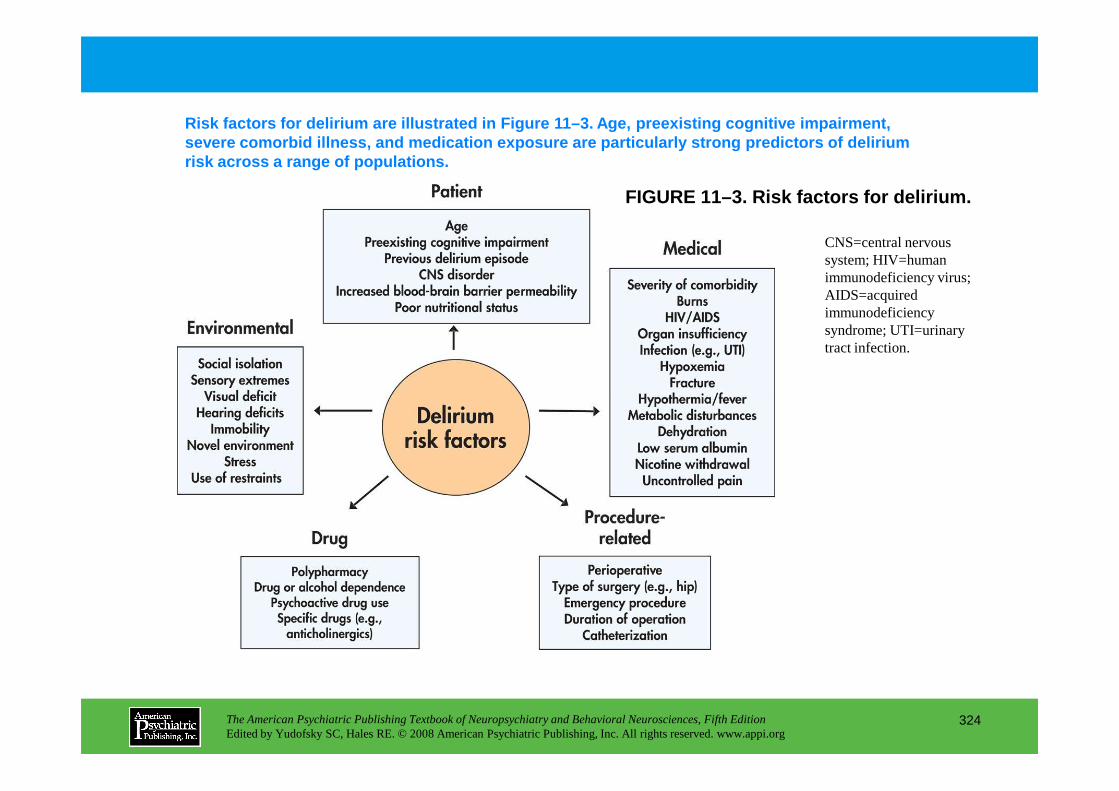
FIGURE 11–3. Risk factors for delirium.
Risk factors for delirium are illustrated in Figure 11–3. Age, preexisting cognitive impairment, severe comorbid illness, and medication exposure ar e particularly strong predictors of delirium risk across a range of populations.
CNS=central nervous system; HIV=human immunodeficiency virus; AIDS=acquired immunodeficiency syndrome; UTI=urinary tract infection.
The American Psychiatric Publishing Textbook of Neuropsychiatry and Behavioral Neurosciences, Fifth EditionEdited by Yudofsky SC, Hales RE. © 2008 American Psychiatric Publishing, Inc. All rights reserved. www.appi.org
324
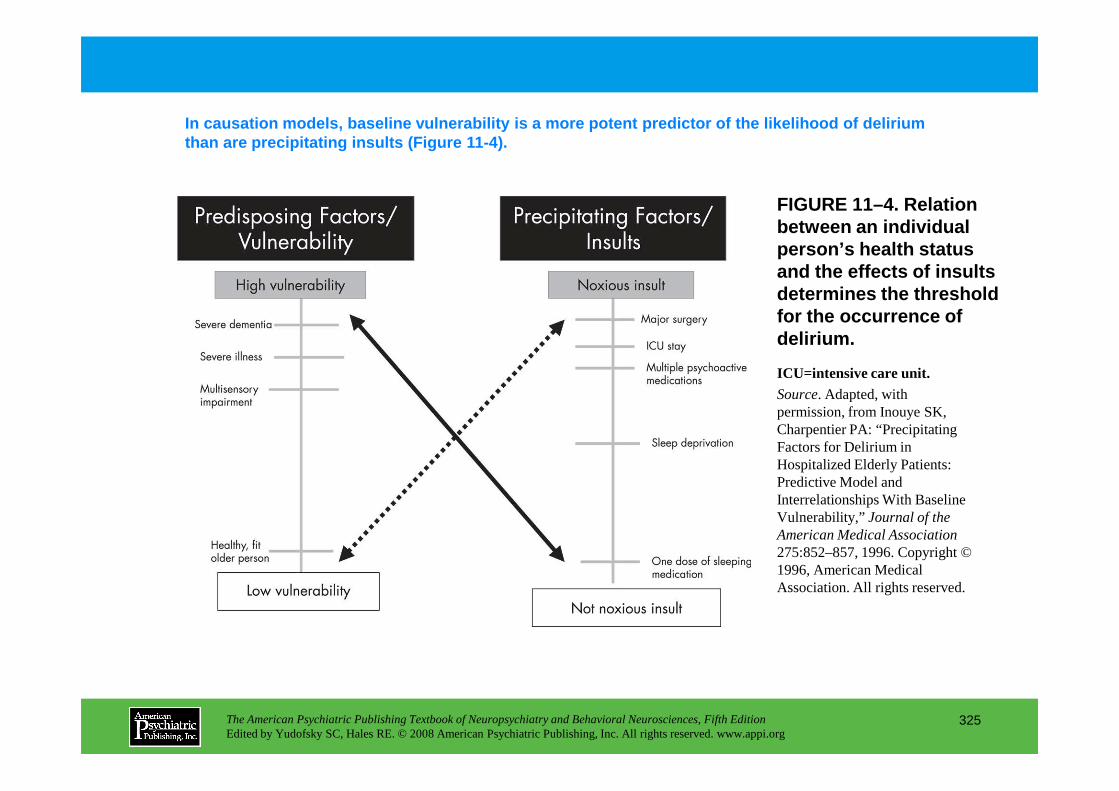
FIGURE 11–4. Relation between an individual person’s health status and the effects of insults determines the threshold for the occurrence of delirium.
In causation models, baseline vulnerability is a mo re potent predictor of the likelihood of delirium than are precipitating insults (Figure 11-4).
ICU=intensive care unit.Source. Adapted, with
The American Psychiatric Publishing Textbook of Neuropsychiatry and Behavioral Neurosciences, Fifth EditionEdited by Yudofsky SC, Hales RE. © 2008 American Psychiatric Publishing, Inc. All rights reserved. www.appi.org
325
Source. Adapted, with permission, from Inouye SK, Charpentier PA: “Precipitating Factors for Delirium in Hospitalized Elderly Patients: Predictive Model and Interrelationships With Baseline Vulnerability,” Journal of the American Medical Association275:852–857, 1996. Copyright © 1996, American Medical Association. All rights reserved.
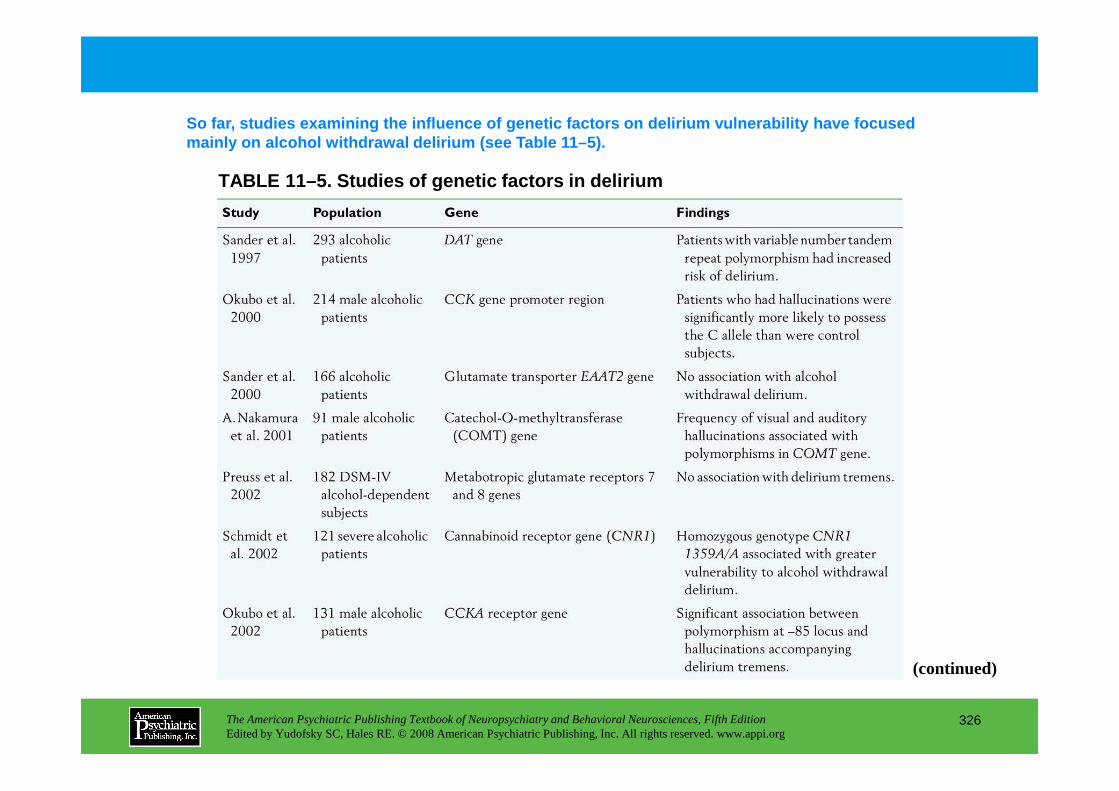
TABLE 11–5. Studies of genetic factors in delirium
So far, studies examining the influence of genetic factors on delirium vulnerability have focused mainly on alcohol withdrawal delirium (see Table 11 –5).
The American Psychiatric Publishing Textbook of Neuropsychiatry and Behavioral Neurosciences, Fifth EditionEdited by Yudofsky SC, Hales RE. © 2008 American Psychiatric Publishing, Inc. All rights reserved. www.appi.org
326
(continued)
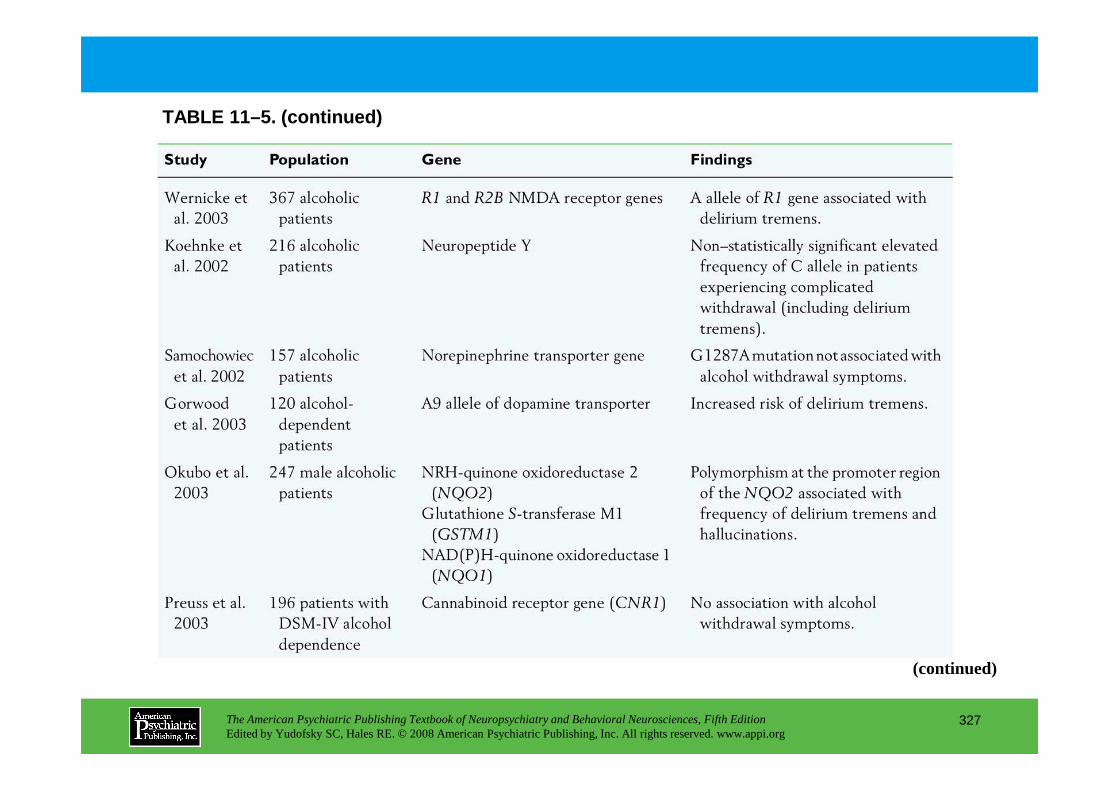
TABLE 11–5. (continued)
The American Psychiatric Publishing Textbook of Neuropsychiatry and Behavioral Neurosciences, Fifth EditionEdited by Yudofsky SC, Hales RE. © 2008 American Psychiatric Publishing, Inc. All rights reserved. www.appi.org
327
(continued)
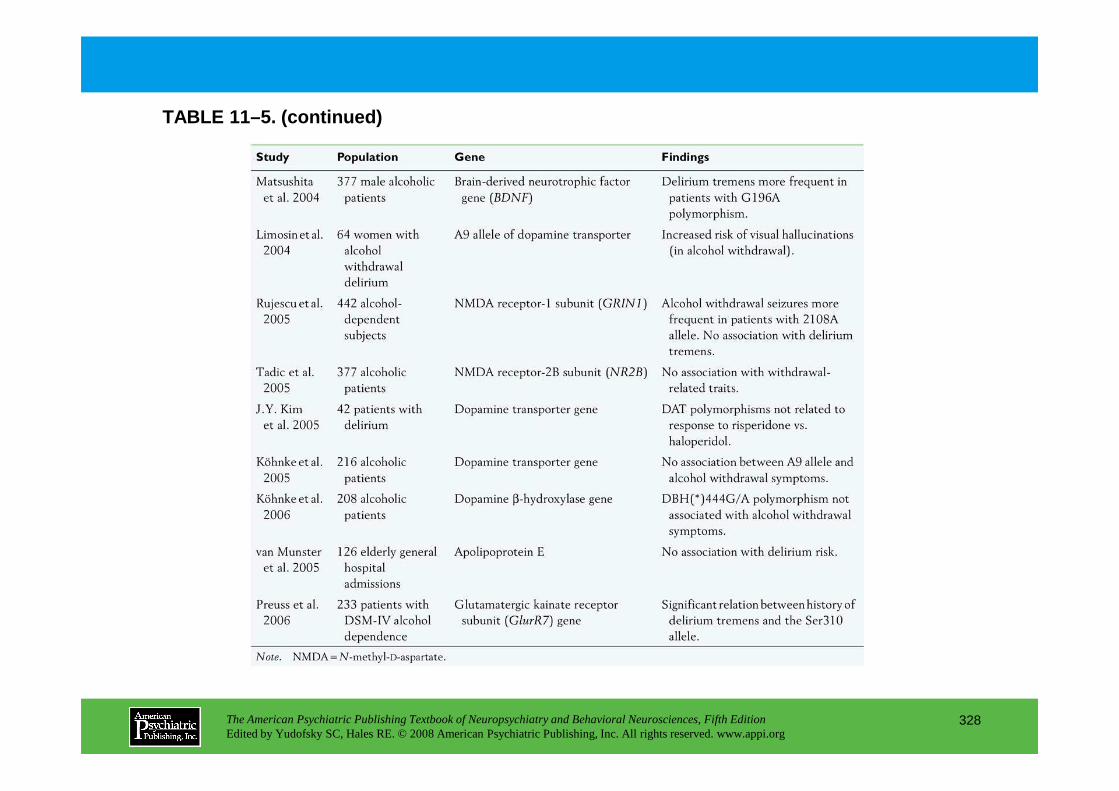
TABLE 11–5. (continued)
The American Psychiatric Publishing Textbook of Neuropsychiatry and Behavioral Neurosciences, Fifth EditionEdited by Yudofsky SC, Hales RE. © 2008 American Psychiatric Publishing, Inc. All rights reserved. www.appi.org
328
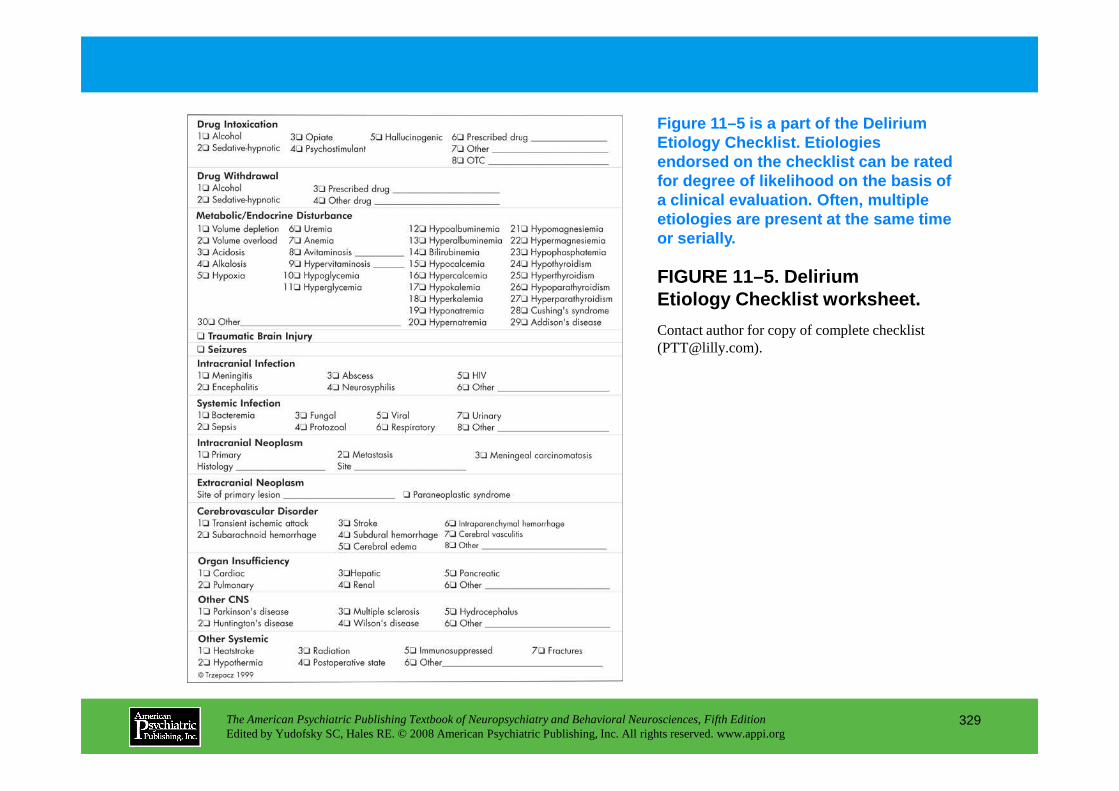
FIGURE 11–5. Delirium Etiology Checklist worksheet.
Contact author for copy of complete checklist ([email protected]).
Figure 11–5 is a part of the Delirium Etiology Checklist. Etiologies endorsed on the checklist can be rated for degree of likelihood on the basis of a clinical evaluation. Often, multiple etiologies are present at the same time or serially.
The American Psychiatric Publishing Textbook of Neuropsychiatry and Behavioral Neurosciences, Fifth EditionEdited by Yudofsky SC, Hales RE. © 2008 American Psychiatric Publishing, Inc. All rights reserved. www.appi.org
329
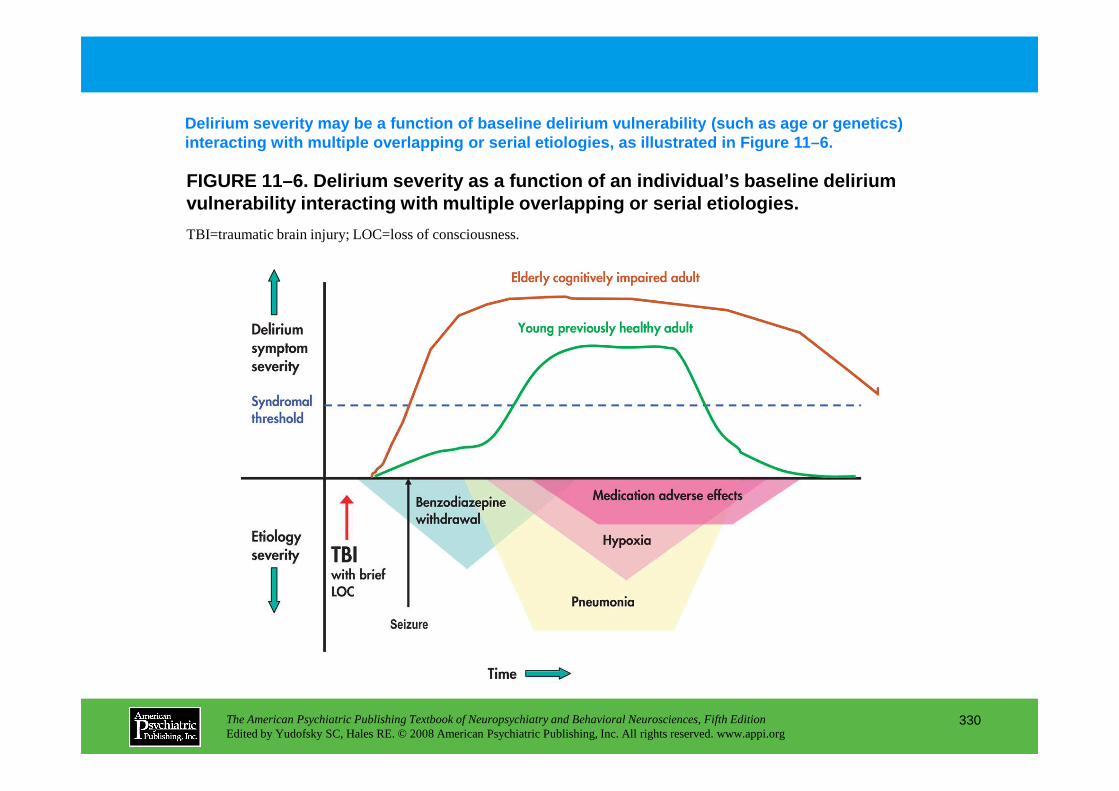
FIGURE 11–6. Delirium severity as a function of an individual’s baseline delirium vulnerability interacting with multiple overlapping or serial etiologies.
TBI=traumatic brain injury; LOC=loss of consciousness.
Delirium severity may be a function of baseline del irium vulnerability (such as age or genetics) interacting with multiple overlapping or serial eti ologies, as illustrated in Figure 11–6.
The American Psychiatric Publishing Textbook of Neuropsychiatry and Behavioral Neurosciences, Fifth EditionEdited by Yudofsky SC, Hales RE. © 2008 American Psychiatric Publishing, Inc. All rights reserved. www.appi.org
330

TABLE 11–6. Factors relevant to choice of delirium assessment instrument
The choice of instrument to assess delirium is dictated by many factors, as listed in Table 11–6.
The American Psychiatric Publishing Textbook of Neuropsychiatry and Behavioral Neurosciences, Fifth EditionEdited by Yudofsky SC, Hales RE. © 2008 American Psychiatric Publishing, Inc. All rights reserved. www.appi.org
331
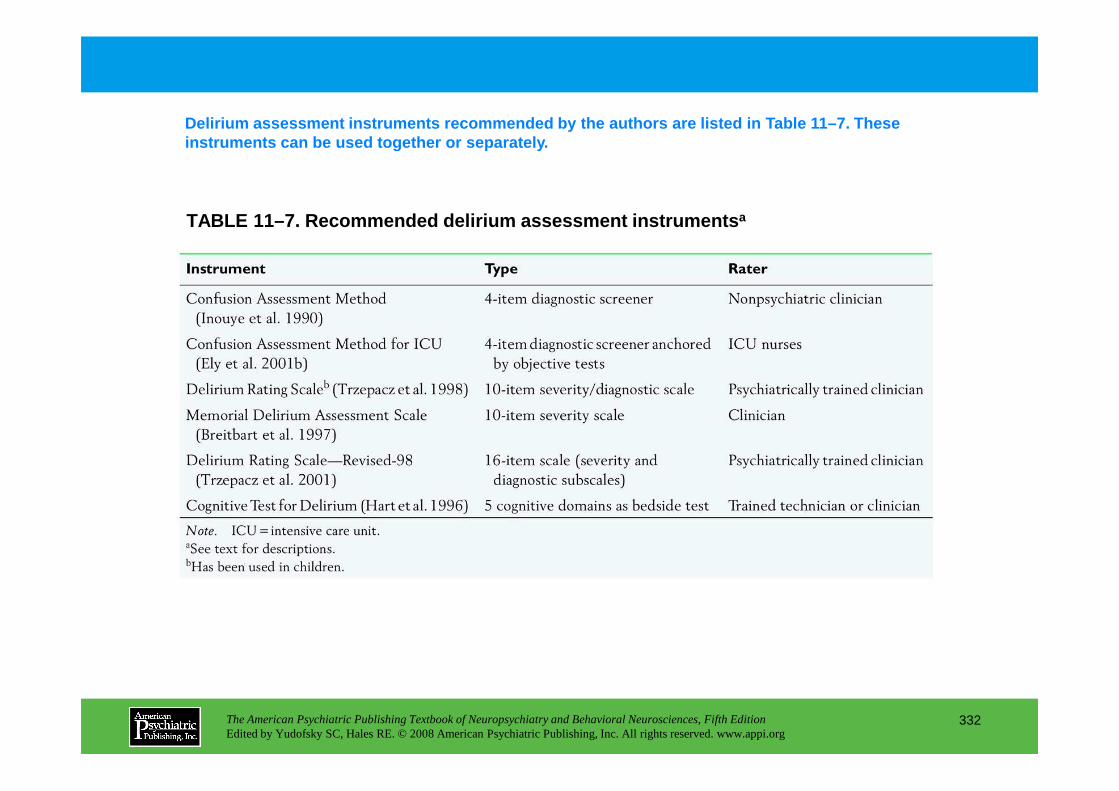
TABLE 11–7. Recommended delirium assessment instrum ents a
Delirium assessment instruments recommended by the authors are listed in Table 11–7. These instruments can be used together or separately.
The American Psychiatric Publishing Textbook of Neuropsychiatry and Behavioral Neurosciences, Fifth EditionEdited by Yudofsky SC, Hales RE. © 2008 American Psychiatric Publishing, Inc. All rights reserved. www.appi.org
332

FIGURE 11–7. Quantitative electro-encephalogram (QEEG) brain map in delirium.
Delirium assessment instruments recommended by the authors are listed in Table 11–7. These instruments can be used together or separatel y.
Relative power in each of four frequency bands (higher power in darker color).
Source.Reprinted from Jacobson S, Jerrier H: “EEG in Delirium.”
The American Psychiatric Publishing Textbook of Neuropsychiatry and Behavioral Neurosciences, Fifth EditionEdited by Yudofsky SC, Hales RE. © 2008 American Psychiatric Publishing, Inc. All rights reserved. www.appi.org
333
Jerrier H: “EEG in Delirium.” Seminars in Clinical Neuropsychiatry5:86–92, copyright 2000, with permission from Elsevier.
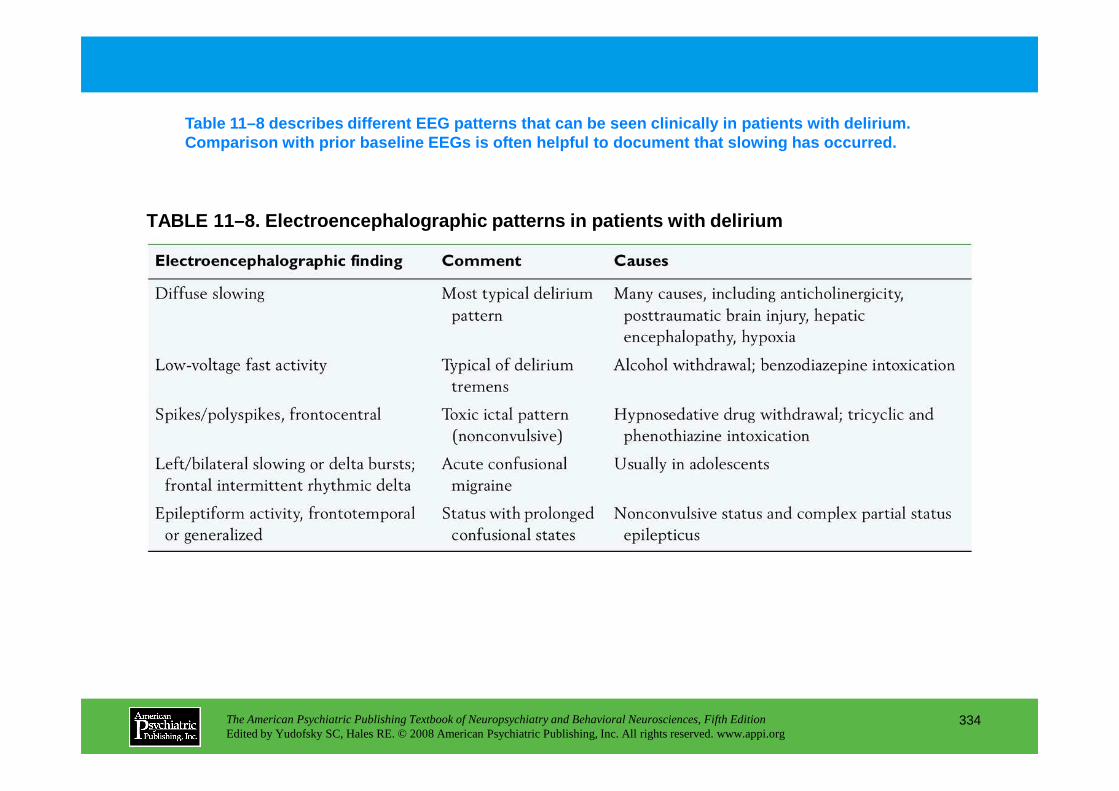
TABLE 11–8. Electroencephalographic patterns in pat ients with delirium
Table 11–8 describes different EEG patterns that ca n be seen clinically in patients with delirium. Comparison with prior baseline EEGs is often helpfu l to document that slowing has occurred.
The American Psychiatric Publishing Textbook of Neuropsychiatry and Behavioral Neurosciences, Fifth EditionEdited by Yudofsky SC, Hales RE. © 2008 American Psychiatric Publishing, Inc. All rights reserved. www.appi.org
334

TABLE 11–9. Studies of delirium phenomenology
Although symptom frequency differs across studies, certain symptoms do occur more often than others in delirium (see Table 11–9). This is consistent with the proposal that delirium has core symptoms irrespective of etiology.
The American Psychiatric Publishing Textbook of Neuropsychiatry and Behavioral Neurosciences, Fifth EditionEdited by Yudofsky SC, Hales RE. © 2008 American Psychiatric Publishing, Inc. All rights reserved. www.appi.org
335
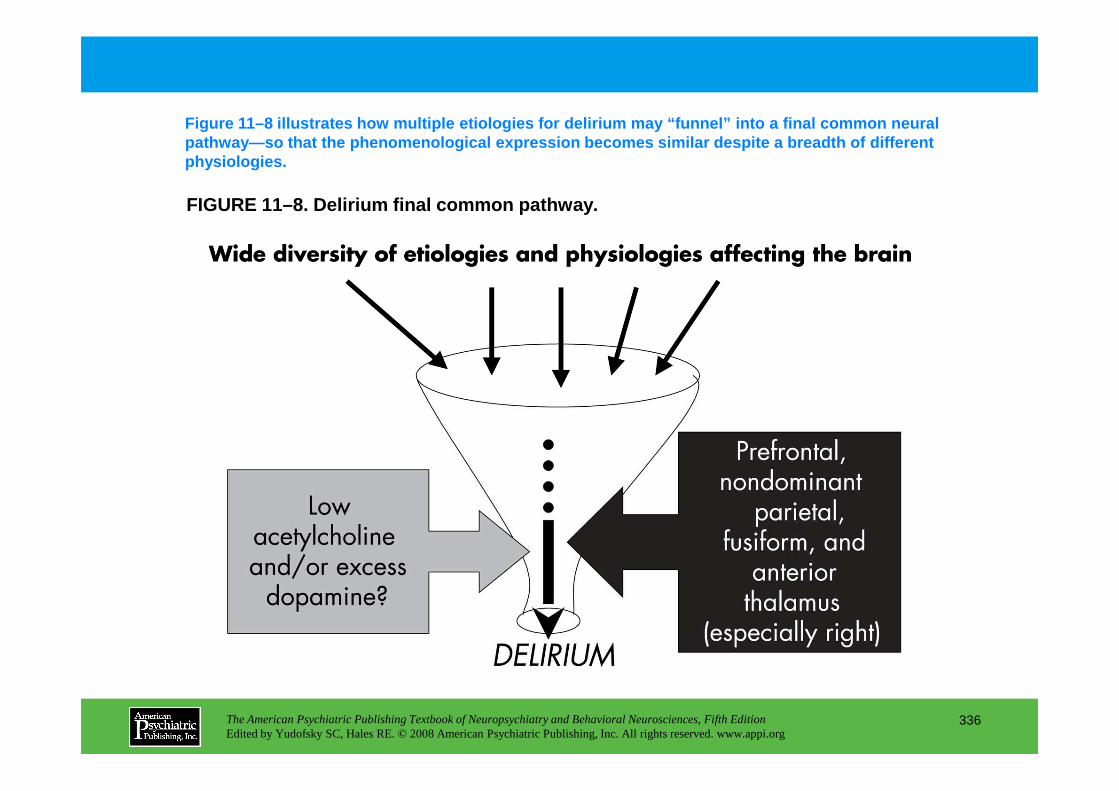
FIGURE 11–8. Delirium final common pathway.
Figure 11–8 illustrates how multiple etiologies for delirium may “funnel” into a final common neural pathway—so that the phenomenological expression beco mes similar despite a breadth of different physiologies.
The American Psychiatric Publishing Textbook of Neuropsychiatry and Behavioral Neurosciences, Fifth EditionEdited by Yudofsky SC, Hales RE. © 2008 American Psychiatric Publishing, Inc. All rights reserved. www.appi.org
336
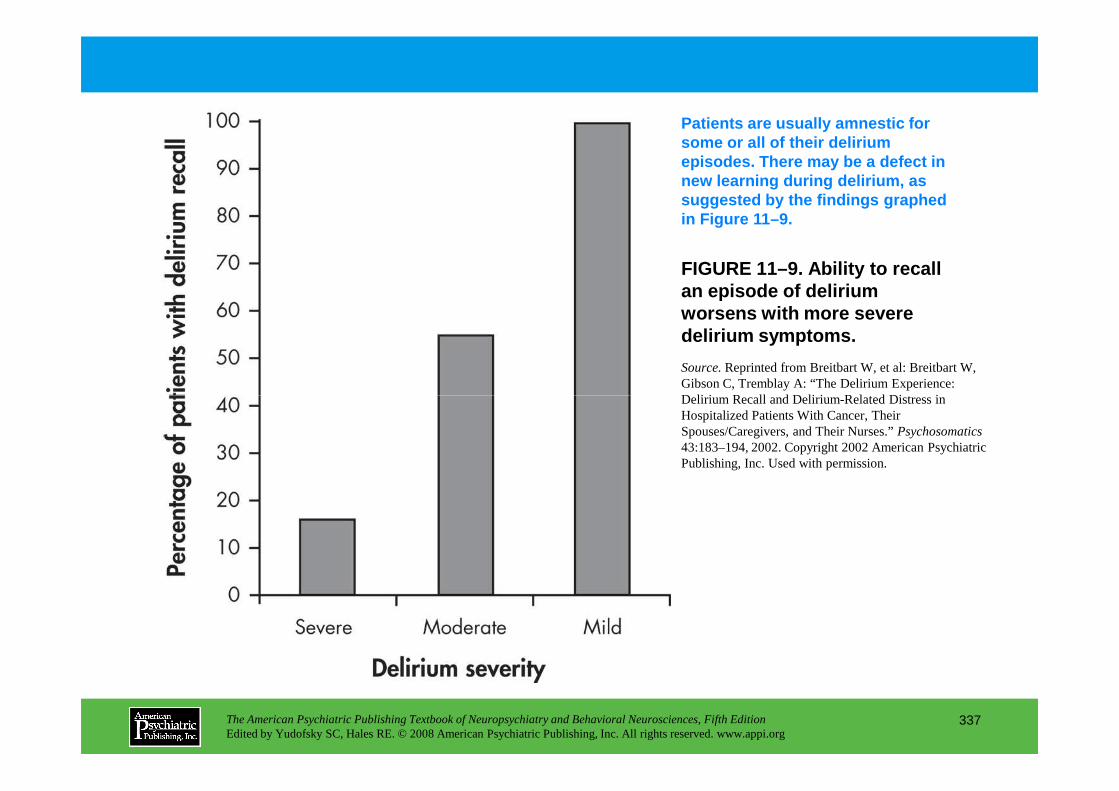
FIGURE 11–9. Ability to recall an episode of delirium worsens with more severe delirium symptoms.
Patients are usually amnestic for some or all of their delirium episodes. There may be a defect in new learning during delirium, as suggested by the findings graphed in Figure 11–9.
Source.Reprinted from Breitbart W, et al: Breitbart W, Gibson C, Tremblay A: “The Delirium Experience: Delirium Recall and Delirium-Related Distress in
The American Psychiatric Publishing Textbook of Neuropsychiatry and Behavioral Neurosciences, Fifth EditionEdited by Yudofsky SC, Hales RE. © 2008 American Psychiatric Publishing, Inc. All rights reserved. www.appi.org
337
Delirium Recall and Delirium-Related Distress in Hospitalized Patients With Cancer, Their Spouses/Caregivers, and Their Nurses.” Psychosomatics43:183–194, 2002. Copyright 2002 American Psychiatric Publishing, Inc. Used with permission.

TABLE 11–10. Studies of frequency of motor subtypes in delirium
Disturbances of motor behavior are almost invariable in delirium. Reports differ as to the relative frequencies of the different subtypes of disturbances—hypoactive, hyperactive, mixed, or none (Table 11–10).
The American Psychiatric Publishing Textbook of Neuropsychiatry and Behavioral Neurosciences, Fifth EditionEdited by Yudofsky SC, Hales RE. © 2008 American Psychiatric Publishing, Inc. All rights reserved. www.appi.org
338
(continued)
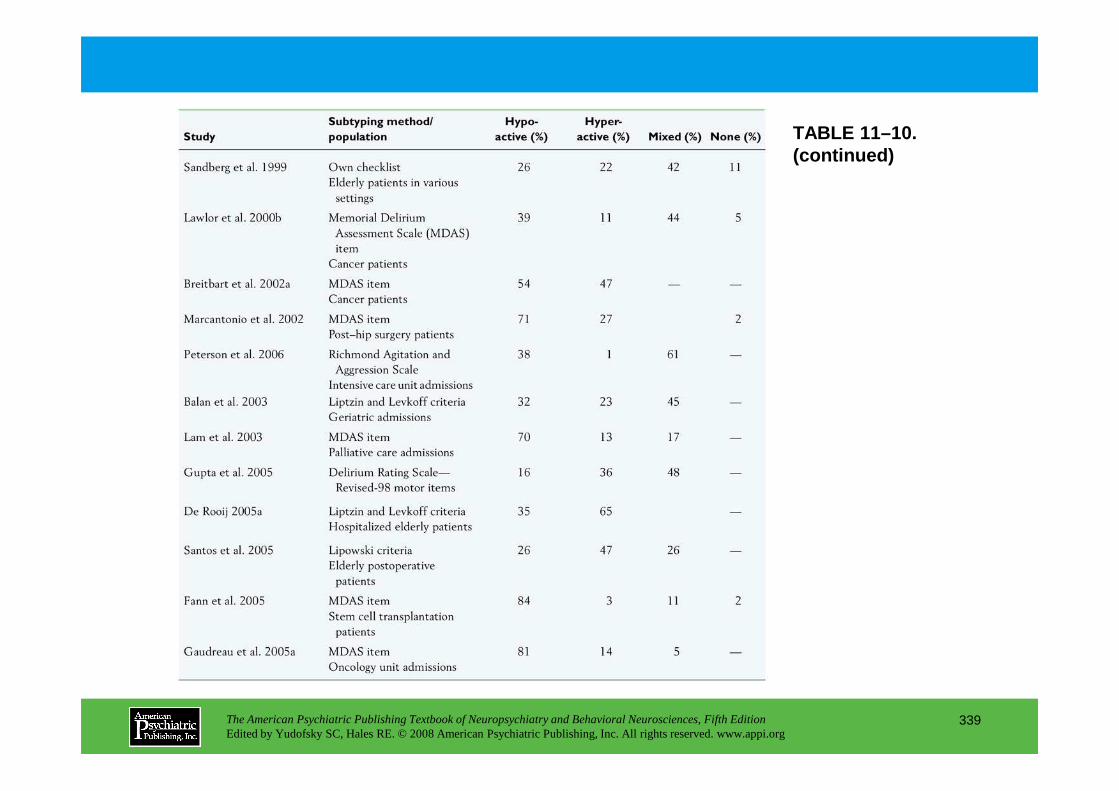
TABLE 11–10. (continued)
The American Psychiatric Publishing Textbook of Neuropsychiatry and Behavioral Neurosciences, Fifth EditionEdited by Yudofsky SC, Hales RE. © 2008 American Psychiatric Publishing, Inc. All rights reserved. www.appi.org
339

TABLE 11 –11.
The widening range of therapeutic options in delirium includes atypical antipsychotics, procholinergic agents, and melatonergic compounds. Most prospective drug studies have used open-label designs (Table 11–11).
The American Psychiatric Publishing Textbook of Neuropsychiatry and Behavioral Neurosciences, Fifth EditionEdited by Yudofsky SC, Hales RE. © 2008 American Psychiatric Publishing, Inc. All rights reserved. www.appi.org
340
TABLE 11 –11. Prospective studies of drug treatment in delirium
(continued)
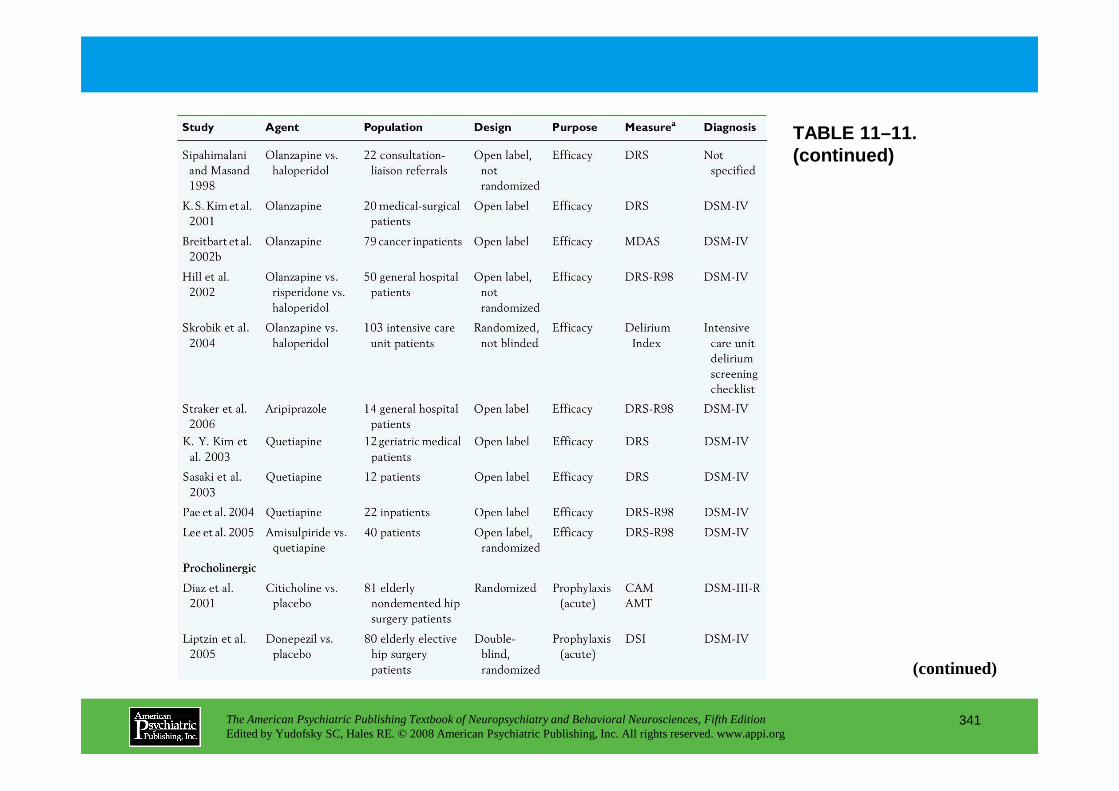
TABLE 11–11. (continued)
The American Psychiatric Publishing Textbook of Neuropsychiatry and Behavioral Neurosciences, Fifth EditionEdited by Yudofsky SC, Hales RE. © 2008 American Psychiatric Publishing, Inc. All rights reserved. www.appi.org
341
(continued)

TABLE 11–11. (continued)
The American Psychiatric Publishing Textbook of Neuropsychiatry and Behavioral Neurosciences, Fifth EditionEdited by Yudofsky SC, Hales RE. © 2008 American Psychiatric Publishing, Inc. All rights reserved. www.appi.org
342
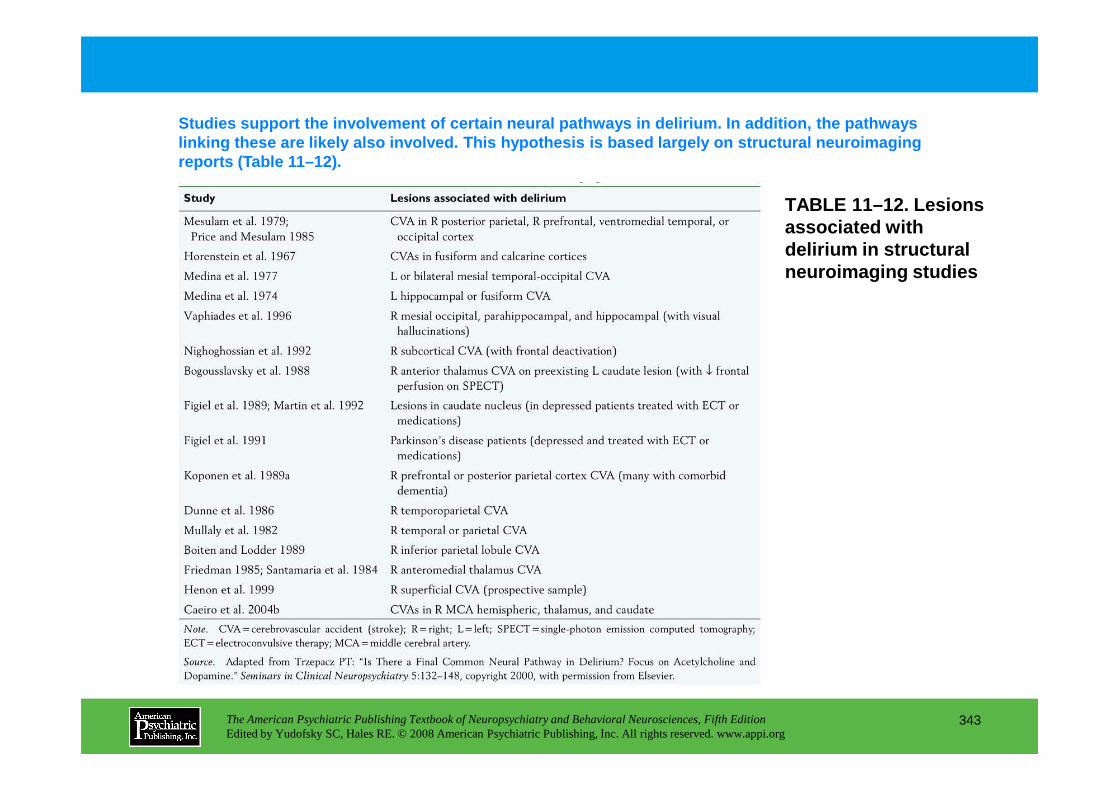
TABLE 11–12. Lesions associated with delirium in structural neuroimaging studies
Studies support the involvement of certain neural p athways in delirium. In addition, the pathways linking these are likely also involved. This hypoth esis is based largely on structural neuroimaging reports (Table 11–12).
The American Psychiatric Publishing Textbook of Neuropsychiatry and Behavioral Neurosciences, Fifth EditionEdited by Yudofsky SC, Hales RE. © 2008 American Psychiatric Publishing, Inc. All rights reserved. www.appi.org
343
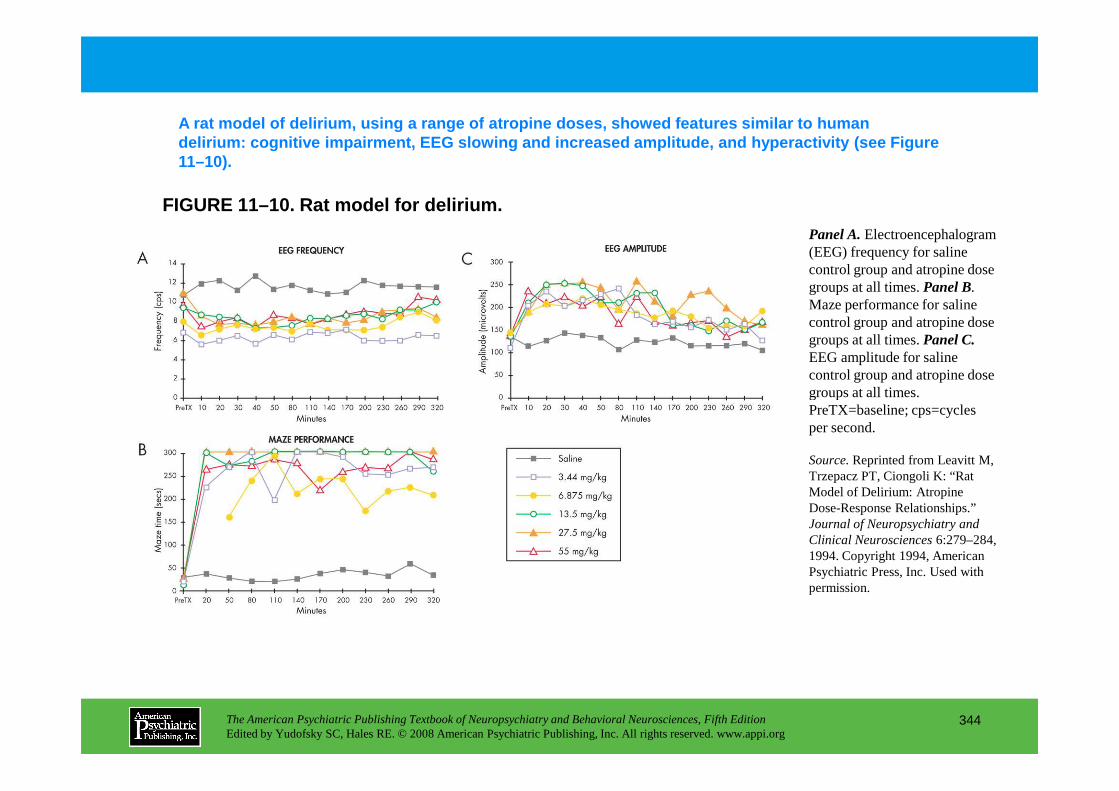
FIGURE 11–10. Rat model for delirium.
A rat model of delirium, using a range of atropine doses, showed features similar to human delirium: cognitive impairment, EEG slowing and inc reased amplitude, and hyperactivity (see Figure 11–10).
Panel A.Electroencephalogram (EEG) frequency for saline control group and atropine dose groups at all times. Panel B.Maze performance for saline control group and atropine dose groups at all times. Panel C.EEG amplitude for saline control group and atropine dose groups at all times.
The American Psychiatric Publishing Textbook of Neuropsychiatry and Behavioral Neurosciences, Fifth EditionEdited by Yudofsky SC, Hales RE. © 2008 American Psychiatric Publishing, Inc. All rights reserved. www.appi.org
344
groups at all times. PreTX=baseline; cps=cycles per second.
Source.Reprinted from Leavitt M, Trzepacz PT, Ciongoli K: “Rat Model of Delirium: Atropine Dose-Response Relationships.” Journal of Neuropsychiatry and Clinical Neurosciences6:279–284, 1994. Copyright 1994, American Psychiatric Press, Inc. Used with permission.
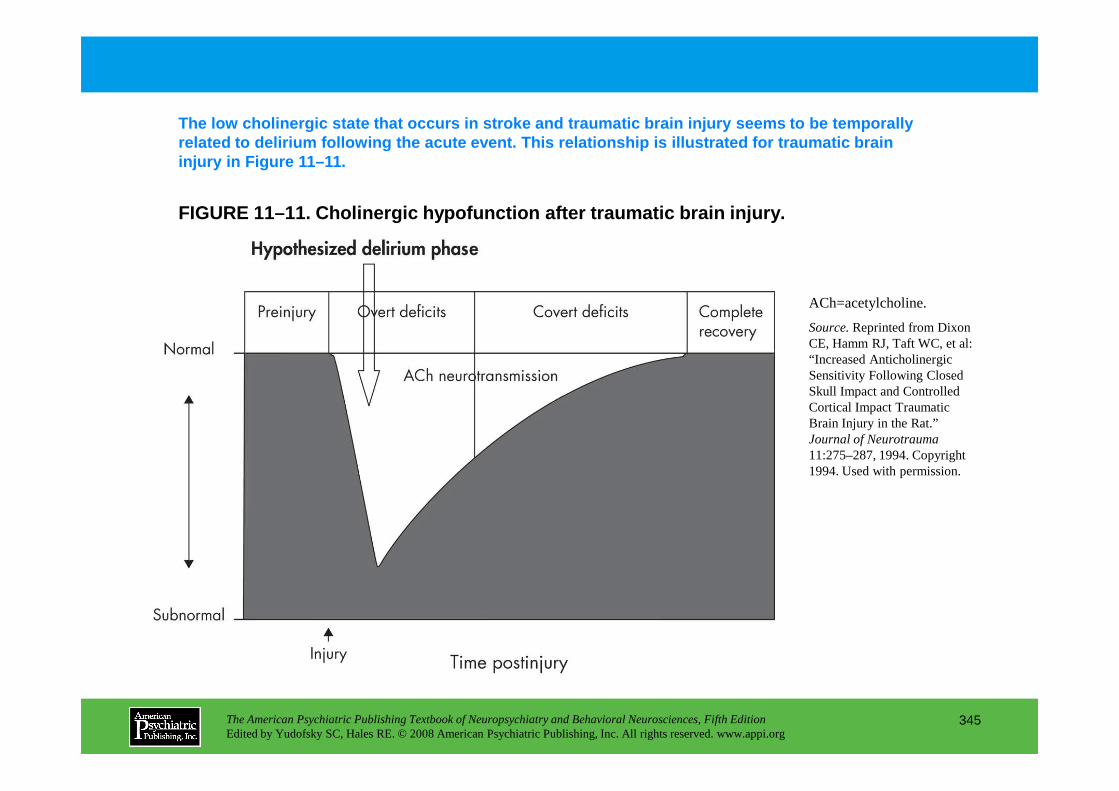
FIGURE 11–11. Cholinergic hypofunction after trauma tic brain injury.
The low cholinergic state that occurs in stroke and traumatic brain injury seems to be temporally related to delirium following the acute event. This relationship is illustrated for traumatic brain injury in Figure 11–11.
ACh=acetylcholine.
Source.Reprinted from Dixon CE, Hamm RJ, Taft WC, et al: “Increased Anticholinergic Sensitivity Following Closed Skull Impact and Controlled
The American Psychiatric Publishing Textbook of Neuropsychiatry and Behavioral Neurosciences, Fifth EditionEdited by Yudofsky SC, Hales RE. © 2008 American Psychiatric Publishing, Inc. All rights reserved. www.appi.org
345
Skull Impact and Controlled Cortical Impact Traumatic Brain Injury in the Rat.” Journal of Neurotrauma11:275–287, 1994. Copyright 1994. Used with permission.
Chapter 11 • Highlights for the Clinician
Characteristics of Dementia: Caveats and ActionsHigher Cortical DysfunctionCaveats:• Higher cortical dysfunction produces acute, diffuse cognitive disorder with the cardinal
symptom of inattention or altered consciousness and a breadth of other neuropsychiatric symptoms affecting thought, sleep-wake cycle, mood, language, motor activity, and perception.
Actions:• Do a cognitive assessment, because reliance on any one symptom of delirium alone might be
misleading diagnostically.
The American Psychiatric Publishing Textbook of Neuropsychiatry and Behavioral Neurosciences, Fifth EditionEdited by Yudofsky SC, Hales RE. © 2008 American Psychiatric Publishing, Inc. All rights reserved. www.appi.org
346
Motor Activity LevelsCaveats:• Hypoactive presentations are often missed or misdiagnosed as depression, whereas
hyperactive presentations are noticed more because of the disruptions to nursing care.Actions:• Maintain a high level of suspicion for delirium in the medically ill, especially quiet patients.
(continued)
Comorbidity With Dementia in Older PatientsCaveats:• Dementia is a risk factor for delirium and also has overlapping symptoms, which complicates accurate
diagnosis. Because of the poor prognosis for delirium and high potential for reversibility, the rule of thumb is: “It is delirium until proven otherwise.”
Actions:• Assess for attention deficits that help diagnose delirium rather than most dementias; the latter have
primary memory deficits, although Lewy body dementia masquerades as delirium.
Multiple EtiologiesCaveats:
The American Psychiatric Publishing Textbook of Neuropsychiatry and Behavioral Neurosciences, Fifth EditionEdited by Yudofsky SC, Hales RE. © 2008 American Psychiatric Publishing, Inc. All rights reserved. www.appi.org
347
Caveats:• Delirium is caused by a wide variety of medical, surgical, and pharmacological conditions that need to
be evaluated stepwise on an individualized basis to elucidate one or more etiologies.Actions:• Identify and correct or treat each etiology as soon as possible while monitoring mental status.
(continued)
Serious ConsequencesCaveats:• Delirium is associated with high morbidity, long-term mortality, and increased length of stay and
costs in the hospital.Actions:• Take prompt action in managing the underlying causes and in treating the delirium itself as a
brain disorder.
TreatmentCaveats:• Pharmacological and nonpharmacological methods are used to treat delirium, in such a way that
The American Psychiatric Publishing Textbook of Neuropsychiatry and Behavioral Neurosciences, Fifth EditionEdited by Yudofsky SC, Hales RE. © 2008 American Psychiatric Publishing, Inc. All rights reserved. www.appi.org
348
• Pharmacological and nonpharmacological methods are used to treat delirium, in such a way that treatment targets core neuropsychiatric symptoms (cognition, sleep, thoughts), and not just psychotic symptoms or motor presentation.
• No regulatory body has approved a particular medication for delirium.Actions:• Consider empirical evidence from consensus and mostly open-label studies suggesting that
neuroleptics may be useful (except in delirium tremens, for which benzodiazepines are preferred).
CHAPTER 12
NEUROPSYCHIATRIC ASPECTS OF APHASIA AND RELATED DISORDERS
Mario F. Mendez, M.D., Ph.D.David Glenn Clark, M.D.
The American Psychiatric Publishing Textbook of Neuropsychiatry and Behavioral Neurosciences, Fifth EditionEdited by Yudofsky SC, Hales RE. © 2008 American Psychiatric Publishing, Inc. All rights reserved. www.appi.org
349
Slide Show
Topic headings and reading list
Tables and figures
Highlights for the clinician
Main menu
(About, Contents, Contributors, Publishing facts)
Background
Classification and Diagnosis of AphasiaThe Language Examination
Clinical Aphasia SyndromesBroca’s AphasiaWernicke’s AphasiaConduction AphasiaGlobal AphasiaTranscortical AphasiasAnomic AphasiaSubcortical AphasiaAmelodia or AprosodiaVerbal DysdecorumMiscellaneous Disorders
Neuropsychiatric Aspects of AphasiaPsychiatric Aspects
Anterior Aphasia Behavioral SyndromePosterior Aphasia Behavioral SyndromeBehavior in Primary Progressive Aphasia
Cognitive AspectsPsychosocial Aspects
Prognosis and Treatment
Conclusion
RECOMMENDED READINGSBerthier ML: Poststroke aphasia: epidemiology, pathophysiology and
treatment. Drugs Aging 22:163–182, 2005
CHAPTER 12 • Topics and Readings
The American Psychiatric Publishing Textbook of Neuropsychiatry and Behavioral Neurosciences, Fifth EditionEdited by Yudofsky SC, Hales RE. © 2008 American Psychiatric Publishing, Inc. All rights reserved. www.appi.org
350
Miscellaneous Disorderstreatment. Drugs Aging 22:163–182, 2005
Grossman M, Ash S: Primary progressive aphasia: a review. Neurocase 10:3–18, 2004
CHAPTER 12 • Tables and Figures
Figure 12–1. Lateral view of the left hemisphere indicating the perisylvian area
Figure 12–2. Wernicke-Geschwind model
Table 12–1. Principal aphasia syndromes
Figure 12–3. Magnetic resonance images (T1 weighted) of a patient with Broca’s aphasia
Table 12–2. Comparison of language characteristics for Wernicke’s aphasia, delirium, schizophrenia, and mania
Figure 12–4. Magnetic resonance images (T1 weighted) of a patient with Wernicke’s aphasia
Summary Highlights for the Clinician
The American Psychiatric Publishing Textbook of Neuropsychiatry and Behavioral Neurosciences, Fifth EditionEdited by Yudofsky SC, Hales RE. © 2008 American Psychiatric Publishing, Inc. All rights reserved. www.appi.org
351

FIGURE 12–1. Lateral view of the left hemisphere in dicating the perisylvian area (central clear region), where the major language centers are located (Catan i et al. 2005).
Current approaches to aphasia stem from early work on the localization of language to discrete, interconnected areas in the left hemisphere. Elabor ation of this model led to a view that language functions were localized in neuroanatomical regions in the left perisylvian region (Figure 12–1).
Broca’s area in the frontal operculum, Wernicke’s area in the superior temporal gyrus, and the arcuate fasciculus are indicated. Lesions in these corresponding structures result in Broca’s aphasia, Wernicke’s aphasia,
The American Psychiatric Publishing Textbook of Neuropsychiatry and Behavioral Neurosciences, Fifth EditionEdited by Yudofsky SC, Hales RE. © 2008 American Psychiatric Publishing, Inc. All rights reserved. www.appi.org
352
Broca’s aphasia, Wernicke’s aphasia, and conduction aphasia, respectively. These perisylvian aphasia syndromes include disturbances in the ability to repeat spoken language. Lesions in the surrounding border zone area (cross-hatched region) may result in transcortical aphasia syndromes characterized by sparing of repetition. TMA=region where a lesser lesion may result in transcortical motor aphasia; TSA=region where a lesion may result in transcortical sensory aphasia.
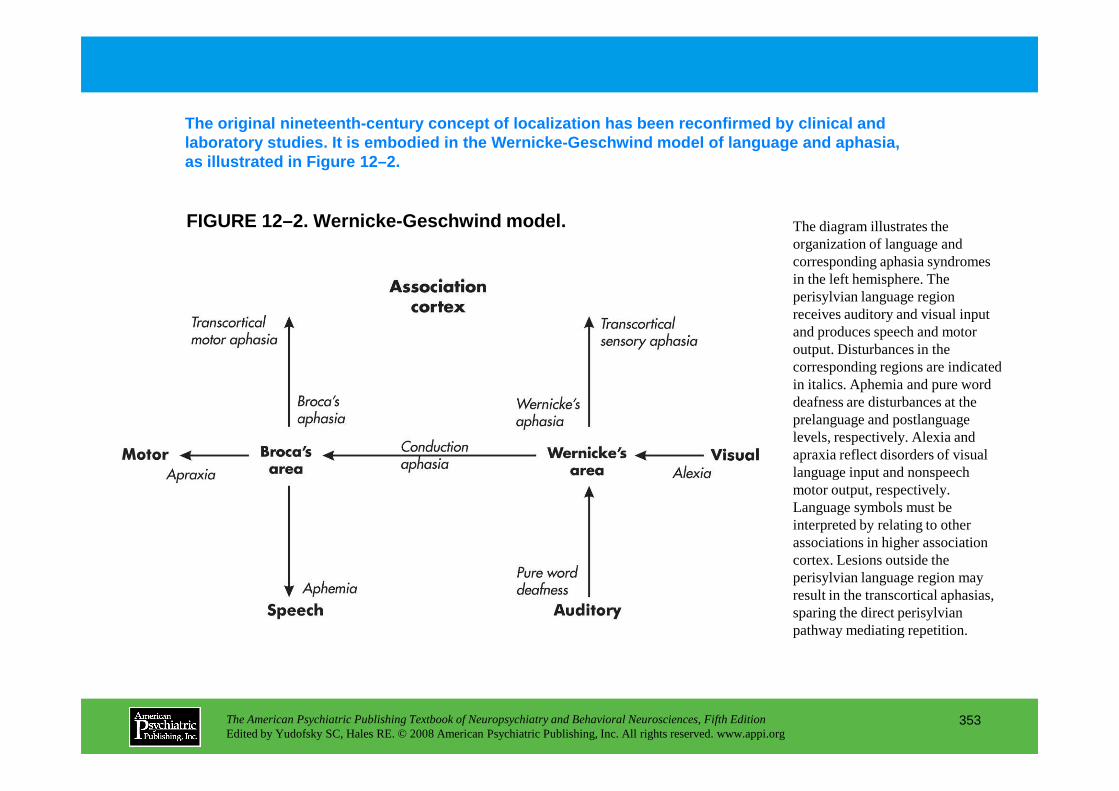
FIGURE 12–2. Wernicke-Geschwind model.
The original nineteenth-century concept of localizat ion has been reconfirmed by clinical and laboratory studies. It is embodied in the Wernicke- Geschwind model of language and aphasia, as illustrated in Figure 12–2.
The diagram illustrates the organization of language and corresponding aphasia syndromes in the left hemisphere. The perisylvian language region receives auditory and visual input and produces speech and motor output. Disturbances in the corresponding regions are indicated in italics. Aphemia and pure word deafness are disturbances at the
The American Psychiatric Publishing Textbook of Neuropsychiatry and Behavioral Neurosciences, Fifth EditionEdited by Yudofsky SC, Hales RE. © 2008 American Psychiatric Publishing, Inc. All rights reserved. www.appi.org
353
deafness are disturbances at the prelanguage and postlanguage levels, respectively. Alexia and apraxia reflect disorders of visual language input and nonspeech motor output, respectively. Language symbols must be interpreted by relating to other associations in higher association cortex. Lesions outside the perisylvian language region may result in the transcortical aphasias, sparing the direct perisylvian pathway mediating repetition.

TABLE 12–1. Principal aphasia syndromes
The syndrome classification based on the Wernicke-G eschwind model remains the core of clinical and academic studies of aphasia. Table 12–1 present s an abridged version of this classification with the major language abnormalities associated with ea ch syndrome.
The American Psychiatric Publishing Textbook of Neuropsychiatry and Behavioral Neurosciences, Fifth EditionEdited by Yudofsky SC, Hales RE. © 2008 American Psychiatric Publishing, Inc. All rights reserved. www.appi.org
354
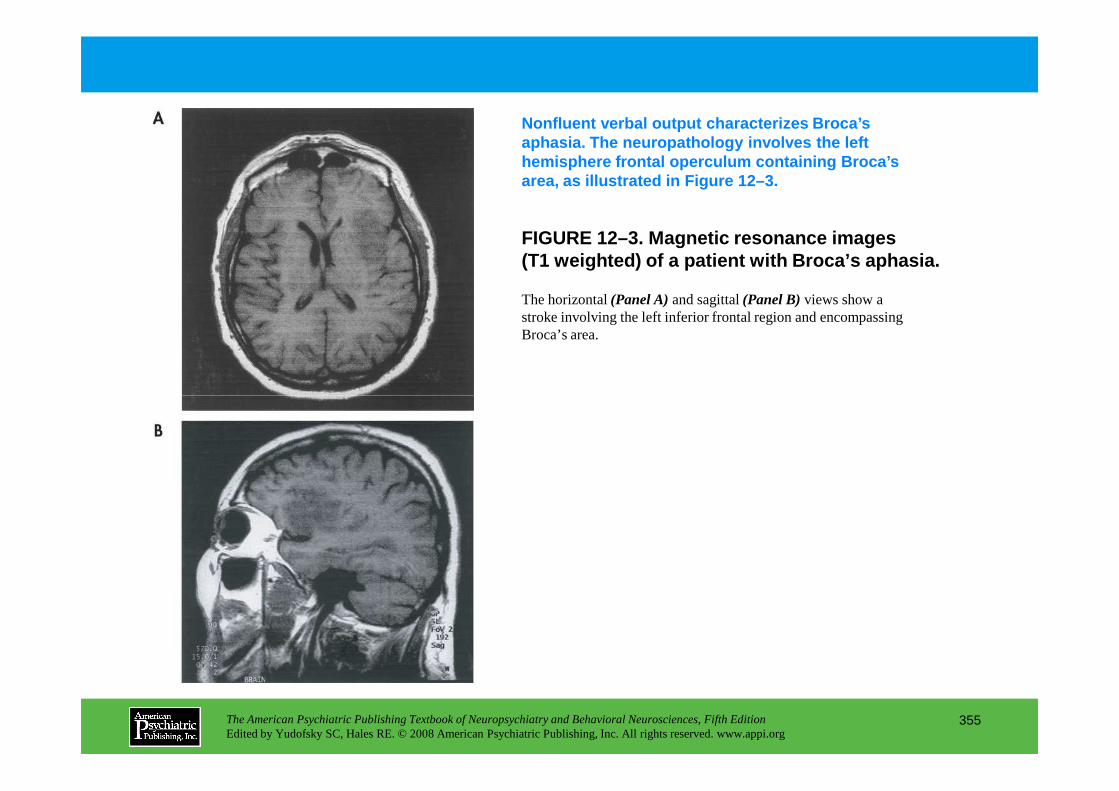
FIGURE 12–3. Magnetic resonance images(T1 weighted) of a patient with Broca’s aphasia.
Nonfluent verbal output characterizes Broca’s aphasia. The neuropathology involves the left hemisphere frontal operculum containing Broca’s area, as illustrated in Figure 12–3.
The horizontal (Panel A)and sagittal (Panel B)views show a stroke involving the left inferior frontal region and encompassing Broca’s area.
The American Psychiatric Publishing Textbook of Neuropsychiatry and Behavioral Neurosciences, Fifth EditionEdited by Yudofsky SC, Hales RE. © 2008 American Psychiatric Publishing, Inc. All rights reserved. www.appi.org
355

TABLE 12–2. Comparison of language characteristics for Wernicke’s aphasia, delirium, schizophrenia, and mania
Clinicians must be able to distinguish among the di fferent language abnormalities of Wernicke’s aphasia, psychiatric disorders, and delirium. These characteristics are summarized in Table 12–2.
The American Psychiatric Publishing Textbook of Neuropsychiatry and Behavioral Neurosciences, Fifth EditionEdited by Yudofsky SC, Hales RE. © 2008 American Psychiatric Publishing, Inc. All rights reserved. www.appi.org
356
(continued)
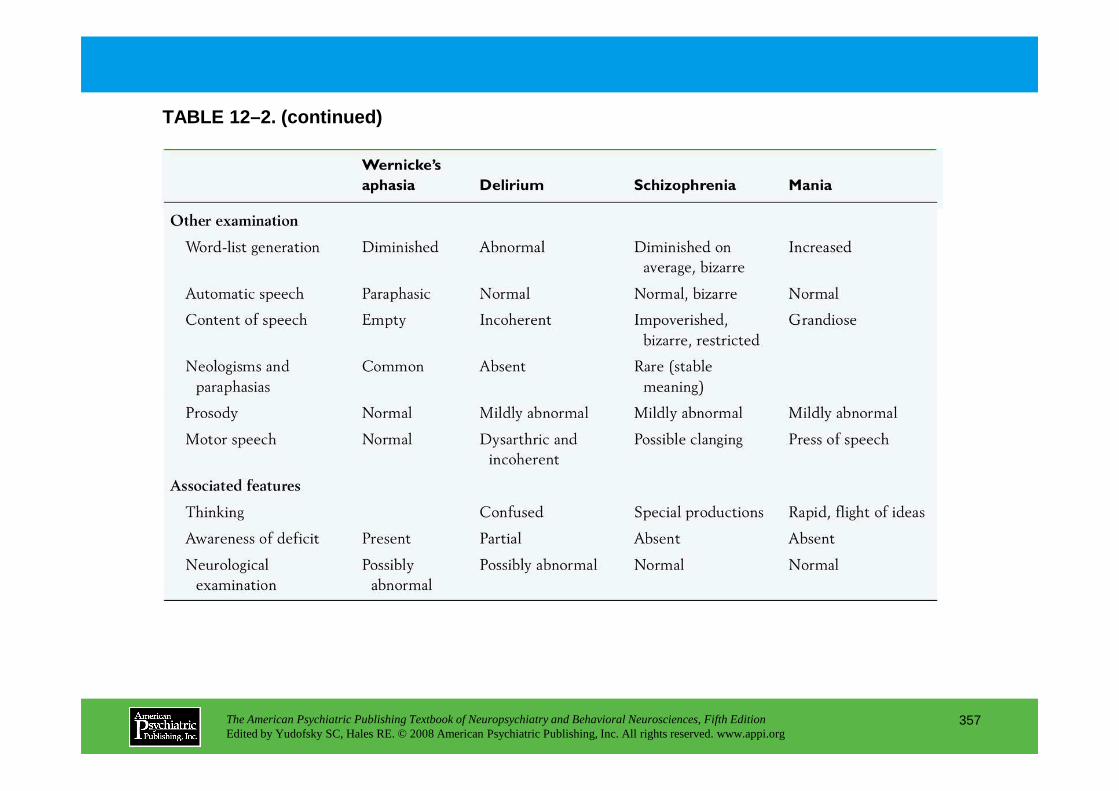
TABLE 12–2. (continued)
The American Psychiatric Publishing Textbook of Neuropsychiatry and Behavioral Neurosciences, Fifth EditionEdited by Yudofsky SC, Hales RE. © 2008 American Psychiatric Publishing, Inc. All rights reserved. www.appi.org
357
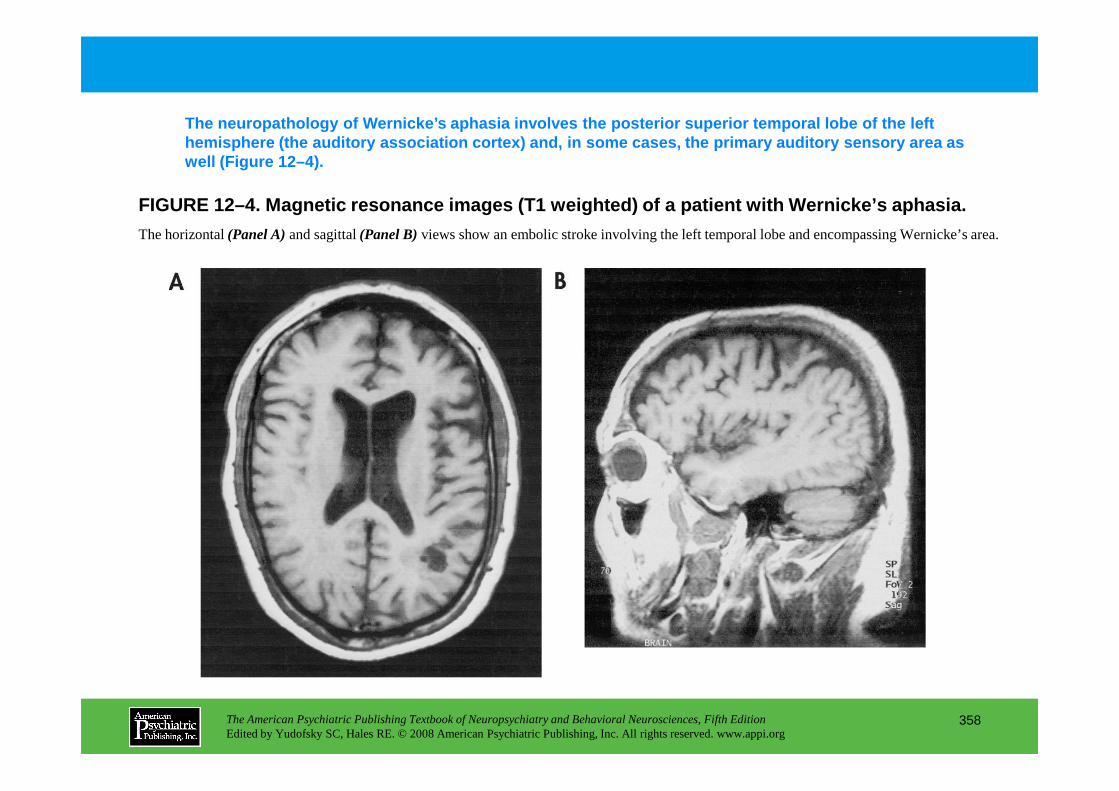
FIGURE 12–4. Magnetic resonance images (T1 weighted ) of a patient with Wernicke’s aphasia.
The neuropathology of Wernicke’s aphasia involves t he posterior superior temporal lobe of the left hemisphere (the auditory association cortex) and, i n some cases, the primary auditory sensory area as well (Figure 12–4).
The horizontal (Panel A)and sagittal (Panel B)views show an embolic stroke involving the left temporal lobe and encompassing Wernicke’s area.
The American Psychiatric Publishing Textbook of Neuropsychiatry and Behavioral Neurosciences, Fifth EditionEdited by Yudofsky SC, Hales RE. © 2008 American Psychiatric Publishing, Inc. All rights reserved. www.appi.org
358
Chapter 12 • Highlights for the Clinician
• The aphasias are disturbances of the brain’s use of symbols.
• In addition to language impairment, the aphasias can result in devastating neuropsychiatric manifestations.
• The different aphasic syndromes can be organized by the Wernicke-Geschwind model of language in the brain.
• These syndromes are characterized by the language examination, which assesses fluency, comprehension, naming, repetition, reading, and writing.
• The aphasias must be distinguished from the language manifestations of delirium, schizophrenia, and mania.
The American Psychiatric Publishing Textbook of Neuropsychiatry and Behavioral Neurosciences, Fifth EditionEdited by Yudofsky SC, Hales RE. © 2008 American Psychiatric Publishing, Inc. All rights reserved. www.appi.org
359
• The anterior aphasic syndrome is characterized by frustration, depression, and a possible catastrophic reaction.
• The posterior aphasic syndrome is characterized by unawareness and unconcern, paranoia with agitation, and impulsive behavior.
• The aphasias result in multiple additional cognitive and psychosocial issues, such as major alterations in lifestyle with significant social and occupational limitations.
• The aphasias include a range of considerations that affect prognosis and treatment.
CHAPTER 13
NEUROPSYCHIATRIC ASPECTS OF AGGRESSION AND IMPULSE-
CONTROL DISORDERS
Eric Hollander, M.D.Heather A. Berlin, Ph.D., M.P.H.
The American Psychiatric Publishing Textbook of Neuropsychiatry and Behavioral Neurosciences, Fifth EditionEdited by Yudofsky SC, Hales RE. © 2008 American Psychiatric Publishing, Inc. All rights reserved. www.appi.org
360
Slide Show
Topic headings and reading list
Tables and figures
Highlights for the clinician
Main menu
(About, Contents, Contributors, Publishing facts)
Epidemiology
Measurements of Impulsivity and AggressionSelf-Report Assessments
Buss-Durkee Hostility InventoryHostility and Direction of Hostility QuestionnaireSpielberger State-Trait Anger Expression InventoryBarratt Impulsiveness Scale, Version 11Massachusetts General Hospital Hairpulling ScaleGambling Symptom Assessment ScaleKleptomania Symptom Assessment Scale
Interview AssessmentsLife History Assessments: The Brown-Goodwin Assessment for Life History of AggressionPathological Gambling Modification of the Yale-
Neurobiology and NeuropsychiatryNeurological Structures Involved in Aggression
HypothalamusAmygdalaPrefrontal Cortex
Neuropharmacology of Impulsivity and AggressionDecreased Serotonin Function
Pharmacological Challenge StudiesGenetic StudiesEvidence for the Role of the Serotonin 1B Receptor in AggressionEndocrine StudiesNeuropsychiatric/Neuropsychological Studies of Impulsivity and
AggressionBorderline Personality Disorder
CHAPTER 13 • Topics and Readings
The American Psychiatric Publishing Textbook of Neuropsychiatry and Behavioral Neurosciences, Fifth EditionEdited by Yudofsky SC, Hales RE. © 2008 American Psychiatric Publishing, Inc. All rights reserved. www.appi.org
361
Pathological Gambling Modification of the Yale-Brown Obsessive Compulsive Scale
South Oaks Gambling Screen—Interview or Self-Report
Psychiatric Institute Trichotillomania ScaleDirect Laboratory Assessments of Aggression
Buss “Aggression Machine” ParadigmTaylor Competitive Reaction Time-TaskCherek Point Subtraction Aggression Paradigm
Direct Laboratory Assessments of Impulsivity
Borderline Personality DisorderAntisocial Personality DisorderImpulse-Control Disorders
Treatment of Impulsivity and AggressionPharmacotherapeutic InterventionsTreatment in Developmentally Disabled Persons
RECOMMENDED READINGSCoccaro E (ed): Aggression: Psychiatric Assessment and Treatment.
New York, Informa Healthcare, 2003Hollander E, Stein DJ (eds): Impulsivity and Aggression. Sussex,
UK, Wiley, 1995Hollander E, Stein DJ (eds): Clinical Manual of Impulse-Control
Disorders. Washington, DC, American Psychiatric Publishing, 2006
CHAPTER 13 • Tables and Figures
Figure 13–1. Factors contributing to aggression and impulsivity
Table 13–1. Studies of serotonin with aggression and impulsivity
Figure 13–2. Neurochemistry of aggression and impulsivity
Summary Highlights for the Clinician
The American Psychiatric Publishing Textbook of Neuropsychiatry and Behavioral Neurosciences, Fifth EditionEdited by Yudofsky SC, Hales RE. © 2008 American Psychiatric Publishing, Inc. All rights reserved. www.appi.org
362
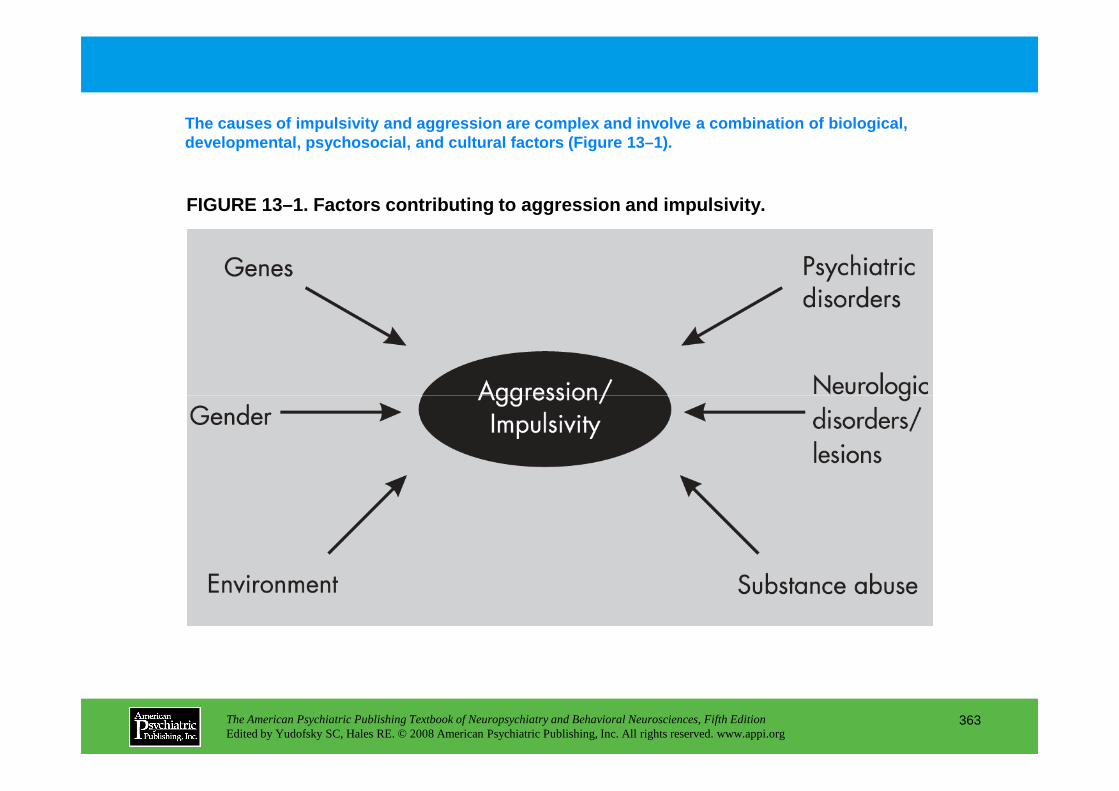
FIGURE 13–1. Factors contributing to aggression and impulsivity.
The causes of impulsivity and aggression are comple x and involve a combination of biological, developmental, psychosocial, and cultural factors ( Figure 13–1).
The American Psychiatric Publishing Textbook of Neuropsychiatry and Behavioral Neurosciences, Fifth EditionEdited by Yudofsky SC, Hales RE. © 2008 American Psychiatric Publishing, Inc. All rights reserved. www.appi.org
363
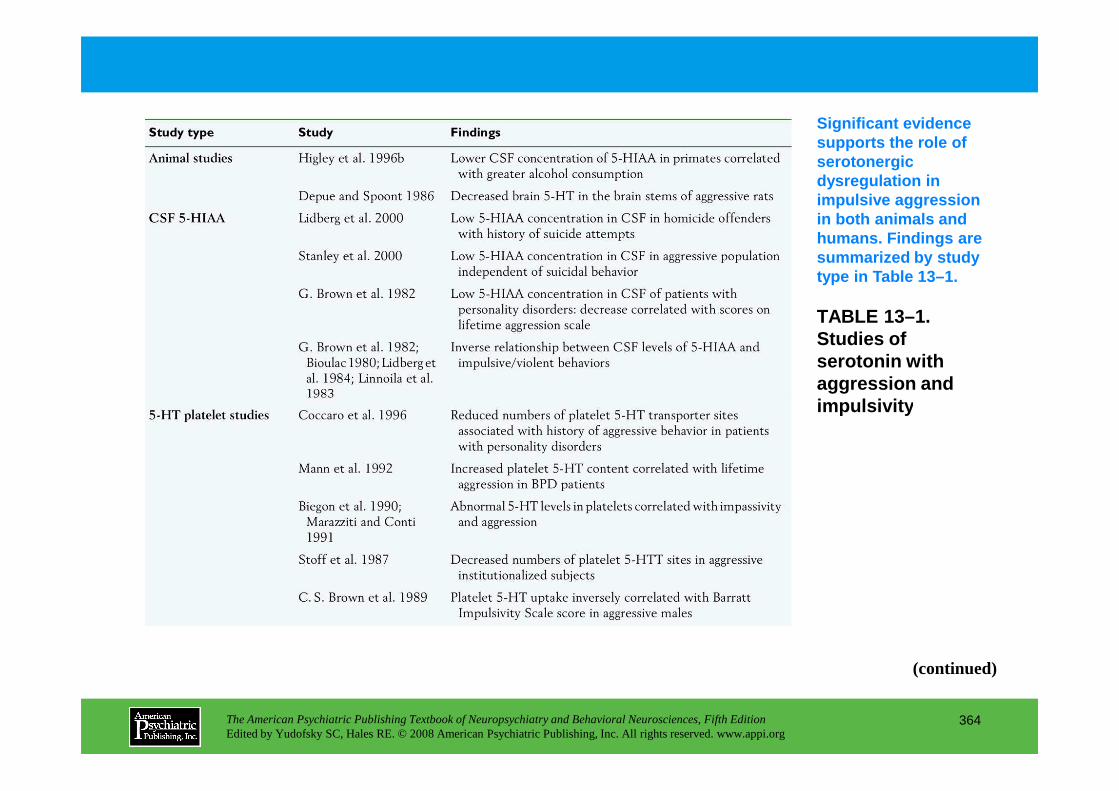
TABLE 13–1. Studies of serotonin with aggression and impulsivity
Significant evidence supports the role of serotonergic dysregulation in impulsive aggression in both animals and humans. Findings are summarized by study type in Table 13–1.
The American Psychiatric Publishing Textbook of Neuropsychiatry and Behavioral Neurosciences, Fifth EditionEdited by Yudofsky SC, Hales RE. © 2008 American Psychiatric Publishing, Inc. All rights reserved. www.appi.org
364
impulsivity
(continued)
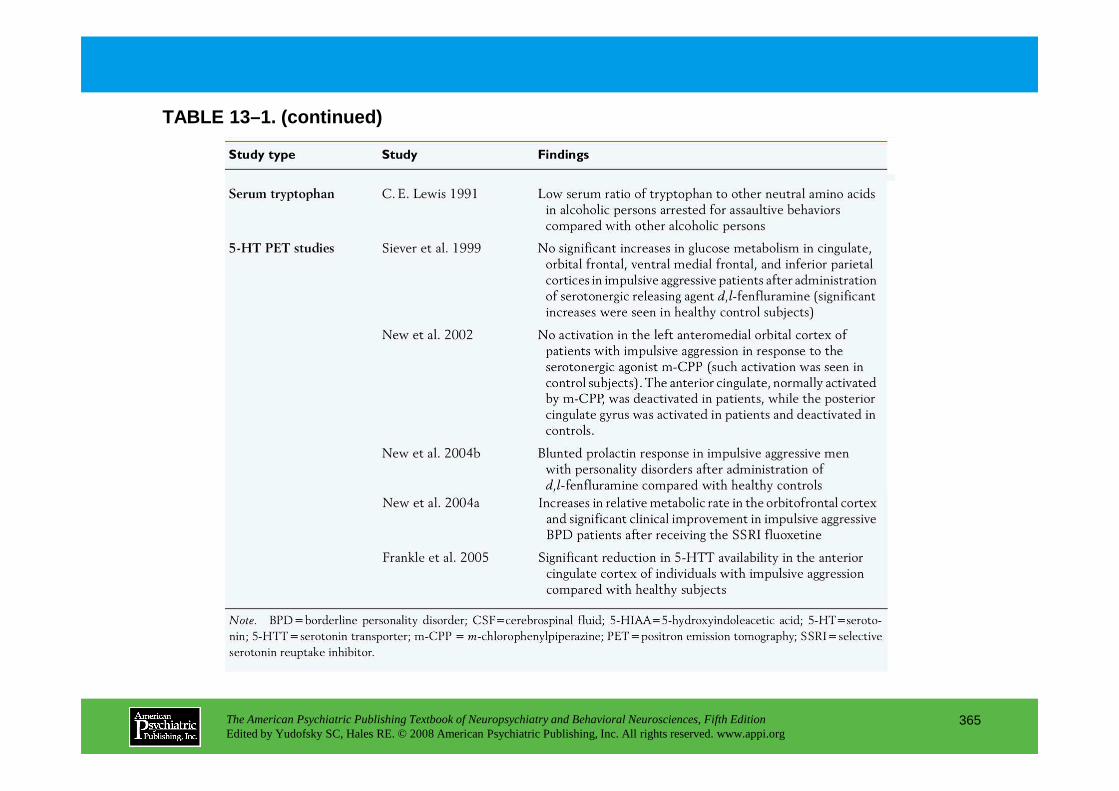
TABLE 13–1. (continued)
The American Psychiatric Publishing Textbook of Neuropsychiatry and Behavioral Neurosciences, Fifth EditionEdited by Yudofsky SC, Hales RE. © 2008 American Psychiatric Publishing, Inc. All rights reserved. www.appi.org
365
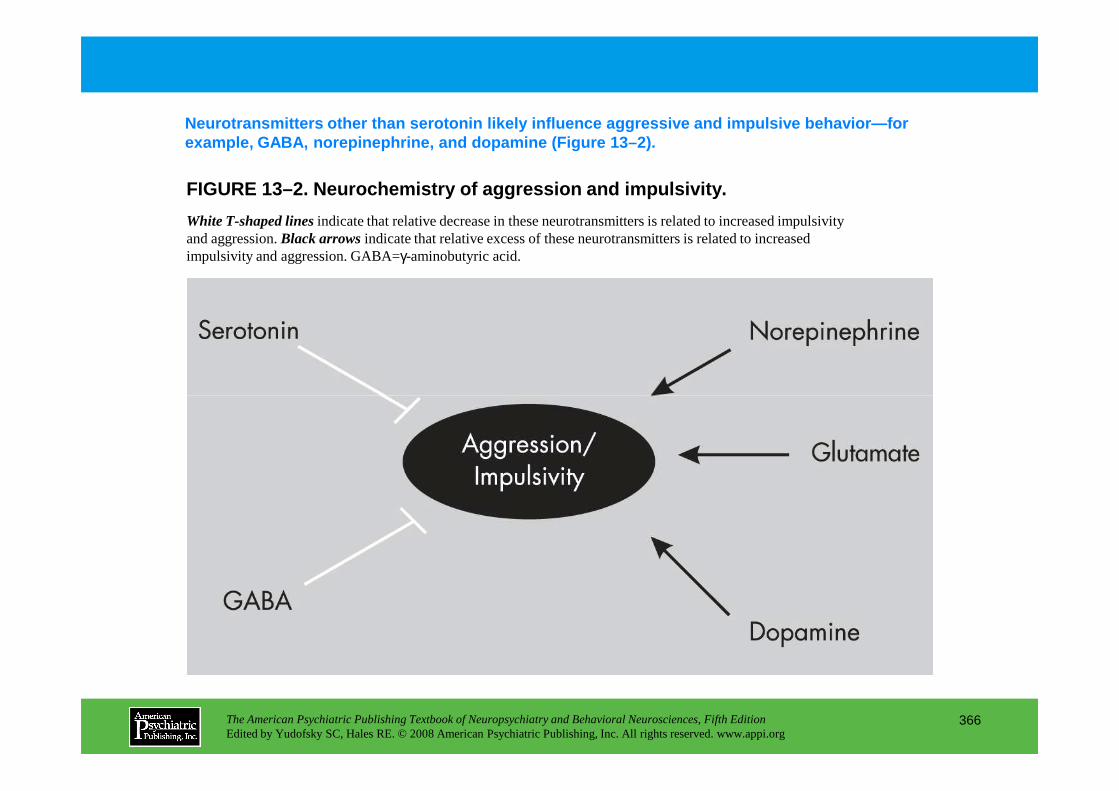
FIGURE 13–2. Neurochemistry of aggression and impul sivity.
Neurotransmitters other than serotonin likely influ ence aggressive and impulsive behavior—for example, GABA, norepinephrine, and dopamine (Figure 13–2).
White T-shaped linesindicate that relative decrease in these neurotransmitters is related to increased impulsivity and aggression. Black arrowsindicate that relative excess of these neurotransmitters is related to increased impulsivity and aggression. GABA=γ-aminobutyric acid.
The American Psychiatric Publishing Textbook of Neuropsychiatry and Behavioral Neurosciences, Fifth EditionEdited by Yudofsky SC, Hales RE. © 2008 American Psychiatric Publishing, Inc. All rights reserved. www.appi.org
366
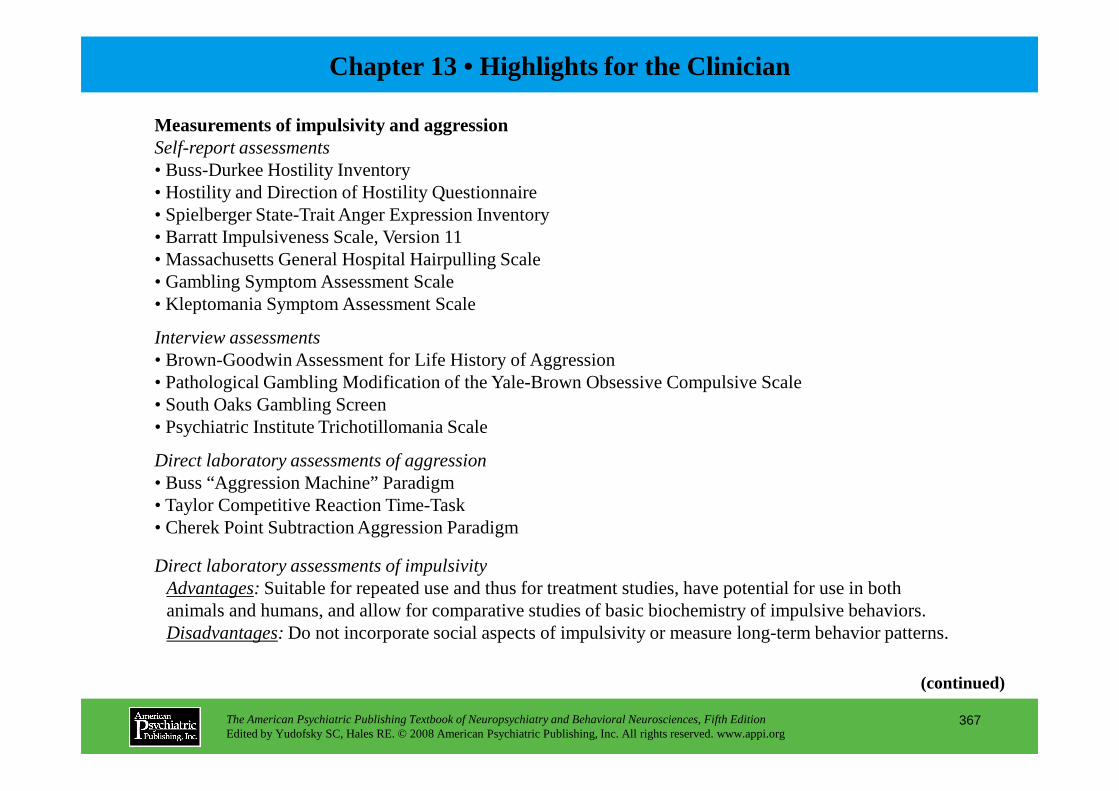
Chapter 13 • Highlights for the Clinician
Measurements of impulsivity and aggressionSelf-report assessments• Buss-Durkee Hostility Inventory• Hostility and Direction of Hostility Questionnaire• Spielberger State-Trait Anger Expression Inventory• Barratt Impulsiveness Scale, Version 11• Massachusetts General Hospital Hairpulling Scale• Gambling Symptom Assessment Scale• Kleptomania Symptom Assessment Scale
Interview assessments• Brown-Goodwin Assessment for Life History of Aggression• Pathological Gambling Modification of the Yale-Brown Obsessive Compulsive Scale• South Oaks Gambling Screen
The American Psychiatric Publishing Textbook of Neuropsychiatry and Behavioral Neurosciences, Fifth EditionEdited by Yudofsky SC, Hales RE. © 2008 American Psychiatric Publishing, Inc. All rights reserved. www.appi.org
367
• South Oaks Gambling Screen• Psychiatric Institute Trichotillomania Scale
Direct laboratory assessments of aggression• Buss “Aggression Machine” Paradigm• Taylor Competitive Reaction Time-Task• Cherek Point Subtraction Aggression Paradigm
Direct laboratory assessments of impulsivityAdvantages: Suitable for repeated use and thus for treatment studies, have potential for use in both animals and humans, and allow for comparative studies of basic biochemistry of impulsive behaviors.Disadvantages: Do not incorporate social aspects of impulsivity or measure long-term behavior patterns.
(continued)

• Three broad categories of behavioral laboratory paradigms have been used to measure impulsivity:1. Punishment and/or extinction paradigms (Matthys et al. 1998)2. Reward-choice paradigms (Ainslie 1975)3. Response disinhibition/attentional paradigms (Dougherty et al. 1999; Halperin et al. 1991).
• Commonly used laboratory tests: go/no-go task, Matching Familiar Figures Test
Neurobiology and neuropsychiatryNeurological structures involved in aggression• Hypothalamus• Amygdala• Prefrontal cortex
Neuropharmacology of impulsivity and aggression• Decreased serotonin function (see Table 13-1)
The American Psychiatric Publishing Textbook of Neuropsychiatry and Behavioral Neurosciences, Fifth EditionEdited by Yudofsky SC, Hales RE. © 2008 American Psychiatric Publishing, Inc. All rights reserved. www.appi.org
368
• Decreased serotonin function (see Table 13-1)
Pharmacological challenge studies• Studies confirm a role for serotonin in impulsivity and aggression.• In general, studies show that a blunted prolactin response to serotonin agonists is related to
aggressive/impulsive behavior.
Genetic studies• Genetic studies in humans and animals have not yet supported a definitive association among
impulsivity, aggression, and reduced serotonin activity, but there is evidence to suggest they are related.
(continued)
Evidence for the role of the 5-HT1B receptor in aggression• Animal studies suggest a role for the 5-HT1B receptors in modulating aggressive, impulsive, and
addiction behavior.• Genetic studies involving the 5-HT1B receptor gene in human subjects have been equivocal.
Endocrine studies• Animal studies show that testosterone levels of male rhesus monkeys correlate positively with
behavioral dominance and aggression.• Some researchers suggest that the androgen insensitivity syndrome and the androgenital syndrome are
examples of androgen excesses and deficiencies associated with aggressive and inhibited behavior, respectively.
Neuropsychiatric/neuropsychological studies of impulsivity and aggression• Because aggression and impulsivity appear to be core features of both borderline personality disorder
The American Psychiatric Publishing Textbook of Neuropsychiatry and Behavioral Neurosciences, Fifth EditionEdited by Yudofsky SC, Hales RE. © 2008 American Psychiatric Publishing, Inc. All rights reserved. www.appi.org
369
• Because aggression and impulsivity appear to be core features of both borderline personality disorder (BPD) and antisocial personality disorder (ASPD), much of the neuropsychiatric research in this area has focused on patients who meet criteria for these disorders.
• Researchers have suggested that impaired neuropsychiatric development could lead to personality pathology and that individuals with aggressive symptoms manifest subtle neuropsychiatric impairment.
• A number of lines of research (e.g., imaging, neuropsychological testing, neurological soft signs) are suggestive of biological disturbances, in particular those related to prefrontal cortex, that are associated with the impulsive and aggressive aspects of BPD and ASPD.
• Few studies have examined the neurobiological underpinnings of DSM-IV-TR impulse-control disorders (i.e., intermittent explosive disorder, kleptomania, pathological gambling, pyromania, and trichotillomania).
• Most of the studies of impulse-control disorders involve controlled pharmacotherapy studies for the treatment of impulsivity, which is discussed in the treatment section of this chapter. (continued)
Treatment of impulsivity and aggression• Controlled studies suggest that a number of medications may be useful in the treatment of impulsivity
and aggression.• Given the evidence for decreased serotonergic function in impulsive and aggressive behaviors, many
(but not all) of these medications involve direct serotonergic mechanisms. Selective serotonin reuptake inhibitors have been shown to reduce impulsive aggressive behaviors in impulsive or aggressive psychiatric disorders.
• Lithium has been found effective for impulsivity and aggression across different patient populations.• Researchers and clinicians have used lithium, carbamazepine, valproic acid, and, more recently,
gabapentin, lamotrigine, and topiramate to treat the impulsivity, aggression, and mood instability in patient populations.
• MAOIs have not been shown to decrease the behavioral dyscontrol or impulsivity seen in BPD. Further, in BPD patients, overdosing on psychotropic agents is a common form of suicide, and MAOIs are
The American Psychiatric Publishing Textbook of Neuropsychiatry and Behavioral Neurosciences, Fifth EditionEdited by Yudofsky SC, Hales RE. © 2008 American Psychiatric Publishing, Inc. All rights reserved. www.appi.org
370
in BPD patients, overdosing on psychotropic agents is a common form of suicide, and MAOIs are clearly dangerous in these situations.
• Although they are clearly effective for depressive symptoms, tricyclic antidepressants have not been shown to be particularly helpful in decreasing aggression and impulsivity in BPD. Further, the potential for worsening impulsive, aggressive symptoms and the danger of overdose in patients who have impaired self-control may limit the use of tricyclic antidepressants.
• Neuroleptics are among the most studied medications for treatment of BPD, and they have been effective in treating violence associated with psychosis. However, neuroleptics are often chronically misused as sedatives and may not be well tolerated. Despite the efficacy of these agents, clinicians should keep in mind that neuroleptics may result in a number of adverse side effects.
• Mood stabilizers/anticonvulsants such as valproate (divalproex), carbamazepine, topiramate, gabapentin, and lamotrigine have been effective in treating impulsivity and aggression in patient populations, in particular BPD patients. (continued)

Treatment in the developmentally disabled• Autistic disorder and mental retardation are often associated with impulsive outbursts, emotional lability,
rage episodes, and aggression toward self and others.• Various treatments have been shown to be effective in treating aggressive and impulsive symptoms
(included self-harm) in these populations. These treatments include fluoxetine, lithium, β-blockers (which also bind to 5-HT1-like receptors, such as propranolol), carbamazepine, divalproex sodium (valproate), risperidone, and buspirone (a 5-HT1A agonist).
• Eltoprazine, a phenylpiperazine derivative and mixed 5-HT1 agonist, has shown antiaggressive properties in animal models.
• Eltoprazine-like compounds may be used in future treatment strategies and as a probe to further study the basis of impulsivity and aggression.
The American Psychiatric Publishing Textbook of Neuropsychiatry and Behavioral Neurosciences, Fifth EditionEdited by Yudofsky SC, Hales RE. © 2008 American Psychiatric Publishing, Inc. All rights reserved. www.appi.org
371
CHAPTER 14
NEUROPSYCHIATRIC ASPECTS OF MEMORY AND AMNESIA
Yaakov Stern, Ph.D.Harold A. Sackeim, Ph.D.
The American Psychiatric Publishing Textbook of Neuropsychiatry and Behavioral Neurosciences, Fifth EditionEdited by Yudofsky SC, Hales RE. © 2008 American Psychiatric Publishing, Inc. All rights reserved. www.appi.org
372
Slide Show
Topic headings and reading list
Tables and figures
Highlights for the clinician
Main menu
(About, Contents, Contributors, Publishing facts)
Memory SystemsDeclarative MemoryNondeclarative Memory
Procedural MemorySimple Conditioning and Simple Associative LearningPriming
Working MemoryMemory Consolidation
System Versus Process ConceptsCoordination of Memory Systems
AmnesiaLesions of the Medial Regions of the Temporal LobesWernicke-Korsakoff Syndrome
SchizophreniaDissociative Amnesia
Differential DiagnosisMalingering
Normal Aging
Metamemory: Subjective Evaluation of Memory
Effects of Somatic Treatments on Learning and Memor yPsychotropic AgentsElectroconvulsive Therapy and Other Brain Stimulation Treatments
RECOMMENDED READINGSBudson AE, Price BH: Memory dysfunction. N Engl J Med
CHAPTER 14 • Topics and Readings
The American Psychiatric Publishing Textbook of Neuropsychiatry and Behavioral Neurosciences, Fifth EditionEdited by Yudofsky SC, Hales RE. © 2008 American Psychiatric Publishing, Inc. All rights reserved. www.appi.org
373
Wernicke-Korsakoff SyndromeFrontal Lobe Lesions and the Role of the Frontal Lobes in MemoryAlzheimer’s Disease
Psychiatric Disorders and Normal AgingMood Disorders
Automatic and Effortful ProcessingMood-Congruence EffectsImpact of Episodic FrequencyAnatomical Correlates
Budson AE, Price BH: Memory dysfunction. N Engl J Med 352:692–699, 2005
Tulving E, Craik F (eds): The Oxford Handbook of Memory. New York, Oxford University Press, 2000
CHAPTER 14 • Tables and Figures
Figure 14–1. An outline of the components of memory
Table 14–1. DSM-IV-TR criteria for amnestic disorder
Table 14–2. DSM-IV-TR criteria for dissociative amnesia
Figure 14–2. Scores on the Squire Subjective Memory Questionnaire in depressed patients treated with electroconvulsive therapy (ECT)
Summary Highlights for the Clinician
The American Psychiatric Publishing Textbook of Neuropsychiatry and Behavioral Neurosciences, Fifth EditionEdited by Yudofsky SC, Hales RE. © 2008 American Psychiatric Publishing, Inc. All rights reserved. www.appi.org
374

FIGURE 14–1. An outline of the components of memory .
Since the 1990s, several related lines of research have demonstrated that memory is not a unitary entity and have outlined the nature of diff erent memory “systems.” The various systems are summarized in Figure 14–1.
Source.Adapted from Squire 1992.
The American Psychiatric Publishing Textbook of Neuropsychiatry and Behavioral Neurosciences, Fifth EditionEdited by Yudofsky SC, Hales RE. © 2008 American Psychiatric Publishing, Inc. All rights reserved. www.appi.org
375

TABLE 14–1. DSM-IV-TR criteria for amnestic disorder
Amnesia is the generic term for severe memory deficit, regardless of cause. Table 14–1 summarizes the DSM-IV-TR criteria for amnesia.
The American Psychiatric Publishing Textbook of Neuropsychiatry and Behavioral Neurosciences, Fifth EditionEdited by Yudofsky SC, Hales RE. © 2008 American Psychiatric Publishing, Inc. All rights reserved. www.appi.org
376
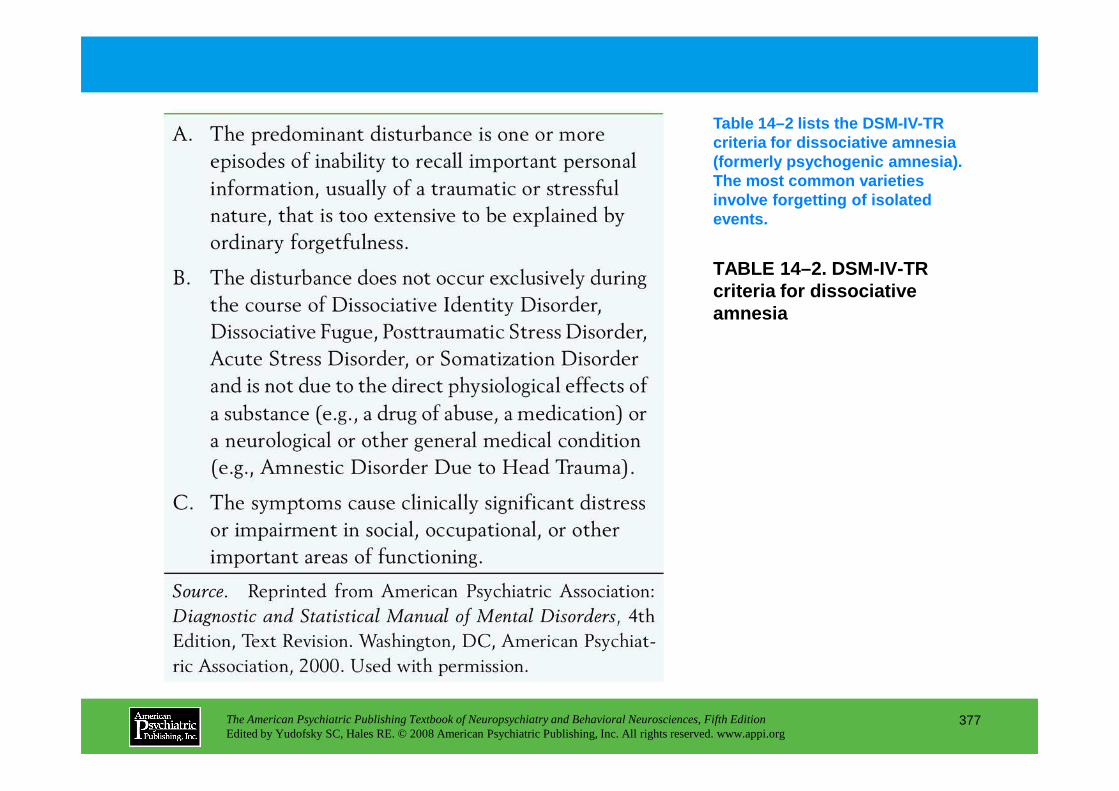
TABLE 14–2. DSM-IV-TR criteria for dissociative amnesia
Table 14–2 lists the DSM-IV-TR criteria for dissociative amnesia (formerly psychogenic amnesia). The most common varieties involve forgetting of isolated events.
The American Psychiatric Publishing Textbook of Neuropsychiatry and Behavioral Neurosciences, Fifth EditionEdited by Yudofsky SC, Hales RE. © 2008 American Psychiatric Publishing, Inc. All rights reserved. www.appi.org
377
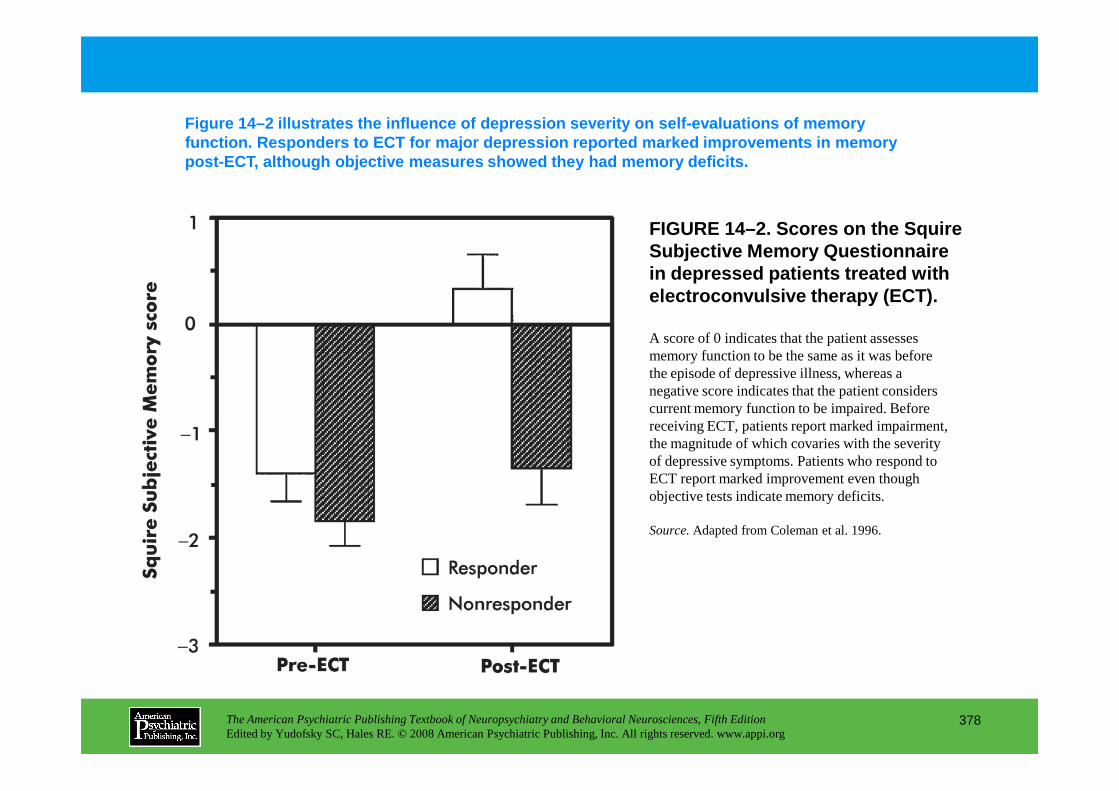
FIGURE 14–2. Scores on the Squire Subjective Memory Questionnaire in depressed patients treated with electroconvulsive therapy (ECT).
Figure 14–2 illustrates the influence of depression severity on self-evaluations of memory function. Responders to ECT for major depression re ported marked improvements in memory post-ECT, although objective measures showed they h ad memory deficits.
A score of 0 indicates that the patient assesses memory function to be the same as it was before the episode of depressive illness, whereas a negative score indicates that the patient considers
The American Psychiatric Publishing Textbook of Neuropsychiatry and Behavioral Neurosciences, Fifth EditionEdited by Yudofsky SC, Hales RE. © 2008 American Psychiatric Publishing, Inc. All rights reserved. www.appi.org
378
negative score indicates that the patient considers current memory function to be impaired. Before receiving ECT, patients report marked impairment, the magnitude of which covaries with the severity of depressive symptoms. Patients who respond to ECT report marked improvement even though objective tests indicate memory deficits.
Source.Adapted from Coleman et al. 1996.
Chapter 14 • Highlights for the Clinician
• Memory is not a unitary entity. A set of “systems” has been outlined that encompasses different aspects of memory. Most memory researchers make an initial separation of memory into two categories: a) declarative (the type of memory assessed by traditional recall and recognition tests) and b) nondeclarative (including conditioning, priming, and procedural memory).
• Amnesia is the generic term for severe memory deficit. Four clinical characteristics are typical of most amnesic patients: anterograde amnesia, retrograde amnesia, confabulation, and intact intellectual function.
• Normal aging is accompanied by characteristic decrements in memory performance. However, the decline in memory with aging is selective, affecting some cognitive processes more than others. Alzheimer's disease is the most common dementia. Its hallmark, and typically earliest
The American Psychiatric Publishing Textbook of Neuropsychiatry and Behavioral Neurosciences, Fifth EditionEdited by Yudofsky SC, Hales RE. © 2008 American Psychiatric Publishing, Inc. All rights reserved. www.appi.org
379
others. Alzheimer's disease is the most common dementia. Its hallmark, and typically earliest symptom, is amnesia.
• The major psychiatric disorders—schizophrenia, mania, and major depression—almost invariably compromise aspects of attention and concentration. Because the ability to focus and sustain attention is central to the acquisition of new information in general and declarative memory in particular, deficits in acquiring new information are common among patients with these disorders.
• Psychotropic agents and ECT can have specific effects on memory.

CHAPTER 15
NEUROPSYCHIATRIC ASPECTS OF TRAUMATIC BRAIN INJURY
Jonathan M. Silver, M.D.Robert E. Hales, M.D., M.B.A.
Stuart C. Yudofsky, M.D.
The American Psychiatric Publishing Textbook of Neuropsychiatry and Behavioral Neurosciences, Fifth EditionEdited by Yudofsky SC, Hales RE. © 2008 American Psychiatric Publishing, Inc. All rights reserved. www.appi.org
380
Slide Show
Topic headings and reading list
Tables and figures
Highlights for the clinician
Main menu
(About, Contents, Contributors, Publishing facts)
Epidemiology
Neuroanatomy and Pathophysiology of TBINeuroanatomyPathophysiologyNeurotransmitter Changes After TBI
CatecholaminesSerotoninAcetylcholine
Neuropsychiatric Assessment of TBIHistory-TakingDocumentation and Rating of SymptomsLaboratory Evaluation
Imaging Techniques
Sleep DisordersMild Traumatic Brain Injury and Postconcussion SyndromeAggressionPhysical Problems
ColdnessOther Somatic Problems
Therapeutic StrategiesPsychopharmacological TreatmentAffective Illness
DepressionGuidelines for using antidepressants for patients with TBISide effects
Mania
CHAPTER 15 • Topics and Readings
The American Psychiatric Publishing Textbook of Neuropsychiatry and Behavioral Neurosciences, Fifth EditionEdited by Yudofsky SC, Hales RE. © 2008 American Psychiatric Publishing, Inc. All rights reserved. www.appi.org
381
Imaging TechniquesElectrophysiological TechniquesNeuropsychological Testing
Clinical FeaturesPersonality ChangesIntellectual ChangesPsychiatric DisordersAffective Changes
Prevalence of Depression After TBIMania After Traumatic Brain Injury
DeliriumPsychotic DisordersPosttraumatic EpilepsyAnxiety Disorders
ManiaLability of Mood and AffectCognitive Function and Arousal
Dextroamphetamine and MethylphenidateSinemet and BromocriptineAmantadineTricyclic AntidepressantsSide Effects of Medications for Impaired Concentration and Arousal
Problems With Processing Multiple StimuliFatigueCognition
Cholinesterase InhibitorsPsychosisSleep
(continued)
CHAPTER 15 • Topics and Readings (continued)
Aggression and AgitationChronic Aggression
Antipsychotic medicationsAntianxiety medicationsAnticonvulsive medicationsAntimanic medicationsAntidepressantsStimulantsAntihypertensive medications: beta-blockers
Acute Aggression and AgitationAntipsychotic drugsSedatives and hypnotics
Concerns Regarding Pharmacotherapy
Behavioral and Cognitive Treatments
The American Psychiatric Publishing Textbook of Neuropsychiatry and Behavioral Neurosciences, Fifth EditionEdited by Yudofsky SC, Hales RE. © 2008 American Psychiatric Publishing, Inc. All rights reserved. www.appi.org
382
Behavioral and Cognitive Treatments
Psychological and Social Interventions
PreventionMotor Vehicle AccidentsPrevention of Brain Injury in Children
Conclusion
RECOMMENDED READINGSilver JM, McAllister TW, Yudofsky SC (eds):
Textbook of Traumatic Brain Injury. Washington, DC, American Psychiatric Publishing, 2005
CHAPTER 15 • Tables and Figures
Table 15–1. Mechanisms of neuronal damage in traumatic brain injury
Table 15–2. Assessment of traumatic brain injury
Table 15–3. Glasgow Coma Scale
Figure 15-1. The Galveston Orientation and Amnesia Test (GOAT)
Figure 15–2. The Overt Aggression Scale (OAS)
Table 15–4. Rancho Los Amigos Cognitive Scale
Table 15–5. Definition of mild traumatic brain injury
Table 15–6. Major factors affecting neuropsychological test findings
Table 15–7. Factors influencing outcome after brain injury
The American Psychiatric Publishing Textbook of Neuropsychiatry and Behavioral Neurosciences, Fifth EditionEdited by Yudofsky SC, Hales RE. © 2008 American Psychiatric Publishing, Inc. All rights reserved. www.appi.org
383
Table 15–7. Factors influencing outcome after brain injury
Table 15–8. DSM-IV-TR diagnostic criteria for personality change due to traumatic brain injury
Table 15–9. Aspects of executive functions potentially impaired after traumatic brain injury
Table 15–10. Causes of delirium in patients with traumatic brain injury
Table 15–11. Postconcussion syndrome
Figure 15–3. Factors associated with agitation in brain injury
Table 15–12. Clinical use of propranolol
Table 15–13. Pharmacotherapy of agitation
Summary Highlights for the Clinician

TABLE 15–1. Mechanisms of neuronal damage in traumatic brain injury
The patient who sustains brain injury from trauma may incur damage through several mechanisms, which are listed in Table 15–1.
The American Psychiatric Publishing Textbook of Neuropsychiatry and Behavioral Neurosciences, Fifth EditionEdited by Yudofsky SC, Hales RE. © 2008 American Psychiatric Publishing, Inc. All rights reserved. www.appi.org
384
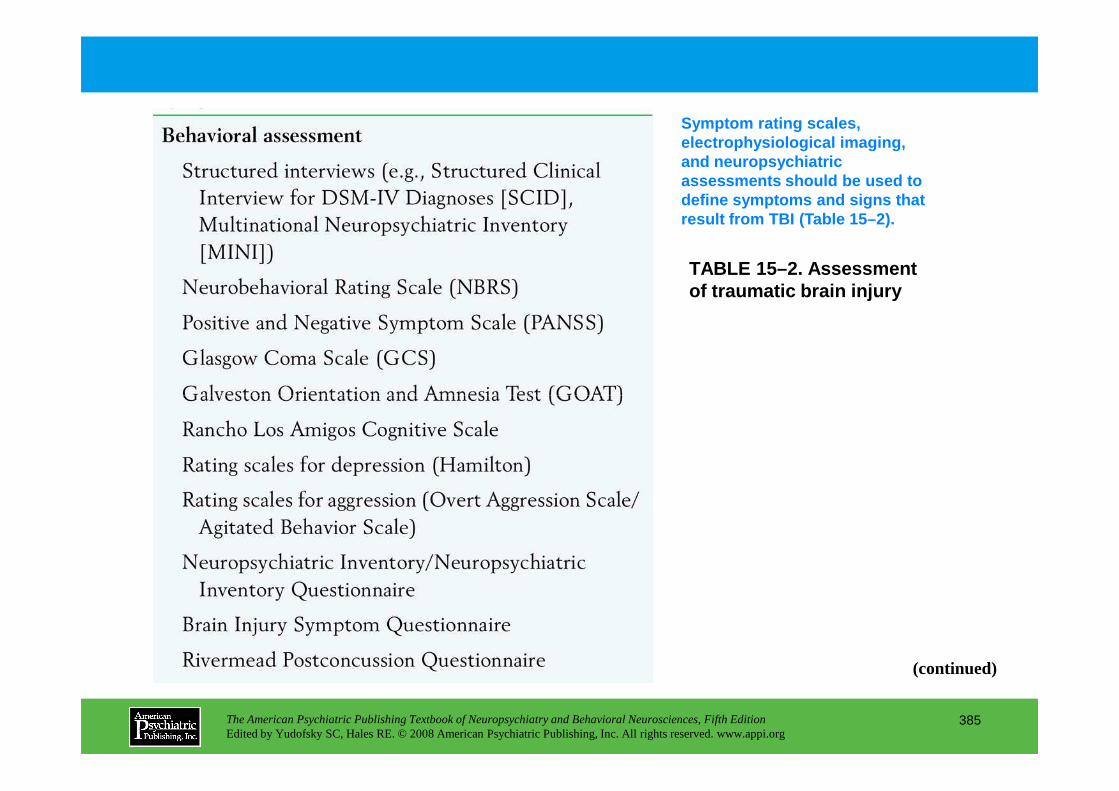
TABLE 15–2. Assessment of traumatic brain injury
Symptom rating scales, electrophysiological imaging, and neuropsychiatric assessments should be used to define symptoms and signs that result from TBI (Table 15–2).
The American Psychiatric Publishing Textbook of Neuropsychiatry and Behavioral Neurosciences, Fifth EditionEdited by Yudofsky SC, Hales RE. © 2008 American Psychiatric Publishing, Inc. All rights reserved. www.appi.org
385
(continued)
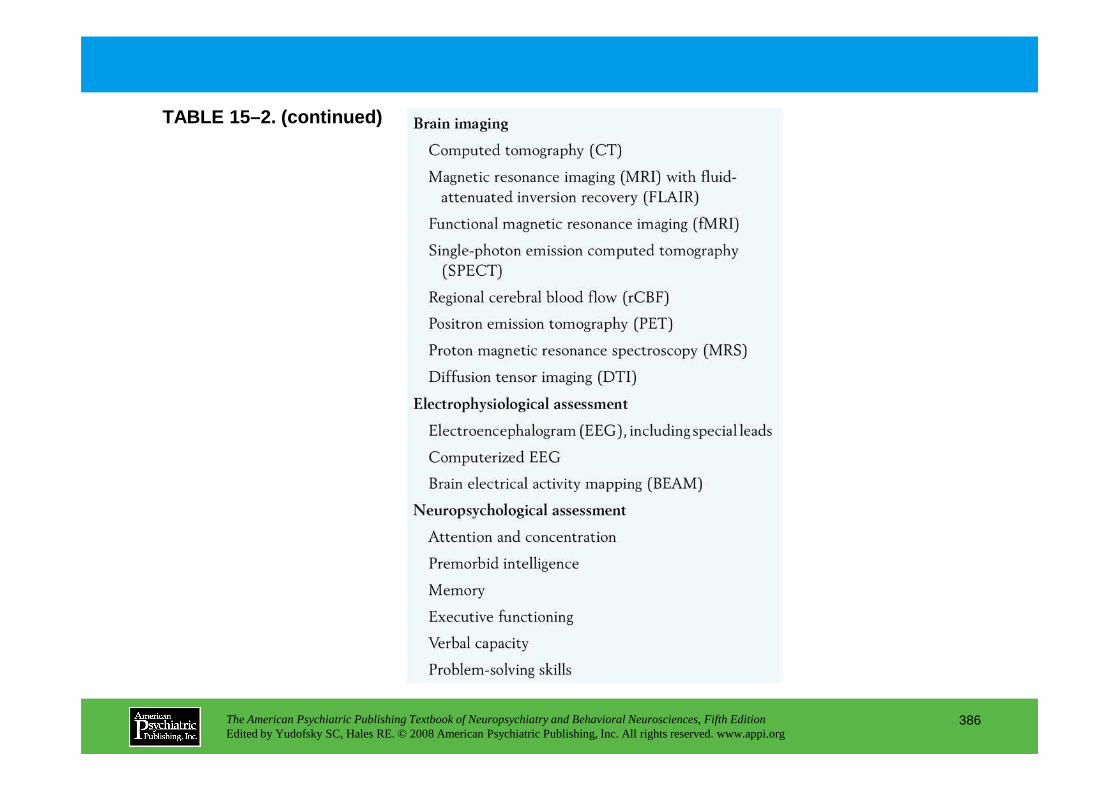
TABLE 15–2. (continued)
The American Psychiatric Publishing Textbook of Neuropsychiatry and Behavioral Neurosciences, Fifth EditionEdited by Yudofsky SC, Hales RE. © 2008 American Psychiatric Publishing, Inc. All rights reserved. www.appi.org
386
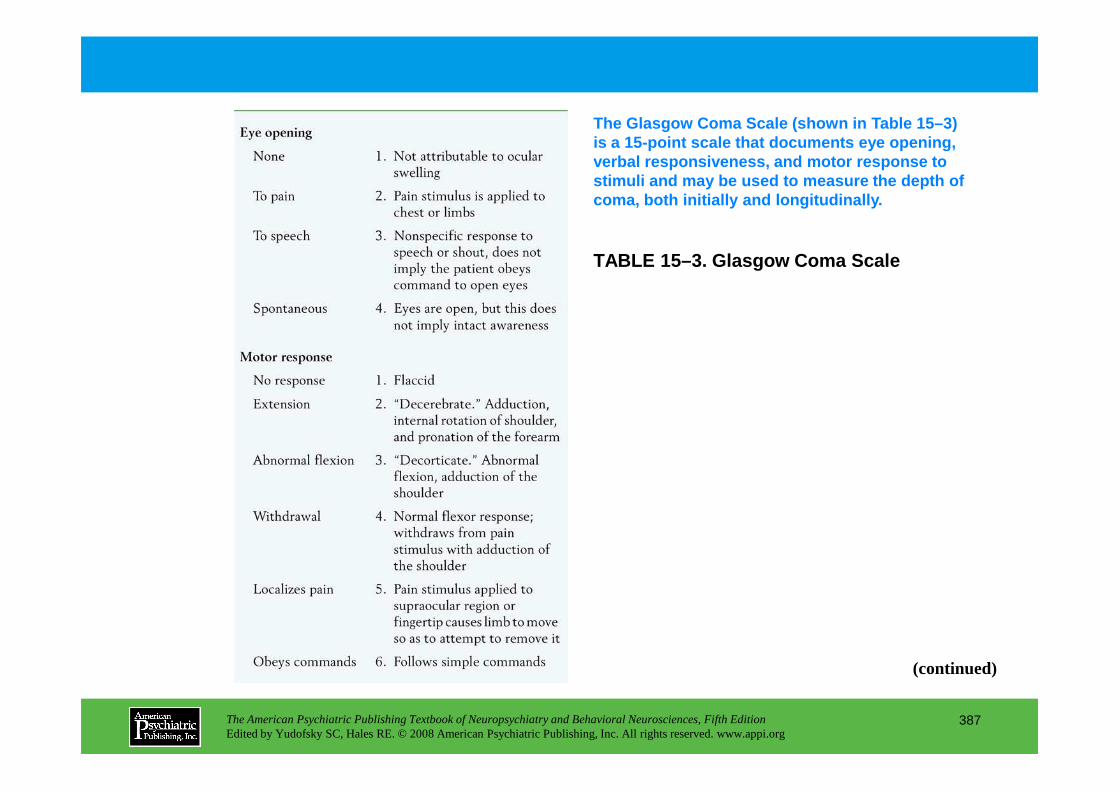
TABLE 15–3. Glasgow Coma Scale
The Glasgow Coma Scale (shown in Table 15–3) is a 15-point scale that documents eye opening, verbal responsiveness, and motor response to stimuli and may be used to measure the depth of coma, both initially and longitudinally.
The American Psychiatric Publishing Textbook of Neuropsychiatry and Behavioral Neurosciences, Fifth EditionEdited by Yudofsky SC, Hales RE. © 2008 American Psychiatric Publishing, Inc. All rights reserved. www.appi.org
387
(continued)
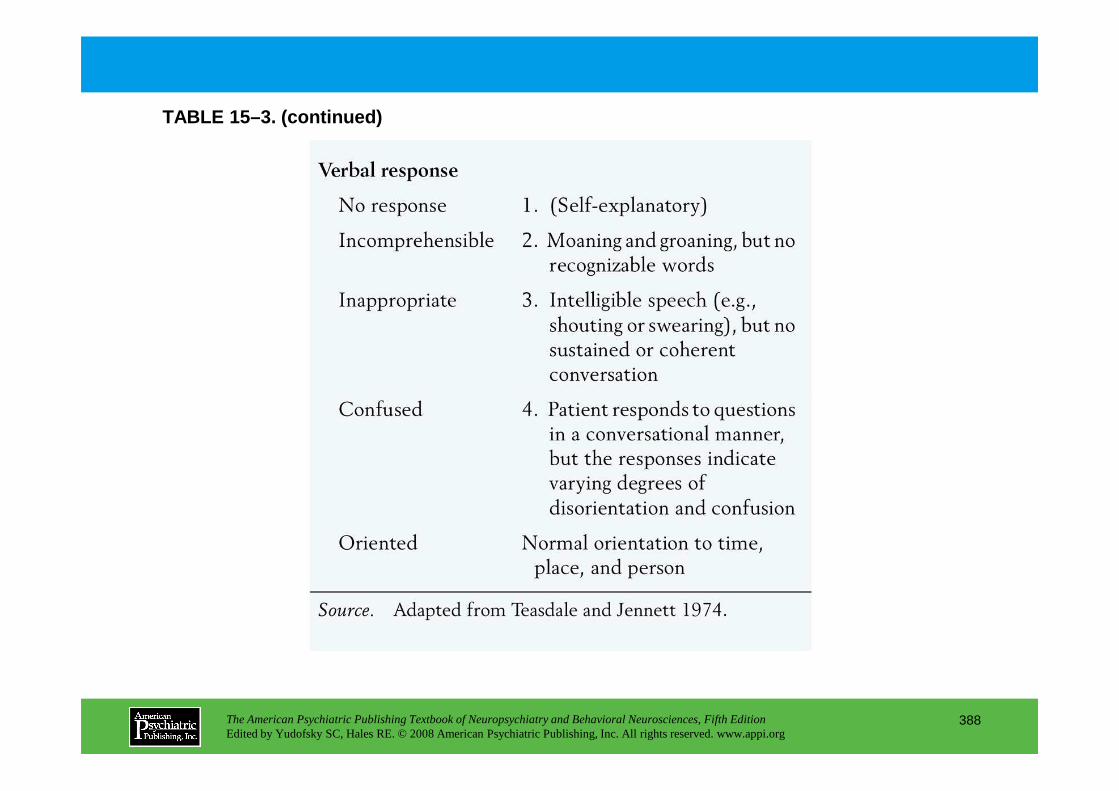
TABLE 15–3. (continued)
The American Psychiatric Publishing Textbook of Neuropsychiatry and Behavioral Neurosciences, Fifth EditionEdited by Yudofsky SC, Hales RE. © 2008 American Psychiatric Publishing, Inc. All rights reserved. www.appi.org
388

FIGURE 15–1. The Galveston Orientation and Amnesia Test (GOAT).
The Galveston Orientation and Amnesia Test (GOAT) measures the extent of posttraumatic amnesia and can be used serially to document recovery of memory (Figure 15–1).
Source.Reprinted from Levin HS,
The American Psychiatric Publishing Textbook of Neuropsychiatry and Behavioral Neurosciences, Fifth EditionEdited by Yudofsky SC, Hales RE. © 2008 American Psychiatric Publishing, Inc. All rights reserved. www.appi.org
389
Source.Reprinted from Levin HS, O’Donnell VM, Grossman RG: “The Galveston Orientation and Amnesia Test: A Practical Scale to Assess Cognition After Head Injury.” Journal of Nervous and Mental Disease167:675–684, 1979. Used with permission.

FIGURE 15–2. The Overt Aggression Scale (OAS).
The Overt Aggression Scale (Figure 15–2), along with measures of agitation, can be used to document the frequency and severity of the aggressive outbursts and agitated behaviors that are so commonly associated with brain injury.
Source.Reprinted from Yudofsky SC,
The American Psychiatric Publishing Textbook of Neuropsychiatry and Behavioral Neurosciences, Fifth EditionEdited by Yudofsky SC, Hales RE. © 2008 American Psychiatric Publishing, Inc. All rights reserved. www.appi.org
390
Source.Reprinted from Yudofsky SC, Silver JM, Jackson W, et al.: “The Overt Aggression Scale for the Objective Rating of Verbal and Physical Aggression.” American Journal of Psychiatry143:35–39, 1986. Used with permission.

TABLE 15–4. Rancho Los Amigos Cognitive Scale
Overall cognitive and behavioral recovery may be documented by using the Rancho Los Amigos Cognitive Scale (Table 15–4).
The American Psychiatric Publishing Textbook of Neuropsychiatry and Behavioral Neurosciences, Fifth EditionEdited by Yudofsky SC, Hales RE. © 2008 American Psychiatric Publishing, Inc. All rights reserved. www.appi.org
391
(continued)

TABLE 15–4. (continued)
The American Psychiatric Publishing Textbook of Neuropsychiatry and Behavioral Neurosciences, Fifth EditionEdited by Yudofsky SC, Hales RE. © 2008 American Psychiatric Publishing, Inc. All rights reserved. www.appi.org
392

TABLE 15–5. Definition of mild traumatic brain injury
Operationalized diagnostic criteria for mild traumatic brain injury have been proposed (Table 15–5).
The American Psychiatric Publishing Textbook of Neuropsychiatry and Behavioral Neurosciences, Fifth EditionEdited by Yudofsky SC, Hales RE. © 2008 American Psychiatric Publishing, Inc. All rights reserved. www.appi.org
393
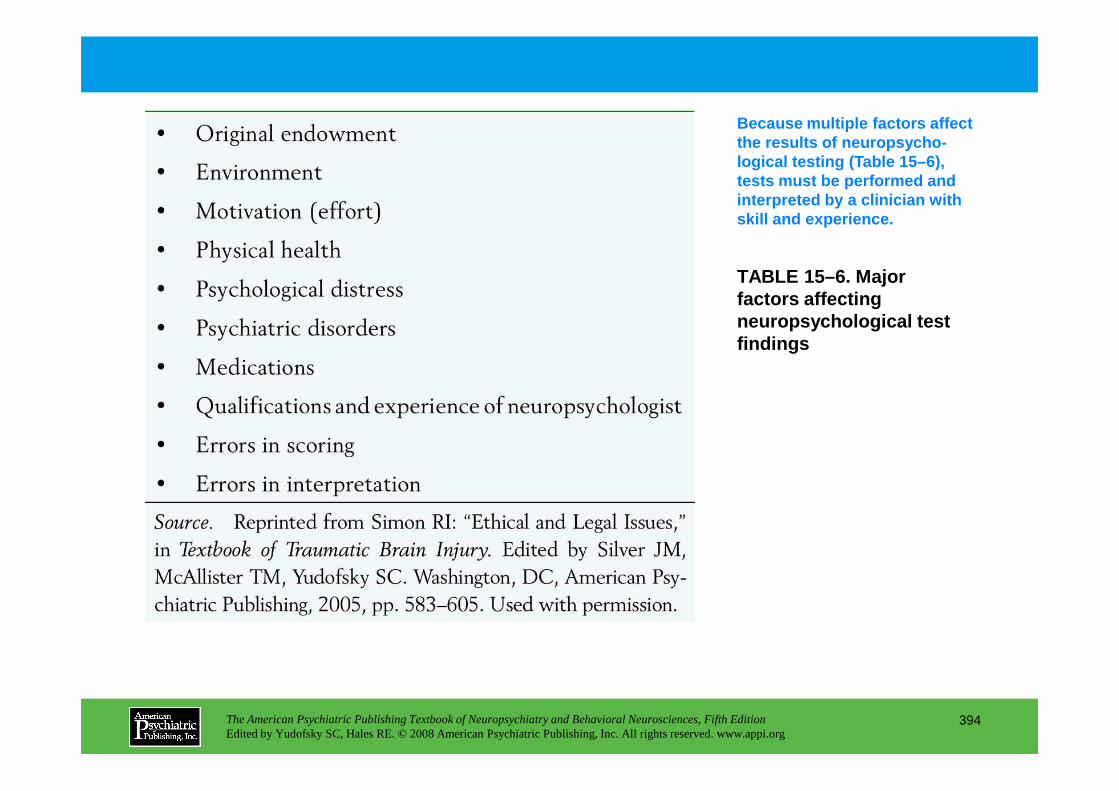
TABLE 15–6. Major factors affecting neuropsychological test findings
Because multiple factors affect the results of neuropsycho-logical testing (Table 15–6), tests must be performed and interpreted by a clinician with skill and experience.
The American Psychiatric Publishing Textbook of Neuropsychiatry and Behavioral Neurosciences, Fifth EditionEdited by Yudofsky SC, Hales RE. © 2008 American Psychiatric Publishing, Inc. All rights reserved. www.appi.org
394
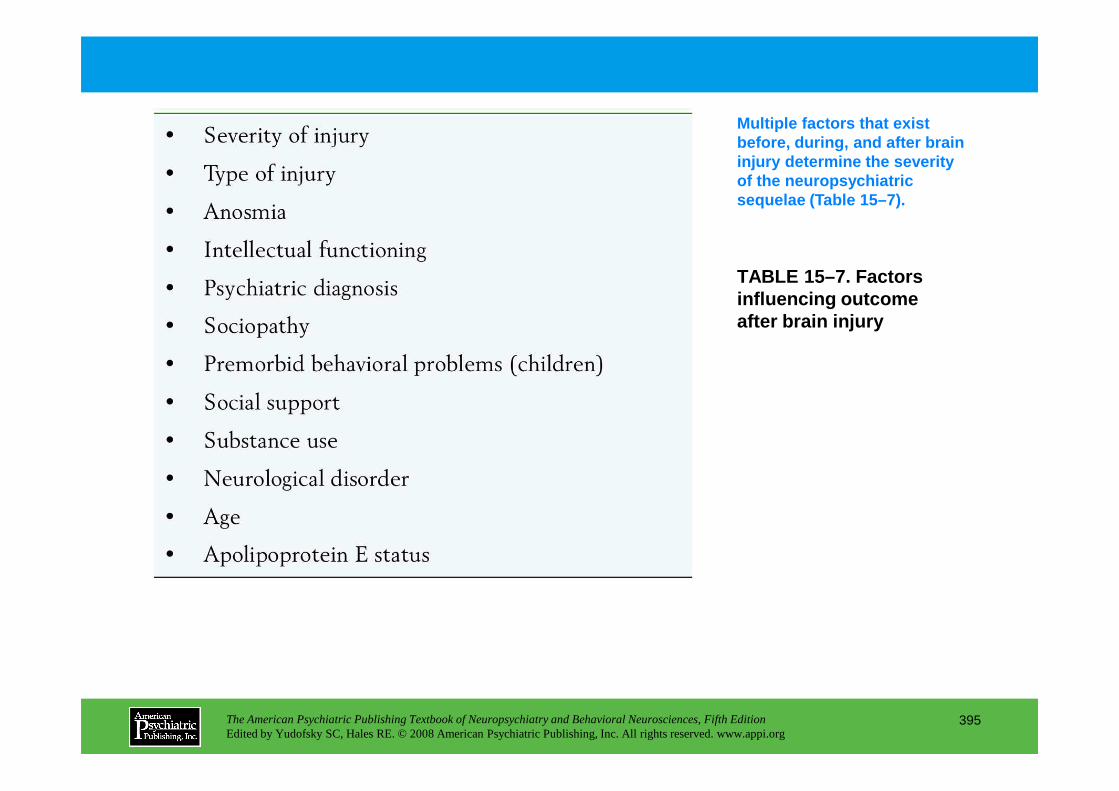
TABLE 15–7. Factors influencing outcome after brain injury
Multiple factors that exist before, during, and after brain injury determine the severity of the neuropsychiatric sequelae (Table 15–7).
The American Psychiatric Publishing Textbook of Neuropsychiatry and Behavioral Neurosciences, Fifth EditionEdited by Yudofsky SC, Hales RE. © 2008 American Psychiatric Publishing, Inc. All rights reserved. www.appi.org
395
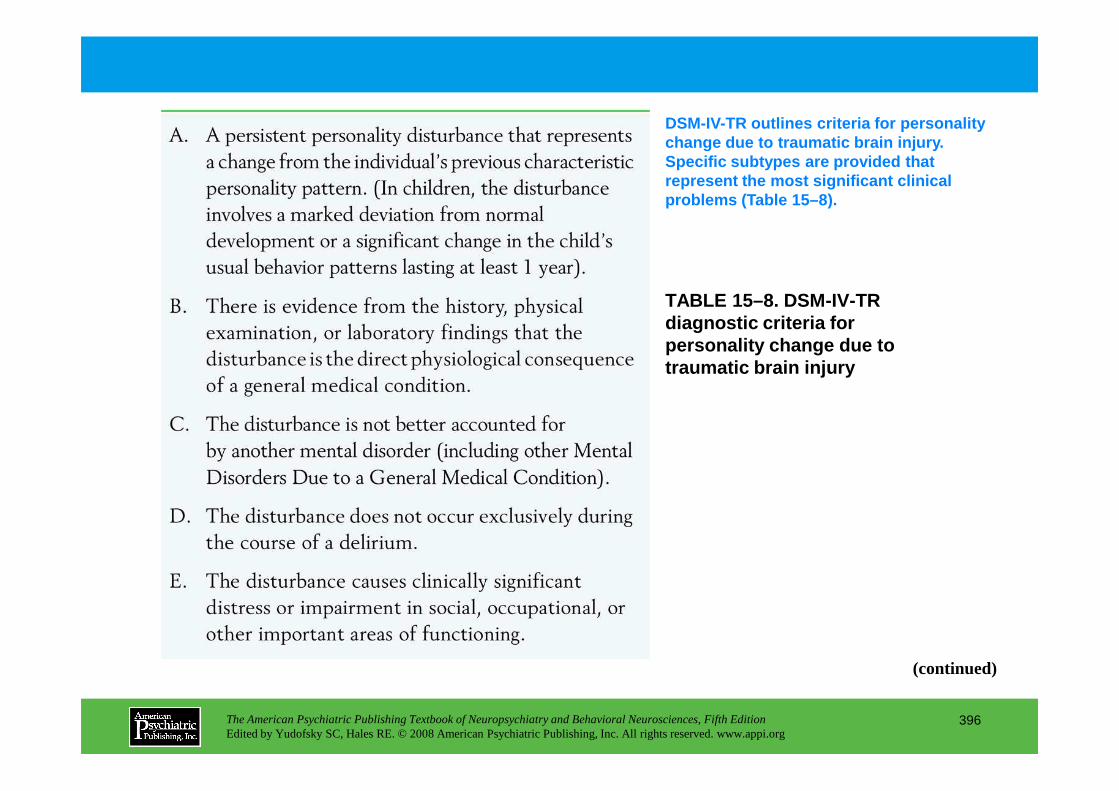
TABLE 15–8. DSM-IV-TR diagnostic criteria for personality change due to traumatic brain injury
DSM-IV-TR outlines criteria for personality change due to traumatic brain injury. Specific subtypes are provided that represent the most significant clinical problems (Table 15–8).
The American Psychiatric Publishing Textbook of Neuropsychiatry and Behavioral Neurosciences, Fifth EditionEdited by Yudofsky SC, Hales RE. © 2008 American Psychiatric Publishing, Inc. All rights reserved. www.appi.org
396
(continued)

TABLE 15–8. (continued)
The American Psychiatric Publishing Textbook of Neuropsychiatry and Behavioral Neurosciences, Fifth EditionEdited by Yudofsky SC, Hales RE. © 2008 American Psychiatric Publishing, Inc. All rights reserved. www.appi.org
397
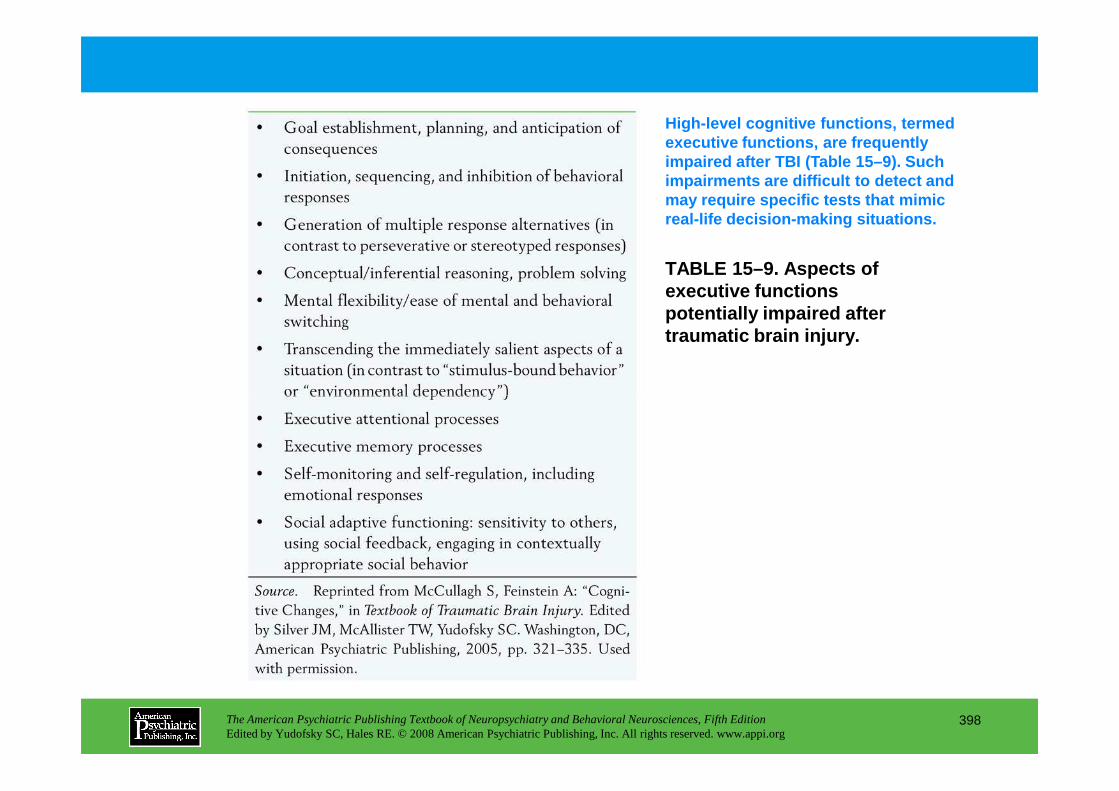
TABLE 15–9. Aspects of executive functions potentially impaired after traumatic brain injury.
High-level cognitive functions, termed executive functions, are frequently impaired after TBI (Table 15–9). Such impairments are difficult to detect and may require specific tests that mimic real-life decision-making situations.
The American Psychiatric Publishing Textbook of Neuropsychiatry and Behavioral Neurosciences, Fifth EditionEdited by Yudofsky SC, Hales RE. © 2008 American Psychiatric Publishing, Inc. All rights reserved. www.appi.org
398

TABLE 15–10. Causes of delirium in patients with traumatic brain injury
Delirium following TBI most often results from effects of the injury on brain tissue chemistry, but there may be other causes—for example, medication side effects or alcohol withdrawal. Table 15–10 lists common factors that can result in posttraumatic delirium.
The American Psychiatric Publishing Textbook of Neuropsychiatry and Behavioral Neurosciences, Fifth EditionEdited by Yudofsky SC, Hales RE. © 2008 American Psychiatric Publishing, Inc. All rights reserved. www.appi.org
399
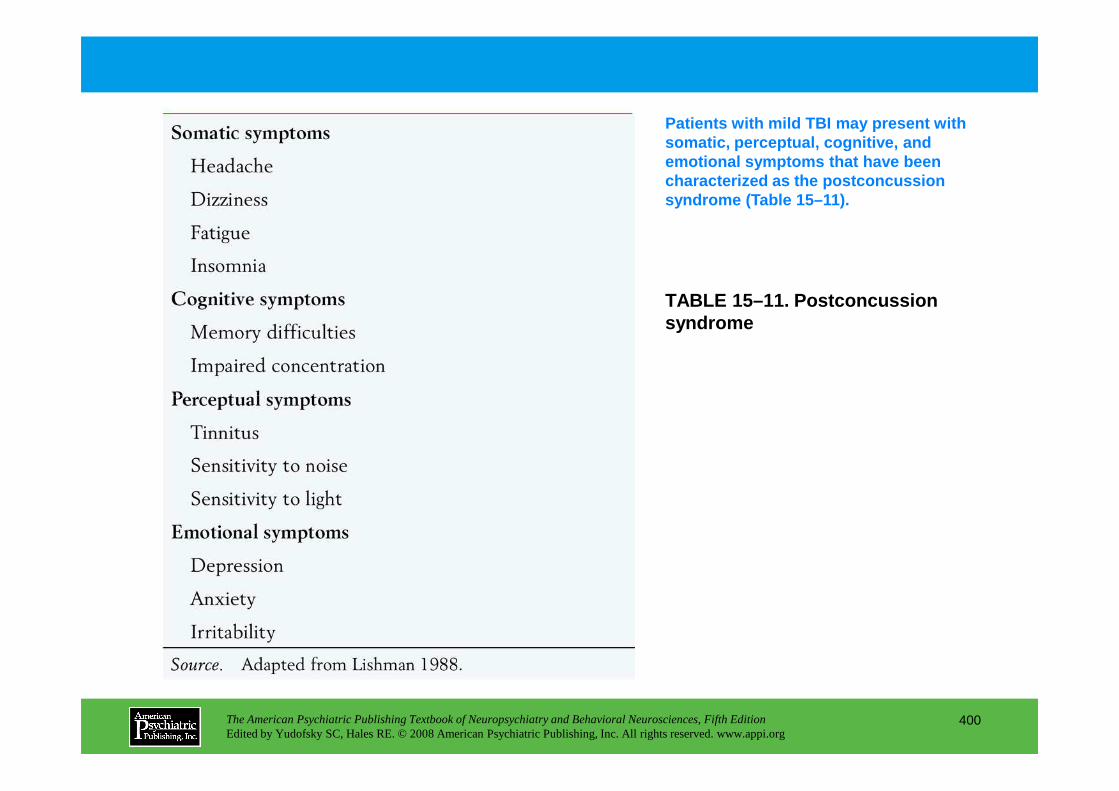
TABLE 15–11. Postconcussion syndrome
Patients with mild TBI may present with somatic, perceptual, cognitive, and emotional symptoms that have been characterized as the postconcussion syndrome (Table 15–11).
The American Psychiatric Publishing Textbook of Neuropsychiatry and Behavioral Neurosciences, Fifth EditionEdited by Yudofsky SC, Hales RE. © 2008 American Psychiatric Publishing, Inc. All rights reserved. www.appi.org
400
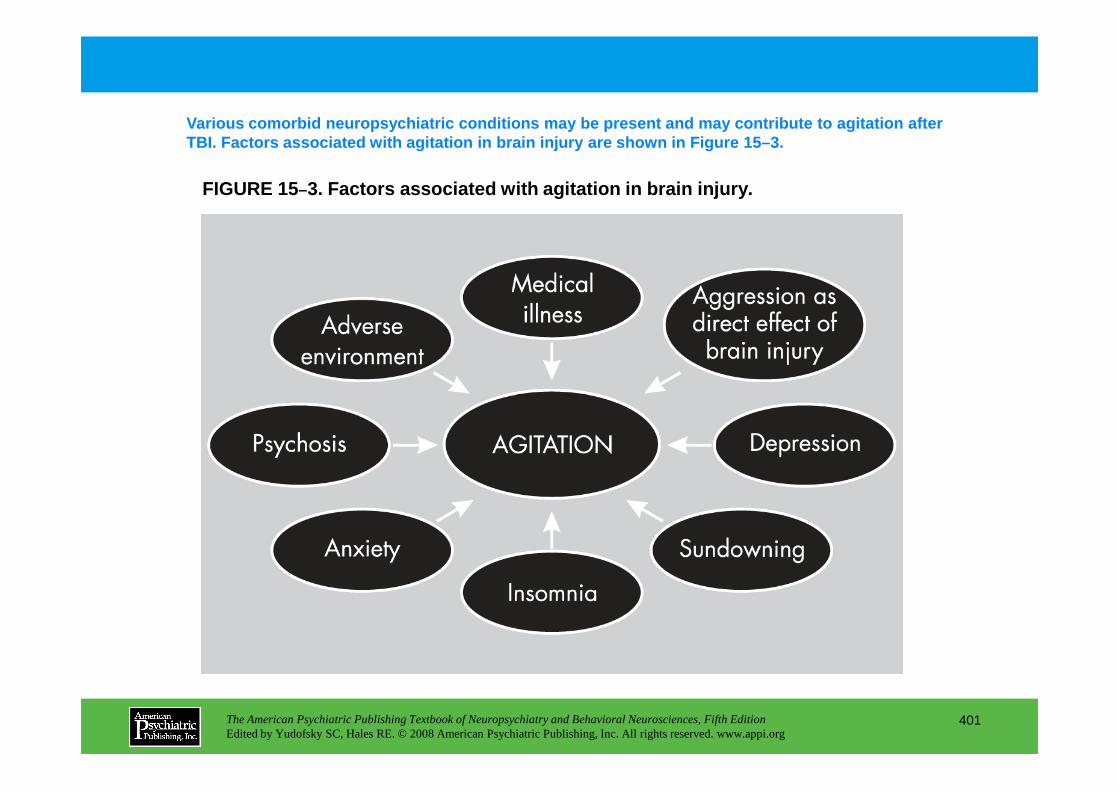
FIGURE 15–3. Factors associated with agitation in brain injur y.
Various comorbid neuropsychiatric conditions may be present and may contribute to agitation after TBI. Factors associated with agitation in brain inj ury are shown in Figure 15–3.
The American Psychiatric Publishing Textbook of Neuropsychiatry and Behavioral Neurosciences, Fifth EditionEdited by Yudofsky SC, Hales RE. © 2008 American Psychiatric Publishing, Inc. All rights reserved. www.appi.org
401
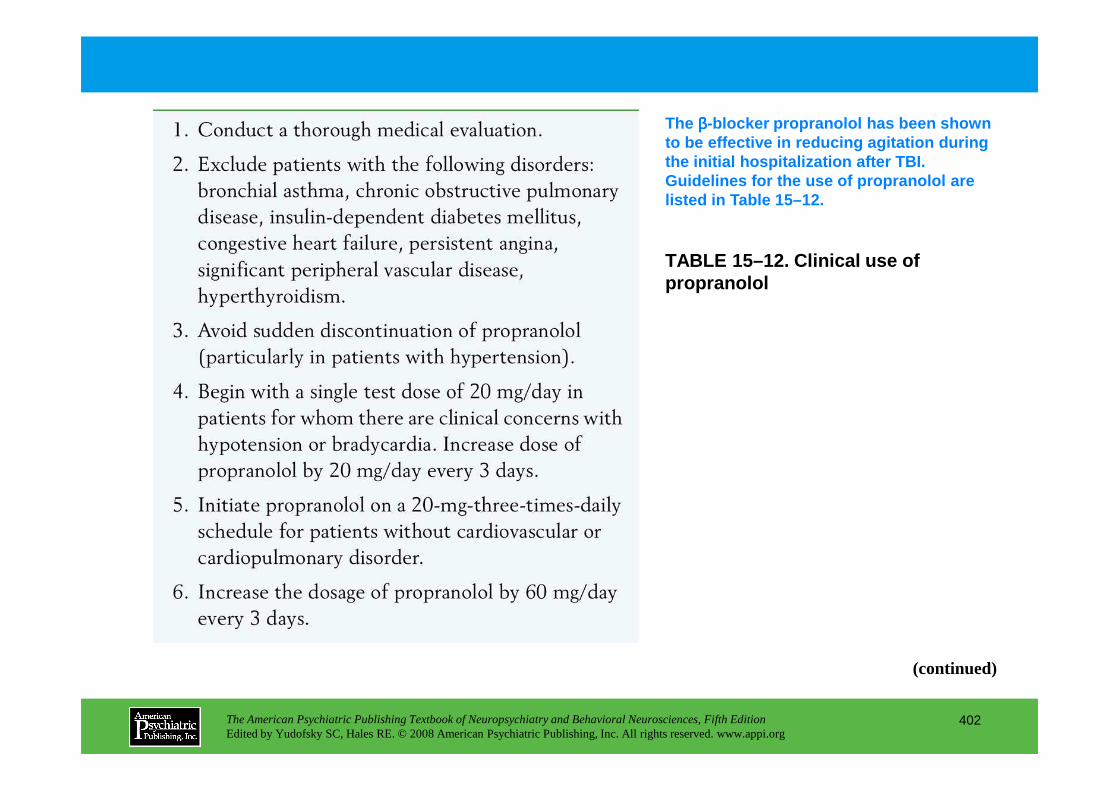
TABLE 15–12. Clinical use of propranolol
The ββββ-blocker propranolol has been shown to be effective in reducing agitation during the initial hospitalization after TBI. Guidelines for the use of propranolol are listed in Table 15–12.
The American Psychiatric Publishing Textbook of Neuropsychiatry and Behavioral Neurosciences, Fifth EditionEdited by Yudofsky SC, Hales RE. © 2008 American Psychiatric Publishing, Inc. All rights reserved. www.appi.org
402
(continued)
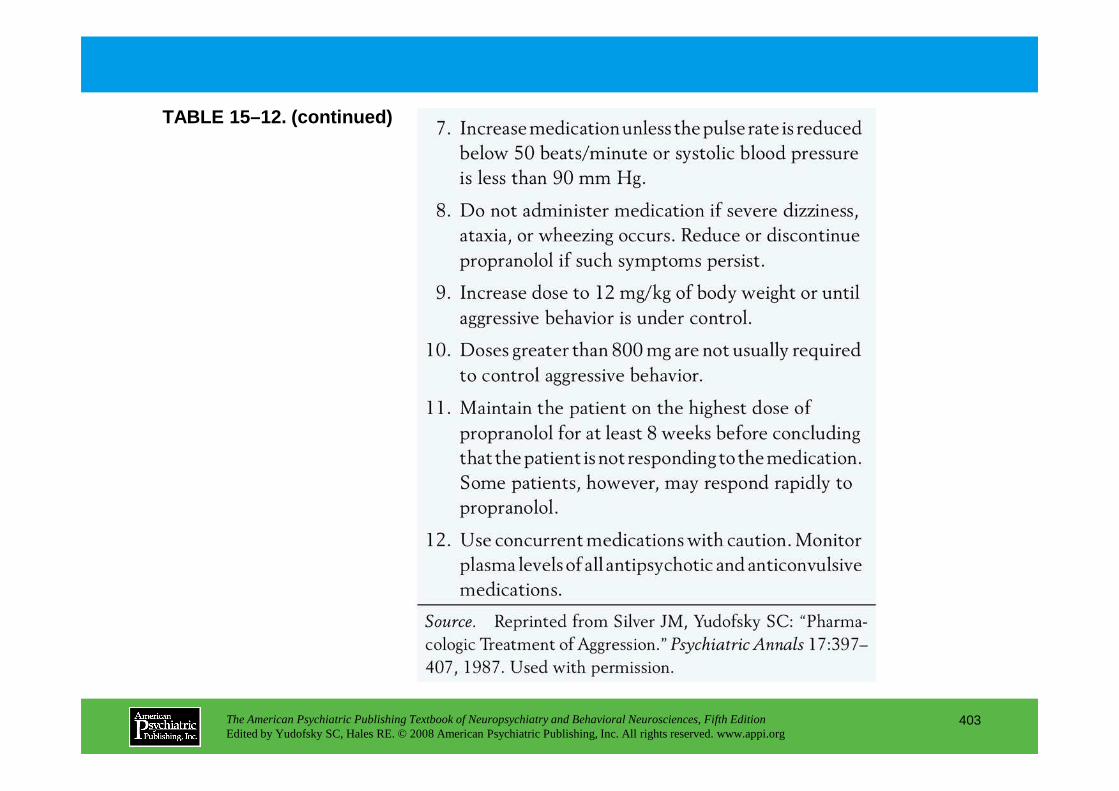
TABLE 15–12. (continued)
The American Psychiatric Publishing Textbook of Neuropsychiatry and Behavioral Neurosciences, Fifth EditionEdited by Yudofsky SC, Hales RE. © 2008 American Psychiatric Publishing, Inc. All rights reserved. www.appi.org
403
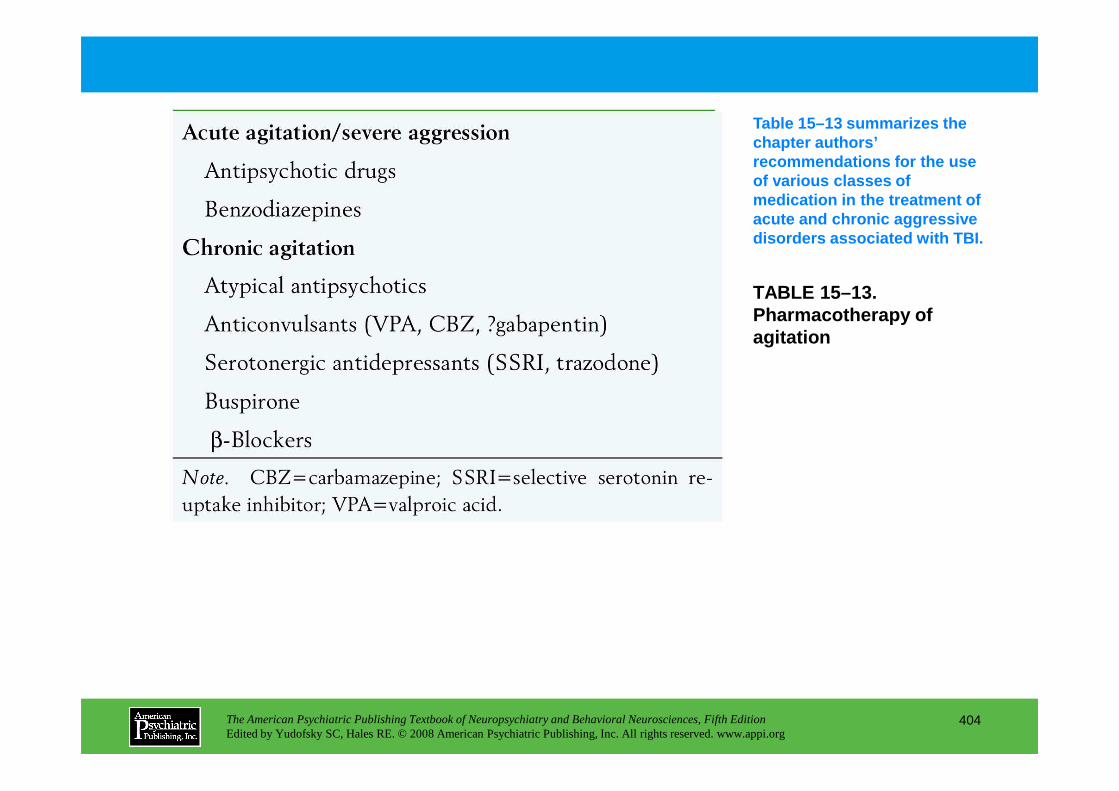
TABLE 15–13. Pharmacotherapy of agitation
Table 15–13 summarizes the chapter authors’ recommendations for the use of various classes of medication in the treatment of acute and chronic aggressive disorders associated with TBI.
The American Psychiatric Publishing Textbook of Neuropsychiatry and Behavioral Neurosciences, Fifth EditionEdited by Yudofsky SC, Hales RE. © 2008 American Psychiatric Publishing, Inc. All rights reserved. www.appi.org
404
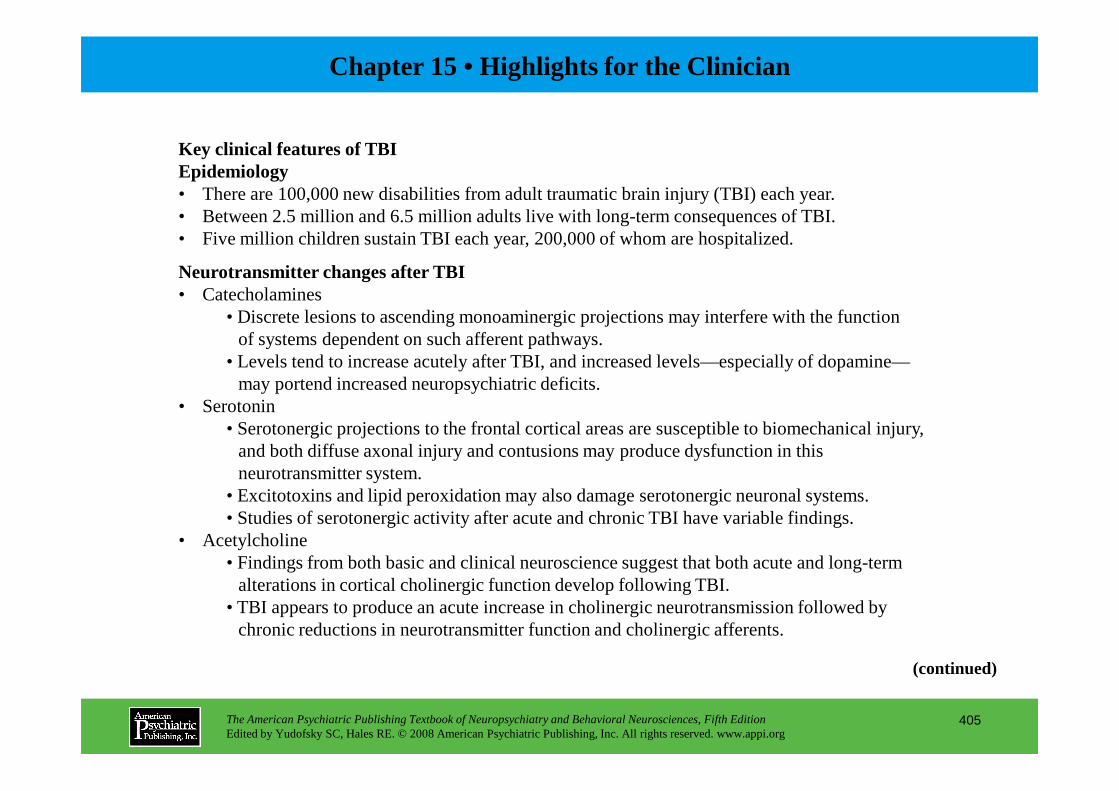
Chapter 15 • Highlights for the Clinician
Key clinical features of TBIEpidemiology• There are 100,000 new disabilities from adult traumatic brain injury (TBI) each year.• Between 2.5 million and 6.5 million adults live with long-term consequences of TBI.• Five million children sustain TBI each year, 200,000 of whom are hospitalized.
Neurotransmitter changes after TBI• Catecholamines
• Discrete lesions to ascending monoaminergic projections may interfere with the function of systems dependent on such afferent pathways.
• Levels tend to increase acutely after TBI, and increased levels—especially of dopamine—may portend increased neuropsychiatric deficits.
• Serotonin
The American Psychiatric Publishing Textbook of Neuropsychiatry and Behavioral Neurosciences, Fifth EditionEdited by Yudofsky SC, Hales RE. © 2008 American Psychiatric Publishing, Inc. All rights reserved. www.appi.org
405
• Serotonin• Serotonergic projections to the frontal cortical areas are susceptible to biomechanical injury,
and both diffuse axonal injury and contusions may produce dysfunction in this neurotransmitter system.
• Excitotoxins and lipid peroxidation may also damage serotonergic neuronal systems.• Studies of serotonergic activity after acute and chronic TBI have variable findings.
• Acetylcholine• Findings from both basic and clinical neuroscience suggest that both acute and long-term
alterations in cortical cholinergic function develop following TBI.• TBI appears to produce an acute increase in cholinergic neurotransmission followed by
chronic reductions in neurotransmitter function and cholinergic afferents.
(continued)
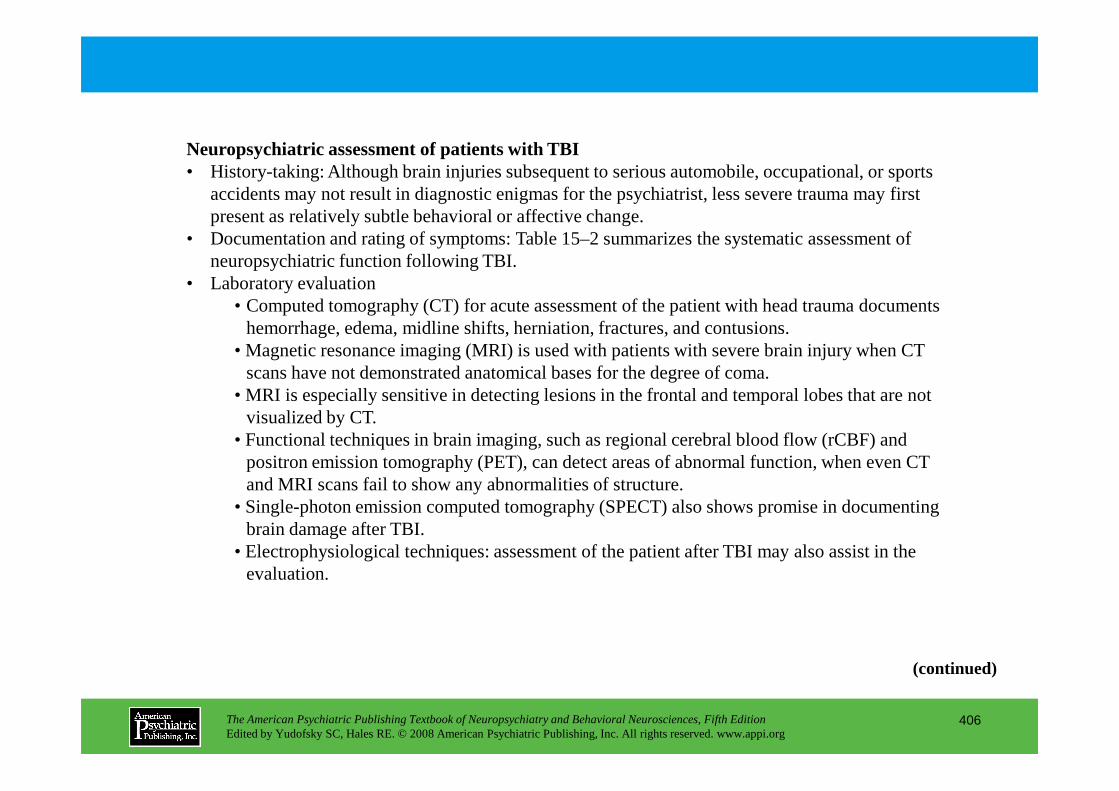
Neuropsychiatric assessment of patients with TBI• History-taking: Although brain injuries subsequent to serious automobile, occupational, or sports
accidents may not result in diagnostic enigmas for the psychiatrist, less severe trauma may first present as relatively subtle behavioral or affective change.
• Documentation and rating of symptoms: Table 15–2 summarizes the systematic assessment of neuropsychiatric function following TBI.
• Laboratory evaluation• Computed tomography (CT) for acute assessment of the patient with head trauma documents
hemorrhage, edema, midline shifts, herniation, fractures, and contusions.• Magnetic resonance imaging (MRI) is used with patients with severe brain injury when CT
scans have not demonstrated anatomical bases for the degree of coma.• MRI is especially sensitive in detecting lesions in the frontal and temporal lobes that are not
The American Psychiatric Publishing Textbook of Neuropsychiatry and Behavioral Neurosciences, Fifth EditionEdited by Yudofsky SC, Hales RE. © 2008 American Psychiatric Publishing, Inc. All rights reserved. www.appi.org
406
• MRI is especially sensitive in detecting lesions in the frontal and temporal lobes that are not visualized by CT.
• Functional techniques in brain imaging, such as regional cerebral blood flow (rCBF) and positron emission tomography (PET), can detect areas of abnormal function, when even CT and MRI scans fail to show any abnormalities of structure.
• Single-photon emission computed tomography (SPECT) also shows promise in documenting brain damage after TBI.
• Electrophysiological techniques: assessment of the patient after TBI may also assist in the evaluation.
(continued)
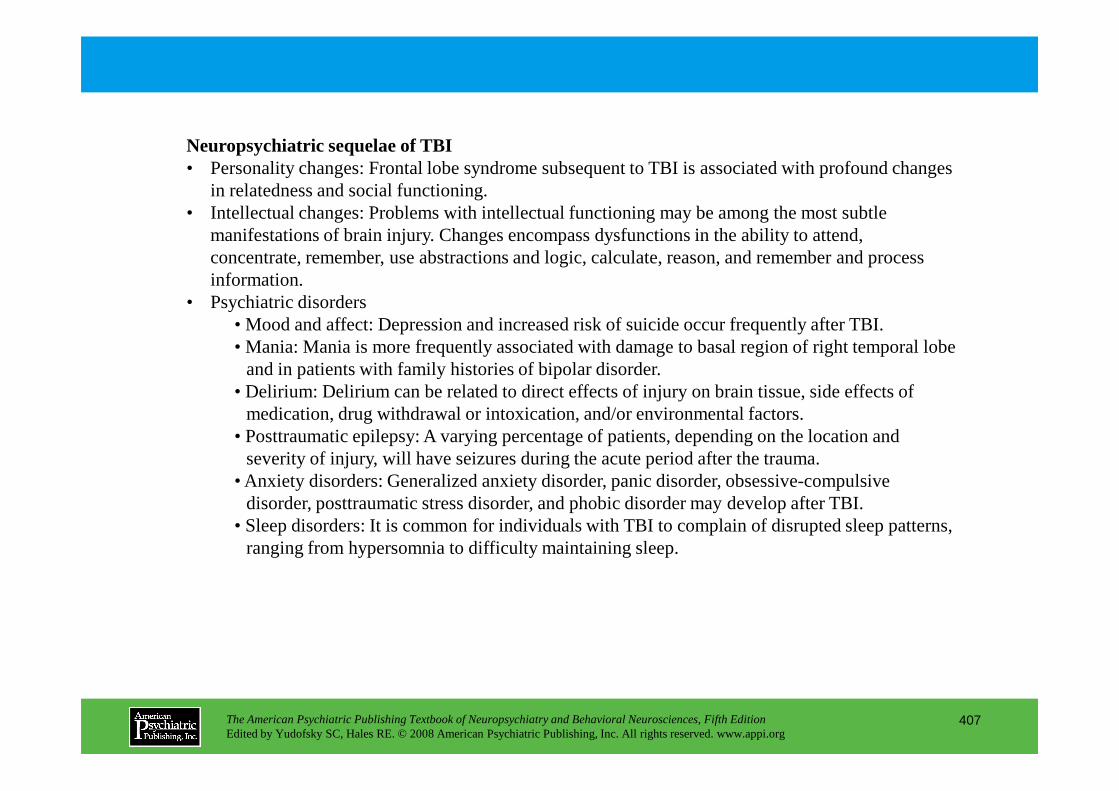
Neuropsychiatric sequelae of TBI• Personality changes: Frontal lobe syndrome subsequent to TBI is associated with profound changes
in relatedness and social functioning.• Intellectual changes: Problems with intellectual functioning may be among the most subtle
manifestations of brain injury. Changes encompass dysfunctions in the ability to attend, concentrate, remember, use abstractions and logic, calculate, reason, and remember and process information.
• Psychiatric disorders• Mood and affect: Depression and increased risk of suicide occur frequently after TBI.• Mania: Mania is more frequently associated with damage to basal region of right temporal lobe
and in patients with family histories of bipolar disorder.• Delirium: Delirium can be related to direct effects of injury on brain tissue, side effects of
The American Psychiatric Publishing Textbook of Neuropsychiatry and Behavioral Neurosciences, Fifth EditionEdited by Yudofsky SC, Hales RE. © 2008 American Psychiatric Publishing, Inc. All rights reserved. www.appi.org
407
• Delirium: Delirium can be related to direct effects of injury on brain tissue, side effects of medication, drug withdrawal or intoxication, and/or environmental factors.
• Posttraumatic epilepsy: A varying percentage of patients, depending on the location and severity of injury, will have seizures during the acute period after the trauma.
• Anxiety disorders: Generalized anxiety disorder, panic disorder, obsessive-compulsive disorder, posttraumatic stress disorder, and phobic disorder may develop after TBI.
• Sleep disorders: It is common for individuals with TBI to complain of disrupted sleep patterns, ranging from hypersomnia to difficulty maintaining sleep.

CHAPTER 16
NEUROPSYCHIATRIC ASPECTS OF SEIZURE DISORDERS
H. Florence Kim, M.D.Stuart C. Yudofsky, M.D.
Robert E. Hales, M.D., M.B.A.Gary J. Tucker, M.D.
The American Psychiatric Publishing Textbook of Neuropsychiatry and Behavioral Neurosciences, Fifth EditionEdited by Yudofsky SC, Hales RE. © 2008 American Psychiatric Publishing, Inc. All rights reserved. www.appi.org
408
Slide Show
Topic headings and reading list
Tables
Highlights for the clinician
Main menu
(About, Contents, Contributors, Publishing facts)
Gary J. Tucker, M.D.

Seizure DisordersSeizures and EpilepsyClassification of Seizures
Generalized SeizuresFocal (Partial) SeizuresTonic-Clonic SeizuresAbsence SeizuresStatus Epilepticus
Causes of EpilepsyTemporal Lobe EpilepsyEpidemiology of Seizure DisordersPsychosocial Facets of EpilepsyDiagnosis
Laboratory
Behavioral and Personality DisturbancesCognitive DisordersOverall Guidelines for Treatment of Comorbid Psychiatric Syndromes
Specific Aspects of Anticonvulsant UsePharmacokinetic Interactions
PhenobarbitalPhenytoinCarbamazepineValproateNew Antiepileptic Drugs
Conclusion
CHAPTER 16 • Topics and Readings
The American Psychiatric Publishing Textbook of Neuropsychiatry and Behavioral Neurosciences, Fifth EditionEdited by Yudofsky SC, Hales RE. © 2008 American Psychiatric Publishing, Inc. All rights reserved. www.appi.org
409
LaboratoryImagingEEG
Differential Diagnosis of Behavioral Symptoms Associated With EpilepsyEtiological Links of Seizures to PsychopathologyTemporal Lobe Specificity and Psychopathology
Comorbid Psychiatric SyndromesPsychosis
Possibly Related Seizure DisordersTreatment of Psychotic Conditions
Anxiety DisordersTreatment of Comorbid Anxiety
Mood DisordersTreatment of Comorbid Mood Disorders
RECOMMENDED READINGTrimble M, Schmitz B (eds): The Neuropsychiatry of Epilepsy.
Cambridge, UK, Cambridge University Press, 2002
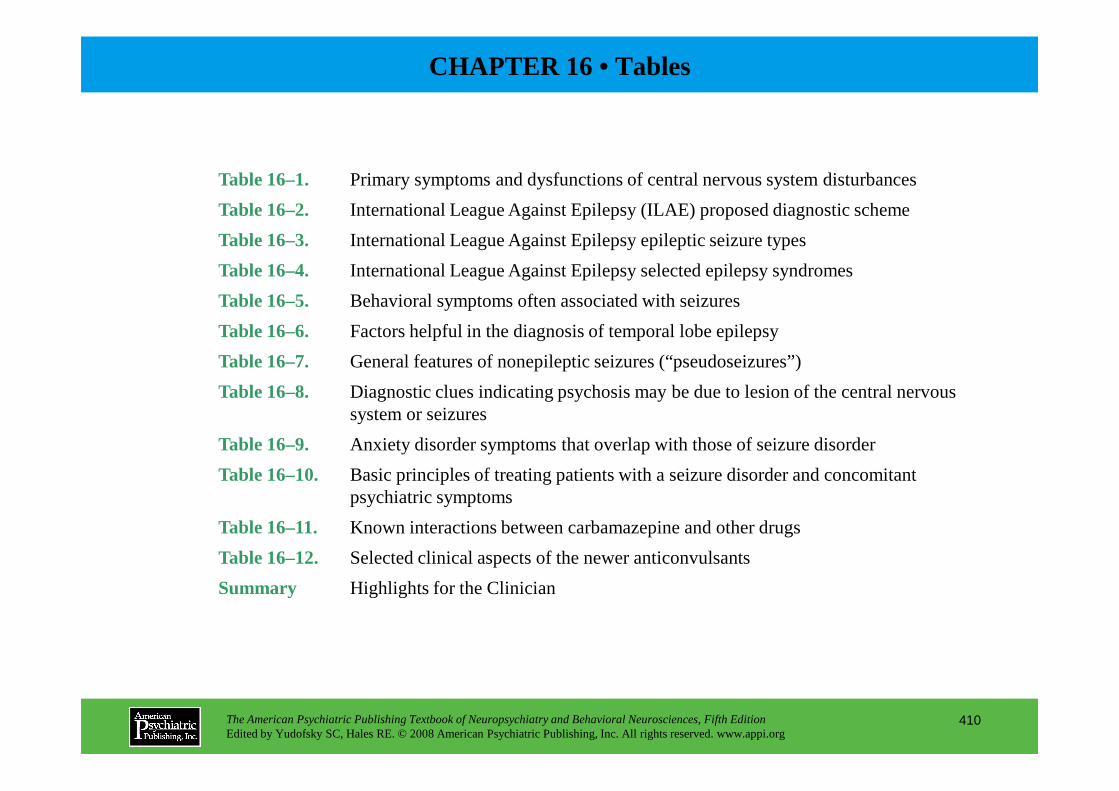
CHAPTER 16 • Tables
Table 16–1. Primary symptoms and dysfunctions of central nervous system disturbances
Table 16–2. International League Against Epilepsy (ILAE) proposed diagnostic scheme
Table 16–3. International League Against Epilepsy epileptic seizure types
Table 16–4. International League Against Epilepsy selected epilepsy syndromes
Table 16–5. Behavioral symptoms often associated with seizures
Table 16–6. Factors helpful in the diagnosis of temporal lobe epilepsy
Table 16–7. General features of nonepileptic seizures (“pseudoseizures”)
Table 16–8. Diagnostic clues indicating psychosis may be due to lesion of the central nervous
The American Psychiatric Publishing Textbook of Neuropsychiatry and Behavioral Neurosciences, Fifth EditionEdited by Yudofsky SC, Hales RE. © 2008 American Psychiatric Publishing, Inc. All rights reserved. www.appi.org
410
Table 16–8. Diagnostic clues indicating psychosis may be due to lesion of the central nervous system or seizures
Table 16–9. Anxiety disorder symptoms that overlap with those of seizure disorder
Table 16–10. Basic principles of treating patients with a seizure disorder and concomitant psychiatric symptoms
Table 16–11. Known interactions between carbamazepine and other drugs
Table 16–12. Selected clinical aspects of the newer anticonvulsants
Summary Highlights for the Clinician

TABLE 16–1. Primary symptoms and dysfunctions of central nervous system disturbances
The behavioral symptoms associated with insults to or diseases of the central nervous system are actually very few, and a wide variety of etiologies can cause the same symptoms (Table 16–1).
The American Psychiatric Publishing Textbook of Neuropsychiatry and Behavioral Neurosciences, Fifth EditionEdited by Yudofsky SC, Hales RE. © 2008 American Psychiatric Publishing, Inc. All rights reserved. www.appi.org
411
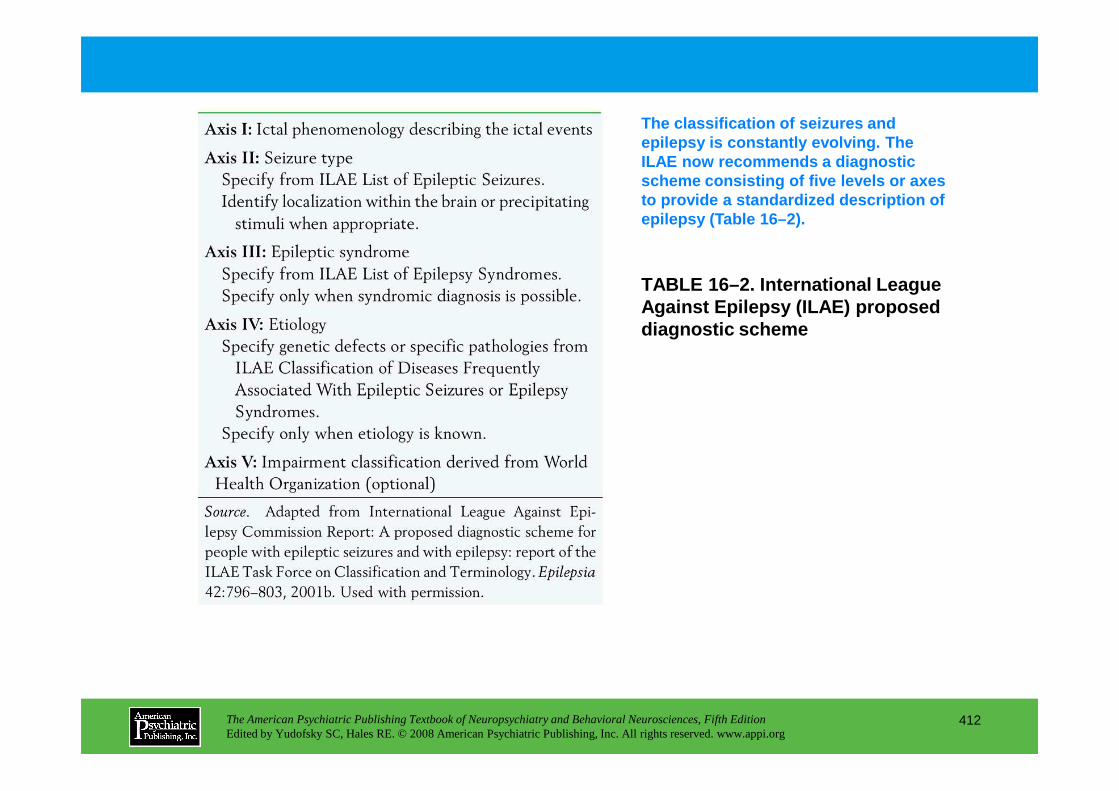
TABLE 16–2. International League Against Epilepsy (ILAE) proposed diagnostic scheme
The classification of seizures and epilepsy is constantly evolving. The ILAE now recommends a diagnostic scheme consisting of five levels or axes to provide a standardized description of epilepsy (Table 16–2).
The American Psychiatric Publishing Textbook of Neuropsychiatry and Behavioral Neurosciences, Fifth EditionEdited by Yudofsky SC, Hales RE. © 2008 American Psychiatric Publishing, Inc. All rights reserved. www.appi.org
412
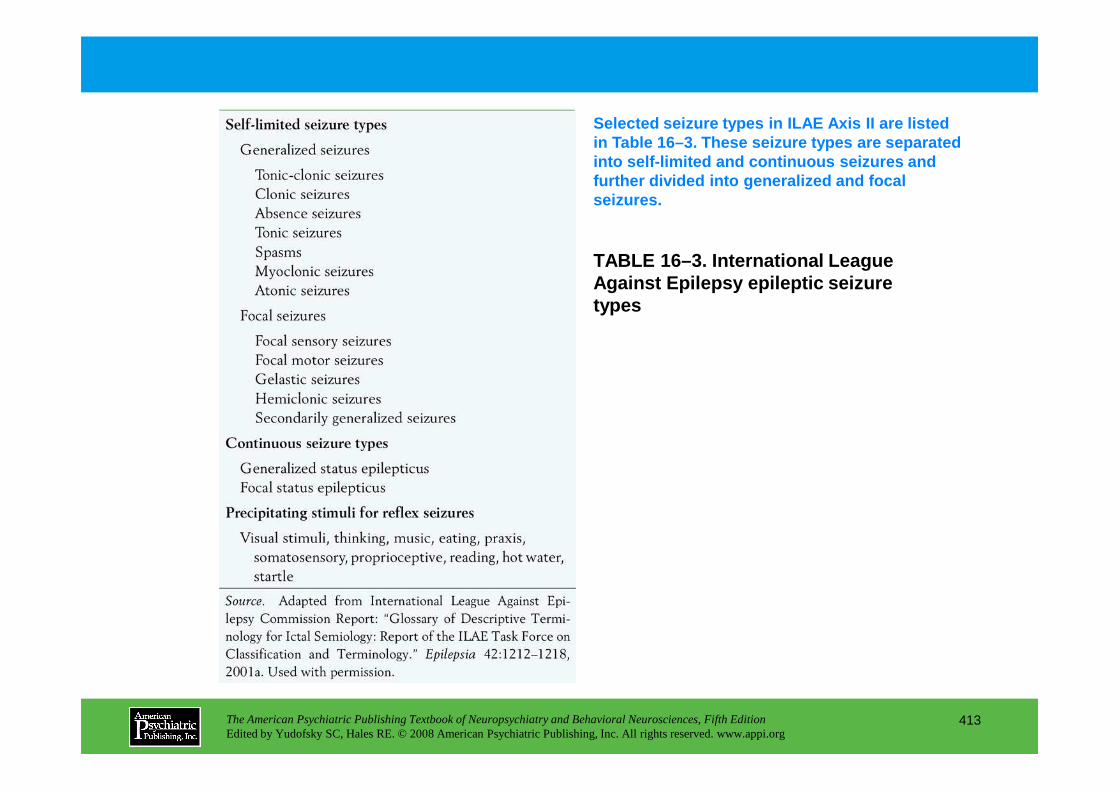
TABLE 16–3. International League Against Epilepsy epileptic seizure types
Selected seizure types in ILAE Axis II are listed in Table 16–3. These seizure types are separated into self-limited and continuous seizures and further divided into generalized and focal seizures.
The American Psychiatric Publishing Textbook of Neuropsychiatry and Behavioral Neurosciences, Fifth EditionEdited by Yudofsky SC, Hales RE. © 2008 American Psychiatric Publishing, Inc. All rights reserved. www.appi.org
413

TABLE 16–4. International League Against Epilepsy selected epilepsy syndromes
Axis III in the ILAE classification scheme is the epileptic syndrome, a constellation of signs and symptoms that define an epileptic condition. Selected epileptic syndrome diagnoses are listed in Table 16–4.
The American Psychiatric Publishing Textbook of Neuropsychiatry and Behavioral Neurosciences, Fifth EditionEdited by Yudofsky SC, Hales RE. © 2008 American Psychiatric Publishing, Inc. All rights reserved. www.appi.org
414
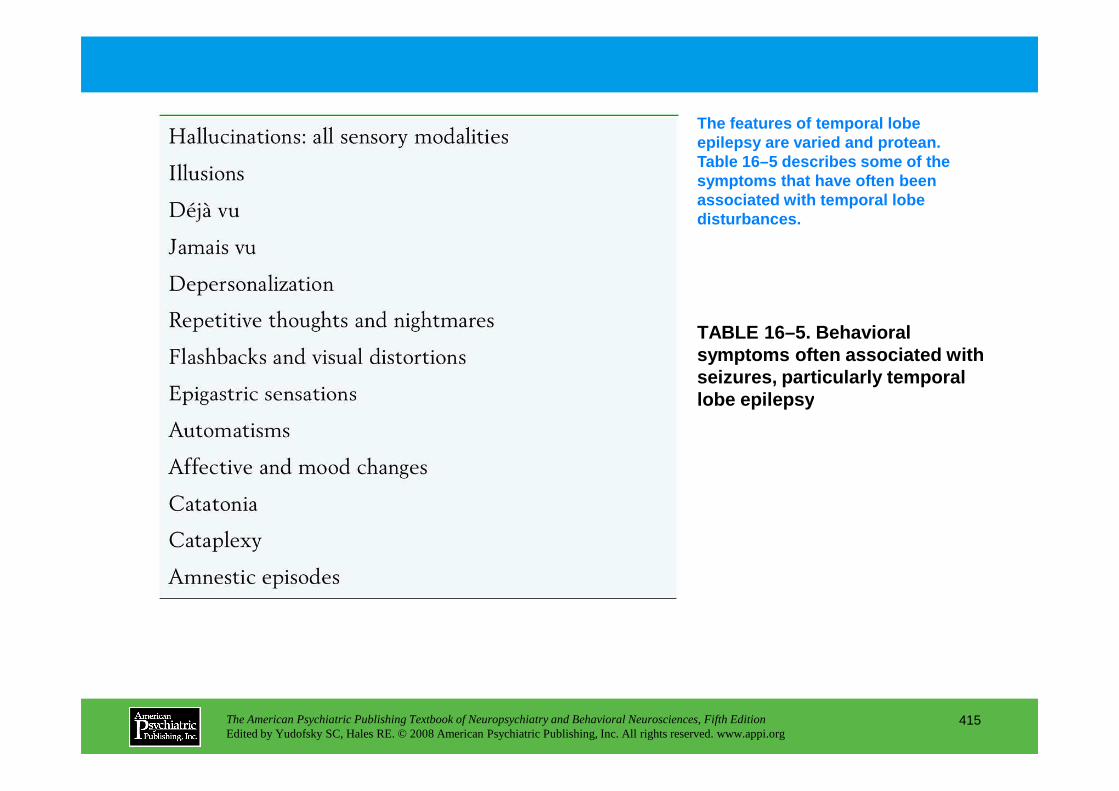
TABLE 16–5. Behavioral symptoms often associated with seizures, particularly temporal lobe epilepsy
The features of temporal lobe epilepsy are varied and protean. Table 16–5 describes some of the symptoms that have often been associated with temporal lobe disturbances.
The American Psychiatric Publishing Textbook of Neuropsychiatry and Behavioral Neurosciences, Fifth EditionEdited by Yudofsky SC, Hales RE. © 2008 American Psychiatric Publishing, Inc. All rights reserved. www.appi.org
415
lobe epilepsy
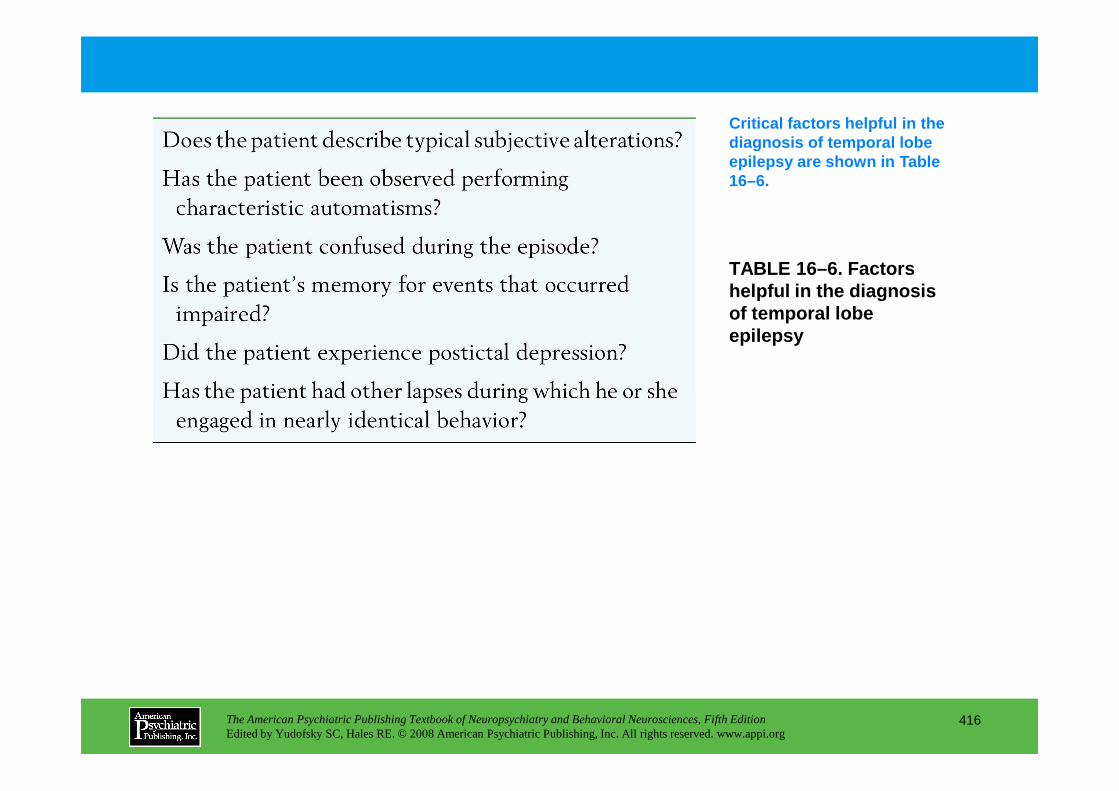
TABLE 16–6. Factors helpful in the diagnosis of temporal lobe epilepsy
Critical factors helpful in the diagnosis of temporal lobe epilepsy are shown in Table 16–6.
The American Psychiatric Publishing Textbook of Neuropsychiatry and Behavioral Neurosciences, Fifth EditionEdited by Yudofsky SC, Hales RE. © 2008 American Psychiatric Publishing, Inc. All rights reserved. www.appi.org
416
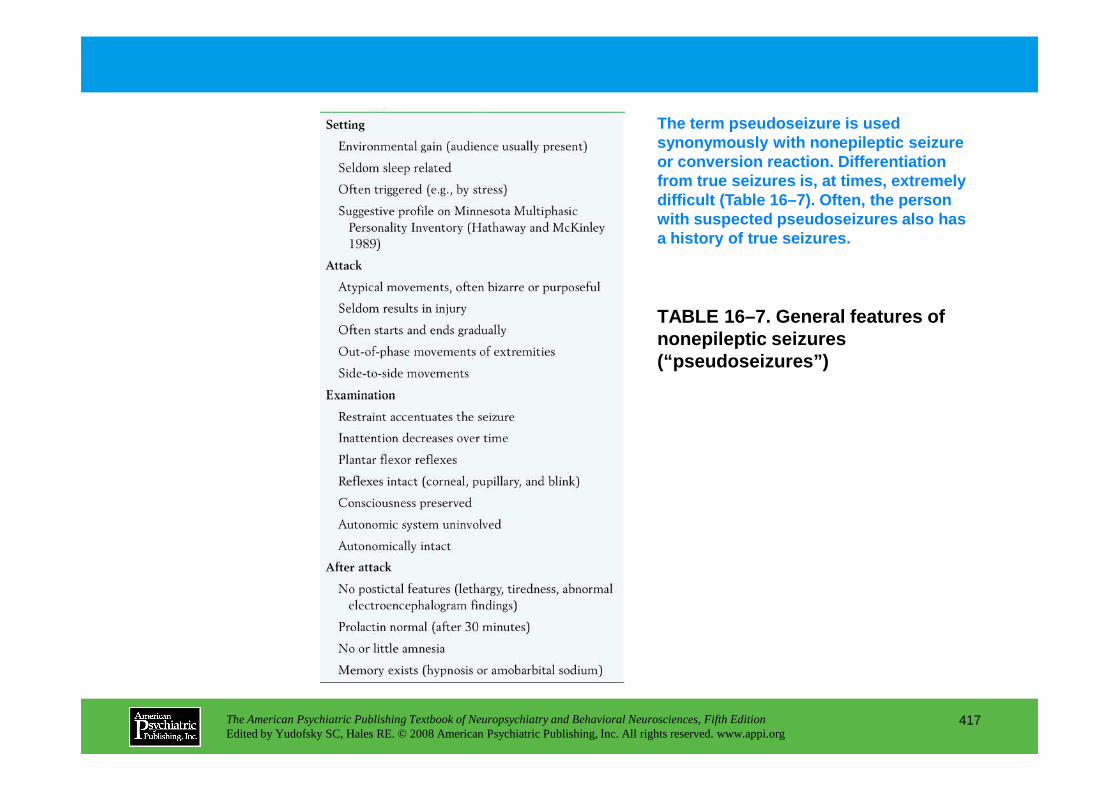
TABLE 16–7. General features of nonepileptic seizures (“pseudoseizures”)
The term pseudoseizure is used synonymously with nonepileptic seizureor conversion reaction . Differentiation from true seizures is, at times, extremely difficult (Table 16–7). Often, the person with suspected pseudoseizures also has a history of true seizures.
The American Psychiatric Publishing Textbook of Neuropsychiatry and Behavioral Neurosciences, Fifth EditionEdited by Yudofsky SC, Hales RE. © 2008 American Psychiatric Publishing, Inc. All rights reserved. www.appi.org
417
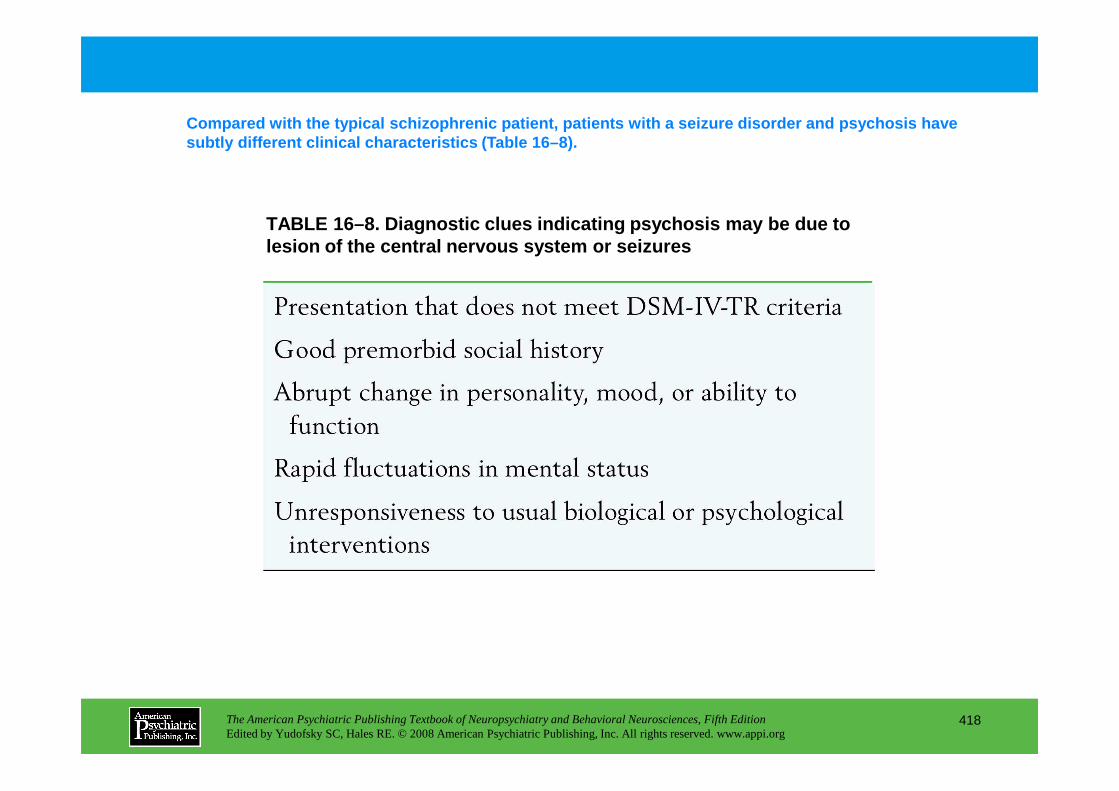
TABLE 16–8. Diagnostic clues indicating psychosis m ay be due to lesion of the central nervous system or seizures
Compared with the typical schizophrenic patient, pat ients with a seizure disorder and psychosis have subtly different clinical characteristics (Table 16 –8).
The American Psychiatric Publishing Textbook of Neuropsychiatry and Behavioral Neurosciences, Fifth EditionEdited by Yudofsky SC, Hales RE. © 2008 American Psychiatric Publishing, Inc. All rights reserved. www.appi.org
418
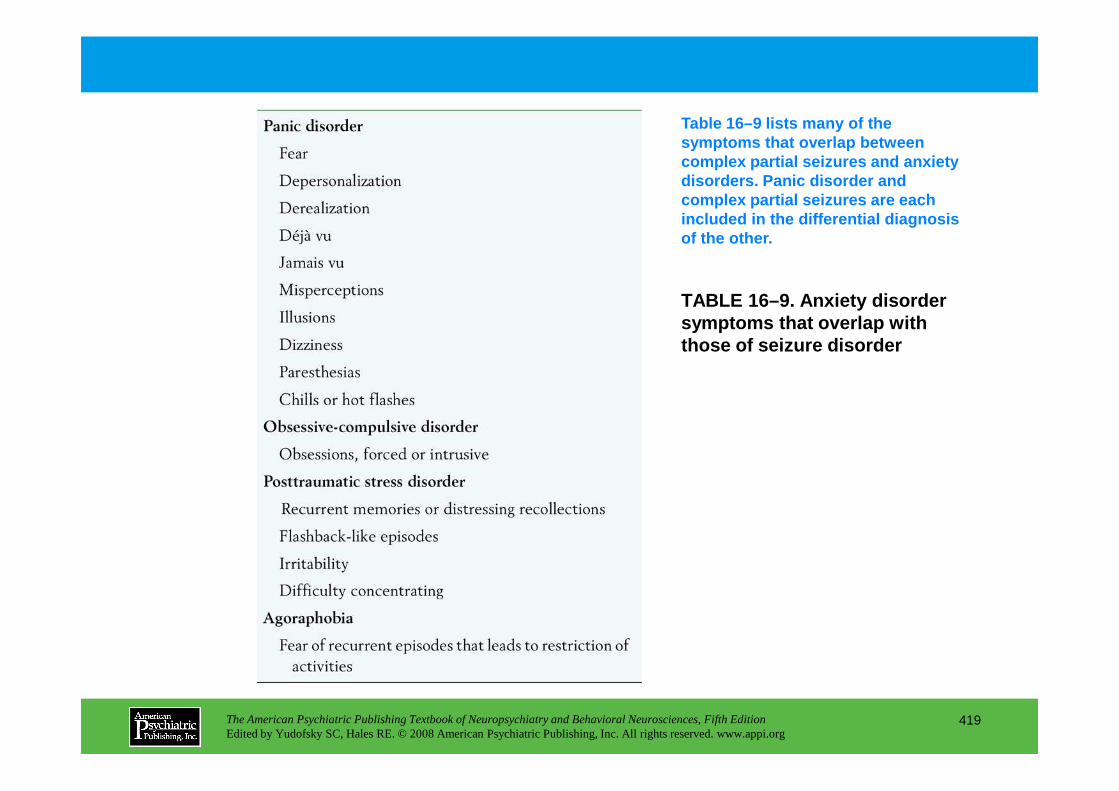
TABLE 16–9. Anxiety disorder symptoms that overlap with those of seizure disorder
Table 16–9 lists many of the symptoms that overlap between complex partial seizures and anxiety disorders. Panic disorder and complex partial seizures are each included in the differential diagnosis of the other.
The American Psychiatric Publishing Textbook of Neuropsychiatry and Behavioral Neurosciences, Fifth EditionEdited by Yudofsky SC, Hales RE. © 2008 American Psychiatric Publishing, Inc. All rights reserved. www.appi.org
419
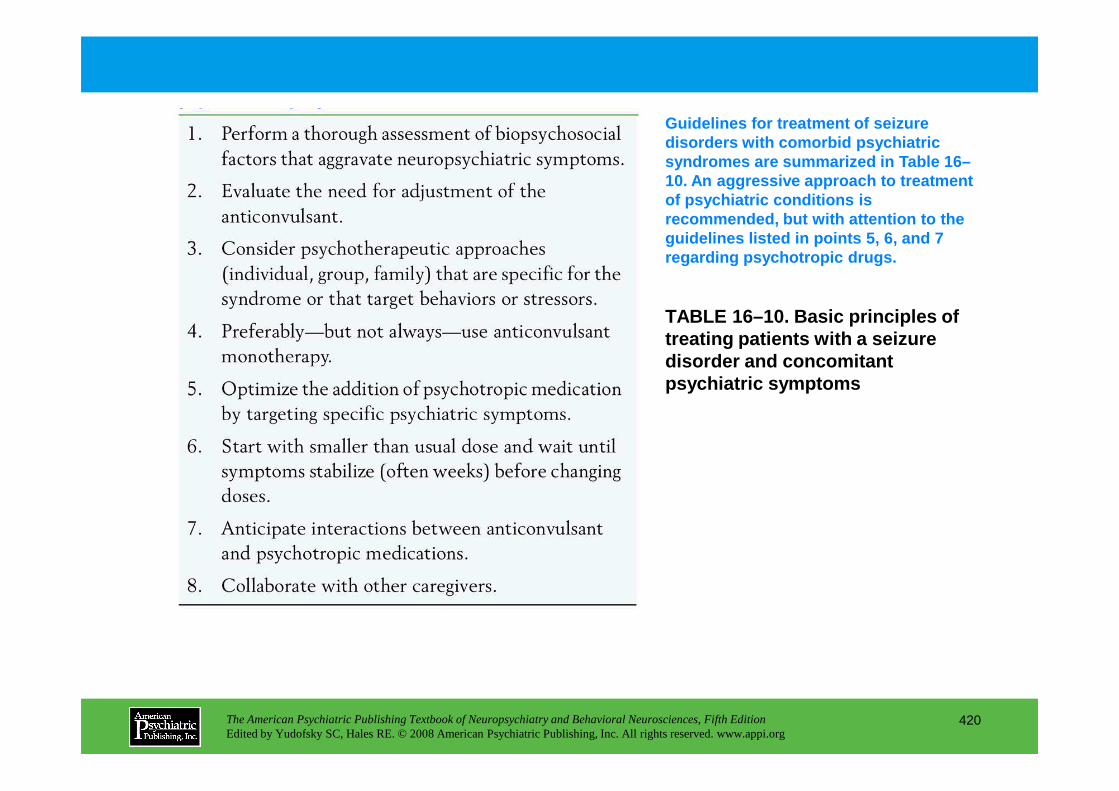
TABLE 16–10. Basic principles of treating patients with a seizure disorder and concomitant psychiatric symptoms
Guidelines for treatment of seizure disorders with comorbid psychiatric syndromes are summarized in Table 16–10. An aggressive approach to treatment of psychiatric conditions is recommended, but with attention to the guidelines listed in points 5, 6, and 7 regarding psychotropic drugs.
The American Psychiatric Publishing Textbook of Neuropsychiatry and Behavioral Neurosciences, Fifth EditionEdited by Yudofsky SC, Hales RE. © 2008 American Psychiatric Publishing, Inc. All rights reserved. www.appi.org
420

TABLE 16–11. Known interactions between carbamazepine and other drugs
Of the major anticonvulsants, phenobarbital, phenytoin, carbamazepine, lamotrigine, topiramate, and tiagabine have potent drug interactions. Table 16–11 indicates what is known about some interactions and shows the complexity of these drug interactions.
The American Psychiatric Publishing Textbook of Neuropsychiatry and Behavioral Neurosciences, Fifth EditionEdited by Yudofsky SC, Hales RE. © 2008 American Psychiatric Publishing, Inc. All rights reserved. www.appi.org
421
(continued)
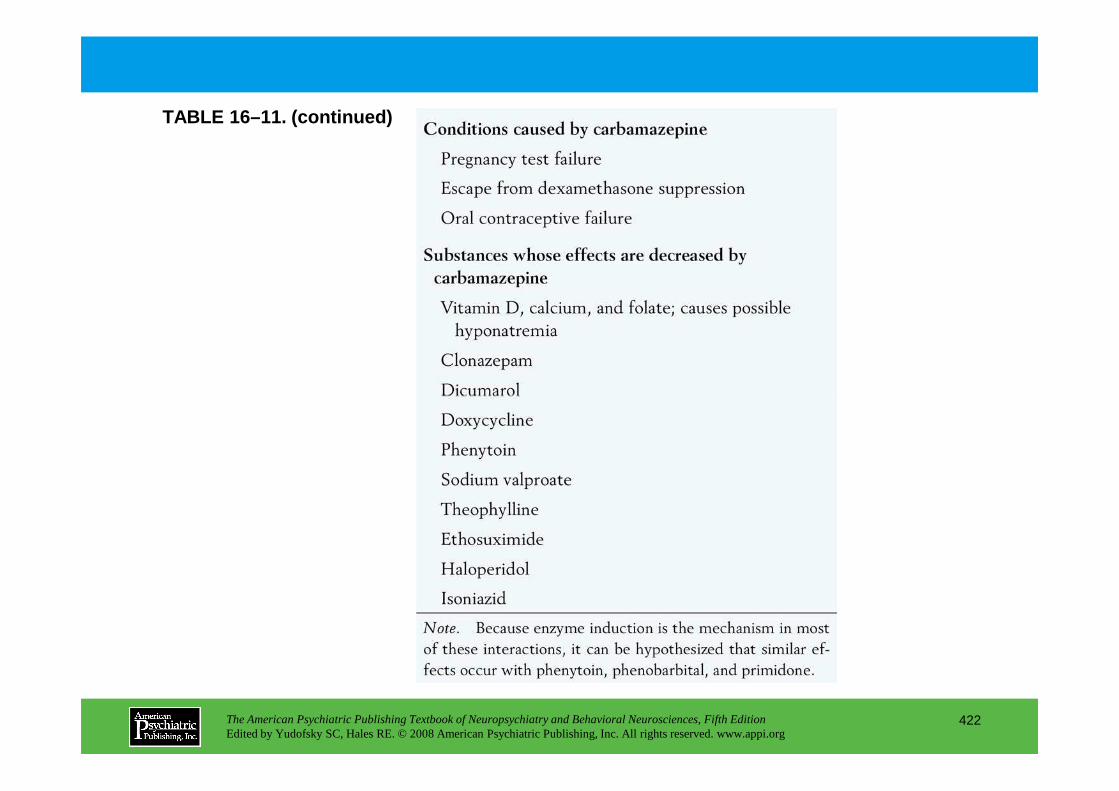
TABLE 16–11. (continued)
The American Psychiatric Publishing Textbook of Neuropsychiatry and Behavioral Neurosciences, Fifth EditionEdited by Yudofsky SC, Hales RE. © 2008 American Psychiatric Publishing, Inc. All rights reserved. www.appi.org
422
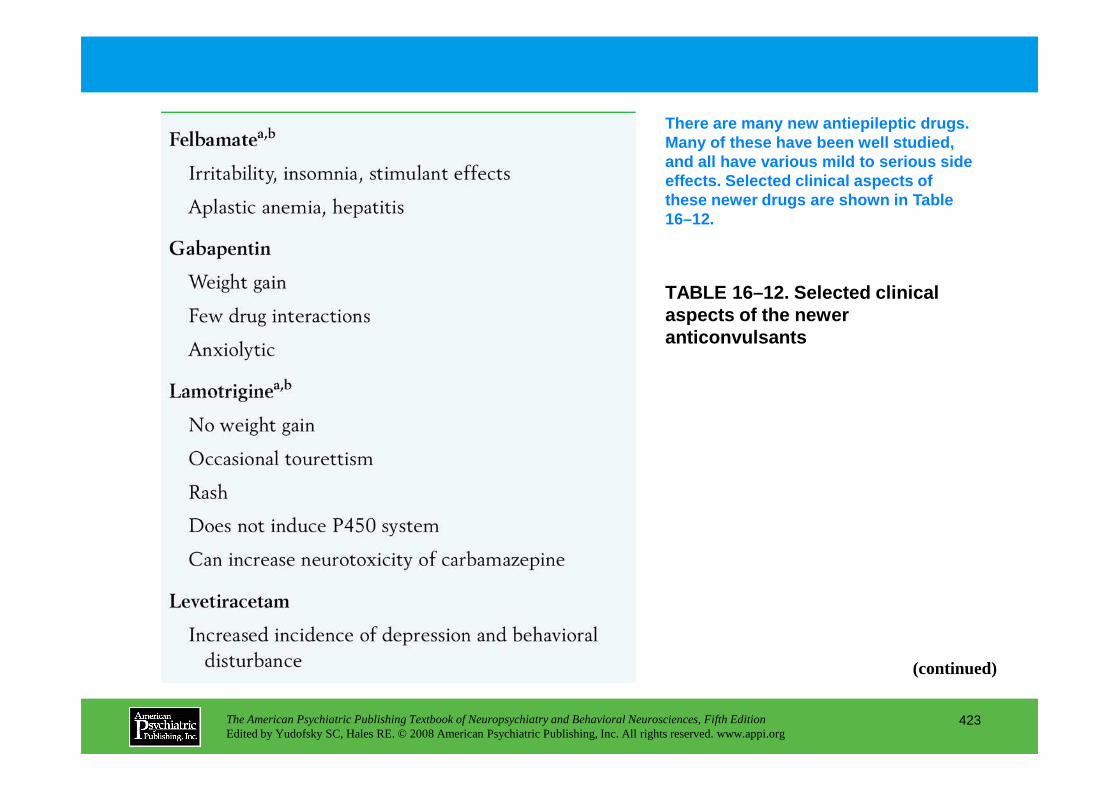
TABLE 16–12. Selected clinical aspects of the newer anticonvulsants
There are many new antiepileptic drugs. Many of these have been well studied, and all have various mild to serious side effects. Selected clinical aspects of these newer drugs are shown in Table 16–12.
The American Psychiatric Publishing Textbook of Neuropsychiatry and Behavioral Neurosciences, Fifth EditionEdited by Yudofsky SC, Hales RE. © 2008 American Psychiatric Publishing, Inc. All rights reserved. www.appi.org
423
(continued)
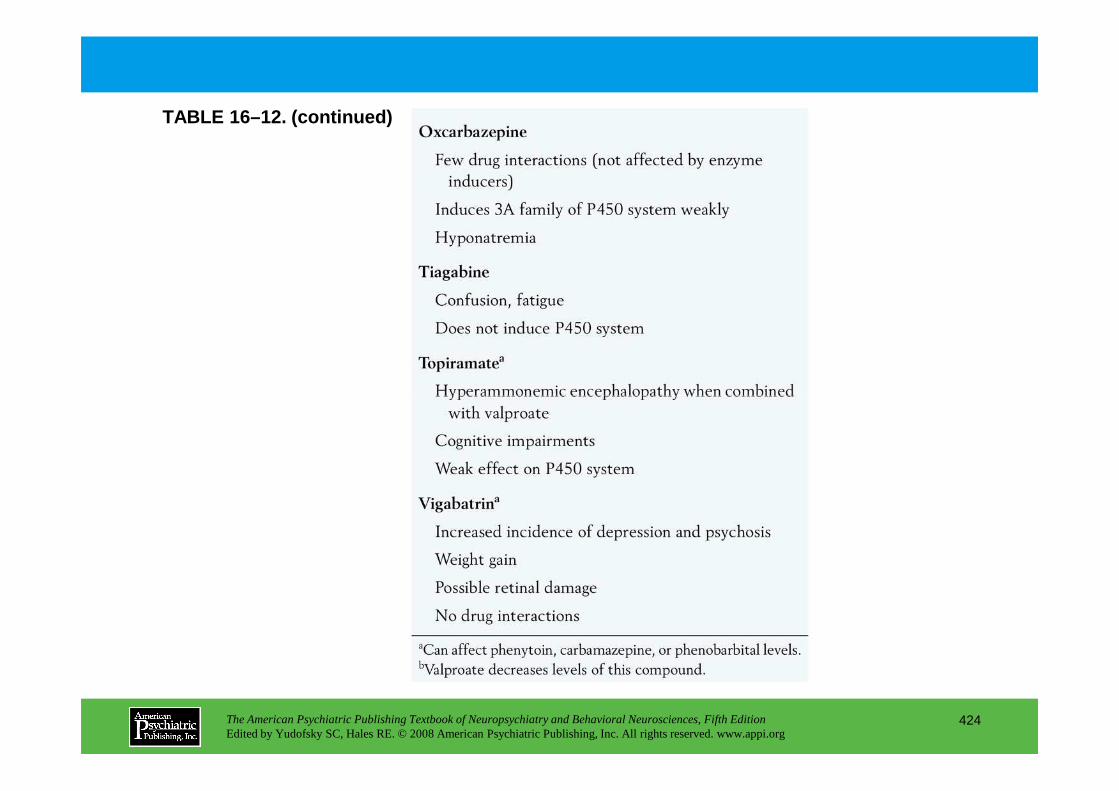
TABLE 16–12. (continued)
The American Psychiatric Publishing Textbook of Neuropsychiatry and Behavioral Neurosciences, Fifth EditionEdited by Yudofsky SC, Hales RE. © 2008 American Psychiatric Publishing, Inc. All rights reserved. www.appi.org
424

Chapter 16 • Highlights for the Clinician
• Diagnosis of a seizure disorder is a clinical diagnosis.• An EEG may be confirmatory, but 20% of patients with epilepsy will have a normal EEG result.• Structural and functional neuroimaging modalities can be helpful in the localization of seizure foci.• Seizure disorders and the medications used to treat them are both associated with chronic and
episodic neuropsychiatric symptoms.• Mood or psychotic symptoms related to seizure episodes are classified temporally into peri-ictal,
ictal, postictal, and interictal episodes and differ in terms of intensity and duration.• Treatment of neuropsychiatric symptoms in epilepsy patients can be complex:
• The clinician should administer very small doses of psychotropic medications with infrequent changes.
• Psychotherapy in addition to pharmacotherapy can be helpful.
The American Psychiatric Publishing Textbook of Neuropsychiatry and Behavioral Neurosciences, Fifth EditionEdited by Yudofsky SC, Hales RE. © 2008 American Psychiatric Publishing, Inc. All rights reserved. www.appi.org
425
• Psychotherapy in addition to pharmacotherapy can be helpful.• Anticonvulsant and psychotropic medications often have significant drug interactions.• A multidisciplinary treatment team, including neurologist, psychiatrist, psychotherapist, and
social worker, can provide optimal treatment for epilepsy patients.
CHAPTER 17
NEUROPSYCHIATRIC ASPECTS OF SLEEP AND SLEEP DISORDERS
Max Hirshkowitz, Ph.D.Amir Sharafkhaneh, M.D.
The American Psychiatric Publishing Textbook of Neuropsychiatry and Behavioral Neurosciences, Fifth EditionEdited by Yudofsky SC, Hales RE. © 2008 American Psychiatric Publishing, Inc. All rights reserved. www.appi.org
426
Slide Show
Topic headings and reading list
Tables and figures
Highlights for the clinician
Main menu
(About, Contents, Contributors, Publishing facts)
Physiology of Normal Human SleepThe Stages of Sleep
Normal Sleep Pattern: Generalizations
Mechanisms Regulating SleepAutonomic Nervous System BalanceHomeostatic Sleep DriveCircadian Rhythms
Sleep in Patients With Psychiatric Conditions
Sleep Disorders Overview and Classification Systems
InsomniaPsychophysiological InsomniaDrug and Alcohol Dependence
Drug TreatmentsCurrent Recommendations
HypersomniaSleep-Disordered Breathing
TreatmentContinuous positive airway pressureBilevel and self-adjusting positive airway pressureOral appliancesSurgeryOther treatments
NarcolepsyTreatment
Idiopathic HypersomniaTreatment
CHAPTER 17 • Topics and Readings
The American Psychiatric Publishing Textbook of Neuropsychiatry and Behavioral Neurosciences, Fifth EditionEdited by Yudofsky SC, Hales RE. © 2008 American Psychiatric Publishing, Inc. All rights reserved. www.appi.org
427
Drug and Alcohol DependenceRestless Legs Syndrome and Periodic Limb Movement DisorderParadoxical Insomnia (Formerly Sleep-State Misperception)Sleep-Disordered BreathingIdiopathic InsomniaCircadian Rhythm DyssomniasInsomnia Treatment Options
Behavioral Treatment: Cognitive-Behavioral TherapyCognitive therapyUniversal sleep hygieneRelaxation trainingStimulus control therapySleep restriction therapyBright light therapy
Treatment
ParasomniasSleepwalkingSleep TerrorsSleep EnuresisNightmaresSleep ParalysisRhythmic Movement DisorderSleep BruxismREM Sleep Behavior Disorder
RECOMMENDED READINGSAvidan A, Zee P: Handbook of Sleep Medicine. Baltimore, MD,
Lippincott Williams & Wilkins, 2006Glovinsky P, Spielman A: The Insomnia Answer. New York, The
Penguin Group, 2006

CHAPTER 17 • Tables and Figures
Table 17–1. Sleep stage electroencephalographic, electro-oculographic, and electromyographic characteristics
Figure 17–1. Polysomnographic recordings of the stages of sleep
Table 17–2. Comparison of NREM and REM sleep activity
Figure 17–2. Sleep stage percentages in a healthy young adult
Figure 17–3. Sleep stage histogram for a healthy young adult
Figure 17–4. Sleep macroarchitecture (stages) as a function of age
Table 17–3. Autonomic nervous system roles in precipitating and perpetuating insomnia
Table 17–4. Outline of the International Classification of Sleep Disorders, second edition
Figure 17–5. Spielman’s dynamic model of insomnia
The American Psychiatric Publishing Textbook of Neuropsychiatry and Behavioral Neurosciences, Fifth EditionEdited by Yudofsky SC, Hales RE. © 2008 American Psychiatric Publishing, Inc. All rights reserved. www.appi.org
428
Figure 17–6. Proportions for the most common insomnias, hypersomnias, and parasomnias seen in sleep disorders centers
Table 17–5. International study group diagnostic criteria for restless legs syndrome
Table 17–6. Sleep hygiene recommendations
Table 17–7. Profile for an ideal hypnotic
Table 17–8. Pharmacokinetics of drugs approved for treating insomnia
Figure 17–7. The relationship of common parasomnias to REM sleep, NREM sleep, and the awake state
Summary Highlights for the Clinician
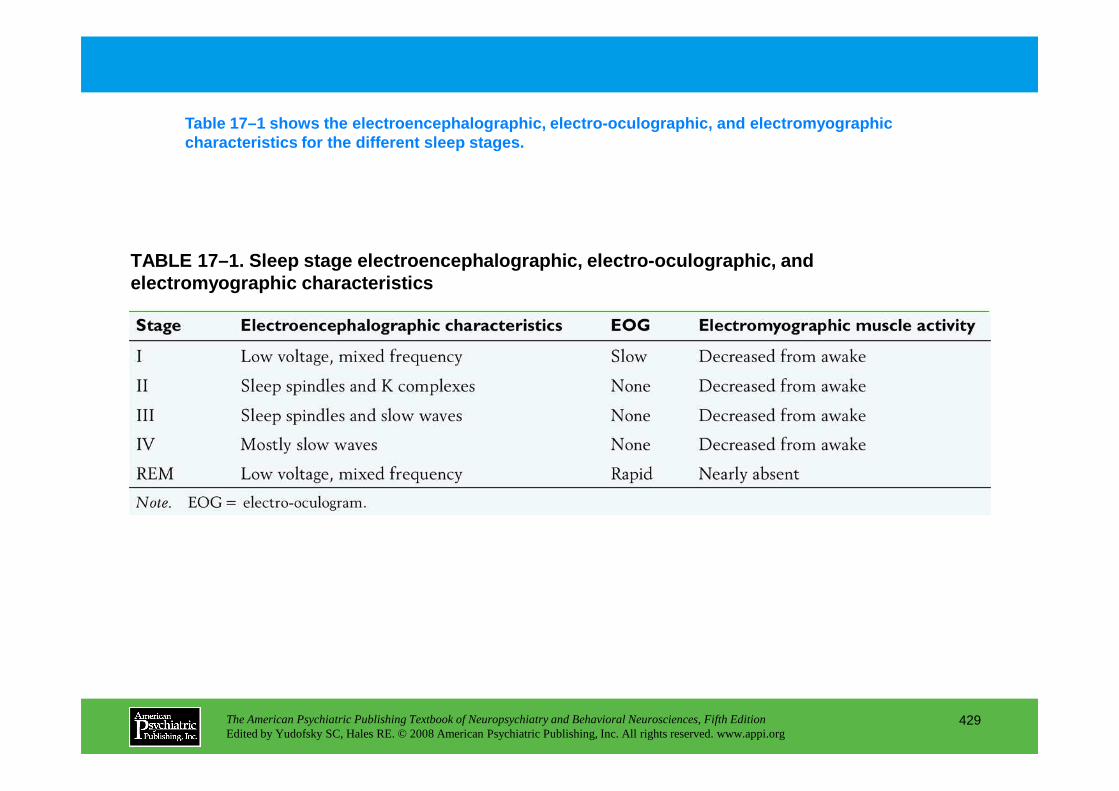
TABLE 17–1. Sleep stage electroencephalographic, el ectro-oculographic, and electromyographic characteristics
Table 17–1 shows the electroencephalographic, elect ro-oculographic, and electromyographic characteristics for the different sleep stages.
The American Psychiatric Publishing Textbook of Neuropsychiatry and Behavioral Neurosciences, Fifth EditionEdited by Yudofsky SC, Hales RE. © 2008 American Psychiatric Publishing, Inc. All rights reserved. www.appi.org
429
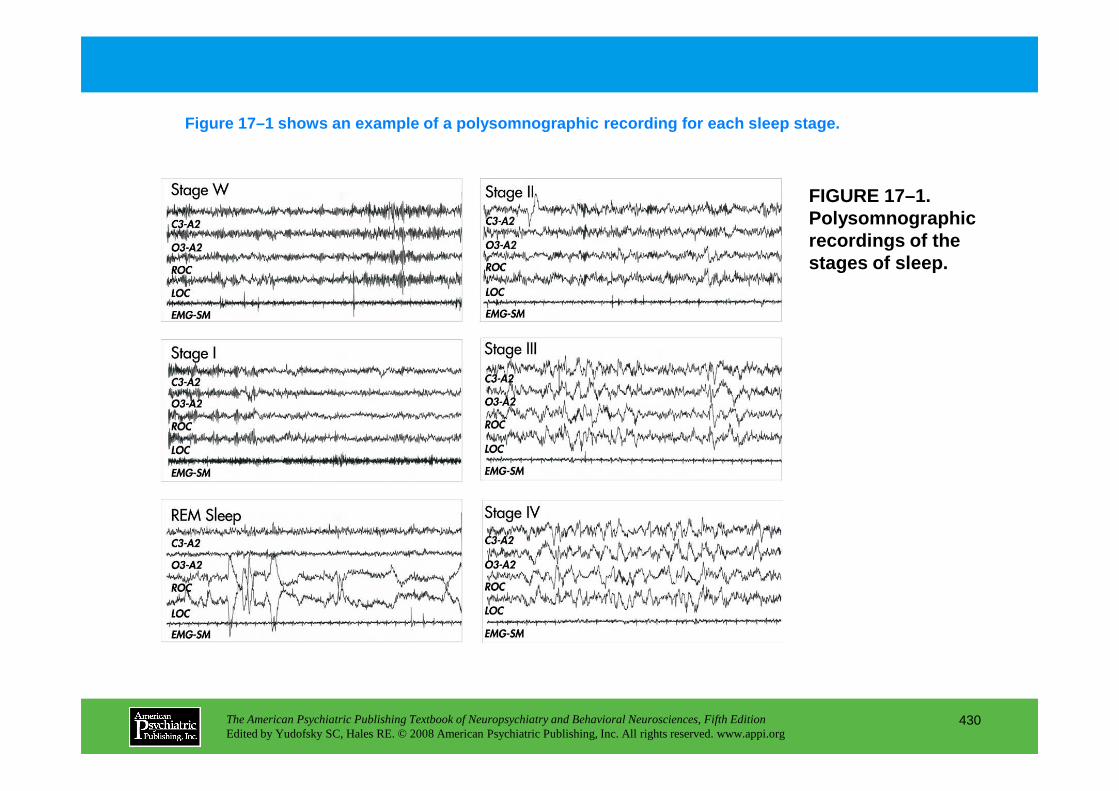
FIGURE 17–1. Polysomnographic recordings of the stages of sleep.
Figure 17–1 shows an example of a polysomnographic recording for each sleep stage.
The American Psychiatric Publishing Textbook of Neuropsychiatry and Behavioral Neurosciences, Fifth EditionEdited by Yudofsky SC, Hales RE. © 2008 American Psychiatric Publishing, Inc. All rights reserved. www.appi.org
430

FIGURE 17–1 (enlarged)
The American Psychiatric Publishing Textbook of Neuropsychiatry and Behavioral Neurosciences, Fifth EditionEdited by Yudofsky SC, Hales RE. © 2008 American Psychiatric Publishing, Inc. All rights reserved. www.appi.org
431

TABLE 17–2. Comparison of NREM and REM sleep activi ty
Stages I, II, III, and IV are sometimes collectively referred to as non-REM (NREM) sleep. Stages III and IV are often combined and called slow-wave slee p. NREM and REM sleep differ for many physiological measures, as shown in Table 17–2.
The American Psychiatric Publishing Textbook of Neuropsychiatry and Behavioral Neurosciences, Fifth EditionEdited by Yudofsky SC, Hales RE. © 2008 American Psychiatric Publishing, Inc. All rights reserved. www.appi.org
432

FIGURE 17–2. Sleep stage percentages in a healthy y oung adult.
Figure 17–2 shows the nightly percentages for each sleep stage in a healthy young adult: about half the night is spent in Stage II sleep, about one -quarter in REM sleep, and the rest in slow-wave and Stage I sleep.
The American Psychiatric Publishing Textbook of Neuropsychiatry and Behavioral Neurosciences, Fifth EditionEdited by Yudofsky SC, Hales RE. © 2008 American Psychiatric Publishing, Inc. All rights reserved. www.appi.org
433

FIGURE 17–3. Sleep stage histogram for a healthy yo ung adult.
Sleep architecture is the progression and continuit y of sleep through a given night. There are repeating cycles, with systematic alterations in th e cycles’ properties as the night progresses. Figure 17–3 shows a typical night with normal sleep architecture in a healthy young adult.
The American Psychiatric Publishing Textbook of Neuropsychiatry and Behavioral Neurosciences, Fifth EditionEdited by Yudofsky SC, Hales RE. © 2008 American Psychiatric Publishing, Inc. All rights reserved. www.appi.org
434
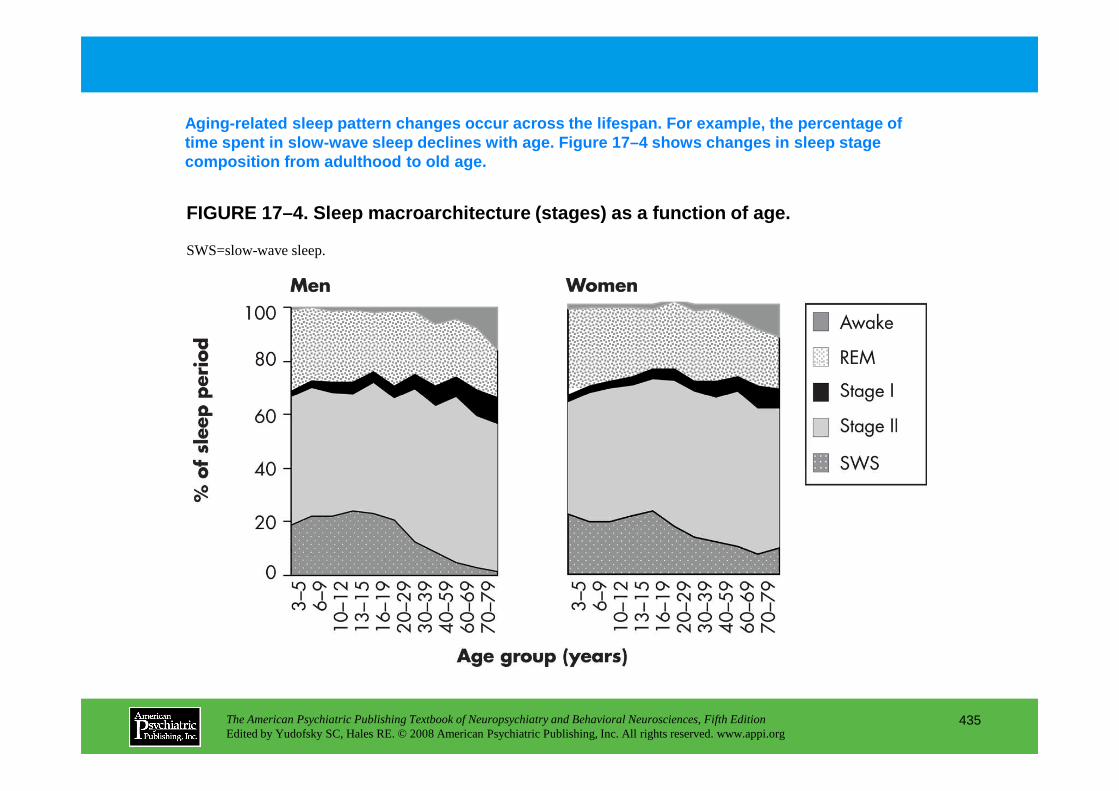
FIGURE 17–4. Sleep macroarchitecture (stages) as a function of age.
Aging-related sleep pattern changes occur across th e lifespan. For example, the percentage of time spent in slow-wave sleep declines with age. Fi gure 17–4 shows changes in sleep stage composition from adulthood to old age.
SWS=slow-wave sleep.
The American Psychiatric Publishing Textbook of Neuropsychiatry and Behavioral Neurosciences, Fifth EditionEdited by Yudofsky SC, Hales RE. © 2008 American Psychiatric Publishing, Inc. All rights reserved. www.appi.org
435

TABLE 17–3. Autonomic nervous system (ANS) roles in precipitating and perpetuating insomnia
Table 17–3 shows some common sources of arousal tha t can cause sleep disruption. Sometimes an external stimulus can trigger and be a mplified by an internal source of arousal. For example, an unfamiliar noise in the house can p rovoke anxiety or fear.
The American Psychiatric Publishing Textbook of Neuropsychiatry and Behavioral Neurosciences, Fifth EditionEdited by Yudofsky SC, Hales RE. © 2008 American Psychiatric Publishing, Inc. All rights reserved. www.appi.org
436
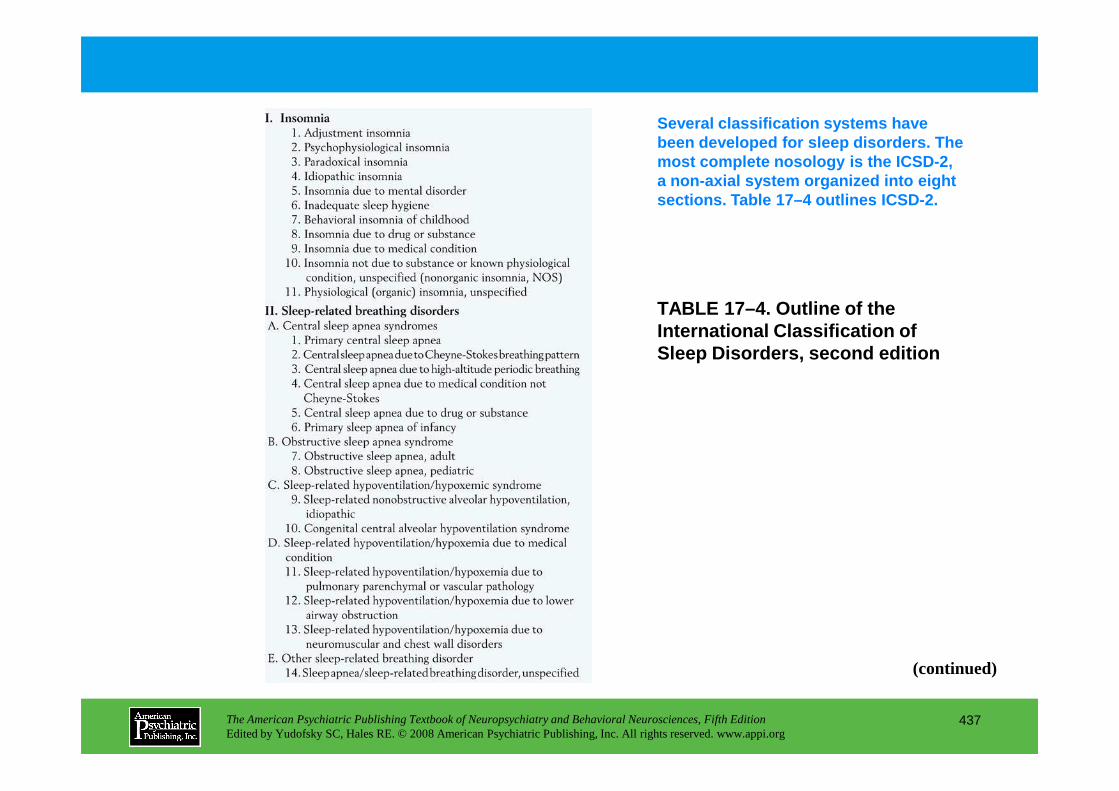
TABLE 17–4. Outline of the International Classification of Sleep Disorders, second edition
Several classification systems have been developed for sleep disorders. The most complete nosology is the ICSD-2, a non-axial system organized into eight sections. Table 17–4 outlines ICSD-2.
The American Psychiatric Publishing Textbook of Neuropsychiatry and Behavioral Neurosciences, Fifth EditionEdited by Yudofsky SC, Hales RE. © 2008 American Psychiatric Publishing, Inc. All rights reserved. www.appi.org
437
(continued)
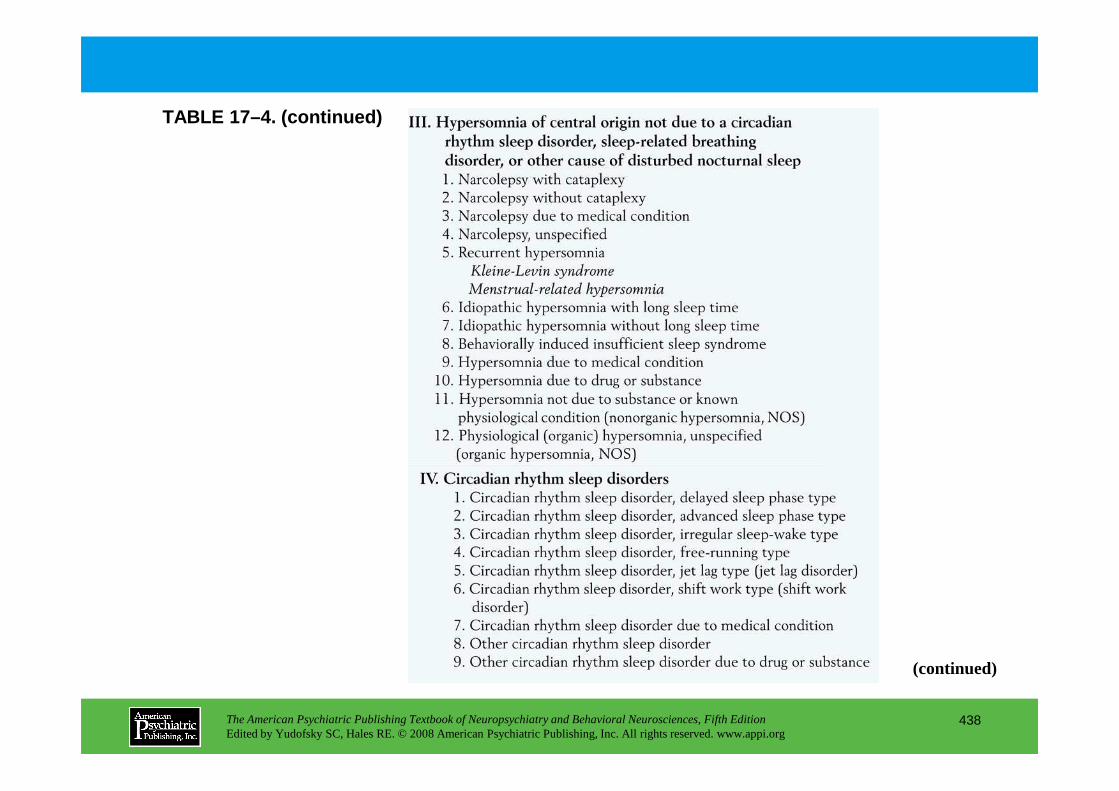
TABLE 17–4. (continued)
The American Psychiatric Publishing Textbook of Neuropsychiatry and Behavioral Neurosciences, Fifth EditionEdited by Yudofsky SC, Hales RE. © 2008 American Psychiatric Publishing, Inc. All rights reserved. www.appi.org
438
(continued)
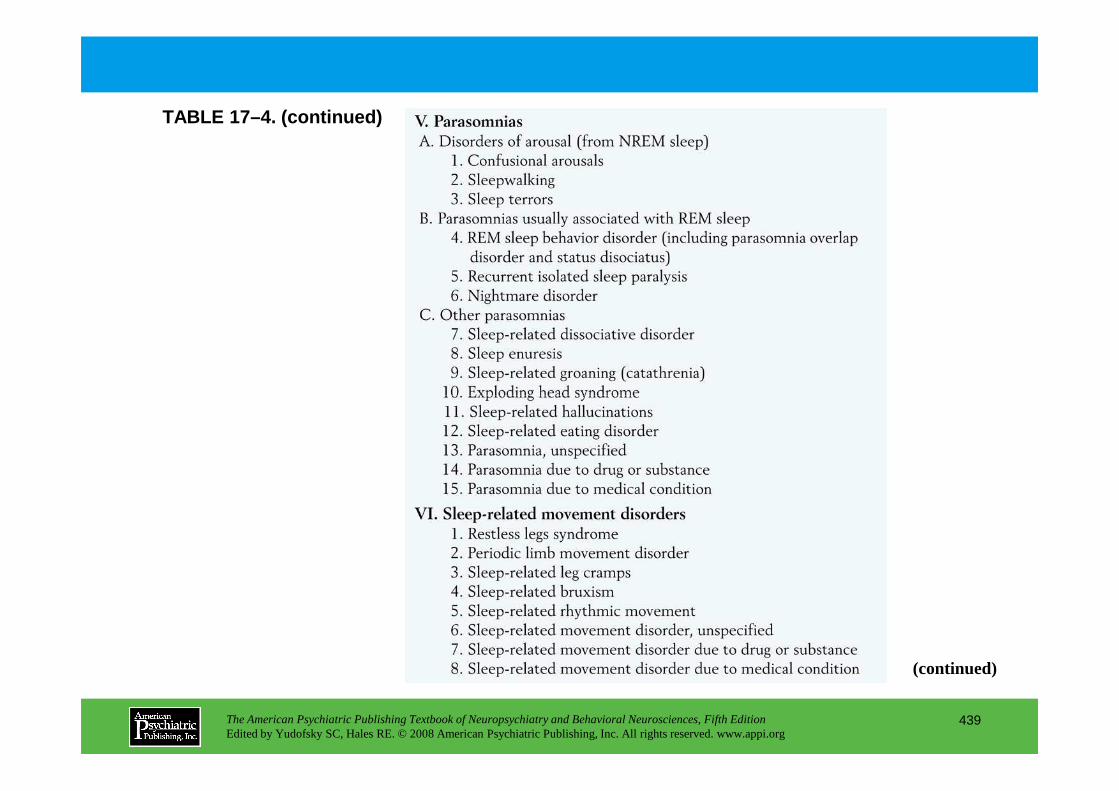
TABLE 17–4. (continued)
The American Psychiatric Publishing Textbook of Neuropsychiatry and Behavioral Neurosciences, Fifth EditionEdited by Yudofsky SC, Hales RE. © 2008 American Psychiatric Publishing, Inc. All rights reserved. www.appi.org
439
(continued)

TABLE 17–4. (continued)
The American Psychiatric Publishing Textbook of Neuropsychiatry and Behavioral Neurosciences, Fifth EditionEdited by Yudofsky SC, Hales RE. © 2008 American Psychiatric Publishing, Inc. All rights reserved. www.appi.org
440

FIGURE 17–5. Spielman’s dynamic model of insomnia.
Figure 17–5 shows a dynamic model of insomnia. In t his model, an individual’s threshold for sleeplessness interacts with three factors: predisp osition, a precipitating event such as job stress, and perpetuating factors such as habits not consistent with good quality sleep.
Source.Adapted from Spielman et al. 1987a.
The American Psychiatric Publishing Textbook of Neuropsychiatry and Behavioral Neurosciences, Fifth EditionEdited by Yudofsky SC, Hales RE. © 2008 American Psychiatric Publishing, Inc. All rights reserved. www.appi.org
441

FIGURE 17–6. Proportions for the most common insomnias (A), hypersomnias (B), and parasomnias (C) seen in sleep disorders centers.
The most common primary diagnoses seen at sleep dis order centers are psychiatric disorders, psychophysiological insomnia, drug and alcohol depe ndence, limb movement disorders, sleep-state misperception, and sleep-disordered breathing . Figure 17–6 shows the proportions.
PLMD=periodic limb movement disorder; RLS=restless legs
The American Psychiatric Publishing Textbook of Neuropsychiatry and Behavioral Neurosciences, Fifth EditionEdited by Yudofsky SC, Hales RE. © 2008 American Psychiatric Publishing, Inc. All rights reserved. www.appi.org
442
disorder; RLS=restless legs syndrome.
Source.Adapted from Coleman et al. 1982.
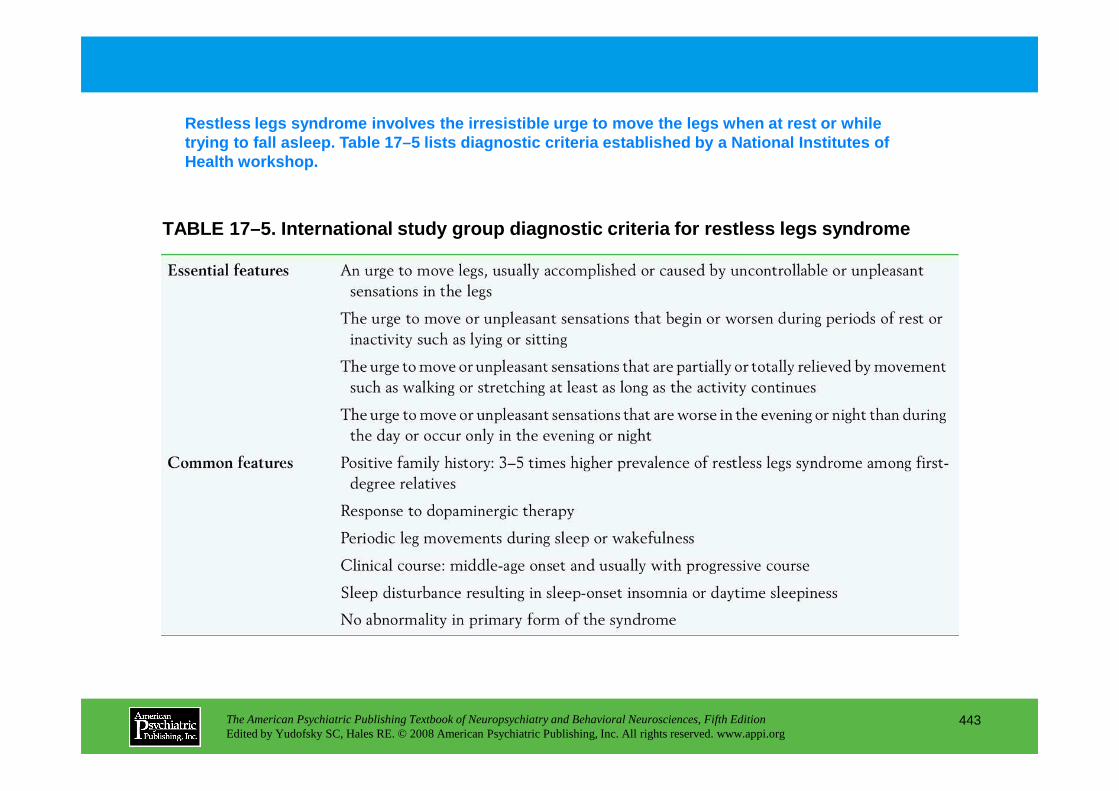
TABLE 17–5. International study group diagnostic cr iteria for restless legs syndrome
Restless legs syndrome involves the irresistible ur ge to move the legs when at rest or while trying to fall asleep. Table 17–5 lists diagnostic criteria established by a National Institutes of Health workshop.
The American Psychiatric Publishing Textbook of Neuropsychiatry and Behavioral Neurosciences, Fifth EditionEdited by Yudofsky SC, Hales RE. © 2008 American Psychiatric Publishing, Inc. All rights reserved. www.appi.org
443
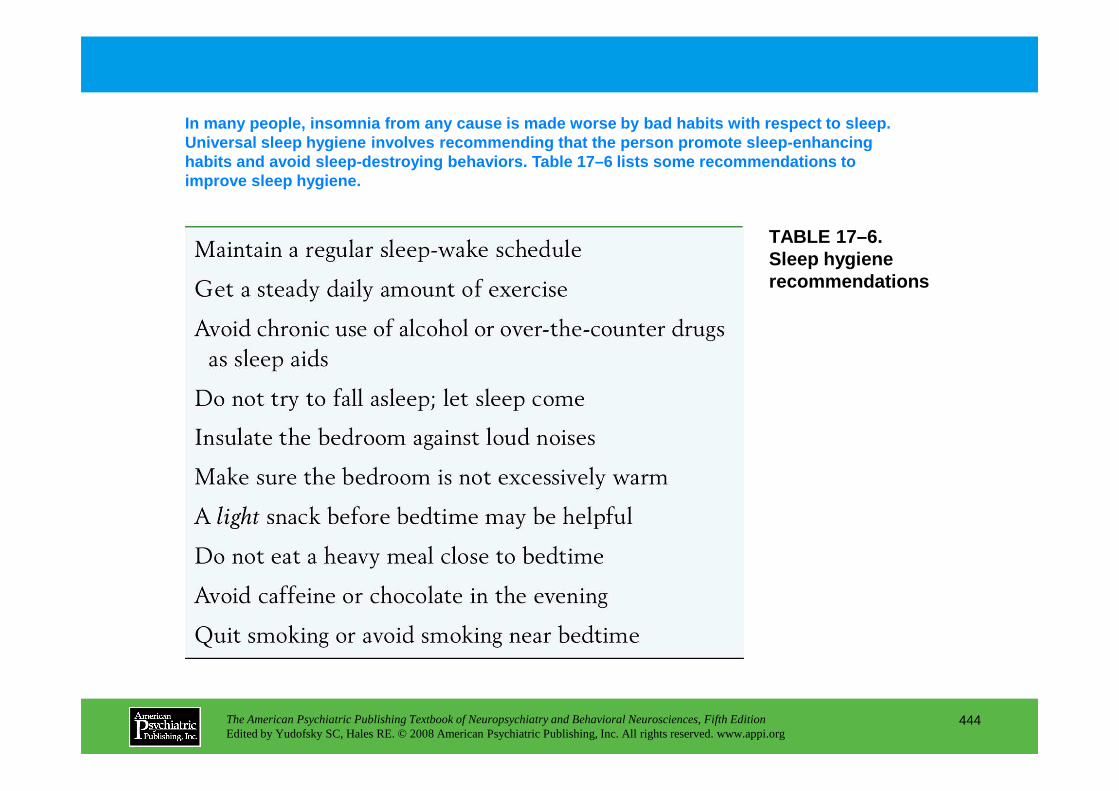
TABLE 17–6.Sleep hygiene recommendations
In many people, insomnia from any cause is made wor se by bad habits with respect to sleep. Universal sleep hygiene involves recommending that the person promote sleep-enhancing habits and avoid sleep-destroying behaviors. Table 17–6 lists some recommendations to improve sleep hygiene.
The American Psychiatric Publishing Textbook of Neuropsychiatry and Behavioral Neurosciences, Fifth EditionEdited by Yudofsky SC, Hales RE. © 2008 American Psychiatric Publishing, Inc. All rights reserved. www.appi.org
444
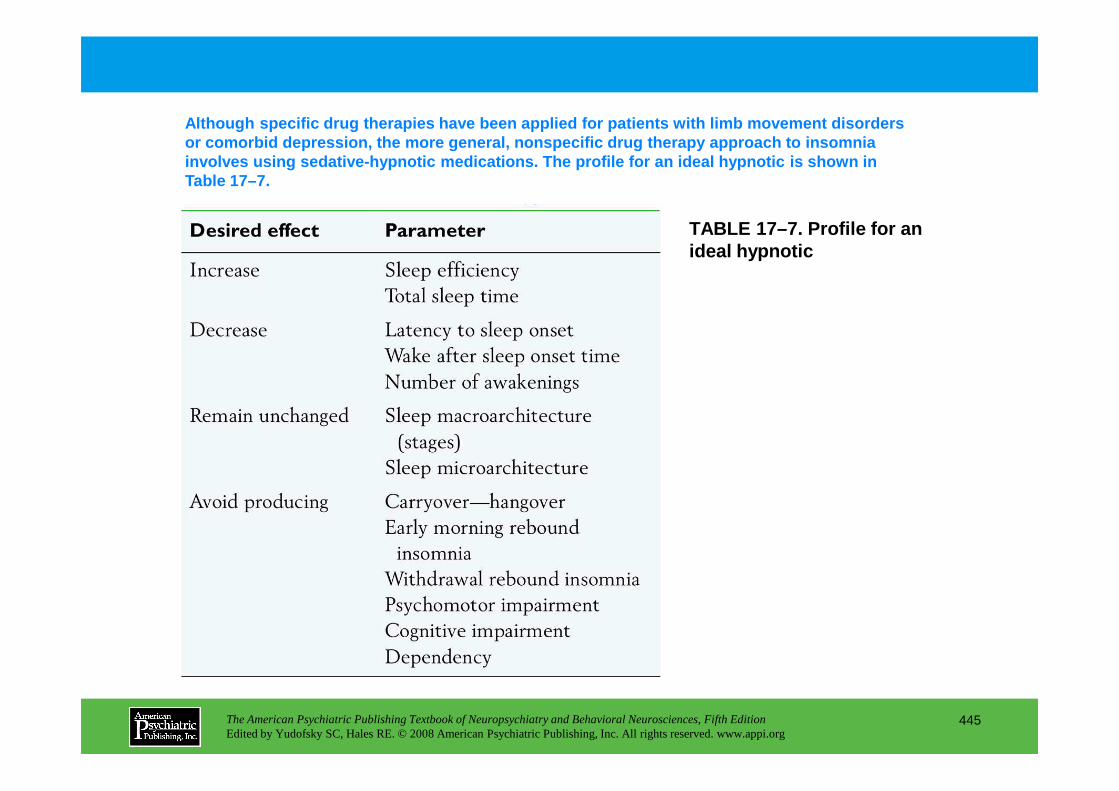
TABLE 17–7. Profile for an ideal hypnotic
Although specific drug therapies have been applied for patients with limb movement disorders or comorbid depression, the more general, nonspecif ic drug therapy approach to insomnia involves using sedative-hypnotic medications. The p rofile for an ideal hypnotic is shown in Table 17–7.
The American Psychiatric Publishing Textbook of Neuropsychiatry and Behavioral Neurosciences, Fifth EditionEdited by Yudofsky SC, Hales RE. © 2008 American Psychiatric Publishing, Inc. All rights reserved. www.appi.org
445
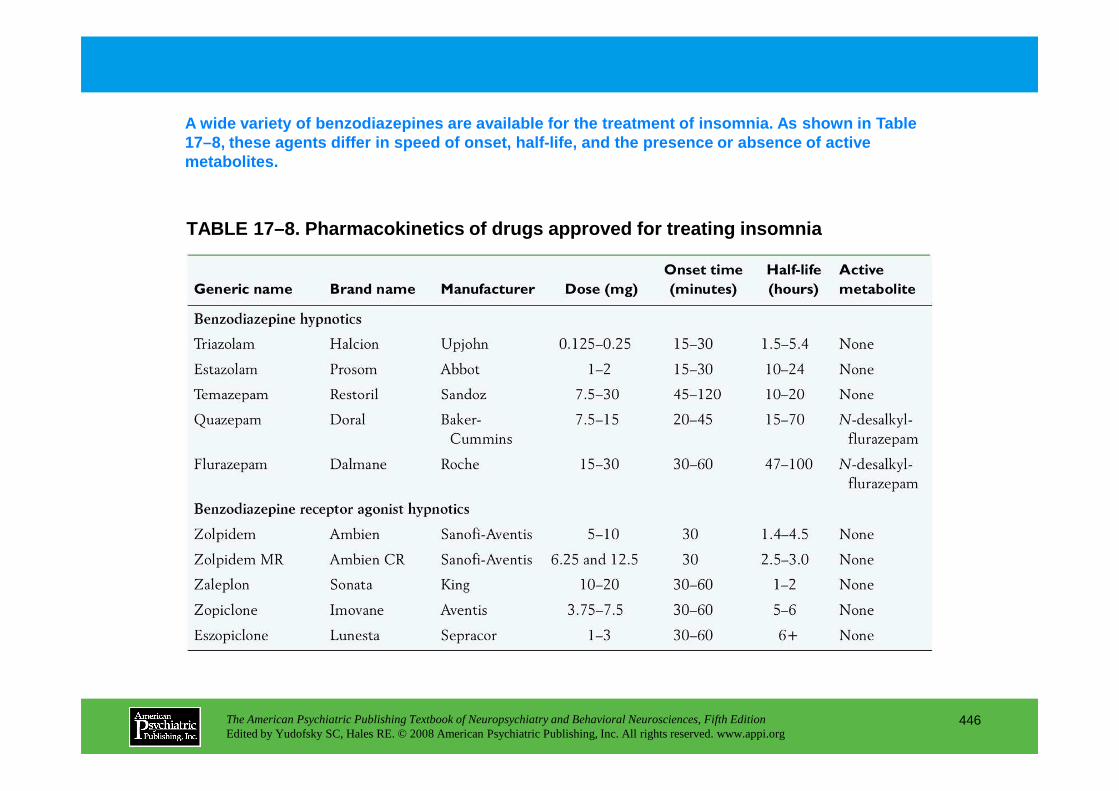
TABLE 17–8. Pharmacokinetics of drugs approved for treating insomnia
A wide variety of benzodiazepines are available for t he treatment of insomnia. As shown in Table 17–8, these agents differ in speed of onset, half-l ife, and the presence or absence of active metabolites.
The American Psychiatric Publishing Textbook of Neuropsychiatry and Behavioral Neurosciences, Fifth EditionEdited by Yudofsky SC, Hales RE. © 2008 American Psychiatric Publishing, Inc. All rights reserved. www.appi.org
446
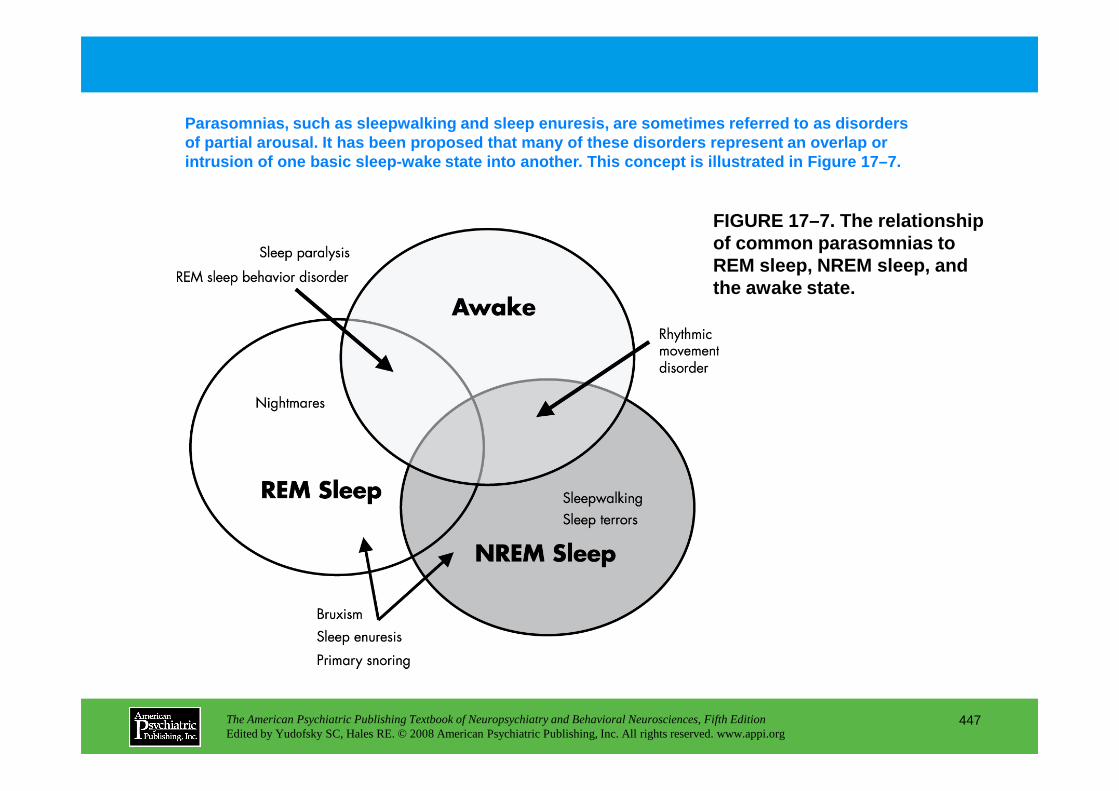
FIGURE 17–7. The relationship of common parasomnias to REM sleep, NREM sleep, and the awake state.
Parasomnias, such as sleepwalking and sleep enuresi s, are sometimes referred to as disorders of partial arousal. It has been proposed that many of these disorders represent an overlap or intrusion of one basic sleep-wake state into anothe r. This concept is illustrated in Figure 17–7.
The American Psychiatric Publishing Textbook of Neuropsychiatry and Behavioral Neurosciences, Fifth EditionEdited by Yudofsky SC, Hales RE. © 2008 American Psychiatric Publishing, Inc. All rights reserved. www.appi.org
447
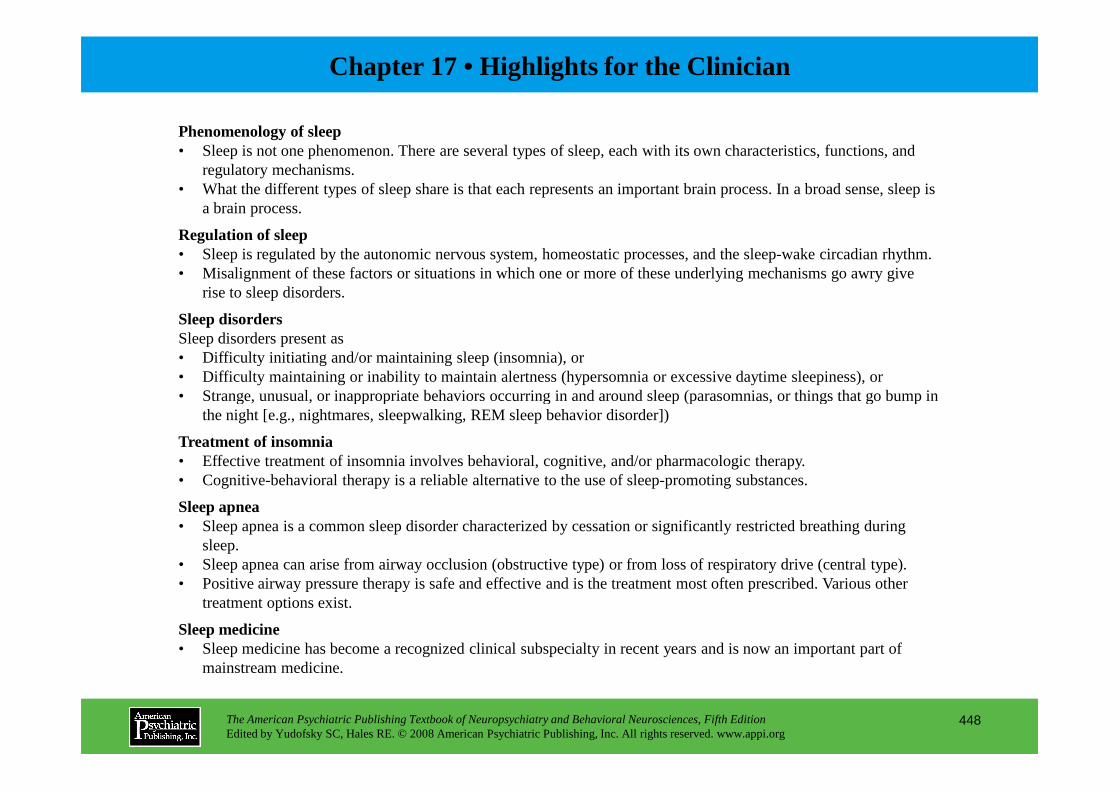
Chapter 17 • Highlights for the Clinician
Phenomenology of sleep• Sleep is not one phenomenon. There are several types of sleep, each with its own characteristics, functions, and
regulatory mechanisms.• What the different types of sleep share is that each represents an important brain process. In a broad sense, sleep is
a brain process.
Regulation of sleep• Sleep is regulated by the autonomic nervous system, homeostatic processes, and the sleep-wake circadian rhythm. • Misalignment of these factors or situations in which one or more of these underlying mechanisms go awry give
rise to sleep disorders.
Sleep disordersSleep disorders present as• Difficulty initiating and/or maintaining sleep (insomnia), or • Difficulty maintaining or inability to maintain alertness (hypersomnia or excessive daytime sleepiness), or• Strange, unusual, or inappropriate behaviors occurring in and around sleep (parasomnias, or things that go bump in
The American Psychiatric Publishing Textbook of Neuropsychiatry and Behavioral Neurosciences, Fifth EditionEdited by Yudofsky SC, Hales RE. © 2008 American Psychiatric Publishing, Inc. All rights reserved. www.appi.org
448
• Strange, unusual, or inappropriate behaviors occurring in and around sleep (parasomnias, or things that go bump in the night [e.g., nightmares, sleepwalking, REM sleep behavior disorder])
Treatment of insomnia• Effective treatment of insomnia involves behavioral, cognitive, and/or pharmacologic therapy. • Cognitive-behavioral therapy is a reliable alternative to the use of sleep-promoting substances.
Sleep apnea• Sleep apnea is a common sleep disorder characterized by cessation or significantly restricted breathing during
sleep. • Sleep apnea can arise from airway occlusion (obstructive type) or from loss of respiratory drive (central type). • Positive airway pressure therapy is safe and effective and is the treatment most often prescribed. Various other
treatment options exist.
Sleep medicine• Sleep medicine has become a recognized clinical subspecialty in recent years and is now an important part of
mainstream medicine.

CHAPTER 18
NEUROPSYCHIATRIC ASPECTS OF CEREBROVASCULAR DISORDERS
Robert G. Robinson, M.D.Sergio E. Starkstein, M.D., Ph.D.
The American Psychiatric Publishing Textbook of Neuropsychiatry and Behavioral Neurosciences, Fifth EditionEdited by Yudofsky SC, Hales RE. © 2008 American Psychiatric Publishing, Inc. All rights reserved. www.appi.org
449
Slide Show
Topic headings and reading list
Tables and figures
Highlights for the clinician
Main menu
(About, Contents, Contributors, Publishing facts)

Historical Perspective
Classification of Cerebrovascular DiseaseAtherosclerotic ThrombosisCerebral EmbolismLacunaeIntracerebral HemorrhageAneurysms and Arteriovenous MalformationsSubdural and Epidural HematomasOther Types of Cerebrovascular Disease
Neuropsychiatric Syndromes Associated With Cerebrovascular DiseasePoststroke Depression
DiagnosisPhenomenology
Poststroke ManiaPhenomenology of Secondary ManiaLesion LocationRisk FactorsMechanism of Secondary ManiaTreatment of Secondary Mania
Poststroke Bipolar DisorderPoststroke Anxiety DisorderPoststroke PsychosisApathyCatastrophic ReactionPathological EmotionsAprosody
Conclusion
CHAPTER 18 • Topics and Readings
The American Psychiatric Publishing Textbook of Neuropsychiatry and Behavioral Neurosciences, Fifth EditionEdited by Yudofsky SC, Hales RE. © 2008 American Psychiatric Publishing, Inc. All rights reserved. www.appi.org
450
PhenomenologyPrevalenceDurationRelationship to Lesion VariablesPremorbid Risk FactorsRelationship to Physical ImpairmentRelationship to Cognitive ImpairmentMechanism of Poststroke DepressionTreatment of Poststroke DepressionPsychosocial Adjustment
Conclusion
RECOMMENDED READINGSRobinson RG: The Clinical Neuropsychiatry of Stroke, 2nd Edition.
Cambridge, UK, Cambridge University Press, 2006Whyte EM, Mulsant BH: Poststroke depression: epidemiology,
pathophysiology and biological treatment. Biol Psychiatry 52:253–264, 2002
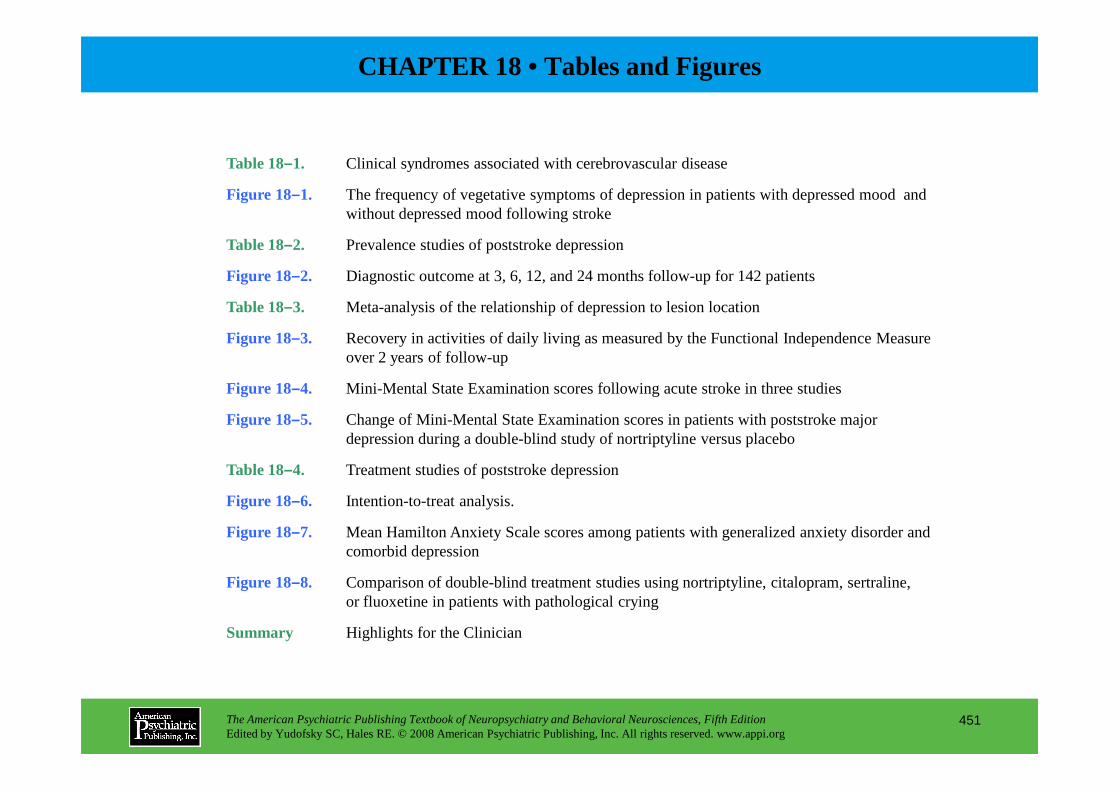
CHAPTER 18 • Tables and Figures
Table 18–1. Clinical syndromes associated with cerebrovascular disease
Figure 18–1. The frequency of vegetative symptoms of depression in patients with depressed mood and without depressed mood following stroke
Table 18–2. Prevalence studies of poststroke depression
Figure 18–2. Diagnostic outcome at 3, 6, 12, and 24 months follow-up for 142 patients
Table 18–3. Meta-analysis of the relationship of depression to lesion location
Figure 18–3. Recovery in activities of daily living as measured by the Functional Independence Measure over 2 years of follow-up
Figure 18–4. Mini -Mental State Examination scores following acute stroke in three studies
The American Psychiatric Publishing Textbook of Neuropsychiatry and Behavioral Neurosciences, Fifth EditionEdited by Yudofsky SC, Hales RE. © 2008 American Psychiatric Publishing, Inc. All rights reserved. www.appi.org
451
Figure 18–4. Mini -Mental State Examination scores following acute stroke in three studies
Figure 18–5. Change of Mini-Mental State Examination scores in patients with poststroke major depression during a double-blind study of nortriptyline versus placebo
Table 18–4. Treatment studies of poststroke depression
Figure 18–6. Intention-to-treat analysis.
Figure 18–7. Mean Hamilton Anxiety Scale scores among patients with generalized anxiety disorder and comorbid depression
Figure 18–8. Comparison of double-blind treatment studies using nortriptyline, citalopram, sertraline, or fluoxetine in patients with pathological crying
Summary Highlights for the Clinician
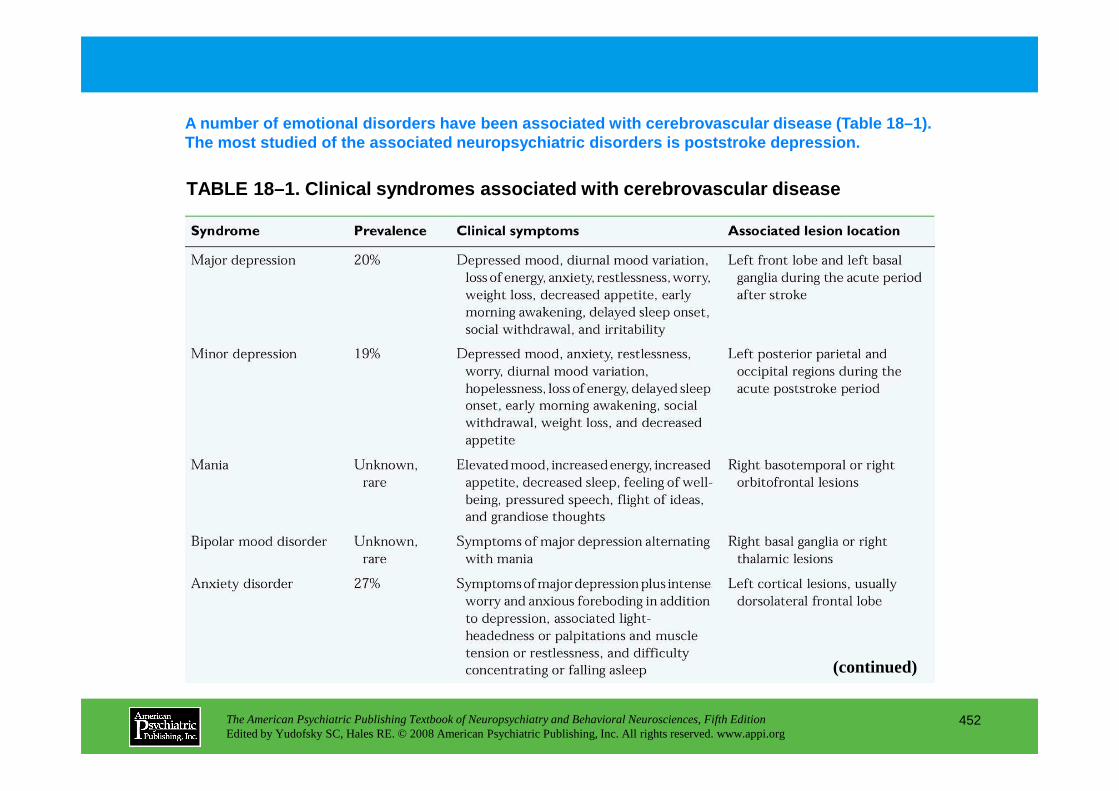
TABLE 18–1. Clinical syndromes associated with cere brovascular disease
A number of emotional disorders have been associate d with cerebrovascular disease (Table 18–1). The most studied of the associated neuropsychiatric disorders is poststroke depression.
The American Psychiatric Publishing Textbook of Neuropsychiatry and Behavioral Neurosciences, Fifth EditionEdited by Yudofsky SC, Hales RE. © 2008 American Psychiatric Publishing, Inc. All rights reserved. www.appi.org
452
(continued)
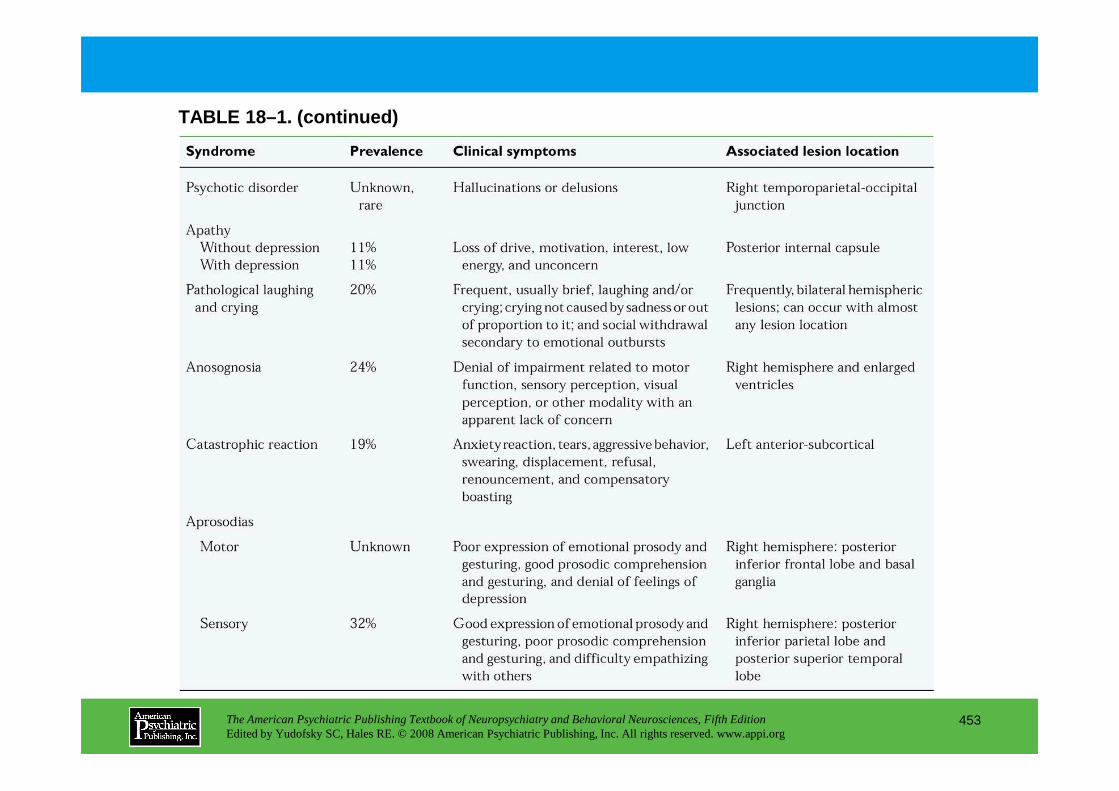
TABLE 18–1. (continued)
The American Psychiatric Publishing Textbook of Neuropsychiatry and Behavioral Neurosciences, Fifth EditionEdited by Yudofsky SC, Hales RE. © 2008 American Psychiatric Publishing, Inc. All rights reserved. www.appi.org
453

FIGURE 18–1. The frequency of vegetative symptoms of depression in patients with depressed mood (Dep) and without depressed mood (Non-Dep) following stroke.
The frequency of vegetative symptoms in poststroke depression, in the hospital and at follow-up visits in a 2-year study, is shown in Figure 18– 1.
Symptom frequency is shown over the 2-year follow-up. Morning depression (i.e., diurnal mood variation) and anergia were associated with depression through the entire 2-year period. Loss of libido was only seen
The American Psychiatric Publishing Textbook of Neuropsychiatry and Behavioral Neurosciences, Fifth EditionEdited by Yudofsky SC, Hales RE. © 2008 American Psychiatric Publishing, Inc. All rights reserved. www.appi.org
454
the entire 2-year period. Loss of libido was only seen early in the follow-up, whereas early morning awakening was only seen late in the follow-up. These findings suggest changes over time in both the effects of chronic medical illness and the phenomenology of depression following stroke. Auton anx=autonomic anxiety; Anxious forebod=anxious foreboding; Morning dep=morning depression; Sleep dis=sleep disturbance; Early awake=early morning awakening; Loss libido=loss of libido.
Source. Reprinted from Robinson RG: The Clinical Neuropsychiatry of Stroke, 2nd Edition.Cambridge, UK, Cambridge University Press, 2006, p. 70 (data taken from Paradiso et al. 1997). Used with permission.

FIGURE 18–1 (enlarged)
The American Psychiatric Publishing Textbook of Neuropsychiatry and Behavioral Neurosciences, Fifth EditionEdited by Yudofsky SC, Hales RE. © 2008 American Psychiatric Publishing, Inc. All rights reserved. www.appi.org
455
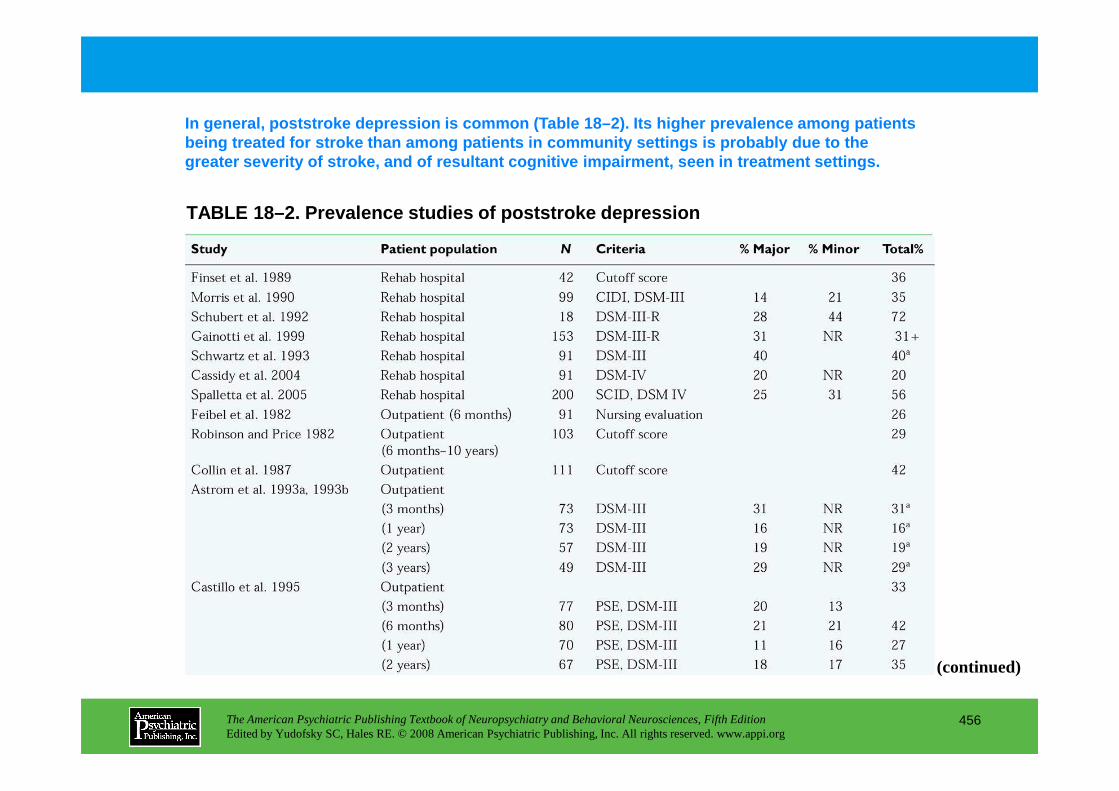
TABLE 18–2. Prevalence studies of poststroke depres sion
In general, poststroke depression is common (Table 18–2). Its higher prevalence among patients being treated for stroke than among patients in com munity settings is probably due to the greater severity of stroke, and of resultant cognit ive impairment, seen in treatment settings.
The American Psychiatric Publishing Textbook of Neuropsychiatry and Behavioral Neurosciences, Fifth EditionEdited by Yudofsky SC, Hales RE. © 2008 American Psychiatric Publishing, Inc. All rights reserved. www.appi.org
456
(continued)

TABLE 18–2 (continued)
The American Psychiatric Publishing Textbook of Neuropsychiatry and Behavioral Neurosciences, Fifth EditionEdited by Yudofsky SC, Hales RE. © 2008 American Psychiatric Publishing, Inc. All rights reserved. www.appi.org
457
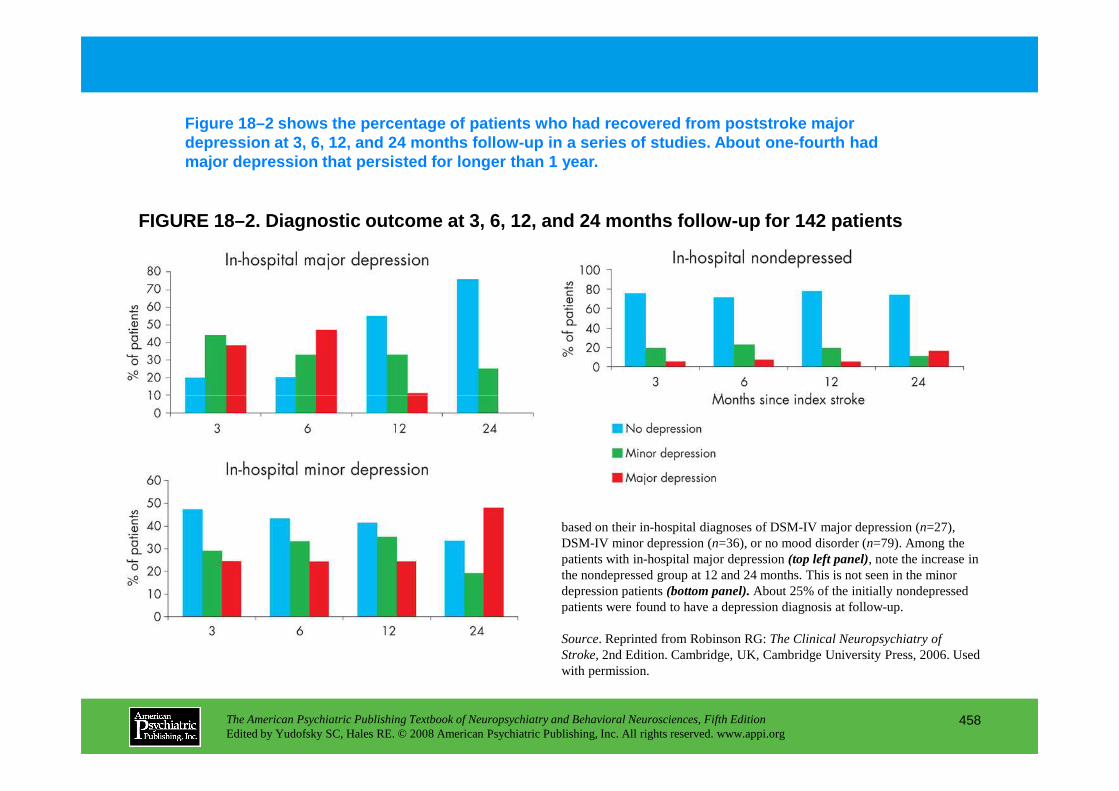
FIGURE 18–2. Diagnostic outcome at 3, 6, 12, and 24 months follow-up for 142 patients
Figure 18–2 shows the percentage of patients who ha d recovered from poststroke major depression at 3, 6, 12, and 24 months follow-up in a series of studies. About one-fourth had major depression that persisted for longer than 1 ye ar.
The American Psychiatric Publishing Textbook of Neuropsychiatry and Behavioral Neurosciences, Fifth EditionEdited by Yudofsky SC, Hales RE. © 2008 American Psychiatric Publishing, Inc. All rights reserved. www.appi.org
458
based on their in-hospital diagnoses of DSM-IV major depression (n=27), DSM-IV minor depression (n=36), or no mood disorder (n=79). Among the patients with in-hospital major depression (top left panel), note the increase in the nondepressed group at 12 and 24 months. This is not seen in the minor depression patients (bottom panel).About 25% of the initially nondepressed patients were found to have a depression diagnosis at follow-up.
Source. Reprinted from Robinson RG: The Clinical Neuropsychiatry of Stroke,2nd Edition. Cambridge, UK, Cambridge University Press, 2006. Used with permission.
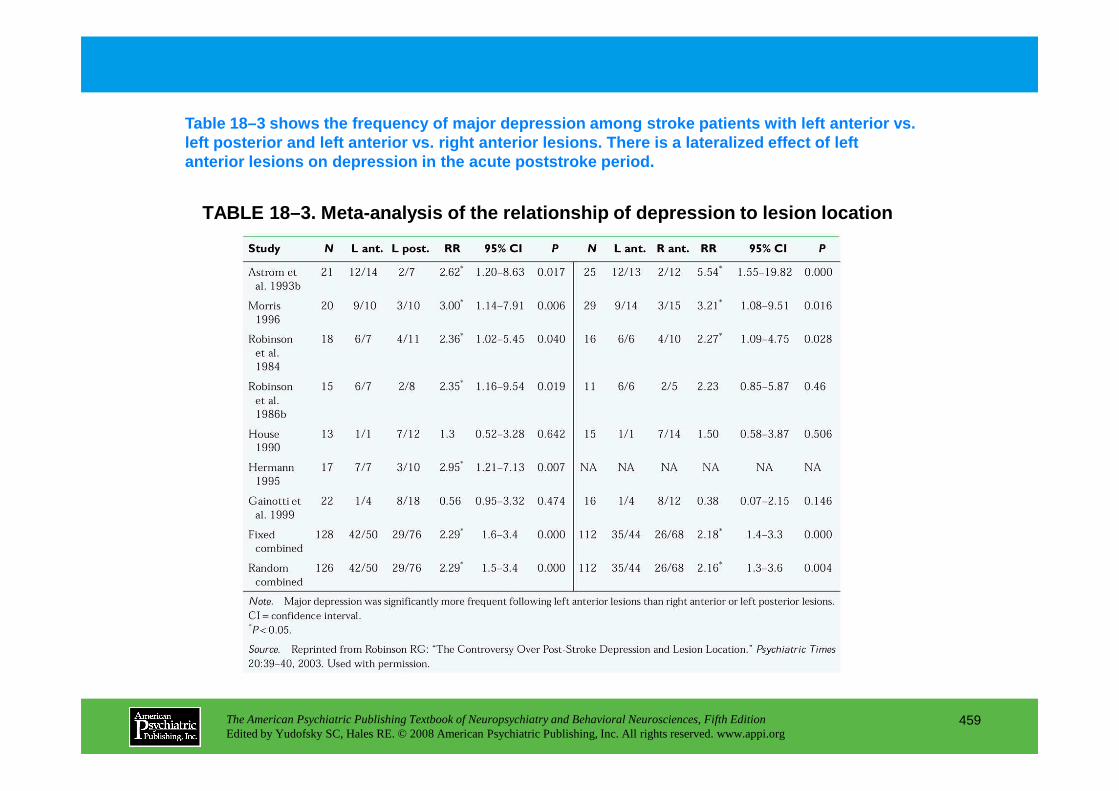
TABLE 18–3. Meta-analysis of the relationship of de pression to lesion location
Table 18–3 shows the frequency of major depression among stroke patients with left anterior vs. left posterior and left anterior vs. right anterior lesions. There is a lateralized effect of left anterior lesions on depression in the acute poststr oke period.
The American Psychiatric Publishing Textbook of Neuropsychiatry and Behavioral Neurosciences, Fifth EditionEdited by Yudofsky SC, Hales RE. © 2008 American Psychiatric Publishing, Inc. All rights reserved. www.appi.org
459

FIGURE 18–3. Recovery in activities of daily living as measured by the Functional Independence Measure (FIM) over 2 years of follow-u p.
In this study, “early” vs. “late” antidepressant treatm ent was the only variable that predicted depressed stroke patients’ activities of daily livi ng scores at 2-year follow-up (Figure 18–3).
All patients were treated for 12 weeks in a double-blind study with fluoxetine or nortriptyline. Patients who received treatment within 1 month poststroke (mean 2 weeks, “Early”) improved significantly more than those who received treatment after the first month poststroke (mean 12 weeks, “Late”). FIM scores were measured at the same
The American Psychiatric Publishing Textbook of Neuropsychiatry and Behavioral Neurosciences, Fifth EditionEdited by Yudofsky SC, Hales RE. © 2008 American Psychiatric Publishing, Inc. All rights reserved. www.appi.org
460
FIM scores were measured at the same times following stroke to control for group differences in time since stroke when the 3-month treatment was given.*Intention to treat, P=0.02. Efficacy, P=0.02.
Source. Reprinted from Robinson RG: The Clinical Neuropsychiatry of Stroke, 2nd Edition.Cambridge, UK, Cambridge University Press, 2006. Used with permission.
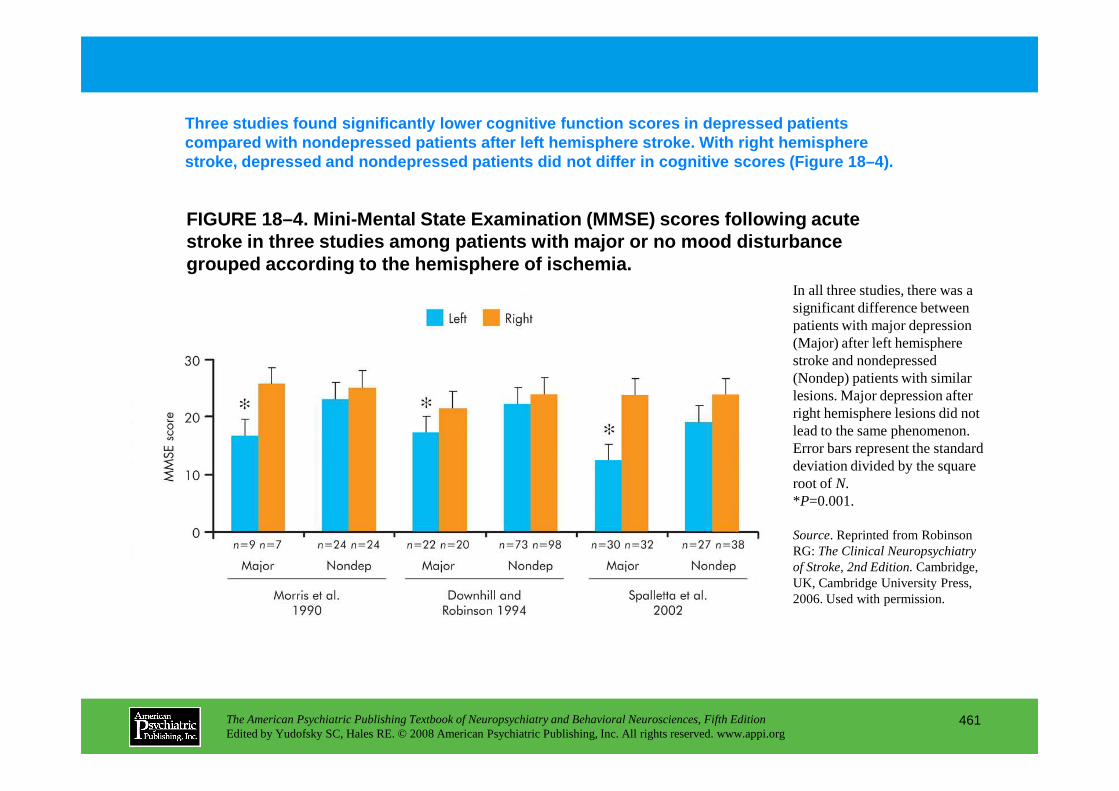
FIGURE 18–4. Mini-Mental State Examination (MMSE) s cores following acute stroke in three studies among patients with major o r no mood disturbance grouped according to the hemisphere of ischemia.
Three studies found significantly lower cognitive f unction scores in depressed patients compared with nondepressed patients after left hemi sphere stroke. With right hemisphere stroke, depressed and nondepressed patients did not differ in cognitive scores (Figure 18–4).
In all three studies, there was a significant difference between patients with major depression (Major) after left hemisphere stroke and nondepressed (Nondep) patients with similar lesions. Major depression after
The American Psychiatric Publishing Textbook of Neuropsychiatry and Behavioral Neurosciences, Fifth EditionEdited by Yudofsky SC, Hales RE. © 2008 American Psychiatric Publishing, Inc. All rights reserved. www.appi.org
461
lesions. Major depression after right hemisphere lesions did not lead to the same phenomenon. Error bars represent the standard deviation divided by the square root of N.*P=0.001.
Source. Reprinted from Robinson RG: The Clinical Neuropsychiatry of Stroke, 2nd Edition.Cambridge, UK, Cambridge University Press, 2006. Used with permission.

FIGURE 18–5. Change of Mini-Mental State Examinatio n scores (MMSE) in patients with poststroke major depression during a double-bl ind treatment study of nortriptyline versus placebo.
Improvement in cognitive function scores was greate r in treatment responders than in nonresponders in this study of stroke patients with major depression (Figure 18–5). Findings of no difference in earlier studies were the result of effect size.
Treatment responders (n=15) showed significantly greater improvement in cognitive function than nonresponders (n=18) (P=0.0087). Error bars represent standard error of the mean (SE).
The American Psychiatric Publishing Textbook of Neuropsychiatry and Behavioral Neurosciences, Fifth EditionEdited by Yudofsky SC, Hales RE. © 2008 American Psychiatric Publishing, Inc. All rights reserved. www.appi.org
462
Source. Reprinted from Kimura M, Robinson RG, Kosier T: “Treatment of Cognitive Impairment After Poststroke Depression.” Stroke31:1482–1486, 2000. Used with permission.
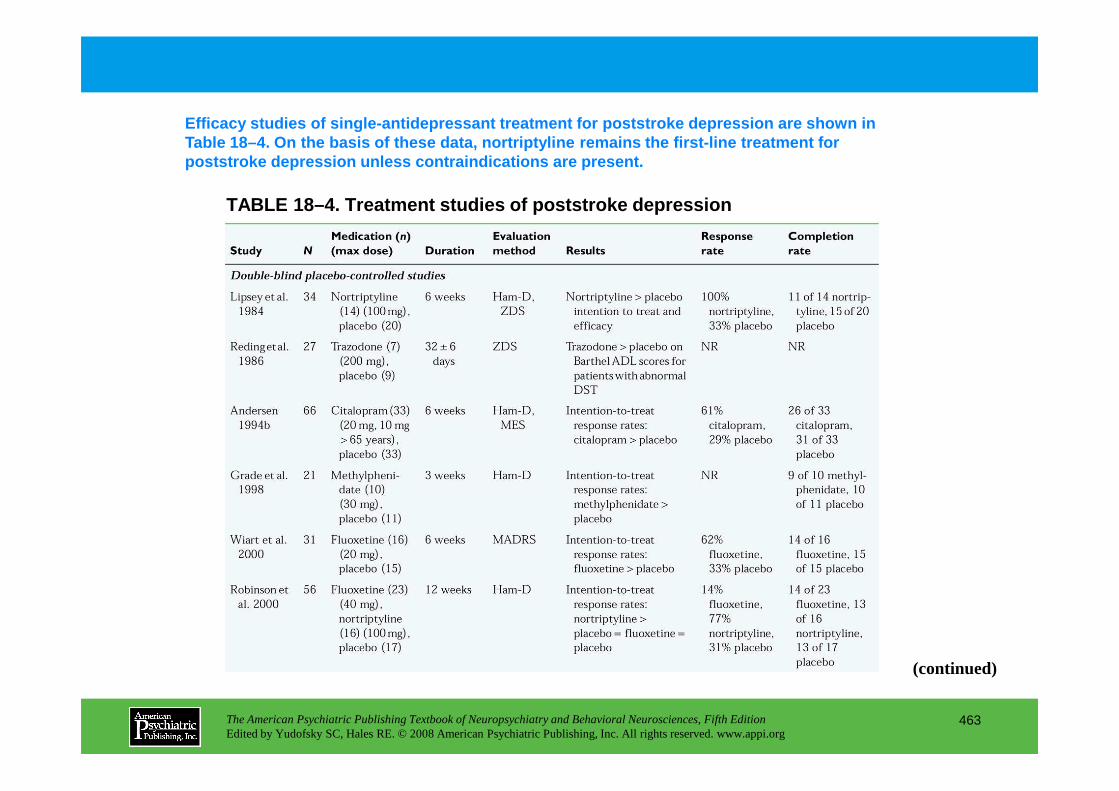
TABLE 18–4. Treatment studies of poststroke depress ion
Efficacy studies of single-antidepressant treatment for poststroke depression are shown in Table 18–4. On the basis of these data, nortriptyli ne remains the first-line treatment for poststroke depression unless contraindications are present.
The American Psychiatric Publishing Textbook of Neuropsychiatry and Behavioral Neurosciences, Fifth EditionEdited by Yudofsky SC, Hales RE. © 2008 American Psychiatric Publishing, Inc. All rights reserved. www.appi.org
463
(continued)
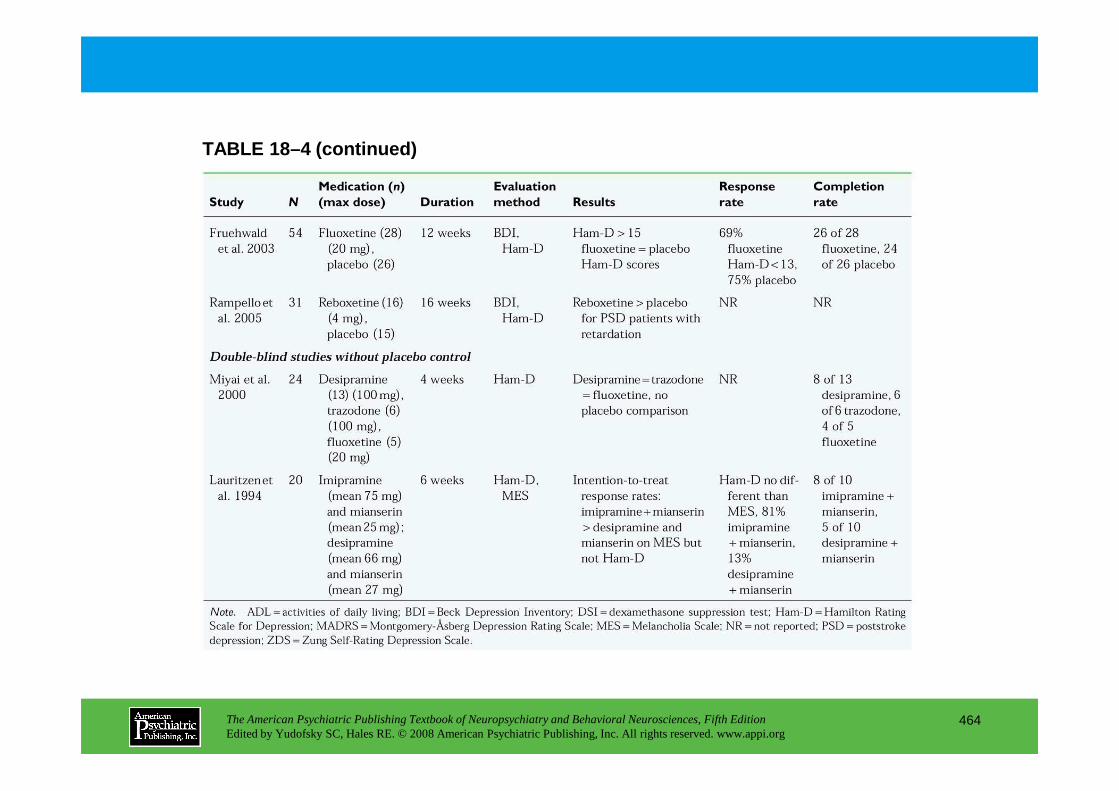
TABLE 18–4 (continued)
The American Psychiatric Publishing Textbook of Neuropsychiatry and Behavioral Neurosciences, Fifth EditionEdited by Yudofsky SC, Hales RE. © 2008 American Psychiatric Publishing, Inc. All rights reserved. www.appi.org
464

FIGURE 18–6. Intention-to-treat analysis.
Depressed stroke patients who received nortriptylin e had a significantly greater decline in depression scores than those who received fluoxetin e or placebo in an intention-to-treat analysis of a double-blind, randomized study (Figure 18–6).
Change in (28-item) Hamilton Rating Scale for Depression score over 12 weeks of treatment for all patients who were entered in the study. Error bars represent the standard deviation divided by the square root of N.*P<0.05 compared with fluoxetine or placebo.
The American Psychiatric Publishing Textbook of Neuropsychiatry and Behavioral Neurosciences, Fifth EditionEdited by Yudofsky SC, Hales RE. © 2008 American Psychiatric Publishing, Inc. All rights reserved. www.appi.org
465
fluoxetine or placebo.
Source. Reprinted from Robinson RG, Schultz SK, Castillo C, et al: “Nortriptyline Versus Fluoxetine in the Treatment of Depression and in Short Term Recovery After Stroke: A Placebo Controlled, Double-Blind Study.” American Journal of Psychiatry157:351–359, 2000. Used with permission.

FIGURE 18–7. Mean Hamilton Anxiety Scale scores amo ng patients with generalized anxiety disorder and comorbid depressio n after stroke following treatment with nortriptyline and placebo.
In a study of stroke patients with generalized anxie ty disorder and comorbid depression, anxiety scores improved more quickly with nortriptyline tre atment at doses of 50 mg, 75 mg, or 100 mg than with placebo (Figure 18–7).
The nortriptyline group (n=13) showed significantly greater improvement in anxiety symptoms than the placebo group (n=14) (P=0.002). Error bars represent standard error of
The American Psychiatric Publishing Textbook of Neuropsychiatry and Behavioral Neurosciences, Fifth EditionEdited by Yudofsky SC, Hales RE. © 2008 American Psychiatric Publishing, Inc. All rights reserved. www.appi.org
466
represent standard error of the mean (SE).*P<0.05; †P<0.01; ‡P<0.02.
Source. Reprinted from Kimura M, Robinson RG: “Treatment of Poststroke Generalized Anxiety Disorder Comorbid With Poststroke Depression: Merged Analysis of Nortriptyline Trials.” American Journal of Geriatric Psychiatry 11:320–327, 2003. Used with permission.
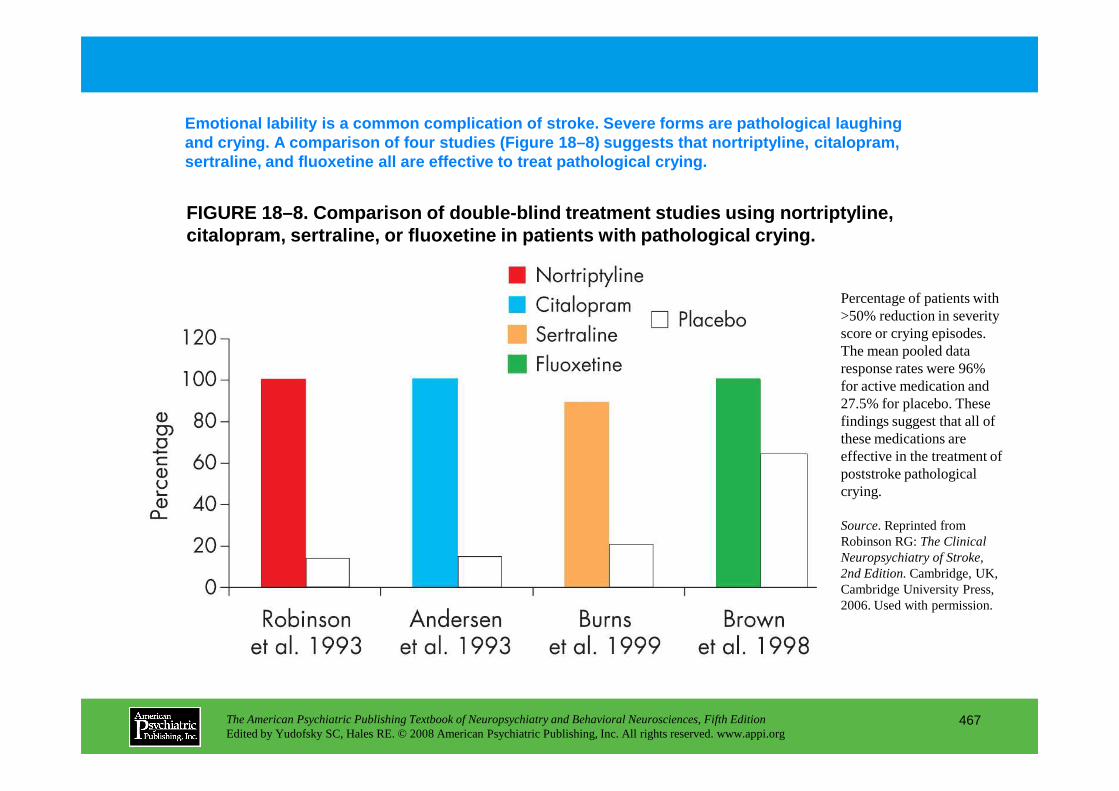
FIGURE 18–8. Comparison of double-blind treatment s tudies using nortriptyline, citalopram, sertraline, or fluoxetine in patients w ith pathological crying.
Emotional lability is a common complication of stro ke. Severe forms are pathological laughing and crying. A comparison of four studies (Figure 18 –8) suggests that nortriptyline, citalopram, sertraline, and fluoxetine all are effective to tre at pathological crying.
Percentage of patients with >50% reduction in severity score or crying episodes. The mean pooled data response rates were 96% for active medication and 27.5% for placebo. These
The American Psychiatric Publishing Textbook of Neuropsychiatry and Behavioral Neurosciences, Fifth EditionEdited by Yudofsky SC, Hales RE. © 2008 American Psychiatric Publishing, Inc. All rights reserved. www.appi.org
467
27.5% for placebo. These findings suggest that all of these medications are effective in the treatment of poststroke pathological crying.
Source. Reprinted from Robinson RG: The Clinical Neuropsychiatry of Stroke, 2nd Edition.Cambridge, UK, Cambridge University Press, 2006. Used with permission.

Chapter 18 • Highlights for the Clinician
Poststroke depression• Has repeatedly been shown to impair recovery in activities of daily living (ADL) over 2 years.• Impairs cognitive recovery over 2 years.• Eight double-blind treatment studies showed benefits of antidepressants on depression and/or
cognitive recovery.• Successful antidepressant treatment beginning within the first 2 months poststroke improved
recovery in ADL significantly more than late treatment or nonresponse to treatment.
Poststroke anxiety disorder• In combination with major depression, anxiety disorder has an additive effect on delaying recovery
in ADL and social functioning over 2 years.• One double-blind trial showed that antidepressants with an antianxiety component can
significantly reduce poststroke anxiety symptoms.
The American Psychiatric Publishing Textbook of Neuropsychiatry and Behavioral Neurosciences, Fifth EditionEdited by Yudofsky SC, Hales RE. © 2008 American Psychiatric Publishing, Inc. All rights reserved. www.appi.org
468
significantly reduce poststroke anxiety symptoms.
Pathological laughing and crying• Estimated prevalence across all studies was 15%.• Four double-blind treatment trials showed superiority of antidepressant treatment over placebo.
Apathy, denial of illness, catastrophic reactions, impaired emotional comprehension (aprosody)• All of these disorders occur in approximately 20% or more of stroke patients and can impede both
recovery and treatment efforts.
CHAPTER 19
NEUROPSYCHIATRIC ASPECTS OF BRAIN TUMORS
Trevor R. P. Price, M.D.Kenneth L. Goetz, M.D.Mark R. Lovell, Ph.D.
The American Psychiatric Publishing Textbook of Neuropsychiatry and Behavioral Neurosciences, Fifth EditionEdited by Yudofsky SC, Hales RE. © 2008 American Psychiatric Publishing, Inc. All rights reserved. www.appi.org
469
Slide Show
Topic headings and reading list
Tables and figures
Highlights for the clinician
Main menu
(About, Contents, Contributors, Publishing facts)
Mark R. Lovell, Ph.D.
Frequency of Neuropsychiatric Symptoms in Patients With Brain Tumors
General Neuropsychiatric and Neuropsychological Considerations in Relation to Brain TumorsGeneral Neuropsychiatric ConsiderationsGeneral Neuropsychological Considerations
Specific Neuropsychiatric and Neuropsychological Symptoms and Brain Tumor LocationTumors of the Frontal Lobe
Neuropsychiatric and Behavioral ManifestationsNeuropsychological Manifestations
Tumors of the Temporal Lobe
Laterality of Brain Tumors and Clinical Manifestati ons
Clinical DiagnosisGeneral Clinical Characteristics of Brain TumorsWhen to Suspect a Brain Tumor in a Psychiatric PatientDiagnostic Evaluation
Physical and Neurological ExaminationsCT ScansMRI ScansCisternographySkull FilmsCerebral AngiographyNeuropsychological TestingLumbar PunctureElectroencephalography
CHAPTER 19 • Topics and Readings
The American Psychiatric Publishing Textbook of Neuropsychiatry and Behavioral Neurosciences, Fifth EditionEdited by Yudofsky SC, Hales RE. © 2008 American Psychiatric Publishing, Inc. All rights reserved. www.appi.org
470
Tumors of the Temporal LobeNeuropsychiatric and Behavioral ManifestationsNeuropsychological Manifestations
Tumors of the Parietal LobeNeuropsychiatric and Behavioral ManifestationsNeuropsychological Manifestations
Tumors of the Occipital LobeNeuropsychiatric and Behavioral ManifestationsNeuropsychological Manifestations
Diencephalic TumorsNeuropsychiatric and Behavioral ManifestationsNeuropsychological Manifestations
Tumors of the Corpus CallosumPituitary TumorsTumors of the Posterior Fossa
ElectroencephalographyOther Testing
Treatment of Psychiatric and Behavioral Symptoms Associated With Cerebral TumorsGeneral ConsiderationsPharmacological Management of Patients With Primary Psychiatric
Disorders Who Develop Brain TumorsPsychotherapeutic Management of Syndromes Associated With
Brain TumorsSomatic Treatment of Mental Disorders Due to Brain TumorsDrug Treatment of Psychotic Disorders Due to Brain TumorsTreatment of Mood Disorders Due to Brain TumorsTreatment of Anxiety Disorders Due to Brain Tumors
(continued)

CHAPTER 19 • Topics and Readings (continued)
Treatment of Delirium Associated With Brain TumorsTreatment of Personality Changes Due to Brain TumorsCognitive Rehabilitation
Neuropsychiatric Consequences of Treatments of Brain Tumors
Conclusion
RECOMMENDED READINGSCummings J: Clinical Neuropsychiatry. Orlando, FL, Grune & Stratton,
1985Feinberg T, Frank M (eds): Behavioral Neurology and Neuropsychology.
New York, McGraw-Hill, 1997Jobe TH, Gaviria M: Clinical Neuropsychiatry. Oxford, UK, Blackwell
The American Psychiatric Publishing Textbook of Neuropsychiatry and Behavioral Neurosciences, Fifth EditionEdited by Yudofsky SC, Hales RE. © 2008 American Psychiatric Publishing, Inc. All rights reserved. www.appi.org
471
Jobe TH, Gaviria M: Clinical Neuropsychiatry. Oxford, UK, Blackwell Science, 1997
Kandel E, Schwartz J, Jessel T: Principles of Neural Science, 4th Edition. New York, McGraw-Hill, 2000
Lishman A, Malden MA: Organic Psychiatry: The Psychological Consequences of Cerebral Disorders, 3rd Edition. Oxford, UK, Blackwell Science, 1998
Mesulam M: Principles of Behavioral Neurology. Philadelphia, PA, FA Davis, 1986
Strub R, Black FW: Neurobehavioral Disorders: A Clinical Approach. Philadelphia, PA, FA Davis, 1988

CHAPTER 19 • Tables and Figures
Table 19–1. Relative frequencies of common histological types of brain tumors
Table 19–2. Relative frequencies of metastatic brain tumors by site of the primary lesion
Figure 19–1. Relative frequency of intracranial brain tumors according to location in the adult
Figure 19–2. Topographical distribution of intracranial tumors in the adult
Figure 19–3. Comparison of incidence of mental symptoms in 110 patients with tumors of the temporal lobe and in 64 patients with tumors of the frontal lobe
Table 19–3. Neurological and neuropsychological findings with localizing value
Figure 19–4. Diffuse metastatic disease (small cell carcinoma of the lung) in a 66-year-old man, as seen with magnetic resonance imaging
The American Psychiatric Publishing Textbook of Neuropsychiatry and Behavioral Neurosciences, Fifth EditionEdited by Yudofsky SC, Hales RE. © 2008 American Psychiatric Publishing, Inc. All rights reserved. www.appi.org
472
with magnetic resonance imaging
Figure 19–5. Brain images of a 50-year-old man with a multicentric glioma
Figure 19–6. Brain images of a 70-year-old man with a meningioma
Figure 19–7. Single-photon emission computed tomography scans of a patient with recurrent glioblastoma
Figure 19–8. Single-photon emission computed tomography scans of a patient after radiation of a left occipital tumor
Summary Highlights for the Clinician
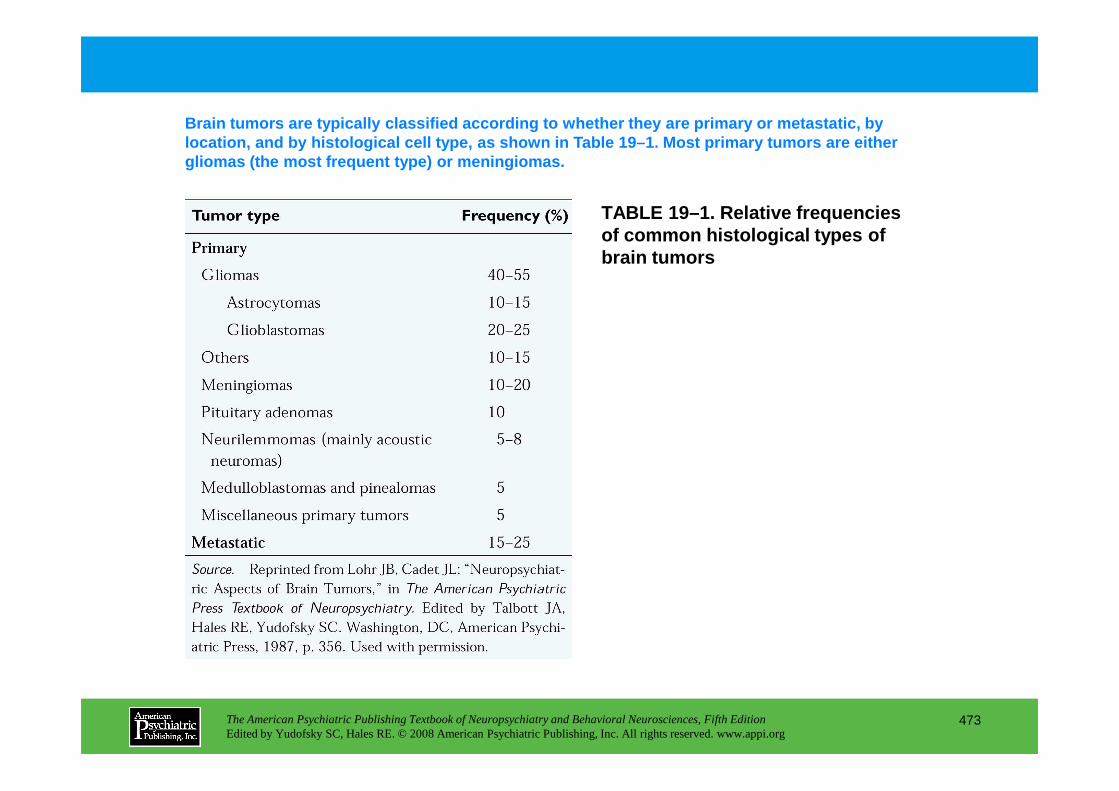
TABLE 19–1. Relative frequencies of common histological types of brain tumors
Brain tumors are typically classified according to whether they are primary or metastatic, by location, and by histological cell type, as shown i n Table 19–1. Most primary tumors are either gliomas (the most frequent type) or meningiomas.
The American Psychiatric Publishing Textbook of Neuropsychiatry and Behavioral Neurosciences, Fifth EditionEdited by Yudofsky SC, Hales RE. © 2008 American Psychiatric Publishing, Inc. All rights reserved. www.appi.org
473
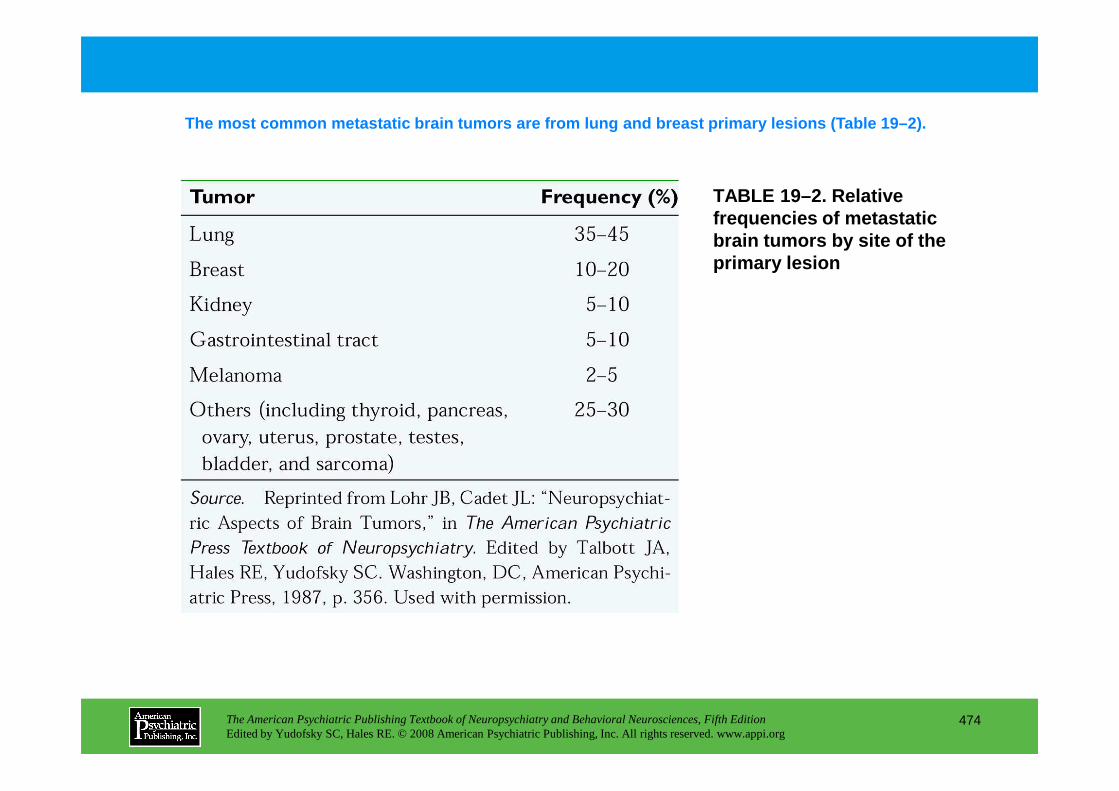
TABLE 19–2. Relative frequencies of metastatic brain tumors by site of the primary lesion
The most common metastatic brain tumors are from lu ng and breast primary lesions (Table 19–2).
The American Psychiatric Publishing Textbook of Neuropsychiatry and Behavioral Neurosciences, Fifth EditionEdited by Yudofsky SC, Hales RE. © 2008 American Psychiatric Publishing, Inc. All rights reserved. www.appi.org
474

FIGURE 19–1. Relative frequency of intracranial brain tumors according to location in the adult.
Seventy percent of all brain tumors are supratentor ial, with distribution by lobe as indicated in Figure 19–1.
Source. Reprinted from Lohr JB, Cadet JL: “Neuropsychiatric Aspects of Brain Tumors,” in The American Psychiatric Press Textbook of Neuropsychiatry.Edited by Talbott JA, Hales RE, Yudofsky SC. Washington, DC, American Psychiatric Press, 1987, p. 355. Used with permission.
The American Psychiatric Publishing Textbook of Neuropsychiatry and Behavioral Neurosciences, Fifth EditionEdited by Yudofsky SC, Hales RE. © 2008 American Psychiatric Publishing, Inc. All rights reserved. www.appi.org
475
Press, 1987, p. 355. Used with permission.
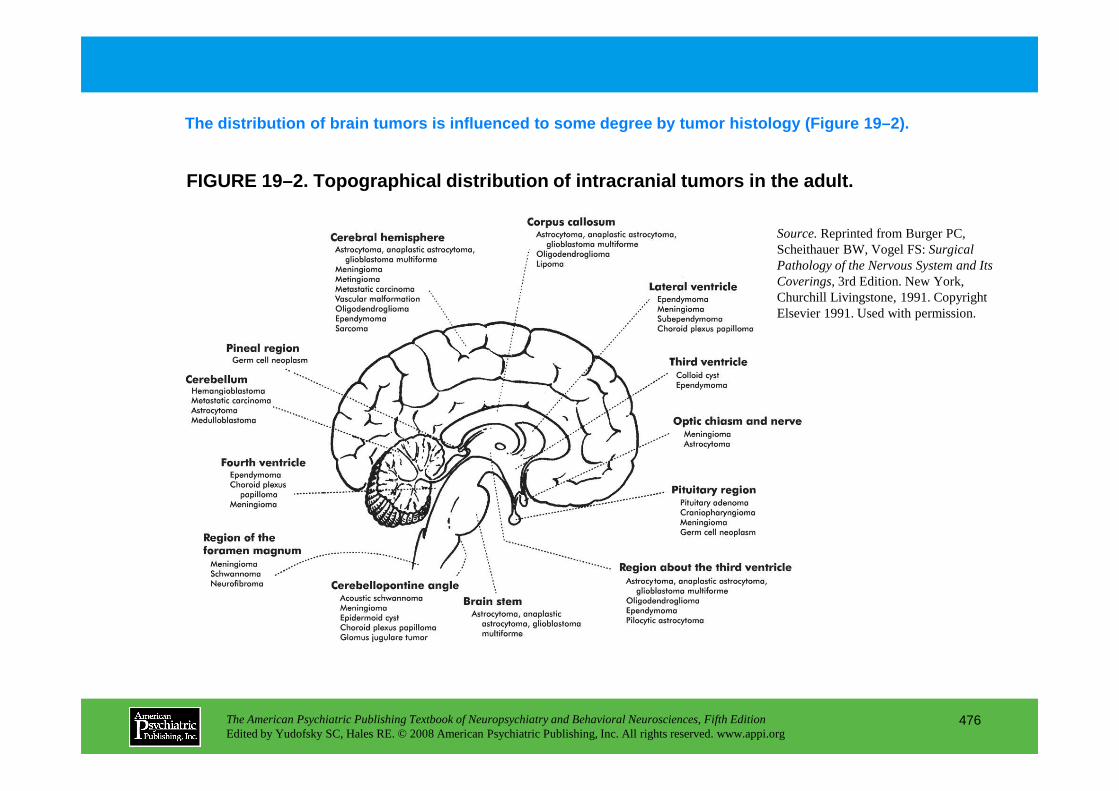
FIGURE 19–2. Topographical distribution of intracra nial tumors in the adult.
The distribution of brain tumors is influenced to s ome degree by tumor histology (Figure 19–2).
Source.Reprinted from Burger PC, Scheithauer BW, Vogel FS: Surgical Pathology of the Nervous System and Its Coverings,3rd Edition. New York, Churchill Livingstone, 1991. Copyright Elsevier 1991. Used with permission.
The American Psychiatric Publishing Textbook of Neuropsychiatry and Behavioral Neurosciences, Fifth EditionEdited by Yudofsky SC, Hales RE. © 2008 American Psychiatric Publishing, Inc. All rights reserved. www.appi.org
476

FIGURE 19–2 (enlarged)
The American Psychiatric Publishing Textbook of Neuropsychiatry and Behavioral Neurosciences, Fifth EditionEdited by Yudofsky SC, Hales RE. © 2008 American Psychiatric Publishing, Inc. All rights reserved. www.appi.org
477
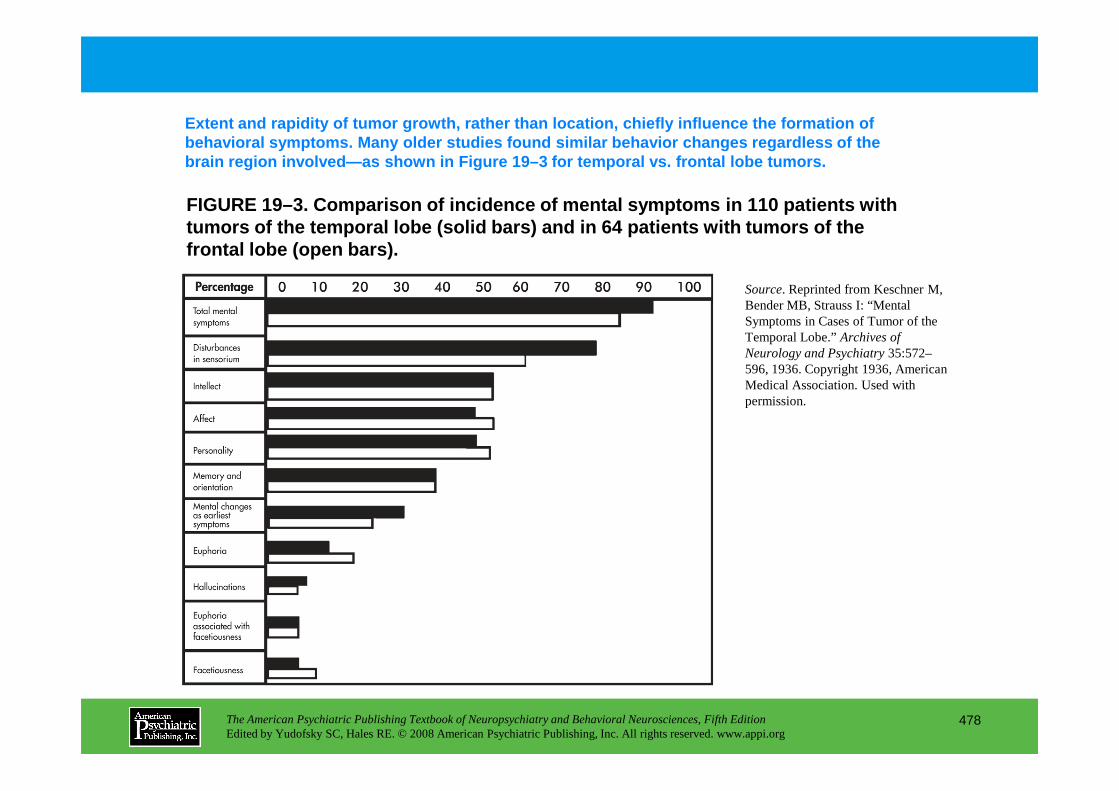
FIGURE 19–3. Comparison of incidence of mental symp toms in 110 patients with tumors of the temporal lobe (solid bars) and in 64 patients with tumors of the frontal lobe (open bars) .
Extent and rapidity of tumor growth, rather than lo cation, chiefly influence the formation of behavioral symptoms. Many older studies found simil ar behavior changes regardless of the brain region involved—as shown in Figure 19–3 for te mporal vs. frontal lobe tumors.
Source. Reprinted from Keschner M, Bender MB, Strauss I: “Mental Symptoms in Cases of Tumor of the Temporal Lobe.” Archives of Neurology and Psychiatry35:572–596, 1936. Copyright 1936, American Medical Association. Used with permission.
The American Psychiatric Publishing Textbook of Neuropsychiatry and Behavioral Neurosciences, Fifth EditionEdited by Yudofsky SC, Hales RE. © 2008 American Psychiatric Publishing, Inc. All rights reserved. www.appi.org
478
permission.

FIGURE 19–3 (enlarged)
The American Psychiatric Publishing Textbook of Neuropsychiatry and Behavioral Neurosciences, Fifth EditionEdited by Yudofsky SC, Hales RE. © 2008 American Psychiatric Publishing, Inc. All rights reserved. www.appi.org
479
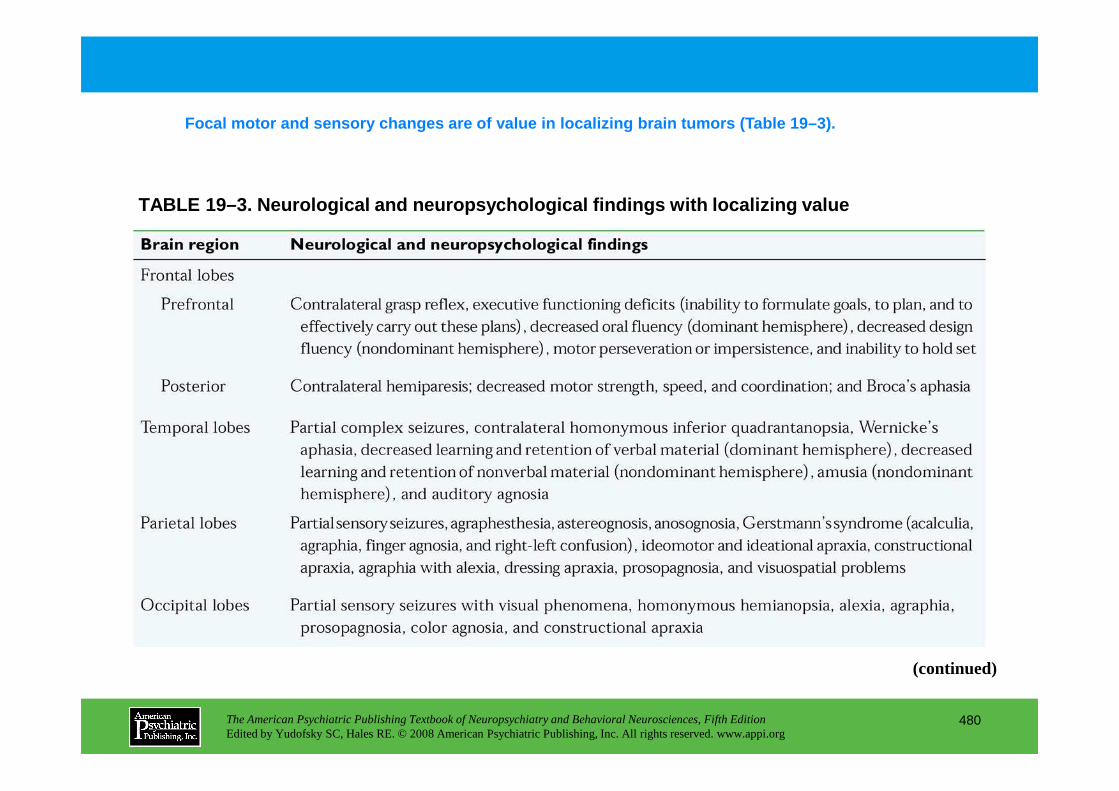
TABLE 19–3. Neurological and neuropsychological fin dings with localizing value
Focal motor and sensory changes are of value in loc alizing brain tumors (Table 19–3).
The American Psychiatric Publishing Textbook of Neuropsychiatry and Behavioral Neurosciences, Fifth EditionEdited by Yudofsky SC, Hales RE. © 2008 American Psychiatric Publishing, Inc. All rights reserved. www.appi.org
480
(continued)
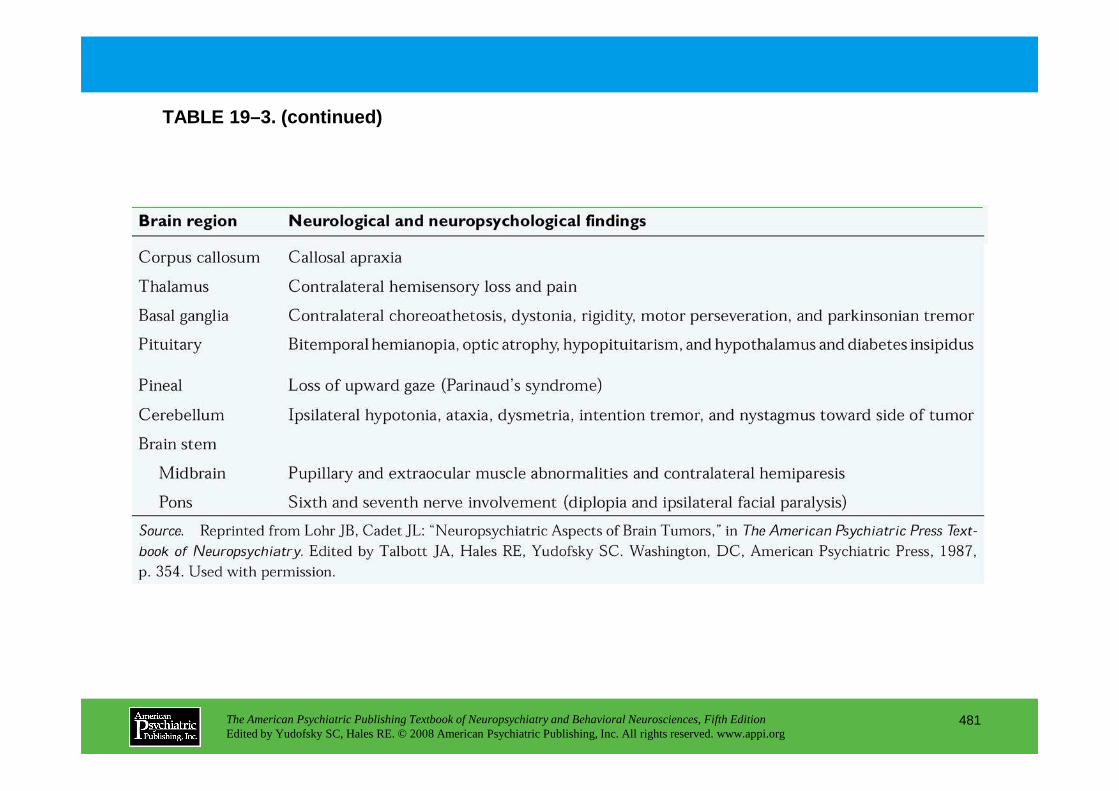
TABLE 19–3. (continued)
The American Psychiatric Publishing Textbook of Neuropsychiatry and Behavioral Neurosciences, Fifth EditionEdited by Yudofsky SC, Hales RE. © 2008 American Psychiatric Publishing, Inc. All rights reserved. www.appi.org
481
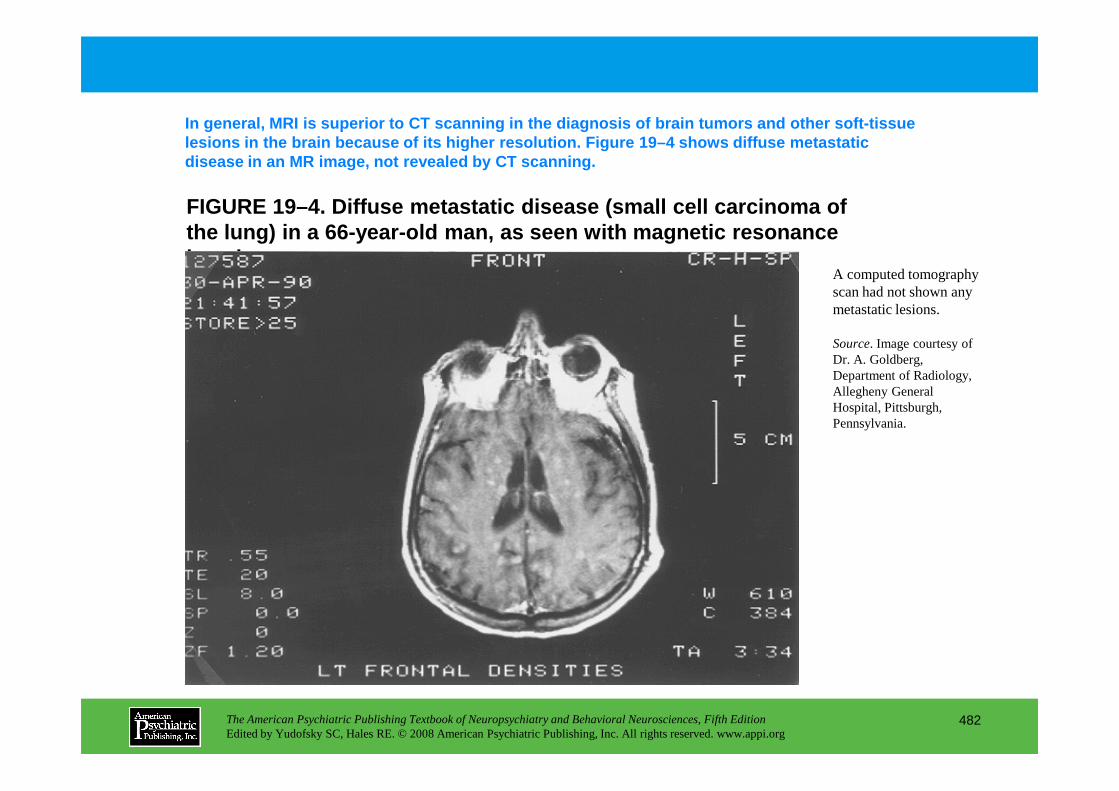
FIGURE 19–4. Diffuse metastatic disease (small cell carcinoma of the lung) in a 66-year-old man, as seen with magnet ic resonance imaging.
In general, MRI is superior to CT scanning in the d iagnosis of brain tumors and other soft-tissue lesions in the brain because of its higher resoluti on. Figure 19–4 shows diffuse metastatic disease in an MR image, not revealed by CT scanning .
A computed tomography scan had not shown any metastatic lesions.
Source. Image courtesy of Dr. A. Goldberg, Department of Radiology, Allegheny General
The American Psychiatric Publishing Textbook of Neuropsychiatry and Behavioral Neurosciences, Fifth EditionEdited by Yudofsky SC, Hales RE. © 2008 American Psychiatric Publishing, Inc. All rights reserved. www.appi.org
482
Allegheny General Hospital, Pittsburgh, Pennsylvania.
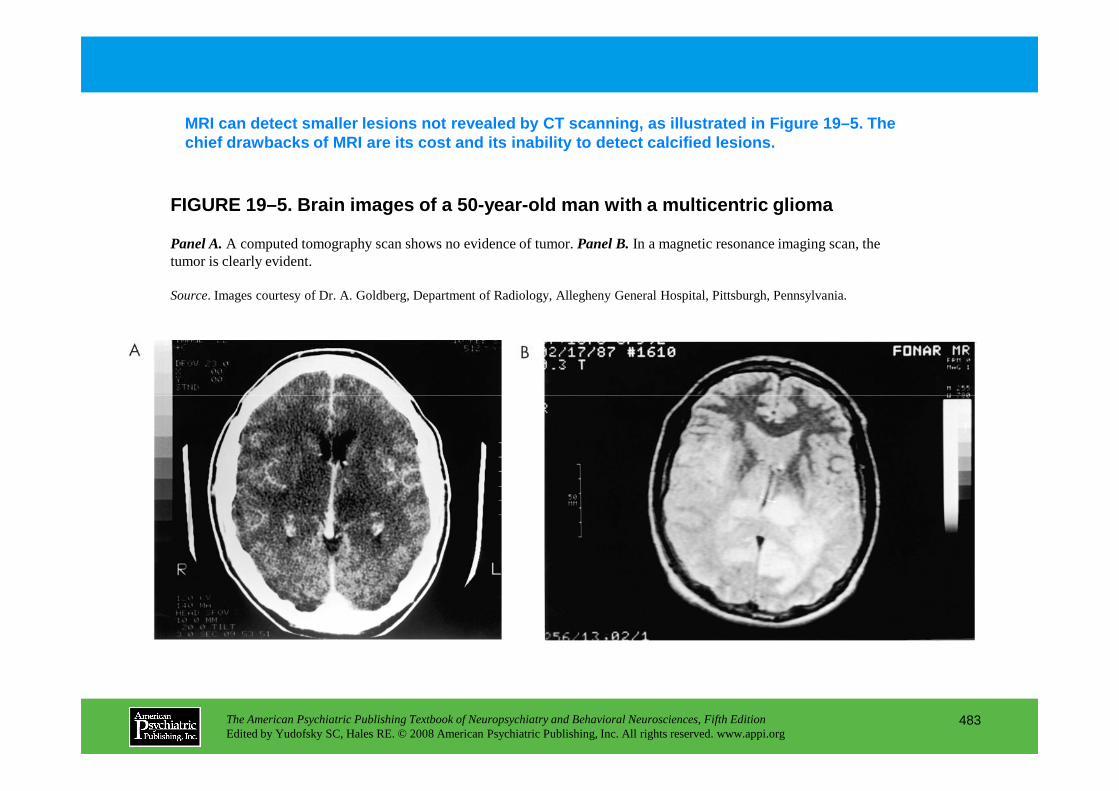
FIGURE 19–5. Brain images of a 50-year-old man with a multicentric glioma
MRI can detect smaller lesions not revealed by CT s canning, as illustrated in Figure 19–5. The chief drawbacks of MRI are its cost and its inabili ty to detect calcified lesions.
Panel A.A computed tomography scan shows no evidence of tumor. Panel B.In a magnetic resonance imaging scan, the tumor is clearly evident.
Source. Images courtesy of Dr. A. Goldberg, Department of Radiology, Allegheny General Hospital, Pittsburgh, Pennsylvania.
The American Psychiatric Publishing Textbook of Neuropsychiatry and Behavioral Neurosciences, Fifth EditionEdited by Yudofsky SC, Hales RE. © 2008 American Psychiatric Publishing, Inc. All rights reserved. www.appi.org
483

Enhancement of MRI with gadolinium further increase s its diagnostic sensitivity (Figure 19–6).
FIGURE 19–6. Brain images of a 70-year-old man with a meningioma
Panel A.This tumor was not evidenced on an unenhanced magnetic resonance imaging (MRI) scan.Panel B.The tumor wasseen clearly with a gadolinium-enhanced MRI scan.
Source. Images courtesy of Dr. A. Goldberg, Department of Radiology, Allegheny General Hospital, Pittsburgh, Pennsylvania
The American Psychiatric Publishing Textbook of Neuropsychiatry and Behavioral Neurosciences, Fifth EditionEdited by Yudofsky SC, Hales RE. © 2008 American Psychiatric Publishing, Inc. All rights reserved. www.appi.org
484

FIGURE 19–7. Single-photon emission computed tomogr aphy scans of a patient with recurrent glioblastoma.
SPECT may be useful in differentiating tumor recurr ence from radiation necrosis in brain tumor patients who have received radiation therapy (Figur es 19–7 and 19–8), or in distinguishing CNS lymphoma from toxoplasma encephalitis in AIDS patie nts.
[99mTc]Hexamethylpropylene amine oxime (HMPAO) scan (left)indicates decreased tracer uptake in the right frontal area. Superimposed thallium scan (right) shows increased tracer uptake in the same area, indicating recurrent tumor.
The American Psychiatric Publishing Textbook of Neuropsychiatry and Behavioral Neurosciences, Fifth EditionEdited by Yudofsky SC, Hales RE. © 2008 American Psychiatric Publishing, Inc. All rights reserved. www.appi.org
485
recurrent tumor.
Source. Images courtesy of Dr. M. Adatepe, Department of Nuclear Medicine, Allegheny General Hospital, Pittsburgh, Pennsylvania.

FIGURE 19–8. Single-photon emission computed tomogr aphy scans of a patient after radiation of a left occipital tumor.
A SPECT image and superimposed thallium scan sugges t postradiation necrosis rather than recurrent brain tumor in this patient. (Figures 19– 8).
Decreased uptake on [99mTc]hexamethylpropylene amine oxime (HMPAO) scan (left) combined with decreased uptake on superimposed thallium scan (right) suggests an area of postradiation necrosis rather
The American Psychiatric Publishing Textbook of Neuropsychiatry and Behavioral Neurosciences, Fifth EditionEdited by Yudofsky SC, Hales RE. © 2008 American Psychiatric Publishing, Inc. All rights reserved. www.appi.org
486
postradiation necrosis rather than recurrent tumor.
Source. Images courtesy of Dr. M. Adatepe, Department of Nuclear Medicine, Allegheny General Hospital, Pittsburgh, Pennsylvania.

Chapter 19 • Highlights for the Clinician
• Psychiatric, behavioral, and neurocognitive symptoms and syndromes are frequently associated with brain tumors.
• The types of such disturbances occurring in association with brain tumors are quite varied.
• Psychiatric, behavioral, and neurocognitive symptoms associated with cerebral tumors may mimic a wide variety of primary psychiatric disorders.
• Such symptoms and syndromes may be the first indication of a previously unsuspected, underlying brain tumor.
• The possibility that a brain tumor may be causing such symptoms should always be considered in new-onset psychiatric or neurocognitive symptomatology, especially if accompanied by any neurological signs and symptoms or atypical clinical or treatment response features.
• Brain tumors may exacerbate the clinical effect of preexisting primary psychiatric illness.
• Careful neurological examination, state-of-the-art imaging studies and sophisticated scanning techniques, electrophysiological tests, and neuropsychological testing can all be quite helpful in the evaluation of a possible underlying brain tumor.
The American Psychiatric Publishing Textbook of Neuropsychiatry and Behavioral Neurosciences, Fifth EditionEdited by Yudofsky SC, Hales RE. © 2008 American Psychiatric Publishing, Inc. All rights reserved. www.appi.org
487
underlying brain tumor.
• The causes of specific types of brain tumor-associated behavioral symptomatology appear to be multiple and are believed to include anatomical location and laterality, histological type, size, and aggressiveness of the tumor in conjunction with associated factors such as cerebral edema and intracranial pressure.
• Tumor-associated psychiatric and behavioral symptoms, like those associated with primary psychiatric disorders, often respond favorably to appropriate psychopharmacological, psychotherapeutic, and psychoeducational interventions with patients and their families.
• Brain tumor patients with psychiatric and behavioral symptoms, like other patients with CNS disorders with such symptoms, often tolerate and respond to lower doses of psychopharmacological agents than are required for and tolerated by patients with similar symptoms caused by primary psychiatric illnesses.
• Psychiatrists can make valuable contributions to the overall clinical management of brain tumor patients with psychiatric, behavioral, and neurocognitive symptomatology and can help to optimize the patient's sense of well-being and overall quality of life.

CHAPTER 20
NEUROPSYCHIATRIC ASPECTS OF HUMAN IMMUNODEFICIENCY VIRUS
INFECTION OF THE CENTRAL NERVOUS SYSTEM
Francisco Fernandez, M.D.Jun Tan, M.D., Ph.D.
The American Psychiatric Publishing Textbook of Neuropsychiatry and Behavioral Neurosciences, Fifth EditionEdited by Yudofsky SC, Hales RE. © 2008 American Psychiatric Publishing, Inc. All rights reserved. www.appi.org
488
Slide Show
Topic headings and reading list
Tables and figures
Highlights for the clinician
Main menu
(About, Contents, Contributors, Publishing facts)
HIV: Medical Factors
CNS Pathology Resulting Directly From HIV
CNS Neuropathology Due to Opportunistic Infections and Neoplasia
Direct Assessment of CNS Injury in HIV DiseaseNeuroimaging FindingsCerebrospinal Fluid FindingsElectrophysiological Findings
Neurobehavioral Assessment of HIV Infection of the CNS
Treatment of HIV Infection of the CNSPrimary Therapy: Antivirals
Behavioral Methods in the Treatment of Cognitive Disorder
Manifestations of Specific HIV-Related Neuropsychia tric Disorders and Their Treatment
Delirium and Psychosis in HIV DiseaseDepression in HIV DiseaseMania in HIV DiseaseAnxiety and Insomnia in HIV Disease
Conclusion
RECOMMENDED READINGS
CHAPTER 20 • Topics and Readings
The American Psychiatric Publishing Textbook of Neuropsychiatry and Behavioral Neurosciences, Fifth EditionEdited by Yudofsky SC, Hales RE. © 2008 American Psychiatric Publishing, Inc. All rights reserved. www.appi.org
489
Primary Therapy: AntiviralsAdjunctive Therapy: Additional Biological and
Pharmacological InterventionsAdjuvant Therapy: Psychopharmacological
Enhancement of Function
RECOMMENDED READINGSFernandez F, Ruiz P (eds): Psychiatric Aspects of HIV/AIDS.
Philadelphia, PA, Lippincott Williams & Wilkins, 2006McArthur JC, Brew B, Nath A: Neurological complications of
HIV infection. Lancet Neurol 4:543–555, 2005
CHAPTER 20 • Tables and Figures
Table 20–1. CNS conditions associated with AIDS and HIV infection
Figure 20–1. Magnetic resonance imaging scan of a 35-year-old woman presenting with severe postpartum depression and history of long-term intravenous drug use
Figure 20–2. Computed tomography scan of a 21-year-old man presenting in an emergency department with a first episode of mania
Table 20–2. HIV-1-associated minor cognitive/motor disorder: American Academy of Neurology criteria
Table 20–3. Early signs and symptoms of HIV-related neurobehavioral impairment
Table 20–4. Late signs and symptoms of HIV-related neurobehavioral impairment
The American Psychiatric Publishing Textbook of Neuropsychiatry and Behavioral Neurosciences, Fifth EditionEdited by Yudofsky SC, Hales RE. © 2008 American Psychiatric Publishing, Inc. All rights reserved. www.appi.org
490
Table 20–4. Late signs and symptoms of HIV-related neurobehavioral impairment
Table 20–5. HIV neuropsychological screening battery
Summary Highlights for the Clinician

TABLE 20–1. CNS conditions associated with AIDS and HIV infection
Table 20–1 lists the CNS conditions most commonly associated with AIDS and HIV infection. The list includes opportunistic CNS infections, neoplasia, and other complications induced by the infection or its treatment.
The American Psychiatric Publishing Textbook of Neuropsychiatry and Behavioral Neurosciences, Fifth EditionEdited by Yudofsky SC, Hales RE. © 2008 American Psychiatric Publishing, Inc. All rights reserved. www.appi.org
491
(continued)

TABLE 20–1. (continued)
The American Psychiatric Publishing Textbook of Neuropsychiatry and Behavioral Neurosciences, Fifth EditionEdited by Yudofsky SC, Hales RE. © 2008 American Psychiatric Publishing, Inc. All rights reserved. www.appi.org
492
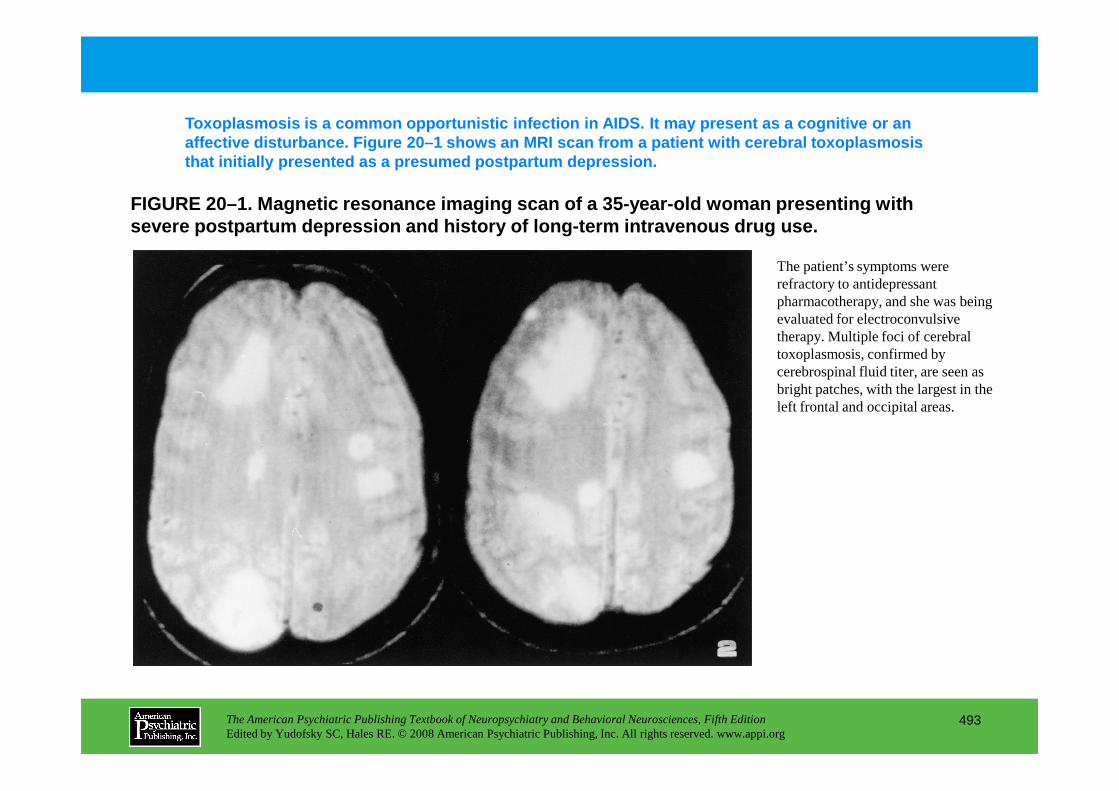
FIGURE 20–1. Magnetic resonance imaging scan of a 3 5-year-old woman presenting with severe postpartum depression and history of long-te rm intravenous drug use.
Toxoplasmosis is a common opportunistic infection i n AIDS. It may present as a cognitive or an affective disturbance. Figure 20–1 shows an MRI sca n from a patient with cerebral toxoplasmosis that initially presented as a presumed postpartum d epression.
The patient’s symptoms were refractory to antidepressant pharmacotherapy, and she was being evaluated for electroconvulsive therapy. Multiple foci of cerebral toxoplasmosis, confirmed by cerebrospinal fluid titer, are seen as bright patches, with the largest in the
The American Psychiatric Publishing Textbook of Neuropsychiatry and Behavioral Neurosciences, Fifth EditionEdited by Yudofsky SC, Hales RE. © 2008 American Psychiatric Publishing, Inc. All rights reserved. www.appi.org
493
bright patches, with the largest in the left frontal and occipital areas.

FIGURE 20–2. Computed tomography scan of a 21-year-old man presenting in an emergency department with a first episode of mania.
Non-Hodgkin’s lymphoma is common in AIDS patients as a primary CNS tumor. Patients usually present with altered mental status and/or focal symptoms. A CT scan showing lymphoma in a man who presented with a manic episode is shown in Figure 20–2.
The American Psychiatric Publishing Textbook of Neuropsychiatry and Behavioral Neurosciences, Fifth EditionEdited by Yudofsky SC, Hales RE. © 2008 American Psychiatric Publishing, Inc. All rights reserved. www.appi.org
494
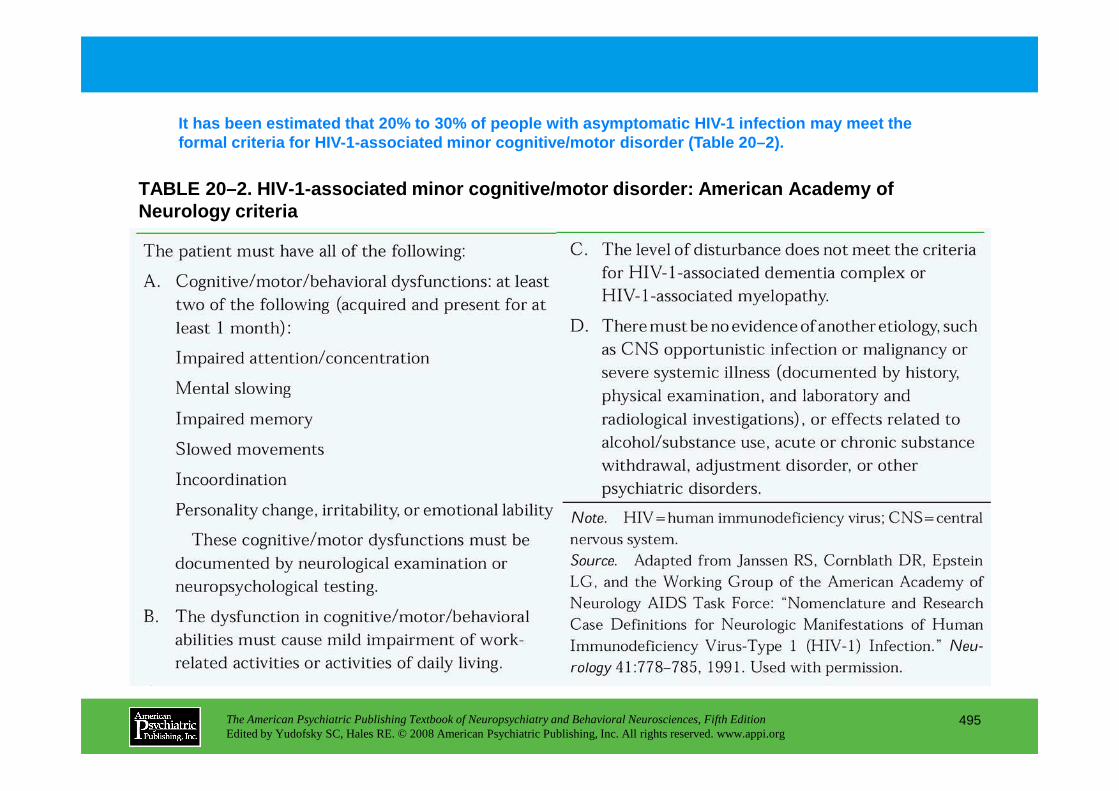
TABLE 20–2. HIV-1-associated minor cognitive/motor disorder: American Academy of Neurology criteria
It has been estimated that 20% to 30% of people wit h asymptomatic HIV-1 infection may meet the formal criteria for HIV-1-associated minor cognitiv e/motor disorder (Table 20–2).
The American Psychiatric Publishing Textbook of Neuropsychiatry and Behavioral Neurosciences, Fifth EditionEdited by Yudofsky SC, Hales RE. © 2008 American Psychiatric Publishing, Inc. All rights reserved. www.appi.org
495

TABLE 20–3. Early signs and symptoms of HIV-related neurobehavioral impairment
Table 20–3 lists signs and symptoms of cognitive and psychiatric disturbances commonly found early in the course of HIV-associated dementia.
The American Psychiatric Publishing Textbook of Neuropsychiatry and Behavioral Neurosciences, Fifth EditionEdited by Yudofsky SC, Hales RE. © 2008 American Psychiatric Publishing, Inc. All rights reserved. www.appi.org
496

TABLE 20–4. Late signs and symptoms of HIV-related neurobehavioral impairment
Table 20–4 lists signs and symptoms of cognitive an d psychiatric difficulties encountered late in the course of HIV-associated dementia.
The American Psychiatric Publishing Textbook of Neuropsychiatry and Behavioral Neurosciences, Fifth EditionEdited by Yudofsky SC, Hales RE. © 2008 American Psychiatric Publishing, Inc. All rights reserved. www.appi.org
497

TABLE 20–5. HIV neuropsychological screening battery
If the patient’s situation precludes an extensive t est battery, the brief battery shown in Table 20–5 (or another battery addressing similar functions) c an assess the critical areas to detect HIV involvement at an early stage.
The American Psychiatric Publishing Textbook of Neuropsychiatry and Behavioral Neurosciences, Fifth EditionEdited by Yudofsky SC, Hales RE. © 2008 American Psychiatric Publishing, Inc. All rights reserved. www.appi.org
498
Chapter 20 • Highlights for the Clinician
• HIV-1 is a retrovirus that produces profound CD4 depletion leading to immunodeficiency and death.
• Infection of the central nervous system directly affects brain tissue, producing distinct neurobehavioral disorders.
• Secondary CNS dysfunction is produced by chronic immune activation by HIV-1 infection, leading to macrophage and glial cell activation that results in overproduction of inflammatory cytokines and chemokines.
• These proinflammatory cytokines and chemokines are related to the pathogenesis of cognitive disorders and dementia in HIV/AIDS.
The American Psychiatric Publishing Textbook of Neuropsychiatry and Behavioral Neurosciences, Fifth EditionEdited by Yudofsky SC, Hales RE. © 2008 American Psychiatric Publishing, Inc. All rights reserved. www.appi.org
499
cognitive disorders and dementia in HIV/AIDS.
• Cognitive, mood, and psychotic disorders are the most common clinical neuropsychiatric disorders associated with HIV infection.
• HIV-related neuropsychiatric disorders are diagnoses of exclusion.
• Although therapeutic interventions are readily available, their efficacy has not been widely studied.

CHAPTER 21
NEUROPSYCHIATRIC ASPECTS OF ENDOCRINE DISORDERS
Monica Kelly Cowles, M.D., M.S.Elizabeth B. Boswell, M.D.Theodore J. Anfinson, M.D.
Charles B. Nemeroff, M.D., Ph.D.
The American Psychiatric Publishing Textbook of Neuropsychiatry and Behavioral Neurosciences, Fifth EditionEdited by Yudofsky SC, Hales RE. © 2008 American Psychiatric Publishing, Inc. All rights reserved. www.appi.org
500
Slide Show
Topic headings and reading list
Tables and figures
Highlights for the clinician
Main menu
(About, Contents, Contributors, Publishing facts)
Charles B. Nemeroff, M.D., Ph.D.
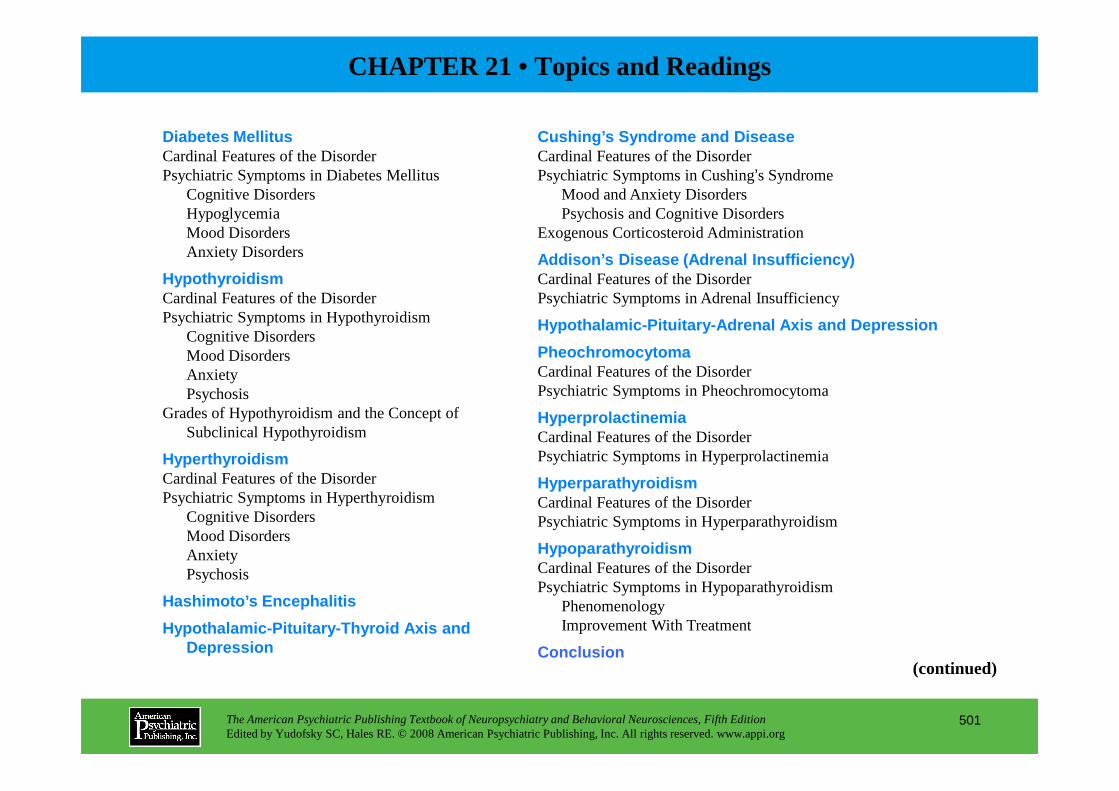
Diabetes MellitusCardinal Features of the DisorderPsychiatric Symptoms in Diabetes Mellitus
Cognitive DisordersHypoglycemiaMood DisordersAnxiety Disorders
HypothyroidismCardinal Features of the DisorderPsychiatric Symptoms in Hypothyroidism
Cognitive DisordersMood DisordersAnxietyPsychosis
Cushing’s Syndrome and DiseaseCardinal Features of the DisorderPsychiatric Symptoms in Cushing’s Syndrome
Mood and Anxiety DisordersPsychosis and Cognitive Disorders
Exogenous Corticosteroid Administration
Addison’s Disease (Adrenal Insufficiency)Cardinal Features of the DisorderPsychiatric Symptoms in Adrenal Insufficiency
Hypothalamic-Pituitary-Adrenal Axis and Depression
PheochromocytomaCardinal Features of the DisorderPsychiatric Symptoms in Pheochromocytoma
CHAPTER 21 • Topics and Readings
The American Psychiatric Publishing Textbook of Neuropsychiatry and Behavioral Neurosciences, Fifth EditionEdited by Yudofsky SC, Hales RE. © 2008 American Psychiatric Publishing, Inc. All rights reserved. www.appi.org
501
PsychosisGrades of Hypothyroidism and the Concept of
Subclinical Hypothyroidism
HyperthyroidismCardinal Features of the DisorderPsychiatric Symptoms in Hyperthyroidism
Cognitive DisordersMood DisordersAnxietyPsychosis
Hashimoto’s Encephalitis
Hypothalamic-Pituitary-Thyroid Axis and Depression
Psychiatric Symptoms in Pheochromocytoma
HyperprolactinemiaCardinal Features of the DisorderPsychiatric Symptoms in Hyperprolactinemia
HyperparathyroidismCardinal Features of the DisorderPsychiatric Symptoms in Hyperparathyroidism
HypoparathyroidismCardinal Features of the DisorderPsychiatric Symptoms in Hypoparathyroidism
PhenomenologyImprovement With Treatment
Conclusion(continued)
CHAPTER 21 • Topics and Readings (continued)
RECOMMENDED READINGSEgede LE: Effect of comorbid chronic diseases on prevalence and odds of depression in
adults with diabetes. Psychosom Med 67:46–51, 2005Gillespie CF, Nemeroff CB: Hypercortisolemia and depression. Psychosom Med 67
(suppl 1):S26–S28, 2005Patten SB: Exogenous corticosteroids and major depression in the general population. J
Psychosom Res 49:447–449, 2000
The American Psychiatric Publishing Textbook of Neuropsychiatry and Behavioral Neurosciences, Fifth EditionEdited by Yudofsky SC, Hales RE. © 2008 American Psychiatric Publishing, Inc. All rights reserved. www.appi.org
502
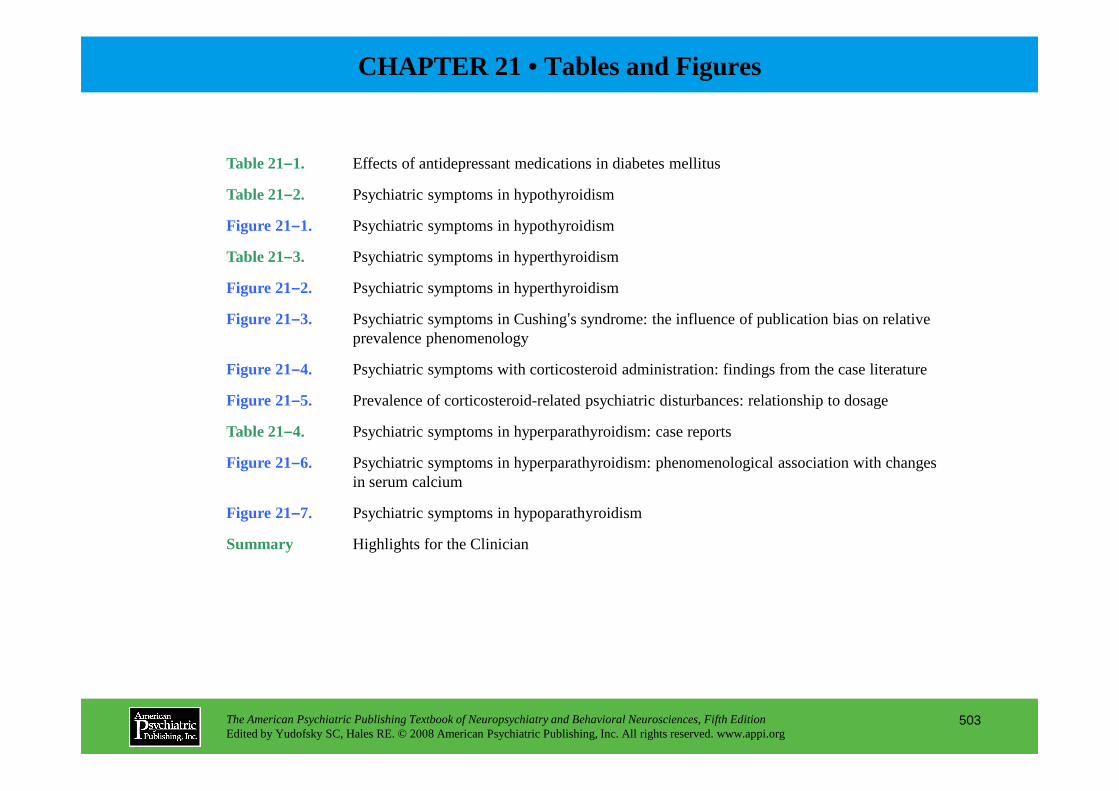
CHAPTER 21 • Tables and Figures
Table 21–1. Effects of antidepressant medications in diabetes mellitus
Table 21–2. Psychiatric symptoms in hypothyroidism
Figure 21–1. Psychiatric symptoms in hypothyroidism
Table 21–3. Psychiatric symptoms in hyperthyroidism
Figure 21–2. Psychiatric symptoms in hyperthyroidism
Figure 21–3. Psychiatric symptoms in Cushing’s syndrome: the influence of publication bias on relative prevalence phenomenology
Figure 21–4. Psychiatric symptoms with corticosteroid administration: findings from the case literature
Figure 21–5. Prevalence of corticosteroid-related psychiatric disturbances: relationship to dosage
The American Psychiatric Publishing Textbook of Neuropsychiatry and Behavioral Neurosciences, Fifth EditionEdited by Yudofsky SC, Hales RE. © 2008 American Psychiatric Publishing, Inc. All rights reserved. www.appi.org
503
Figure 21–5. Prevalence of corticosteroid-related psychiatric disturbances: relationship to dosage
Table 21–4. Psychiatric symptoms in hyperparathyroidism: case reports
Figure 21–6. Psychiatric symptoms in hyperparathyroidism: phenomenological association with changes in serum calcium
Figure 21–7. Psychiatric symptoms in hypoparathyroidism
Summary Highlights for the Clinician

TABLE 21–1. Effects of antidepressant medications i n diabetes mellitus
Table 21–1 summarizes the effects of antidepressants in diabetic patients. Successful treatment of depression has been shown to improve glycemic contr ol. An SSRI should be the first-line choice of antidepressant for the patient with diabetes.
The American Psychiatric Publishing Textbook of Neuropsychiatry and Behavioral Neurosciences, Fifth EditionEdited by Yudofsky SC, Hales RE. © 2008 American Psychiatric Publishing, Inc. All rights reserved. www.appi.org
504

TABLE 21–2. Psychiatric symptoms in hypothyroidism
Psychiatric symptoms are often the first manifestat ion of thyroid disturbance. Patients with hypothyroidism frequently show cognitive, affective , psychotic, and anxiety symptoms. The relevant literature is summarized in Table 21–2.
The American Psychiatric Publishing Textbook of Neuropsychiatry and Behavioral Neurosciences, Fifth EditionEdited by Yudofsky SC, Hales RE. © 2008 American Psychiatric Publishing, Inc. All rights reserved. www.appi.org
505

FIGURE 21–1. Psychiatric symptoms in hypothyroidism.
Figure 21–1 shows the relative prevalence of psychi atric symptoms and cognitive deficits in the patients with hypothyroidism in the case literature in Table 21–1.
Numbers under bars indicate the number of patients in whom the symptom was sought in unselected cases.
Source.Adapted from the case literature in Table 21–2.
The American Psychiatric Publishing Textbook of Neuropsychiatry and Behavioral Neurosciences, Fifth EditionEdited by Yudofsky SC, Hales RE. © 2008 American Psychiatric Publishing, Inc. All rights reserved. www.appi.org
506
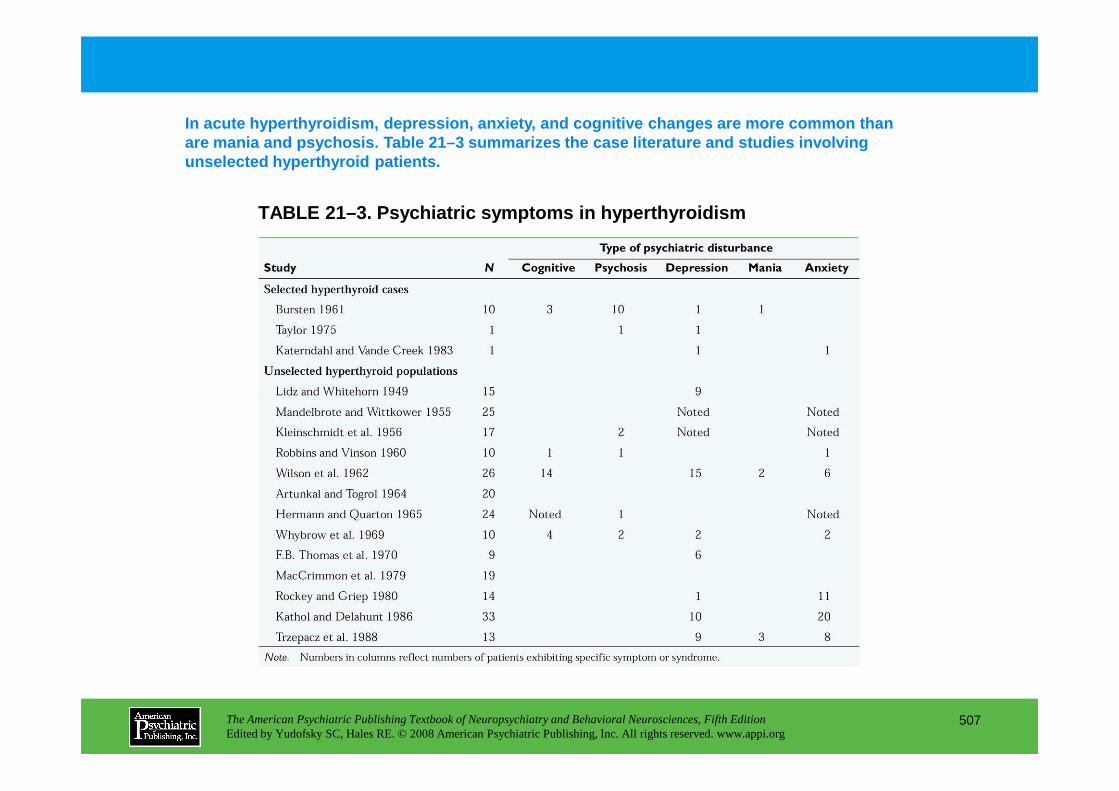
TABLE 21–3. Psychiatric symptoms in hyperthyroidism
In acute hyperthyroidism, depression, anxiety, and cognitive changes are more common than are mania and psychosis. Table 21–3 summarizes the c ase literature and studies involving unselected hyperthyroid patients.
The American Psychiatric Publishing Textbook of Neuropsychiatry and Behavioral Neurosciences, Fifth EditionEdited by Yudofsky SC, Hales RE. © 2008 American Psychiatric Publishing, Inc. All rights reserved. www.appi.org
507
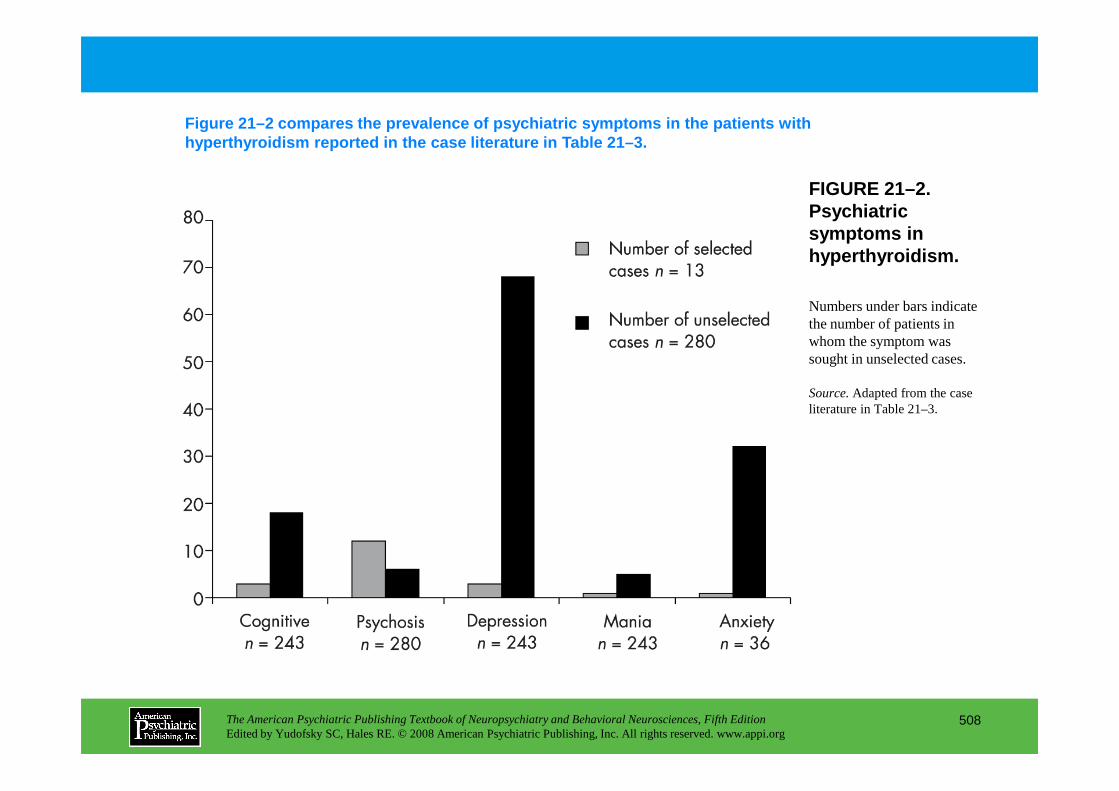
FIGURE 21–2. Psychiatric symptoms in hyperthyroidism.
Figure 21–2 compares the prevalence of psychiatric symptoms in the patients with hyperthyroidism reported in the case literature in Table 21–3.
Numbers under bars indicate the number of patients in whom the symptom was sought in unselected cases.
Source.Adapted from the case
The American Psychiatric Publishing Textbook of Neuropsychiatry and Behavioral Neurosciences, Fifth EditionEdited by Yudofsky SC, Hales RE. © 2008 American Psychiatric Publishing, Inc. All rights reserved. www.appi.org
508
Source.Adapted from the case literature in Table 21–3.

FIGURE 21–3. Psychiatric symptoms in Cushing’s syndrome: the influence of publication bias on relative prevalence phenomenology.
The presence of mixed anxiety and depressed states in Cushing’s syndrome probably has been underappreciated because of reporting and investigator bias. Figure 21–3 illustrates this effect.
Panel A.All cases of psychiatric disturbances in Cushing’s syndrome. Panel B.Relative prevalence of
The American Psychiatric Publishing Textbook of Neuropsychiatry and Behavioral Neurosciences, Fifth EditionEdited by Yudofsky SC, Hales RE. © 2008 American Psychiatric Publishing, Inc. All rights reserved. www.appi.org
509
Cushing’s syndrome. Panel B.Relative prevalence of major psychiatric symptoms in cases of Cushing’s syndrome using broad clinical or structured interview.
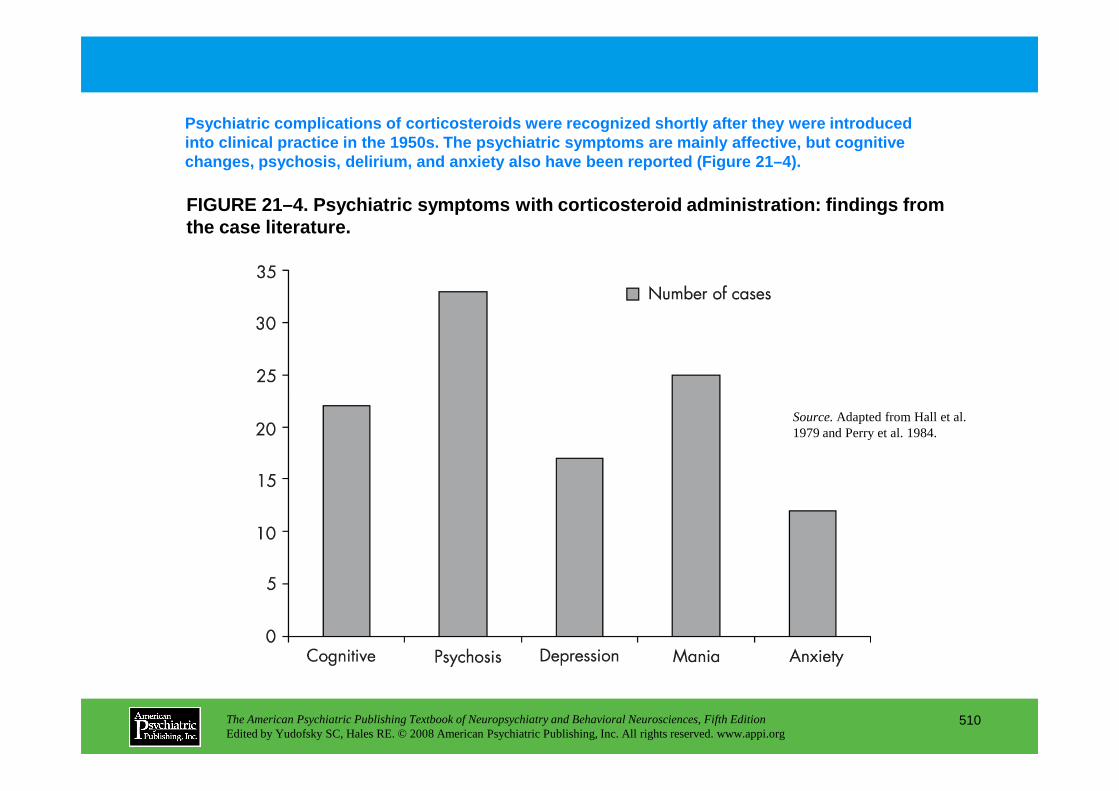
FIGURE 21–4. Psychiatric symptoms with corticostero id administration: findings from the case literature.
Psychiatric complications of corticosteroids were r ecognized shortly after they were introduced into clinical practice in the 1950s. The psychiatri c symptoms are mainly affective, but cognitive changes, psychosis, delirium, and anxiety also have been reported (Figure 21–4).
The American Psychiatric Publishing Textbook of Neuropsychiatry and Behavioral Neurosciences, Fifth EditionEdited by Yudofsky SC, Hales RE. © 2008 American Psychiatric Publishing, Inc. All rights reserved. www.appi.org
510
Source.Adapted from Hall et al. 1979 and Perry et al. 1984.

Figure 21–5. Prevalence of corticosteroid-related ps ychiatric disturbances: relationship to dosage.
The prevalence of psychiatric disturbances associat ed with corticosteroid administration appears to be dose-related. Figure 21–5 shows resul ts from a prospective study of 718 hospitalized patients receiving prednisone.
The American Psychiatric Publishing Textbook of Neuropsychiatry and Behavioral Neurosciences, Fifth EditionEdited by Yudofsky SC, Hales RE. © 2008 American Psychiatric Publishing, Inc. All rights reserved. www.appi.org
511
Source.Adapted from Boston Collaborative Drug Surveillance Program 1972.

TABLE 21–4. Psychiatric symptoms in hyperparathyroi dism: case reports
Psychiatric disturbances are sometimes associated w ith hyperparathyroidism. Table 21–4 summarizes the case literature. A review of the earl y literature found mainly affective and cognitive changes and noted that most of the patients were el derly women.
The American Psychiatric Publishing Textbook of Neuropsychiatry and Behavioral Neurosciences, Fifth EditionEdited by Yudofsky SC, Hales RE. © 2008 American Psychiatric Publishing, Inc. All rights reserved. www.appi.org
512
(continued)

TABLE 21–4. (continued)
The American Psychiatric Publishing Textbook of Neuropsychiatry and Behavioral Neurosciences, Fifth EditionEdited by Yudofsky SC, Hales RE. © 2008 American Psychiatric Publishing, Inc. All rights reserved. www.appi.org
513

FIGURE 21–6. Psychiatric symptoms in hyperparathyroidism: phenomenological association with changes in serum calcium.
Figure 21–6 illistrates the relationship between se rum calcium changes and the nature of the psychiatric disturbance in hyperparathyroidism.
Source.Adapted from Peterson et al. 1968, updated to include case
The American Psychiatric Publishing Textbook of Neuropsychiatry and Behavioral Neurosciences, Fifth EditionEdited by Yudofsky SC, Hales RE. © 2008 American Psychiatric Publishing, Inc. All rights reserved. www.appi.org
514
updated to include case data from Table 21–4.

FIGURE 21–7. Psychiatric symptoms in hypoparathyroi dism.
Patients with surgical hypoparathyroidism and those with the idiopathic form differ in the prevalence of psychiatric symptoms. Results from a study of 268 cases are summarized in Figure 21–7.
Source.Adapted from Denko and Kaelbling 1962.
The American Psychiatric Publishing Textbook of Neuropsychiatry and Behavioral Neurosciences, Fifth EditionEdited by Yudofsky SC, Hales RE. © 2008 American Psychiatric Publishing, Inc. All rights reserved. www.appi.org
515

Chapter 21 • Highlights for the Clinician
• Patients with diabetes are at two to three times the risk for depression as the general population.
• There is evidence that the long-term presence of diabetes imparts a risk of cognitive impairment. Furthermore, poor metabolic control appears to worsen the deleterious effects of diabetes on cognition.
• Many studies have identified a relationship between diabetes and dementia. This includes both vascular dementia and Alzheimer’s disease, though the mechanisms appear to differ.
• In patients with diabetes and depression, once the depression has been treated effectively, remission of symptoms is sustained only 10% of the time over the course of the following 5 years. Furthermore, relapses occur at a rate of approximately once a year.
• Patients with hypothyroidism frequently exhibit cognitive, affective, psychotic, and anxiety symptoms.
• Disturbances in cognition are the most commonly reported psychiatric symptom in hypothyroidism, occurring in 46.3% of unselected cases and 48.2% of psychiatrically ill hypothyroid patients.
• Depression is the second most frequent psychiatric syndrome to occur in unselected hypothyroid patients.
The American Psychiatric Publishing Textbook of Neuropsychiatry and Behavioral Neurosciences, Fifth EditionEdited by Yudofsky SC, Hales RE. © 2008 American Psychiatric Publishing, Inc. All rights reserved. www.appi.org
516
• Depression is the second most frequent psychiatric syndrome to occur in unselected hypothyroid patients.
• Although many authors have emphasized the ubiquitous presence of psychiatric symptoms in patients with hyperthyroidism, scrutiny of the literature suggests that serious psychopathology occurs in only a minority of patients.
• Major depression is the most common psychiatric manifestation of hyperthyroidism, occurring in approximately 28% of unselected patients.
• Whybrow and Hurwitz (1976) reviewed the literature and found that 35.0% of patients with Cushing’s syndrome reported depressive symptoms, compared with 3.7% who reported mania. Delirium was noted in 16.2% and psychosis in 9.3% of patients.
• Depressive symptoms resolve in 70% of Cushing’s syndrome patients with correction in serum cortisol.
(continued)
• In patients with Cushing’s syndrome, there is a correlation between elevated cortisol levels, reduced hippocampal formation volume (HFV), multiple cognitive tasks (particularly verbal learning), and memory dysfunction. After treatment of Cushing’s syndrome, it has been demonstrated that HFV increased after cortisol levels returned to normal concentrations.
• Exogenous corticosteroid administration imparts approximately three times the 12-month period prevalence of major depression seen in nontreated subjects, regardless of age, gender, and perceived health.
• Hypercortisolemia appears to represent a state as opposed to a trait marker for depression.
• A growing body of literature relates stressful life events to activation of the hypothalamic-pituitary-adrenal (HPA) axis. Investigators propose that HPA axis and autonomic nervous system hyperreactivity, presumably due to hypersecretion of corticotropin-releasing factor, may be a persistent consequence of childhood abuse and contribute to a vulnerability to psychopathological conditions in adulthood.
The American Psychiatric Publishing Textbook of Neuropsychiatry and Behavioral Neurosciences, Fifth EditionEdited by Yudofsky SC, Hales RE. © 2008 American Psychiatric Publishing, Inc. All rights reserved. www.appi.org
517
CHAPTER 22
NEUROPSYCHIATRIC ASPECTS OF POISONS AND TOXINS
Shreenath V. Doctor, M.D., Ph.D.
The American Psychiatric Publishing Textbook of Neuropsychiatry and Behavioral Neurosciences, Fifth EditionEdited by Yudofsky SC, Hales RE. © 2008 American Psychiatric Publishing, Inc. All rights reserved. www.appi.org
518
Slide Show
Topic headings and reading list
Tables and figures
Highlights for the clinician
Main menu
(About, Contents, Contributors, Publishing facts)
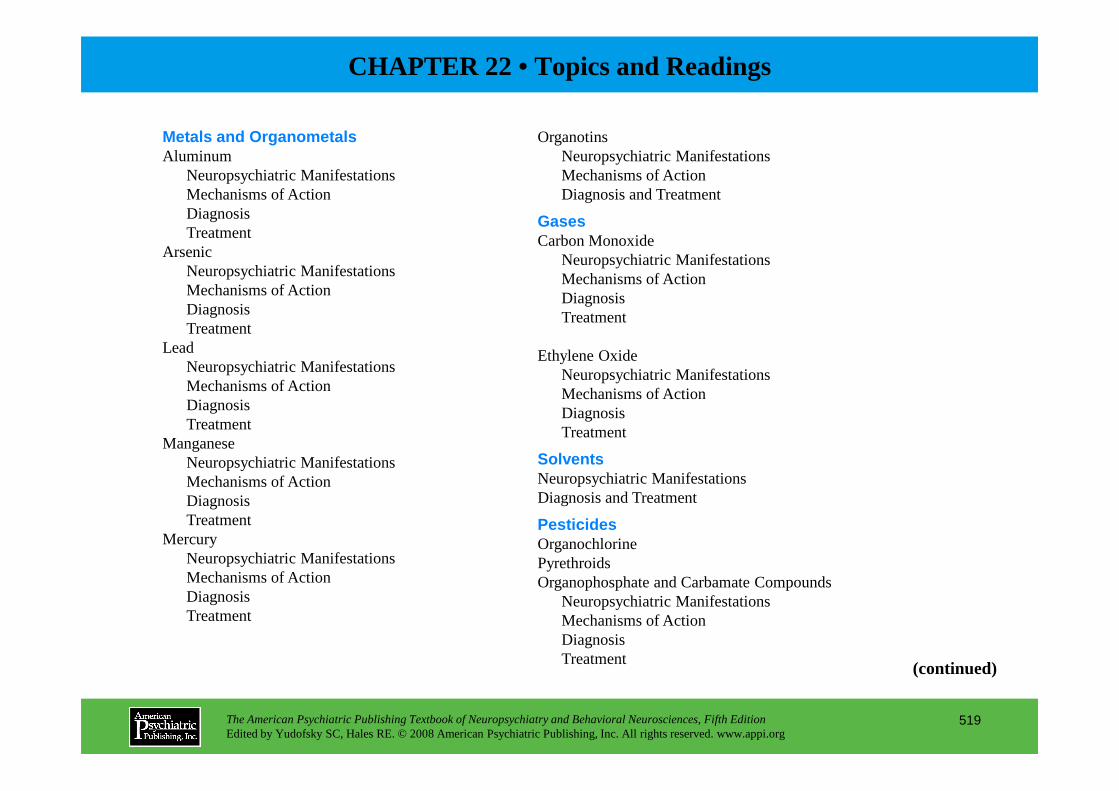
Metals and OrganometalsAluminum
Neuropsychiatric ManifestationsMechanisms of ActionDiagnosisTreatment
ArsenicNeuropsychiatric ManifestationsMechanisms of ActionDiagnosisTreatment
LeadNeuropsychiatric ManifestationsMechanisms of Action
OrganotinsNeuropsychiatric ManifestationsMechanisms of ActionDiagnosis and Treatment
GasesCarbon Monoxide
Neuropsychiatric ManifestationsMechanisms of ActionDiagnosisTreatment
Ethylene OxideNeuropsychiatric ManifestationsMechanisms of Action
CHAPTER 22 • Topics and Readings
The American Psychiatric Publishing Textbook of Neuropsychiatry and Behavioral Neurosciences, Fifth EditionEdited by Yudofsky SC, Hales RE. © 2008 American Psychiatric Publishing, Inc. All rights reserved. www.appi.org
519
DiagnosisTreatment
ManganeseNeuropsychiatric ManifestationsMechanisms of ActionDiagnosisTreatment
MercuryNeuropsychiatric ManifestationsMechanisms of ActionDiagnosisTreatment
Mechanisms of ActionDiagnosisTreatment
SolventsNeuropsychiatric ManifestationsDiagnosis and Treatment
PesticidesOrganochlorinePyrethroidsOrganophosphate and Carbamate Compounds
Neuropsychiatric ManifestationsMechanisms of ActionDiagnosisTreatment
(continued)

CHAPTER 22 • Topics and Readings (continued)
ToxinsMarine Toxins
Domoic AcidTetrodotoxin
Microbial ToxinsBotulinum ToxinTetanus Toxin
Plant ToxinsFungal Toxins
MacrofungiMicrofungi
Neuropsychiatric manifestationsMechanisms of actionDiagnosis
RECOMMENDED READINGSDart RC: Medical Toxicology. Philadelphia, PA, Lippincott
Williams & Wilkins, 2004Ellenhorn MJ: Ellenhorn’s Medical Toxicology: Diagnosis
and Treatment of Human Poisoning. Baltimore, MD, Williams & Wilkins, 1997
Rea WJ, Didriksen N, Simon TR, et al: Effects of toxic exposure to molds and mycotoxins in building-related illnesses. Arch Environ Health 58:399–405, 2003
The American Psychiatric Publishing Textbook of Neuropsychiatry and Behavioral Neurosciences, Fifth EditionEdited by Yudofsky SC, Hales RE. © 2008 American Psychiatric Publishing, Inc. All rights reserved. www.appi.org
520
TreatmentAnimal Toxins
Chemical Warfare AgentsNerve Agents
Neuropsychiatric ManifestationsMechanisms of ActionDiagnosisTreatment
Additional Poisons and Toxins Used as Chemical Weapons
Assessment of Toxic Exposure
Developmental Effects

CHAPTER 22 • Tables and Figures
Table 22–1. Selected poisons producing neuropsychiatric sequelae
Table 22–2. Neuropsychiatric sequelae associated with metal exposure
Table 22–3. Neuropsychiatric sequelae associated with solvent exposure
Table 22–4. Neuropsychiatric sequelae associated with gas exposure
Table 22–5. Neuropsychiatric sequelae associated with pesticide exposure
Table 22–6. Sources of aluminum exposure
Table 22–7. Serum aluminum concentrations associated with neurotoxicity
Table 22–8. Sources of arsenic exposure
Table 22–9. Sources of lead exposure
Table 22–10. Sources of mercury exposure
Figure 22–1. Chemical structures of trialkyltin compounds
The American Psychiatric Publishing Textbook of Neuropsychiatry and Behavioral Neurosciences, Fifth EditionEdited by Yudofsky SC, Hales RE. © 2008 American Psychiatric Publishing, Inc. All rights reserved. www.appi.org
521
Figure 22–1. Chemical structures of trialkyltin compounds
Table 22–11. Neuropsychiatric symptoms in delayed syndrome associated with carbon monoxide intoxication
Figure 22–2. Chemical structures of representative organochlorine pesticides
Figure 22–3. Chemical structures of 2,4-dichlorophenoxyacetic acid (2,4-D), 2,4,5-trichlorophenoxyacetic acid (2,4,5-T), and 2,3,7,8-tetrachlorodibenzo-p-dioxin (TCDD)
Table 22–12. Representative commercially available organophosphate and carbamate insecticides and comparison of their relative toxicities by LD50 on a rat lethality model
Figure 22–4. Chemical structures of organophosphate pesticides parathion, diazinon, and malathion
Figure 22–5. Chemical structures of representative carbamate pesticides
(continued)

CHAPTER 22 • Tables and Figures (continued)
Figure 22–6. Interaction between an organophosphate or carbamate ester with the serine hydroxyl group in the active site of the enzyme acetylcholinesterase
Table 22–13. Psychoactive substances used in herbal preparations
Table 22–14. Major hallucinogenic plants and their active components
Table 22–15. Plants of abuse
Figure 22–7. Chemical structures of psilocybin and psilocin
Figure 22–8. Chemical structures of pharmacologically active ergot alkaloids derived from mold
Figure 22–9. Chemical structures of some representative mycotoxins with reported neurotoxicity
Table 22–16. Composition of snake venoms
Figure 22–10. Chemical structures of nerve agents cyclosarin (GF), soman (GD), sarin (GB), tabun (GA), and VX
The American Psychiatric Publishing Textbook of Neuropsychiatry and Behavioral Neurosciences, Fifth EditionEdited by Yudofsky SC, Hales RE. © 2008 American Psychiatric Publishing, Inc. All rights reserved. www.appi.org
522
and VX
Table 22–17. Signs and symptoms of nerve agent poisoning
Figure 22–11. The “aging” reaction between organophosphorus pesticides or nerve agents and acetylcholinesterase occurs in a three-step process
Table 22–18. Aging of the nerve agent acetylcholinesterase complex
Figure 22–12. Prolonged miosis after accidental exposure to soman
Figure 22–13. Oxime acetylcholinesterase reactivators obidoxime chloride, pralidoxime (2-PAM), and bispyridinium oxime (HI-6)
Table 22–19. Comparative lethality and molecular weight of neurotoxic substances used as chemical weapons in a laboratory mice model
Summary Highlights for the Clinician

TABLE 22–1. Selected poisons producing neuropsychia tric sequelae
A poison is a material or substance that can produc e a harmful response in a biological life form, causing serious functional injury or death. Several different classes of chemical poisons producing neuropsychiatric sequelae are shown in Table 22–1.
The American Psychiatric Publishing Textbook of Neuropsychiatry and Behavioral Neurosciences, Fifth EditionEdited by Yudofsky SC, Hales RE. © 2008 American Psychiatric Publishing, Inc. All rights reserved. www.appi.org
523

TABLE 22–2. Neuropsychiatric sequelae associated wi th metal exposure
Exposure to various metals can result in neuropsych iatric manifestations, as shown in Table 22–2. For more information on specific metals, see Tables 22–6 though 22–10 and Figure 22–1.
The American Psychiatric Publishing Textbook of Neuropsychiatry and Behavioral Neurosciences, Fifth EditionEdited by Yudofsky SC, Hales RE. © 2008 American Psychiatric Publishing, Inc. All rights reserved. www.appi.org
524
(continued)
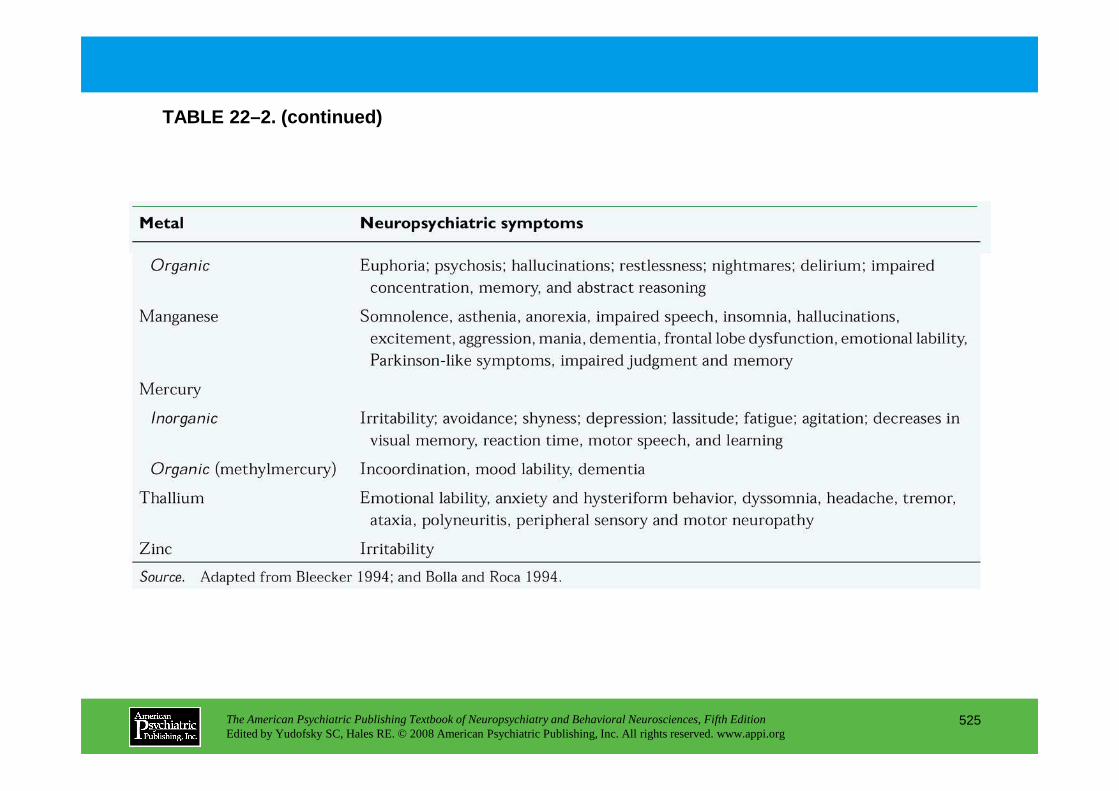
TABLE 22–2. (continued)
The American Psychiatric Publishing Textbook of Neuropsychiatry and Behavioral Neurosciences, Fifth EditionEdited by Yudofsky SC, Hales RE. © 2008 American Psychiatric Publishing, Inc. All rights reserved. www.appi.org
525
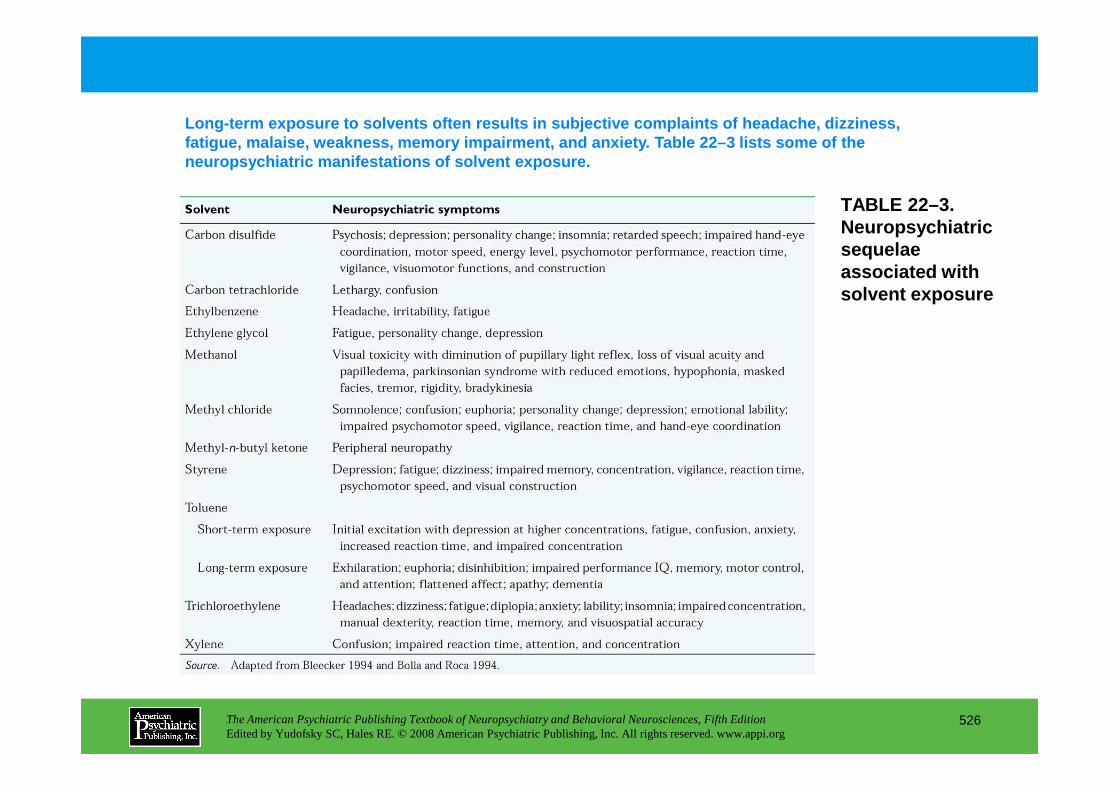
TABLE 22–3. Neuropsychiatric sequelae associated with solvent exposure
Long-term exposure to solvents often results in sub jective complaints of headache, dizziness, fatigue, malaise, weakness, memory impairment, and anxiety. Table 22–3 lists some of the neuropsychiatric manifestations of solvent exposure .
The American Psychiatric Publishing Textbook of Neuropsychiatry and Behavioral Neurosciences, Fifth EditionEdited by Yudofsky SC, Hales RE. © 2008 American Psychiatric Publishing, Inc. All rights reserved. www.appi.org
526

TABLE 22–4. Neuropsychiatric sequelae associated wi th gas exposure
Neuropsychiatric manifestations of exposure to vari ous gases are listed in Table 22–4. For more information on carbon monoxide exposure, see Table 22–11.
The American Psychiatric Publishing Textbook of Neuropsychiatry and Behavioral Neurosciences, Fifth EditionEdited by Yudofsky SC, Hales RE. © 2008 American Psychiatric Publishing, Inc. All rights reserved. www.appi.org
527
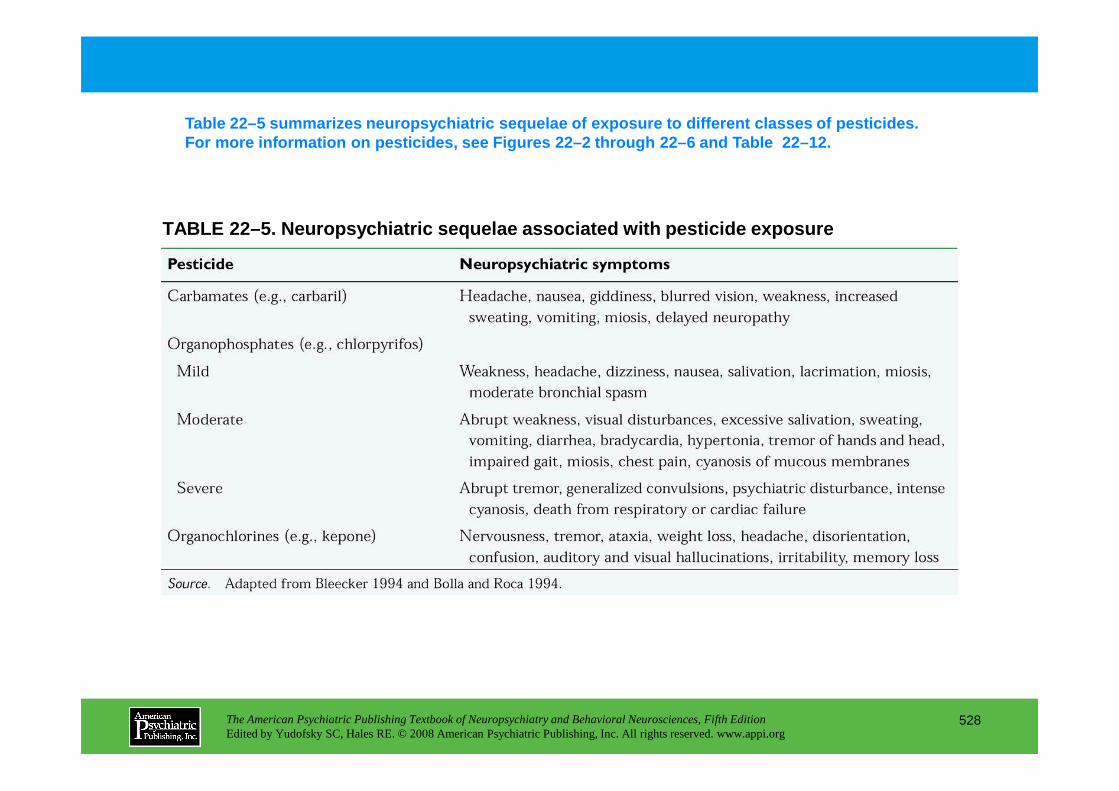
TABLE 22–5. Neuropsychiatric sequelae associated wi th pesticide exposure
Table 22–5 summarizes neuropsychiatric sequelae of e xposure to different classes of pesticides. For more information on pesticides, see Figures 22– 2 through 22–6 and Table 22–12.
The American Psychiatric Publishing Textbook of Neuropsychiatry and Behavioral Neurosciences, Fifth EditionEdited by Yudofsky SC, Hales RE. © 2008 American Psychiatric Publishing, Inc. All rights reserved. www.appi.org
528

TABLE 22–6. Sources of aluminum exposure
People are exposed to aluminum in multiple ways through its use in construction, household and industrial utensils, and medications. Table 22–6 lists some of the sources of aluminum exposure.
The American Psychiatric Publishing Textbook of Neuropsychiatry and Behavioral Neurosciences, Fifth EditionEdited by Yudofsky SC, Hales RE. © 2008 American Psychiatric Publishing, Inc. All rights reserved. www.appi.org
529

TABLE 22–7. Serum aluminum concentrations associate d with neurotoxicity
Aluminum neurotoxicity occurs almost exclusively in persons who are unable to excrete dietary aluminum, usually due to renal failure. Table 22–7 lists serum aluminum levels and their correlation with clinical effects.
The American Psychiatric Publishing Textbook of Neuropsychiatry and Behavioral Neurosciences, Fifth EditionEdited by Yudofsky SC, Hales RE. © 2008 American Psychiatric Publishing, Inc. All rights reserved. www.appi.org
530

TABLE 22–8. Sources of arsenic exposure
Industry continues to be the major source of arsenic compounds. Table 22–8 provides an overview of the various sources of arsenic exposure.
The American Psychiatric Publishing Textbook of Neuropsychiatry and Behavioral Neurosciences, Fifth EditionEdited by Yudofsky SC, Hales RE. © 2008 American Psychiatric Publishing, Inc. All rights reserved. www.appi.org
531

TABLE 22–9. Sources of lead exposure
Plumbism, or lead poisoning, was recognized as an occupational hazard as long ago as 150 B.C. Despite its removal from gasoline and paints, lead continues to be an environmental hazard with sources of exposure in multiple industries (Table 22–9).
The American Psychiatric Publishing Textbook of Neuropsychiatry and Behavioral Neurosciences, Fifth EditionEdited by Yudofsky SC, Hales RE. © 2008 American Psychiatric Publishing, Inc. All rights reserved. www.appi.org
532
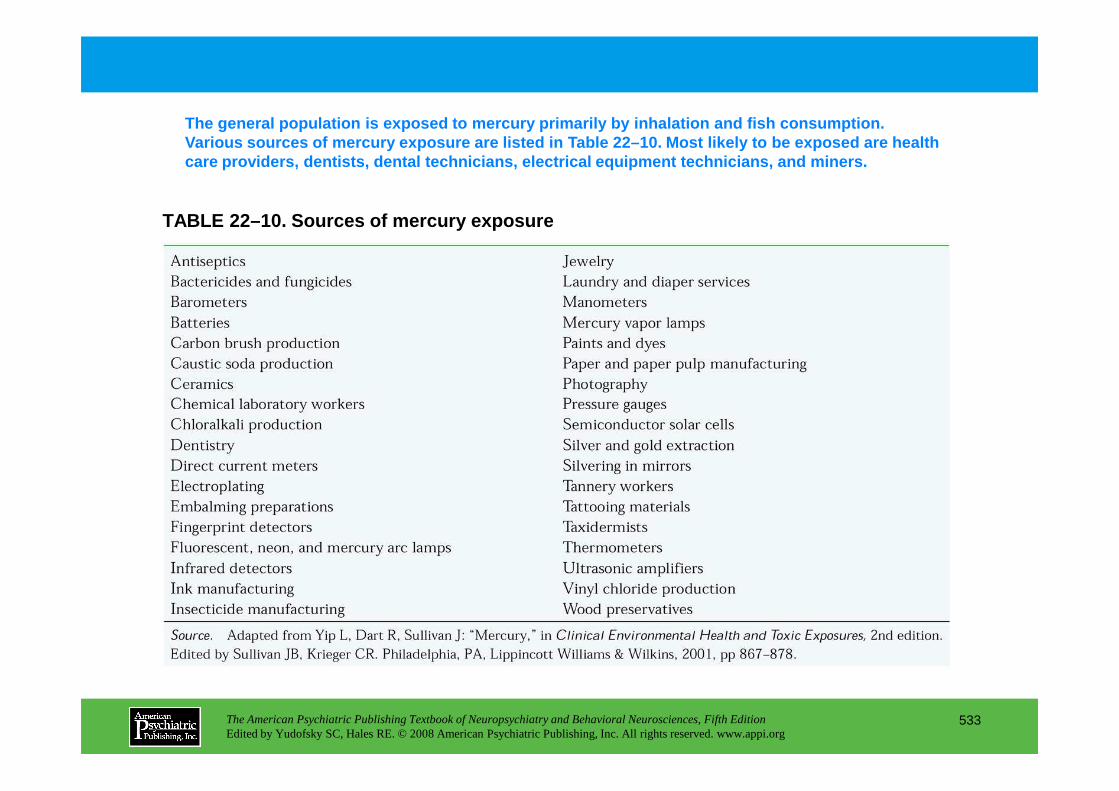
TABLE 22–10. Sources of mercury exposure
The general population is exposed to mercury primar ily by inhalation and fish consumption. Various sources of mercury exposure are listed in T able 22–10. Most likely to be exposed are health care providers, dentists, dental technicians, elect rical equipment technicians, and miners.
The American Psychiatric Publishing Textbook of Neuropsychiatry and Behavioral Neurosciences, Fifth EditionEdited by Yudofsky SC, Hales RE. © 2008 American Psychiatric Publishing, Inc. All rights reserved. www.appi.org
533
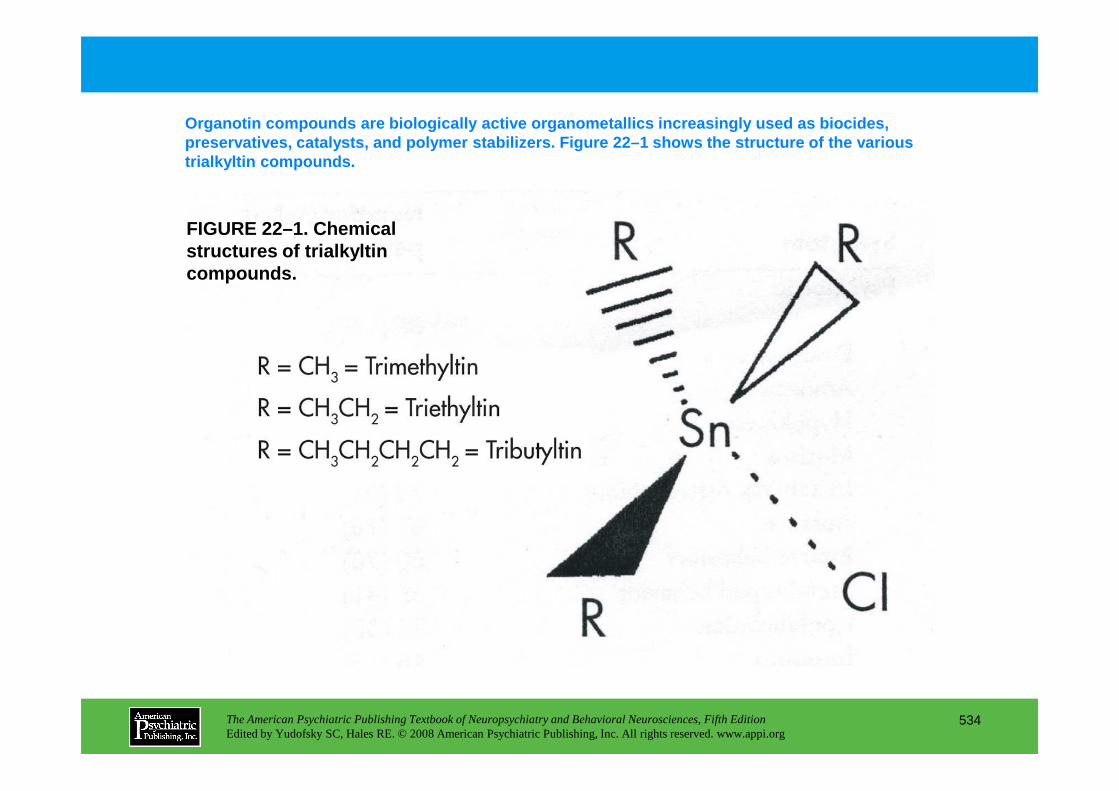
FIGURE 22–1. Chemical structures of trialkyltin compounds.
Organotin compounds are biologically active organom etallics increasingly used as biocides, preservatives, catalysts, and polymer stabilizers. F igure 22–1 shows the structure of the various trialkyltin compounds.
The American Psychiatric Publishing Textbook of Neuropsychiatry and Behavioral Neurosciences, Fifth EditionEdited by Yudofsky SC, Hales RE. © 2008 American Psychiatric Publishing, Inc. All rights reserved. www.appi.org
534

TABLE 22–11. Neuropsychiatric symptoms in delayed s yndrome associated with carbon monoxide intoxication
Patients may appear to recover from a short-term ex posure to carbon monoxide after several days, but after 2 to 4 weeks, a sudden deterioration may develop. Table 22–11 lists delayed neuropsychiatric sequelae after carbon monoxide int oxication.
The American Psychiatric Publishing Textbook of Neuropsychiatry and Behavioral Neurosciences, Fifth EditionEdited by Yudofsky SC, Hales RE. © 2008 American Psychiatric Publishing, Inc. All rights reserved. www.appi.org
535
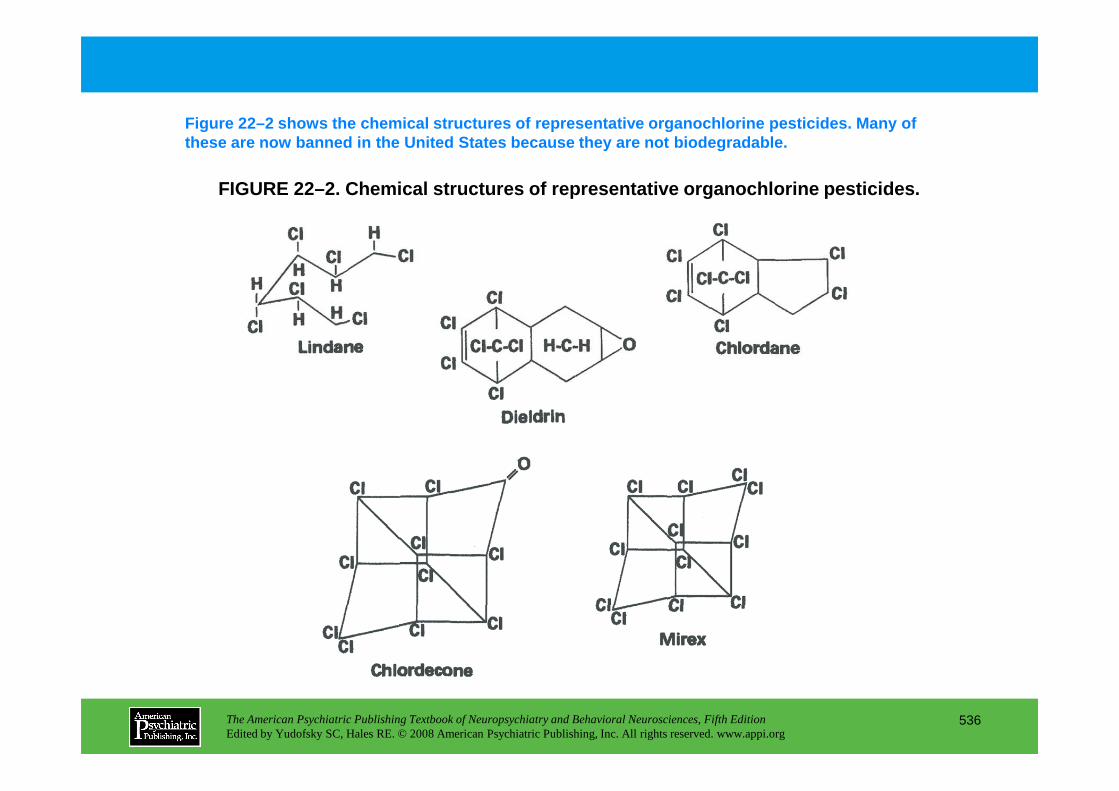
FIGURE 22–2. Chemical structures of representative organochlorine pesticides.
Figure 22–2 shows the chemical structures of repres entative organochlorine pesticides. Many of these are now banned in the United States because t hey are not biodegradable.
The American Psychiatric Publishing Textbook of Neuropsychiatry and Behavioral Neurosciences, Fifth EditionEdited by Yudofsky SC, Hales RE. © 2008 American Psychiatric Publishing, Inc. All rights reserved. www.appi.org
536
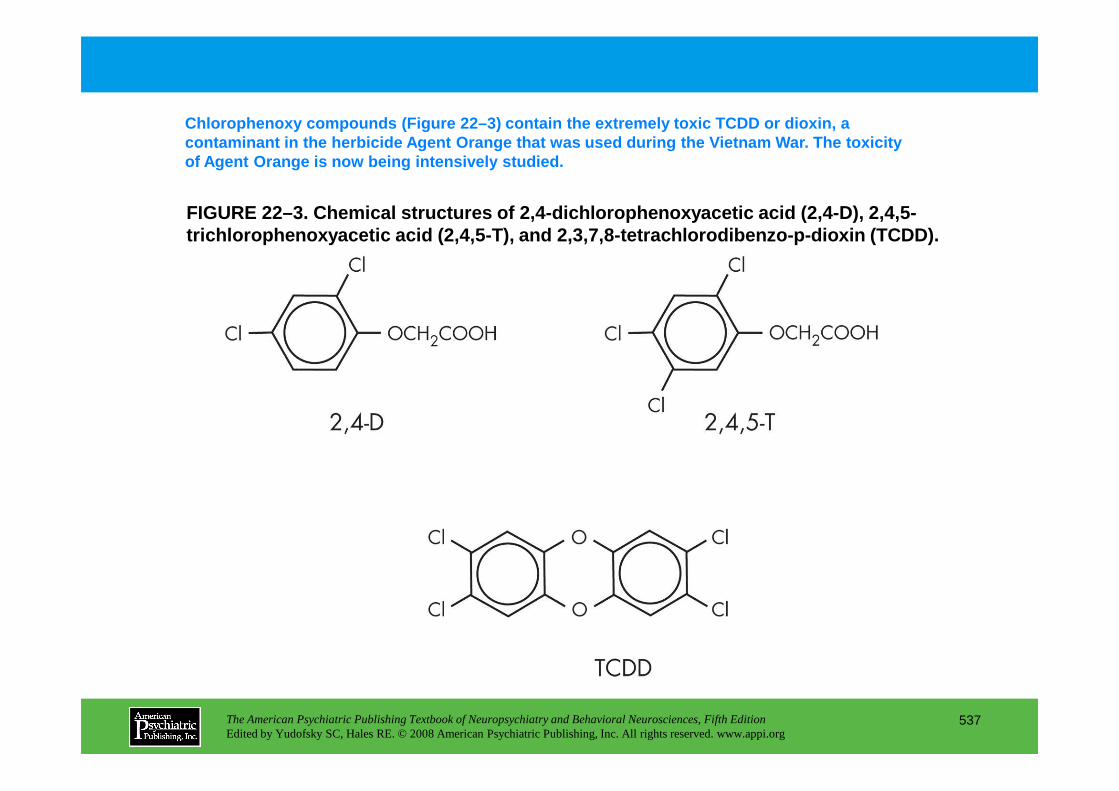
FIGURE 22–3. Chemical structures of 2,4-dichlorophe noxyacetic acid (2,4-D), 2,4,5-trichlorophenoxyacetic acid (2,4,5-T), and 2,3,7,8- tetrachlorodibenzo- p-dioxin (TCDD).
Chlorophenoxy compounds (Figure 22–3) contain the e xtremely toxic TCDD or dioxin, a contaminant in the herbicide Agent Orange that was used during the Vietnam War. The toxicity of Agent Orange is now being intensively studied.
The American Psychiatric Publishing Textbook of Neuropsychiatry and Behavioral Neurosciences, Fifth EditionEdited by Yudofsky SC, Hales RE. © 2008 American Psychiatric Publishing, Inc. All rights reserved. www.appi.org
537

TABLE 22–12. Representative commercially available organophosphate and
The organophosphate and carbamate pesticides include 60 to 100 individual compounds used throughout the world, more than 40 of which are currently in commercial use in the United States (Table 22–12).
The American Psychiatric Publishing Textbook of Neuropsychiatry and Behavioral Neurosciences, Fifth EditionEdited by Yudofsky SC, Hales RE. © 2008 American Psychiatric Publishing, Inc. All rights reserved. www.appi.org
538
organophosphate and carbamate insecticides and comparison of their relative toxicities by LD50
a on a rat lethality model
(continued)
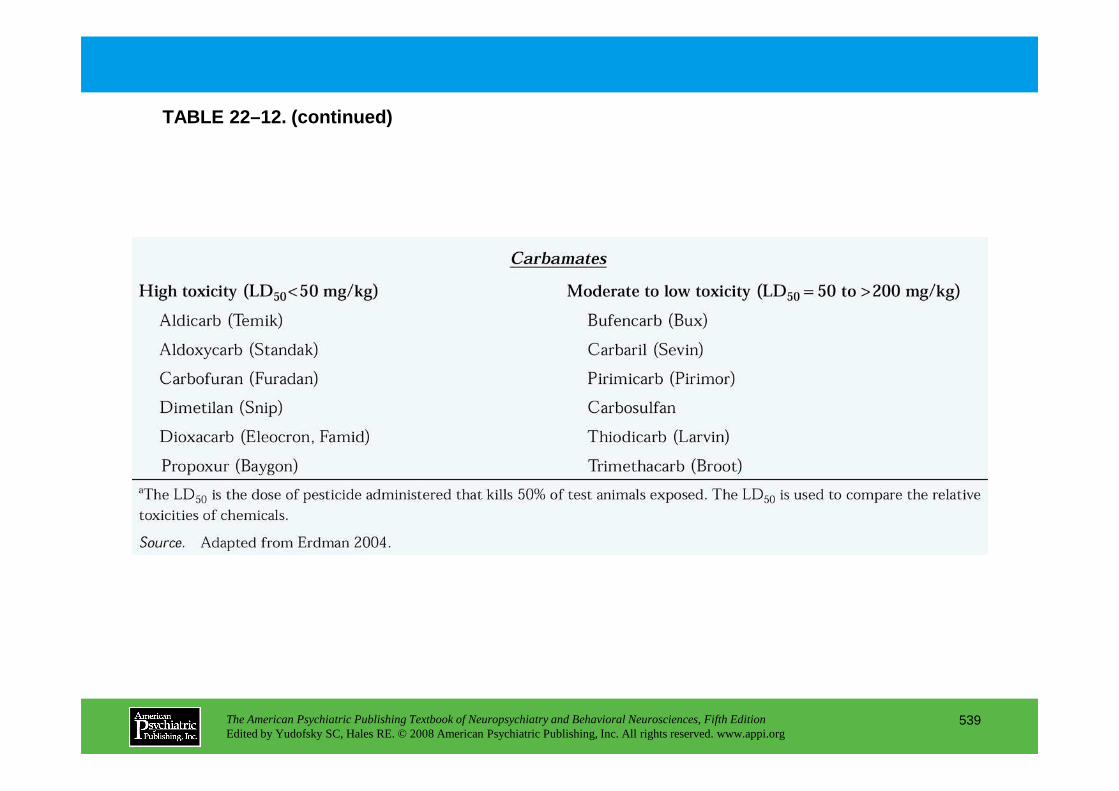
TABLE 22–12. (continued)
The American Psychiatric Publishing Textbook of Neuropsychiatry and Behavioral Neurosciences, Fifth EditionEdited by Yudofsky SC, Hales RE. © 2008 American Psychiatric Publishing, Inc. All rights reserved. www.appi.org
539

FIGURE 22–4. Chemical structures of organophosphate pesticides parathion, diazinon, and malathion.
Figure 22–4 shows representative structures of common organophosphate pesticides. Concerns about possible hostile use of these agents have led to increased interest in studying them and in training clinicians to identify and treat organophosphate toxicity.
The American Psychiatric Publishing Textbook of Neuropsychiatry and Behavioral Neurosciences, Fifth EditionEdited by Yudofsky SC, Hales RE. © 2008 American Psychiatric Publishing, Inc. All rights reserved. www.appi.org
540

FIGURE 22–5. Chemical structures of representative carbamate pesticides.
Figure 22–5 illustrates representative structures o f common carbamate pesticides.
The American Psychiatric Publishing Textbook of Neuropsychiatry and Behavioral Neurosciences, Fifth EditionEdited by Yudofsky SC, Hales RE. © 2008 American Psychiatric Publishing, Inc. All rights reserved. www.appi.org
541
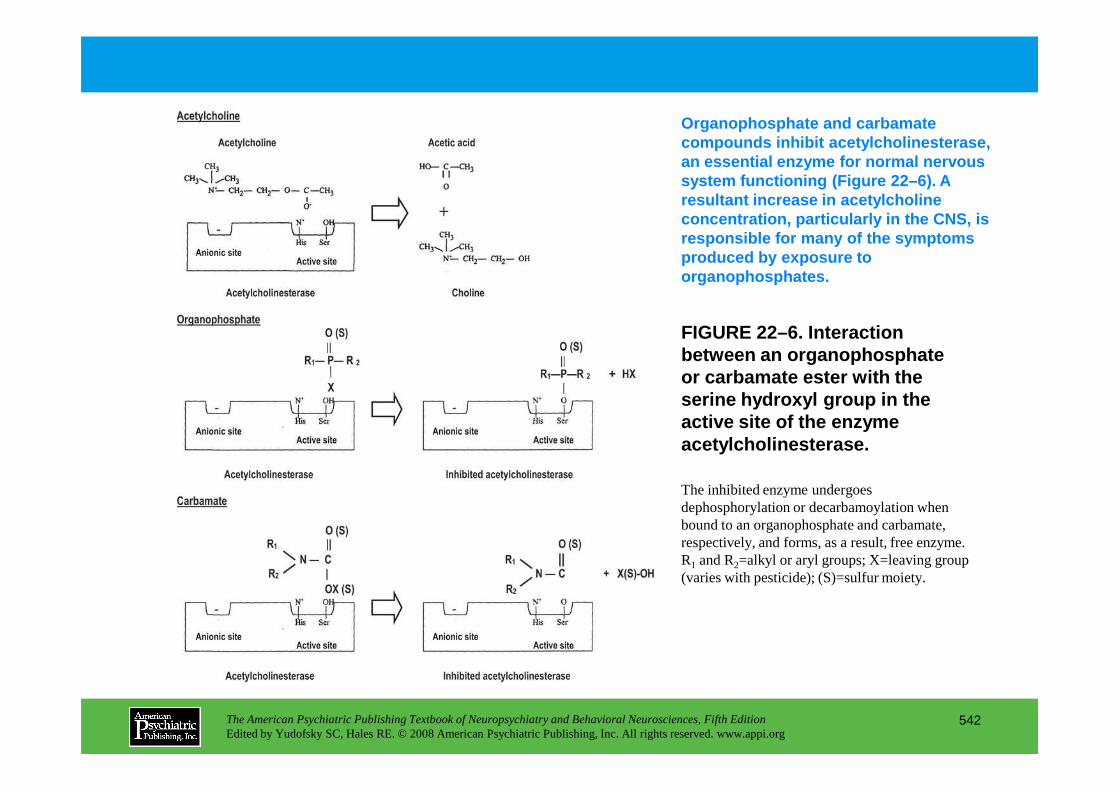
FIGURE 22–6. Interaction between an organophosphate or carbamate ester with the serine hydroxyl group in the
Organophosphate and carbamate compounds inhibit acetylcholinesterase, an essential enzyme for normal nervous system functioning (Figure 22–6). A resultant increase in acetylcholine concentration, particularly in the CNS, is responsible for many of the symptoms produced by exposure to organophosphates.
The American Psychiatric Publishing Textbook of Neuropsychiatry and Behavioral Neurosciences, Fifth EditionEdited by Yudofsky SC, Hales RE. © 2008 American Psychiatric Publishing, Inc. All rights reserved. www.appi.org
542
serine hydroxyl group in the active site of the enzyme acetylcholinesterase.
The inhibited enzyme undergoes dephosphorylation or decarbamoylation when bound to an organophosphate and carbamate, respectively, and forms, as a result, free enzyme. R1 and R2=alkyl or aryl groups; X=leaving group (varies with pesticide); (S)=sulfur moiety.
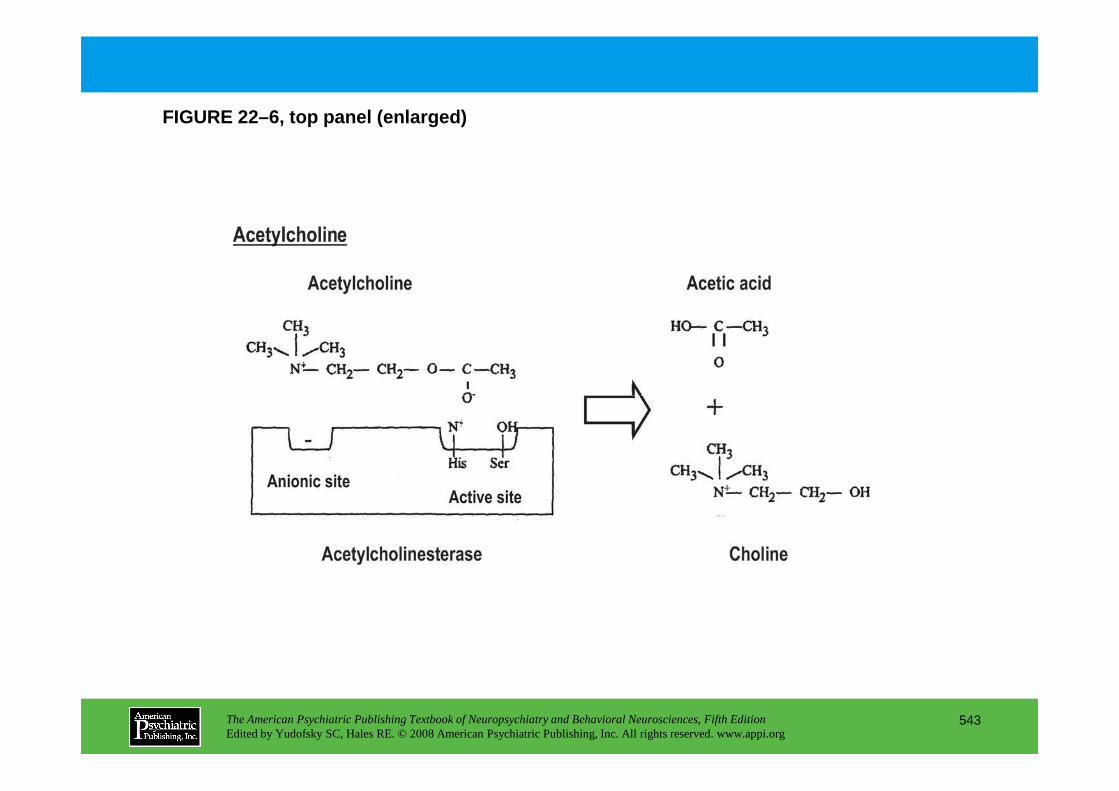
FIGURE 22–6, top panel (enlarged)
The American Psychiatric Publishing Textbook of Neuropsychiatry and Behavioral Neurosciences, Fifth EditionEdited by Yudofsky SC, Hales RE. © 2008 American Psychiatric Publishing, Inc. All rights reserved. www.appi.org
543
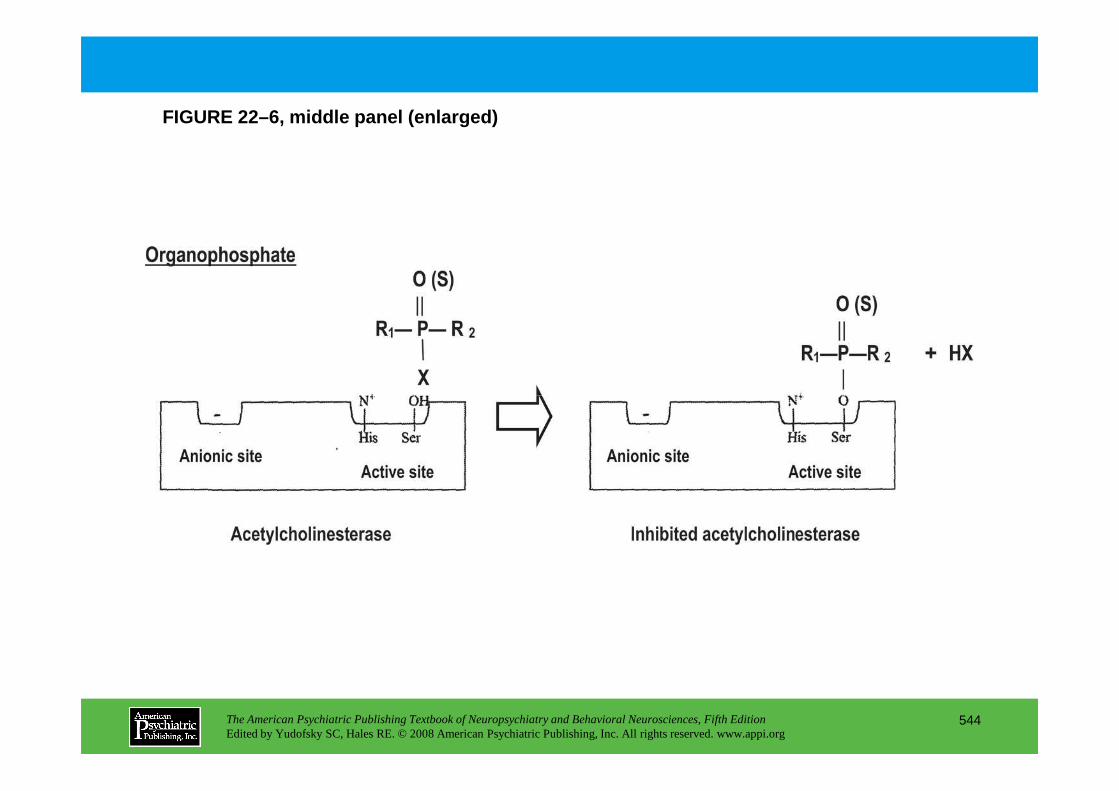
FIGURE 22–6, middle panel (enlarged)
The American Psychiatric Publishing Textbook of Neuropsychiatry and Behavioral Neurosciences, Fifth EditionEdited by Yudofsky SC, Hales RE. © 2008 American Psychiatric Publishing, Inc. All rights reserved. www.appi.org
544

FIGURE 22–6, bottom panel (enlarged)
The American Psychiatric Publishing Textbook of Neuropsychiatry and Behavioral Neurosciences, Fifth EditionEdited by Yudofsky SC, Hales RE. © 2008 American Psychiatric Publishing, Inc. All rights reserved. www.appi.org
545

TABLE 22–13. Psychoactive substances used in herbal preparations
Table 22–13 lists psychoactive substances with neur opsychiatric effects that are found in herbal preparations.
The American Psychiatric Publishing Textbook of Neuropsychiatry and Behavioral Neurosciences, Fifth EditionEdited by Yudofsky SC, Hales RE. © 2008 American Psychiatric Publishing, Inc. All rights reserved. www.appi.org
546
(continued)
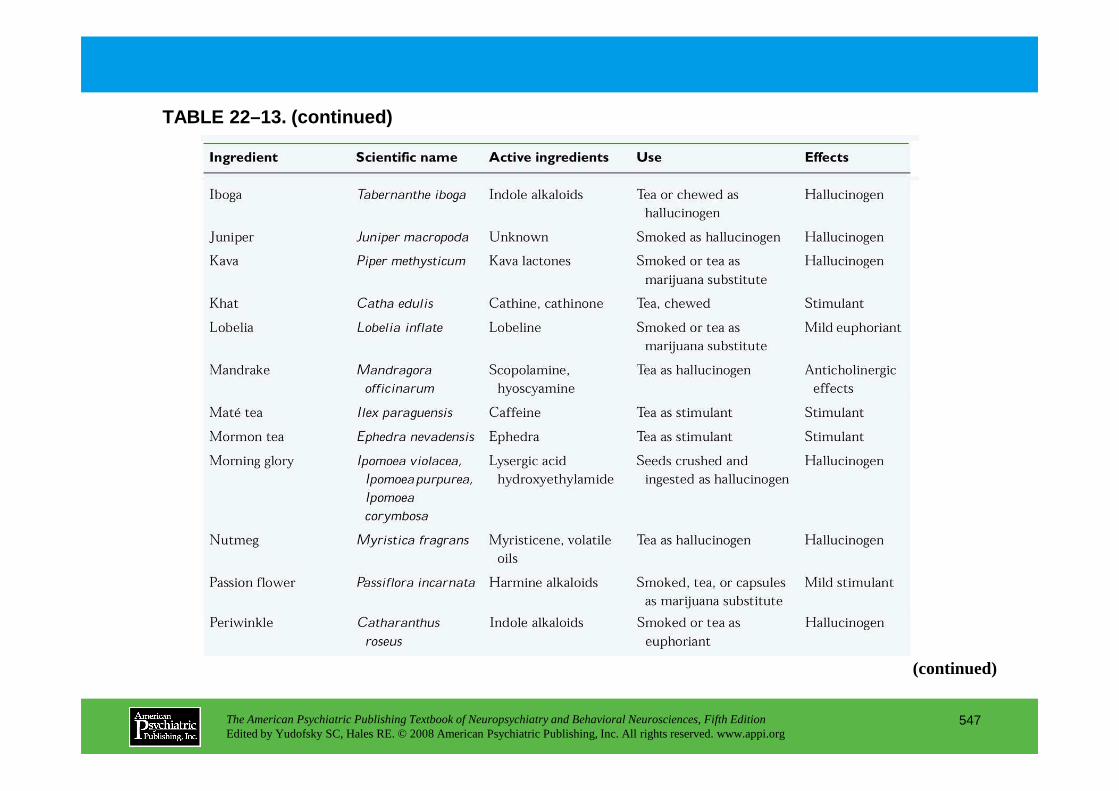
TABLE 22–13. (continued)
The American Psychiatric Publishing Textbook of Neuropsychiatry and Behavioral Neurosciences, Fifth EditionEdited by Yudofsky SC, Hales RE. © 2008 American Psychiatric Publishing, Inc. All rights reserved. www.appi.org
547
(continued)
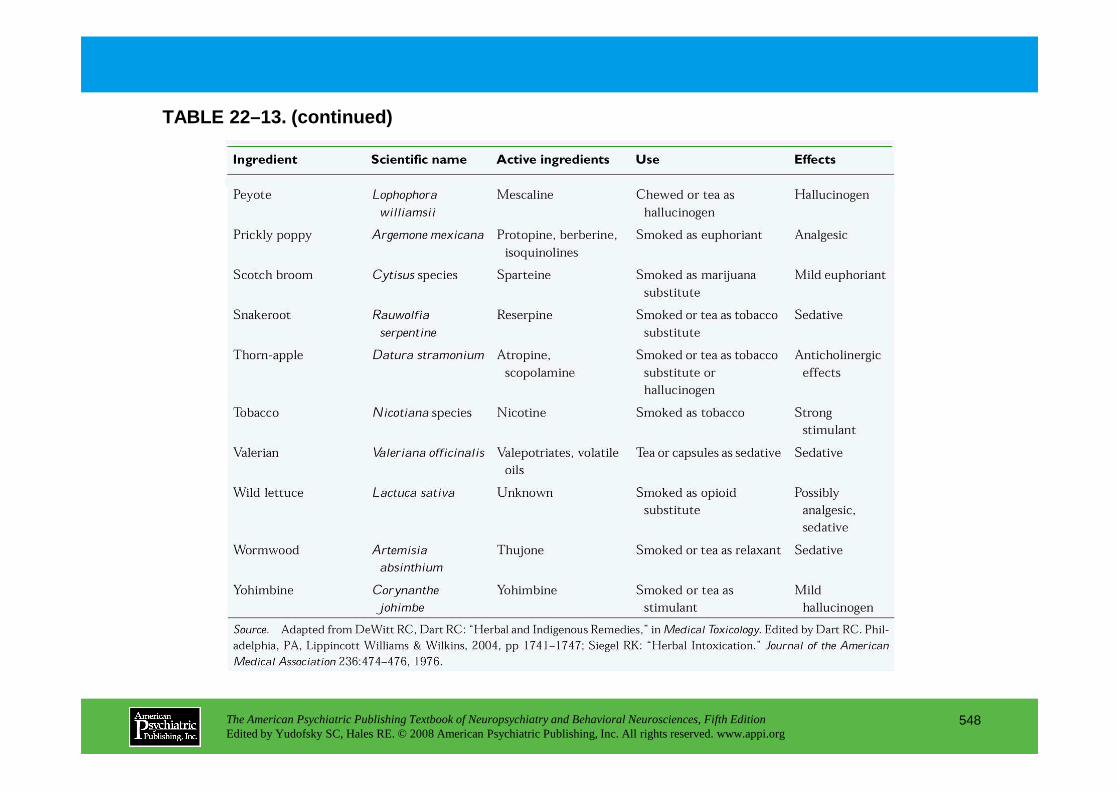
TABLE 22–13. (continued)
The American Psychiatric Publishing Textbook of Neuropsychiatry and Behavioral Neurosciences, Fifth EditionEdited by Yudofsky SC, Hales RE. © 2008 American Psychiatric Publishing, Inc. All rights reserved. www.appi.org
548
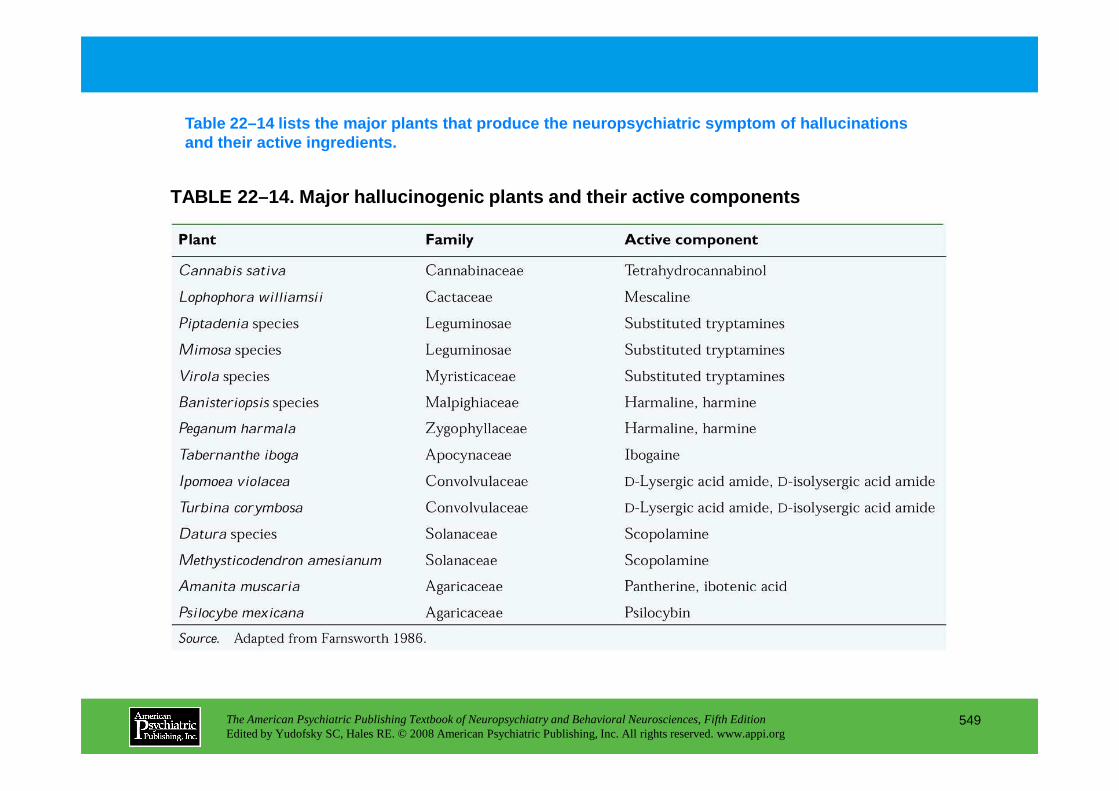
TABLE 22–14. Major hallucinogenic plants and their active components
Table 22–14 lists the major plants that produce the neuropsychiatric symptom of hallucinations and their active ingredients.
The American Psychiatric Publishing Textbook of Neuropsychiatry and Behavioral Neurosciences, Fifth EditionEdited by Yudofsky SC, Hales RE. © 2008 American Psychiatric Publishing, Inc. All rights reserved. www.appi.org
549

TABLE 22–15. Plants of abuse
Table 22–15 lists the major plants abused recreationally for their ability to alter the sensorium.
The American Psychiatric Publishing Textbook of Neuropsychiatry and Behavioral Neurosciences, Fifth EditionEdited by Yudofsky SC, Hales RE. © 2008 American Psychiatric Publishing, Inc. All rights reserved. www.appi.org
550
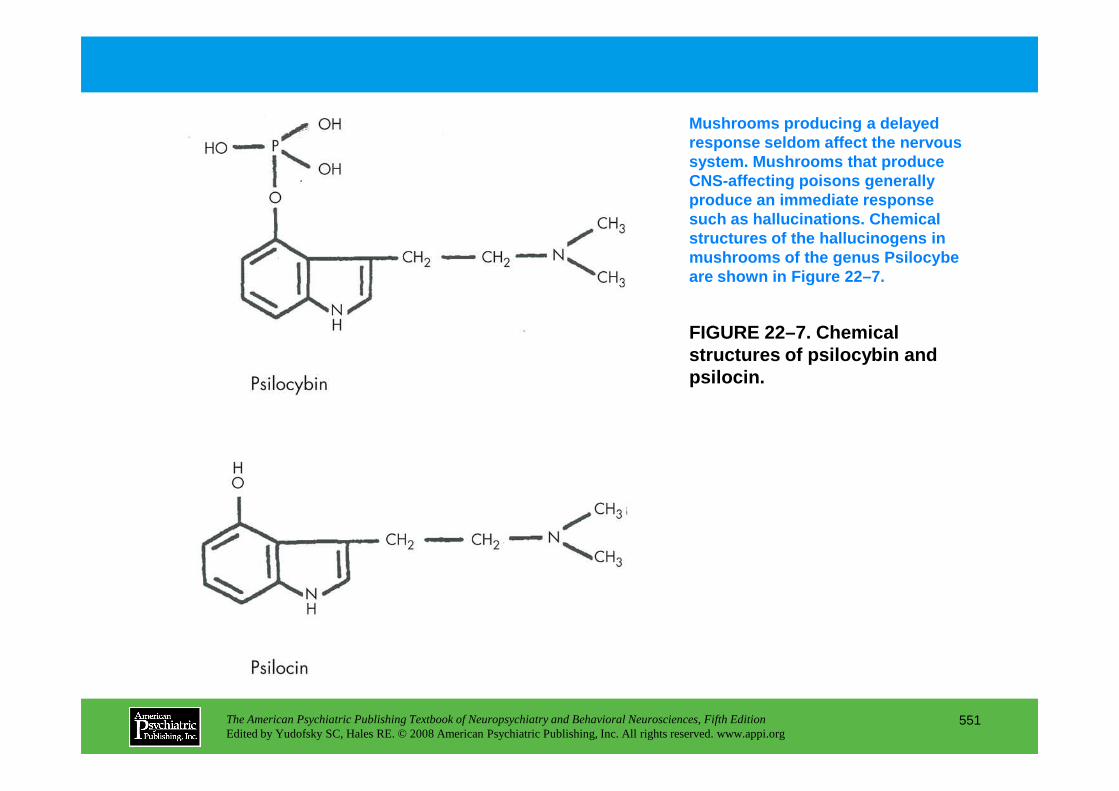
FIGURE 22–7. Chemical structures of psilocybin and psilocin.
Mushrooms producing a delayed response seldom affect the nervous system. Mushrooms that produce CNS-affecting poisons generally produce an immediate response such as hallucinations. Chemical structures of the hallucinogens in mushrooms of the genus Psilocybeare shown in Figure 22–7.
The American Psychiatric Publishing Textbook of Neuropsychiatry and Behavioral Neurosciences, Fifth EditionEdited by Yudofsky SC, Hales RE. © 2008 American Psychiatric Publishing, Inc. All rights reserved. www.appi.org
551
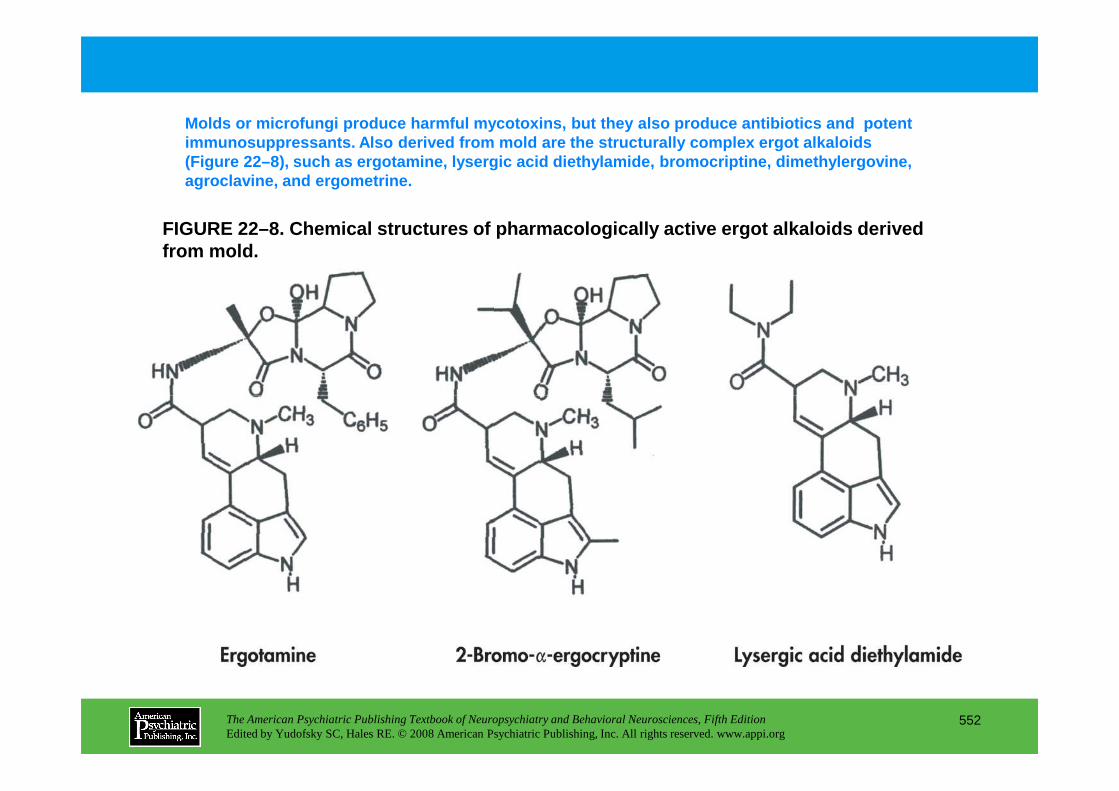
FIGURE 22–8. Chemical structures of pharmacological ly active ergot alkaloids derived from mold.
Molds or microfungi produce harmful mycotoxins, but they also produce antibiotics and potent immunosuppressants. Also derived from mold are the structurally complex ergot alkaloids (Figure 22–8), such as ergotamine, lysergic acid di ethylamide, bromocriptine, dimethylergovine, agroclavine, and ergometrine.
The American Psychiatric Publishing Textbook of Neuropsychiatry and Behavioral Neurosciences, Fifth EditionEdited by Yudofsky SC, Hales RE. © 2008 American Psychiatric Publishing, Inc. All rights reserved. www.appi.org
552
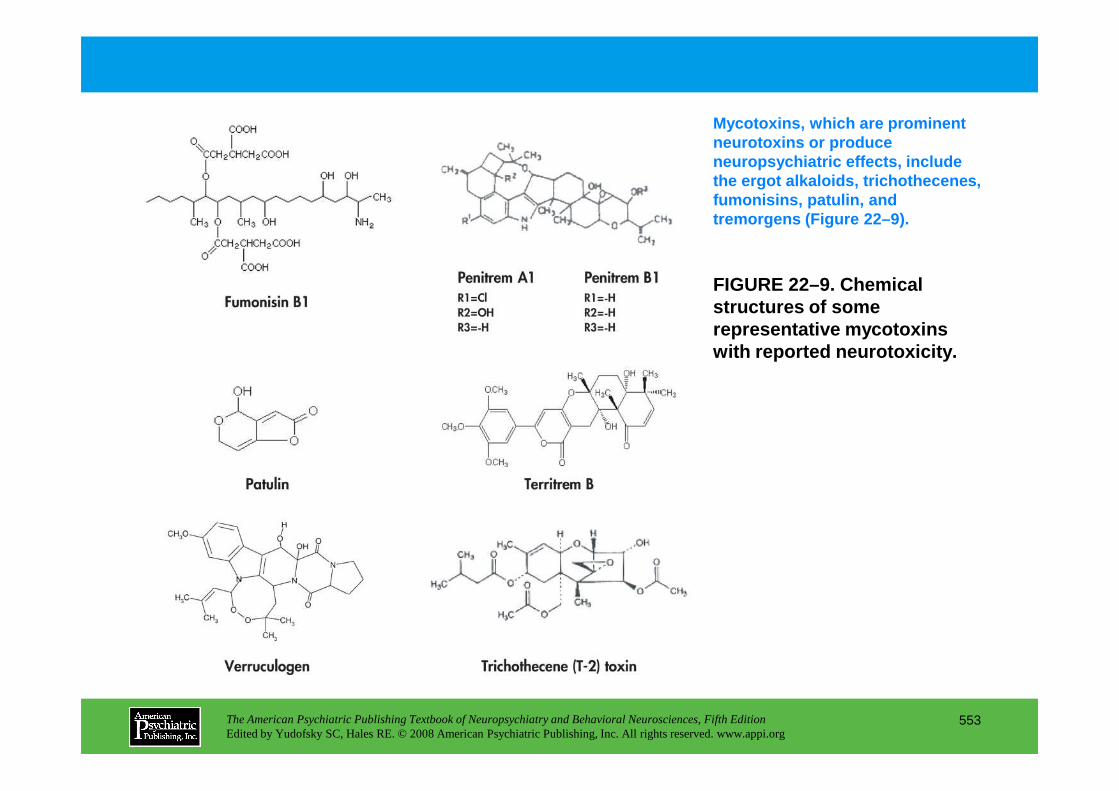
FIGURE 22–9. Chemical structures of some representative mycotoxins with reported neurotoxicity.
Mycotoxins, which are prominent neurotoxins or produce neuropsychiatric effects, include the ergot alkaloids, trichothecenes, fumonisins, patulin, and tremorgens (Figure 22–9).
The American Psychiatric Publishing Textbook of Neuropsychiatry and Behavioral Neurosciences, Fifth EditionEdited by Yudofsky SC, Hales RE. © 2008 American Psychiatric Publishing, Inc. All rights reserved. www.appi.org
553

TABLE 22–16. Composition of snake venoms
Animal venoms are complex mixtures of enzymes and proteins (Table 22–16) with various components that are neurotoxins, myotoxins, hemostatic system toxins, hemorrhagins, nephrotoxins, cardiotoxins, and necrotoxins.
The American Psychiatric Publishing Textbook of Neuropsychiatry and Behavioral Neurosciences, Fifth EditionEdited by Yudofsky SC, Hales RE. © 2008 American Psychiatric Publishing, Inc. All rights reserved. www.appi.org
554

FIGURE 22–10. Chemical structures of nerve agents cyclosarin (GF), soman (GD), sarin (GB), tabun (GA), and VX.
Nerve agents are particularly potent organophosphat es used for chemical warfare. Representative chemical structures are shown in Fig ure 22–10.
The American Psychiatric Publishing Textbook of Neuropsychiatry and Behavioral Neurosciences, Fifth EditionEdited by Yudofsky SC, Hales RE. © 2008 American Psychiatric Publishing, Inc. All rights reserved. www.appi.org
555
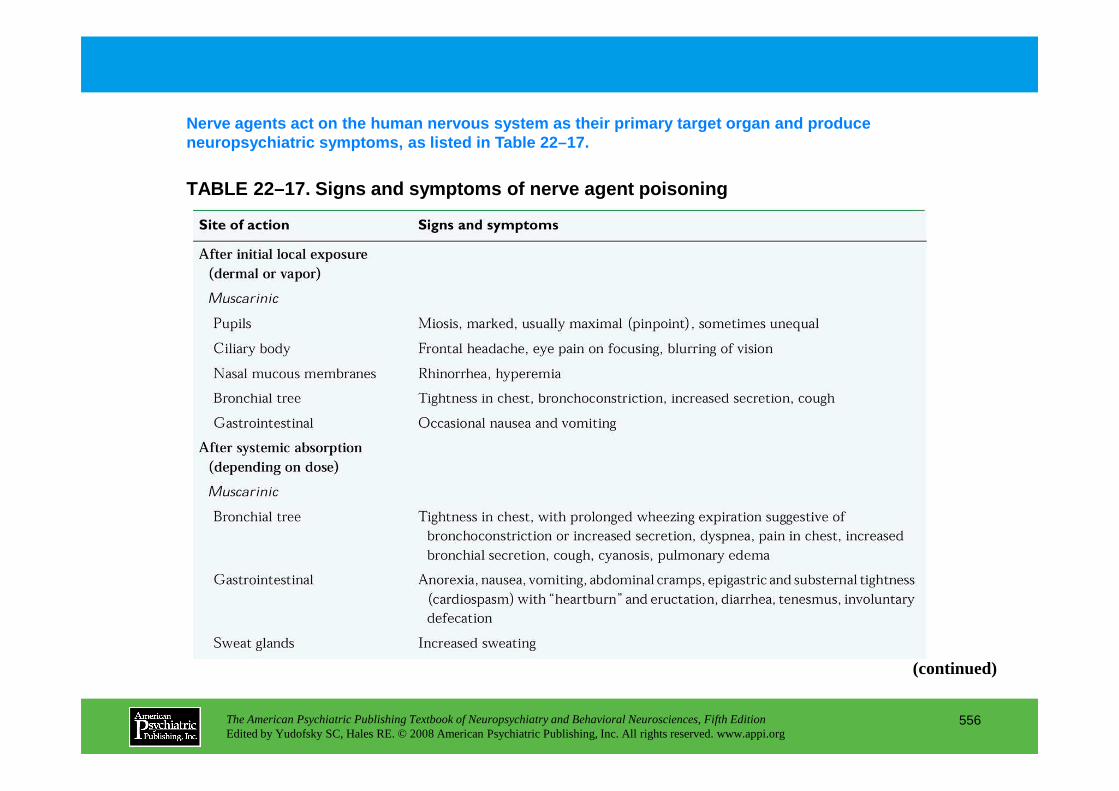
TABLE 22–17. Signs and symptoms of nerve agent pois oning
Nerve agents act on the human nervous system as the ir primary target organ and produce neuropsychiatric symptoms, as listed in Table 22–17 .
The American Psychiatric Publishing Textbook of Neuropsychiatry and Behavioral Neurosciences, Fifth EditionEdited by Yudofsky SC, Hales RE. © 2008 American Psychiatric Publishing, Inc. All rights reserved. www.appi.org
556
(continued)
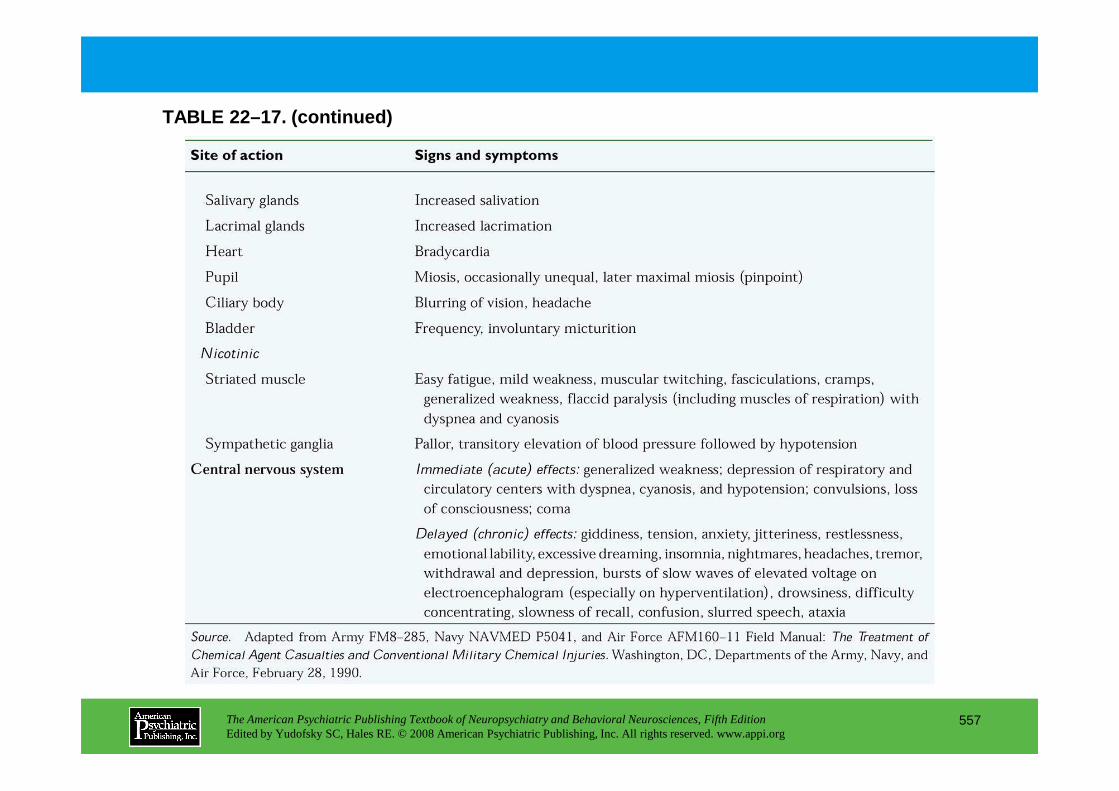
TABLE 22–17. (continued)
The American Psychiatric Publishing Textbook of Neuropsychiatry and Behavioral Neurosciences, Fifth EditionEdited by Yudofsky SC, Hales RE. © 2008 American Psychiatric Publishing, Inc. All rights reserved. www.appi.org
557
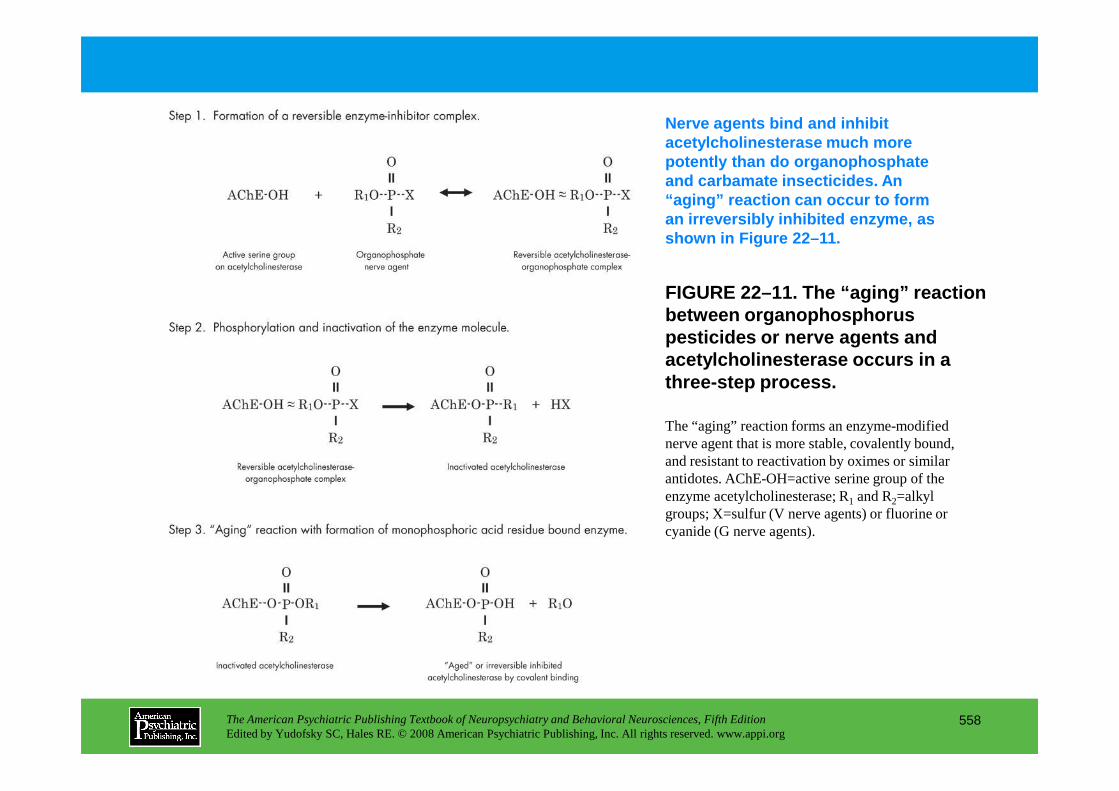
FIGURE 22–11. The “aging” reaction between organophosphorus pesticides or nerve agents and acetylcholinesterase occurs in a three-step process.
Nerve agents bind and inhibit acetylcholinesterase much more potently than do organophosphate and carbamate insecticides. An “aging” reaction can occur to form an irreversibly inhibited enzyme, as shown in Figure 22–11.
The American Psychiatric Publishing Textbook of Neuropsychiatry and Behavioral Neurosciences, Fifth EditionEdited by Yudofsky SC, Hales RE. © 2008 American Psychiatric Publishing, Inc. All rights reserved. www.appi.org
558
The “aging” reaction forms an enzyme-modified nerve agent that is more stable, covalently bound, and resistant to reactivation by oximes or similar antidotes. AChE-OH=active serine group of the enzyme acetylcholinesterase; R1 and R2=alkyl groups; X=sulfur (V nerve agents) or fluorine or cyanide (G nerve agents).

TABLE 22–18. Aging of the nerve agent acetylcholine sterase complex
Recovery from organophosphate nerve agents is slow because of the need to regenerate acetylcholinesterase. Table 22–18 lists the typical aging half-lives for the different nerve agents, after which the ability to reactivate the enzyme dim inishes.
The American Psychiatric Publishing Textbook of Neuropsychiatry and Behavioral Neurosciences, Fifth EditionEdited by Yudofsky SC, Hales RE. © 2008 American Psychiatric Publishing, Inc. All rights reserved. www.appi.org
559

FIGURE 22–12. Prolonged miosis after accidental exposure to soman.
Following accidental exposure to soman, symptoms such as pupil dilation can linger for weeks, as illustrated in Figure 22–12.
As with other volatile nerve agents, miosis tends to be predominant and prolonged. This series of photographs was taken by Dr. Frederick Sidell to show the long duration of miosis after soman exposure. These photographs were taken over a 62-day period in which the patient was maximally
The American Psychiatric Publishing Textbook of Neuropsychiatry and Behavioral Neurosciences, Fifth EditionEdited by Yudofsky SC, Hales RE. © 2008 American Psychiatric Publishing, Inc. All rights reserved. www.appi.org
560
62-day period in which the patient was maximally dark-adapted, and then a flash photograph was taken of the pupil faster than its ability to constrict.
Source.Reprinted from Sidell FR: “Soman and Sarin: Clinical Manifestations and Treatment of Accidental Poisoning by Organophosphates.” Clinical Toxicology7:1–17, 1974.
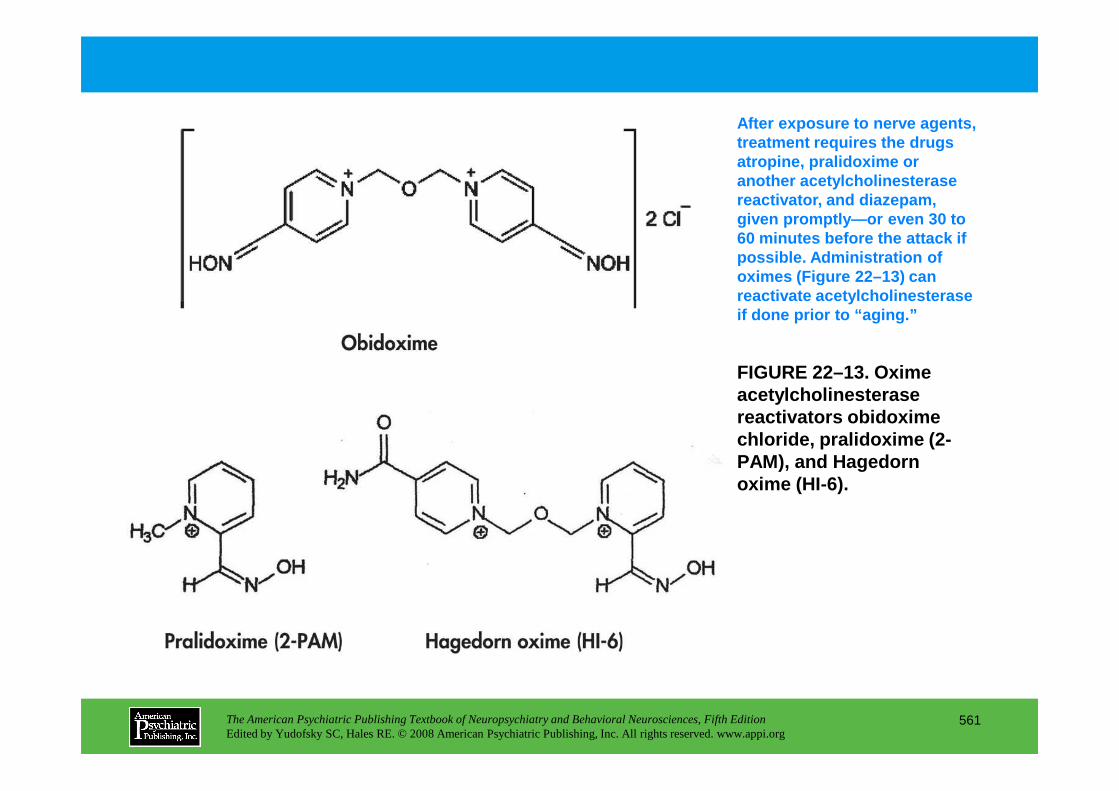
FIGURE 22–13. Oxime acetylcholinesterase
After exposure to nerve agents, treatment requires the drugs atropine, pralidoxime or another acetylcholinesterase reactivator, and diazepam, given promptly—or even 30 to 60 minutes before the attack if possible. Administration of oximes (Figure 22–13) can reactivate acetylcholinesterase if done prior to “aging.”
The American Psychiatric Publishing Textbook of Neuropsychiatry and Behavioral Neurosciences, Fifth EditionEdited by Yudofsky SC, Hales RE. © 2008 American Psychiatric Publishing, Inc. All rights reserved. www.appi.org
561
acetylcholinesterase reactivators obidoxime chloride, pralidoxime (2-PAM), and Hagedorn oxime (HI-6).

TABLE 22–19. Comparative lethality and molecular we ight of neurotoxic substances used as chemical weapons in a laboratory mice model
Table 22–19 shows the comparative lethal doses in l aboratory mice for various agents that have potential for use as chemical weapons.
The American Psychiatric Publishing Textbook of Neuropsychiatry and Behavioral Neurosciences, Fifth EditionEdited by Yudofsky SC, Hales RE. © 2008 American Psychiatric Publishing, Inc. All rights reserved. www.appi.org
562

Chapter 22 • Highlights for the Clinician
Exposure to poisons and toxinscan be acute or chronic and can occur through the respiratory tract via inhalation, through the skin by dermal contact or bite and envenomation, and through the digestive tract via oral ingestion, including through eating or smoking with contaminated hands or in contaminated work areas.
1. Obtain a historyIn a neuropsychiatric interview of a patient,a thorough history should include questions to
determine whether an exposure to poisons or toxins plays a role in the patient’s illness. Family members who know the patient well may be a source of information regarding behavior or personality changes as well as changes in cognitive status that may interfere with an accurate history. In the event of a suspected poison or toxin, information obtained should include the following:
The American Psychiatric Publishing Textbook of Neuropsychiatry and Behavioral Neurosciences, Fifth EditionEdited by Yudofsky SC, Hales RE. © 2008 American Psychiatric Publishing, Inc. All rights reserved. www.appi.org
563
• Ask about the patient’s occupation and that of other household members; description and duration of employment; and exposure to hazards such as pesticides, solvents, chemicals, fumes, fibers, radiation, metals, and biological agents. Ask about use of protective equipment at work such as a respirator, gloves, or safety glasses. Obtain a list of previous jobs, including full-time, part-time, and summer jobs and military experience.
• Ask if the patient smokes or eats at his or her worksite with contaminated hands or in contaminated work areas.
• Ask if anyone in the family worked with hazardous materials that they may have brought home.
• Ask if the patient has a hobby with exposure to hazardous materials such as paints, ceramics, solvents, resins, glue, adhesives, cements, or metals. Ask if the patient does repairs on his or her own or another automobile. (continued)
• Ask about pesticide use in the patient’s garden and home or on their pet, safe storage of the pesticides, and removal of pesticide residue by thoroughly washing fruits and vegetables.
• Ask whether the patient has ever lived near a facility that contaminated the surrounding area such as a plant, dump, smelter, or mine.
• Ask whether the patient has changed residence because of a health problem.
• Ask whether the source of the patient’s drinking water is a private well, the city water supply, or a grocery store.
• Ask what year the patient’s home was built and if the home had any recent or previous water damage or flooding, underwent any recent remodeling, or received new carpet or furniture. Inquire as to the presence of an air conditioner or purifier, oil or gas central heating, gas or electric stove, wood stove, fireplace, or humidifier.
The American Psychiatric Publishing Textbook of Neuropsychiatry and Behavioral Neurosciences, Fifth EditionEdited by Yudofsky SC, Hales RE. © 2008 American Psychiatric Publishing, Inc. All rights reserved. www.appi.org
564
wood stove, fireplace, or humidifier.
• Obtain any previous records, including laboratory testing, neuroimaging, neurophysiological and neuropsychological testing, and consultations, for comparison. Most workers in this industry have had preemployment physical examinations, laboratory studies, and an electrocardiogram.
2. Characterize symptoms• Inquire about the timing of the patient’s symptoms having any relation to work hours or to
environmental activities listed above.
• Determine whether any other household members or nearby neighbors had similar symptoms.
• Determine whether anyone else at work had the same or similar problems.
(continued)
• Ask whether the patient uses tobacco or drinks alcohol. Ask whether the patient takes any medications, including prescription, herbal, or homeopathic remedies.
3. Evaluate the patient• Perform a physical examination of all systems following a thorough review of symptoms by each
body system. Annual physical examinations and laboratory studies conducted on chemical workers should include, at a minimum, relevant tests that evaluate for the toxicity specific to the particular chemicals to which that worker is exposed.
• Obtain laboratory or basic clinical studies, including a complete blood count, platelet count and differential, comprehensive metabolic function including electrolytes, liver and kidney function, endocrine function, urinalysis, and an electrocardiogram.
The American Psychiatric Publishing Textbook of Neuropsychiatry and Behavioral Neurosciences, Fifth EditionEdited by Yudofsky SC, Hales RE. © 2008 American Psychiatric Publishing, Inc. All rights reserved. www.appi.org
565
• Analyze blood and urine for heavy metals, and screen the blood, urine, and fat for organics. This analysis may be of limited value; however, in conjunction with other testing, it may help categorize the toxin.
• Complete neuropsychological testing to assess the level of neuropsychological impairment and to monitor any changes (if previous testing is available). Ideally, workers in the chemical industry have had preexposure neuropsychological testing as part of the preemployment physical examination.
• Use electroencephalography, which may be invaluable in certain cases in determining encephalopathic states induced by toxins. The use of quantitative electroencephalography further increases the sensitivity of detection.
(continued)

• Perform nerve conduction studies to identify neuropathies and demyelination caused by peripheral neurotoxins.
• Use computed tomography and magnetic resonance imaging (MRI), volumetric if indicated, to help identify and localize structural abnormalities secondary to toxin exposure.
• Use single photon emission computed tomography and/or functional MRI to study metabolic derangements secondary to neurotoxin exposure.
• Perform positron emission tomography scans to quantitate neurological effects occurring following neurotoxin exposure.
A team approach is encouragedin the identification of the offending agent and management of the patient, in the form of consultations with a regional poison control center, medical toxicologist,
The American Psychiatric Publishing Textbook of Neuropsychiatry and Behavioral Neurosciences, Fifth EditionEdited by Yudofsky SC, Hales RE. © 2008 American Psychiatric Publishing, Inc. All rights reserved. www.appi.org
566
patient, in the form of consultations with a regional poison control center, medical toxicologist, industrial medicine specialist, and other medical specialties.
CHAPTER 23
NEUROPSYCHIATRIC ASPECTS OF ETHANOL AND OTHER CHEMICAL
DEPENDENCIES
Eric J. Nestler, M.D., Ph.D.David W. Self, Ph.D.
The American Psychiatric Publishing Textbook of Neuropsychiatry and Behavioral Neurosciences, Fifth EditionEdited by Yudofsky SC, Hales RE. © 2008 American Psychiatric Publishing, Inc. All rights reserved. www.appi.org
567
Slide Show
Topic headings and reading list
Tables and figures
Highlights for the clinician
Main menu
(About, Contents, Contributors, Publishing facts)

Definition of Terms
The Synapse as the Immediate Target of Drugs of Abuse
Molecular and Cellular Adaptations as the Long-Term Consequences of Drugs of Abuse
Molecular Mechanisms of Opiate Dependence in the Locus CoeruleusMechanisms Intrinsic to the Locus Coeruleus
Role of the Mesolimbic Dopamine System in Drug Reinforcement
Neurobiological Mechanisms of Relapse
Evidence for Structural Changes in the Ventral Tegmental Area–Nucleus Accumbens Pathway
Molecular Mechanisms Underlying Drug-Induced Adaptations in the Nucleus Accumbens
Conclusion
RECOMMENDED READINGSGoldstein A: Addiction: From Biology to Drug Policy, 2nd
Edition. New York, Oxford University Press, 2001Hyman SE, Malenka RC: Addiction and the brain: the
neurobiology of compulsion and its persistence. Nature Rev Neurosci 2:695–703, 2001
Kalivas PW, Volkow N, Seamans J: Unmanageable
CHAPTER 23 • Topics and Readings
The American Psychiatric Publishing Textbook of Neuropsychiatry and Behavioral Neurosciences, Fifth EditionEdited by Yudofsky SC, Hales RE. © 2008 American Psychiatric Publishing, Inc. All rights reserved. www.appi.org
568
Neurobiological Mechanisms of RelapseDrug-Induced Relapse to Drug-Seeking BehaviorCue-Induced Relapse to Drug-Seeking BehaviorStress-Induced Relapse to Drug-Seeking BehaviorMechanisms of Dopamine-Induced Relapse
Adaptations in the Mesolimbic Dopamine System After Long-Term Drug Exposure
Regulation of Dopamine in the Ventral Tegmental Area–Nucleus Accumbens PathwayRegulation of Opioid and Dopamine Receptors in the Ventral Tegmental Area and Nucleus AccumbensRole of Glutamatergic Systems in Long-Term Drug ActionRegulation of G Proteins and the cAMP Pathway in the Ventral Tegmental Area and Nucleus Accumbens
Kalivas PW, Volkow N, Seamans J: Unmanageable motivation in addiction: a pathology in prefrontal-accumbens glutamate transmission. Neuron 45:647–650, 2005
Koob GF, Sanna PP, Bloom FE: Neuroscience of addiction. Neuron 21:467–476, 1998
Nestler EJ: Molecular basis of neural plasticity underlying addiction. Nature Rev Neurosci 2:119–128, 2001
Nestler EJ, Malenka RC: The addicted brain. Sci Am 290:78–85, 2004
Robinson TE, Kolb B: Structural plasticity associated with exposure to drugs of abuse. Neuropharmacology 47 (suppl 1):33–46, 2004

CHAPTER 23 • Tables and Figures
Figure 23–1. A classic working model of synaptic transmission
Table 23–1. Examples of acute pharmacologic actions of drugs of abuse
Figure 23–2. A working model of synaptic transmission
Figure 23–3. Locations of the locus coeruleus, ventral tegmental area, and nucleus accumbens in rat brain
Figure 23–4. Schematic illustration of opiate actions in the locus coeruleus
Figure 23–5. Schematic illustration of possible mechanisms of drug-induced changes in opioid receptor sensitivity
Figure 23–6. Schematic representation of the primary pathways through which stress, drugs of abuse, and drug-associated conditioned stimuli are hypothesized to trigger drug craving and relapse to drug seeking
The American Psychiatric Publishing Textbook of Neuropsychiatry and Behavioral Neurosciences, Fifth EditionEdited by Yudofsky SC, Hales RE. © 2008 American Psychiatric Publishing, Inc. All rights reserved. www.appi.org
569
Figure 23–7. Schematic summary of some common, chronic actions of drugs of abuse on the ventral tegmental area–nucleus accumbens circuit
Figure 23–8. Schematic illustration of the hypothetical role played by gene expression in drug addiction
Figure 23–9. Scheme for the gradual accumulation of ∆FosB (also called chronic Fos-related antigens [FRAs]) versus the rapid and transient induction of acute FRAs in the brain
Summary Highlights for the Clinician
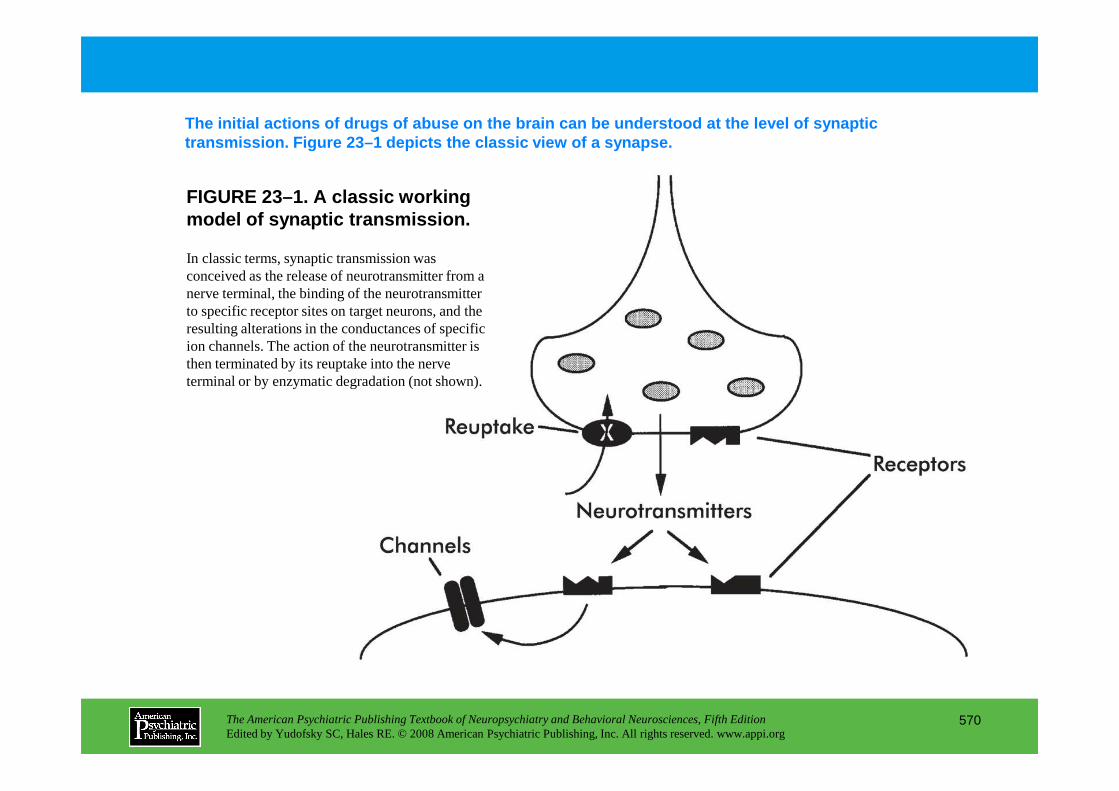
FIGURE 23–1. A classic working model of synaptic transmission.
The initial actions of drugs of abuse on the brain can be understood at the level of synaptic transmission. Figure 23–1 depicts the classic view of a synapse.
In classic terms, synaptic transmission was conceived as the release of neurotransmitter from a nerve terminal, the binding of the neurotransmitter to specific receptor sites on target neurons, and the resulting alterations in the conductances of specific ion channels. The action of the neurotransmitter is then terminated by its reuptake into the nerve terminal or by enzymatic degradation (not shown).
The American Psychiatric Publishing Textbook of Neuropsychiatry and Behavioral Neurosciences, Fifth EditionEdited by Yudofsky SC, Hales RE. © 2008 American Psychiatric Publishing, Inc. All rights reserved. www.appi.org
570
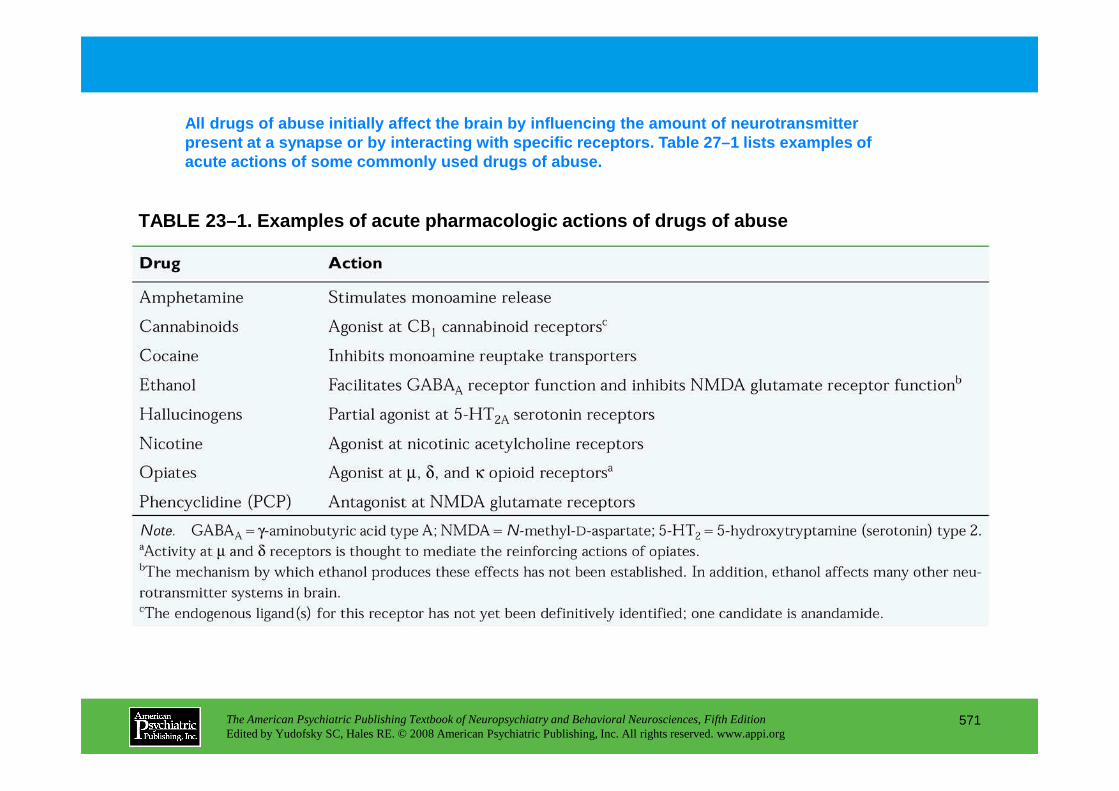
TABLE 23–1. Examples of acute pharmacologic actions of drugs of abuse
All drugs of abuse initially affect the brain by in fluencing the amount of neurotransmitter present at a synapse or by interacting with specifi c receptors. Table 27–1 lists examples of acute actions of some commonly used drugs of abuse.
The American Psychiatric Publishing Textbook of Neuropsychiatry and Behavioral Neurosciences, Fifth EditionEdited by Yudofsky SC, Hales RE. © 2008 American Psychiatric Publishing, Inc. All rights reserved. www.appi.org
571
FIGURE 23–2 (on next slide). A working model of syn aptic transmission.
Understanding the long-term effects of repeated drug expos ure requires moving beyond theclassic view of a synapse. Virtually every neuronal process can be affected by neurotransmitter-receptor activation, as depicted in Figure 23–2.
Studies in basic neuroscience have provided a much more complex view of synaptic transmission than that shown in Figure 23–1. These studies focused on the involvement of intracellular messenger systems involving coupling factors (termed G proteins), second messengers (e.g., cyclic adenosine monophosphate [cAMP], calcium, nitric oxide, and the metabolites of phosphatidylinositol), and protein phosphorylation (involving the phosphorylation of phosphoproteins by protein kinases and their dephosphorylation by protein phosphatases) in mediating multiple actions of neurotransmitters on their target neurons. Second messenger–dependent protein kinases (e.g., those activated by cAMP or calcium) are classified as protein serine/threonine kinases, because they phosphorylate substrate proteins on serine or threonine residues. Each second messenger–dependent protein kinase phosphorylates a specific array of substrate proteins (which can be considered third messengers) and thereby leads to multiple biological responses of the neurotransmitter. Brain also contains many important
The American Psychiatric Publishing Textbook of Neuropsychiatry and Behavioral Neurosciences, Fifth EditionEdited by Yudofsky SC, Hales RE. © 2008 American Psychiatric Publishing, Inc. All rights reserved. www.appi.org
572
messengers) and thereby leads to multiple biological responses of the neurotransmitter. Brain also contains many important intracellular regulatory pathways in addition to those regulated directly by G proteins and second messengers. This includes numerous protein serine/threonine kinases (e.g., the extracellular signal–regulated kinases [ERKs] or mitogen-activated protein [MAP] kinases), as well as numerous protein tyrosine kinases (which phosphorylate substrate proteins on tyrosine residues), some of which reside in the receptors for neurotrophins and most other growth factors (e.g., the trk proteins), and others that are not associated with growth factor receptors (e.g., src kinase). Each of these various protein kinases are highlyregulated by extracellular stimuli. The second messenger–dependent protein kinases are regulated by receptor–G protein–second messenger pathways as mentioned above. The receptor-associated protein tyrosine kinases are activated on growth factor binding to the receptor. The second messenger–independent protein serine/threonine kinases and the protein tyrosine kinases that are not receptor associated seem to be regulated indirectly via the second messenger–dependent and growth factor–dependent pathways as depicted in the figure. The brain also contains numerous types of protein serine/threonine and protein tyrosine phosphatases, not shown in the figure, which are also subject to regulation by extracellular and intracellular stimuli. Thus, the binding of neurotransmitter to its receptor extracellularly results in numerous short-term and long-term biological responses through the complex regulation of multiple intracellular regulatory pathways and the phosphorylation or dephosphorylation of numerous substrate proteins.
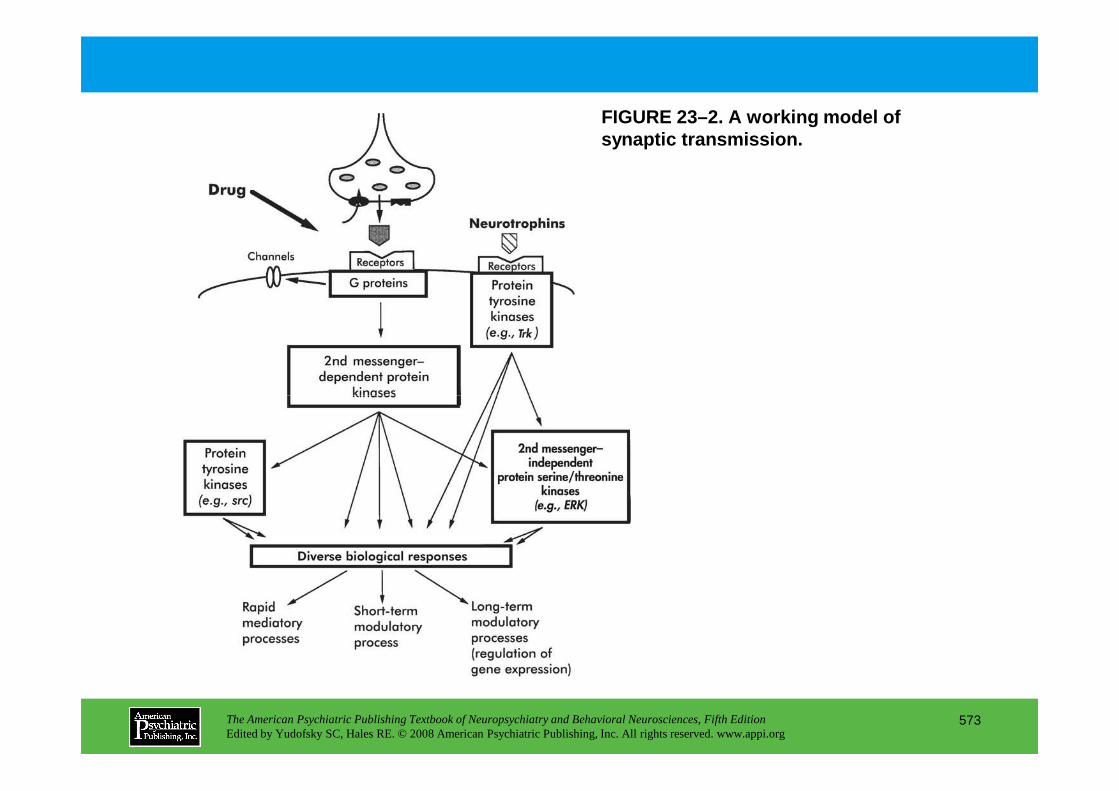
FIGURE 23–2. A working model of synaptic transmission.
The American Psychiatric Publishing Textbook of Neuropsychiatry and Behavioral Neurosciences, Fifth EditionEdited by Yudofsky SC, Hales RE. © 2008 American Psychiatric Publishing, Inc. All rights reserved. www.appi.org
573
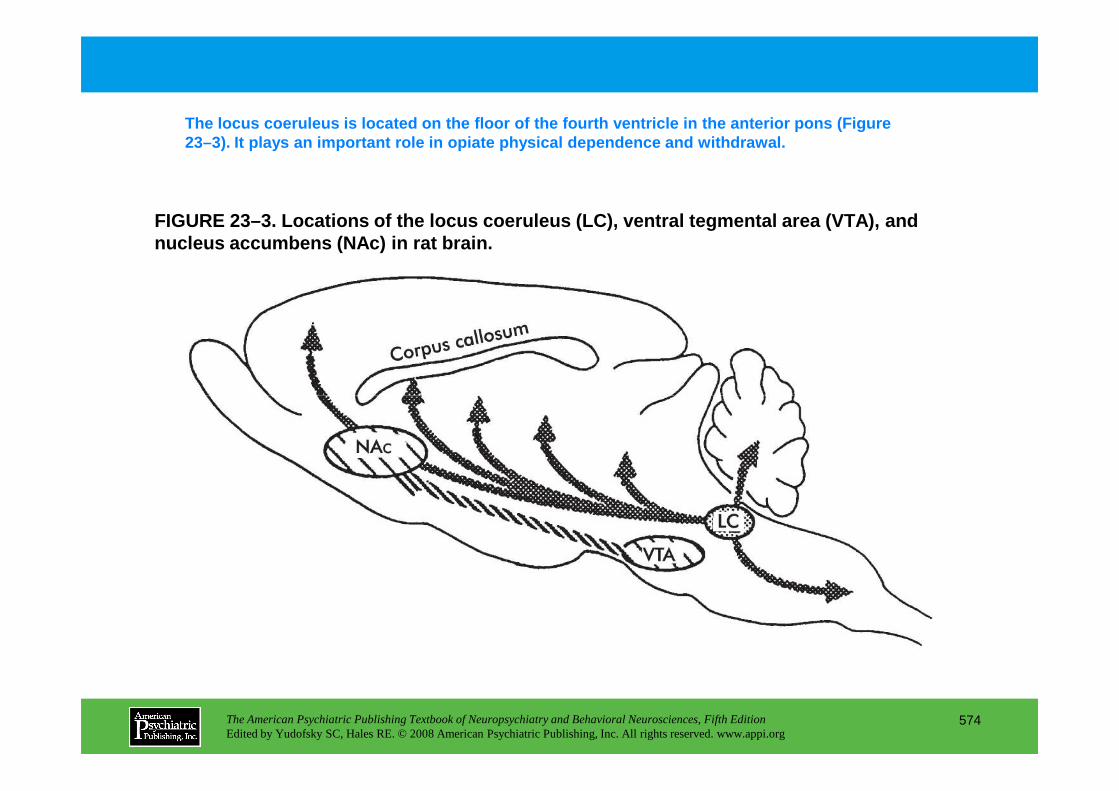
FIGURE 23–3. Locations of the locus coeruleus (LC), ventral tegmental area (VTA), and nucleus accumbens (NAc) in rat brain.
The locus coeruleus is located on the floor of the fourth ventricle in the anterior pons (Figure 23–3). It plays an important role in opiate physica l dependence and withdrawal.
The American Psychiatric Publishing Textbook of Neuropsychiatry and Behavioral Neurosciences, Fifth EditionEdited by Yudofsky SC, Hales RE. © 2008 American Psychiatric Publishing, Inc. All rights reserved. www.appi.org
574
FIGURE 23–4 (on next slide). Schematic illustration of opiate actions in the locus coeruleus (LC).
Acute and long-term opiate actions in the locus coe ruleus are illustrated in Figure 23–4. Overactivation of locus coeruleus neurons, arising from both extrinsic and intrinsic sources, produces many of the behavioral signs of opiate wit hdrawal.
Opiates acutely inhibit LC neurons by increasing the conductance of an inwardly rectifying K+ channel (light crosshatch)via coupling with subtypes of Gi and Go and by decreasing an Na+-dependent inward current (dark crosshatch)via coupling with Gi and Go and the consequent inhibition of adenylyl cyclase. Reduced levels of cyclic adenosine monophosphate (cAMP) decrease protein kinase A (PKA) activity and the phosphorylation of the responsible channel or pump. Inhibition of the cAMP pathway also decreases phosphorylation of numerous other proteins and thereby affects many additional processes in the neuron. For example, it reduces the phosphorylation state of cAMP response element binding protein (CREB), which may initiate some of the longer-term changes in locus coeruleus function. Upward bold arrowssummarize effects of long-term morphine use in the locus coeruleus. Long-term morphine use
The American Psychiatric Publishing Textbook of Neuropsychiatry and Behavioral Neurosciences, Fifth EditionEdited by Yudofsky SC, Hales RE. © 2008 American Psychiatric Publishing, Inc. All rights reserved. www.appi.org
575
coeruleus function. Upward bold arrowssummarize effects of long-term morphine use in the locus coeruleus. Long-term morphine use increases levels of types I and VIII adenylyl cyclase (AC), PKA catalytic (C) and regulatory type II (RII) subunits, and severalphosphoproteins, including CREB. These changes contribute to the altered phenotype of the drug-addicted state. For example, the intrinsic excitability of LC neurons is increased via enhanced activity of the cAMP pathway and Na+-dependent inward current, which contributes to the tolerance, dependence, and withdrawal exhibited by these neurons. Upregulation of type VIII adenylyl cyclase is mediated via CREB, whereas upregulation of type I adenylyl cyclase and of the PKA subunits appears to occur via CREB-independentmechanisms not yet identified.
Source. Reprinted from Nestler EJ, Aghajanian GK: “Molecular and Cellular Basis of Addiction.” Science 278:58–63, 1997. Used with permission.
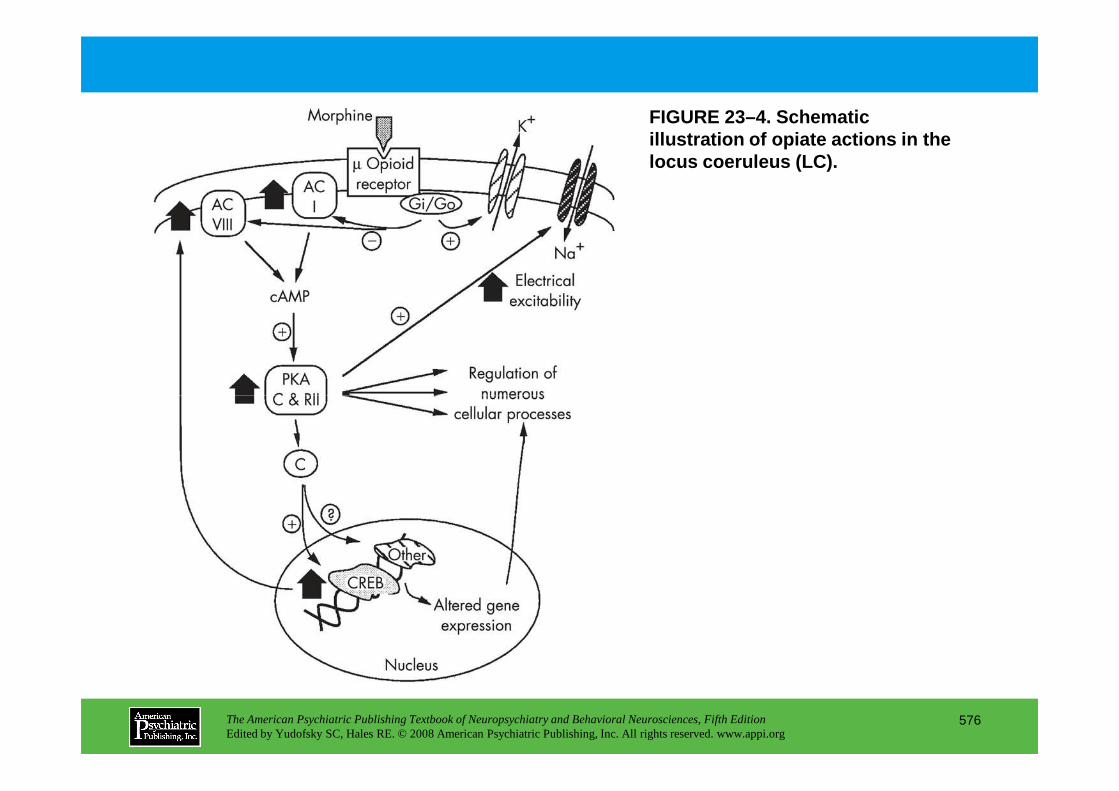
FIGURE 23–4. Schematic illustration of opiate actions in the locus coeruleus (LC).
The American Psychiatric Publishing Textbook of Neuropsychiatry and Behavioral Neurosciences, Fifth EditionEdited by Yudofsky SC, Hales RE. © 2008 American Psychiatric Publishing, Inc. All rights reserved. www.appi.org
576
FIGURE 23–5 (on next slide). Schematic illustration of possible mechanisms of drug-induced changes in opioid receptor sensitivity.
Alterations in the ability of opioid receptors to c ouple to G proteins also could contribute to opiate tolerance (Figure 23–5).
Drug-induced adaptations in the efficacy of receptor-Gi/Go coupling could contribute to aspects of drug tolerance or sensitization. One possible mechanism is adaptations in processes that mediate acute desensitization of receptor function, such as receptor phosphorylation by G protein–coupled receptor kinases (GRKs) (1). Other possible mechanisms include alterations in levels of G protein a (2) or βγ (3) subunits or of other proteins [for example, phosducin (4); regulators of G protein signaling (RGS) proteins (5), activators of G protein signaling (AGS) proteins (not depicted)] that modulate G protein function. Phosphorylation of the receptor by protein kinase A could not mediate acute receptor desensitization (since receptor activation leads to inhibition of the
The American Psychiatric Publishing Textbook of Neuropsychiatry and Behavioral Neurosciences, Fifth EditionEdited by Yudofsky SC, Hales RE. © 2008 American Psychiatric Publishing, Inc. All rights reserved. www.appi.org
577
receptor by protein kinase A could not mediate acute receptor desensitization (since receptor activation leads to inhibition of the kinase); however, upregulation of the kinase (6) after long-term drug administration (see Figure 23–2) could phosphorylate and regulate receptor function during withdrawal states. Also shown in the figure is agonist-induced receptor internalization, which may be mediated via receptor phosphorylation. MAP=mitogen-activated protein.
Source.Reprinted from Nester EJ, Aghajanian GK: “Molecular and Cellular Basis of Addiction.” Science278:58–63, 1997. Used with permission.
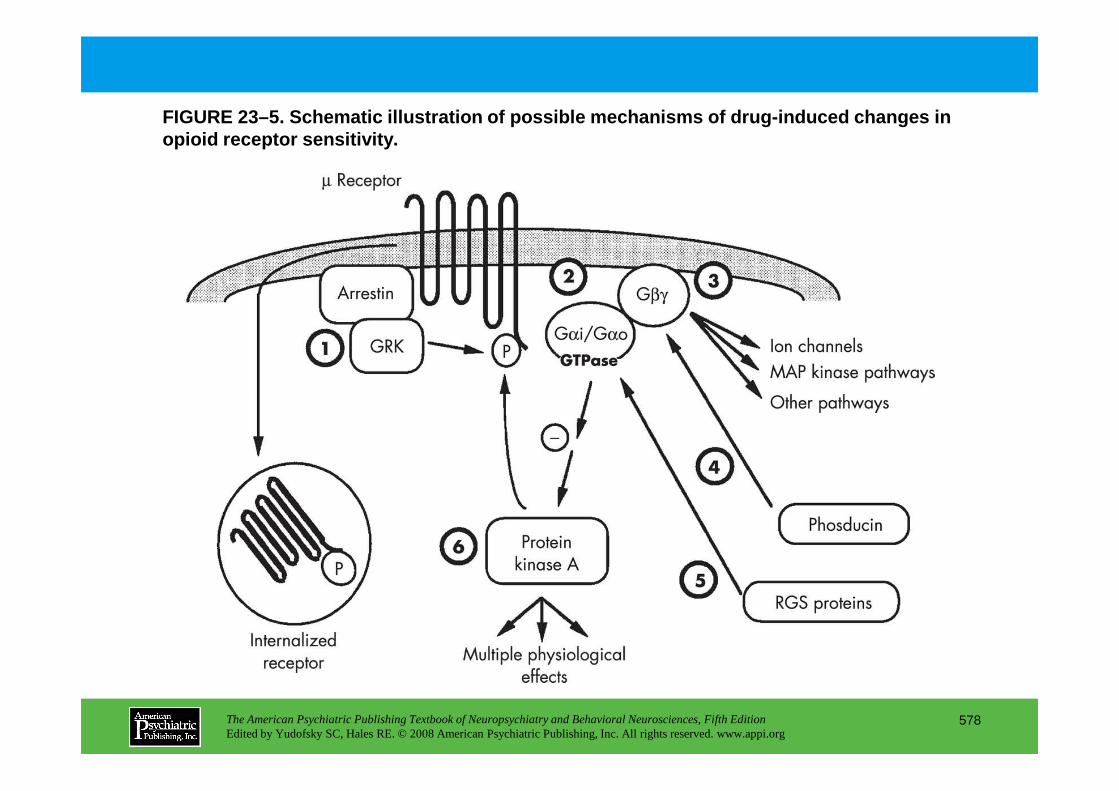
FIGURE 23–5. Schematic illustration of possible mec hanisms of drug-induced changes in opioid receptor sensitivity.
The American Psychiatric Publishing Textbook of Neuropsychiatry and Behavioral Neurosciences, Fifth EditionEdited by Yudofsky SC, Hales RE. © 2008 American Psychiatric Publishing, Inc. All rights reserved. www.appi.org
578
FIGURE 23–6 (on next slide). Schematic representati on of the primary pathways through which stress, drugs of abuse, and drug-associated c onditioned stimuli are hypothesized to trigger drug craving and relapse to drug seeking.
Data from several studies suggest that dopamine rel ease in the nucleus accumbens induces relapse to opiate-seeking and psychostimulant-seeki ng behavior (Figure 23–6).
Stress and conditioned stimuli can activate excitatory glutamatergic projections (Glu) to the ventral tegmental area (VTA) from the amygdala (Amyg) and perhaps other regions, and indirectly (dotted line)from the prefrontal cortex (PfC) and hippocampus (Hipp), whereas priming injections of drugs directly stimulate dopamine (DA) release in the nucleus accumbens (NAc). In this sense, dopamine release in the NAc may be a final common trigger of drug craving by all three stimuli. At the level of NAc neurons, dopamine from the VTA modulates direct excitatory signals from the PfC, Amyg, and Hipp, where complex spatiotemporal integration of relapse-related information occurs. Studies showing involvement of these brain regions in relapse to drug seeking suggest that long-term changesin
The American Psychiatric Publishing Textbook of Neuropsychiatry and Behavioral Neurosciences, Fifth EditionEdited by Yudofsky SC, Hales RE. © 2008 American Psychiatric Publishing, Inc. All rights reserved. www.appi.org
579
information occurs. Studies showing involvement of these brain regions in relapse to drug seeking suggest that long-term changesin gene expression in these regions would alter the functionality of this circuitry and could produce profound changes in reactivity to stimuli that trigger drug craving and relapse to drug seeking.
Source. Adapted from Self DW, Nestler EJ: “Relapse to Drug Seeking: Neural and Molecular Mechanisms.” Drug and Alcohol Dependence51:49–60, copyright 1998, with permission from Elsevier.
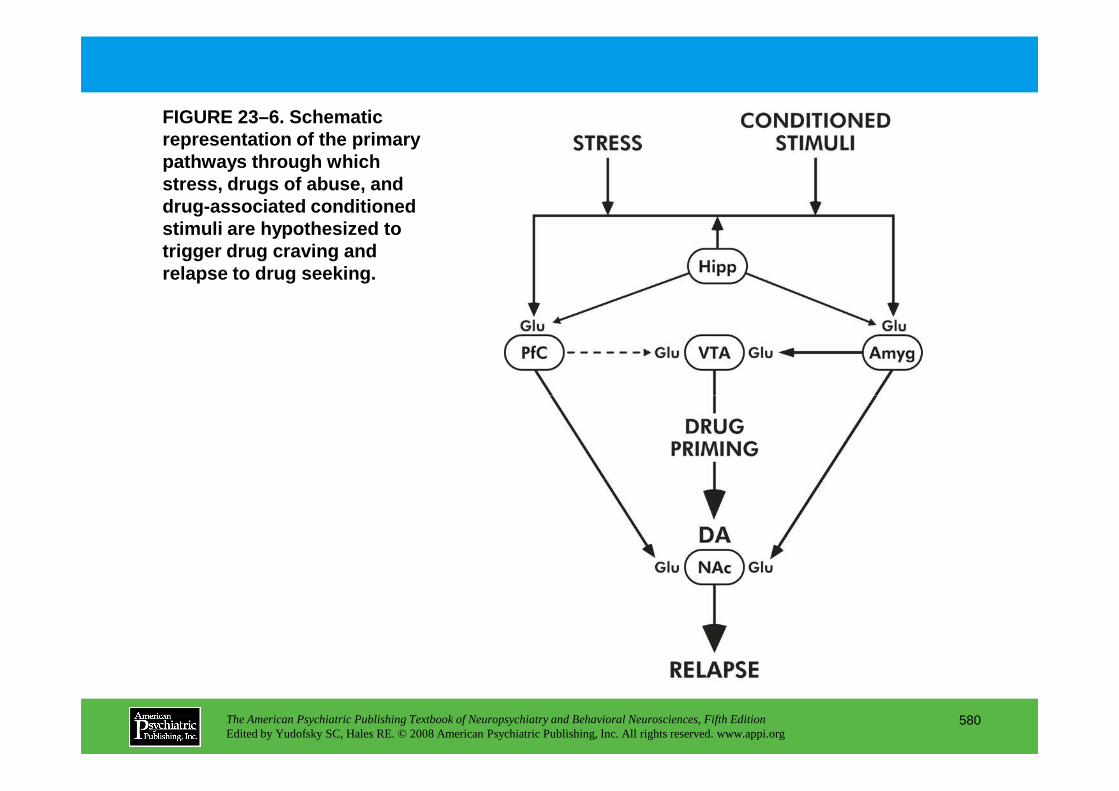
FIGURE 23–6. Schematic representation of the primary pathways through which stress, drugs of abuse, and drug-associated conditioned stimuli are hypothesized to trigger drug craving and relapse to drug seeking.
The American Psychiatric Publishing Textbook of Neuropsychiatry and Behavioral Neurosciences, Fifth EditionEdited by Yudofsky SC, Hales RE. © 2008 American Psychiatric Publishing, Inc. All rights reserved. www.appi.org
580

FIGURE 23–7 (on next slide). Schematic summary of s ome common, chronic actions of drugs of abuse on the ventral tegmental area (VTA)–nucleus accumbens (NAc) circuit.
There is evidence that after long-term administrati on, different drugs of abuse can produce similar molecular adaptations in the ventral tegmen tal area–nucleus accumbens pathway. These adaptations may be part of a common mechanism of dr ug addiction and craving (Figure 23–7).
Panel A (Control) shows a VTA neuron innervating an NAc neuron, and glutamatergic inputs to the VTA and NAc neurons, under normal conditions. Panel B(Addicted) illustrates several adaptations that occur after chronic drug administration. In the VTA, drug exposure induces tyrosine hydroxylase (TH) and increases α-amino-3-hydroxy-5-methyl-4-isoxalone propionic acid (AMPA) glutamatergic responses (Glut), possibly via induction of GluR1 (an AMPA glutamate receptor subunit) and altered trafficking of AMPA receptors. There is also evidence that VTA dopamine neurons decrease in size, an effect demonstrated thusfar with chronic opiates only, but presumed for other drugs of abuse due to common associated biochemical adaptations (e.g.,
The American Psychiatric Publishing Textbook of Neuropsychiatry and Behavioral Neurosciences, Fifth EditionEdited by Yudofsky SC, Hales RE. © 2008 American Psychiatric Publishing, Inc. All rights reserved. www.appi.org
581
far with chronic opiates only, but presumed for other drugs of abuse due to common associated biochemical adaptations (e.g., reduced levels of neurofilament proteins). Induction of cyclic adenosine monophosphate (cAMP) response element binding protein (CREB) activity and alterations in neurotrophic factor (NTF) signaling may partly mediate these various effects. In the NAc, all drugs of abuse induce the transcription factor DFosB, which may then mediate some of the shared aspects of addictionvia regulation of numerous target genes. Several, but not all, drugs of abuse also induce CREB activity in this region, which may be mediated via upregulation of the cAMP pathway. Several additional changes have been found for stimulant exposure; it is not yet known whether they generalize to other drugs. Stimulants decrease AMPA glutamatergic responses in NAc neurons, possibly mediated via induction of GluR2 or repression of several postsynaptic density proteins (e.g., PSD95, Homer-1). These changes in postsynaptic glutamate responses are associated with complex changes in glutamatergic innervation of the NAc, including reduced glutamatergic transmission at baseline and in response to normal rewards, but enhanced transmission in response to cocaine and associated cues, effects mediated in part via upregulation of AGS3 (activator of G protein signaling) in cortical neurons and downregulation of the cystine-glutamate transporter (system Xc
–) in glia. Stimulants and nicotine also induce dendritic outgrowth of NAc neurons, although opiates are reported to produce the opposite action. The net effect of this complex dysregulation inglutamate function and synaptic structure is not yet known.
Source.Reprinted from Nestler EJ: “Is There a Common Molecular Pathway for Addiction?” Nature Neuroscience8:1445–1449, 2005. Used with permission.

FIGURE 23–7. Schematic summary of some common, chro nic actions of drugs of abuse on the ventral tegmental area (VTA)–nucleus accumbe ns (NAc) circuit.
The American Psychiatric Publishing Textbook of Neuropsychiatry and Behavioral Neurosciences, Fifth EditionEdited by Yudofsky SC, Hales RE. © 2008 American Psychiatric Publishing, Inc. All rights reserved. www.appi.org
582
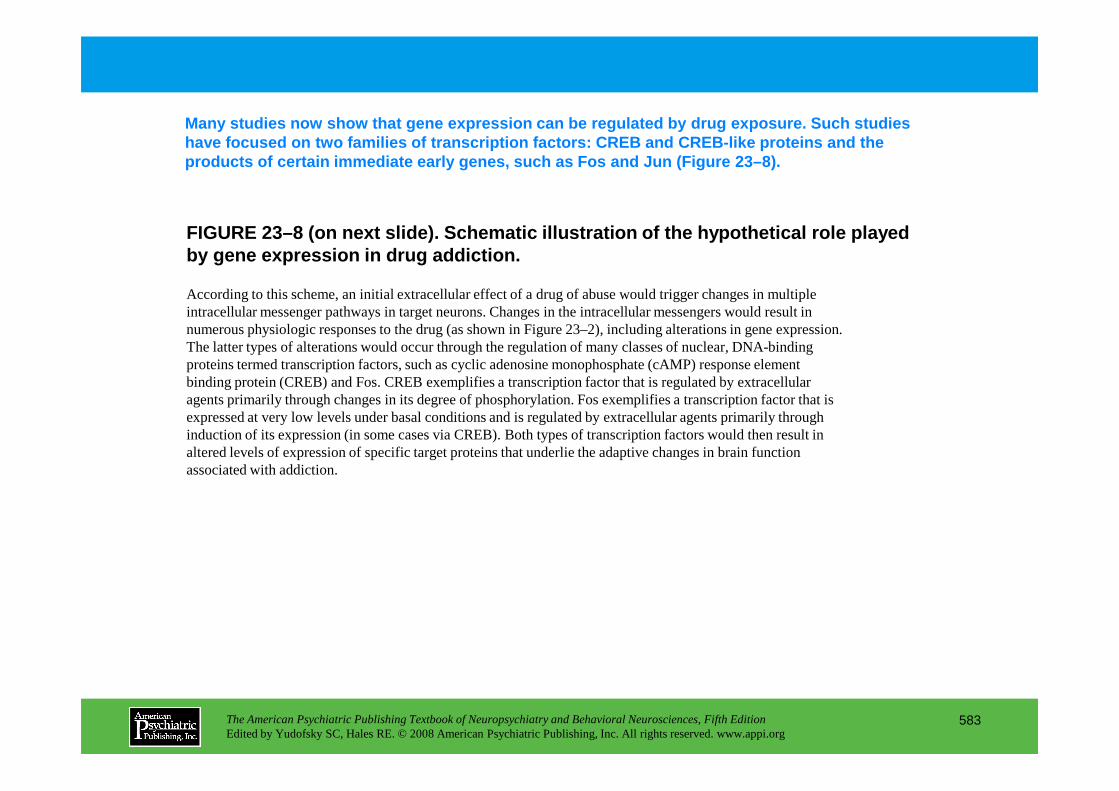
FIGURE 23–8 (on next slide). Schematic illustration of the hypothetical role played by gene expression in drug addiction.
Many studies now show that gene expression can be r egulated by drug exposure. Such studies have focused on two families of transcription facto rs: CREB and CREB-like proteins and the products of certain immediate early genes, such as Fos and Jun (Figure 23–8).
According to this scheme, an initial extracellular effect of a drug of abuse would trigger changes in multiple intracellular messenger pathways in target neurons. Changes in the intracellular messengers would result in numerous physiologic responses to the drug (as shown in Figure 23–2), including alterations in gene expression. The latter types of alterations would occur through the regulation of many classes of nuclear, DNA-binding proteins termed transcription factors, such as cyclic adenosine monophosphate (cAMP) response element binding protein (CREB) and Fos. CREB exemplifies a transcription factor that is regulated by extracellular agents primarily through changes in its degree of phosphorylation. Fos exemplifies a transcription factor that is
The American Psychiatric Publishing Textbook of Neuropsychiatry and Behavioral Neurosciences, Fifth EditionEdited by Yudofsky SC, Hales RE. © 2008 American Psychiatric Publishing, Inc. All rights reserved. www.appi.org
583
agents primarily through changes in its degree of phosphorylation. Fos exemplifies a transcription factor that is expressed at very low levels under basal conditions and is regulated by extracellular agents primarily through induction of its expression (in some cases via CREB). Both types of transcription factors would then result in altered levels of expression of specific target proteins that underlie the adaptive changes in brain function associated with addiction.
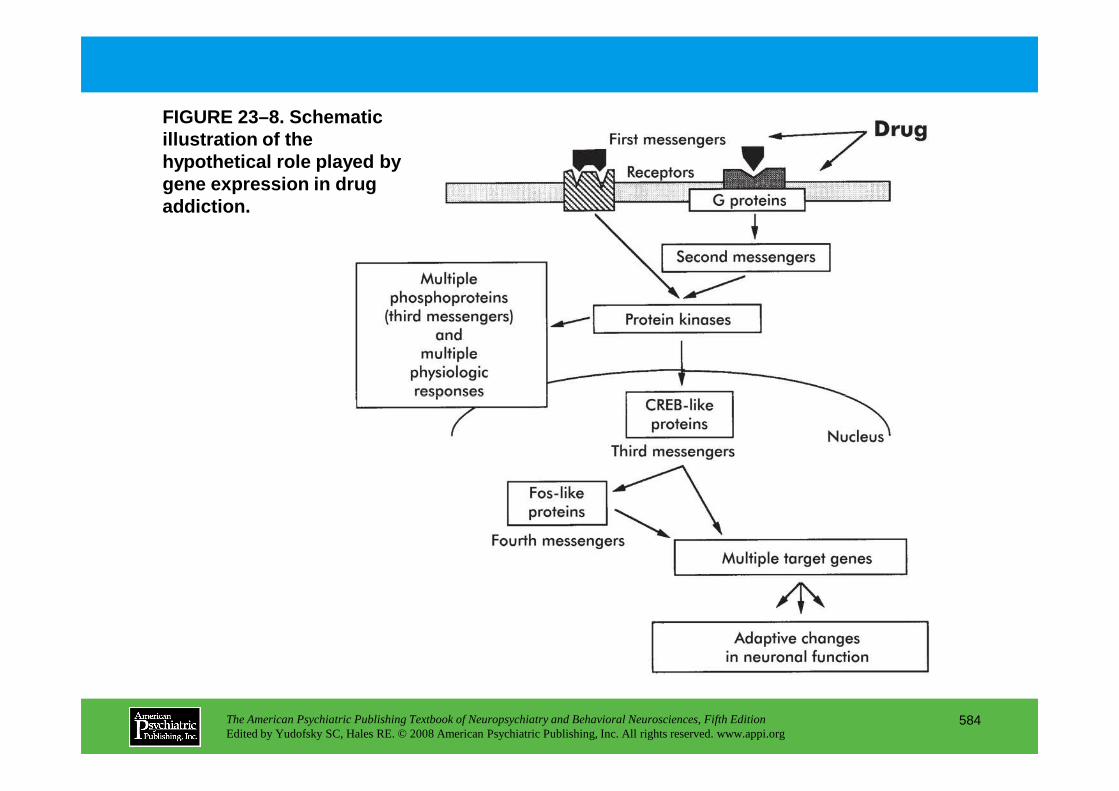
FIGURE 23–8. Schematic illustration of the hypothetical role played by gene expression in drug addiction.
The American Psychiatric Publishing Textbook of Neuropsychiatry and Behavioral Neurosciences, Fifth EditionEdited by Yudofsky SC, Hales RE. © 2008 American Psychiatric Publishing, Inc. All rights reserved. www.appi.org
584

FIGURE 23–9 (on next slide). Scheme for the gradual accumulation of ∆∆∆∆FosB (also called chronic Fos-related antigens [FRAs]) versus the rap id and transient induction of acute FRAs in the brain.
∆∆∆∆FosB persists in the brain for a long time, and thu s it could represent a type of sustained molecular switch that contributes to prolonged aspe cts of cocaine addiction (Figure 23–9).
Panel A. Several waves of FRAs are induced in neurons by many acute stimuli. c-Fos is induced rapidly and degrades within several hours of the acute stimulus, whereas other “acute FRAs” (e.g., FosB, FRA-1, and FRA-2) are induced somewhat later and persist somewhat longer than c-Fos. The chronic FRAs are phosphorylated isoforms of ∆FosB; they, too, are induced (although at low levels) after a single acute stimulus but persist in the brain for long periods (with a half-life longer than 1 week). In a complex with Jun-like proteins, these waves of FRAs form activator protein 1 (AP-1)–binding complexes with shifting composition over time. Panel B.With repeated (e.g., twice daily) stimulation, each acute stimulus induces a low level of ∆FosB. This is indicated by the lower set of overlapping lines, which indicate ∆FosB induced by each acute stimulus. The result is a gradual increase in the
The American Psychiatric Publishing Textbook of Neuropsychiatry and Behavioral Neurosciences, Fifth EditionEdited by Yudofsky SC, Hales RE. © 2008 American Psychiatric Publishing, Inc. All rights reserved. www.appi.org
585
the lower set of overlapping lines, which indicate ∆FosB induced by each acute stimulus. The result is a gradual increase in the total levels of ∆FosB with repeated stimuli during a course of long-term treatment. This is indicated by the increasing stepped line in the graph. The increasing levels of ∆FosB with repeated stimulation would result in the gradual induction of significant levels of a long-lasting AP-1 complex, which could underlie persisting forms of neural plasticity in the brain.
Source.Adapted from Hope BT, Nye HE, Kelz MB, et al: “Induction of a Long-Lasting AP1 Complex Composed of Altered Fos-like Proteins in Brain by Chronic Cocaine and Other Chronic Treatments.” Neuron13:1235–1244, copyright 1994, with permission from Elsevier.
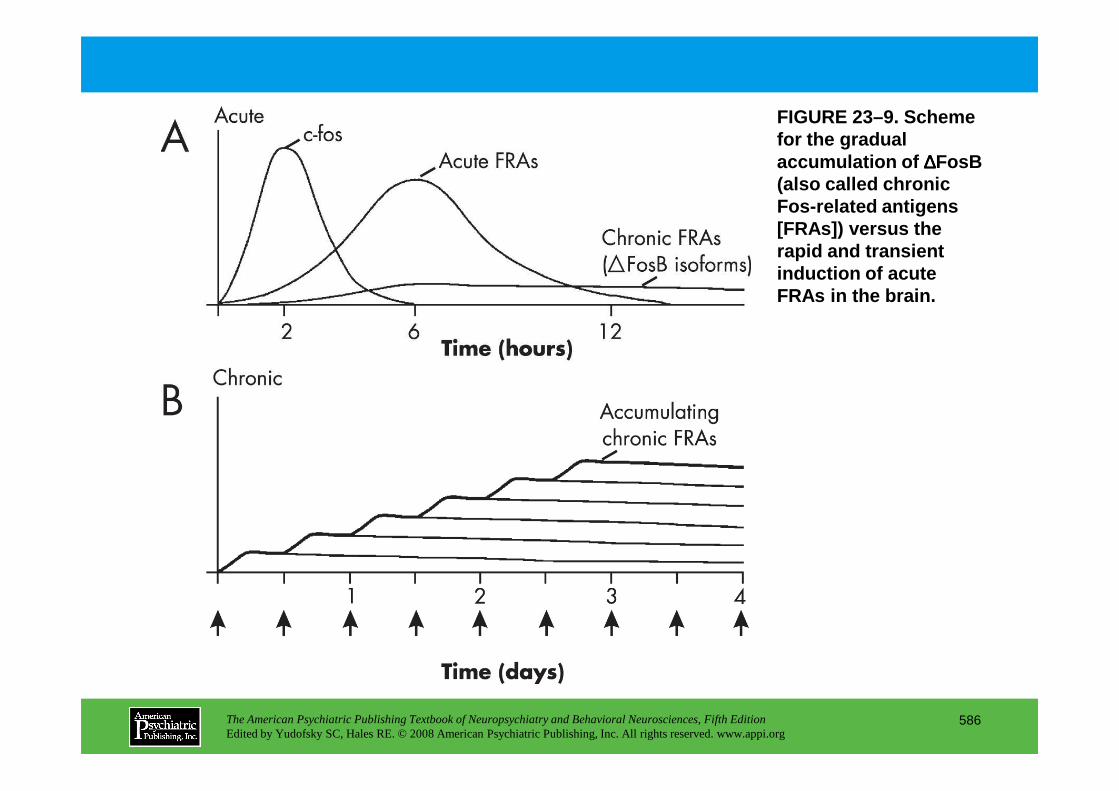
FIGURE 23–9. Scheme for the gradual accumulation of ∆∆∆∆FosB (also called chronic Fos-related antigens [FRAs]) versus the rapid and transient induction of acute FRAs in the brain.
The American Psychiatric Publishing Textbook of Neuropsychiatry and Behavioral Neurosciences, Fifth EditionEdited by Yudofsky SC, Hales RE. © 2008 American Psychiatric Publishing, Inc. All rights reserved. www.appi.org
586
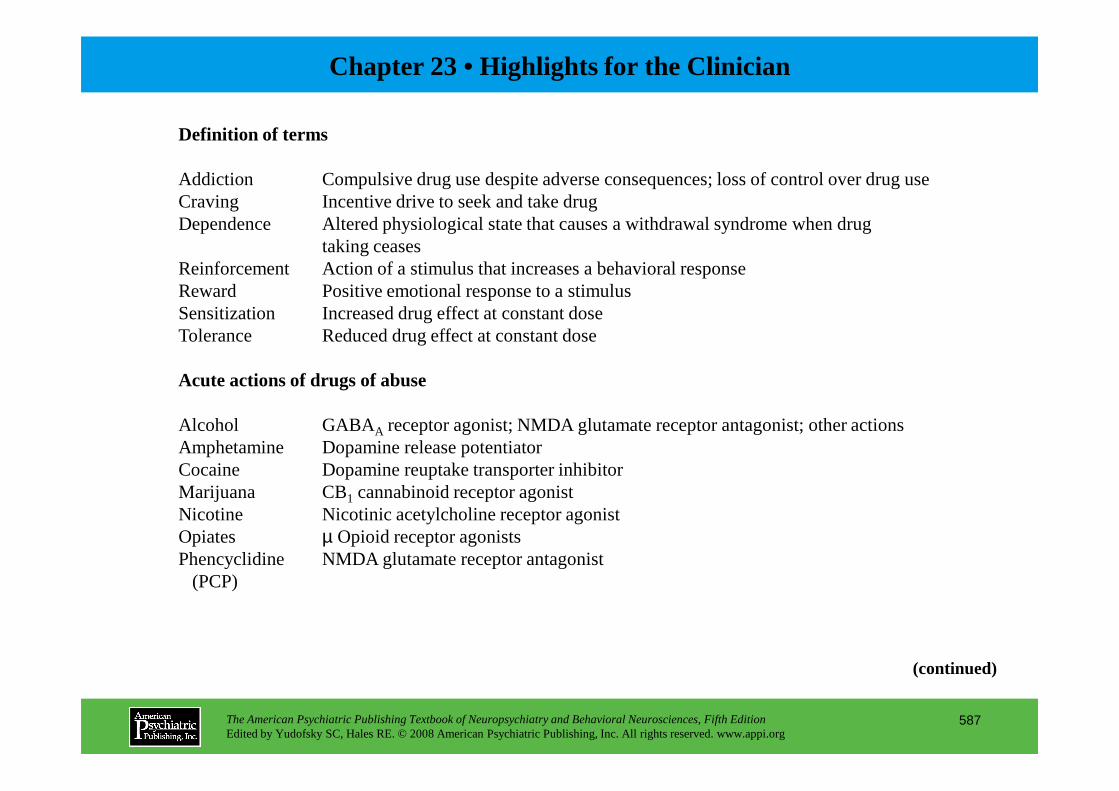
Chapter 23 • Highlights for the Clinician
Definition of terms
Addiction Compulsive drug use despite adverse consequences; loss of control over drug useCraving Incentive drive to seek and take drugDependence Altered physiological state that causes a withdrawal syndrome when drug
taking ceasesReinforcement Action of a stimulus that increases a behavioral responseReward Positive emotional response to a stimulusSensitization Increased drug effect at constant doseTolerance Reduced drug effect at constant dose
Acute actions of drugs of abuse
The American Psychiatric Publishing Textbook of Neuropsychiatry and Behavioral Neurosciences, Fifth EditionEdited by Yudofsky SC, Hales RE. © 2008 American Psychiatric Publishing, Inc. All rights reserved. www.appi.org
587
Alcohol GABAA receptor agonist; NMDA glutamate receptor antagonist; other actionsAmphetamine Dopamine release potentiatorCocaine Dopamine reuptake transporter inhibitorMarijuana CB1 cannabinoid receptor agonistNicotine Nicotinic acetylcholine receptor agonistOpiates µ Opioid receptor agonistsPhencyclidine NMDA glutamate receptor antagonist
(PCP)
(continued)
Role of locus coeruleus
• The major noradrenergic nucleus in the brain—one mediator of opiate physical dependence and withdrawal.
Features of mesolimbic dopamine reward circuit
• Site of cAMP pathway upregulation induced by chronic opiate administration (includes induction of adenylyl cyclase, protein kinase A, and transcription factor CREB). This upregulation represents the mechanism of opiate tolerance and physical dependence-withdrawal.
• Consists of dopamine neurons in VTA and their targets in NAc and several other limbic structures such as amygdala and frontal cortex.
• Mediates positive reinforcing and rewarding effects of all drugs of abuse as well as natural rewards (e.g., food, sex, social interaction).
• Drug-induced adaptations in mesolimbic dopamine system (includes common adaptations to many
The American Psychiatric Publishing Textbook of Neuropsychiatry and Behavioral Neurosciences, Fifth EditionEdited by Yudofsky SC, Hales RE. © 2008 American Psychiatric Publishing, Inc. All rights reserved. www.appi.org
588
• Drug-induced adaptations in mesolimbic dopamine system (includes common adaptations to many different drugs) mediate changes in reward mechanisms that in part underlie addiction—including tolerance, dependence-withdrawal, sensitization, and relapse.
Examples of drug-induced adaptations:• Regulation of dopamine and opioid systems (mechanisms of tolerance and sensitization)• Regulation of glutamate systems (influences drug-related memories)• Upregulation of the cAMP pathway and transcription factor CREB (mechanisms of drug
tolerance, dependence, and withdrawal)• Structural changes in VTA neurons (influence drug tolerance)• Structural changes in NAc neurons (influence drug sensitization)• Role of transcription factor ∆FosB (influences drug sensitization)
Note. cAMP=cyclic adenosine monophosphate; CREB=cAMP response element binding protein; GABAA=gaminobutyric acid type A; NAc=nucleus accumbens; NMDA=N-methyl-D-aspartate; VTA=ventral tegmental area.
CHAPTER 24
NEUROPSYCHIATRIC ASPECTS OF DEMENTIAS ASSOCIATED WITH
MOTOR DYSFUNCTION
Alan J. Lerner, M.D.David Riley, M.D.
The American Psychiatric Publishing Textbook of Neuropsychiatry and Behavioral Neurosciences, Fifth EditionEdited by Yudofsky SC, Hales RE. © 2008 American Psychiatric Publishing, Inc. All rights reserved. www.appi.org
589
Slide Show
Topic headings and reading list
Tables and figures
Highlights for the clinician
Main menu
(About, Contents, Contributors, Publishing facts)
Huntington’s DiseaseEpidemiologyEtiologyDiagnosis and Clinical FeaturesNeurobiologyMotor AbnormalitiesCognitive AbnormalitiesPsychiatric AbnormalitiesTreatment
Parkinson’s DiseaseEpidemiologyEtiologyNeurobiologyMotor Symptoms
Treatment
Progressive Supranuclear PalsyDiagnosisNeuropsychiatric ManifestationsDiagnostic ImagingNeurobiologyTreatment
Cortical–Basal Ganglionic Degeneration
Frontotemporal Dementia
Multiple System Atrophy
Friedreich’s Ataxia
CHAPTER 24 • Topics and Readings
The American Psychiatric Publishing Textbook of Neuropsychiatry and Behavioral Neurosciences, Fifth EditionEdited by Yudofsky SC, Hales RE. © 2008 American Psychiatric Publishing, Inc. All rights reserved. www.appi.org
590
Motor SymptomsCognitive ImpairmentsPsychiatric Abnormalities
Premorbid PersonalityPsychiatric DisturbancesPsychosisDementia
TreatmentBiological TreatmentSurgical Treatment
Dementia With Lewy BodiesClinical DiagnosisNeurobiologyNeuroimaging
Friedreich’s Ataxia
Other Spinocerebellar Ataxias
Motor Neuron Disease With Dementia
Thalamic Degeneration
Wilson’s Disease
Calcification of the Basal Ganglia (Fahr’s Disease)
Pantothenate Kinase–Associated Neurodegeneration
Normal-Pressure Hydrocephalus(continued)
CHAPTER 24 • Topics and Readings (continued)
RECOMMENDED READINGSHuntington ’s DiseaseHague SM, Klaffke S, Bandmann O:
Neurodegenerative disorders: Parkinson’s disease and Huntington’s disease. J Neurol Neurosurg Psychiatry 76:1058–1063, 2005
Landles C, Bates GP: Huntingtin and the molecular pathogenesis of Huntingtons disease. Fourth in molecular medicine review series. EMBO Rep 5:958–963, 2004
Parkinson’s DiseaseJankovic J: An update on the treatment of Parkinson’s
disease. Mt Sinai J Med 73:682–689, 2006Savitt JM, Dawson VL, Dawson TM: Diagnosis and
Mosimann UP, Rowan EN, Partington CE, et al: Characteristics of visual hallucinations in Parkinson disease dementia and dementia with Lewy bodies. Am J Geriatr Psychiatry 14:153–160, 2006
Weisman D, McKeith I: Dementia with Lewy bodies. Semin Neurol 27:42–47, 2007
Progressive Supranuclear PalsyRampello L, Butta V, Raffaele R, et al: Progressive
supranuclear palsy: a systematic review. Neurobiol Dis 20:179–186, 2005
Corticobasal DegenerationSha S, Hou C, Viskontas IV, et al: Are frontotemporal
lobar degeneration, progressive supranuclear palsy
The American Psychiatric Publishing Textbook of Neuropsychiatry and Behavioral Neurosciences, Fifth EditionEdited by Yudofsky SC, Hales RE. © 2008 American Psychiatric Publishing, Inc. All rights reserved. www.appi.org
591
Savitt JM, Dawson VL, Dawson TM: Diagnosis and treatment of Parkinson disease: molecules to medicine. J Clin Invest 116:1744–1754, 2006
Dementia With Lewy BodiesLippa CF, Duda JE, Grossman M, et al: DLB and PDD
boundary issues: diagnosis, treatment, molecular pathology, and biomarkers. Neurology 68:812–819, 2007
McKeith IG, Rowan E, Askew K, et al: Severe functional impairment in dementia with Lewy bodies than Alzheimer disease is related to extrapyramidal motor dysfunction. Am J Geriatr Psychiatry 14:582–588, 2006
lobar degeneration, progressive supranuclear palsy and corticobasal degeneration distinct diseases? Nat Clin Pract Neurol 2:658–665, 2006
Frontotemporal DementiaBoxer AL, Miller BL: Clinical features of
frontotemporal dementia. Alzheimer Dis Assoc Disord 19 (suppl 1):S3–S6, 2005
Multiple System AtrophyBak TH, Rogers TT, Crawford LM, et al: Cognitive
bedside assessment in atypical parkinsonian syndromes. J Neurol Neurosurg Psychiatry 76:420–422, 2005
(continued)
CHAPTER 24 • Topics and Readings (continued)
Singer W, Opfer-Gehrking TL, McPhee BR, et al: Acetylcholinesterase inhibition: a novel approach in the treatment of neurogenic orthostatic hypotension. J Neurol Neurosurg Psychiatry 74:1294–1298, 2003
Freidreich’s Ataxia and Spinocerebellar AtaxiaGeschwind DH: Focusing attention on cognitive
impairment in spinocerebellar ataxia. Arch Neurol 56:20–22, 1999
Motor Neuron Disease With DementiaRingholz GM, Greene SR: The relationship between
amyotrophic lateral sclerosis and frontotemporal dementia. Curr Neurol Neurosci Rep 6:387–392, 2006
Schmidt U, Mursch K, Halatsch ME: Symmetrical intracerebral and intracerebellar calcification (“Fahr's disease”). Funct Neurol 20:15, 2005
Pantothenate Kinase-Associated Neurodegeneration
Gregory A, Hayflick SJ: Neurodegeneration with brain iron accumulation. Folia Neuropathol 43:286–296, 2005
Nemeth AH: The genetics of primary dystonias and related disorders. Brain 125 (pt 4):695–721, 2002
Normal Pressure HydrocephalusMcGirt MJ, Woodworth G, Coon AL, et al:
Diagnosis, treatment, and analysis of long-term outcomes in idiopathic normal-pressure
The American Psychiatric Publishing Textbook of Neuropsychiatry and Behavioral Neurosciences, Fifth EditionEdited by Yudofsky SC, Hales RE. © 2008 American Psychiatric Publishing, Inc. All rights reserved. www.appi.org
592
2006
Thalamic DegenerationMontagna P, Gambetti P, Cortelli P, et al: Familial and
sporadic fatal insomnia. Lancet Neurol 2:167–176, 2003
Wilson’s DiseaseAla A, Walker AP, Ashkan K, et al: Wilson’s disease.
Lancet 369:397–408, 2007
Fahr’s DiseaseGeschwind DH, Loginov M, Stern JM: Identification
of a locus on chromosome 14Q for idiopathic basal ganglia calcification (Fahr disease). Am J Hum Genet 65:764–772, 1999
outcomes in idiopathic normal-pressure hydrocephalus. Neurosurgery 57:699–705, 2005
Relkin N, Marmarou A, Klinge P, et al: Diagnosing idiopathic normal-pressure hydrocephalus. Neurosurgery 57 (3 suppl):S4–S16, 2005

CHAPTER 24 • Tables and Figures
Table 24–1. Degenerative dementias associated with motor system impairment
Table 24–2. Genes associated with degenerative disorders with motor involvement
Figure 24–1. Atrophy of the caudate nucleus in Huntington’s disease (coronal section)
Table 24–3. Clinical features of Huntington’s disease
Table 24–4. Clinical features of Parkinson’s disease
Table 24–5. Clinical core characteristics of diffuse Lewy body disease
Table 24–6. Clinical characteristics of progressive supranuclear palsy
Table 24–7. Clinical characteristics of cortical–basal ganglionic degeneration
The American Psychiatric Publishing Textbook of Neuropsychiatry and Behavioral Neurosciences, Fifth EditionEdited by Yudofsky SC, Hales RE. © 2008 American Psychiatric Publishing, Inc. All rights reserved. www.appi.org
593
Table 24–7. Clinical characteristics of cortical–basal ganglionic degeneration
Summary Highlights for the Clinician
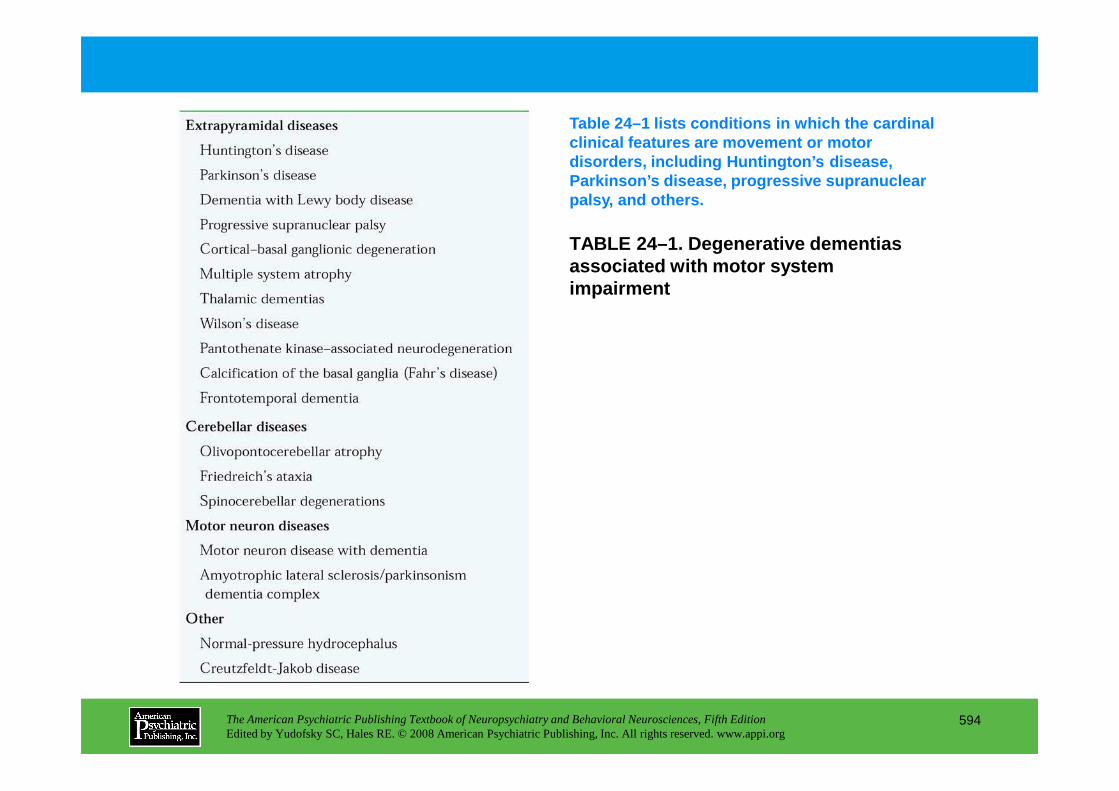
TABLE 24–1. Degenerative dementias associated with motor system impairment
Table 24–1 lists conditions in which the cardinal clinical features are movement or motor disorders, including Huntington’s disease, Parkinson’s disease, progressive supranuclear palsy, and others.
The American Psychiatric Publishing Textbook of Neuropsychiatry and Behavioral Neurosciences, Fifth EditionEdited by Yudofsky SC, Hales RE. © 2008 American Psychiatric Publishing, Inc. All rights reserved. www.appi.org
594
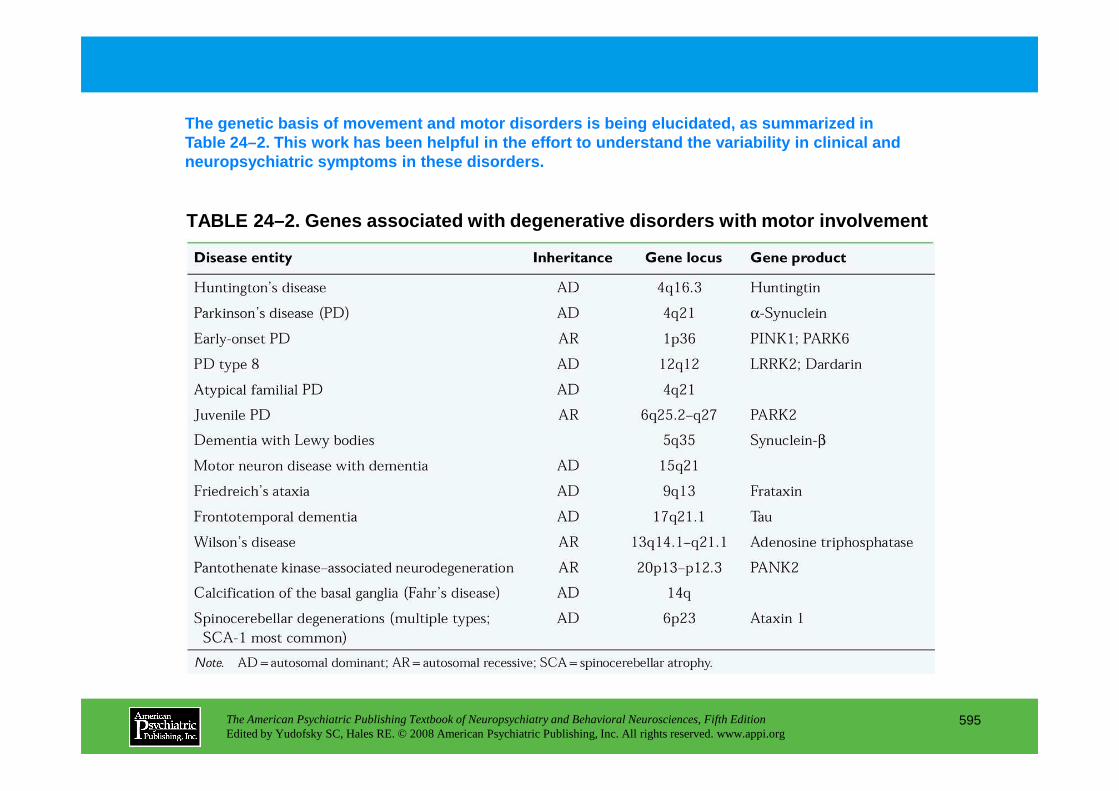
TABLE 24–2. Genes associated with degenerative diso rders with motor involvement
The genetic basis of movement and motor disorders i s being elucidated, as summarized in Table 24–2. This work has been helpful in the effor t to understand the variability in clinical and neuropsychiatric symptoms in these disorders.
The American Psychiatric Publishing Textbook of Neuropsychiatry and Behavioral Neurosciences, Fifth EditionEdited by Yudofsky SC, Hales RE. © 2008 American Psychiatric Publishing, Inc. All rights reserved. www.appi.org
595
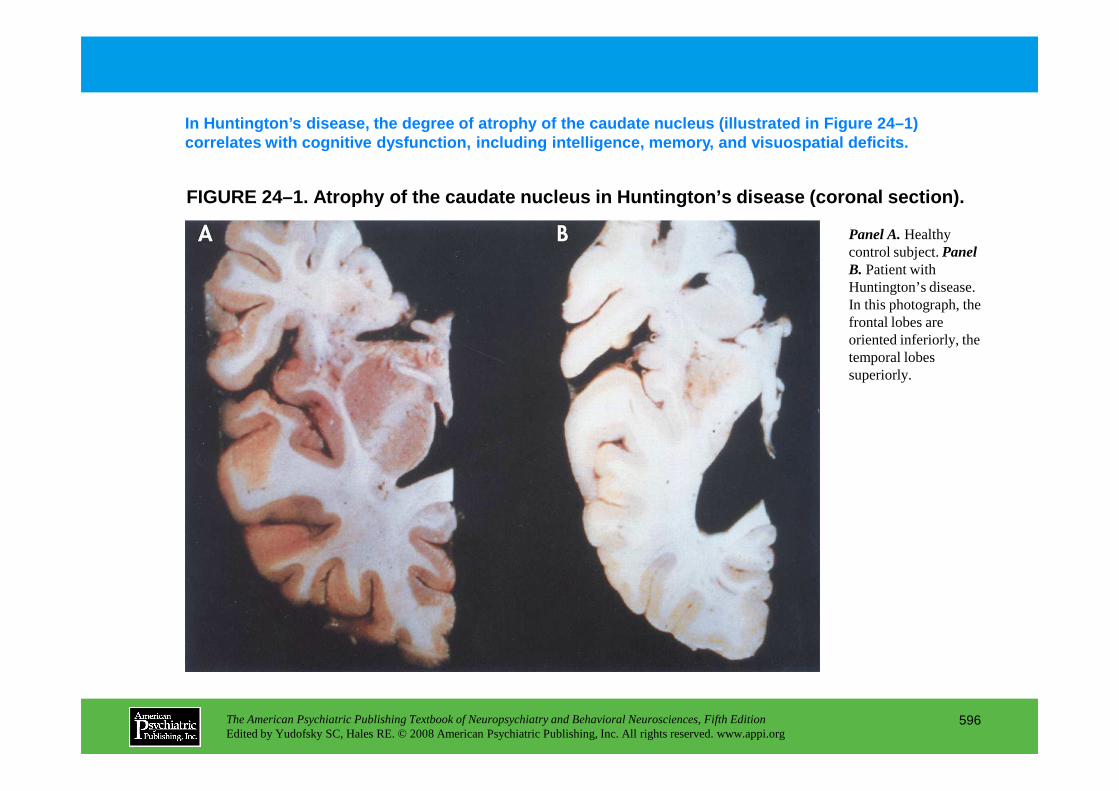
FIGURE 24–1. Atrophy of the caudate nucleus in Hunt ington’s disease (coronal section).
In Huntington’s disease, the degree of atrophy of t he caudate nucleus (illustrated in Figure 24–1) correlates with cognitive dysfunction, including in telligence, memory, and visuospatial deficits.
Panel A.Healthy control subject. Panel B. Patient with Huntington’s disease. In this photograph, the frontal lobes are oriented inferiorly, the temporal lobes superiorly.
The American Psychiatric Publishing Textbook of Neuropsychiatry and Behavioral Neurosciences, Fifth EditionEdited by Yudofsky SC, Hales RE. © 2008 American Psychiatric Publishing, Inc. All rights reserved. www.appi.org
596
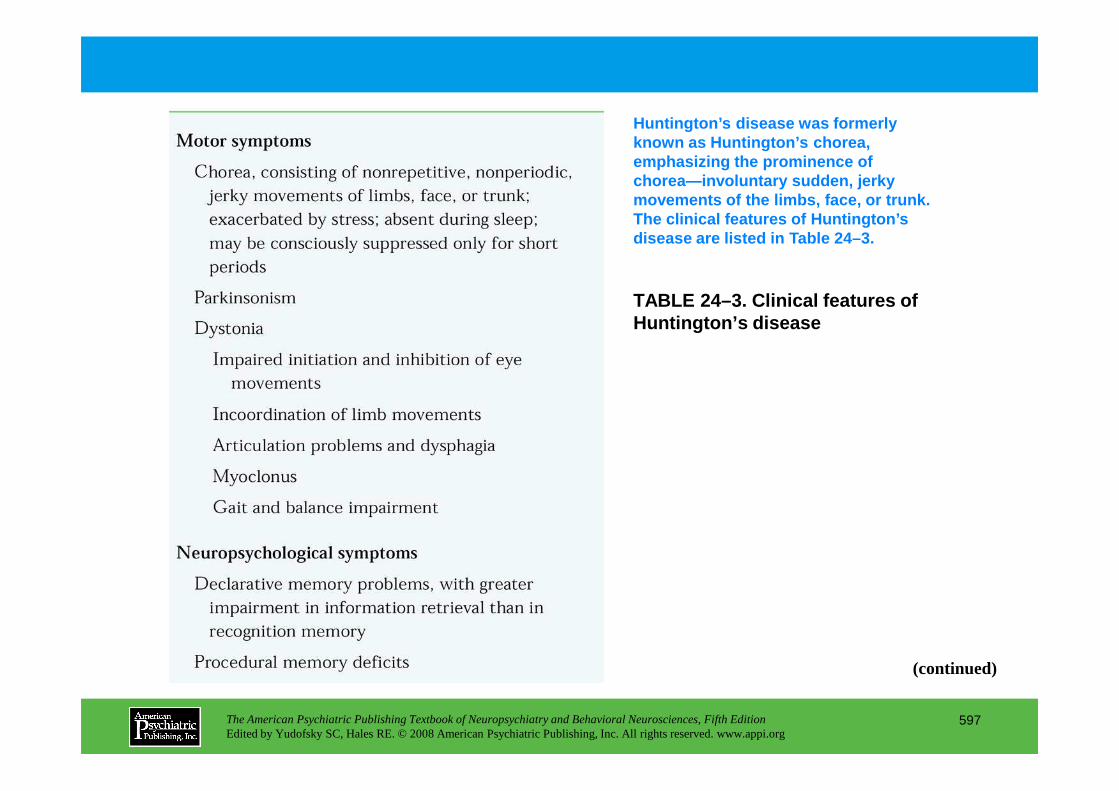
TABLE 24–3. Clinical features of Huntington’s disease
Huntington’s disease was formerly known as Huntington’s chorea,emphasizing the prominence of chorea—involuntary sudden, jerky movements of the limbs, face, or trunk. The clinical features of Huntington’s disease are listed in Table 24–3.
The American Psychiatric Publishing Textbook of Neuropsychiatry and Behavioral Neurosciences, Fifth EditionEdited by Yudofsky SC, Hales RE. © 2008 American Psychiatric Publishing, Inc. All rights reserved. www.appi.org
597
(continued)

TABLE 24–3. (continued)
The American Psychiatric Publishing Textbook of Neuropsychiatry and Behavioral Neurosciences, Fifth EditionEdited by Yudofsky SC, Hales RE. © 2008 American Psychiatric Publishing, Inc. All rights reserved. www.appi.org
598
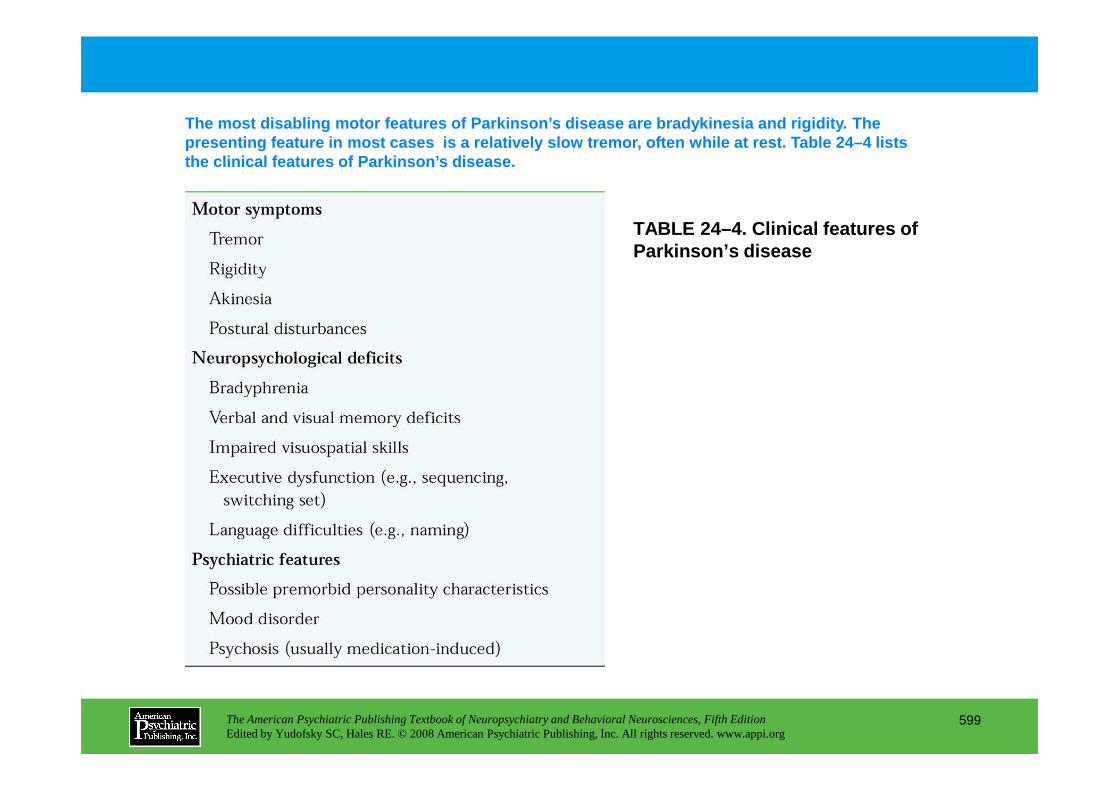
TABLE 24–4. Clinical features of Parkinson’s disease
The most disabling motor features of Parkinson’s di sease are bradykinesia and rigidity. The presenting feature in most cases is a relatively s low tremor, often while at rest. Table 24–4 lists the clinical features of Parkinson’s disease.
The American Psychiatric Publishing Textbook of Neuropsychiatry and Behavioral Neurosciences, Fifth EditionEdited by Yudofsky SC, Hales RE. © 2008 American Psychiatric Publishing, Inc. All rights reserved. www.appi.org
599
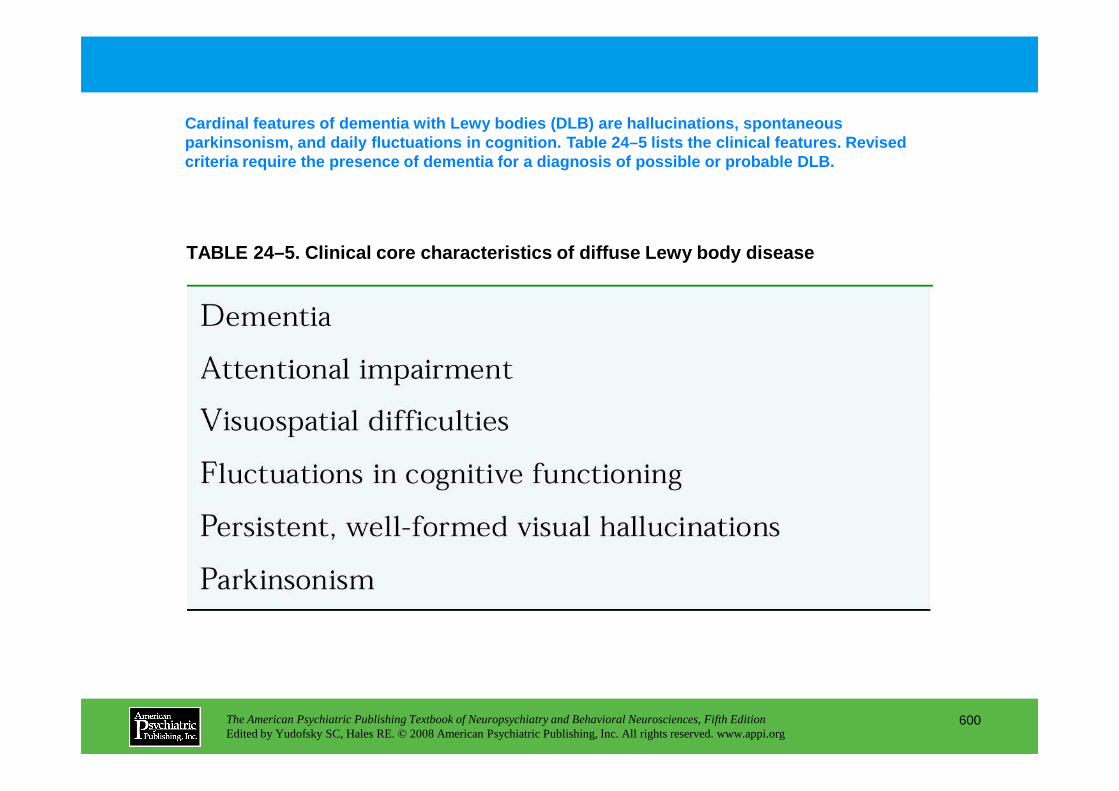
TABLE 24–5. Clinical core characteristics of diffus e Lewy body disease
Cardinal features of dementia with Lewy bodies (DLB ) are hallucinations, spontaneous parkinsonism, and daily fluctuations in cognition. Table 24–5 lists the clinical features. Revised criteria require the presence of dementia for a dia gnosis of possible or probable DLB.
The American Psychiatric Publishing Textbook of Neuropsychiatry and Behavioral Neurosciences, Fifth EditionEdited by Yudofsky SC, Hales RE. © 2008 American Psychiatric Publishing, Inc. All rights reserved. www.appi.org
600
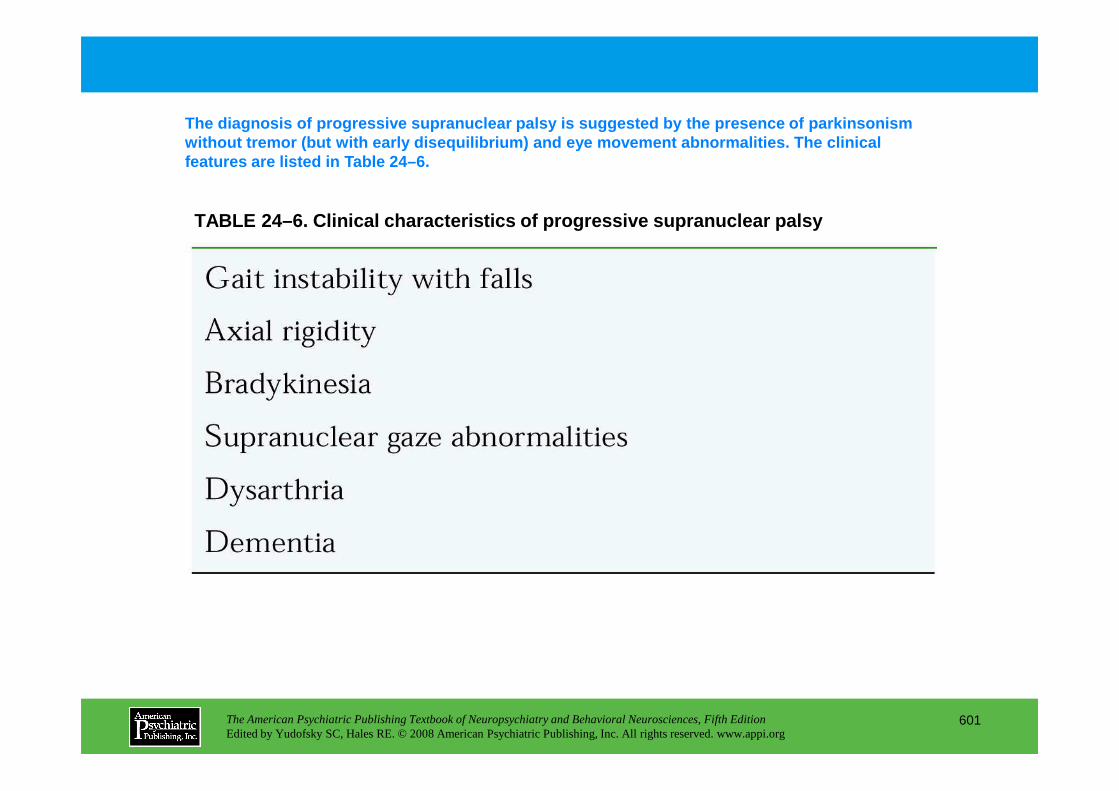
TABLE 24–6. Clinical characteristics of progressive supranuclear palsy
The diagnosis of progressive supranuclear palsy is suggested by the presence of parkinsonism without tremor (but with early disequilibrium) and eye movement abnormalities. The clinical features are listed in Table 24–6.
The American Psychiatric Publishing Textbook of Neuropsychiatry and Behavioral Neurosciences, Fifth EditionEdited by Yudofsky SC, Hales RE. © 2008 American Psychiatric Publishing, Inc. All rights reserved. www.appi.org
601
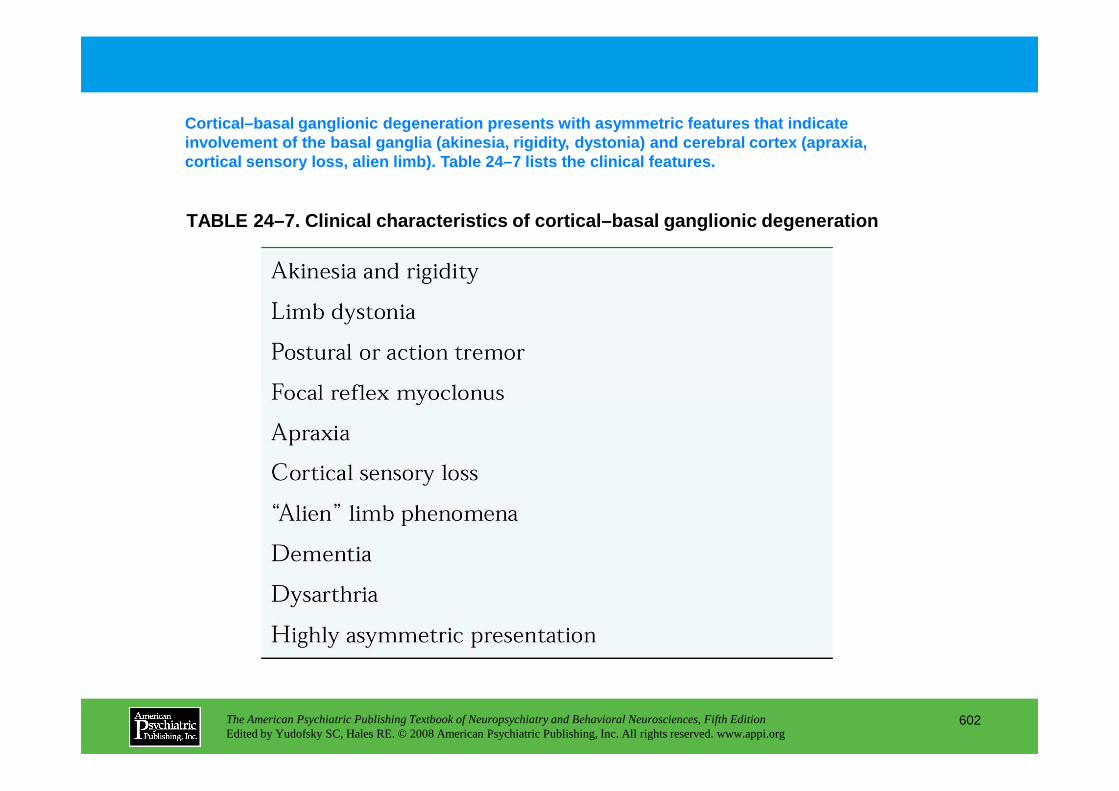
TABLE 24–7. Clinical characteristics of cortical–ba sal ganglionic degeneration
Cortical–basal ganglionic degeneration presents wit h asymmetric features that indicate involvement of the basal ganglia (akinesia, rigidit y, dystonia) and cerebral cortex (apraxia, cortical sensory loss, alien limb). Table 24–7 list s the clinical features.
The American Psychiatric Publishing Textbook of Neuropsychiatry and Behavioral Neurosciences, Fifth EditionEdited by Yudofsky SC, Hales RE. © 2008 American Psychiatric Publishing, Inc. All rights reserved. www.appi.org
602
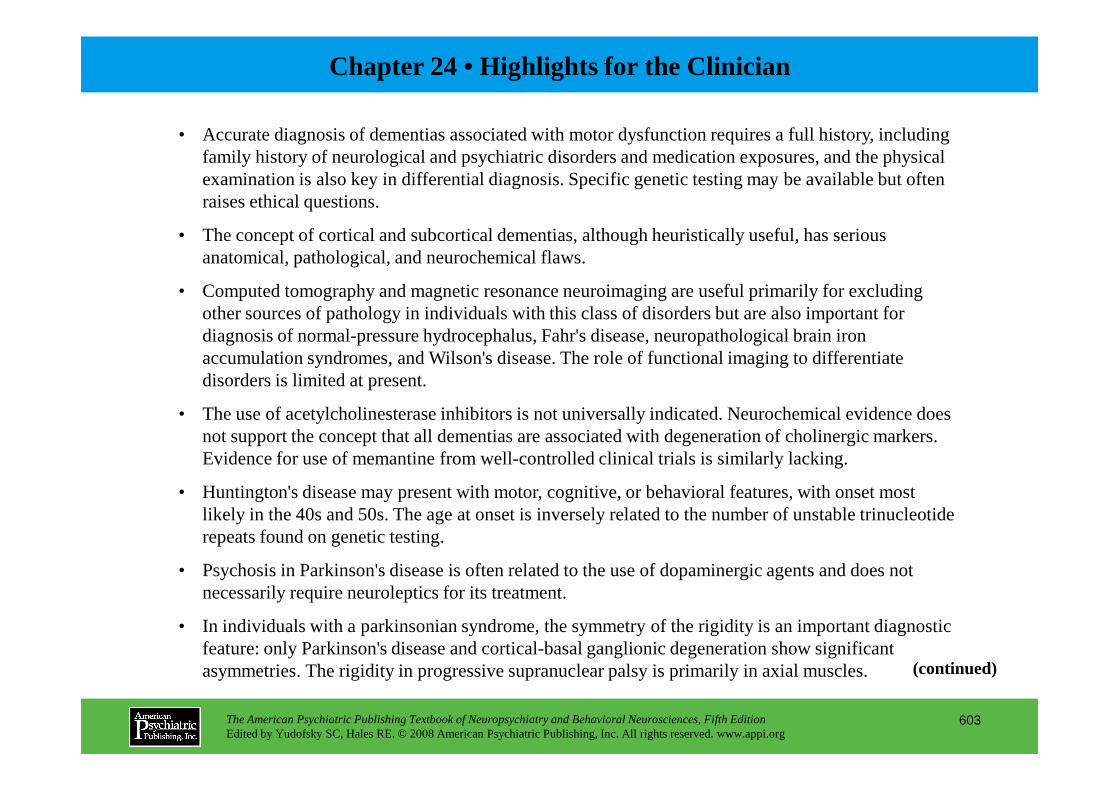
Chapter 24 • Highlights for the Clinician
• Accurate diagnosis of dementias associated with motor dysfunction requires a full history, including family history of neurological and psychiatric disorders and medication exposures, and the physical examination is also key in differential diagnosis. Specific genetic testing may be available but often raises ethical questions.
• The concept of cortical and subcortical dementias, although heuristically useful, has serious anatomical, pathological, and neurochemical flaws.
• Computed tomography and magnetic resonance neuroimaging are useful primarily for excluding other sources of pathology in individuals with this class of disorders but are also important for diagnosis of normal-pressure hydrocephalus, Fahr's disease, neuropathological brain iron accumulation syndromes, and Wilson's disease. The role of functional imaging to differentiate disorders is limited at present.
The American Psychiatric Publishing Textbook of Neuropsychiatry and Behavioral Neurosciences, Fifth EditionEdited by Yudofsky SC, Hales RE. © 2008 American Psychiatric Publishing, Inc. All rights reserved. www.appi.org
603
• The use of acetylcholinesterase inhibitors is not universally indicated. Neurochemical evidence does not support the concept that all dementias are associated with degeneration of cholinergic markers. Evidence for use of memantine from well-controlled clinical trials is similarly lacking.
• Huntington's disease may present with motor, cognitive, or behavioral features, with onset most likely in the 40s and 50s. The age at onset is inversely related to the number of unstable trinucleotide repeats found on genetic testing.
• Psychosis in Parkinson's disease is often related to the use of dopaminergic agents and does not necessarily require neuroleptics for its treatment.
• In individuals with a parkinsonian syndrome, the symmetry of the rigidity is an important diagnostic feature: only Parkinson's disease and cortical-basal ganglionic degeneration show significant asymmetries. The rigidity in progressive supranuclear palsy is primarily in axial muscles. (continued)
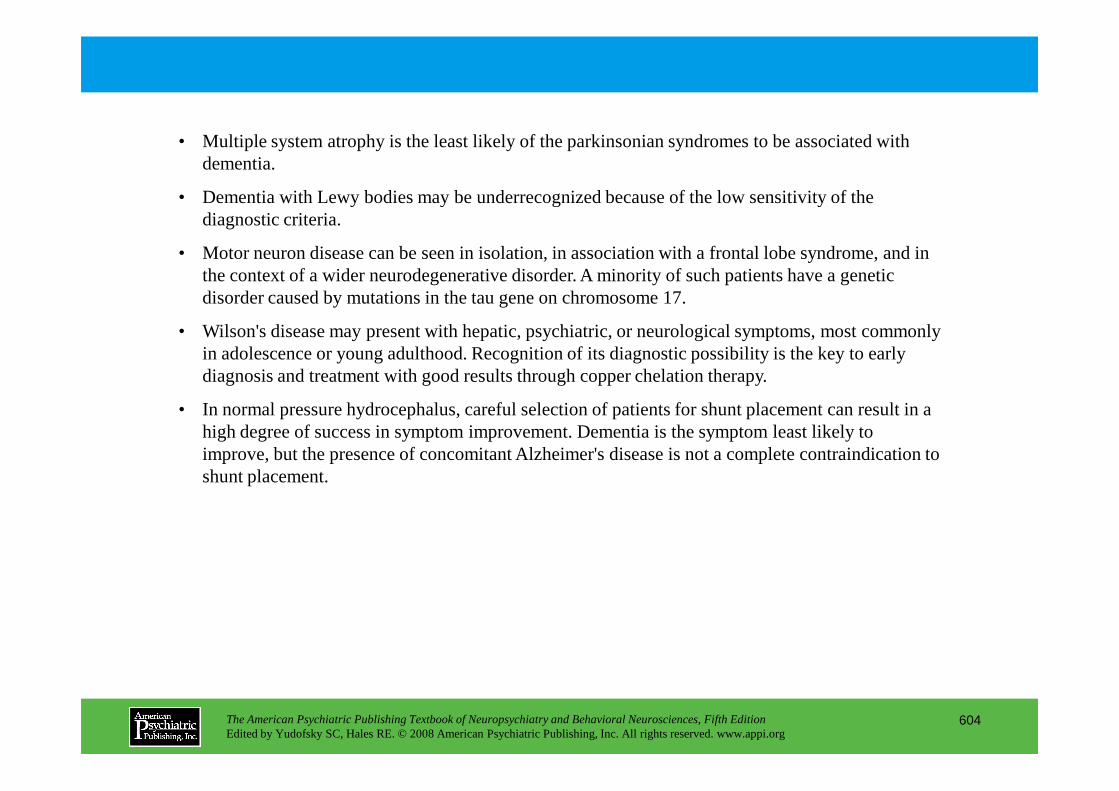
• Multiple system atrophy is the least likely of the parkinsonian syndromes to be associated with dementia.
• Dementia with Lewy bodies may be underrecognized because of the low sensitivity of the diagnostic criteria.
• Motor neuron disease can be seen in isolation, in association with a frontal lobe syndrome, and in the context of a wider neurodegenerative disorder. A minority of such patients have a genetic disorder caused by mutations in the tau gene on chromosome 17.
• Wilson's disease may present with hepatic, psychiatric, or neurological symptoms, most commonly in adolescence or young adulthood. Recognition of its diagnostic possibility is the key to early diagnosis and treatment with good results through copper chelation therapy.
The American Psychiatric Publishing Textbook of Neuropsychiatry and Behavioral Neurosciences, Fifth EditionEdited by Yudofsky SC, Hales RE. © 2008 American Psychiatric Publishing, Inc. All rights reserved. www.appi.org
604
• In normal pressure hydrocephalus, careful selection of patients for shunt placement can result in a high degree of success in symptom improvement. Dementia is the symptom least likely to improve, but the presence of concomitant Alzheimer's disease is not a complete contraindication to shunt placement.
CHAPTER 25
NEUROPSYCHIATRIC ASPECTS OF ALZHEIMER ’S DISEASE AND OTHER
DEMENTING ILLNESSES
Liana G. Apostolova, M.D.Jeffrey L. Cummings, M.D.
The American Psychiatric Publishing Textbook of Neuropsychiatry and Behavioral Neurosciences, Fifth EditionEdited by Yudofsky SC, Hales RE. © 2008 American Psychiatric Publishing, Inc. All rights reserved. www.appi.org
605
Slide Show
Topic headings and reading list
Tables and figures
Highlights for the clinician
Main menu
(About, Contents, Contributors, Publishing facts)

Diagnostic Criteria
Mild Cognitive Impairment
Alzheimer’s DiseaseNeuropsychiatric Features of Alzheimer’s DiseasePathology of Alzheimer’s DiseaseGenetics of Alzheimer’s DiseaseNeuroimaging in Alzheimer’s DiseaseTherapy for Alzheimer’s DiseaseManagement of Neuropsychiatric Disturbances in Alzheimer’s Disease
Dementia With Lewy BodiesNeuropsychiatric Features of Dementia With Lewy BodiesPathology of Dementia With Lewy Bodies
Vascular DementiaNeuropsychiatric Features of Vascular DementiaPathology of Vascular DementiaNeuroimaging in Vascular DementiaTherapy for Vascular Dementia
Creutzfeldt-Jakob DiseaseNeuropsychiatric Features of Creutzfeldt-Jakob DiseasePathology of Creutzfeldt-Jakob DiseaseNeuroimaging in Creutzfeldt-Jakob DiseaseTherapy for Creutzfeldt-Jakob Disease
Conclusion
RECOMMENDED READINGSApostolova LG, Cummings JL: Neuropsychiatric features of
CHAPTER 25 • Topics and Readings
The American Psychiatric Publishing Textbook of Neuropsychiatry and Behavioral Neurosciences, Fifth EditionEdited by Yudofsky SC, Hales RE. © 2008 American Psychiatric Publishing, Inc. All rights reserved. www.appi.org
606
Pathology of Dementia With Lewy BodiesNeuroimaging in Dementia With Lewy BodiesTherapy for Dementia With Lewy Bodies
Frontotemporal DementiaFrontal Variant Frontotemporal DementiaPrimary Progressive AphasiaSemantic DementiaNeuropsychiatric Features of Frontotemporal DementiaPathology of Frontotemporal DementiaGenetics of Frontotemporal DementiaNeuroimaging in Frontotemporal DementiaTherapy for Frontotemporal Dementia
Apostolova LG, Cummings JL: Neuropsychiatric features of dementia with Lewy bodies, in Dementia With Lewy Bodies and Parkinson’s Disease. Edited by O'Brien J, McKeith I, Ames D, et al. Oxford, UK, Taylor and Francis, 2006, pp 73–94
Ballard C, Waite J, Birks J: Atypical antipsychotics for aggression and psychosis in Alzheimer’s disease. Cochrane Database of Systematic Reviews. Wiley, 2006, pp 1–108
Craig D, Mirakhur A, Hart DJ, et al: A cross-sectional study of neuropsychiatric symptoms in 435 patients with Alzheimer’s disease. Am J Geriatr Psychiatry 13:460–468, 2005
(continued)
CHAPTER 25 • Topics and Readings (continued)
Lyketsos CG, Lopez O, Jones B, et al: Prevalence of neuropsychiatric symptoms in dementia and mild cognitive impairment: results from the cardiovascular health study. JAMA 288:1475–1483, 2002
McKeith IG, Dickson DW, Lowe J, et al: Diagnosis and management of dementia with Lewy bodies: third report of the DLB Consortium. Neurology 65:1863–1872, 2005
Sink KM, Holden KF, Yaffe K: Pharmacological treatment of neuropsychiatric symptoms of dementia: a review of the evidence. JAMA 293:596–608, 2005
The American Psychiatric Publishing Textbook of Neuropsychiatry and Behavioral Neurosciences, Fifth EditionEdited by Yudofsky SC, Hales RE. © 2008 American Psychiatric Publishing, Inc. All rights reserved. www.appi.org
607
CHAPTER 25 • Tables and Figures
Table 25–1. Diagnostic criteria for mild cognitive impairment
Figure 25–1. Frequency of neuropsychiatric symptoms in mild cognitive impairment
Figure 25–2. Gray matter atrophy in a patient with mild cognitive impairment
Table 25–2. Diagnostic criteria for Alzheimer’s disease
Figure 25–3. Frequency of neuropsychiatric symptoms in mild, moderate, and severe Alzheimer’s disease
Figure 25–4. Frequency of neuropsychiatric symptoms from normal aging to severe Alzheimer’s disease
The American Psychiatric Publishing Textbook of Neuropsychiatry and Behavioral Neurosciences, Fifth EditionEdited by Yudofsky SC, Hales RE. © 2008 American Psychiatric Publishing, Inc. All rights reserved. www.appi.org
608
Table 25–3. Delusional misidentification syndromes
Figure 25–5. Amyloid plaques and neurofibrillary tangles stained with Bielschowsky’s stain
Figure 25–6. Gray matter atrophy in a patient with mild Alzheimer’s disease
Figure 25–7. Single-photon emission computed tomography in the primary dementias
Table 25–4. Diagnostic criteria for dementia with Lewy bodies
Figure 25–8. Prevalence of some neuropsychiatric features at disease onset in dementia with Lewy bodies and Alzheimer's disease
Figure 25–9. Lewy bodies stained with hematoxylin-eosin (continued)
CHAPTER 25 • Tables and Figures (continued)
Table 25–5. Diagnostic criteria for frontotemporal dementia spectrum
Figure 25–10. Panel A.Frequency of neuropsychiatric symptoms in frontotemporal dementia. Panel B.Comparison of the frequency of neuropsychiatric symptoms in frontal variant FTD, temporal variant FTD, and Alzheimer’s disease.
Figure 25–11. Pick’s bodies stained with Bielschowsky’s stain
Figure 25–12. Gray matter atrophy in frontotemporal dementia
Figure 25–13. Three-dimensional reconstruction of structural magnetic resonance imaging in primary progressive aphasia
The American Psychiatric Publishing Textbook of Neuropsychiatry and Behavioral Neurosciences, Fifth EditionEdited by Yudofsky SC, Hales RE. © 2008 American Psychiatric Publishing, Inc. All rights reserved. www.appi.org
609
Table 25–6. Diagnostic criteria for vascular dementia
Figure 25–14. Frequency of neuropsychiatric symptoms in vascular dementia.
Figure 25–15. T2-weighted magnetic resonance imaging scan of a patient with vascular dementia
Figure 25–16. Panel A.Spongiosis of the basal ganglia in Creutzfeldt-Jakob disease stained with hematoxylin-eosin. Panel B.PrPSc immunostain in CJD.
Summary Highlights for the Clinician

TABLE 25–1. Diagnostic criteria for mild cognitive impairment
Mild cognitive impairment (Table 25–1) is an increa singly recognized intermediate stage between normal aging and dementia. These patients d o not meet criteria for dementia because they are unimpaired in activities of daily living.
The American Psychiatric Publishing Textbook of Neuropsychiatry and Behavioral Neurosciences, Fifth EditionEdited by Yudofsky SC, Hales RE. © 2008 American Psychiatric Publishing, Inc. All rights reserved. www.appi.org
610

FIGURE 25–1. Frequency of neuropsychiatric symptoms in mild cognitive impairment.
About half of patients with mild cognitive impairme nt have one or more neuropsychiatric symptoms. The most common are dysphoria, apathy, ir ritability, and anxiety (Figure 25–1).
AMB=aberrant motor behavior.
Source. Data from Baquero et al. 2004; Geda et al. 2004; Hwang et al. 2004; Lyketsos et al. 2002.
The American Psychiatric Publishing Textbook of Neuropsychiatry and Behavioral Neurosciences, Fifth EditionEdited by Yudofsky SC, Hales RE. © 2008 American Psychiatric Publishing, Inc. All rights reserved. www.appi.org
611
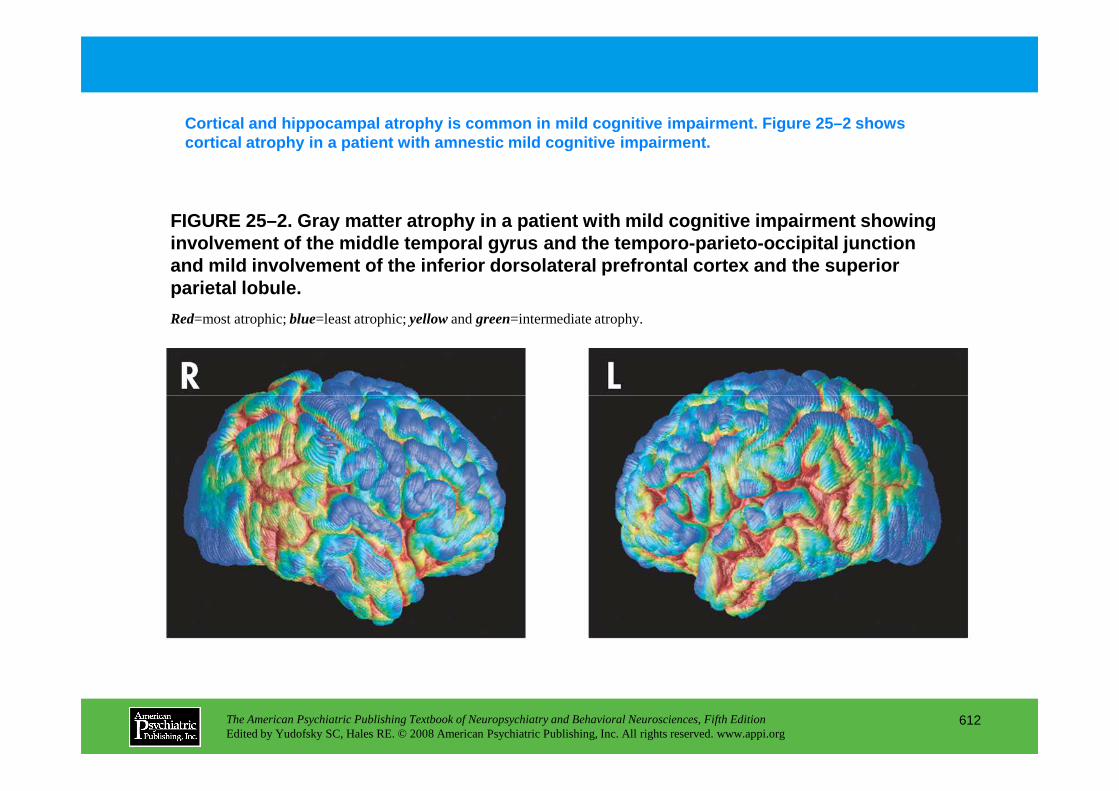
FIGURE 25–2. Gray matter atrophy in a patient with mild cognitive impairment showing involvement of the middle temporal gyrus and the te mporo-parieto-occipital junction and mild involvement of the inferior dorsolateral p refrontal cortex and the superior parietal lobule.
Cortical and hippocampal atrophy is common in mild cognitive impairment. Figure 25–2 shows cortical atrophy in a patient with amnestic mild co gnitive impairment.
Red=most atrophic; blue=least atrophic; yellowand green=intermediate atrophy.
The American Psychiatric Publishing Textbook of Neuropsychiatry and Behavioral Neurosciences, Fifth EditionEdited by Yudofsky SC, Hales RE. © 2008 American Psychiatric Publishing, Inc. All rights reserved. www.appi.org
612
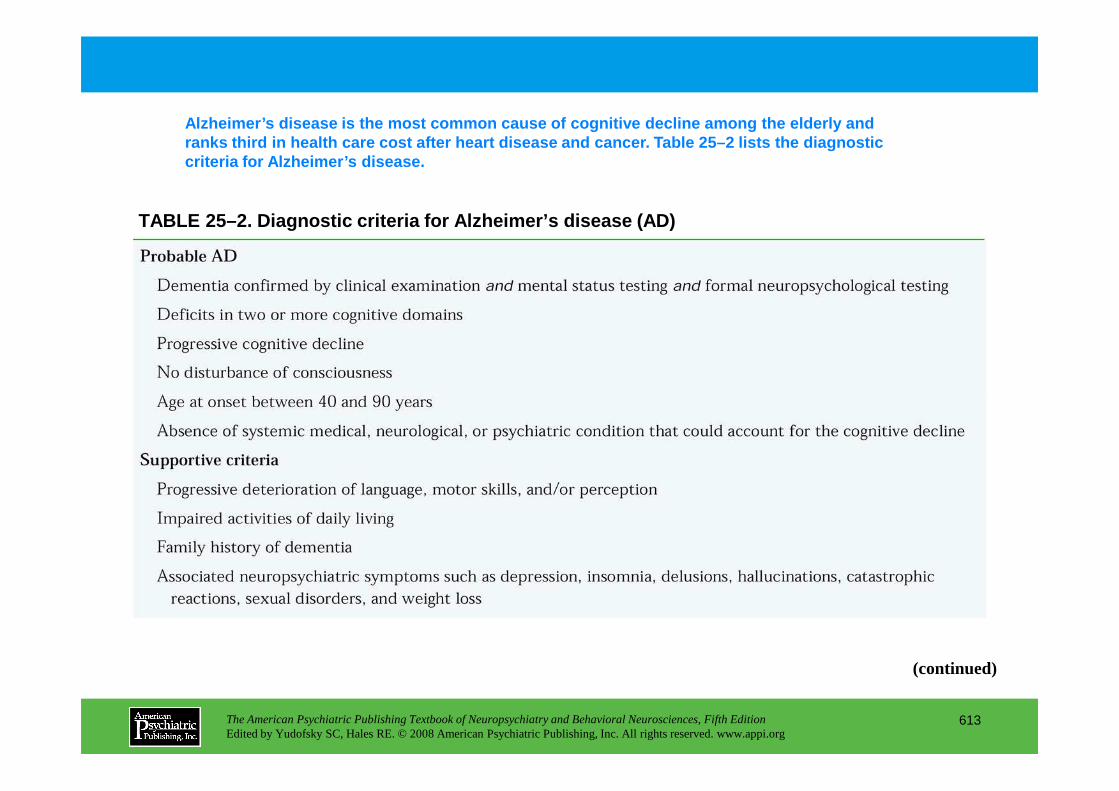
TABLE 25–2. Diagnostic criteria for Alzheimer’s dis ease (AD)
Alzheimer’s disease is the most common cause of cogn itive decline among the elderly and ranks third in health care cost after heart disease and cancer. Table 25–2 lists the diagnostic criteria for Alzheimer’s disease.
The American Psychiatric Publishing Textbook of Neuropsychiatry and Behavioral Neurosciences, Fifth EditionEdited by Yudofsky SC, Hales RE. © 2008 American Psychiatric Publishing, Inc. All rights reserved. www.appi.org
613
(continued)
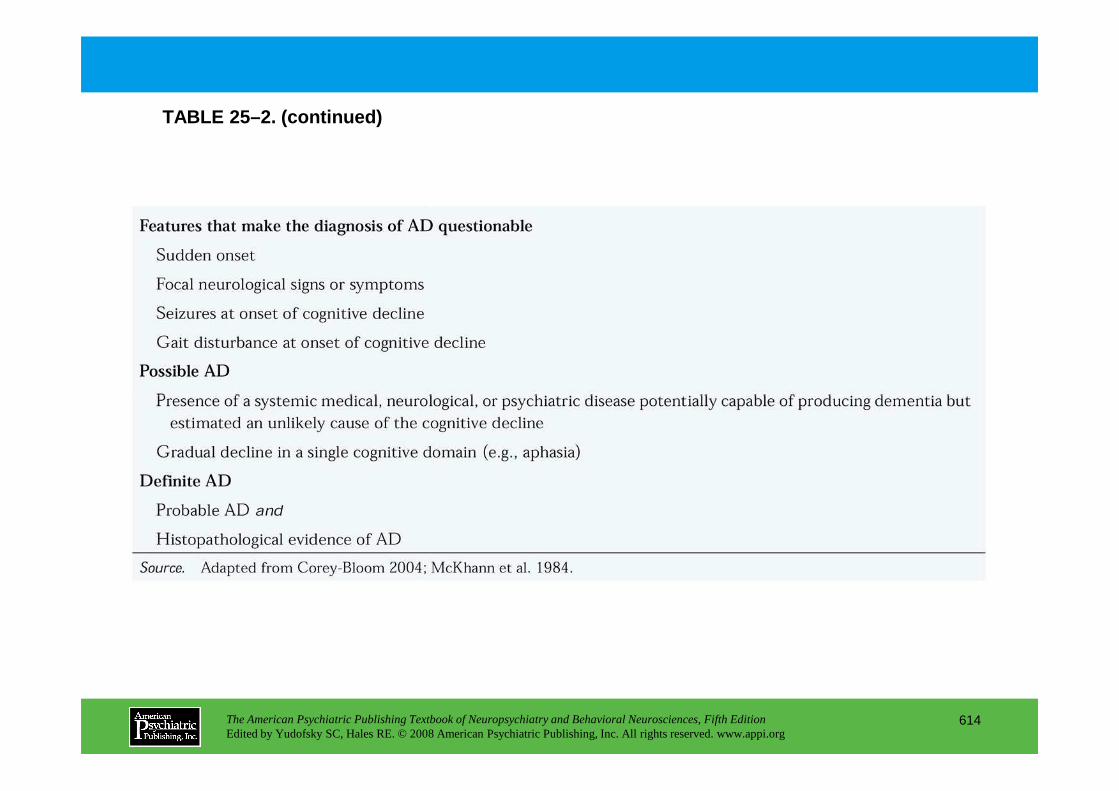
TABLE 25–2. (continued)
The American Psychiatric Publishing Textbook of Neuropsychiatry and Behavioral Neurosciences, Fifth EditionEdited by Yudofsky SC, Hales RE. © 2008 American Psychiatric Publishing, Inc. All rights reserved. www.appi.org
614
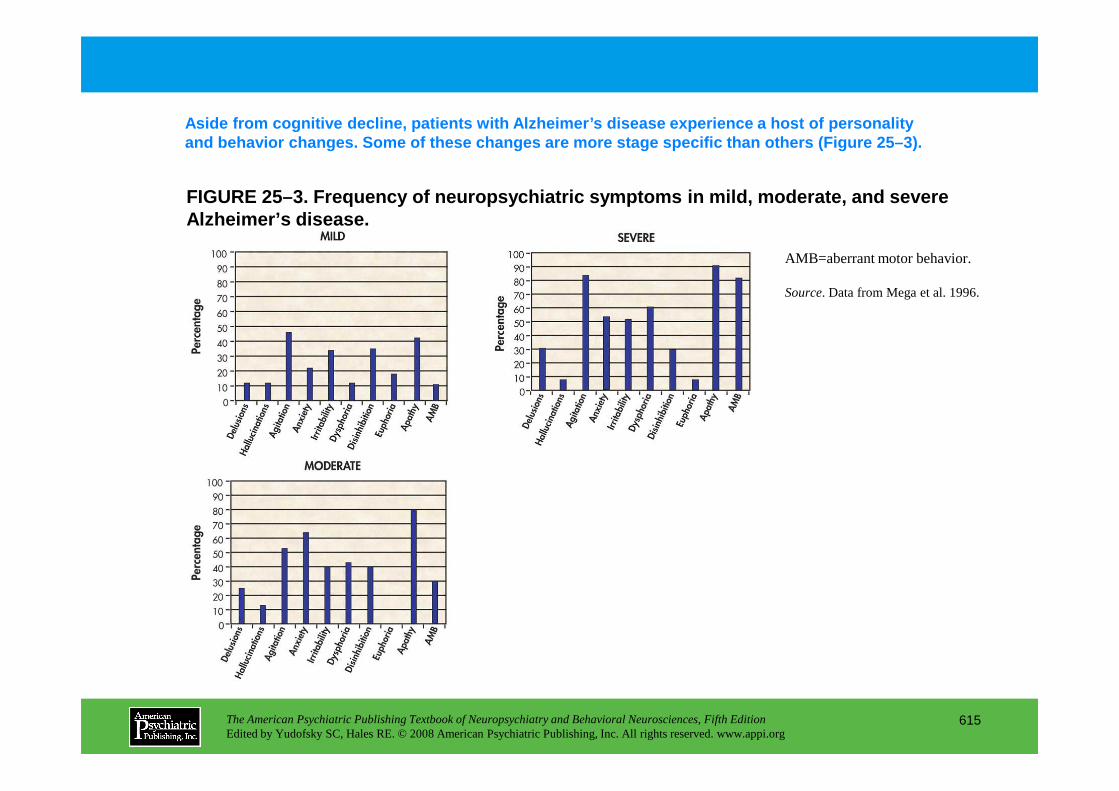
FIGURE 25–3. Frequency of neuropsychiatric symptoms in mild, moderate, and severe Alzheimer’s disease.
Aside from cognitive decline, patients with Alzheime r’s disease experience a host of personality and behavior changes. Some of these changes are mor e stage specific than others (Figure 25–3).
AMB=aberrant motor behavior.
Source. Data from Mega et al. 1996.
The American Psychiatric Publishing Textbook of Neuropsychiatry and Behavioral Neurosciences, Fifth EditionEdited by Yudofsky SC, Hales RE. © 2008 American Psychiatric Publishing, Inc. All rights reserved. www.appi.org
615
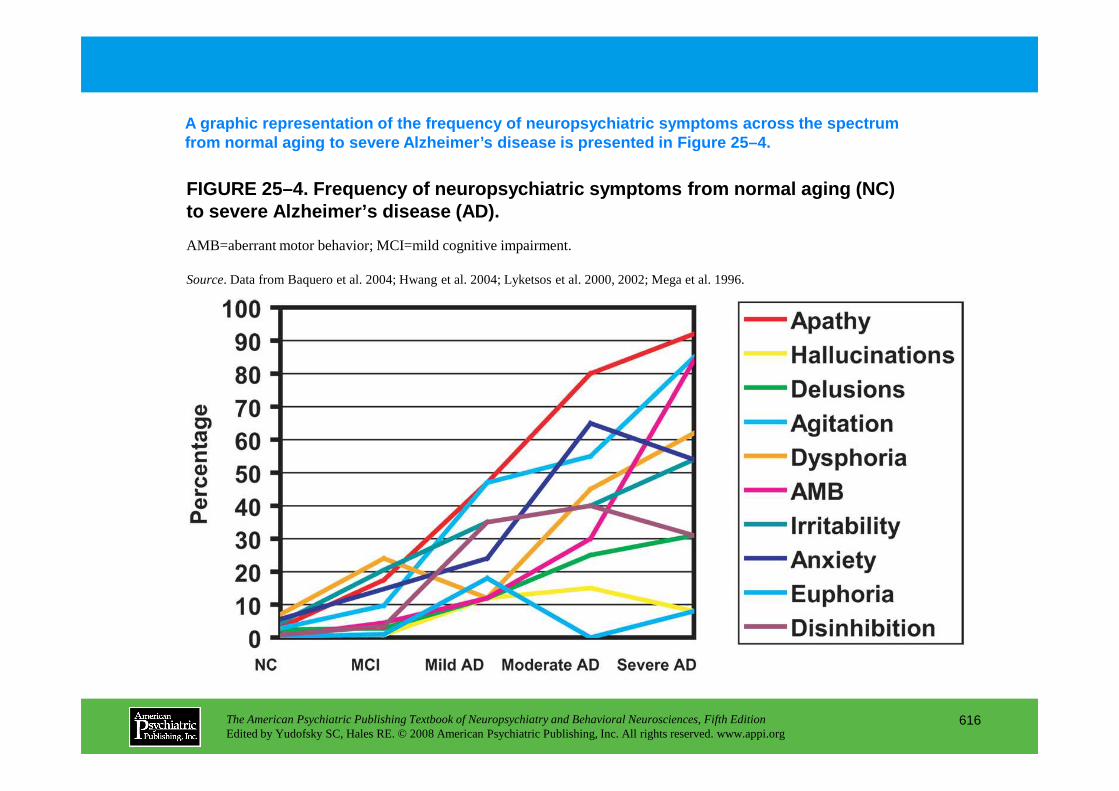
FIGURE 25–4. Frequency of neuropsychiatric symptoms from normal aging (NC) to severe Alzheimer’s disease (AD).
A graphic representation of the frequency of neurop sychiatric symptoms across the spectrum from normal aging to severe Alzheimer’s disease is p resented in Figure 25–4.
AMB=aberrant motor behavior; MCI=mild cognitive impairment.
Source. Data from Baquero et al. 2004; Hwang et al. 2004; Lyketsos et al. 2000, 2002; Mega et al. 1996.
The American Psychiatric Publishing Textbook of Neuropsychiatry and Behavioral Neurosciences, Fifth EditionEdited by Yudofsky SC, Hales RE. © 2008 American Psychiatric Publishing, Inc. All rights reserved. www.appi.org
616
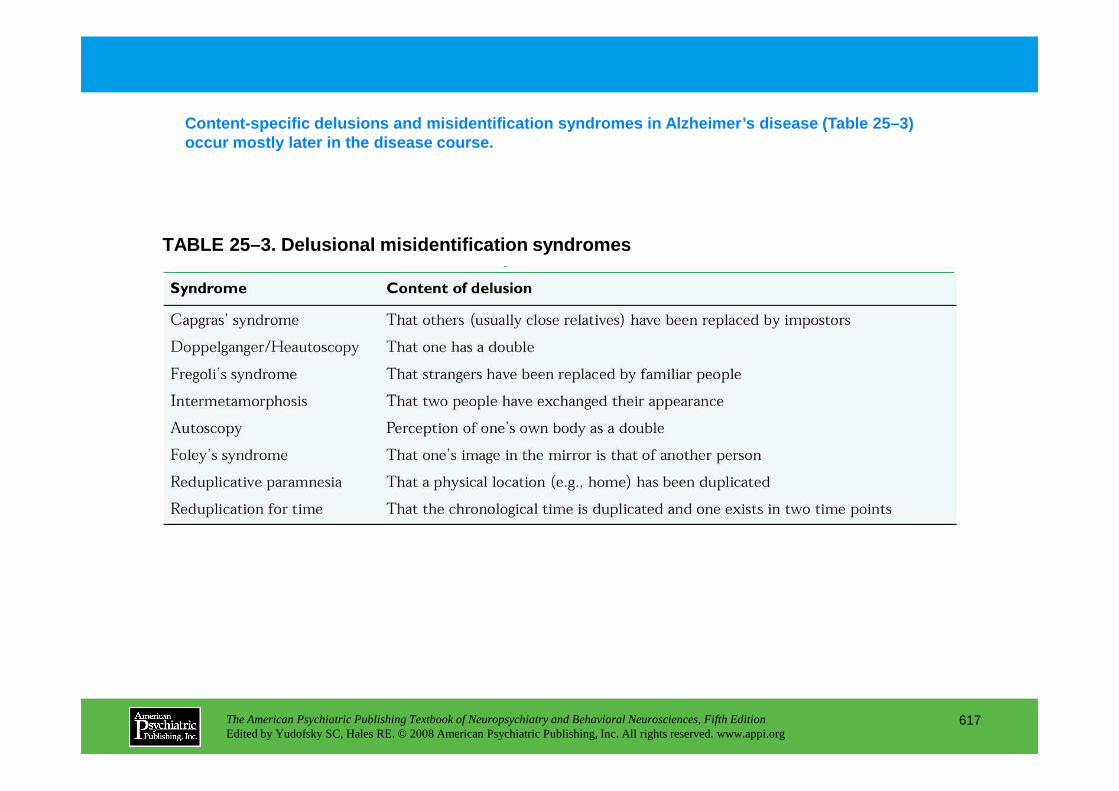
TABLE 25–3. Delusional misidentification syndromes
Content-specific delusions and misidentification sy ndromes in Alzheimer’s disease (Table 25–3) occur mostly later in the disease course.
The American Psychiatric Publishing Textbook of Neuropsychiatry and Behavioral Neurosciences, Fifth EditionEdited by Yudofsky SC, Hales RE. © 2008 American Psychiatric Publishing, Inc. All rights reserved. www.appi.org
617

FIGURE 25–5. Amyloid plaques and neurofibrillary tangles stained with Bielschowsky’s stain.
Alzheimer’s disease results from overproduction or a ccumulation of amyloid ββββ (Aββββ) and tau protein. A ββββ polymerizes and produces several types of amyloid in clusions. The diffuse and neuritic plaques deposit extracellularly (Figure 25 –5).
Source. Image courtesy of Ivan Klement.
The American Psychiatric Publishing Textbook of Neuropsychiatry and Behavioral Neurosciences, Fifth EditionEdited by Yudofsky SC, Hales RE. © 2008 American Psychiatric Publishing, Inc. All rights reserved. www.appi.org
618
Klement.

FIGURE 25–6. Gray matter atrophy in a patient with mild Alzheimer’s disease showing involvement of the temporal, parietal, occipital, a nd frontal association cortices more severe on the left.
Gray matter atrophy can now be visualized easily wit h computational anatomy techniques. In Alzheimer’s disease, it is most pronounced in the as sociation cortices, whereas primary cortices are relatively spared (Figure 25–6).
Note the relative sparing of the primary sensory, motor, and visual cortices. Red=most atrophic; blue=least atrophic; yellowand green=intermediate atrophy.
The American Psychiatric Publishing Textbook of Neuropsychiatry and Behavioral Neurosciences, Fifth EditionEdited by Yudofsky SC, Hales RE. © 2008 American Psychiatric Publishing, Inc. All rights reserved. www.appi.org
619

FIGURE 25–7. Single-photon emission computed tomography in the primary dementias.
Functional neuroimaging techniques such as SPECT and PET can identify early changes in regional blood flow and metabolism that are characteristic of the different primary dementias (Figure 25–7).
In Alzheimer’s disease (AD), there is
The American Psychiatric Publishing Textbook of Neuropsychiatry and Behavioral Neurosciences, Fifth EditionEdited by Yudofsky SC, Hales RE. © 2008 American Psychiatric Publishing, Inc. All rights reserved. www.appi.org
620
In Alzheimer’s disease (AD), there is bilateral mesial temporal and parietal hypoperfusion (left side). In dementia with Lewy bodies (DLB), bilateral parietal and occipital hypoperfusion is seen. Frontotemporal dementia (FTD) is characterized by frontotemporal hypoperfusion pattern.
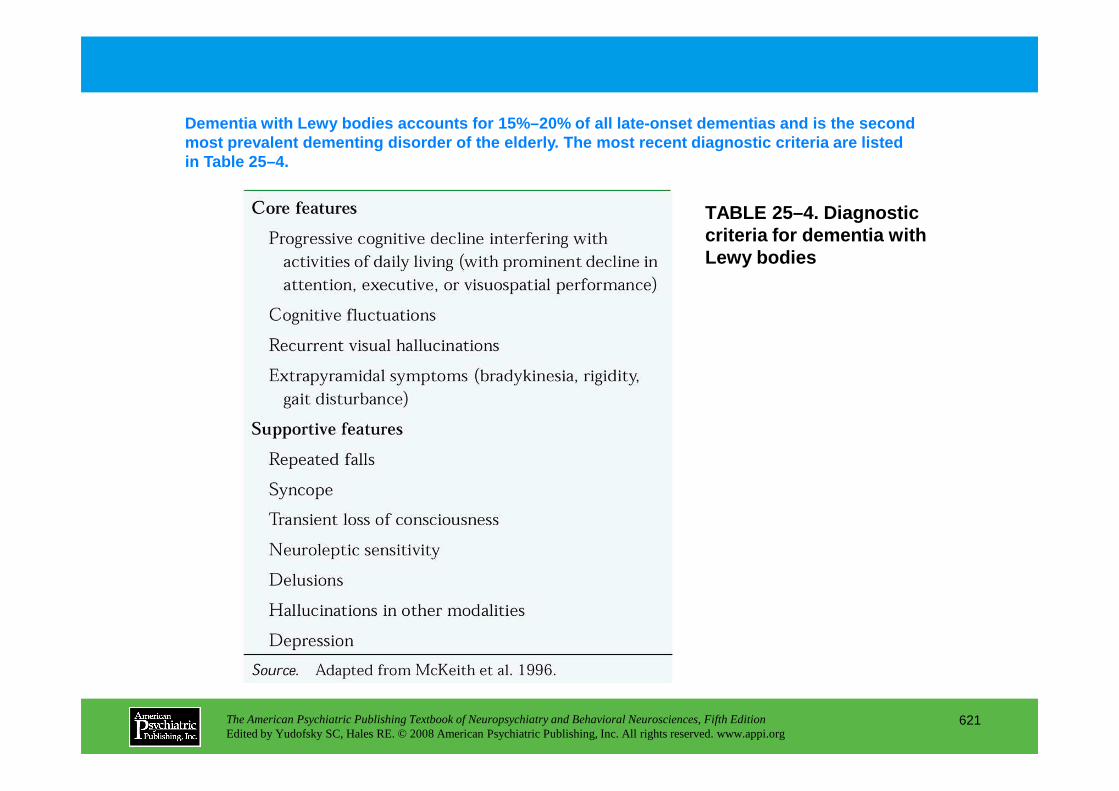
TABLE 25–4. Diagnostic criteria for dementia with Lewy bodies
Dementia with Lewy bodies accounts for 15%–20% of a ll late-onset dementias and is the second most prevalent dementing disorder of the elderly. T he most recent diagnostic criteria are listed in Table 25–4.
The American Psychiatric Publishing Textbook of Neuropsychiatry and Behavioral Neurosciences, Fifth EditionEdited by Yudofsky SC, Hales RE. © 2008 American Psychiatric Publishing, Inc. All rights reserved. www.appi.org
621

FIGURE 25–8. Prevalence of some neuropsychiatric features at disease onset in dementia with Lewy bodies (DLB; blue ) and Alzheimer's disease (AD; orange ).
Multiple, simultaneous psychiatric symptoms are alm ost universal in dementia with Lewy bodies. Neuropsychiatric features are much more com mon at disease onset in DLB than in Alzheimer’s disease, as shown in Figure 25–8.
Source.Data from Simard et al. 2000.
The American Psychiatric Publishing Textbook of Neuropsychiatry and Behavioral Neurosciences, Fifth EditionEdited by Yudofsky SC, Hales RE. © 2008 American Psychiatric Publishing, Inc. All rights reserved. www.appi.org
622

FIGURE 25–9. Lewy bodies stained with hematoxylin-eosin.
The major pathological finding in DLB is the Lewy b ody (Figure 25–9). Its major component is a-synuclein.
Source. Image courtesy of Ivan Klement.
The American Psychiatric Publishing Textbook of Neuropsychiatry and Behavioral Neurosciences, Fifth EditionEdited by Yudofsky SC, Hales RE. © 2008 American Psychiatric Publishing, Inc. All rights reserved. www.appi.org
623
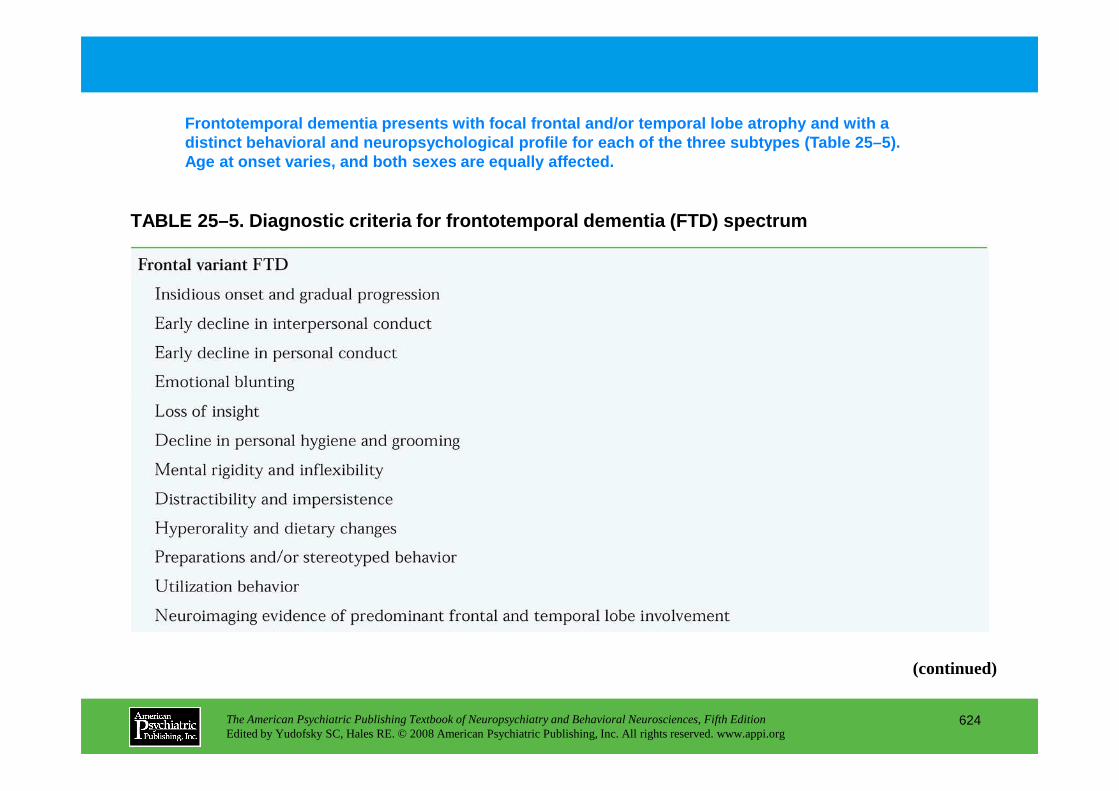
TABLE 25–5. Diagnostic criteria for frontotemporal dementia (FTD) spectrum
Frontotemporal dementia presents with focal frontal and/or temporal lobe atrophy and with a distinct behavioral and neuropsychological profile for each of the three subtypes (Table 25–5). Age at onset varies, and both sexes are equally aff ected.
The American Psychiatric Publishing Textbook of Neuropsychiatry and Behavioral Neurosciences, Fifth EditionEdited by Yudofsky SC, Hales RE. © 2008 American Psychiatric Publishing, Inc. All rights reserved. www.appi.org
624
(continued)
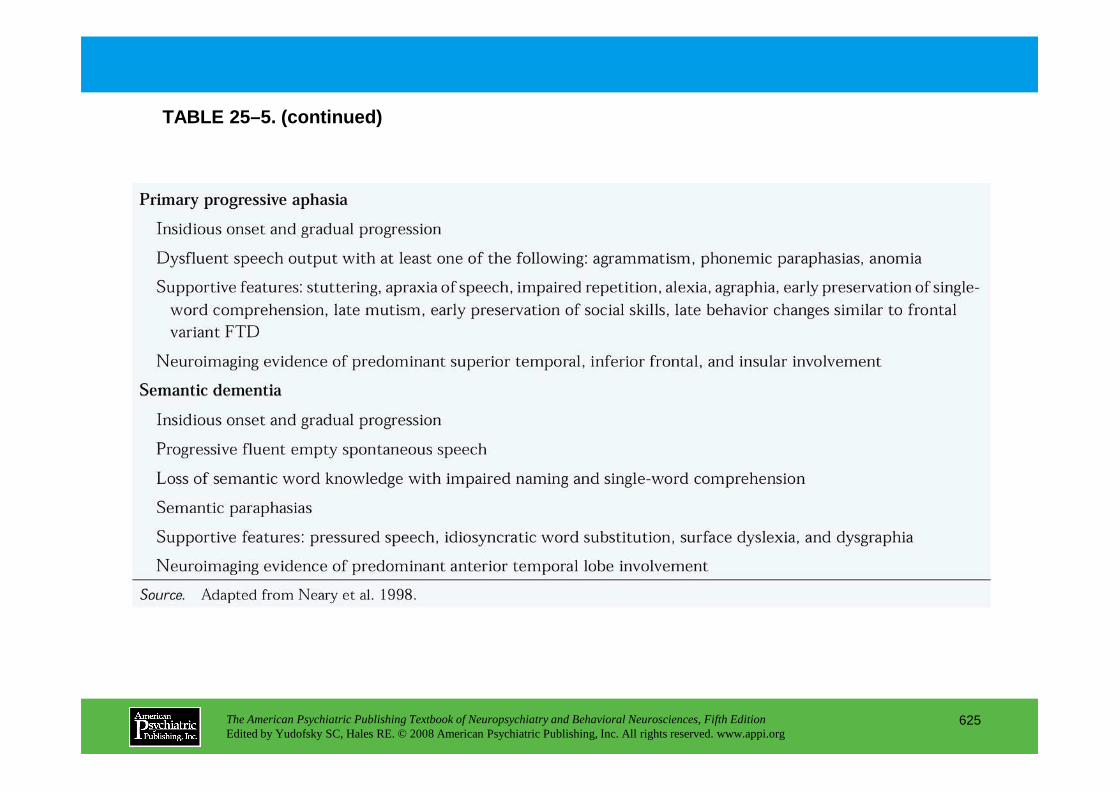
TABLE 25–5. (continued)
The American Psychiatric Publishing Textbook of Neuropsychiatry and Behavioral Neurosciences, Fifth EditionEdited by Yudofsky SC, Hales RE. © 2008 American Psychiatric Publishing, Inc. All rights reserved. www.appi.org
625

FIGURE 25–10. Panel A. Frequency of neuropsychiatric symptoms in frontotem poral dementia (FTD). Panel B. Comparison of the frequency of neuropsychiatric sym ptoms in frontal variant FTD (fvFTD; blue ), temporal variant FTD (tvFTD; orange ), and Alzheimer’s disease (AD; green ).
Figure 25–10 shows the frequency of neuropsychiatri c symptoms in frontotemporal dementia. Relative to Alzheimer’s disease, FTD patie nts have significantly more apathy, euphoria, disinhibition, and aberrant motor behavio r.
AMB=aberrant motor behavior.
Source. Panel A data from Levy et al. 1996; Mourik et al. 2004. Panel B data from Liu et al. 2004.
The American Psychiatric Publishing Textbook of Neuropsychiatry and Behavioral Neurosciences, Fifth EditionEdited by Yudofsky SC, Hales RE. © 2008 American Psychiatric Publishing, Inc. All rights reserved. www.appi.org
626
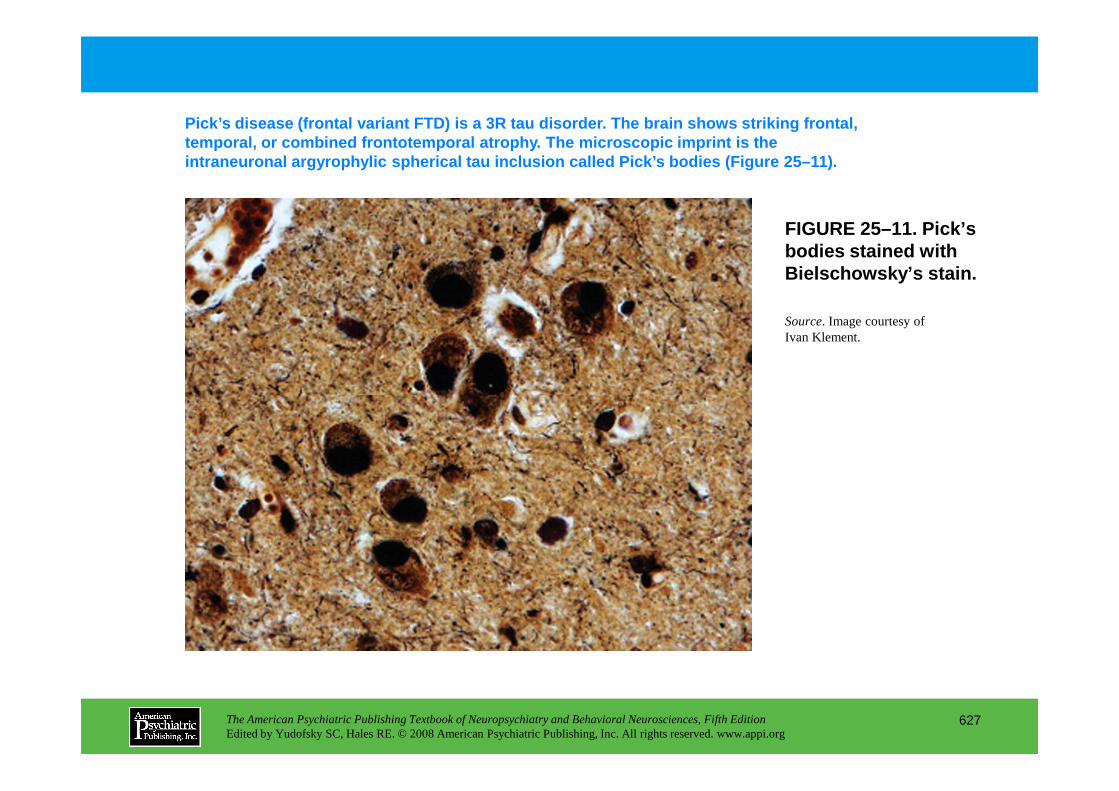
FIGURE 25–11. Pick’s bodies stained with Bielschowsky’s stain.
Pick’s disease (frontal variant FTD) is a 3R tau di sorder. The brain shows striking frontal, temporal, or combined frontotemporal atrophy. The m icroscopic imprint is the intraneuronal argyrophylic spherical tau inclusion called Pick’s bodies (Figure 25–11).
Source. Image courtesy of Ivan Klement.
The American Psychiatric Publishing Textbook of Neuropsychiatry and Behavioral Neurosciences, Fifth EditionEdited by Yudofsky SC, Hales RE. © 2008 American Psychiatric Publishing, Inc. All rights reserved. www.appi.org
627
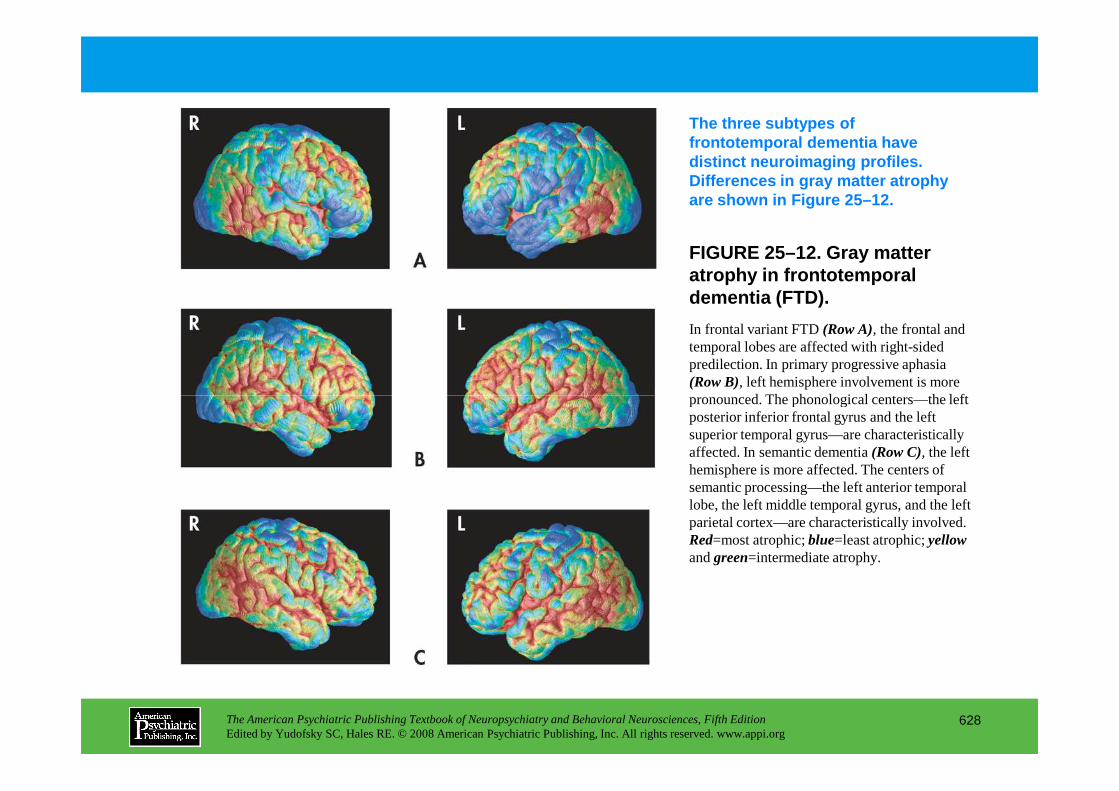
FIGURE 25–12. Gray matter atrophy in frontotemporal dementia (FTD).
The three subtypes of frontotemporal dementia have distinct neuroimaging profiles. Differences in gray matter atrophy are shown in Figure 25–12.
In frontal variant FTD (Row A), the frontal and temporal lobes are affected with right-sided predilection. In primary progressive aphasia (Row B), left hemisphere involvement is more pronounced. The phonological centers—the left
The American Psychiatric Publishing Textbook of Neuropsychiatry and Behavioral Neurosciences, Fifth EditionEdited by Yudofsky SC, Hales RE. © 2008 American Psychiatric Publishing, Inc. All rights reserved. www.appi.org
628
pronounced. The phonological centers—the left posterior inferior frontal gyrus and the left superior temporal gyrus—are characteristically affected. In semantic dementia (Row C), the left hemisphere is more affected. The centers of semantic processing—the left anterior temporal lobe, the left middle temporal gyrus, and the left parietal cortex—are characteristically involved. Red=most atrophic; blue=least atrophic; yellowand green=intermediate atrophy.
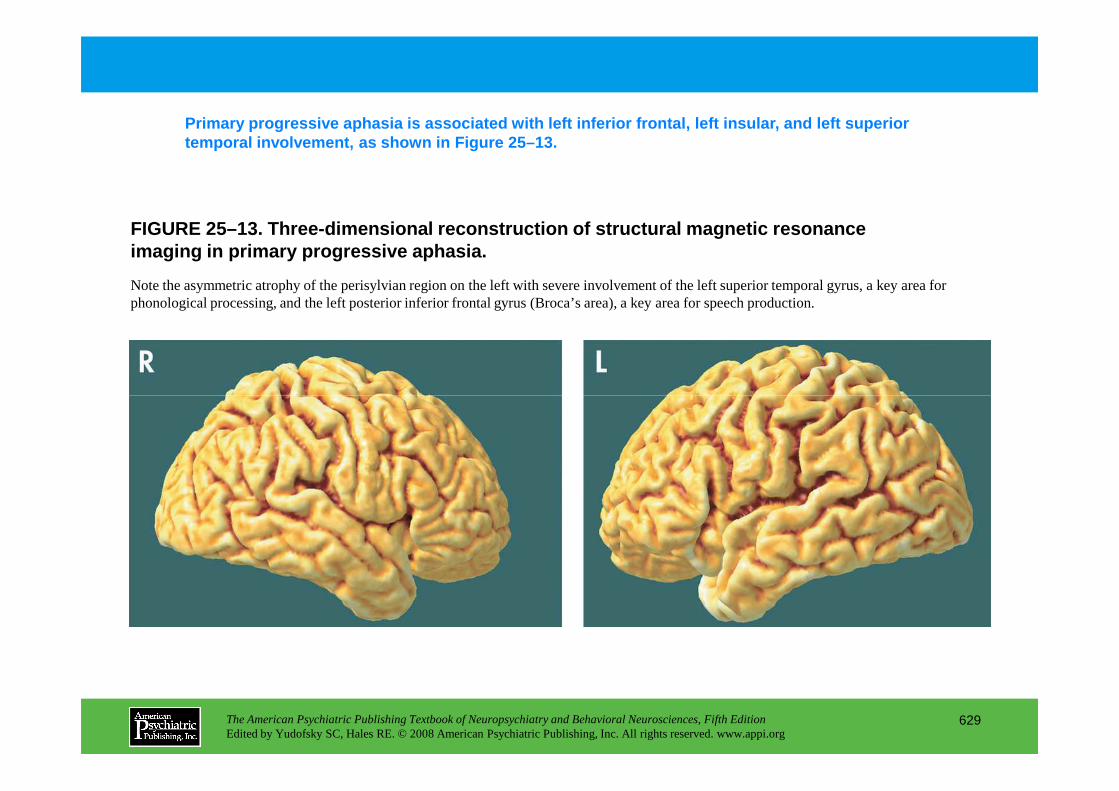
FIGURE 25–13. Three-dimensional reconstruction of s tructural magnetic resonance imaging in primary progressive aphasia.
Primary progressive aphasia is associated with left inferior frontal, left insular, and left superior temporal involvement, as shown in Figure 25–13.
Note the asymmetric atrophy of the perisylvian region on the left with severe involvement of the left superior temporal gyrus, a key area for phonological processing, and the left posterior inferior frontal gyrus (Broca’s area), a key area for speech production.
The American Psychiatric Publishing Textbook of Neuropsychiatry and Behavioral Neurosciences, Fifth EditionEdited by Yudofsky SC, Hales RE. © 2008 American Psychiatric Publishing, Inc. All rights reserved. www.appi.org
629
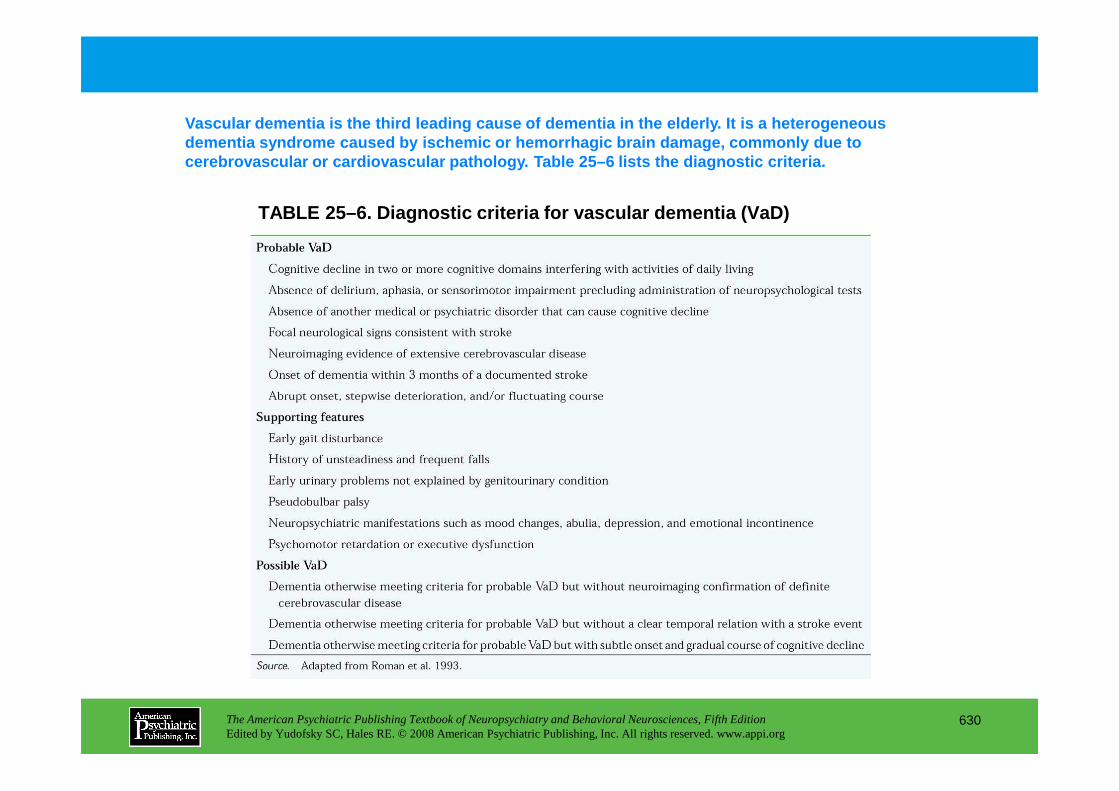
TABLE 25–6. Diagnostic criteria for vascular dement ia (VaD)
Vascular dementia is the third leading cause of dem entia in the elderly. It is a heterogeneous dementia syndrome caused by ischemic or hemorrhagic brain damage, commonly due to cerebrovascular or cardiovascular pathology. Table 25–6 lists the diagnostic criteria.
The American Psychiatric Publishing Textbook of Neuropsychiatry and Behavioral Neurosciences, Fifth EditionEdited by Yudofsky SC, Hales RE. © 2008 American Psychiatric Publishing, Inc. All rights reserved. www.appi.org
630
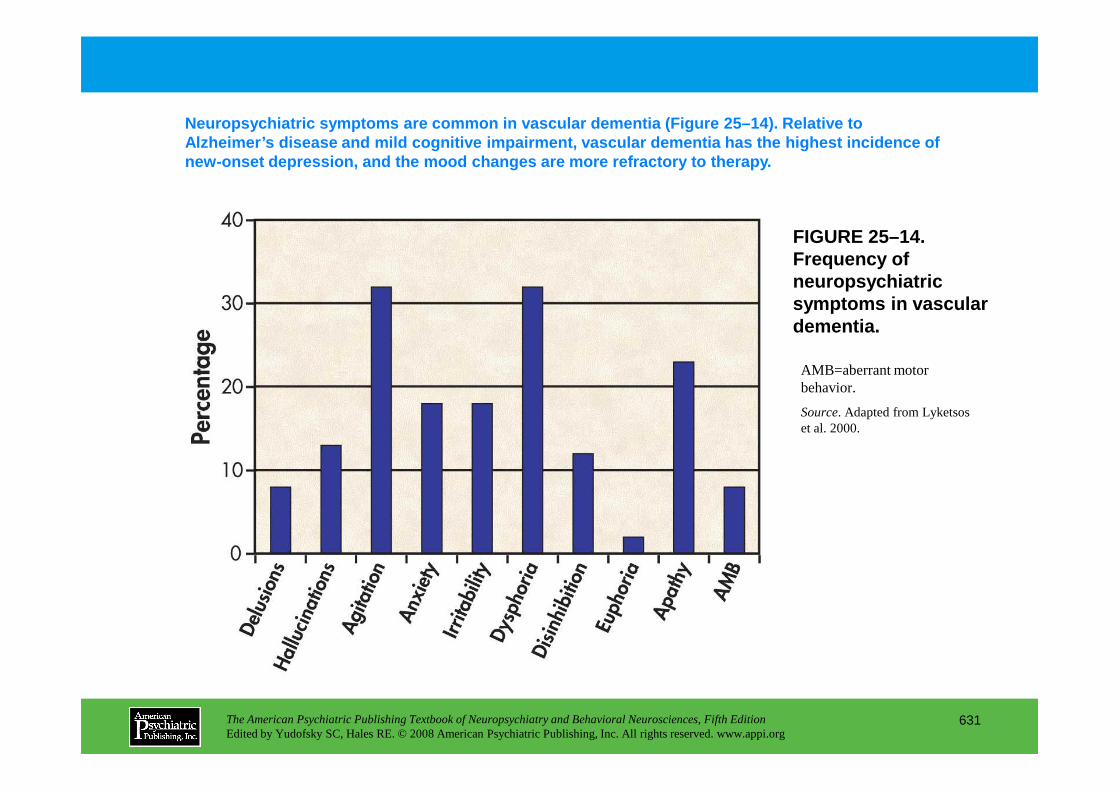
FIGURE 25–14. Frequency of neuropsychiatric symptoms in vascular dementia.
Neuropsychiatric symptoms are common in vascular de mentia (Figure 25–14). Relative to Alzheimer’s disease and mild cognitive impairment, v ascular dementia has the highest incidence of new-onset depression, and the mood changes are more refractory to therapy.
AMB=aberrant motor behavior.
The American Psychiatric Publishing Textbook of Neuropsychiatry and Behavioral Neurosciences, Fifth EditionEdited by Yudofsky SC, Hales RE. © 2008 American Psychiatric Publishing, Inc. All rights reserved. www.appi.org
631
behavior.
Source. Adapted from Lyketsos et al. 2000.
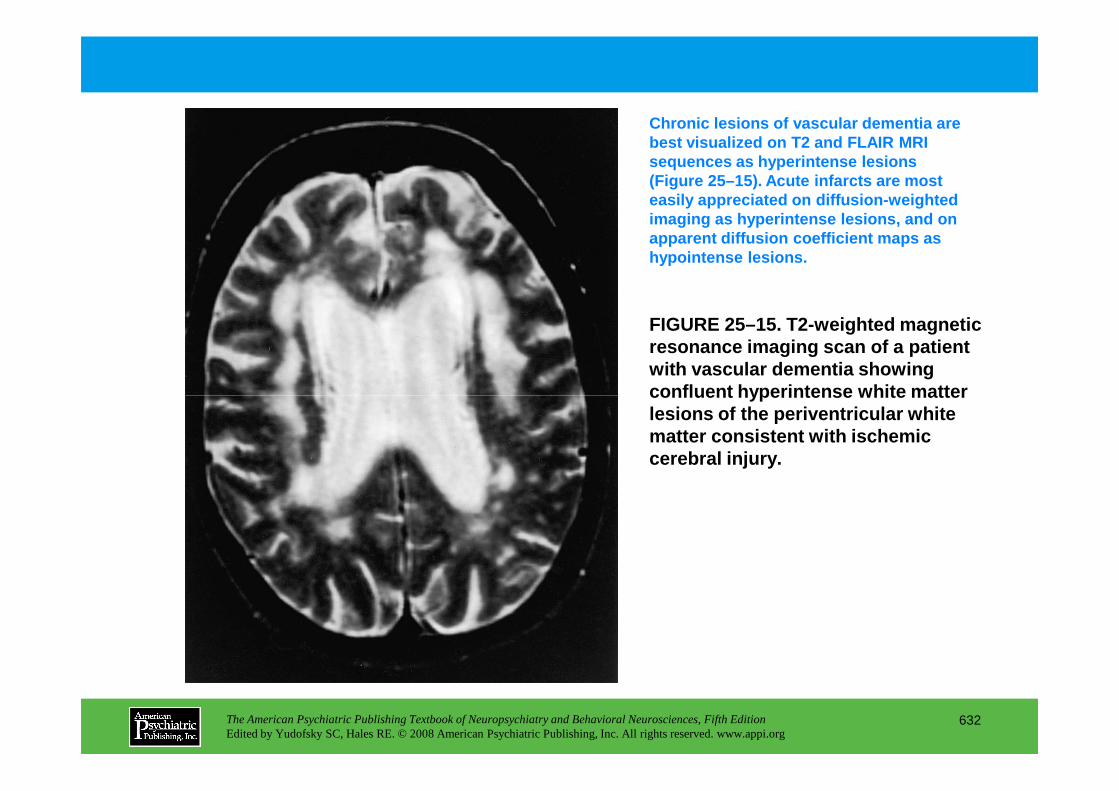
FIGURE 25–15. T2-weighted magnetic resonance imaging scan of a patient with vascular dementia showing confluent hyperintense white matter
Chronic lesions of vascular dementia are best visualized on T2 and FLAIR MRI sequences as hyperintense lesions (Figure 25–15). Acute infarcts are most easily appreciated on diffusion-weighted imaging as hyperintense lesions, and on apparent diffusion coefficient maps as hypointense lesions.
The American Psychiatric Publishing Textbook of Neuropsychiatry and Behavioral Neurosciences, Fifth EditionEdited by Yudofsky SC, Hales RE. © 2008 American Psychiatric Publishing, Inc. All rights reserved. www.appi.org
632
confluent hyperintense white matter lesions of the periventricular white matter consistent with ischemic cerebral injury.
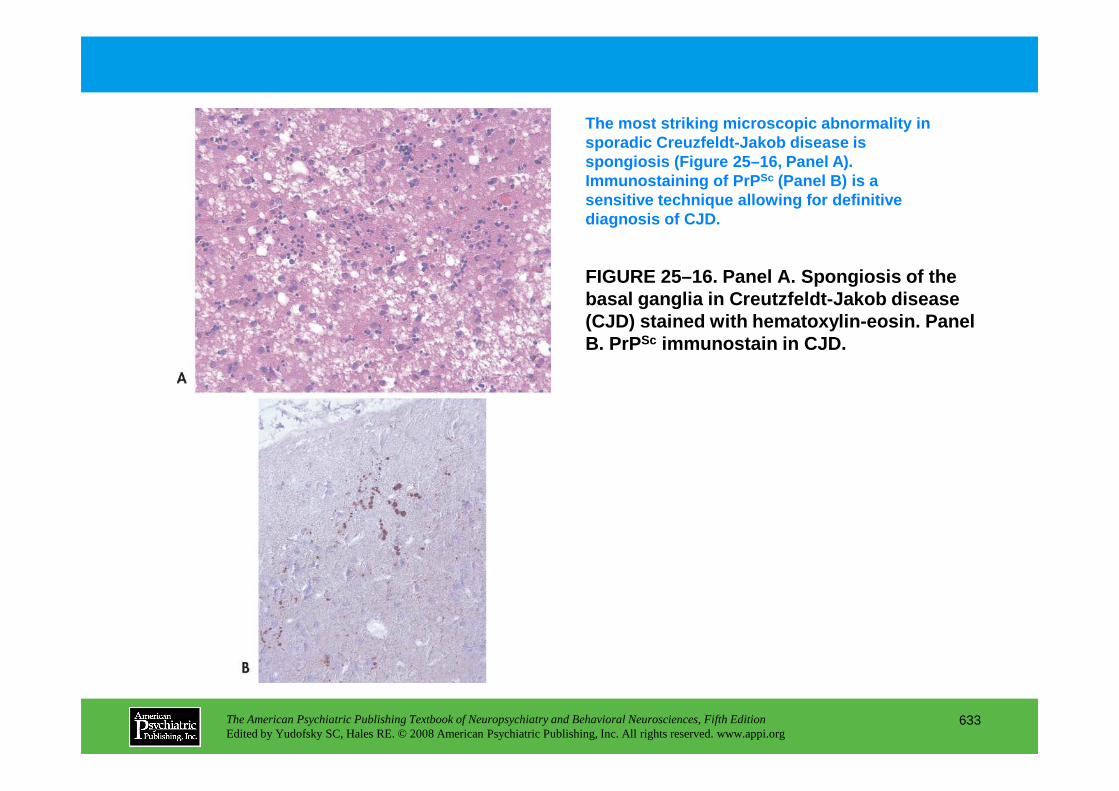
FIGURE 25–16. Panel A. Spongiosis of the basal ganglia in Creutzfeldt-Jakob disease (CJD) stained with hematoxylin-eosin. Panel B. PrPSc immunostain in CJD.
The most striking microscopic abnormality in sporadic Creuzfeldt-Jakob disease is spongiosis (Figure 25–16, Panel A). Immunostaining of PrP Sc (Panel B) is a sensitive technique allowing for definitive diagnosis of CJD.
The American Psychiatric Publishing Textbook of Neuropsychiatry and Behavioral Neurosciences, Fifth EditionEdited by Yudofsky SC, Hales RE. © 2008 American Psychiatric Publishing, Inc. All rights reserved. www.appi.org
633
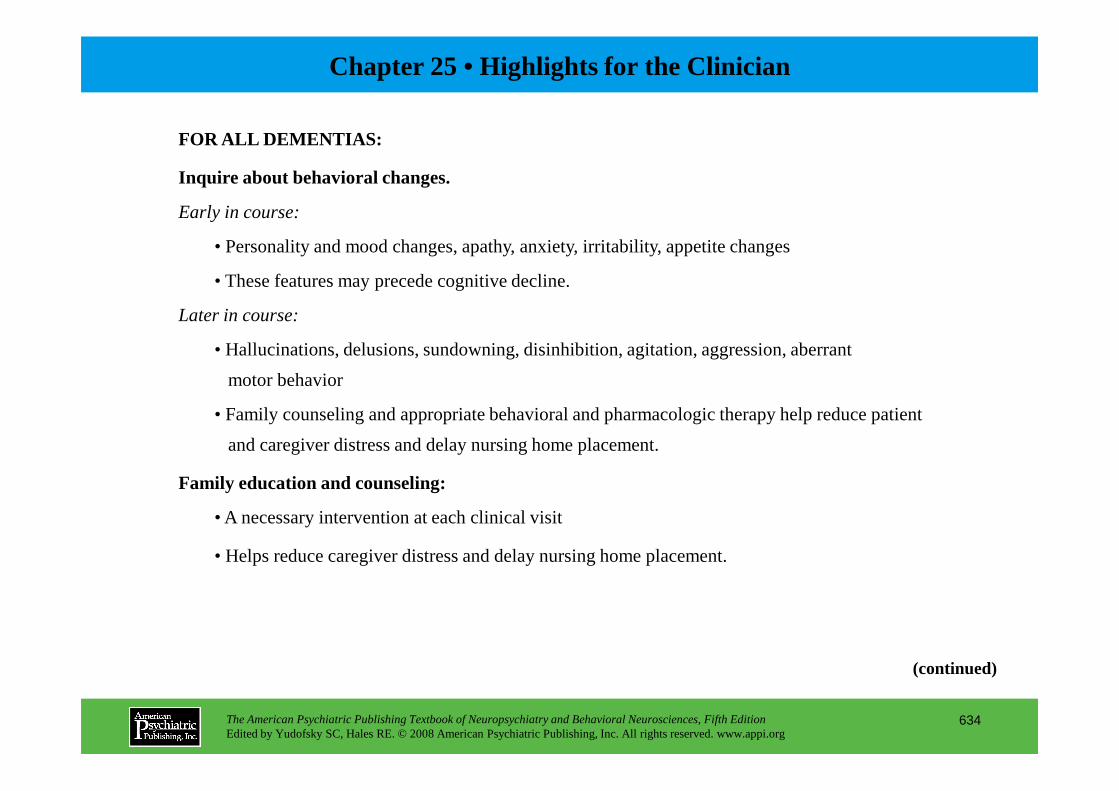
Chapter 25 • Highlights for the Clinician
FOR ALL DEMENTIAS:
Inquire about behavioral changes.
Early in course:
• Personality and mood changes, apathy, anxiety, irritability, appetite changes
• These features may precede cognitive decline.
Later in course:
• Hallucinations, delusions, sundowning, disinhibition, agitation, aggression, aberrant
motor behavior
The American Psychiatric Publishing Textbook of Neuropsychiatry and Behavioral Neurosciences, Fifth EditionEdited by Yudofsky SC, Hales RE. © 2008 American Psychiatric Publishing, Inc. All rights reserved. www.appi.org
634
• Family counseling and appropriate behavioral and pharmacologic therapy help reduce patient
and caregiver distress and delay nursing home placement.
Family education and counseling:
• A necessary intervention at each clinical visit
• Helps reduce caregiver distress and delay nursing home placement.
(continued)
Treatment:
Behavioral interventions:
• Help reduce caregiver distress and delay nursing home placement.
Medications:
• Use cautiously and only when needed.
• Do not prescribe typical antipsychotics (high risk of parkinsonism and neuroleptic
malignant syndrome).
• Treat with atypical antipsychotics only if psychosis is disturbing to patient and family.
The American Psychiatric Publishing Textbook of Neuropsychiatry and Behavioral Neurosciences, Fifth EditionEdited by Yudofsky SC, Hales RE. © 2008 American Psychiatric Publishing, Inc. All rights reserved. www.appi.org
635
• Treat with atypical antipsychotics only if psychosis is disturbing to patient and family.
• Consider anticholinesterase inhibitors as an alternative.
Always consider: Dementia with Lewy bodies in patients with psychosis and parkinsonian features.
CHAPTER 26
NEUROPSYCHIATRIC ASPECTS OF SCHIZOPHRENIA
Carol A. Tamminga, M.D.Mujeeb U. Shad, M.D.
Subroto Ghose, M.D., Ph.D.
The American Psychiatric Publishing Textbook of Neuropsychiatry and Behavioral Neurosciences, Fifth EditionEdited by Yudofsky SC, Hales RE. © 2008 American Psychiatric Publishing, Inc. All rights reserved. www.appi.org
636
Slide Show
Topic headings and reading list
Tables and figures
Highlights for the clinician
Main menu
(About, Contents, Contributors, Publishing facts)

Clinical Characteristics of SchizophreniaDiagnosisSymptomatologyCourse
Risk Factors in SchizophreniaGenetics
Dystrobrevin Binding Protein-1 (DTNBP1 or Dysbindin)Neuregulin-1 (NRG1)D–Amino Acid Oxidase Activator and D–Amino Acid
OxidaseRegulator of G-Protein Signaling-4 (RGS4)Catechol-O-Methyltransferase (COMT)Disrupted-in-Schizophrenia-1 and -2 (DISC1and DISC2)Metabotropic Glutamate Receptor-3 (GRM3)
Biochemical Studies in Schizophrenia
Functional Studies in Schizophrenia With In Vivo Imaging Techniques
Functional ImagingNeuroreceptor Imaging
Clinical Therapeutics in Schizophrenia
Integrative Basic Brain Mechanisms Important to Understanding Cerebral Function
Cortical-Subcortical CircuitsSymptom Cluster Circuits
Psychosis Neural CircuitNegative Affect Neural CircuitCognitive Deficit Neural Circuit
CHAPTER 26 • Topics and Readings
The American Psychiatric Publishing Textbook of Neuropsychiatry and Behavioral Neurosciences, Fifth EditionEdited by Yudofsky SC, Hales RE. © 2008 American Psychiatric Publishing, Inc. All rights reserved. www.appi.org
637
Metabotropic Glutamate Receptor-3 (GRM3)Environmental Factors
Pre- and Perinatal FactorsChildhood and Adolescent Factors
Gene–Environment Interactions
Endophenotypes
Anatomical and Neurochemical Features of Schizophrenia
In Vivo Brain Structure Using Magnetic Resonance ImagingMicroscopic Analysis of Postmortem Central Nervous
System TissueMarkers of Brain DevelopmentNeural Plasticity
SynthesisClinical Observations About Schizophrenia Important for
Formulating PathophysiologyPitfalls and Confounds in Schizophrenia StudiesToward a Pathophysiology of Schizophrenia
RECOMMENDED READINGSHarrison PJ, Weinberger DR: Schizophrenia genes, gene
expression, and neuropathology: on the matter of their convergence. Mol Psychiatry 10:40–68, 2005
Maki P, Veijola J, Jones PB, et al: Predictors of schizophrenia: a review. Br Med Bull 73–74:1–15, 2005
CHAPTER 26 • Tables and Figures
Table 26–1. Frequency of psychotic symptoms in schizophrenia
Figure 26–1. Positron emission tomographic images with fluorodeoxyglucose
Figure 26–2. Regional cerebral blood flow elevations
Figure 26–3. Regional cerebral blood flow localization of ketamine action in schizophrenic brain
Figure 26–4. Hypothetical neural circuits underlying the three symptom domains of schizophrenia
Summary Highlights for the Clinician
The American Psychiatric Publishing Textbook of Neuropsychiatry and Behavioral Neurosciences, Fifth EditionEdited by Yudofsky SC, Hales RE. © 2008 American Psychiatric Publishing, Inc. All rights reserved. www.appi.org
638

TABLE 26–1. Frequency of psychotic symptoms in schi zophrenia
Throughout history, the identification of psychosis has been straightforward because of its distinctive cognitive symptoms. The most frequently reported symptoms from an international study (Table 26–1) are descriptive of the disease w e see today.
The American Psychiatric Publishing Textbook of Neuropsychiatry and Behavioral Neurosciences, Fifth EditionEdited by Yudofsky SC, Hales RE. © 2008 American Psychiatric Publishing, Inc. All rights reserved. www.appi.org
639
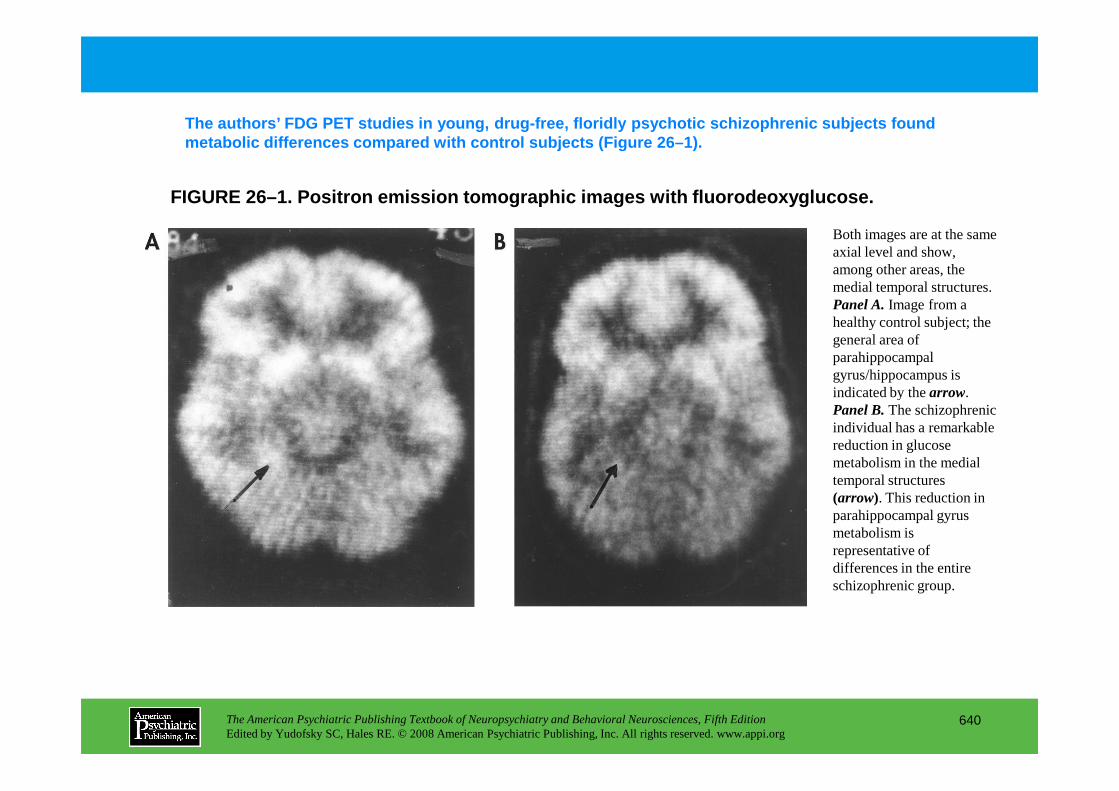
FIGURE 26–1. Positron emission tomographic images w ith fluorodeoxyglucose.
The authors’ FDG PET studies in young, drug-free, f loridly psychotic schizophrenic subjects found metabolic differences compared with control subject s (Figure 26–1).
Both images are at the same axial level and show, among other areas, the medial temporal structures. Panel A.Image from a healthy control subject; the general area of parahippocampal gyrus/hippocampus is indicated by the arrow.
The American Psychiatric Publishing Textbook of Neuropsychiatry and Behavioral Neurosciences, Fifth EditionEdited by Yudofsky SC, Hales RE. © 2008 American Psychiatric Publishing, Inc. All rights reserved. www.appi.org
640
indicated by the arrow. Panel B.The schizophrenic individual has a remarkable reduction in glucose metabolism in the medial temporal structures (arrow). This reduction in parahippocampal gyrus metabolism is representative of differences in the entire schizophrenic group.
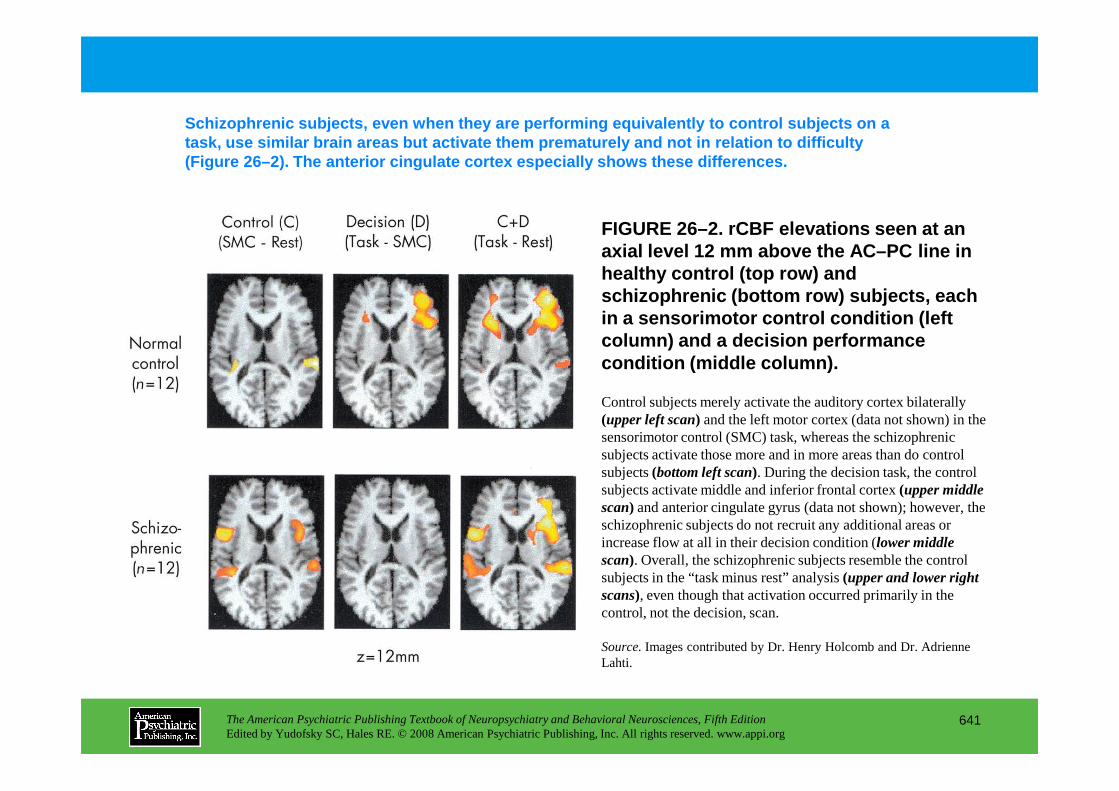
FIGURE 26–2. rCBF elevations seen at an axial level 12 mm above the AC–PC line in healthy control ( top row ) and schizophrenic ( bottom row ) subjects, each in a sensorimotor control condition (left column) and a decision performance condition ( middle column ).
Schizophrenic subjects, even when they are performin g equivalently to control subjects on a task, use similar brain areas but activate them pre maturely and not in relation to difficulty (Figure 26–2). The anterior cingulate cortex especi ally shows these differences.
Control subjects merely activate the auditory cortex bilaterally
The American Psychiatric Publishing Textbook of Neuropsychiatry and Behavioral Neurosciences, Fifth EditionEdited by Yudofsky SC, Hales RE. © 2008 American Psychiatric Publishing, Inc. All rights reserved. www.appi.org
641
Control subjects merely activate the auditory cortex bilaterally (upper left scan) and the left motor cortex (data not shown) in the sensorimotor control (SMC) task, whereas the schizophrenic subjects activate those more and in more areas than do control subjects (bottom left scan). During the decision task, the control subjects activate middle and inferior frontal cortex (upper middle scan) and anterior cingulate gyrus (data not shown); however, the schizophrenic subjects do not recruit any additional areas or increase flow at all in their decision condition (lower middle scan). Overall, the schizophrenic subjects resemble the control subjects in the “task minus rest” analysis (upper and lower right scans), even though that activation occurred primarily in the control, not the decision, scan.
Source.Images contributed by Dr. Henry Holcomb and Dr. Adrienne Lahti.
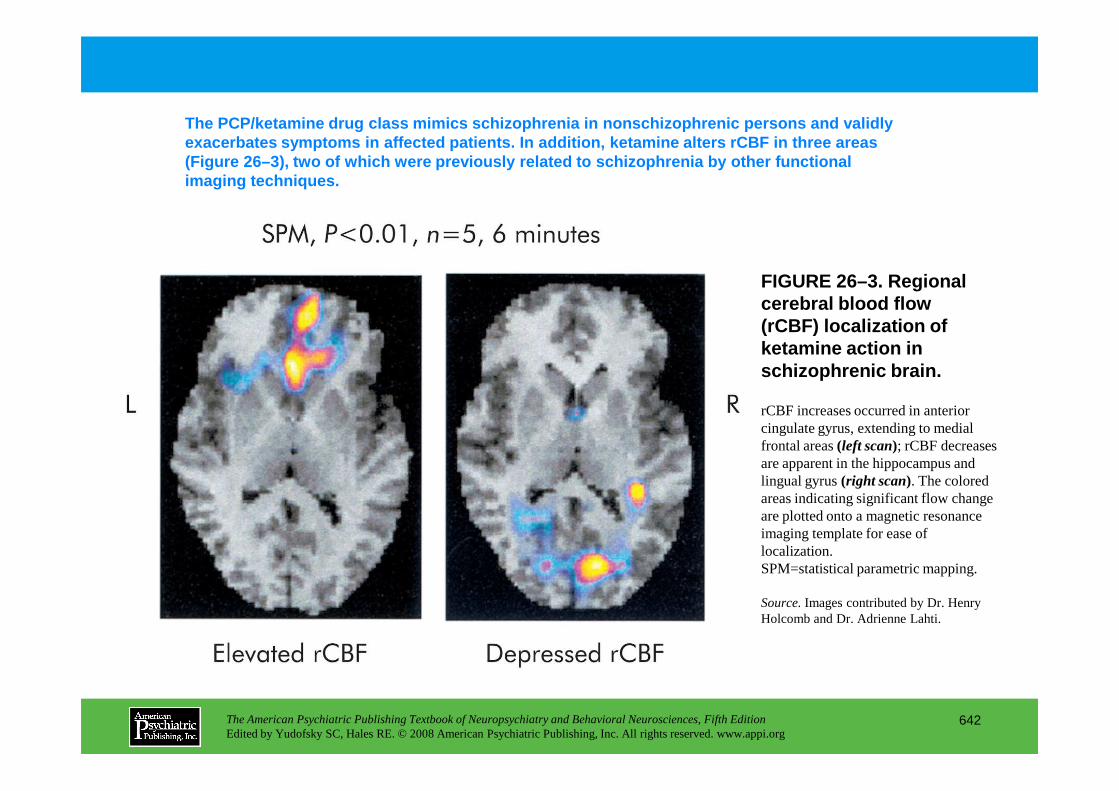
FIGURE 26–3. Regional cerebral blood flow (rCBF) localization of ketamine action in schizophrenic brain.
The PCP/ketamine drug class mimics schizophrenia in nonschizophrenic persons and validly exacerbates symptoms in affected patients. In addit ion, ketamine alters rCBF in three areas (Figure 26–3), two of which were previously related to schizophrenia by other functional imaging techniques.
The American Psychiatric Publishing Textbook of Neuropsychiatry and Behavioral Neurosciences, Fifth EditionEdited by Yudofsky SC, Hales RE. © 2008 American Psychiatric Publishing, Inc. All rights reserved. www.appi.org
642
rCBF increases occurred in anterior cingulate gyrus, extending to medial frontal areas (left scan); rCBF decreases are apparent in the hippocampus and lingual gyrus (right scan). The colored areas indicating significant flow change are plotted onto a magnetic resonance imaging template for ease of localization. SPM=statistical parametric mapping.
Source.Images contributed by Dr. Henry Holcomb and Dr. Adrienne Lahti.
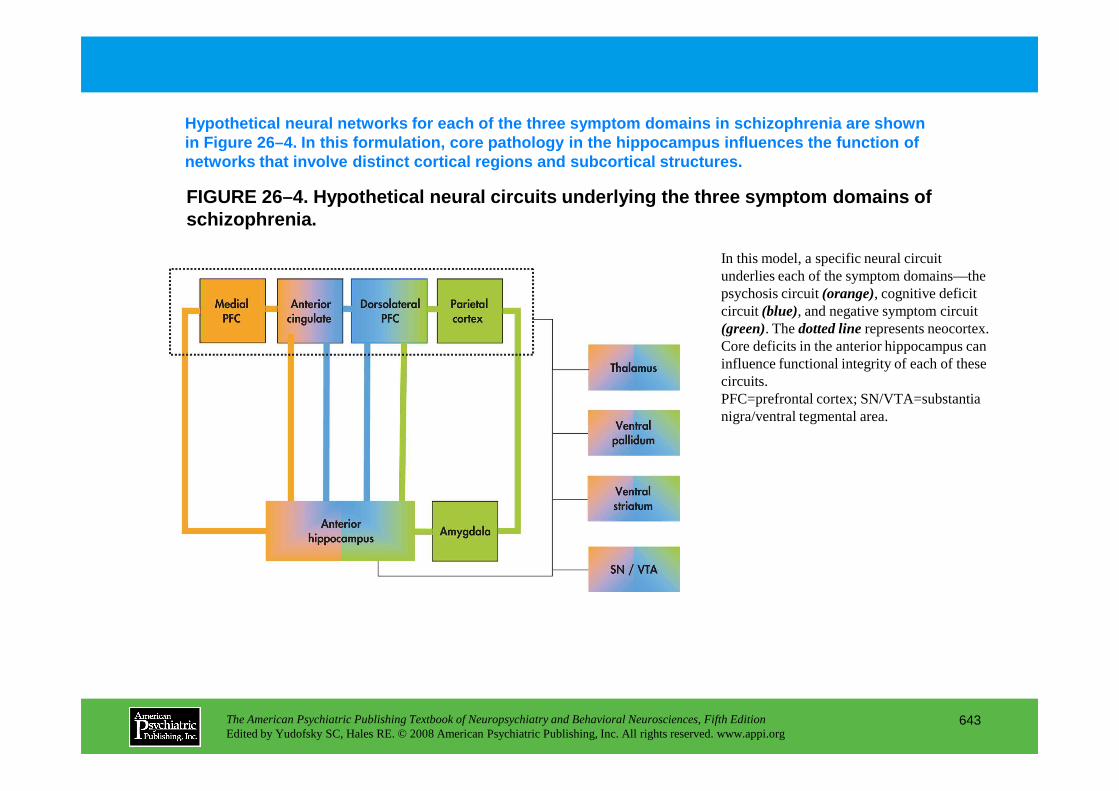
FIGURE 26–4. Hypothetical neural circuits underlyin g the three symptom domains of schizophrenia.
Hypothetical neural networks for each of the three symptom domains in schizophrenia are shown in Figure 26–4. In this formulation, core pathology in the hippocampus influences the function of networks that involve distinct cortical regions and subcortical structures.
In this model, a specific neural circuit underlies each of the symptom domains—the psychosis circuit (orange), cognitive deficit circuit (blue), and negative symptom circuit (green). The dotted linerepresents neocortex. Core deficits in the anterior hippocampus can influence functional integrity of each of these circuits. PFC=prefrontal cortex; SN/VTA=substantia
The American Psychiatric Publishing Textbook of Neuropsychiatry and Behavioral Neurosciences, Fifth EditionEdited by Yudofsky SC, Hales RE. © 2008 American Psychiatric Publishing, Inc. All rights reserved. www.appi.org
643
PFC=prefrontal cortex; SN/VTA=substantia nigra/ventral tegmental area.
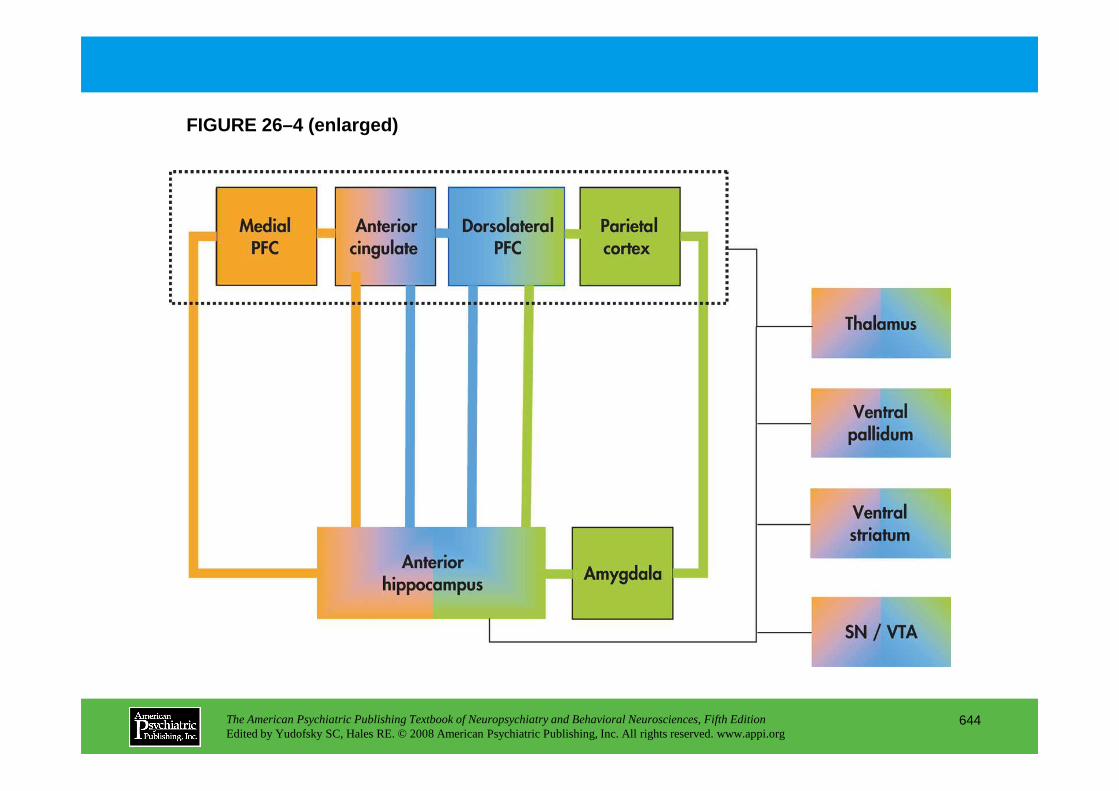
FIGURE 26–4 (enlarged)
The American Psychiatric Publishing Textbook of Neuropsychiatry and Behavioral Neurosciences, Fifth EditionEdited by Yudofsky SC, Hales RE. © 2008 American Psychiatric Publishing, Inc. All rights reserved. www.appi.org
644
Chapter 26 • Highlights for the Clinician
• Schizophrenia is a disease composed of three symptom clusters, each of which may have a distinct molecular pathology and differ in its response to treatment: 1. Deficits in cognition2. Psychosis3. Negative symptoms
• Cognitive deficits are arguably the core symptoms of schizophrenia.
• Current treatment strategies target the “psychosis” cluster. The “cognitive deficit” cluster is largely untreated. New adjunctive treatment strategies targeting cognitive dysfunction in schizophrenia are being evaluated.
• Gene–environment interactions are important etiological factors in schizophrenia. Minimizing
The American Psychiatric Publishing Textbook of Neuropsychiatry and Behavioral Neurosciences, Fifth EditionEdited by Yudofsky SC, Hales RE. © 2008 American Psychiatric Publishing, Inc. All rights reserved. www.appi.org
645
environmental stressors in high-risk children and adolescents may reduce their risk of developing schizophrenia in adulthood.
CHAPTER 27
NEUROPSYCHIATRIC ASPECTS OF MOOD DISORDERS
Paul E. Holtzheimer III, M.D.Helen S. Mayberg, M.D.
The American Psychiatric Publishing Textbook of Neuropsychiatry and Behavioral Neurosciences, Fifth EditionEdited by Yudofsky SC, Hales RE. © 2008 American Psychiatric Publishing, Inc. All rights reserved. www.appi.org
646
Slide Show
Topic headings and reading list
Tables and figures
Highlights for the clinician
Main menu
(About, Contents, Contributors, Publishing facts)
Clinical FeaturesTypes of Mood DisordersMood and AffectInterest and MotivationSleepAppetitePsychomotor ActivityEmotional BiasCognition
Mood Disorders Associated With Neuropsychiatric ConditionsDifficulties in DiagnosisDepressionMania
Symptom-Specific FindingsMood and AffectInterest and MotivationSleepAppetitePsychomotor ActivityEmotional BiasCognition
A Putative Neural Network Model of Mood Disorders
Conclusion
RECOMMENDED READINGSDrevets WC: Prefrontal cortical-amygdalar metabolism in
major depression. Ann N Y Acad Sci 877:614–637, 1999
CHAPTER 27 • Topics and Readings
The American Psychiatric Publishing Textbook of Neuropsychiatry and Behavioral Neurosciences, Fifth EditionEdited by Yudofsky SC, Hales RE. © 2008 American Psychiatric Publishing, Inc. All rights reserved. www.appi.org
647
Mania
Neurobiology of Mood DisordersSyndrome-Specific Findings
Neurochemical FindingsGeneticsNeuroanatomical FindingsNeurobiology of Mood Disorders in Neuropsychiatric
Patients
major depression. Ann N Y Acad Sci 877:614–637, 1999Mayberg HS: Modulating dysfunctional limbic-cortical
circuits in depression: towards development of brain-based algorithms for diagnosis and optimised treatment. Br Med Bull 65:193–207, 2003
McDonald WM, Richard IH, DeLong MR: Prevalence, etiology, and treatment of depression in Parkinson’s disease. Biol Psychiatry 54:363–375, 2003
CHAPTER 27 • Tables and Figures
Table 27–1. Current DSM-IV-TR nosology of mood disorders
Table 27–2. Common associations with depression in neuropsychiatric patients
Table 27–3. Common associations with mania in neuropsychiatric patients
Figure 27–1. Glucose metabolic positron emission tomography scan patterns in major depression
Figure 27–2. Common glucose metabolic positron emission tomography findings in neurological and idiopathic depression
Figure 27–3. Imaging data supporting a role for Brodmann area 25 in depression
The American Psychiatric Publishing Textbook of Neuropsychiatry and Behavioral Neurosciences, Fifth EditionEdited by Yudofsky SC, Hales RE. © 2008 American Psychiatric Publishing, Inc. All rights reserved. www.appi.org
648
Figure 27–4. A proposed model of mood regulation: Different sets of brain regions are involved in different aspects of mood experience and modulation.
Summary Highlights for the Clinician
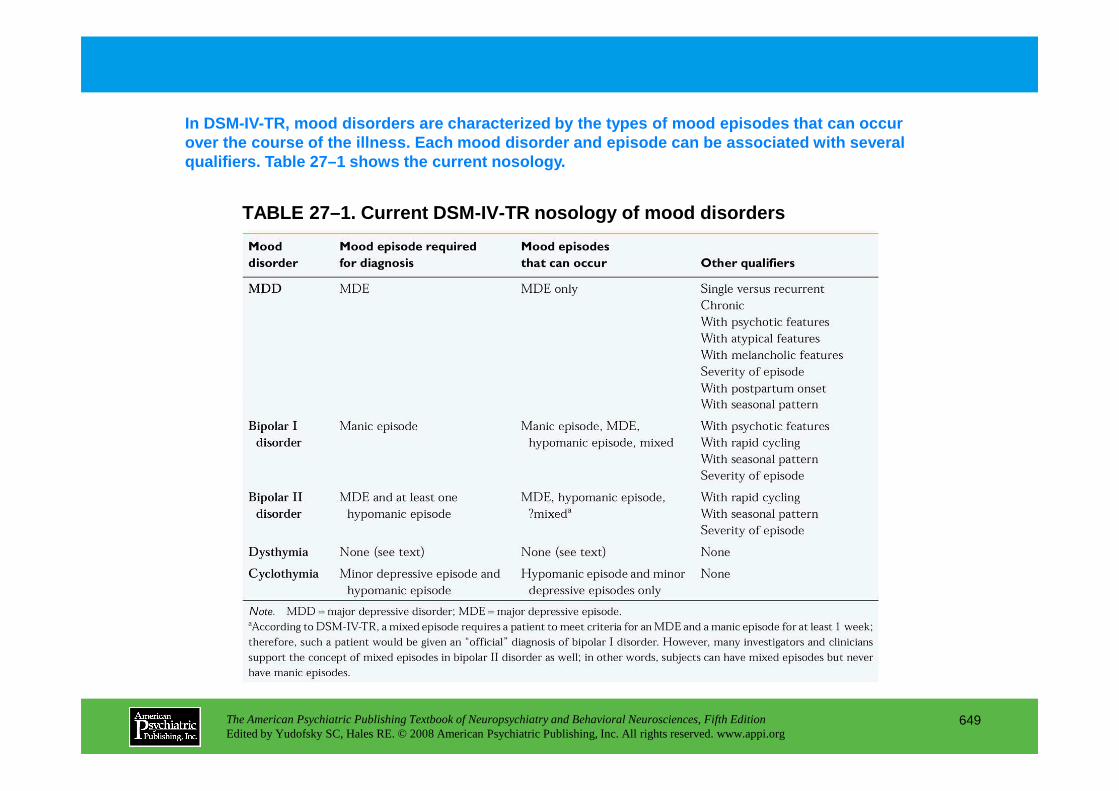
TABLE 27–1. Current DSM-IV-TR nosology of mood diso rders
In DSM-IV-TR, mood disorders are characterized by th e types of mood episodes that can occur over the course of the illness. Each mood disorder and episode can be associated with several qualifiers. Table 27–1 shows the current nosology.
The American Psychiatric Publishing Textbook of Neuropsychiatry and Behavioral Neurosciences, Fifth EditionEdited by Yudofsky SC, Hales RE. © 2008 American Psychiatric Publishing, Inc. All rights reserved. www.appi.org
649

TABLE 27–2. Common associations with depression in neuropsychiatric patients
Depression is the most common mood disorder associa ted with neuropsychiatric illness. Table 27–2 lists common associations with various neuropsych iatric illnesses and treatments. In many patients, the etiology of depression may be multifa ctorial.
The American Psychiatric Publishing Textbook of Neuropsychiatry and Behavioral Neurosciences, Fifth EditionEdited by Yudofsky SC, Hales RE. © 2008 American Psychiatric Publishing, Inc. All rights reserved. www.appi.org
650

TABLE 27–3. Common associations with mania in neuro psychiatric patients
Mania is seen less commonly than depression in neur opsychiatric patients. Mania may result from neuropathological changes related to the under lying illness, medications used to treat the illness, or an underlying bipolar disorder. Table 2 7–3 lists known associations.
The American Psychiatric Publishing Textbook of Neuropsychiatry and Behavioral Neurosciences, Fifth EditionEdited by Yudofsky SC, Hales RE. © 2008 American Psychiatric Publishing, Inc. All rights reserved. www.appi.org
651

FIGURE 27–1. Glucose metabolic positron emission to mography (PET) scan patterns in major depression.
The most common metabolic pattern in major depressi on is decreased resting blood flow in the prefrontal cortex, but a pattern of prefrontal hype ractivity has also been reported. Both patterns are shown in Figure 27–1.
The most common pattern of resting brain activity measured with functional neuroimaging in depressed patients (vs. healthy control subjects) is prefrontal hypometabolism (Pattern 1). However, this is not universal; some studies identify increased prefrontal brain activity in comparably depressed patients (Pattern 2).
The American Psychiatric Publishing Textbook of Neuropsychiatry and Behavioral Neurosciences, Fifth EditionEdited by Yudofsky SC, Hales RE. © 2008 American Psychiatric Publishing, Inc. All rights reserved. www.appi.org
652
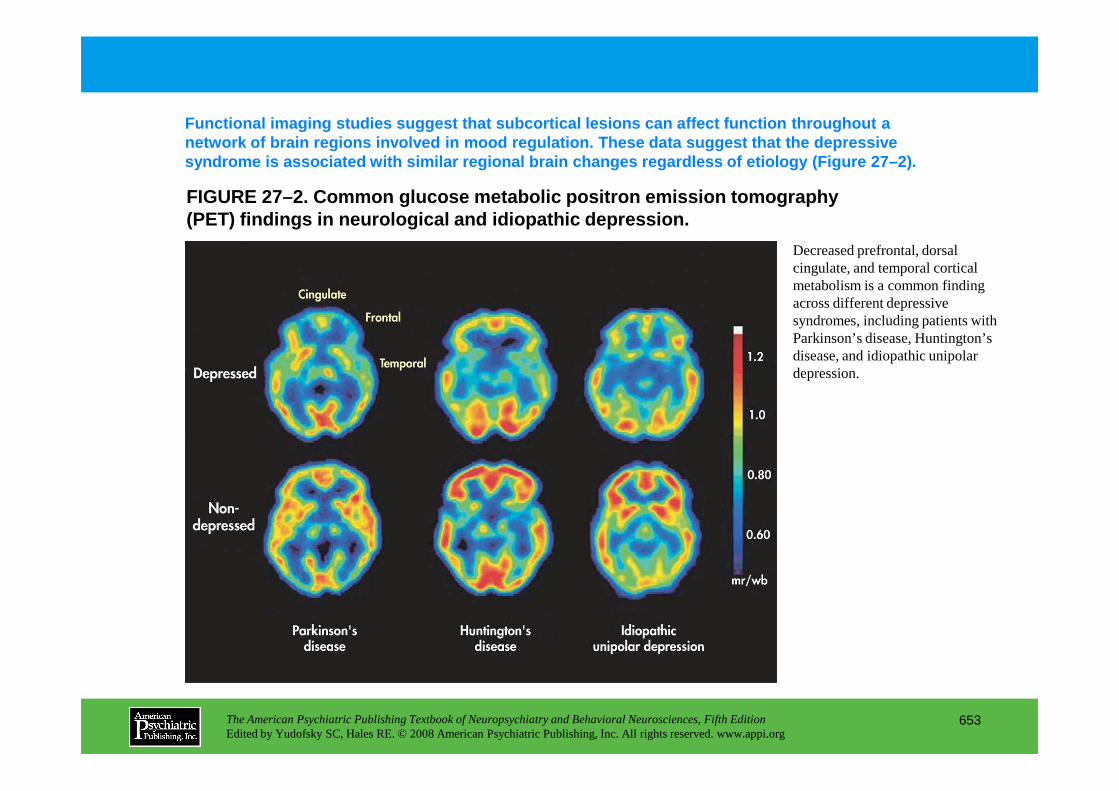
FIGURE 27–2. Common glucose metabolic positron emis sion tomography (PET) findings in neurological and idiopathic depre ssion.
Functional imaging studies suggest that subcortical lesions can affect function throughout a network of brain regions involved in mood regulatio n. These data suggest that the depressive syndrome is associated with similar regional brain changes regardless of etiology (Figure 27–2).
Decreased prefrontal, dorsal cingulate, and temporal cortical metabolism is a common finding across different depressive syndromes, including patients with Parkinson’s disease, Huntington’s disease, and idiopathic unipolar depression.
The American Psychiatric Publishing Textbook of Neuropsychiatry and Behavioral Neurosciences, Fifth EditionEdited by Yudofsky SC, Hales RE. © 2008 American Psychiatric Publishing, Inc. All rights reserved. www.appi.org
653
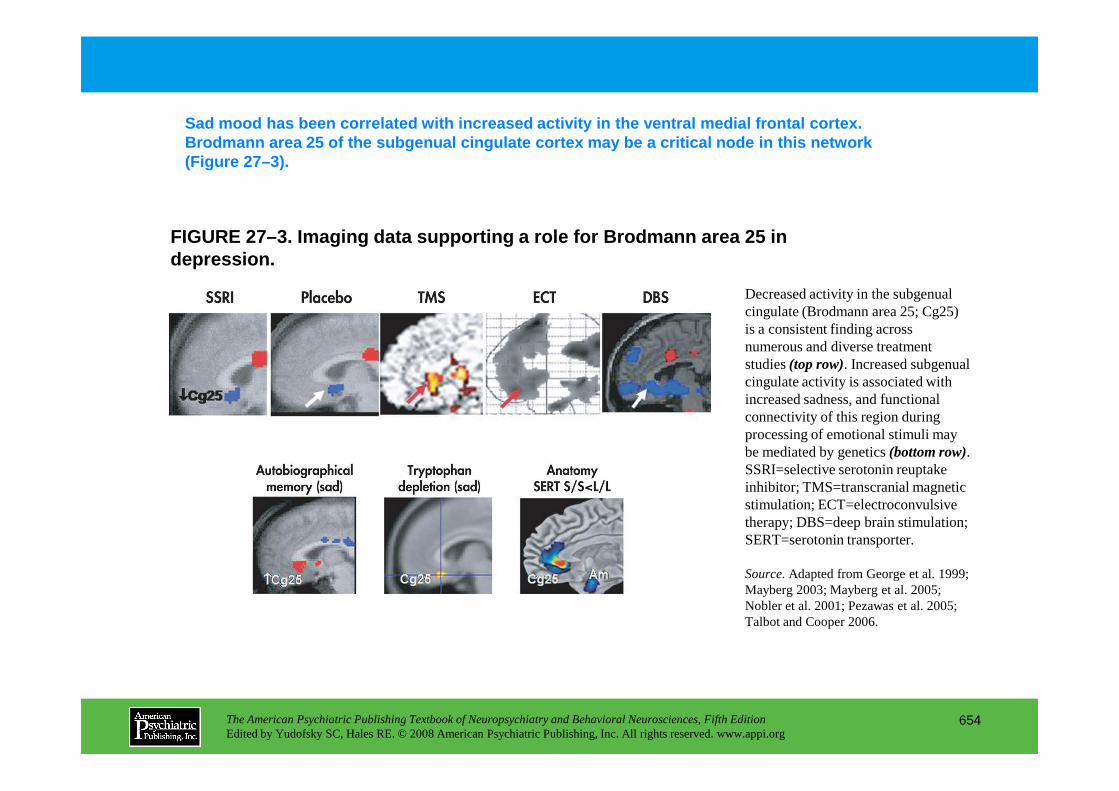
Sad mood has been correlated with increased activit y in the ventral medial frontal cortex. Brodmann area 25 of the subgenual cingulate cortex may be a critical node in this network (Figure 27–3).
FIGURE 27–3. Imaging data supporting a role for Bro dmann area 25 in depression.
Decreased activity in the subgenual cingulate (Brodmann area 25; Cg25) is a consistent finding across numerous and diverse treatment studies (top row). Increased subgenual cingulate activity is associated with increased sadness, and functional
The American Psychiatric Publishing Textbook of Neuropsychiatry and Behavioral Neurosciences, Fifth EditionEdited by Yudofsky SC, Hales RE. © 2008 American Psychiatric Publishing, Inc. All rights reserved. www.appi.org
654
increased sadness, and functional connectivity of this region during processing of emotional stimuli may be mediated by genetics (bottom row). SSRI=selective serotonin reuptake inhibitor; TMS=transcranial magnetic stimulation; ECT=electroconvulsive therapy; DBS=deep brain stimulation; SERT=serotonin transporter.
Source.Adapted from George et al. 1999; Mayberg 2003; Mayberg et al. 2005; Nobler et al. 2001; Pezawas et al. 2005; Talbot and Cooper 2006.

FIGURE 27–3 (enlarged)
The American Psychiatric Publishing Textbook of Neuropsychiatry and Behavioral Neurosciences, Fifth EditionEdited by Yudofsky SC, Hales RE. © 2008 American Psychiatric Publishing, Inc. All rights reserved. www.appi.org
655

FIGURE 27–4. A proposed model of mood regulation: D ifferent sets of brain regions are involved in different aspects of mood experience an d modulation.
One example of a neural network model for depressio n is presented in Figure 27–4. In this model, the network is potentially modulated by dysf unction (or by treatment) at “critical nodes” that produce effects elsewhere in the network .
Numerous interconnections exist among these different regions, and the system is recognized to be dynamic and potentially modulated at any critical node. Different treatments for mood disorder syndromes may act primarily at different nodes within the system, with therapeutic downstream effects.
The American Psychiatric Publishing Textbook of Neuropsychiatry and Behavioral Neurosciences, Fifth EditionEdited by Yudofsky SC, Hales RE. © 2008 American Psychiatric Publishing, Inc. All rights reserved. www.appi.org
656
PF9/46=dorsolateral prefrontal cortex; PM6=premotor area; Par40=dorsal parietal; hc=hippocampus; aCg24b=Brodmann area 24b/dorsal-perigenual anterior cingulate cortex; mCg24c=Brodmann area 24c/dorsal anterior cingulate cortex; pCg=posterior cingulate gyrus; mF9/10=medial frontal cortex; rCg24a=Brodmann area 24a/perigenual-subgenual cingulate cortex; oF11=orbitofrontal cortex; cd-vst=ventral caudate–ventral striatum; thal=thalamus; amg=amygdala; mb-sn=midbrain–subthalamic nuclei; sgCg25=Brodmann area 25/subgenual cingulate cortex; a-ins=anterior insula, hth=hypothalamus, bstem=brain stem; CBT=cognitive-behavioral therapy; DBS=deep brain stimulation of Brodmann area 25; MEDS=antidepressant medications.
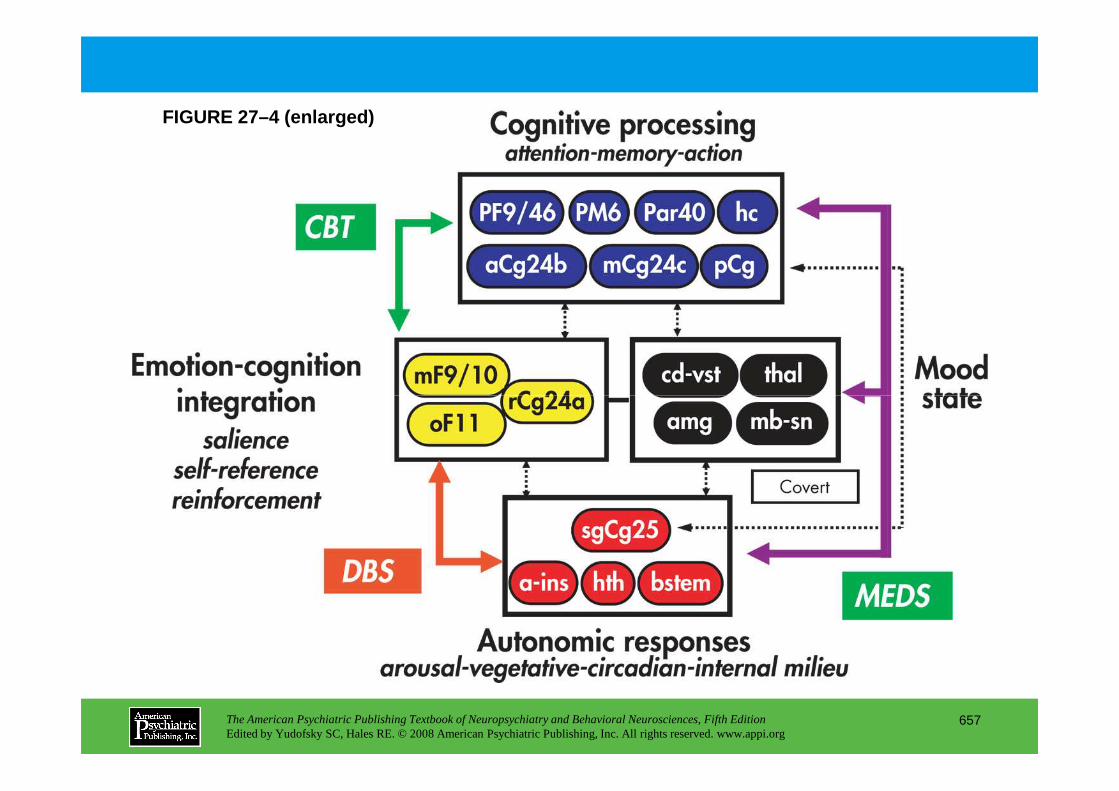
FIGURE 27–4 (enlarged)
The American Psychiatric Publishing Textbook of Neuropsychiatry and Behavioral Neurosciences, Fifth EditionEdited by Yudofsky SC, Hales RE. © 2008 American Psychiatric Publishing, Inc. All rights reserved. www.appi.org
657

Chapter 27 • Highlights for the Clinician
Symptoms of mood disorders in patients with neurological illness
Less specific symptoms
• Affect disturbance
• Apathy
• Agitation
• Decreased psychomotor speed
• Cognitive abnormalities
• Sleep disturbance
The American Psychiatric Publishing Textbook of Neuropsychiatry and Behavioral Neurosciences, Fifth EditionEdited by Yudofsky SC, Hales RE. © 2008 American Psychiatric Publishing, Inc. All rights reserved. www.appi.org
658
• Sleep disturbance
• Appetite disturbance
More specific symptoms
• Mood disturbance
• Anhedonia
• Excessive guilt
• Suicidality
CHAPTER 28
NEUROPSYCHIATRIC ASPECTS OF ANXIETY DISORDERS
Dan J. Stein, M.D., Ph.D.Scott L. Rauch, M.D.
The American Psychiatric Publishing Textbook of Neuropsychiatry and Behavioral Neurosciences, Fifth EditionEdited by Yudofsky SC, Hales RE. © 2008 American Psychiatric Publishing, Inc. All rights reserved. www.appi.org
659
Slide Show
Topic headings and reading list
Tables and figures
Highlights for the clinician
Main menu
(About, Contents, Contributors, Publishing facts)

Neurological Disorders With Anxiety Symptoms
Neuroanatomy of Anxiety DisordersGeneralized Anxiety Disorder
Neurochemical StudiesNeuroanatomical Studies
Obsessive-Compulsive DisorderNeurochemical StudiesNeuroanatomical Studies
Panic DisorderNeurochemical StudiesNeuroanatomical Studies
Posttraumatic Stress DisorderNeurochemical StudiesNeuroanatomical Studies
Social Phobia (Social Anxiety Disorder)
RECOMMENDED READINGSFurmark T, Tillfors M, Marteinsdottir I, et al: Common
changes in cerebral blood flow in patients with social phobia treated with citalopram or cognitive-behavioral therapy. Arch Gen Psychiatry 59:425–433, 2002
Gorman JM, Kent JM, Sullivan GM, et al: Neuroanatomical hypothesis of panic disorder, revised. Am J Psychiatry 157:493–505, 2000
Kitayama N, Vaccarino V, Kutner M, et al: Magnetic resonance imaging (MRI) measurement of hippocampal volume in posttraumatic stress disorder: a meta-analysis. J Affect Disord 88:79–86, 2005
Talbot PS: The molecular neuroimaging of anxiety disorders. Curr Psychiatry Rep 6:274–279, 2004
Whiteside SP, Port JD, Abramowitz JS: A meta-analysis of
CHAPTER 28 • Topics and Readings
The American Psychiatric Publishing Textbook of Neuropsychiatry and Behavioral Neurosciences, Fifth EditionEdited by Yudofsky SC, Hales RE. © 2008 American Psychiatric Publishing, Inc. All rights reserved. www.appi.org
660
Social Phobia (Social Anxiety Disorder)Neurochemical StudiesNeuroanatomical Studies
Conclusion
Whiteside SP, Port JD, Abramowitz JS: A meta-analysis of functional neuroimaging in obsessive-compulsive disorder. Psychiatry Res 132:69–79, 2004
CHAPTER 28 • Tables and Figures
Figure 28–1. Neuroanatomical model of generalized anxiety disorder
Figure 28–2. Serotonergic circuits project to key regions involved in the mediation of anxiety disorders
Figure 28–3. Neuroanatomical model of obsessive-compulsive disorder
Figure 28–4. Neuroanatomical model of panic disorder
Figure 28–5. Neuroanatomical model of posttraumatic stress disorder
Figure 28–6. Neuroanatomical model of social phobia
Summary Highlights for the Clinician
The American Psychiatric Publishing Textbook of Neuropsychiatry and Behavioral Neurosciences, Fifth EditionEdited by Yudofsky SC, Hales RE. © 2008 American Psychiatric Publishing, Inc. All rights reserved. www.appi.org
661
Highlights for the Clinician
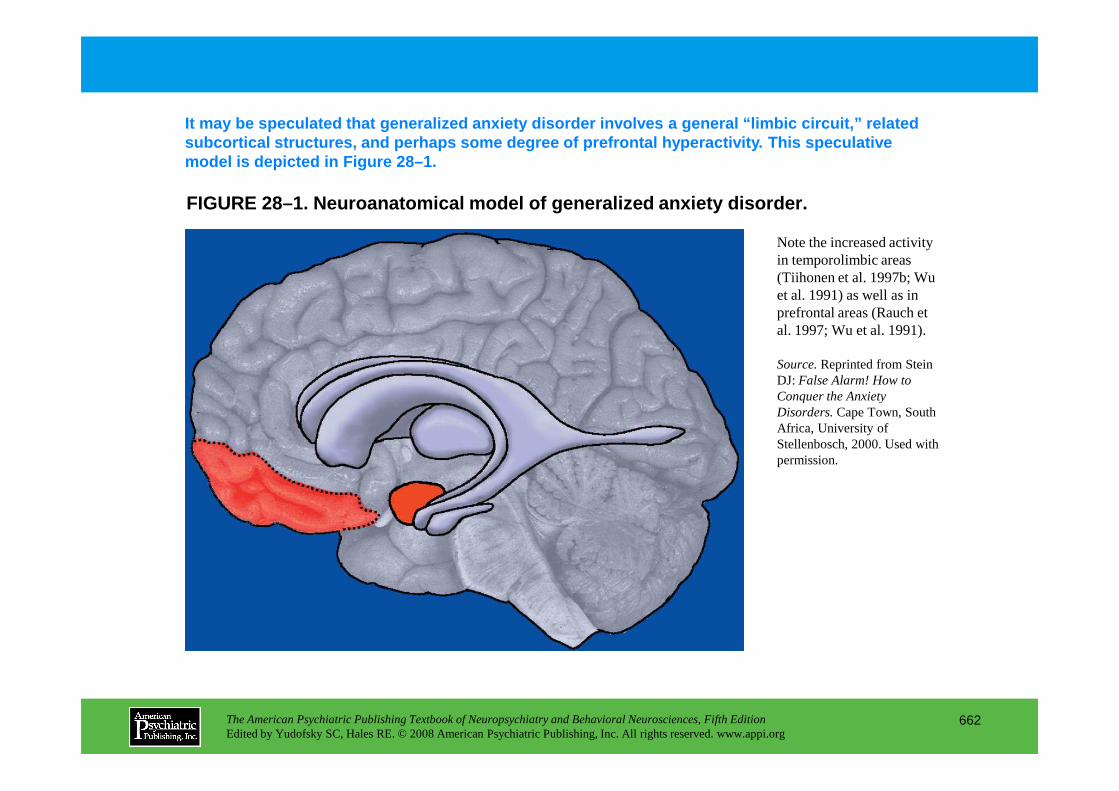
FIGURE 28–1. Neuroanatomical model of generalized a nxiety disorder.
It may be speculated that generalized anxiety disord er involves a general “limbic circuit,” related subcortical structures, and perhaps some degree of prefrontal hyperactivity. This speculative model is depicted in Figure 28–1.
Note the increased activity in temporolimbic areas (Tiihonen et al. 1997b; Wu et al. 1991) as well as in prefrontal areas (Rauch et al. 1997; Wu et al. 1991).
Source.Reprinted from Stein DJ: False Alarm! How to Conquer the Anxiety
The American Psychiatric Publishing Textbook of Neuropsychiatry and Behavioral Neurosciences, Fifth EditionEdited by Yudofsky SC, Hales RE. © 2008 American Psychiatric Publishing, Inc. All rights reserved. www.appi.org
662
Conquer the Anxiety Disorders.Cape Town, South Africa, University of Stellenbosch, 2000. Used with permission.
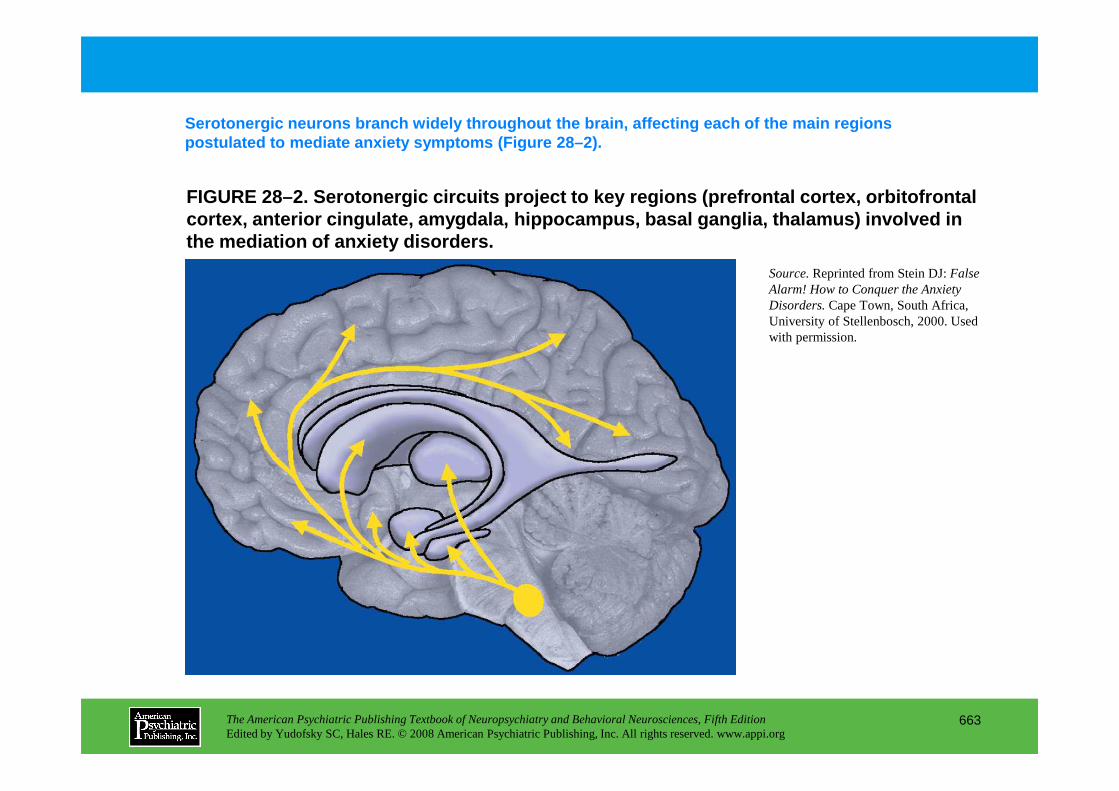
FIGURE 28–2. Serotonergic circuits project to key r egions (prefrontal cortex, orbitofrontal cortex, anterior cingulate, amygdala, hippocampus, basal ganglia, thalamus) involved in the mediation of anxiety disorders.
Serotonergic neurons branch widely throughout the b rain, affecting each of the main regions postulated to mediate anxiety symptoms (Figure 28–2 ).
Source.Reprinted from Stein DJ: False Alarm! How to Conquer the Anxiety Disorders.Cape Town, South Africa, University of Stellenbosch, 2000. Used with permission.
The American Psychiatric Publishing Textbook of Neuropsychiatry and Behavioral Neurosciences, Fifth EditionEdited by Yudofsky SC, Hales RE. © 2008 American Psychiatric Publishing, Inc. All rights reserved. www.appi.org
663
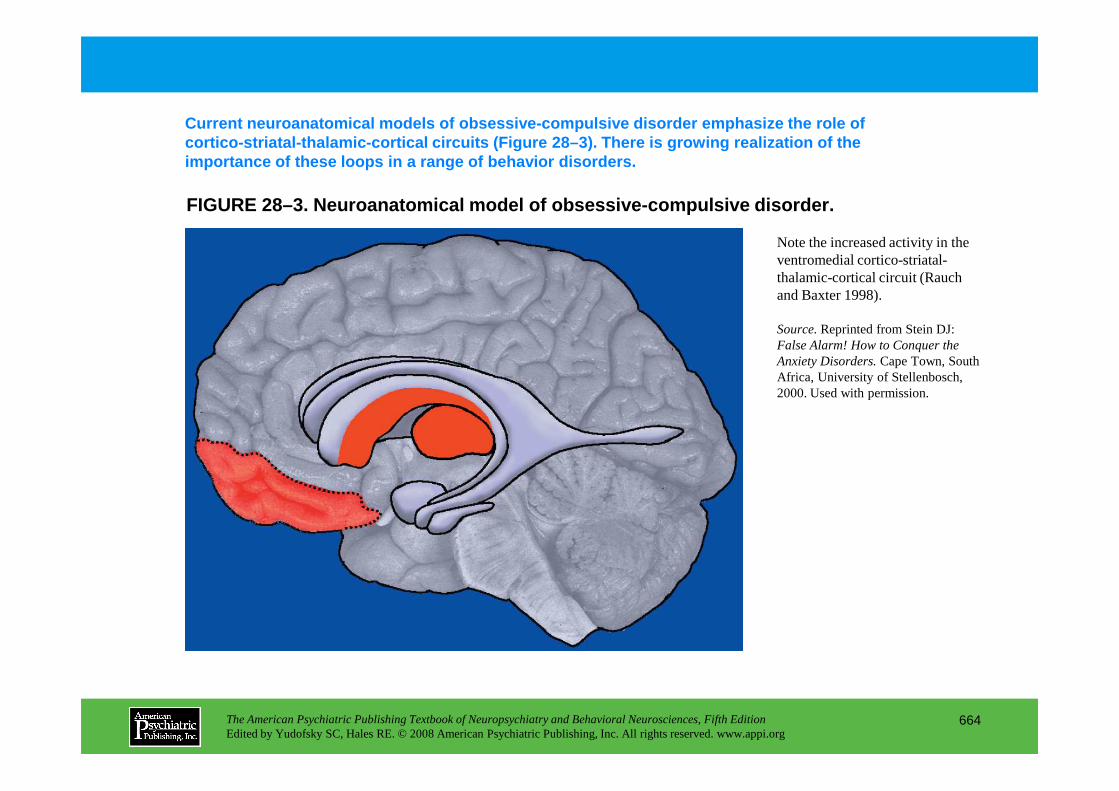
FIGURE 28–3. Neuroanatomical model of obsessive-com pulsive disorder.
Current neuroanatomical models of obsessive-compuls ive disorder emphasize the role of cortico-striatal-thalamic-cortical circuits (Figure 28–3). There is growing realization of the importance of these loops in a range of behavior di sorders.
Note the increased activity in the ventromedial cortico-striatal-thalamic-cortical circuit (Rauch and Baxter 1998).
Source.Reprinted from Stein DJ: False Alarm! How to Conquer the Anxiety Disorders.Cape Town, South Africa, University of Stellenbosch, 2000. Used with permission.
The American Psychiatric Publishing Textbook of Neuropsychiatry and Behavioral Neurosciences, Fifth EditionEdited by Yudofsky SC, Hales RE. © 2008 American Psychiatric Publishing, Inc. All rights reserved. www.appi.org
664
2000. Used with permission.

FIGURE 28–4. Neuroanatomical model of panic disorde r.
Panic disorder is a highly prevalent disorder with substantial negative effects on quality of life. In rcent years, models of panic disorder have become i ncreasingly sophisticated. A current neuroanatomical model is shown in Figure 28–4.
Note the activation of the amygdala, which has efferents to hypothalamus and brain stem sites (Gorman et al. 2000).
Source.Reprinted from Stein DJ: False Alarm! How to Conquer the Anxiety Disorders.Cape Town, South Africa, University of Stellenbosch, 2000. Used with permission.
The American Psychiatric Publishing Textbook of Neuropsychiatry and Behavioral Neurosciences, Fifth EditionEdited by Yudofsky SC, Hales RE. © 2008 American Psychiatric Publishing, Inc. All rights reserved. www.appi.org
665
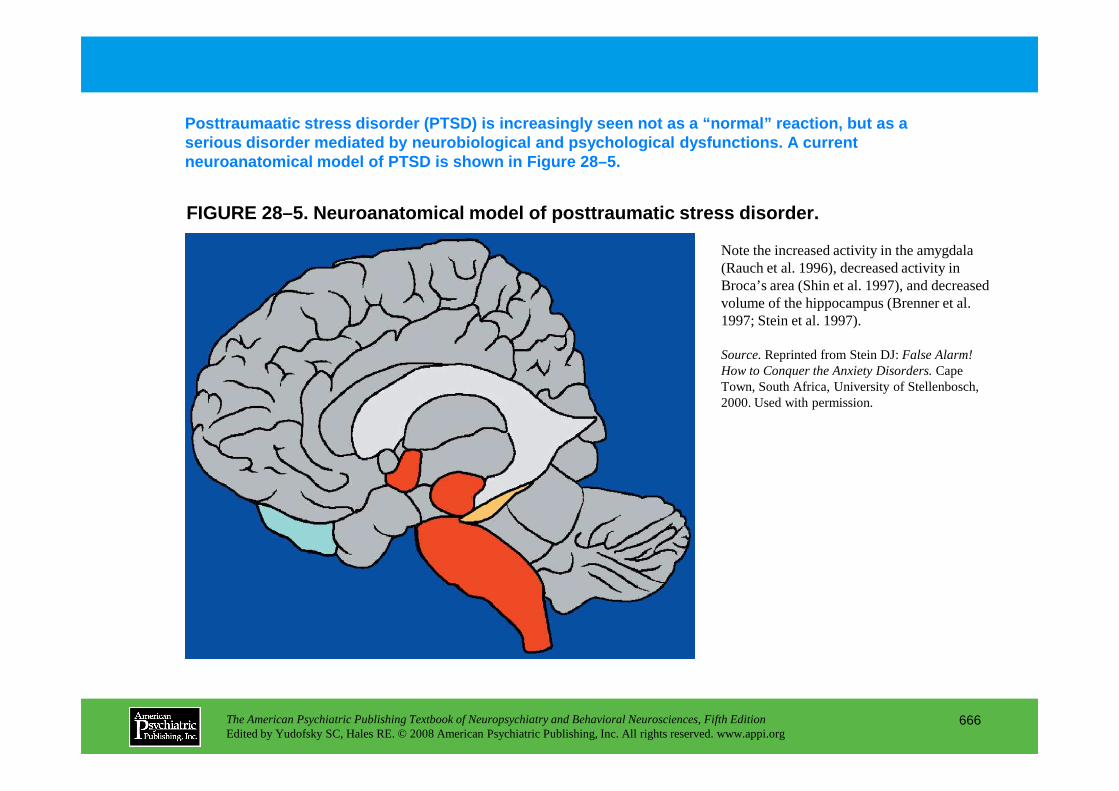
FIGURE 28–5. Neuroanatomical model of posttraumatic stress disorder.
Posttraumaatic stress disorder (PTSD) is increasing ly seen not as a “normal” reaction, but as a serious disorder mediated by neurobiological and ps ychological dysfunctions. A current neuroanatomical model of PTSD is shown in Figure 28 –5.
Note the increased activity in the amygdala (Rauch et al. 1996), decreased activity in Broca’s area (Shin et al. 1997), and decreased volume of the hippocampus (Brenner et al. 1997; Stein et al. 1997).
Source.Reprinted from Stein DJ: False Alarm! How to Conquer the Anxiety Disorders.Cape Town, South Africa, University of Stellenbosch, 2000. Used with permission.
The American Psychiatric Publishing Textbook of Neuropsychiatry and Behavioral Neurosciences, Fifth EditionEdited by Yudofsky SC, Hales RE. © 2008 American Psychiatric Publishing, Inc. All rights reserved. www.appi.org
666
2000. Used with permission.
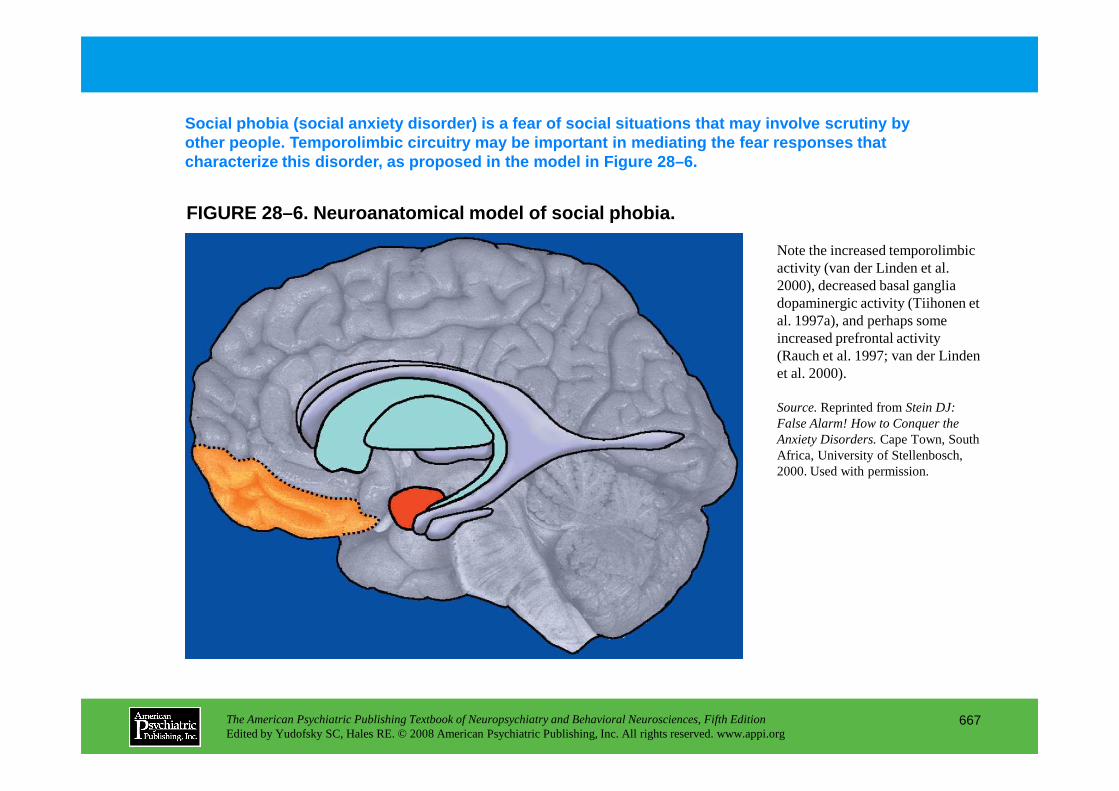
FIGURE 28–6. Neuroanatomical model of social phobia .
Social phobia (social anxiety disorder) is a fear o f social situations that may involve scrutiny by other people. Temporolimbic circuitry may be import ant in mediating the fear responses that characterize this disorder, as proposed in the model in Figure 28–6.
Note the increased temporolimbic activity (van der Linden et al. 2000), decreased basal ganglia dopaminergic activity (Tiihonen et al. 1997a), and perhaps some increased prefrontal activity (Rauch et al. 1997; van der Linden et al. 2000).
The American Psychiatric Publishing Textbook of Neuropsychiatry and Behavioral Neurosciences, Fifth EditionEdited by Yudofsky SC, Hales RE. © 2008 American Psychiatric Publishing, Inc. All rights reserved. www.appi.org
667
Source.Reprinted from Stein DJ: False Alarm! How to Conquer the Anxiety Disorders.Cape Town, South Africa, University of Stellenbosch, 2000. Used with permission.

Chapter 28 • Highlights for the Clinician
• Anxiety symptoms and disorders are common in a range of neurological conditions.
• Although the literature on treatment is limited, in some cases standard antianxiety treatments may be useful.
• The neurocircuitry of the different anxiety disorders overlaps somewhat, but certain distinctive differences are seen, consistent with differences in symptomatology.
• The neurocircuitry of obsessive-compulsive disorder differs from that of other anxiety disorders, suggesting that this condition should be assessed and treated in a unique way.
• Genetic variations may account for some of the variance in functional neuroanatomy in studies of a particular disorder.
The American Psychiatric Publishing Textbook of Neuropsychiatry and Behavioral Neurosciences, Fifth EditionEdited by Yudofsky SC, Hales RE. © 2008 American Psychiatric Publishing, Inc. All rights reserved. www.appi.org
668
studies of a particular disorder.
• Both effective pharmacotherapy and psychotherapy can normalize the functional neuroanatomy involved in mediating anxiety disorders.
CHAPTER 29
NEUROPSYCHIATRIC DISORDERS OF CHILDHOOD AND ADOLESCENCE
Martin H. Teicher, M.D., Ph.D. • Susan L. Andersen, Ph.D.Carryl P. Navalta, Ph.D. • Akemi Tomoda, M.D., Ph.D.
Ann Polcari, Ph.D., R.N. • Dennis Kim, M.D.
The American Psychiatric Publishing Textbook of Neuropsychiatry and Behavioral Neurosciences, Fifth EditionEdited by Yudofsky SC, Hales RE. © 2008 American Psychiatric Publishing, Inc. All rights reserved. www.appi.org
669
Slide Show
Topic headings and reading list
Tables and figures
Highlights for the clinician
Main menu
(About, Contents, Contributors, Publishing facts)

Brain DevelopmentDevelopment of Lateralization and Hemispheric
AsymmetrySensitive and Critical Periods
Disorders of Excessive Motor Activity, Movement, Impulse, and Thought
Attention-Deficit/Hyperactivity DisorderCharacteristic FeaturesClinical CourseEtiology and PathophysiologyPathophysiological Models of ADHDTreatment
Tourette Syndrome and Other Tic DisordersCharacteristic Features
Autism and Pervasive Developmental DisordersAutism
Characteristic FeaturesEtiology and PathophysiologyTreatment
Rett’s DisorderAsperger’s Disorder
Specific Disorders of LearningCharacteristic FeaturesEtiology and PathophysiologyTreatment
Seizure DisordersClassification and Features
Generalized Seizures
CHAPTER 29 • Topics and Readings
The American Psychiatric Publishing Textbook of Neuropsychiatry and Behavioral Neurosciences, Fifth EditionEdited by Yudofsky SC, Hales RE. © 2008 American Psychiatric Publishing, Inc. All rights reserved. www.appi.org
670
Characteristic FeaturesEtiology and PathophysiologyTreatment
Mental RetardationDown Syndrome
Etiology and PathophysiologyFragile X Syndrome
Etiology and PathophysiologyX-Linked Mental Retardation
Etiology and PathophysiologySubtelomere Deletion (Telomeric Defect)
Etiology and PathophysiologyPrader-Willi Syndrome and Angelman’s Syndrome
Etiology and Pathophysiology
Generalized SeizuresPartial SeizuresPseudoseizures
Psychiatric Consequences of EpilepsyTreatment
Trauma, Infections, and StressTraumatic Brain InjuryPediatric Autoimmune Neuropsychiatric DisordersNeuropsychiatric Consequences of Childhood Abuse
(continued)

CHAPTER 29 • Topics and Readings (continued)
RECOMMENDED READINGSAmerican Psychiatric Association: Diagnostic and
Statistical Manual of Mental Disorders, 4th Edition, Text Revision. Washington, DC, American Psychiatric Association, 2000
Biederman J, Monuteaux MC, Mick E, et al: Psychopathology in females with attention-deficit/hyperactivity disorder: a controlled, five-year prospective study. Biol Psychiatry 60:1098–1105, 2006
Blume WT: Lennox-Gastaut syndrome: potential mechanisms of cognitive regression. Ment Retard Dev Disabil Res Rev 10:150–153, 2004
Campbell M, Schopler E, Cueva JE, et al: Treatment of autistic disorder. J Am Acad Child Adolesc Psychiatry 35:134–143, 1996
Metz-Lutz MN, Kleitz C, de Saint Martin A, et al: Cognitive development in benign focal epilepsies of childhood. Dev Neurosci 21:182–190, 1999
Michaud LJ, Duhaime AC, Batshaw ML: Traumatic brain injury in children. Pediatr Clin North Am 40:553–565, 1993
Opitz JM: Vision and insight in the search for gene mutations causing nonsyndromal mental deficiency. Neurology 55:328–330, 2000
Seltzer MM, Shattuck P, Abbeduto L, et al: Trajectory of development in adolescents and adults with autism. Ment Retard Dev Disabil Res Rev 10:234–247, 2004
Snider LA, Swedo SE: PANDAS: current status and directions for research. Mol Psychiatry 9:900–907,
The American Psychiatric Publishing Textbook of Neuropsychiatry and Behavioral Neurosciences, Fifth EditionEdited by Yudofsky SC, Hales RE. © 2008 American Psychiatric Publishing, Inc. All rights reserved. www.appi.org
671
35:134–143, 1996Deckersbach T, Rauch S, Buhlmann U, et al: Habit reversal
versus supportive psychotherapy in Tourette’s disorder: a randomized controlled trial and predictors of treatment response. Behav Res Ther 44:1079–1090, 2006
Dunn DW, Austin JK: Behavioral issues in pediatric epilepsy. Neurology 53 (5 suppl 2):S96–S100, 1999
Kinsella G, Ong B, Murtagh D, et al: The role of the family for behavioral outcome in children and adolescents following traumatic brain injury. J Consult Clin Psychol 67:116–123, 1999
Lovaas OI, Smith T: A comprehensive behavioral theory of autistic children: paradigm for research and treatment. J Behav Ther Exp Psychiatry 20:17–29, 1989
directions for research. Mol Psychiatry 9:900–907, 2004
Spencer T, Biederman J, Wilens T: Attention-deficit/hyperactivity disorder and comorbidity. Pediatr Clin North Am 46:915–927, 1999
Teicher MH, Andersen SL, Hostetter JC Jr: Evidence for dopamine receptor pruning between adolescence and adulthood in striatum but not nucleus accumbens. Brain Res Dev Brain Res 89:167–172, 1995
Teicher MH, Samson JA, Polcari A, et al: Sticks, stones, and hurtful words: relative effects of various forms of childhood maltreatment. Am J Psychiatry 163:993–1000, 2006

CHAPTER 29 • Tables and Figures
Figure 29–1. Major overlapping stages of human brain development and approximate temporal sequence
Figure 29–2. Overproduction and pruning of dopamine D1 and D2 receptors in human corpus striatum during childhood and adolescence
Figure 29–3. Simplified neural circuit diagram indicating the interconnections between brain regions and neurotransmitter systems involved in the regulation of activity and attention
Summary Highlights for the Clinician
The American Psychiatric Publishing Textbook of Neuropsychiatry and Behavioral Neurosciences, Fifth EditionEdited by Yudofsky SC, Hales RE. © 2008 American Psychiatric Publishing, Inc. All rights reserved. www.appi.org
672

FIGURE 29–1. Major overlapping stages of human brai n development and approximate temporal sequence.
The brain develops through a series of overlapping stages, which are illustrated in Figure 29–1. The first and most critical stage is neuronal mitos is.
The American Psychiatric Publishing Textbook of Neuropsychiatry and Behavioral Neurosciences, Fifth EditionEdited by Yudofsky SC, Hales RE. © 2008 American Psychiatric Publishing, Inc. All rights reserved. www.appi.org
673
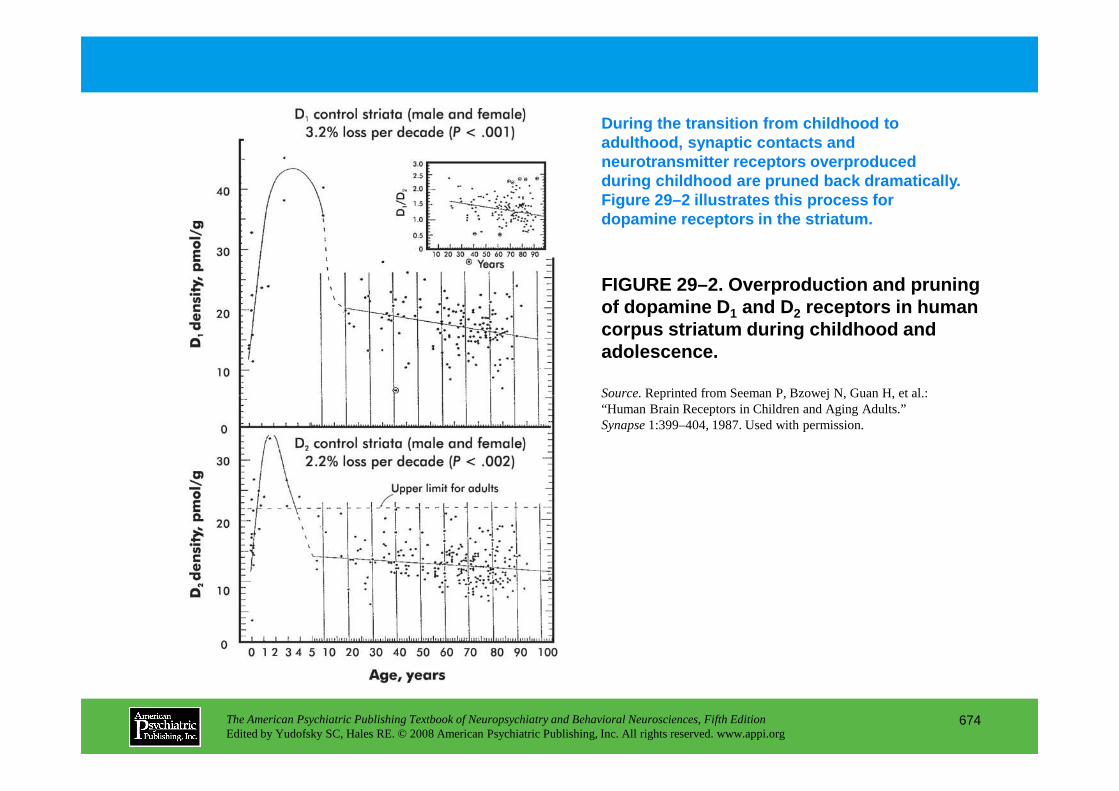
FIGURE 29–2. Overproduction and pruning of dopamine D 1 and D2 receptors in human corpus striatum during childhood and adolescence.
During the transition from childhood to adulthood, synaptic contacts and neurotransmitter receptors overproduced during childhood are pruned back dramatically. Figure 29–2 illustrates this process for dopamine receptors in the striatum.
Source.Reprinted from Seeman P, Bzowej N, Guan H, et al.:
The American Psychiatric Publishing Textbook of Neuropsychiatry and Behavioral Neurosciences, Fifth EditionEdited by Yudofsky SC, Hales RE. © 2008 American Psychiatric Publishing, Inc. All rights reserved. www.appi.org
674
Source.Reprinted from Seeman P, Bzowej N, Guan H, et al.: “Human Brain Receptors in Children and Aging Adults.” Synapse 1:399–404, 1987. Used with permission.
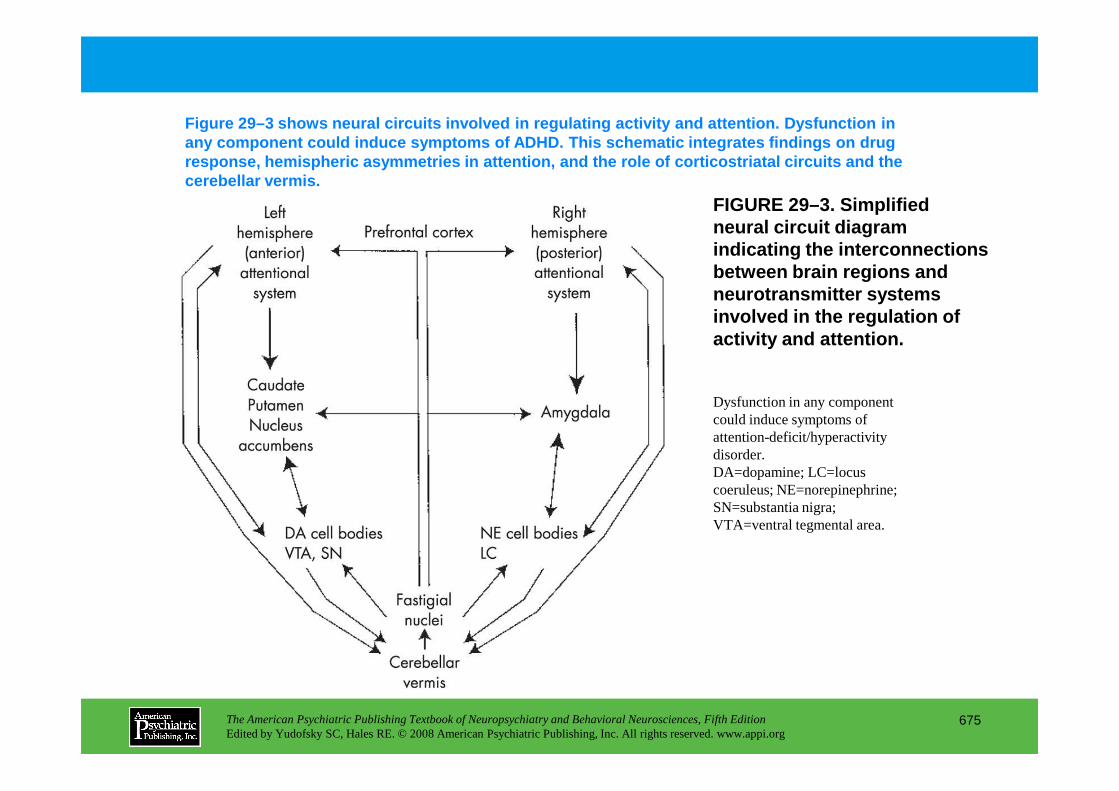
FIGURE 29–3. Simplified neural circuit diagram indicating the interconnections between brain regions and neurotransmitter systems involved in the regulation of activity and attention.
Figure 29–3 shows neural circuits involved in regul ating activity and attention. Dysfunction in any component could induce symptoms of ADHD. This s chematic integrates findings on drug response, hemispheric asymmetries in attention, and the role of corticostriatal circuits and the cerebellar vermis.
Dysfunction in any component
The American Psychiatric Publishing Textbook of Neuropsychiatry and Behavioral Neurosciences, Fifth EditionEdited by Yudofsky SC, Hales RE. © 2008 American Psychiatric Publishing, Inc. All rights reserved. www.appi.org
675
Dysfunction in any component could induce symptoms of attention-deficit/hyperactivity disorder. DA=dopamine; LC=locus coeruleus; NE=norepinephrine; SN=substantia nigra; VTA=ventral tegmental area.
Chapter 29 • Highlights for the Clinician
Synaptic pruning and brain development• Axons, dendrites, synapses, and receptors in many brain regions are overproduced during childhood
and scaled back (“pruned”) during the transition from puberty to adulthood.• In synaptic pruning, high synaptic density, facilitating acquisition of new knowledge and skills, may
be partially traded for a lower-density system designed for rapid analysis and enhanced performance through utilization of established connections (Teicher et al. 1995). This may represent an important developmental stage.
• Overproduction and pruning of dopamine receptors (which occurs to a greater extent in males than females) may account for the waxing and waning of symptom severity in attention-deficit/ hyperactivity disorder and Tourette syndrome.
Sensitive and critical periods for brain development• Brain development is sculpted by experience, but timing is crucial.
The American Psychiatric Publishing Textbook of Neuropsychiatry and Behavioral Neurosciences, Fifth EditionEdited by Yudofsky SC, Hales RE. © 2008 American Psychiatric Publishing, Inc. All rights reserved. www.appi.org
676
• Brain development is sculpted by experience, but timing is crucial.• Specific stages exist in which experience may maximally affect development (sensitive period) must
be present (critical period) for the formation of appropriate connections. • Environmental enrichment during sensitive periods may provide a means of altering brain
development to compensate for deficiencies.
Attention-deficit/hyperactivity disorder (ADHD)• ADHD is characterized by age-inappropriate problems with attention, impulse control, and
hyperactivity. • ADHD commonly occurs in conjunction with conduct disorder, learning disorders, and mood
disorders (Biederman et al. 2006; Spencer et al. 1999). • ADHD is highly heritable, but no single gene has been found to have more than a
modest influence. (continued)
• The major brain regions affected by ADHD include prefrontal and orbital cortex, striatum (caudate and putamen), and cerebellar vermis.
• Primary medication treatment options for ADHD include psychostimulants and atomoxetine. • Stimulants are still the mainstay of treatment but can be combined with behavioral treatment when
parenting issues arise or when co-occurring disorders are present.
Tics and Tourette's syndrome• Tics are stereotyped, brief, repetitive, purposeless, nonrhythmic motor and vocal responses.• Tics can be simple or complex, and they can be chronic or transient.• Simple motor tics include jerking movements, shrugging, and eye blinking. Simple vocal tics include
grunting, sniffing, and throat clearing.• More complex motor tics involve grimacing, banging, or temper tantrums.
The American Psychiatric Publishing Textbook of Neuropsychiatry and Behavioral Neurosciences, Fifth EditionEdited by Yudofsky SC, Hales RE. © 2008 American Psychiatric Publishing, Inc. All rights reserved. www.appi.org
677
• More complex motor tics involve grimacing, banging, or temper tantrums. • Tourette syndrome (TS) is diagnosed when both chronic motor and vocal tics are present.• The modal age at onset of TS is 6–7 years. Tic symptoms are generally most severe during the period
preceding puberty and gradually improve thereafter, except in the most severe cases. • Although TS is clearly a brain-based disorder, the condition can be exacerbated by stress and anxiety
and can be a severely stigmatizing illness. • The basal ganglia and related thalamocortical circuitry have been implicated in the underlying
pathophysiology of TS.• Primary medication treatment options for tics include typical and atypical neuroleptics.• Habit reversal therapy can help control the frequency of tics, and both this type of behavior therapy
and supportive psychotherapy can improve quality of life (Deckersbach et al. 2006).
(continued)

Mental retardation• Mental retardation is diagnosed when an individual <18 years of age presents with an IQ score of
<70 and concurrent deficits in adaptive functioning (American Psychiatric Association 2000).• Individuals with only mild deficits make up the vast majority of all cases (90%).• Hundreds of genetic syndromes are known to be associated with mental retardation (Opitz 2000).
The major ones are Down syndrome, fragile X syndrome, various forms of X-linked mental retardation, subtelomeric defects, Prader-Willi syndrome, and Angelman’s syndrome.
• Available treatments include special education for children and adolescents, residential services for adults, and newer atypical antipsychotics (e.g., risperidone) for severe behavior problems.
Autism and pervasive developmental disorders• Autism is characterized by severe disturbances in social recognition and interaction, impaired
communication, and a restricted, stereotypic behavioral repertoire and range of interests.
The American Psychiatric Publishing Textbook of Neuropsychiatry and Behavioral Neurosciences, Fifth EditionEdited by Yudofsky SC, Hales RE. © 2008 American Psychiatric Publishing, Inc. All rights reserved. www.appi.org
678
communication, and a restricted, stereotypic behavioral repertoire and range of interests.• Other pervasive developmental disorders share these characteristics, including Rett’s disorder,
childhood disintegrative disorder, Asperger’s disorder, and pervasive developmental disorder not otherwise specified
• Stereotypies, which can involve the flicking, twirling, or spinning of objects, or hand flapping, whirling, and posturing, may diminish with maturation.
• Restricted and repetitive behaviors, as well as impaired communication and social deficits, continue into adulthood (Seltzer et al. 2004).
• Premature cessation of development in the cerebellum, cerebrum, and limbic system may be the neuroanatomic process by which autism results.
• Pharmacotherapy for autism has had mixed results, but appearance of target symptoms such as hyperactivity, irritability, depression, and obsessive-compulsive behaviors may warrant a therapeutic trial (Campbell et al. 1996). (continued)
• Primary medication treatment options include neuroleptics, atypical antipsychotics, and antidepressants.
• Nonpharmacological treatments include extremely intensive behavioral treatment initiated during preschool, designed to increase skills in the areas of attention, emotionality, language, toy play, peer interaction, and self-help while reducing tantrums, aggression, and self-stimulation (Lovaas and Smith 1989).
• Long-term interventions focus on community-based special educational programs and subsequent residential services for those who cannot be cared for at home.
Learning disorders• Learning disorders are specific deficits in the acquisition and performance of the academic skills of
reading, writing, or arithmetic skills in the presence of normal intelligence and aptitude.
The American Psychiatric Publishing Textbook of Neuropsychiatry and Behavioral Neurosciences, Fifth EditionEdited by Yudofsky SC, Hales RE. © 2008 American Psychiatric Publishing, Inc. All rights reserved. www.appi.org
679
reading, writing, or arithmetic skills in the presence of normal intelligence and aptitude. • Heritability across learning disorders is quite high (e.g., 91% concordance rate for monozygotic
twins with a reading disorder). • Imaging studies reveal evidence for diminished anatomical and functional lateralization in reading
disorders.• Mandated special education, provided in the least restrictive environment, is the current treatment
for children with learning disorders. • Empirically based interventions that target certain aspects of speech (e.g., phonology) have shown
promise in remediating reading and language deficits. • No evidence supports the efficacy of medications, diet alterations, or vitamin supplementation to
treat learning disorders.
(continued)
Seizure disorders• Seizures are classified according to whether the initial locus of activity is bilateral and subcortical
(generalized seizures) or unilateral and cortical (partial seizures).• The primary types of generalized seizures are tonic-clonic, absence, myoclonic, and infantile
spasms.• The major types of partial seizures are simple seizures, complex partial seizures, and partial seizures
secondarily generalized.• Seizure etiologies can be divided into genetic and acquired brain lesions. The latter may be focal,
multifocal, or diffuse.• Specific epilepsy syndromes with a predominantly genetic basis (e.g., Lennox-Gastaut syndrome)
can emerge in infancy or childhood (Blume 2004).• An association exists between childhood epilepsy and behavioral, academic, and cognitive problems
The American Psychiatric Publishing Textbook of Neuropsychiatry and Behavioral Neurosciences, Fifth EditionEdited by Yudofsky SC, Hales RE. © 2008 American Psychiatric Publishing, Inc. All rights reserved. www.appi.org
680
• An association exists between childhood epilepsy and behavioral, academic, and cognitive problems (Dunn and Austin 1999; Metz-Lutz et al. 1999).
• Emotional disorders (i.e., depression and anxiety) as well as suicidality can be co-occurring conditions with epilepsy.
• Anticonvulsants can modify the balance between neuronal excitation and inhibition via their influence on cerebral transmitter systems and/or ion channel activities.
• Newer adjunctive agents can potentiate anticonvulsant efficacy with little increase in side effects.
Traumatic brain injury• The leading cause of disability in children between birth and 19 years of age is injury.• Traumatic brain injury affects intelligence, fine motor skills, sensorimotor function, problem-solving
ability, memory, adaptive function, attention, and language processing (Michaud et al. 1993a). • By 3 months after injury, some psychiatric sequelae become apparent.
(continued)
• Posttraumatic psychiatric disorders include organic personality syndrome, mood disorders, anxiety disorders, disruptive behavior disorders, adjustment disorder, and substance use disorders.
• Psychosocial intervention and family support can be helpful during the first 2 years after injury (Kinsella et al. 1999).
Pediatric autoimmune neuropsychiatric disorders (PANDAS)• In this recently described clinical syndrome, obsessive-compulsive disorder or tic disorders emerge
in the context of group A β-hemolytic streptococcal infection (Snider and Swedo 2004).• Plasma exchange therapy and intravenous immuglobulin treatment have produced mixed results. • Antibiotic prophylaxis using azithromycin and penicillin have produced some promising results
(Snider et al. 2005).
Trauma, brain development, and psychiatric disorders
The American Psychiatric Publishing Textbook of Neuropsychiatry and Behavioral Neurosciences, Fifth EditionEdited by Yudofsky SC, Hales RE. © 2008 American Psychiatric Publishing, Inc. All rights reserved. www.appi.org
681
Trauma, brain development, and psychiatric disorders• Physical, sexual, or emotional traumatization during childhood can contribute to the development of
a spectrum of psychiatric disorders (Teicher et al. 2006b).• Such disorders include dissociative identity disorder, psychosis, borderline personality disorder,
depression, bipolar disorder, and posttraumatic stress disorder. • Converging evidence from imaging, electrophysiological, neuropsychological, and preclinical
studies indicates that early traumatic stress detrimentally affects the development of the cerebral cortex, corpus callosum, and limbic system.
• These effects may depend, in part, on the age or developmental stage when the insult occurred as well as genetic factors.

CHAPTER 30
INTRACELLULAR AND INTERCELLULARPRINCIPLES OF PHARMACOTHERAPYFOR NEUROPSYCHIATRIC DISORDERS
W. Dale Horst, Ph.D.Michael J. Burke, M.D., Ph.D.
The American Psychiatric Publishing Textbook of Neuropsychiatry and Behavioral Neurosciences, Fifth EditionEdited by Yudofsky SC, Hales RE. © 2008 American Psychiatric Publishing, Inc. All rights reserved. www.appi.org
682
Slide Show
Topic headings and reading list
Tables and figures
Highlights for the clinician
Main menu
(About, Contents, Contributors, Publishing facts)

Historical Perspectives
NeurobiologyGliaNeurons
SynapseChemical Transmission
Neurotransmitter synthesisNeurotransmitter storage and releaseNeurotransmitter inactivationReceptorsG proteinsSecond messengers
Other Modulators of Neuronal FunctionNitric oxideCarbon monoxide
Psychotropic Drug DevelopmentAdvances in Molecular PharmacologyNeuroreceptor Pharmacology
Antipsychotic PharmacodynamicsAtypical antipsychotic drugs
Merits of Psychotropic Drug SelectivityNovel Targets for Pharmacotherapy
Substance P and NeuropeptidesGlutamate Transmission and NMDA Receptors
Glutamate in schizophreniaIntracellular Messenger Systems
Conclusion
RECOMMENDED READING
CHAPTER 30 • Topics and Readings
The American Psychiatric Publishing Textbook of Neuropsychiatry and Behavioral Neurosciences, Fifth EditionEdited by Yudofsky SC, Hales RE. © 2008 American Psychiatric Publishing, Inc. All rights reserved. www.appi.org
683
Carbon monoxideRECOMMENDED READINGCharney DS, Nestler EJ: Neurobiology of Mental Illness, 2nd
Edition. New York, Oxford University Press, 2004

CHAPTER 30 • Tables and Figures
Figure 30–1. The role of glia (astrocytes) in accumulating, metabolizing, and conserving synaptic GABA and glutamate
Table 30–1. Membrane elements of mammalian glia
Table 30–2. Elements required for chemical transmission
Figure 30–2. Typical presynaptic neuron with key structures relevant to neurotransmission
Figure 30–3. Typical postsynaptic neuron with key structures relevant to neurotransmission
Figure 30–4. A typical neurotransmitter transporter protein
Figure 30–5. A typical G protein–coupled neurotransmitter receptor
Table 30–3. Some major types of neurotransmitters
The American Psychiatric Publishing Textbook of Neuropsychiatry and Behavioral Neurosciences, Fifth EditionEdited by Yudofsky SC, Hales RE. © 2008 American Psychiatric Publishing, Inc. All rights reserved. www.appi.org
684
Figure 30–6. Regulatory cycle of G protein signal coupling
Table 30–4. Classes of proteins that are targets for phosphorylation by protein kinases
Figure 30–7. Regulation and actions of the second messenger adenylate cyclase
Figure 30–8. Intraneuronal actions of phospholipase C activity
Table 30–5. Characteristics of the subtypes of nitric oxide synthase
Figure 30–9. Biochemical events related to the synthesis and biological effects of nitric oxide occur in both neurons and glial cells
Table 30–6. Receptor binding affinity for selected antipsychotic drugs
Summary Highlights for the Clinician

FIGURE 30–1. The role of glia (astrocytes) in accumulating, metabolizing, and conserving synaptic γγγγ-aminobutyric acid (GABA) and glutamate.
An important example of the interaction of glia wit h neurons, involving the regulation of GABA and glutamate concentrations, is shown in Figure 30 –1.
Specific membrane transporters move GABA and glutamate into glia cells, where GABA is
The American Psychiatric Publishing Textbook of Neuropsychiatry and Behavioral Neurosciences, Fifth EditionEdited by Yudofsky SC, Hales RE. © 2008 American Psychiatric Publishing, Inc. All rights reserved. www.appi.org
685
glia cells, where GABA is carboxylated (combined with CO2) to form glutamate; glutamate is in turn aminated (combined with NH4) to create glutamine. Glutamine is then transported out of the glia and is available to GABAergic and glutamatergic presynaptic neurons for conversion to their respective neurotransmitters. Through these mechanisms, glia play an important role in maintaining synaptic concentrations below neurotoxic levels and salvage two ubiquitous and important neurotransmitters.
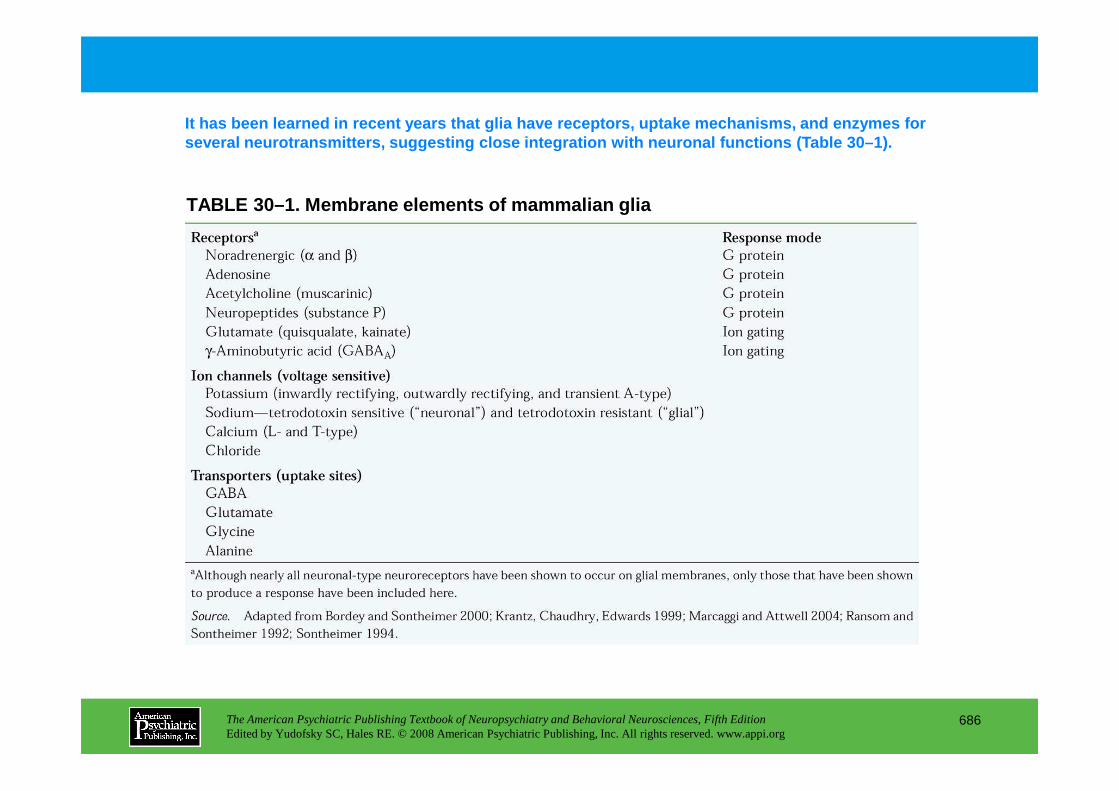
TABLE 30–1. Membrane elements of mammalian glia
It has been learned in recent years that glia have receptors, uptake mechanisms, and enzymes for several neurotransmitters, suggesting close integra tion with neuronal functions (Table 30–1).
The American Psychiatric Publishing Textbook of Neuropsychiatry and Behavioral Neurosciences, Fifth EditionEdited by Yudofsky SC, Hales RE. © 2008 American Psychiatric Publishing, Inc. All rights reserved. www.appi.org
686
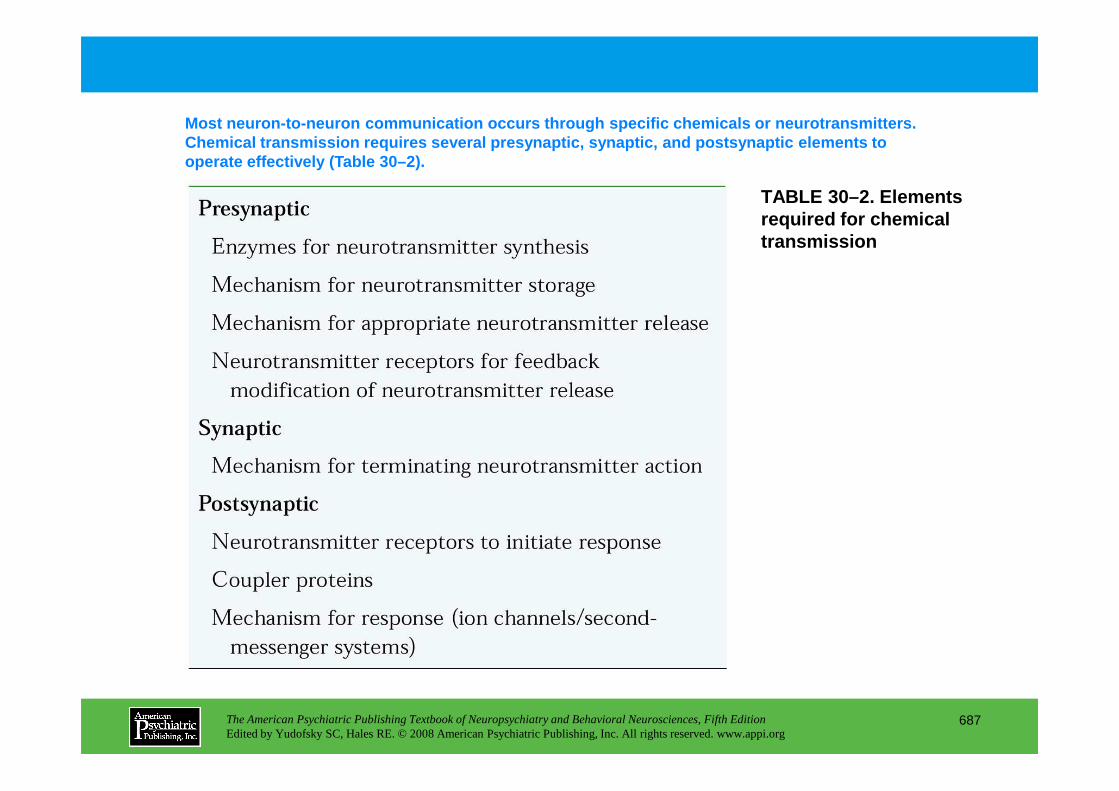
TABLE 30–2. Elements required for chemical transmission
Most neuron-to-neuron communication occurs through specific chemicals or neurotransmitters. Chemical transmission requires several presynaptic, synaptic, and postsynaptic elements to operate effectively (Table 30–2).
The American Psychiatric Publishing Textbook of Neuropsychiatry and Behavioral Neurosciences, Fifth EditionEdited by Yudofsky SC, Hales RE. © 2008 American Psychiatric Publishing, Inc. All rights reserved. www.appi.org
687

Figure 30–2 shows the functional relation of the el ements of neurotransmission for a typical presynaptic neuron.
FIGURE 30–2. Typical presynaptic neuron with key st ructures relevant to neurotransmission.
Microtubules transport storage vesicles, enzymes, and a variety of proteins from the neuronal soma, where they are synthesized, to the nerve ending, where they are required for carrying out their physiological functions. Storage vesicles maintain stores of neurotransmitter molecules for eventual release into the synaptic cleft. Mitochondria contain enzymes vital to providing energy to the neuron; in many cases (such as the biogenic amines) they contain enzymes, such as monoamine oxidase, which help to regulate neurotransmitter levels in the nerve ending. Calcium and a variety of special fusion proteins fuse the storage vesicle membranes with the neuronal membrane to release the neurotransmitter into the synaptic cleft. Transporter pumps are proteins incorporated into the neuronal membrane that transport the neurotransmitter from the synapse into the neuron, where it can be reincorporated back into the storage vesicle. Autoreceptors respond to neurotransmitter released from the nerve ending to provide feedback regulation of presynaptic depolarization.
The American Psychiatric Publishing Textbook of Neuropsychiatry and Behavioral Neurosciences, Fifth EditionEdited by Yudofsky SC, Hales RE. © 2008 American Psychiatric Publishing, Inc. All rights reserved. www.appi.org
688
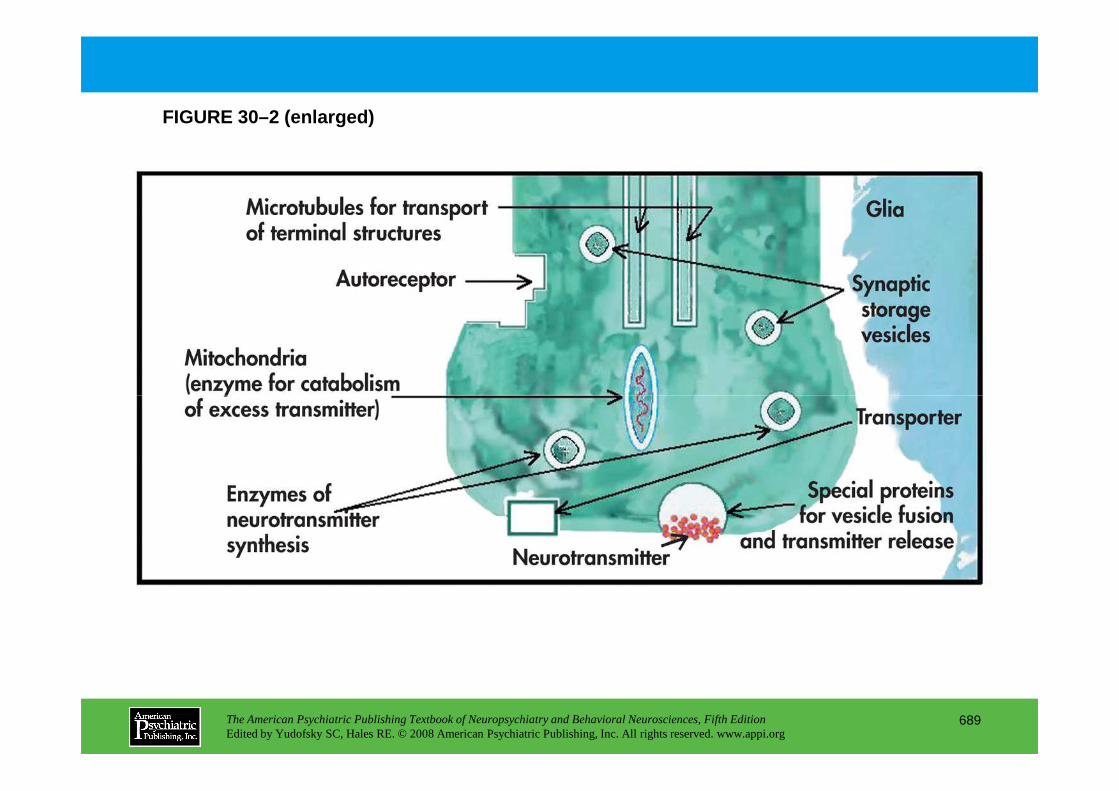
FIGURE 30–2 (enlarged)
The American Psychiatric Publishing Textbook of Neuropsychiatry and Behavioral Neurosciences, Fifth EditionEdited by Yudofsky SC, Hales RE. © 2008 American Psychiatric Publishing, Inc. All rights reserved. www.appi.org
689
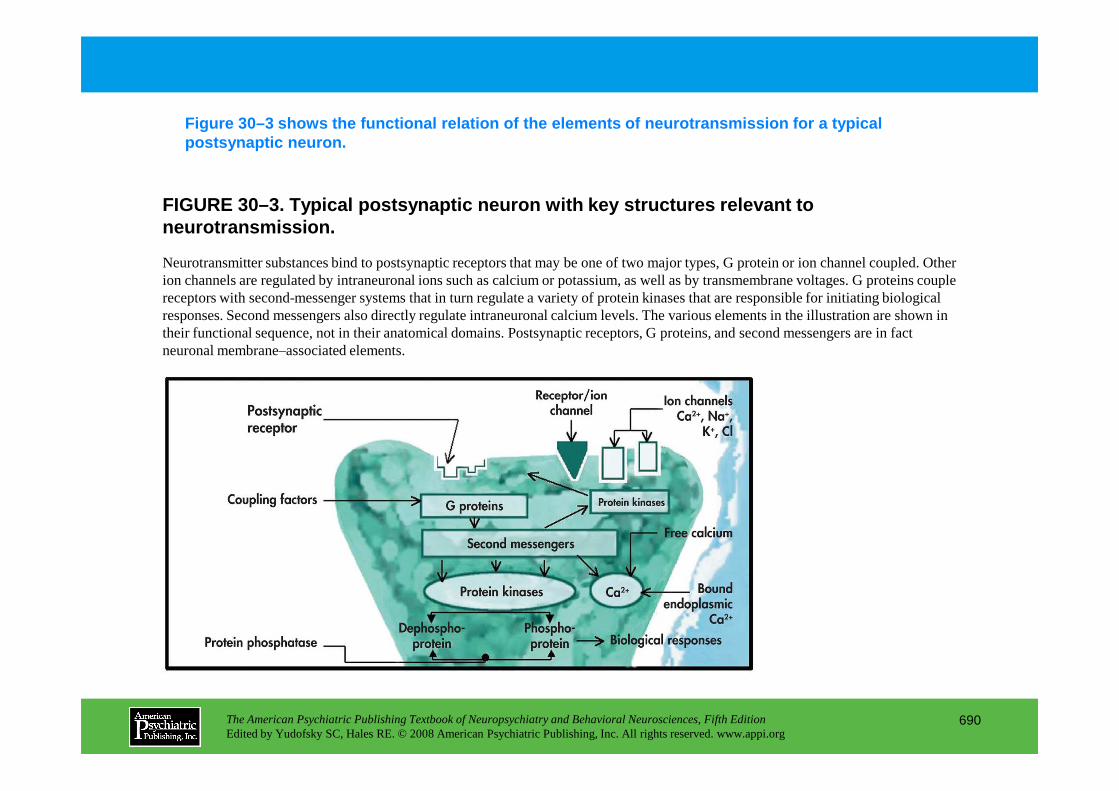
FIGURE 30–3. Typical postsynaptic neuron with key s tructures relevant to neurotransmission.
Figure 30–3 shows the functional relation of the el ements of neurotransmission for a typical postsynaptic neuron.
Neurotransmitter substances bind to postsynaptic receptors that may be one of two major types, G protein or ion channel coupled. Other ion channels are regulated by intraneuronal ions such as calcium or potassium, as well as by transmembrane voltages. G proteins couple receptors with second-messenger systems that in turn regulate a variety of protein kinases that are responsible for initiating biological responses. Second messengers also directly regulate intraneuronal calcium levels. The various elements in the illustration are shown in their functional sequence, not in their anatomical domains. Postsynaptic receptors, G proteins, and second messengers are in fact neuronal membrane–associated elements.
The American Psychiatric Publishing Textbook of Neuropsychiatry and Behavioral Neurosciences, Fifth EditionEdited by Yudofsky SC, Hales RE. © 2008 American Psychiatric Publishing, Inc. All rights reserved. www.appi.org
690

FIGURE 30–3 (enlarged)
The American Psychiatric Publishing Textbook of Neuropsychiatry and Behavioral Neurosciences, Fifth EditionEdited by Yudofsky SC, Hales RE. © 2008 American Psychiatric Publishing, Inc. All rights reserved. www.appi.org
691
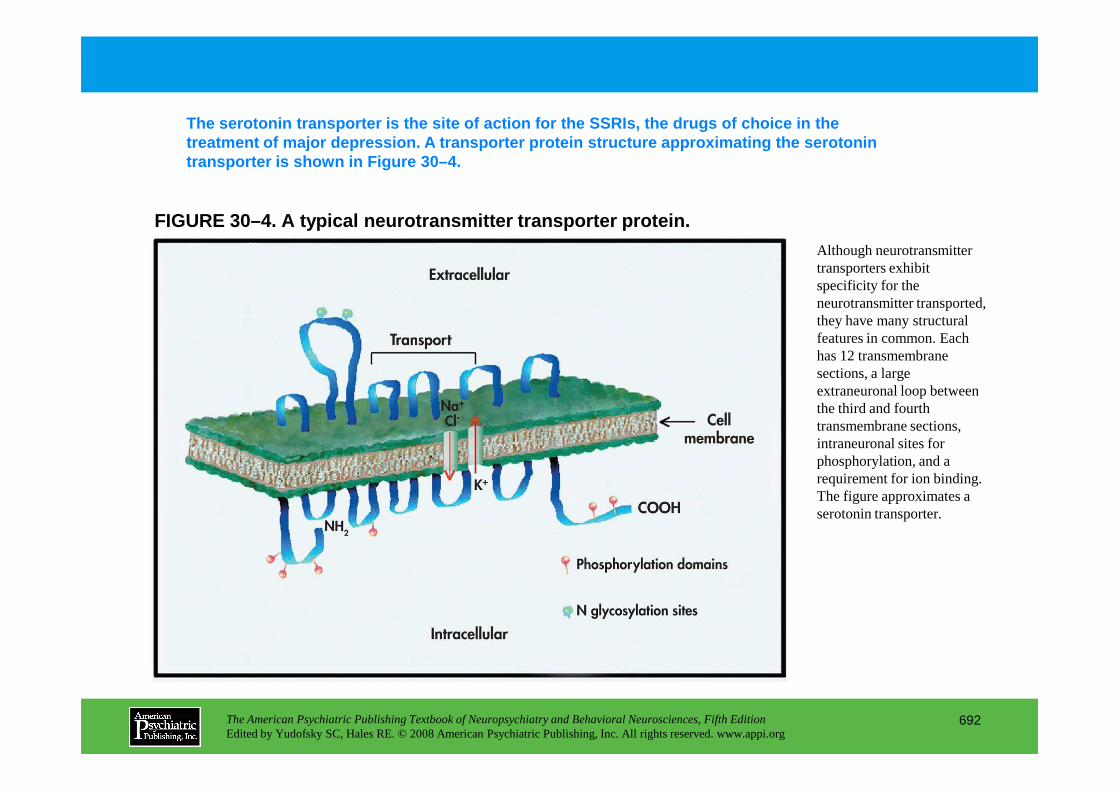
FIGURE 30–4. A typical neurotransmitter transporter protein.
The serotonin transporter is the site of action for the SSRIs, the drugs of choice in the treatment of major depression. A transporter protei n structure approximating the serotonin transporter is shown in Figure 30–4.
Although neurotransmitter transporters exhibit specificity for the neurotransmitter transported, they have many structural features in common. Each has 12 transmembrane sections, a large extraneuronal loop between
The American Psychiatric Publishing Textbook of Neuropsychiatry and Behavioral Neurosciences, Fifth EditionEdited by Yudofsky SC, Hales RE. © 2008 American Psychiatric Publishing, Inc. All rights reserved. www.appi.org
692
extraneuronal loop between the third and fourth transmembrane sections, intraneuronal sites for phosphorylation, and a requirement for ion binding. The figure approximates a serotonin transporter.
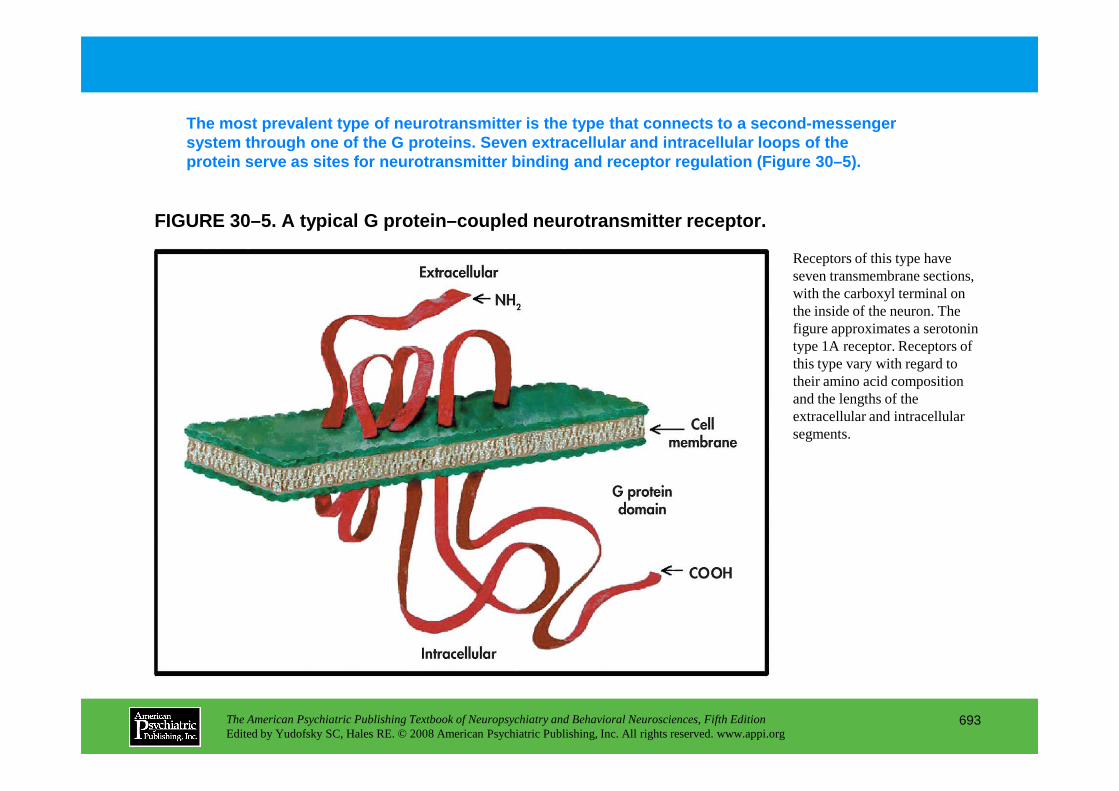
FIGURE 30–5. A typical G protein–coupled neurotrans mitter receptor.
The most prevalent type of neurotransmitter is the type that connects to a second-messenger system through one of the G proteins. Seven extrace llular and intracellular loops of the protein serve as sites for neurotransmitter binding and receptor regulation (Figure 30–5).
Receptors of this type have seven transmembrane sections, with the carboxyl terminal on the inside of the neuron. The figure approximates a serotonin type 1A receptor. Receptors of this type vary with regard to their amino acid composition and the lengths of the
The American Psychiatric Publishing Textbook of Neuropsychiatry and Behavioral Neurosciences, Fifth EditionEdited by Yudofsky SC, Hales RE. © 2008 American Psychiatric Publishing, Inc. All rights reserved. www.appi.org
693
and the lengths of the extracellular and intracellular segments.

TABLE 30–3. Some major types of neurotransmitters
Table 30–3 lists some of the major types of neurotr ansmitters. The abundance of receptor subtypes is important pharmacologically, in that compounds c an be identified for a specific receptor subtype, thus limiting the pharmacological effects.
The American Psychiatric Publishing Textbook of Neuropsychiatry and Behavioral Neurosciences, Fifth EditionEdited by Yudofsky SC, Hales RE. © 2008 American Psychiatric Publishing, Inc. All rights reserved. www.appi.org
694
(continued)

TABLE 30–3. (continued)
The American Psychiatric Publishing Textbook of Neuropsychiatry and Behavioral Neurosciences, Fifth EditionEdited by Yudofsky SC, Hales RE. © 2008 American Psychiatric Publishing, Inc. All rights reserved. www.appi.org
695
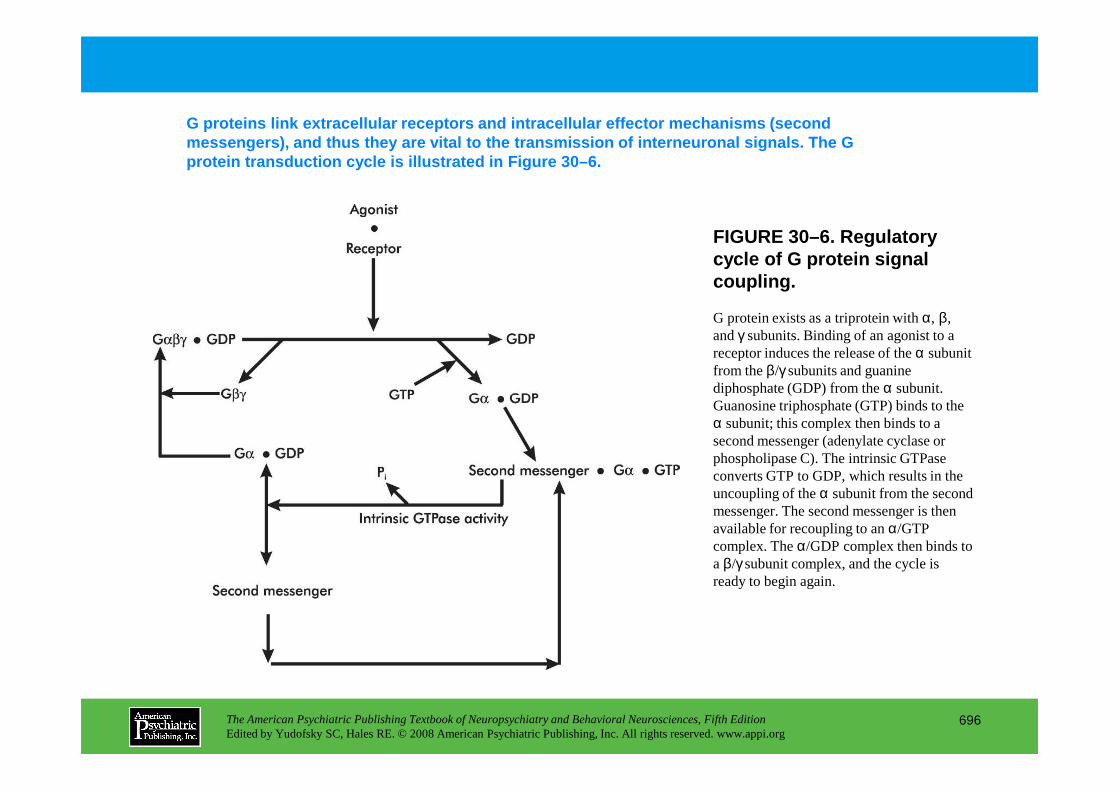
FIGURE 30–6. Regulatory cycle of G protein signal coupling.
G proteins link extracellular receptors and intrace llular effector mechanisms (second messengers), and thus they are vital to the transmi ssion of interneuronal signals. The G protein transduction cycle is illustrated in Figure 30–6.
G protein exists as a triprotein with α, β, and γ subunits. Binding of an agonist to a receptor induces the release of the α subunit from the β/γ subunits and guanine diphosphate (GDP) from the α subunit.
The American Psychiatric Publishing Textbook of Neuropsychiatry and Behavioral Neurosciences, Fifth EditionEdited by Yudofsky SC, Hales RE. © 2008 American Psychiatric Publishing, Inc. All rights reserved. www.appi.org
696
diphosphate (GDP) from the α subunit. Guanosine triphosphate (GTP) binds to the α subunit; this complex then binds to a second messenger (adenylate cyclase or phospholipase C). The intrinsic GTPase converts GTP to GDP, which results in the uncoupling of the α subunit from the second messenger. The second messenger is then available for recoupling to an α/GTP complex. The α/GDP complex then binds to a β/γ subunit complex, and the cycle is ready to begin again.
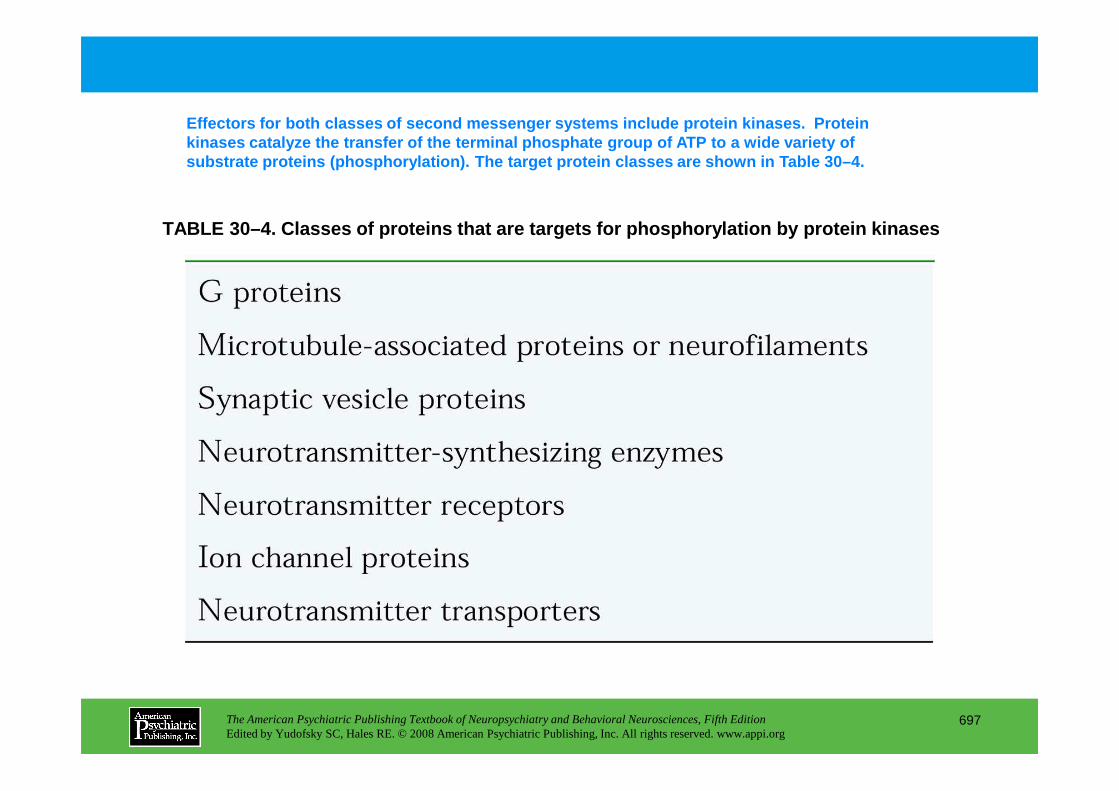
TABLE 30–4. Classes of proteins that are targets fo r phosphorylation by protein kinases
Effectors for both classes of second messenger syst ems include protein kinases. Protein kinases catalyze the transfer of the terminal phosph ate group of ATP to a wide variety of substrate proteins (phosphorylation). The target pr otein classes are shown in Table 30–4.
The American Psychiatric Publishing Textbook of Neuropsychiatry and Behavioral Neurosciences, Fifth EditionEdited by Yudofsky SC, Hales RE. © 2008 American Psychiatric Publishing, Inc. All rights reserved. www.appi.org
697
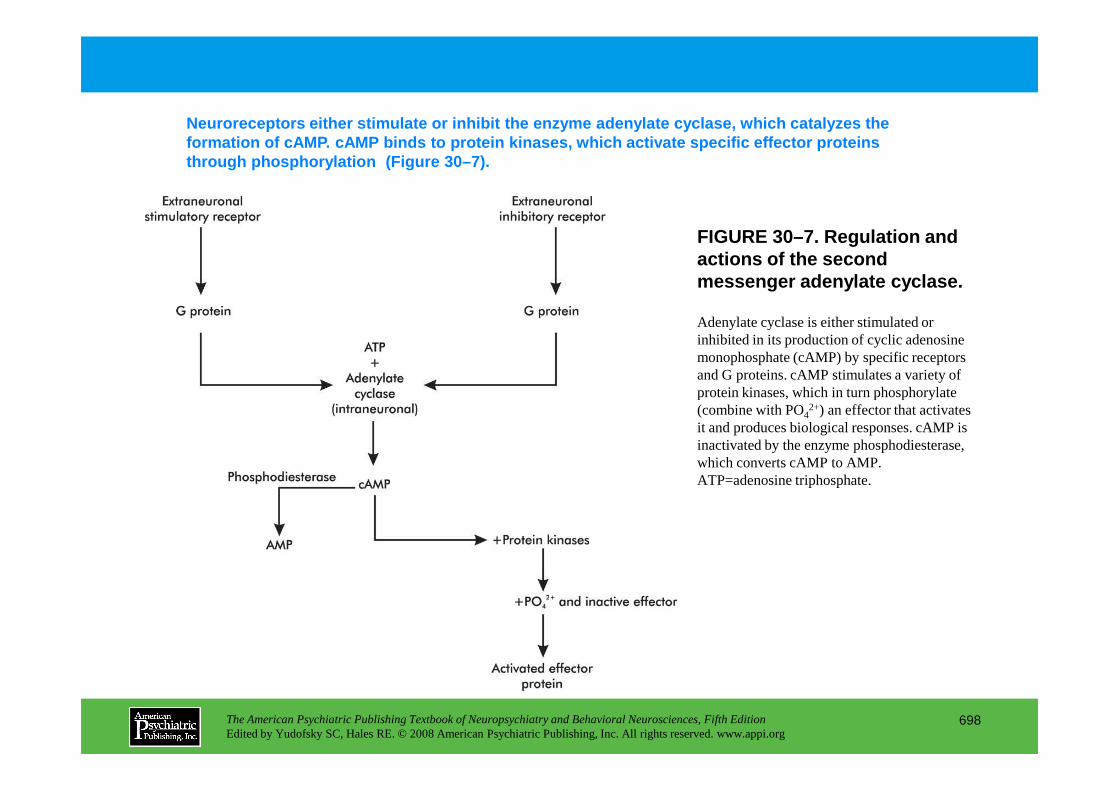
FIGURE 30–7. Regulation and actions of the second messenger adenylate cyclase.
Neuroreceptors either stimulate or inhibit the enzym e adenylate cyclase, which catalyzes the formation of cAMP. cAMP binds to protein kinases, w hich activate specific effector proteins through phosphorylation (Figure 30–7).
Adenylate cyclase is either stimulated or inhibited in its production of cyclic adenosine monophosphate (cAMP) by specific receptors and G proteins. cAMP stimulates a variety of protein kinases, which in turn phosphorylate
The American Psychiatric Publishing Textbook of Neuropsychiatry and Behavioral Neurosciences, Fifth EditionEdited by Yudofsky SC, Hales RE. © 2008 American Psychiatric Publishing, Inc. All rights reserved. www.appi.org
698
protein kinases, which in turn phosphorylate (combine with PO42+) an effector that activates it and produces biological responses. cAMP is inactivated by the enzyme phosphodiesterase, which converts cAMP to AMP. ATP=adenosine triphosphate.
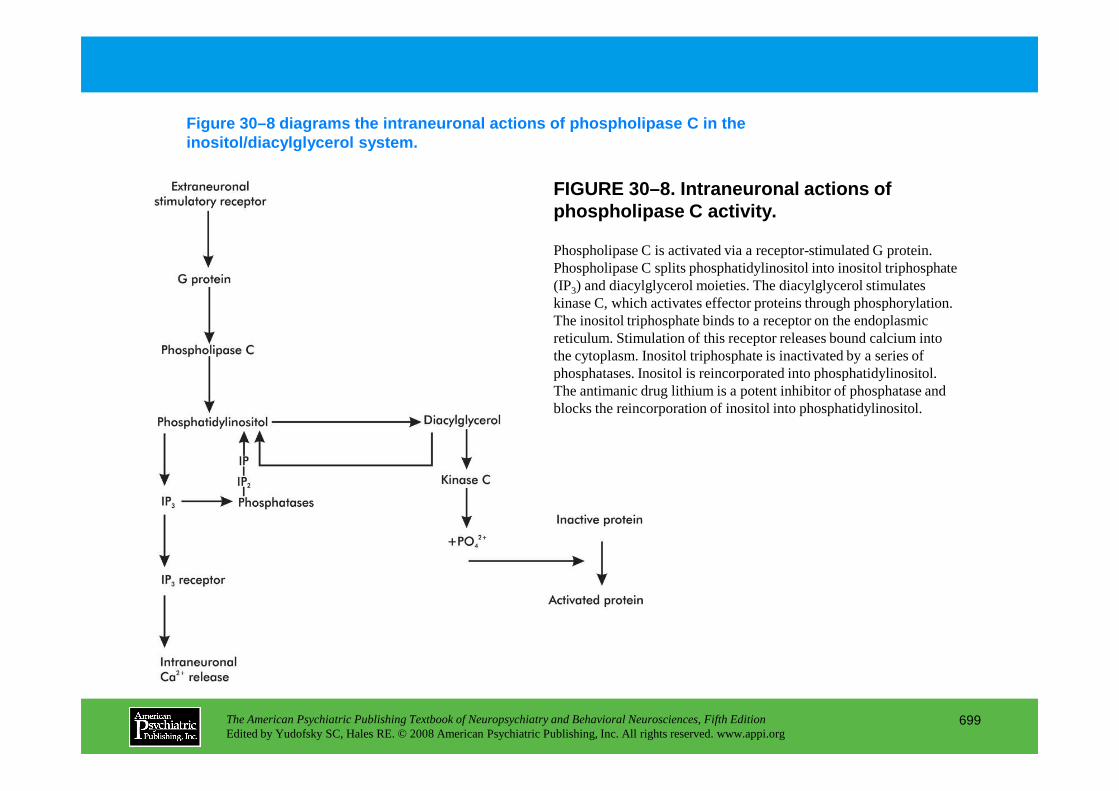
FIGURE 30–8. Intraneuronal actions of phospholipase C activity.
Figure 30–8 diagrams the intraneuronal actions of p hospholipase C in the inositol/diacylglycerol system.
Phospholipase C is activated via a receptor-stimulated G protein. Phospholipase C splits phosphatidylinositol into inositol triphosphate (IP3) and diacylglycerol moieties. The diacylglycerol stimulates kinase C, which activates effector proteins through phosphorylation. The inositol triphosphate binds to a receptor on the endoplasmic reticulum. Stimulation of this receptor releases bound calcium into the cytoplasm. Inositol triphosphate is inactivated by a series of phosphatases. Inositol is reincorporated into phosphatidylinositol. The antimanic drug lithium is a potent inhibitor of phosphatase and
The American Psychiatric Publishing Textbook of Neuropsychiatry and Behavioral Neurosciences, Fifth EditionEdited by Yudofsky SC, Hales RE. © 2008 American Psychiatric Publishing, Inc. All rights reserved. www.appi.org
699
The antimanic drug lithium is a potent inhibitor of phosphatase and blocks the reincorporation of inositol into phosphatidylinositol.
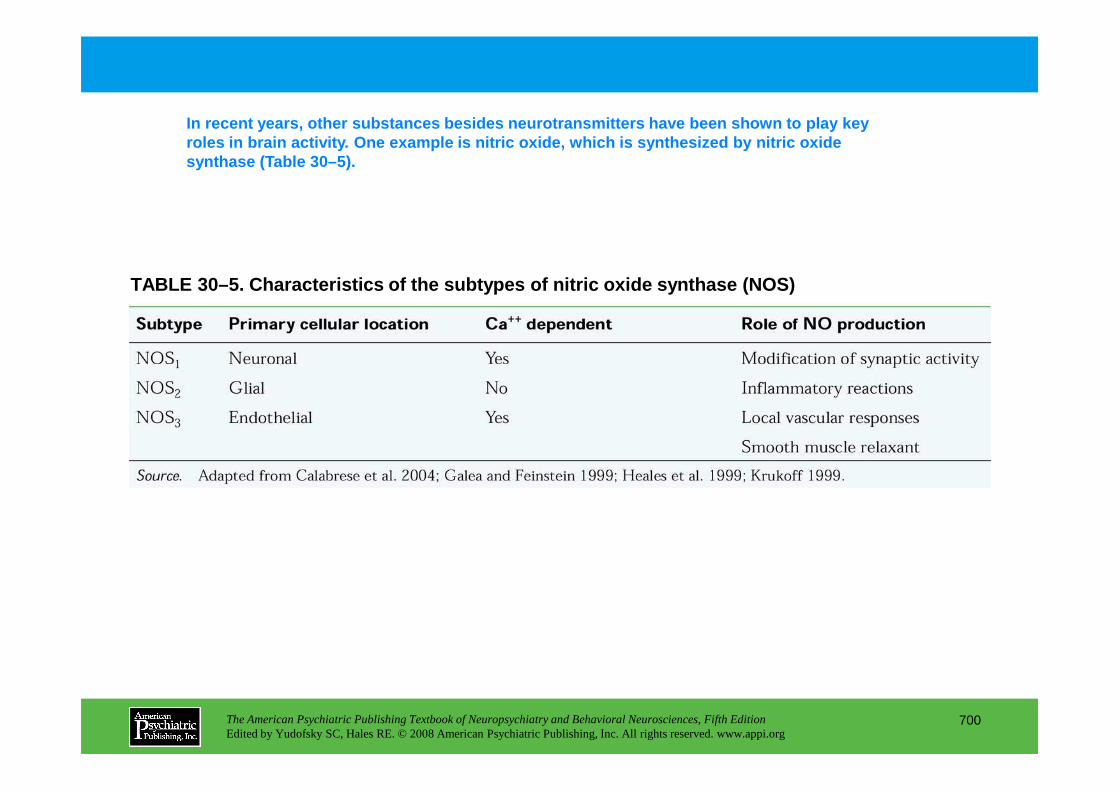
TABLE 30–5. Characteristics of the subtypes of nitr ic oxide synthase (NOS)
In recent years, other substances besides neurotran smitters have been shown to play key roles in brain activity. One example is nitric oxid e, which is synthesized by nitric oxide synthase (Table 30–5).
The American Psychiatric Publishing Textbook of Neuropsychiatry and Behavioral Neurosciences, Fifth EditionEdited by Yudofsky SC, Hales RE. © 2008 American Psychiatric Publishing, Inc. All rights reserved. www.appi.org
700
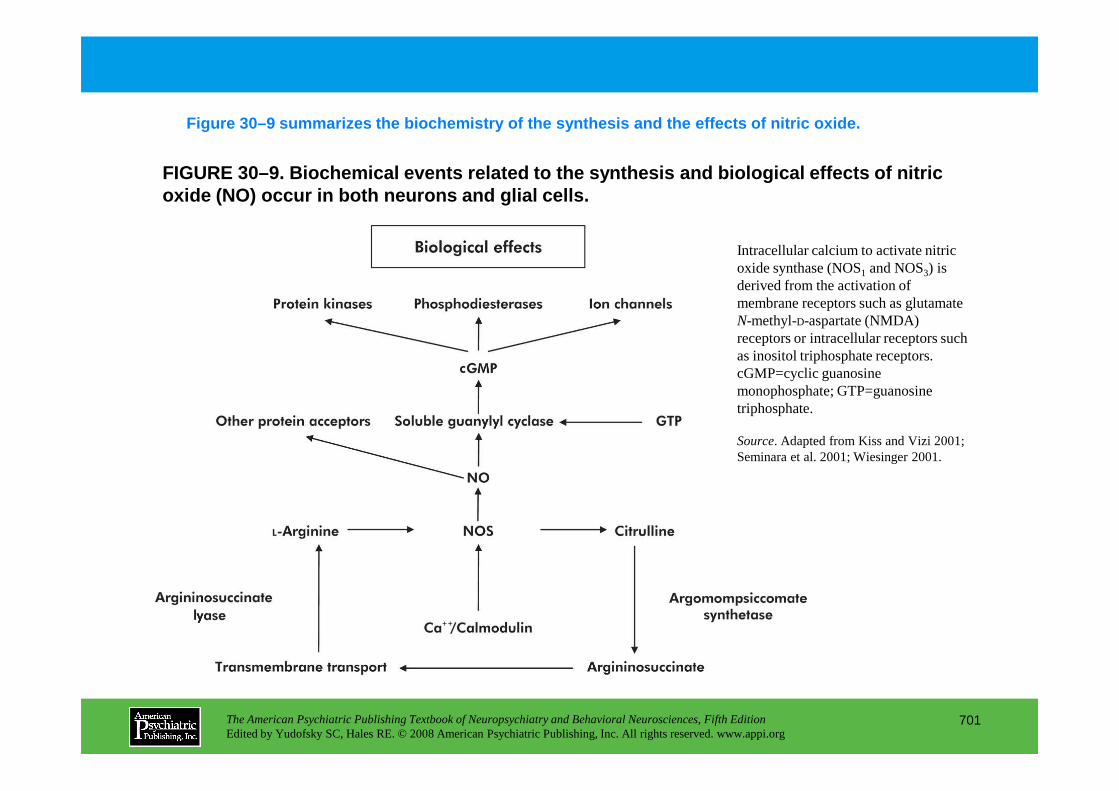
FIGURE 30–9. Biochemical events related to the synt hesis and biological effects of nitric oxide (NO) occur in both neurons and glial cells.
Figure 30–9 summarizes the biochemistry of the synth esis and the effects of nitric oxide.
Intracellular calcium to activate nitric oxide synthase (NOS1 and NOS3) is derived from the activation of membrane receptors such as glutamate N-methyl-D-aspartate (NMDA) receptors or intracellular receptors such as inositol triphosphate receptors. cGMP=cyclic guanosine monophosphate; GTP=guanosine
The American Psychiatric Publishing Textbook of Neuropsychiatry and Behavioral Neurosciences, Fifth EditionEdited by Yudofsky SC, Hales RE. © 2008 American Psychiatric Publishing, Inc. All rights reserved. www.appi.org
701
monophosphate; GTP=guanosine triphosphate.
Source. Adapted from Kiss and Vizi 2001; Seminara et al. 2001; Wiesinger 2001.
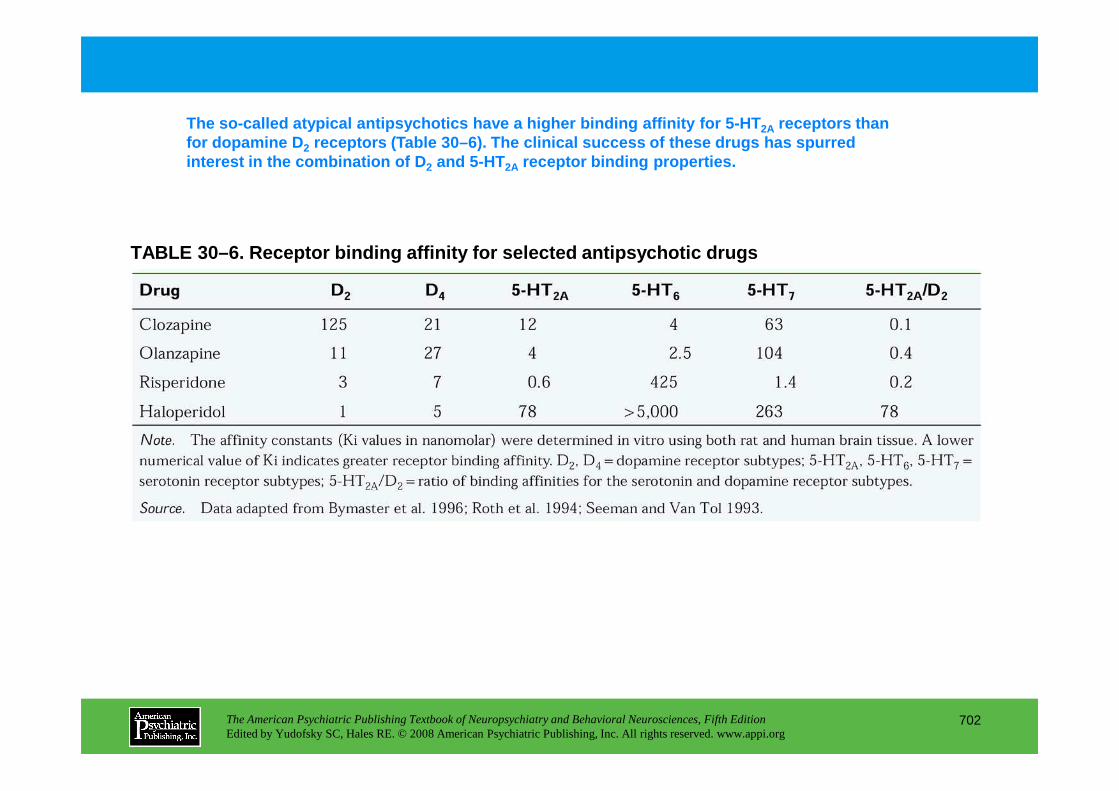
TABLE 30–6. Receptor binding affinity for selected antipsychotic drugs
The so-called atypical antipsychotics have a higher binding affinity for 5-HT 2A receptors than for dopamine D 2 receptors (Table 30–6). The clinical success of the se drugs has spurred interest in the combination of D 2 and 5-HT2A receptor binding properties.
The American Psychiatric Publishing Textbook of Neuropsychiatry and Behavioral Neurosciences, Fifth EditionEdited by Yudofsky SC, Hales RE. © 2008 American Psychiatric Publishing, Inc. All rights reserved. www.appi.org
702
Chapter 30 • Highlights for the Clinician
Historical perspective• Development of modern psychopharmacology in the 1950s was via serendipity
• Psychopharmacology has contributed to understanding the organic nature of brain functions
Neurobiology• Glia make up approximately one half of the brain’s volume and contribute significantly to brain
functions through chemical interactions with neurons.
• The predominant means of synaptic communication between neurons is via chemical transmission.
• Five essential processes involved in chemical transmission include (presynaptic) synthesis; storage; release; (postsynaptic) inactivation; and receptors; these processes provide many targets for drug-
The American Psychiatric Publishing Textbook of Neuropsychiatry and Behavioral Neurosciences, Fifth EditionEdited by Yudofsky SC, Hales RE. © 2008 American Psychiatric Publishing, Inc. All rights reserved. www.appi.org
703
induced modifications of neuronal activity.
• G proteins serve as important molecular mediators between neuroreceptors and intraneuronal second-messenger systems.
• Phosphorylation of proteins provides an important means of regulating neuronal activity through increasing and decreasing protein activity.
• The gases nitric oxide and carbon monoxide are important neuromodulatory agents and may be involved in psychiatric disorders and neurodegenerative events.
(continued)
Psychotropic drug development• Advances in molecular pharmacology have streamlined the search for new and novel
psychotherapeutic agents by providing specific molecular targets.
• Examples of the new technologies can be seen in the identification and characterization of neurotransmitter receptors, allowing for the development of specific, limited-action drugs for these sites.
• As technology permits the development of more selective therapeutic agents, a better understanding of how specific proteins are involved in brain dysfunction is required to make optimum therapeutic use of novel therapeutics.
• Novel sites under investigation for drug intervention in psychotherapeutics include neuropeptides
The American Psychiatric Publishing Textbook of Neuropsychiatry and Behavioral Neurosciences, Fifth EditionEdited by Yudofsky SC, Hales RE. © 2008 American Psychiatric Publishing, Inc. All rights reserved. www.appi.org
704
• Novel sites under investigation for drug intervention in psychotherapeutics include neuropeptides and glutamate receptors.
• Intracellular processes that regulate gene expression also represent new areas for the development of novel psychotherapeutic agents.
CHAPTER 31
PSYCHOPHARMACOLOGICAL TREATMENTS FOR PATIENTS WITHNEUROPSYCHIATRIC DISORDERS
Paul E. Holtzheimer III, M.D. • Mark Snowden, M.D., M.P.H.Peter P. Roy-Byrne, M.D.
The American Psychiatric Publishing Textbook of Neuropsychiatry and Behavioral Neurosciences, Fifth EditionEdited by Yudofsky SC, Hales RE. © 2008 American Psychiatric Publishing, Inc. All rights reserved. www.appi.org
705
Slide Show
Topic headings and reading list
Tables and figures
Highlights for the clinician
Main menu
(About, Contents, Contributors, Publishing facts)
Peter P. Roy-Byrne, M.D.
Approach to the Neuropsychiatric Patient
Depression, Apathy, and “Deficit” StatesCommon EtiologiesAnatomy and NeurochemistryTreatment
PsychosisCommon EtiologiesAnatomy and NeurochemistryTreatment
Agitated States, Including Anxiety and ManiaCommon EtiologiesAnatomy and NeurochemistryTreatment
Aggression, Impulsivity, and Behavioral
Cognitive DisturbanceCommon EtiologiesAnatomy and NeurochemistryTreatment
RECOMMENDED READINGSCharney D, Nestler E (eds): Neurobiology of Mental Illness,
2nd Edition. New York, Oxford University Press, 2005Davis KL, Charney D, Coyle JT, et al (eds):
Neuropsychopharmacology: The Fifth Generation of Progress. American College of Neuropsychopharmacology. Philadelphia, PA, Lippincott Williams & Wilkins, 2002
Nestler EJ, Hyman SE, Malenka RC (eds): Molecular Basis
CHAPTER 31 • Topics and Readings
The American Psychiatric Publishing Textbook of Neuropsychiatry and Behavioral Neurosciences, Fifth EditionEdited by Yudofsky SC, Hales RE. © 2008 American Psychiatric Publishing, Inc. All rights reserved. www.appi.org
706
Aggression, Impulsivity, and Behavioral DyscontrolCommon EtiologiesAnatomy and NeurochemistryTreatment
Nestler EJ, Hyman SE, Malenka RC (eds): Molecular Basis of Neuropharmacology: A Foundation for Clinical Neuroscience. New York, McGraw-Hill, 2001

CHAPTER 31 • Tables and Figures
Figure 31–1. Rating scale for the assessment of medication efficacy
Table 31–1. Antidepressants
Table 31–2. Antipsychotics/neuroleptics
Table 31–3. Mood stabilizers
Table 31–4. Anxiolytics and sedative-hypnotics
Table 31–5. Cognitive agents
Summary Highlights for the Clinician
The American Psychiatric Publishing Textbook of Neuropsychiatry and Behavioral Neurosciences, Fifth EditionEdited by Yudofsky SC, Hales RE. © 2008 American Psychiatric Publishing, Inc. All rights reserved. www.appi.org
707

FIGURE 31–1. Rating scale for the assessment of med ication efficacy.
For neuropsychiatric patients, target symptoms and functional goals should be measured prospectively and then tracked for optimal manageme nt. Figure 31–1 shows one example of a simple rating scale that can be tailored to each pa tient’s symptoms and problems.
The American Psychiatric Publishing Textbook of Neuropsychiatry and Behavioral Neurosciences, Fifth EditionEdited by Yudofsky SC, Hales RE. © 2008 American Psychiatric Publishing, Inc. All rights reserved. www.appi.org
708

TABLE 31–1. Antidepressants
Table 31–1 lists characteristic antidepressants rec ommended in the text (see text discussion) for patients with neurological illness.
The American Psychiatric Publishing Textbook of Neuropsychiatry and Behavioral Neurosciences, Fifth EditionEdited by Yudofsky SC, Hales RE. © 2008 American Psychiatric Publishing, Inc. All rights reserved. www.appi.org
709
(continued)
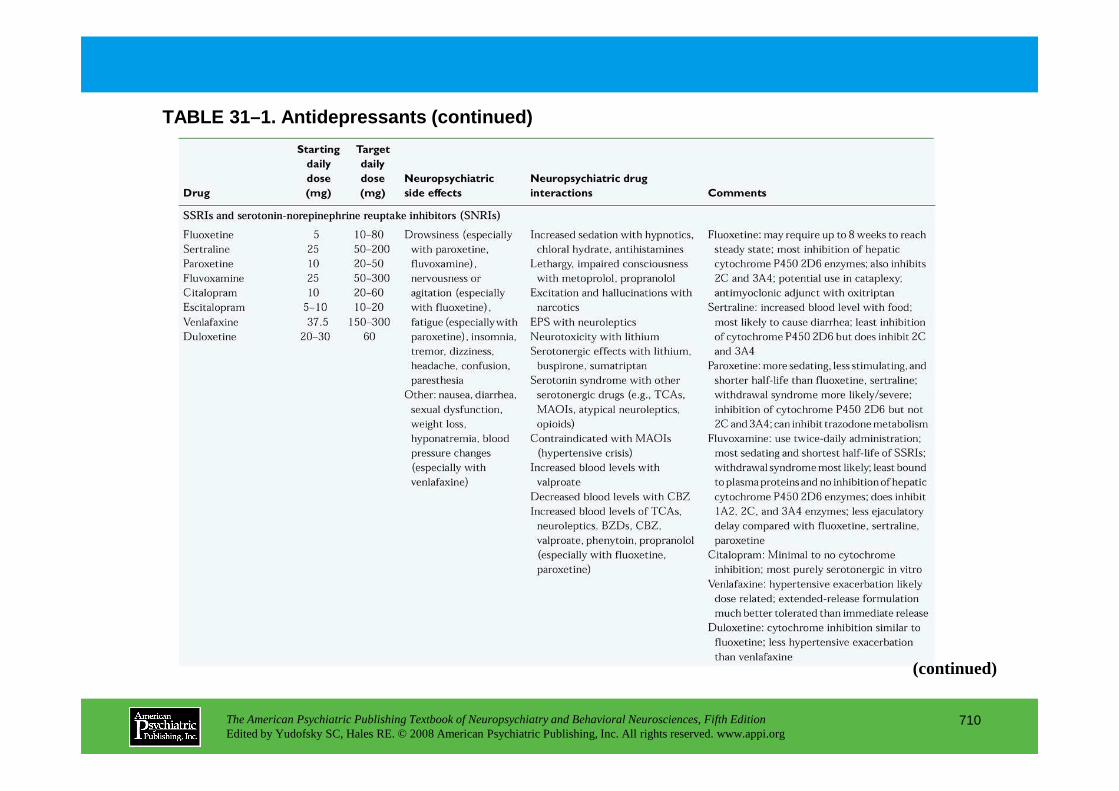
TABLE 31–1. Antidepressants (continued)
The American Psychiatric Publishing Textbook of Neuropsychiatry and Behavioral Neurosciences, Fifth EditionEdited by Yudofsky SC, Hales RE. © 2008 American Psychiatric Publishing, Inc. All rights reserved. www.appi.org
710
(continued)
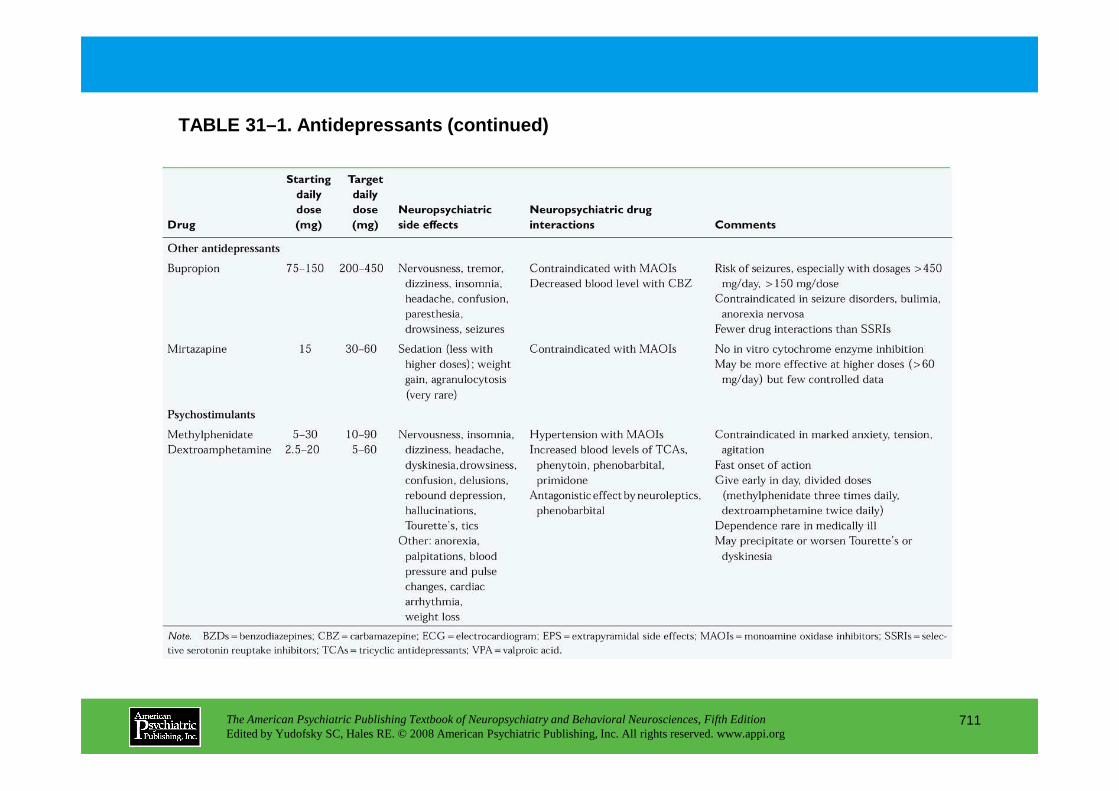
TABLE 31–1. Antidepressants (continued)
The American Psychiatric Publishing Textbook of Neuropsychiatry and Behavioral Neurosciences, Fifth EditionEdited by Yudofsky SC, Hales RE. © 2008 American Psychiatric Publishing, Inc. All rights reserved. www.appi.org
711
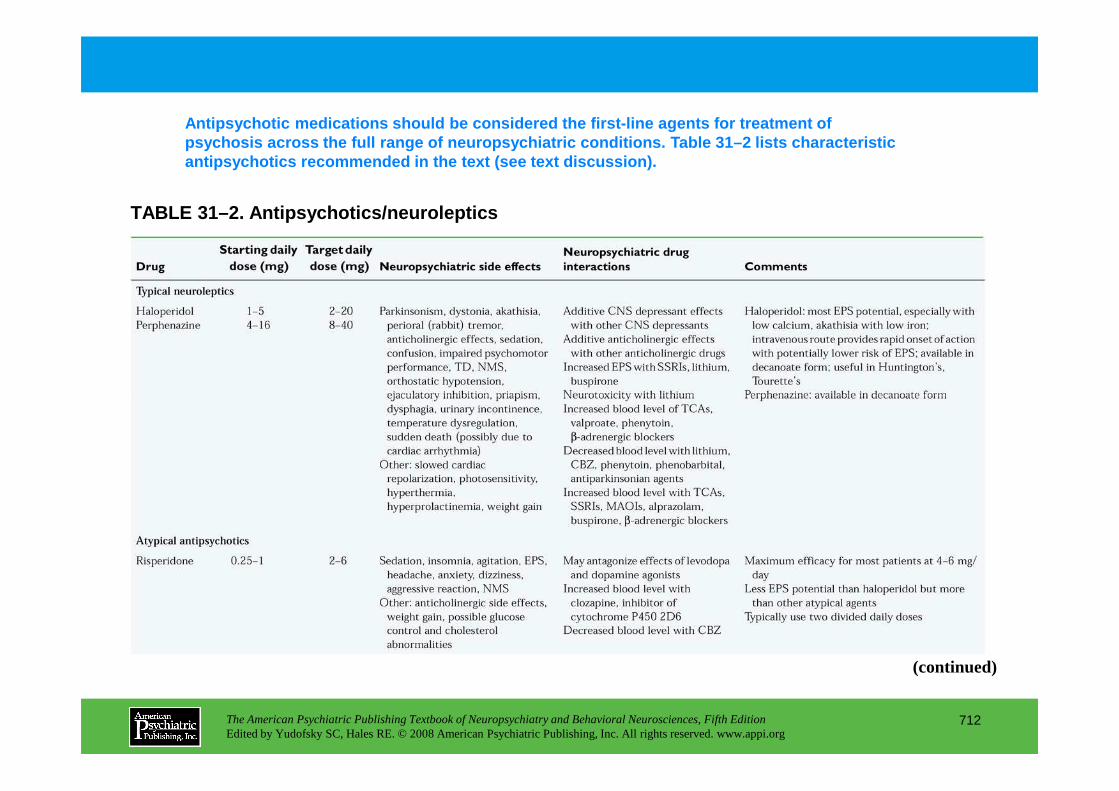
Antipsychotic medications should be considered the first-line agents for treatment of psychosis across the full range of neuropsychiatric conditions. Table 31–2 lists characteristic antipsychotics recommended in the text (see text di scussion).
TABLE 31–2. Antipsychotics/neuroleptics
The American Psychiatric Publishing Textbook of Neuropsychiatry and Behavioral Neurosciences, Fifth EditionEdited by Yudofsky SC, Hales RE. © 2008 American Psychiatric Publishing, Inc. All rights reserved. www.appi.org
712
(continued)
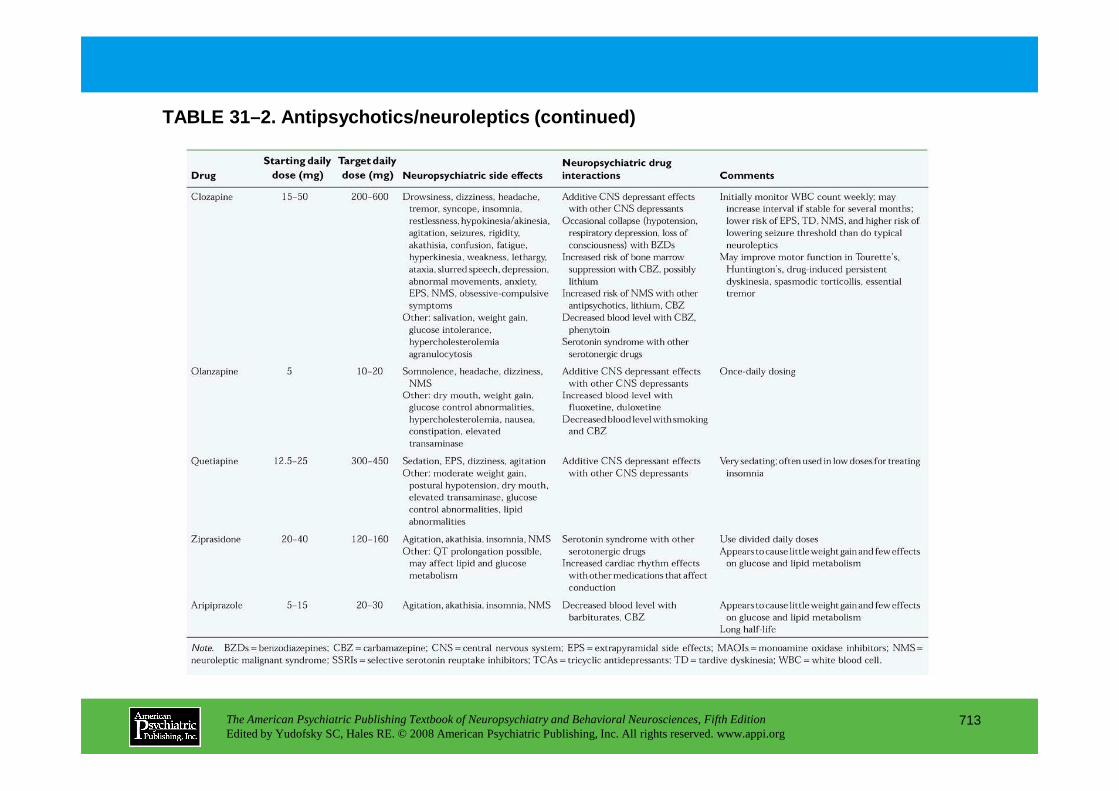
TABLE 31–2. Antipsychotics/neuroleptics (continued)
The American Psychiatric Publishing Textbook of Neuropsychiatry and Behavioral Neurosciences, Fifth EditionEdited by Yudofsky SC, Hales RE. © 2008 American Psychiatric Publishing, Inc. All rights reserved. www.appi.org
713
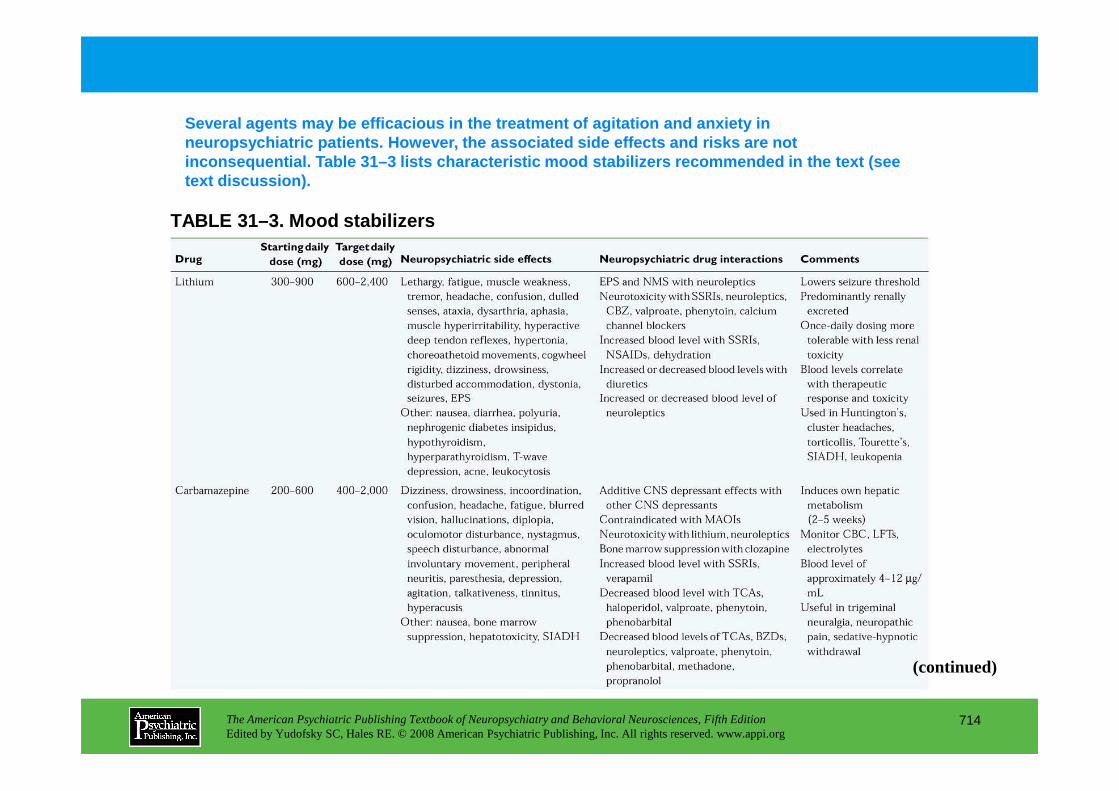
TABLE 31–3. Mood stabilizers
Several agents may be efficacious in the treatment of agitation and anxiety in neuropsychiatric patients. However, the associated side effects and risks are not inconsequential. Table 31–3 lists characteristic mo od stabilizers recommended in the text (see text discussion).
The American Psychiatric Publishing Textbook of Neuropsychiatry and Behavioral Neurosciences, Fifth EditionEdited by Yudofsky SC, Hales RE. © 2008 American Psychiatric Publishing, Inc. All rights reserved. www.appi.org
714
(continued)

TABLE 31-3. Mood stabilizers (continued)
The American Psychiatric Publishing Textbook of Neuropsychiatry and Behavioral Neurosciences, Fifth EditionEdited by Yudofsky SC, Hales RE. © 2008 American Psychiatric Publishing, Inc. All rights reserved. www.appi.org
715

TABLE 31–4. Anxiolytics and sedative-hypnotics
Anxiolytics should be used cautiously in treating n europsychiatric patients. Table 31–4 lists characteristic anxiolytics and sedative-hypnotics r ecommended in the text (see text discussion).
The American Psychiatric Publishing Textbook of Neuropsychiatry and Behavioral Neurosciences, Fifth EditionEdited by Yudofsky SC, Hales RE. © 2008 American Psychiatric Publishing, Inc. All rights reserved. www.appi.org
716
(continued)
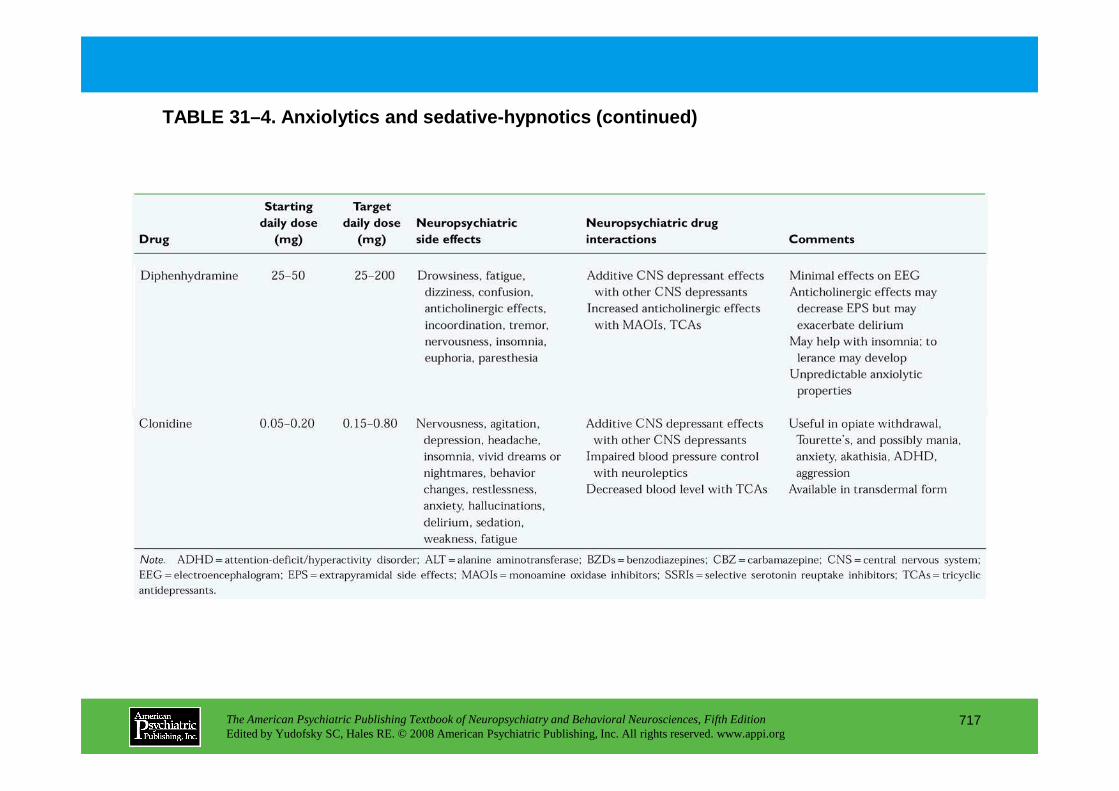
TABLE 31–4. Anxiolytics and sedative-hypnotics (con tinued)
The American Psychiatric Publishing Textbook of Neuropsychiatry and Behavioral Neurosciences, Fifth EditionEdited by Yudofsky SC, Hales RE. © 2008 American Psychiatric Publishing, Inc. All rights reserved. www.appi.org
717

TABLE 31–5. Cognitive agents
Only a few approved treatments for cognitive impair ment exist. Those available are principally for use in Alzheimer’s dementia. Table 31–5 lists ch aracteristic cognitive agents recommended in the text (see text discussion).
The American Psychiatric Publishing Textbook of Neuropsychiatry and Behavioral Neurosciences, Fifth EditionEdited by Yudofsky SC, Hales RE. © 2008 American Psychiatric Publishing, Inc. All rights reserved. www.appi.org
718
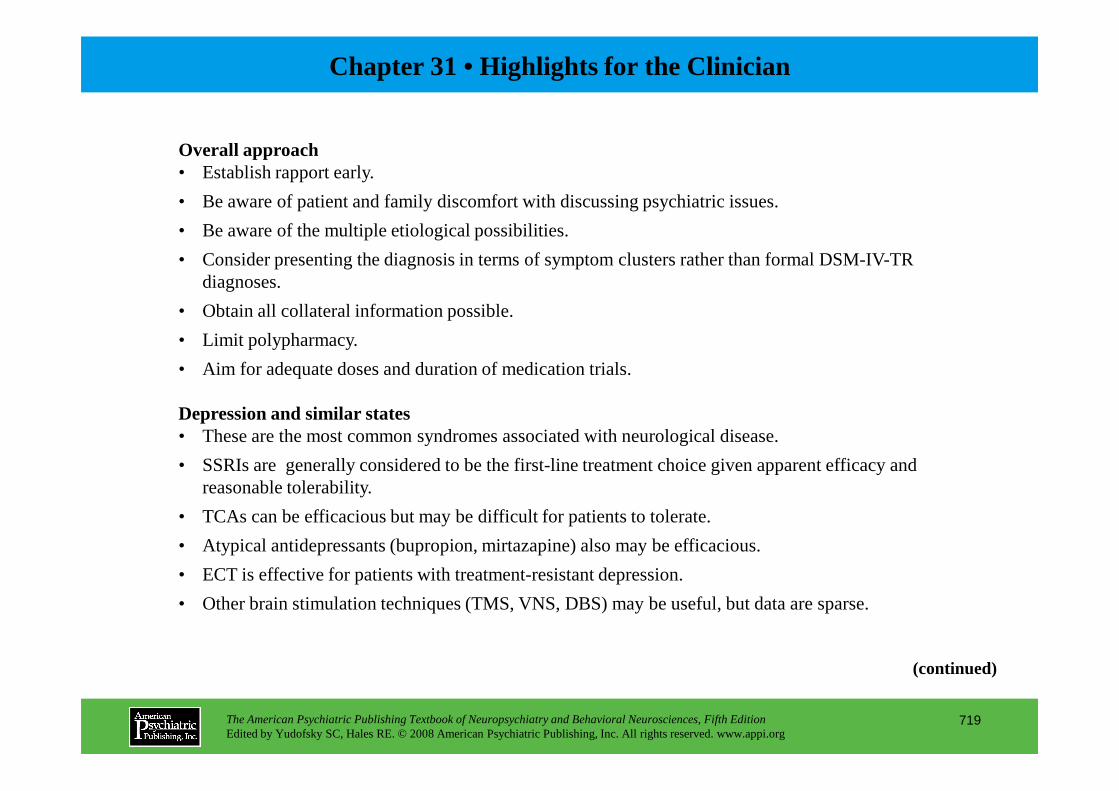
Chapter 31 • Highlights for the Clinician
Overall approach• Establish rapport early.
• Be aware of patient and family discomfort with discussing psychiatric issues.
• Be aware of the multiple etiological possibilities.
• Consider presenting the diagnosis in terms of symptom clusters rather than formal DSM-IV-TR diagnoses.
• Obtain all collateral information possible.
• Limit polypharmacy.
• Aim for adequate doses and duration of medication trials.
The American Psychiatric Publishing Textbook of Neuropsychiatry and Behavioral Neurosciences, Fifth EditionEdited by Yudofsky SC, Hales RE. © 2008 American Psychiatric Publishing, Inc. All rights reserved. www.appi.org
719
Depression and similar states• These are the most common syndromes associated with neurological disease.
• SSRIs are generally considered to be the first-line treatment choice given apparent efficacy and reasonable tolerability.
• TCAs can be efficacious but may be difficult for patients to tolerate.
• Atypical antidepressants (bupropion, mirtazapine) also may be efficacious.
• ECT is effective for patients with treatment-resistant depression.
• Other brain stimulation techniques (TMS, VNS, DBS) may be useful, but data are sparse.
(continued)
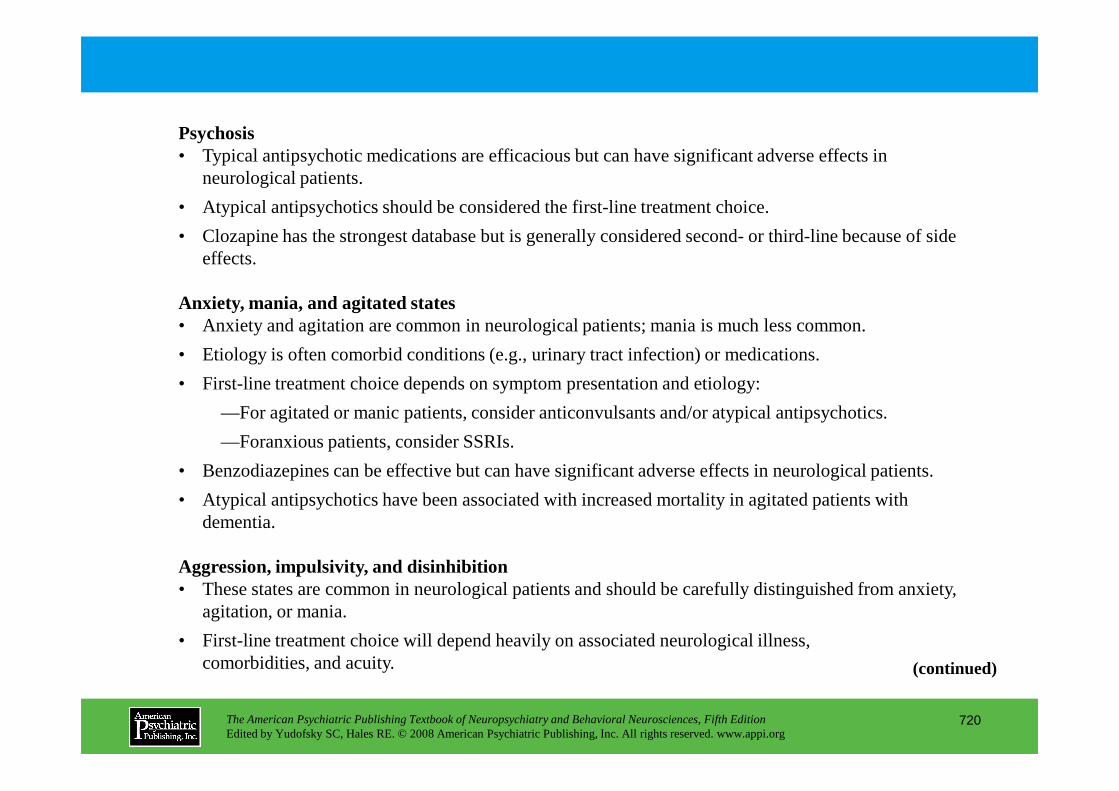
Psychosis• Typical antipsychotic medications are efficacious but can have significant adverse effects in
neurological patients.
• Atypical antipsychotics should be considered the first-line treatment choice.
• Clozapine has the strongest database but is generally considered second- or third-line because of side effects.
Anxiety, mania, and agitated states• Anxiety and agitation are common in neurological patients; mania is much less common.
• Etiology is often comorbid conditions (e.g., urinary tract infection) or medications.
• First-line treatment choice depends on symptom presentation and etiology:
The American Psychiatric Publishing Textbook of Neuropsychiatry and Behavioral Neurosciences, Fifth EditionEdited by Yudofsky SC, Hales RE. © 2008 American Psychiatric Publishing, Inc. All rights reserved. www.appi.org
720
—For agitated or manic patients, consider anticonvulsants and/or atypical antipsychotics.
—Foranxious patients, consider SSRIs.
• Benzodiazepines can be effective but can have significant adverse effects in neurological patients.
• Atypical antipsychotics have been associated with increased mortality in agitated patients with dementia.
Aggression, impulsivity, and disinhibition• These states are common in neurological patients and should be carefully distinguished from anxiety,
agitation, or mania.
• First-line treatment choice will depend heavily on associated neurological illness, comorbidities, and acuity. (continued)
• For acute agitation, parenteral atypical antipsychotics are a first-line choice; parenteral benzodiazepines can be used with caution.
• For prolonged states, consider SSRIs, anticonvulsants, and possibly atypical antipsychotics.
Cognitive disturbances• Acetylcholinesterase inhibitors are first-line agents for most patients with dementia.
• Memantine may be effective alone or in combination with acetylcholinesterase inhibitors, especially in patients with moderate to severe dementia.
Note. DBS=deep brain stimulation; ECT=electroconvulsive therapy; SSRIs=selective serotonin reuptake inhibitors; TCAs=tricyclic antidepressants; TMS=transcranial magnetic stimulation; VNS=vagus nerve stimulation.
The American Psychiatric Publishing Textbook of Neuropsychiatry and Behavioral Neurosciences, Fifth EditionEdited by Yudofsky SC, Hales RE. © 2008 American Psychiatric Publishing, Inc. All rights reserved. www.appi.org
721

CHAPTER 32
PSYCHOTHERAPY FOR PATIENTSWITH NEUROPSYCHIATRIC DISORDERS
David V. Forrest, M.D.
The American Psychiatric Publishing Textbook of Neuropsychiatry and Behavioral Neurosciences, Fifth EditionEdited by Yudofsky SC, Hales RE. © 2008 American Psychiatric Publishing, Inc. All rights reserved. www.appi.org
722
Slide Show
Topic headings and reading list
Tables and figures
Highlights for the clinician
Main menu
(About, Contents, Contributors, Publishing facts)

Psychodynamic Aspects of the Mental ExaminationContact in Neuropsychiatric PatientsDefenses: The Neuropsychodynamic Continuum
Techniques From Psychotherapy for Schizophrenia
Basic Approaches to Neuropsychiatric Patients
Traumatic Brain InjuryLanguage and Other Psychotherapeutic CorrelatesSexual Disturbances After Brain InjuryOther Therapeutic Emotional IssuesFamily Approach to Traumatic Brain Injury
Alzheimer’s DiseaseOther Suggestions for Psychotherapy With Memory-
Impaired PatientsCare for the CaregiverTreating the Working MemoryContribution of the Somatic MemoryApproach to Agitation in Patients With Profound Dementia
Parkinson’s DiseaseTreatment Considerations in Early Parkinson’s DiseaseNonmotor Experiences in Parkinsonism and Related ConditionsTreatment Considerations in Late Parkinson’s DiseaseDopamine and Personality in Parkinson’s Disease
Huntington’s DiseaseManagement of Affected Patients
CHAPTER 32 • Topics and Readings
The American Psychiatric Publishing Textbook of Neuropsychiatry and Behavioral Neurosciences, Fifth EditionEdited by Yudofsky SC, Hales RE. © 2008 American Psychiatric Publishing, Inc. All rights reserved. www.appi.org
723
Family Approach to Traumatic Brain Injury
StrokePostdischarge PlanningDefenses and Object Relations in Hemiplegia
Approach to Patients Who Are Unstable on Their Feet
Spinal Cord InjurySexual Therapy for Patients With Spinal Cord InjuriesThe Family Model in Spinal Cord Injury
EpilepsyManagement of Interictal Behavior and Personality Changes
Management of Affected Patients
Infections and Autoimmune Disorders of the Central Nervous System
Multiple Sclerosis
Psychogenic Movement DisordersGeneral Suggestions for the Management of Psychogenic DystoniaStudies in Hysteria Revisited: Multidisciplinary Approach to
Conversion Disorder in an Outpatient Movement Disorder Clinic
Brain Tumors
Conclusion
(continued)

CHAPTER 32 • Topics and Readings (continued)
RECOMMENDED READINGSAnderson KE, Weiner WJ, Lang AE (eds): Advances in Neurology, Vol 96:
Behavioral Neurology of Movement Disorders. Philadelphia, PA, Lippincott Williams & Wilkins, 2005
Schiffer RB, Rao SM, Fogel BS (eds): Neuropsychiatry, 2nd Edition. Philadelphia, PA, Lippincott Williams & Wilkins, 2003
Silver JM, McAllister TW, Yudofsky SC (eds): Textbook of Traumatic Brain Injury. Washington, DC, American Psychiatric Publishing, 2005
Yudofsky SC, Kim HF: Neuropsychiatric Assessment (Review of Psychiatry Series, Vol 23; Oldham JM and Riba MB, series eds). Washington, DC, American Psychiatric Publishing, 2004
The American Psychiatric Publishing Textbook of Neuropsychiatry and Behavioral Neurosciences, Fifth EditionEdited by Yudofsky SC, Hales RE. © 2008 American Psychiatric Publishing, Inc. All rights reserved. www.appi.org
724

CHAPTER 32 • Tables and Figures
Table 32–1. Hierarchy of capacities for psychotherapeutic contact that may be impaired in neuropsychiatric patients
Figure 32–1. Tracing of a drawing titled “the goose that layed [sic] (the golden egg)” by a 17-year-old male patient with early-onset schizophrenia and delineation disorder
Figure 32–2. Eight variant forms of misidentification
Table 32–2. Neuropsychiatric defense continuum
Table 32–3. Modalities of psychotherapy in neuropsychiatry
Table 32–4. Measures to assist recovery of patients with brain injury
Table 32–5. Management issues for patients with spinal cord injury
Table 32–6. Management issues for patients with Alzheimer’s disease
Figure 32–3. Facial warm-up and facial affect exercises
The American Psychiatric Publishing Textbook of Neuropsychiatry and Behavioral Neurosciences, Fifth EditionEdited by Yudofsky SC, Hales RE. © 2008 American Psychiatric Publishing, Inc. All rights reserved. www.appi.org
725
Facial warm-up and facial affect exercises
Figure 32–4. The tremometer is a simple device that closes a circuit and lights a bulb when the patient is unable to hold the probe in progressively smaller holes without touching the washers.
Figure 32–5. Patients with parkinsonism may have difficulty with motor blocks, which often occur in narrowed spaces such as doorways.
Table 32–7. Questions to evaluate depression in Parkinson’s disease
Table 32–8. Management issues for patients with Parkinson’s disease
Table 32–9. Management issues for patients with Huntington’s disease
Table 32–10. Management issues for patients with multiple sclerosis
Table 32–11. Management issues for patients with brain tumors
Summary Highlights for the Clinician

TABLE 32–1. Hierarchy of capacities for psychothera peutic contact that may be impaired in neuropsychiatric pa tients
Impairments in the patient’s hierarchy of capacitie s impede beneficial therapeutic contact and require adaptations in technique. In general, each capacity listed in Table 32–1 is dependent on the integrity of those that precede it.
The American Psychiatric Publishing Textbook of Neuropsychiatry and Behavioral Neurosciences, Fifth EditionEdited by Yudofsky SC, Hales RE. © 2008 American Psychiatric Publishing, Inc. All rights reserved. www.appi.org
726
(continued)
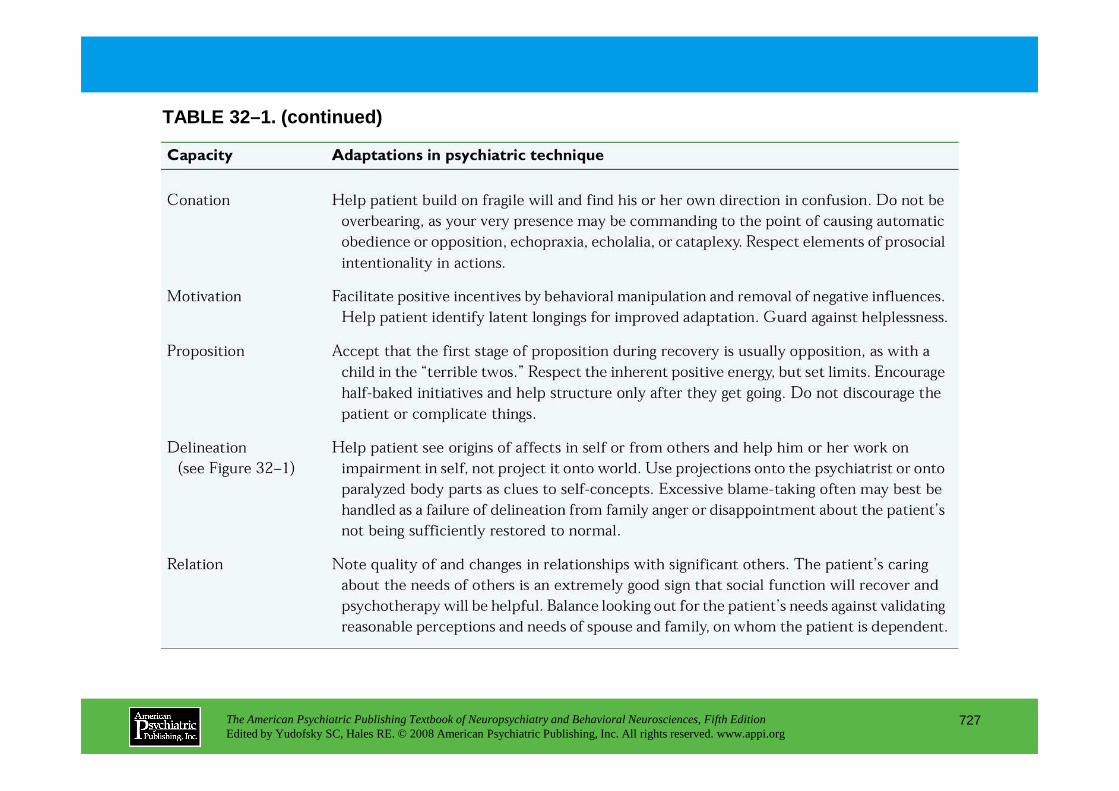
TABLE 32–1. (continued)
The American Psychiatric Publishing Textbook of Neuropsychiatry and Behavioral Neurosciences, Fifth EditionEdited by Yudofsky SC, Hales RE. © 2008 American Psychiatric Publishing, Inc. All rights reserved. www.appi.org
727

FIGURE 32–1. Tracing of a drawing titled “the goose that layed [sic] (the golden egg)” by a 17-year-old male patient with early-onset schizophrenia and delineation disorder.
Defects in delineation, with impaired concepts of self and of intention, appear in several disorders.
Delineation disorder, which occurs in schizophrenic, borderline, and numerous neuropsychiatric conditions, is characterized by difficulties in determining
The American Psychiatric Publishing Textbook of Neuropsychiatry and Behavioral Neurosciences, Fifth EditionEdited by Yudofsky SC, Hales RE. © 2008 American Psychiatric Publishing, Inc. All rights reserved. www.appi.org
728
is characterized by difficulties in determining interpersonal boundaries and self- versus others’ ownership of intentionality.
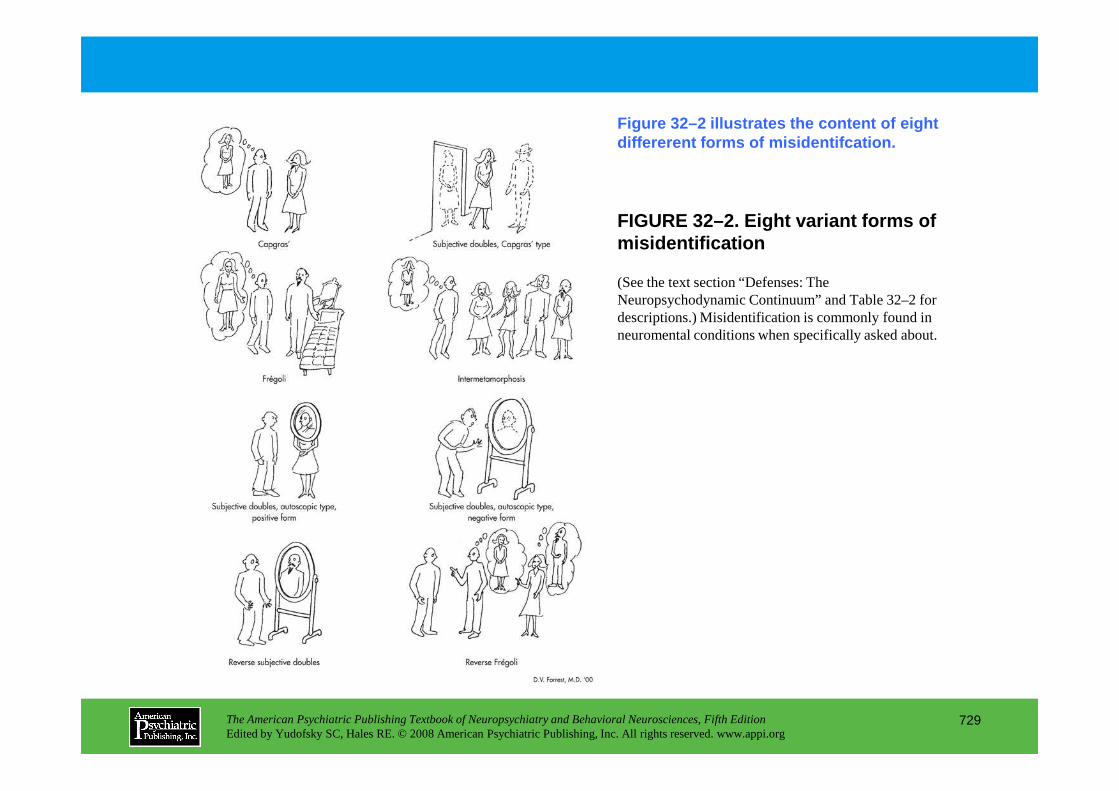
FIGURE 32–2. Eight variant forms of misidentification
Figure 32–2 illustrates the content of eight differerent forms of misidentifcation.
(See the text section “Defenses: The Neuropsychodynamic Continuum” and Table 32–2 for descriptions.) Misidentification is commonly found in neuromental conditions when specifically asked about.
The American Psychiatric Publishing Textbook of Neuropsychiatry and Behavioral Neurosciences, Fifth EditionEdited by Yudofsky SC, Hales RE. © 2008 American Psychiatric Publishing, Inc. All rights reserved. www.appi.org
729
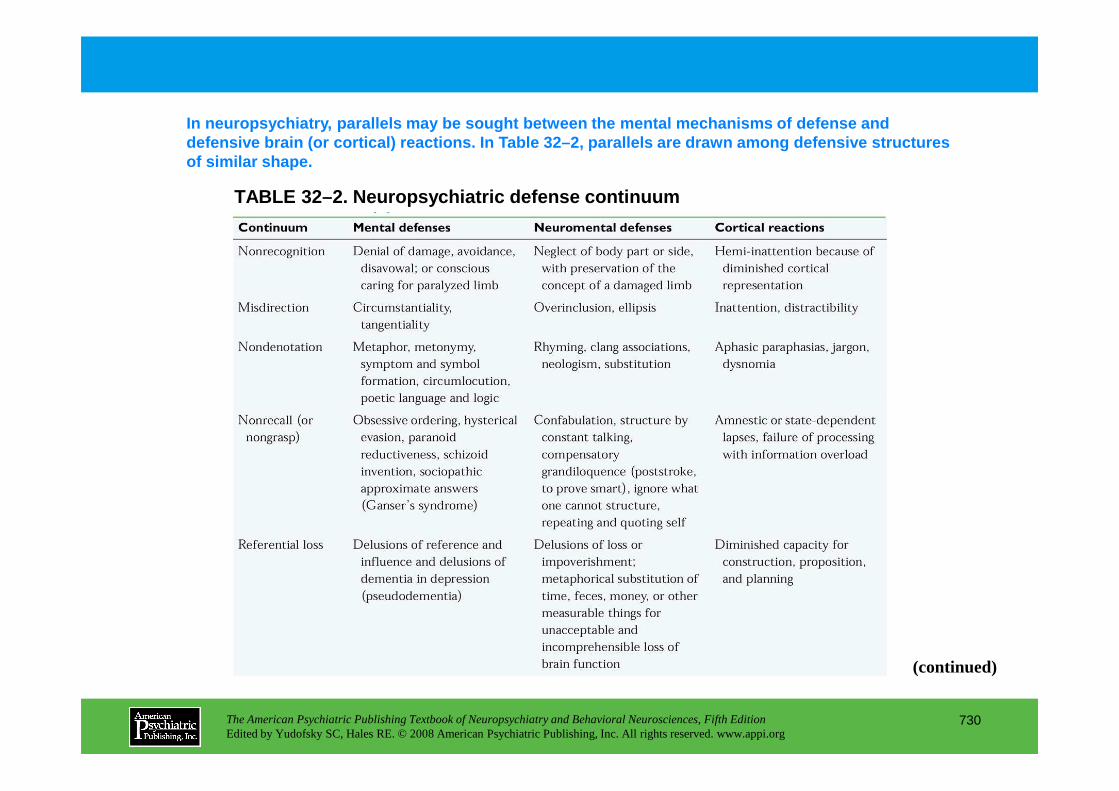
In neuropsychiatry, parallels may be sought between the mental mechanisms of defense and defensive brain (or cortical) reactions. In Table 3 2–2, parallels are drawn among defensive structures of similar shape.
TABLE 32–2. Neuropsychiatric defense continuum
The American Psychiatric Publishing Textbook of Neuropsychiatry and Behavioral Neurosciences, Fifth EditionEdited by Yudofsky SC, Hales RE. © 2008 American Psychiatric Publishing, Inc. All rights reserved. www.appi.org
730
(continued)
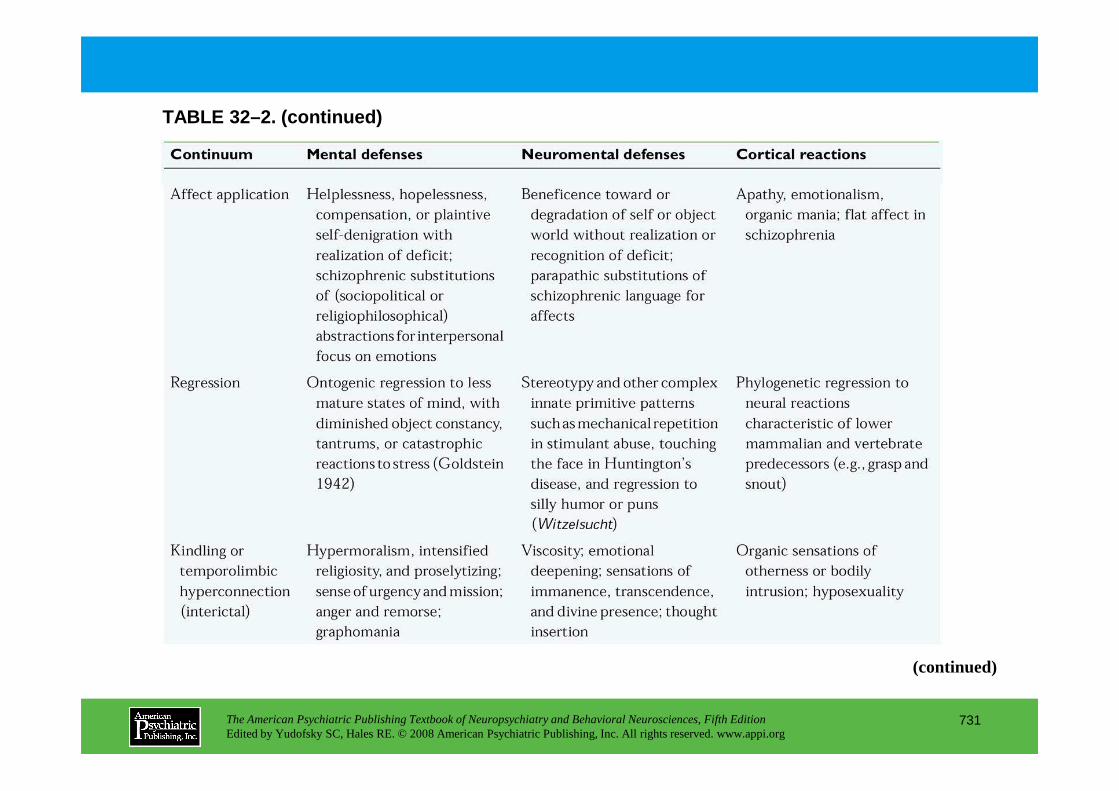
TABLE 32–2. (continued)
The American Psychiatric Publishing Textbook of Neuropsychiatry and Behavioral Neurosciences, Fifth EditionEdited by Yudofsky SC, Hales RE. © 2008 American Psychiatric Publishing, Inc. All rights reserved. www.appi.org
731
(continued)

TABLE 32–2. (continued)
The American Psychiatric Publishing Textbook of Neuropsychiatry and Behavioral Neurosciences, Fifth EditionEdited by Yudofsky SC, Hales RE. © 2008 American Psychiatric Publishing, Inc. All rights reserved. www.appi.org
732
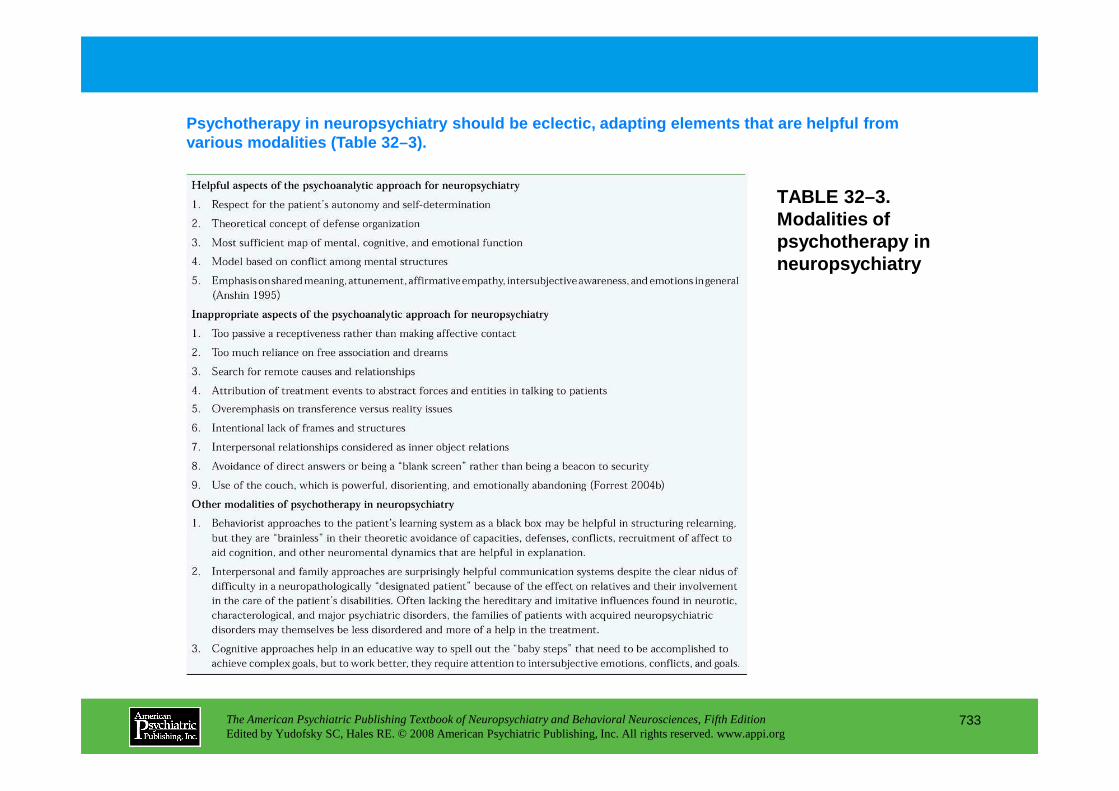
TABLE 32–3. Modalities of psychotherapy in neuropsychiatry
Psychotherapy in neuropsychiatry should be eclectic , adapting elements that are helpful from various modalities (Table 32–3).
The American Psychiatric Publishing Textbook of Neuropsychiatry and Behavioral Neurosciences, Fifth EditionEdited by Yudofsky SC, Hales RE. © 2008 American Psychiatric Publishing, Inc. All rights reserved. www.appi.org
733
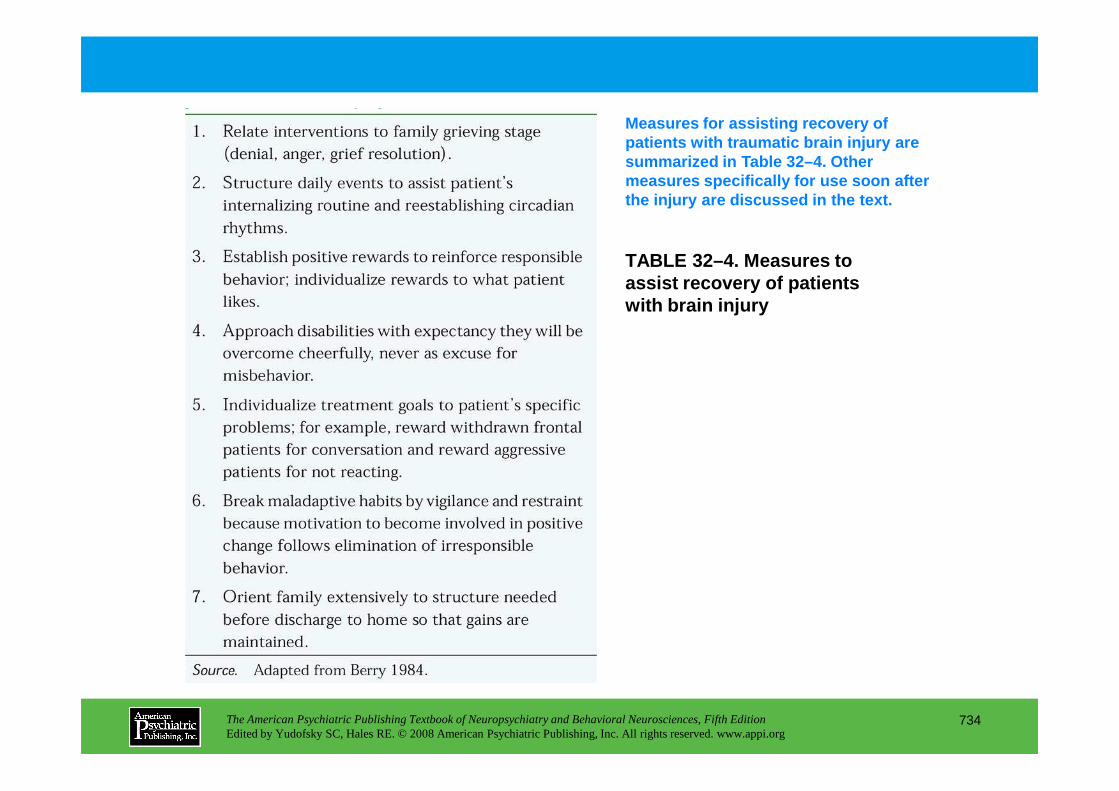
TABLE 32–4. Measures to assist recovery of patients with brain injury
Measures for assisting recovery of patients with traumatic brain injury are summarized in Table 32–4. Other measures specifically for use soon after the injury are discussed in the text.
The American Psychiatric Publishing Textbook of Neuropsychiatry and Behavioral Neurosciences, Fifth EditionEdited by Yudofsky SC, Hales RE. © 2008 American Psychiatric Publishing, Inc. All rights reserved. www.appi.org
734

TABLE 32–5. Management issues for patients with spinal cord injury
A longitudinal study found that the best-adjusted patients with spinal cord injuries used defenses of rationalization and denial. Table 32–5 summarizes management issues for patients with spinal cord injuries.
The American Psychiatric Publishing Textbook of Neuropsychiatry and Behavioral Neurosciences, Fifth EditionEdited by Yudofsky SC, Hales RE. © 2008 American Psychiatric Publishing, Inc. All rights reserved. www.appi.org
735
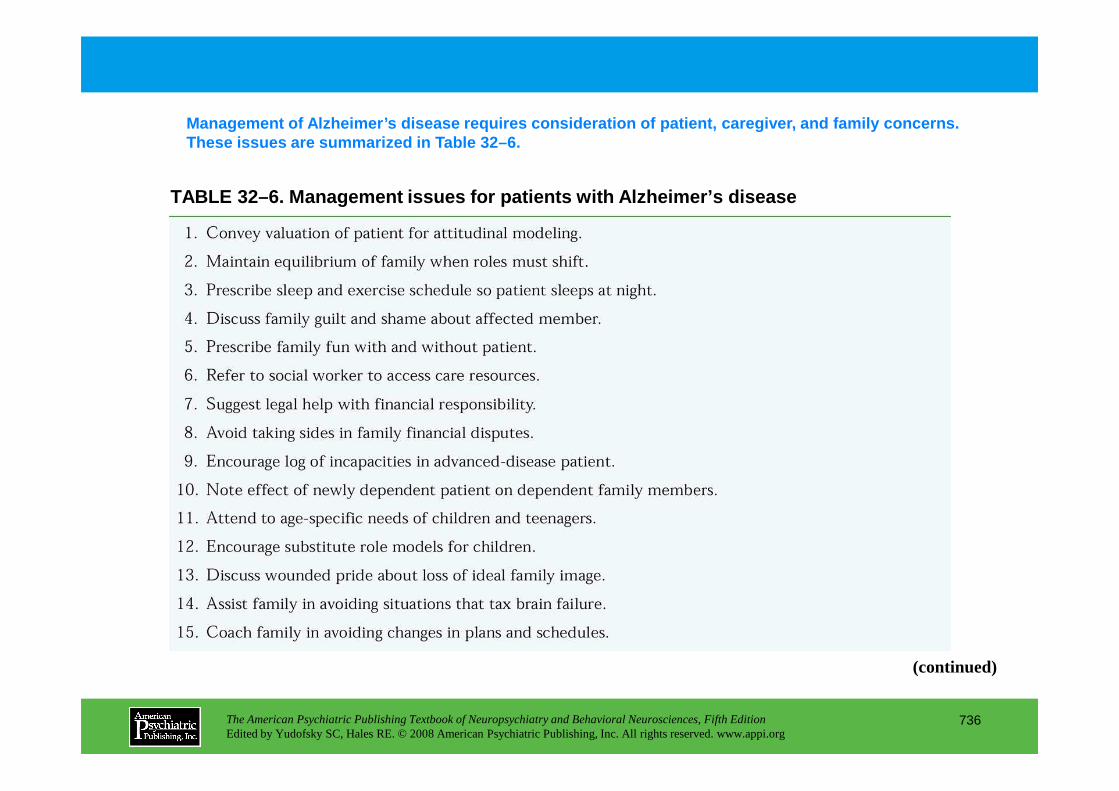
TABLE 32–6. Management issues for patients with Alz heimer’s disease
Management of Alzheimer’s disease requires considera tion of patient, caregiver, and family concerns. These issues are summarized in Table 32–6.
The American Psychiatric Publishing Textbook of Neuropsychiatry and Behavioral Neurosciences, Fifth EditionEdited by Yudofsky SC, Hales RE. © 2008 American Psychiatric Publishing, Inc. All rights reserved. www.appi.org
736
(continued)
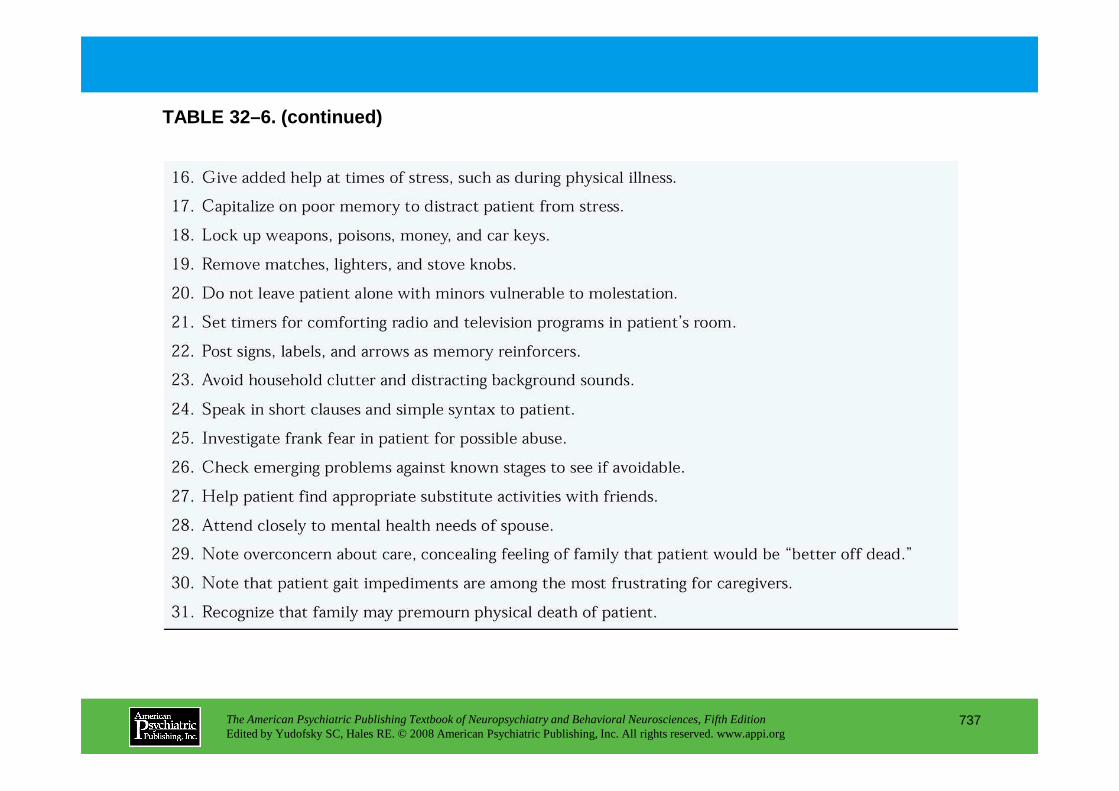
TABLE 32–6. (continued)
The American Psychiatric Publishing Textbook of Neuropsychiatry and Behavioral Neurosciences, Fifth EditionEdited by Yudofsky SC, Hales RE. © 2008 American Psychiatric Publishing, Inc. All rights reserved. www.appi.org
737

FIGURE 32–3. Facial warm-up and facial affect exerc ises.
Interpersonal and videotaped feedback can teach the patient with early Parkinson’s disease to be more facially expressive. Figure 32–3 shows faci al warm-up and facial affect exercises.
The American Psychiatric Publishing Textbook of Neuropsychiatry and Behavioral Neurosciences, Fifth EditionEdited by Yudofsky SC, Hales RE. © 2008 American Psychiatric Publishing, Inc. All rights reserved. www.appi.org
738

FIGURE 32–4. The tremometer is a simple device that closes a circuit and lights a bulb when the patient is unable to hold the probe in progressively smaller holes without touching the washers.
A simple device to quantify tremor (Figure 32–4) ca n reassure Parkinson’s disease patients of preserved control of intentional movements. It can also be used to monitor other patients whose hands shake from a variety of causes.
The suggested sizes for the inside diameters of the washers are 9/16”, 3/8”, 5/16”, 1/4”, and 3/16”. Although the device quantitates tremor, it is most useful for reassuring patients that they are able to accomplish the
The American Psychiatric Publishing Textbook of Neuropsychiatry and Behavioral Neurosciences, Fifth EditionEdited by Yudofsky SC, Hales RE. © 2008 American Psychiatric Publishing, Inc. All rights reserved. www.appi.org
739
reassuring patients that they are able to accomplish the task despite their shaky hands.
Source. Full instructions for the tremometer, suggestions for use, and clinical examples are presented in Forrest D: “The Tremometer: A Convenient Device to Measure Postural Tremor From Lithium and Other Causes.” Journal of Neuropsychiatry and Clinical Neurosciences 2:391–394, 1990.

FIGURE 32–5. Patients with parkinsonism may have difficulty with motor blocks, which often occur in narrowed spaces such as doorways.
In patients with parkinsonism, the problem of sudden “freezing” or motor block is often associated with narrowed spaces, with turning, or with starting to walk. Patients can be encouraged to focus on pattern continuities at constricted points (see Figure 32–5).
This behavior has an atavistic quality and resembles the liminal wariness of animals. Concentration on
The American Psychiatric Publishing Textbook of Neuropsychiatry and Behavioral Neurosciences, Fifth EditionEdited by Yudofsky SC, Hales RE. © 2008 American Psychiatric Publishing, Inc. All rights reserved. www.appi.org
740
the liminal wariness of animals. Concentration on visual continuities may help to counter this problem.
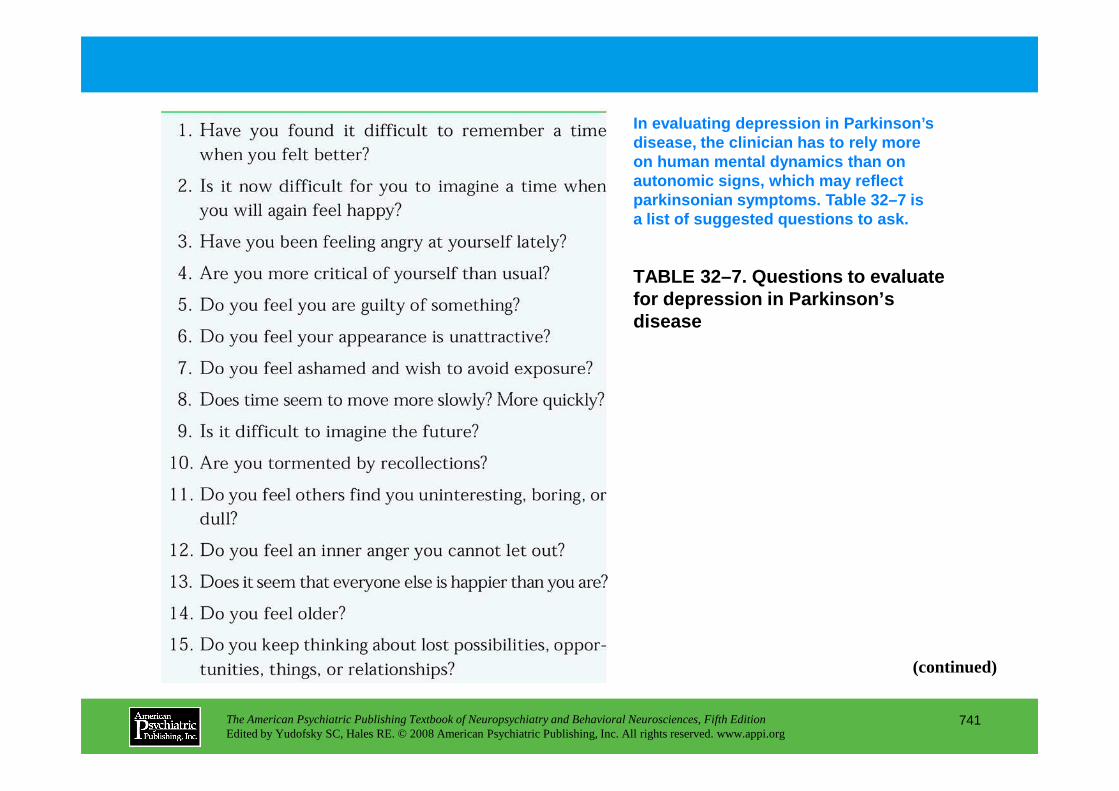
TABLE 32–7. Questions to evaluate for depression in Parkinson’s disease
In evaluating depression in Parkinson’s disease, the clinician has to rely more on human mental dynamics than on autonomic signs, which may reflect parkinsonian symptoms. Table 32–7 is a list of suggested questions to ask.
The American Psychiatric Publishing Textbook of Neuropsychiatry and Behavioral Neurosciences, Fifth EditionEdited by Yudofsky SC, Hales RE. © 2008 American Psychiatric Publishing, Inc. All rights reserved. www.appi.org
741
(continued)

TABLE 32–7 (continued)
The American Psychiatric Publishing Textbook of Neuropsychiatry and Behavioral Neurosciences, Fifth EditionEdited by Yudofsky SC, Hales RE. © 2008 American Psychiatric Publishing, Inc. All rights reserved. www.appi.org
742

TABLE 32–8. Management issues for patients with Parkinson’s disease
Parkinson’s disease presents a wide variety of management issues, as summarized in Table 32–8.
The American Psychiatric Publishing Textbook of Neuropsychiatry and Behavioral Neurosciences, Fifth EditionEdited by Yudofsky SC, Hales RE. © 2008 American Psychiatric Publishing, Inc. All rights reserved. www.appi.org
743

TABLE 32–8 (continued)
The American Psychiatric Publishing Textbook of Neuropsychiatry and Behavioral Neurosciences, Fifth EditionEdited by Yudofsky SC, Hales RE. © 2008 American Psychiatric Publishing, Inc. All rights reserved. www.appi.org
744

TABLE 32–9. Management issues for patients with Huntington’s disease
Psychosocial support remains the hallmark in the care of patients and relatives confronted with genetically determined inevitable functional decline. Table 32–9 lists management issues for Huntington’s disease.
The American Psychiatric Publishing Textbook of Neuropsychiatry and Behavioral Neurosciences, Fifth EditionEdited by Yudofsky SC, Hales RE. © 2008 American Psychiatric Publishing, Inc. All rights reserved. www.appi.org
745

TABLE 32–10. Management
Multiple sclerosis patients have varying needs and face differing and fluctuating levels of disability. Table 32–10 summarizes management issues.
The American Psychiatric Publishing Textbook of Neuropsychiatry and Behavioral Neurosciences, Fifth EditionEdited by Yudofsky SC, Hales RE. © 2008 American Psychiatric Publishing, Inc. All rights reserved. www.appi.org
746
Management issues for patients with multiple sclerosis

TABLE 32–11. Management issues for patients with br ain tumors
Some brain tumors can result in behavioral changes. Overall, patients often can benefit from understanding, explanation, and reassurance. Table 32–11 summarizes management issues.
The American Psychiatric Publishing Textbook of Neuropsychiatry and Behavioral Neurosciences, Fifth EditionEdited by Yudofsky SC, Hales RE. © 2008 American Psychiatric Publishing, Inc. All rights reserved. www.appi.org
747
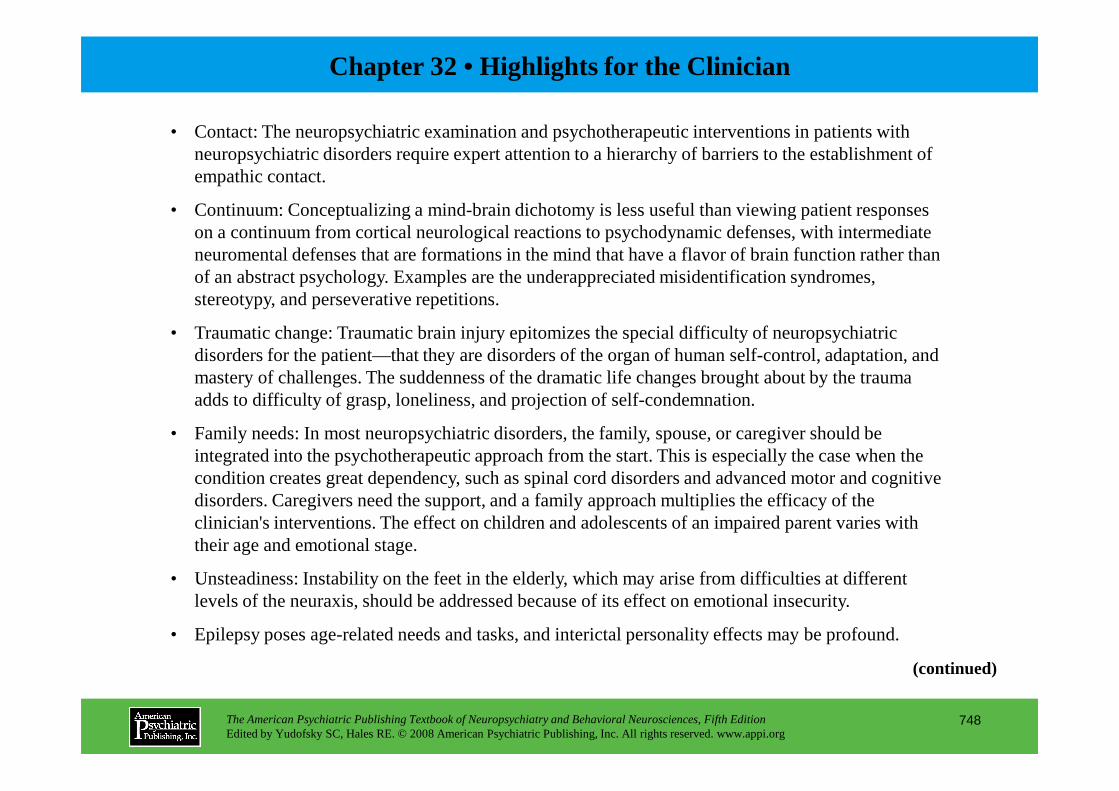
Chapter 32 • Highlights for the Clinician
• Contact: The neuropsychiatric examination and psychotherapeutic interventions in patients with neuropsychiatric disorders require expert attention to a hierarchy of barriers to the establishment of empathic contact.
• Continuum: Conceptualizing a mind-brain dichotomy is less useful than viewing patient responses on a continuum from cortical neurological reactions to psychodynamic defenses, with intermediate neuromental defenses that are formations in the mind that have a flavor of brain function rather than of an abstract psychology. Examples are the underappreciated misidentification syndromes, stereotypy, and perseverative repetitions.
• Traumatic change: Traumatic brain injury epitomizes the special difficulty of neuropsychiatric disorders for the patient—that they are disorders of the organ of human self-control, adaptation, and mastery of challenges. The suddenness of the dramatic life changes brought about by the trauma adds to difficulty of grasp, loneliness, and projection of self-condemnation.
The American Psychiatric Publishing Textbook of Neuropsychiatry and Behavioral Neurosciences, Fifth EditionEdited by Yudofsky SC, Hales RE. © 2008 American Psychiatric Publishing, Inc. All rights reserved. www.appi.org
748
(continued)
adds to difficulty of grasp, loneliness, and projection of self-condemnation.
• Family needs: In most neuropsychiatric disorders, the family, spouse, or caregiver should be integrated into the psychotherapeutic approach from the start. This is especially the case when the condition creates great dependency, such as spinal cord disorders and advanced motor and cognitive disorders. Caregivers need the support, and a family approach multiplies the efficacy of the clinician's interventions. The effect on children and adolescents of an impaired parent varies with their age and emotional stage.
• Unsteadiness: Instability on the feet in the elderly, which may arise from difficulties at different levels of the neuraxis, should be addressed because of its effect on emotional insecurity.
• Epilepsy poses age-related needs and tasks, and interictal personality effects may be profound.
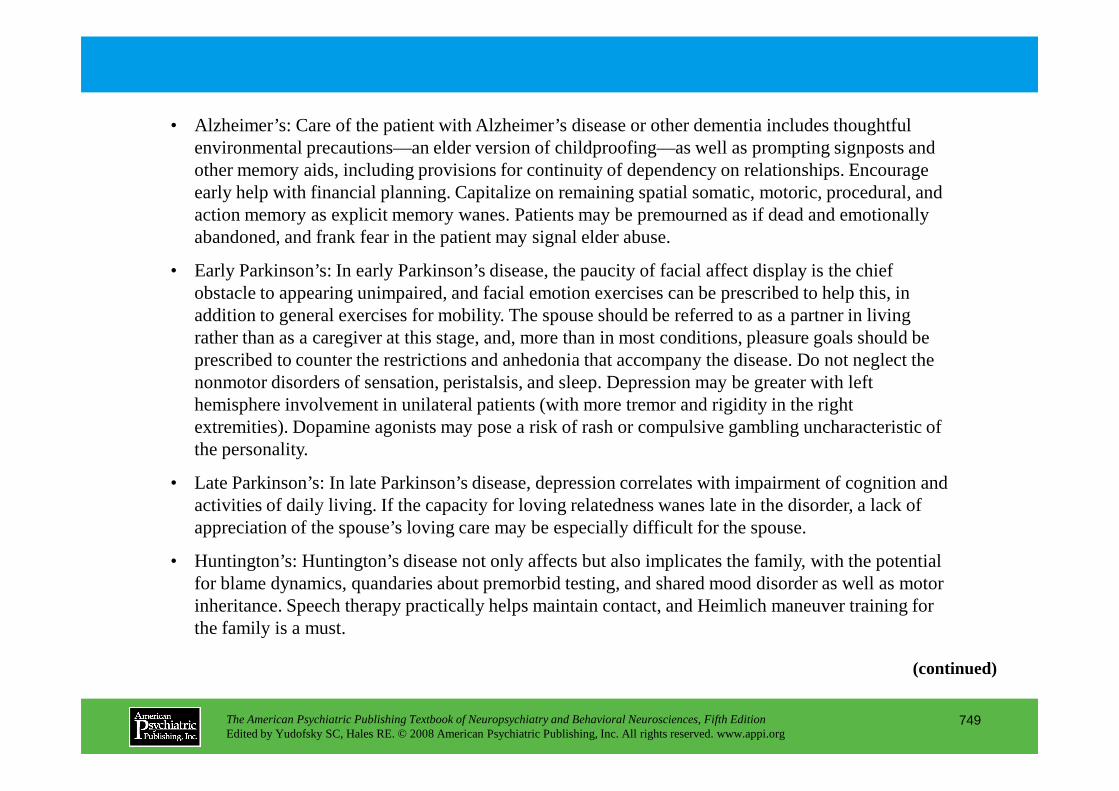
• Alzheimer’s: Care of the patient with Alzheimer’s disease or other dementia includes thoughtful environmental precautions—an elder version of childproofing—as well as prompting signposts and other memory aids, including provisions for continuity of dependency on relationships. Encourage early help with financial planning. Capitalize on remaining spatial somatic, motoric, procedural, and action memory as explicit memory wanes. Patients may be premourned as if dead and emotionally abandoned, and frank fear in the patient may signal elder abuse.
• Early Parkinson’s: In early Parkinson’s disease, the paucity of facial affect display is the chief obstacle to appearing unimpaired, and facial emotion exercises can be prescribed to help this, in addition to general exercises for mobility. The spouse should be referred to as a partner in living rather than as a caregiver at this stage, and, more than in most conditions, pleasure goals should be prescribed to counter the restrictions and anhedonia that accompany the disease. Do not neglect the nonmotor disorders of sensation, peristalsis, and sleep. Depression may be greater with left hemisphere involvement in unilateral patients (with more tremor and rigidity in the right
The American Psychiatric Publishing Textbook of Neuropsychiatry and Behavioral Neurosciences, Fifth EditionEdited by Yudofsky SC, Hales RE. © 2008 American Psychiatric Publishing, Inc. All rights reserved. www.appi.org
749
(continued)
hemisphere involvement in unilateral patients (with more tremor and rigidity in the right extremities). Dopamine agonists may pose a risk of rash or compulsive gambling uncharacteristic of the personality.
• Late Parkinson’s: In late Parkinson’s disease, depression correlates with impairment of cognition and activities of daily living. If the capacity for loving relatedness wanes late in the disorder, a lack of appreciation of the spouse’s loving care may be especially difficult for the spouse.
• Huntington’s: Huntington’s disease not only affects but also implicates the family, with the potential for blame dynamics, quandaries about premorbid testing, and shared mood disorder as well as motor inheritance. Speech therapy practically helps maintain contact, and Heimlich maneuver training for the family is a must.
• Multiple sclerosis: In multiple sclerosis, do not reinforce the sick role, because the patient is not ill in the traditional sense. Omit onerous activities temporarily and selectively. Depression is more likely than, and may underlie, apparent euphoria. Help ambitious young patients to pace themselves. The occult origins of exacerbations may lead to a guilty, paranoid, or blaming culture of the disease.
• Movement disorders: Patients with psychogenic movement disorders tend to be alexithymic, lacking verbal but not gestural language, which they use like mime actors to portray their distress. Although hospital admission is preferable for explanation that they have dystonia or tremor of emotional origin, and for appropriate behavior therapy, this is often impossible because of constricted reimbursement. They do not receive verbal interpretation of their symptoms gladly and may be approached in an outpatient setting with the aid of a physical therapist and a strong ethos of expectancy of improvement. Often secret conflicts and traumata must remain secret for the time being.
The American Psychiatric Publishing Textbook of Neuropsychiatry and Behavioral Neurosciences, Fifth EditionEdited by Yudofsky SC, Hales RE. © 2008 American Psychiatric Publishing, Inc. All rights reserved. www.appi.org
750
being.
• Brain tumors: Brain tumor patients benefit from much less disabling and pain-inducing techniques of treatment and can be supported with more optimism than in the past.
• Prognosis and perspectives: Neuropsychiatric prognoses are not necessarily grim. For example, 90% of stroke patients were still in their homes, and 99% could walk independently a year later. But when faced with a patient with a chronic downhill course, the young professional with high self-standards of performance must guard against countertransference feelings that reinforce temporary suicidal inclinations and recognize that the patients may be more able than the clinicians are to contemplate their impaired lives with grace, equanimity, and gratitude.
CHAPTER 33
COGNITIVE REHABILITATION ANDBEHAVIOR THERAPY FOR PATIENTS
WITH NEUROPSYCHIATRIC DISORDERS
Michael D. Franzen, Ph.D.Mark R. Lovell, Ph.D.
The American Psychiatric Publishing Textbook of Neuropsychiatry and Behavioral Neurosciences, Fifth EditionEdited by Yudofsky SC, Hales RE. © 2008 American Psychiatric Publishing, Inc. All rights reserved. www.appi.org
751
Slide Show
Topic headings and reading list
Tables and figures
Highlights for the clinician
Main menu
(About, Contents, Contributors, Publishing facts)

Neuroanatomical and Neurophysiological Determinants of Recovery
Cognitive Rehabilitation of Patients With Neuropsychiatric DisordersAttentional ProcessesMemory
Use of Spared Skills
Repetitive Practice
External Memory Aids
Visual-Perceptual Disorders
Problem Solving and Executive Functions
Interventions Aimed at the Consequences of BehaviorInterventions Aimed at the Antecedents of BehaviorOther Behavioral Approaches
Social Learning ApproachCognitive-Behavioral ApproachAssessment of Treatment Effects
Case Examples of Behavioral Intervention
Conclusion
RECOMMENDED READINGSHalligan PW, Wade DT (eds): The Effectiveness of Rehabilitation
for Cognitive Deficits. New York, Oxford University Press, 2005High WM Jr, Sander AM, Struchen MA, et al (eds): Rehabilitation
for Traumatic Brain Injury. New York, Oxford University Press,
CHAPTER 33 • Topics and Readings
The American Psychiatric Publishing Textbook of Neuropsychiatry and Behavioral Neurosciences, Fifth EditionEdited by Yudofsky SC, Hales RE. © 2008 American Psychiatric Publishing, Inc. All rights reserved. www.appi.org
752
Problem Solving and Executive Functions
Speech and Language
Molar Behaviors
Use of Computers in Cognitive Rehabilitation
Disorders and Associated Treatments
Behavioral Dysfunction After Brain Injury
Behavior Therapy for Patients With Brain ImpairmentTraditional Behavioral Approach
for Traumatic Brain Injury. New York, Oxford University Press, 2005
Klein R, McNamara P, Albert ML: Neuropharmacologic approaches to cognitive rehabilitation. Behav Neurol 17:1–3, 2006
León-Carrión J, von Wild KRH, Zitnay GA (eds): Brain Injury Treatment: Theories and Practices. New York, Taylor & Francis, 2006
Loewenstein D, Acevedo A: Training of cognitive and functionally relevant skills in Mild Alzheimer’s disease: an integrated approach, in Geriatric Neuropsychology: Assessment and Intervention. Edited by Attix DK, Welsh-Bohmer KA. New York, Guilford, 2006, pp 261–274
Murrey GJ: Alternate Therapies in the Treatment of Brain Injury and Neurobehavioral Disorders: A Practical Guide. New York, Haworth Press, 2006
CHAPTER 33 • Tables and Figures
Figure 33–1. Multiple baseline design for the treatment of a patient with brain injury and deficits in attention, memory, and visual-spatial processing
Summary Highlights for the Clinician
The American Psychiatric Publishing Textbook of Neuropsychiatry and Behavioral Neurosciences, Fifth EditionEdited by Yudofsky SC, Hales RE. © 2008 American Psychiatric Publishing, Inc. All rights reserved. www.appi.org
753
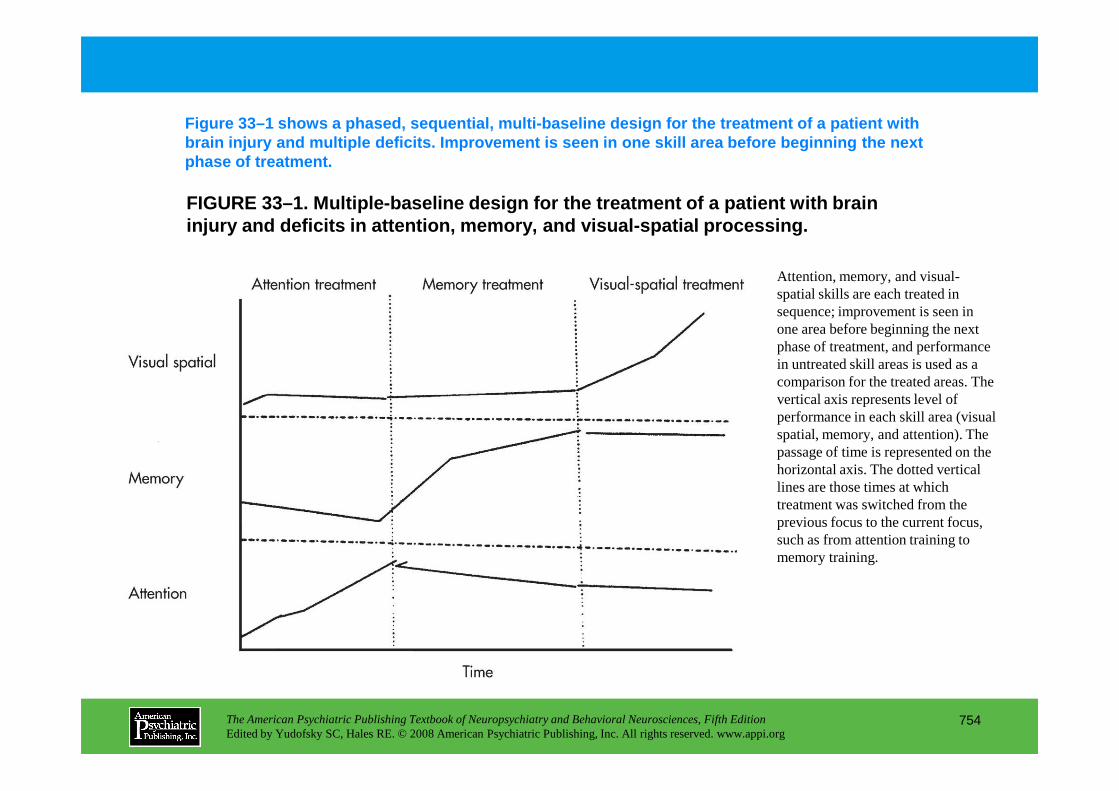
FIGURE 33–1. Multiple-baseline design for the treat ment of a patient with brain injury and deficits in attention, memory, and visua l-spatial processing.
Figure 33–1 shows a phased, sequential, multi-basel ine design for the treatment of a patient with brain injury and multiple deficits. Improvement is seen in one skill area before beginning the next phase of treatment.
Attention, memory, and visual-spatial skills are each treated in sequence; improvement is seen in one area before beginning the next phase of treatment, and performance in untreated skill areas is used as a comparison for the treated areas. The vertical axis represents level of
The American Psychiatric Publishing Textbook of Neuropsychiatry and Behavioral Neurosciences, Fifth EditionEdited by Yudofsky SC, Hales RE. © 2008 American Psychiatric Publishing, Inc. All rights reserved. www.appi.org
754
vertical axis represents level of performance in each skill area (visual spatial, memory, and attention). The passage of time is represented on the horizontal axis. The dotted vertical lines are those times at which treatment was switched from the previous focus to the current focus, such as from attention training to memory training.
Chapter 33 • Highlights for the Clinician
• The neuroanatomical and neurophysiological determinants of recovery vary by etiology; therefore, treatment in different disorders will vary.
• Rehabilitation efforts have been developed to address deficits in attention, memory, visuoperceptual skills, executive functions, and speech and language.
• Behavioral dysfunction is a frequent effect of acquired brain impairment and can complicate treatment of cognitive deficits as well as be a target for intervention in itself.
• Pharmacological and behavioral interventions optimally are integrated to increase the success of rehabilitative efforts.
• The assessment of treatment effects can be documented by using single-subject experimental designs.
The American Psychiatric Publishing Textbook of Neuropsychiatry and Behavioral Neurosciences, Fifth EditionEdited by Yudofsky SC, Hales RE. © 2008 American Psychiatric Publishing, Inc. All rights reserved. www.appi.org
755
designs.
Related Documents