Neuropilin-1 and neuropilin-2 are differentially expressed in human proteinuric nephropathies and cytokine-stimulated proximal tubular cells Herbert Schramek 1 , Rita Sarko ¨zi 1 , Christina Lauterberg 2 , Andreas Kronbichler 1 , Markus Pirklbauer 1 , Rudolf Albrecht 1 , Susie-Jane Noppert 1 , Paul Perco 3 , Michael Rudnicki 1 , Frank M Strutz 2 and Gert Mayer 1 Neuropilin-1 (NRP1) and neuropilin-2 (NRP2) are transmembrane glycoproteins with large extracellular domains that interact with class 3 semaphorins, vascular endothelial growth factor (VEGF) family members, and ligands, such as hepatocyte growth factor, platelet-derived growth factor BB, transforming growth factor-b1 (TGF-b1), and fibroblast growth factor2 (FGF2). Neuropilins (NRPs) have been implicated in tumor growth and vascularization, as novel mediators of the primary immune response and in regeneration and repair; however, their role in renal pathophysiology is largely unknown. Here, we report upregulation of tubular and interstitial NRP2 protein expression in patients with focal segmental glomerulosclerosis (FSGS). In an additional cohort of patients with minimal change disease (MCD), membra- nous nephropathy (MN), and FSGS, elevated NRP2 mRNA expression in kidney biopsies inversely correlated with estimated glomerular filtration rate (eGFR) at the time of biopsy. Furthermore, upregulation of NRP2 mRNA correlated with post-bioptic decline of kidney function. Expression of NRP1 and NRP2 in human proximal tubular cells (PTCs) was differentially affected after stimulation with TGF-b1, interleukin-1b (IL-1b), and oncostatin M (OSM). Although the pro-fibrotic mediators, TGF-b1 and IL-1b, induced upregulation of NRP2 expression but downregulation of NRP1 expression, OSM stimulated the expression of both NRP1 and NRP2. Basal and OSM-induced NRP1 mRNA expression, as well as TGF-b1-induced NRP2 mRNA and protein expression were partially mediated by MEK1/2-ERK1/2 signaling. This is the first report suggesting a differential role of NRP1 and NRP2 in renal fibrogenesis, and TGF-b1, IL-1b, and OSM represent the first ligands known to stimulate NRP2 expression in mammalian cells. Laboratory Investigation (2009) 89, 1304–1316; doi:10.1038/labinvest.2009.96; published online 7 September 2009 KEYWORDS: tubulointerstitial fibrosis; FSGS; neuropilin; TGF-b1; oncostatin M; proximal tubular epithelial cell In contrast to the well-studied neuronal and vascular system, neuropilin (NRP) expression in cells of epithelial origin has received little attention so far. As epithelial cells in the breast, uterus, endometrium, kidney, and lung do express neuropi- lin-1 (NRP1), it is not surprising that tumors of epithelial origin show strong expression of this NRP isoform. 1,2 NRP1 is highly expressed in carcinoma cell lines, such as prostatic and breast carcinoma cells, transitional cell, and renal cell carcinoma cells. 3 In contrast, neoplasms of non-epithelial origin, such as human melanoma cells or human glio- blastoma cells, show little NRP1 expression but high neuro- pilin-2 (NRP2) expression. 3 NRP2 has recently been shown to have a critical and direct role in colorectal carcinoma tumor progression and may represent a potential therapeutic target for cancers in which it is expressed. 4 Very little in- formation is available regarding NRP expression and its regulation in renal tubular epithelial cells. NRP1 mRNA and protein expression has been detected in whole kidney, single and sieved glomeruli, as well as in cultured visceral glo- merular epithelial cells. 5 Furthermore, mRNA expression of NRP1 and NRP2 was observed in immortalized murine inner medullary collecting duct cells and mouse proximal tubular cells (PTCs). 6 In these tubular epithelial cells, vascular endothelial growth factor (VEGF)-induced branching morphogenesis and tubulogenesis was VEGFR2- and NRP1- dependent, suggesting that, in addition to endothelial vas- Received 29 December 2008; revised 2 June 2009; accepted 23 July 2009 1 Department of Internal Medicine IV, Nephrology and Hypertension, Innsbruck Medical University, Innsbruck, Austria; 2 Department of Nephrology and Rheumatology, Georg-August-University Medical Center, Go ¨ ttingen, Germany and 3 Emergentec Biodevelopment GmbH, Vienna, Austria Correspondence: Dr H Schramek, MD, Department of Internal Medicine IV, Nephrology and Hypertension, Innsbruck Medical University, Anichstrasse 35, A-6020 Innsbruck, Austria. E-mail: [email protected] Laboratory Investigation (2009) 89, 1304–1316 & 2009 USCAP, Inc All rights reserved 0023-6837/09 $32.00 1304 Laboratory Investigation | Volume 89 November 2009 | www.laboratoryinvestigation.org

Welcome message from author
This document is posted to help you gain knowledge. Please leave a comment to let me know what you think about it! Share it to your friends and learn new things together.
Transcript
Neuropilin-1 and neuropilin-2 are differentiallyexpressed in human proteinuric nephropathies andcytokine-stimulated proximal tubular cellsHerbert Schramek1, Rita Sarkozi1, Christina Lauterberg2, Andreas Kronbichler1, Markus Pirklbauer1,Rudolf Albrecht1, Susie-Jane Noppert1, Paul Perco3, Michael Rudnicki1, Frank M Strutz2 and Gert Mayer1
Neuropilin-1 (NRP1) and neuropilin-2 (NRP2) are transmembrane glycoproteins with large extracellular domains thatinteract with class 3 semaphorins, vascular endothelial growth factor (VEGF) family members, and ligands, such ashepatocyte growth factor, platelet-derived growth factor BB, transforming growth factor-b1 (TGF-b1), and fibroblastgrowth factor2 (FGF2). Neuropilins (NRPs) have been implicated in tumor growth and vascularization, as novel mediatorsof the primary immune response and in regeneration and repair; however, their role in renal pathophysiology is largelyunknown. Here, we report upregulation of tubular and interstitial NRP2 protein expression in patients with focalsegmental glomerulosclerosis (FSGS). In an additional cohort of patients with minimal change disease (MCD), membra-nous nephropathy (MN), and FSGS, elevated NRP2 mRNA expression in kidney biopsies inversely correlated withestimated glomerular filtration rate (eGFR) at the time of biopsy. Furthermore, upregulation of NRP2 mRNA correlatedwith post-bioptic decline of kidney function. Expression of NRP1 and NRP2 in human proximal tubular cells (PTCs)was differentially affected after stimulation with TGF-b1, interleukin-1b (IL-1b), and oncostatin M (OSM). Although thepro-fibrotic mediators, TGF-b1 and IL-1b, induced upregulation of NRP2 expression but downregulation of NRP1expression, OSM stimulated the expression of both NRP1 and NRP2. Basal and OSM-induced NRP1 mRNA expression, aswell as TGF-b1-induced NRP2 mRNA and protein expression were partially mediated by MEK1/2-ERK1/2 signaling. This isthe first report suggesting a differential role of NRP1 and NRP2 in renal fibrogenesis, and TGF-b1, IL-1b, and OSMrepresent the first ligands known to stimulate NRP2 expression in mammalian cells.Laboratory Investigation (2009) 89, 1304–1316; doi:10.1038/labinvest.2009.96; published online 7 September 2009
KEYWORDS: tubulointerstitial fibrosis; FSGS; neuropilin; TGF-b1; oncostatin M; proximal tubular epithelial cell
In contrast to the well-studied neuronal and vascular system,neuropilin (NRP) expression in cells of epithelial origin hasreceived little attention so far. As epithelial cells in the breast,uterus, endometrium, kidney, and lung do express neuropi-lin-1 (NRP1), it is not surprising that tumors of epithelialorigin show strong expression of this NRP isoform.1,2 NRP1is highly expressed in carcinoma cell lines, such as prostaticand breast carcinoma cells, transitional cell, and renal cellcarcinoma cells.3 In contrast, neoplasms of non-epithelialorigin, such as human melanoma cells or human glio-blastoma cells, show little NRP1 expression but high neuro-pilin-2 (NRP2) expression.3 NRP2 has recently been shownto have a critical and direct role in colorectal carcinoma
tumor progression and may represent a potential therapeutictarget for cancers in which it is expressed.4 Very little in-formation is available regarding NRP expression and itsregulation in renal tubular epithelial cells. NRP1 mRNA andprotein expression has been detected in whole kidney, singleand sieved glomeruli, as well as in cultured visceral glo-merular epithelial cells.5 Furthermore, mRNA expression ofNRP1 and NRP2 was observed in immortalized murine innermedullary collecting duct cells and mouse proximal tubularcells (PTCs).6 In these tubular epithelial cells, vascularendothelial growth factor (VEGF)-induced branchingmorphogenesis and tubulogenesis was VEGFR2- and NRP1-dependent, suggesting that, in addition to endothelial vas-
Received 29 December 2008; revised 2 June 2009; accepted 23 July 2009
1Department of Internal Medicine IV, Nephrology and Hypertension, Innsbruck Medical University, Innsbruck, Austria; 2Department of Nephrology and Rheumatology,Georg-August-University Medical Center, Gottingen, Germany and 3Emergentec Biodevelopment GmbH, Vienna, AustriaCorrespondence: Dr H Schramek, MD, Department of Internal Medicine IV, Nephrology and Hypertension, Innsbruck Medical University, Anichstrasse 35, A-6020Innsbruck, Austria.E-mail: [email protected]
Laboratory Investigation (2009) 89, 1304–1316
& 2009 USCAP, Inc All rights reserved 0023-6837/09 $32.00
1304 Laboratory Investigation | Volume 89 November 2009 | www.laboratoryinvestigation.org

culogenesis, VEGF can induce renal epithelial cell morpho-genesis in a NRP1-dependent fashion.6 Very recently it hasbeen shown that advanced glycation end-products suppressNRP1 expression in podocytes, and that NRP1 expression isdecreased in glomeruli of diabetic db/db mice when com-pared with their nondiabetic littermates.7 Finally, transcriptsof both NRPs were found to be decreased in renal biopsiesfrom patients with diabetic nephropathy compared withtransplant donors.7
Here, we studied expression of NRP1 and NRP2 in tissuesections of patients with focal segmental glomerulosclerosis(FSGS) and different levels of tubulointerstitial fibrosis, aswell as in human PTCs stimulated with the pro-fibroticmediators transforming growth factor-b1 (TGF-b1) and in-terleukin-1b (IL-1b). Immunofluorescence analysis of FSGStissue showed upregulation of tubular and interstitial NRP2expression in fibrotic kidneys. In an additional cohort ofpatients with minimal change disease (MCD), membranousnephropathy (MN), and FSGS, elevated NRP2 mRNAexpression in kidney biopsies correlated with post-biopticdecline of kidney function. Furthermore, the pro-fibroticmediators, TGF-b1 and IL-1b, induced upregulation ofNRP2 expression but downregulation of NRP1 expression,whereas the interleukin-6 family member oncostatin M(OSM) stimulated expression of both NRP1 and NRP2. Basaland OSM-stimulated NRP1 mRNA expression, as well asTGF-b1-induced NRP2 expression was partially U0126- andCl-1040-sensitive, suggesting that the MEK1/2-ERK1/2 sig-naling module is involved in these effects. Together, theseresults suggest a differential role of NRP1 and NRP2 in hu-man renal fibrogenesis and represent the first description ofligands, such as TGF-b1, IL-1b, and OSM, which are able tostimulate NRP2 expression in mammalian cells.
MATERIALS AND METHODSReagentsCell culture reagents were obtained from Gibco (Life Tech-nologies, Lofer, Austria). U0126 was purchased from Cal-biochem (Nottingham, UK) and Cl-1040 was kindlyprovided by P Cohen (MRC Protein Phosphorylation Unit,University of Dundee, Dundee, UK). Recombinant humanOSM was obtained from Sigma (St Louis, MO, USA),whereas recombinant human TGF-b1 and recombinant hu-man IL-1b were purchased from R&D Systems. All otherreagents were obtained from Sigma.
Cell CultureHuman PTCs human kidney-2 (HK-2) were cultured inKeratinocyte-Serum Free Medium (KSFM) containing 10%fetal bovine serum (FBS), 5 ng/ml recombinant epidermalgrowth factor (rEGF), 0.05 mg/ml bovine pituitary extract,100 units/ml penicillin, and 100 mg/ml streptomycin.8–10 Thecells (passages 20–30) were grown at 371C in a humidified5% CO2 atmosphere, and split at a 1:10 ratio, once a week.After growth to a subconfluent state, cells were washed once,
made quiescent by incubation in serum- and supplement-free medium for 48 h, and then used for experiments.Stimulations with ligands, such as OSM, TGF-b1 and IL-1b,or combinations thereof were performed in the absence ofserum and any other growth supplements.
Western Blot AnalysisCells were washed with ice-cold phosphate buffered saline(PBS) and lysed in 1� Laemmli buffer.10 For the examina-tion of ERK1/2 phosphorylation and ERK2 protein expres-sion, cells were lysed in ice-cold RIPA lysis buffer as describedpreviously.10 Insoluble material was removed by centrifuga-tion at 12 000 g for 15 min at 41C. The protein concentrationswere determined using a microbicinchoninic acid assay(Pierce) or Coomassie protein assay (Pierce) with BSA as astandard. Cell lysates were matched for protein, separatedby 10% SDS-PAGE, and transferred to a polyvinylidenedifluoride microporous membrane. Subsequently, mem-branes were probed with one of the following specific anti-bodies: anti-NRP1 (A-12) mouse monoclonal antibody,anti-NRP2 (C-9) mouse monoclonal antibody, anti-ERK2(C-14) goat polyclonal antibody (all from Santa CruzBiotechnology, Santa Cruz, CA, USA), anti-b-actin mousemonoclonal antibody (Sigma), anti-phospho-p44/42 MAPK(ERK1/2) Thr202/Tyr204 rabbit polyclonal antibody (CellSignaling Technology, Beverly, MA, USA). After extensivewashing of the sheets in TBS, 0.1% Tween-20, the primaryantibodies were detected using horseradish peroxidase-conjugated goat anti-mouse IgG, rabbit anti-goat IgG, orgoat anti-rabbit IgG (all from Santa Cruz Biotechnology),and visualized by ECL Plus Western Blotting Detection sys-tem (GE Healthcare, Buckinghamshire, UK) or by LumiGLOWestern Blot Detection system (Cell Signaling Technology).
Renal BiopsiesWe used 20 kidney biopsies obtained from patients withnephrotic kidney diseases during their routine diagnosticworkup for which we had sufficient clinical follow-up data(Table 3). The histological diagnoses were MCD (n¼ 8), MN(n¼ 7), and FSGS (n¼ 5). Renal function was assessed at twotime points by calculating the estimated glomerular filtrationrate (eGFR) using the MDRD formula. The median follow-up time was 25 months (12–32 months). Patients weredefined stable (n¼ 13) when eGFR was 460 ml/min/1.73 m2
at both time points, or when eGFR was o60 ml/min/1.73 m2
at either time point, and DeGFR was higher than �1 ml/min/1.73 m2 per year. Patients were defined as progressive (n¼ 7)when eGFR was 460 ml/min/1.73 m2 at the time of biopsyand o60 ml/min/1.73 m2 during follow-up, or when eGFRwas o60 ml/min/1.73 m2 at both time points and DeGFRwas o�1 ml/min/1.73 m2 per year, or when they reachedend-stage renal disease. RNA was isolated using QiagenRNeasy Mini kit (Qiagen, Valencia, CA, USA), the sampleswere preamplified using TaqMan PreAmp Master Mix(Ambion, Austin, TX, USA) together with the respective
Differential neuropilin expression in FSGS
H Schramek et al
www.laboratoryinvestigation.org | Laboratory Investigation | Volume 89 November 2009 1305

TaqMan probes (vide infra) for B400-fold amplification ofthe original RNA. The accuracy of this amplification methodwas tested, and we did not find any amplification bias (datanot shown). In all biopsy real-time PCR experiments, weused PPIA (cyclophilin A; Hs99999904_m1) as an en-dogenous control. The use of surplus material for researchpurposes after routine diagnostic workup was approved bythe Institutional Review Board of the Innsbruck MedicalUniversity.
RNA Isolation and Real-Time PCR AnalysisTotal cellular RNA was extracted using TRI Reagent (Mole-cular Research Center, Cincinnati, OH, USA).9 RNA quantitywas estimated by spectrophotometric analysis. Reverse tran-scription was carried out in 20 ml volume using 2 mg totalRNA, 1 mM random hexanucleotides as primer (RocheDiagnostics, Indianapolis, IN, USA), and Omniscript ReverseTranscriptase (Qiagen) according to the manufacturer’sinstructions. The reaction was carried out in RNase-freecondition at 371C for 60 min and heated at 931C for 5 min toinactivate RTase. The cDNA was stored at �201C until use inTaqMan Gene Expression Assays (Applied Biosystems).
PCR was carried out using 2ml of cDNA template from theRT reaction, 1� TaqMan Universal PCR Master Mix con-taining dNTPs, AmpErase UNG, and AmpliTaq Gold DNApolymerase (Applied Biosystems), and premade TaqMan GeneExpression Assay Mix consisting of FAM dye-labeled TaqManMGB probe and unlabeled PCR primers for human NRP1(Hs00826129_m1), for human NRP2 (Hs00187290_m1), orfor human VEGF-A (Hs00173626_m1), respectively (AppliedBiosystems).9 Thermal cycler conditions were as follows: 501Cfor 2 min and 951C for 10 min, followed by 45 cycles of am-plification at 951C for 15 s and 601C for 1 min. All reactionswere run in duplicate. Each amplification experiment wascarried out in a 96-well PCR plate on an ABI 7500 SequenceDetection System. All cellular RNA samples were normalizedbased on the TaqMan Gene Expression Assays for humanGAPDH (Hs99999905_m1). Relative changes in gene expres-sion (fold change) were calculated using the 2�DDCT method.
Indirect ImmunofluorescenceHuman PTCs were grown to subconfluence on chamberslides (Lab-tek) and starved for 24 h. Next, cells were sti-mulated with TGF-b1 at a concentration of 10 ng/ml for 24,48, and 72 h. Controls were grown in regular DMEM med-ium. After the end of the stimulation period, cells were wa-shed three times with PBS and fixed with methanol/acetone(1:1) at �201C for 20 min. Cells were subsequently washedthree times with PBS, and blocked with 1% BSA in PBS for1 h. Wells were incubated with the anti-NRP1 or anti-NRP2antibody (at a concentration of 1:25) for 1 h at 371C, washedthree times with PBS, and incubated with the rhodamine-conjugated Fab secondary antibody (dilution 1:100, Chemi-con, Hofheim, Germany) for 1 h at 371C. Nuclei were coun-terstained with DAPI (dilution 1:1000 of a stock of 1 mg/ml).
After washing three times with PBS, cells were mounted byDAKO fluorescence mounting medium (DAKO, Hamburg,Germany). Visualization was performed using an OlympusIX10 fluorescence microscope.
For NRP1 and NRP2 expression studies in renal tissue,eight kidney sections from biopsies from patients with FSGSand variable degrees of tubulointerstitial fibrosis werestained. Kidney sections from non-tumor parts of tumornephrectomies served as controls. Stainings were performedby indirect immunofluorescence. Briefly, paraffin sectionswere deparaffinized followed by blocking with 3% H2O2 for15 min. Incubation with the primary antibodies (anti-NRP1and anti-NRP2, both 1:200) was followed by incubation withthe Rhodamine-labeled secondary antibody (Chemicon) at adilution of 1:500. Before analysis, nuclei were counterstainedwith DAPI (dilution of 1:1000 of a 1 mg/ml stock solution).Specificity of antibody labeling was shown by the lack ofstaining after substituting proper control immunoglobulinsfor the primary antibodies. Slides were mounted with DAKOfluorescent mounting medium (DAKO) and images werevisualized using an Olympus IX10 fluorescence microscope.Tubular stainings were classified by two independent in-vestigators who had been blinded for the diagnosis andstaining performed as negative (+), positivity in o25% oftubuli (þ ), staining of 25–50% of tubuli (þ þ ), and po-sitivity of 450% of tubuli (þ þ þ ). In addition, stainingpatterns were noted. The use of kidney biopsies for researchpurposes was approved by the local ethics committee of theUniversity of Goettingen, and written consent was obtainedfrom all patients before biopsy.
Statistical AnalysesPearson’s R and a two-tailed t-test were used for calculationof correlation between real-time PCR results of NRP1 andNRP2 mRNA expression in the renal biopsies, the eGFR atthe time of biopsy, and the decline of eGFR during follow-up,respectively. Two-tailed t-tests were used to assess thesignificance of differences of ligand and inhibitor adminis-tration on the mRNA expression in human PTC whencompared with untreated cells. Fold alterations in mRNAlevels are expressed as mean±s.e.m.
RESULTSUpregulation of Endoluminal and Interstitial NRP2Expression in Human FSGSAs preliminary real-time PCR analyses of microdissectedPTC obtained from patients with a progressive loss of kidneyfunction revealed alterations in NRP expression, we decidedto carry out immunofluorescence analysis of NRP1 andNRP2 expression in tissue sections from FSGS patients(n¼ 8) with variable degrees of tubulointerstitial fibrosiswhen compared with expression levels in normal controlkidneys (n¼ 3). Clinical characteristics of FSGS patients andcontrols are summarized in Table 1. As depicted in Figure 1b,basal NRP1 protein expression in control kidneys was
Differential neuropilin expression in FSGS
H Schramek et al
1306 Laboratory Investigation | Volume 89 November 2009 | www.laboratoryinvestigation.org

Table 1 Characteristics of patients and controls
Diagnosis Gender Age (years) S-Creatinin (mg/dl) Proteinuria (g/24 h) Interstitial fibrosis
Control 1 Normal kidney Male 61 0.8 + +
Control 2 Normal kidney Male 57 0.9 + +
Control 3 Normal kidney Female 71 1.1 + +
Patient 1 FSGS Male 58 2.1 1.7 35%
Patient 2 FSGS Female 56 2.0 3.2 50%
Patient 3 FSGS Female 61 1.9 1.4 45%
Patient 4 FSGS Female 73 1.4 0.8 15%
Patient 5 FSGS Male 57 1.3 1.1 25%
Patient 6 FSGS Female 61 1.5 1.1 30%
Patient 7 FSGS Female 49 1.8 2.8 50%
Patient 8 FSGS Male 61 1.5 3.7 20%
FSGS, focal segmental glomerulosclerosis.
Figure 1 Indirect immunofluorescence staining of NRP1 and NRP2 protein expression in tissue sections of a normal human kidney. (a and b) Selected
tubular epithelial cells show NRP1 expression (red) with a tendency towards staining at the apical side (b), when compared with negative controls (a).
(c and d) Conversely, tubular NRP2 expression (red) seemed to be located more to the perinuclear cytoplasm (d). Panel c depicts the respective negative
control. Nuclei were counterstained with DAPI (blue). Representative micrographs are depicted. Original magnification � 400.
Differential neuropilin expression in FSGS
H Schramek et al
www.laboratoryinvestigation.org | Laboratory Investigation | Volume 89 November 2009 1307

detected in several tubular epithelial cells with a tendencytowards staining of apical membrane domains. Conversely,tubular NRP2 expression seemed to be located more to theperinuclear cytoplasm (Figure 1d). Figures 1a and c show therespective negative-control stainings in normal adult humankidneys. In contrast, immunofluorescence analysis of FSGStissue sections revealed robust upregulation of NRP2 expres-sion in fibrotic kidneys with tubular endoluminal pre-dominance (Figure 2c) and with increased interstitial staining(Figure 2d). Although tubular staining was mainly detectedin PTC, interstitial staining seemed to be localized mainly tointerstitial fibroblasts. Moreover, atrophic tubules and mor-phologically unchanged tubules displayed increased NRP2staining. This increased NRP2 expression seemed to be as-sociated with a tendency towards the downregulation oftubular NRP1 expression in FSGS kidneys when comparedwith control kidneys (Table 2). A semi-quantitativeanalysis of all the experiments in eight FSGS patients andthree control kidneys is summarized in Table 2. These resultssuggest that the two NRP isoforms are differentially expressedin FSGS patients with variable degrees of tubulointerstitialfibrosis when compared with those of normal controlkidneys.
Increased NRP2 mRNA Expression in Nephrotic KidneyDiseases Correlates Inversely with eGFR at the Time ofBiopsy and is Associated with Adverse Renal PrognosisTo validate these findings, we analyzed mRNA expression ofNRP1 and NRP2 in 20 additional kidney biopsies from pa-tients with nephrotic kidney diseases, such as MCD, MN, andFSGS (Table 3 and Figure 3). mRNA expression of NRP2, butnot of NRP1, showed a significant correlation withrenal function (expressed as eGFR) at the time of biopsy(Figure 3a). Patients with impaired renal function showedhigher NRP2 mRNA expression, whereas patients with nearnormal renal function showed low NRP2 mRNA values(Figure 3a). Furthermore, we analyzed the correlation ofNRP1 and NRP2 mRNA levels with the clinical follow-upof these patients. Although NRP1 mRNA showed higherexpression in progressive patients when compared with stablenephrotic diseases, this difference did not reach significance(1.4-fold; P¼ 0.08). However, NRP2 was significantly upre-gulated in those patients who showed a decline of renalfunction during the median follow-up period of 25 months(1.7-fold; P¼ 0.04) (Figure 3b). These results suggest that anincreased mRNA expression of NRP2, but not of NRP1,predicts poor renal outcome in various renal nephroticpathologies already at the time of biopsy.
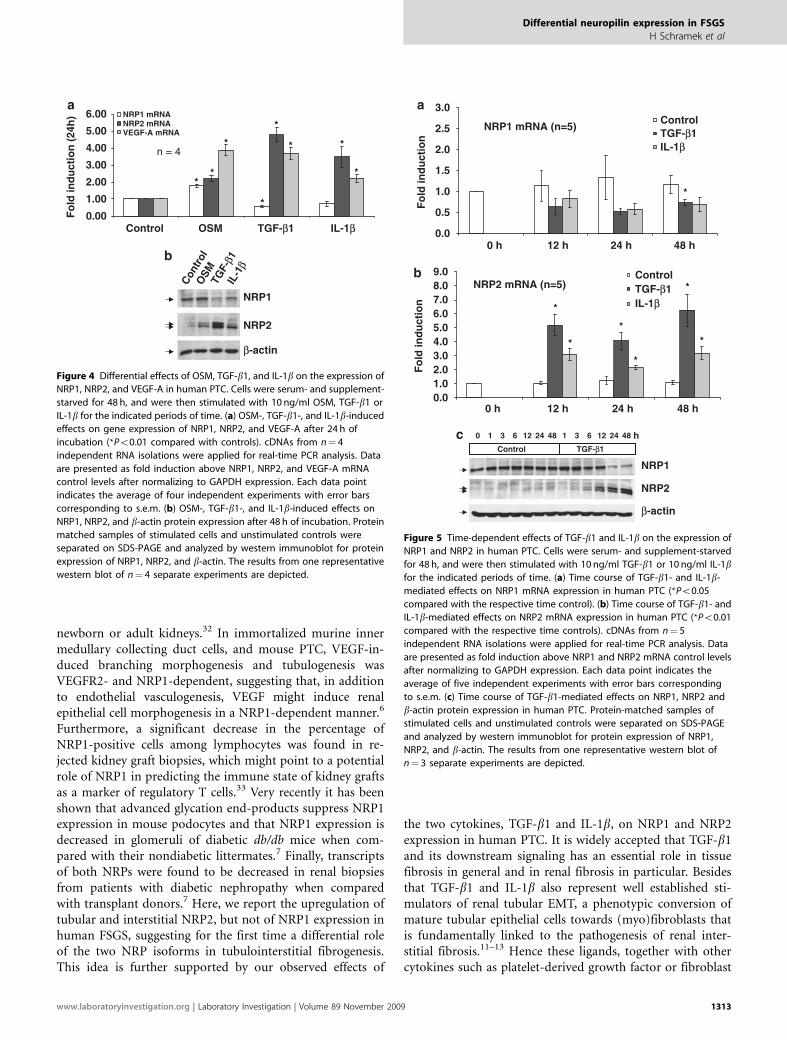
The Pro-Fibrotic Mediators, TGF-b1 and IL-1b, InhibitNRP1 Expression But Stimulate NRP2 Expression inHuman Proximal Tubular CellsAmong the many factors that regulate the renal fibroticprocess, TGF-b1 is one that have a central role.11–14 Otherfactors, such as IL-1b, can regulate epithelial–mesenchymaltransition (EMT) and fibrosis through modulation ofTGF-b1 expression or activity,15 or in the case of OSM, havepotential to act as both a pro-EMT molecule and a pro-METmediator.10 As human kidneys with various degrees oftubulointerstitial fibrosis showed robust upregulation oftubular and interstitial NRP2 protein expression, weinvestigated the effects of pro-fibrotic mediators TGF-b1 andIL-1b when compared with OSM in human PTCs in culture.A 24 h stimulation of human PTC with TGF-b1 (10 ng/ml) orIL-1b (10 ng/ml) led to a partial inhibition of NRP1 mRNAexpression and a strong induction of NRP2 mRNA levels(Figure 4a). When compared with unstimulated controls,TGF-b1- and IL-1b-induced NRP2 mRNA expression was4.8-fold and 3.5-fold, respectively (n¼ 4; Po0.01). In con-trast, 10 ng/ml OSM stimulated both NRP1 and NRP2mRNA expression 1.8- and 2.2-fold, respectively (Figure 4a;n¼ 4, Po0.01). All three cytokines of interest inducedVEGF-A mRNA expression in human PTC after 24 h(Figure 4a). These results from real-time PCR were verifiedby western blot analysis. After 48 h of incubation, TGF-b1and IL-1b inhibited NRP1 protein expression but stimu-lated NRP2 protein expression (Figure 4b), whereas OSMincreased both NRP1 and NRP2 protein levels (Figure 4b).Administration of IL-1b together with TGF-b1 revealedan additive inhibitory effect on NRP1 protein expression(data not shown). The effects of TGF-b1 and IL-1b on NRP1and NRP2 mRNA expression were time dependent. TGF-b1-mediated inhibition of NRP1 mRNA expression startedafter 12 h and reached significance after 48 h of incubation(Figure 5a; n¼ 5, Po0.05). IL-1b led to a similar, albeit notsignificant tendency towards inhibition of NRP1 mRNAexpression (Figure 5a; n¼ 5, P¼ 0.056 after 48 h of incuba-tion). TGF-b1- and IL-1b-stimulated NRP2 mRNA expres-sion showed similar kinetics (Figure 5b) as did the OSM-induced VEGF-A mRNA expression (data not shown). After48 h of stimulation, TGF-b1 and IL-1b led to a 6.3- and a3.2-fold increase in NRP2 mRNA expression, respectively(Figure 5b; n¼ 5, Po0.01). TGF-b1-mediated effects onNRP1 and NRP2 protein expression showed a similartime dependence (Figure 5c). Both TGF-b1-inhibited NRP1protein expression and TGF-b1-stimulated NRP2 proteinexpression started as early as 6 h after incubation and showed
Figure 2 Indirect immunofluorescence staining of NRP1 and NRP2 protein expression in tissue sections of human kidneys with variable degrees of
tubulointerstitial fibrosis. (a and b) Tubular NRP1 protein expression (red) in fibrotic kidneys. (c and d) Tubular NRP2 expression (red) showed robust
upregulation in fibrotic kidneys and was located predominantly at the endoluminal side (c). In addition, increased interstitial NRP2 expression was observed
(d). (e and f) Substitution of proper control immunoglobulins for the primary antibodies showed lack of specific staining. Nuclei were counterstained with
DAPI (blue). Representative micrographs are depicted. Original magnification � 400.
Differential neuropilin expression in FSGS
H Schramek et al
1308 Laboratory Investigation | Volume 89 November 2009 | www.laboratoryinvestigation.org

Differential neuropilin expression in FSGS
H Schramek et al
www.laboratoryinvestigation.org | Laboratory Investigation | Volume 89 November 2009 1309

a maximum effect after 48 h. All together these results suggestthat in human PTC in culture the two pro-fibrotic mediators,TGF-b1 and IL-1b, represent strong stimulators of NRP2expression but inhibitors of NRP1 expression. In contrast,the IL-6 family member OSM seems to induce expression ofboth NRP2 and NRP1.
These results were corroborated by immunofluorescencestudies showing that NRP2 was not detectable in human PTCin culture under basal conditions (Figure 6a) and that NRP1expression was not inducible by stimulation with 10 ng/mlTGF-b1 (Figure 6b). Conversely, the expression of NRP2 wasinducible by TGF-b1 in a time-dependent manner peakingafter 48 (Figure 6c) and 72 h (Figure 6d). Interestingly, NRP2expression was restricted almost exclusively to cells under-going mitosis. In summary, TGF-b1, IL-1b, and OSMrepresent the first mediators known to affect NRP2 expres-sion in mammalian cells. Moreover, these findings are thefirst evidence for a differential regulation of NRP1 and NRP2mRNA expression in cytokine-stimulated renal tubularepithelial cells of human origin and support the idea ofa differential role of both NRPs in renal tubulointerstitialfibrogenesis.
TGF-b1-Induced NRP2 mRNA and Protein Expression isMEK1/2-ERK1/2 DependentIn addition to the canonical Smad signaling pathways thatare known to have a role in the regulation of cell growth,differentiation and TGF-b-induced EMT, Smad-independentTGF-b-regulated networks are known to include Ras-Raf-MEK-ERK signaling.16 Cooperative signaling between
TGF-b1 and MEK1/2-ERK1/2 is required for the main-tenance of complete EMT in various epithelial cell types,17,18
and OSM is a strong stimulator of the mitogen-activatedprotein kinases, ERK1, ERK2, and ERK5, in human PTC.10
Thus, we investigated the regulatory function of theintracellular signaling molecules ERK1 and ERK2 for NRP1and NRP2 expression in OSM- when compared withTGF-b1-stimulated human PTC. Preincubation of humanPTC with 10 mM of the synthetic MEK1/2 inhibitor U0126slightly inhibited basal and OSM-induced NRP1 mRNAexpression after 24 h (n¼ 6, Po0.05), but did not affectTGF-b1- and IL-1b-mediated inhibition of NRP1 mRNAexpression (Figure 7a). In contrast, 10 mM U0126 partiallyinhibited TGF-b1-induced NRP2 mRNA expression in hu-man PTC from a 3.85- ± 0.35-fold increase in the absence ofU0126 to a 2.63- ± 0.13-fold increase in the presenceof U0126 (Figure 7b; n¼ 6, Po0.01). Similar results wereobtained using 1mM of the MEK1/2 inhibitor Cl-1040, whichpartially inhibited TGF-b1-induced NRP2 protein expressionwithout having an effect on basal NRP2 protein expression(Figure 7c). In parallel, the synthetic MEK1/2 inhibitorCl-1040 (PD184352) completely inhibited ERK1/2 phos-phorylation in the absence and in the presence of OSM orTGF-b1 after 24 h of incubation without affecting ERK2protein expression (Figure 7c). Furthermore, Cl-1040inhibited rapid OSM-induced ERK1/2 phosphorylation after10 min of stimulation (Figure 7c). At a concentration of1 mM, Cl-1040 has previously been reported to inhibit basaland EGF-induced ERK1/2 phosphorylation, but not ERK5phosphorylation in human PTC.17 Thus, these results suggestthat OSM-induced NRP1 mRNA expression and TGF-b1-induced NRP2 mRNA and protein expression is partiallymediated by MEK1/2-ERK1/2 signaling.
DISCUSSIONOur study shows four novel findings with respect to apathophysiological role of NRP isoforms 1 and 2 and theirregulation in human kidneys: (i) Tubular and interstitialNRP2 expression is upregulated in human FSGS kidneys withvariable degrees of tubulointerstitial fibrosis. (ii) IncreasedNRP2 mRNA expression in separate kidney biopsies frompatients with nephrotic kidney diseases correlates inverselywith eGFR at the time of biopsy and is associated withadverse renal prognosis. (iii) NRP1 and NRP2 expression inhuman PTC is differentially affected by the pro-fibroticcytokines TGF-b1 and IL-1b when compared with the IL-6family member OSM. TGF-b1 and IL-1b induce upregu-lation of NRP2 expression and downregulation of NRP1expression in human PTC. (iv) OSM-stimulated NRP1mRNA expression and TGF-b1-stimulated NRP2 expressionare U0126- and Cl-1040-sensitive suggesting that these effectsare at least partially mediated by the MEK1/2-ERK1/2 sig-naling pathway.
NRP1 was originally identified as a neuronal cell surfaceprotein.19 Subsequently, analysis of NRP1 transgenic and
Table 2 Degree of tubulointerstitial fibrosis and intensity oftubular NRP1 and NRP2 stainings
Diagnosis Interstitialfibrosis
Tubular NRP1staining
Tubular NRP2staining
Control 1 + +(endoluminal) +(diffuse)
Control 2 + +(endoluminal) +(perinuclear)
Control 3 + +(endoluminal) +(perinuclear)
FSGS 35% (+) ++(endoluminal)
FSGS 50% + ++(endoluminal)
FSGS 45% + +(endoluminal)
FSGS 15% (+) +(perinuclear)
FSGS 25% + +(perinuclear)
FSGS 30% + ++(diffuse)
FSGS 50% + ++(endoluminal)
FSGS 20% + +(endoluminal)
FSGS, focal segmental glomerulosclerosis.
Owing to different stainings patterns, the respective predominant stainingpattern is indicated in parenthesis. +¼negative, (+)¼weak, +¼positive,++¼ robustly positive, +++¼ highly positive.
Differential neuropilin expression in FSGS
H Schramek et al
1310 Laboratory Investigation | Volume 89 November 2009 | www.laboratoryinvestigation.org

Table 3 Patients characteristics
Subject no. Diagnosis Gender Age (years) eGFR biopsy(ml/min/1.73 m2)
Proteinuriabiopsy (g/g)
eGFR follow-up(ml/min/1.73 m2)
Proteinuriafollow-up (g/g)
Follow-uptime(months)
DeGFR(ml/min/year)
Interstitialfibrosis
Stable patients
NC16 MCD M 31 77 7.0 92 0.1 24 7.6 Mild
NC17 MCD F 56 109 17.0 134 0.0 30 9.7 None
NC18 MCD M 41 77 1.3 78 0.6 27 0.4 None
NC19 MCD M 69 57 8.0 61 0.2 24 2.2 Severe
NC27 pFSGS F 26 115 2.9 132 0.1 24 8.4 None
NC43 pFSGS M 31 55 4.4 55 2.2 25 �0.2 Severe
NC56 pFSGS F 42 85 1.8 77 5.4 26 �3.5 Mild
NC70 MCD F 31 113 5.8 85 3.7 25 �13.5 Mild
NC76 MCD F 53 43 9.6 58 0.0 25 7.5 Mild
NC81 MCD M 20 136 2.2 112 0.1 12 �23.1 None
NC82 MCD F 54 81 11.3 86 0.9 23 2..9 Mild
NC23 MN M 71 63 3.4 65 0.2 24 0.8 Mild
NC72 MN M 53 87 8.7 77 1.9 25 �4.8 Moderate
Progressive patients
NC42 pFSGS F 20 47 1.7 40 0.4 32 �2.8 Mild
NC44 pFSGS M 43 57 4.5 41 5.4 26 �7.5 None
NC39 MN F 63 37 8.5 11 6.9 26 �12.3 Moderate
NC51 MN M 51 100 1.3 23 7.6 26 �36.1 Mild
NC52 MN M 71 68 2.5 31 2.4 25 �18.0 Mild
NC73 MN F 69 79 4.8 50 1.2 27 �12.9 Mild
NC89 MN F 63 154 3.0 31 1.0 22 �65.7 Mild
F, female; M, male.
MCD, minimal change disease; pFSGS, primary focal-segmental glomerulosclerosis; MN, membranous nephropathy. Interstitial fibrosis was scored as none, mild (o10%), moderate (10–30%) and severe (430 %).
We analyzed NRP1 and NRP2 mRNA expression in 20 kidney biopsies from patients with nephrotic kidney diseases.
Diffe
ren
tial
ne
uro
pilin
ex
pre
ssion
inF
SG
S
HSch
ramek
eta
l
ww
w.la
bo
rato
ryinv
estig
atio
n.o
rg|
Labo
ratory
Investig
ation
|V
olu
me
89
No
vem
ber
20
09
13
11

deficient mouse and zebrafish models established an essentialrole of NRP1 in the development of the embryonic nervousand cardiovascular systems.20–23 NRPs are also highly ex-pressed in diverse tumor cell lines and human neoplasms andhave been implicated in tumor growth and vasculariza-tion.2–4,24,25 More recently, it has been reported that NRP1might have a role as a novel mediator of the primary immuneresponse, as well as in tissue regeneration and repair.26
Together these findings suggest that NRPs are multi-functional co-receptors essential for neuronal and cardio-vascular development, but potentially have additionalfunctions in diverse physiological and disease-related set-tings. Thus, and on the basis of the preliminary real-timePCR analyses of microdissected proximal tubular cells frompatients with a progressive loss of kidney function, it was ofinterest to us to study the expression of the two NRP iso-forms in renal tissue sections of patients suffering from FSGS.Interestingly, these experiments revealed reduced luminalNRP1 expression associated with the upregulation ofendoluminal and interstitial NRP2 expression in humanFSGS. These results were corroborated by the finding of aninverse correlation of increased NRP2 mRNA expression withimpaired renal function at the time of biopsy and with ad-verse renal outcome in various nephrotic kidney diseases,such as MCD, MN, and FSGS. Hence, an increased expres-sion of NRP2 mRNA may predict poor renal outcomein renal nephrotic pathologies already at time of biopsy.
Clinical studies suggest that NRP1 has a role in tumorgrowth and disease progression.3,25,27 Overexpression ofNRP1 has been shown to be positively associated with themetastatic potential, advanced stage, and clinical grade ofprostate carcinoma.28 NRP1 upregulation in gastrointestinalcarcinomas seems to correlate with invasive behavior andmetastatic potential.29 Co-expression of NRP1 and NRP2also increased in the progression from dysplasia to micro-invasive lung carcinoma, and correlated significantly withtumor progression and poor prognosis in patients with non-small-cell lung carcinoma.30 Although most studies haveindicated a pro-tumorigenic role of NRPs, some reportssuggest that NRP1 has a more complex role in some tumortypes. NRP1 overexpression in Panc-1 cells was found toreduce tumor volume and incidence,31 and there is alsoevidence pointing to potentially differential or antagonisticroles of NRP1 and NRP2 in tumor cell regulation.27 Inagreement with murine studies, data from human surgicalwounds indicate endothelial NRP1 upregulation early in thewound-healing process, that is, by 2 weeks after injury.26
Thereafter, NRP1 expression is downregulated as tissue repaircontinues. To date there is no evidence that NRP2 has a rolein wound healing.26
In contrast to these reports, very little is known about apossible physiological or pathophysiological role of NRPs inthe kidney. In embryonic rat and mouse kidneys, NRP1 andespecially NRP2 are several fold more abundant than in
NRP1 mRNA
0.00
0.05
0.10
0.15
eGFR at time of biopsy
Rat
io to
hou
seke
eper
R = - 0.24n.s.
NRP2 mRNA
0.00
0.05
0.10
eGFR at time of biopsy
Rat
io to
hou
seke
eper
R = - 0.50P < 0.05
0.00
0.05
0.10
0.15
NRP1 mRNA NRP2 mRNA
ratio
to h
ouse
keep
er
StableProgressive
*
120 16020 40 60 80 100 140 120 16020 40 60 80 100 140
Figure 3 Real-time PCR analysis of renal biopsy material from patients with nephrotic kidney diseases. NRP1 and NRP2 mRNA expression values were
calculated as ratio to the endogenous control PPIA (cyclophilin A). (a) mRNA expression of NRP2, but not of NRP1, showed a significant inverse correlation
with renal function (expressed as eGFR) at time of biopsy. (b) Correlation of NRP1 and NRP2 mRNA levels with the clinical follow-up of these patients.
Patients were defined as stable (n¼ 13) or progressive (n¼ 7) according to loss of eGFR during follow-up as described in section Materials and Methods.
NRP1 mRNA expression showed a tendency to higher values in progressive patients (P¼ 0.08), whereas NRP2 mRNA was significantly (P¼ 0.04) upregulated
in progressive patients (*Po0.05).
Differential neuropilin expression in FSGS
H Schramek et al
1312 Laboratory Investigation | Volume 89 November 2009 | www.laboratoryinvestigation.org
newborn or adult kidneys.32 In immortalized murine innermedullary collecting duct cells, and mouse PTC, VEGF-in-duced branching morphogenesis and tubulogenesis wasVEGFR2- and NRP1-dependent, suggesting that, in additionto endothelial vasculogenesis, VEGF might induce renalepithelial cell morphogenesis in a NRP1-dependent manner.6
Furthermore, a significant decrease in the percentage ofNRP1-positive cells among lymphocytes was found in re-jected kidney graft biopsies, which might point to a potentialrole of NRP1 in predicting the immune state of kidney graftsas a marker of regulatory T cells.33 Very recently it has beenshown that advanced glycation end-products suppress NRP1expression in mouse podocytes and that NRP1 expression isdecreased in glomeruli of diabetic db/db mice when com-pared with their nondiabetic littermates.7 Finally, transcriptsof both NRPs were found to be decreased in renal biopsiesfrom patients with diabetic nephropathy when comparedwith transplant donors.7 Here, we report the upregulation oftubular and interstitial NRP2, but not of NRP1 expression inhuman FSGS, suggesting for the first time a differential roleof the two NRP isoforms in tubulointerstitial fibrogenesis.This idea is further supported by our observed effects of
the two cytokines, TGF-b1 and IL-1b, on NRP1 and NRP2expression in human PTC. It is widely accepted that TGF-b1and its downstream signaling has an essential role in tissuefibrosis in general and in renal fibrosis in particular. Besidesthat TGF-b1 and IL-1b also represent well established sti-mulators of renal tubular EMT, a phenotypic conversion ofmature tubular epithelial cells towards (myo)fibroblasts thatis fundamentally linked to the pathogenesis of renal inter-stitial fibrosis.11–13 Hence these ligands, together with othercytokines such as platelet-derived growth factor or fibroblast
0.0
0.5
1.0
1.5
2.0
2.5
3.0
Fo
ld in
du
ctio
n
ControlTGF-β1IL-1β
NRP1 mRNA (n=5)
*
0.01.02.03.04.05.06.07.08.09.0
Fo
ld in
du
ctio
n
Control
Control
TGF-β1IL-1β
NRP2 mRNA (n=5)
*
*
*
*
*
*
TGF-β1
0 1 3 6 12 24 48 1 3 6 12 24 48
NRP1
NRP2
β-actin
0 h 12 h 24 h 48 h
0 h 12 h 24 h 48 h
h
Figure 5 Time-dependent effects of TGF-b1 and IL-1b on the expression of
NRP1 and NRP2 in human PTC. Cells were serum- and supplement-starved
for 48 h, and were then stimulated with 10 ng/ml TGF-b1 or 10 ng/ml IL-1bfor the indicated periods of time. (a) Time course of TGF-b1- and IL-1b-
mediated effects on NRP1 mRNA expression in human PTC (*Po0.05
compared with the respective time control). (b) Time course of TGF-b1- and
IL-1b-mediated effects on NRP2 mRNA expression in human PTC (*Po0.01
compared with the respective time controls). cDNAs from n¼ 5
independent RNA isolations were applied for real-time PCR analysis. Data
are presented as fold induction above NRP1 and NRP2 mRNA control levels
after normalizing to GAPDH expression. Each data point indicates the
average of five independent experiments with error bars corresponding
to s.e.m. (c) Time course of TGF-b1-mediated effects on NRP1, NRP2 and
b-actin protein expression in human PTC. Protein-matched samples of
stimulated cells and unstimulated controls were separated on SDS-PAGE
and analyzed by western immunoblot for protein expression of NRP1,
NRP2, and b-actin. The results from one representative western blot of
n¼ 3 separate experiments are depicted.
n = 4
0.00
1.00
2.00
3.00
4.00
5.00
6.00
Fo
ld in
du
ctio
n (
24h
) NRP1 mRNANRP2 mRNAVEGF-A mRNA
**
*
*
*
* *
*
NRP1
NRP2
β-actin
OSM
IL-1
β
TGF-
β1
Con
trol
Control OSM TGF-β1 IL-1β
Figure 4 Differential effects of OSM, TGF-b1, and IL-1b on the expression of
NRP1, NRP2, and VEGF-A in human PTC. Cells were serum- and supplement-
starved for 48 h, and were then stimulated with 10 ng/ml OSM, TGF-b1 or
IL-1b for the indicated periods of time. (a) OSM-, TGF-b1-, and IL-1b-induced
effects on gene expression of NRP1, NRP2, and VEGF-A after 24 h of
incubation (*Po0.01 compared with controls). cDNAs from n¼ 4
independent RNA isolations were applied for real-time PCR analysis. Data
are presented as fold induction above NRP1, NRP2, and VEGF-A mRNA
control levels after normalizing to GAPDH expression. Each data point
indicates the average of four independent experiments with error bars
corresponding to s.e.m. (b) OSM-, TGF-b1-, and IL-1b-induced effects on
NRP1, NRP2, and b-actin protein expression after 48 h of incubation. Protein
matched samples of stimulated cells and unstimulated controls were
separated on SDS-PAGE and analyzed by western immunoblot for protein
expression of NRP1, NRP2, and b-actin. The results from one representative
western blot of n¼ 4 separate experiments are depicted.
Differential neuropilin expression in FSGS
H Schramek et al
www.laboratoryinvestigation.org | Laboratory Investigation | Volume 89 November 2009 1313

growth factor2 (FGF2), may differentially affect NRP isoformexpression leading to fibroblast generation, activation,and subsequent accumulation of ECM proteins resulting intubulointerstitial fibrosis. In endothelial and various cancercells, however, growth factors and cytokines, such as EGF,FGF2, VEGF, and TNF-a, have been reported to stimulateNRP1 expression.34–40 In contrast, no stimulators of NRP2expression have been published so far.3,26 As additionalmechanisms that favor the maintenance of an epithelialarchitecture, such as those driving MET, must exist in ahealthy renal proximal tubular system, even in response totubular injury, cellular mechanisms acting in both directionsmight be turned on.10 Indeed, it has been speculated thatOSM may represent a cytokine that has the ability to actas both a pro-EMT molecule and a pro-MET mediatordepending on the tubular epithelial cell microenvironmentand/or the specific injury.10 In this context, it is of interestthat the IL-6 family member OSM stimulates both NRP1
and NRP2 expression in human PTC, in contrast to the twoestablished pro-fibrotic mediators, TGF-b1 and IL-1b. BothOSM-induced NRP1 expression and TGF-b1-induced NRP2expression seem to be partially mediated by MEK1/2-ERK1/2signaling. Indeed, major signal transduction pathways thatinduce EMT include Smad signaling, PI3K, the mitogen-activated protein kinases ERK1/2, and STAT signaling.18,41
Especially in the renal tubular system, strong evidence existsfor an important function of the MEK1/2-ERK1/2 signalingmodule in EMT.10,42–44 Furthermore, it has been reportedthat OSM represents a strong stimulator of both ERK1/2 andSTAT1/3 signaling in human PTC.10
In summary, the final functional cellular outcome of dif-ferential NRP isoform expression in renal cells such as tub-ular epithelial cells or tubulointerstitial fibroblasts could becontrolled by gradients of extracellular ligands, by co-expression of signaling receptors, such as plexins or VEGFRs,and by ligands acting through NRPs and their co-receptors.
Figure 6 Indirect immunofluorescence stainings for NRP1 and NRP2 in human PTC. Serum- and supplement-starved cells were stimulated with
10 ng/ml TGF-b1 for 24, 48, and 72 h and compared with unstimulated controls. (a) NRP2 was not detectable under basal conditions. (b) Stimulation of
cells with TGF-b1 for up to 72 h resulted in no detectable NRP1 expression. Conversely, NRP2 expression was inducible in selected tubular epithelial
cells as early as 24 h after stimulation with TGF-b1 peaking after 48 h (c) and 72 h (d). Most (but not all) of the NRP2 positive cells were undergoing
mitosis. In order to identify cells, nuclei were counterstained with DAPI. All magnifications � 1000.
Differential neuropilin expression in FSGS
H Schramek et al
1314 Laboratory Investigation | Volume 89 November 2009 | www.laboratoryinvestigation.org

For example, some SEMAs such as SEMA3F have beenreported to function as anti-tumorigenic and anti-angiogenicagents, whereas others such as SEMA4D have pro-angiogenicand pro-tumorigenic effects.45 Moreover, one has to keep inmind that NRP1 isoform expression might follow a differenttime course when compared with NRP2. We believe thatour data derived from this in vivo and in vitro experimentsestablish an involvement of NRP1 and NRP2 in renal tubu-lointerstitial pathophysiology. All together, it is temptingto speculate that, depending on the renal cellular micro-environment and on their relative amount of expression,these two co-receptors may contribute to either renalfibrogenesis or tubulointerstitial protection and repair
processes. If this were so, then therapeutically targeting NRPisoforms may offer a novel approach to the inhibition ofpathophysiological mechanisms associated with tubulointer-stitial fibrogenesis.
ACKNOWLEDGEMENT
This work was supported by the Austrian National Bank (Grant No. 12221 to
HS).
DISCLOSURE/CONFLICT OF INTEREST
The authors declare no conflict of interest.
1. Gagnon ML, Bielenberg DR, Grechtman Z, et al. Identification of anatural soluble neuropilin-1 that binds vascular endothelial growthfactor: in vivo expression and antitumor activity. Proc Natl Acad SciUSA 2000;97:2573–2578.
2. Klagsbrun M, Takashima S, Mamluk R. The role of neuropilin in vascularand tumor biology. Adv Exp Med Biol 2002;515:33–48.
3. Bielenberg DR, Pettaway CA, Takashima S, et al. Neuropilins inneoplasms: expression, regulation, and function. Exp Cell Res2006;312:584–593.
4. Gray MJ, Van Buren G, Dallas NA, et al. Therapeutic targeting ofneuropilin-2 on colorectal carcinoma cells implanted in the murineliver. J Natl Cancer Inst 2008;100:109–120.
5. Harper SJ, Xing CY, Whittle C, et al. Expression of neuropilin-1 byhuman glomerular epithelial cells in vito and in vivo. Clin Sci2001;101:439–446.
6. Karihaloo A, Karumanchi SA, Cantley WL, et al. Vascular endothelialgrowth factor induces branching morphogenesis/tubulogenesis inrenal epithelial cells in a neuropilin-dependent fashion. Mol Cell Biol2005;25:7441–7448.
7. Bondeva T, Ruster C, Franke S, et al. Advanced glycation end-productssuppress neuropilin-1 expression in podocytes. Kidney Int2009;75:605–616.
0.00.20.40.60.81.01.21.41.61.8
Fo
ld c
han
ge
(24
h)
U0126+ U0126 (10µM)
NRP1 mRNA(n = 6)
*
*
****
0.00.51.01.52.02.53.03.54.04.5
Fo
ld c
han
ge
(24
h) + U0126 (10µM)
NRP2 mRNA(n = 6)
*
+ Cl-1040Ø Cl-1040
TGF-
β1 2
4 h
OSM
24
h
TGF-
β12
4h
OSM
24
h
Con
trol
Con
trol
NRP1
NRP2
β-actin
p-ERK1/2
ERK2
Cl-1
040
+ O
SM 1
0 m
in
OSM
10
min
Con
trol
Control 1IL-1β(all 10 ng/ml)
OSM TGF-β
Control 1IL-1β(all 10 ng/ml)
OSM TGF-β
U0126
Figure 7 Cytokine-mediated effects on NRP1 and NRP2 expression in the
absence and in the presence of the synthetic MEK1/2 inhibitors U0126 and
Cl-1040. (a and b) Real-time PCR analysis of NRP1 and NRP2 mRNA
expression in human PTC, which were serum- and supplement-starved
for 48 h, and which were then stimulated for 24 h with 10 ng/ml of OSM,
TGF-b1, or IL-1b either in the absence (+ U0126) or in the presence
(þ U0126) of 10mM U0126. cDNAs from n¼ 6 independent RNA isolations
were used for real-time PCR analysis of the NRP1 gene (a) and the NRP2
gene (b), respectively. Data are presented as fold induction above NRP1 or
NRP2 mRNA control levels after normalizing to GAPDH expression. Each
data point indicates the average of six independent experiments with error
bars corresponding to s.e.m. (a) *Po0.05 compared with unstimulated or
OSM-stimulated cells in the absence of U0126. TGF-b1 and IL-1b led to a
significant inhibition of NRP1 mRNA expression. (**Po0.001 compared with
unstimulated control cells). (b) *Po0.01 compared with TGF-b1-stimulated
cells in the absence of U0126. (c) Western blot analysis of NRP1, NRP2, ERK2
protein expression, and of ERK1/2 phosphorylation in human PTC, which
were serum- and supplement-starved for 48 h, and were then stimulated
with OSM (10 ng/ml) or TGF-b1 (10 ng/ml) for 24 h either in the absence
(+ Cl-1040) or in the presence (þCl-1040) of the synthetic MEK1/2
inhibitor Cl-1040 (1 mM). As an additional, positive control human PTC
were stimulated for 10 min with OSM in the absence and in the presence
of Cl-1040 (PD184352). Protein-matched samples of whole cell lysates
(for NRP1, NRP2, b-actin) and soluble lysates (for p-ERK1/2 and ERK2) were
separated on SDS-PAGE and analyzed by western immunoblot for protein
expression of NRP1, NRP2, b-actin, phosphorylated-ERK1/2 (p-ERK1/2), and
ERK2. The results from one representative western blot of n¼ 4
independent experiments are depicted.
Differential neuropilin expression in FSGS
H Schramek et al
www.laboratoryinvestigation.org | Laboratory Investigation | Volume 89 November 2009 1315
8. Ryan MJ, Johnson G, Kirk J, et al. HK-2: an immortalized proximaltubule epithelial cell line from normal adult human kidney. Kidney Int1994;45:48–57.
9. Sarkozi R, Miller B, Pollack V, et al. ERK1/2-driven and MKP-mediatedinhibition of EGF-induced ERK5 signaling in human proximal tubularcells. J Cell Physiol 2007;211:88–100.
10. Pollack V, Sarkozi R, Banki Z, et al. Oncostatin M-induced effects onEMT in human proximal tubular cells: differential role of ERK signaling.Am J Physiol Renal Physiol 2007;293:F1714–F1726.
11. Liu Y. Epithelial to mesenchymal transition in renal fibrogenesis:pathologic significance, molecular mechanisms, and therapeuticintervention. J Am Soc Nephrol 2004;15:1–12.
12. Neilson EG. Mechanisms of disease: fibroblasts—a new look at an oldproblem. Nat Clin Pract Nephrol 2006;2:101–108.
13. Strutz F, Zeisberg M. Renal fibroblasts and myofibroblasts in chronickidney disease. J Am Soc Nephrol 2006;17:2992–2998.
14. Liu Y. Renal fibrosis: new insights into the pathogenesis andtherapeutics. Kidney Int 2006;69:213–217.
15. Fan JM, Huang XR, Ng YY, et al. Interleukin-1 induces tubular epithelial-myofibroblast transdifferentiation through a transforming growthfactor-beta1-dependent mechanism in vitro. Am J Kidney Dis2001;37:820–831.
16. Bierie B, Moses HL. TGFb: the molecular Jekyll and Hyde of cancer. NatRev Cancer 2006;6:506–520.
17. Zavadil J, Bottinger EP. TGF-b and epithelial-to-mesenchymaltransitions. Oncogene 2005;24:5764–5774.
18. Li M-X, Liu B-C. Epithelial to mesenchymal transition in the progressionof tubulointerstitial fibrosis. Chin Med J 2007;120:1925–1930.
19. Takagi S, Tsuji T, Amagai T, et al. Specific cell surface labels in the visualcenters of Xenopus laevis tadpole identified using monoclonalantibodies. Dev Biol 1987;122:90–100.
20. Kawasaki T, Kitsukawa T, Bekku Y, et al. A requirement forneuropilin-1 in embryonic vessel formation. Development1999;126:4895–4902.
21. Gu C, Rodriguez ER, Reimert DV, et al. Neuropilin-1 conveyssemaphorin and VEGF signaling during neural and cardiovasculardevelopment. Dev Cell 2003;5:45–57.
22. Kitsukawa T, Shimizu M, Sanbo M, et al. Neuropilin-semaphorin III/D-mediated chemorepulsive signals play a crucial role in peripheral nerveprojection in mice. Neuron 1997;19:995–1005.
23. Lee P, Goishi K, Davidson AJ, et al. Neuropilin-1 is required for vasculardevelopment and is a mediator of VEGF-dependent angiogenesis inzebrafish. Proc Natl Acad Sci USA 2002;99:10470–10475.
24. Pan Q, Chanthery Y, Liang WC, et al. Blocking neuropilin-1 function hasan additive effect with anti-VEGF to inhibit tumor growth. Cancer Cell2007;11:53–67.
25. Guttmann-Raviv N, Kessler O, Shraga-Heled N, et al. The neuropilinsand their role in tumorigenesis and tumor progression. Cancer Lett2006;231:1–11.
26. Staton CA, Kumar I, Reed MWR, et al. Neuropilins in physiological andpathological angiogenesis. J Pathol 2007;212:237–248.
27. Pellet-Many C, Frankel P, Jia H, et al. Neuropilins: structure, functionand role in disease. Biochem J 2008;411:211–226.
28. Latil A, Bieche I, Pesche S, et al. VEGF overexpression in clinicallylocalized prostate tumors and neuropilin-1 overexpression inmetastatic forms. Int J Cancer 2000;89:167–171.
29. Hansel DE, Wilentz RE, Yeo CJ, et al. Expression of neuropilin-1 in high-grade dysplasia, invasive cancer, and metastases of the humangastrointestinal tract. Am J Surg Pathol 2004;28:347–356.
30. Kawakami T, Tokunaga T, Hatanaka H, et al. Neuropilin 1 andneuropilin 2 co-expression is significantly correlated with increasedvascularity and poor prognosis in nonsmall cell lung carcinoma. Cancer2002;95:2196–2201.
31. Gray MJ, Wey JS, Belcheva A, et al. Neuropilin-1 suppressestumorigenic properties in a human pancreatic adenocarcinoma cellline lacking neuropilin-1 coreceptors. Cancer Res 2005;65:3664–3670.
32. Villegas G, Tufro A. Ontogeny of semaphorins 3A and 3F and theirreceptors neuropilins 1 and 2 in the kidney. Mech Dev2002;119S:S149–S153.
33. Zhou H, Zhang L, Tong L, et al. Expression of neuropilin-1 in kidneygraft biopsies: what is the significance? Transplant Proc 2007;39:81–83.
34. Oh H, Takagi H, Otani A, et al. Selective induction of neuropilin-1 byvascular endothelial growth factor (VEGF): a mechanism contri-buting to VEGF-induced angiogenesis. Proc Natl Acad Sci USA2002;99:383–388.
35. Giraudo E, Primo L, Audero E, et al. Tumor necrosis factor-alpharegulates expression of vascular endothelial growth factor receptor-2and of its co-receptor neuropilin-1 in human vascular endothelial cells.J Biol Chem 1998;273:22128–22135.
36. Akagi M, Kawaguchi M, Liu W, et al. Induction of neuropilin-1 andvascular endothelial growth factor by epidermal growth factor inhuman gastric cancer cells. Br J Cancer 2003;88:796–802.
37. Parikh AA, Fan F, Liu WB, et al. Neuropilin-1 in human coloncancer: expression, regulation, and role in induction of angiogenesis.Am J Pathol 2004;164:2139–2151.
38. Parikh AA, Liu WB, Fan F, et al. Expression and regulation of thenovel vascular endothelial growth factor receptor neuropilin-1 byepidermal growth factor in human pancreatic carcinoma. Cancer2003;98:720–729.
39. Liu W, Parikh AA, Stoeltzing O, et al. Upregulation of neuropilin-1 bybasic fibroblast growth factor enhances vascular smooth muscle cellmigration in response to VEGF. Cytokine 2005;32:206–212.
40. Yang H, Li M, Chai H, et al. Expression and regulation of neuropilinsand VEGF receptors by TNF-a in human endothelial cells. J Surg Res2004;122:249–255.
41. Moustakas A, Heldin C-H. Signaling networks guiding epithelial-mesenchymal transitions during embryogenesis and cancerprogression. Cancer Sci 2007;98:1512–1520.
42. Schramek H, Feifel E, Healy E, et al. Constitutively active mutant of themitogen-activated protein kinase kinase MEK1 induces epithelialdedifferentiation and growth inhibition in Madin-Darby CanineKidney-C7 cells. J Biol Chem 1997;272:11426–11433.
43. Montesano R, Soriano JV, Hosseini G, et al. Constitutively activemitogen-activated protein kinase kinase MEK1 disruptsmorphogenesis and induces an invasive phenotype in Madin-DarbyCanine Kidney epithelial cells. Cell Growth Diff 1999;10:317–332.
44. Schramek H, Feifel E, Marschitz I, et al. Loss of active MEK1-ERK1/2restores epithelial phenotype and morphogenesis intransdifferentiated MDCK cells. Am J Physiol Cell Physiol2003;285:C652–C661.
45. Neufeld G, Kessler O. The semaphorins: versatile regulators of tumourprogression and tumour angiogenesis. Nature Rev Cancer 2008;8:632–645.
Differential neuropilin expression in FSGS
H Schramek et al
1316 Laboratory Investigation | Volume 89 November 2009 | www.laboratoryinvestigation.org
Related Documents