Neuromagnetic evidence for the timing of lexical activation: an MEG component sensitive to phonotactic probability but not to neighborhood density Liina Pylkknen, Andrew Stringfellow and Alec Marantz Department of Linguistics and Philosophy, Massachusetts Institute of Technology, Cambridge, MA, and the Mind Articulation Project, International Cooperative Research Project, Japan Science and Technology Corporation, Tokyo, Japan Running title: MEG correlate of lexical activation Correspondence: Liina Pylkknen Department of Linguistics and Philosophy Massachusetts Institute of Technology E39-229 77 Massachusetts Avenue Cambridge, MA 02139 (617) 253 2690 (Phone) (617) 253-5017 (fax) [email protected] (E-mail) Manuscript details: 32 pages 6090 words 5 figures 1 table Acknowledgements: This work was supported by the JST/MIT Mind Articulation Project. We wish to thank Hiram Brownell, Colin Phillips and David Poeppel and two anonymous reviewers for comments on a previous version.

Welcome message from author
This document is posted to help you gain knowledge. Please leave a comment to let me know what you think about it! Share it to your friends and learn new things together.
Transcript
Neuromagnetic evidence for the timing of lexical activation:
an MEG component sensitive to phonotactic probability
but not to neighborhood density
Liina Pylkkänen, Andrew Stringfellow and Alec Marantz
Department of Linguistics and Philosophy, Massachusetts Institute of Technology,
Cambridge, MA, and the Mind Articulation Project, International Cooperative Research
Project, Japan Science and Technology Corporation, Tokyo, Japan
Running title: MEG correlate of lexical activation
Correspondence: Liina PylkkänenDepartment of Linguistics and PhilosophyMassachusetts Institute of TechnologyE39-22977 Massachusetts AvenueCambridge, MA 02139(617) 253 2690 (Phone)(617) 253-5017 (fax)[email protected] (E-mail)
Manuscript details: 32 pages6090 words5 figures1 table
Acknowledgements:
This work was supported by the JST/MIT Mind Articulation Project. We wish to thankHiram Brownell, Colin Phillips and David Poeppel and two anonymous reviewers forcomments on a previous version.
2
ABSTRACT
Evidence from electrophysiological measures such as ERPs (event-related potentials) and
MEG (magnetoencephalography) suggest that the first evoked brain response component
sensitive to stimulus properties affecting reaction times in word recognition tasks occurs
at 300-400 ms. The present study used the stimulus manipulation of Vitevich and Luce
(1999) to investigate whether the M350, an MEG response component peaking at 300-
400 ms, reflects lexical or post-lexical processing. Stimuli were simultaneously varied in
phonotactic probability, which facilitates lexical activation, and in phonological
neighborhood density, which inhibits the lexical decision process. The present results
indicate that the M350 shows facilitation by phonotactic probability rather than inhibition
by neighborhood density. Thus the M350 cannot be a post-lexical component. (118
words)
Keywords: MEG, lexical decision, lexical access, phonotactic probability,
neighborhood effects, N400, M350
3
INTRODUCTION
Despite numerous reaction time (RT) and neuroimaging studies on word recognition,
the timing of automatic lexical activation remains controversial. Since reaction times
offer only one measure for the multiple mental operations between stimulus onset and
response, they are a priori limited in their potential to determine the timing of specific
cognitive processes. Behavioral studies have, however, been valuable in categorizing
various effects as either lexical or post-lexical (see, e.g., discussion in Bradley & Forster,
1987; Forster, 1989:77; and Taft, 1991:28-32). This makes them an important
background for electrophysiological investigations of lexical access, which do provide
the additional dependent variables necessary for studying the timing of mental processes
in detail. The millisecond-by-millisecond temporal resolution of techniques such as EEG
(electroencephalography) and MEG (magnetoencephalography) allows one to search for
response components whose properties reflect understood effects on RTs. If there is
evidence that a given RT effect reflects some stage of lexical processing, e.g., spreading
activation of lexical entries or selection of the �winning� candidate (Marslen-Wilson,
1989), and if a response component that shows a parallel effect is identified, it is
reasonable to hypothesize that the component indexes the same process to which the RT
effect is attributed.
To date, electrophysiological research on lexical processing has centered around the
N400 event-related potential (ERP) (Kutas & Hillyard, 1980), which is a response
component elicited by all word-like stimuli (Bentin, McCarthy & Wood, 1985), and
modulated by many of the same stimulus properties that affect RTs. The cognitive
4
process underlying the N400 component has however, been subject to much debate.
Interpretations vary from automatic spreading activation (Van Petten & Kutas, 1991;
Fischler & Raney, 1989; Kutas & Hillyard, 1989; Besson & Kutas, 1992) to a high-level
�integrative� process (Rugg, 1990; Rugg, Furda & Lorist, 1988). The main criticism
against automatic activation interpretations of the N400 component has been failed
attempts to modulate N400 amplitudes with semantic priming in a masked priming
paradigm even though robust RT priming is obtained under such conditions (Brown &
Hagoort, 1993; Neville, Pratarelli & Forster, 1989). Significantly, however, two recent
studies have succeeded in eliciting semantic priming effects on the N400 even in the
masked priming paradigm (Deacon, Hewitt, Yang, & Nagata, 2000; Kiefer & Spitzer,
2000), which strongly supports automatic accounts of the N400 and poses a problem for
postlexical interpretations.
So far electrophysiological studies of lexical processing have mainly attempted to
correlate effects on event related response components with effects on reaction times, and
the methods for determining which cognitive process a given component indexes have
been borrowed directly from behavioral studies. For example, N400 interpretations have
been based entirely on whether N400 effects require an SOA of a certain length (Besson
& Kutas, 1992; Boddy, 1986; Kiefer & Spitzer, 2000), recognition of the prime (Brown
& Hagoort, 1993; Neville et al., 1989; Deacon et al., 2000; Kiefer & Spitzer, 2000) or a
certain type of task (e.g. Kutas & Hillyard, 1989). The fine temporal resolution of
electrophysiological techniques, however, opens up the possibility for a different
approach to the mapping between response components and cognitive processes.
Specifically, these techniques permit the simultaneous varying of stimuli along several
5
dimensions affecting distinct levels of processing. One can then study the effects of the
different stimulus properties independently of each other. Thus, for example, if stimulus
property A has a facilitatory effect on lexical access and stimulus property B an
inhibitory effect on postlexical processing, we can determine whether a given response
component reflects pre- or post-access processing by testing whether it shows facilitation
or inhibition for a stimulus that has both A and B. The advantages of this type of
approach are clear. First, a priming paradigm is not required (unlike in SOA
manipulations and masking), which makes it possible to study the effects of variables that
are intrinsic to the stimulus (such as frequency). Second, task manipulations are avoided,
which obviates the need for detailed models of the tasks involved.
The present study varied stimuli along two different dimensions affecting distinct
levels of processing to investigate the time course of lexical processing in MEG. MEG
differs from EEG in that it measures the magnetic fields, instead of electric potentials,
generated by postsynaptic currents in nerve cells. Unlike electric potentials, magnetic
fields are not distorted by the skull. Therefore, localization of the currents underlying the
activity measured outside the head is much easier in MEG than in EEG. (For a review of
magnetoencephalography, see Hämäläinen, Hari, Ilmoniemi, Knuutila & Lounasmaa,
1993.)
The specific goal of the present study was to determine whether the M350 MEG
response component reflects automatic lexical activation or subsequent processing. The
M350 is a response component in the left temporal cortex peaking at 300-450 ms after
the visual presentation of a word or a pronounceable nonword, i.e. slightly earlier than
the N400 ERP. M350 latencies and/or amplitudes have been shown to parallel RTs in
6
being sensitive to repetition (Sekiguchi, Koyama & Kakigi, 2000; Pylkkänen,
Stringfellow, Flagg & Marantz, 2000), frequency (Embick, Hackl, Schaeffer, Kelepir &
Marantz, 2001) and cloze probability (Helenius, Salmelin, Service & Connolly, 1998,
1999). The cognitive level reflected by the M350 has, however, not yet been directly
addressed, the results cited above being compatible both with lexical and postlexical
interpretations. For example, M350 latencies could be decreased for frequent and for
repeated words because the M350 indexes lexical access, which is facilitated by high
frequency and repetition. Alternatively, M350 latencies could show these effects because
the latencies of some earlier response do. In other words, it is possible that the studies
cited above did not identify a lexical activation component, but rather a post-lexical
component that only appears to be modulated by stimulus properties affecting lexical
activation because the latencies of some earlier response, unidentified in these studies,
are. Such secondary effects were found, for example, for developmental dyslexics, who
showed a delay in N400-type activity likely attributable to an earlier abnormality
(Helenius et. al 1999).
To test the predictions of the lexical and post-lexical hypotheses of the M350, we
investigated M350 latencies and RTs in a situation where automatic lexical activation is
facilitated while post-lexical processing is slowed down. To construct such a situation,
we based our study on previous results by Vitevich and collegues (Vitevich & Luce,
1998, 1999; Vitevich, Luce, Charles-Luce & Kemmerer, 1997), who report task-
dependent effects of phonotactic probability (i.e., how frequent the sounds and sound
sequences in the word are) and phonological neighborhood density (i.e., how many
similar sounding words there are to a stimulus in the language) on RTs in spoken word
7
recognition. Vitevich and Luce show that nonword stimuli with high phonotactic
probability are responded to faster than low probability nonwords in tasks such as the
same-different task or the speeded single-word shadowing task. In the lexical decision
task, however, this facilitatory effect disappears and high probability nonwords are
responded to more slowly than low probability nonwords. This effect is due to the fact
that high probability nonwords necessarily resemble, and hence activate, more actual
lexical entries than low probability nonwords and the more competing lexical entries a
nonword activates, the longer the time needed for determining that none of them can be
selected as the "winner." Thus, in tasks where the subject is forced to attempt selection,
such as the lexical decision task, the competition induced by the dense similarity
neighborhood has an inhibitory effect which overrides the earlier facilitation gained by
high phonotactic probability. Unsurprisingly, competition effects are task-dependent only
for nonwords: for words, selection is automatic and therefore reaction times to words are
slowed down by competition both in lexical decision and in the �low-level� same-
different and shadowing tasks (Vitevich & Luce, 1999). Thus, for words, the facilitatory
effect of phonotactic probability cannot be observed behaviorally in any task in which the
subject recognizes the stimulus.
The present study aimed to investigate whether the M350 would show facilitatory
effects of phonotactic probability in the lexical decision task, where reaction times to
both words and nonwords fail to show such an effect. Specifically, we hypothesized that
if the M350 reflects automatic spreading activation prior to selection, stimuli which are
high both in phonotactic probability and in phonological neighborhood density should
elicit decreased M350 latencies due to facilitation by phonotactic probability and
8
increased RTs due to competition. Such a result would clearly distinguish between lexical
and postlexical interpretations of the M350: if the component was associated with post-
lexical processing, it should show increased rather than decreased latencies in this type of
manipulation.
MATERIALS AND METHODS
Participants
Eleven right-handed, English-speaking adults with normal or corrected-to-normal
vision gave their informed consent to participate in the experiment (three females and
eight males ranging in age from 24 to 32, mean age 27). Participants were all graduate
students or employees at the Massachusetts Institute of Technology and were paid $20
for their participation.
Stimuli
Our materials were based on the spoken stimuli of Vitevich and Luce (1999)
which were converted into orthographic stimuli to permit direct comparison of the brain
responses to those elicited in previous M350 studies from our laboratory. Participants
were presented with four categories of 70 stimuli: (i) high probability/density words
(BELL, LINE), (ii) low probability/density words (PAGE, DISH), (iii) high
probability/density nonwords (MIDE, PAKE) and (iv) low probability/density nonwords
(JIZE, YUSH). All stimuli were monosyllabic and the high and the low
probability/density words were matched for frequency (Kucera & Francis 1967). The
9
mean lengths of the different stimulus categories were 3.61 letters (high
probability/density words), 3.94 letters (low probability/density words), 4.31 letters (high
probability/density nonwords) and 4.7 letters (low probability/density nonwords). Thus,
even though the auditory stimuli of Vitevich and Luce (1999) were matched for duration,
the written versions of the low probability items were longer than those of the high
probability stimuli (words: t(1, 138) = -3.28, p < 0.01; nonwords: t(1, 138) = - 4.48, p <
0.001). Therefore the materials were slightly biased against our hypothesis, i.e., increased
RTs for high probability stimuli. The words were the 140 word stimuli used in Vitevich
and Luce 1999 (Appendix 1) and the 140 nonwords were selected from their list of 240
monosyllabic nonword stimuli in such a way as to achieve the best possible length-match
between the high and the low probability/density items. The appropriate spellings for the
nonwords were determined by having three native speakers of English spell the spoken
nonwords of Vitevich and Luce. If a speaker considered several spellings possible, they
were asked to judge which one was the most �English-like�. The list of orthographic
nonwords arrived at in this way was further tested with three different native speakers
who were asked to read the items out loud. The pronunciations of all three speakers
matched those used in Vitevitch and Luce (1999).
The measures for phonotactic probability were positional segment frequency and
biphone frequency. Similarity neighborhoods were frequency-weighted and phonological
neighbors were defined as any item that could be converted to the stimulus by one
phoneme substitution, deletion, or addition in any position (for details, see Vitevich &
Luce 1999).
10
To assess whether the high and the low probability stimuli differed in orthographic
probability, which could be a potential confound, total bigram frequency was calculated
for each stimulus (Solso and Juel 1980) and entered into a 2 (Lexicality) x 2
(Probability/density) ANOVA. High probability stimuli did not differ reliably from low
probability stimuli in orthographic probability nor did words differ from nonwords (both
Fs < 1). Also, there was no reliable interaction between lexicality and probability
(F(1,276) = 2.64, p > 0.1).
Procedure
Stimuli were presented using PsyScope 1.2.5 (Cohen, MacWhinney, Flatt & Provost
1993) in a randomized order in two blocks of 140 stimuli. A pause between blocks
allowed participants to rest. Each trial consisted of a fixation point (+) which lasted for a
1000 ms followed by the presentation of the stimulus which disappeared at the button
press response. The task was continuous lexical decision. In the first block participants
made word decisions with the index finger of their left hand and non-word decisions with
the middle finger; in the second block the fingers were reversed. The intertrial interval
randomly varied between 500 and 1500 ms.
During the experiment, participants lay in a dimly lit magnetically shielded room in
the KIT/MIT MEG laboratory. Stimuli were projected onto a screen on the ceiling of the
magnetically shielded room approximately 120cm above the participant�s eyes. All letter
string stimuli were centered on the fixation point, and were presented in the Courier font.
Stimuli subtended approximately 1.2° of visual angle vertically, and 4.8, 6.4, 8.0, or 9.6°
of visual angle horizontally (for 3-, 4-, 5-, and 6-letter stimuli, respectively).
11
Neuromagnetic fields were recorded using an axial gradiometer whole-head system
(Kanazawa Institute of Technology, Japan). Measurements from the first nine participants
were performed using a 64-channel system; 29 additional sensors were then added,
offering 93 channels for the last two participants.
For the purposes of source localization, small electromagnetic coils were attached to
the participant�s head prior to the MEG measurement. Using a 3D digitizer, the locations
of these coils were calculated with respect to three anatomical landmarks (the nasion and
points just anterior to the participant�s ear canals), which established the head coordinate
system for each participant. Once the participant was positioned in the MEG instrument,
the coils were also localized with respect to the sensors. Thus MEG measurements could
be transformed into each participant�s individual head coordinate system. Since structural
MRIs were not available for any of the participants, the shape of each participant�s head
was recorded during digitization. The head shapes were later used to estimate a
maximally appropriate spherical head model for each participant for the purposes of
source localization.
Data were sampled at 500Hz, with acquisition between 1 and 200Hz. The recording
for each participant lasted approximately 20 minutes. After the presentation of the word
stimuli, responses to 1kHz tones were recorded in order to identify the participant�s
auditory cortex, which was used as a functional landmark in source localization. Raw
data were noise-reduced to remove environmental artifacts. For the first nine participants�
data, external sources of noise were removed via signal-space projection; for the last two
participants� data, external noise sources were removed using the Continuously Adjusted
Least-Squares Method (CALM, Adachi, Shimogawara, Higuchi, Haruta & Ochiai, in
12
press). Responses to stimuli were averaged by stimulus condition. In the averaging,
further artifact rejection was performed by excluding all responses to stimuli which
contained signals exceeding ± 2.5pT in amplitude (if any had survived the noise-
reduction algorithms). Following averaging, data were baseline adjusted using a 100ms
pre-stimulus interval and low pass filtered under 30Hz.
Data analysis
Reaction times were calculated from the onset of the visual stimulus. Incorrect trials
and RTs deviating over 3SD from the mean for the particular participant were excluded
from the analysis. This resulted in the exclusion of 5.6% of the data. The same trials were
also rejected from the MEG averages. Only MEG averages consisting of more than 50
trials after artifact and error rejection were accepted for further analysis. All participants
and all conditions survived this criterion.
In the analysis of the MEG data, averaged signals were first visually inspected to
identify dipolar field distributions that showed consistency across experimental
conditions and across participants. Such distributions were identified in three time
windows: 140-220 ms (M170), 200-300 ms (M250) and 300-420 ms (M350), yielding
response components compatible with activity reported in previous MEG studies of
visual word recognition (Koyama, Kakigi, Hoshiyama & Kitamura, 1998; Koyama,
Kakigi & Hoshiyama, 1998; Kuriki, Takeuchi & Hirata, 1998; Kuriki, Hirata, Fujimaki &
Kobayashi, 1996; Sekiguchi et al., 2000; Helenius et al., 1998, 1999; Pylkkänen et al.,
2000; Embick et al., to appear).
13
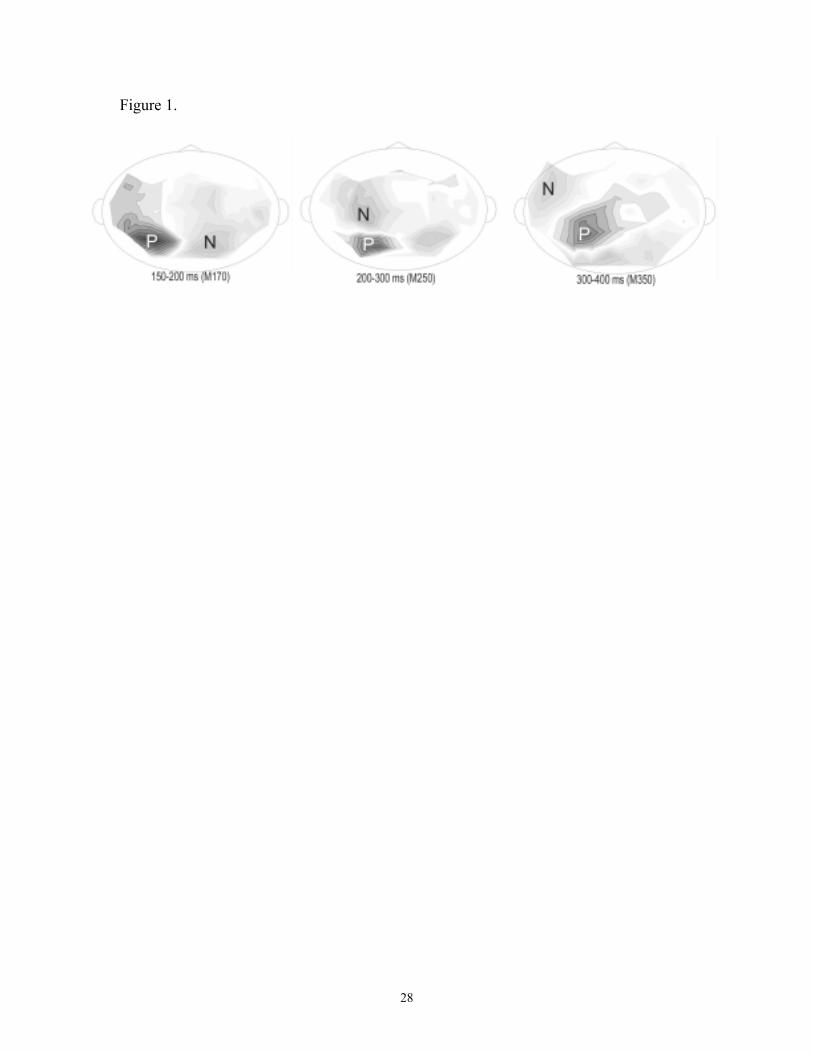
As shown in Fig. 1, the M170 was associated with a bilateral field distribution over
the occipitotemporal sensors; the M250 with a left-lateralized dipolar pattern oriented
along the lateral axis with a posterior positive field (i.e. magnetic flux emerging from the
brain) and an anterior negative field (i.e. magnetic flux re-entering the brain); and the
M350 with a left-lateralized dipolar distribution oriented along the anterior-posterior axis,
with the positive field on the right and the negative field on the left. The amplitudes and
latencies of these components were recorded by calculating the root mean square (RMS)
field strength from the sensors that covered the field pattern of the particular component.
In some participants, the M250 and/or the M350 showed a bilateral distribution; however,
since this did not hold consistently across participants, RMS for these components was
calculated from left-hemisphere sensors only. The sensors used for the RMS analysis
were selected on the basis of the condition that showed the clearest dipolar distribution
and held constant across conditions within a subject. The number of sensors used for
RMS analysis varied from 10 to 18 for data collected using the 64-channels and from 22
to 38 for data collected using the 93-channels. In some conditions for some participants,
the M350 distribution showed two prominent peaks instead of one. In these cases only
the first peak was classified as an M350 and entered into comparisons with M350s that
only peaked once. The second peaks of those M350 distributions that peaked twice were
considered post-M350 activity and are discussed in the corresponding results section.
One participant did not show the criterial M350 field pattern in any condition and
therefore no M350 response latencies could be recorded from this participant. Since the
aim of this study was to examine the latencies of the M350 in relation to RTs, data from
this participant were excluded from all analyses.
14
RESULTS
Reaction times
2 (Lexicality) x 2 (Probability/density) ANOVAs were performed for reaction times
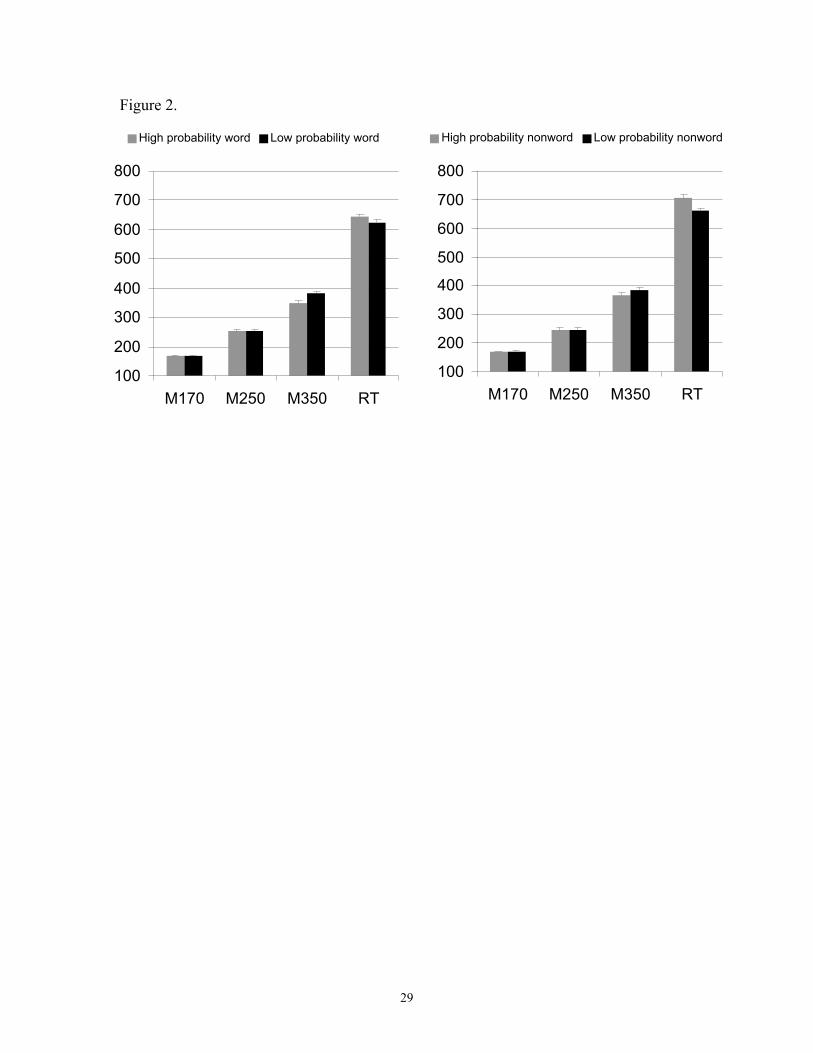
and for accuracy. As Figure 2 shows, the behavioral results of Vitevich and Luce 1999
were replicated: high probability/density stimuli were responded to more slowly than low
probability stimuli. An ANOVA on reaction times showed a significant overall effect of
probability/density (F(1,9) = 103.41, p < 0.0001) which according to planned
comparisons (Scheffe t test) was reliable both for words and for nonwords. High
probability/density words ( x = 650.6) were responded to more slowly than low
probability/density words ( x = 625; p < 0.01), and high probability/density nonwords ( x
= 711.1) more slowly than low probability/density nonwords ( x = 664.1, p < 0.0005).
The main effect of lexicality was also reliable, RTs to nonwords being longer than RTs to
words (F(1,9)=26.81, p < 0.001). The interaction between probability/density and
lexicality approached significance (F(1,9) = 4.27, p = 0.07), the slow-down for high
probability/density nonwords being more than the slow-down for the high
probability/density words.
Analyses of accuracy, where incorrect trials and trials deviating over 3SD from the
mean for the particular participant were counted as errors, revealed that low probability
stimuli were responded to more accurately than high probability/density stimuli (F(1,9) =
21.57, p < 0.005). Planned comparisons showed this effect to be reliable both for words
(p < 0.05) and for nonwords (p < 0.005). This, again, replicates Vitevich and Luce�s
15
findings. For accuracy, there was no interaction between lexicality and
probability/density (F(1,9) < 1).
M350
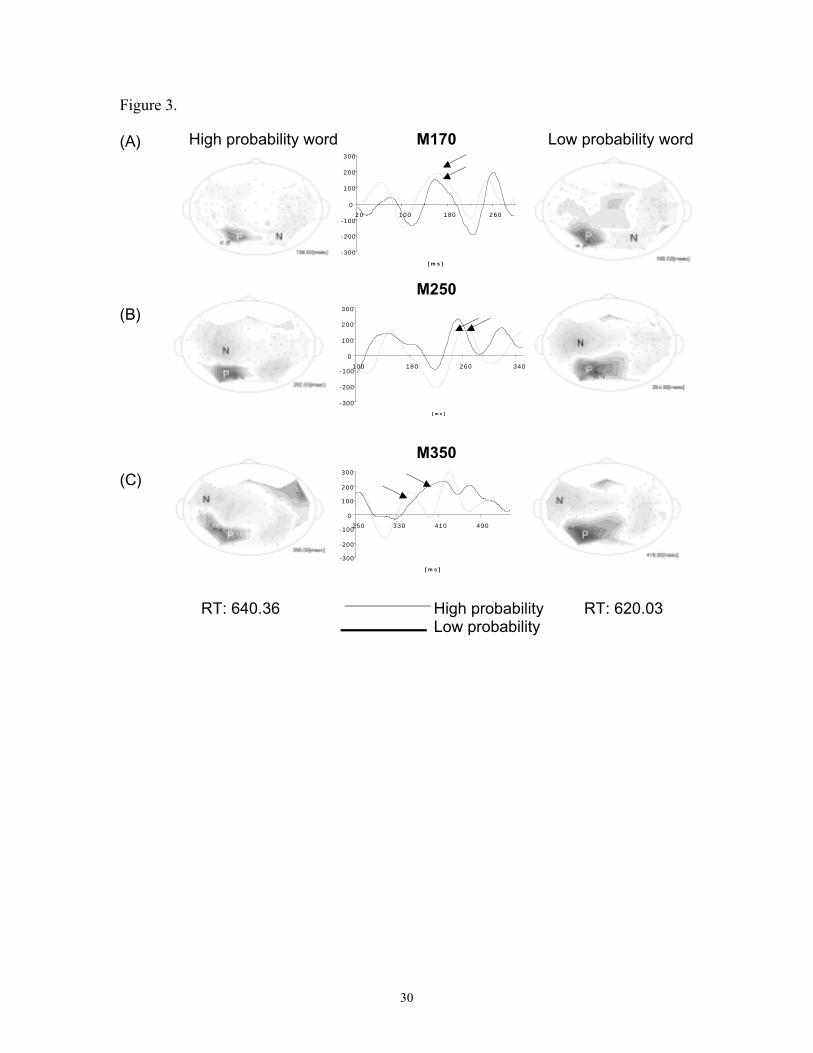
Figure 3 illustrates the averaged MEG responses to high and low probability/density
words for a representative participant. Figure 4 shows the grand average standardized
RMS waveforms for the M170, M250 and M350 components elicited by high and low
probability/density words and nonwords. Counter to the predictions of post-lexical
interpretations of the M350 component, M350 latencies were shorter, rather than longer,
for high probability/density stimuli than for low probability/density stimuli. Thus M350
latencies showed facilitation by high phonotactic probability/density while response
times showed the opposite effect. An ANOVA on M350 latencies (two factors: lexicality,
probability/density) revealed a main effect of probability/density (F (1,9) = 19.18 p <
0.005) which planned comparisons showed to be reliable both for words and for
nonwords: high probability/density words elicited shorter M350 latencies ( x = 349.4ms)
than low probability/density words ( x = 382.2ms; p < 0.005) and high
probability/density nonwords shorter latencies ( x = 368ms) than low probability/density
words ( x = 385.6ms; p < 0.05) (Fig. 2). While the difference between high and low
probability stimuli was larger for words (32.8 ms) than for nonwords (17.6 ms), the
interaction between lexicality and probability/density was not significant (F(1,9) =
1.1963, p = 0.2).
16
The M350 latency ANOVA also showed an effect of lexicality, M350 latencies for
words ( x = 365.8ms) being shorter than those for nonwords ( x = 376.8ms) although this
effect did not quite reach reliability (F(1,9) = 4.87, p = 0.05).
M350 amplitudes (two factors: lexicality, probability/density) were not modulated by
probability/density (F(1,9) = 2.04, p = 0.18) although a trend was observed for words,
high probability/density stimuli eliciting decreased M350 amplitudes (p = 0.09).
M250 and M170
In contrast to the M350, neither phonotactic probability/density nor lexicality
modulated the latencies of the earlier M250 component (both Fs < 1). As regards
amplitude, while no significant overall effect of probability/density was found (F(1,9) =
2.57, p = 0.14), pair-wise planned comparisons showed that M250 amplitudes of high
probability words were smaller than those of low probability words (p < 0.05).
The M170 component was not sensitive to phonotactic probability/density nor to
lexicality either in amplitude or in latency (all p�s > 0.1).
Later activity
An obvious question raised by the facilitation seen on the M350 is whether a
cortical correlate of the inhibitory effect seen on reaction times could be identified as
well. To this end, the magnetic fields following the M350 distribution were inspected to
see whether dipolar field patterns showing consistency across participants could be
identified for RMS analysis, but the patterns were too variable to justify this.
17
However, a possible neural correlate of the RT competition effect was identified
in M350 activity itself. As already mentioned above, the M350 distribution was
sometimes associated with two prominent peaks instead of one. An ANOVA on the
number of peaks associated with the M350 revealed that high probability stimuli elicited
two M350 peaks more often than low probability stimuli (F(1,9) = 6 , p < 0.05). Thus it is
possible that intense competition is indexed by a second M350 peak, while no such peak
is elicited when the similarity neighborhood is sparse.
M250 and M350 source locations
Finally, in order to take advantage of the spatial accuracy of MEG, the locations
of the currents underlying the M250 and M350 response components were estimated
using equivalent current dipoles (ECD). The shape of the conducting volume was
modeled as a sphere defined on the basis of each participant�s head shape data. ECDs
were estimated at the times of RMS peaks, using the same sensors as in the RMS
analysis. In addition to M250 and M350 localizations, the left-hemisphere source of the
auditory M100 component was estimated from each participant�s responses to 1kHz
tones to serve as an anatomical landmark. A dipole was considered reliable if it explained
≥ 80% of the activity in the sensors used for the localization and if it was within 4cm
from the surface of the participant�s skull. The latter criterion was used as MEG is best
suited for measuring activity in fissural cortex (Hämäläinen et al. 1993), its spatial
resolution decreasing considerably for deeper structures.
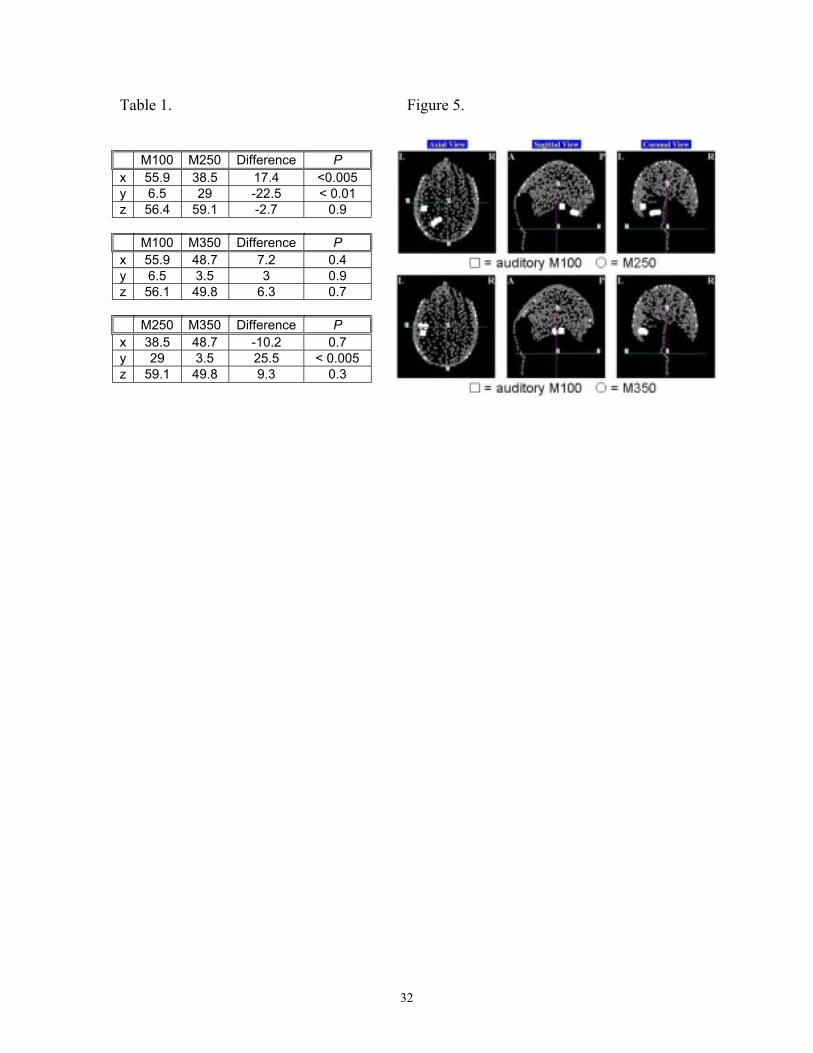
Figure 5 illustrates typical spatial locations of dipoles explaining the M100, M250
and M350 magnetic field distributions for a single participant: M250 sources are
18
posterior to both M100 and M350 sources, which localize within 2cm of each other. The
M350 source location conforms to previous findings that show activity 300-400ms post
presentation of visual word stimuli localizing to the vicinity of the auditory cortex in
superior and middle temporal gyri (Sekiguchi et al. 2000; Helenius et al. 1998, 1999).1
DISCUSSION
The present study manipulated two highly correlated stimulus variables, phonotactic
probability and phonological neighborhood density, to shed light on the cognitive process
underlying the M350 evoked response component. Our results indicate that M350
latencies vary independently from reaction times when stimuli are simultaneously varied
along a dimension that affects lexical activation and a dimension that affects
selection/decision. This result can only be explained by lexical accounts of the M350; if
the M350 reflected post-lexical processing, its latency should reflect inhibitory effects of
neighborhood density rather than earlier facilitatory effects of phonotactic probability,
given the behavioral evidence of Vitevich and Luce (1999). The present study, together
with previous results showing that the M350 is the earliest component whose latency
and/or amplitude is sensitive to repetition (Sekiguchi et al. 2000; Pylkkänen et al. 2000),
to cloze probability (Helenius et al. 1998, 1999) and, in particular, to lexical frequency
(Embick et al. 2001) strongly support the hypothesis that the M350 indexes automatic
spreading activation across lexical entries.
19
In addition to the facilitatory effect on M350 latencies, phonotactic probability
modulated the amplitudes of the earlier M250 component, although this was reliable only
for words. Thus, assuming that decreased latencies and amplitudes both index facilitation,
the latency difference seen in the M350 could at least partially be a secondary effect of
the earlier amplitude difference. Such a relationship between M250 amplitudes and M350
latencies is in particular suggested by the fact that facilitation for high probability stimuli
was larger for words than for nonwords both in M250 amplitudes and in M350 latencies.
Whether high phonotactic probability facilitates initial lexical activation, which we
hypothesize to be indexed by the first peak of the M350 distribution, or some earlier
process, is irrelevant for our present conclusion (for discussion on cognitive models of
the role of phonotactic probability, see Vitevich and Luce 1999). What is important is
that high probability/density stimuli do not elicit increased M350 latencies, which they
would if the component indexed a process whose timing is sensitive to competition, i.e.
selection/decision or any subsequent process leading up to RT.
With respect to the relationship between the M350 and the N400 ERP, the present
results are consistent with recent findings by Deacon et al. (2000) and Kiefer and Spitzer
(2000), who report N400 priming effects in masked priming, indicating that the N400
cannot be a post-recognition component. Since the M350 peaks somewhat earlier than the
N400, these masked priming results predict that the M350 should not be a post-lexical
component, either, which is supported by the present results. However, the M350 peak
reported here and the N400 ERP are unlikely to correspond directly, given their latency
difference. Rather, the M350 more plausibly corresponds only to an early component of
the rather long N400 wave; the M350 distribution never persists for longer than 150 ms
20
while the N400 can persist for up 500ms. Another candidate for an electric correspondent
of the M350 is negativities in the 250-350 ms range found to be sensitive to lexical
factors in various ERP word-class studies (e.g. King & Kutas 1998; Brown, Hagoort &
ter Keurs, 1999).
As regards neuromagnetic predictors of the competition effect on response times,
M350 distributions elicited by high probability stimuli were associated with two
prominent peaks more often than those elicited by low probability stimuli. This suggests
that the number of times the M350 distribution peaks correlates with the amount of
competition in a similarity neighborhood. The present results thus support the following
hypothesis concerning the dissociation between activation and competition: activation is
indexed by the first peak of the M350 distribution and competition by the presence of a
second peak with the same distribution.
1 An ANOVA on the x, y and z coordinates of all M100 (n=7), M250 (n=20) and M350
(n=12) sources meeting our criteria revealed the pattern shown in Figure 6 to be reliable.
In the head-coordinate system, the x-axis runs between the peripheral fiducials (i.e. points
right in front of the left and the right ears), the y-axis from the nasion to the back of the
head perpendicular to the x-axis and the z-axis perpendicular both to the x- and the y-
axes. The effect of Component was significant both for the x (F(1,28) = 7.88, p < 0.005)
and the y (F(1,28) = 11.21, p < 0.0005) axes but not for the z-axis (F(1,28) = 1.18, p =
0.3). Planned pair-wise comparisons revealed M250 sources to be more posterior (i.e.
larger y-value) than both M100 (p < 0.005) and M350 sources (p < 0.005) which between
21
themselves did not differ in posteriority. M250 sources were also found to be less lateral
(i.e. smaller x-value) than M100 (p < 0.005) and M350 sources, although the latter
difference did not reach significance (p = 0.06). M100 and M350 sources did not differ
reliably in laterality. The results of the pair-wise comparisons are summarized in Table 1.
REFERENCES
Adachi, Y., Shimogawara, M. Higuchi, M., Haruta, Y., and Ochiai, M. In press.
Reduction of Nonperiodical Extramural Magnetic Noise in MEG measurement by
Continuosly Adjusted Least Squares Method. IEEE Transactions on Applied
Superconductivity, ASC2000, Virginia Beach.
Bentin, S. McCarthy, G. and C. C. Wood. (1985). Event-related potential, lexical
decision and semantic processing, Electroencephalography and Clinical
Neurophysiology 60, 342-355.
Besson, M. and M. Kutas, (1992). The many facets of repetition: A cued-recall and
event- related potential analysis of repeating words in same versus different
sentence context. Journal of Experimental Psychology: Learning, Memory and
Cognition, 19(5), 1115-1133.
Brown, C. and P. Hagoort. (1993). The processing nature of the N400: evidence from
masked priming. Journal of Cognitive Neuroscience 5(1), 34-44.
22
Bradley, D. C. and K. I. Forster (1987). A reader�s view of listening. Cognition 25:103-
134.
Brown, C. M., Hagoort, P. and M. ter Keurs (1999). Electrophysiological signatures of
visual lexical processing: open and closed-class words. Journal of Cognitive
Neuroscience 11:3, pp. 216-281.
Cohen J.D., MacWhinney B., Flatt M., and J. Provost (1993). PsyScope: A new graphic
interactive environment for designing psychology experiments. Behavioral
Research Methods, Instruments, and Computers, 25(2), 257-271.
Deacon, D. Hewitt, S. Yang, C-M and M. Nagata. (2000). Event-related potential indices
of semantic priming using masked and unmasked words: evidence that the N400
does not reflect a post-lexical process. Cognitive Brain Research 9, 137-146.
Embick, D., Hackl, M., Schaeffer, J., Kelepir, M. and A. Marantz (2001). A
magnetoencephalographic component whose latency reflects lexical frequency.
Cognitive Brain Research, 10: 3, 345-348.
Fischler, I. and G. E. Raney (1989). Language by eye: behavioral, autonomic and cortical
approaches to reading. In: J. R. Jennings & M. G. H. Coles (eds.), Handbook of
Cognitive Psychology: Central and Autonomic Nervous System. New York:
Wiley.
Forster, K. I. (1989). Basic Issues in Lexical Processing. In Marslen-Wilson, W. (ed.)
Lexical Representation and Process. The MIT Press, Cambridge, MA. 75-107.
Helenius, P., Salmelin, R., Service, E. and J. F. Connolly (1998). Distinct time courses of
word and context comprehension in the left temporal cortex. Brain 121, 1133-
1142.
23
Helenius, P., Salmelin, R., Service, E. and J. F. Connolly (1999). Semantic Cortical
Activation in Dyslexic Readers. Journal of Cognitive Neuroscience 11:5, 535-
550.
Hämäläinen, M., Hari, R., Ilmoniemi,R. J. Knuutila, J., and Lounasmaa, O. L. (1993).
Magnetoencephalography: theory, instrumentation,, and applications to
noninvasive studies of the working human brain. Review of Modern Physics, 65,
413-495.
Kiefer, M. and M. Spitzer (2000). Time course of conscious and unconscious semantic
brain activation. NeuroReport, 11, 2401-2407.
King, J. W., and M. Kutas (1998). Neural plasticity in the dynamics of human visual
word recognition. Neuroscience Letters, 244, 1-4.
Koyama, S. Kakigi, R. Hoshiyama, M. and Y. Kitamura (1998). Reading of Japanese
Kanji (morphograms) and Kana (syllabograms): a magnetoencephalographic
study. Neuropsychologia 36:1, 83-98.
Koyama, S. Naka, D. and R. Kakigi (1999). Evoked magnetic responses during a word
completion task. Electroencephalography and Clinical Neurophysiology:
Supplement, 49, 174-178.
Kucera, H. and W. N. Francis (1967). Computational analysis of present-day American
English. Providence, RI: Brown University Press.
Kuriki, S., Takauchi, F., Fujimaki, N. and T. Kobayashi (1996).
Magnetoencephalographic study on the cerebral neural activities related to the
processing of visually presented characters. Cognitive Brain Research, 4, 185-
199.
24
Kutas, M. and Hillyard, S. A. (1980). Reading senseless sentences: brain potentials
reflect semantic incongruity. Science, 207(4427), 203-205.
Kutas, M. and S. A. Hillyard (1989). An electrophysiological probe of incidental
semantic association. Journal of Cognitive Neuroscience, 1, 38-49.
Marslen-Wilson, W. (1989). Access and Integration: Access and Integration: Projecting
Sound onto Meaning. In Marslen-Wilson, W. (ed.) Lexical Representation and
Process. The MIT Press, Cambridge, MA. 3-24.
Neville, H. J., Pratarelli, M. E. and K. I. Forster (1989). Distinct neural systems for
lexical and episodic representations of words. Society of Neuroscience Abstracts,
15, Abstract No. 101.11
Pylkkänen, L., Stringfellow, A., Flagg, E. and A. Marantz (2000). A neural response
sensitive to repetition and phonotactic probability: MEG investigations of lexical
access. Proceedings of Biomag 2000, Helsinki, Finland.
Rugg, M. D. (1990). Event-related brain potentials dissociate repetition effects of high-
and low-frequency words. Memory and Cognition, 18, 367-379.
Rugg, M. D., Furda, J. and M. Lorist (1988). The effects of task on the modulation of
event-related potentials by word repetition. Psychophysiology, 25, 55-63.
Sekiguchi, T., Koyama, S. and R. Kakigi (2000). The effect of word repetition on evoked
magnetic responses in the human brain. Japanese Psychological Research, 42, 3-
14.
Solso, R. L. and C. L. Juel (1980). Positional frequency and versatility of bigrams for
two-through nine-letter English words. Behavioral Research Methods and
Instrumentation, Vol. 12(3), 297-343.
25
Taft, M. (1991). Reading and the mental lexicon. Hove, England: Lawrence Erlbaum
Associates.
Van Petten, C. and M. Kutas (1991). Influences of semantic and syntactic context in
open- and closed-class words. Memory and Cognition 19(1), 95-112.
Vitevitch, M. S. and P. A. Luce (1998). When words compete: levels of processing in
spoken word recognition. Psychological Science, 9, 325-329.
Vitevitch, M. S. and P. A. Luce (1999). Probabilistic Phonotactics and Neighborhood
Activation in Spoken Word Recognition. Journal of Memory and Language 40:
374-408.
Vitevitch, M. S. and P. A. Luce, J. Charles-Luce and D. Kemmerer (1997). Phonotactics
and syllable stress: Implications for the processing of spoken nonsense words.
Language and Speech, 40, 47-62.
26
Figure 1: The magnetic field distributions of the M170, M250 and M350 response
components at the time of component peak in one representative participant. The letter P
indicates the positive field (i.e. the magnetic field emerging from the brain) and the letter
N the negative field (i.e. the magnetic field entering the brain) of the magnetic field
around the current source.
Figure 2: The mean reaction times and MEG component latencies for high and low
probability/density words and nonwords (n = 10).
Figure 3: Averaged MEG responses from one participant to high and low
probability/density words showing activity from the positive maximum of the M170 (A),
the M250 (B) and the M350 (C) response components. The middle column overlays
responses to high and low probability/density stimuli, the arrows indicating component
peaks. The contour maps on the left and right show the magnetic field distributions for
the two stimulus categories at the times of component peaks.
Figure 4. Grand average standardized RMS waveforms for the M170, M250 and M350
response components (n = 10).
Figure 5. Source localizations filling reliability criteria for the M250 (above) and M350
(below) components for one representative participant. The square indicates the location
of the auditory M100 response and the circles responses to word stimuli.
27
Table 1. Summary of pair-wise comparisons of the mean coordinates of all reliable
M100, M250 and M350 source localizations. The x-axis runs between the peripheral
fiducials (i.e. points right in front of the left and the right ears), the y-axis from the nasion
to the back of the head perpendicular to the x-axis and the z-axis perpendicular both to the
x- and the y-axes.
28
Figure 1.
29
Figure 2.
100
200
300
400
500
600
700
800
M170 M250 M350 RT
High probability nonword Low probability nonword
100
200
300
400
500
600
700
800
M170 M250 M350 RT
High probability word Low probability word
30
Figure 3.
(A)
(B)
(C)
-300
-200
-100
0
100
200
300
250 330 410 490
[ m s ]
-300
-200
-100
0
100
200
300
100 180 260 340
[ m s ]
-300
-200
-100
0
100
200
300
2 0 100 180 260
[ m s ]
High probability word Low probability wordM170
M250
M350
RT: 640.36 RT: 620.03High probabilityLow probability

31
Figure 4.
Words Nonwords
-0.60
-0.40
-0.20
0.00
0.20
0.40
0.60
0.80
120 140 160 180 200 220
-0.60
-0.40
-0.20
0.00
0.20
0.40
0.60
0.80
120 140 160 180 200 220
M170
-0.60-0.40-0.200.000.200.400.600.801.00
150 190 230 270
-0.60-0.40-0.200.000.20
0.400.60
0.801.00
150 190 230 270
M250
-1.20-1.00-0.80-0.60-0.40-0.200.000.200.400.600.801.00
300 320340360380 400420
-1.20-1.00-0.80-0.60-0.40-0.200.000.200.400.600.801.00
300 320340360380 400420
M350
High probabilityLow probability
32
Table 1. Figure 5.
M100 M250 Difference Px 55.9 38.5 17.4 <0.005y 6.5 29 -22.5 < 0.01z 56.4 59.1 -2.7 0.9
M100 M350 Difference Px 55.9 48.7 7.2 0.4y 6.5 3.5 3 0.9z 56.1 49.8 6.3 0.7
M250 M350 Difference Px 38.5 48.7 -10.2 0.7y 29 3.5 25.5 < 0.005z 59.1 49.8 9.3 0.3
Related Documents


