Cognitive Brain Research 17 (2003) 599–611 www.elsevier.com / locate / cogbrainres Research report Neuromagnetic imaging of cortical oscillations accompanying tactile stimulation a, a b b * Douglas Cheyne , William Gaetz , Line Garnero , Jean-Philippe Lachaux , b b b ,1 Antoine Ducorps , Denis Schwartz , Francisco J. Varela a Neuromagnetic Imaging Laboratory, Department of Diagnostic Imaging, Hospital for Sick Children Research Institute, 555 University Avenue, Toronto, Ontario M5G 1X8, Canada b ´´ ˆ ˆ ´ Laboratoire de Neurosciences Cognitive et Imagerie Cerebrale, Hopital de La Salpetriere, Paris, France Accepted 23 May 2003 Abstract We applied a new method of imaging frequency-specific changes in brain activity in humans during a finger brushing task in order to measure changes in cortical rhythms during tactile stimulation. Neuromagnetic recordings were conducted in five subjects using a whole-head MEG system during tactile stimulation of the right index finger, with or without visual feedback, and while viewing another individual’s index finger being stimulated. Volumetric images of changes in source power relative to pre-stimulus baseline levels were computed with 2 mm resolution over the entire brain using a minimum-variance beamforming algorithm (synthetic aperture magnetometry). Onset of tactile stimulation produced a brief (200–300 ms) suppression of mu band (8–15 Hz) and beta band (15–30 Hz) cortical activity in the primary somatosensory and primary motor cortex, respectively, followed by a bilateral increase in beta band activity (‘beta rebound’) in motor cortex. This pattern of suppression / rebound was absent when subjects observed finger brushing or brushing motions without receiving stimulation. In contrast, these conditions resulted in bilateral increases in beta band activity in sensorimotor areas and decreased power in the alpha (8–12 Hz) band in primary visual areas. These results show that spatially filtered MEG provides a useful method for directly imaging the temporal sequence of changes in cortical rhythms during transient tactile stimulation, and provide evidence that observation of tactile input to another individual’s hand, or object motion itself, can influence independent rhythmic activity in visual and sensorimotor cortex. 2003 Elsevier B.V. All rights reserved. Theme: Motor systems and sensorimotor integration Topic: Cortex Keywords: Brain rhythms; Somatosensory cortex; MEG; Spatial filtering; Minimum-variance beamformer; Tactile perception 1. Introduction activity during sensorimotor tasks was termed event-re- lated desynchronization (ERD) or event-related synchroni- It has long been known from early EEG studies that the zation (ERS), respectively [28,44], and has been suggested amplitude of ongoing rhythmic brain activity in the alpha to arise from functional connectivity between sensorimotor (8–15 Hz) and beta (15–30 Hz) frequency bands can be cortex and other brain areas involved in various aspects of influenced by motor activity [8,16,20] or visual input motor preparation and execution (for recent review see [6,21]. A decrease or increase in ongoing rhythmic cortical Ref. [29] ). Direct electrocorticographic recordings in humans [3,11] and magnetoencephalographic (MEG) studies [13,35] have also provided evidence for the func- *Corresponding author. Tel.: 11-416-813-2168; fax: 11-416-813- tional significance of specific oscillatory brain activity in 7362. humans associated with both somatosensory stimulation E-mail address: [email protected] (D. Cheyne). 1 and motor output. These centrally distributed MEG Francisco J. Varela, deceased May 28, 2001, was Head of the Neuro- rhythms are predominant at frequencies around 10 Hz— dynamics Group at the Cognitive Neuroscience and Brain Imaging ˆ ˆ ´ Laboratory, CNRS UPR 640, Hopital de La Salpetriere, Paris, France. referred to as mu rhythm due to its similarity to the EEG 0926-6410 / 03 / $ – see front matter 2003 Elsevier B.V. All rights reserved. doi:10.1016 / S0926-6410(03)00173-3

Welcome message from author
This document is posted to help you gain knowledge. Please leave a comment to let me know what you think about it! Share it to your friends and learn new things together.
Transcript

Cognitive Brain Research 17 (2003) 599–611www.elsevier.com/ locate/cogbrainres
Research report
N euromagnetic imaging of cortical oscillations accompanying tactilestimulation
a , a b b*Douglas Cheyne , William Gaetz , Line Garnero , Jean-Philippe Lachaux ,b b b ,1Antoine Ducorps , Denis Schwartz , Francisco J. Varela
aNeuromagnetic Imaging Laboratory, Department of Diagnostic Imaging, Hospital for Sick Children Research Institute, 555 University Avenue,Toronto, Ontario M5G 1X8, Canada
b ´ ´ ˆ ˆ ´Laboratoire de Neurosciences Cognitive et Imagerie Cerebrale, Hopital de La Salpetriere, Paris, France
Accepted 23 May 2003
Abstract
We applied a new method of imaging frequency-specific changes in brain activity in humans during a finger brushing task in order tomeasure changes in cortical rhythms during tactile stimulation. Neuromagnetic recordings were conducted in five subjects using awhole-head MEG system during tactile stimulation of the right index finger, with or without visual feedback, and while viewing anotherindividual’s index finger being stimulated. Volumetric images of changes in source power relative to pre-stimulus baseline levels werecomputed with 2 mm resolution over the entire brain using a minimum-variance beamforming algorithm (synthetic aperturemagnetometry). Onset of tactile stimulation produced a brief (200–300 ms) suppression of mu band (8–15 Hz) and beta band (15–30 Hz)cortical activity in the primary somatosensory and primary motor cortex, respectively, followed by a bilateral increase in beta bandactivity (‘beta rebound’) in motor cortex. This pattern of suppression/ rebound was absent when subjects observed finger brushing orbrushing motions without receiving stimulation. In contrast, these conditions resulted in bilateral increases in beta band activity insensorimotor areas and decreased power in the alpha (8–12 Hz) band in primary visual areas. These results show that spatially filteredMEG provides a useful method for directly imaging the temporal sequence of changes in cortical rhythms during transient tactilestimulation, and provide evidence that observation of tactile input to another individual’s hand, or object motion itself, can influenceindependent rhythmic activity in visual and sensorimotor cortex. 2003 Elsevier B.V. All rights reserved.
Theme: Motor systems and sensorimotor integration
Topic: Cortex
Keywords: Brain rhythms; Somatosensory cortex; MEG; Spatial filtering; Minimum-variance beamformer; Tactile perception
1 . Introduction activity during sensorimotor tasks was termed event-re-lated desynchronization (ERD) or event-related synchroni-
It has long been known from early EEG studies that the zation (ERS), respectively[28,44], and has been suggestedamplitude of ongoing rhythmic brain activity in the alpha to arise from functional connectivity between sensorimotor(8–15 Hz) and beta (15–30 Hz) frequency bands can be cortex and other brain areas involved in various aspects ofinfluenced by motor activity[8,16,20] or visual input motor preparation and execution (for recent review see[6,21]. A decrease or increase in ongoing rhythmic cortical Ref.[29]). Direct electrocorticographic recordings in
humans [3,11] and magnetoencephalographic (MEG)studies[13,35] have also provided evidence for the func-
*Corresponding author. Tel.:11-416-813-2168; fax:11-416-813- tional significance of specific oscillatory brain activity in7362. humans associated with both somatosensory stimulation
E-mail address: [email protected](D. Cheyne).1 and motor output. These centrally distributed MEGFrancisco J. Varela, deceased May 28, 2001, was Head of the Neuro-
rhythms are predominant at frequencies around 10 Hz—dynamics Group at the Cognitive Neuroscience and Brain Imagingˆ ˆ ´Laboratory, CNRS UPR 640, Hopital de La Salpetriere, Paris, France. referred to as mu rhythm due to its similarity to the EEG
0926-6410/03/$ – see front matter 2003 Elsevier B.V. All rights reserved.doi:10.1016/S0926-6410(03)00173-3

600 D. Cheyne et al. / Cognitive Brain Research 17 (2003) 599–611
rhythm described by Gastaut[16]—and at frequencies multiple source models to peak latencies in the averagedaround 20 Hz. It has been suggested that these are response which may capture the maximal activation offunctionally independent cortical oscillations that originate brain areas that are highly time-locked to stimulus onset. Infrom postcentral and precentral regions, respectively contrast, beamformer-based spatial filtering provides in-[29,36]. The attenuation of the 20 Hz rhythm to somato- dependent estimates of source activity over time from asensory nerve stimulation is followed by a transient predetermined three-dimensional array of specified brainincrease or ‘rebound’ within 500 ms following stimulus locations, with minimum crosstalk between simultaneouslyonset, and bears a strong similarity to the beta rhythm active regions. This array can then be used to create arebound observed after onset of voluntary movements three-dimensional image of integrated source power from[14,44]. It was also found that the amplitude of this unaveraged data over arbitrary periods of time, therebystimulus-evoked rebound could be attenuated by sen- allowing for the measurement of oscillatory changes thatsorimotor tasks such as movement or passive tactile may not be precisely phase-locked to a single stimulus.stimulation[34] or even motor imagery[37]. This suggests In recent studies, the synthetic aperture magnetometrythat activation of the sensorimotor cortex, even in the (SAM) beamformer algorithm described by Robinson andabsence of overt movements or reafferent activity may co-workers[32,50] has been used to successfully detectinfluence beta band oscillatory activity, most likely involv- time-locked increases and decreases in the mu and betaing the primary motor cortex[9]. Interestingly, it has been frequency bands in the vicinity of the central sulcus duringshown that even observation of another individual’s move- median nerve stimulation[10,15,18] and voluntary con-ments (‘action observation’) may attenuate beta rhythm tractions of the hand[46], as well as oscillatory changes inrebound during median nerve stimulation[4,17]. This sensory association areas during more complex taskssuggests the involvement of these brain areas in the so-[19,41]. In the current study, we utilized SAM imaging ofcalled ‘mirror–neuron’ system of the frontal lobes, thought neuromagnetic measurements to localize frequency-spe-to play an important role in incorporating the observation cific changes in cortical rhythms during naturalistic tactileof another individual’s actions in motor learning[31]. stimulation (finger brushing). Since it is known that simple
The observation that peripheral nerve stimulation can observation of movements can also influence these braininduce beta band suppression followed by enhancement rhythms, we also measured rhythmic brain activity undersuggests that stimulation of the peripheral nerves may conditions where the subjects received visual feedbackinfluence 20 Hz oscillatory networks in motor cortex and regarding stimulation of their own hand, stimulation ofthe degree of rebound may thus index the functional state another individual’s hand, or simply movement in theof the motor cortex during various cognitive processes subject’s visual field, in order to investigate the role ofwhich may engage the motor system (e.g. motor imagery visual monitoring on oscillatory brain activity related toor observation of another’s movements). However, it is not somatosensory input.clear whether the rhythmic bursts induced by electricalstimulation of the peripheral nerves are related to thesynchronization of normally uncorrelated cortical oscil- 2 . Materials and methodslators, or if they are related to the normal processing ofsomatosensory input[34]. However, there is one report of 2 .1. Subjects and recordingsbeta band increases in the EEG overlying sensorimotorregions during mechanical stimulation of the digits[30]. In Five adult subjects (four male, one female, all right-this regard, it would be useful to utilize methods that handed) participated in the experiment with their informedmeasure directly, frequency-specific power changes in consent. Each subject sat upright in a comfortable chair,these cortical areas during such tasks, including naturalistic with eyes open, in a magnetically shielded room with theirsomatosensory stimulation in order to determine if these right arm resting on a wooden table in front of them. Arhythmic changes are present during normal activation of visual mask was placed in the subject’s visual field andthe somatosensory system. This would also allow for the adjusted so that they could view through a small aperturemeasurement of oscillatory changes in sensorimotor cortex the area surrounding their right hand that rested, palmresulting from various cognitive processes in the absence downwards, on the table surface. An experimenter sat nextof sensory input. to the subject and lightly brushed the dorsal surface of the
New spatial filtering approaches to the analysis of MEG posterior part of the subject’s right index finger with the tipand EEG data based on the minimum-variance beamformer of a small brush at random intervals separated by severalalgorithm have shown promise as an alternative source seconds. The visual mask was adjusted so that the motionlocalization method in which single trial data may be used of the experimenter’s arm or hand was not visible to theto calculate volumetric changes in signal power within subject.selected frequency ranges, without a priori assumptions Neuromagnetic activity was recorded during the stimula-regarding the number of active brain regions[32,39,47,50]. tion task using a whole-head 151 channel MEG systemConventional dipole analysis involves fitting single or (Omega-151, CTF Systems, Port Coquitlam, Canada). The

D. Cheyne et al. / Cognitive Brain Research 17 (2003) 599–611 601
movement of the brush across the finger interrupted a light of uncorrelated noise in the data at any point in the brain.path, which in turn triggered acquisition of individual Pseudo-t images were computed for specified frequencyepochs of 4-s duration, with a 2-s pre-trigger period. Each bands over the entire brain at 2 mm resolution usingcondition consisted of 100 trials collected at a sample rate selected active time windows relative to pre-stimulusof 625 samples per second with an on-line band-pass of 0 baseline windows of equivalent duration, in order toto 200 Hz. localize significant changes in total power during various
phases of the post-stimulus epoch. A non-parametric2 .2. Experimental design Monte-Carlo test for significance of peak pseudo-t values
in the images was performed by computing 500 iterationsThe experiment consisted of four different stimulation of each difference image while randomizing active and
conditions: (i) brushing the subject’s right index finger, control time windows across single trials[27]. The om-with the subject’s hand hidden from their view (TOUCH); nibus significance value corresponding to the upper 5th(ii) brushing the subject’s right index finger while the percentile for all voxels in the randomized images (P,subject viewed their hand (VIEW TOUCH); (iii) the 0.05) was then used as a threshold to identify statisticallysubject observing the brush touching the surface of the significant peaks in the pseudo-t images.table (OBSERVE MOTION); and (iv) the subject viewingthe brushing of the experimenter’s right index finger 2 .4. Time–frequency analysis of virtual sensors(OBSERVE TOUCH). In the latter two conditions thesubjects rested their hands on their laps below the table In order to observe the time course of frequency-specificand could only see the table surface or the experimenter’s changes at cortical locations of interest, the wide-band (1hand, which was placed in the same location as the to 50 Hz) output of the spatial filter for any selected targetsubject’s hand during the first two conditions. Throughout location could be viewed as a continuous time signal. Thisthe experiment, subjects were instructed to keep their ‘virtual sensor’ time series reflects the estimate of changehands and arms completely relaxed and to avoid any in source power at the target location for individual trials.movements of their hands. Subjects were questioned after The time–frequency representation (TFR) of virtual sensorthe recording session if they felt any tendency to move output was then calculated using a wavelet-based tech-during any of the experimental conditions. In one subject, nique[42,45] in which the time signal is convoluted withEMG was recorded from the forearm flexors and extensors Morlet wavelets that have a Gaussian distribution in thein order to confirm that there was no significant muscle time and frequency domain (see Appendix B). For time–activity during the tasks. frequency plots we used a ratio off /s 57.0 f
TFR power was computed from 1 to 50 Hz using Morlet2 .3. MEG analysis wavelets with a center frequency at 0.5 Hz intervals and
then averaged across single trials such that both phase-Synthetic aperture magnetometry (SAM) analysis of the locked and non-phase-locked activities sum to provide an
MEG data was carried out individually for all conditions estimate of overall source power, independent of phase-and subjects. This consisted of creating a three-dimension- locking with stimulus onset[45]. Power over a pre-al lattice of spatial filters (each spatial filter being a stimulus time period was subtracted as a baseline level forweighted linear combination of the MEG channels) at a each frequency band in order to produce pseudo-colouredfixed resolution throughout the brain, where the output of time–frequency plots showing both increases and de-each spatial filter is an estimate of the source strength of a creases of source power following stimulus onset.dipole source at that location as a function of time[32,50]. In addition, phase synchrony between virtual sensorsThe SAM spatial filter algorithm is based on minimum- was calculated using the phase-locking statistic (PLS)variance beamforming[32,47] and optimally suppresses described by Lachaux et al.[23]. This method has beeninteraction between simultaneously active sources and applied to electroencephalographic and intracranial datatherefore provides a spatially accurate indication of peak recorded during cognitive tasks[23,24,33].The calculationchange in source power (see Appendix A for details). This of the PLS coefficient is described in detail in Appendix B.approach presents a trade-off in terms of reducing error in Instantaneous phase-synchrony was calculated using theestimating source number and location by minimizing PLS coefficient for all combinations of virtual sensorscrosstalk between simultaneously active brain regions located at peak areas of power change in the SAM pseudo-while being limited in detecting sources that are highly t images, for each condition as described below. It shouldcorrelated throughout the time period of analysis, since be noted that beamformer methods such as SAM arethey will appear as correlated noise in the data[47]. The insensitive to multiple generators that are highly correlatedSAM algorithm also provides a convenient method of over the duration of the time window of analysis, sinceestimating power changes over a defined time window they appear as correlated noise that should be suppressed.relative to baseline activity by computing a differential As a result, any phase synchrony detected between virtualpower estimate (pseudo-t) that is normalized by the level sensors at distant locations is unlikely to be due to
602 D. Cheyne et al. / Cognitive Brain Research 17 (2003) 599–611
widespread correlated activity and reflects more accurately followed by a strong rebound or event-related synchroniza-phase-locking between independent neural generators. tion (Fig. 1,arrowsB andC). The latter varied in duration
with some subjects showing very strong rebound lastingover 1 s and others a weaker brief rebound of 400 to 500
3 . Results ms in duration. In three of the five subjects a strongsuppression was also observed in the mu frequency band
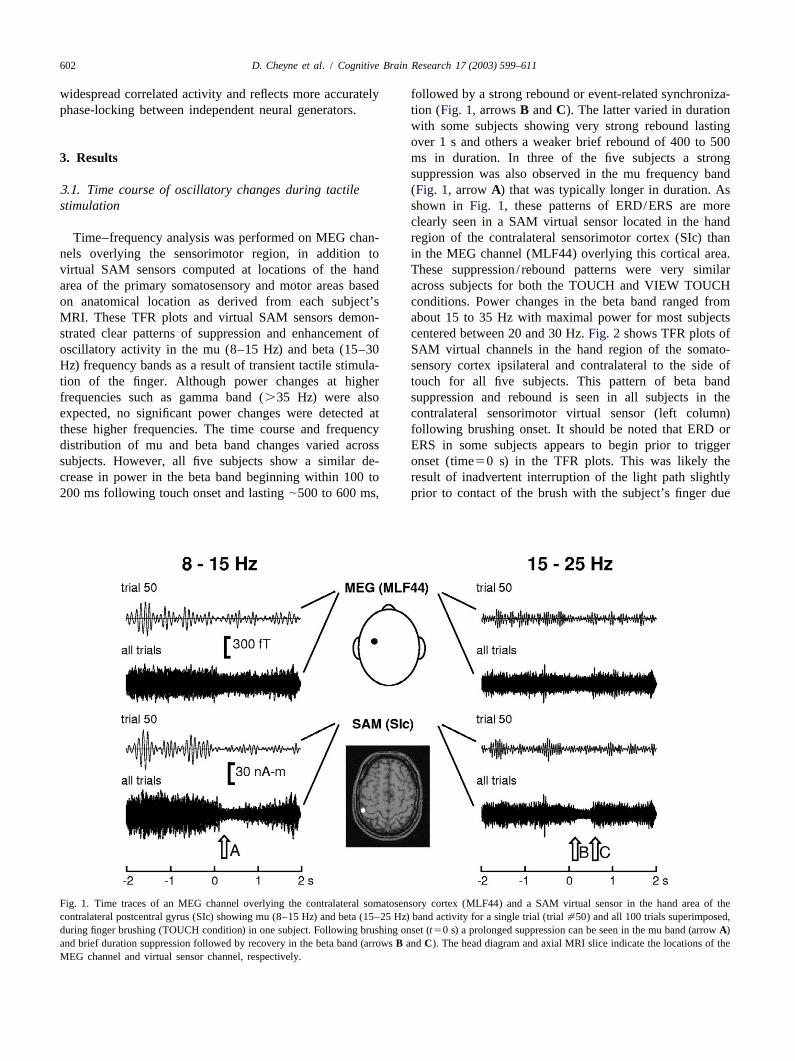
3 .1. Time course of oscillatory changes during tactile (Fig. 1, arrow A) that was typically longer in duration. Asstimulation shown in Fig. 1, these patterns of ERD/ERS are more
clearly seen in a SAM virtual sensor located in the handTime–frequency analysis was performed on MEG chan- region of the contralateral sensorimotor cortex (SIc) than
nels overlying the sensorimotor region, in addition to in the MEG channel (MLF44) overlying this cortical area.virtual SAM sensors computed at locations of the hand These suppression/ rebound patterns were very similararea of the primary somatosensory and motor areas based across subjects for both the TOUCH and VIEW TOUCHon anatomical location as derived from each subject’s conditions. Power changes in the beta band ranged fromMRI. These TFR plots and virtual SAM sensors demon- about 15 to 35 Hz with maximal power for most subjectsstrated clear patterns of suppression and enhancement of centered between 20 and 30 Hz.Fig. 2 shows TFR plots ofoscillatory activity in the mu (8–15 Hz) and beta (15–30 SAM virtual channels in the hand region of the somato-Hz) frequency bands as a result of transient tactile stimula- sensory cortex ipsilateral and contralateral to the side oftion of the finger. Although power changes at higher touch for all five subjects. This pattern of beta bandfrequencies such as gamma band (.35 Hz) were also suppression and rebound is seen in all subjects in theexpected, no significant power changes were detected at contralateral sensorimotor virtual sensor (left column)these higher frequencies. The time course and frequency following brushing onset. It should be noted that ERD ordistribution of mu and beta band changes varied across ERS in some subjects appears to begin prior to triggersubjects. However, all five subjects show a similar de- onset (time50 s) in the TFR plots. This was likely thecrease in power in the beta band beginning within 100 to result of inadvertent interruption of the light path slightly200 ms following touch onset and lasting|500 to 600 ms, prior to contact of the brush with the subject’s finger due
Fig. 1. Time traces of an MEG channel overlying the contralateral somatosensory cortex (MLF44) and a SAM virtual sensor in the hand area of thecontralateral postcentral gyrus (SIc) showing mu (8–15 Hz) and beta (15–25 Hz) band activity for a single trial (trial[50) and all 100 trials superimposed,during finger brushing (TOUCH condition) in one subject. Following brushing onset (t50 s) a prolonged suppression can be seen in the mu band (arrowA)and brief duration suppression followed by recovery in the beta band (arrowsB andC). The head diagram and axial MRI slice indicate the locations of theMEG channel and virtual sensor channel, respectively.

D. Cheyne et al. / Cognitive Brain Research 17 (2003) 599–611 603
Fig. 2. Time–frequency representation (TFR) plots for the virtual sensor output from locations in the hand region of the contralateral (left) somatosensorycortex (left column) and the ipsilateral (right) somatosensory cortex (right column) for all five subjects for the TOUCH condition. TFR source power isshown over the duration of the trial from 1 to 50 Hz as decreases (blue colours) or increases (red colours) relative to the pre-stimulus period (22 s to 0 s).The bottom row shows the TFR pattern averaged over all five subjects.
to the angle at which the brush was held. In some subjects, somewhat weak in two of the subjects. The overall patternmodulation of mu and beta activity was also observed in of rhythmic changes are reflected in the TFR plot averagedthe ipsilateral sensorimotor cortex (Fig. 2, right column). over all five subjects (Fig. 2, bottom row). Note that theIn most subjects, strong suppression of mu band activity mu ERD demonstrates a slightly different time coursecan also be seen following brushing onset although is (onset latency and duration) to that for the beta band. Also,
604 D. Cheyne et al. / Cognitive Brain Research 17 (2003) 599–611
beta ERS was largest contralateral to the side of stimula- source power, excluding peak pseudo-t values that did nottion and always preceded by suppression for the TOUCH exceed the omnibus threshold. Images were thencondition, whereas mu ERD was more bilaterally symmet- thresholded at half the maximum peak value to estimateric and did not show a clear rebound with the exception of the SAM peak width (full-width half-maximum, FWHM)subject 4. prior to overlay on the subject’s MRI to determine the
location and spatial extent of significant source power3 .2. Localization of mu and beta oscillations in changes.sensorimotor cortex Fig. 3 shows the FWHM thresholded pseudo-t images
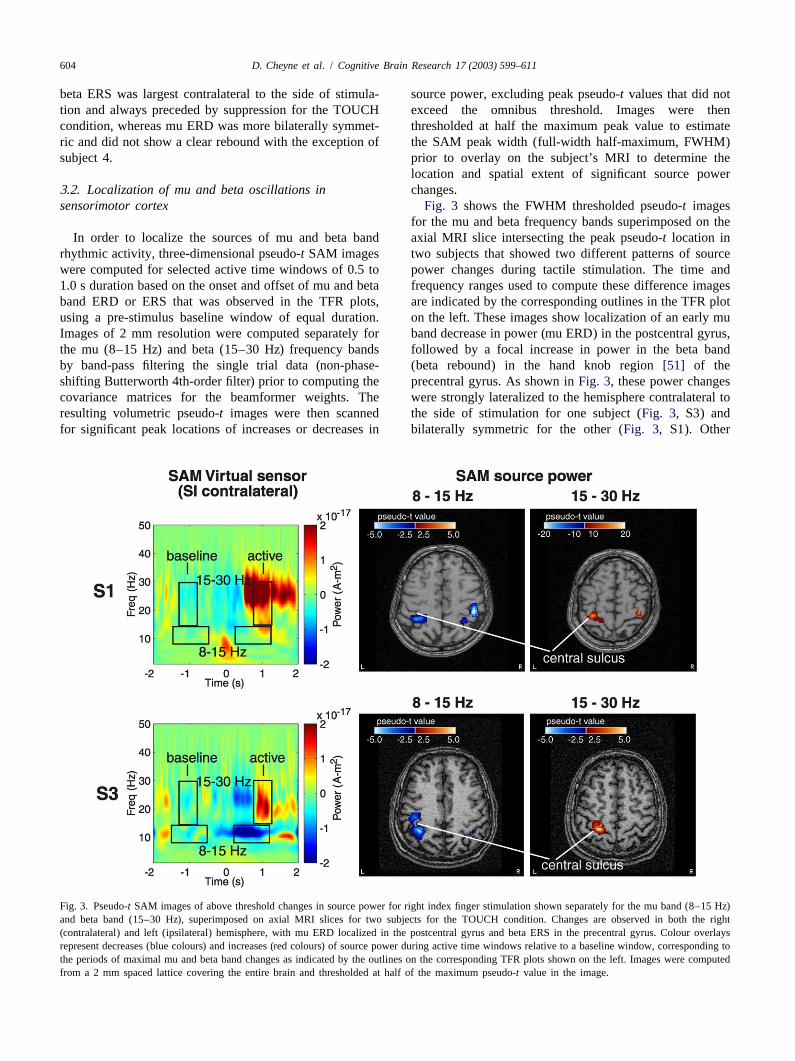
for the mu and beta frequency bands superimposed on theIn order to localize the sources of mu and beta band axial MRI slice intersecting the peak pseudo-t location in
rhythmic activity, three-dimensional pseudo-t SAM images two subjects that showed two different patterns of sourcewere computed for selected active time windows of 0.5 to power changes during tactile stimulation. The time and1.0 s duration based on the onset and offset of mu and beta frequency ranges used to compute these difference imagesband ERD or ERS that was observed in the TFR plots, are indicated by the corresponding outlines in the TFR plotusing a pre-stimulus baseline window of equal duration. on the left. These images show localization of an early muImages of 2 mm resolution were computed separately for band decrease in power (mu ERD) in the postcentral gyrus,the mu (8–15 Hz) and beta (15–30 Hz) frequency bands followed by a focal increase in power in the beta bandby band-pass filtering the single trial data (non-phase- (beta rebound) in the hand knob region[51] of theshifting Butterworth 4th-order filter) prior to computing the precentral gyrus. As shown inFig. 3, these power changescovariance matrices for the beamformer weights. The were strongly lateralized to the hemisphere contralateral toresulting volumetric pseudo-t images were then scanned the side of stimulation for one subject (Fig. 3, S3) andfor significant peak locations of increases or decreases in bilaterally symmetric for the other (Fig. 3, S1). Other
Fig. 3. Pseudo-t SAM images of above threshold changes in source power for right index finger stimulation shown separately for the mu band (8–15 Hz)and beta band (15–30 Hz), superimposed on axial MRI slices for two subjects for the TOUCH condition. Changes are observed in both the right(contralateral) and left (ipsilateral) hemisphere, with mu ERD localized in the postcentral gyrus and beta ERS in the precentral gyrus. Colour overlaysrepresent decreases (blue colours) and increases (red colours) of source power during active time windows relative to a baseline window, corresponding tothe periods of maximal mu and beta band changes as indicated by the outlines on the corresponding TFR plots shown on the left. Images were computedfrom a 2 mm spaced lattice covering the entire brain and thresholded at half of the maximum pseudo-t value in the image.

D. Cheyne et al. / Cognitive Brain Research 17 (2003) 599–611 605
subjects showed varying degrees of lateralization of these ditions, however, beta band ERS could be observed in allchanges and no subjects showed only ipsilateral power subjects that was time-locked to the onset of brushing ofchanges. In all cases however, the spatial extent of these the table or the experimenter’s hand.Fig. 4 shows TFRpeaks were typically 1–2 cm (FWHM) indicating highly plots for SAM virtual sensors computed for the hand areafocal changes in source power in either precentral (beta of contralateral motor cortex comparing the VIEWERS) or postcentral (mu ERD) cortical areas. The virtual TOUCH and OBSERVE TOUCH conditions in all fivechannels used in the TFR analysis described in Section 3.1 subjects. Beta band ERD can be clearly seen in all subjectswere then recalculated using location of the peaks in the for the VIEW TOUCH condition where they receivedcorresponding pseudo-t SAM images. However, these somatosensory input (Fig. 4, left column) which is absentwere found to produce very similar TFR plots, indicating in the OBSERVE TOUCH condition where no somato-that small changes in locations of the virtual sensors did sensory input was present (Fig. 4, right column), with thenot change the overall pattern of ERD and ERS. This exception of subject 4 who shows a small suppression insuggests that the TFR plots for the postcentral virtual the beta band in the OBSERVE TOUCH condition. Notesensors as shown inFig. 2 reflect source activity from both that subject 5, who showed a prolonged mu and beta bandprecentral and postcentral generators due to their close ERD (and somewhat weaker beta ERS) for the VIEWproximity. The three-dimensional pseudo-t images on the TOUCH condition, showed a strong mu band ERS in theother hand reflect more accurately the spatial extent of OBSERVE TOUCH condition. In comparison to the VIEWeach of these sensorimotor cortex sources of ERD and TOUCH condition, the pattern of beta ERS observed in theERS. One subject (S1) revealed significant peak changes OBSERVE TOUCH condition was more variable in onsetin power although only weak ERD can be seen in thecorresponding TFR plot. This is due partly to scaling of the
TFR to accommodate the much larger amplitude beta ERSoccurring at the same time, but also reflects the gain insignal-to-noise in the pseudo-t images due to integration ofpower over the time window of analysis. Significantdecreases in power in the 8 to 12 Hz frequency range werealso observed as peaks in the pseudo-t SAM images in theregion of primary visual cortex in the VIEW TOUCH,OBSERVE MOTION and OBSERVE TOUCH conditions.These changes in source power tended to be bilateral andmore diffuse than those of the sensorimotor cortex, withsome degree of lateralization to the ipsilateral hemisphere.This alpha band ERD in the visual areas appeared to beindependent of whether or not tactile stimulation wasreceived by the subject. In contrast, in the TOUCHcondition where subjects viewed a fixation point duringstimulation, rather than viewing their hand, subjectsshowed no change or in some cases, a slight decrease inalpha band activity in similar locations.
3 .3. Effects of visual feedback on sensorimotor rhythms
Based on the location of peak pseudo-t values in theSAM images for mu or beta band ERD or ERS, virtualsensors were calculated for locations in the hand region ofthe contralateral and ipsilateral somatosensory, motor andvisual cortex of all subjects. In cases where there was nocorresponding peak in the pseudo-t images, locations wereselected based on anatomical location of the primary motoror visual cortices determined from the subject’s MRI. As Fig. 4. Time–frequency representation (TFR) plots for the virtual sensordescribed above, significant beta band suppression fol-output from locations in the hand region of the contralateral (left) motor
cortex for all five subjects, comparing viewing their own finger beinglowed by rebound was observed in contralateral sen-brushed (VIEW TOUCH, left column) and observing the experimenter’ssorimotor areas for both the TOUCH and VIEW TOUCHfinger being brushed (OBSERVE TOUCH, right column). TFR source
conditions, but was absent in the OBSERVE MOTION and power is shown over the duration of the trial from 1 to 50 Hz as decreasesOBSERVE TOUCH conditions where subjects did not (blue colours) or increases (red colours) relative to the pre-stimulus periodreceive somatosensory stimulation. In the latter two con- (22 s to 0 s).
606 D. Cheyne et al. / Cognitive Brain Research 17 (2003) 599–611
and duration and varied across subjects. Although not strong synchronies between both sides of the visual cortex,shown, the patterns of ERS induced by the observation of but these appeared to be due to widespread backgroundbrushing (OBSERVE TOUCH) were remarkably similar alpha rhythm observed in this subject. Overall, thesefor the OBSERVE MOTION condition within individual patterns of interhemispheric phase synchrony were moresubjects, suggesting that these two conditions resulted in prevalent in the mu frequency band, and in all experimen-very similar changes in sensorimotor rhythmic activity. tal conditions, without any clear relationship to stimulusThis is also consistent with the general observation that onset.each subject demonstrated individually different, yet high-ly repeatable patterns of mu and beta band ERD and ERSfor similar stimulation conditions. 4 . Discussion
3 .4. Phase locking between virtual sensors These results indicate that time–frequency analysis ofneuromagnetic recordings using minimum-variance-based
The results of phase synchrony estimates calculated for beamformers can provide useful information about bothpairwise comparisons of virtual sensors in somatosensory, the location and time course of oscillatory brain activitymotor and visual areas in both the mu (alpha) 10–12 Hz associated with processing of somatosensory input. Analy-and beta (20–30 Hz) bands were variable among the sis of the time course of power changes from selectedsubjects and some subjects showed very little or no virtual sensor output indicated that discrete tactile eventssignificant synchrony patterns. Not surprisingly, SI and M1 (finger brushing) are accompanied by transient changes invirtual sensors within the same hemisphere were highly mu (8–15 Hz) and beta (15–30 Hz) band oscillatorycorrelated. This is likely due to their proximity and reflects activity. These changes consisted of a brief decrease orthe spatial leakage of power from strong focal sources in suppression of oscillatory activity prior to an increase oreither precentral or postcentral locations as indicated in the rebound, similar to changes observed during median nervepseudo-t images and were not considered as meaningful stimulation[36]. Three-dimensional SAM imaging ofcorrelations. As a result, synchrony patterns for these power changes integrated over the periods of suppressionvirtual sensors were considered together when making or enhancement confirmed the origin of these oscillatorycomparisons with virtual sensors in the contralateral changes in sensorimotor cortex. Specifically, powersensorimotor areas or visual cortex virtual sensors. changes in the mu band were localized to the lateral areas
We found no significant phase synchrony between visual of the postcentral gyrus, whereas a higher frequency betaareas and sensorimotor cortex, with the exception of weak band activity (with peak frequency ranging from 20 to 30synchrony in subject 5. Some subjects did however show Hz) was localized to focal locations in the hand knobperiods of phase synchrony between contralateral and region of the precentral gyrus[51]. This further supportsipsilateral motor and somatosensory cortex in both the mu previous speculations that rhythmic brain activity in theand beta frequency bands. As shown inTable 1, this mu and beta frequency bands reflects the activity ofoccurred either before or after onset of stimulation, or neuronal populations in the primary somatosensory andthroughout the trial, and was most prevalent in subject 5. motor areas, respectively[10,34,36].One subject (S3) showed no phase synchrony in any of the Using source analysis of EEG data, Pfurtscheller et al.conditions. For some subjects (e.g. subject 4) there were[30] reported beta band increases in the region of sen-
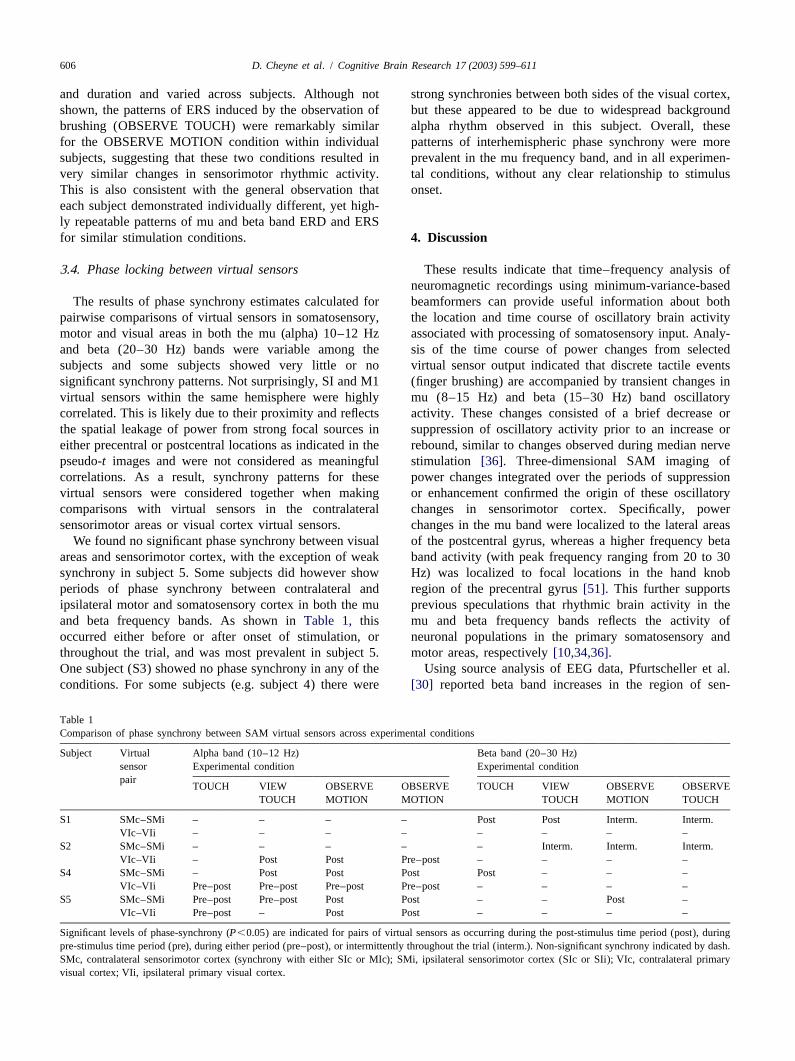
T able 1Comparison of phase synchrony between SAM virtual sensors across experimental conditions
Subject Virtual Alpha band (10–12 Hz) Beta band (20–30 Hz)sensor Experimental condition Experimental conditionpair
TOUCH VIEW OBSERVE OBSERVE TOUCH VIEW OBSERVE OBSERVETOUCH MOTION MOTION TOUCH MOTION TOUCH
S1 SMc–SMi – – – – Post Post Interm. Interm.VIc–VIi – – – – – – – –
S2 SMc–SMi – – – – – Interm. Interm. Interm.VIc–VIi – Post Post Pre–post – – – –
S4 SMc–SMi – Post Post Post Post – – –VIc–VIi Pre–post Pre–post Pre–post Pre–post – – – –
S5 SMc–SMi Pre–post Pre–post Post Post – – Post –VIc–VIi Pre–post – Post Post – – – –
Significant levels of phase-synchrony (P,0.05) are indicated for pairs of virtual sensors as occurring during the post-stimulus time period (post), duringpre-stimulus time period (pre), during either period (pre–post), or intermittently throughout the trial (interm.). Non-significant synchrony indicated by dash.SMc, contralateral sensorimotor cortex (synchrony with either SIc or MIc); SMi, ipsilateral sensorimotor cortex (SIc or SIi); VIc, contralateral primaryvisual cortex; VIi, ipsilateral primary visual cortex.

D. Cheyne et al. / Cognitive Brain Research 17 (2003) 599–611 607
sorimotor cortex following discrete mechanical stimulation dot) although to a lesser extent than that observed duringof the digits. In the current study, naturalistic stimulation action observation. However, these results are difficult toof the finger with a single brushing motion induced a brief compare to the current study since we observed rhythmicsuppression or event-related desynchronization (ERD) of changes in motor cortex in the absence of any sensorythese sensorimotor rhythms, followed by enhancement at stimulation. The latter study involved a salient sensorythe same frequency, suggesting that the beta band ERS stimulus (electrical nerve stimulation) that the subjectsreflects a true ‘rebound’ effect in response to normal might have attributed to the visual events occurring in theactivation of the somatosensory system. In addition, sub- proximity of their hand. In contrast, we observed betajects also showed suppression of mu band activity that was rhythm changes in motor cortex when subject’s hands weremore prolonged and in some subjects also showed an ERS completely at rest and not in view. In addition, beta bandor rebound at a longer latency than that observed for the suppression followed by enhancement was contingent onbeta band. This lower frequency ERD is consistent with a somatosensory input, whereas, the non-stimulation con-previous study using SAM imaging of rhythmic brain ditions resulted only in enhancement. The latter alsoactivity changes during continuous finger brushing, in tended to be bilaterally symmetric and variable in durationwhich contralateral decreases in mu rhythm where ob- and amplitude, suggesting a more non-specific activationserved in the postcentral gyrus[10] presumably reflecting of motor cortex that is induced by the observation ofactivation of primary somatosensory cortex (SI). Also brushing movements. This possibly reflects the influenceconsistent was the observation of mu band ERD in the of attention towards a body part involved in an executedipsilateral postcentral gyrus, although often weaker in [22] or even imagined[37] motor task. Alternatively, thisamplitude. Since post-stimulus mu ERD lasted for periods activation may not be related to activation of the motorof 500 ms or more, involvement of ipsilateral primary system, but rather to the anticipation of sensory input orsomatosensory area most likely reflects either transcallosal other non-specific attentional processes. Studies of selec-input from the contralateral SI[38] or possibly indirectly tive spatial attention have shown that attention directedfrom secondary somatosensory cortex (SII). However, in towards tactile stimuli presented to one side of the bodycontrast to changes observed in mu band rhythms reported can affect tactile discrimination[43] and are also accom-for continuous sensory stimulation[10] we did not observe panied by changes in cerebral blood flow in sensorimotorsignificant rhythmic changes in the secondary somato- areas[12,25]. Bastiaansen et al.[5] showed that directingsensory cortex. attention toward an expected sensory stimulus that con-
The observed transient suppression of mu or beta band tained information related to task performance resulted inactivity, followed by rebound or event-related synchroniza- stimulus preceding mu ERD over the sensory cortextion, occurred only in experimental conditions where the specific to the modality of stimulation, particularly for thesubjects received tactile stimulation. In contrast, significant visual modality. Thus, the observed modulation of sen-bilateral increases in beta band rhythmic activity were sorimotor rhythms by visual stimulation in the currentobserved in the same locations in motor cortex when study may reflect the influence of directed spatial attentionsubjects observed the brushing of another individual’s towards an anticipated tactile stimulus on one side of thehand in place of their own. This might be interpreted as the body, even in conditions where the subject is aware that itactivation of motor cortex as the result of action observa- is not their hand that will be stimulated. Further studies aretion, similar to previous reports that sensorimotor rhythms required to determine the exact role of motor cortexcan be modulated by observation of hand movements in activation during the visual monitoring of body-relatedthe subject’s field of view[4,17]. However, given that the actions in the subject’s visual field, particularly withexperimenter’s hand was hidden from view, and that respect to the location of the visual stimulus in relation tosimilar increases in beta band activity were observed in the subject’s own hand.motor cortex when subjects observed the motion of the An additional and unexpected finding in the currentbrush only, these changes in sensorimotor rhythms may study was that in all conditions that involved visualhave been related to transient visual stimulation resulting feedback, a prolonged suppression of oscillatory activity infrom the movement of the brush itself. This interpretation the 8–15 Hz band was observed following stimulus onsetis supported by reports of automatic activation of primary that could be localized to primary visual areas. It should bemotor cortex by various forms of visual input[1,6,21,48]. noted that this suppression could be clearly separated fromNonetheless, since subjects were aware that the brush simultaneous increases in power within the same frequencymovements were the result of the actions of the experimen- band in sensorimotor cortex. This reflects the usefulness ofter, we cannot rule out the possibility that the task still beamformer-based spatial filtering methods for the locali-involved some form of action observation, even though the zation of changes in oscillatory brain activity occurringother individual’s actions were indirectly observed. It simultaneously in different cortical areas at similar fre-should be noted that previous studies[4,17] reported that quencies. Although all stimulation was presented with thebeta rebound induced by median nerve stimulation could subject’s gaze directed towards the right side of their body,also be modulated by a moving visual stimulus (moving alpha band changes were typically bilateral, and in some

608 D. Cheyne et al. / Cognitive Brain Research 17 (2003) 599–611
cases lateralized to the hemisphere ipsilateral to the side of et al.[26] described coherence in the gamma band betweenstimulation or observation. Interestingly, Pfurtscheller et somatosensory and visual areas in the EEG during a taskal. [29] reported that movement-induced alpha band ERS that involved associative learning between a visualover parieto-occipital areas were larger ipsilateral to the stimulus and electric shock to the finger. The fact that weside of movement. did not observe significant gamma band activity in the
We also predicted that observation of sensory input to current study may reflect the automaticity of the taskone’s own hand in the VIEW TOUCH condition would (although subjects were asked to maintain their attention toinvolve the integration of sensory processing in visual and the sensory stimulation throughout the experiment) andsomatosensory areas—and therefore some degree of corre- indicates that any sensory interactions may have takenlated activity between these brain regions. However, we place at subcortical, or other brain regions not detected bywere unable to detect any significant degree of phase the current method.synchronization between virtual channels in somatosensory In conclusion, the results of the present study demon-and visual areas in either the mu or beta frequency bands. strate that neuromagnetic imaging based on minimum-This suggests that although there is simultaneous activation variance beamforming provides a new method of describ-of both visual and somatosensory cortex during observa- ing both the time course and specific location of changes intion of sensory stimulation of one’s own hand as reflected cortical oscillatory activity. In particular, we demonstrateby stimulus-induced ERD and ERS, the latter reflect that time-locked changes in rhythmic activity of both theuncorrelated changes in the activity of neural populations primary somatosensory and motor cortex are associatedthat display inherent oscillatory activity in the same (8–15 with simple tactile stimulation such as finger brushing.Hz) frequency range. We did observe intermittent phase When subjects receive visual feedback regarding thecorrelation between contralateral and ipsilateral motor and stimulation of their finger, additional yet uncorrelatedsomatosensory areas in some subjects in both the tactile rhythmic changes of similar frequency are observed instimulation and tactile observation conditions. This indi- visual areas. Most interestingly, motor cortex rhythmiccates that inter-hemispheric phase synchrony in sen- activity is also modulated during observation of the samesorimotor areas may be present during all tasks used in this brushing movements even when the subject receives nostudy, but is sensitive to signal amplitude and not clearly somatosensory input. This suggests that cortical motortask related. Nevertheless, this finding is interesting in light systems may be engaged during visual monitoring ofof reported interhemispheric coherence between motor body-oriented actions that do not necessarily involveareas during the performance and learning of complex movements or proprioceptive feedback and may reflect themotor tasks[2,40]. Thus, the modulation of motor cortex role of these systems in monitoring visual events in therhythms induced by observation of tactile stimulation may environment in the context of sensory input to the limbs.reflect the activation of similar cortical networks that areinvolved in higher level processing of sensory input to thehands that are required for the acquisition of motor skills A cknowledgementsand warrants further study.
The results of the current study support the hypothesis This work was supported by the Hospital for Sickthat lower frequency (mu and beta) oscillations in sen- Children Research Institute, the Natural Sciences andsorimotor areas are related to lower level aspects of Engineering Research Council of Canada (NSERC Grantsensorimotor control. Changes in sensorimotor rhythms in [184018) and an MRC (Canada)–CNRS (France) sci-the mu and beta frequency bands associated with various entific exchange grant to the first author. We would alsoaspects of voluntary movement have been suggested to like to thank Dr. Ole Jensen for making available thereflect the possible functional role of rhythmic cortical time–frequency wavelet analysis routines.activity in motor output (‘cortical drive’), as evidenced bythe observed coherence of these rhythms with oscillationsin the electromyogram[7,13]. The lack of phase synchronybetween the somatosensory and occipital rhythms of A ppendix A. Spatial filtering using synthetic aperturesimilar frequency in the current study implies a functional magnetometry (SAM)dissociation between sensorimotor mu and occipital alpha,as has been previously argued in the case of EEG rhythms Synthetic aperture magnetometry (SAM) spatial filtering[29]. This conclusion also implies that sensory integration is a method of computing source power estimates atof correlated events across sensory modalities (i.e. the arbitrary locations in the brain. These estimates are basedperceptual binding of sensory and visual events) may on the minimum-variance beamformer algorithminvolve higher frequency brain oscillations such as gamma [39,47,50]which suppresses contributions from other brainband (.35 Hz) rhythms that have been implicated in sources (and other sources of spatially correlated noise) bylong-range synchrony between different brain regions computing a unique set of sensor weights for a targetunderlying perceptual processes[49]. For example, Miltner dipole qr, f with location r and orientationf. For as d
D. Cheyne et al. / Cognitive Brain Research 17 (2003) 599–611 609
‘target’ locationu represented by a dipole source qr, f source power that is normalized by the estimated amounts dthe sensor weightsW are optimized to suppress spatial of uncorrelated noise in the data.u
correlations in the data that do not correspond to theforward solutionB for that dipole source. In the case ofu
the SAM minimum-variance beamformer algorithm, the A ppendix B. Phase locking statistic (PLS)optimal dipole orientationf for each target location isdetermined by an iterative search for the orientation that The instantaneous phases of the signals were extractedproduces maximal power output of the filter over the time from the coefficients of their wavelet transform at thewindow of interest[50]. The corresponding weights are target frequency f using the complex Gabor waveletderived from the data covariance matrixC which provides transformGWT (t, f ) which is the result of a convolution1,2an estimate of the spatial correlations in the data segmentsof the original signalJ (t) with a complex Gabor wavelet1,2of interest, and reflects the minimization of total source G(t, f ) both centered on frequencyf. The complex Gabor
2powerS (minimize all spatially correlated activity) while wavelet is defined as:u
retaining unit gain for the forward solution2t]
]]2 T T G t, f 5 f exp 2 exp j2pft . (B.1)s d s dœ S D2min S 5W CW subject toW B ; 1. (A.1)u u u u u 2 s /fs dhW ju
This is a Gaussian function centered at timet, with aThe weight vectorW solution for this minimization thatu constant standard deviations the value of which sets theprovides maximum spatial resolution (minimum sourcenumber of cyclesnco of the wavelet: nco 5 6s. Thisinteraction) is given by the forward solution weightedparameternco determines the temporal and frequencyinverse of the covariance matrix with no regularizationresolutions of the analysis by setting the widths of the[50]temporal and frequency intervals for which phases are
]21 T 21 21 Œmeasured; these widths are roughly equal tonco p /16fW 5C B B C B . (A.2)f gu u u uand 4f/nco. For instance, at 40 Hz withnco58, thetemporal and frequency resolution correspond to622 ms
In order to create frequency-specific images of theand to [20, 60] Hz, respectively. As the frequency range of
spatial distribution of source activity, a three-dimensionalthe data band-pass filtering is often narrower than the
lattice of spatial filters is created over a region of interestfrequency resolution of the Gabor wavelet transform, the
(ROI) using the band-limited single trial data. The outputlimiting factor for the choice ofnco is the temporal
of the filter corresponding to locationu is then integratedresolution of the Gabor wavelet transform. Finally,
over selected time windows producing a single estimate ofjw t, fs d1,2total source powerP where GWT t, f 5G t, f ^ J t 5 A t, f e (B.2)s d s d s d s du 1,2 1,2 1,2
TP 5W CW . (A.3) where^ implies convolution, andA (t, f ) andw (t, f )u u u 1,2 1,2
are the instantaneous amplitude and phase of the Gaborwavelet transform at frequencyf, respectively.Due to spatial non-uniformity of signal-to-noise with
Once the instantaneous phasesw (t, f ) have beendepth, these band-limited images of source power must be 1,2
estimated, one has to quantify the phase locking strengthnormalized by the estimated amount of uncorrelated noisenoise using the phase locking coefficientr(t, f ). For thisP projected by each spatial filter[32,47] which will beu
purpose, we use the procedure introduced by Lachaux etamplified with increasing depth. This noise level is derivedal. [23] which consists of quantifying the stability of thefrom the smallest singular value of a singular valuephase difference between the two signals during a givendecomposition of the time data across all chosen timetime window of lengthd centered on timet. The procedurewindows, providing a constant normalization value foris usually iterated in several frequency ranges to cover theeach target location. Differential images of source powerwhole meaningful part of the spectrum (typically 1–100can be created by subtracting filter output integrated overHz). The phase locking coefficientr is defined as:two different time windows in order to detect both
increases and decreases in total source power between t1d / 2
1‘active’ and ‘control’ states. In the current study we used]r t, f 5 E exp j w t, f 2w t, f dt (B.3)s d s d s ds s dd1 2the ‘pseudo-t’ estimate [32] of changes in source power d* *
t2d / 2between states wherewithactive control noisepseudo-t(u )5 P 2P /P . (A.4)s du u u ncy]d 5 (B.4)
fThis value is equivalent to the ‘neural activity index’
described by Van Veen et al.[47], and in contrast to a true wherency is the number of oscillations integrated in theStudent’s t-statistic, simply represents a difference in considered time window (usually set between 6 and 10).

610 D. Cheyne et al. / Cognitive Brain Research 17 (2003) 599–611
observation: a neuromagnetic study, Proc. Natl. Acad. Sci. 95The values for the coefficientr are comprised between 0(1998) 15061–15065.(complete phase jittering) and 1 (perfect phase locking).
[18] M . Hirata, A. Kato, M. Taniguchi, H. Ninomiya, D. Cheyne, S.E.Phase locked signals are detected whenr is larger than a Robinson, M. Maruno, E. Kumura, R. Ishii, N. Hirabuki, H.threshold which is statistically determined using surrogate Nakamura, T. Yoshimine, Frequency-dependent spatial distributiondata[23]. of human somatosensory evoked neuromagnetic fields, Neurosci.
Lett. 318 (2002) 73–76.[19] R . Ishii, K. Shinosaki, S. Ukai, T. Inouye, T. Ishihara, T. Yoshimine,
N. Hirabuki, H. Asada, T. Kihara, S.E. Robinson, M. Takeda,Medial prefrontal cortex generates frontal midline theta rhythm,R eferencesNeuroReport 10 (1999) 675–679.
[20] H . Jasper, W. Penfield, Electrocorticograms in man: effect of[1] S .J. Anderson, G.R. Barnes, N. Swift, N. Yamagishi, Magnetoence- voluntary movement upon the electrical activity of the precentral
phalographic (MEG) evidence for automatic activation of the human gyrus, Arch. Psychiatrie Zeitschr. Neurol. 183 (1949) 163–174.motor cortex by visual stimuli, in: K.J. Friston, R.S. Frackowiak, E. [21] Y . Koshino, E. Niedermeyer, Enhancement of Rolandic mu-rhythmBullmore (Eds.), 7th Annual Meeting of the Organization for by pattern vision, Electroencephalogr. Clin. Neurophysiol. 38 (1975)Human Brain Mapping, Academic Press, 2001, p. S857. 535–538.
[2] F .G. Andres, T. Mima, A.E. Schulman, J. Dichgans, M. Hallett, C. [22] R . Kristeva-Feige, C. Fritsch, J. Timmer, C.H. Lucking, Effects ofGerloff, Functional coupling of human cortical sensorimotor areas attention and precision of exerted force on beta range EEG-EMGduring bimanual skill acquisition, Brain 122 (1999) 855–870. synchronization during a maintained motor contraction task, Clin.
[3] S . Arroyo, R.P. Lesser, B. Gordon, S. Uematsu, D. Jackson, R. Neurophysiol. 113 (2002) 124–131.Webber, Functional significance of the mu rhythm of human cortex: [23] J .P. Lachaux, E. Rodriguez, M. le Van Quyen, J. Martinerie, F.an electrophysiologic study with subdural electrodes, Electroence- Varela, Studying single-trials of phase-synchronous activity in brain,phalogr. Clin. Neurophysiol. 87 (1993) 76–87. Int. J. Bifur. Chaos 10 (2000) 2429–2439.
[4] S . Avikainen, N. Forss, R. Hari, Modulated activation of the human [24] J .P. Lachaux, E. Rodriguez, J. Martinerie, C. Adam, D. Hasboun,SI and SII cortices during observation of hand actions, NeuroImage F.J. Varela, A quantitative study of gamma-band activity in human15 (2002) 640–646. intracranial recordings triggered by visual stimuli, Eur. J. Neurosci.
[5] M .C. Bastiaansen, C.H. Brunia, Anticipatory attention: an event- 12 (2000) 2608–2622.related desynchronization approach, Int. J. Psychophysiol. 43 (2001) [25] E . Macaluso, C. Frith, J. Driver, Selective spatial attention in vision91–107. and touch: unimodal and multimodal mechanisms revealed by PET,
[6] R . Brechat, R. Lecasble, Reactivity of mu-rhythm to flicker, J. Neurophysiol. 83 (2000) 3062–3075.Electroencephalogr. Clin. Neurophysiol. 18 (1965) 721–722. [26] W .H. Miltner, C. Braun, M. Arnold, H. Witte, E. Taub, Coherence of
[7] P . Brown, Cortical drives to human muscle: the Piper and related gamma-band EEG activity as a basis for associative learning, Naturerhythms, Prog. Neurobiol. 60 (2000) 97–108. 397 (1999) 434–436.
[8] G .E. Chatrian, M.C. Peterson, J.A. Lazarte, The blocking of the [27] T .E. Nichols, A.P. Holmes, Nonparametric permutation tests forroland wicket rhythm and some central changes related to move- functional neuroimaging: a primer with examples, Hum. Brainment, Electroencephalogr. Clin. Neurophysiol. 11 (1959) 497–510. Mapp. 15 (2002) 1–25.
[9] R . Chen, Z. Yaseen, L.G. Cohen, M. Hallett, Time course of [28] G . Pfurtscheller, A. Aranibar, Event-related cortical desynchroniza-corticospinal excitability in reaction time and self-paced movements, tion detected by power measurements of scalp EEG, Electroence-Ann. Neurol. 44 (1998) 317–325. phalogr. Clin. Neurophysiol. 42 (1977) 817–826.
[10] D . Cheyne, G.R. Barnes, I.E. Holliday, P.L. Furlong, Localization of [29] G . Pfurtscheller, F.H. Lopes da Silva, Event-related EEG/MEGbrain activity associated with non-time-locked tactile stimulation synchronization and desynchronization: basic principles, Clin.using synthetic aperture magnetometry, in: J. Nenonen, R.J. Il- Neurophysiol. 110 (1999) 1842–1857.moniemi, T. Katila (Eds.), 12th International Conference on [30] G . Pfurtscheller, M. Woertz, G. Krausz, C. Neuper, Distinction ofBiomagnetism, Helsinki University of Technology, Espoo, Finland, different fingers by the frequency of stimulus induced beta oscilla-2001, pp. 255–258. tions in the human EEG, Neurosci. Lett. 307 (2001) 49–52.
[11] N .E. Crone, D.L. Miglioretti, B. Gordon, J.M. Sieracki, M.T. [31] G . Rizzolatti, L. Fogassi, V. Gallese, Motor and cognitive functionsWilson, S. Uematsu, R.P. Lesser, Functional mapping of human of the ventral premotor cortex, Curr. Opin. Neurobiol. 12 (2002)sensorimotor cortex with electrocorticographic spectral analysis. I. 149–154.Alpha and beta event-related desynchronization, Brain 121 (1998) [32] S .E. Robinson, J. Vrba, Functional neuroimaging by synthetic2271–2299. aperture magnetometry, in: J. Nenonen, R.J. Ilmoniemi, T. Katila
[12] W .C. Drevets, H. Burton, T.O. Videen, A.Z. Snyder, J.R. Simpson (Eds.), Biomag 2000: Proceedings of the 12th International Confer-Jr., M.E. Raichle, Blood flow changes in human somatosensory ence on Biomagnetism, Helsinki University of Technology, Espoo,cortex during anticipated stimulation, Nature 373 (1995) 249–252. 1999, pp. 302–305.
[13] B . Feige, A. Aertsen, R. Kristeva-Feige, Dynamic synchronization [33] E . Rodriguez, N. George, J.P. Lachaux, J. Martinerie, B. Renault,between multiple cortical motor areas and muscle activity in phasic F.J. Varela, Perception’s shadow: long-distance synchronization ofvoluntary movements, J. Neurophysiol. 84 (2000) 2622–2629. human brain activity, Nature 397 (1999) 430–433.
[14] B . Feige, R. Kristeva-Feige, S. Rossi, V. Pizzella, P.M. Rossini, [34] S . Salenius, A. Schnitzler, R. Salmelin, V. Jousmaki, R. Hari,Neuromagnetic study of movement-related changes in rhythmic Modulation of human cortical rolandic rhythms during naturalbrain activity, Brain Res. 734 (1996) 252–260. sensorimotor tasks, NeuroImage 5 (1997) 221–228.
[15] W .C. Gaetz, D.O. Cheyne, Localization of human somatosensory [35] R . Salmelin, R. Hari, Characterization of spontaneous MEG rhythmscortex using spatially filtered magnetoencephalography, Neurosci. in healthy adults, Electroencephalogr. Clin. Neurophysiol. 91 (1994)Lett. 340 (2003) 161–164. 237–248.
´ ´ ´[16] H . Gastaut, Etude electrocorticographic de la reactivite des rhythmes [36] R . Salmelin, R. Hari, Spatiotemporal characteristics of sensorimotorrolandique, Rev. Neurol. Paris 87 (1952) 176–182. neuromagnetic rhythms related to thumb movement, Neuroscience
[17] R . Hari, N. Forss, S. Avikainen, E. Kirveskari, S. Salenius, G. 60 (1994) 537–550.Rizzolatti, Activation of human primary motor cortex during action [37] A . Schnitzler, S. Salenius, R. Salmelin, V. Jousmaki, R. Hari,

D. Cheyne et al. / Cognitive Brain Research 17 (2003) 599–611 611
Involvement of primary motor cortex in motor imagery: a neuro- [45] C . Tallon-Baudry, O. Bertrand, C. Delpuech, J. Permier, Oscillatorymagnetic study, NeuroImage 6 (1997) 201–208. gamma-band (30–70 Hz) activity induced by a visual search task in
[38] A . Schnitzler, R. Salmelin, S. Salenius,V. Jousmaki, R. Hari, Tactile humans, J. Neurosci. 17 (1997) 722–734.information from the human hand reaches the ipsilateral primary [46] M . Taniguchi, A. Kato, N. Fujita, M. Hirata, H. Tanaka, T. Kihara,somatosensory cortex, Neurosci. Lett. 200 (1995) 25–28. H. Ninomiya, N. Hirabuki, H. Nakamura, S.E. Robinson, D.
[39] K . Sekihara, S.S. Nagarajan, D. Poeppel, A. Marantz, Y. Miyashita, Cheyne, T. Yoshimine, Movement-related desynchronization of theApplication of a MEG eigenspace beamformer to reconstructing cerebral cortex studied with spatially filtered magnetoence-spatio-temporal activities of neural sources, Hum. Brain Mapp. 15 phalography, NeuroImage 12 (2000) 298–306.(2002) 199–215. [47] B .D. Van Veen, W. van Drongelen, M. Yuchtman, A. Suzuki,
[40] D .J. Serrien, P. Brown, The functional role of interhemispheric Localization of brain electrical activity via linearly constrainedsynchronization in the control of bimanual timing tasks, Exp. Brain minimum variance spatial filtering, IEEE Trans. Biomed. Eng. 44Res. 147 (2002) 268–272. (1997) 867–880.
[41] K .D. Singh, G.R. Barnes, A. Hillebrand, E.M.E. Forde, A.L. [48] S . Vanni, K. Portin, V. Virsu, R. Hari, Mu rhythm modulation duringWilliams, Task-related changes in cortical synchronization are changes of visual percepts, Neuroscience 91 (1999) 21–31.spatially coincident with the hemodynamic response, NeuroImage [49] F . Varela, J.P. Lachaux, E. Rodriguez, J. Martinerie, The brainweb:16 (2002) 103–114. phase synchronization and large-scale integration, Nat. Rev. Neuro-
[42] J . Sinkkonen, H. Tiitinen, R. Naatanen, Gabor filters: an informative sci. 2 (2001) 229–239.way for analysing event-related brain activity, J. Neurosci. Methods [50] J . Vrba, S.E. Robinson, Signal processing in magnetoence-56 (1995) 99–104. phalography, Methods (Duluth) 25 (2001) 249–271.
[43] C . Spence, F. Pavani, J. Driver, Crossmodal links between vision [51] T .A. Yousry, U.D. Schmid, H. Alkadhi, D. Schmidt, A. Peraud, A.and touch in covert endogenous spatial attention, J. Exp. Psychol. Buettner, P. Winkler, Localization of the motor hand area to a knobHum. Percept. Perform. 26 (2000) 1298–1319. on the precentral gyrus. A new landmark, Brain 120 (1997) 141–
[44] A . Stancak Jr., G. Pfurtscheller, Desynchronization and recovery of 157.beta rhythms during brisk and slow self-paced finger movements inman, Neurosci. Lett. 196 (1995) 21–24.
Related Documents


![Behavioural Brain Research · presentations of body parts (i.e., somatotopic organization) have been established in mammals and humans [33–35]. In the tactile domain, the cortical](https://static.cupdf.com/doc/110x72/5f8daeb8de58b554b0742e49/behavioural-brain-research-presentations-of-body-parts-ie-somatotopic-organization.jpg)


