www.huawei.com HUAWEI TECHNOLOGIES CO., LTD. Security Level: Introduction of Network Coverage Evaluation Based on MR

Welcome message from author
This document is posted to help you gain knowledge. Please leave a comment to let me know what you think about it! Share it to your friends and learn new things together.
Transcript
www.huawei.com
HUAWEI TECHNOLOGIES CO., LTD.
Security Level:
Introduction of Network Coverage Evaluation Based on MR
Page 2
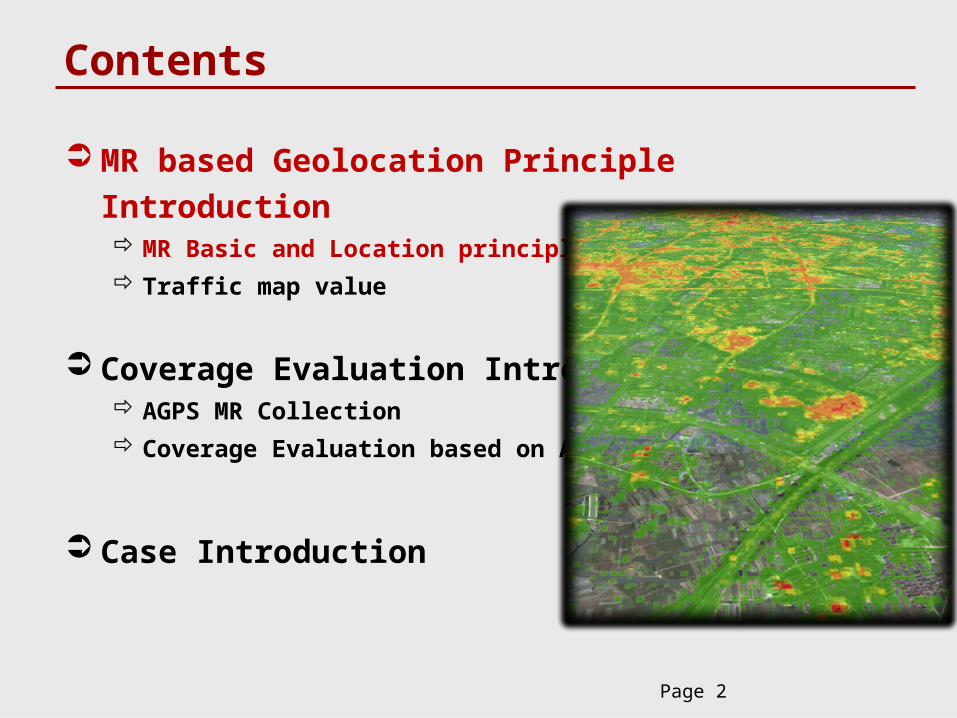
Contents
MR based Geolocation Principle Introduction MR Basic and Location principle Traffic map value
Coverage Evaluation Introduction AGPS MR Collection Coverage Evaluation based on AGPS MR
Case Introduction
www.huawei.com
HUAWEI TECHNOLOGIES CO., LTD.
Security Level:
Page 3
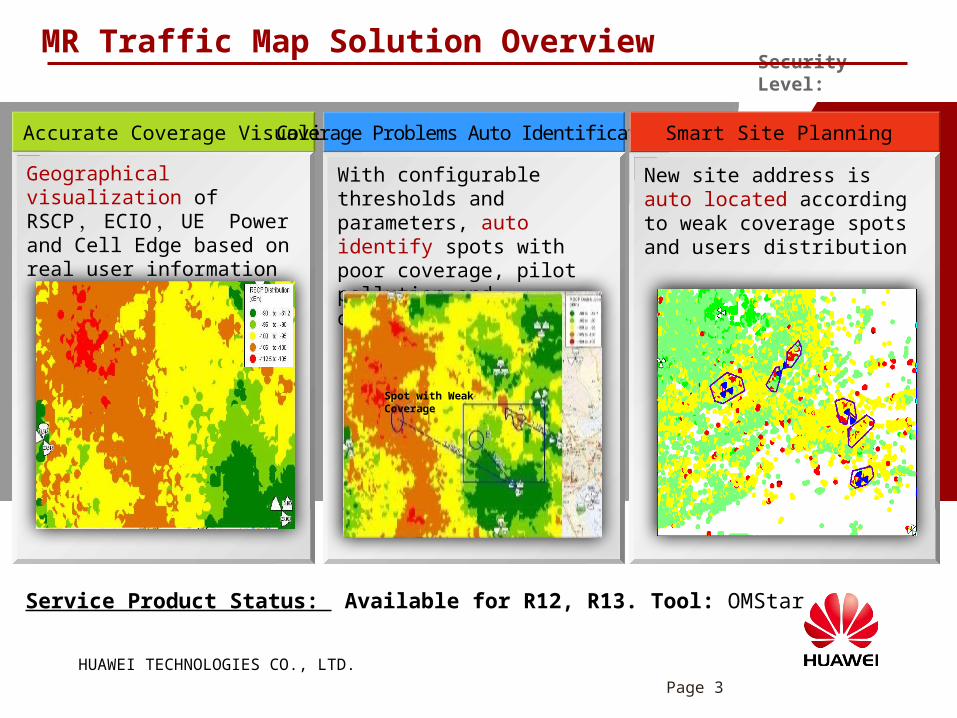
MR Traffic Map Solution Overview
Geographical visualization of RSCP, ECIO, UE Power and Cell Edge based on real user information
Accurate Coverage Visualization
With configurable thresholds and parameters, auto identify spots with poor coverage, pilot pollution and overshooting problems
Coverage Problems Auto Identification
Spot with Weak Coverage
New site address is auto located according to weak coverage spots and users distribution
Smart Site Planning
Service Product Status: Available for R12, R13. Tool: OMStar
Page 4
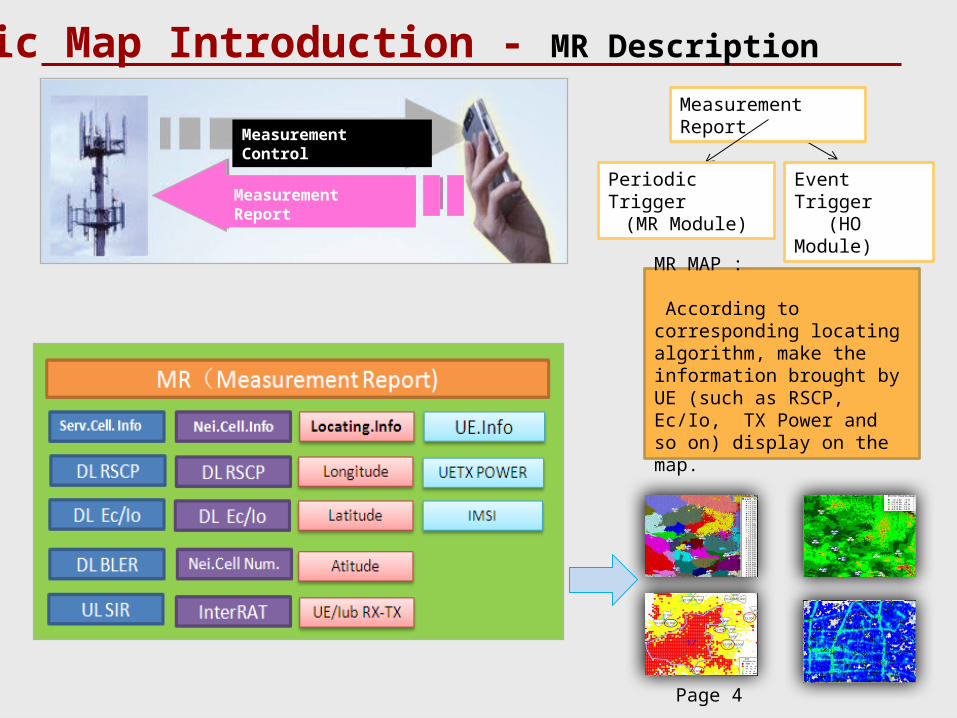
Measurement Control
Measurement Report
Measurement Report
Periodic Trigger(MR Module)
Event Trigger (HO Module)
MR MAP : According to corresponding locating algorithm, make the information brought by UE (such as RSCP, Ec/Io, TX Power and so on) display on the map.
Traffic Map Introduction - MR Description
HUAWEI TECHNOLOGIES CO., LTD. Page 5华华华华华华 华华华华华华华华,
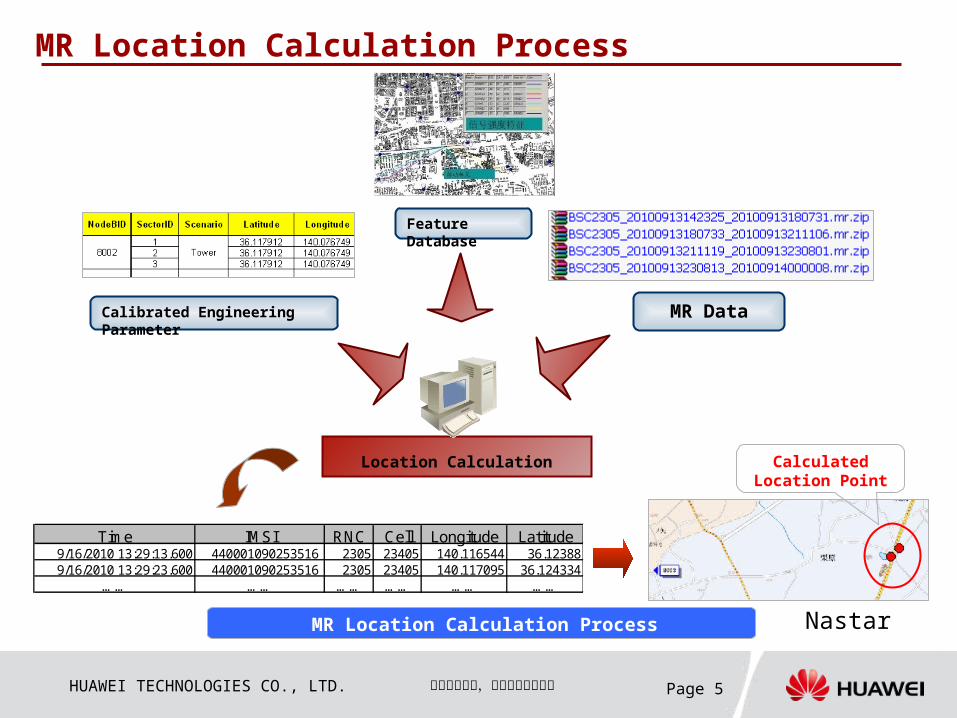
MR Location Calculation Process
Calibrated Engineering Parameter
Feature Database
MR Data
Location Calculation Calculated Location Point
MR Location Calculation Process Nastar
Tim e IM SI RNC Cell Longitude Latitude9/16/2010 13:29:13.600 440001090253516 2305 23405 140.116544 36.123889/16/2010 13:29:23.600 440001090253516 2305 23405 140.117095 36.124334
… … … … … … … … … … … …
HUAWEI TECHNOLOGIES CO., LTD. Page 6华华华华华华 华华华华华华华华,
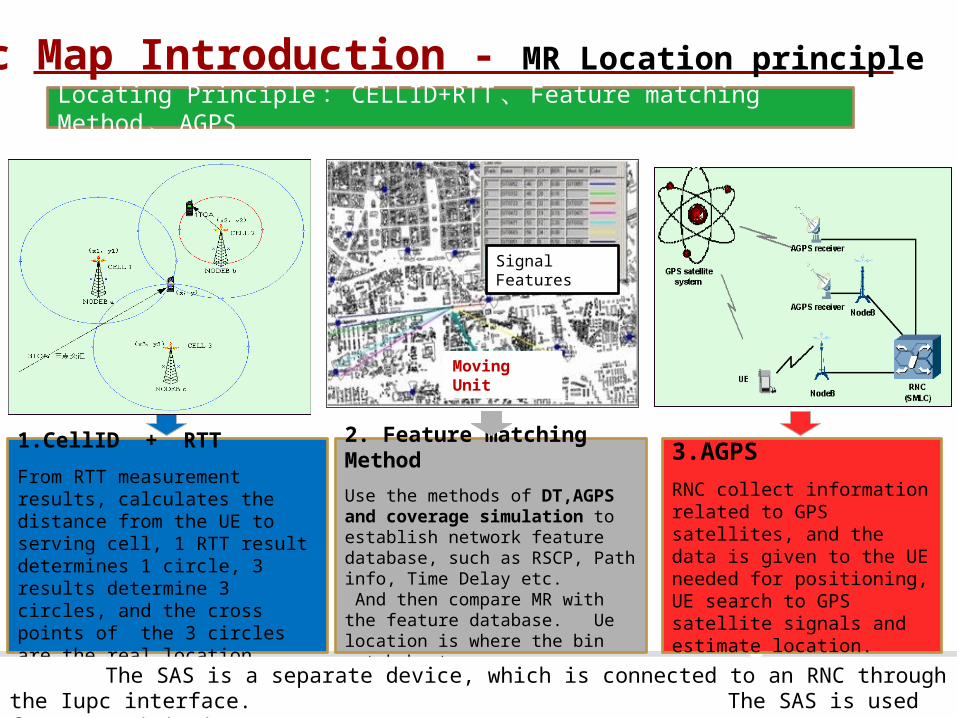
Locating Principle: CELLID+RTT、 Feature matching Method、 AGPS
1.CellID + RTTFrom RTT measurement results, calculates the distance from the UE to serving cell, 1 RTT result determines 1 circle, 3 results determine 3 circles, and the cross points of the 3 circles are the real location.
Signal Features
Moving Unit
2. Feature matching MethodUse the methods of DT,AGPS and coverage simulation to establish network feature database, such as RSCP, Path info, Time Delay etc. And then compare MR with the feature database. Ue location is where the bin match best.
3.AGPSRNC collect information related to GPS satellites, and the data is given to the UE needed for positioning, UE search to GPS satellite signals and estimate location.
Traffic Map Introduction - MR Location principle
The SAS is a separate device, which is connected to an RNC through the Iupc interface. The SAS is used for UE positioning
HUAWEI TECHNOLOGIES CO., LTD. Page 7华华华华华华 华华华华华华华华,
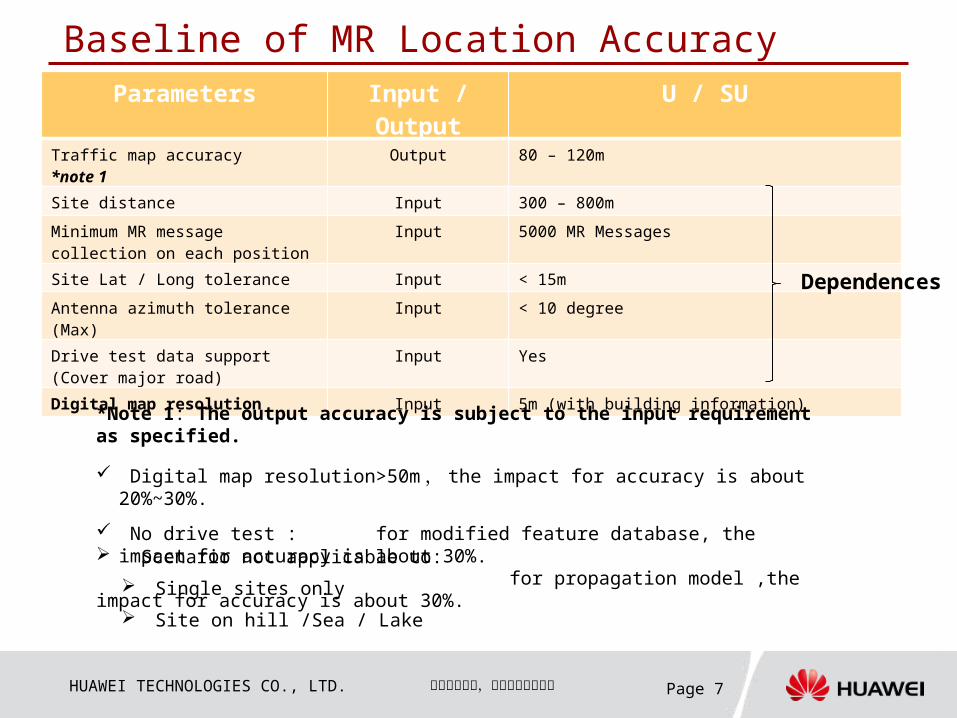
Baseline of MR Location Accuracy
Scenario not applicable to: Single sites only Site on hill /Sea / Lake
Parameters Input / Output
U / SU
Traffic map accuracy*note 1
Output 80 – 120m
Site distance Input 300 – 800mMinimum MR message collection on each position
Input 5000 MR Messages
Site Lat / Long tolerance Input < 15mAntenna azimuth tolerance (Max)
Input < 10 degree
Drive test data support (Cover major road)
Input Yes
Digital map resolution Input 5m (with building information)*Note 1: The output accuracy is subject to the input requirement as specified. Digital map resolution>50m, the impact for accuracy is about
20%~30%. No drive test : for modified feature database, the
impact for accuracy is about 30%. for propagation model ,the impact for accuracy is about 30%.
Dependences
HUAWEI TECHNOLOGIES CO., LTD. Page 8华华华华华华 华华华华华华华华,
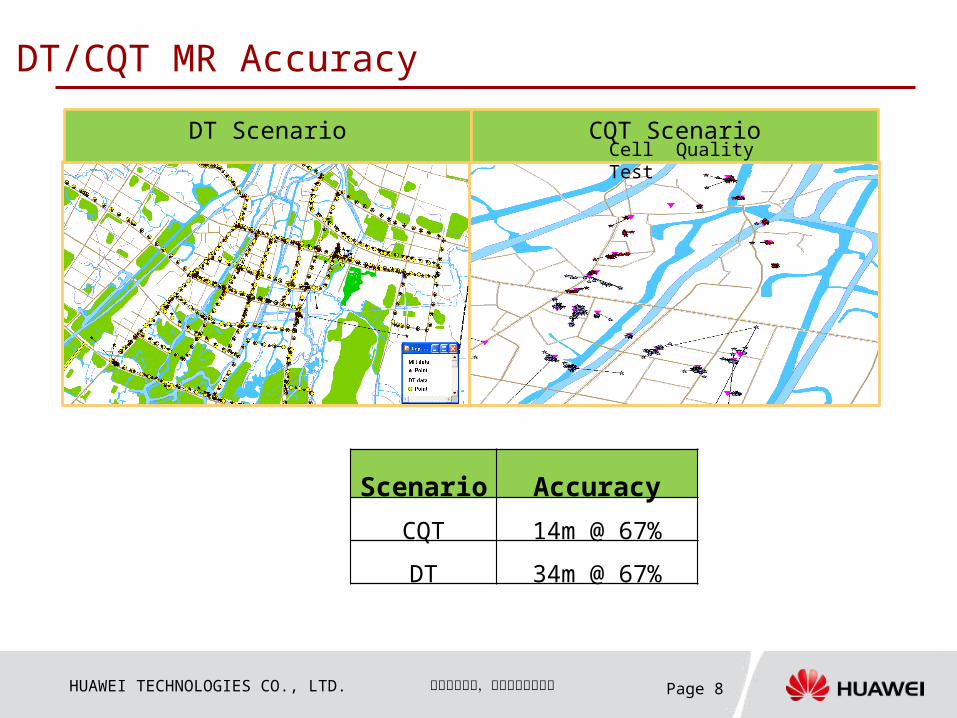
DT/CQT MR Accuracy
Scenario AccuracyCQT 14m @ 67%DT 34m @ 67%
DT Scenario CQT ScenarioCell Quality Test
HUAWEI TECHNOLOGIES CO., LTD. Page 9华华华华华华 华华华华华华华华,
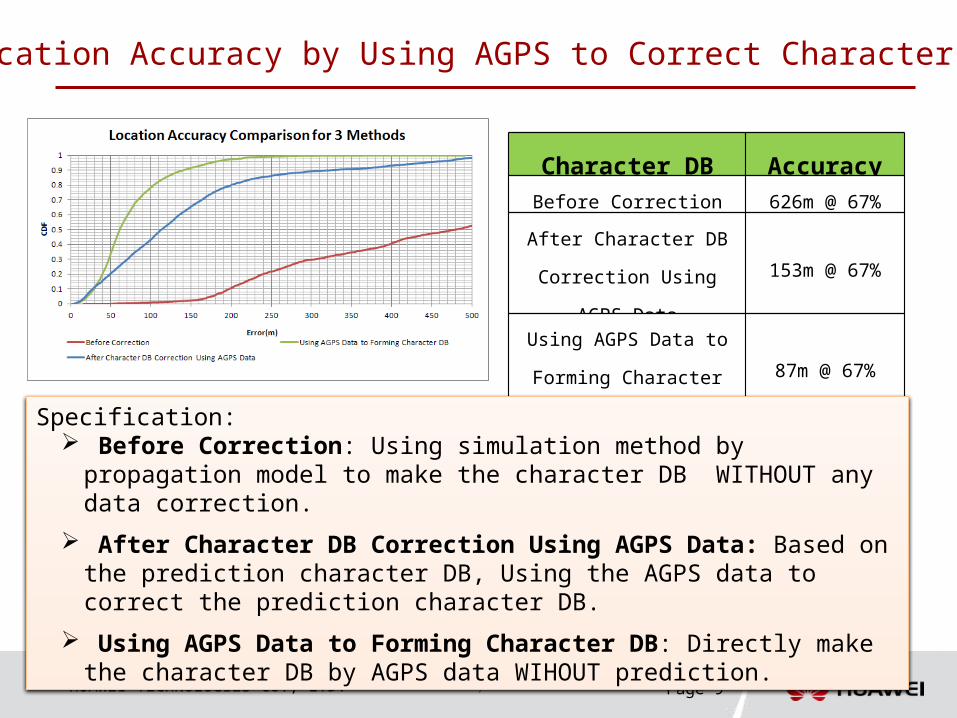
MR Location Accuracy by Using AGPS to Correct Character DB
Character DB AccuracyBefore Correction 626m @ 67%After Character DB
Correction Using
AGPS Data
153m @ 67%
Using AGPS Data to
Forming Character
DB
87m @ 67%
Specification: Before Correction: Using simulation method by propagation model to make the character DB WITHOUT any data correction.
After Character DB Correction Using AGPS Data: Based on the prediction character DB, Using the AGPS data to correct the prediction character DB.
Using AGPS Data to Forming Character DB: Directly make the character DB by AGPS data WIHOUT prediction.
HUAWEI TECHNOLOGIES CO., LTD. Page 10华华华华华华 华华华华华华华华,
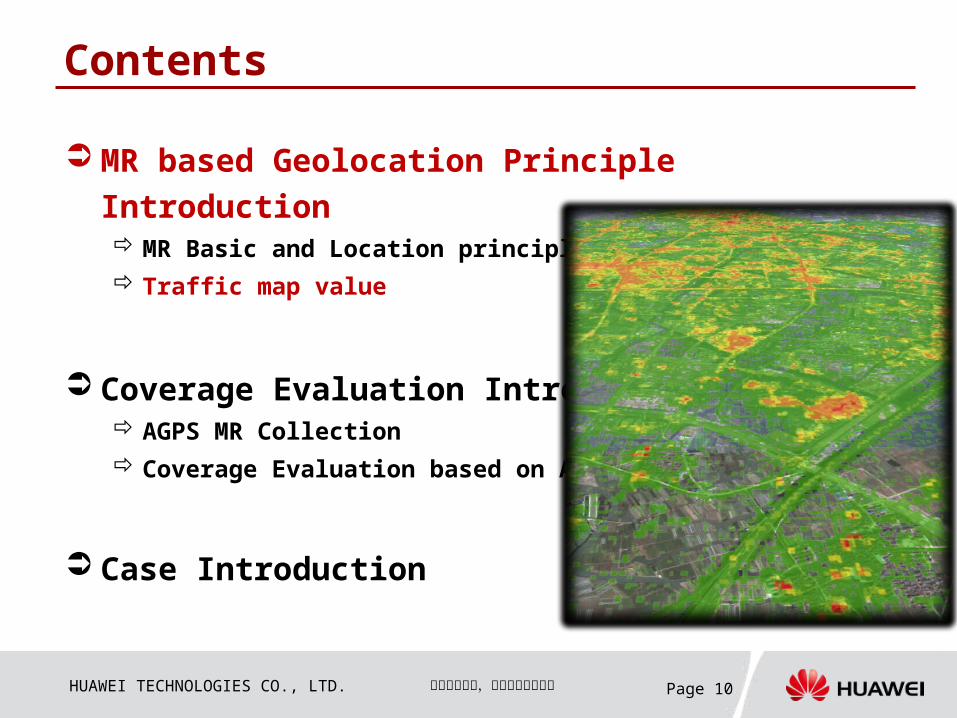
Contents
MR based Geolocation Principle Introduction MR Basic and Location principle Traffic map value
Coverage Evaluation Introduction AGPS MR Collection Coverage Evaluation based on AGPS MR
Case Introduction
HUAWEI TECHNOLOGIES CO., LTD. Page 11华华华华华华 华华华华华华华华,
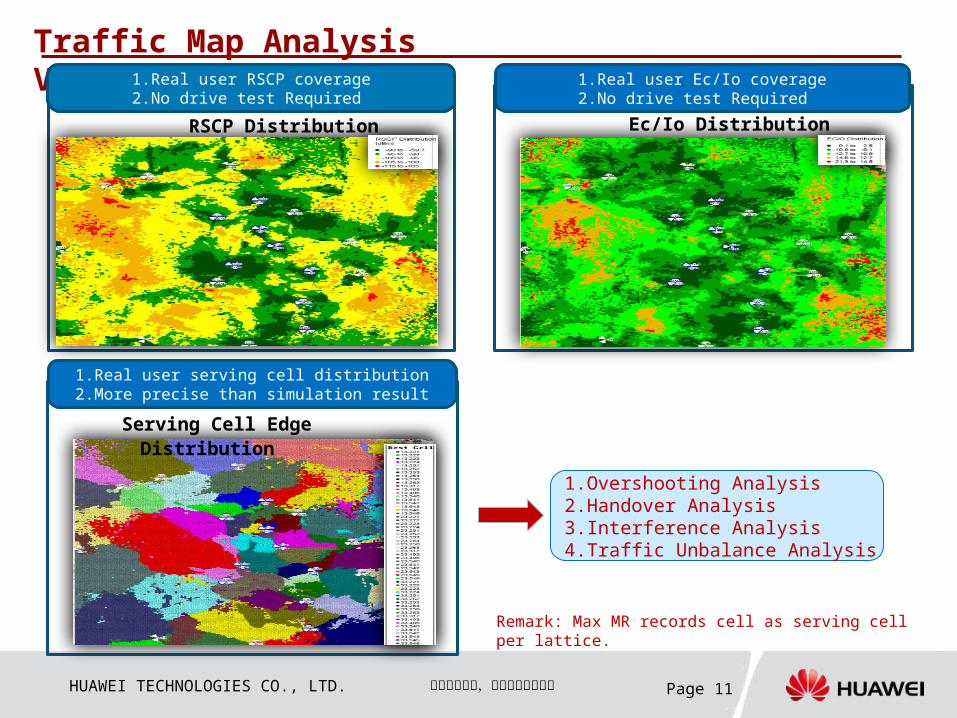
Traffic Map Analysis Value1.Real user RSCP coverage
2.No drive test RequiredRSCP Distribution
1.Real user Ec/Io coverage2.No drive test Required
Ec/Io Distribution
1.Real user serving cell distribution2.More precise than simulation result
Serving Cell Edge Distribution
1.Overshooting Analysis2.Handover Analysis3.Interference Analysis4.Traffic Unbalance Analysis
Remark: Max MR records cell as serving cell per lattice.
HUAWEI TECHNOLOGIES CO., LTD. Page 12华华华华华华 华华华华华华华华,
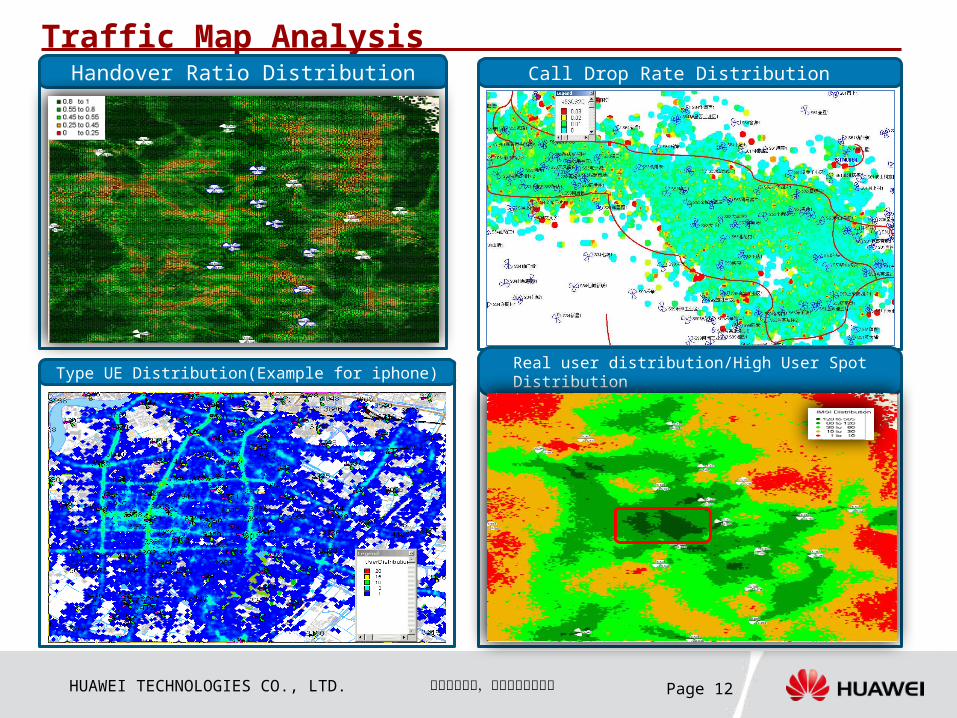
Traffic Map Analysis Value Call Drop Rate Distribution
Type UE Distribution(Example for iphone) Real user distribution/High User Spot Distribution
Handover Ratio Distribution
HUAWEI TECHNOLOGIES CO., LTD. Page 13华华华华华华 华华华华华华华华,
Contents
MR based Geolocation Principle Introduction MR Basic and Location principle Traffic map value
Coverage Evaluation Introduction AGPS MR Collection Coverage Evaluation based on AGPS MR
Case Introduction
HUAWEI TECHNOLOGIES CO., LTD. Page 14华华华华华华 华华华华华华华华,
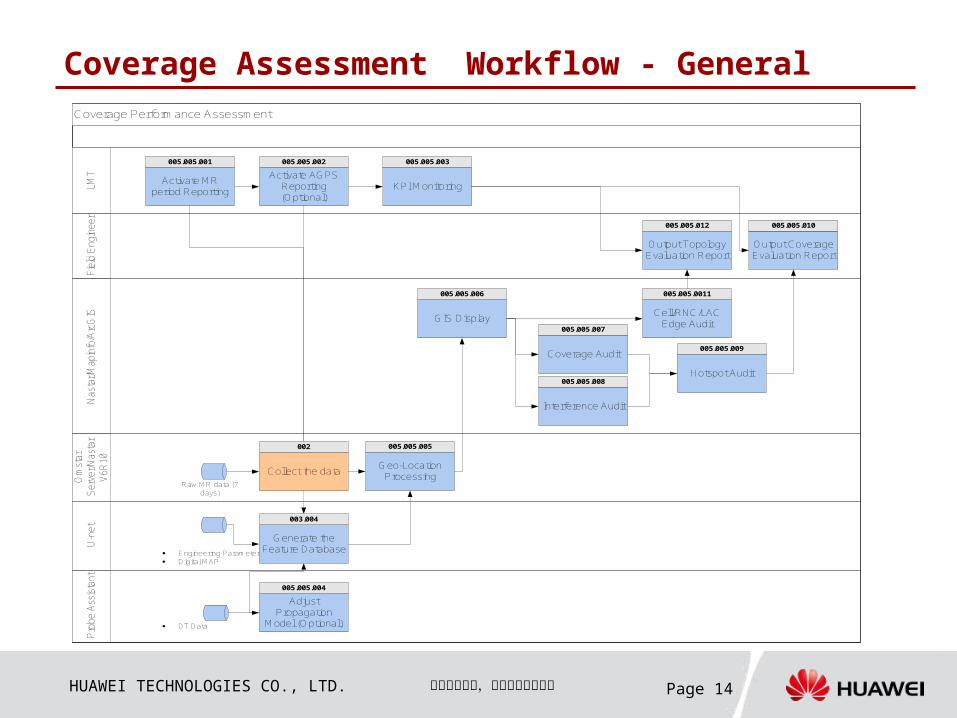
Coverage Assessment Workflow - GeneralCoverage Perform ance Assessm ent
Field En
gineer
Nasta
r/Mapinfo/A
rcGIS
Probe A
ssistant
U-net
Omsta
r Se
rver/N
astar
V6R1
0LM
T
005.005.001
Activate M R period Reporting
Raw M R data (7 days)
· Engineering Param eter· Digital M AP
G enerate the Feature Database
003.004
005.005.005
Geo-Location Processing
· DT Data
Adjust Propagation
M odel (Optional)
005.005.004
005.005.002
Activate AGPS Reporting (Optional)
GIS Display
005.005.006
Coverage Audit
005.005.007
Interference Audit
005.005.008
005.005.009
Hotspot Audit
005.005.003
KPI M onitoring
Output Coverage Evaluation Report
005.005.010
Collect the data
002
Cell/RNC/LAC Edge Audit
005.005.0011
005.005.012
Output Topology Evaluation Report
HUAWEI TECHNOLOGIES CO., LTD. Page 15华华华华华华 华华华华华华华华,
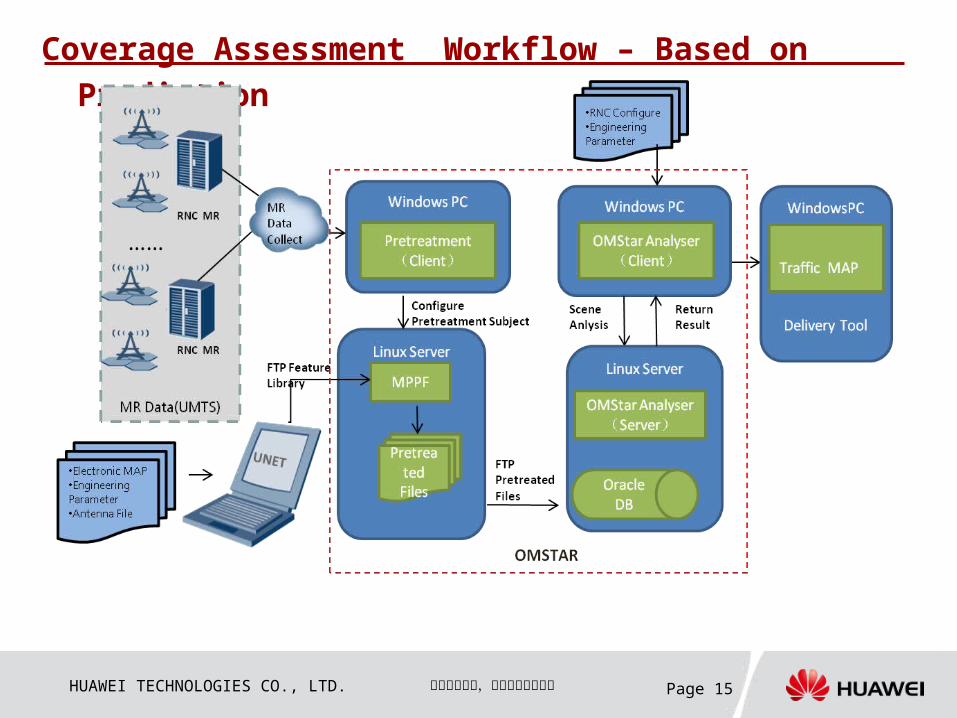
Coverage Assessment Workflow – Based on Prediction
HUAWEI TECHNOLOGIES CO., LTD. Page 16华华华华华华 华华华华华华华华,
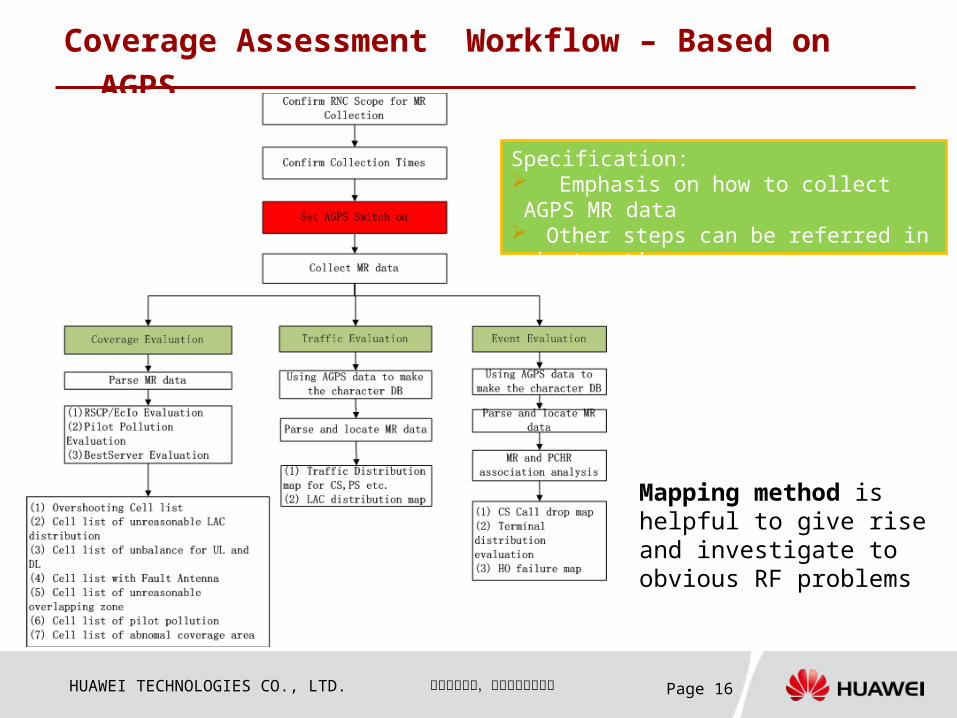
Coverage Assessment Workflow – Based on AGPS
Specification: Emphasis on how to collect AGPS MR data Other steps can be referred in instructions.
Mapping method is helpful to give rise and investigate to obvious RF problems
HUAWEI TECHNOLOGIES CO., LTD. Page 17华华华华华华 华华华华华华华华,
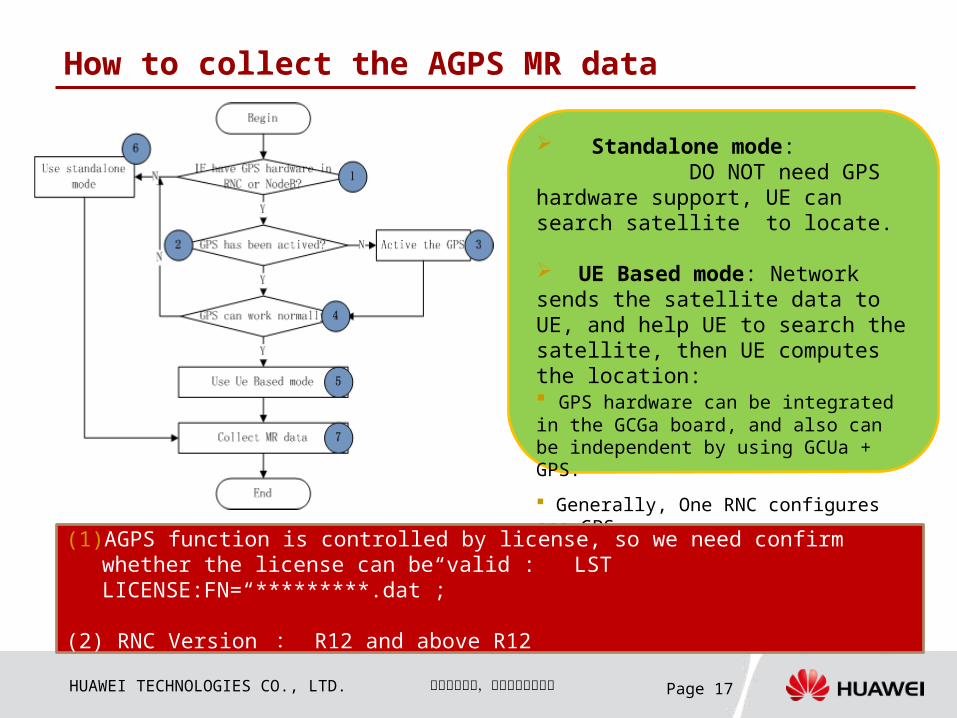
How to collect the AGPS MR data
Standalone mode: DO NOT need GPS hardware support, UE can search satellite to locate.
UE Based mode: Network sends the satellite data to UE, and help UE to search the satellite, then UE computes the location: GPS hardware can be integrated in the GCGa board, and also can be independent by using GCUa + GPS. Generally, One RNC configures one GPS. (1)AGPS function is controlled by license, so we need confirm
whether the license can be valid : LST LICENSE:FN=“*********.dat”;
(2) RNC Version : R12 and above R12
HUAWEI TECHNOLOGIES CO., LTD. Page 18华华华华华华 华华华华华华华华,
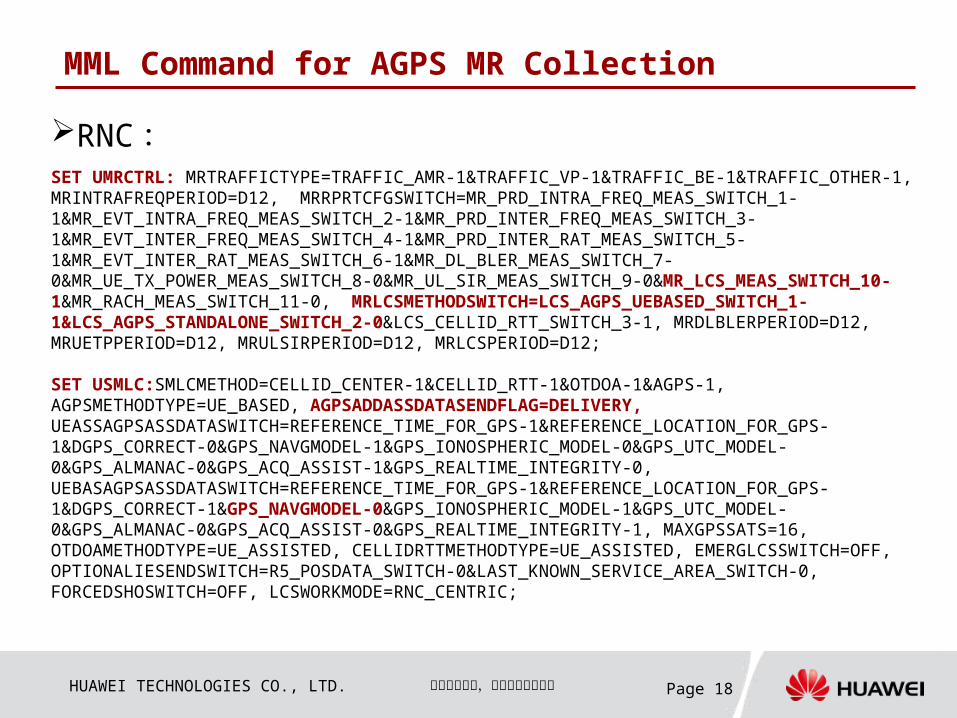
MML Command for AGPS MR Collection
RNC:SET UMRCTRL: MRTRAFFICTYPE=TRAFFIC_AMR-1&TRAFFIC_VP-1&TRAFFIC_BE-1&TRAFFIC_OTHER-1, MRINTRAFREQPERIOD=D12, MRRPRTCFGSWITCH=MR_PRD_INTRA_FREQ_MEAS_SWITCH_1-1&MR_EVT_INTRA_FREQ_MEAS_SWITCH_2-1&MR_PRD_INTER_FREQ_MEAS_SWITCH_3-1&MR_EVT_INTER_FREQ_MEAS_SWITCH_4-1&MR_PRD_INTER_RAT_MEAS_SWITCH_5-1&MR_EVT_INTER_RAT_MEAS_SWITCH_6-1&MR_DL_BLER_MEAS_SWITCH_7-0&MR_UE_TX_POWER_MEAS_SWITCH_8-0&MR_UL_SIR_MEAS_SWITCH_9-0&MR_LCS_MEAS_SWITCH_10-1&MR_RACH_MEAS_SWITCH_11-0, MRLCSMETHODSWITCH=LCS_AGPS_UEBASED_SWITCH_1-1&LCS_AGPS_STANDALONE_SWITCH_2-0&LCS_CELLID_RTT_SWITCH_3-1, MRDLBLERPERIOD=D12, MRUETPPERIOD=D12, MRULSIRPERIOD=D12, MRLCSPERIOD=D12;
SET USMLC:SMLCMETHOD=CELLID_CENTER-1&CELLID_RTT-1&OTDOA-1&AGPS-1, AGPSMETHODTYPE=UE_BASED, AGPSADDASSDATASENDFLAG=DELIVERY, UEASSAGPSASSDATASWITCH=REFERENCE_TIME_FOR_GPS-1&REFERENCE_LOCATION_FOR_GPS-1&DGPS_CORRECT-0&GPS_NAVGMODEL-1&GPS_IONOSPHERIC_MODEL-0&GPS_UTC_MODEL-0&GPS_ALMANAC-0&GPS_ACQ_ASSIST-1&GPS_REALTIME_INTEGRITY-0, UEBASAGPSASSDATASWITCH=REFERENCE_TIME_FOR_GPS-1&REFERENCE_LOCATION_FOR_GPS-1&DGPS_CORRECT-1&GPS_NAVGMODEL-0&GPS_IONOSPHERIC_MODEL-1&GPS_UTC_MODEL-0&GPS_ALMANAC-0&GPS_ACQ_ASSIST-0&GPS_REALTIME_INTEGRITY-1, MAXGPSSATS=16, OTDOAMETHODTYPE=UE_ASSISTED, CELLIDRTTMETHODTYPE=UE_ASSISTED, EMERGLCSSWITCH=OFF, OPTIONALIESENDSWITCH=R5_POSDATA_SWITCH-0&LAST_KNOWN_SERVICE_AREA_SWITCH-0, FORCEDSHOSWITCH=OFF, LCSWORKMODE=RNC_CENTRIC;
HUAWEI TECHNOLOGIES CO., LTD. Page 19华华华华华华 华华华华华华华华,
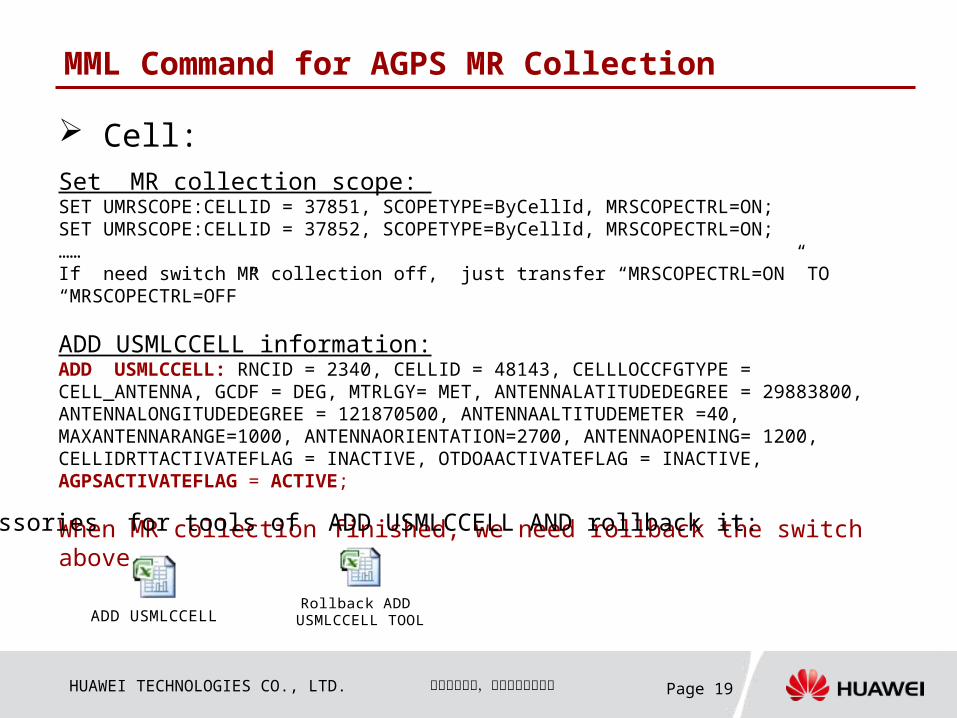
MML Command for AGPS MR Collection
Cell:Set MR collection scope: SET UMRSCOPE:CELLID = 37851, SCOPETYPE=ByCellId, MRSCOPECTRL=ON;SET UMRSCOPE:CELLID = 37852, SCOPETYPE=ByCellId, MRSCOPECTRL=ON;……If need switch MR collection off, just transfer “MRSCOPECTRL=ON” TO “MRSCOPECTRL=OFF”
ADD USMLCCELL information:ADD USMLCCELL: RNCID = 2340, CELLID = 48143, CELLLOCCFGTYPE = CELL_ANTENNA, GCDF = DEG, MTRLGY= MET, ANTENNALATITUDEDEGREE = 29883800, ANTENNALONGITUDEDEGREE = 121870500, ANTENNAALTITUDEMETER =40, MAXANTENNARANGE=1000, ANTENNAORIENTATION=2700, ANTENNAOPENING= 1200, CELLIDRTTACTIVATEFLAG = INACTIVE, OTDOAACTIVATEFLAG = INACTIVE, AGPSACTIVATEFLAG = ACTIVE;
When MR collection finished, we need rollback the switch above.
Accessories for tools of ADD USMLCCELL AND rollback it:
ADD USMLCCELLRollback ADD USMLCCELL TOOL
HUAWEI TECHNOLOGIES CO., LTD. Page 20华华华华华华 华华华华华华华华,
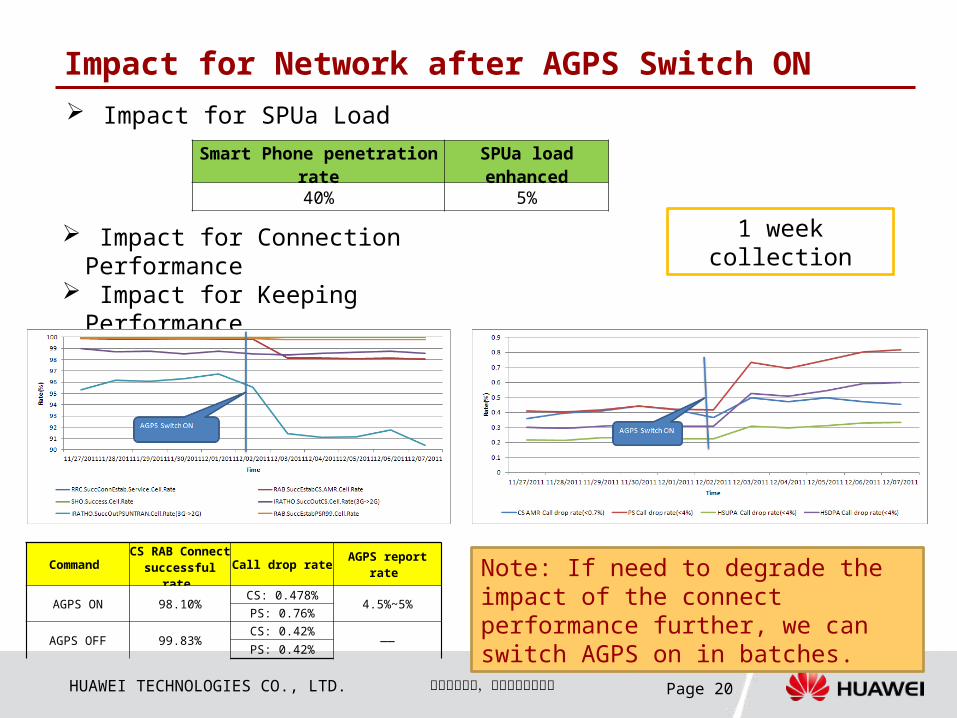
Impact for Network after AGPS Switch ON Impact for SPUa Load
Smart Phone penetration rate
SPUa load enhanced
40% 5%
Impact for Connection Performance
Impact for Keeping Performance
Impact for Handover Performance
Command CS RAB Connect successful
rate Call drop rate AGPS report
rate
AGPS ON 98.10% CS: 0.478% 4.5%~5%PS: 0.76%
AGPS OFF 99.83% CS: 0.42% ——PS: 0.42%
Note: If need to degrade the impact of the connect performance further, we can switch AGPS on in batches.
1 week collection
HUAWEI TECHNOLOGIES CO., LTD. Page 21华华华华华华 华华华华华华华华,
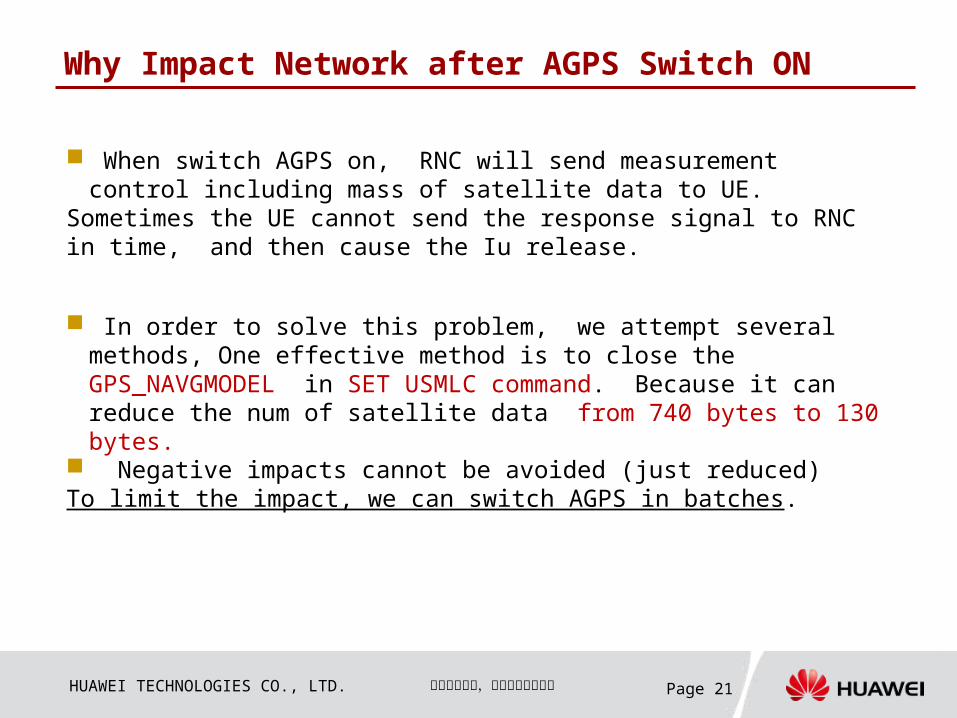
Why Impact Network after AGPS Switch ON
When switch AGPS on, RNC will send measurement control including mass of satellite data to UE.
Sometimes the UE cannot send the response signal to RNC in time, and then cause the Iu release.
In order to solve this problem, we attempt several methods, One effective method is to close the GPS_NAVGMODEL in SET USMLC command. Because it can reduce the num of satellite data from 740 bytes to 130 bytes.
Negative impacts cannot be avoided (just reduced) To limit the impact, we can switch AGPS in batches.
HUAWEI TECHNOLOGIES CO., LTD. Page 22华华华华华华 华华华华华华华华, Page 22
Contents
MR based Geolocation Principle Introduction MR Basic and Location principle Traffic map value
Coverage Evaluation Introduction AGPS MR Collection Coverage Evaluation based on AGPS MR
Case Introduction
HUAWEI TECHNOLOGIES CO., LTD. Page 23华华华华华华 华华华华华华华华,
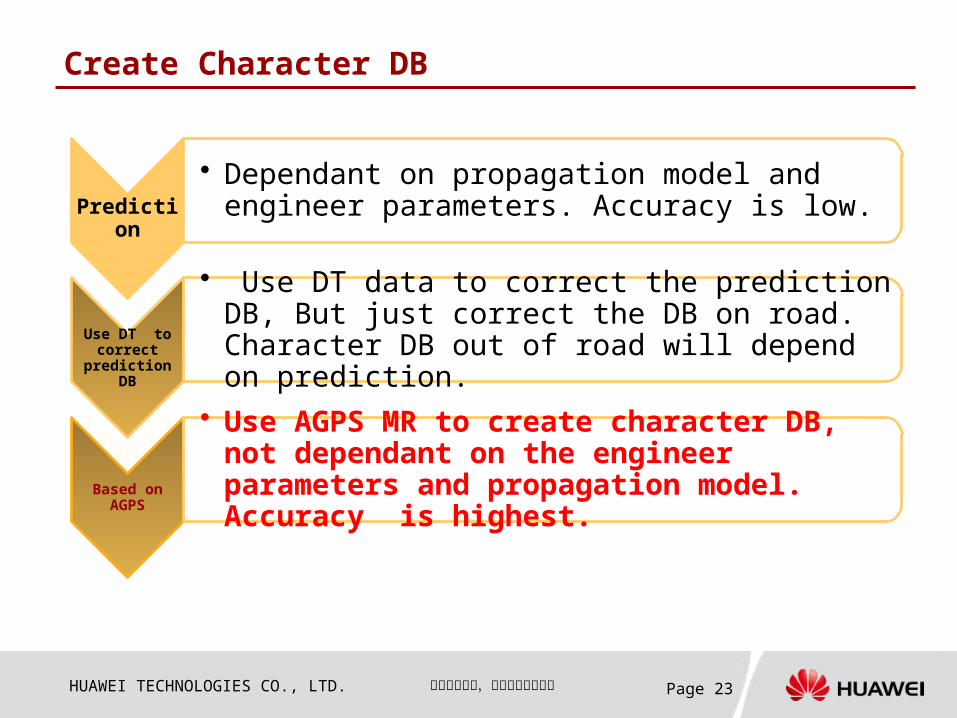
Create Character DB
Prediction
• Dependant on propagation model and engineer parameters. Accuracy is low.
Use DT to correct
prediction DB
• Use DT data to correct the prediction DB, But just correct the DB on road. Character DB out of road will depend on prediction.
Based on AGPS
• Use AGPS MR to create character DB, not dependant on the engineer parameters and propagation model. Accuracy is highest.
HUAWEI TECHNOLOGIES CO., LTD. Page 24华华华华华华 华华华华华华华华,
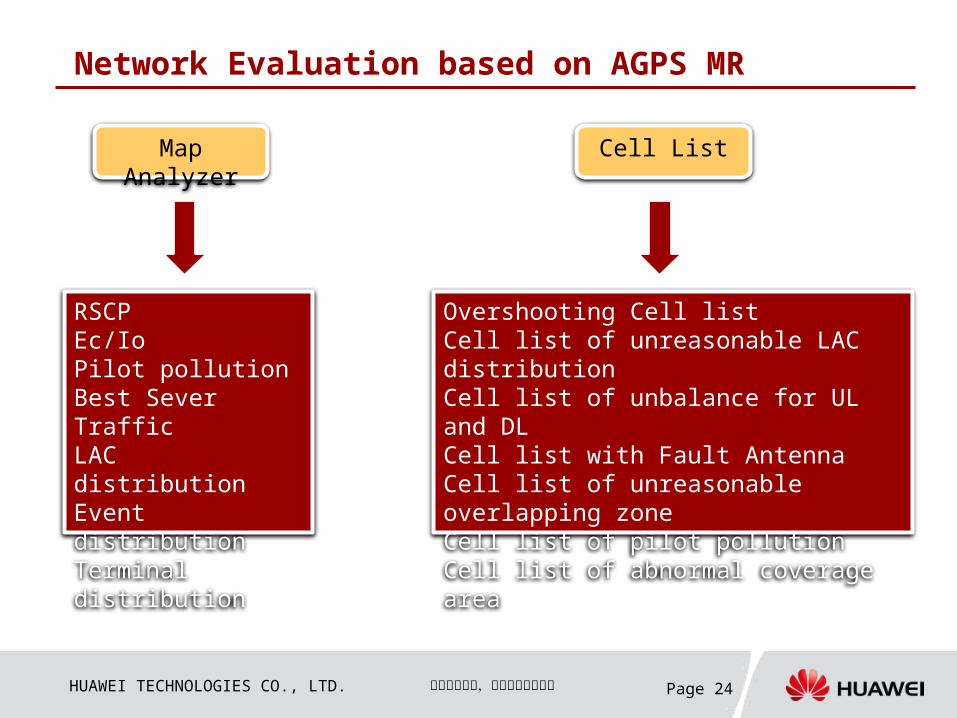
Network Evaluation based on AGPS MR
Cell List
RSCPEc/IoPilot pollutionBest SeverTrafficLAC distributionEvent distributionTerminal distribution
Map Analyzer
Overshooting Cell listCell list of unreasonable LAC distribution Cell list of unbalance for UL and DLCell list with Fault AntennaCell list of unreasonable overlapping zone Cell list of pilot pollution Cell list of abnormal coverage area
HUAWEI TECHNOLOGIES CO., LTD. Page 25华华华华华华 华华华华华华华华,
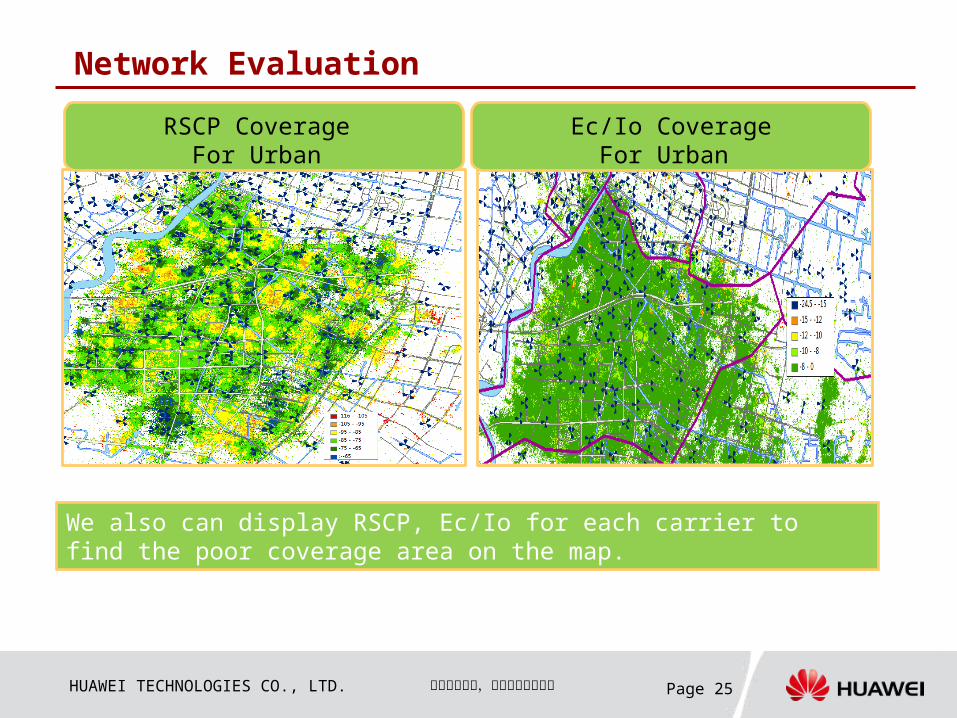
Network EvaluationRSCP Coverage
For Urban Ec/Io Coverage
For Urban
We also can display RSCP, Ec/Io for each carrier to find the poor coverage area on the map.
HUAWEI TECHNOLOGIES CO., LTD. Page 26华华华华华华 华华华华华华华华,
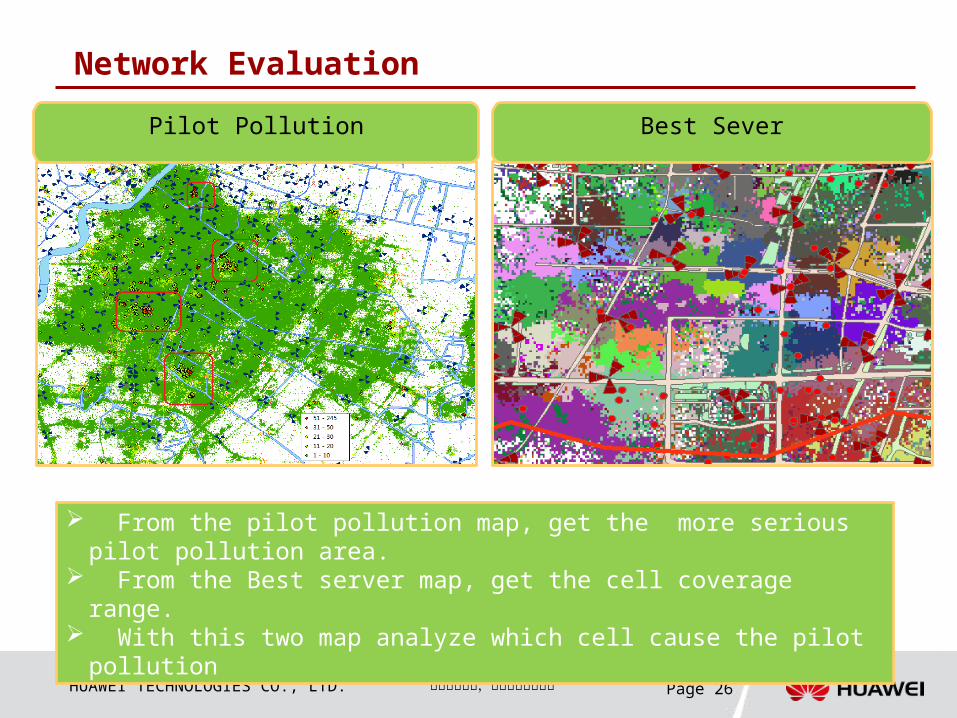
Network EvaluationPilot Pollution Best Sever
From the pilot pollution map, get the more serious pilot pollution area.
From the Best server map, get the cell coverage range.
With this two map analyze which cell cause the pilot pollution
HUAWEI TECHNOLOGIES CO., LTD. Page 27华华华华华华 华华华华华华华华,
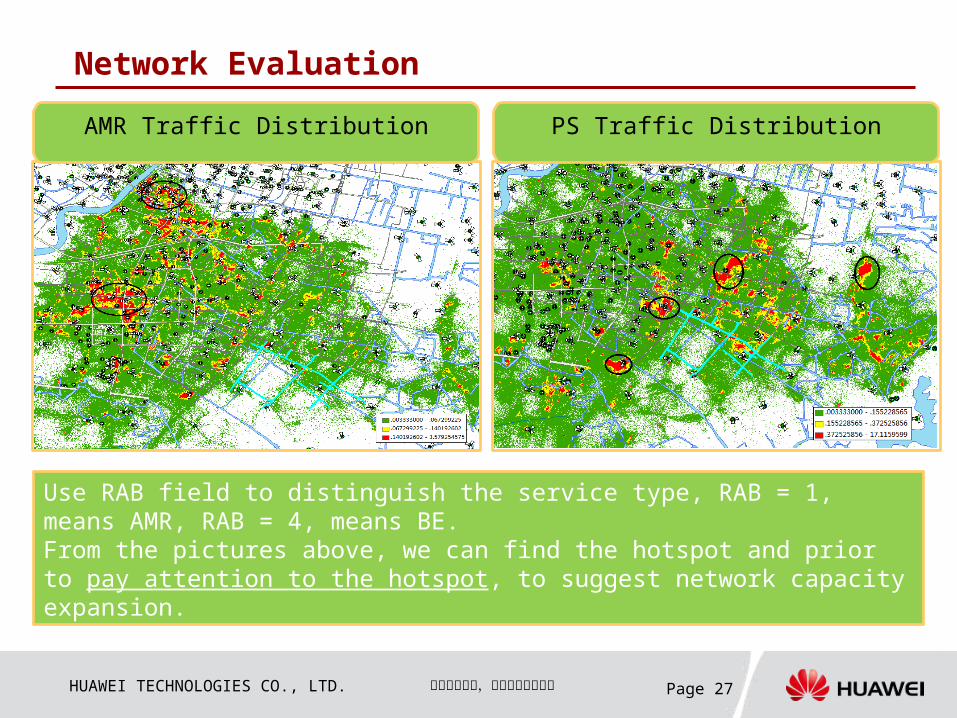
Network EvaluationAMR Traffic Distribution PS Traffic Distribution
Use RAB field to distinguish the service type, RAB = 1, means AMR, RAB = 4, means BE.From the pictures above, we can find the hotspot and prior to pay attention to the hotspot, to suggest network capacity expansion.
HUAWEI TECHNOLOGIES CO., LTD. Page 28华华华华华华 华华华华华华华华,
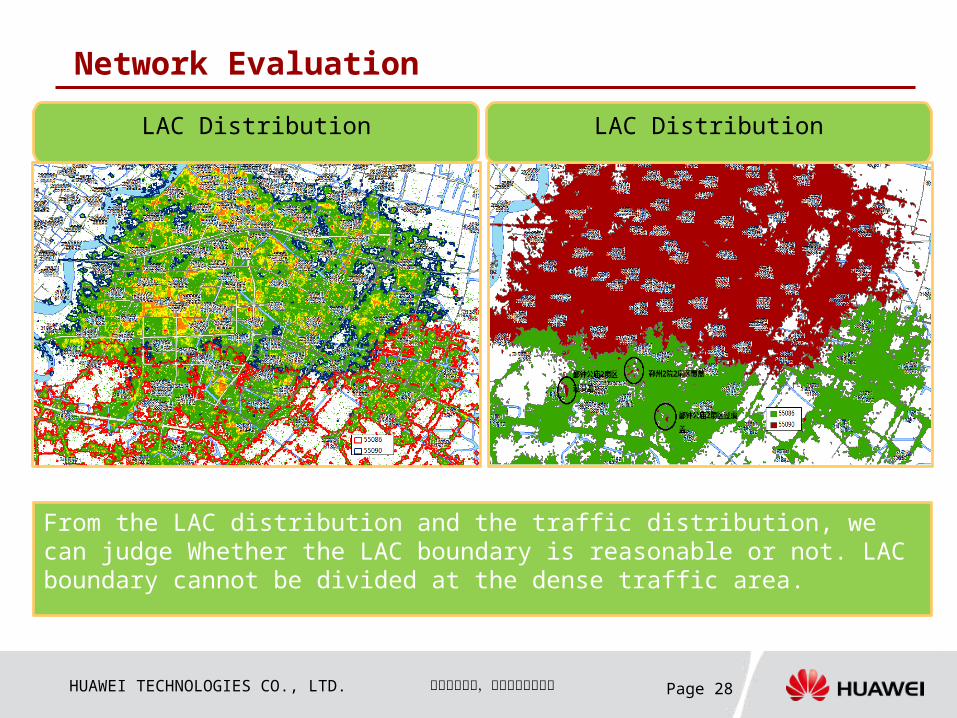
Network EvaluationLAC Distribution LAC Distribution
From the LAC distribution and the traffic distribution, we can judge Whether the LAC boundary is reasonable or not. LAC boundary cannot be divided at the dense traffic area.
HUAWEI TECHNOLOGIES CO., LTD. Page 29华华华华华华 华华华华华华华华,
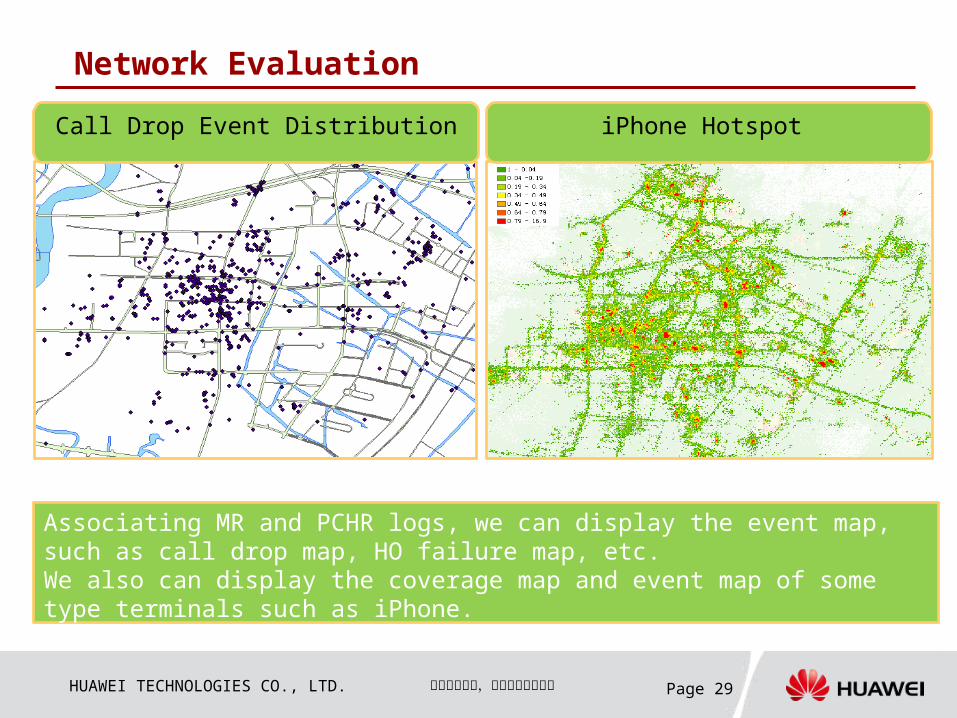
Network EvaluationCall Drop Event Distribution iPhone Hotspot
Associating MR and PCHR logs, we can display the event map, such as call drop map, HO failure map, etc.We also can display the coverage map and event map of some type terminals such as iPhone.
HUAWEI TECHNOLOGIES CO., LTD. Page 30华华华华华华 华华华华华华华华,
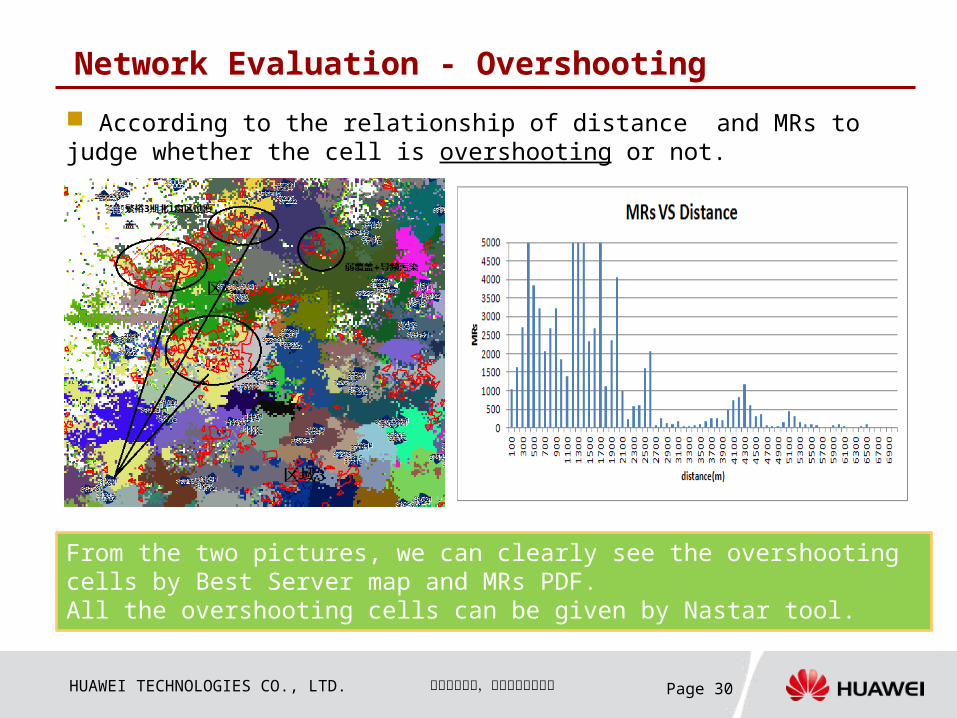
Network Evaluation - Overshooting According to the relationship of distance and MRs to judge whether the cell is overshooting or not.
From the two pictures, we can clearly see the overshooting cells by Best Server map and MRs PDF.All the overshooting cells can be given by Nastar tool.
HUAWEI TECHNOLOGIES CO., LTD. Page 31华华华华华华 华华华华华华华华,
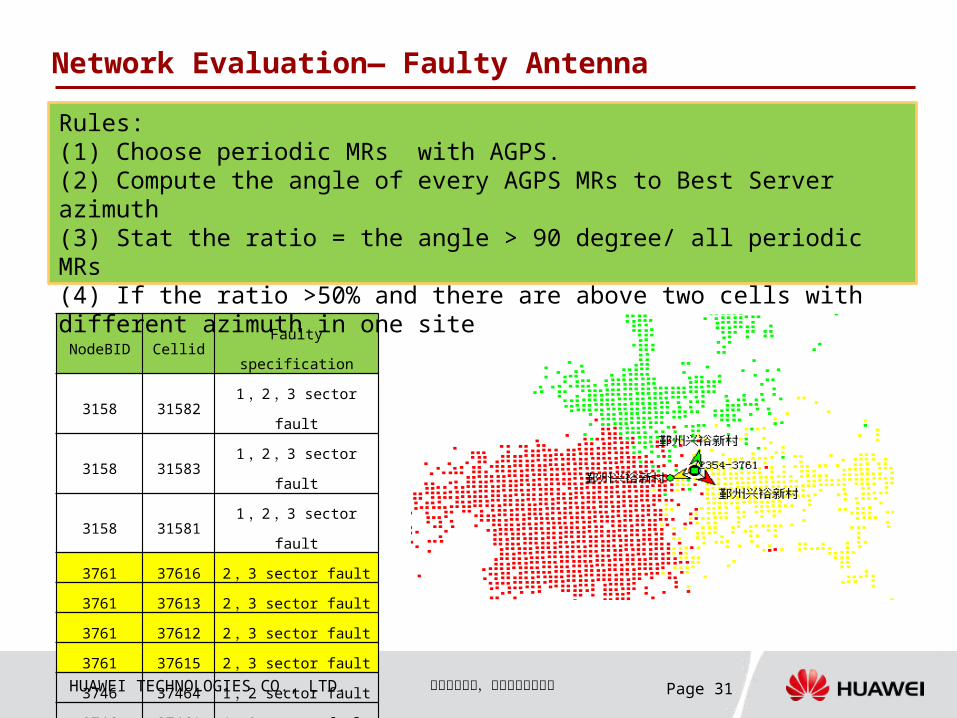
Network Evaluation— Faulty Antenna
NodeBID CellidFaulty
specification
3158 315821,2,3 sector
fault
3158 315831,2,3 sector
fault
3158 315811,2,3 sector
fault
3761 37616 2,3 sector fault
3761 37613 2,3 sector fault
3761 37612 2,3 sector fault
3761 37615 2,3 sector fault
3746 37464 1,2 sector fault
3746 37461 1,2 sector fault
3746 37462 1,2 sector fault
Rules:(1) Choose periodic MRs with AGPS.(2) Compute the angle of every AGPS MRs to Best Server azimuth(3) Stat the ratio = the angle > 90 degree/ all periodic MRs(4) If the ratio >50% and there are above two cells with different azimuth in one site
HUAWEI TECHNOLOGIES CO., LTD. Page 32华华华华华华 华华华华华华华华,
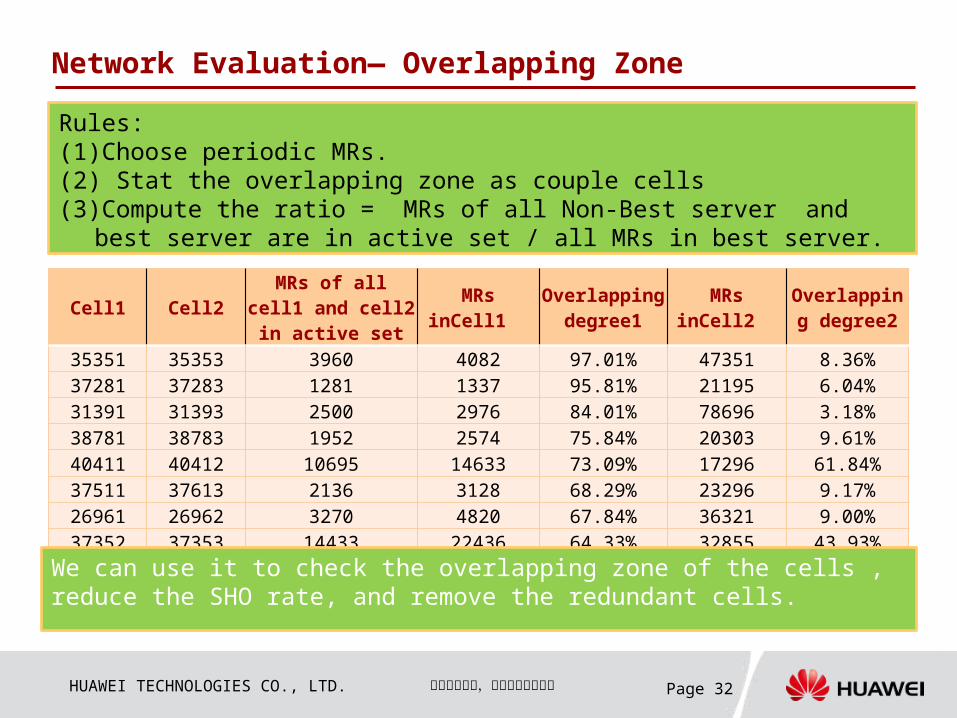
Network Evaluation— Overlapping Zone Rules:(1)Choose periodic MRs.(2) Stat the overlapping zone as couple cells(3)Compute the ratio = MRs of all Non-Best server and
best server are in active set / all MRs in best server.
Cell1 Cell2MRs of all
cell1 and cell2 in active set
MRs inCell1
Overlapping degree1
MRs inCell2
Overlapping degree2
35351 35353 3960 4082 97.01% 47351 8.36%37281 37283 1281 1337 95.81% 21195 6.04%31391 31393 2500 2976 84.01% 78696 3.18%38781 38783 1952 2574 75.84% 20303 9.61%40411 40412 10695 14633 73.09% 17296 61.84%37511 37613 2136 3128 68.29% 23296 9.17%26961 26962 3270 4820 67.84% 36321 9.00%37352 37353 14433 22436 64.33% 32855 43.93%
We can use it to check the overlapping zone of the cells , reduce the SHO rate, and remove the redundant cells.
HUAWEI TECHNOLOGIES CO., LTD. Page 33华华华华华华 华华华华华华华华,
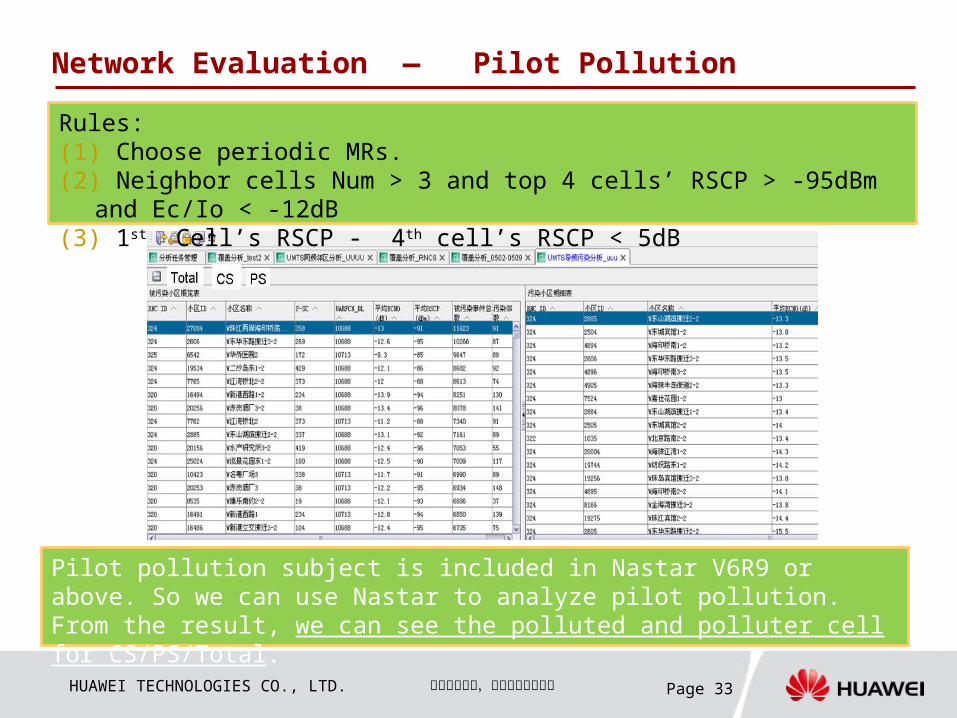
Network Evaluation — Pilot Pollution
Pilot pollution subject is included in Nastar V6R9 or above. So we can use Nastar to analyze pilot pollution. From the result, we can see the polluted and polluter cell for CS/PS/Total.
Rules:(1) Choose periodic MRs.(2) Neighbor cells Num > 3 and top 4 cells’ RSCP > -95dBm
and Ec/Io < -12dB(3) 1st Cell’s RSCP - 4th cell’s RSCP < 5dB
HUAWEI TECHNOLOGIES CO., LTD. Page 34华华华华华华 华华华华华华华华,
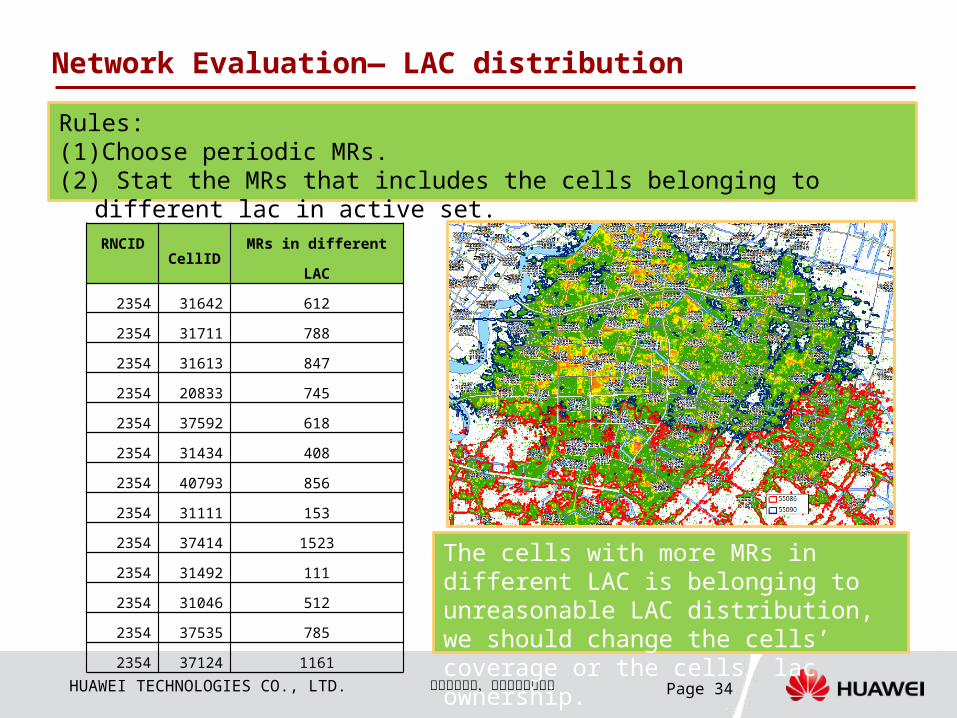
Network Evaluation— LAC distribution Rules:(1)Choose periodic MRs.(2) Stat the MRs that includes the cells belonging to
different lac in active set.RNCID
CellIDMRs in different
LAC
2354 31642 612
2354 31711 788
2354 31613 847
2354 20833 745
2354 37592 618
2354 31434 408
2354 40793 856
2354 31111 153
2354 37414 1523
2354 31492 111
2354 31046 512
2354 37535 785
2354 37124 1161
The cells with more MRs in different LAC is belonging to unreasonable LAC distribution, we should change the cells’ coverage or the cells’ lac ownership.
HUAWEI TECHNOLOGIES CO., LTD. Page 35华华华华华华 华华华华华华华华, Page 35
Contents
MR based Geolocation Principle Introduction MR Basic and Location principle Traffic map value
Coverage Evaluation Introduction AGPS MR Collection Coverage Evaluation based on AGPS MR
Case Introduction
HUAWEI TECHNOLOGIES CO., LTD. Page 36华华华华华华 华华华华华华华华,
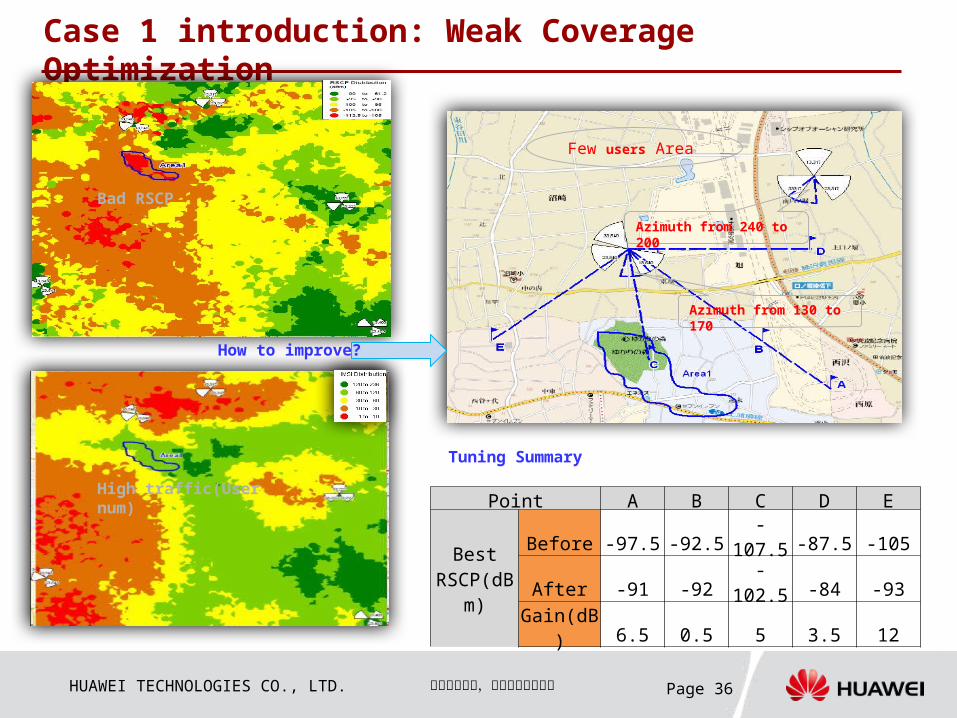
Case 1 introduction: Weak Coverage Optimization
High traffic(User num)
Few users Area
Azimuth from 130 to 170
Bad RSCP
How to improve?
Azimuth from 240 to 200
Point A B C D E
Best RSCP(dB
m)
Before -97.5 -92.5-
107.5 -87.5 -105
After -91 -92-
102.5 -84 -93Gain(dB
) 6.5 0.5 5 3.5 12
Tuning Summary
HUAWEI TECHNOLOGIES CO., LTD. Page 37华华华华华华 华华华华华华华华,
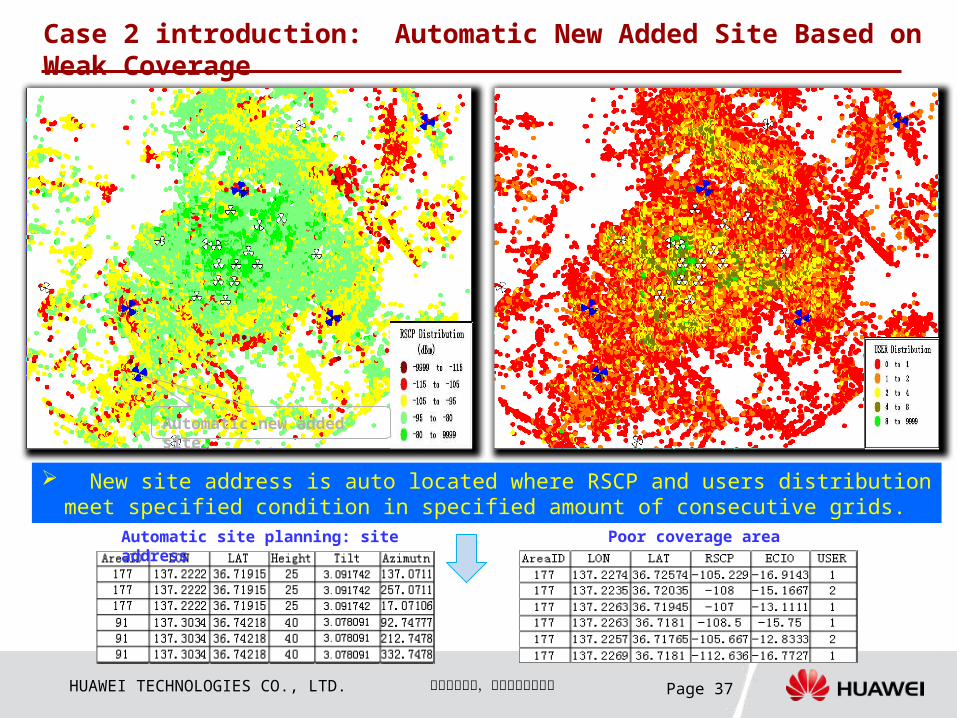
Case 2 introduction: Automatic New Added Site Based on Weak Coverage
New site address is auto located where RSCP and users distribution meet specified condition in specified amount of consecutive grids.
Automatic new added site
Automatic site planning: site address
Poor coverage area
HUAWEI TECHNOLOGIES CO., LTD. Page 38华华华华华华 华华华华华华华华,
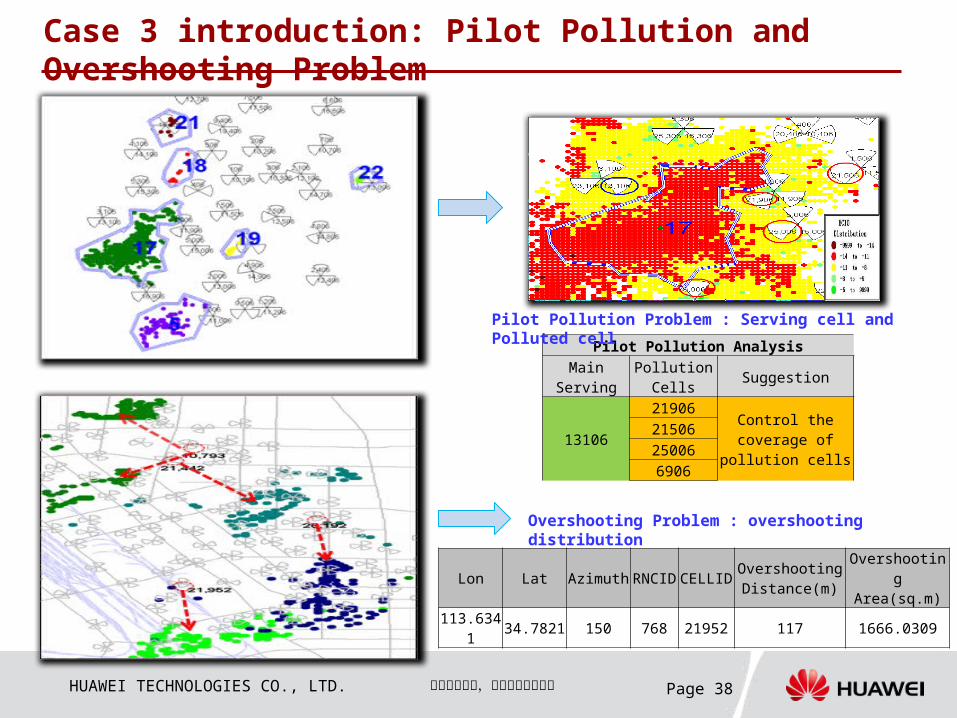
Case 3 introduction: Pilot Pollution and Overshooting Problem
Pilot Pollution AnalysisMain
ServingPollution
Cells Suggestion
13106
21906 Control the coverage of
pollution cells
21506250066906
Lon Lat Azimuth RNCID CELLID Overshooting Distance(m)
Overshooting
Area(sq.m)113.634
1 34.7821 150 768 21952 117 1666.0309
Pilot Pollution Problem : Serving cell and Polluted cell
Overshooting Problem : overshooting distribution
HUAWEI TECHNOLOGIES CO., LTD. Page 39华华华华华华 华华华华华华华华,
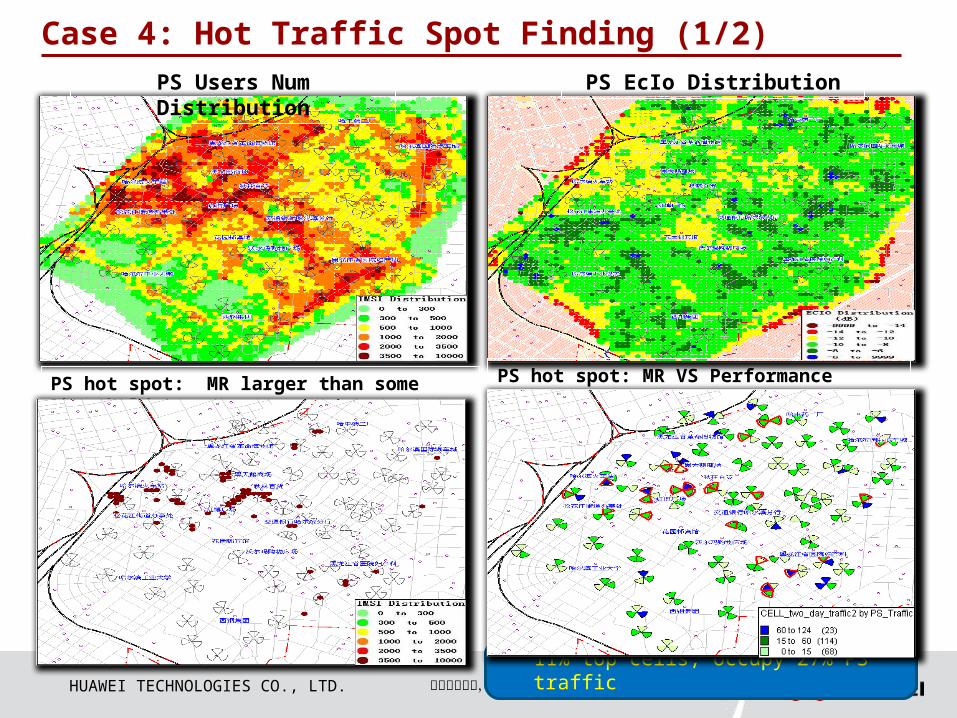
Case 4: Hot Traffic Spot Finding (1/2) PS Users Num Distribution
PS EcIo Distribution
PS hot spot: MR larger than some threshold
PS hot spot: MR VS Performance
11% top cells, occupy 27% PS traffic
HUAWEI TECHNOLOGIES CO., LTD. Page 40华华华华华华 华华华华华华华华, Page 40
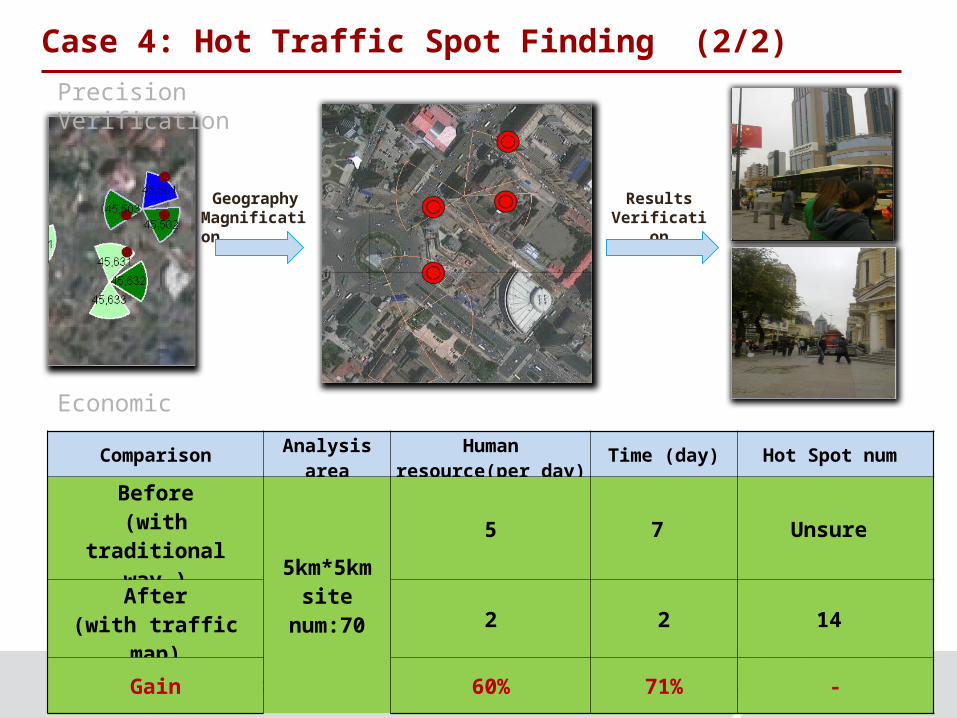
Case 4: Hot Traffic Spot Finding (2/2)
ResultsVerificati
on
GeographyMagnification
Comparison Analysis area
Human resource(per day)
Time (day) Hot Spot num
Before(with
traditional way ) 5km*5km
site num:70
5 7 Unsure
After(with traffic
map)2 2 14
Gain 60% 71% -
Economic
Precision Verification
HUAWEI TECHNOLOGIES CO., LTD. Page 41华华华华华华 华华华华华华华华, Page 41
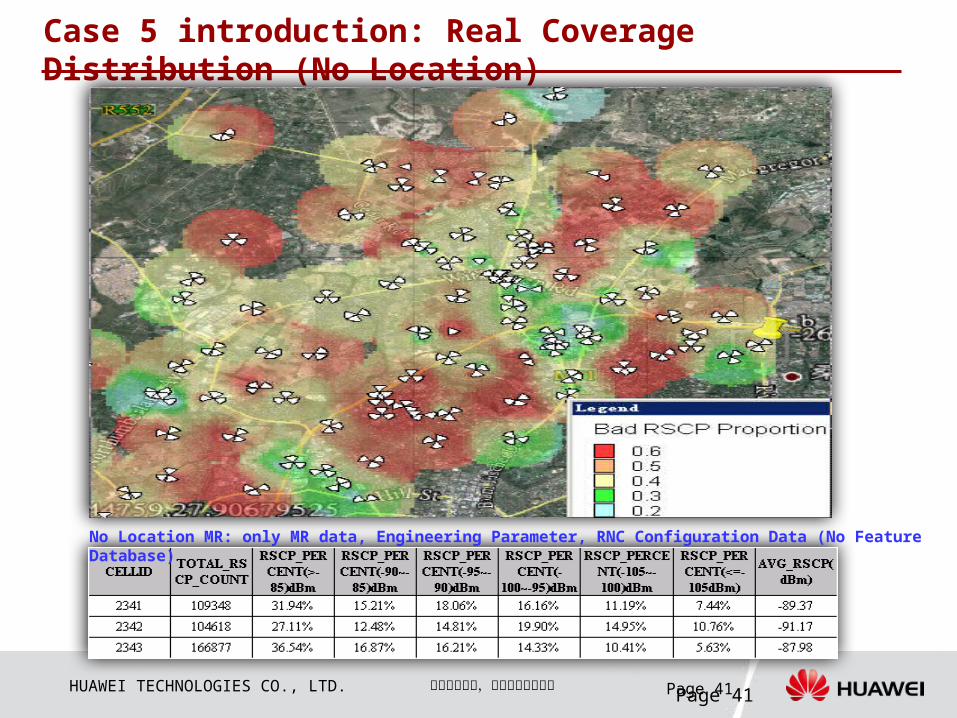
Case 5 introduction: Real Coverage Distribution (No Location)
No Location MR: only MR data, Engineering Parameter, RNC Configuration Data (No Feature Database)
Thank youwww.huawei.com
Copyright©2011 Huawei Technologies Co., Ltd. All Rights Reserved.The information in this document may contain predictive statements including, without limitation, statements regarding the future financial and operating results, future product portfolio, new technology, etc. There are a number of factors that could cause actual results and developments to differ materially from those expressed or implied in the predictive statements. Therefore, such information is provided for reference purpose only and constitutes neither an offer nor an acceptance. Huawei may change the information at any time without notice.
HUAWEI TECHNOLOGIES CO., LTD. Page 43华华华华华华 华华华华华华华华,
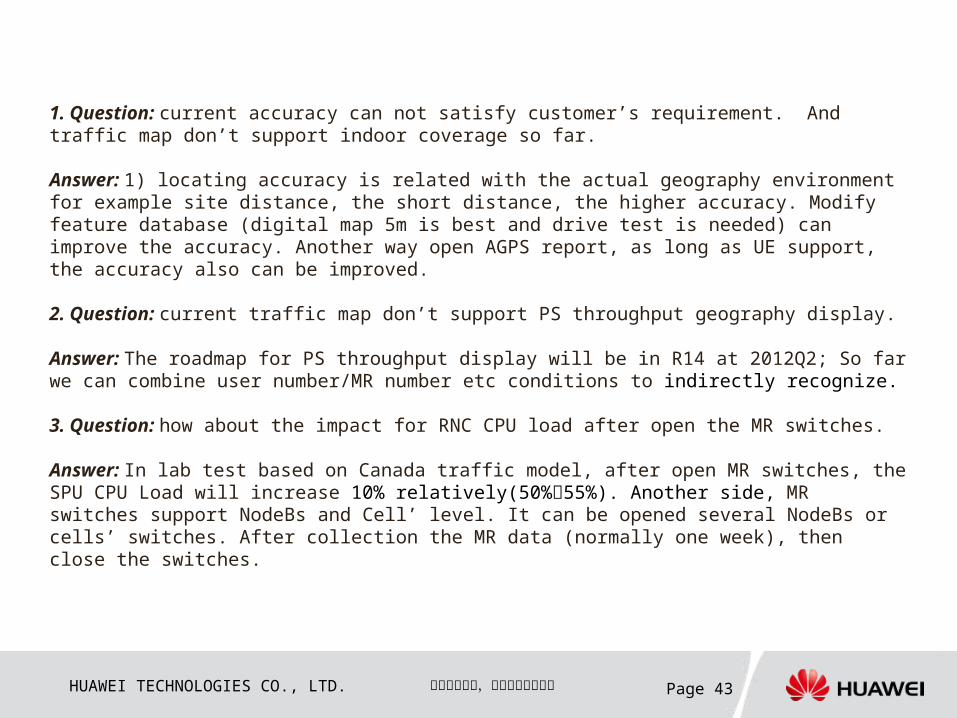
1. Question: current accuracy can not satisfy customer’s requirement. And traffic map don’t support indoor coverage so far.
Answer: 1) locating accuracy is related with the actual geography environment for example site distance, the short distance, the higher accuracy. Modify feature database (digital map 5m is best and drive test is needed) can improve the accuracy. Another way open AGPS report, as long as UE support, the accuracy also can be improved.
2. Question: current traffic map don’t support PS throughput geography display.
Answer: The roadmap for PS throughput display will be in R14 at 2012Q2; So far we can combine user number/MR number etc conditions to indirectly recognize.
3. Question: how about the impact for RNC CPU load after open the MR switches.
Answer: In lab test based on Canada traffic model, after open MR switches, the SPU CPU Load will increase 10% relatively(50%华55%). Another side, MR switches support NodeBs and Cell’ level. It can be opened several NodeBs or cells’ switches. After collection the MR data (normally one week), then close the switches.
Related Documents


