NETWORK AND TOPICAL ANALYSIS FOR THE HUMANITIES USING NWB AND SCI2 Scott Weingart Cyberinfrastructure for Network Science Center Information Visualization Laboratory Indiana Philosophy Ontology Project School of Library and Information Science Department of History and Philosophy of Science Indiana University, Bloomington, IN http://www.scottbot.net With special thanks to Katy Börner, Kevin W. Boyack, Micah Linnemeier, Russell J. Duhon, Patrick Phillips, Joseph Biberstine, Chintan Tank Nianli Ma, Hanning Guo, Mark A. Price, Angela M. Zoss, and Sean Lind Digital Humanities 2011 Meyer Library 2080E (Language Lab) Stanford University, Stanford, CA 13:00-16:30 on June 19, 2011

NETWORK AND TOPICAL ANALYSIS FOR THE HUMANITIES USING NWB AND SCI2 Scott Weingart
Dec 31, 2015
NETWORK AND TOPICAL ANALYSIS FOR THE HUMANITIES USING NWB AND SCI2 Scott Weingart Cyberinfrastructure for Network Science Center Information Visualization Laboratory Indiana Philosophy Ontology Project School of Library and Information Science Department of History and Philosophy of Science - PowerPoint PPT Presentation
Welcome message from author
This document is posted to help you gain knowledge. Please leave a comment to let me know what you think about it! Share it to your friends and learn new things together.
Transcript
NETWORK AND TOPICAL ANALYSIS FORTHE HUMANITIES USING NWB AND SCI2
Scott WeingartCyberinfrastructure for Network Science CenterInformation Visualization LaboratoryIndiana Philosophy Ontology Project
School of Library and Information ScienceDepartment of History and Philosophy of Science
Indiana University, Bloomington, INhttp://www.scottbot.net
With special thanks to Katy Börner, Kevin W. Boyack, Micah Linnemeier, Russell J. Duhon, Patrick Phillips, Joseph Biberstine, Chintan TankNianli Ma, Hanning Guo, Mark A. Price, Angela M. Zoss, and Sean Lind
Digital Humanities 2011Meyer Library 2080E (Language Lab)Stanford University, Stanford, CA13:00-16:30 on June 19, 2011
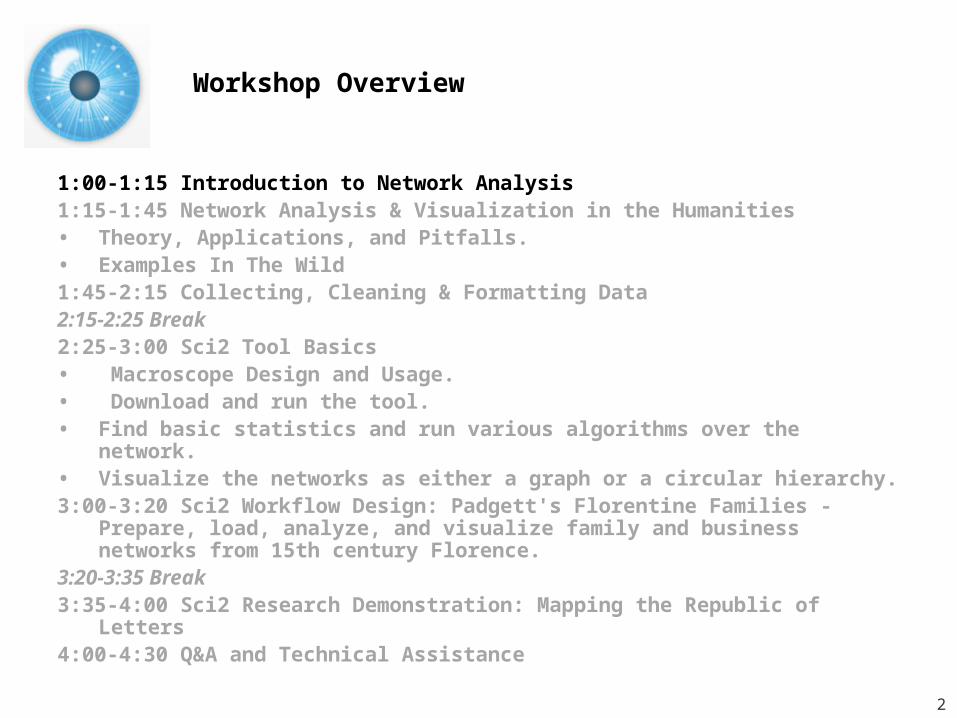
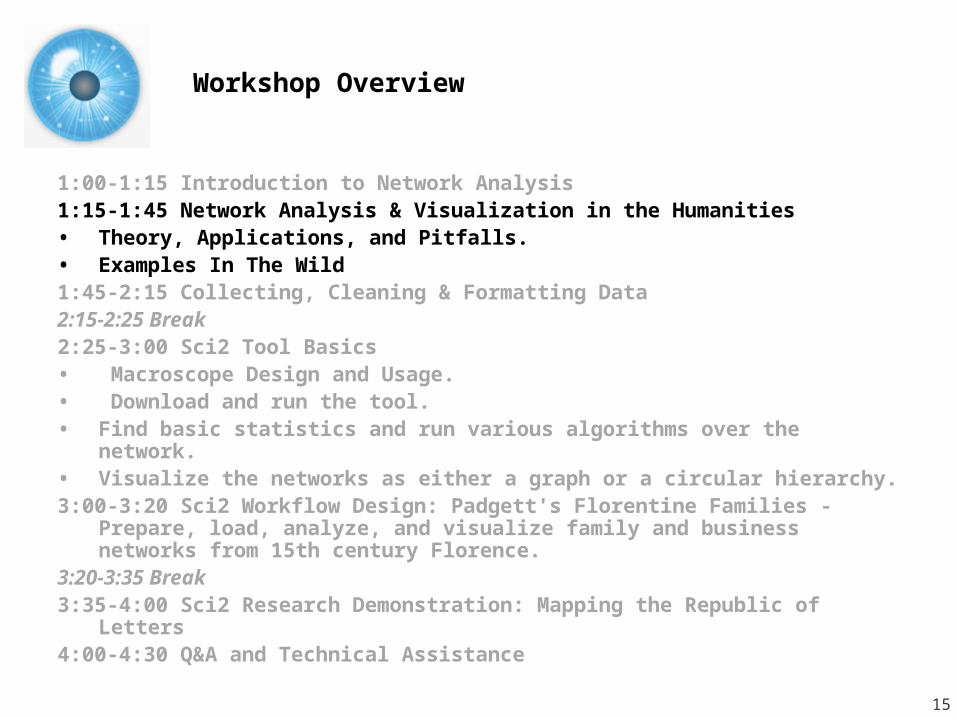
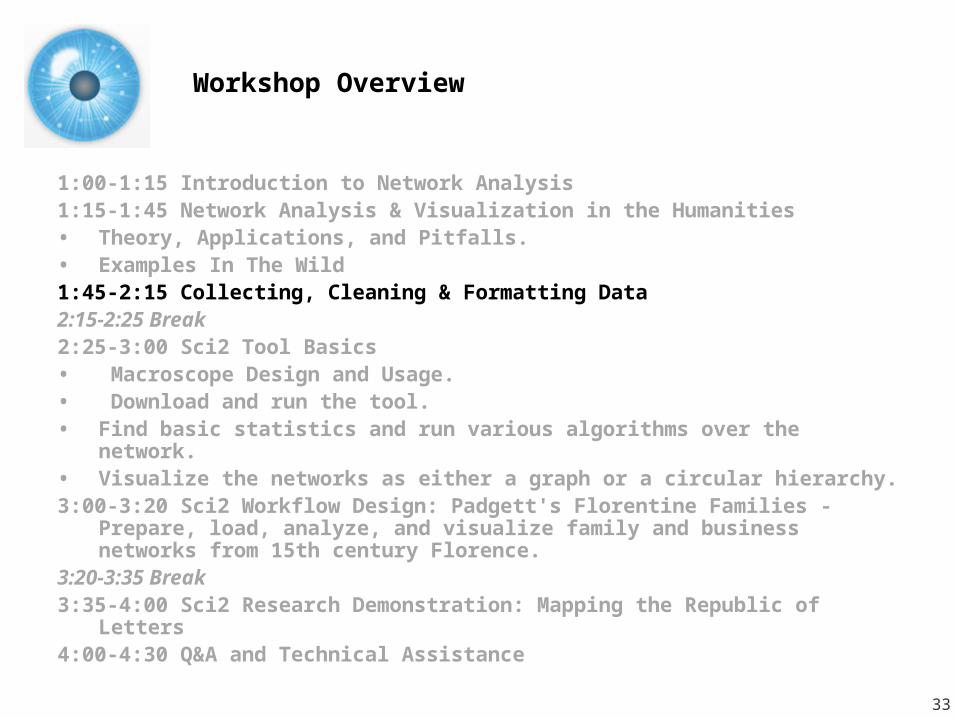
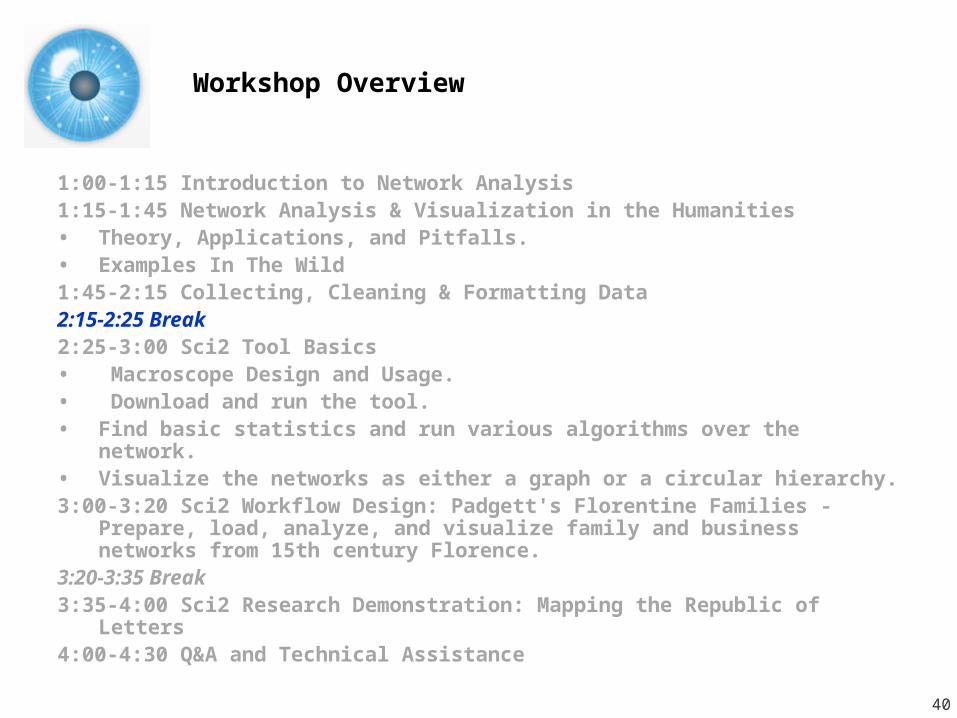
1:00-1:15 Introduction to Network Analysis 1:15-1:45 Network Analysis & Visualization in the Humanities• Theory, Applications, and Pitfalls.• Examples In The Wild1:45-2:15 Collecting, Cleaning & Formatting Data2:15-2:25 Break2:25-3:00 Sci2 Tool Basics • Macroscope Design and Usage.• Download and run the tool.• Find basic statistics and run various algorithms over the
network.• Visualize the networks as either a graph or a circular hierarchy.3:00-3:20 Sci2 Workflow Design: Padgett's Florentine Families -
Prepare, load, analyze, and visualize family and business networks from 15th century Florence.
3:20-3:35 Break3:35-4:00 Sci2 Research Demonstration: Mapping the Republic of
Letters4:00-4:30 Q&A and Technical Assistance
Workshop Overview
2
Network Analysis & Visualization
3
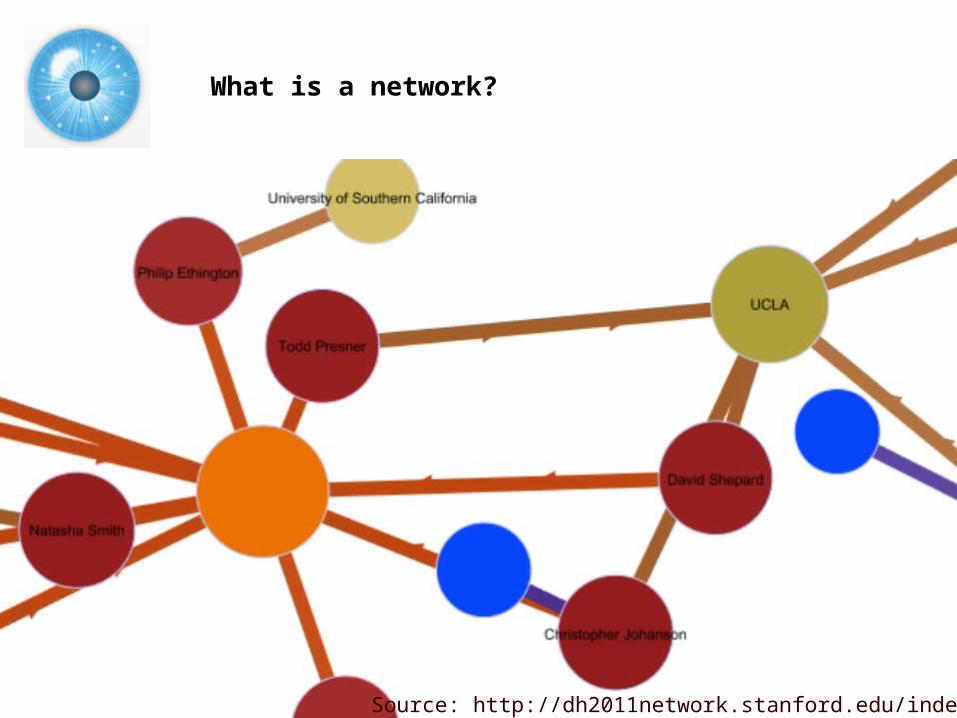
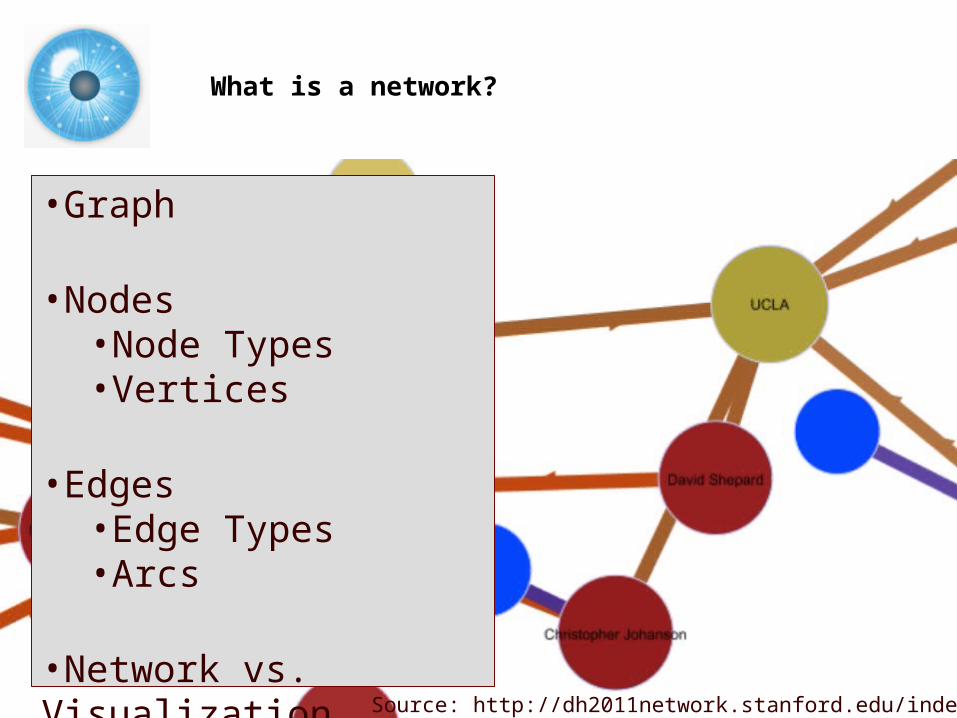
What is a network?
Source: http://dh2011network.stanford.edu/index.html
What is a network?
Source: http://dh2011network.stanford.edu/index.html
•Graph
•Nodes•Node Types•Vertices
•Edges•Edge Types•Arcs
•Network vs. Visualization
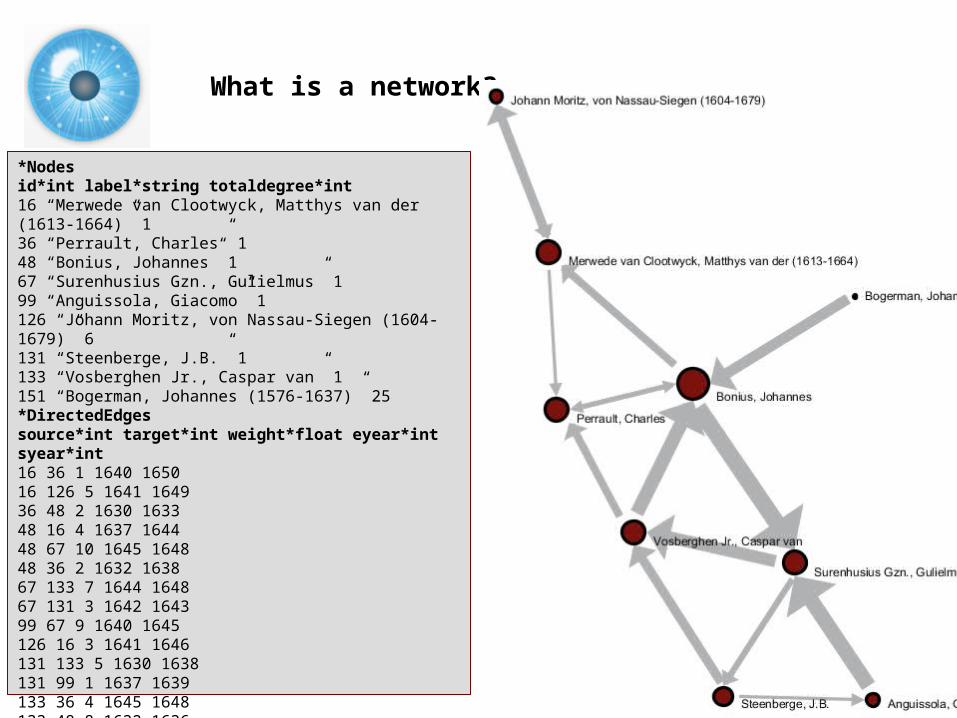
What is a network?
*Nodesid*int label*string totaldegree*int 16 “Merwede van Clootwyck, Matthys van der (1613-1664)” 1 36 “Perrault, Charles” 1 48 “Bonius, Johannes” 1 67 “Surenhusius Gzn., Gulielmus” 1 99 “Anguissola, Giacomo” 1 126 “Johann Moritz, von Nassau-Siegen (1604-1679)” 6 131 “Steenberge, J.B.” 1 133 “Vosberghen Jr., Caspar van” 1 151 “Bogerman, Johannes (1576-1637)” 25 *DirectedEdges source*int target*int weight*float eyear*int syear*int 16 36 1 1640 1650 16 126 5 1641 1649 36 48 2 1630 1633 48 16 4 1637 1644 48 67 10 1645 1648 48 36 2 1632 1638 67 133 7 1644 1648 67 131 3 1642 1643 99 67 9 1640 1645 126 16 3 1641 1646 131 133 5 1630 1638 131 99 1 1637 1639 133 36 4 1645 1648 133 48 8 1632 1636 151 48 6 1644 1647
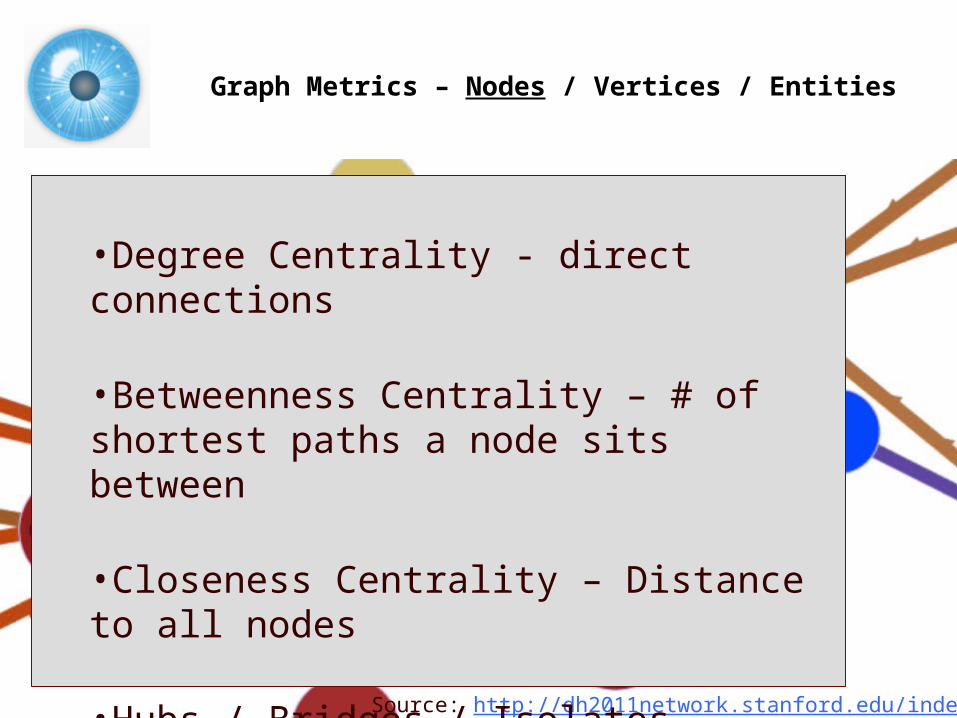
Graph Metrics – Nodes / Vertices / Entities
Source: http://dh2011network.stanford.edu/index.html
•Degree Centrality - direct connections
•Betweenness Centrality – # of shortest paths a node sits between
•Closeness Centrality – Distance to all nodes
•Hubs / Bridges / Isolates
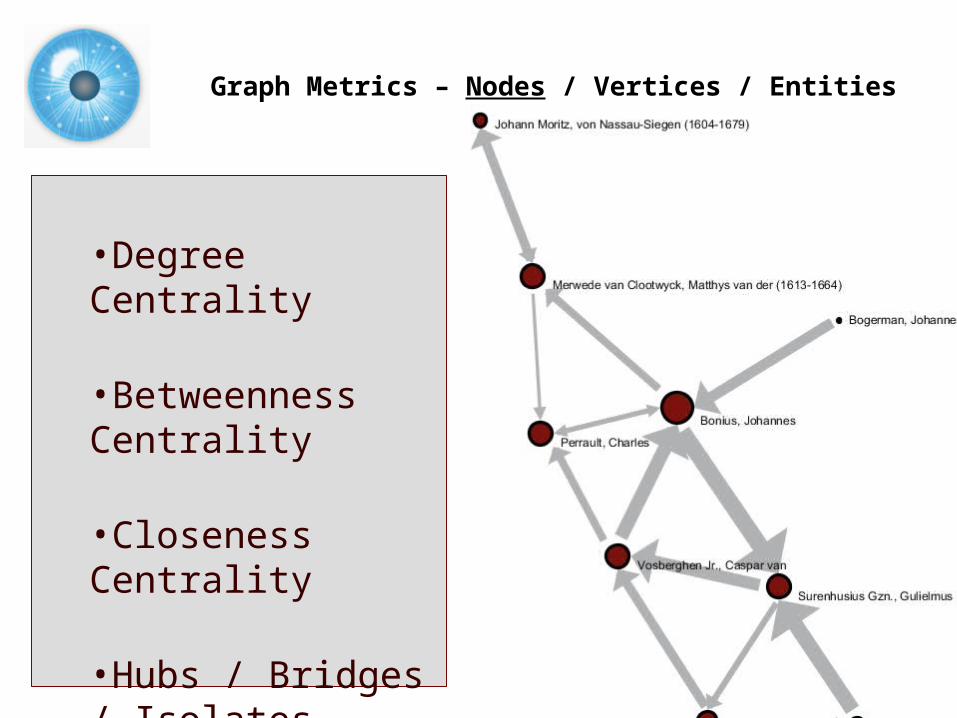
Graph Metrics – Nodes / Vertices / Entities
•Degree Centrality
•Betweenness Centrality
•Closeness Centrality
•Hubs / Bridges / Isolates
Graph Metrics – Edges / Links / Arcs / Connections / Ties
Source: http://dh2011network.stanford.edu/index.html
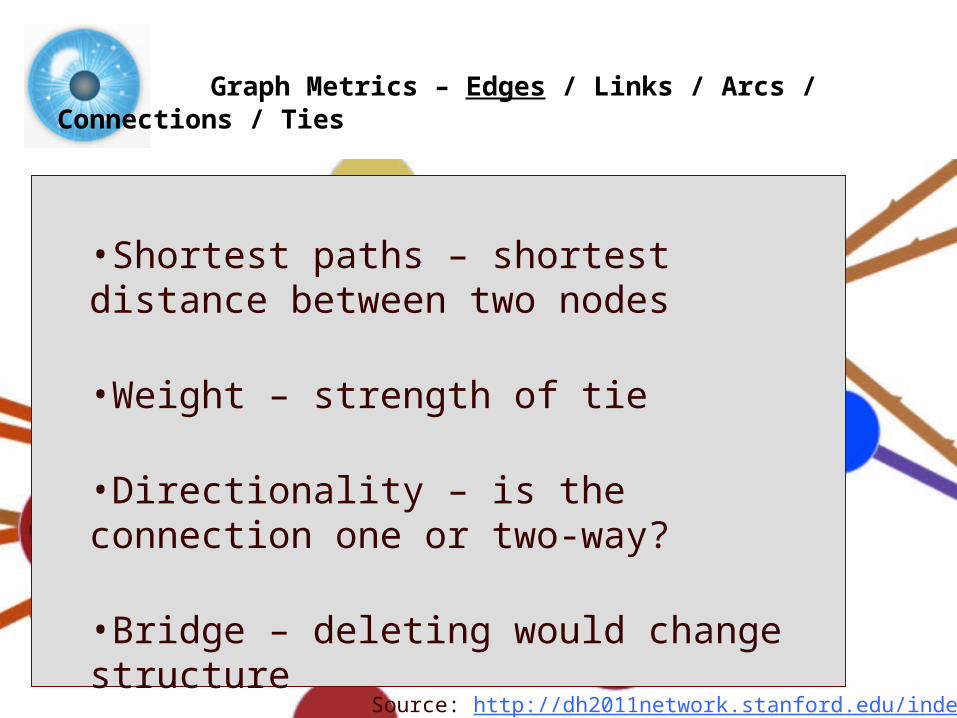
•Shortest paths – shortest distance between two nodes
•Weight – strength of tie
•Directionality – is the connection one or two-way?
•Bridge – deleting would change structure
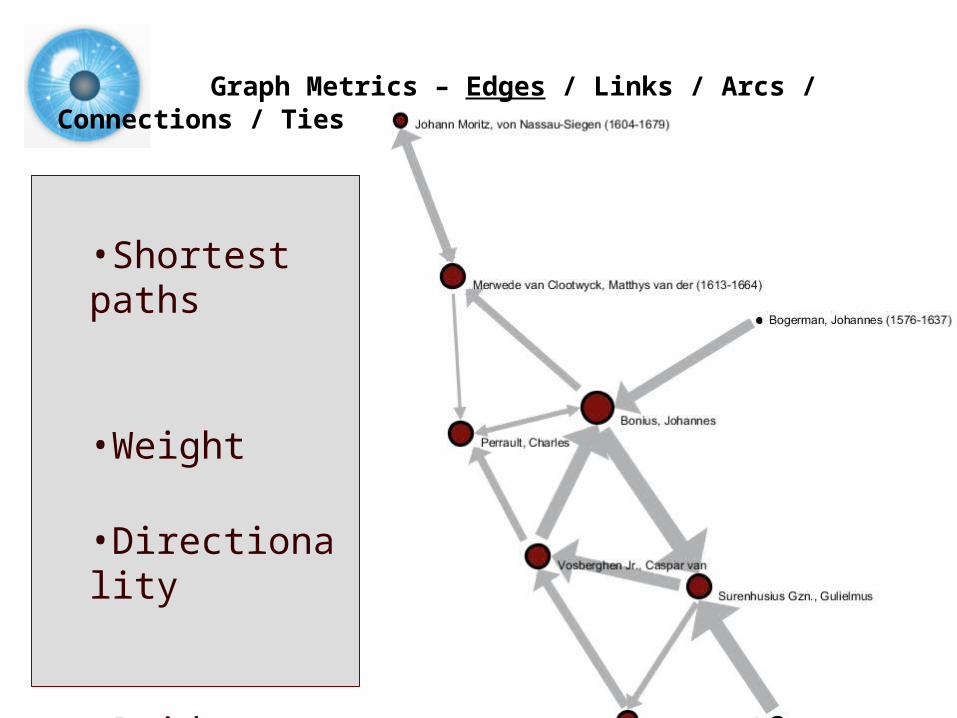
•Shortest paths
•Weight
•Directionality
•Bridge
Graph Metrics – Edges / Links / Arcs / Connections / Ties
Graph Metrics – Structural
Source: http://dh2011network.stanford.edu/index.html
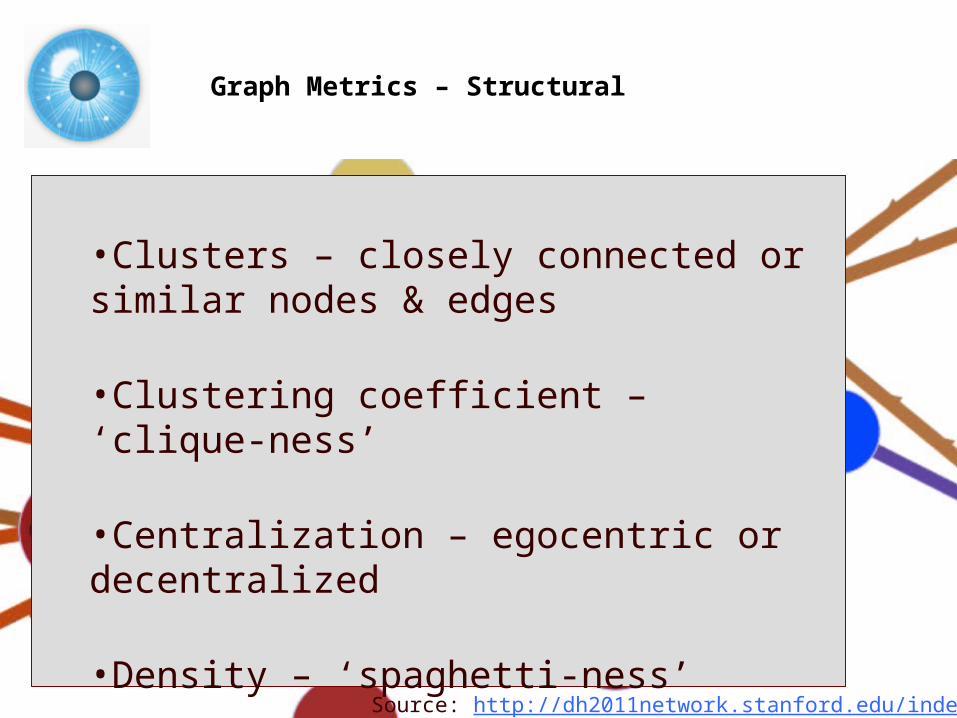
•Clusters – closely connected or similar nodes & edges
•Clustering coefficient – ‘clique-ness’
•Centralization – egocentric or decentralized
•Density – ‘spaghetti-ness’
•Average Path Length – wide or narrow
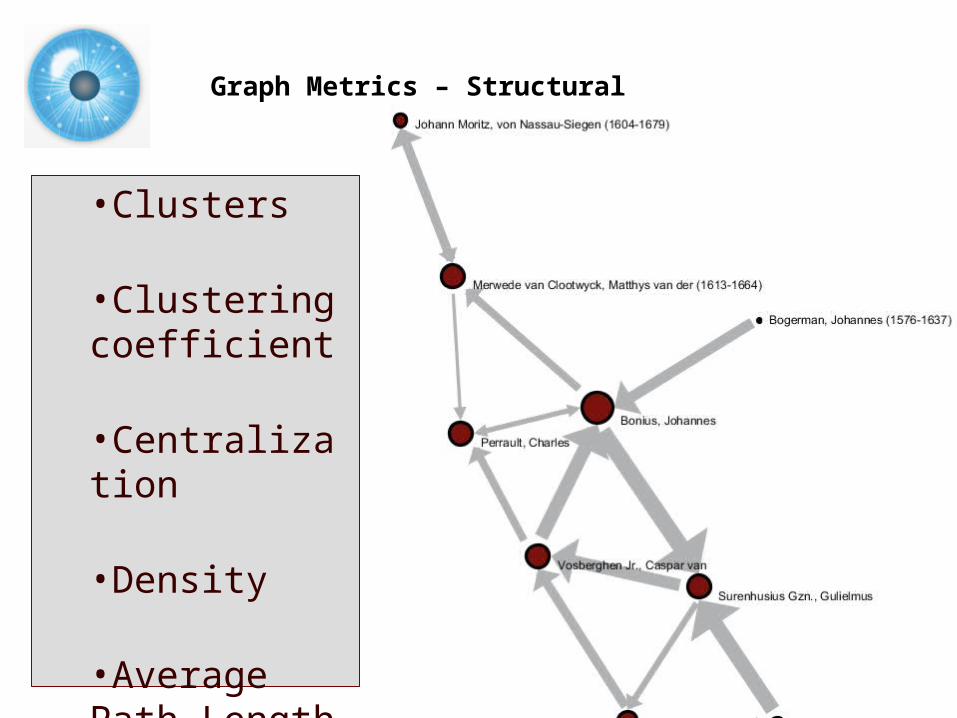
•Clusters
•Clustering coefficient
•Centralization
•Density
•Average Path Length
Graph Metrics – Structural
Graph Metrics – Types Of Networks
Source: http://dh2011network.stanford.edu/index.html
•Bi-Modal or Multi-Nodal
•Egocentric
•Dense/Sparse
Networks – Visualization
Source: http://dh2011network.stanford.edu/index.html
•Networks visualized as graphs
•Layouts•Force-based / Spring / GEM•Tree•Circular
•Distance Re-training
1:00-1:15 Introduction to Network Analysis 1:15-1:45 Network Analysis & Visualization in the Humanities• Theory, Applications, and Pitfalls.• Examples In The Wild1:45-2:15 Collecting, Cleaning & Formatting Data2:15-2:25 Break2:25-3:00 Sci2 Tool Basics • Macroscope Design and Usage.• Download and run the tool.• Find basic statistics and run various algorithms over the
network.• Visualize the networks as either a graph or a circular hierarchy.3:00-3:20 Sci2 Workflow Design: Padgett's Florentine Families -
Prepare, load, analyze, and visualize family and business networks from 15th century Florence.
3:20-3:35 Break3:35-4:00 Sci2 Research Demonstration: Mapping the Republic of
Letters4:00-4:30 Q&A and Technical Assistance
Workshop Overview
15

Network Analysis & Visualization in the Humanities:Theory, Applications, and Pitfalls
16
Uses of Visualization
Solidifies objects of inquiry
Exploration
Discovery
Trend-spotting
Evidence
Audience Engagement
Engaging public / funding agencies
The Importance of Visualization
[Visualization] aim at more than making the invisible visible. [It
aspires] to all-at-once-ness, the condensation of laborious, step-by-
step procedures in to an immediate coup d’oeil… What was a
painstaking process of calculation and correlation—for example, in
the construction of a table of variables—becomes a flash of
intuition. And all-at-once intuition is traditionally the way that
angels know, in contrast to the plodding demonstrations of humans.
Descartes’s craving for angelic all-at-once-ness emerged forcefully in
his mathematics…, compressing the steps of mathematical proof
into a single bright flare of insight: “I see the whole thing at once,
by intuition.”
Lorraine Daston – On Scientific Observation
Warnings
[H]umanists have adopted many applications such as GIS mapping,
graphs, and charts for statistical display that were developed in other
disciplines… such graphical tools are a kind of intellectual Trojan
horse…
Data pass themselves off as mere descriptions of a priori conditions.
Rendering observation (the act of creating a statistical, empirical, or
subjective account or image) as if it were the same as the phenomena
observed collapses the critical distance between the phenomenal
world and its interpretation, undoing the basis of interpretation on
which humanistic knowledge production is based... we seem ready and
eager to suspend critical judgment in a rush to visualization.
Johanna Drucker – Humanities Approaches to Graphical Display
Warnings
Data format limits use, already an act of
interpretation.
Statistics is often misused (wield it very
carefully).
Interpreting spatial distance as meaningful.
Always include a legend (this presentation
breaks that rule).
Accidental legitimization in eyes of public.
Network Analysis & Visualization in the Humanities:Examples In The Wild
21
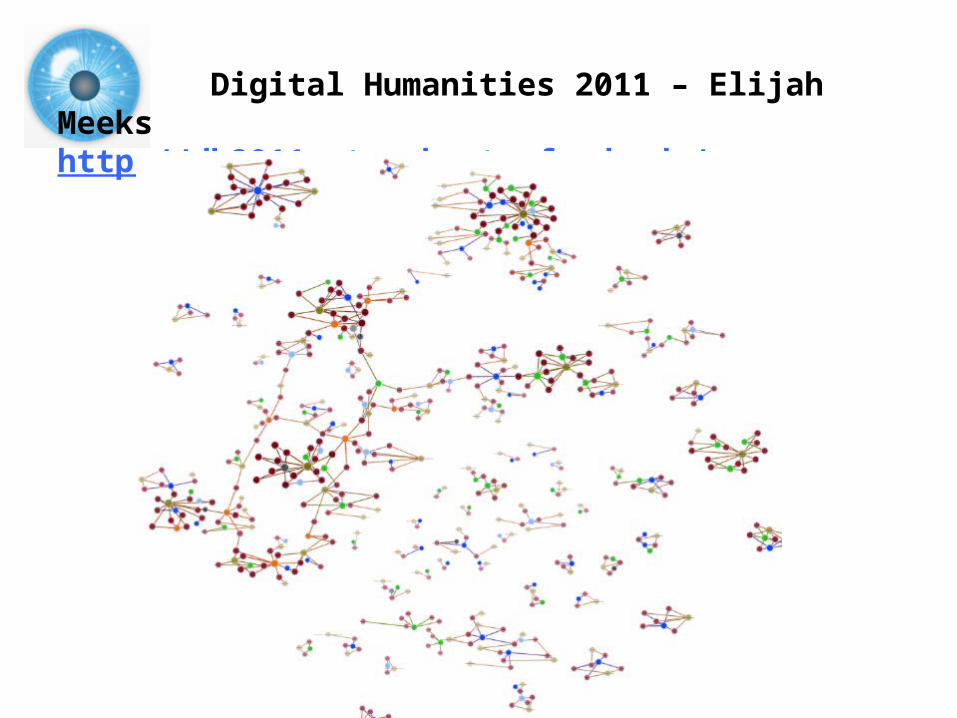
Digital Humanities 2011 – Elijah Meeks http://dh2011network.stanford.edu/
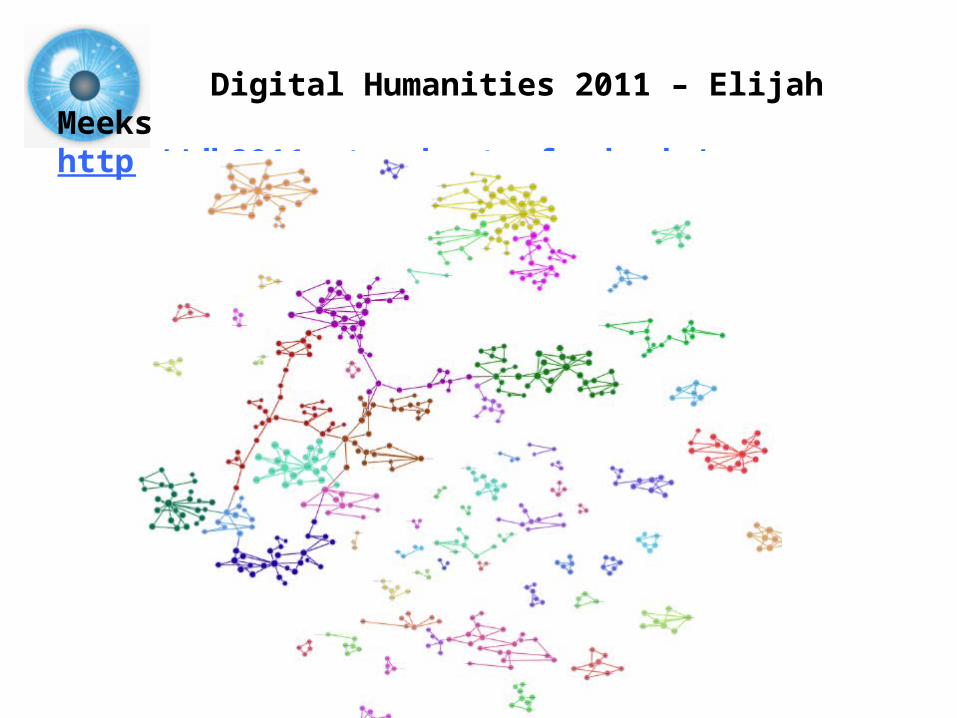
Digital Humanities 2011 – Elijah Meeks http://dh2011network.stanford.edu/
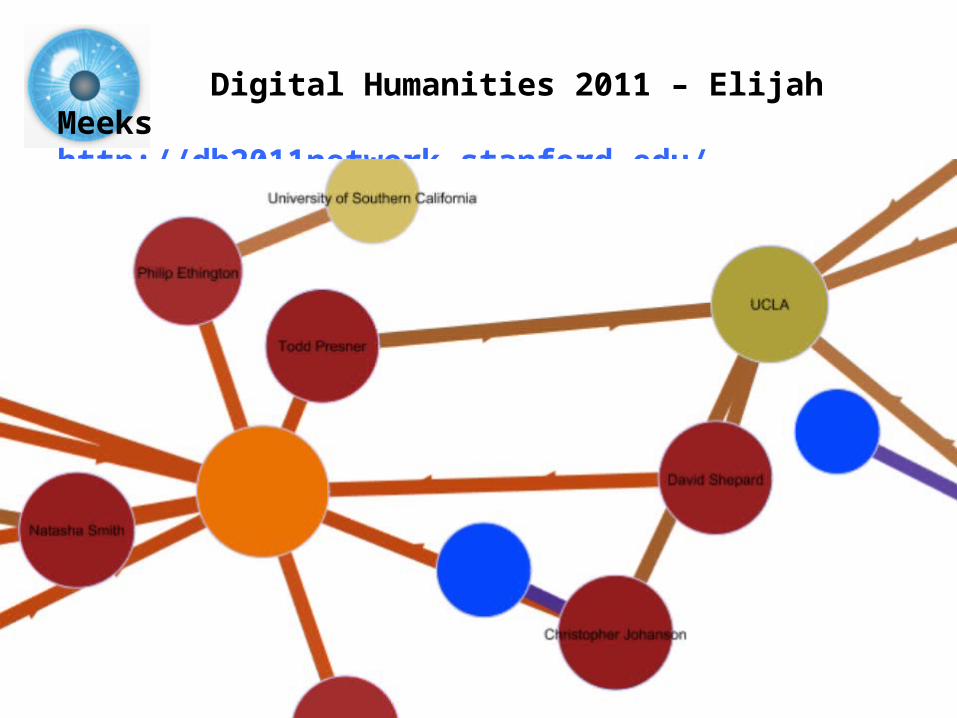
Digital Humanities 2011 – Elijah Meeks http://dh2011network.stanford.edu/
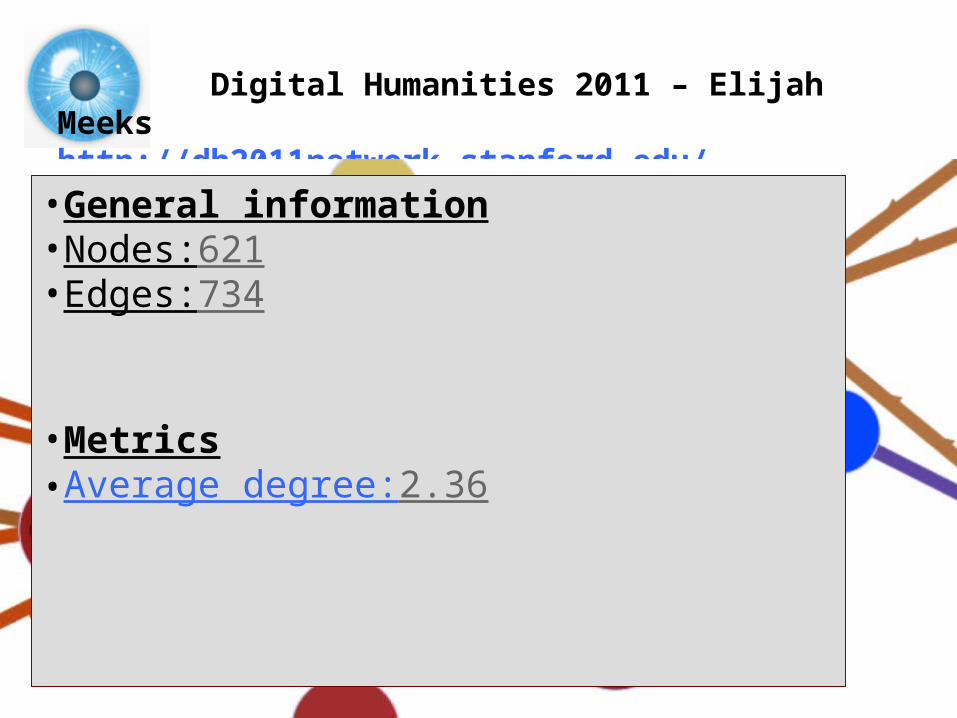
Digital Humanities 2011 – Elijah Meeks http://dh2011network.stanford.edu/•General information•Nodes:621•Edges:734
•Metrics•Average degree:2.36
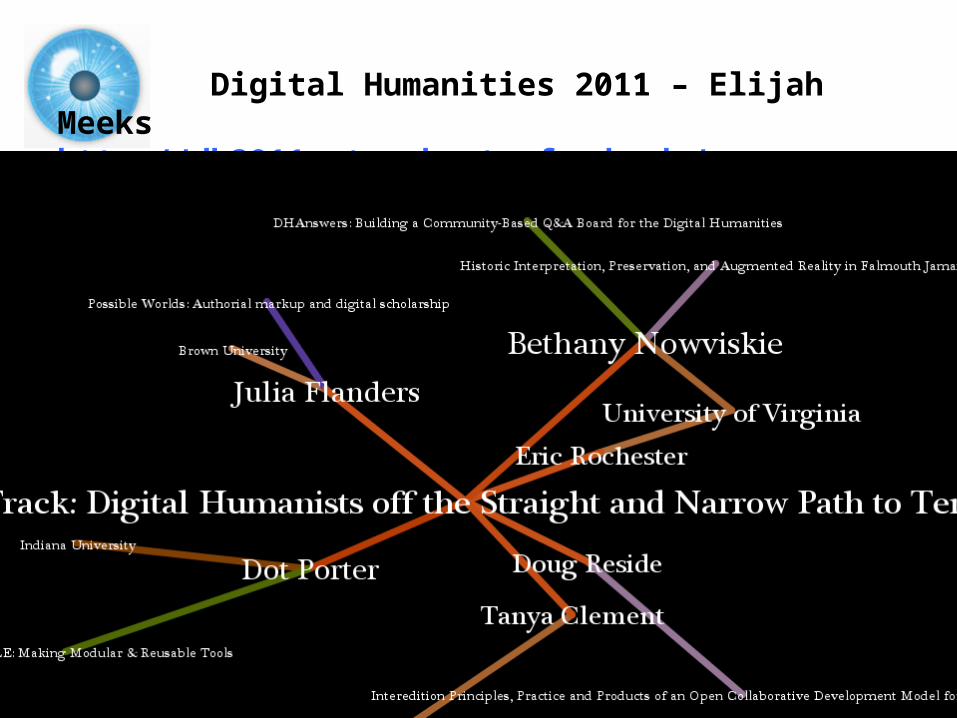
Digital Humanities 2011 – Elijah Meeks http://dh2011network.stanford.edu/
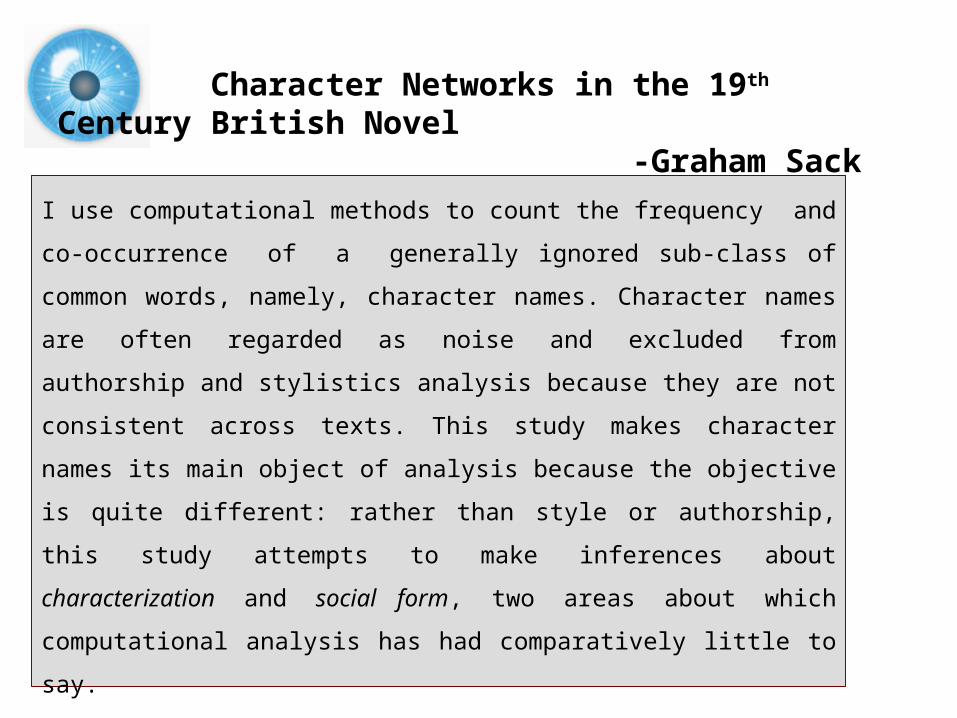
Character Networks in the 19th Century British Novel
-Graham SackI use computational methods to count the frequency and co-
occurrence of a generally ignored sub-class of common words,
namely, character names. Character names are often regarded
as noise and excluded from authorship and stylistics analysis
because they are not consistent across texts. This study makes
character names its main object of analysis because the objective
is quite different: rather than style or authorship, this study
attempts to make inferences about characterization and social
form, two areas about which computational analysis has had
comparatively little to say.
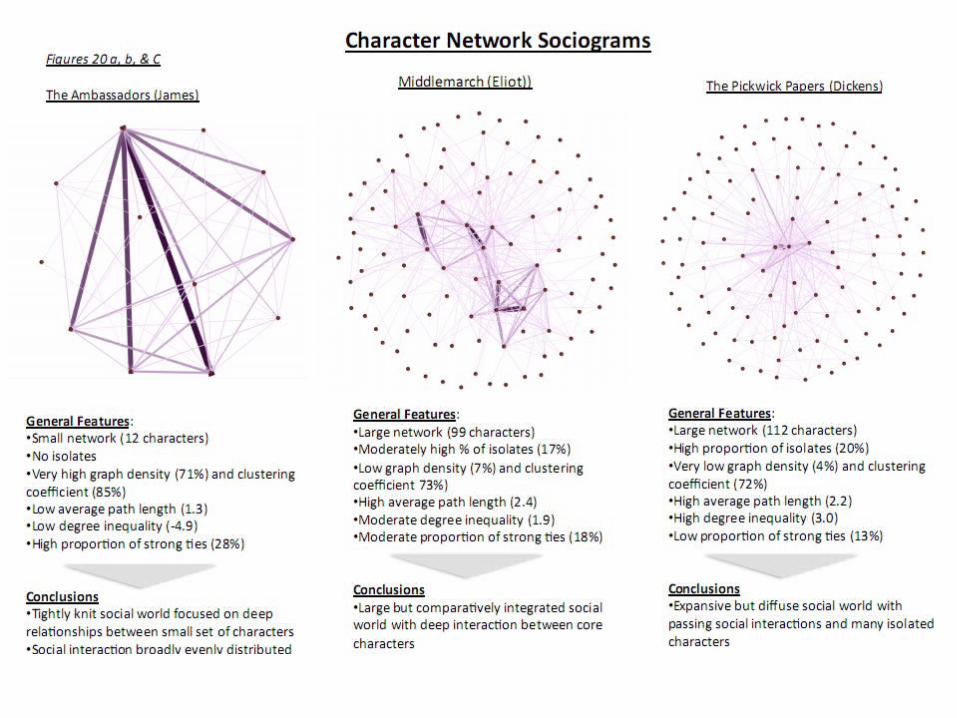
Character Networks in the 19th Century British Novel
-Graham Sack
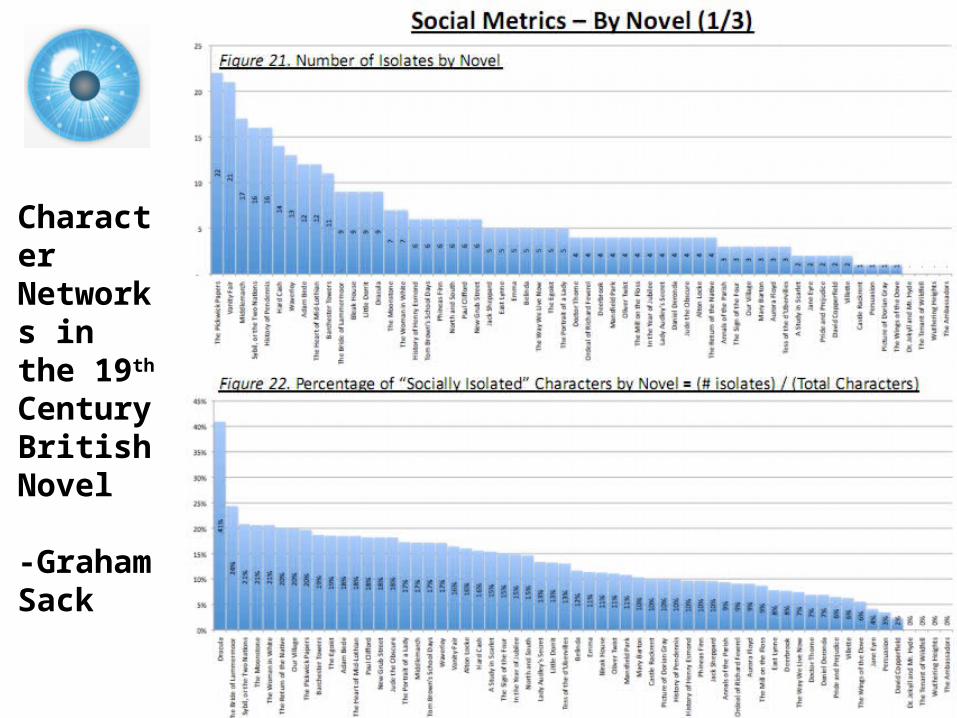
Character Networks in the 19th Century British Novel
-Graham Sack
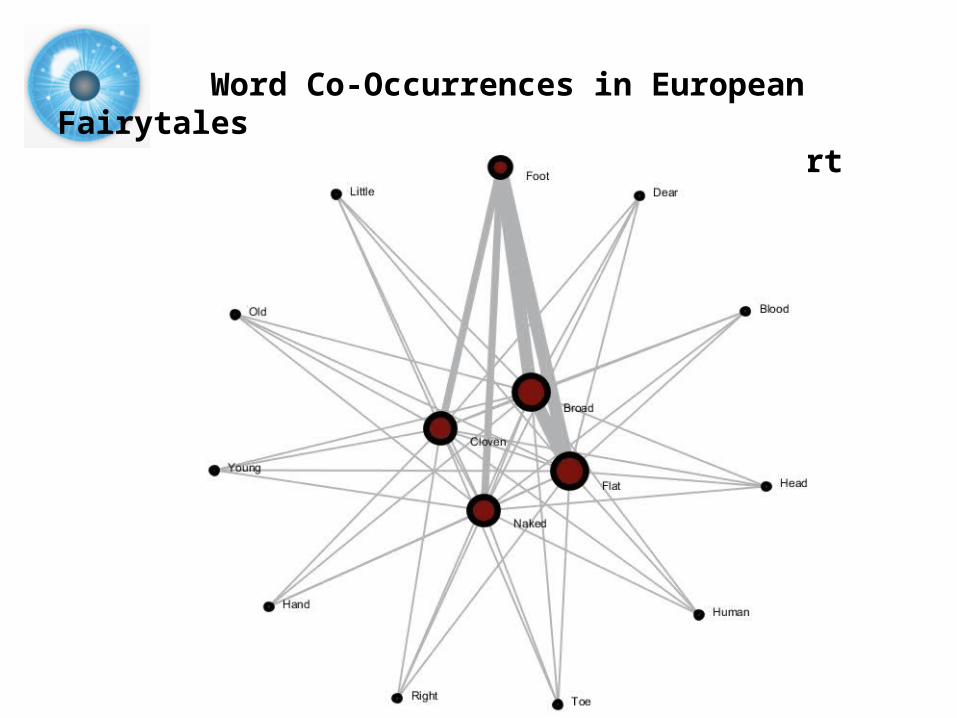
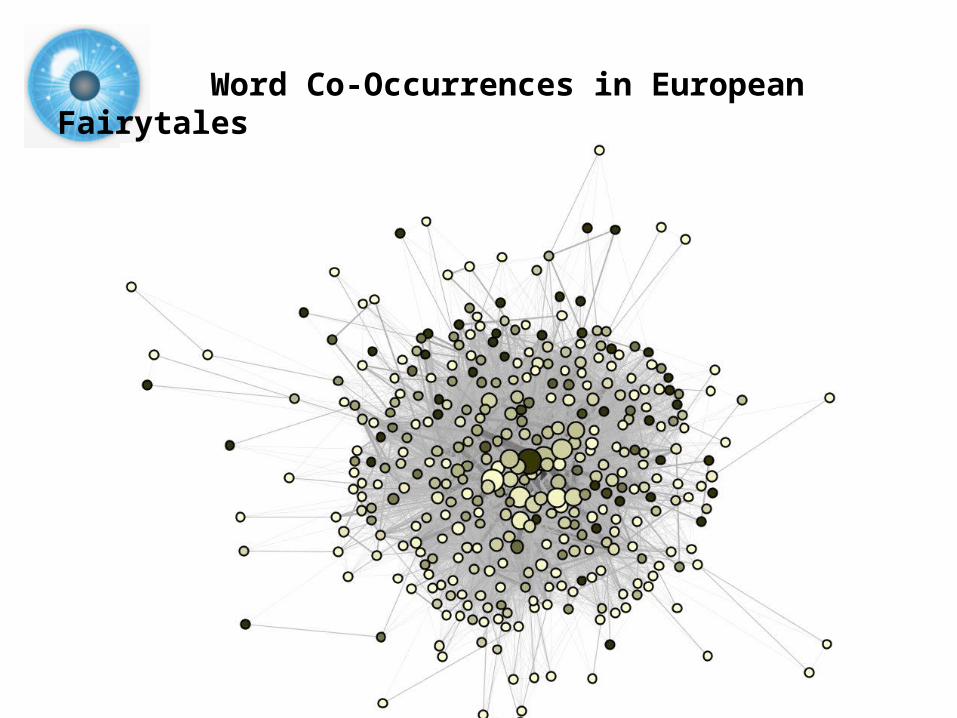
Word Co-Occurrences in European Fairytales
-Jorgensen & Weingart
Word Co-Occurrences in European Fairytales
-Jorgensen & Weingart
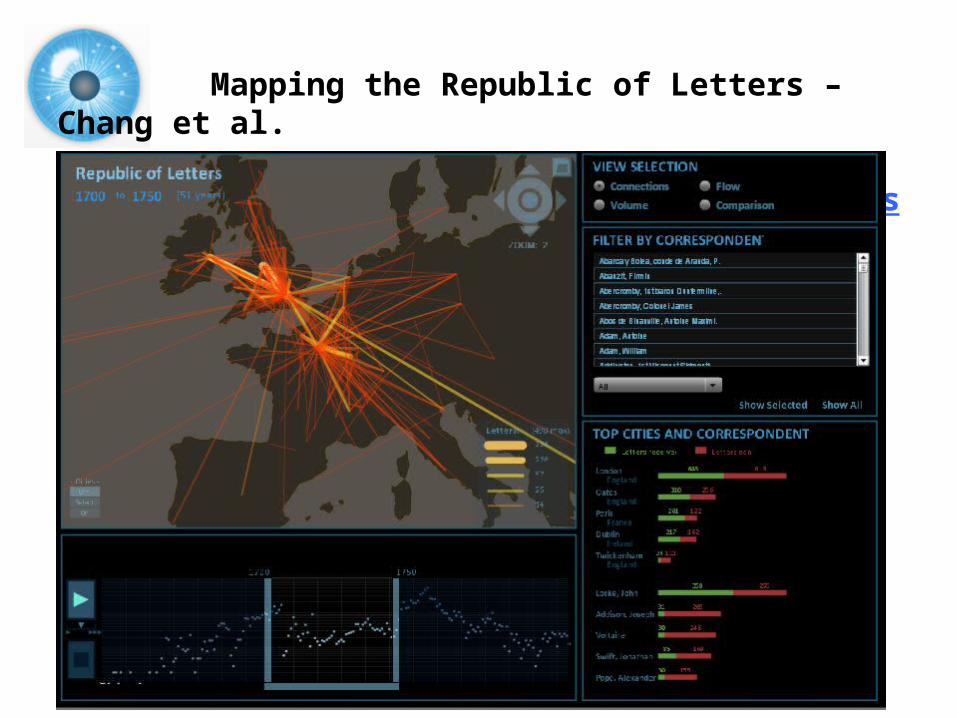
Mapping the Republic of Letters – Chang et al. https://republicofletters.stanford.edu/#maps
1:00-1:15 Introduction to Network Analysis 1:15-1:45 Network Analysis & Visualization in the Humanities• Theory, Applications, and Pitfalls.• Examples In The Wild1:45-2:15 Collecting, Cleaning & Formatting Data2:15-2:25 Break2:25-3:00 Sci2 Tool Basics • Macroscope Design and Usage.• Download and run the tool.• Find basic statistics and run various algorithms over the
network.• Visualize the networks as either a graph or a circular hierarchy.3:00-3:20 Sci2 Workflow Design: Padgett's Florentine Families -
Prepare, load, analyze, and visualize family and business networks from 15th century Florence.
3:20-3:35 Break3:35-4:00 Sci2 Research Demonstration: Mapping the Republic of
Letters4:00-4:30 Q&A and Technical Assistance
Workshop Overview
33
Collecting, Cleaning & Formatting Data
34
Data Collection
65% collecting, 25% cleaning, 5% formatting, 5% analysis.
Keep analysis in mind before first data collected
Remember not just current use but future use as well; nobody wants to do the same work five times.
Make sure system for data entry is easy, transferrable, and as granular as possible.
Data Cleaning & Validation
Multiple coders? Undergraduates? Check for intercoder reliability. Understand biases going in.
Microsoft Excel is your friend (ubiquitous, easy).
Consistency in word use and coding.
Sanity checks at the extremes – order by size, etc.
Check against existing databases if available.
Make sure basic statistics make sense.
File-types
Excel
Database
Text
CSV
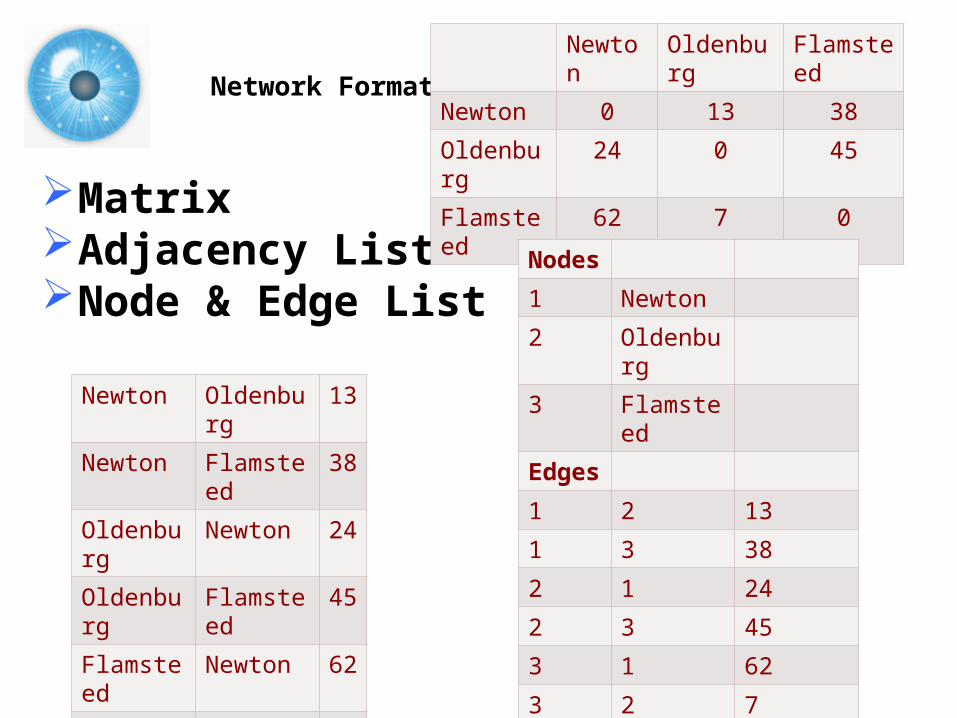
Network Formats
MatrixAdjacency ListNode & Edge List
Newton
Oldenburg
Flamsteed
Newton 0 13 38
Oldenburg
24 0 45
Flamsteed
62 7 0
Newton Oldenburg
13
Newton Flamsteed
38
Oldenburg
Newton 24
Oldenburg
Flamsteed
45
Flamsteed
Newton 62
Flamsteed
Oldenburg
7
Nodes
1 Newton
2 Oldenburg
3 Flamsteed
Edges
1 2 13
1 3 38
2 1 24
2 3 45
3 1 62
3 2 7
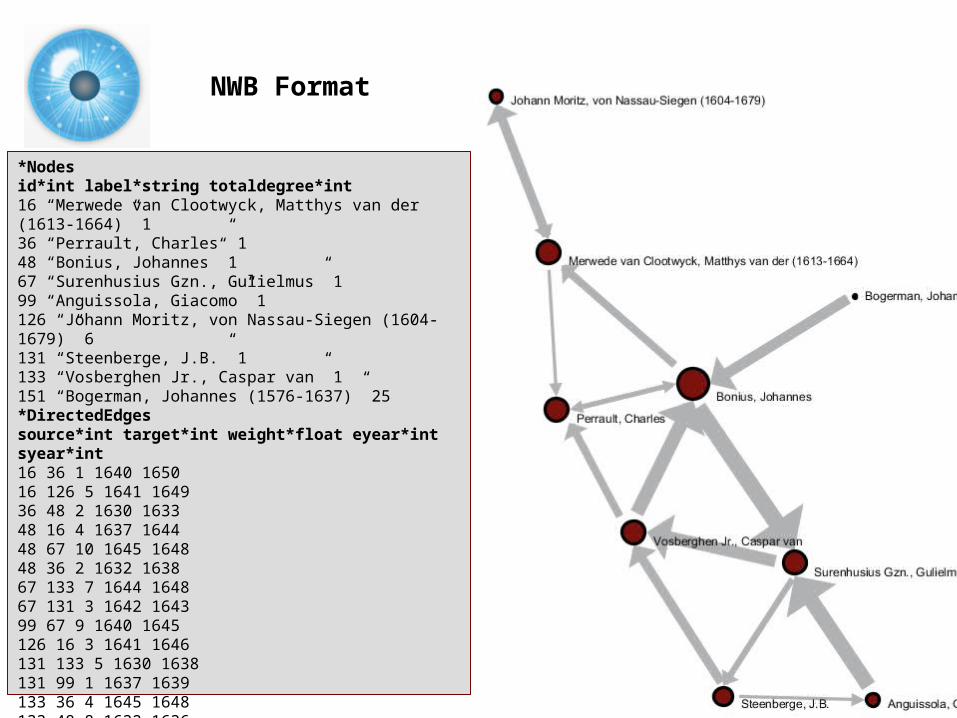
NWB Format
*Nodesid*int label*string totaldegree*int 16 “Merwede van Clootwyck, Matthys van der (1613-1664)” 1 36 “Perrault, Charles” 1 48 “Bonius, Johannes” 1 67 “Surenhusius Gzn., Gulielmus” 1 99 “Anguissola, Giacomo” 1 126 “Johann Moritz, von Nassau-Siegen (1604-1679)” 6 131 “Steenberge, J.B.” 1 133 “Vosberghen Jr., Caspar van” 1 151 “Bogerman, Johannes (1576-1637)” 25 *DirectedEdges source*int target*int weight*float eyear*int syear*int 16 36 1 1640 1650 16 126 5 1641 1649 36 48 2 1630 1633 48 16 4 1637 1644 48 67 10 1645 1648 48 36 2 1632 1638 67 133 7 1644 1648 67 131 3 1642 1643 99 67 9 1640 1645 126 16 3 1641 1646 131 133 5 1630 1638 131 99 1 1637 1639 133 36 4 1645 1648 133 48 8 1632 1636 151 48 6 1644 1647
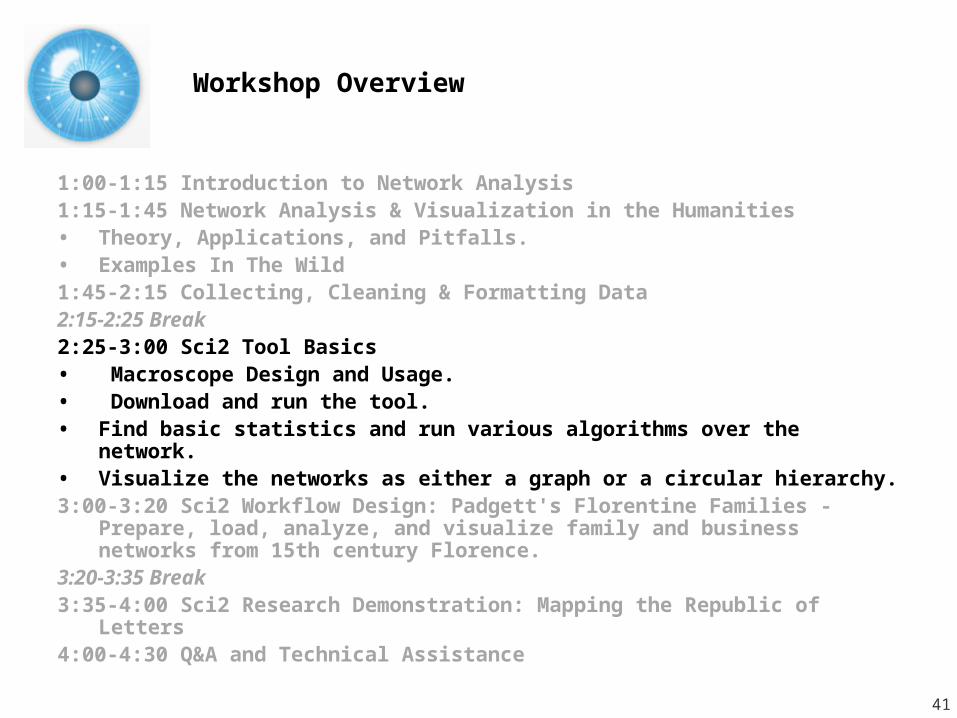
1:00-1:15 Introduction to Network Analysis 1:15-1:45 Network Analysis & Visualization in the Humanities• Theory, Applications, and Pitfalls.• Examples In The Wild1:45-2:15 Collecting, Cleaning & Formatting Data2:15-2:25 Break2:25-3:00 Sci2 Tool Basics • Macroscope Design and Usage.• Download and run the tool.• Find basic statistics and run various algorithms over the
network.• Visualize the networks as either a graph or a circular hierarchy.3:00-3:20 Sci2 Workflow Design: Padgett's Florentine Families -
Prepare, load, analyze, and visualize family and business networks from 15th century Florence.
3:20-3:35 Break3:35-4:00 Sci2 Research Demonstration: Mapping the Republic of
Letters4:00-4:30 Q&A and Technical Assistance
Workshop Overview
40
1:00-1:15 Introduction to Network Analysis 1:15-1:45 Network Analysis & Visualization in the Humanities• Theory, Applications, and Pitfalls.• Examples In The Wild1:45-2:15 Collecting, Cleaning & Formatting Data2:15-2:25 Break2:25-3:00 Sci2 Tool Basics • Macroscope Design and Usage.• Download and run the tool.• Find basic statistics and run various algorithms over the
network.• Visualize the networks as either a graph or a circular hierarchy.3:00-3:20 Sci2 Workflow Design: Padgett's Florentine Families -
Prepare, load, analyze, and visualize family and business networks from 15th century Florence.
3:20-3:35 Break3:35-4:00 Sci2 Research Demonstration: Mapping the Republic of
Letters4:00-4:30 Q&A and Technical Assistance
Workshop Overview
41

Sci2 Tool Basics:Macroscope Design and Usage
42
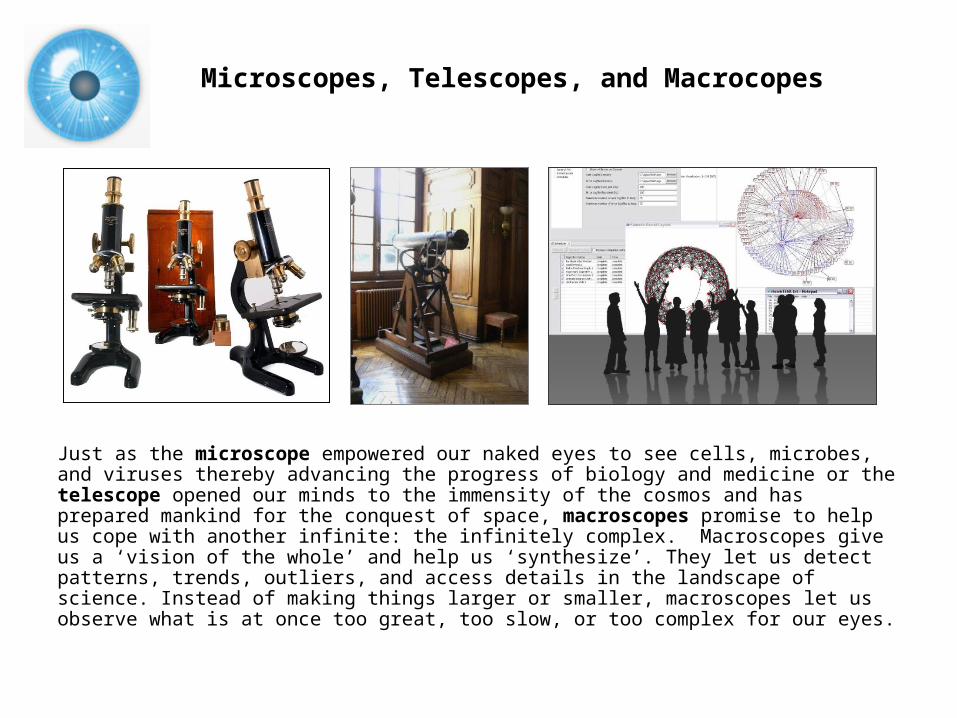
Just as the microscope empowered our naked eyes to see cells, microbes, and viruses thereby advancing the progress of biology and medicine or the telescope opened our minds to the immensity of the cosmos and has prepared mankind for the conquest of space, macroscopes promise to help us cope with another infinite: the infinitely complex. Macroscopes give us a ‘vision of the whole’ and help us ‘synthesize’. They let us detect patterns, trends, outliers, and access details in the landscape of science. Instead of making things larger or smaller, macroscopes let us observe what is at once too great, too slow, or too complex for our eyes.
Microscopes, Telescopes, and Macrocopes

Desirable Features of Macroscopes
Core Architecture & Plugins/Division of Labor: Computer scientists need to design the standardized, modular, easy to maintain and extend “core architecture”. Dataset and algorithm plugins, i.e., the “filling”, are provided by those that care and know most about the data and developed the algorithms: the domain experts.
Ease of Use: As most plugin contributions and usage will come from non-computer scientists it must be possible to contribute, share, and use new plugins without writing one line of code. Users need guidance for constructing effective workflows from 100+ continuously changing plugins.
Modularity: The design of software modules with well defined functionality that can be flexibly combined helps reduce costs, makes it possible to have many contribute, and increases flexibility in tool development, augmentation, and customization.
Standardization: Adoption of (industry) standards speeds up development as existing code can be leveraged. It helps pool resources, supports interoperability, but also eases the migration from research code to production code and hence the transfer of research results into industry applications and products.
Open Data and Open Code: Lets anybody check, improve, or repurpose code and eases the replication of scientific studies.
Macroscopes are similar to Flickr and YouTube and but instead of sharing images
or videos, you freely share datasets and algorithms with scholars around the globe.
Börner, Katy (in press) Plug-and-Play Macroscopes. Communications of the ACM.
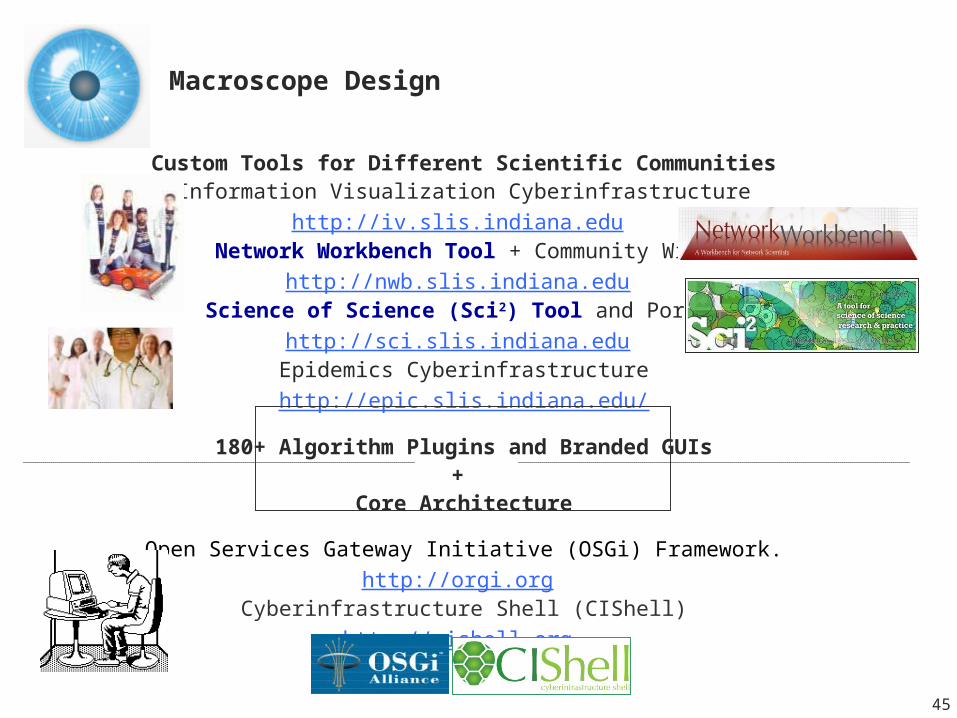
Custom Tools for Different Scientific CommunitiesInformation Visualization Cyberinfrastructure
http://iv.slis.indiana.edu Network Workbench Tool + Community Wiki
http://nwb.slis.indiana.edu Science of Science (Sci2) Tool and Portal
http://sci.slis.indiana.edu Epidemics Cyberinfrastructure
http://epic.slis.indiana.edu/
180+ Algorithm Plugins and Branded GUIs+
Core Architecture
Open Services Gateway Initiative (OSGi) Framework.http://orgi.org
Cyberinfrastructure Shell (CIShell)http://cishell.org
Macroscope Design
45
CIShell Powered Tools: Network Workbench (NWB)
46
47
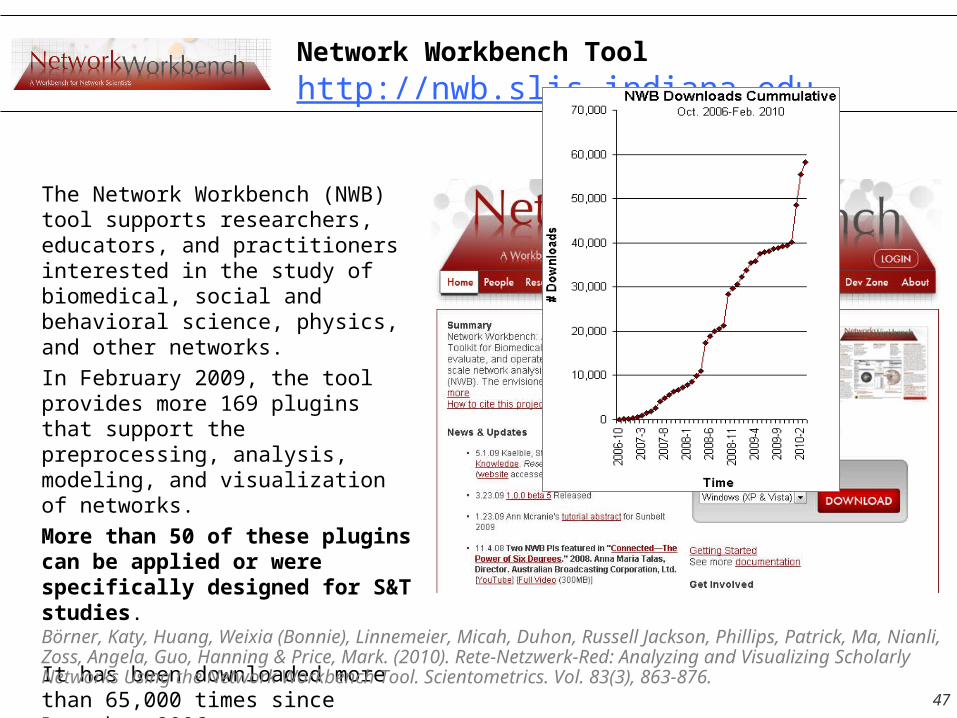
Network Workbench Tool http://nwb.slis.indiana.edu
The Network Workbench (NWB) tool supports researchers, educators, and practitioners interested in the study of biomedical, social and behavioral science, physics, and other networks. In February 2009, the tool provides more 169 plugins that support the preprocessing, analysis, modeling, and visualization of networks. More than 50 of these plugins can be applied or were specifically designed for S&T studies.
It has been downloaded more than 65,000 times since December 2006.
Börner, Katy, Huang, Weixia (Bonnie), Linnemeier, Micah, Duhon, Russell Jackson, Phillips, Patrick, Ma, Nianli, Zoss, Angela, Guo, Hanning & Price, Mark. (2010). Rete-Netzwerk-Red: Analyzing and Visualizing Scholarly Networks Using the Network Workbench Tool. Scientometrics. Vol. 83(3), 863-876.
Project Details
Investigators: Katy Börner, Albert-Laszlo Barabasi, Santiago Schnell, Alessandro Vespignani & Stanley Wasserman, Eric Wernert
Software Team: Lead: Micah LinnemeierMembers: Patrick Phillips, Russell Duhon, Tim Kelley & Ann McCraniePrevious Developers: Weixia (Bonnie) Huang, Bruce Herr, Heng Zhang, Duygu Balcan, Bryan Hook, Ben Markines, Santo Fortunato, Felix Terkhorn, Ramya Sabbineni, Vivek S. Thakre & Cesar Hidalgo
Goal: Develop a large-scale network analysis, modeling and visualization toolkit for physics, biomedical, and social science research.
Amount: $1,120,926, NSF IIS-0513650 awardDuration: Sept. 2005 - Aug. 2009 Website: http://nwb.slis.indiana.edu
Project Details (cont.)
NWB Advisory Board:James Hendler (Semantic Web) http://www.cs.umd.edu/~hendler/Jason Leigh (CI) http://www.evl.uic.edu/spiff/ Neo Martinez (Biology) http://online.sfsu.edu/~webhead/ Michael Macy, Cornell University (Sociology)http://www.soc.cornell.edu/faculty/macy.shtml Ulrik Brandes (Graph Theory) http://www.inf.uni-konstanz.de/~brandes/ Mark Gerstein, Yale University (Bioinformatics) http://bioinfo.mbb.yale.edu/ Stephen North (AT&T) http://public.research.att.com/viewPage.cfm?PageID=81Tom Snijders, University of Groningen http://stat.gamma.rug.nl/snijders/
Noshir Contractor, Northwestern University http://www.spcomm.uiuc.edu/nosh/
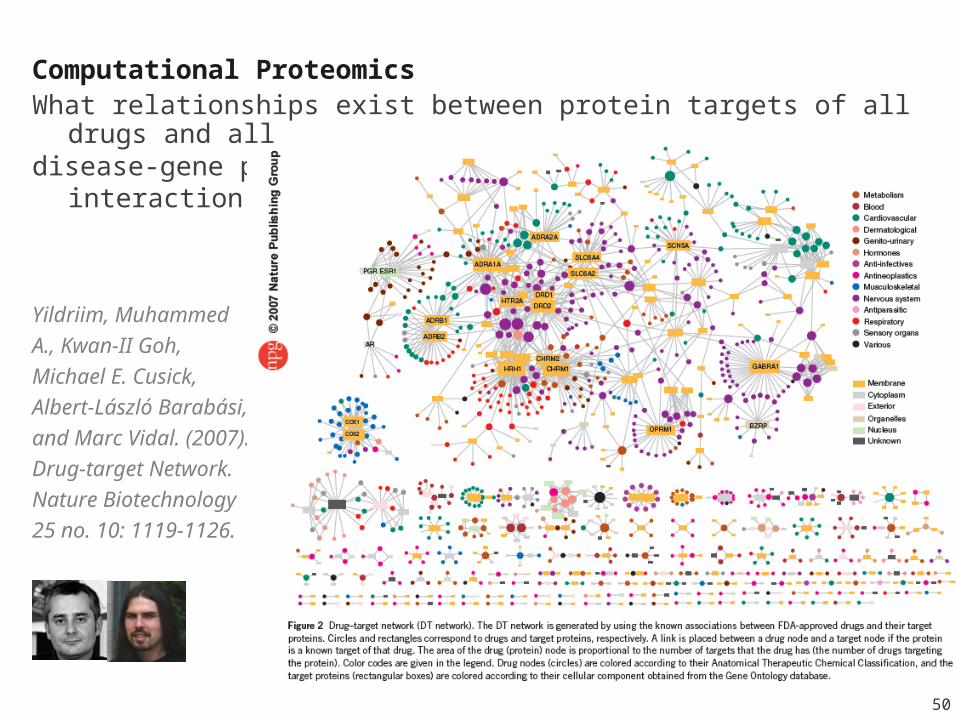
Computational Proteomics What relationships exist between protein targets of all drugs
and all disease-gene products in the human protein–protein interaction
network?
Yildriim, Muhammed A., Kwan-II Goh, Michael E. Cusick, Albert-László Barabási, and Marc Vidal. (2007). Drug-target Network. Nature Biotechnology 25 no. 10: 1119-1126.
50
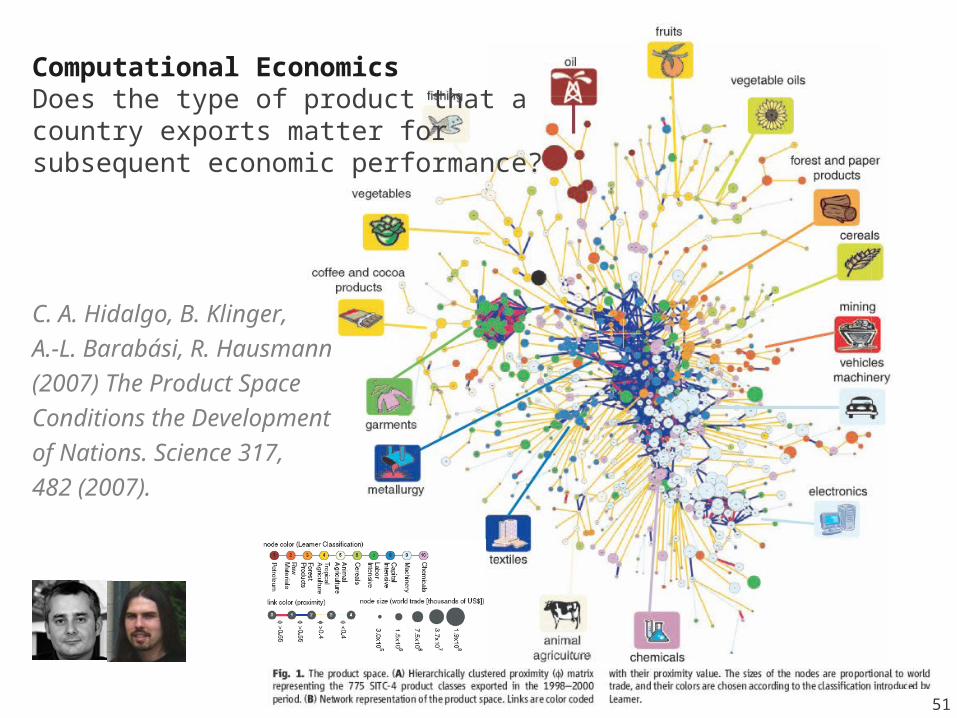
Computational EconomicsDoes the type of product that a country exports matter for subsequent economic performance?
C. A. Hidalgo, B. Klinger, A.-L. Barabási, R. Hausmann (2007) The Product Space Conditions the Development of Nations. Science 317, 482 (2007).
51
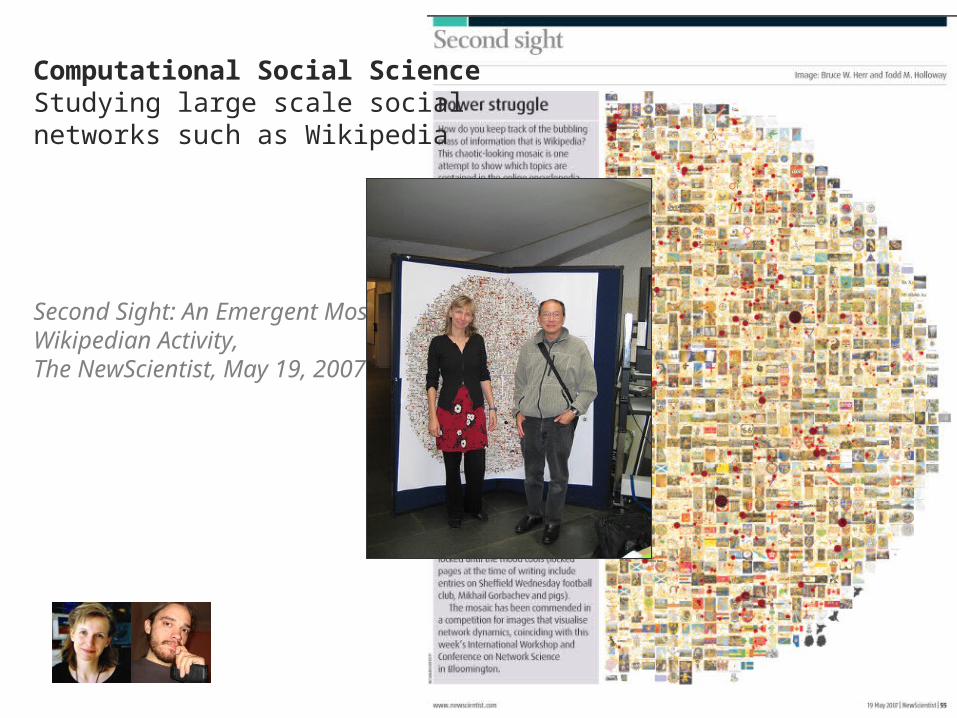
Computational Social ScienceStudying large scale social networks such as Wikipedia
Second Sight: An Emergent Mosaic of Wikipedian Activity, The NewScientist, May 19, 2007
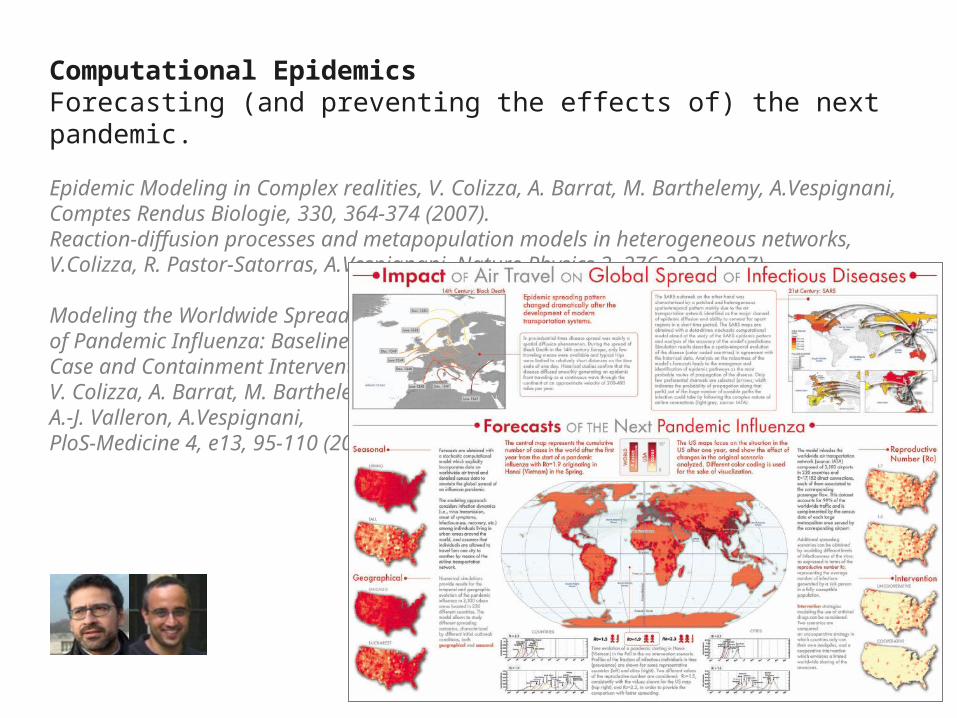
Computational EpidemicsForecasting (and preventing the effects of) the next pandemic.
Epidemic Modeling in Complex realities, V. Colizza, A. Barrat, M. Barthelemy, A.Vespignani, Comptes Rendus Biologie, 330, 364-374 (2007).Reaction-diffusion processes and metapopulation models in heterogeneous networks, V.Colizza, R. Pastor-Satorras, A.Vespignani, Nature Physics 3, 276-282 (2007).
Modeling the Worldwide Spread of Pandemic Influenza: Baseline Case and Containment Interventions, V. Colizza, A. Barrat, M. Barthelemy, A.-J. Valleron, A.Vespignani, PloS-Medicine 4, e13, 95-110 (2007).
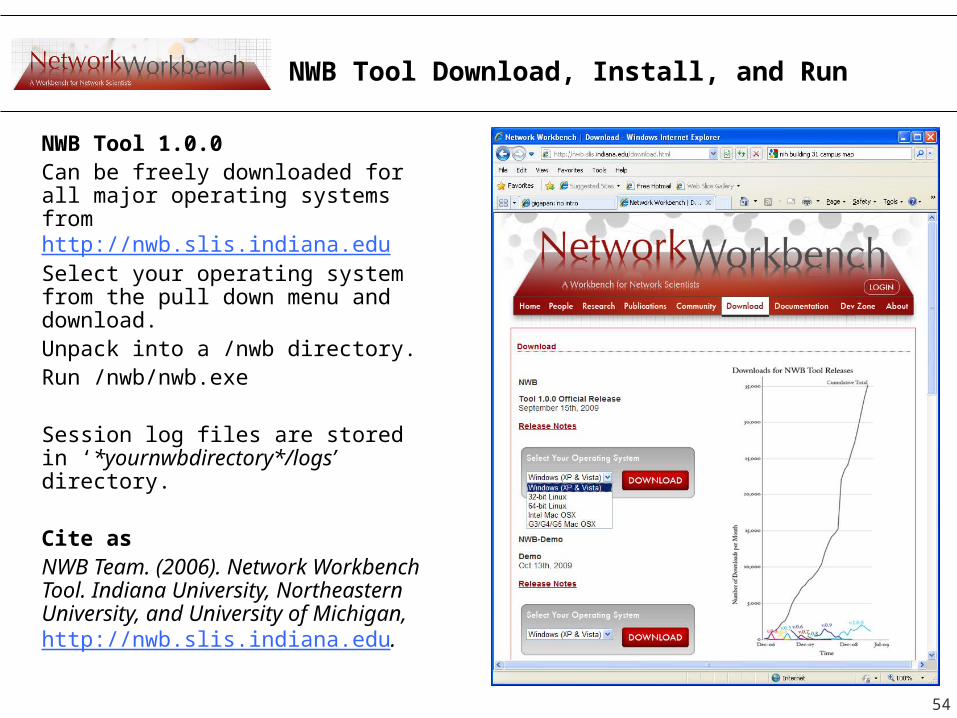
NWB Tool Download, Install, and Run
NWB Tool 1.0.0Can be freely downloaded for all major operating systems from http://nwb.slis.indiana.edu Select your operating system from the pull down menu and download. Unpack into a /nwb directory.Run /nwb/nwb.exe
Session log files are stored in ‘*yournwbdirectory*/logs’ directory.
Cite asNWB Team. (2006). Network Workbench Tool. Indiana University, Northeastern University, and University of Michigan, http://nwb.slis.indiana.edu.
54
55
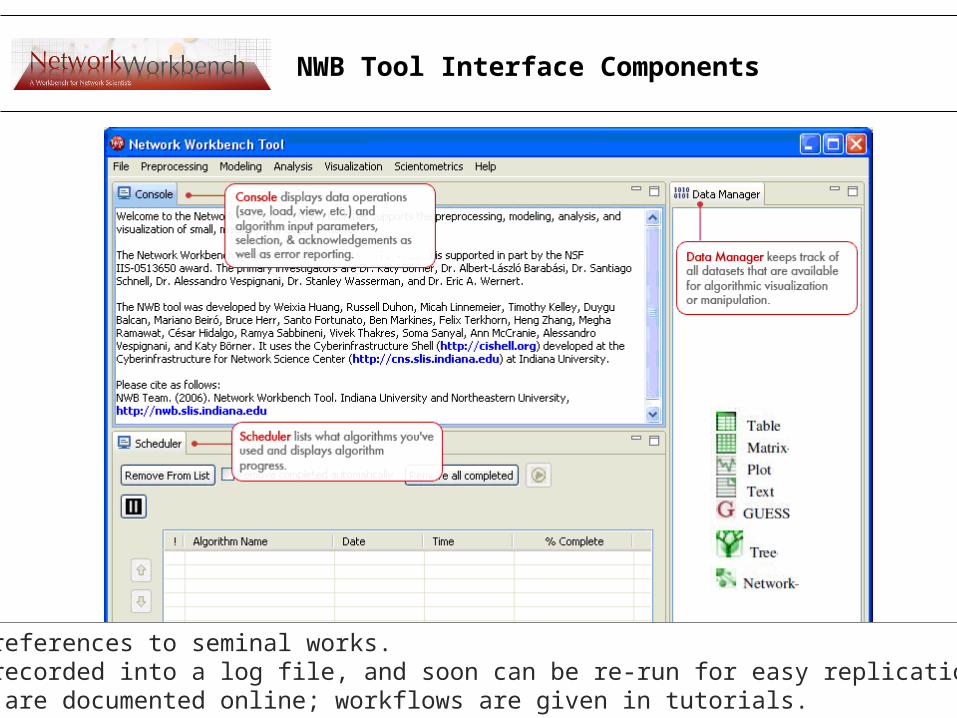
NWB Tool Interface Components
Console shows references to seminal works.Workflows are recorded into a log file, and soon can be re-run for easy replication.All algorithms are documented online; workflows are given in tutorials.
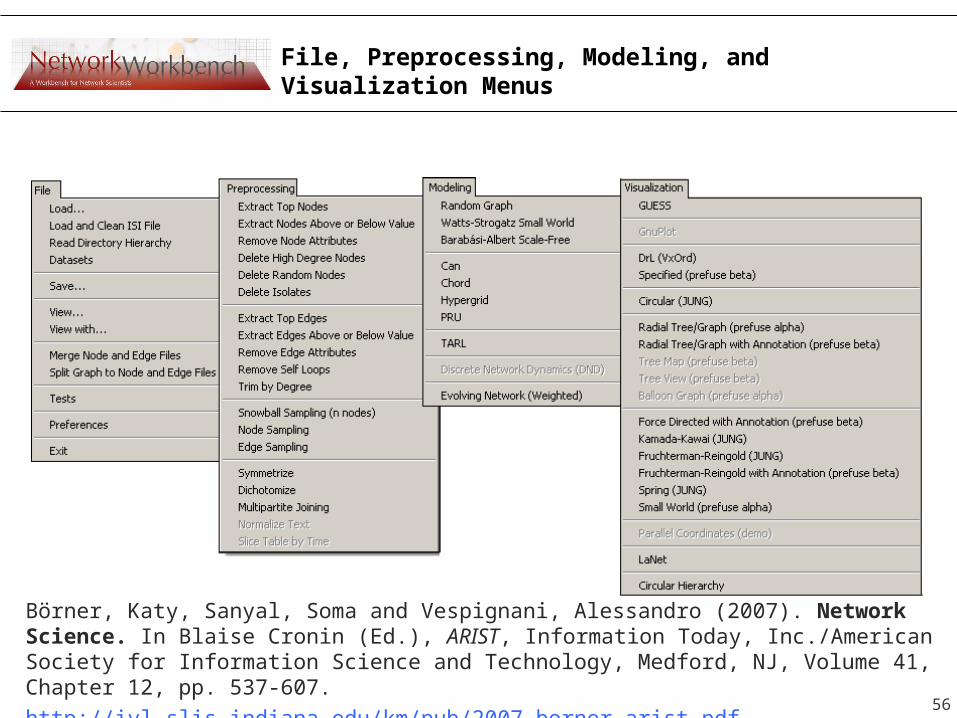
File, Preprocessing, Modeling, and Visualization Menus
56
Börner, Katy, Sanyal, Soma and Vespignani, Alessandro (2007). Network Science. In Blaise Cronin (Ed.), ARIST, Information Today, Inc./American Society for Information Science and Technology, Medford, NJ, Volume 41, Chapter 12, pp. 537-607. http://ivl.slis.indiana.edu/km/pub/2007-borner-arist.pdf
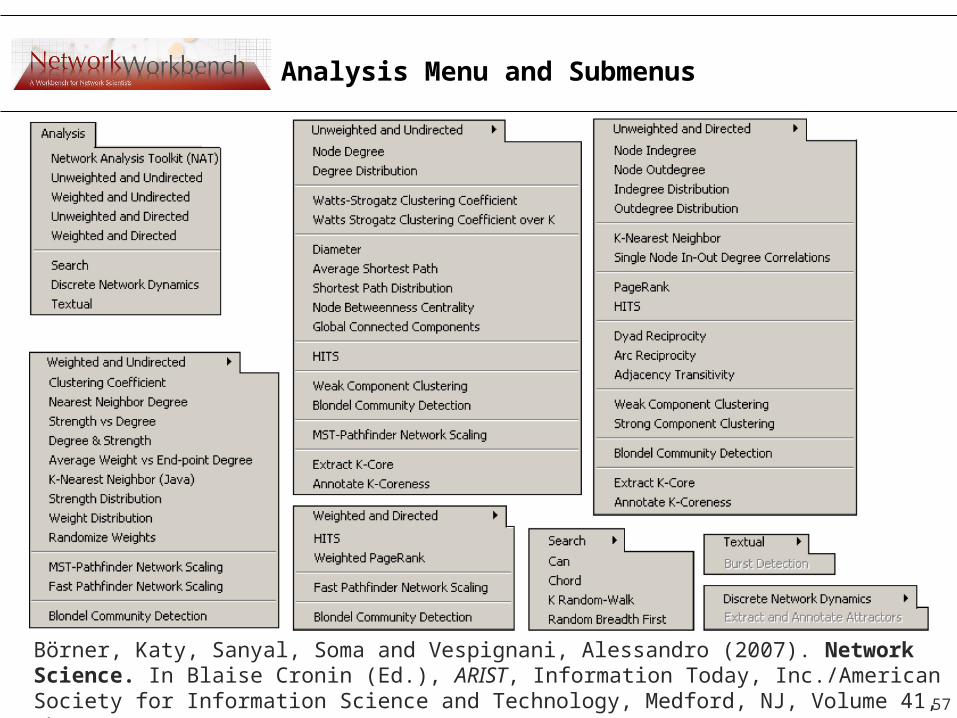
Analysis Menu and Submenus
57
Börner, Katy, Sanyal, Soma and Vespignani, Alessandro (2007). Network Science. In Blaise Cronin (Ed.), ARIST, Information Today, Inc./American Society for Information Science and Technology, Medford, NJ, Volume 41, Chapter 12, pp. 537-607. http://ivl.slis.indiana.edu/km/pub/2007-borner-arist.pdf
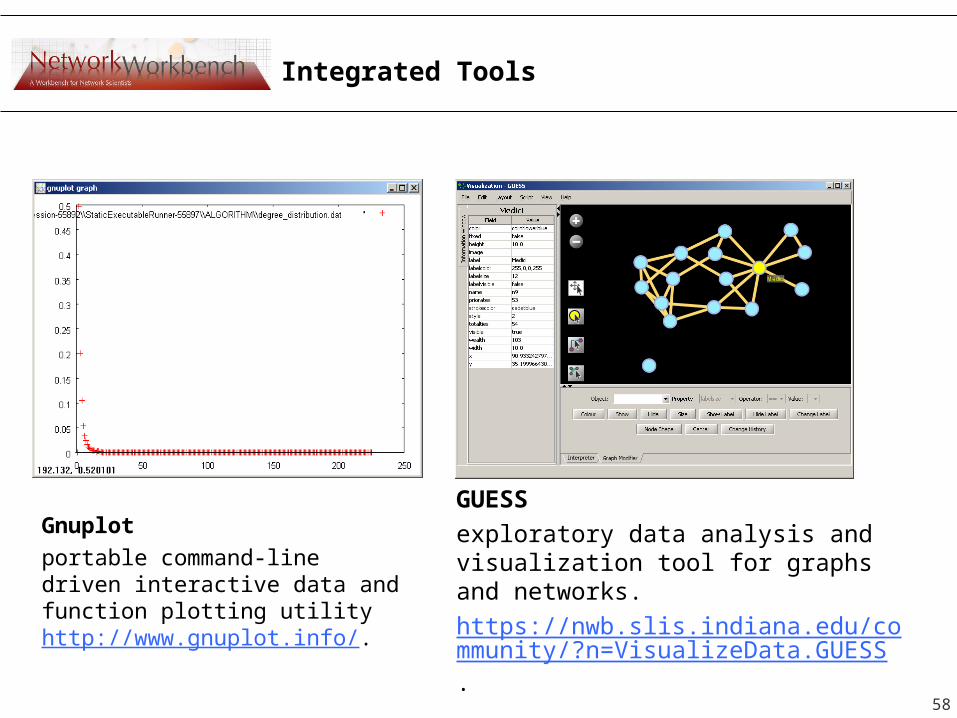
Integrated Tools
Gnuplotportable command-line driven interactive data and function plotting utility http://www.gnuplot.info/.
GUESSexploratory data analysis and visualization tool for graphs and networks. https://nwb.slis.indiana.edu/community/?n=VisualizeData.GUESS.
58
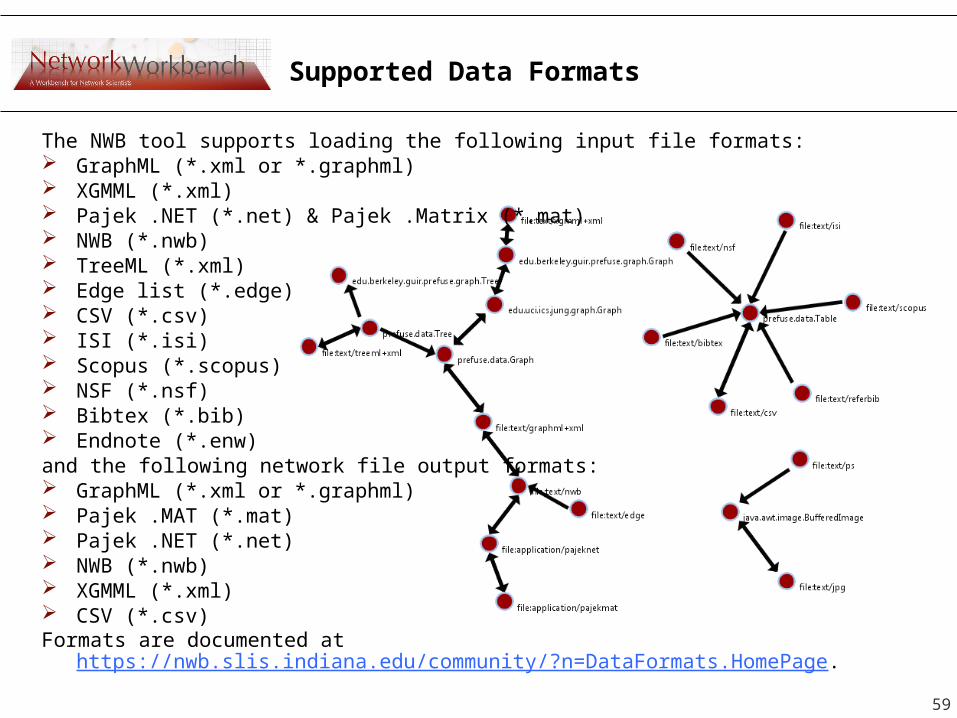
Supported Data Formats
The NWB tool supports loading the following input file formats: GraphML (*.xml or *.graphml) XGMML (*.xml) Pajek .NET (*.net) & Pajek .Matrix (*.mat) NWB (*.nwb) TreeML (*.xml) Edge list (*.edge) CSV (*.csv) ISI (*.isi) Scopus (*.scopus) NSF (*.nsf) Bibtex (*.bib) Endnote (*.enw)and the following network file output formats: GraphML (*.xml or *.graphml) Pajek .MAT (*.mat) Pajek .NET (*.net) NWB (*.nwb) XGMML (*.xml) CSV (*.csv)Formats are documented at
https://nwb.slis.indiana.edu/community/?n=DataFormats.HomePage. 59

60
CIShell Powered Tools:
Science of Science (Sci2) Tool
61
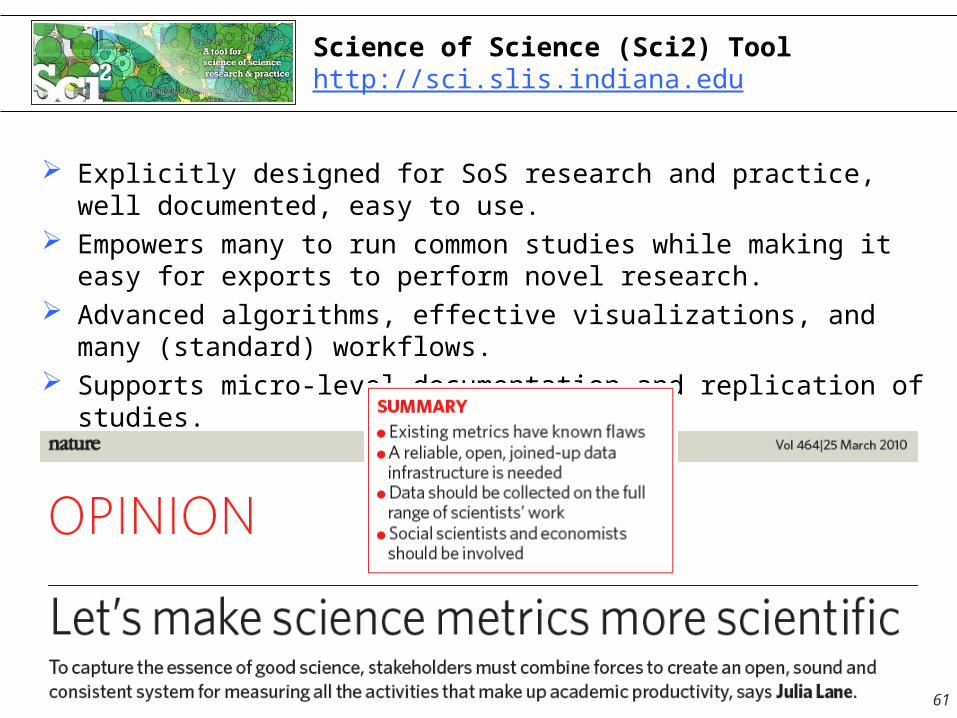
Science of Science (Sci2) Toolhttp://sci.slis.indiana.edu
Explicitly designed for SoS research and practice, well documented, easy to use.
Empowers many to run common studies while making it easy for exports to perform novel research.
Advanced algorithms, effective visualizations, and many (standard) workflows.
Supports micro-level documentation and replication of studies.
Is open source—anybody can review and extend the code, or use it for commercial purposes.
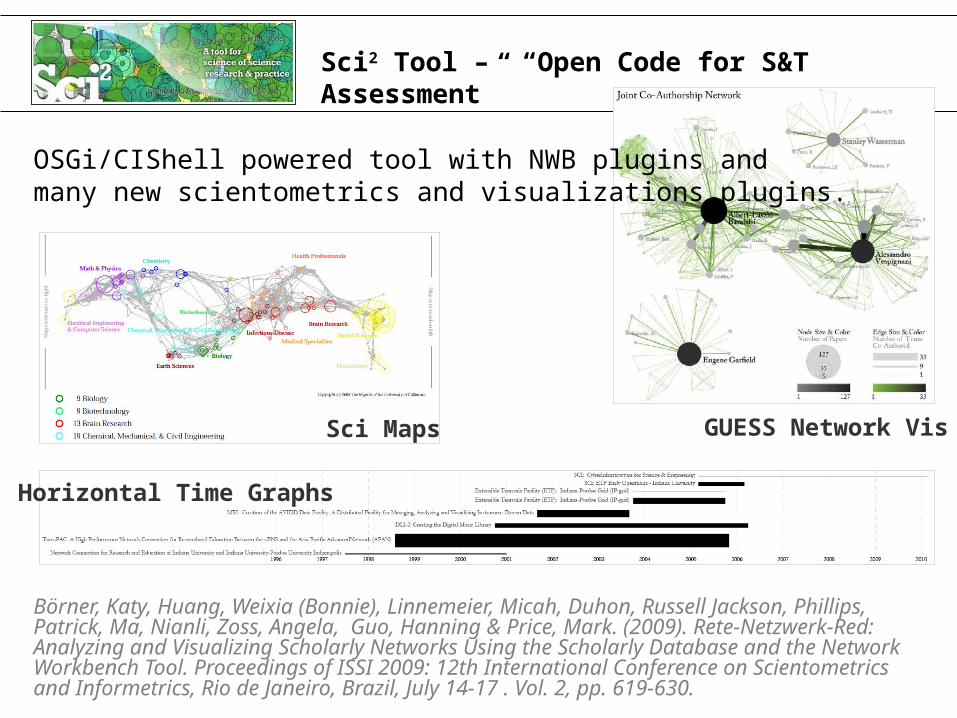
Sci2 Tool – “Open Code for S&T Assessment”
OSGi/CIShell powered tool with NWB plugins and many new scientometrics and visualizations plugins.
Börner, Katy, Huang, Weixia (Bonnie), Linnemeier, Micah, Duhon, Russell Jackson, Phillips, Patrick, Ma, Nianli, Zoss, Angela, Guo, Hanning & Price, Mark. (2009). Rete-Netzwerk-Red: Analyzing and Visualizing Scholarly Networks Using the Scholarly Database and the Network Workbench Tool. Proceedings of ISSI 2009: 12th International Conference on Scientometrics and Informetrics, Rio de Janeiro, Brazil, July 14-17 . Vol. 2, pp. 619-630.
Horizontal Time Graphs
Sci Maps GUESS Network Vis
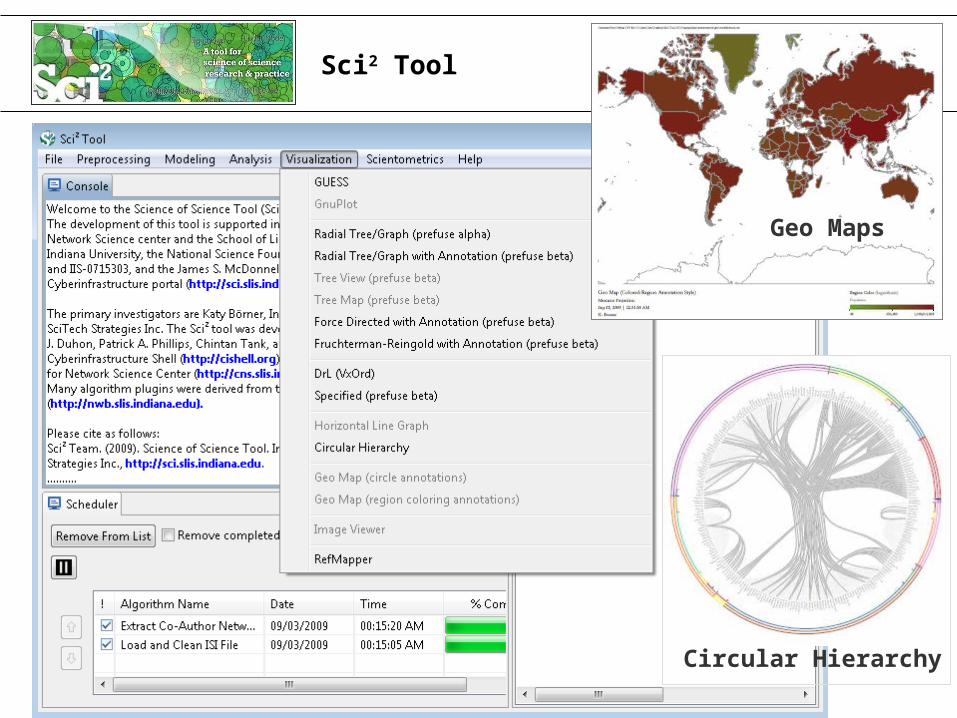
Sci2 Tool
Geo Maps
Circular Hierarchy
64
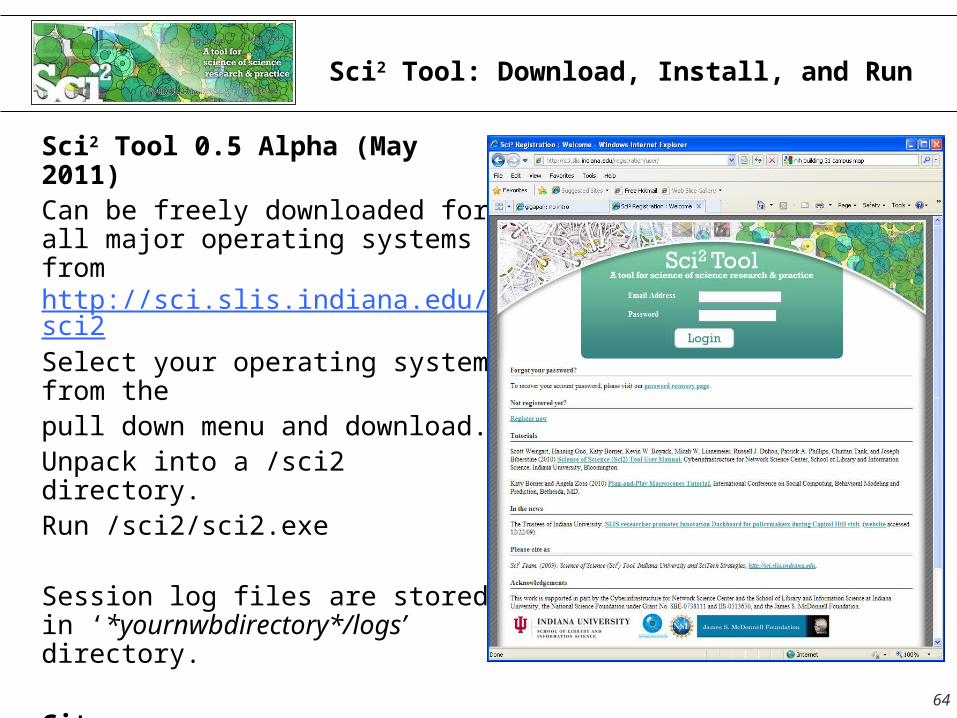
Sci2 Tool: Download, Install, and Run
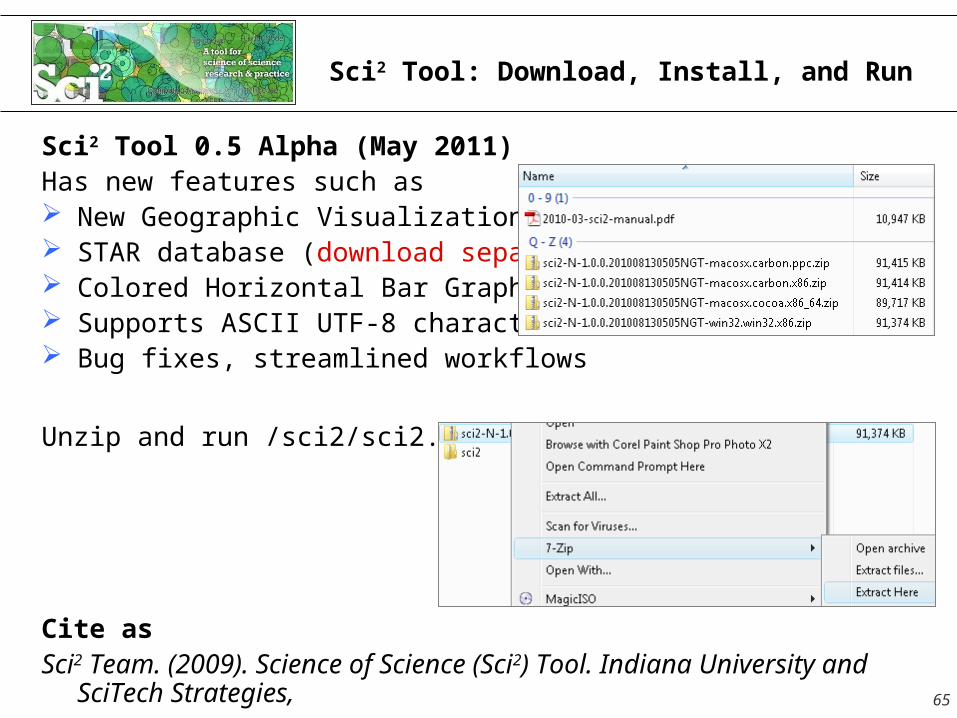
Sci2 Tool 0.5 Alpha (May 2011)Can be freely downloaded for all major operating systems from http://sci.slis.indiana.edu/sci2Select your operating system from the pull down menu and download. Unpack into a /sci2 directory.Run /sci2/sci2.exe
Session log files are stored in ‘*yournwbdirectory*/logs’ directory.
Cite as Sci2 Team. (2009). Science of Science (Sci2) Tool. Indiana University and SciTech Strategies, http://sci.slis.indiana.edu.
65
Sci2 Tool: Download, Install, and Run
Sci2 Tool 0.5 Alpha (May 2011)Has new features such as New Geographic Visualizations STAR database (download separately) Colored Horizontal Bar Graphs Supports ASCII UTF-8 characters Bug fixes, streamlined workflows
Unzip and run /sci2/sci2.exe
Cite as Sci2 Team. (2009). Science of Science (Sci2) Tool. Indiana
University and SciTech Strategies, http://sci.slis.indiana.edu.
66
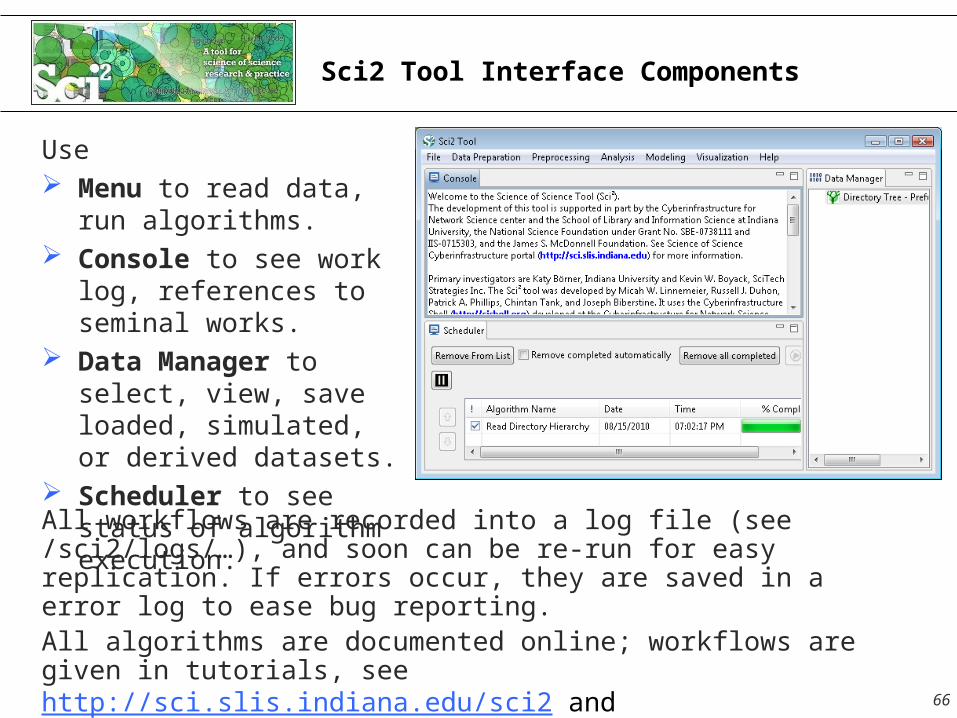
Sci2 Tool Interface Components
Use Menu to read data, run
algorithms. Console to see work
log, references to seminal works.
Data Manager to select, view, save loaded, simulated, or derived datasets.
Scheduler to see status of algorithm execution.
All workflows are recorded into a log file (see /sci2/logs/…), and soon can be re-run for easy replication. If errors occur, they are saved in a error log to ease bug reporting.All algorithms are documented online; workflows are given in tutorials, see http://sci.slis.indiana.edu/sci2 and http://nwb.slis.indiana.edu > Community
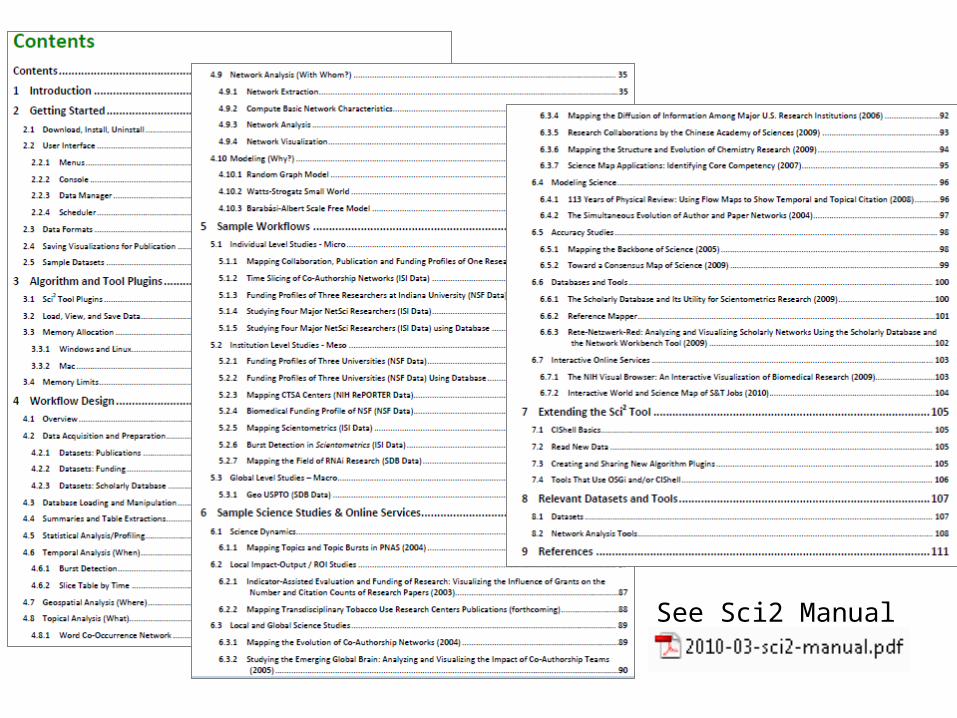
See Sci2 Manual
68
Sci2 Tool – Read+Visualize Sci2 Tool Directory Tree
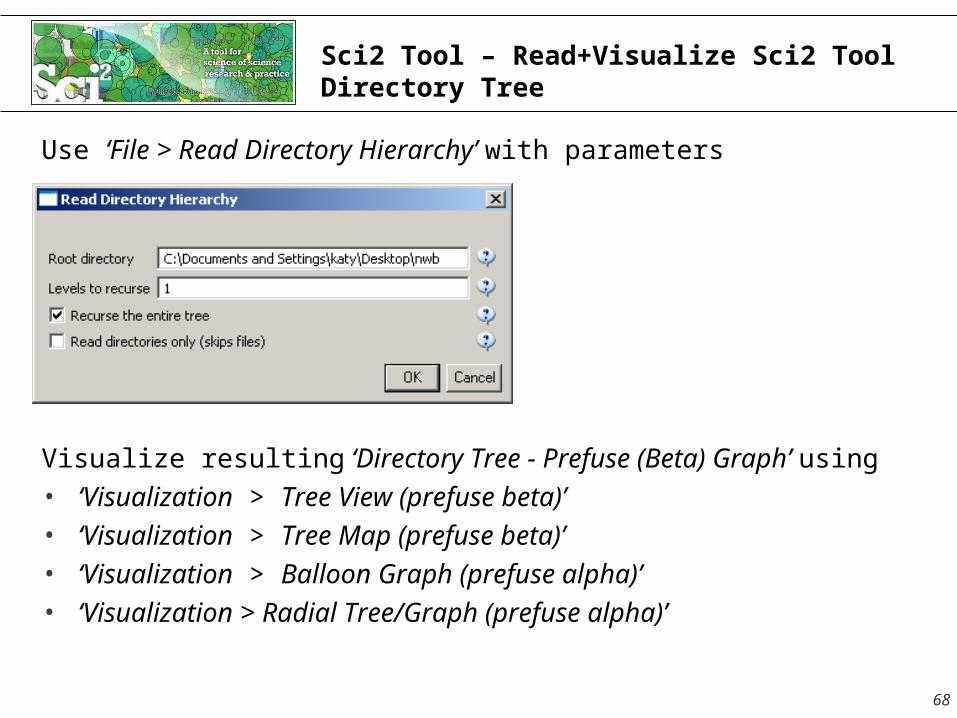
Use ‘File > Read Directory Hierarchy’ with parameters
Visualize resulting ‘Directory Tree - Prefuse (Beta) Graph’ using
• ‘Visualization > Tree View (prefuse beta)’• ‘Visualization > Tree Map (prefuse beta)’• ‘Visualization > Balloon Graph (prefuse alpha)’• ‘Visualization > Radial Tree/Graph (prefuse alpha)’
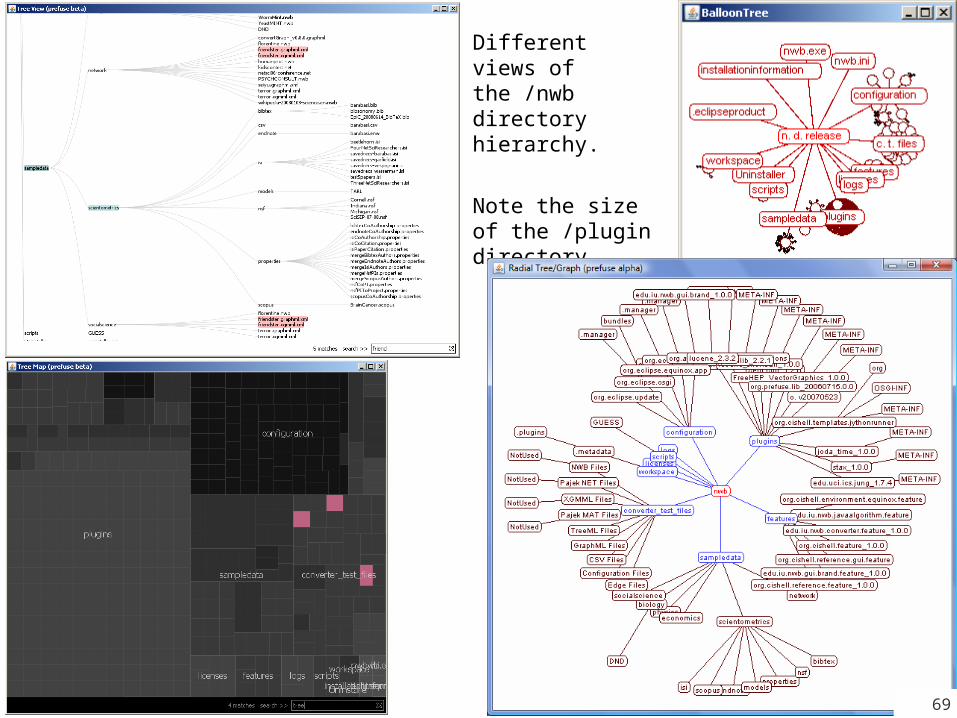
Different views of the /nwb directory hierarchy.
Note the size of the /plugin directory.
69
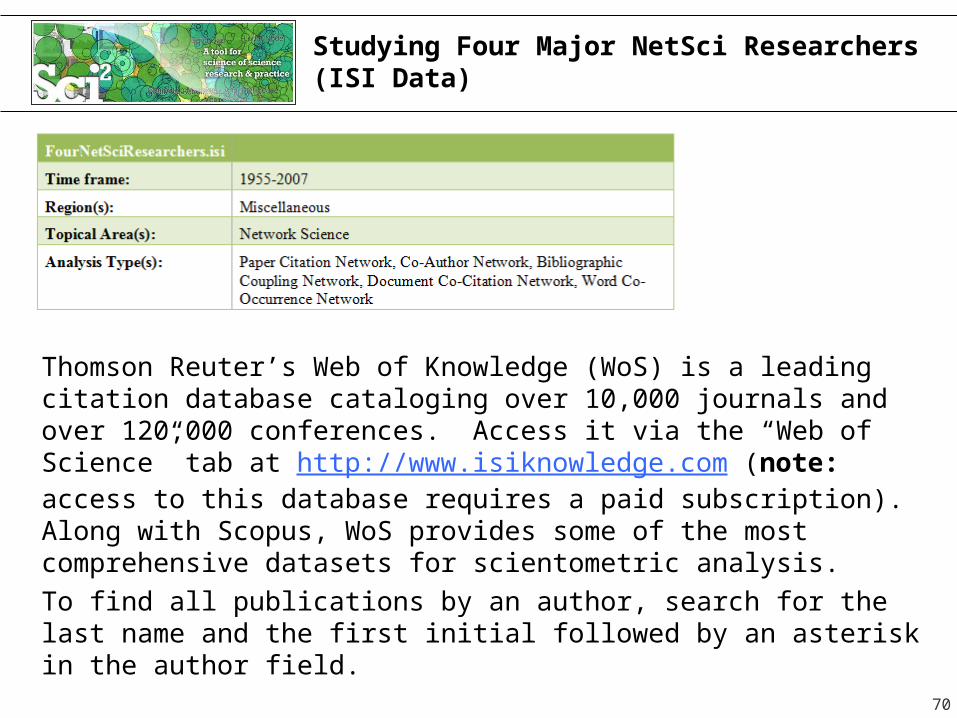
Studying Four Major NetSci Researchers (ISI Data)
Thomson Reuter’s Web of Knowledge (WoS) is a leading citation database cataloging over 10,000 journals and over 120,000 conferences. Access it via the “Web of Science” tab at http://www.isiknowledge.com (note: access to this database requires a paid subscription). Along with Scopus, WoS provides some of the most comprehensive datasets for scientometric analysis. To find all publications by an author, search for the last name and the first initial followed by an asterisk in the author field.
70
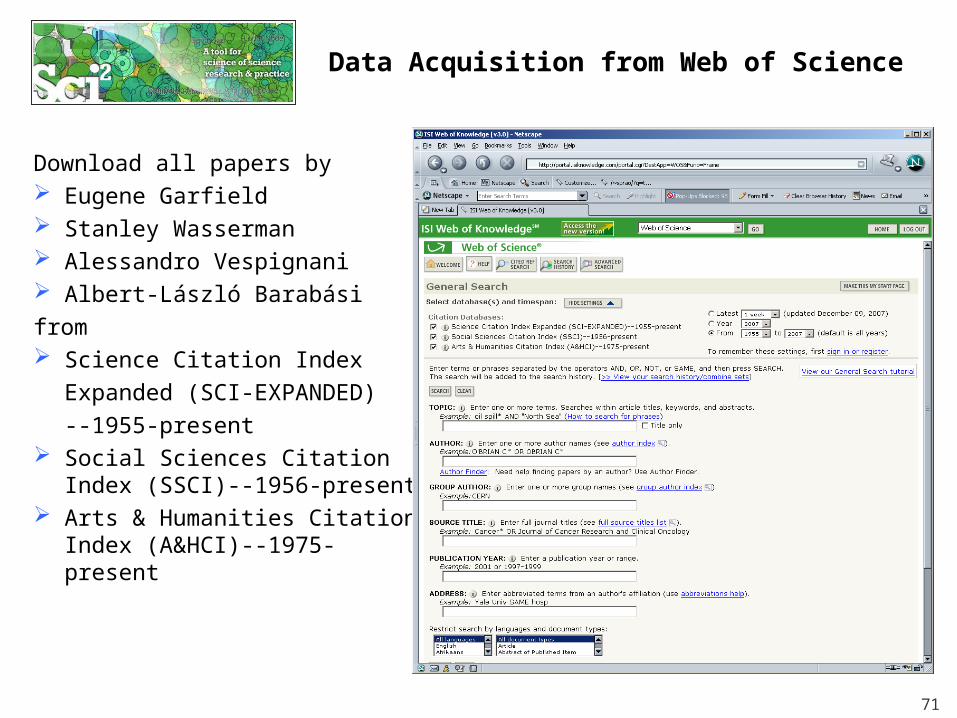
Data Acquisition from Web of Science
Download all papers by Eugene Garfield Stanley Wasserman Alessandro Vespignani Albert-László Barabásifrom Science Citation Index
Expanded (SCI-EXPANDED)--1955-present
Social Sciences Citation Index (SSCI)--1956-present
Arts & Humanities Citation Index (A&HCI)--1975-present
71
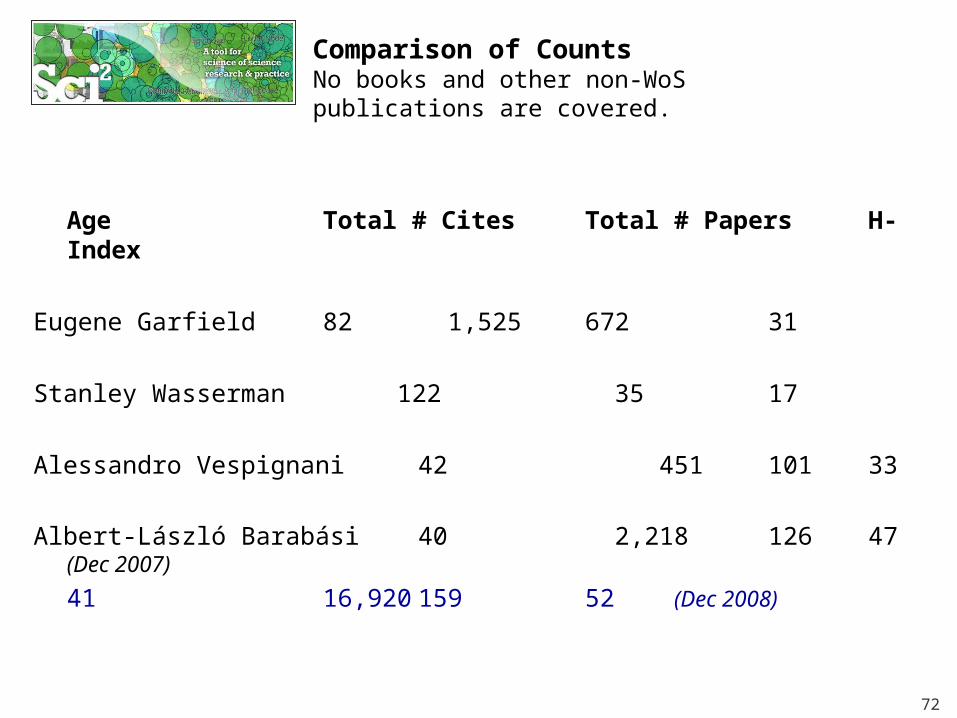
Comparison of CountsNo books and other non-WoS publications are covered.
Age Total # Cites Total # Papers H-Index
Eugene Garfield 82 1,525 672 31
Stanley Wasserman 122 35 17
Alessandro Vespignani 42 451 101 33
Albert-László Barabási 40 2,218 126 47 (Dec 2007)
41 16,920 159 52 (Dec 2008)
72
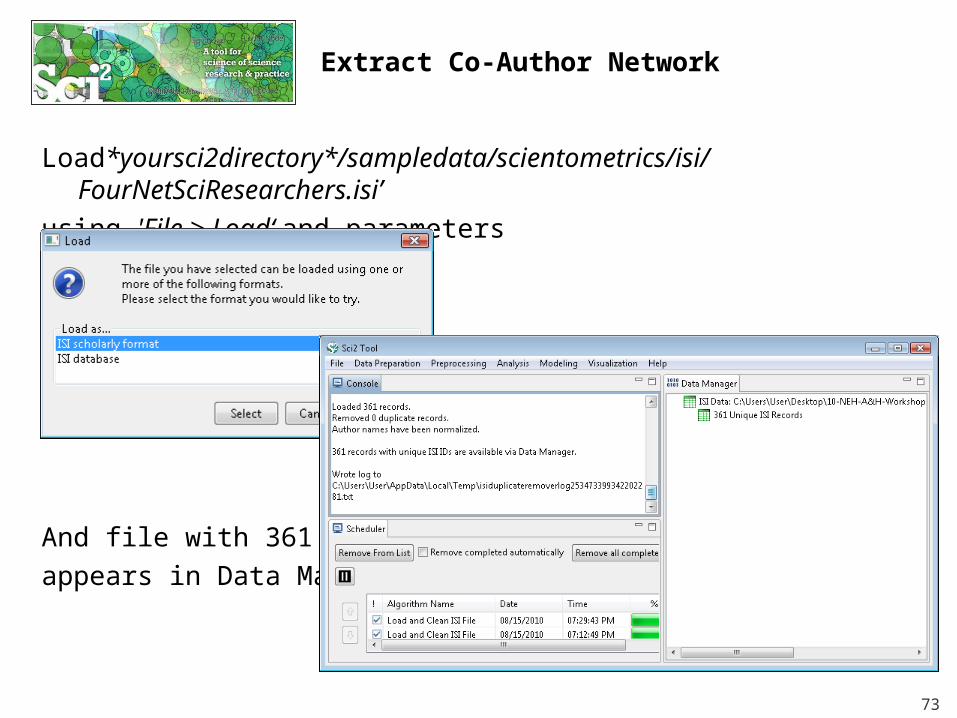
Extract Co-Author Network
Load*yoursci2directory*/sampledata/scientometrics/isi/FourNetSciResearchers.isi’
using 'File > Load‘ and parameters
And file with 361 records appears in Data Manager.
73
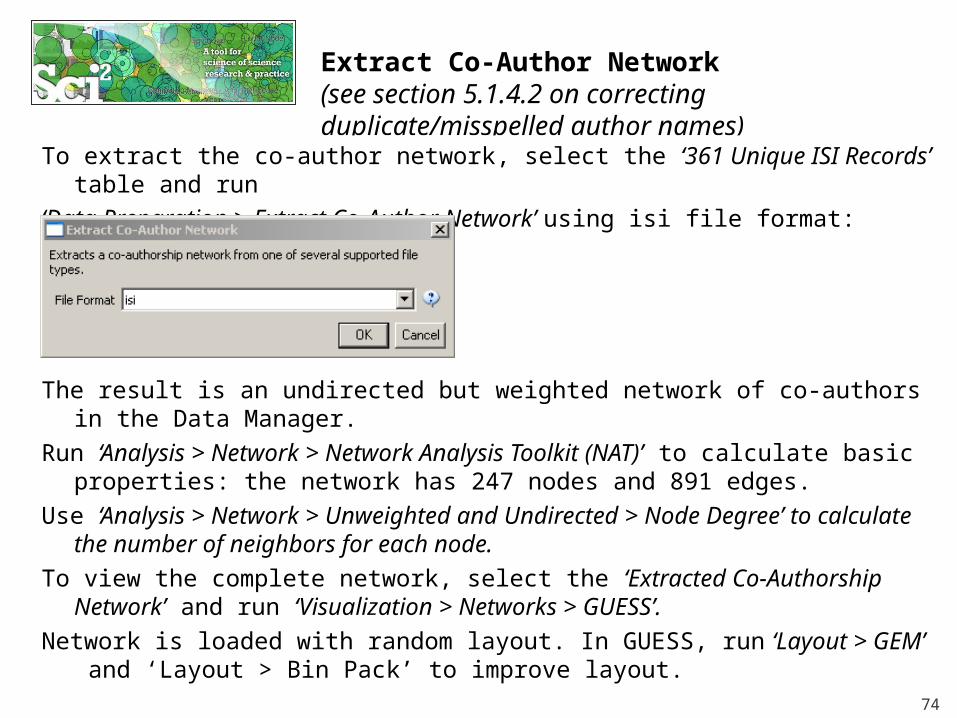
Extract Co-Author Network(see section 5.1.4.2 on correcting duplicate/misspelled author names)
To extract the co-author network, select the ‘361 Unique ISI Records’ table and run
‘Data Preparation > Extract Co-Author Network’ using isi file format:
The result is an undirected but weighted network of co-authors in the Data Manager.
Run ‘Analysis > Network > Network Analysis Toolkit (NAT)’ to calculate basic properties: the network has 247 nodes and 891 edges.
Use ‘Analysis > Network > Unweighted and Undirected > Node Degree’ to calculate the number of neighbors for each node.
To view the complete network, select the ‘Extracted Co-Authorship Network’ and run ‘Visualization > Networks > GUESS’.
Network is loaded with random layout. In GUESS, run ‘Layout > GEM’ and ‘Layout > Bin Pack’ to improve layout.
74
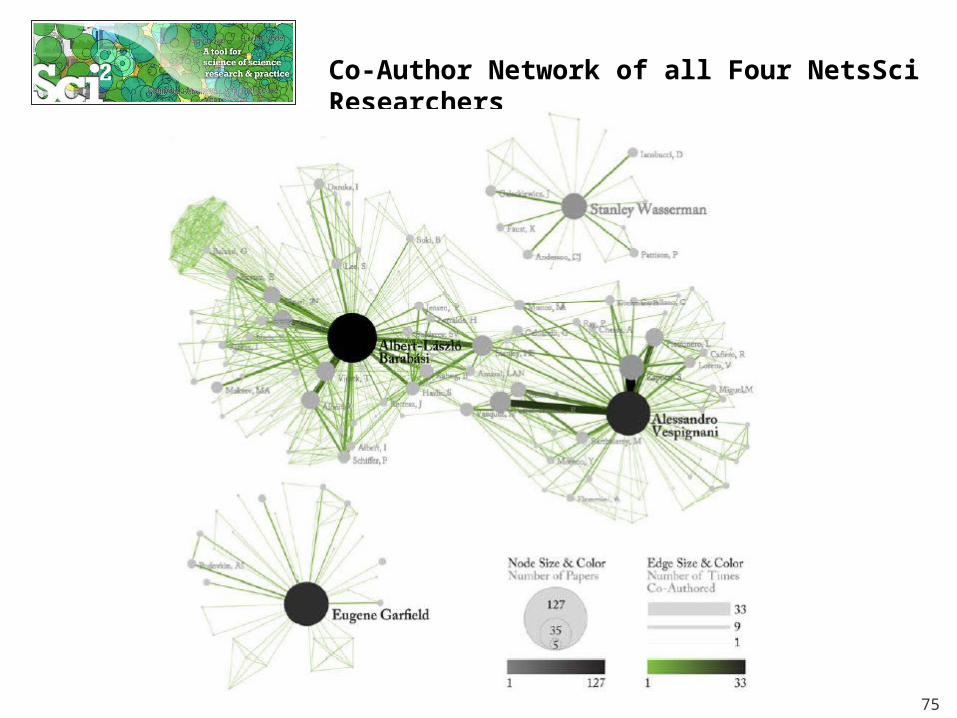
Co-Author Network of all Four NetsSci Researchers
75
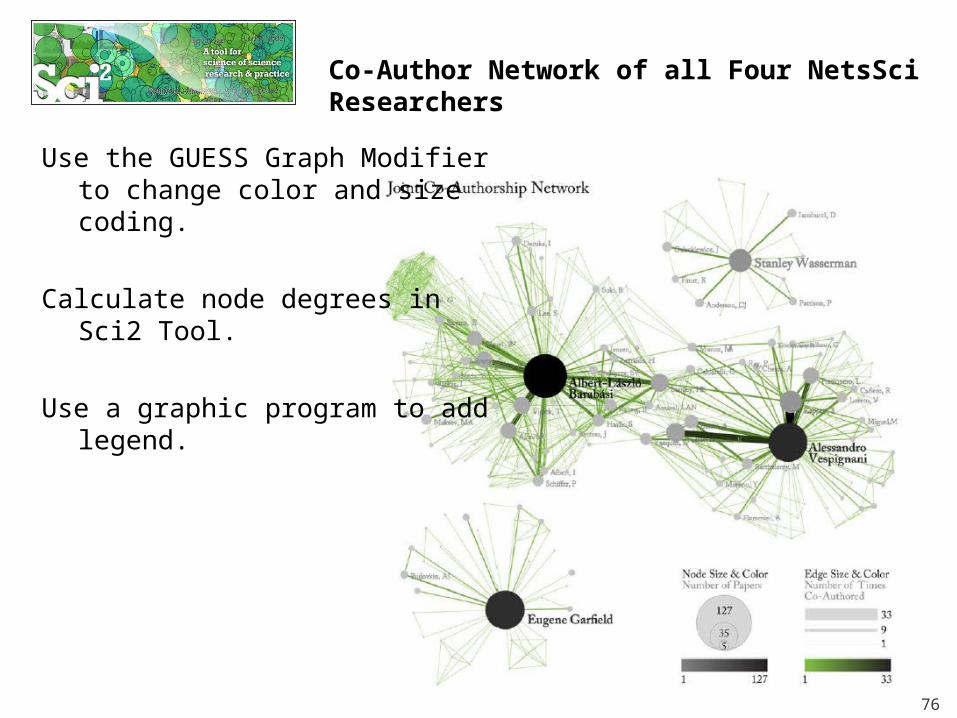
Co-Author Network of all Four NetsSci Researchers
76
Use the GUESS Graph Modifier to change color and size coding.
Calculate node degrees in Sci2 Tool.
Use a graphic program to add legend.
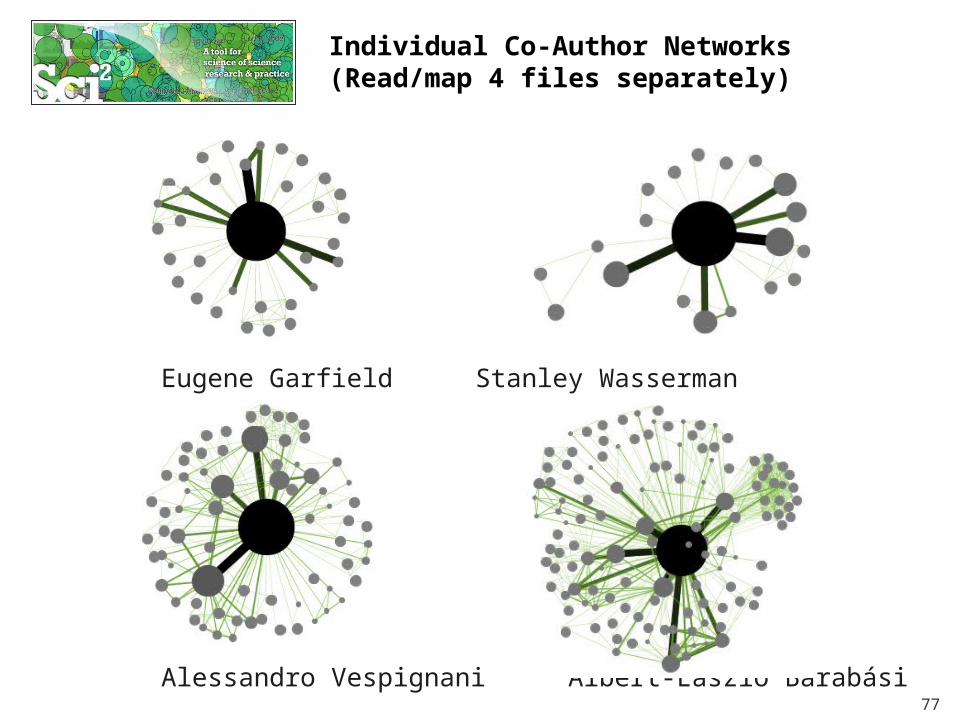
Individual Co-Author Networks (Read/map 4 files separately)
Eugene Garfield Stanley Wasserman
Alessandro Vespignani Albert-László Barabási77
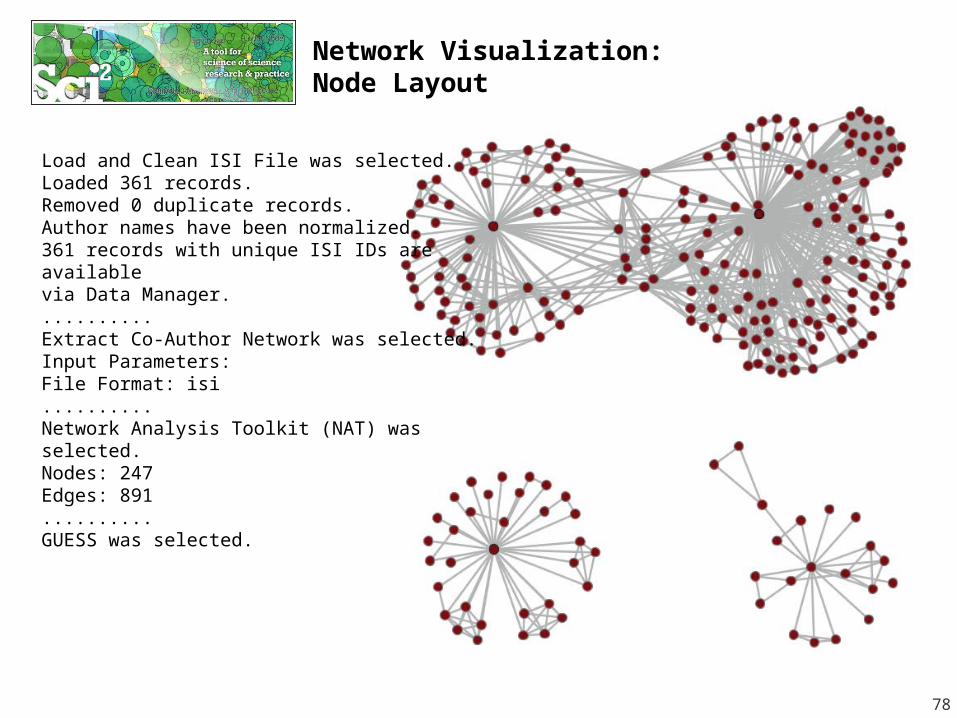
Network Visualization: Node Layout
78
Load and Clean ISI File was selected.Loaded 361 records.Removed 0 duplicate records.Author names have been normalized.361 records with unique ISI IDs are available via Data Manager...........Extract Co-Author Network was selected.Input Parameters:File Format: isi..........Network Analysis Toolkit (NAT) was selected.Nodes: 247Edges: 891..........GUESS was selected.
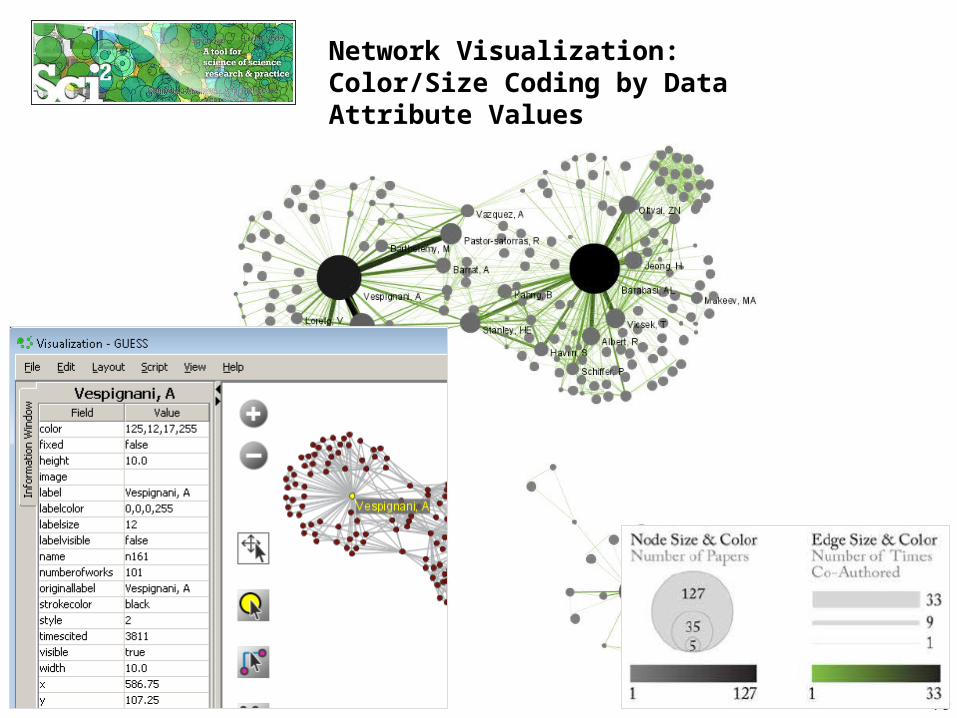
Network Visualization: Color/Size Coding by Data Attribute Values
79
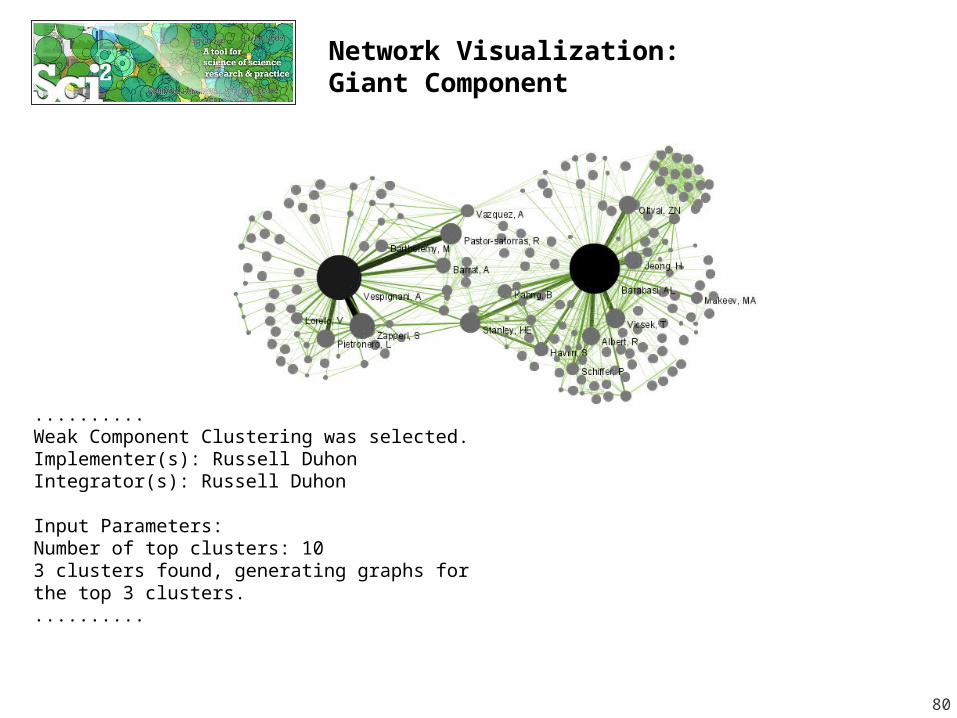
Network Visualization: Giant Component
80
..........Weak Component Clustering was selected.Implementer(s): Russell DuhonIntegrator(s): Russell Duhon
Input Parameters:Number of top clusters: 103 clusters found, generating graphs for the top 3 clusters...........
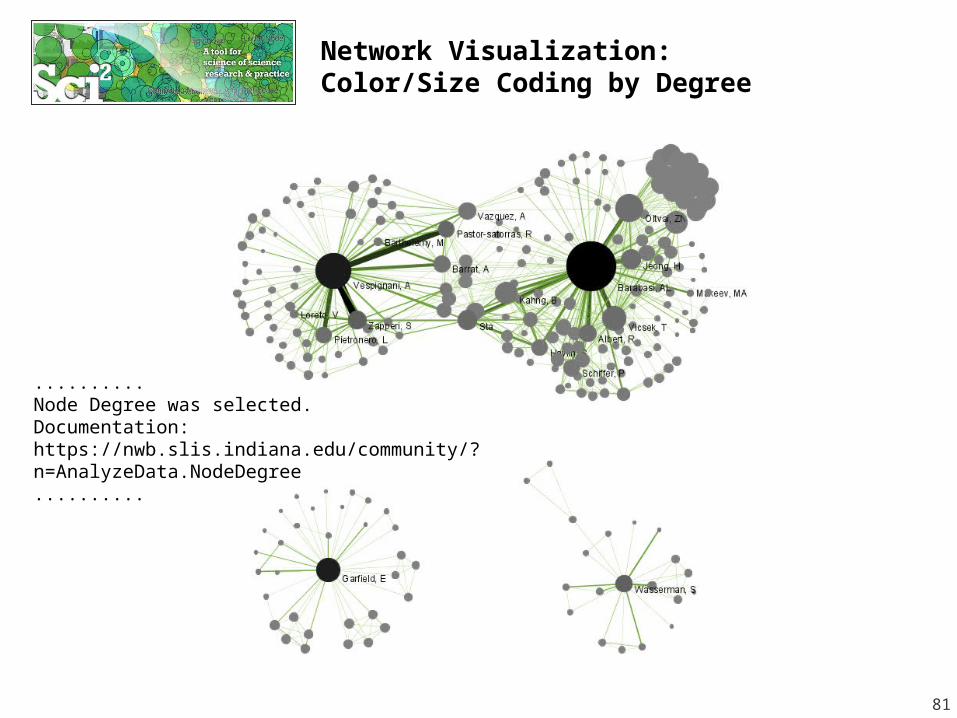
Network Visualization: Color/Size Coding by Degree
81
..........Node Degree was selected.Documentation: https://nwb.slis.indiana.edu/community/?n=AnalyzeData.NodeDegree..........
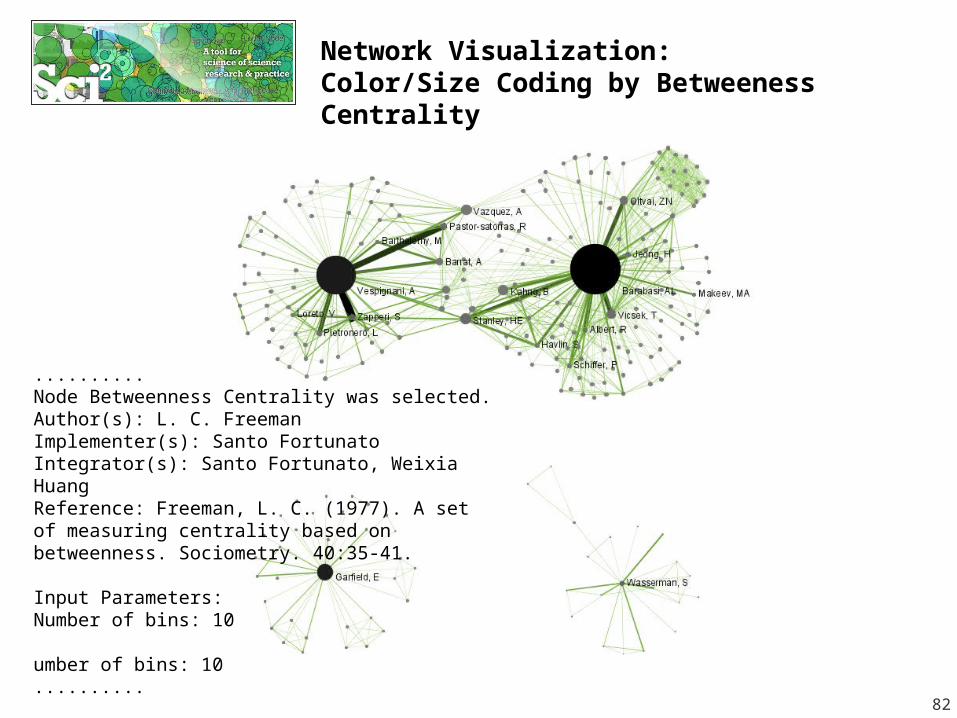
Network Visualization: Color/Size Coding by Betweeness Centrality
82
..........Node Betweenness Centrality was selected.Author(s): L. C. FreemanImplementer(s): Santo FortunatoIntegrator(s): Santo Fortunato, Weixia HuangReference: Freeman, L. C. (1977). A set of measuring centrality based on betweenness. Sociometry. 40:35-41.
Input Parameters:Number of bins: 10 umber of bins: 10..........
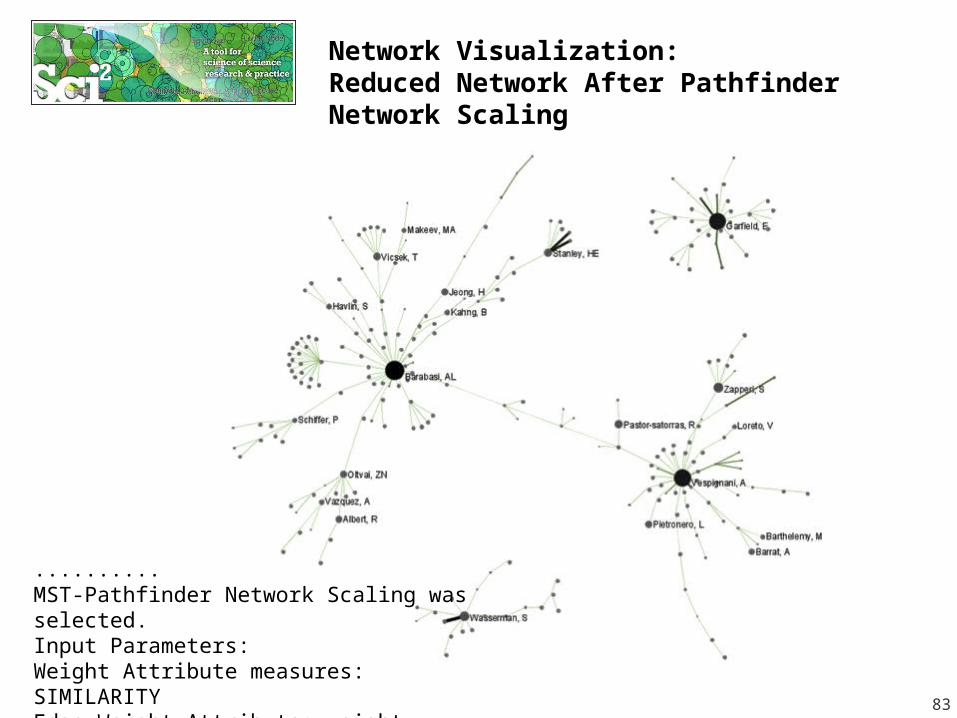
Network Visualization: Reduced Network After Pathfinder Network Scaling
83
..........MST-Pathfinder Network Scaling was selected.Input Parameters:Weight Attribute measures: SIMILARITYEdge Weight Attribute: weight..........
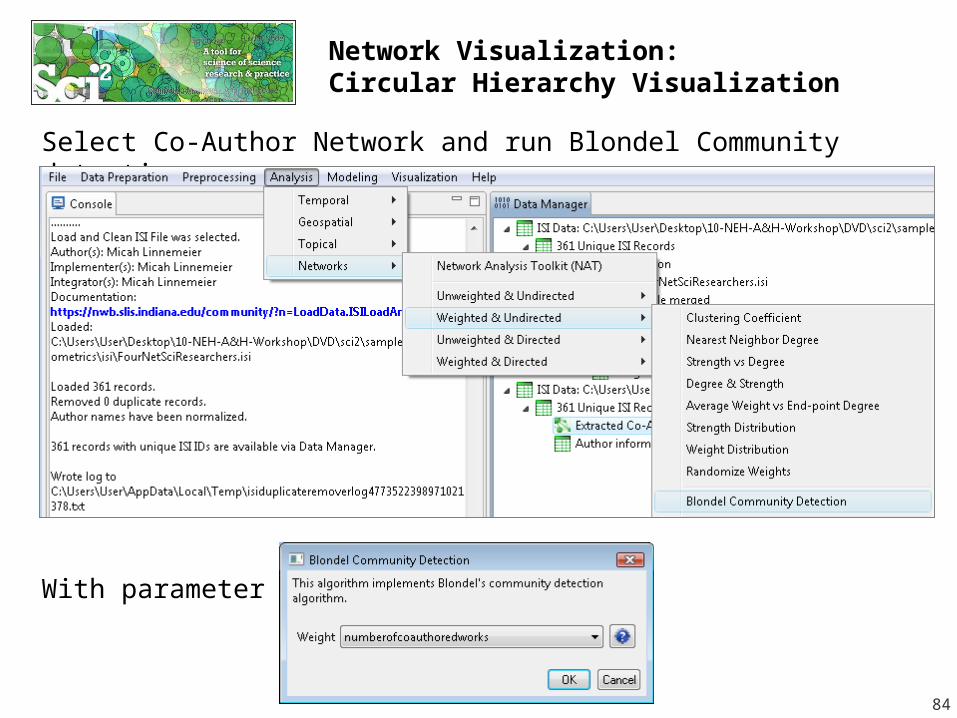
Network Visualization: Circular Hierarchy Visualization
84
Select Co-Author Network and run Blondel Community detection:
With parameter values
Network Visualization: Circular Hierarchy Visualization
85
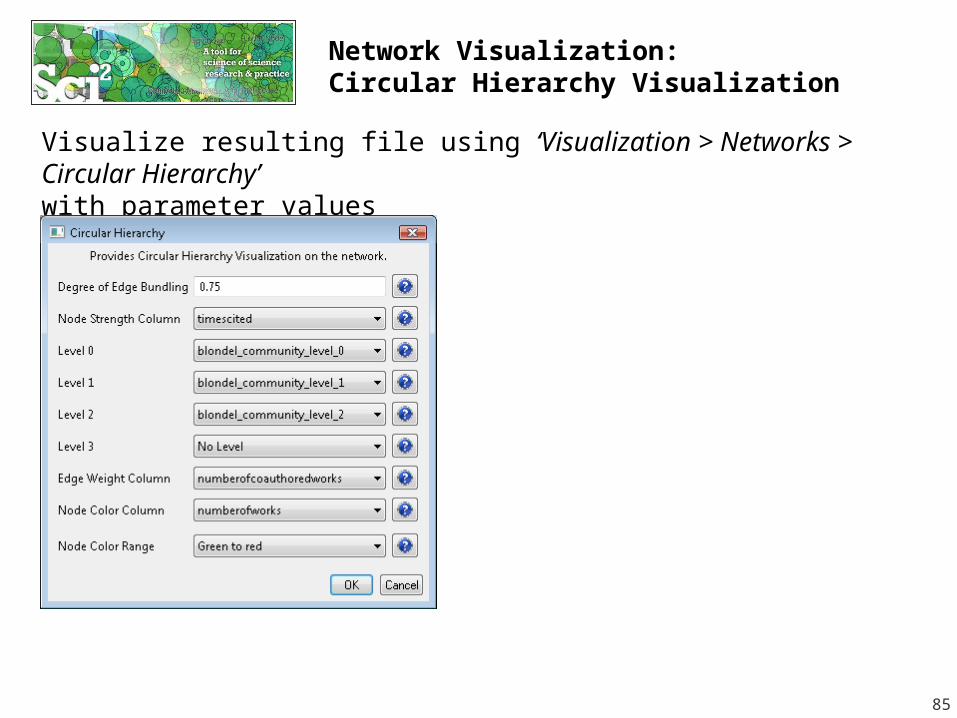
Visualize resulting file using ‘Visualization > Networks > Circular Hierarchy’with parameter values
Network Visualization: Circular Hierarchy Visualization
86
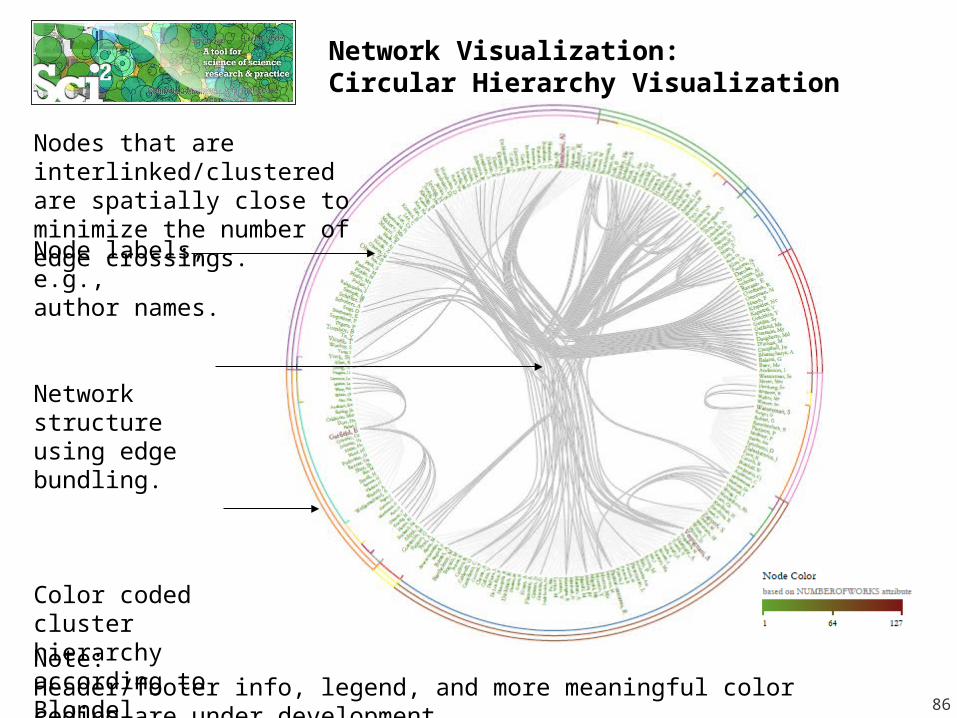
Node labels, e.g., author names.
Network structure using edge bundling.
Color coded cluster hierarchy according to Blondel community detection algorithm.
Note:Header/footer info, legend, and more meaningful color coding are under development.
Nodes that are interlinked/clustered are spatially close to minimize the number of edge crossings.
Paper-Citation Network Layout
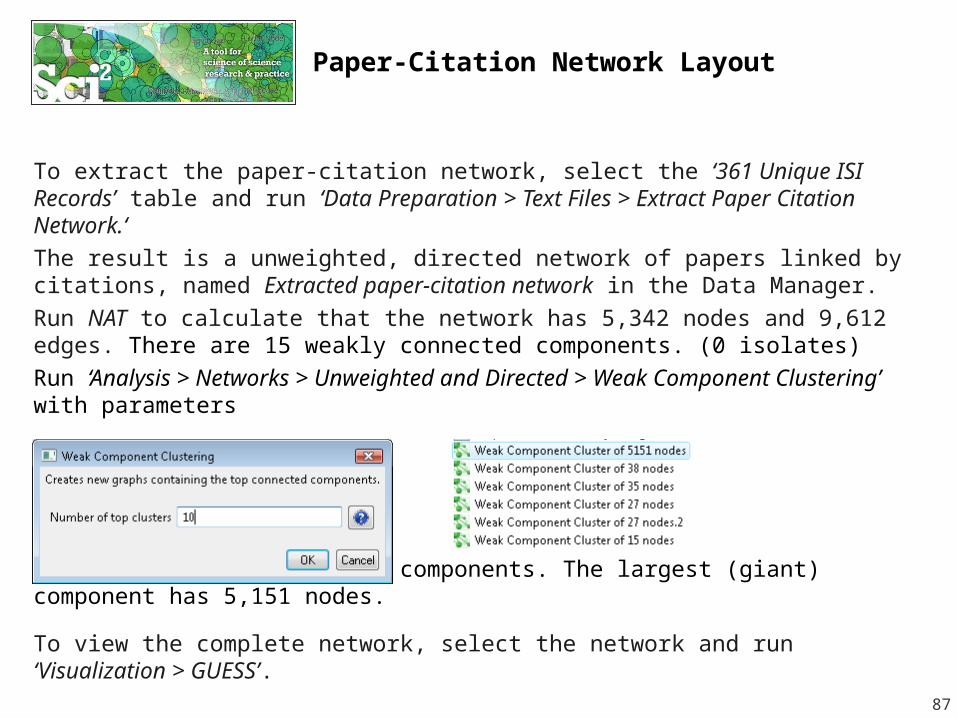
To extract the paper-citation network, select the ‘361 Unique ISI Records’ table and run ‘Data Preparation > Text Files > Extract Paper Citation Network.‘The result is a unweighted, directed network of papers linked by citations, named Extracted paper-citation network in the Data Manager.Run NAT to calculate that the network has 5,342 nodes and 9,612 edges. There are 15 weakly connected components. (0 isolates)Run ‘Analysis > Networks > Unweighted and Directed > Weak Component Clustering’ with parameters
to identify top-10 largest components. The largest (giant) component has 5,151 nodes.
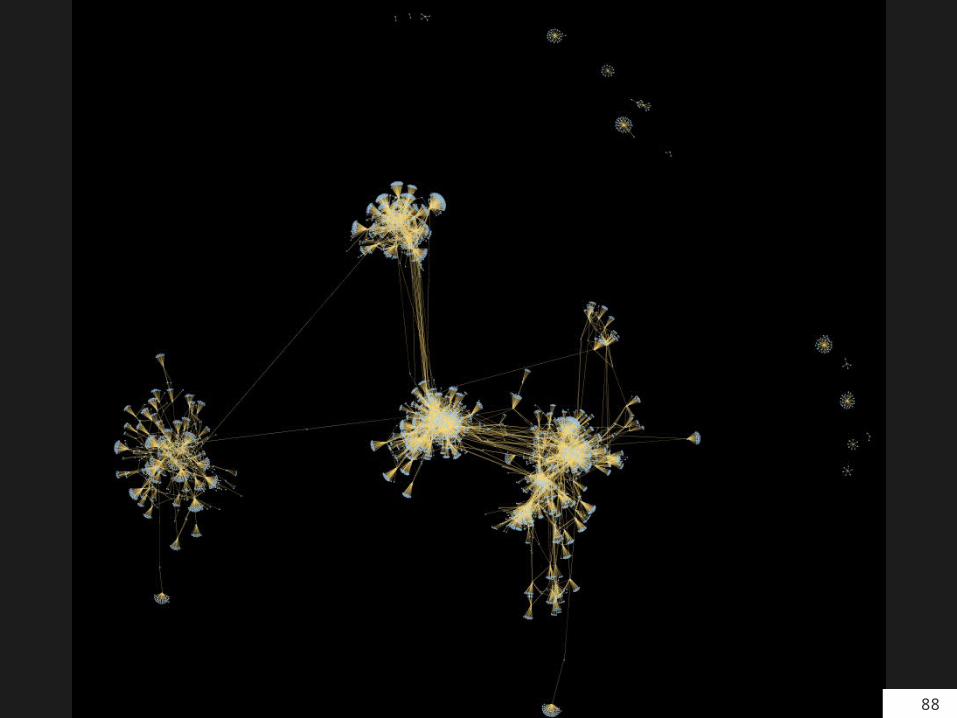
To view the complete network, select the network and run ‘Visualization > GUESS’.
87
88
Studying Four Major NetSci Researchers (ISI Data)
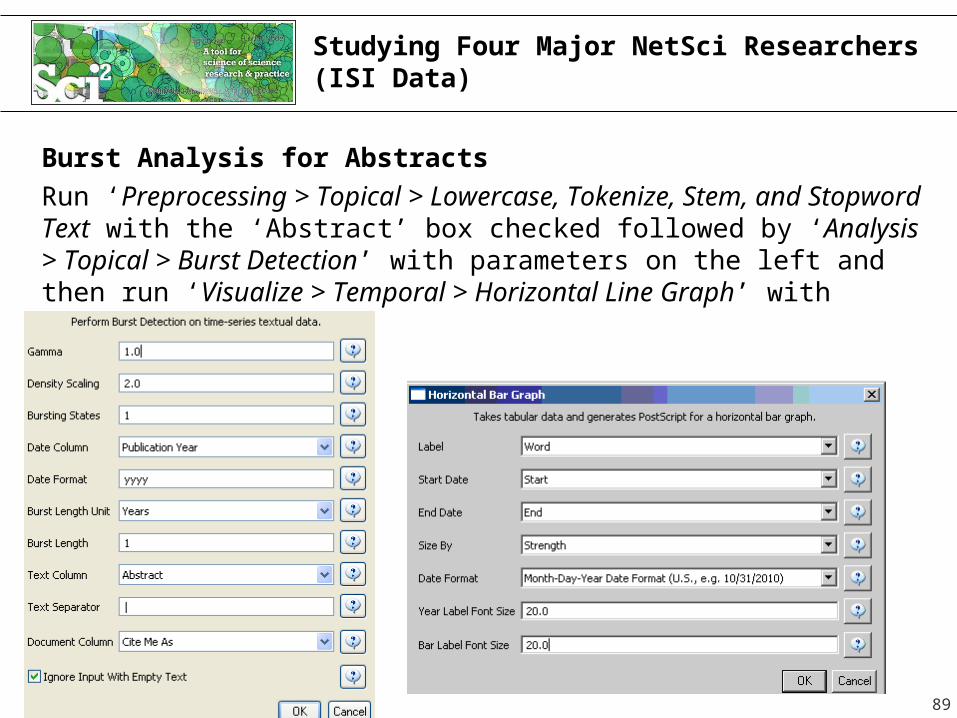
Burst Analysis for AbstractsRun ‘Preprocessing > Topical > Lowercase, Tokenize, Stem, and Stopword Text with the ‘Abstract’ box checked followed by ‘Analysis > Topical > Burst Detection’ with parameters on the left and then run ‘Visualize > Temporal > Horizontal Line Graph’ with parameters on right.
89
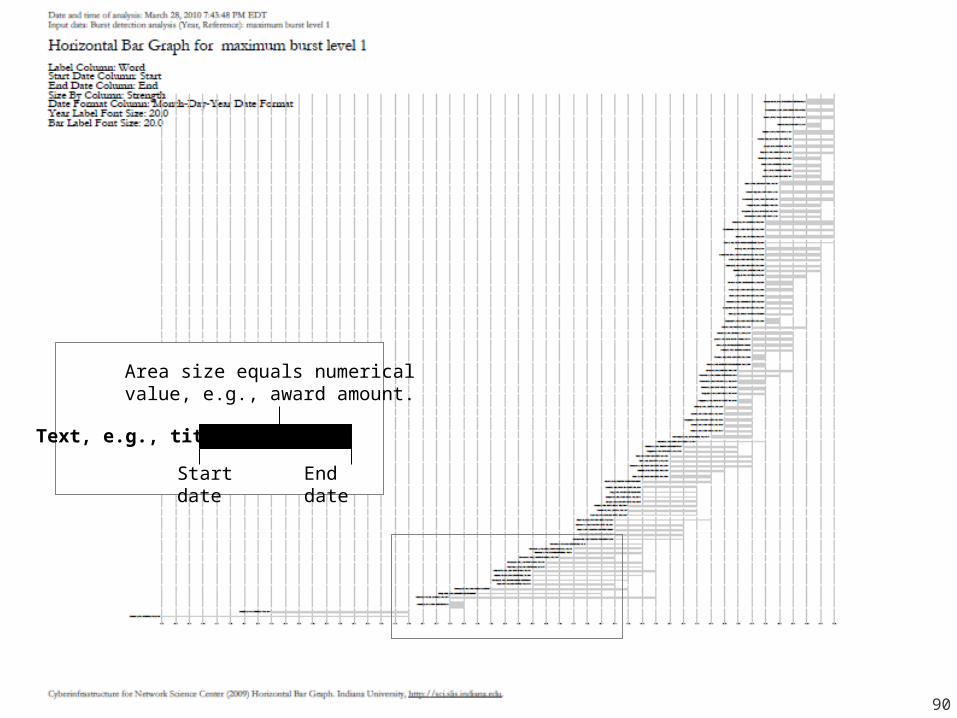
90
Start date
End date
Area size equals numerical value, e.g., award amount.
Text, e.g., title
Studying Four Major NetSci Researchers (ISI Data)
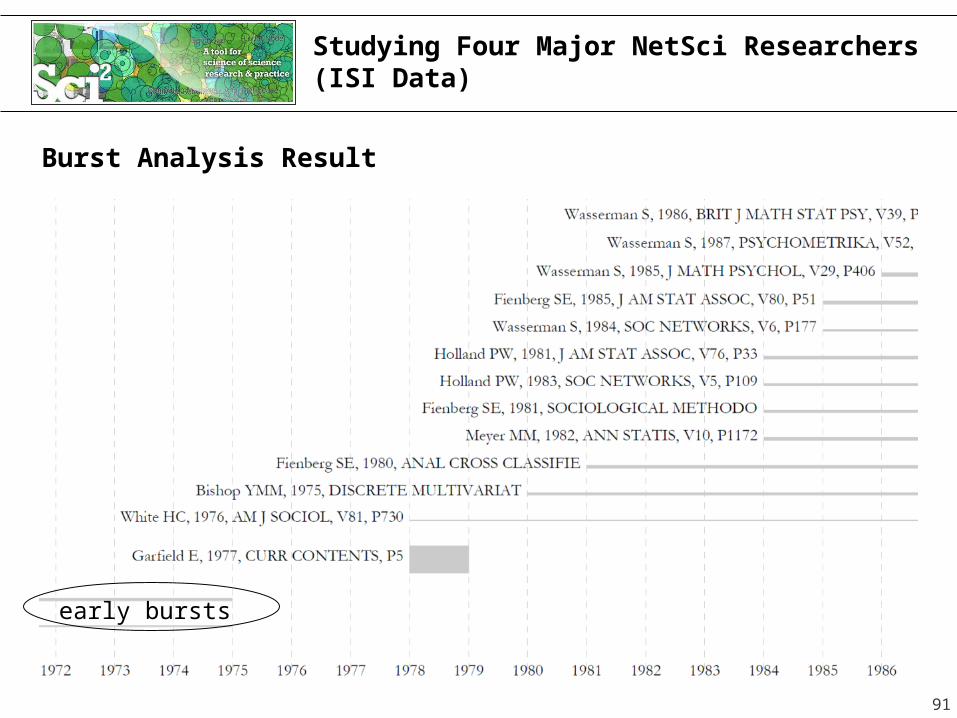
Burst Analysis Result
91
early bursts
1:00-1:15 Introduction to Network Analysis 1:15-1:45 Network Analysis & Visualization in the Humanities• Theory, Applications, and Pitfalls.• Examples In The Wild1:45-2:15 Collecting, Cleaning & Formatting Data2:15-2:25 Break2:25-3:00 Sci2 Tool Basics • Macroscope Design and Usage.• Download and run the tool.• Find basic statistics and run various algorithms over the
network.• Visualize the networks as either a graph or a circular hierarchy.3:00-3:20 Sci2 Workflow Design: Padgett's Florentine Families -
Prepare, load, analyze, and visualize family and business networks from 15th century Florence.
3:20-3:35 Break3:35-4:00 Sci2 Research Demonstration: Mapping the Republic of
Letters4:00-4:30 Q&A and Technical Assistance
Workshop Overview
92

Workflow Design:Padgett’s Florentine Families
93
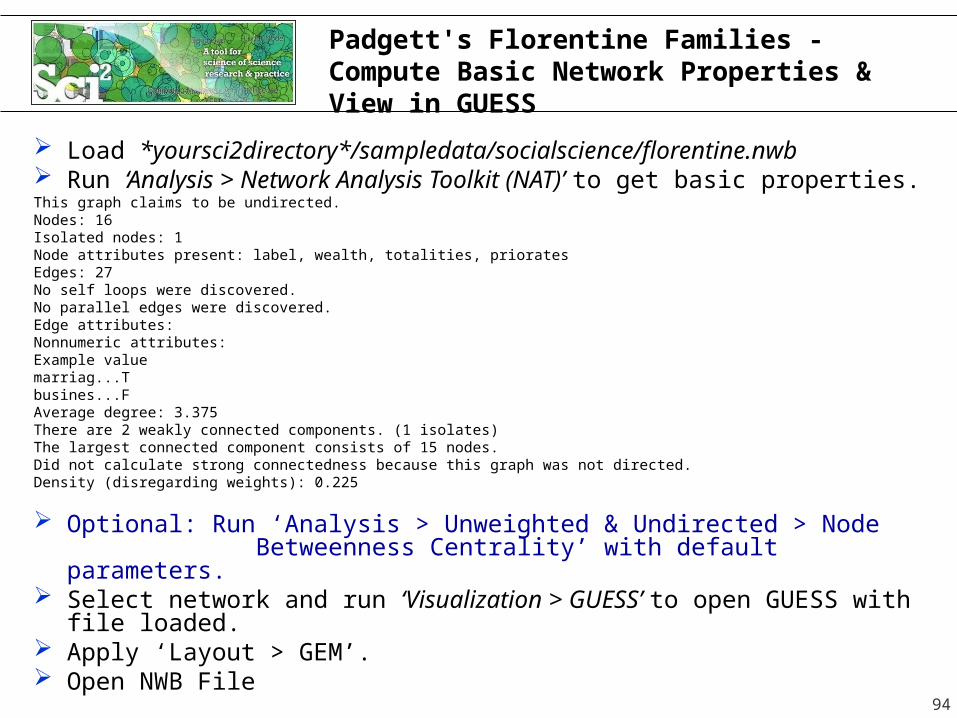
Padgett's Florentine Families - Compute Basic Network Properties & View in GUESS
Load *yoursci2directory*/sampledata/socialscience/florentine.nwb Run ‘Analysis > Network Analysis Toolkit (NAT)’ to get basic
properties.This graph claims to be undirected.Nodes: 16Isolated nodes: 1Node attributes present: label, wealth, totalities, prioratesEdges: 27No self loops were discovered.No parallel edges were discovered.Edge attributes:Nonnumeric attributes:Example valuemarriag...Tbusines...FAverage degree: 3.375There are 2 weakly connected components. (1 isolates)The largest connected component consists of 15 nodes.Did not calculate strong connectedness because this graph was not directed.Density (disregarding weights): 0.225
Optional: Run ‘Analysis > Unweighted & Undirected > Node Betweenness Centrality’ with default
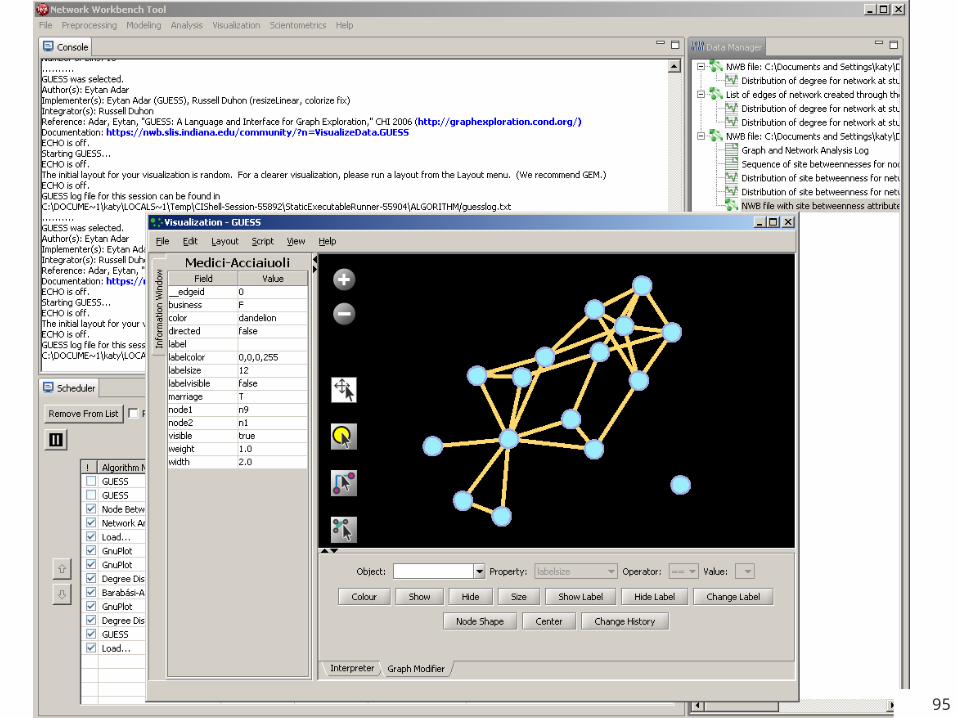
parameters. Select network and run ‘Visualization > GUESS’ to open GUESS
with file loaded. Apply ‘Layout > GEM’. Open NWB File
94
95
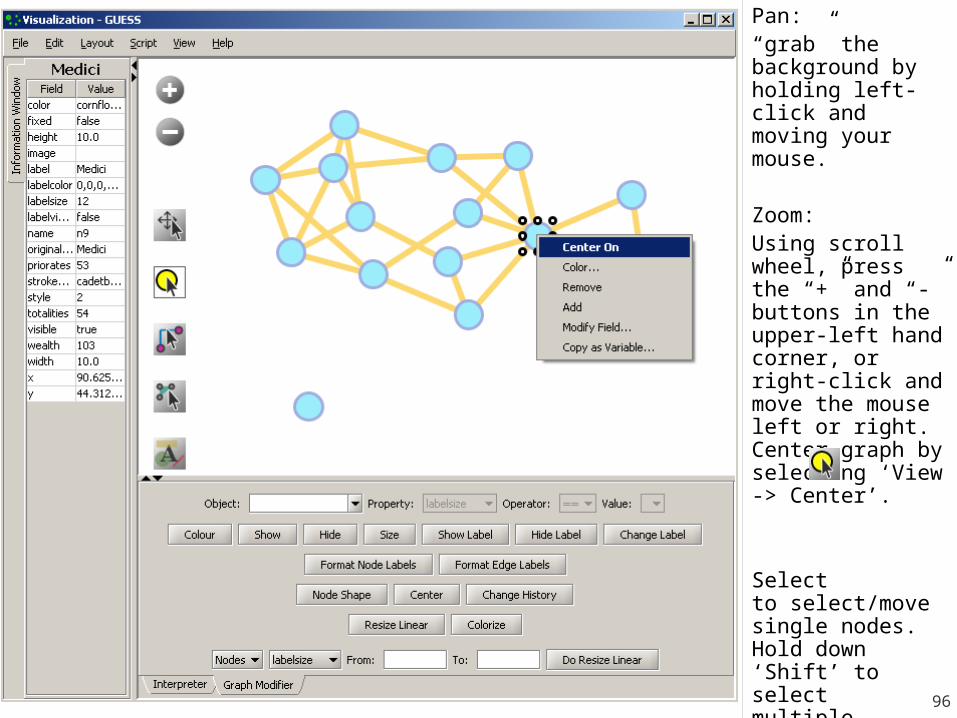
Pan:“grab” the background by holding left-click and moving your mouse.
Zoom:Using scroll wheel, press the “+” and “-” buttons in the upper-left hand corner, or right-click and move the mouse left or right. Center graph by selecting ‘View -> Center’.
Select to select/move single nodes. Hold down ‘Shift’ to select multiple.
Right click to modify Color, etc.
96
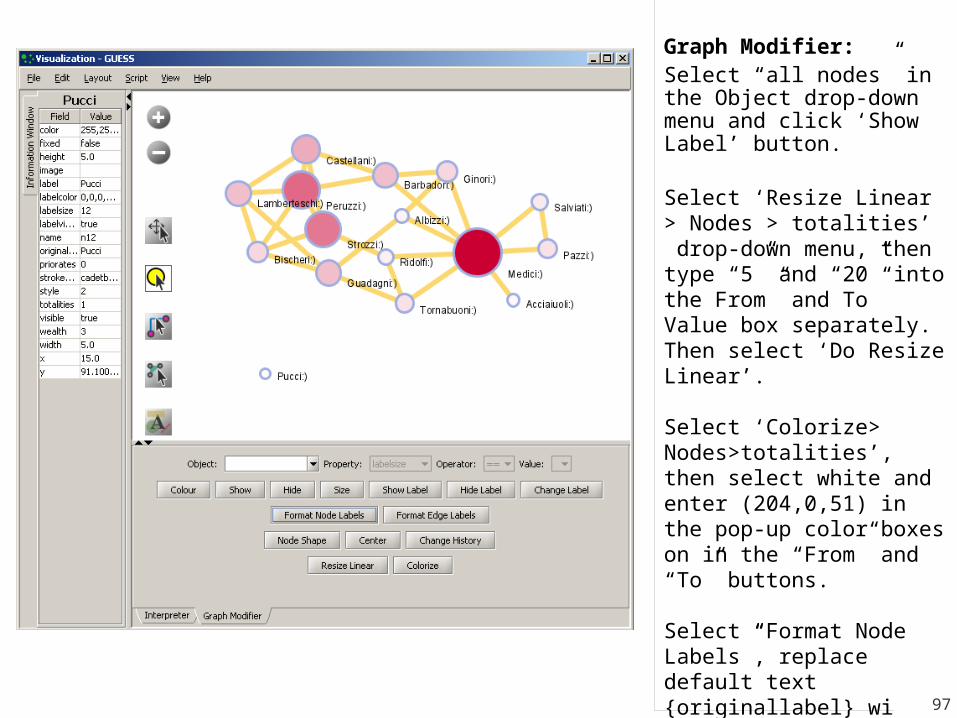
Graph Modifier:Select “all nodes” in the Object drop-down menu and click ‘Show Label’ button.
Select ‘Resize Linear > Nodes > totalities’ drop-down menu, then type “5” and “20” into the From” and To” Value box separately. Then select ‘Do Resize Linear’.
Select ‘Colorize> Nodes>totalities’, then select white and enter (204,0,51) in the pop-up color boxes on in the “From” and “To” buttons.
Select “Format Node Labels”, replace default text {originallabel} with your own label in the pop-up box ‘Enter a formatting string for node labels.’
97
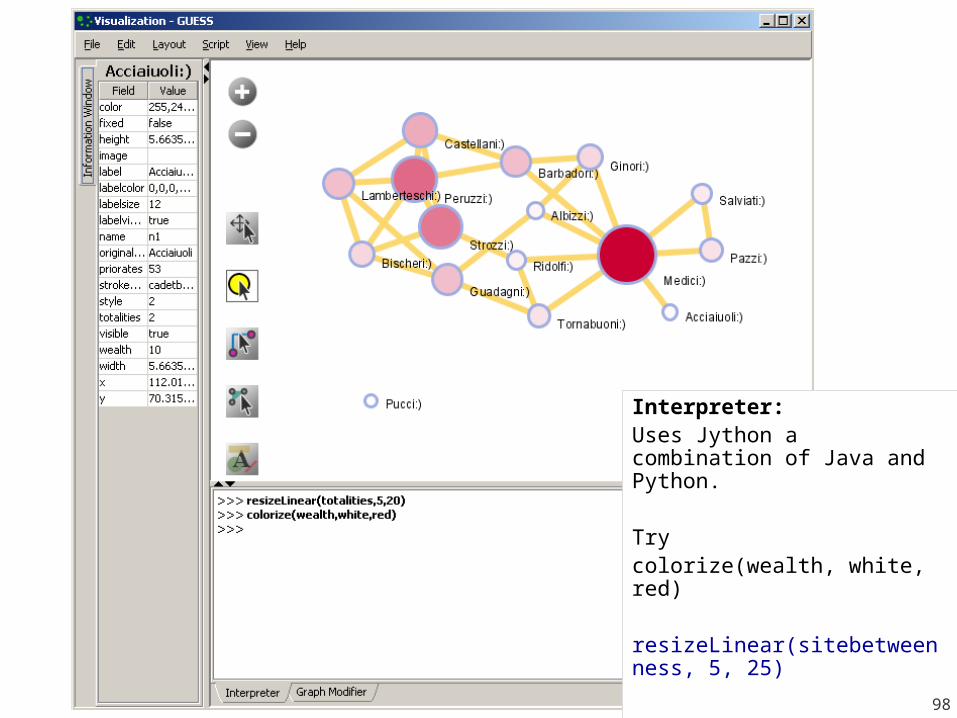
Interpreter:Uses Jython a combination of Java and Python.
Trycolorize(wealth, white, red)
resizeLinear(sitebetweenness, 5, 25)
98
1:00-1:15 Introduction to Network Analysis 1:15-1:45 Network Analysis & Visualization in the Humanities• Theory, Applications, and Pitfalls.• Examples In The Wild1:45-2:15 Collecting, Cleaning & Formatting Data2:15-2:25 Break2:25-3:00 Sci2 Tool Basics • Macroscope Design and Usage.• Download and run the tool.• Find basic statistics and run various algorithms over the
network.• Visualize the networks as either a graph or a circular hierarchy.3:00-3:20 Sci2 Workflow Design: Padgett's Florentine Families -
Prepare, load, analyze, and visualize family and business networks from 15th century Florence.
3:20-3:35 Break3:35-4:00 Sci2 Research Demonstration: Mapping the Republic of
Letters4:00-4:30 Q&A and Technical Assistance
Workshop Overview
99
1:00-1:15 Introduction to Network Analysis 1:15-1:45 Network Analysis & Visualization in the Humanities• Theory, Applications, and Pitfalls.• Examples In The Wild1:45-2:15 Collecting, Cleaning & Formatting Data2:15-2:25 Break2:25-3:00 Sci2 Tool Basics • Macroscope Design and Usage.• Download and run the tool.• Find basic statistics and run various algorithms over the
network.• Visualize the networks as either a graph or a circular hierarchy.3:00-3:20 Sci2 Workflow Design: Padgett's Florentine Families -
Prepare, load, analyze, and visualize family and business networks from 15th century Florence.
3:20-3:35 Break3:35-4:00 Sci2 Research Demonstration: Mapping the Republic of
Letters4:00-4:30 Q&A and Technical Assistance
Workshop Overview
100
Sci2 Research Demonstration:Mapping the Republic of Letters
101
Mapping the Republic of Letters
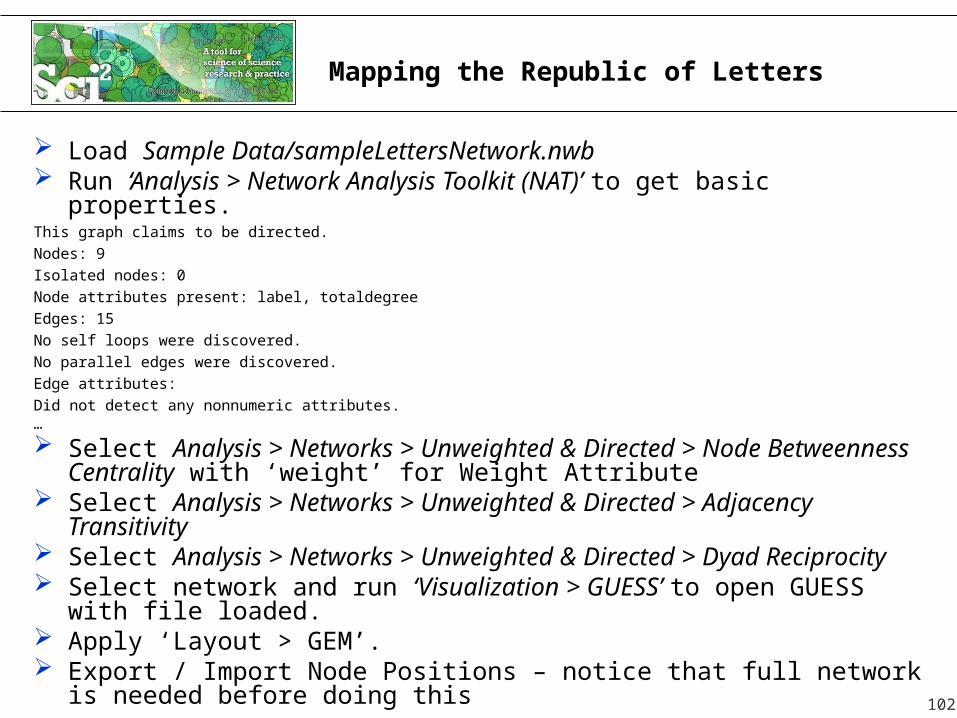
Load Sample Data/sampleLettersNetwork.nwb Run ‘Analysis > Network Analysis Toolkit (NAT)’ to get basic
properties.This graph claims to be directed.
Nodes: 9
Isolated nodes: 0
Node attributes present: label, totaldegree
Edges: 15
No self loops were discovered.
No parallel edges were discovered.
Edge attributes:
Did not detect any nonnumeric attributes.…
Select Analysis > Networks > Unweighted & Directed > Node Betweenness Centrality with ‘weight’ for Weight Attribute
Select Analysis > Networks > Unweighted & Directed > Adjacency Transitivity
Select Analysis > Networks > Unweighted & Directed > Dyad Reciprocity
Select network and run ‘Visualization > GUESS’ to open GUESS with file loaded.
Apply ‘Layout > GEM’. Export / Import Node Positions – notice that full network is needed
before doing this 102
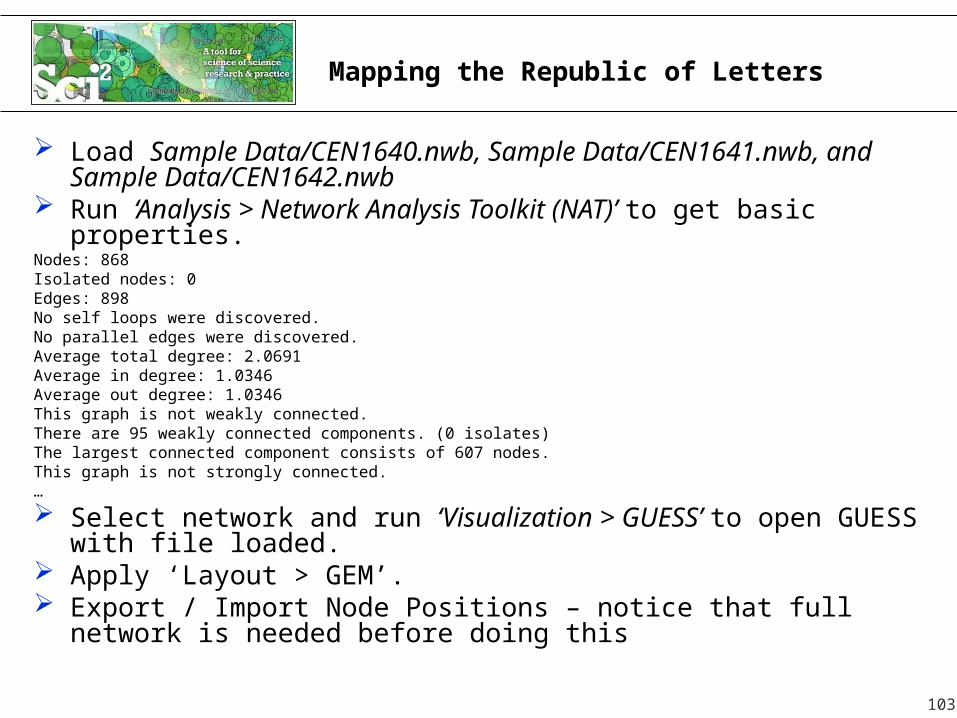
Mapping the Republic of Letters
Load Sample Data/CEN1640.nwb, Sample Data/CEN1641.nwb, and Sample Data/CEN1642.nwb
Run ‘Analysis > Network Analysis Toolkit (NAT)’ to get basic properties.
Nodes: 868Isolated nodes: 0Edges: 898No self loops were discovered.No parallel edges were discovered.Average total degree: 2.0691Average in degree: 1.0346Average out degree: 1.0346This graph is not weakly connected.There are 95 weakly connected components. (0 isolates)The largest connected component consists of 607 nodes.This graph is not strongly connected.…
Select network and run ‘Visualization > GUESS’ to open GUESS with file loaded.
Apply ‘Layout > GEM’. Export / Import Node Positions – notice that full network is
needed before doing this
103
1:00-1:15 Introduction to Network Analysis 1:15-1:45 Network Analysis & Visualization in the Humanities• Theory, Applications, and Pitfalls.• Examples In The Wild1:45-2:15 Collecting, Cleaning & Formatting Data2:15-2:25 Break2:25-3:00 Sci2 Tool Basics • Macroscope Design and Usage.• Download and run the tool.• Find basic statistics and run various algorithms over the
network.• Visualize the networks as either a graph or a circular hierarchy.3:00-3:20 Sci2 Workflow Design: Padgett's Florentine Families -
Prepare, load, analyze, and visualize family and business networks from 15th century Florence.
3:20-3:35 Break3:35-4:00 Sci2 Research Demonstration: Mapping the Republic of
Letters4:00-4:30 Q&A and Technical Assistance
Workshop Overview
104
Geographic Visualizations
Word Co-Occurrence Analysis
Your Data
Possible Workflows
105
106
Extraneous Slides Adding Plugins to CIShell Powered
Tools OSGi/CIShell Adoption
107
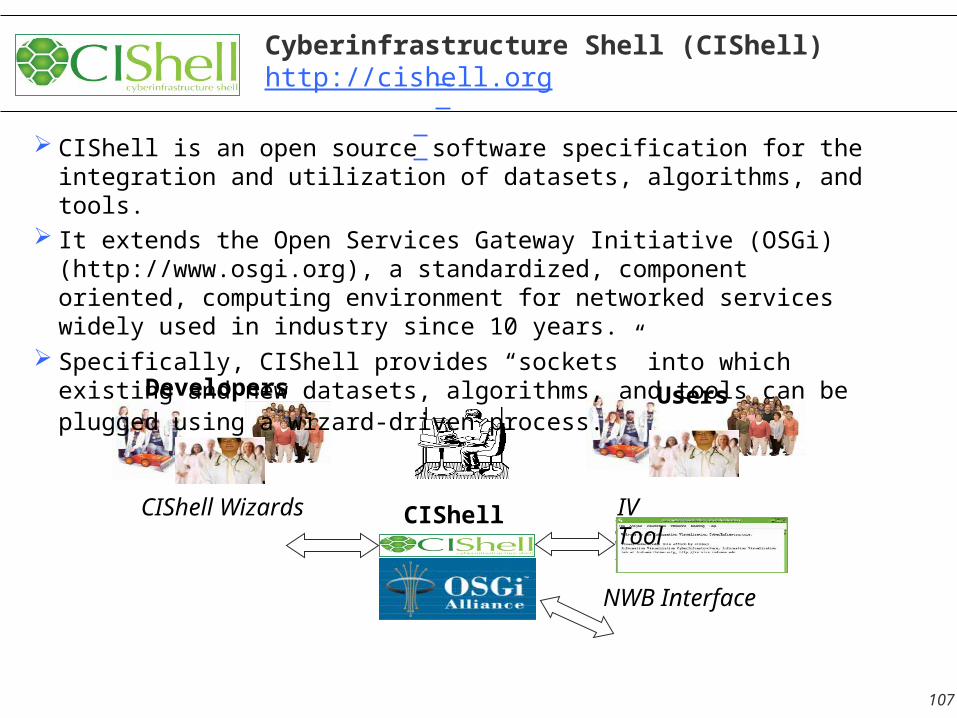
Cyberinfrastructure Shell (CIShell) http://cishell.org
CIShell IV Tool
NWB Interface
CIShell Wizards
Developers
CIShell is an open source software specification for the integration and utilization of datasets, algorithms, and tools.
It extends the Open Services Gateway Initiative (OSGi) (http://www.osgi.org), a standardized, component oriented, computing environment for networked services widely used in industry since 10 years.
Specifically, CIShell provides “sockets” into which existing and new datasets, algorithms, and tools can be plugged using a wizard-driven process. Users
CIShell – Builds on OSGi Industry Standard
CIShell is built upon the Open Services Gateway Initiative (OSGi) Framework.
OSGi (http://www.osgi.org) is A standardized, component oriented, computing environment for
networked services. Successfully used in the industry from high-end servers to
embedded mobile devices since 8 years. Alliance members include IBM (Eclipse), Sun, Intel, Oracle,
Motorola, NEC and many others. Widely adopted in open source realm, especially since Eclipse 3.0
that uses OSGi R4 for its plugin model.
Advantages of Using OSGi Any CIShell algorithm is a service that can be used in any OSGi-
framework based system. Using OSGi, running CIShells/tools can connected via RPC/RMI
supporting peer-to-peer sharing of data, algorithms, and computing power.
Ideally, CIShell becomes a standard for creating OSGi Services for algorithms.
108
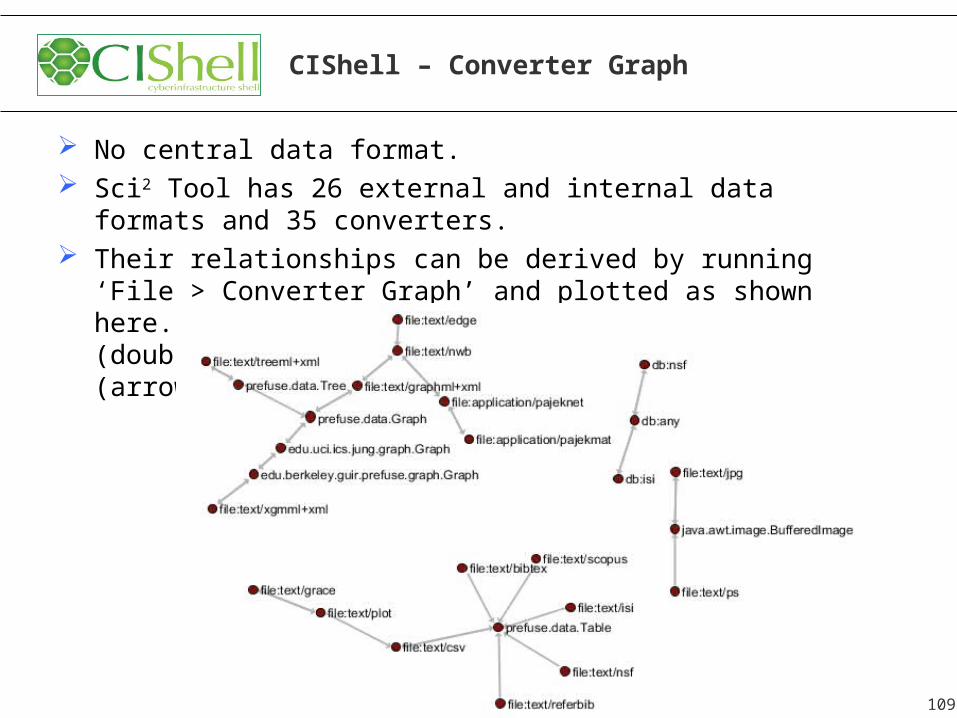
CIShell – Converter Graph
No central data format. Sci2 Tool has 26 external and internal data formats and 35
converters. Their relationships can be derived by running ‘File >
Converter Graph’ and plotted as shown here. Note that some conversions are symmetrical (double arrow) while others are one-directional (arrow).
109
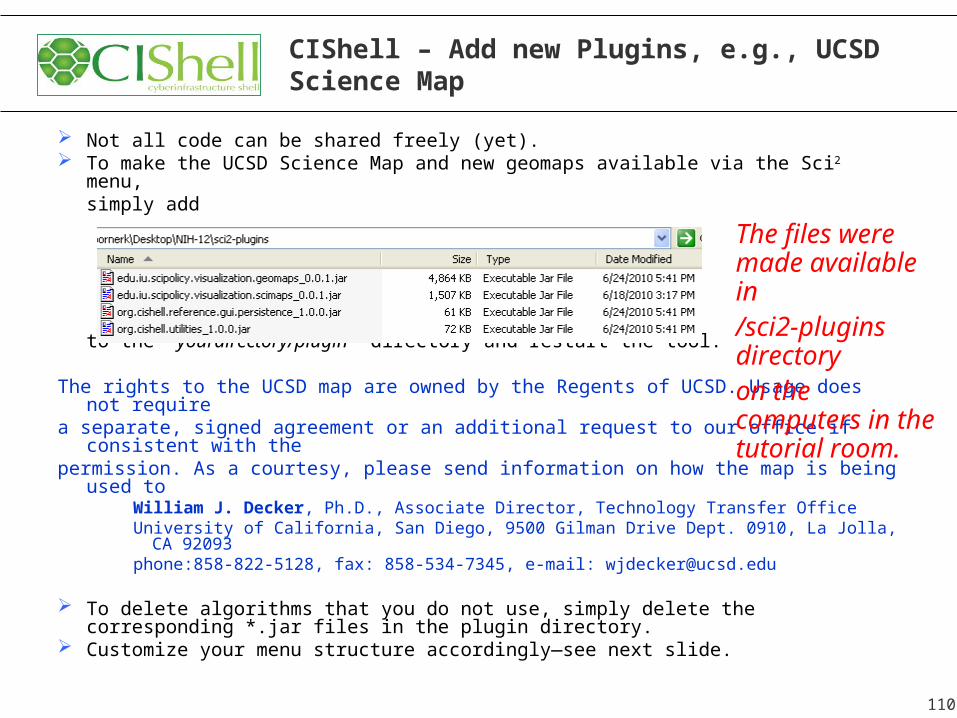
CIShell – Add new Plugins, e.g., UCSD Science Map
Not all code can be shared freely (yet). To make the UCSD Science Map and new geomaps available via the Sci2 menu,
simply add
to the ‘yourdirectory/plugin’ directory and restart the tool.
The rights to the UCSD map are owned by the Regents of UCSD. Usage does not require
a separate, signed agreement or an additional request to our office if consistent with the
permission. As a courtesy, please send information on how the map is being used to
William J. Decker, Ph.D., Associate Director, Technology Transfer OfficeUniversity of California, San Diego, 9500 Gilman Drive Dept. 0910, La Jolla, CA
92093phone:858-822-5128, fax: 858-534-7345, e-mail: [email protected]
To delete algorithms that you do not use, simply delete the corresponding *.jar files in the plugin directory.
Customize your menu structure accordingly—see next slide.
110
The files were made available in /sci2-plugins directory on the computers in the tutorial room.
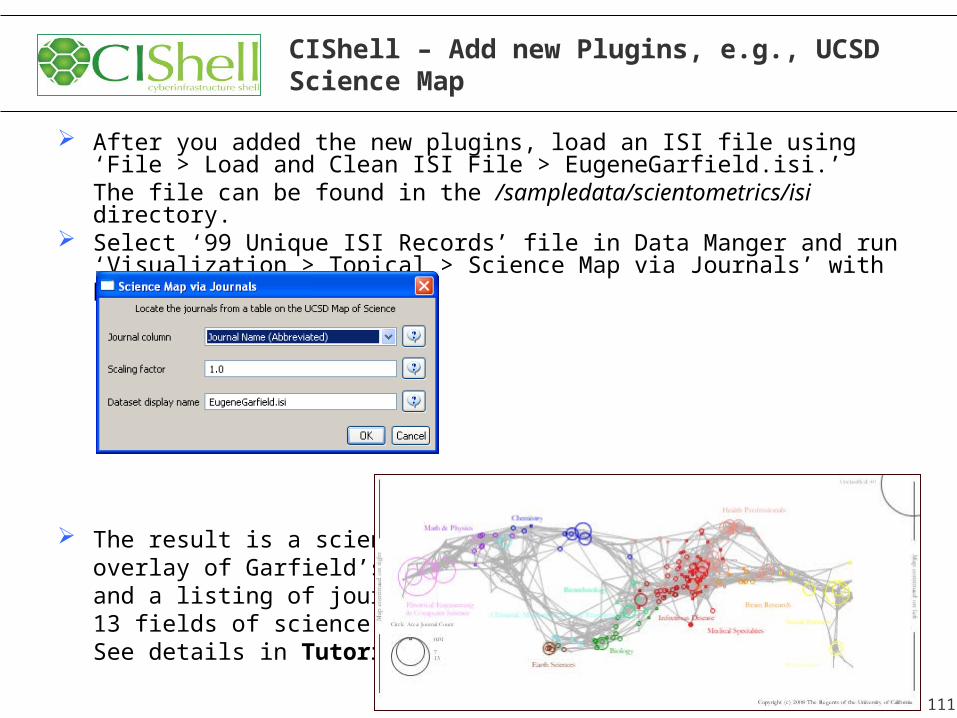
CIShell – Add new Plugins, e.g., UCSD Science Map
After you added the new plugins, load an ISI file using ‘File > Load and Clean ISI File > EugeneGarfield.isi.’ The file can be found in the /sampledata/scientometrics/isi directory.
Select ‘99 Unique ISI Records’ file in Data Manger and run ‘Visualization > Topical > Science Map via Journals’ with parameters:
The result is a science map overlay of Garfield’s papers and a listing of journals in 13 fields of science below.See details in Tutorial #6.
111
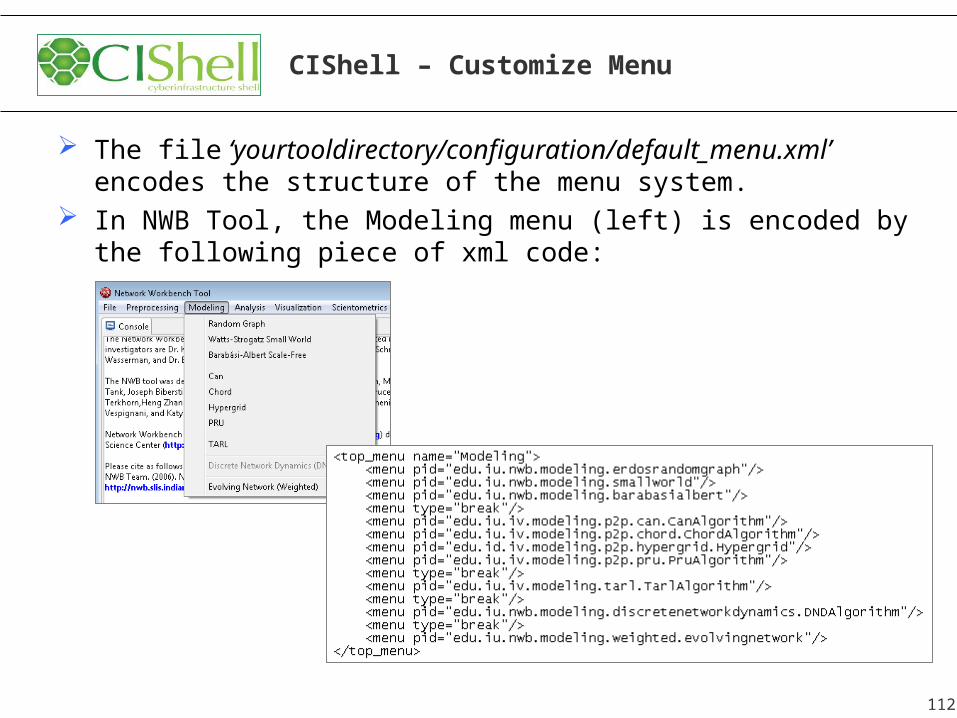
CIShell – Customize Menu
The file ‘yourtooldirectory/configuration/default_menu.xml’ encodes the structure of the menu system.
In NWB Tool, the Modeling menu (left) is encoded by the following piece of xml code:
112
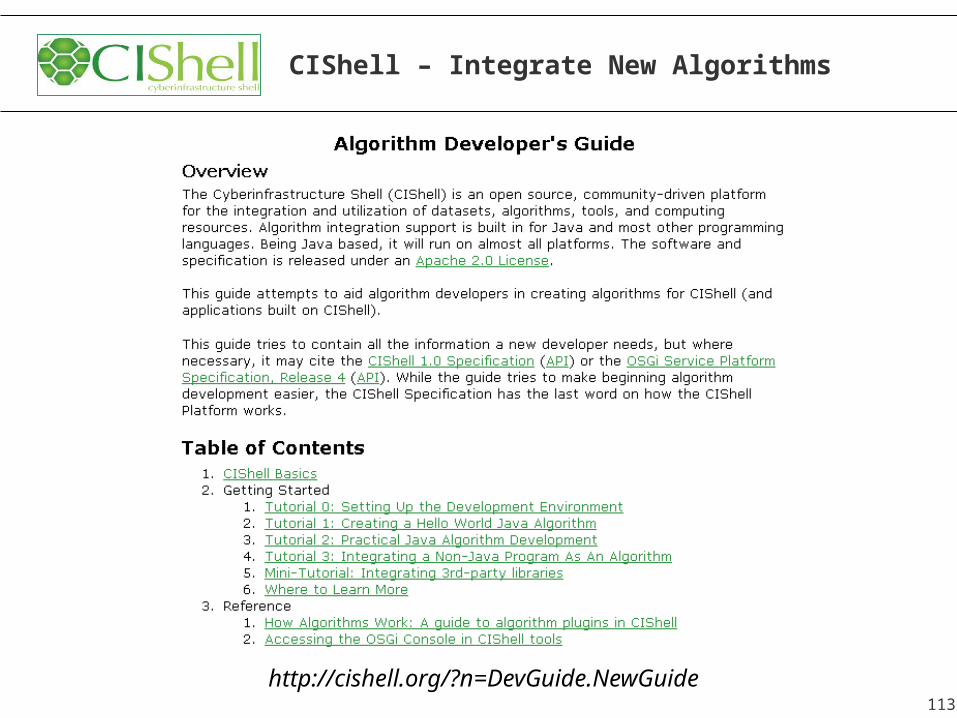
CIShell – Integrate New Algorithms
http://cishell.org/?n=DevGuide.NewGuide 113
OSGi/CIShell Adoption
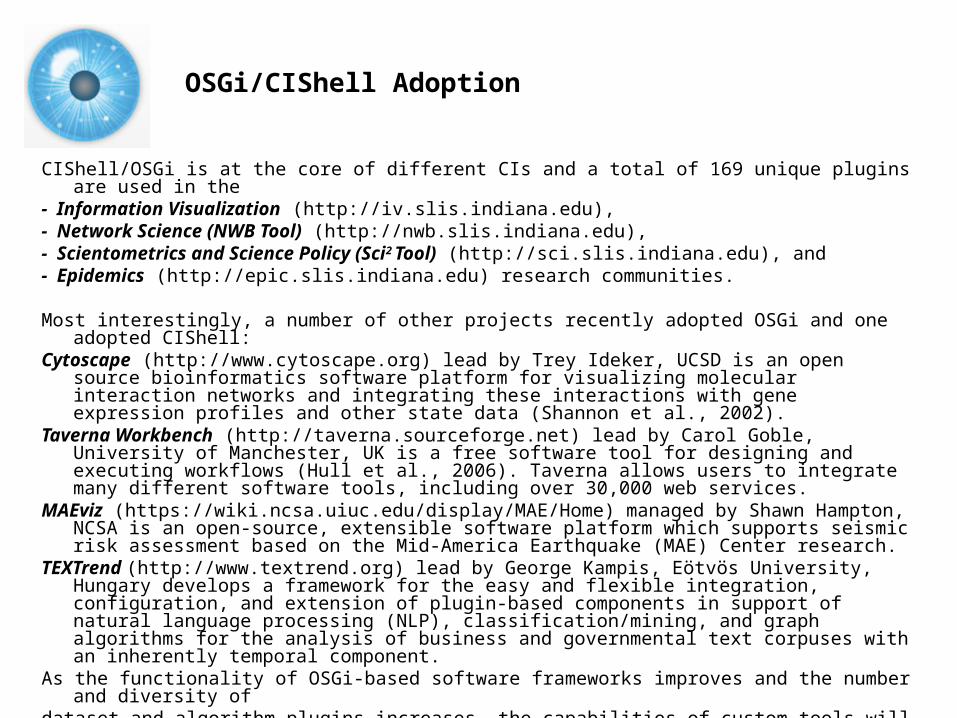
CIShell/OSGi is at the core of different CIs and a total of 169 unique plugins are used in the
- Information Visualization (http://iv.slis.indiana.edu), - Network Science (NWB Tool) (http://nwb.slis.indiana.edu), - Scientometrics and Science Policy (Sci2 Tool) (http://sci.slis.indiana.edu), and - Epidemics (http://epic.slis.indiana.edu) research communities.
Most interestingly, a number of other projects recently adopted OSGi and one adopted CIShell:
Cytoscape (http://www.cytoscape.org) lead by Trey Ideker, UCSD is an open source bioinformatics software platform for visualizing molecular interaction networks and integrating these interactions with gene expression profiles and other state data (Shannon et al., 2002).
Taverna Workbench (http://taverna.sourceforge.net) lead by Carol Goble, University of Manchester, UK is a free software tool for designing and executing workflows (Hull et al., 2006). Taverna allows users to integrate many different software tools, including over 30,000 web services.
MAEviz (https://wiki.ncsa.uiuc.edu/display/MAE/Home) managed by Shawn Hampton, NCSA is an open-source, extensible software platform which supports seismic risk assessment based on the Mid-America Earthquake (MAE) Center research.
TEXTrend (http://www.textrend.org) lead by George Kampis, Eötvös University, Hungary develops a framework for the easy and flexible integration, configuration, and extension of plugin-based components in support of natural language processing (NLP), classification/mining, and graph algorithms for the analysis of business and governmental text corpuses with an inherently temporal component.
As the functionality of OSGi-based software frameworks improves and the number and diversity of
dataset and algorithm plugins increases, the capabilities of custom tools will expand.
The Changing Scientific Landscape
Star Scientist -> Research Teams might have 100 or more members & exist few months only.
Users -> Contributors students, faculty, practitioners.Disciplinary -> Cross-disciplinary with different cultures, languages,
approaches.One Specimen -> Data Streams updated nightly or even more frequently
High Quality Open Data Scholarly Database: 23 million scholarly records http://sdb.slis.indiana.edu VIVO National Researcher Networking http://vivoweb.org
Static Instrument -> Evolving Cyberinfrastructure (CI) daily learning and documentation.
Macroscopes can make a major difference if they support:Division of Labor – proper incentive structures are key.Ease of Use – learn from YouTube, Flickr, WikipediaModularity – plug-and-play helps reduce costs; increases flexibility,
augmentation, customizationStandardization – speeds up ‘translation’ into products/practice.Open Data and Open Code – use the minds of millions!
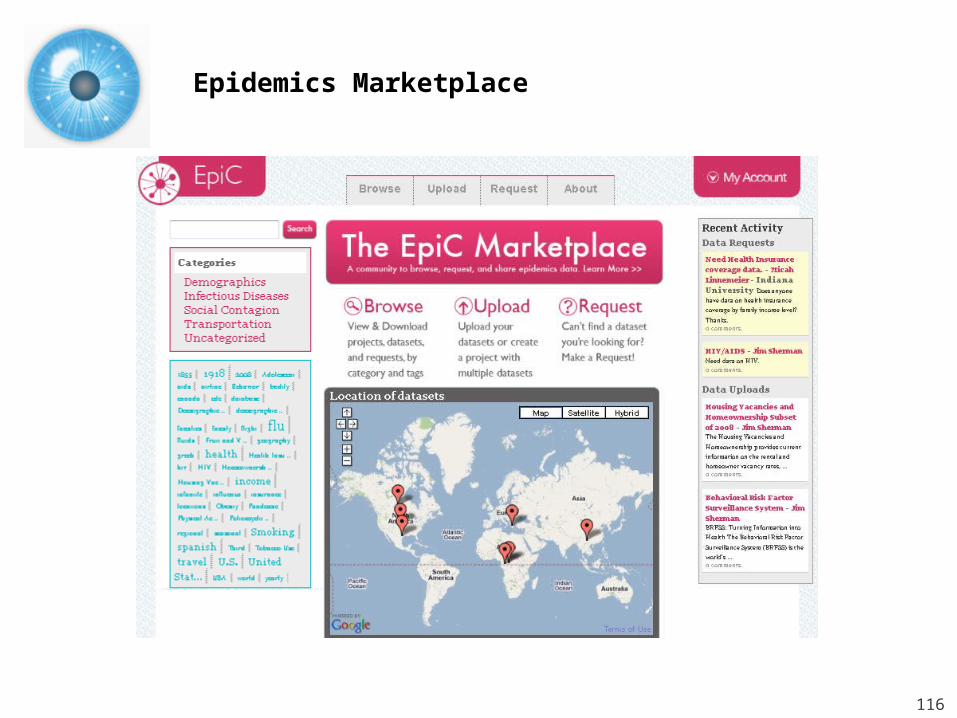
http://dev.epic.slis.indiana.edu
Epidemics Marketplace
116
All papers, maps, cyberinfrastructures, talks, press are linked from http://cns.slis.indiana.edu
117
Related Documents