Publication Analysis Services in Libraries: What, Why, and How Ya-Ling Lu and Chris Belter Informationists, NIH Library October 14, 2016

Welcome message from author
This document is posted to help you gain knowledge. Please leave a comment to let me know what you think about it! Share it to your friends and learn new things together.
Transcript

Publication Analysis Services in Libraries:
What, Why, and How
Ya-Ling Lu and Chris Belter
Informationists, NIH Library
October 14, 2016
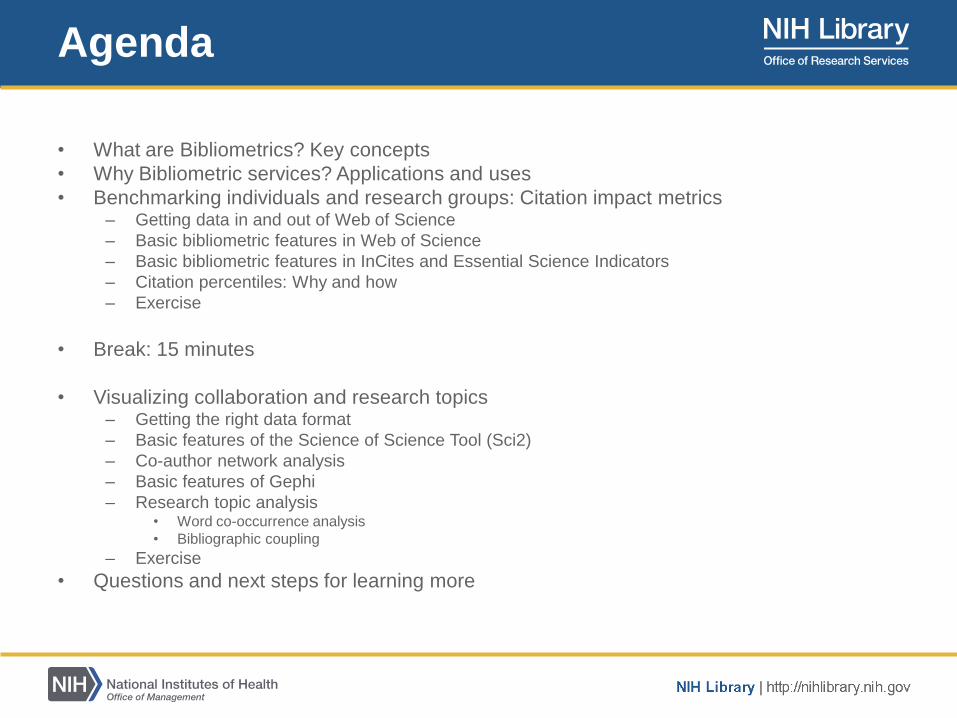
• What are Bibliometrics? Key concepts
• Why Bibliometric services? Applications and uses
• Benchmarking individuals and research groups: Citation impact metrics– Getting data in and out of Web of Science
– Basic bibliometric features in Web of Science
– Basic bibliometric features in InCites and Essential Science Indicators
– Citation percentiles: Why and how
– Exercise
• Break: 15 minutes
• Visualizing collaboration and research topics– Getting the right data format
– Basic features of the Science of Science Tool (Sci2)
– Co-author network analysis
– Basic features of Gephi
– Research topic analysis• Word co-occurrence analysis
• Bibliographic coupling
– Exercise
• Questions and next steps for learning more
Agenda

What are bibliometrics?
Bibliometrics are quantitative methods of studying
scientific research using publications as a proxy for
research
Bibliometrics
Impact &
Evaluation

A set of tools
A statistical approach
Analysis of structure, dynamics, patterns.
Rationale for policies & design
Bibliometrics are

History of science
Sociology of science
Library science (collection, weeding, policies)
Information organization & management; IR
Science policy; resource allocation
It has applications in

We are part of its history.
We have skills in IS, IR, and KM.
We have provided annotated bibliographies and topic summaries for decades.
We are trusted to provide accurate and unbiased information.
We provide customized information services.
Why librarians?
What can bibliometric analyses do?
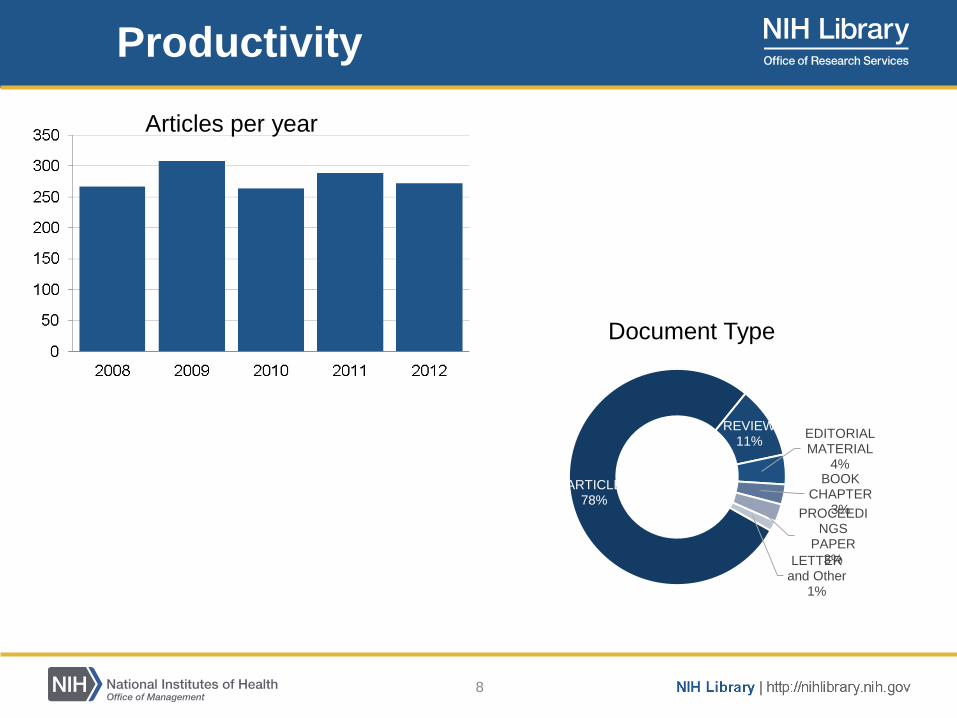
Productivity
Articles per year
8
ARTICLE78%
REVIEW11%
EDITORIAL MATERIAL
4%BOOK
CHAPTER3%PROCEEDI
NGS PAPER
3%LETTER and Other
1%
Document Type
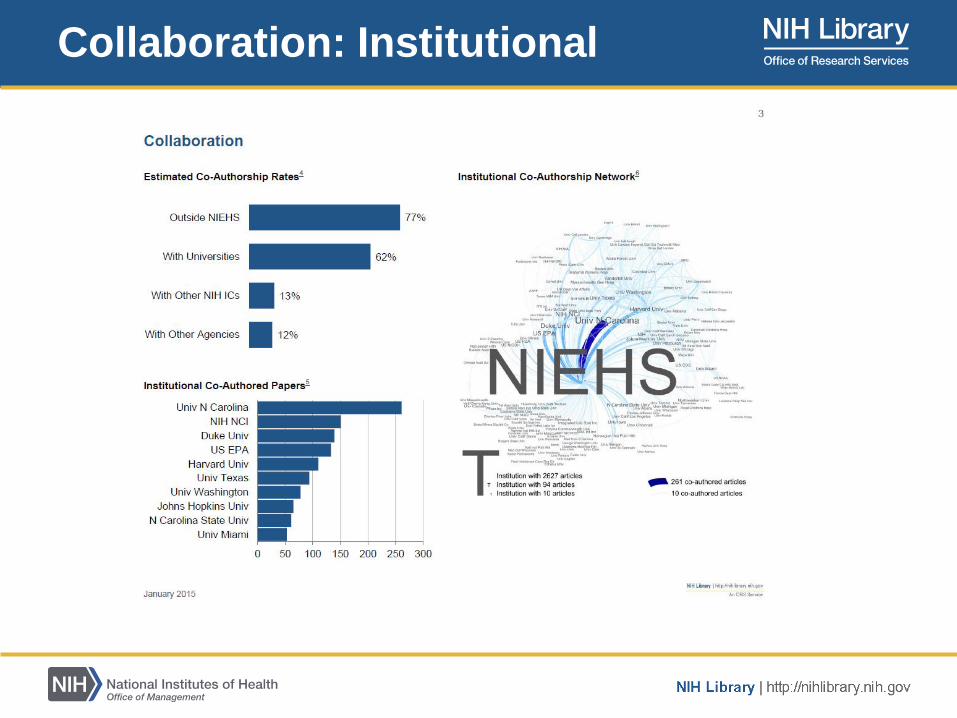
Collaboration: Institutional
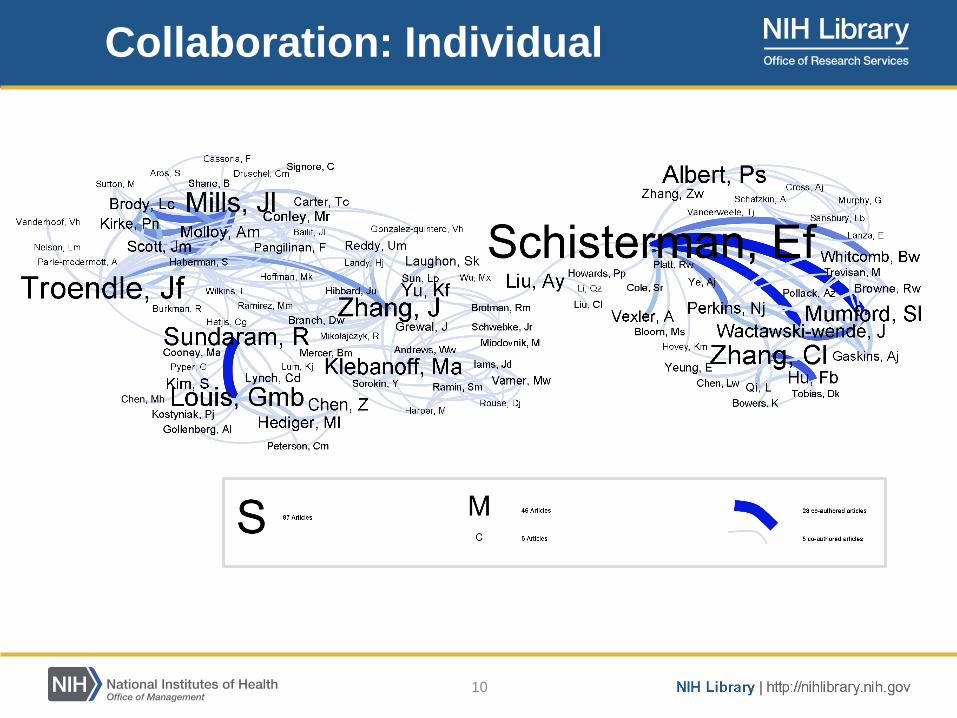
Collaboration: Individual
10

Research topics
11
0 100 200 300 400 500 600 700
MEDICINE RESEARCH EXPERIMENTAL
BIOPHYSICS
GENETICS HEREDITY
PHARMACOLOGY PHARMACY
GASTROENTEROLOGY HEPATOLOGY
MULTIDISCIPLINARY SCIENCES
UROLOGY NEPHROLOGY
CELL BIOLOGY
ENDOCRINOLOGY METABOLISM
BIOCHEMISTRY MOLECULAR BIOLOGY
Major MeSH 2005 2006 2007 2008 2009 2010 2011 2012 2013 2014 Total
Wounds and Injuries 0 2 1 3 4 9 5 6 3 4 37
Suicide/attempted suicide/suicidal ideation 0 0 0 4 2 4 3 5 3 0 21
Alcohol-Related Disorders/Alcoholism/Alcohol drinking 0 0 0 1 2 4 2 6 3 0 18
Accidents/Traffic accidents 0 0 0 1 3 6 2 2 2 2 18
Emergency Medical Services 0 0 0 2 0 0 1 4 1 1 9
Occupational Exposure/Occupational Diseases/Occupational accidents 0 1 1 0 1 1 1 0 2 1 8
Agriculture/Agricultural Workers' Disease 0 1 1 0 1 1 1 1 1 1 8
Brain Injuries 0 0 0 0 2 2 1 2 1 0 8
Impulsive Behavior 0 0 0 1 1 1 0 2 2 0 7
Health education/Health knowledge/Health personnel 0 0 0 3 1 0 1 0 2 0 7
Population Surveillance 0 0 0 1 0 1 0 3 0 1 6
Polymorphism 0 0 0 0 1 0 1 2 2 0 6
Rural Population/Rural Health Services 0 0 1 0 2 2 0 0 0 0 5
Developing Countries 0 0 0 1 0 1 0 1 2 0 5
Mental health/Mental disorders 0 0 0 1 0 1 0 1 1 1 5
Social adjustment/Social control/Social support 0 0 0 1 0 0 1 0 2 0 4
Receptor, Serotonin, 5-HT1A/genetics 0 0 0 0 0 0 1 2 1 0 4
Sleep Disorders 0 0 0 0 1 1 1 1 0 0 4
Automobile Driving 0 0 1 1 1 0 0 0 1 0 4
Abdominal injuries 0 0 0 0 0 0 2 2 0 0 4

Citation impact

DEMO: How?
Getting data in and out of WOS
Citation Impact: Percentile ranking
using InCites and ESI

15
Percentiles
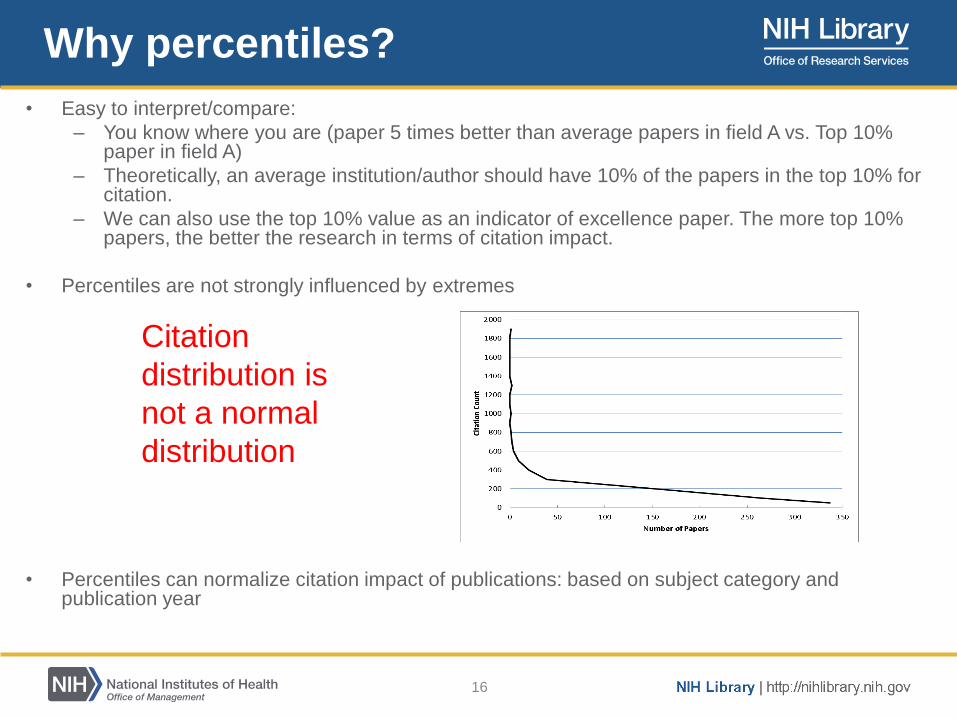
• Easy to interpret/compare:
– You know where you are (paper 5 times better than average papers in field A vs. Top 10% paper in field A)
– Theoretically, an average institution/author should have 10% of the papers in the top 10% for citation.
– We can also use the top 10% value as an indicator of excellence paper. The more top 10% papers, the better the research in terms of citation impact.
• Percentiles are not strongly influenced by extremes
• Percentiles can normalize citation impact of publications: based on subject category and publication year
16
Why percentiles?
Citation
distribution is
not a normal
distribution

• Calculation– Equal citations?
• Use the average rank
• Use the same rank
– 0 citation?
– Articles that have multiple subject categories?• “Why do I have to know citation percentiles?” NIHL Journal, 2012.
• Subject category: A, B, C, D
• Database limitation
• Time consuming!
17
Challenges
18
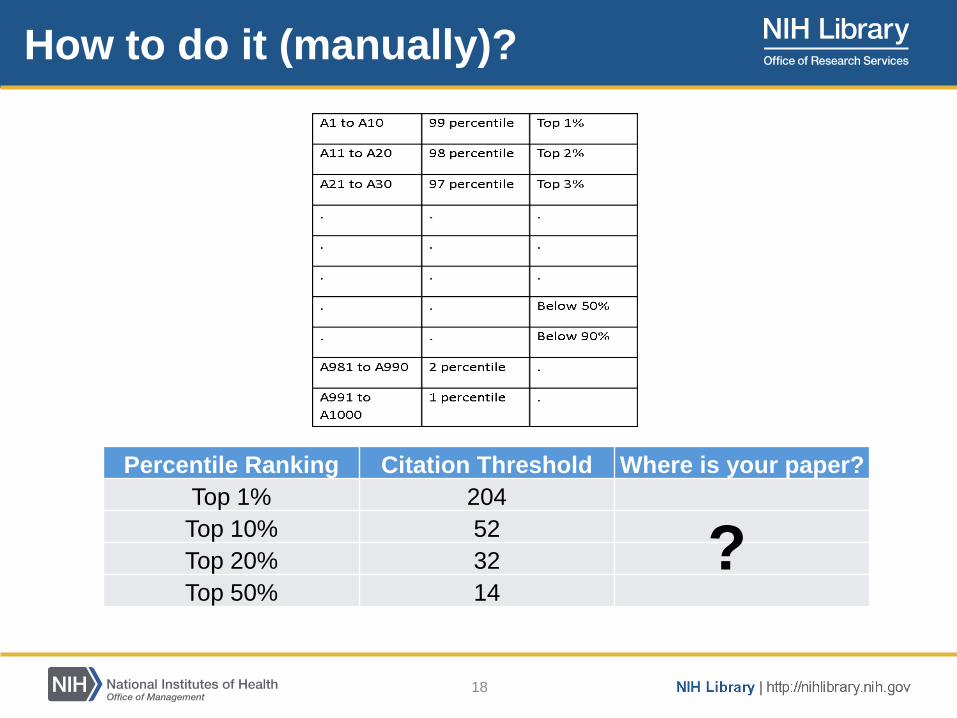
How to do it (manually)?
Percentile Ranking Citation Threshold Where is your paper?
Top 1% 204
Top 10% 52
Top 20% 32
Top 50% 14
?

• Bornmann, L., Leydesdorff, L., & Mutz, R. (2013). The use of percentiles and percentile rank classes in the analysis of bibliometric data: Opportunities and limits.Journal of Informetrics, 7(1), 158-165. doi:10.1016/j.joi.2012.10.001
• Bornmann, L., Leydesdorff, L., & Wang, J. (2013). Which percentile-based approach should be preferred for calculating normalized citation impact values? an empirical comparison of five approaches including a newly developed citation-rank approach (P100). Journal of Informetrics, 7(4), 933-944. doi:10.1016/j.joi.2013.09.003
• Waltman, L., & Schreiber, M. (2013). On the calculation of percentile-based bibliometric indicators. Journal of the American Society for Information Science and Technology, 64(2), 372-379. doi:10.1002/asi.22775
19
Further reading

20
How to do it in InCites?

• Matching!
21
How to do it in ESI?
22
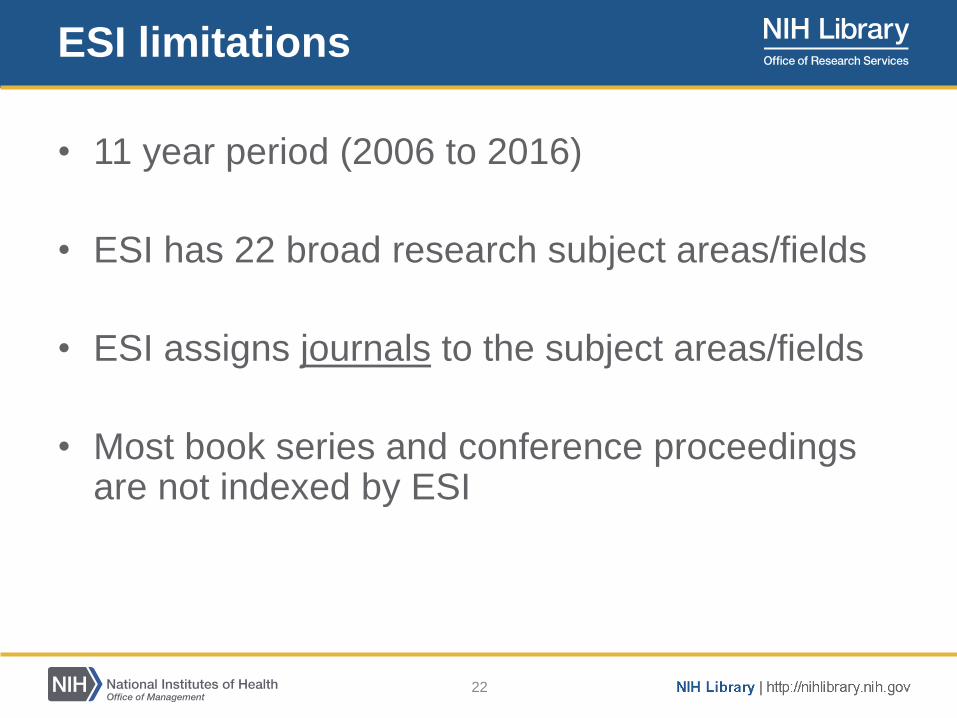
ESI limitations
• 11 year period (2006 to 2016)
• ESI has 22 broad research subject areas/fields
• ESI assigns journals to the subject areas/fields
• Most book series and conference proceedings are not indexed by ESI

23
Workflow
ESI subject
fields
ESI
percentile
ranks
Your papers
?
• ESI is based on WOS citations information.
• Unfortunately, ESI subject fields are not included in the
WOS metadata.
• Fortunately, ESI has a (secret) journal list that shows
the ESI subject fields classification.
24
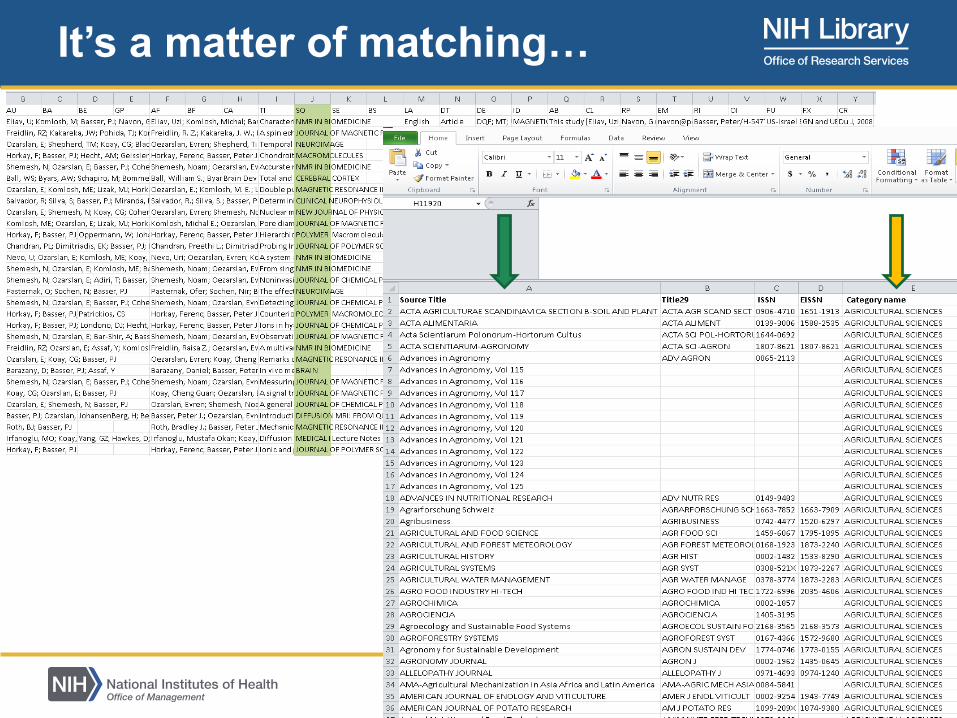
It’s a matter of matching…

• Download ESI journal list
• Download metadata from WOS– Core Collection
– TextExcel
• Match journal titles of your papers (in WOS) to ESI subject fields– VLOOKUP
• Find percentile ranks of you papers based on subject field and publication year
25
Matching steps

26
Step 1: Get the file!
• http://sciencewatch.com/info/journal-list
• http://ipscience-
help.thomsonreuters.com/incitesLiveESI/ESIGroup/overviewESI/esiJournalsList.html

27
VOILA!
11,427 Journals!

• Download the metadata from WOS
• Copy and paste the ESI journal list to a different sheet, for instance, Sheet 2.
28
Step 2: Metadata from WOS

• VLOOKUP(cell,range,return value,FALSE)
– Cell: what to look up? (the cells of your journal titles)
– Range: where to look up? (the ESI journal list)
– Return value: what to return if there is a match?
(Return the subject field)
– FALSE: exact match (I want exactly the same journal
titles.)
29
Step 3: VLOOKUP
=VLOOKUP(J2,Sheet2!$A$2:$F$11428,6,FALSE)

• Sheet 1: publication metadata
• Sheet 2: ESI journal list
• Insert one blank column, anywhere in Sheet 1, for instance, Column B
• In Cell B2, type the following
• Hit “Enter” and you will get either a subject or #N/A
• Check #N/A items for spelling (and, &, space, etc.)
• Check journal merge or update
30
VLOOKUP
=VLOOKUP(J2,Sheet2!$A$2:$F$11428,6,FALSE)

Final step—Find the percentile
ranks in ESI
ESI
percentile
ranks
ESI subject
fields
Your papers
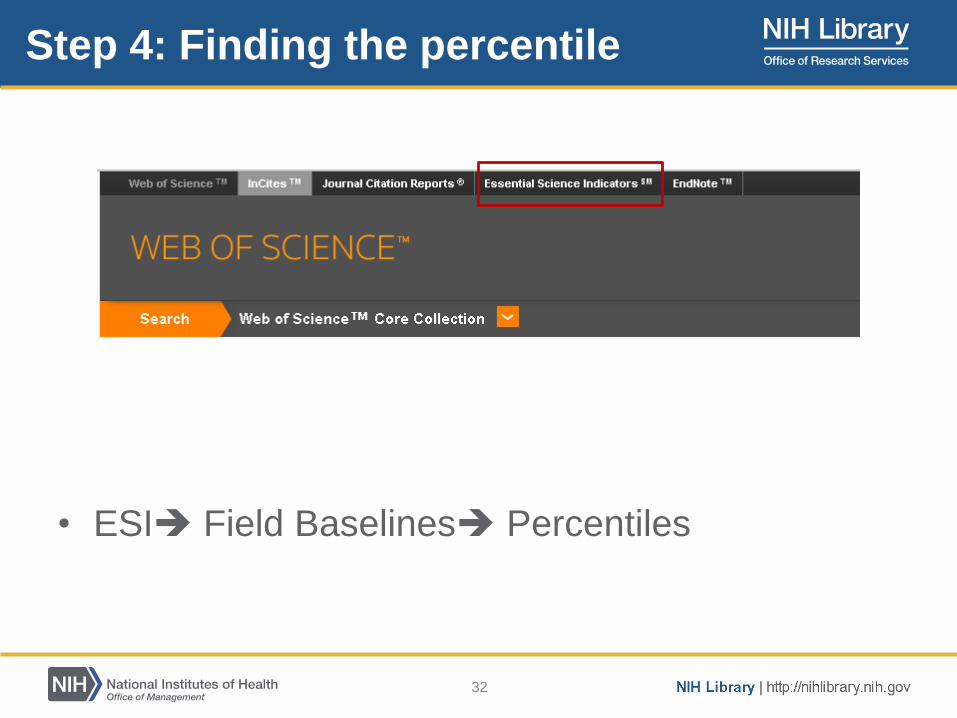
• ESI Field Baselines Percentiles
32
Step 4: Finding the percentile

33
ESI percentile table
34
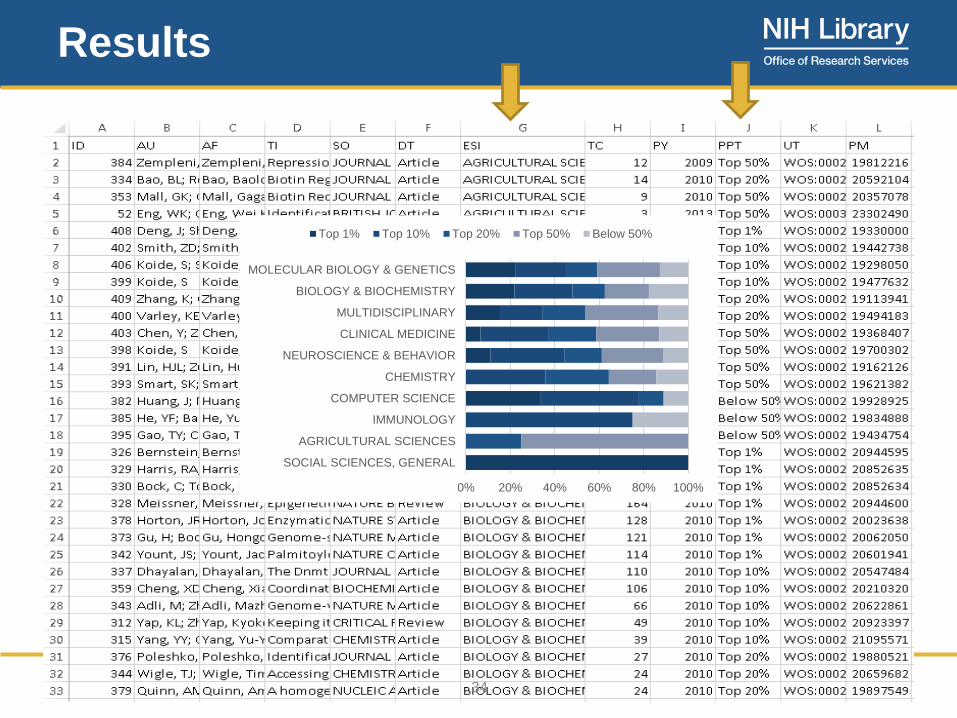
Results
0% 20% 40% 60% 80% 100%
SOCIAL SCIENCES, GENERAL
AGRICULTURAL SCIENCES
IMMUNOLOGY
COMPUTER SCIENCE
CHEMISTRY
NEUROSCIENCE & BEHAVIOR
CLINICAL MEDICINE
MULTIDISCIPLINARY
BIOLOGY & BIOCHEMISTRY
MOLECULAR BIOLOGY & GENETICS
Top 1% Top 10% Top 20% Top 50% Below 50%

Let’s try the VLOOKUP function.
Exercise


Obtaining and Learning Sci2
Download: https://sci2.cns.iu.edu/
Documentation:
https://sci2.cns.iu.edu/user/documentation.php
User manual:
http://sci2.wiki.cns.iu.edu/
Obtaining and Learning Gephi
Download: https://gephi.org/
Quick start tutorials:
https://gephi.org/users/quick-start/
Other tutorials:
http://www.slideshare.net/gephi/presentations

About networks

Definition
A network is a set of relationships between things

Parts of a Network
• Nodes
– Elements of the network
– Can have attributes
• Edges
– Connections between nodes
– Can be directed or undirected
– Can be weighted or unweighted

Basic network
Nodes = Elements
Edges = Relationships
Node
Node
Node
Node
Node

Social network
Nodes = People
Edges = Friendships
Person
Person
Person
Person
Person

Website network
Nodes = Websites
Edges = Hyperlinks
Site
Site
Site
Site
Site

Co-author networks
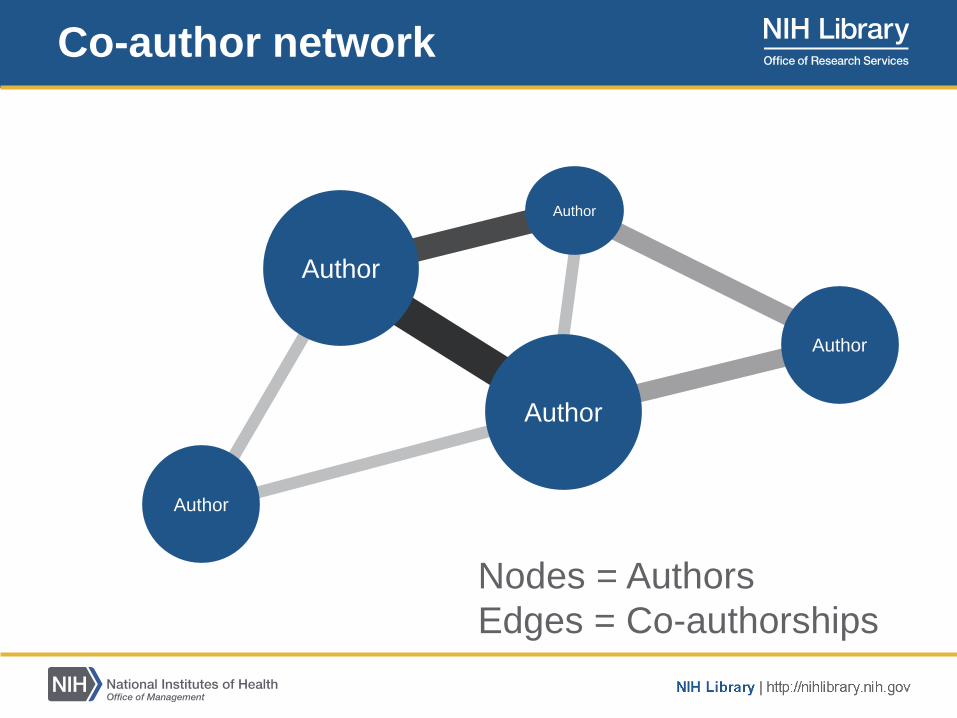
Co-author network
Nodes = Authors
Edges = Co-authorships
Author
Author
Author
Author
Author
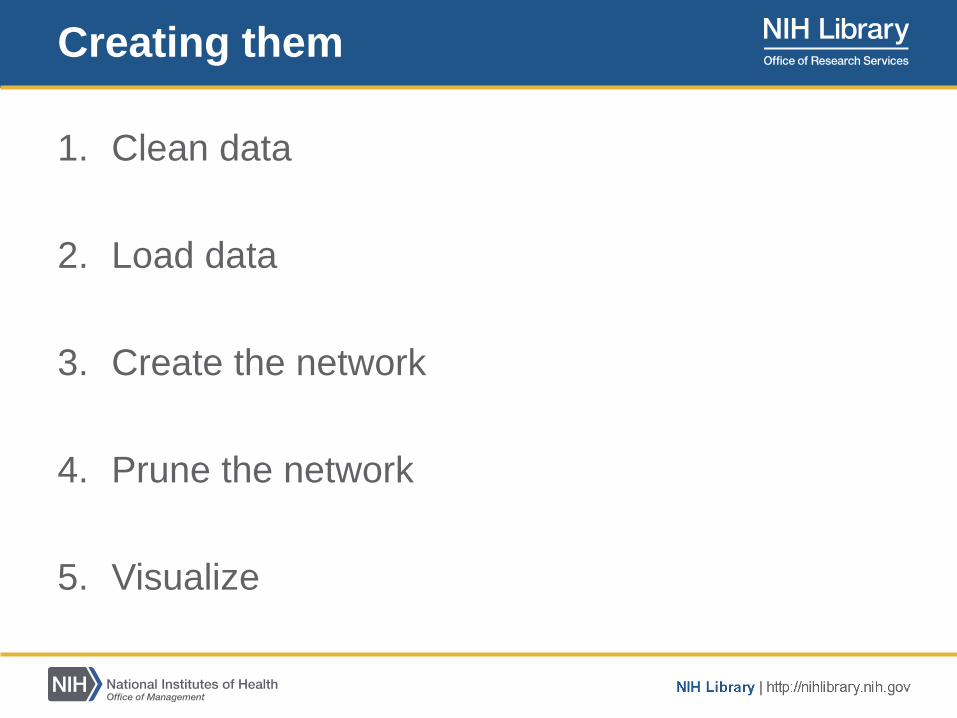
Creating them
1. Clean data
2. Load data
3. Create the network
4. Prune the network
5. Visualize
Word co-occurrence networks
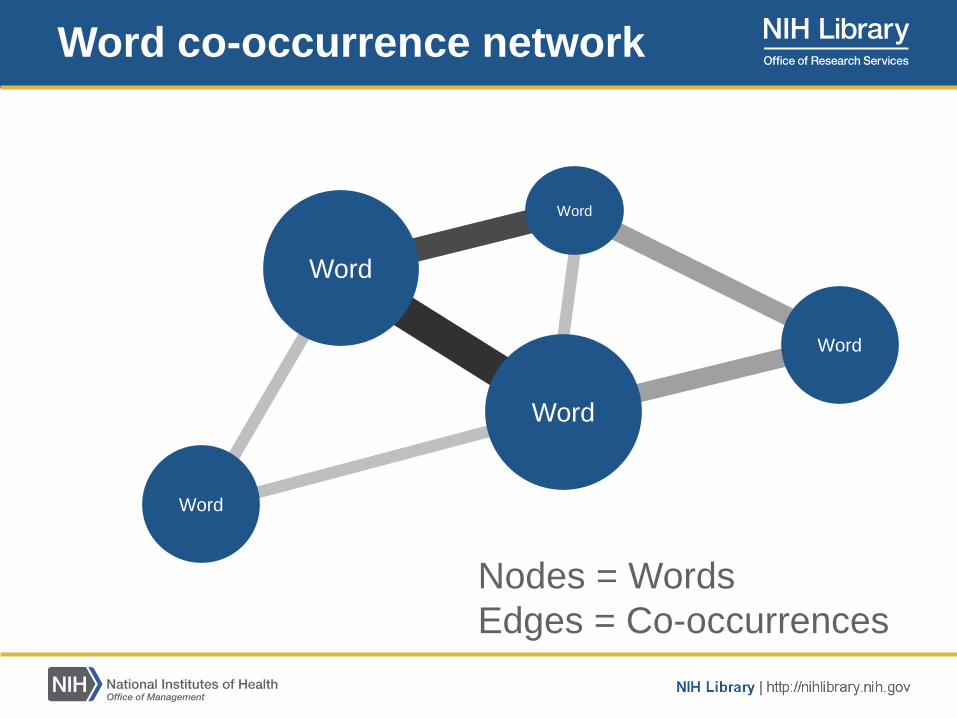
Word co-occurrence network
Nodes = Words
Edges = Co-occurrences
Word
Word
Word
Word
Word
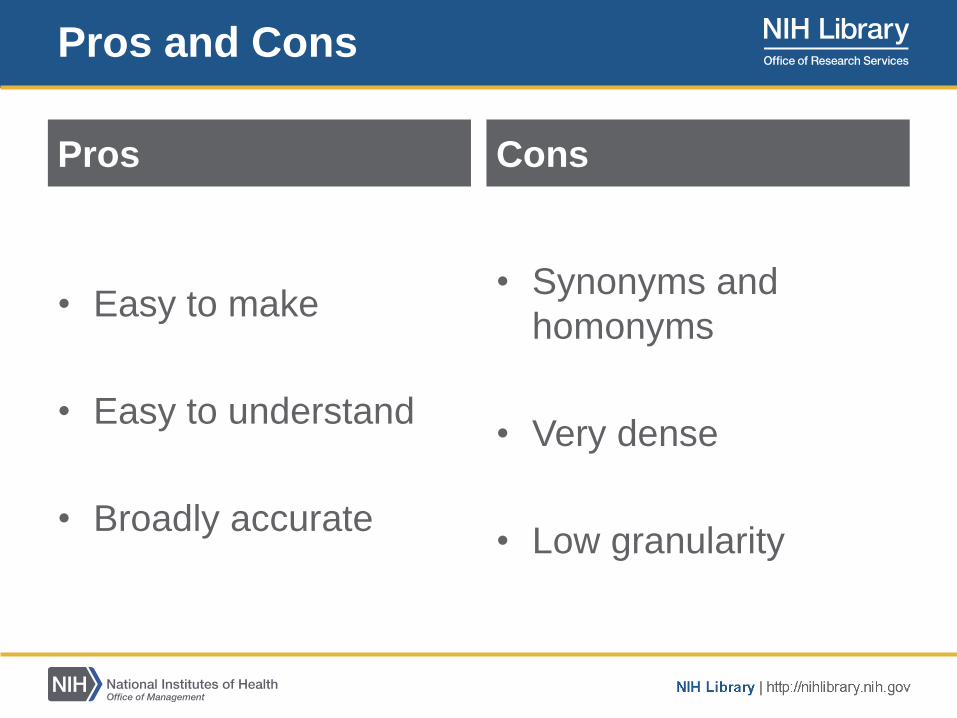
Pros and Cons
Pros
• Easy to make
• Easy to understand
• Broadly accurate
Cons
• Synonyms and
homonyms
• Very dense
• Low granularity

Creating them
1. Load data
2. Transform word data
3. Create the network
4. Prune the network
5. Visualize

Bibliographic coupling networks
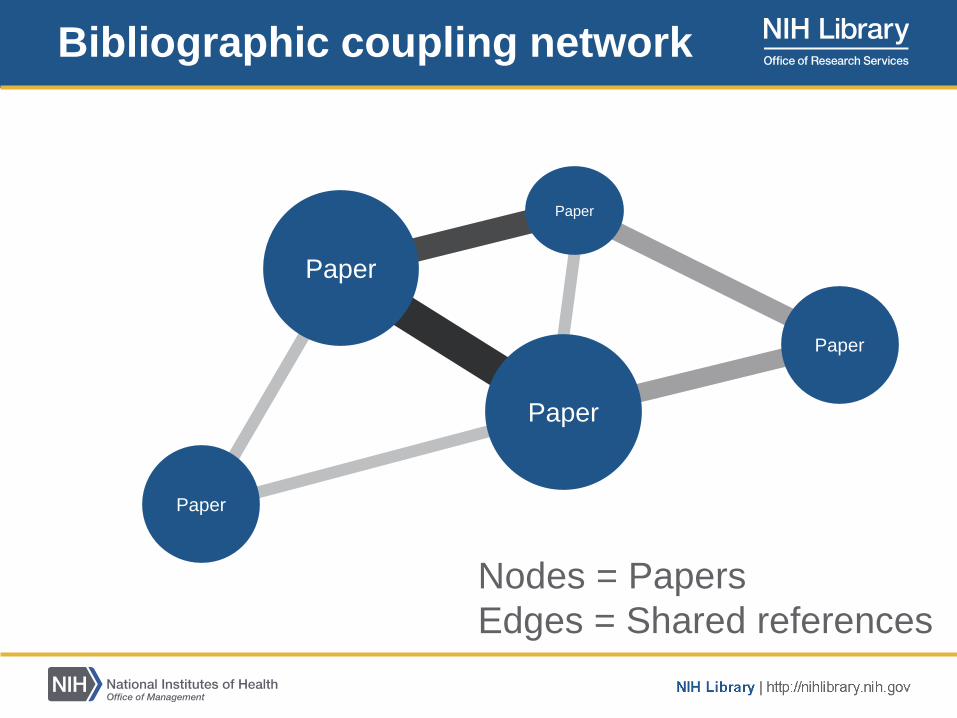
Bibliographic coupling network
Nodes = Papers
Edges = Shared references
Paper
Paper
Paper
Paper
Paper

Pros and Cons
Pros
• Higher granularity
• Paper-topic
assignments
• Self-organization
Cons
• More difficult to create
• More difficult to
understand
• Paper loss
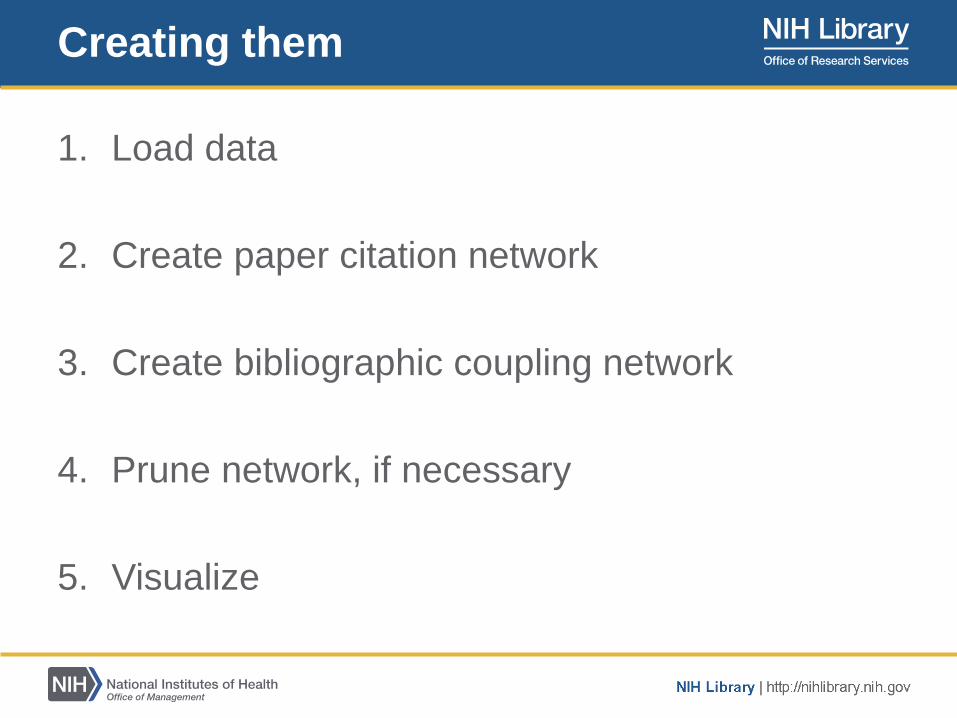
Creating them
1. Load data
2. Create paper citation network
3. Create bibliographic coupling network
4. Prune network, if necessary
5. Visualize
Contact us
Chris Belter
301.451.5861
Ya-Ling Lu
301-272-5464

Related Documents