Technical Report NetApp All Flash FAS Solution for Persistent Desktops with VMware Horizon View Joe Scott and Chris Gebhardt, NetApp May 2017 | TR-4540 Abstract This document describes the solution components used in the 1,500-user Horizon View deployment on NetApp All Flash FAS reference architecture validation. It covers the hardware and software used in the validation, the configuration of the hardware and software, use cases that were tested, and performance results of the completed tests. It also contains sections focusing on the new platforms in the AFF product line, the NetApp AFF A- Series, and their relative performance to the previous generation. It includes workload profiles that allow customers to see the different IO profiles that make up each different test performed in this reference architecture.

Welcome message from author
This document is posted to help you gain knowledge. Please leave a comment to let me know what you think about it! Share it to your friends and learn new things together.
Transcript
Technical Report
NetApp All Flash FAS Solution for Persistent Desktops with VMware Horizon View Joe Scott and Chris Gebhardt, NetApp
May 2017 | TR-4540
Abstract
This document describes the solution components used in the 1,500-user Horizon View
deployment on NetApp All Flash FAS reference architecture validation. It covers the
hardware and software used in the validation, the configuration of the hardware and
software, use cases that were tested, and performance results of the completed tests. It also
contains sections focusing on the new platforms in the AFF product line, the NetApp AFF A-
Series, and their relative performance to the previous generation. It includes workload
profiles that allow customers to see the different IO profiles that make up each different test
performed in this reference architecture.
2 NetApp All Flash FAS Solution for Persistent Desktops with VMware Horizon View
© 2017 NetApp, Inc. All rights reserved. © 2016 NetApp, Inc. All rights reserved.
TABLE OF CONTENTS
1 Executive Summary.............................................................................................................................. 6
2 Reference Architecture Objectives ..................................................................................................... 7
3 Introduction ........................................................................................................................................... 7
3.1 Document Overview ........................................................................................................................................8
3.2 NetApp All Flash FAS .....................................................................................................................................8
3.3 NetApp ONTAP FlashEssentials .....................................................................................................................8
3.4 NetApp ONTAP 9 ............................................................................................................................................9
3.5 Storage Efficiency ...........................................................................................................................................9
4 Solution Infrastructure ....................................................................................................................... 10
4.1 Hardware Infrastructure ................................................................................................................................ 11
4.2 Software Components .................................................................................................................................. 12
4.3 Login VSI ...................................................................................................................................................... 13
4.4 Full-Clone Virtual Desktops........................................................................................................................... 13
5 Storage Design ................................................................................................................................... 14
5.1 Aggregate Layout .......................................................................................................................................... 14
5.2 Volume Layout .............................................................................................................................................. 15
5.3 NetApp Virtual Storage Console for VMware vSphere .................................................................................. 15
5.4 Creating VMware Horizon View Desktop Pools ............................................................................................ 15
6 Testing and Validation: Persistent Full-Clone Desktops................................................................ 16
6.1 Test Results Overview .................................................................................................................................. 17
6.2 Storage Efficiency ......................................................................................................................................... 17
6.3 Test for Provisioning 1,500 VMware Horizon View Full Clones (Offloaded to VAAI) .................................... 18
6.4 Boot Storm Test ............................................................................................................................................ 20
6.5 Boot Storm Test During Storage Failover ..................................................................................................... 23
6.6 Login and Steady-State VSI Test .................................................................................................................. 25
6.7 Test for Patching 1,500 Desktops ................................................................................................................. 40
7 Conclusion of Testing and Validation .............................................................................................. 43
8 Data Center Efficiency with AFF A-Series ....................................................................................... 44
Appendix: Workload Profiles ................................................................................................................... 45
Boot ...................................................................................................................................................................... 45
Monday Morning Login and Steady State Workload Profile ................................................................................. 46
Tuesday Morning Login and Steady State Workload Profile ................................................................................ 46
3 NetApp All Flash FAS Solution for Persistent Desktops with VMware Horizon View
© 2017 NetApp, Inc. All rights reserved. © 2016 NetApp, Inc. All rights reserved.
References ................................................................................................................................................. 47
Acknowledgements .................................................................................................................................. 47
Version History ......................................................................................................................................... 47
LIST OF TABLES
Table 1) Test results for 1,500 persistent desktops. .......................................................................................................7
Table 2) Hardware components of server categories. .................................................................................................. 11
Table 3) Solution software components. ...................................................................................................................... 12
Table 4) Virtual desktop configurations. ....................................................................................................................... 13
Table 5) Test results overview. ..................................................................................................................................... 17
Table 6) Efficiency results for each FlexVol volume. .................................................................................................... 18
Table 7) Results for full-clone provisioning of 1,500 virtual desktops. .......................................................................... 19
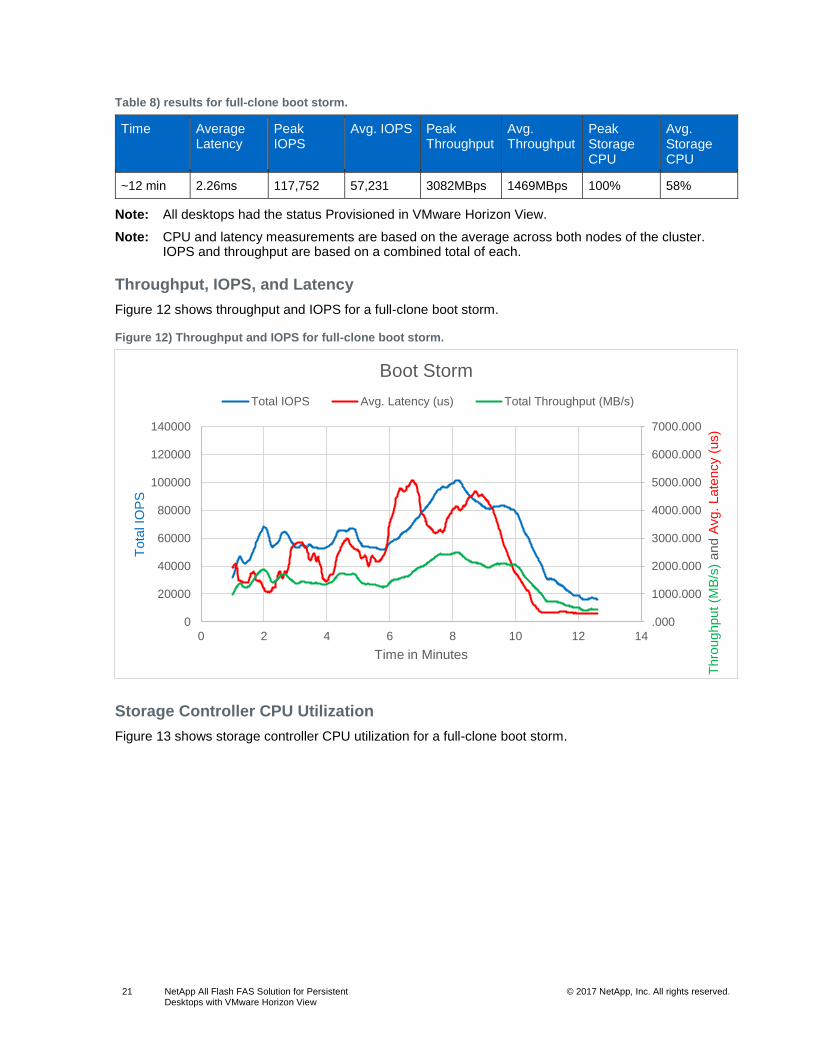
Table 8) results for full-clone boot storm. ..................................................................................................................... 21
Table 9) Results for full-clone boot storm during storage failover. ................................................................................ 23
Table 10) Results for full-clone Monday morning login and workload. ......................................................................... 26
Table 11) Results for full-clone Monday morning login and workload during storage failover. ..................................... 29
Table 12) Results for full-clone Tuesday morning login and workload. ........................................................................ 33
Table 13) Results for full-clone Tuesday morning login and workload during storage failover. .................................... 37
Table 14) Results for patching 1,500 persistent full clones on one node. .................................................................... 40
Table 15) Capacity density of A-Series systems. ......................................................................................................... 44
Table 16) Boot workload profile. ................................................................................................................................... 46
Table 17) Monday morning login and steady state workload profile. ............................................................................ 46
Table 18) Tuesday morning login and steady state workload profile. ........................................................................... 46
LIST OF FIGURES
Figure 1) Visual representation of inline compression and data compaction. ............................................................... 10
Figure 2) Advanced drive partitioning v2. ..................................................................................................................... 10
Figure 3) Solution infrastructure for persistent desktops. ............................................................................................. 11
Figure 4) VMware OS optimization tool. ....................................................................................................................... 14
Figure 5) SSD layout. ................................................................................................................................................... 15
Figure 6) Volume layout for persistent desktops. ......................................................................................................... 15
Figure 7) Windows PowerShell script to create 10 pools of 150 desktops each. .......................................................... 15
Figure 8) Storage efficiency savings. ........................................................................................................................... 18
Figure 9) Creating 150 VMs in one pool. ...................................................................................................................... 18
Figure 10) Throughput and IOPS for full-clone creation. .............................................................................................. 19
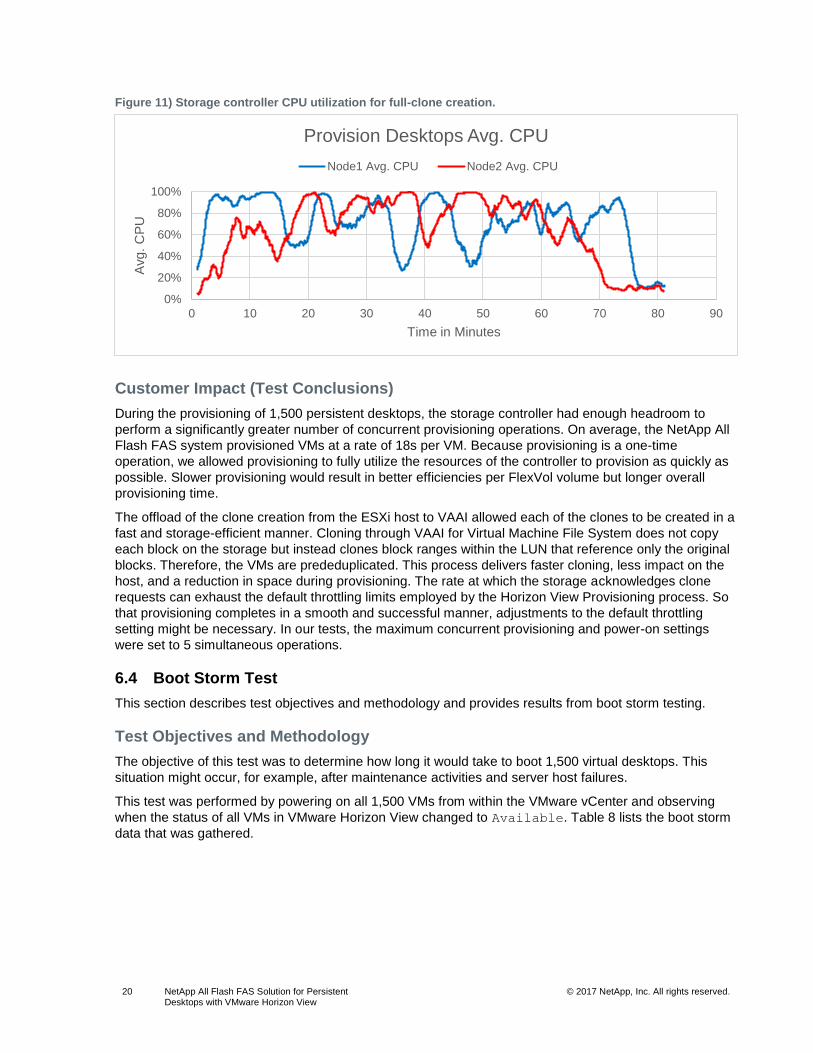
Figure 11) Storage controller CPU utilization for full-clone creation. ............................................................................ 20
Figure 12) Throughput and IOPS for full-clone boot storm. .......................................................................................... 21
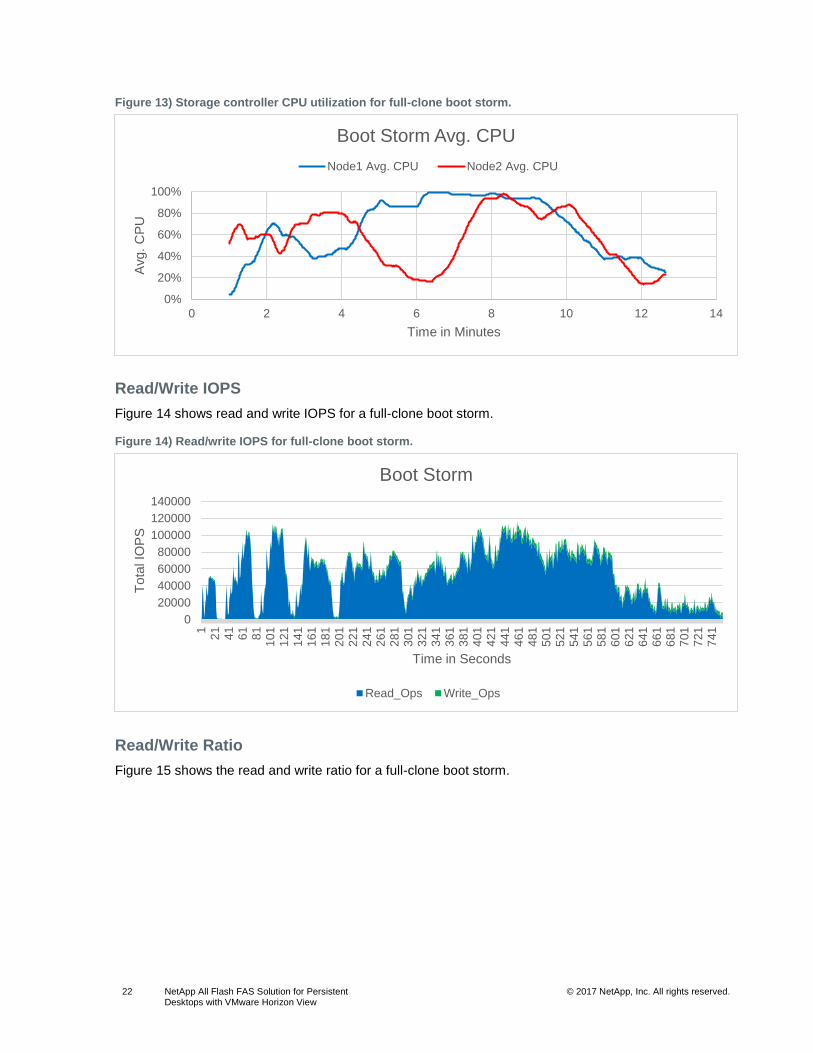
Figure 13) Storage controller CPU utilization for full-clone boot storm. ........................................................................ 22
4 NetApp All Flash FAS Solution for Persistent Desktops with VMware Horizon View
© 2017 NetApp, Inc. All rights reserved. © 2016 NetApp, Inc. All rights reserved.
Figure 14) Read/write IOPS for full-clone boot storm. .................................................................................................. 22
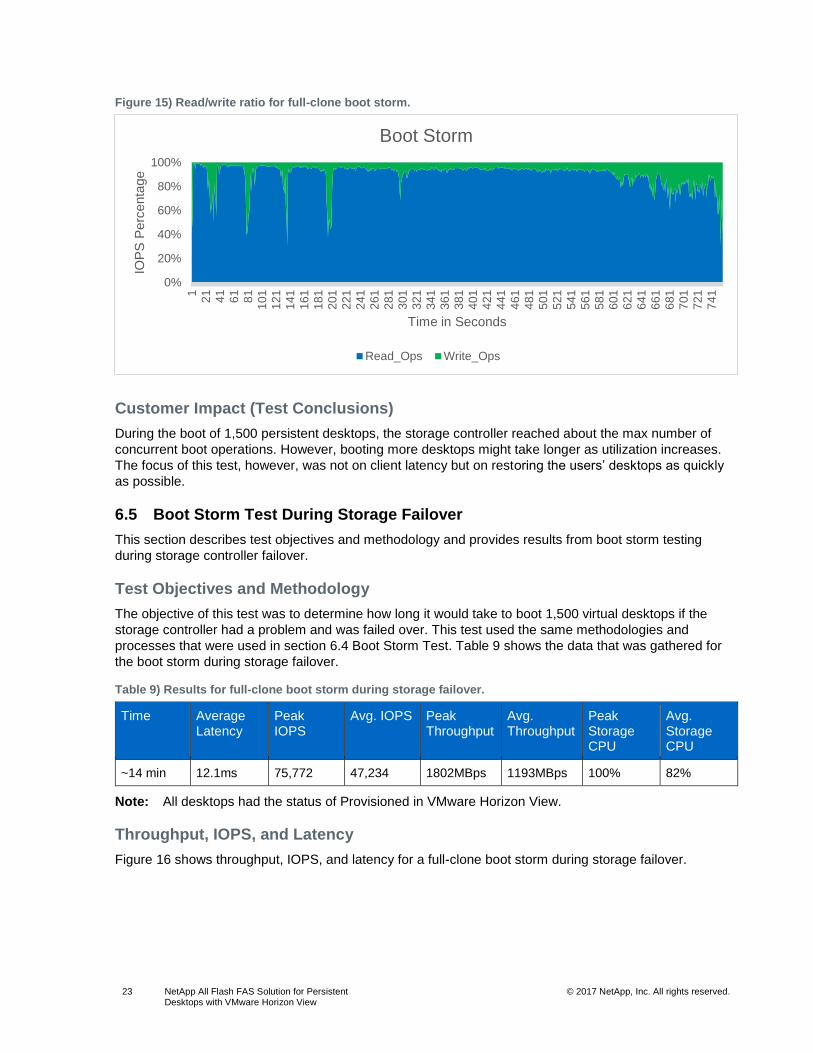
Figure 15) Read/write ratio for full-clone boot storm. .................................................................................................... 23
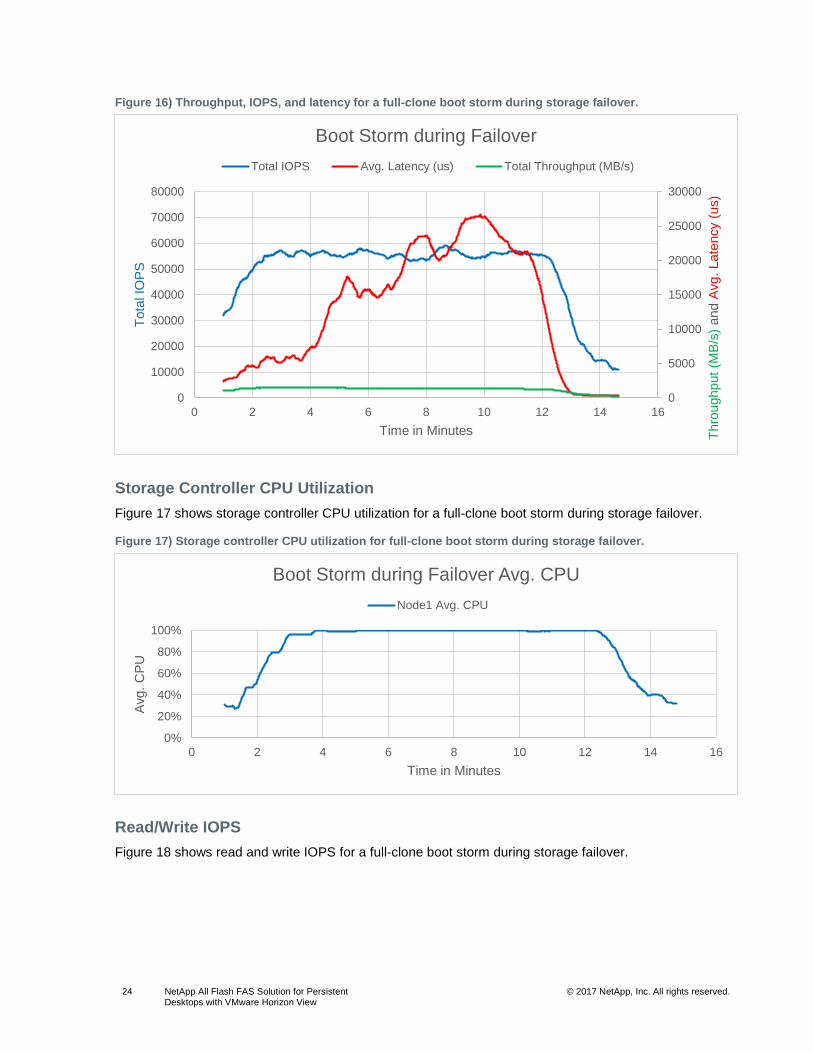
Figure 16) Throughput, IOPS, and latency for a full-clone boot storm during storage failover. .................................... 24
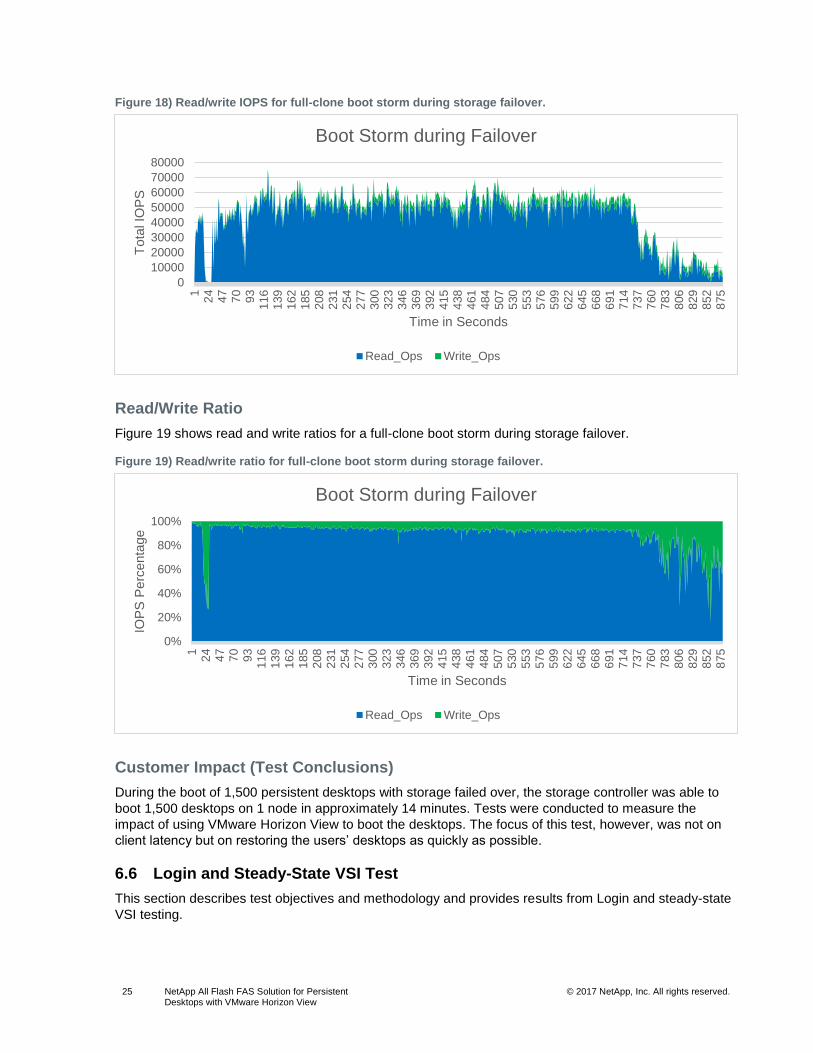
Figure 17) Storage controller CPU utilization for full-clone boot storm during storage failover. .................................... 24
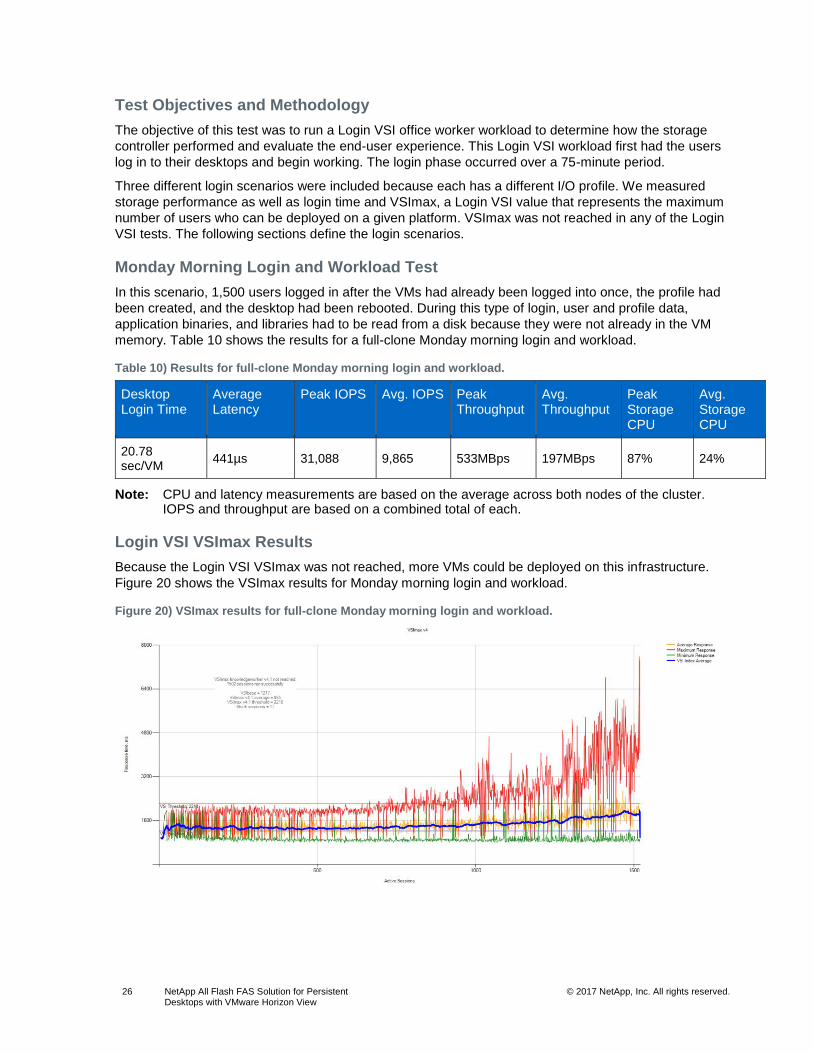
Figure 18) Read/write IOPS for full-clone boot storm during storage failover. .............................................................. 25
Figure 19) Read/write ratio for full-clone boot storm during storage failover. ............................................................... 25
Figure 20) VSImax results for full-clone Monday morning login and workload. ............................................................ 26
Figure 21) Scatterplot of full-clone Monday morning login times. ................................................................................. 27
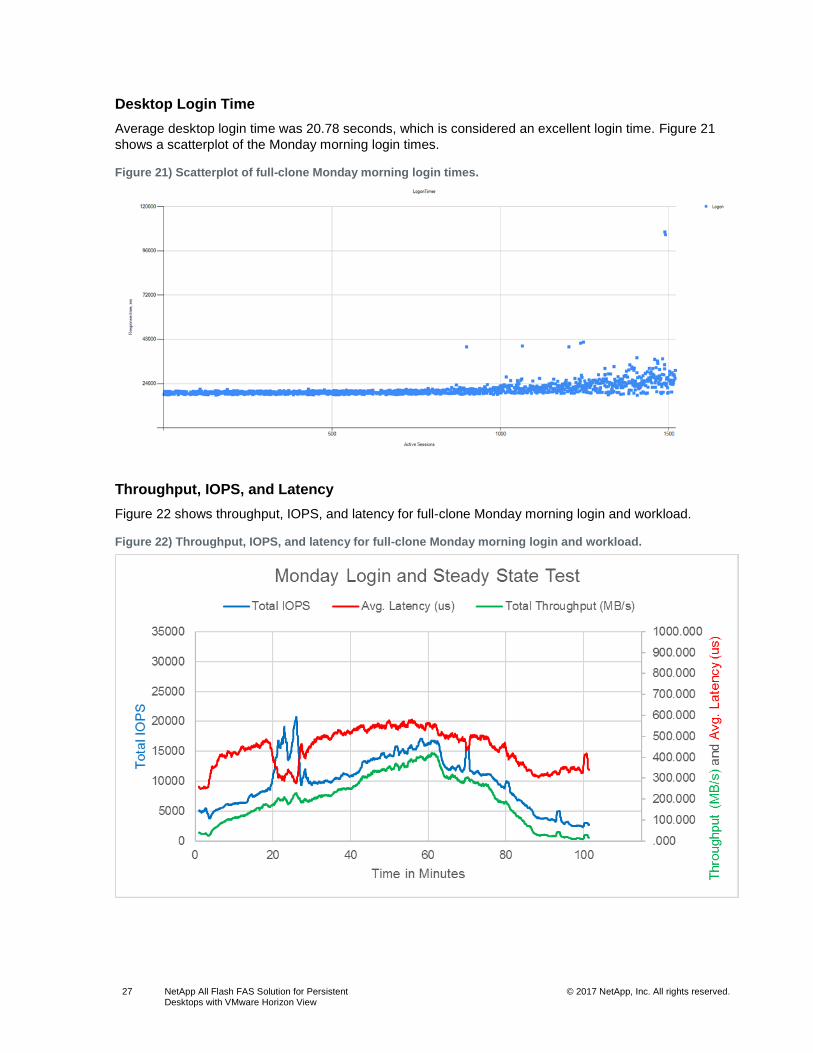
Figure 22) Throughput, IOPS, and latency for full-clone Monday morning login and workload. ................................... 27
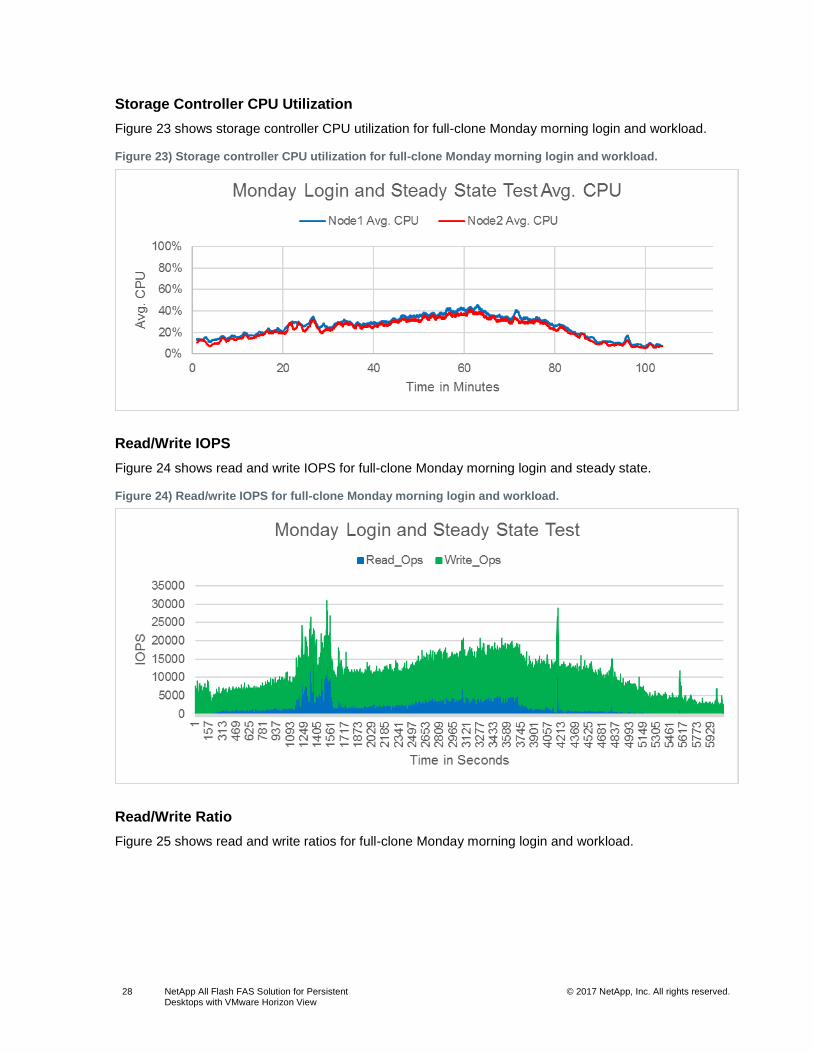
Figure 23) Storage controller CPU utilization for full-clone Monday morning login and workload................................. 28
Figure 24) Read/write IOPS for full-clone Monday morning login and workload........................................................... 28
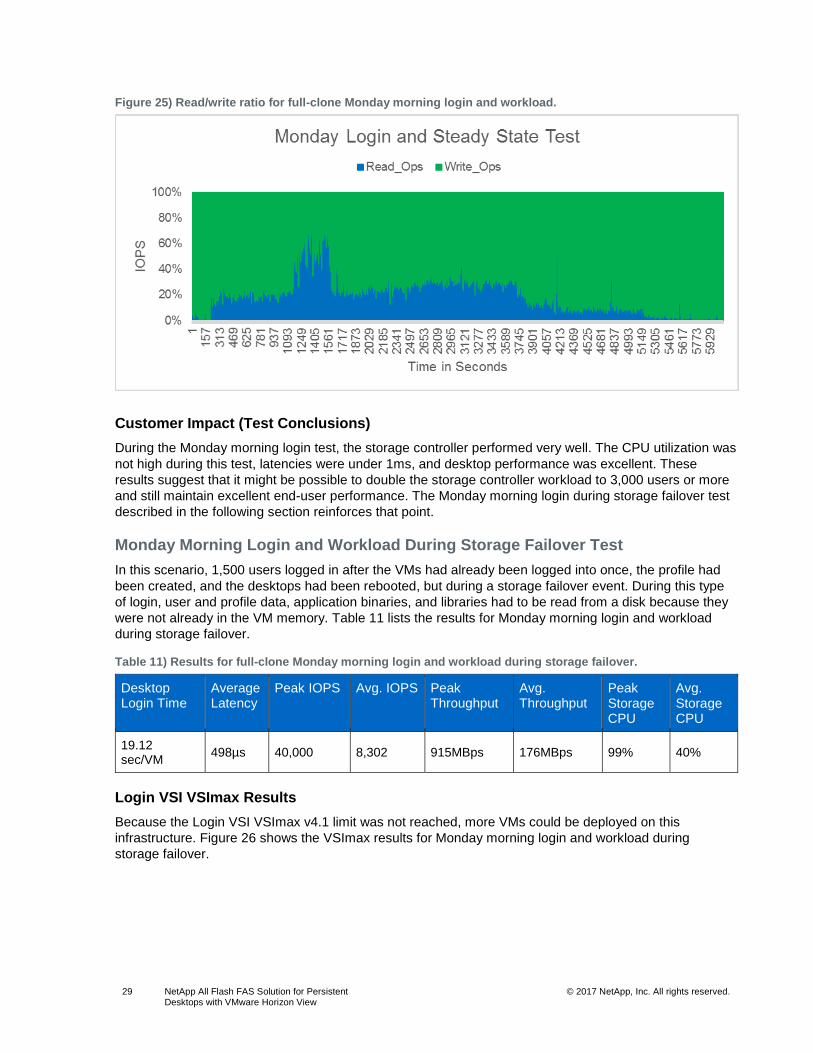
Figure 25) Read/write ratio for full-clone Monday morning login and workload. ........................................................... 29
Figure 26) VSImax results for full-clone Monday morning login and workload during storage failover. ........................ 30
Figure 27) Scatterplot of full-clone Monday morning login times during storage failover. ............................................. 30
Figure 28) Throughput, IOPS, and latency for full-clone Monday morning login and workload during storage failover. ..................................................................................................................................................................................... 31
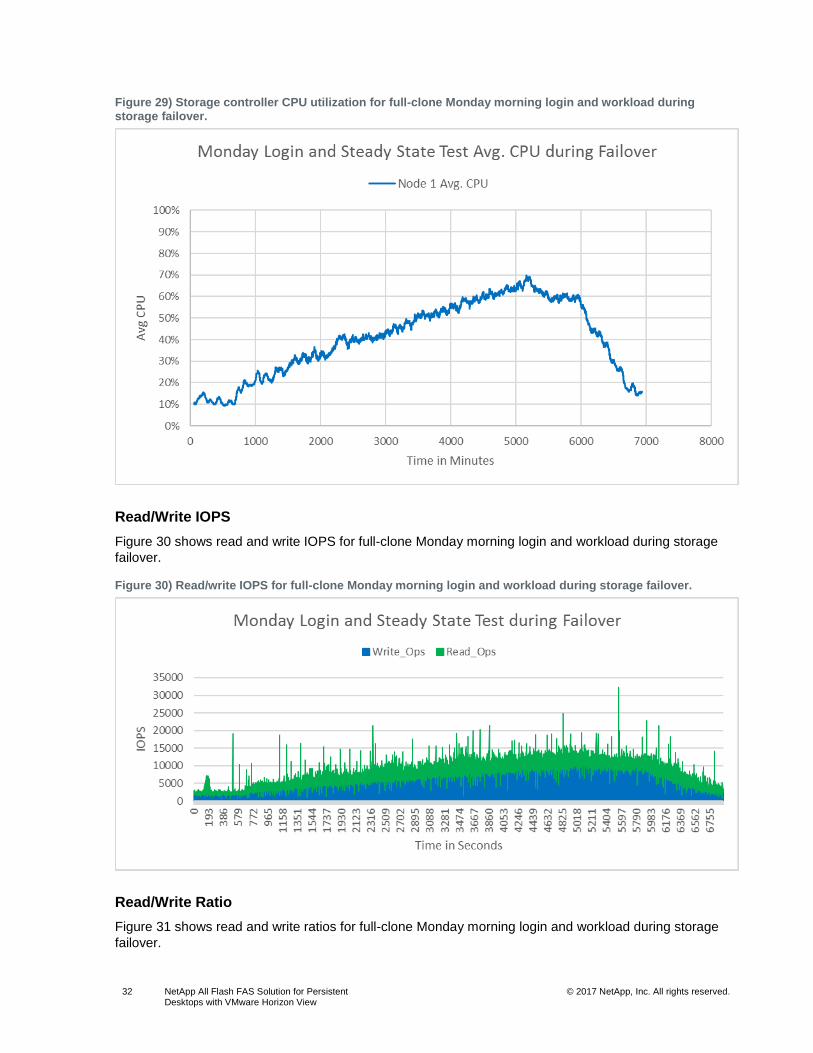
Figure 29) Storage controller CPU utilization for full-clone Monday morning login and workload during storage failover. ......................................................................................................................................................................... 32
Figure 30) Read/write IOPS for full-clone Monday morning login and workload during storage failover. ..................... 32
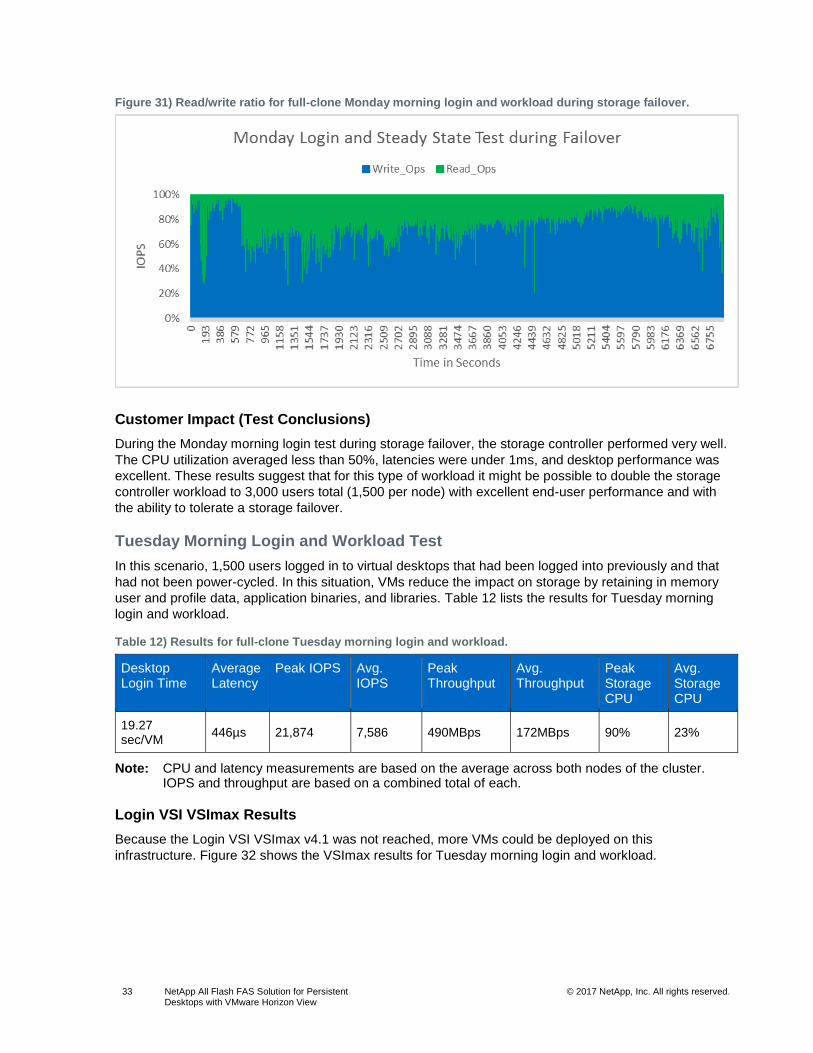
Figure 31) Read/write ratio for full-clone Monday morning login and workload during storage failover. ....................... 33
Figure 32) VSImax results for full-clone Tuesday morning login and workload. ........................................................... 34
Figure 33) Scatterplot of full-clone Tuesday morning login times. ................................................................................ 34
Figure 34) Throughput, IOPS, and latency for full-clone Tuesday morning login and workload. .................................. 35
Figure 35) Storage controller CPU utilization for full-clone Tuesday morning login and workload................................ 35
Figure 36) Read/write IOPS for full-clone Tuesday morning login and workload.......................................................... 36
Figure 37) Read/write ratio for full-clone Tuesday morning login and workload. .......................................................... 36
Figure 38) VSImax results for full-clone Tuesday morning login and workload during storage failover. ....................... 37
Figure 39) Scatterplot of full-clone Tuesday morning login times during storage failover. ............................................ 38
Figure 40) Throughput, IOPS, and latency for full-clone Tuesday morning login and workload during storage failover. ..................................................................................................................................................................................... 38
Figure 41) Storage controller CPU utilization for full-clone Tuesday morning login and workload during storage failover. ......................................................................................................................................................................... 39
Figure 42) Read/write IOPS for full-clone Tuesday morning login and workload during storage failover. .................... 39
Figure 43) Read/write ratio for full-clone Tuesday morning login and workload during storage failover. ...................... 40
Figure 44) Throughput, IOPS, and patency for patching 1,500 persistent full clones. .................................................. 41
Figure 45) Storage controller CPU utilization for patching 1,500 persistent full clones. ............................................... 41
Figure 46) Read/write IOPS for patching 1,500 persistent full clones. ......................................................................... 42
Figure 47) Read/write ratio for patching 1,500 persistent full clones. ........................................................................... 42
Figure 48) Savings in ONTAP 9 (in GB) per FlexVol volume before applying patches. ............................................... 43
Figure 49) Savings in ONTAP 9 (in GB) per FlexVol volume after applying patches. .................................................. 43
Figure 50) User per platform density. ........................................................................................................................... 45
5 NetApp All Flash FAS Solution for Persistent Desktops with VMware Horizon View
© 2017 NetApp, Inc. All rights reserved. © 2016 NetApp, Inc. All rights reserved.
Figure 51) Data center density for AFF8040 and A700s. ............................................................................................. 45
6 NetApp All Flash FAS Solution for Persistent Desktops with VMware Horizon View
© 2017 NetApp, Inc. All rights reserved. © 2016 NetApp, Inc. All rights reserved.
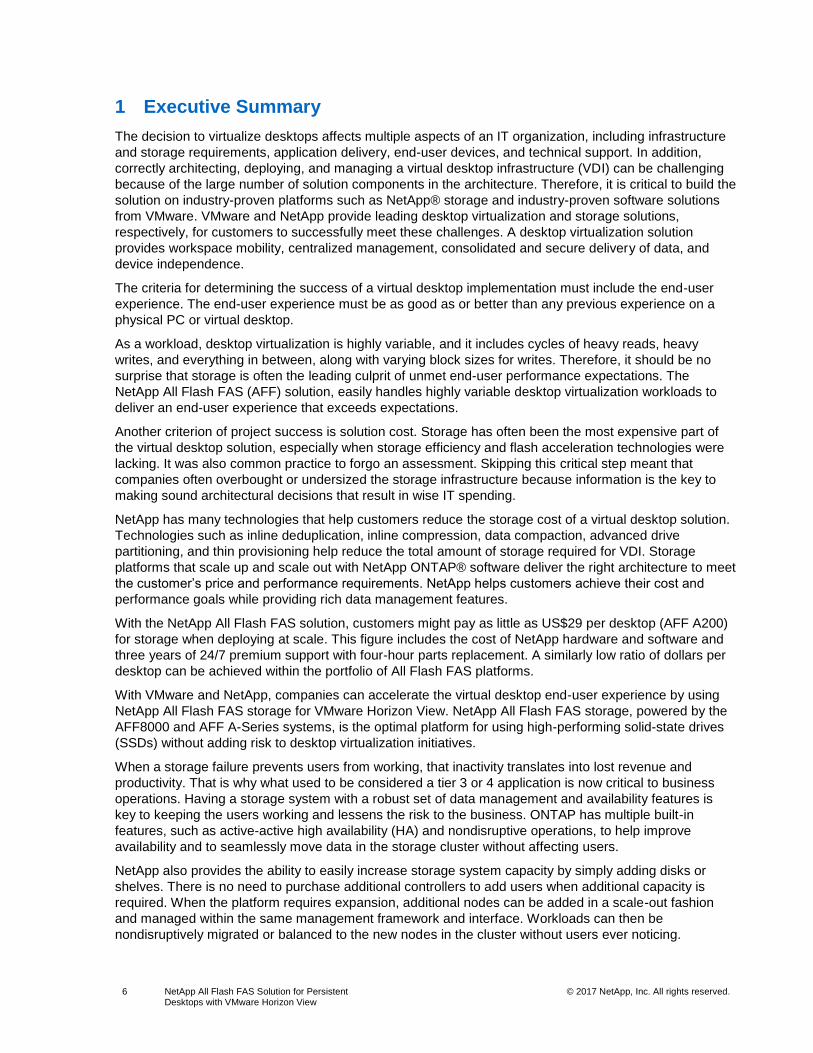
1 Executive Summary
The decision to virtualize desktops affects multiple aspects of an IT organization, including infrastructure
and storage requirements, application delivery, end-user devices, and technical support. In addition,
correctly architecting, deploying, and managing a virtual desktop infrastructure (VDI) can be challenging
because of the large number of solution components in the architecture. Therefore, it is critical to build the
solution on industry-proven platforms such as NetApp® storage and industry-proven software solutions
from VMware. VMware and NetApp provide leading desktop virtualization and storage solutions,
respectively, for customers to successfully meet these challenges. A desktop virtualization solution
provides workspace mobility, centralized management, consolidated and secure delivery of data, and
device independence.
The criteria for determining the success of a virtual desktop implementation must include the end-user
experience. The end-user experience must be as good as or better than any previous experience on a
physical PC or virtual desktop.
As a workload, desktop virtualization is highly variable, and it includes cycles of heavy reads, heavy
writes, and everything in between, along with varying block sizes for writes. Therefore, it should be no
surprise that storage is often the leading culprit of unmet end-user performance expectations. The
NetApp All Flash FAS (AFF) solution, easily handles highly variable desktop virtualization workloads to
deliver an end-user experience that exceeds expectations.
Another criterion of project success is solution cost. Storage has often been the most expensive part of
the virtual desktop solution, especially when storage efficiency and flash acceleration technologies were
lacking. It was also common practice to forgo an assessment. Skipping this critical step meant that
companies often overbought or undersized the storage infrastructure because information is the key to
making sound architectural decisions that result in wise IT spending.
NetApp has many technologies that help customers reduce the storage cost of a virtual desktop solution.
Technologies such as inline deduplication, inline compression, data compaction, advanced drive
partitioning, and thin provisioning help reduce the total amount of storage required for VDI. Storage
platforms that scale up and scale out with NetApp ONTAP® software deliver the right architecture to meet
the customer’s price and performance requirements. NetApp helps customers achieve their cost and
performance goals while providing rich data management features.
With the NetApp All Flash FAS solution, customers might pay as little as US$29 per desktop (AFF A200)
for storage when deploying at scale. This figure includes the cost of NetApp hardware and software and
three years of 24/7 premium support with four-hour parts replacement. A similarly low ratio of dollars per
desktop can be achieved within the portfolio of All Flash FAS platforms.
With VMware and NetApp, companies can accelerate the virtual desktop end-user experience by using
NetApp All Flash FAS storage for VMware Horizon View. NetApp All Flash FAS storage, powered by the
AFF8000 and AFF A-Series systems, is the optimal platform for using high-performing solid-state drives
(SSDs) without adding risk to desktop virtualization initiatives.
When a storage failure prevents users from working, that inactivity translates into lost revenue and
productivity. That is why what used to be considered a tier 3 or 4 application is now critical to business
operations. Having a storage system with a robust set of data management and availability features is
key to keeping the users working and lessens the risk to the business. ONTAP has multiple built-in
features, such as active-active high availability (HA) and nondisruptive operations, to help improve
availability and to seamlessly move data in the storage cluster without affecting users.
NetApp also provides the ability to easily increase storage system capacity by simply adding disks or
shelves. There is no need to purchase additional controllers to add users when additional capacity is
required. When the platform requires expansion, additional nodes can be added in a scale-out fashion
and managed within the same management framework and interface. Workloads can then be
nondisruptively migrated or balanced to the new nodes in the cluster without users ever noticing.
7 NetApp All Flash FAS Solution for Persistent Desktops with VMware Horizon View
© 2017 NetApp, Inc. All rights reserved. © 2016 NetApp, Inc. All rights reserved.
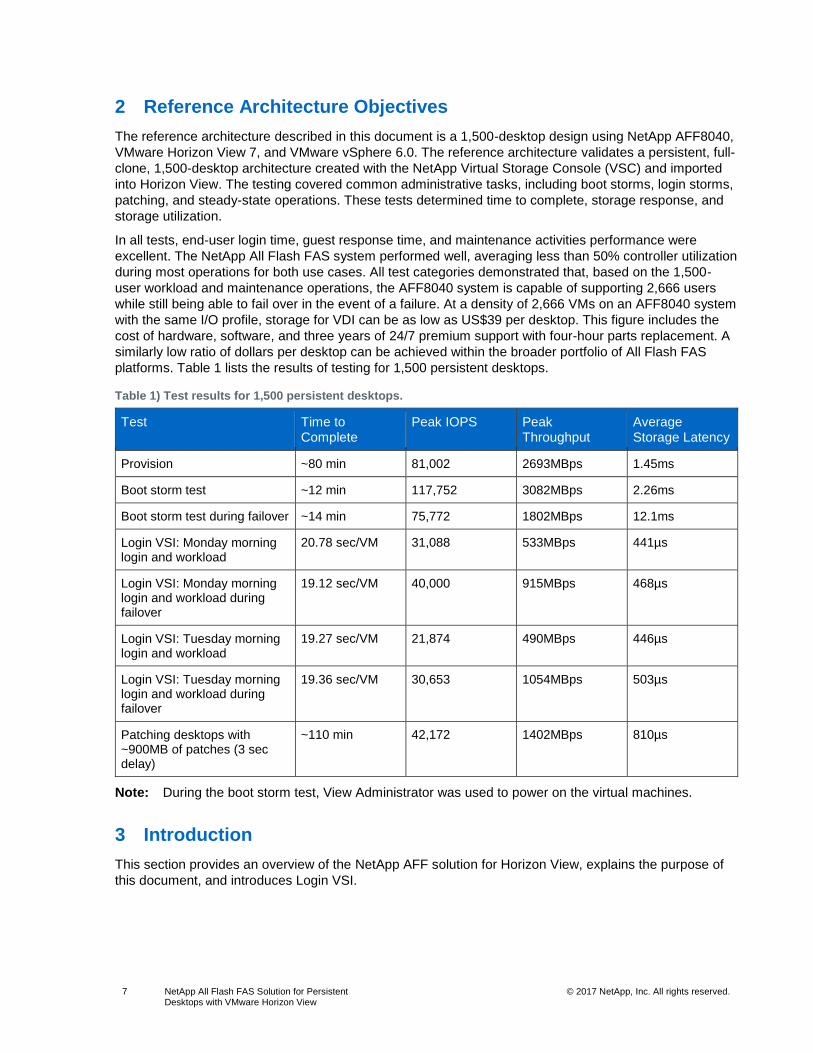
2 Reference Architecture Objectives
The reference architecture described in this document is a 1,500-desktop design using NetApp AFF8040,
VMware Horizon View 7, and VMware vSphere 6.0. The reference architecture validates a persistent, full-
clone, 1,500-desktop architecture created with the NetApp Virtual Storage Console (VSC) and imported
into Horizon View. The testing covered common administrative tasks, including boot storms, login storms,
patching, and steady-state operations. These tests determined time to complete, storage response, and
storage utilization.
In all tests, end-user login time, guest response time, and maintenance activities performance were
excellent. The NetApp All Flash FAS system performed well, averaging less than 50% controller utilization
during most operations for both use cases. All test categories demonstrated that, based on the 1,500-
user workload and maintenance operations, the AFF8040 system is capable of supporting 2,666 users
while still being able to fail over in the event of a failure. At a density of 2,666 VMs on an AFF8040 system
with the same I/O profile, storage for VDI can be as low as US$39 per desktop. This figure includes the
cost of hardware, software, and three years of 24/7 premium support with four-hour parts replacement. A
similarly low ratio of dollars per desktop can be achieved within the broader portfolio of All Flash FAS
platforms. Table 1 lists the results of testing for 1,500 persistent desktops.
Table 1) Test results for 1,500 persistent desktops.
Test Time to Complete
Peak IOPS Peak Throughput
Average Storage Latency
Provision ~80 min 81,002 2693MBps 1.45ms
Boot storm test ~12 min 117,752 3082MBps 2.26ms
Boot storm test during failover ~14 min 75,772 1802MBps 12.1ms
Login VSI: Monday morning login and workload
20.78 sec/VM 31,088 533MBps 441µs
Login VSI: Monday morning login and workload during failover
19.12 sec/VM 40,000 915MBps 468µs
Login VSI: Tuesday morning login and workload
19.27 sec/VM 21,874 490MBps 446µs
Login VSI: Tuesday morning login and workload during failover
19.36 sec/VM 30,653 1054MBps 503µs
Patching desktops with ~900MB of patches (3 sec delay)
~110 min 42,172 1402MBps 810µs
Note: During the boot storm test, View Administrator was used to power on the virtual machines.
3 Introduction
This section provides an overview of the NetApp AFF solution for Horizon View, explains the purpose of
this document, and introduces Login VSI.
8 NetApp All Flash FAS Solution for Persistent Desktops with VMware Horizon View
© 2017 NetApp, Inc. All rights reserved. © 2016 NetApp, Inc. All rights reserved.
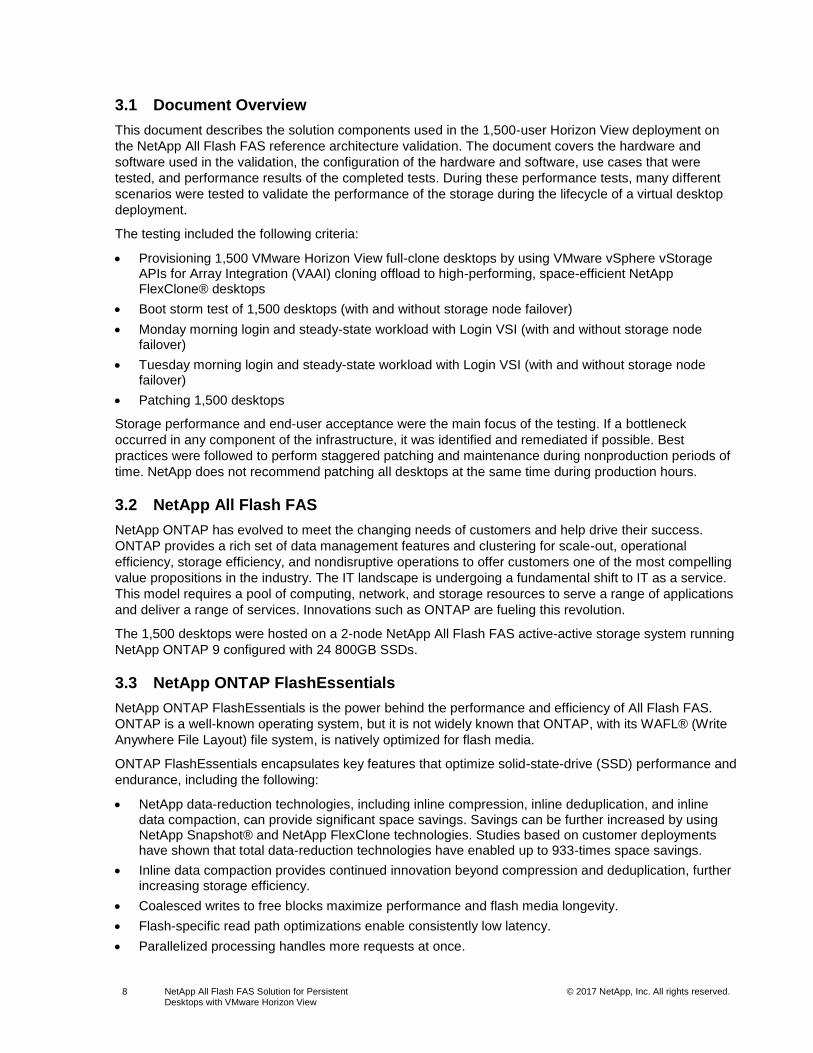
3.1 Document Overview
This document describes the solution components used in the 1,500-user Horizon View deployment on
the NetApp All Flash FAS reference architecture validation. The document covers the hardware and
software used in the validation, the configuration of the hardware and software, use cases that were
tested, and performance results of the completed tests. During these performance tests, many different
scenarios were tested to validate the performance of the storage during the lifecycle of a virtual desktop
deployment.
The testing included the following criteria:
• Provisioning 1,500 VMware Horizon View full-clone desktops by using VMware vSphere vStorage APIs for Array Integration (VAAI) cloning offload to high-performing, space-efficient NetApp FlexClone® desktops
• Boot storm test of 1,500 desktops (with and without storage node failover)
• Monday morning login and steady-state workload with Login VSI (with and without storage node failover)
• Tuesday morning login and steady-state workload with Login VSI (with and without storage node failover)
• Patching 1,500 desktops
Storage performance and end-user acceptance were the main focus of the testing. If a bottleneck
occurred in any component of the infrastructure, it was identified and remediated if possible. Best
practices were followed to perform staggered patching and maintenance during nonproduction periods of
time. NetApp does not recommend patching all desktops at the same time during production hours.
3.2 NetApp All Flash FAS
NetApp ONTAP has evolved to meet the changing needs of customers and help drive their success.
ONTAP provides a rich set of data management features and clustering for scale-out, operational
efficiency, storage efficiency, and nondisruptive operations to offer customers one of the most compelling
value propositions in the industry. The IT landscape is undergoing a fundamental shift to IT as a service.
This model requires a pool of computing, network, and storage resources to serve a range of applications
and deliver a range of services. Innovations such as ONTAP are fueling this revolution.
The 1,500 desktops were hosted on a 2-node NetApp All Flash FAS active-active storage system running
NetApp ONTAP 9 configured with 24 800GB SSDs.
3.3 NetApp ONTAP FlashEssentials
NetApp ONTAP FlashEssentials is the power behind the performance and efficiency of All Flash FAS.
ONTAP is a well-known operating system, but it is not widely known that ONTAP, with its WAFL® (Write
Anywhere File Layout) file system, is natively optimized for flash media.
ONTAP FlashEssentials encapsulates key features that optimize solid-state-drive (SSD) performance and
endurance, including the following:
• NetApp data-reduction technologies, including inline compression, inline deduplication, and inline data compaction, can provide significant space savings. Savings can be further increased by using NetApp Snapshot® and NetApp FlexClone technologies. Studies based on customer deployments have shown that total data-reduction technologies have enabled up to 933-times space savings.
• Inline data compaction provides continued innovation beyond compression and deduplication, further increasing storage efficiency.
• Coalesced writes to free blocks maximize performance and flash media longevity.
• Flash-specific read path optimizations enable consistently low latency.
• Parallelized processing handles more requests at once.
9 NetApp All Flash FAS Solution for Persistent Desktops with VMware Horizon View
© 2017 NetApp, Inc. All rights reserved. © 2016 NetApp, Inc. All rights reserved.
• Software-defined access to flash maximizes deployment flexibility.
• New advanced drive partitioning (ADPv2) increases storage efficiency and further increases usable capacity by almost 20%.
• Data fabric readiness enables live workload migration between flash and hard disk drive (HDD) tiers on the premises or to the cloud.
• Quality-of-service capability safeguards service-level objectives in multiworkload and multitenant environments.
3.4 NetApp ONTAP 9
NetApp ONTAP 9 is a major advance in the industry’s leading enterprise data management software.
ONTAP 9 combines new levels of simplicity and flexibility with powerful capabilities and efficiencies.
Customers can integrate the best of next-generation and traditional technologies, incorporating flash,
cloud, and software-defined architectures while building a foundation for their data fabric. Plus, new
customers and existing Data ONTAP 8.3 environments can quickly and easily use the rich data services
delivered by ONTAP 9.
An essential feature for VDI deployed on shared enterprise storage is the ability to deliver consistent and
dependable high performance. High performance must be coupled with nondisruptive operations, high
availability, scalability, and storage efficiency. Customers can depend on ONTAP 9 and All Flash FAS to
provide these essential elements.
Built on ONTAP unified scale-out architecture, All Flash FAS consistently meets or exceeds the high-
performance demands of VDI. All Flash FAS also provides rich data management capabilities, such as
Integrated Data Protection and nondisruptive upgrades and data migration. These features allow
customers to eliminate performance silos and seamlessly integrate All Flash FAS into a shared
infrastructure. ONTAP delivers enhanced inline deduplication and a completely new inline data-
compaction capability that significantly reduces the amount of flash storage required, with no effect on
system performance. It also provides industry-leading ecosystem integration with database applications
that makes the administration of databases and storage systems far more efficient than other flash
storage solutions on the market.
NetApp is a global enterprise scale-out storage and data management fabric provider, and ONTAP has
been an industry-leading operating system since 2012. On-site ready but cloud connected, ONTAP is a
complete solution that is future-proof in a rapidly changing technology environment.
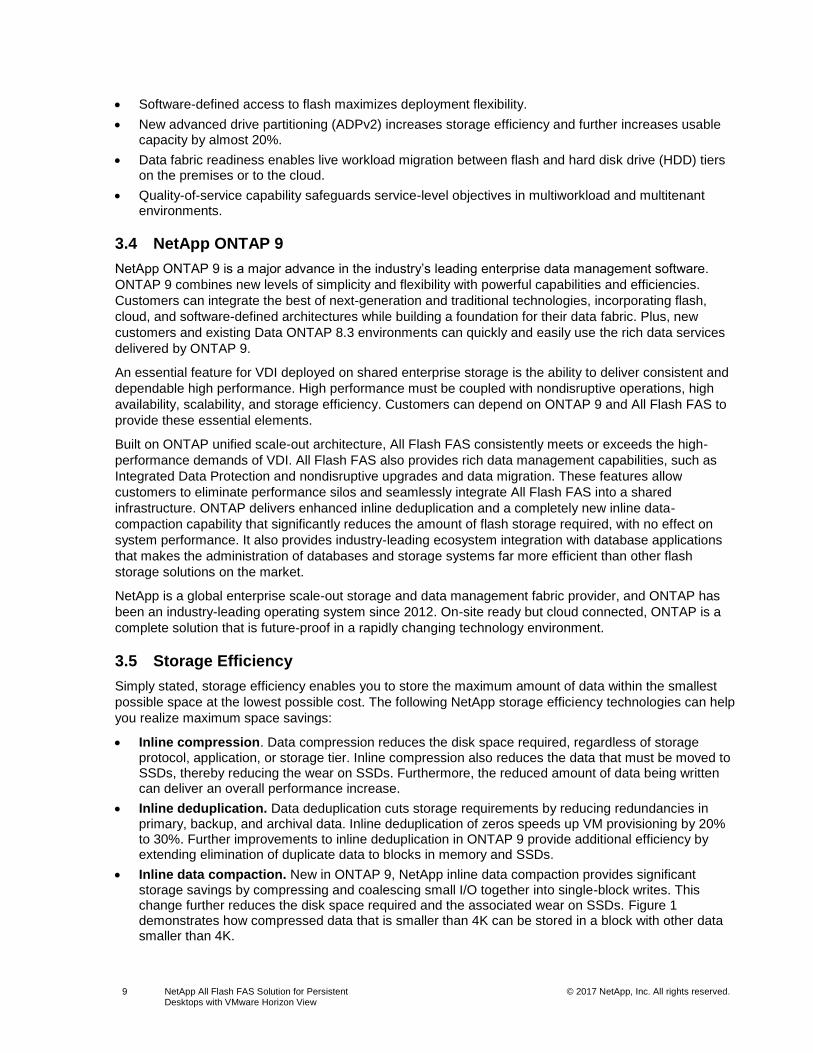
3.5 Storage Efficiency
Simply stated, storage efficiency enables you to store the maximum amount of data within the smallest
possible space at the lowest possible cost. The following NetApp storage efficiency technologies can help
you realize maximum space savings:
• Inline compression. Data compression reduces the disk space required, regardless of storage protocol, application, or storage tier. Inline compression also reduces the data that must be moved to SSDs, thereby reducing the wear on SSDs. Furthermore, the reduced amount of data being written can deliver an overall performance increase.
• Inline deduplication. Data deduplication cuts storage requirements by reducing redundancies in primary, backup, and archival data. Inline deduplication of zeros speeds up VM provisioning by 20% to 30%. Further improvements to inline deduplication in ONTAP 9 provide additional efficiency by extending elimination of duplicate data to blocks in memory and SSDs.
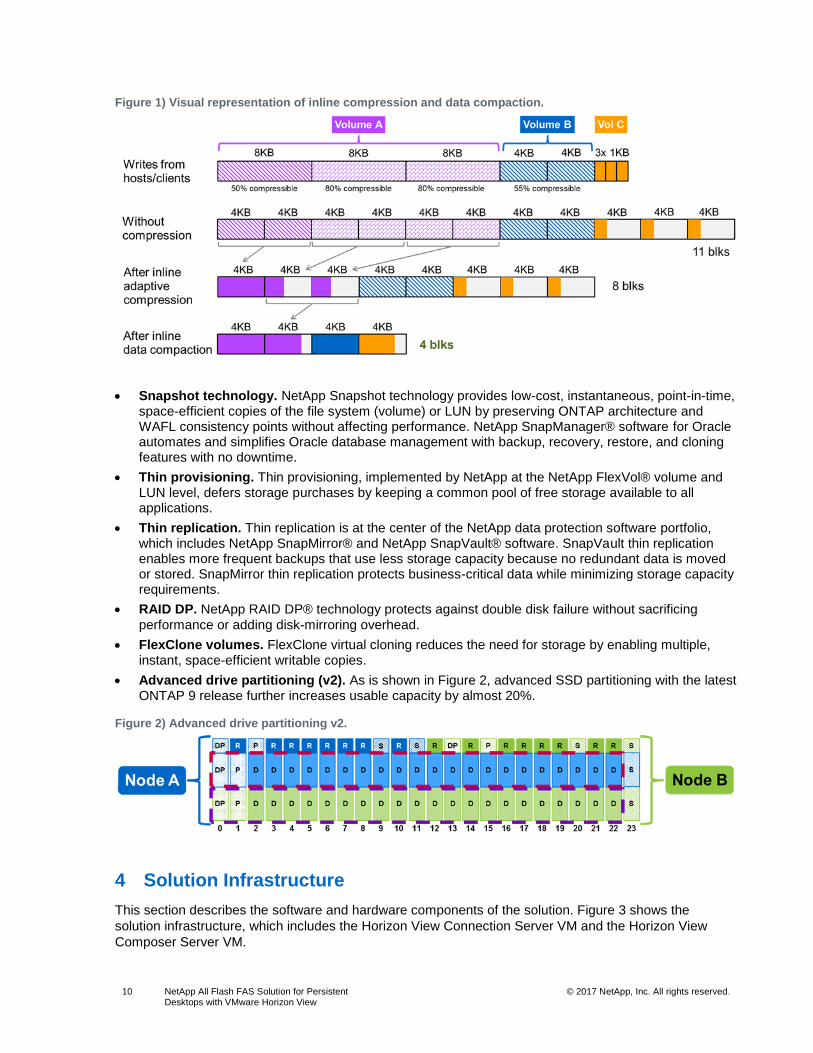
• Inline data compaction. New in ONTAP 9, NetApp inline data compaction provides significant storage savings by compressing and coalescing small I/O together into single-block writes. This change further reduces the disk space required and the associated wear on SSDs. Figure 1 demonstrates how compressed data that is smaller than 4K can be stored in a block with other data smaller than 4K.
10 NetApp All Flash FAS Solution for Persistent Desktops with VMware Horizon View
© 2017 NetApp, Inc. All rights reserved. © 2016 NetApp, Inc. All rights reserved.
Figure 1) Visual representation of inline compression and data compaction.
• Snapshot technology. NetApp Snapshot technology provides low-cost, instantaneous, point-in-time, space-efficient copies of the file system (volume) or LUN by preserving ONTAP architecture and WAFL consistency points without affecting performance. NetApp SnapManager® software for Oracle automates and simplifies Oracle database management with backup, recovery, restore, and cloning features with no downtime.
• Thin provisioning. Thin provisioning, implemented by NetApp at the NetApp FlexVol® volume and LUN level, defers storage purchases by keeping a common pool of free storage available to all applications.
• Thin replication. Thin replication is at the center of the NetApp data protection software portfolio, which includes NetApp SnapMirror® and NetApp SnapVault® software. SnapVault thin replication enables more frequent backups that use less storage capacity because no redundant data is moved or stored. SnapMirror thin replication protects business-critical data while minimizing storage capacity requirements.
• RAID DP. NetApp RAID DP® technology protects against double disk failure without sacrificing
performance or adding disk-mirroring overhead.
• FlexClone volumes. FlexClone virtual cloning reduces the need for storage by enabling multiple, instant, space-efficient writable copies.
• Advanced drive partitioning (v2). As is shown in Figure 2, advanced SSD partitioning with the latest ONTAP 9 release further increases usable capacity by almost 20%.
Figure 2) Advanced drive partitioning v2.
4 Solution Infrastructure
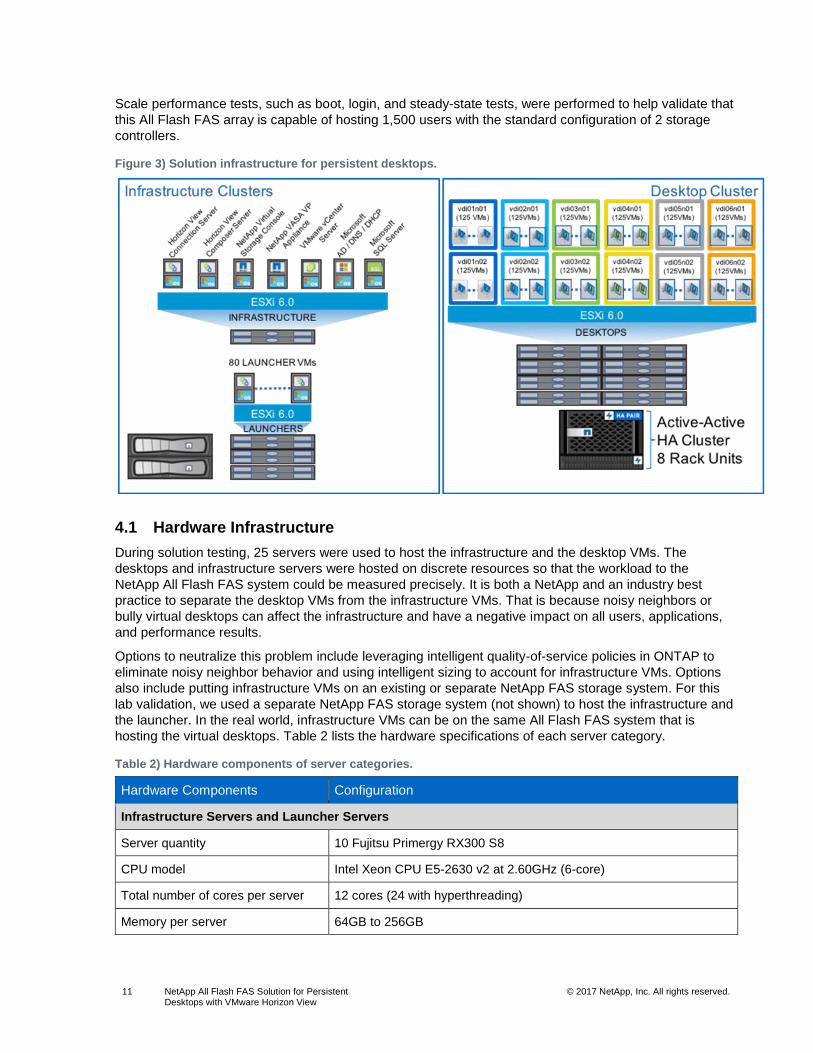
This section describes the software and hardware components of the solution. Figure 3 shows the
solution infrastructure, which includes the Horizon View Connection Server VM and the Horizon View
Composer Server VM.
11 NetApp All Flash FAS Solution for Persistent Desktops with VMware Horizon View
© 2017 NetApp, Inc. All rights reserved. © 2016 NetApp, Inc. All rights reserved.
Scale performance tests, such as boot, login, and steady-state tests, were performed to help validate that
this All Flash FAS array is capable of hosting 1,500 users with the standard configuration of 2 storage
controllers.
Figure 3) Solution infrastructure for persistent desktops.
4.1 Hardware Infrastructure
During solution testing, 25 servers were used to host the infrastructure and the desktop VMs. The
desktops and infrastructure servers were hosted on discrete resources so that the workload to the
NetApp All Flash FAS system could be measured precisely. It is both a NetApp and an industry best
practice to separate the desktop VMs from the infrastructure VMs. That is because noisy neighbors or
bully virtual desktops can affect the infrastructure and have a negative impact on all users, applications,
and performance results.
Options to neutralize this problem include leveraging intelligent quality-of-service policies in ONTAP to
eliminate noisy neighbor behavior and using intelligent sizing to account for infrastructure VMs. Options
also include putting infrastructure VMs on an existing or separate NetApp FAS storage system. For this
lab validation, we used a separate NetApp FAS storage system (not shown) to host the infrastructure and
the launcher. In the real world, infrastructure VMs can be on the same All Flash FAS system that is
hosting the virtual desktops. Table 2 lists the hardware specifications of each server category.
Table 2) Hardware components of server categories.
Hardware Components Configuration
Infrastructure Servers and Launcher Servers
Server quantity 10 Fujitsu Primergy RX300 S8
CPU model Intel Xeon CPU E5-2630 v2 at 2.60GHz (6-core)
Total number of cores per server 12 cores (24 with hyperthreading)
Memory per server 64GB to 256GB
12 NetApp All Flash FAS Solution for Persistent Desktops with VMware Horizon View
© 2017 NetApp, Inc. All rights reserved. © 2016 NetApp, Inc. All rights reserved.
Hardware Components Configuration
Desktop Servers
Server quantity Mix of 15 Fujitsu Primergy RX2540 M1
CPU model Intel Xeon CPU E5-2670 v2 at 2.30GHz (12-core)
Total number of cores per server 16 to 24 cores (32 to 48 with hyperthreading)
Memory per server 256 to 512GB
Storage
NetApp controller AFF8040A
Disk shelf 1 DS2246
Disk drives 24 800GB SSDs
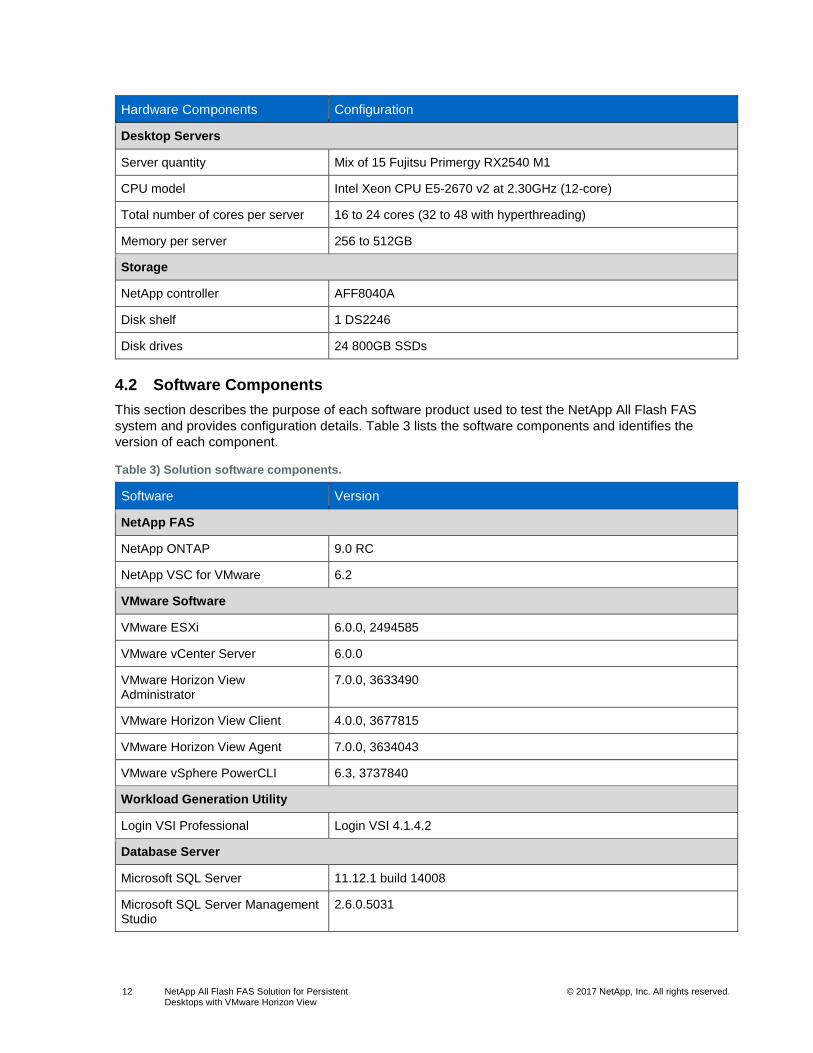
4.2 Software Components
This section describes the purpose of each software product used to test the NetApp All Flash FAS
system and provides configuration details. Table 3 lists the software components and identifies the
version of each component.
Table 3) Solution software components.
Software Version
NetApp FAS
NetApp ONTAP 9.0 RC
NetApp VSC for VMware 6.2
VMware Software
VMware ESXi 6.0.0, 2494585
VMware vCenter Server 6.0.0
VMware Horizon View Administrator
7.0.0, 3633490
VMware Horizon View Client 4.0.0, 3677815
VMware Horizon View Agent 7.0.0, 3634043
VMware vSphere PowerCLI 6.3, 3737840
Workload Generation Utility
Login VSI Professional Login VSI 4.1.4.2
Database Server
Microsoft SQL Server 11.12.1 build 14008
Microsoft SQL Server Management Studio
2.6.0.5031
13 NetApp All Flash FAS Solution for Persistent Desktops with VMware Horizon View
© 2017 NetApp, Inc. All rights reserved. © 2016 NetApp, Inc. All rights reserved.
4.3 Login VSI
Login Virtual Session Indexer (Login VSI) is the industry-standard load-testing tool for
testing the performance and scalability of centralized Windows desktop environments such
as server-based computing (SBC) and VDI.
Login VSI is used for testing and benchmarking by all major hardware and software vendors
and is recommended by both leading IT analysts and the technical community. Login VSI is vendor
independent and works with standardized user workloads; therefore, conclusions based on Login VSI test
data are objective, verifiable, and replicable.
SBC-oriented and VDI-oriented vendor organizations that are committed to enhancing the end-user
experience in the most efficient way use Login VSI as an objective method of testing, benchmarking, and
improving the performance and scalability of their solutions. VSImax provides proof (vendor independent,
industry standard, and easy to understand) to innovative technology vendors of the power, the scalability,
and the gains of their solutions.
Login VSI–based test results are published in technical white papers and are presented at conferences.
Login VSI is used by end-user organizations, system integrators, hosting providers, and testing
companies. It is also the standard tool used in all tests executed in the internationally acclaimed Project
Virtual Reality Check.
For more information about Login VSI or for a free test license, refer to the Login VSI website.
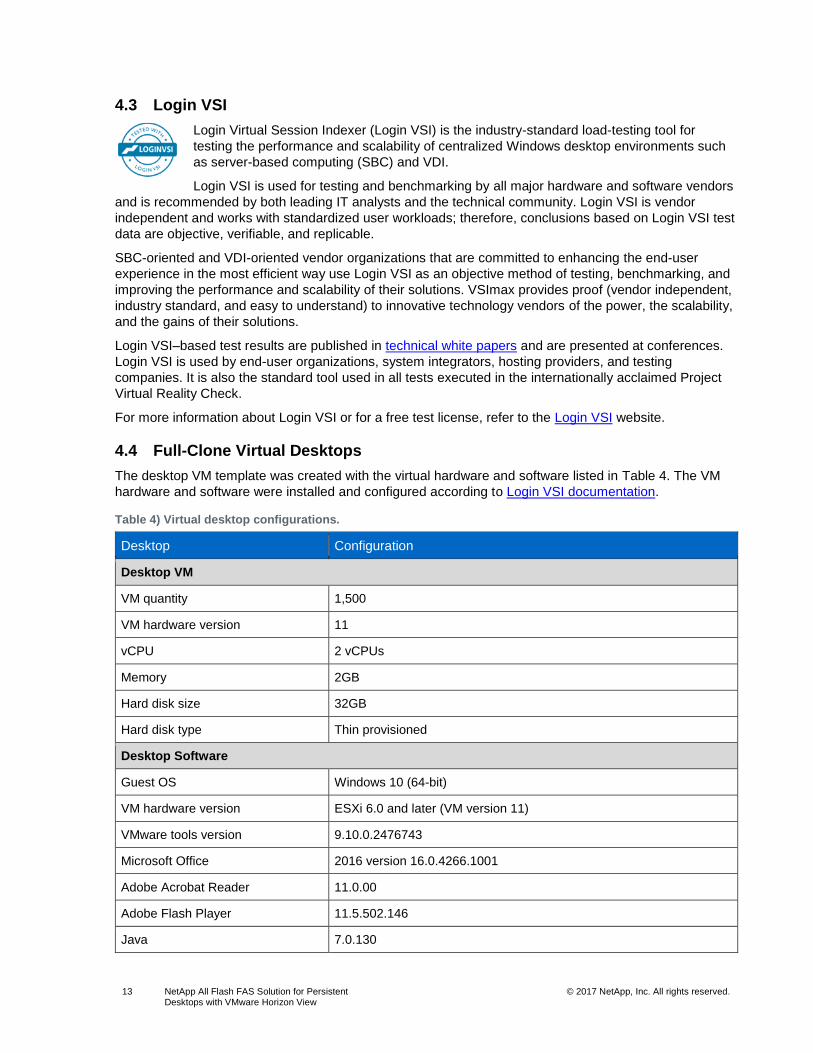
4.4 Full-Clone Virtual Desktops
The desktop VM template was created with the virtual hardware and software listed in Table 4. The VM
hardware and software were installed and configured according to Login VSI documentation.
Table 4) Virtual desktop configurations.
Desktop Configuration
Desktop VM
VM quantity 1,500
VM hardware version 11
vCPU 2 vCPUs
Memory 2GB
Hard disk size 32GB
Hard disk type Thin provisioned
Desktop Software
Guest OS Windows 10 (64-bit)
VM hardware version ESXi 6.0 and later (VM version 11)
VMware tools version 9.10.0.2476743
Microsoft Office 2016 version 16.0.4266.1001
Adobe Acrobat Reader 11.0.00
Adobe Flash Player 11.5.502.146
Java 7.0.130
14 NetApp All Flash FAS Solution for Persistent Desktops with VMware Horizon View
© 2017 NetApp, Inc. All rights reserved. © 2016 NetApp, Inc. All rights reserved.
Desktop Configuration
Doro PDF 1.82
VMware Horizon View Agent 7.0.0, 3634043
Login VSI target software 4.1.4.2
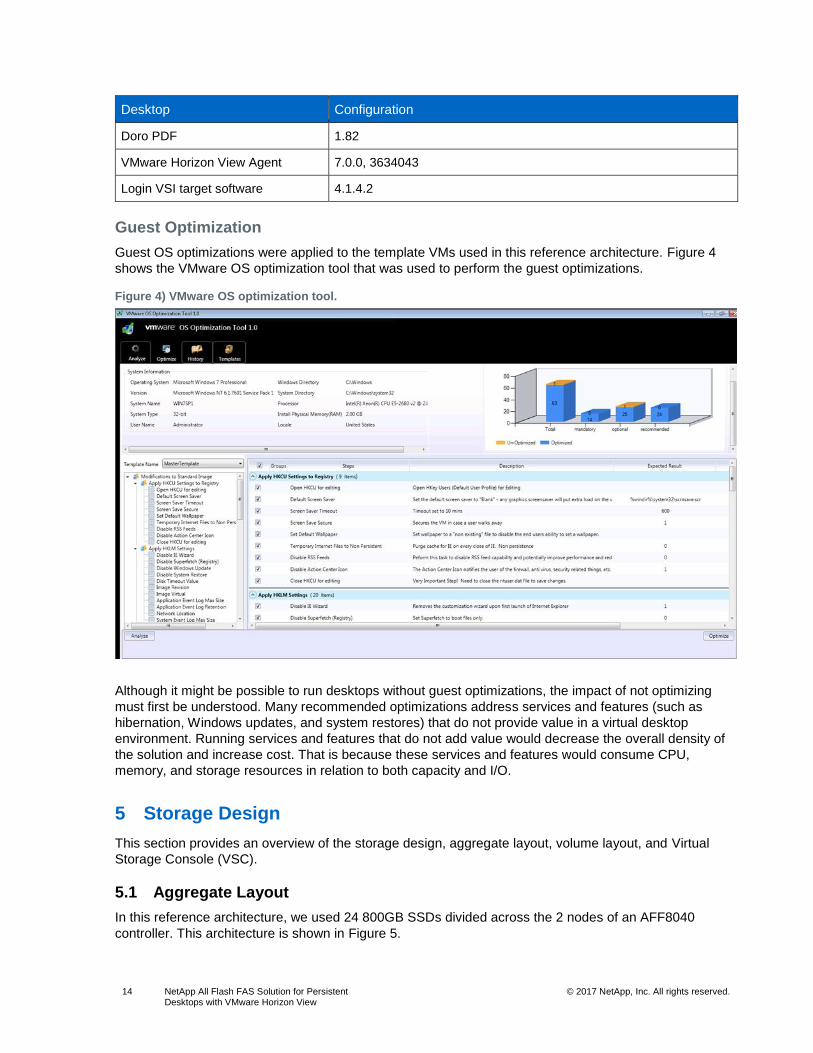
Guest Optimization
Guest OS optimizations were applied to the template VMs used in this reference architecture. Figure 4
shows the VMware OS optimization tool that was used to perform the guest optimizations.
Figure 4) VMware OS optimization tool.
Although it might be possible to run desktops without guest optimizations, the impact of not optimizing
must first be understood. Many recommended optimizations address services and features (such as
hibernation, Windows updates, and system restores) that do not provide value in a virtual desktop
environment. Running services and features that do not add value would decrease the overall density of
the solution and increase cost. That is because these services and features would consume CPU,
memory, and storage resources in relation to both capacity and I/O.
5 Storage Design
This section provides an overview of the storage design, aggregate layout, volume layout, and Virtual
Storage Console (VSC).
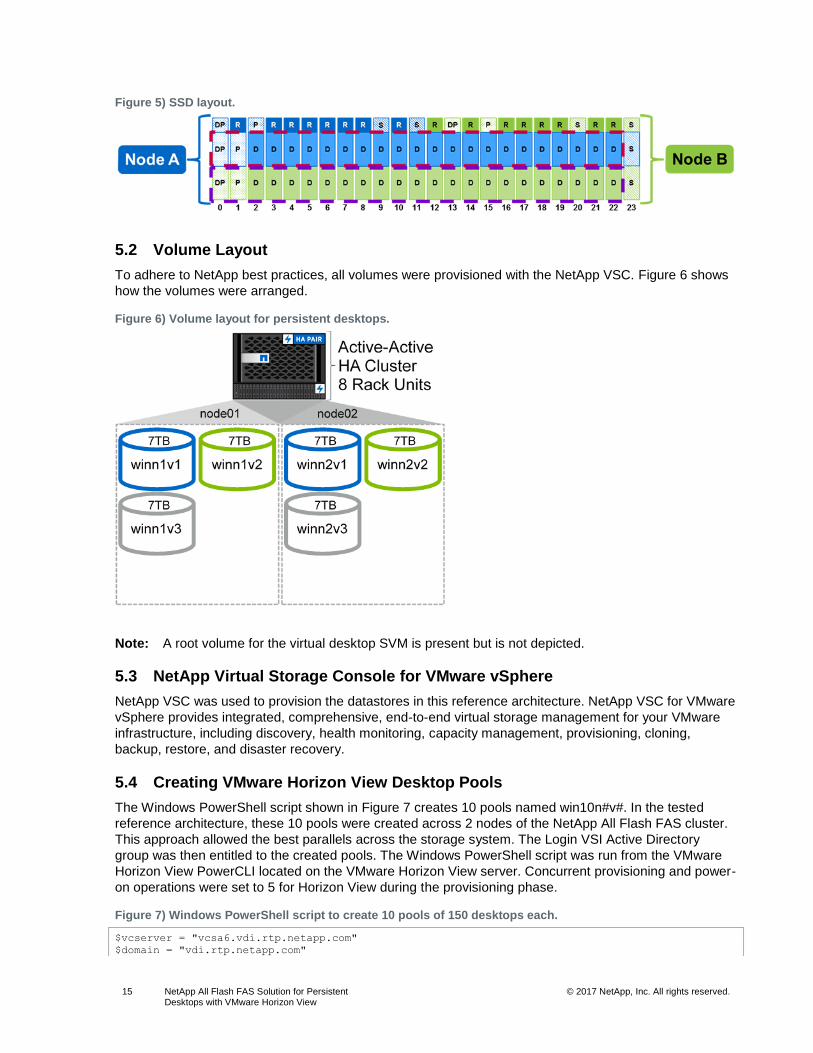
5.1 Aggregate Layout
In this reference architecture, we used 24 800GB SSDs divided across the 2 nodes of an AFF8040
controller. This architecture is shown in Figure 5.
15 NetApp All Flash FAS Solution for Persistent Desktops with VMware Horizon View
© 2017 NetApp, Inc. All rights reserved. © 2016 NetApp, Inc. All rights reserved.
Figure 5) SSD layout.
5.2 Volume Layout
To adhere to NetApp best practices, all volumes were provisioned with the NetApp VSC. Figure 6 shows
how the volumes were arranged.
Figure 6) Volume layout for persistent desktops.
Note: A root volume for the virtual desktop SVM is present but is not depicted.
5.3 NetApp Virtual Storage Console for VMware vSphere
NetApp VSC was used to provision the datastores in this reference architecture. NetApp VSC for VMware
vSphere provides integrated, comprehensive, end-to-end virtual storage management for your VMware
infrastructure, including discovery, health monitoring, capacity management, provisioning, cloning,
backup, restore, and disaster recovery.
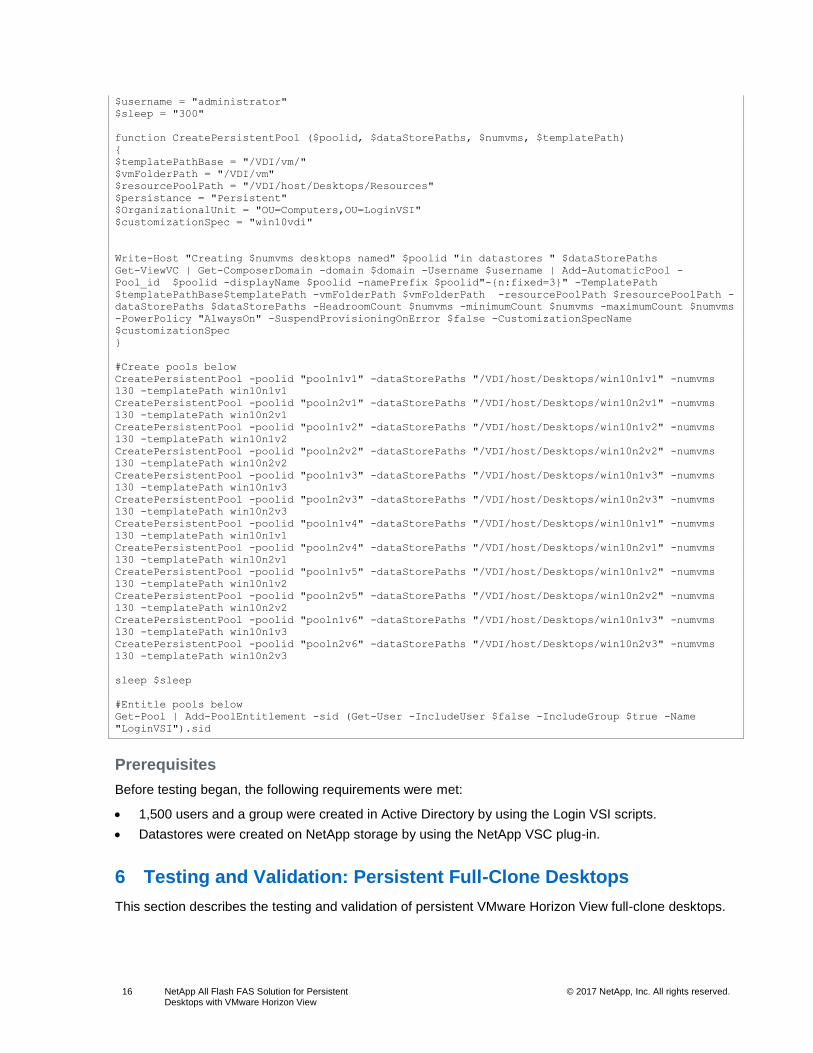
5.4 Creating VMware Horizon View Desktop Pools
The Windows PowerShell script shown in Figure 7 creates 10 pools named win10n#v#. In the tested
reference architecture, these 10 pools were created across 2 nodes of the NetApp All Flash FAS cluster.
This approach allowed the best parallels across the storage system. The Login VSI Active Directory
group was then entitled to the created pools. The Windows PowerShell script was run from the VMware
Horizon View PowerCLI located on the VMware Horizon View server. Concurrent provisioning and power-
on operations were set to 5 for Horizon View during the provisioning phase.
Figure 7) Windows PowerShell script to create 10 pools of 150 desktops each.
$vcserver = "vcsa6.vdi.rtp.netapp.com"
$domain = "vdi.rtp.netapp.com"
16 NetApp All Flash FAS Solution for Persistent Desktops with VMware Horizon View
© 2017 NetApp, Inc. All rights reserved. © 2016 NetApp, Inc. All rights reserved.
$username = "administrator"
$sleep = "300"
function CreatePersistentPool ($poolid, $dataStorePaths, $numvms, $templatePath)
{
$templatePathBase = "/VDI/vm/"
$vmFolderPath = "/VDI/vm"
$resourcePoolPath = "/VDI/host/Desktops/Resources"
$persistance = "Persistent"
$OrganizationalUnit = "OU=Computers,OU=LoginVSI"
$customizationSpec = "win10vdi"
Write-Host "Creating $numvms desktops named" $poolid "in datastores " $dataStorePaths
Get-ViewVC | Get-ComposerDomain -domain $domain -Username $username | Add-AutomaticPool -
Pool_id $poolid -displayName $poolid -namePrefix $poolid"-{n:fixed=3}" -TemplatePath
$templatePathBase$templatePath -vmFolderPath $vmFolderPath -resourcePoolPath $resourcePoolPath -
dataStorePaths $dataStorePaths -HeadroomCount $numvms -minimumCount $numvms -maximumCount $numvms
-PowerPolicy "AlwaysOn" -SuspendProvisioningOnError $false -CustomizationSpecName
$customizationSpec
}
#Create pools below
CreatePersistentPool -poolid "pooln1v1" -dataStorePaths "/VDI/host/Desktops/win10n1v1" -numvms
130 -templatePath win10n1v1
CreatePersistentPool -poolid "pooln2v1" -dataStorePaths "/VDI/host/Desktops/win10n2v1" -numvms
130 -templatePath win10n2v1
CreatePersistentPool -poolid "pooln1v2" -dataStorePaths "/VDI/host/Desktops/win10n1v2" -numvms
130 -templatePath win10n1v2
CreatePersistentPool -poolid "pooln2v2" -dataStorePaths "/VDI/host/Desktops/win10n2v2" -numvms
130 -templatePath win10n2v2
CreatePersistentPool -poolid "pooln1v3" -dataStorePaths "/VDI/host/Desktops/win10n1v3" -numvms
130 -templatePath win10n1v3
CreatePersistentPool -poolid "pooln2v3" -dataStorePaths "/VDI/host/Desktops/win10n2v3" -numvms
130 -templatePath win10n2v3
CreatePersistentPool -poolid "pooln1v4" -dataStorePaths "/VDI/host/Desktops/win10n1v1" -numvms
130 -templatePath win10n1v1
CreatePersistentPool -poolid "pooln2v4" -dataStorePaths "/VDI/host/Desktops/win10n2v1" -numvms
130 -templatePath win10n2v1
CreatePersistentPool -poolid "pooln1v5" -dataStorePaths "/VDI/host/Desktops/win10n1v2" -numvms
130 -templatePath win10n1v2
CreatePersistentPool -poolid "pooln2v5" -dataStorePaths "/VDI/host/Desktops/win10n2v2" -numvms
130 -templatePath win10n2v2
CreatePersistentPool -poolid "pooln1v6" -dataStorePaths "/VDI/host/Desktops/win10n1v3" -numvms
130 -templatePath win10n1v3
CreatePersistentPool -poolid "pooln2v6" -dataStorePaths "/VDI/host/Desktops/win10n2v3" -numvms
130 -templatePath win10n2v3
sleep $sleep
#Entitle pools below
Get-Pool | Add-PoolEntitlement -sid (Get-User -IncludeUser $false -IncludeGroup $true -Name
"LoginVSI").sid
Prerequisites
Before testing began, the following requirements were met:
• 1,500 users and a group were created in Active Directory by using the Login VSI scripts.
• Datastores were created on NetApp storage by using the NetApp VSC plug-in.
6 Testing and Validation: Persistent Full-Clone Desktops
This section describes the testing and validation of persistent VMware Horizon View full-clone desktops.
17 NetApp All Flash FAS Solution for Persistent Desktops with VMware Horizon View
© 2017 NetApp, Inc. All rights reserved. © 2016 NetApp, Inc. All rights reserved.
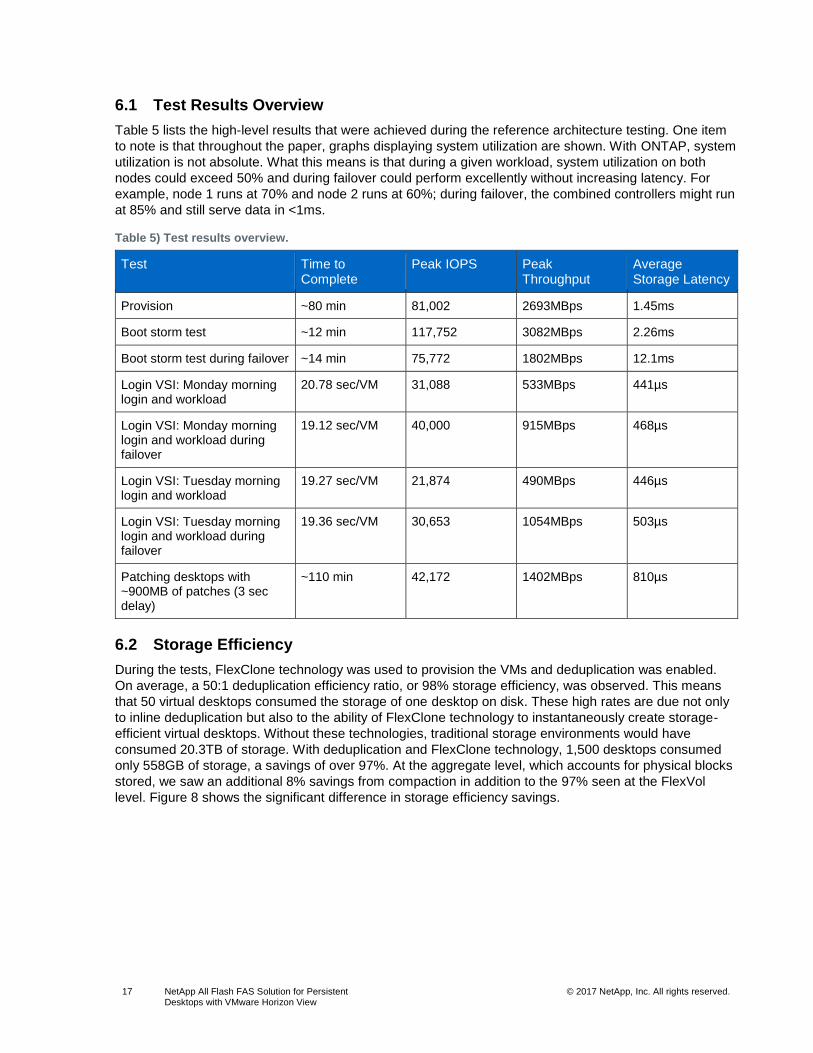
6.1 Test Results Overview
Table 5 lists the high-level results that were achieved during the reference architecture testing. One item
to note is that throughout the paper, graphs displaying system utilization are shown. With ONTAP, system
utilization is not absolute. What this means is that during a given workload, system utilization on both
nodes could exceed 50% and during failover could perform excellently without increasing latency. For
example, node 1 runs at 70% and node 2 runs at 60%; during failover, the combined controllers might run
at 85% and still serve data in <1ms.
Table 5) Test results overview.
Test Time to Complete
Peak IOPS Peak Throughput
Average Storage Latency
Provision ~80 min 81,002 2693MBps 1.45ms
Boot storm test ~12 min 117,752 3082MBps 2.26ms
Boot storm test during failover ~14 min 75,772 1802MBps 12.1ms
Login VSI: Monday morning login and workload
20.78 sec/VM 31,088 533MBps 441µs
Login VSI: Monday morning login and workload during failover
19.12 sec/VM 40,000 915MBps 468µs
Login VSI: Tuesday morning login and workload
19.27 sec/VM 21,874 490MBps 446µs
Login VSI: Tuesday morning login and workload during failover
19.36 sec/VM 30,653 1054MBps 503µs
Patching desktops with ~900MB of patches (3 sec delay)
~110 min 42,172 1402MBps 810µs
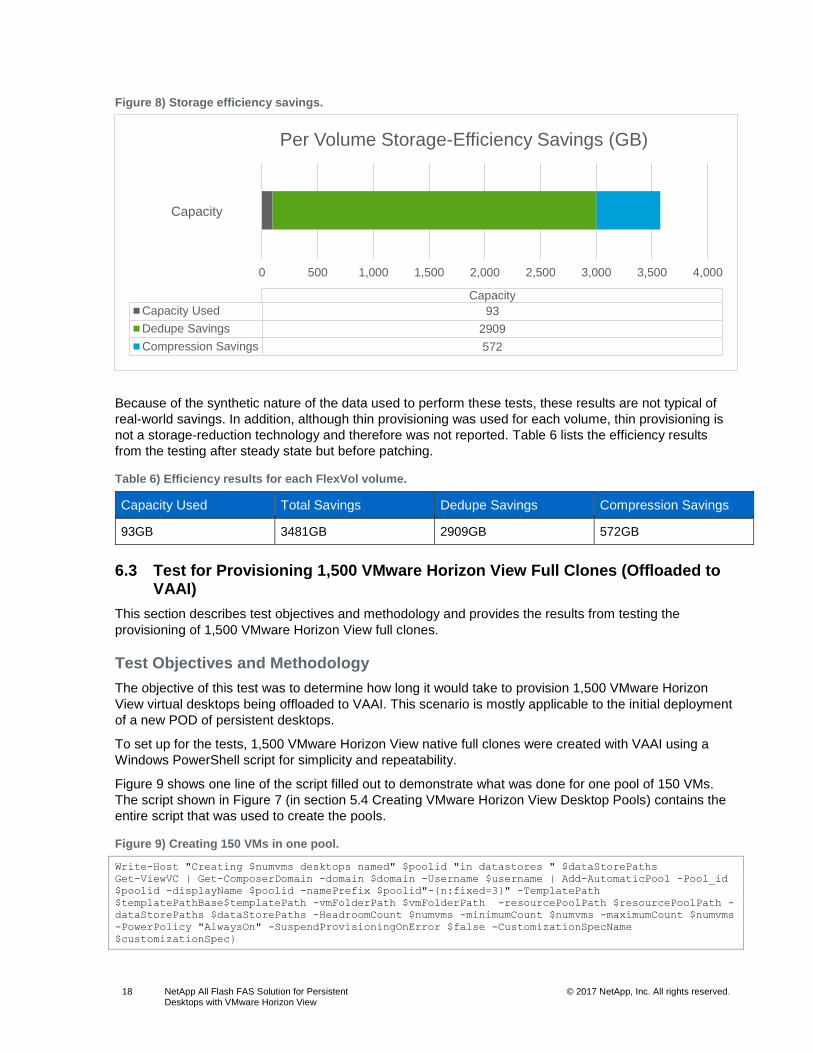
6.2 Storage Efficiency
During the tests, FlexClone technology was used to provision the VMs and deduplication was enabled.
On average, a 50:1 deduplication efficiency ratio, or 98% storage efficiency, was observed. This means
that 50 virtual desktops consumed the storage of one desktop on disk. These high rates are due not only
to inline deduplication but also to the ability of FlexClone technology to instantaneously create storage-
efficient virtual desktops. Without these technologies, traditional storage environments would have
consumed 20.3TB of storage. With deduplication and FlexClone technology, 1,500 desktops consumed
only 558GB of storage, a savings of over 97%. At the aggregate level, which accounts for physical blocks
stored, we saw an additional 8% savings from compaction in addition to the 97% seen at the FlexVol
level. Figure 8 shows the significant difference in storage efficiency savings.
18 NetApp All Flash FAS Solution for Persistent Desktops with VMware Horizon View
© 2017 NetApp, Inc. All rights reserved. © 2016 NetApp, Inc. All rights reserved.
Figure 8) Storage efficiency savings.
Because of the synthetic nature of the data used to perform these tests, these results are not typical of
real-world savings. In addition, although thin provisioning was used for each volume, thin provisioning is
not a storage-reduction technology and therefore was not reported. Table 6 lists the efficiency results
from the testing after steady state but before patching.
Table 6) Efficiency results for each FlexVol volume.
Capacity Used Total Savings Dedupe Savings Compression Savings
93GB 3481GB 2909GB 572GB
6.3 Test for Provisioning 1,500 VMware Horizon View Full Clones (Offloaded to VAAI)
This section describes test objectives and methodology and provides the results from testing the
provisioning of 1,500 VMware Horizon View full clones.
Test Objectives and Methodology
The objective of this test was to determine how long it would take to provision 1,500 VMware Horizon
View virtual desktops being offloaded to VAAI. This scenario is mostly applicable to the initial deployment
of a new POD of persistent desktops.
To set up for the tests, 1,500 VMware Horizon View native full clones were created with VAAI using a
Windows PowerShell script for simplicity and repeatability.
Figure 9 shows one line of the script filled out to demonstrate what was done for one pool of 150 VMs.
The script shown in Figure 7 (in section 5.4 Creating VMware Horizon View Desktop Pools) contains the
entire script that was used to create the pools.
Figure 9) Creating 150 VMs in one pool.
Write-Host "Creating $numvms desktops named" $poolid "in datastores " $dataStorePaths
Get-ViewVC | Get-ComposerDomain -domain $domain -Username $username | Add-AutomaticPool -Pool_id
$poolid -displayName $poolid -namePrefix $poolid"-{n:fixed=3}" -TemplatePath
$templatePathBase$templatePath -vmFolderPath $vmFolderPath -resourcePoolPath $resourcePoolPath -
dataStorePaths $dataStorePaths -HeadroomCount $numvms -minimumCount $numvms -maximumCount $numvms
-PowerPolicy "AlwaysOn" -SuspendProvisioningOnError $false -CustomizationSpecName
$customizationSpec}
0 500 1,000 1,500 2,000 2,500 3,000 3,500 4,000
Capacity
Capacity
Capacity Used 93
Dedupe Savings 2909
Compression Savings 572
Per Volume Storage-Efficiency Savings (GB)
19 NetApp All Flash FAS Solution for Persistent Desktops with VMware Horizon View
© 2017 NetApp, Inc. All rights reserved. © 2016 NetApp, Inc. All rights reserved.
For this testing, we chose specific pool and provisioning settings that would stress the storage while
providing the most granular reporting capabilities. NetApp does not advocate using or disabling these
features because each might provide significant value in the correct use case. NetApp recommends that
customers test these features to understand their impacts before deploying with these features enabled.
These features include, but are not limited to, persona management, replica tiering, user data disks, and
disposable file disks. Table 7 lists the provisioning data that was gathered.
Table 7) Results for full-clone provisioning of 1,500 virtual desktops.
Time Average Latency
Peak IOPS
Avg. IOPS Peak Throughput
Avg. Throughput
Peak Storage CPU
Avg. Storage CPU
~80 min 1.45ms 81,002 43,172 2693MBps 1216MBps 100% 68%
Note: All desktops had the status Available in VMware Horizon View.
Note: CPU and latency measurements are based on the average across both nodes of the cluster. IOPS and throughput are based on a combined total of each.
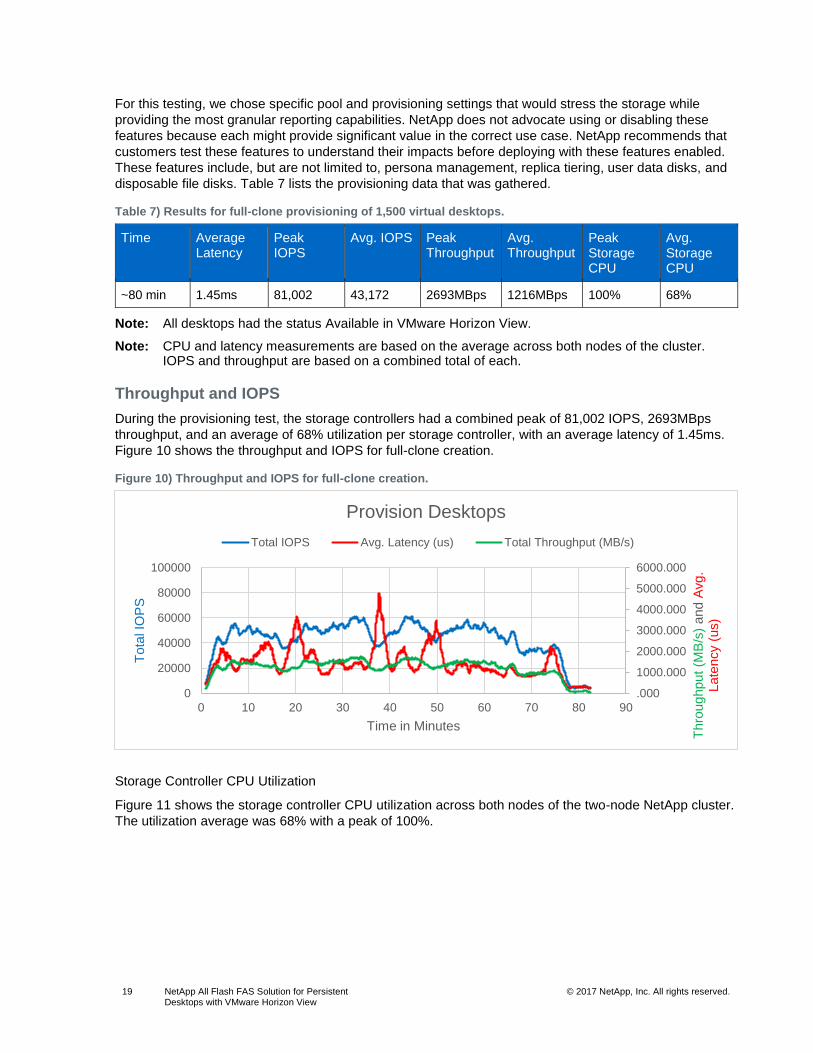
Throughput and IOPS
During the provisioning test, the storage controllers had a combined peak of 81,002 IOPS, 2693MBps
throughput, and an average of 68% utilization per storage controller, with an average latency of 1.45ms.
Figure 10 shows the throughput and IOPS for full-clone creation.
Figure 10) Throughput and IOPS for full-clone creation.
Storage Controller CPU Utilization
Figure 11 shows the storage controller CPU utilization across both nodes of the two-node NetApp cluster.
The utilization average was 68% with a peak of 100%.
.000
1000.000
2000.000
3000.000
4000.000
5000.000
6000.000
0
20000
40000
60000
80000
100000
0 10 20 30 40 50 60 70 80 90T
hro
ughput
(MB
/s)
and A
vg.
Late
ncy (
us)
Tota
l IO
PS
Time in Minutes
Provision Desktops
Total IOPS Avg. Latency (us) Total Throughput (MB/s)
20 NetApp All Flash FAS Solution for Persistent Desktops with VMware Horizon View
© 2017 NetApp, Inc. All rights reserved. © 2016 NetApp, Inc. All rights reserved.
Figure 11) Storage controller CPU utilization for full-clone creation.
Customer Impact (Test Conclusions)
During the provisioning of 1,500 persistent desktops, the storage controller had enough headroom to
perform a significantly greater number of concurrent provisioning operations. On average, the NetApp All
Flash FAS system provisioned VMs at a rate of 18s per VM. Because provisioning is a one-time
operation, we allowed provisioning to fully utilize the resources of the controller to provision as quickly as
possible. Slower provisioning would result in better efficiencies per FlexVol volume but longer overall
provisioning time.
The offload of the clone creation from the ESXi host to VAAI allowed each of the clones to be created in a
fast and storage-efficient manner. Cloning through VAAI for Virtual Machine File System does not copy
each block on the storage but instead clones block ranges within the LUN that reference only the original
blocks. Therefore, the VMs are prededuplicated. This process delivers faster cloning, less impact on the
host, and a reduction in space during provisioning. The rate at which the storage acknowledges clone
requests can exhaust the default throttling limits employed by the Horizon View Provisioning process. So
that provisioning completes in a smooth and successful manner, adjustments to the default throttling
setting might be necessary. In our tests, the maximum concurrent provisioning and power-on settings
were set to 5 simultaneous operations.
6.4 Boot Storm Test
This section describes test objectives and methodology and provides results from boot storm testing.
Test Objectives and Methodology
The objective of this test was to determine how long it would take to boot 1,500 virtual desktops. This
situation might occur, for example, after maintenance activities and server host failures.
This test was performed by powering on all 1,500 VMs from within the VMware vCenter and observing
when the status of all VMs in VMware Horizon View changed to Available. Table 8 lists the boot storm
data that was gathered.
0%
20%
40%
60%
80%
100%
0 10 20 30 40 50 60 70 80 90
Avg.
CP
U
Time in Minutes
Provision Desktops Avg. CPU
Node1 Avg. CPU Node2 Avg. CPU
21 NetApp All Flash FAS Solution for Persistent Desktops with VMware Horizon View
© 2017 NetApp, Inc. All rights reserved. © 2016 NetApp, Inc. All rights reserved.
Table 8) results for full-clone boot storm.
Time Average Latency
Peak IOPS
Avg. IOPS Peak Throughput
Avg. Throughput
Peak Storage CPU
Avg. Storage CPU
~12 min 2.26ms 117,752 57,231 3082MBps 1469MBps 100% 58%
Note: All desktops had the status Provisioned in VMware Horizon View.
Note: CPU and latency measurements are based on the average across both nodes of the cluster. IOPS and throughput are based on a combined total of each.
Throughput, IOPS, and Latency
Figure 12 shows throughput and IOPS for a full-clone boot storm.
Figure 12) Throughput and IOPS for full-clone boot storm.
Storage Controller CPU Utilization
Figure 13 shows storage controller CPU utilization for a full-clone boot storm.
.000
1000.000
2000.000
3000.000
4000.000
5000.000
6000.000
7000.000
0
20000
40000
60000
80000
100000
120000
140000
0 2 4 6 8 10 12 14
Thro
ughput
(MB
/s)
and A
vg.
Late
ncy (
us)
Tota
l IO
PS
Time in Minutes
Boot Storm
Total IOPS Avg. Latency (us) Total Throughput (MB/s)
22 NetApp All Flash FAS Solution for Persistent Desktops with VMware Horizon View
© 2017 NetApp, Inc. All rights reserved. © 2016 NetApp, Inc. All rights reserved.
Figure 13) Storage controller CPU utilization for full-clone boot storm.
Read/Write IOPS
Figure 14 shows read and write IOPS for a full-clone boot storm.
Figure 14) Read/write IOPS for full-clone boot storm.
Read/Write Ratio
Figure 15 shows the read and write ratio for a full-clone boot storm.
0%
20%
40%
60%
80%
100%
0 2 4 6 8 10 12 14
Avg.
CP
U
Time in Minutes
Boot Storm Avg. CPU
Node1 Avg. CPU Node2 Avg. CPU
0
20000
40000
60000
80000
100000
120000
140000
12
14
16
18
11
01
121
141
161
181
201
221
241
261
281
301
321
341
361
381
401
421
441
461
481
501
521
541
561
581
601
621
641
661
681
701
721
741
Tota
l IO
PS
Time in Seconds
Boot Storm
Read_Ops Write_Ops
23 NetApp All Flash FAS Solution for Persistent Desktops with VMware Horizon View
© 2017 NetApp, Inc. All rights reserved. © 2016 NetApp, Inc. All rights reserved.
Figure 15) Read/write ratio for full-clone boot storm.
Customer Impact (Test Conclusions)
During the boot of 1,500 persistent desktops, the storage controller reached about the max number of
concurrent boot operations. However, booting more desktops might take longer as utilization increases.
The focus of this test, however, was not on client latency but on restoring the users’ desktops as quickly
as possible.
6.5 Boot Storm Test During Storage Failover
This section describes test objectives and methodology and provides results from boot storm testing
during storage controller failover.
Test Objectives and Methodology
The objective of this test was to determine how long it would take to boot 1,500 virtual desktops if the
storage controller had a problem and was failed over. This test used the same methodologies and
processes that were used in section 6.4 Boot Storm Test. Table 9 shows the data that was gathered for
the boot storm during storage failover.
Table 9) Results for full-clone boot storm during storage failover.
Time Average Latency
Peak IOPS
Avg. IOPS Peak Throughput
Avg. Throughput
Peak Storage CPU
Avg. Storage CPU
~14 min 12.1ms 75,772 47,234 1802MBps 1193MBps 100% 82%
Note: All desktops had the status of Provisioned in VMware Horizon View.
Throughput, IOPS, and Latency
Figure 16 shows throughput, IOPS, and latency for a full-clone boot storm during storage failover.
0%
20%
40%
60%
80%
100%
1
21
41
61
81
101
121
141
161
181
201
221
241
261
281
301
321
341
361
381
401
421
441
461
481
501
521
541
561
581
601
621
641
661
681
701
721
741
IOP
S P
erc
enta
ge
Time in Seconds
Boot Storm
Read_Ops Write_Ops
24 NetApp All Flash FAS Solution for Persistent Desktops with VMware Horizon View
© 2017 NetApp, Inc. All rights reserved. © 2016 NetApp, Inc. All rights reserved.
Figure 16) Throughput, IOPS, and latency for a full-clone boot storm during storage failover.
Storage Controller CPU Utilization
Figure 17 shows storage controller CPU utilization for a full-clone boot storm during storage failover.
Figure 17) Storage controller CPU utilization for full-clone boot storm during storage failover.
Read/Write IOPS
Figure 18 shows read and write IOPS for a full-clone boot storm during storage failover.
0
5000
10000
15000
20000
25000
30000
0
10000
20000
30000
40000
50000
60000
70000
80000
0 2 4 6 8 10 12 14 16
Thro
ughput
(MB
/s)
and A
vg.
Late
ncy (
us)
Tota
l IO
PS
Time in Minutes
Boot Storm during Failover
Total IOPS Avg. Latency (us) Total Throughput (MB/s)
0%
20%
40%
60%
80%
100%
0 2 4 6 8 10 12 14 16
Avg.
CP
U
Time in Minutes
Boot Storm during Failover Avg. CPU
Node1 Avg. CPU
25 NetApp All Flash FAS Solution for Persistent Desktops with VMware Horizon View
© 2017 NetApp, Inc. All rights reserved. © 2016 NetApp, Inc. All rights reserved.
Figure 18) Read/write IOPS for full-clone boot storm during storage failover.
Read/Write Ratio
Figure 19 shows read and write ratios for a full-clone boot storm during storage failover.
Figure 19) Read/write ratio for full-clone boot storm during storage failover.
Customer Impact (Test Conclusions)
During the boot of 1,500 persistent desktops with storage failed over, the storage controller was able to
boot 1,500 desktops on 1 node in approximately 14 minutes. Tests were conducted to measure the
impact of using VMware Horizon View to boot the desktops. The focus of this test, however, was not on
client latency but on restoring the users’ desktops as quickly as possible.
6.6 Login and Steady-State VSI Test
This section describes test objectives and methodology and provides results from Login and steady-state
VSI testing.
0
10000
20000
30000
40000
50000
60000
70000
80000
12
44
77
09
31
16
139
162
185
208
231
254
277
300
323
346
369
392
415
438
461
484
507
530
553
576
599
622
645
668
691
714
737
760
783
806
829
852
875
Tota
l IO
PS
Time in Seconds
Boot Storm during Failover
Read_Ops Write_Ops
0%
20%
40%
60%
80%
100%
12
44
77
09
31
16
139
162
185
208
231
254
277
300
323
346
369
392
415
438
461
484
507
530
553
576
599
622
645
668
691
714
737
760
783
806
829
852
875
IOP
S P
erc
enta
ge
Time in Seconds
Boot Storm during Failover
Read_Ops Write_Ops
26 NetApp All Flash FAS Solution for Persistent Desktops with VMware Horizon View
© 2017 NetApp, Inc. All rights reserved. © 2016 NetApp, Inc. All rights reserved.
Test Objectives and Methodology
The objective of this test was to run a Login VSI office worker workload to determine how the storage
controller performed and evaluate the end-user experience. This Login VSI workload first had the users
log in to their desktops and begin working. The login phase occurred over a 75-minute period.
Three different login scenarios were included because each has a different I/O profile. We measured
storage performance as well as login time and VSImax, a Login VSI value that represents the maximum
number of users who can be deployed on a given platform. VSImax was not reached in any of the Login
VSI tests. The following sections define the login scenarios.
Monday Morning Login and Workload Test
In this scenario, 1,500 users logged in after the VMs had already been logged into once, the profile had
been created, and the desktop had been rebooted. During this type of login, user and profile data,
application binaries, and libraries had to be read from a disk because they were not already in the VM
memory. Table 10 shows the results for a full-clone Monday morning login and workload.
Table 10) Results for full-clone Monday morning login and workload.
Desktop Login Time
Average Latency
Peak IOPS Avg. IOPS Peak Throughput
Avg. Throughput
Peak Storage CPU
Avg. Storage CPU
20.78 sec/VM
441µs 31,088 9,865 533MBps 197MBps 87% 24%
Note: CPU and latency measurements are based on the average across both nodes of the cluster. IOPS and throughput are based on a combined total of each.
Login VSI VSImax Results
Because the Login VSI VSImax was not reached, more VMs could be deployed on this infrastructure.
Figure 20 shows the VSImax results for Monday morning login and workload.
Figure 20) VSImax results for full-clone Monday morning login and workload.
27 NetApp All Flash FAS Solution for Persistent Desktops with VMware Horizon View
© 2017 NetApp, Inc. All rights reserved. © 2016 NetApp, Inc. All rights reserved.
Desktop Login Time
Average desktop login time was 20.78 seconds, which is considered an excellent login time. Figure 21
shows a scatterplot of the Monday morning login times.
Figure 21) Scatterplot of full-clone Monday morning login times.
Throughput, IOPS, and Latency
Figure 22 shows throughput, IOPS, and latency for full-clone Monday morning login and workload.
Figure 22) Throughput, IOPS, and latency for full-clone Monday morning login and workload.
28 NetApp All Flash FAS Solution for Persistent Desktops with VMware Horizon View
© 2017 NetApp, Inc. All rights reserved. © 2016 NetApp, Inc. All rights reserved.
Storage Controller CPU Utilization
Figure 23 shows storage controller CPU utilization for full-clone Monday morning login and workload.
Figure 23) Storage controller CPU utilization for full-clone Monday morning login and workload.
Read/Write IOPS
Figure 24 shows read and write IOPS for full-clone Monday morning login and steady state.
Figure 24) Read/write IOPS for full-clone Monday morning login and workload.
Read/Write Ratio
Figure 25 shows read and write ratios for full-clone Monday morning login and workload.
29 NetApp All Flash FAS Solution for Persistent Desktops with VMware Horizon View
© 2017 NetApp, Inc. All rights reserved. © 2016 NetApp, Inc. All rights reserved.
Figure 25) Read/write ratio for full-clone Monday morning login and workload.
Customer Impact (Test Conclusions)
During the Monday morning login test, the storage controller performed very well. The CPU utilization was
not high during this test, latencies were under 1ms, and desktop performance was excellent. These
results suggest that it might be possible to double the storage controller workload to 3,000 users or more
and still maintain excellent end-user performance. The Monday morning login during storage failover test
described in the following section reinforces that point.
Monday Morning Login and Workload During Storage Failover Test
In this scenario, 1,500 users logged in after the VMs had already been logged into once, the profile had
been created, and the desktops had been rebooted, but during a storage failover event. During this type
of login, user and profile data, application binaries, and libraries had to be read from a disk because they
were not already in the VM memory. Table 11 lists the results for Monday morning login and workload
during storage failover.
Table 11) Results for full-clone Monday morning login and workload during storage failover.
Desktop Login Time
Average Latency
Peak IOPS Avg. IOPS Peak Throughput
Avg. Throughput
Peak Storage CPU
Avg. Storage CPU
19.12 sec/VM
498µs 40,000 8,302 915MBps 176MBps 99% 40%
Login VSI VSImax Results
Because the Login VSI VSImax v4.1 limit was not reached, more VMs could be deployed on this
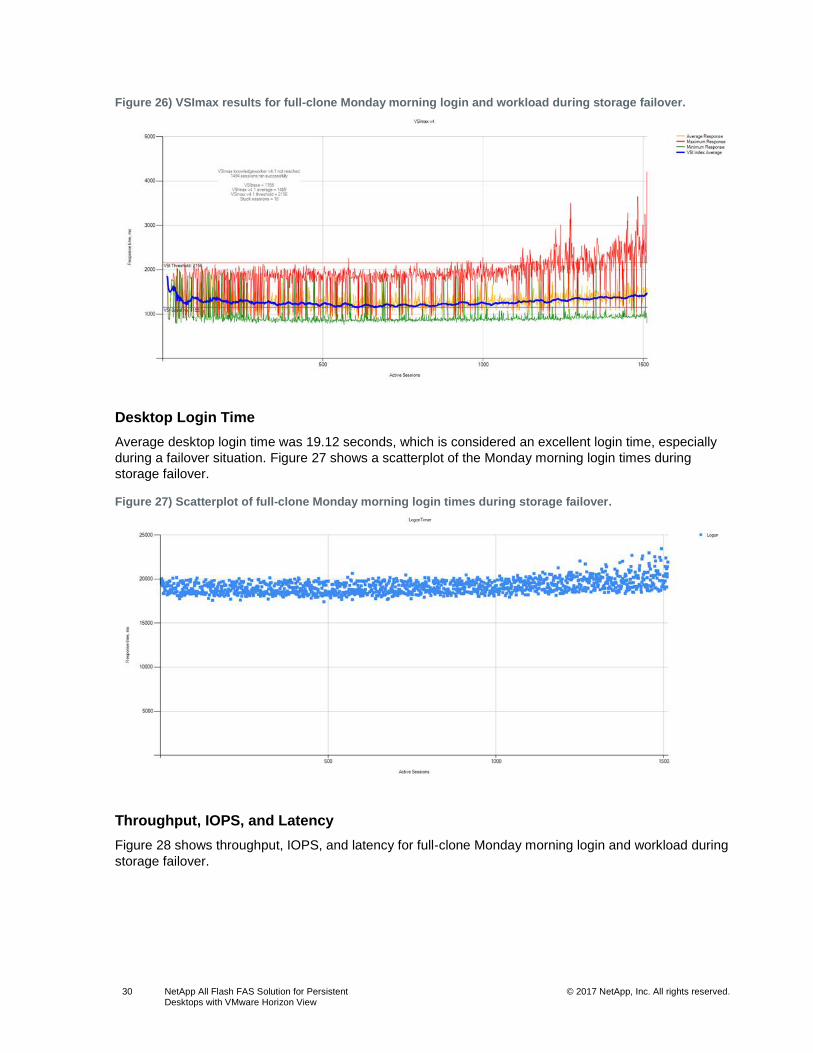
infrastructure. Figure 26 shows the VSImax results for Monday morning login and workload during
storage failover.
30 NetApp All Flash FAS Solution for Persistent Desktops with VMware Horizon View
© 2017 NetApp, Inc. All rights reserved. © 2016 NetApp, Inc. All rights reserved.
Figure 26) VSImax results for full-clone Monday morning login and workload during storage failover.
Desktop Login Time
Average desktop login time was 19.12 seconds, which is considered an excellent login time, especially
during a failover situation. Figure 27 shows a scatterplot of the Monday morning login times during
storage failover.
Figure 27) Scatterplot of full-clone Monday morning login times during storage failover.
Throughput, IOPS, and Latency
Figure 28 shows throughput, IOPS, and latency for full-clone Monday morning login and workload during
storage failover.
31 NetApp All Flash FAS Solution for Persistent Desktops with VMware Horizon View
© 2017 NetApp, Inc. All rights reserved. © 2016 NetApp, Inc. All rights reserved.
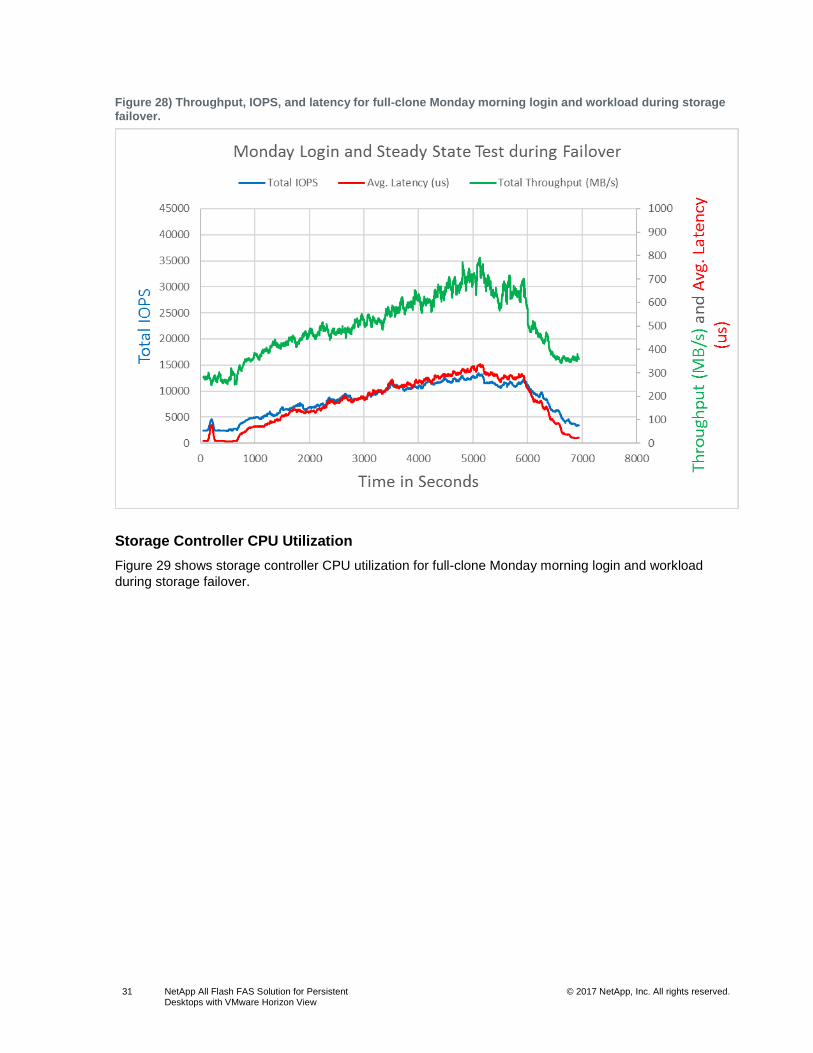
Figure 28) Throughput, IOPS, and latency for full-clone Monday morning login and workload during storage failover.
Storage Controller CPU Utilization
Figure 29 shows storage controller CPU utilization for full-clone Monday morning login and workload
during storage failover.
32 NetApp All Flash FAS Solution for Persistent Desktops with VMware Horizon View
© 2017 NetApp, Inc. All rights reserved. © 2016 NetApp, Inc. All rights reserved.
Figure 29) Storage controller CPU utilization for full-clone Monday morning login and workload during storage failover.
Read/Write IOPS
Figure 30 shows read and write IOPS for full-clone Monday morning login and workload during storage
failover.
Figure 30) Read/write IOPS for full-clone Monday morning login and workload during storage failover.
Read/Write Ratio
Figure 31 shows read and write ratios for full-clone Monday morning login and workload during storage
failover.
33 NetApp All Flash FAS Solution for Persistent Desktops with VMware Horizon View
© 2017 NetApp, Inc. All rights reserved. © 2016 NetApp, Inc. All rights reserved.
Figure 31) Read/write ratio for full-clone Monday morning login and workload during storage failover.
Customer Impact (Test Conclusions)
During the Monday morning login test during storage failover, the storage controller performed very well.
The CPU utilization averaged less than 50%, latencies were under 1ms, and desktop performance was
excellent. These results suggest that for this type of workload it might be possible to double the storage
controller workload to 3,000 users total (1,500 per node) with excellent end-user performance and with
the ability to tolerate a storage failover.
Tuesday Morning Login and Workload Test
In this scenario, 1,500 users logged in to virtual desktops that had been logged into previously and that
had not been power-cycled. In this situation, VMs reduce the impact on storage by retaining in memory
user and profile data, application binaries, and libraries. Table 12 lists the results for Tuesday morning
login and workload.
Table 12) Results for full-clone Tuesday morning login and workload.
Desktop Login Time
Average Latency
Peak IOPS Avg. IOPS
Peak Throughput
Avg. Throughput
Peak Storage CPU
Avg. Storage CPU
19.27 sec/VM
446µs 21,874 7,586 490MBps 172MBps 90% 23%
Note: CPU and latency measurements are based on the average across both nodes of the cluster. IOPS and throughput are based on a combined total of each.
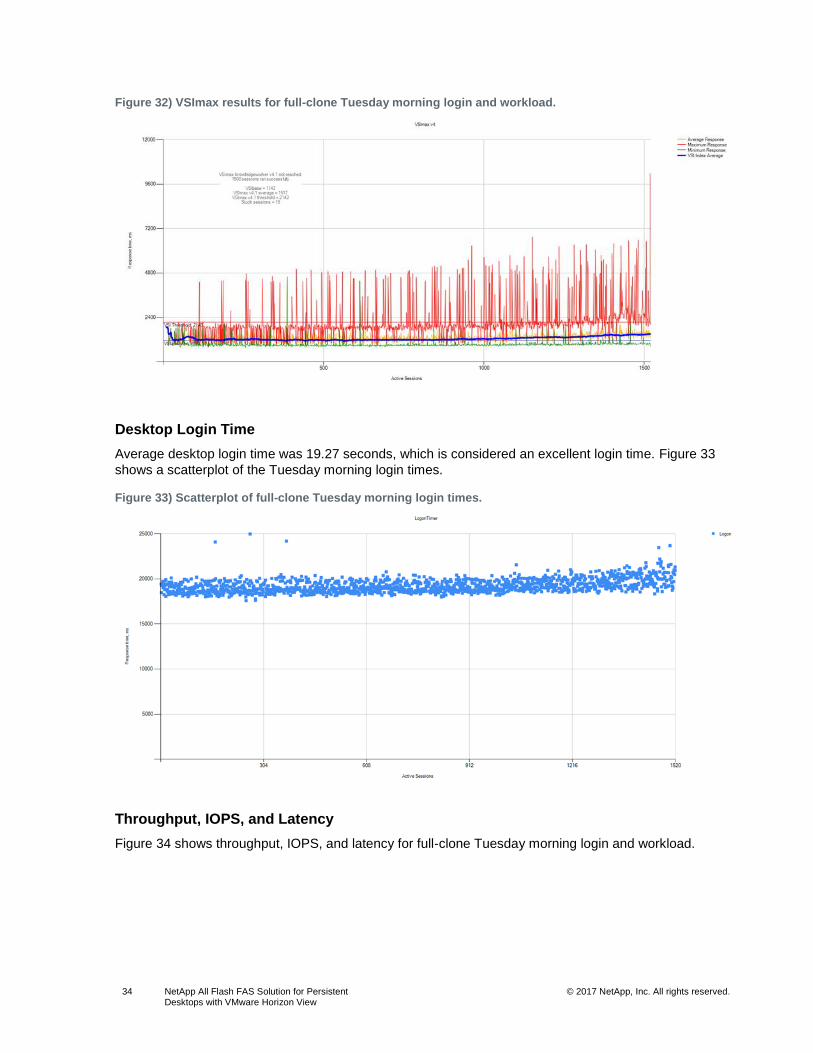
Login VSI VSImax Results
Because the Login VSI VSImax v4.1 was not reached, more VMs could be deployed on this
infrastructure. Figure 32 shows the VSImax results for Tuesday morning login and workload.
34 NetApp All Flash FAS Solution for Persistent Desktops with VMware Horizon View
© 2017 NetApp, Inc. All rights reserved. © 2016 NetApp, Inc. All rights reserved.
Figure 32) VSImax results for full-clone Tuesday morning login and workload.
Desktop Login Time
Average desktop login time was 19.27 seconds, which is considered an excellent login time. Figure 33
shows a scatterplot of the Tuesday morning login times.
Figure 33) Scatterplot of full-clone Tuesday morning login times.
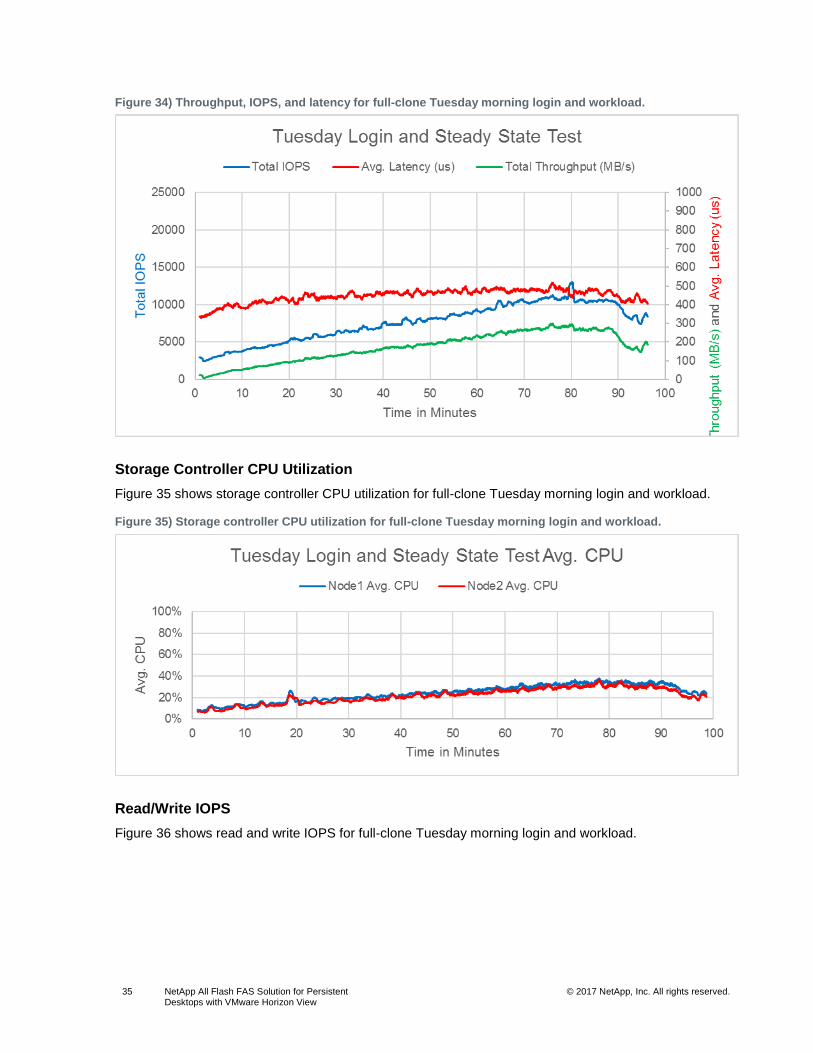
Throughput, IOPS, and Latency
Figure 34 shows throughput, IOPS, and latency for full-clone Tuesday morning login and workload.
35 NetApp All Flash FAS Solution for Persistent Desktops with VMware Horizon View
© 2017 NetApp, Inc. All rights reserved. © 2016 NetApp, Inc. All rights reserved.
Figure 34) Throughput, IOPS, and latency for full-clone Tuesday morning login and workload.
Storage Controller CPU Utilization
Figure 35 shows storage controller CPU utilization for full-clone Tuesday morning login and workload.
Figure 35) Storage controller CPU utilization for full-clone Tuesday morning login and workload.
Read/Write IOPS
Figure 36 shows read and write IOPS for full-clone Tuesday morning login and workload.
36 NetApp All Flash FAS Solution for Persistent Desktops with VMware Horizon View
© 2017 NetApp, Inc. All rights reserved. © 2016 NetApp, Inc. All rights reserved.
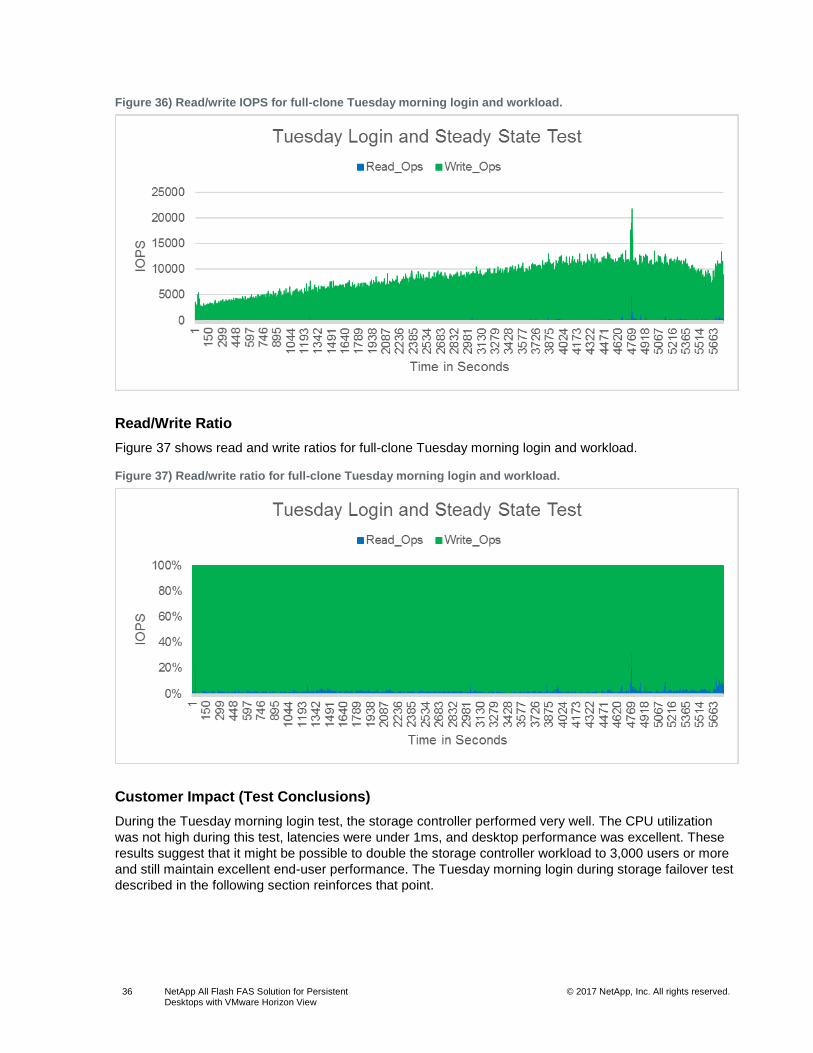
Figure 36) Read/write IOPS for full-clone Tuesday morning login and workload.
Read/Write Ratio
Figure 37 shows read and write ratios for full-clone Tuesday morning login and workload.
Figure 37) Read/write ratio for full-clone Tuesday morning login and workload.
Customer Impact (Test Conclusions)
During the Tuesday morning login test, the storage controller performed very well. The CPU utilization
was not high during this test, latencies were under 1ms, and desktop performance was excellent. These
results suggest that it might be possible to double the storage controller workload to 3,000 users or more
and still maintain excellent end-user performance. The Tuesday morning login during storage failover test
described in the following section reinforces that point.
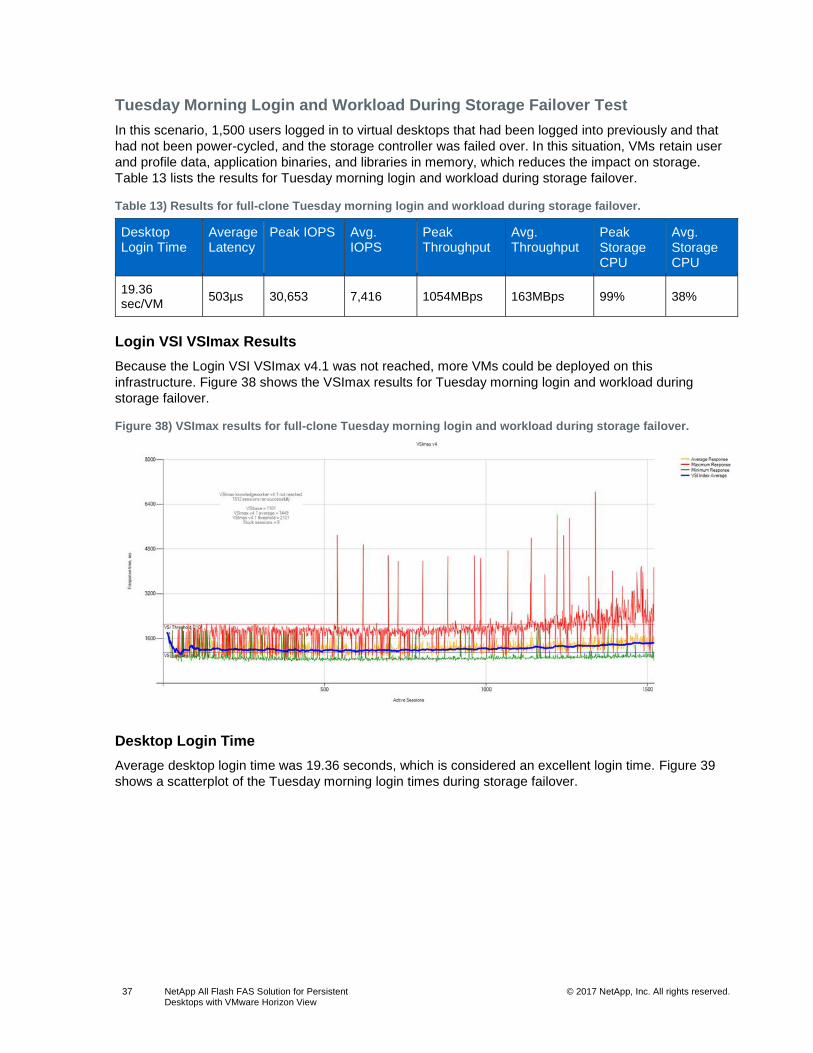
37 NetApp All Flash FAS Solution for Persistent Desktops with VMware Horizon View
© 2017 NetApp, Inc. All rights reserved. © 2016 NetApp, Inc. All rights reserved.
Tuesday Morning Login and Workload During Storage Failover Test
In this scenario, 1,500 users logged in to virtual desktops that had been logged into previously and that
had not been power-cycled, and the storage controller was failed over. In this situation, VMs retain user
and profile data, application binaries, and libraries in memory, which reduces the impact on storage.
Table 13 lists the results for Tuesday morning login and workload during storage failover.
Table 13) Results for full-clone Tuesday morning login and workload during storage failover.
Desktop Login Time
Average Latency
Peak IOPS Avg. IOPS
Peak Throughput
Avg. Throughput
Peak Storage CPU
Avg. Storage CPU
19.36 sec/VM
503µs 30,653 7,416 1054MBps 163MBps 99% 38%
Login VSI VSImax Results
Because the Login VSI VSImax v4.1 was not reached, more VMs could be deployed on this
infrastructure. Figure 38 shows the VSImax results for Tuesday morning login and workload during
storage failover.
Figure 38) VSImax results for full-clone Tuesday morning login and workload during storage failover.
Desktop Login Time
Average desktop login time was 19.36 seconds, which is considered an excellent login time. Figure 39
shows a scatterplot of the Tuesday morning login times during storage failover.
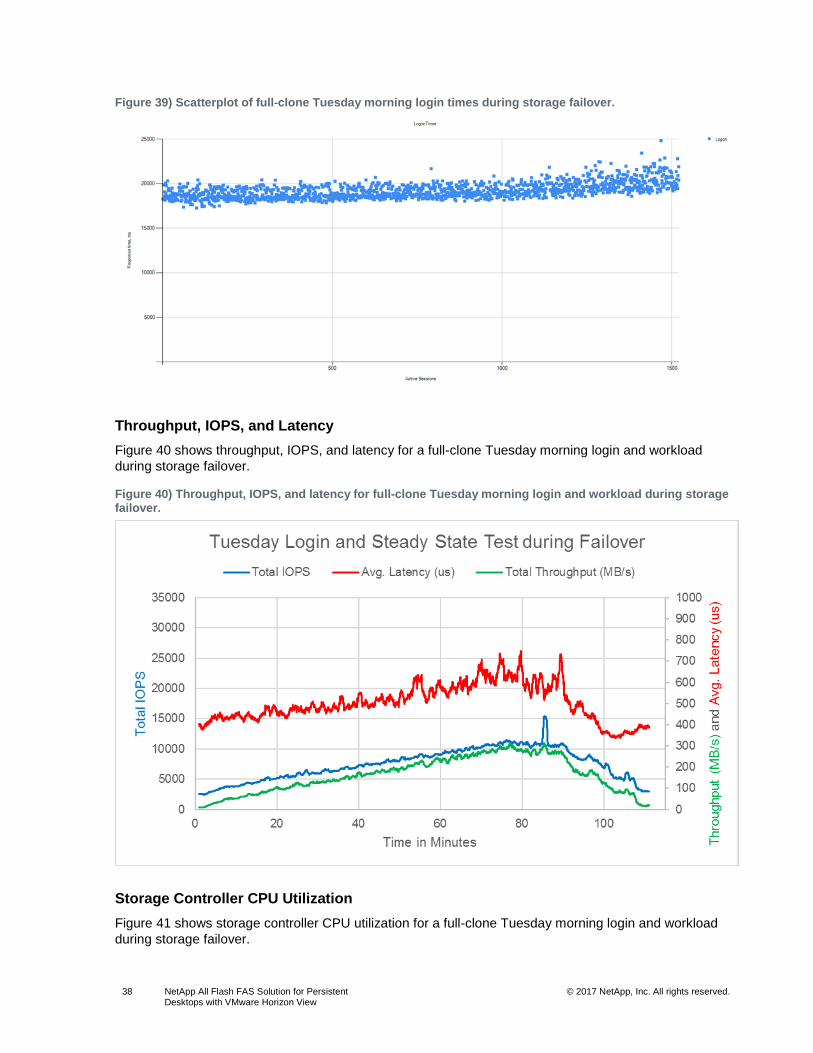
38 NetApp All Flash FAS Solution for Persistent Desktops with VMware Horizon View
© 2017 NetApp, Inc. All rights reserved. © 2016 NetApp, Inc. All rights reserved.
Figure 39) Scatterplot of full-clone Tuesday morning login times during storage failover.
Throughput, IOPS, and Latency
Figure 40 shows throughput, IOPS, and latency for a full-clone Tuesday morning login and workload
during storage failover.
Figure 40) Throughput, IOPS, and latency for full-clone Tuesday morning login and workload during storage failover.
Storage Controller CPU Utilization
Figure 41 shows storage controller CPU utilization for a full-clone Tuesday morning login and workload
during storage failover.
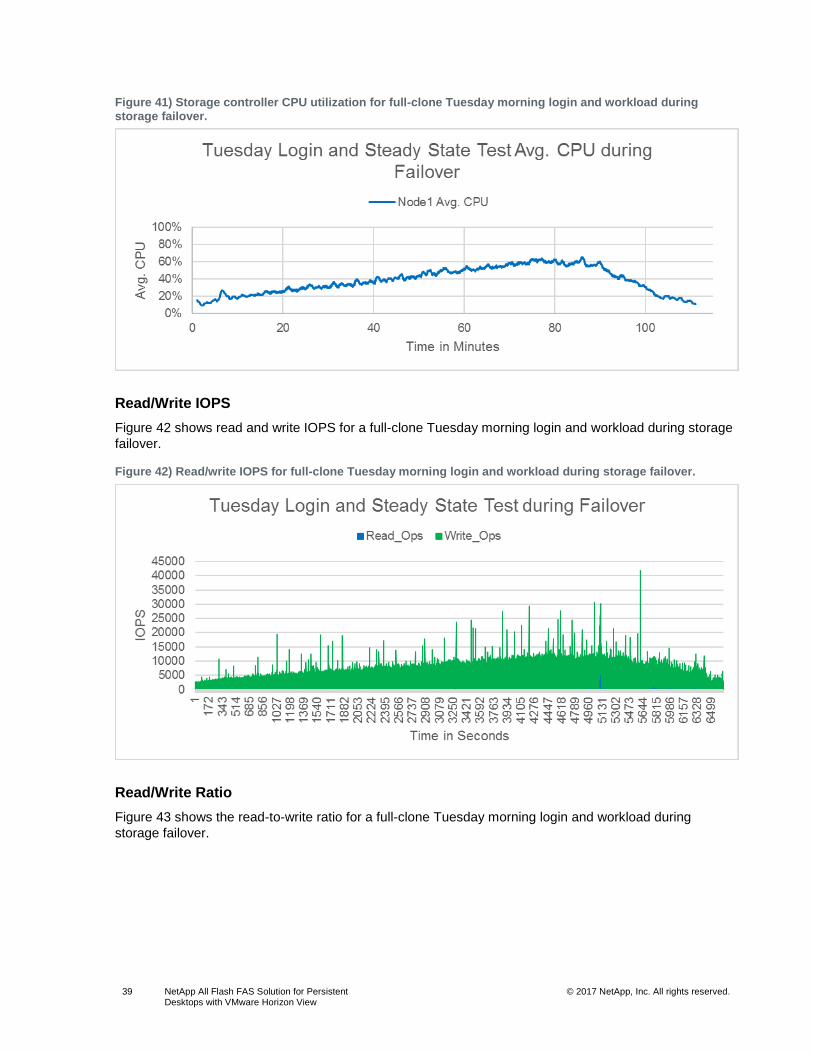
39 NetApp All Flash FAS Solution for Persistent Desktops with VMware Horizon View
© 2017 NetApp, Inc. All rights reserved. © 2016 NetApp, Inc. All rights reserved.
Figure 41) Storage controller CPU utilization for full-clone Tuesday morning login and workload during storage failover.
Read/Write IOPS
Figure 42 shows read and write IOPS for a full-clone Tuesday morning login and workload during storage
failover.
Figure 42) Read/write IOPS for full-clone Tuesday morning login and workload during storage failover.
Read/Write Ratio
Figure 43 shows the read-to-write ratio for a full-clone Tuesday morning login and workload during
storage failover.
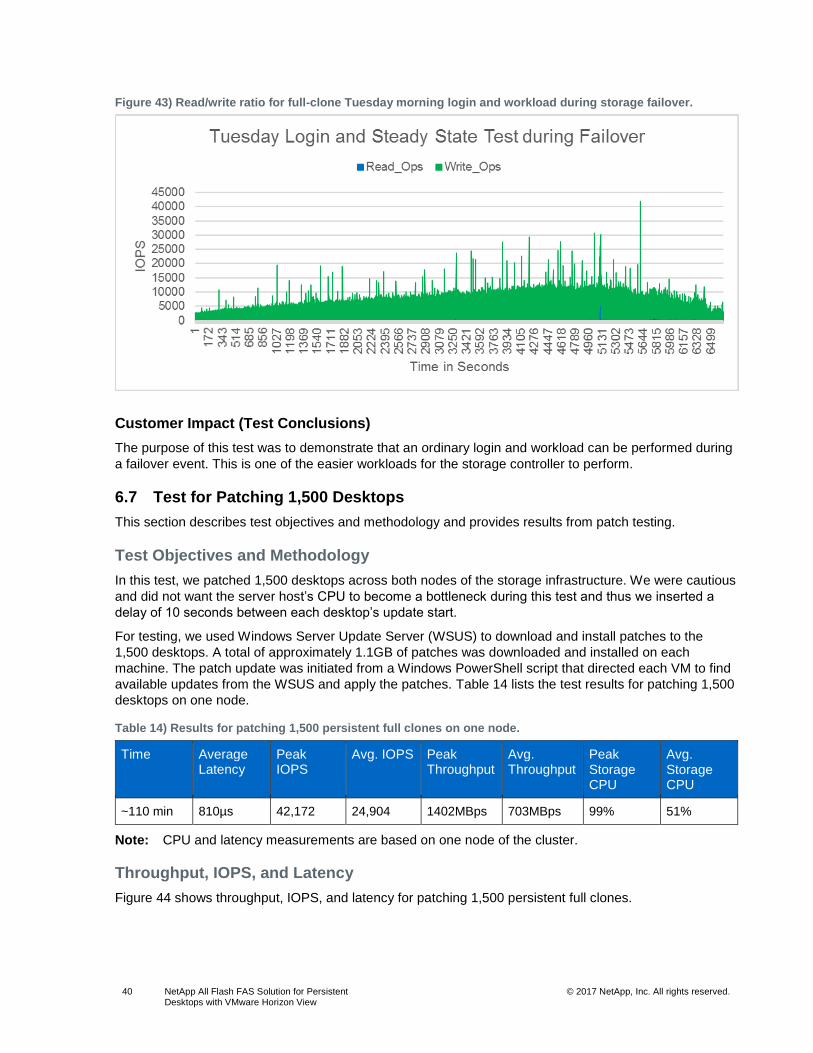
40 NetApp All Flash FAS Solution for Persistent Desktops with VMware Horizon View
© 2017 NetApp, Inc. All rights reserved. © 2016 NetApp, Inc. All rights reserved.
Figure 43) Read/write ratio for full-clone Tuesday morning login and workload during storage failover.
Customer Impact (Test Conclusions)
The purpose of this test was to demonstrate that an ordinary login and workload can be performed during
a failover event. This is one of the easier workloads for the storage controller to perform.
6.7 Test for Patching 1,500 Desktops
This section describes test objectives and methodology and provides results from patch testing.
Test Objectives and Methodology
In this test, we patched 1,500 desktops across both nodes of the storage infrastructure. We were cautious
and did not want the server host’s CPU to become a bottleneck during this test and thus we inserted a
delay of 10 seconds between each desktop’s update start.
For testing, we used Windows Server Update Server (WSUS) to download and install patches to the
1,500 desktops. A total of approximately 1.1GB of patches was downloaded and installed on each
machine. The patch update was initiated from a Windows PowerShell script that directed each VM to find
available updates from the WSUS and apply the patches. Table 14 lists the test results for patching 1,500
desktops on one node.
Table 14) Results for patching 1,500 persistent full clones on one node.
Time Average Latency
Peak IOPS
Avg. IOPS Peak Throughput
Avg. Throughput
Peak Storage CPU
Avg. Storage CPU
~110 min 810µs 42,172 24,904 1402MBps 703MBps 99% 51%
Note: CPU and latency measurements are based on one node of the cluster.
Throughput, IOPS, and Latency
Figure 44 shows throughput, IOPS, and latency for patching 1,500 persistent full clones.
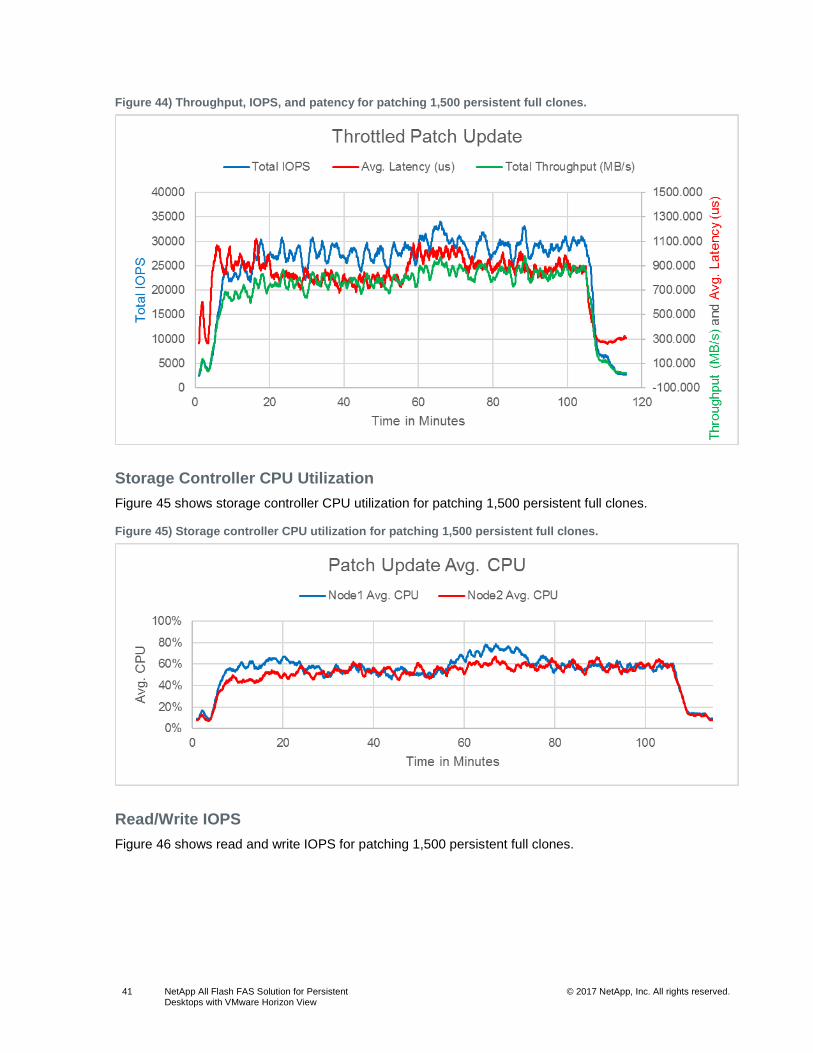
41 NetApp All Flash FAS Solution for Persistent Desktops with VMware Horizon View
© 2017 NetApp, Inc. All rights reserved. © 2016 NetApp, Inc. All rights reserved.
Figure 44) Throughput, IOPS, and patency for patching 1,500 persistent full clones.
Storage Controller CPU Utilization
Figure 45 shows storage controller CPU utilization for patching 1,500 persistent full clones.
Figure 45) Storage controller CPU utilization for patching 1,500 persistent full clones.
Read/Write IOPS
Figure 46 shows read and write IOPS for patching 1,500 persistent full clones.
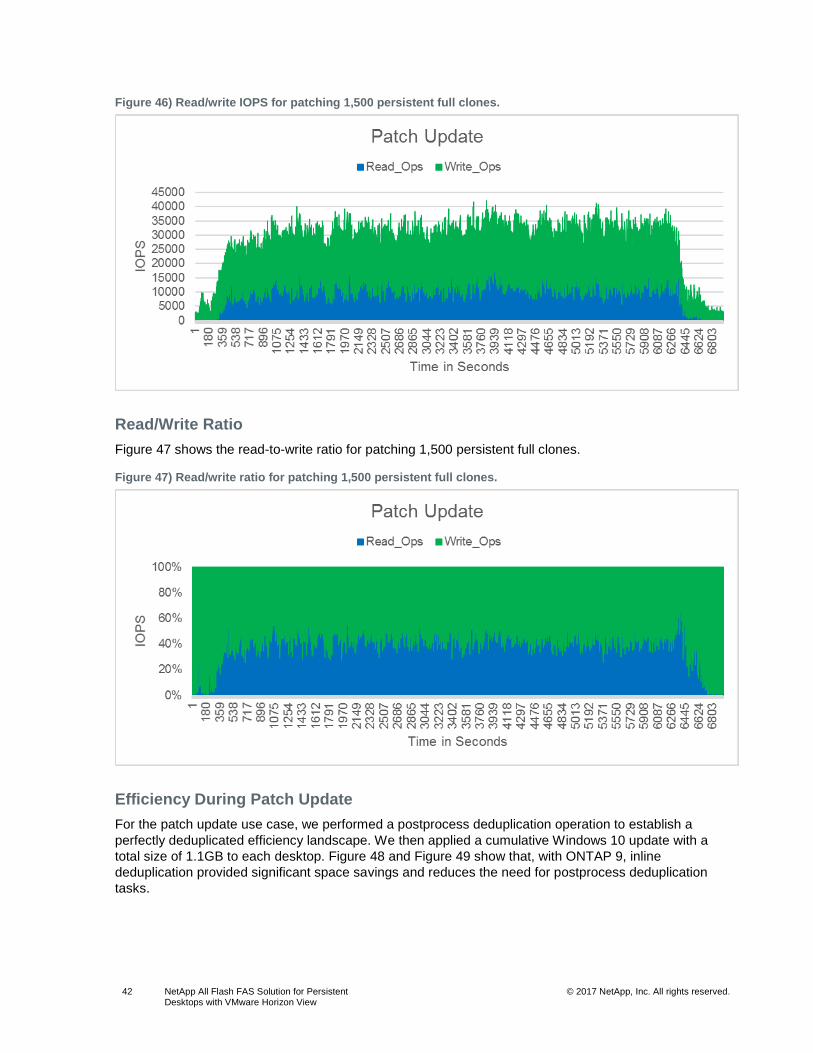
42 NetApp All Flash FAS Solution for Persistent Desktops with VMware Horizon View
© 2017 NetApp, Inc. All rights reserved. © 2016 NetApp, Inc. All rights reserved.
Figure 46) Read/write IOPS for patching 1,500 persistent full clones.
Read/Write Ratio
Figure 47 shows the read-to-write ratio for patching 1,500 persistent full clones.
Figure 47) Read/write ratio for patching 1,500 persistent full clones.
Efficiency During Patch Update
For the patch update use case, we performed a postprocess deduplication operation to establish a
perfectly deduplicated efficiency landscape. We then applied a cumulative Windows 10 update with a
total size of 1.1GB to each desktop. Figure 48 and Figure 49 show that, with ONTAP 9, inline
deduplication provided significant space savings and reduces the need for postprocess deduplication
tasks.
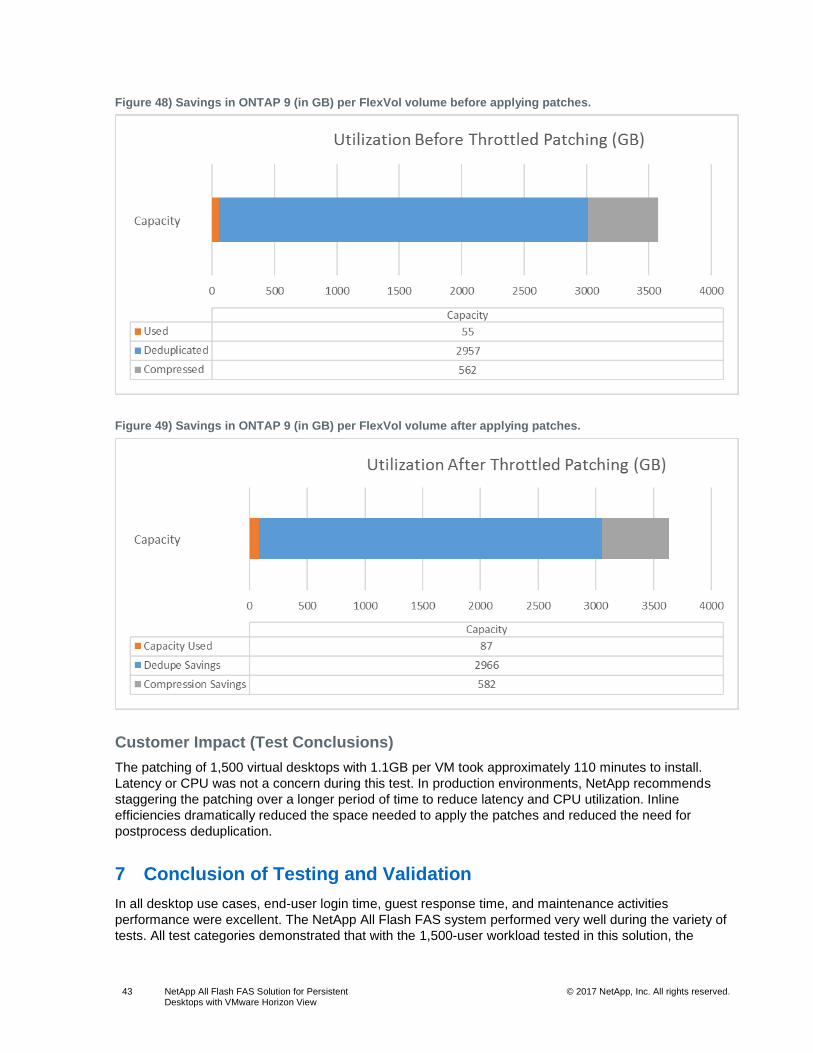
43 NetApp All Flash FAS Solution for Persistent Desktops with VMware Horizon View
© 2017 NetApp, Inc. All rights reserved. © 2016 NetApp, Inc. All rights reserved.
Figure 48) Savings in ONTAP 9 (in GB) per FlexVol volume before applying patches.
Figure 49) Savings in ONTAP 9 (in GB) per FlexVol volume after applying patches.
Customer Impact (Test Conclusions)
The patching of 1,500 virtual desktops with 1.1GB per VM took approximately 110 minutes to install.
Latency or CPU was not a concern during this test. In production environments, NetApp recommends
staggering the patching over a longer period of time to reduce latency and CPU utilization. Inline
efficiencies dramatically reduced the space needed to apply the patches and reduced the need for
postprocess deduplication.
7 Conclusion of Testing and Validation
In all desktop use cases, end-user login time, guest response time, and maintenance activities
performance were excellent. The NetApp All Flash FAS system performed very well during the variety of
tests. All test categories demonstrated that with the 1,500-user workload tested in this solution, the
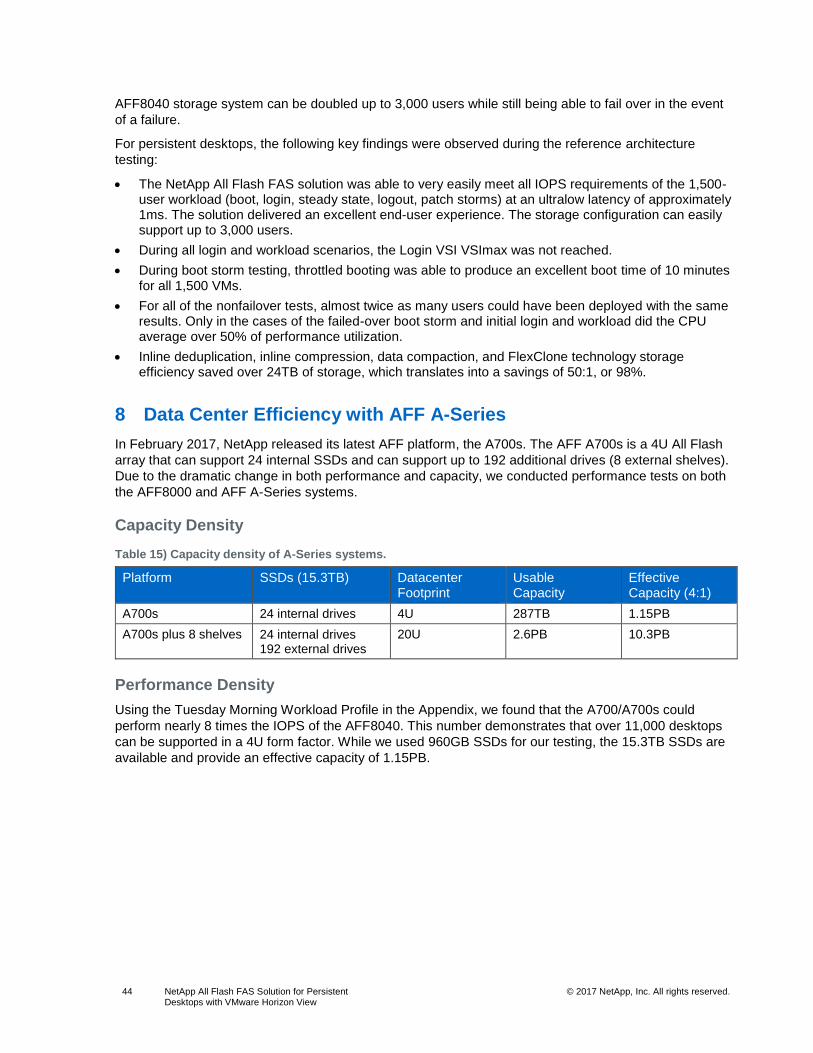
44 NetApp All Flash FAS Solution for Persistent Desktops with VMware Horizon View
© 2017 NetApp, Inc. All rights reserved. © 2016 NetApp, Inc. All rights reserved.
AFF8040 storage system can be doubled up to 3,000 users while still being able to fail over in the event
of a failure.
For persistent desktops, the following key findings were observed during the reference architecture
testing:
• The NetApp All Flash FAS solution was able to very easily meet all IOPS requirements of the 1,500-user workload (boot, login, steady state, logout, patch storms) at an ultralow latency of approximately 1ms. The solution delivered an excellent end-user experience. The storage configuration can easily support up to 3,000 users.
• During all login and workload scenarios, the Login VSI VSImax was not reached.
• During boot storm testing, throttled booting was able to produce an excellent boot time of 10 minutes for all 1,500 VMs.
• For all of the nonfailover tests, almost twice as many users could have been deployed with the same results. Only in the cases of the failed-over boot storm and initial login and workload did the CPU average over 50% of performance utilization.
• Inline deduplication, inline compression, data compaction, and FlexClone technology storage efficiency saved over 24TB of storage, which translates into a savings of 50:1, or 98%.
8 Data Center Efficiency with AFF A-Series
In February 2017, NetApp released its latest AFF platform, the A700s. The AFF A700s is a 4U All Flash
array that can support 24 internal SSDs and can support up to 192 additional drives (8 external shelves).
Due to the dramatic change in both performance and capacity, we conducted performance tests on both
the AFF8000 and AFF A-Series systems.
Capacity Density
Table 15) Capacity density of A-Series systems.
Platform SSDs (15.3TB) Datacenter Footprint
Usable Capacity
Effective Capacity (4:1)
A700s 24 internal drives 4U 287TB 1.15PB
A700s plus 8 shelves 24 internal drives 192 external drives
20U 2.6PB 10.3PB
Performance Density
Using the Tuesday Morning Workload Profile in the Appendix, we found that the A700/A700s could
perform nearly 8 times the IOPS of the AFF8040. This number demonstrates that over 11,000 desktops
can be supported in a 4U form factor. While we used 960GB SSDs for our testing, the 15.3TB SSDs are
available and provide an effective capacity of 1.15PB.
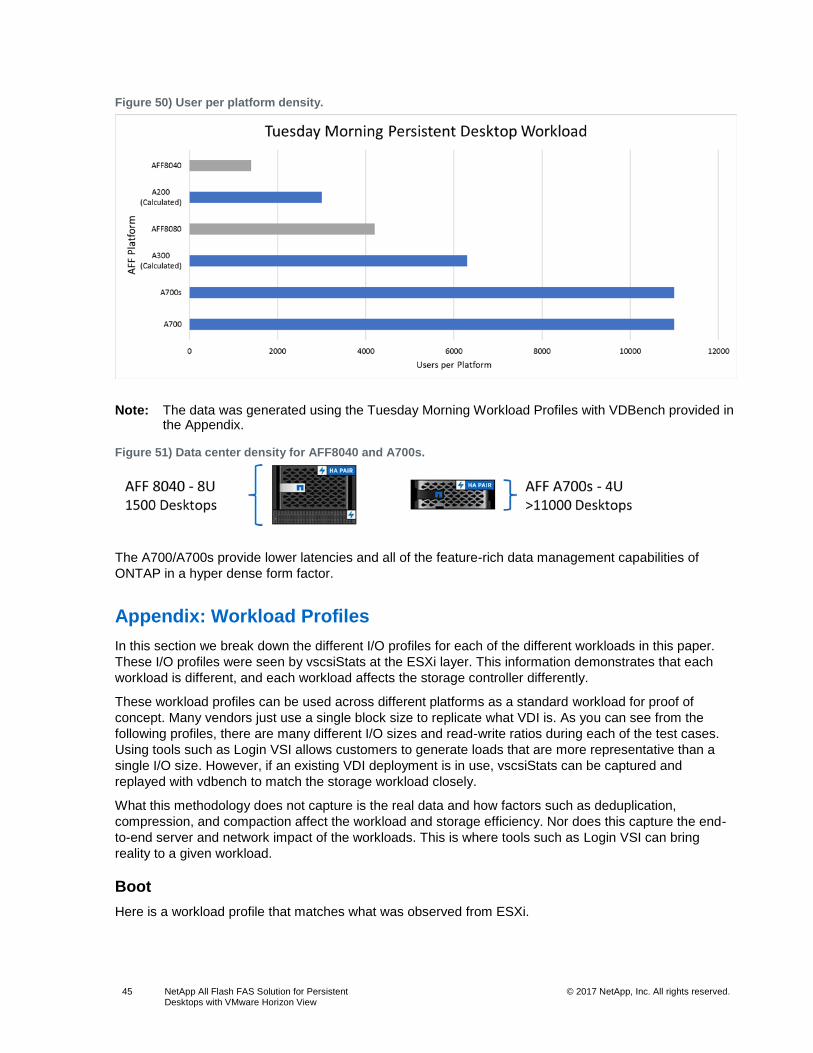
45 NetApp All Flash FAS Solution for Persistent Desktops with VMware Horizon View
© 2017 NetApp, Inc. All rights reserved. © 2016 NetApp, Inc. All rights reserved.
Figure 50) User per platform density.
Note: The data was generated using the Tuesday Morning Workload Profiles with VDBench provided in the Appendix.
Figure 51) Data center density for AFF8040 and A700s.
The A700/A700s provide lower latencies and all of the feature-rich data management capabilities of
ONTAP in a hyper dense form factor.
Appendix: Workload Profiles
In this section we break down the different I/O profiles for each of the different workloads in this paper.
These I/O profiles were seen by vscsiStats at the ESXi layer. This information demonstrates that each
workload is different, and each workload affects the storage controller differently.
These workload profiles can be used across different platforms as a standard workload for proof of
concept. Many vendors just use a single block size to replicate what VDI is. As you can see from the
following profiles, there are many different I/O sizes and read-write ratios during each of the test cases.
Using tools such as Login VSI allows customers to generate loads that are more representative than a
single I/O size. However, if an existing VDI deployment is in use, vscsiStats can be captured and
replayed with vdbench to match the storage workload closely.
What this methodology does not capture is the real data and how factors such as deduplication,
compression, and compaction affect the workload and storage efficiency. Nor does this capture the end-
to-end server and network impact of the workloads. This is where tools such as Login VSI can bring
reality to a given workload.
Boot
Here is a workload profile that matches what was observed from ESXi.
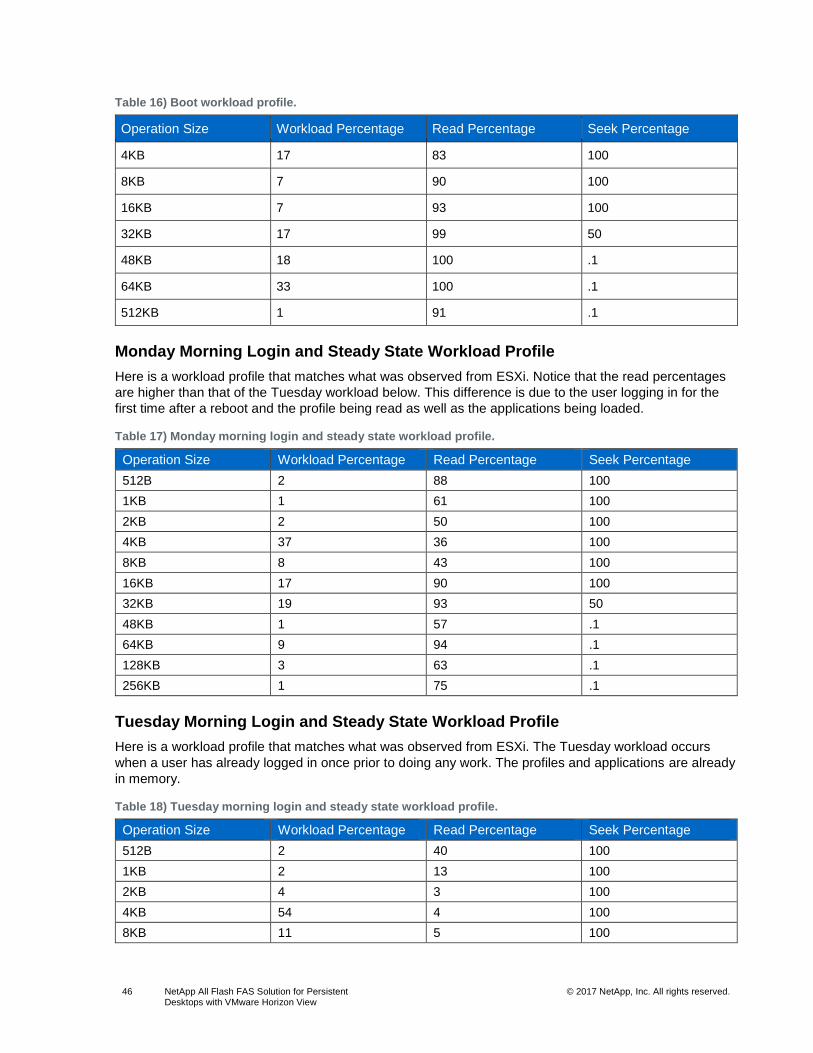
46 NetApp All Flash FAS Solution for Persistent Desktops with VMware Horizon View
© 2017 NetApp, Inc. All rights reserved. © 2016 NetApp, Inc. All rights reserved.
Table 16) Boot workload profile.
Operation Size Workload Percentage Read Percentage Seek Percentage
4KB 17 83 100
8KB 7 90 100
16KB 7 93 100
32KB 17 99 50
48KB 18 100 .1
64KB 33 100 .1
512KB 1 91 .1
Monday Morning Login and Steady State Workload Profile
Here is a workload profile that matches what was observed from ESXi. Notice that the read percentages
are higher than that of the Tuesday workload below. This difference is due to the user logging in for the
first time after a reboot and the profile being read as well as the applications being loaded.
Table 17) Monday morning login and steady state workload profile.
Operation Size Workload Percentage Read Percentage Seek Percentage
512B 2 88 100
1KB 1 61 100
2KB 2 50 100
4KB 37 36 100
8KB 8 43 100
16KB 17 90 100
32KB 19 93 50
48KB 1 57 .1
64KB 9 94 .1
128KB 3 63 .1
256KB 1 75 .1
Tuesday Morning Login and Steady State Workload Profile
Here is a workload profile that matches what was observed from ESXi. The Tuesday workload occurs
when a user has already logged in once prior to doing any work. The profiles and applications are already
in memory.
Table 18) Tuesday morning login and steady state workload profile.
Operation Size Workload Percentage Read Percentage Seek Percentage
512B 2 40 100
1KB 2 13 100
2KB 4 3 100
4KB 54 4 100
8KB 11 5 100
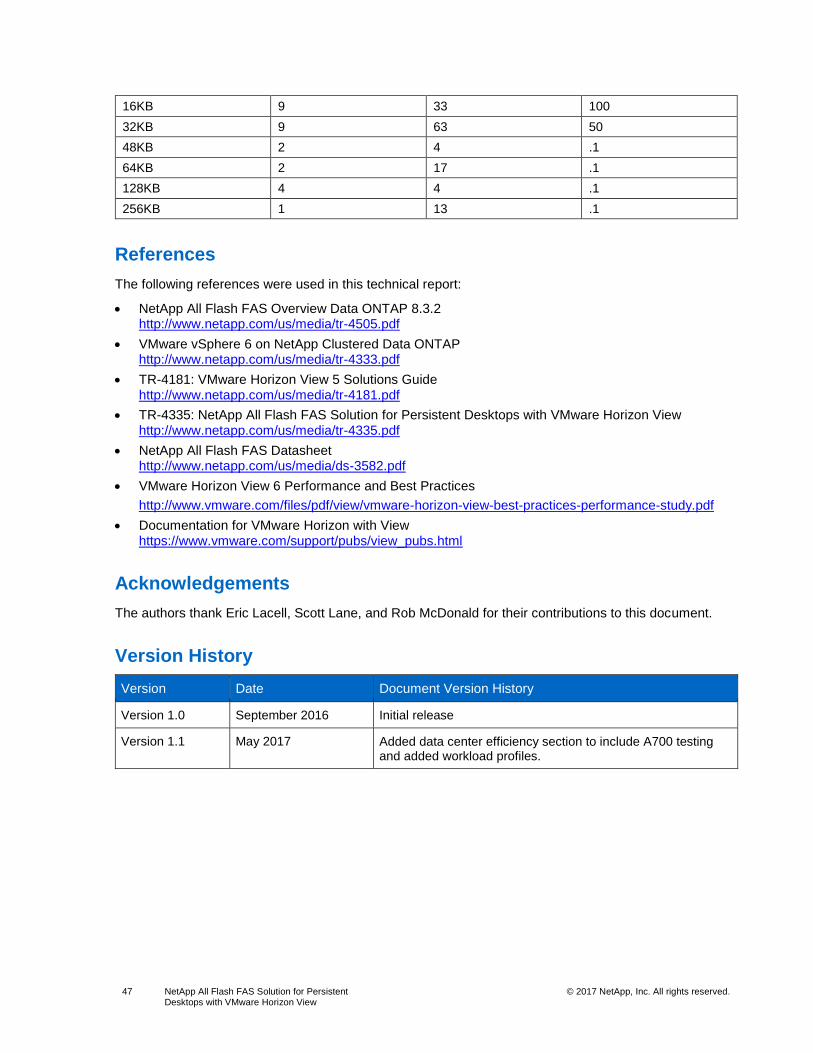
47 NetApp All Flash FAS Solution for Persistent Desktops with VMware Horizon View
© 2017 NetApp, Inc. All rights reserved. © 2016 NetApp, Inc. All rights reserved.
16KB 9 33 100
32KB 9 63 50
48KB 2 4 .1
64KB 2 17 .1
128KB 4 4 .1
256KB 1 13 .1
References
The following references were used in this technical report:
• NetApp All Flash FAS Overview Data ONTAP 8.3.2 http://www.netapp.com/us/media/tr-4505.pdf
• VMware vSphere 6 on NetApp Clustered Data ONTAP http://www.netapp.com/us/media/tr-4333.pdf
• TR-4181: VMware Horizon View 5 Solutions Guide http://www.netapp.com/us/media/tr-4181.pdf
• TR-4335: NetApp All Flash FAS Solution for Persistent Desktops with VMware Horizon View http://www.netapp.com/us/media/tr-4335.pdf
• NetApp All Flash FAS Datasheet http://www.netapp.com/us/media/ds-3582.pdf
• VMware Horizon View 6 Performance and Best Practices
http://www.vmware.com/files/pdf/view/vmware-horizon-view-best-practices-performance-study.pdf
• Documentation for VMware Horizon with View https://www.vmware.com/support/pubs/view_pubs.html
Acknowledgements
The authors thank Eric Lacell, Scott Lane, and Rob McDonald for their contributions to this document.
Version History
Version Date Document Version History
Version 1.0 September 2016 Initial release
Version 1.1 May 2017 Added data center efficiency section to include A700 testing and added workload profiles.
48 NetApp All Flash FAS Solution for Persistent Desktops with VMware Horizon View
© 2017 NetApp, Inc. All rights reserved. © 2016 NetApp, Inc. All rights reserved.
Refer to the Interoperability Matrix Tool (IMT) on the NetApp Support site to validate that the exact product and feature versions described in this document are supported for your specific environment. The NetApp IMT defines the product components and versions that can be used to construct configurations that are supported by NetApp. Specific results depend on each customer’s installation in accordance with published specifications.
Copyright Information
Copyright © 2017 NetApp, Inc. All rights reserved. Printed in the U.S. No part of this document covered by copyright may be reproduced in any form or by any means—graphic, electronic, or mechanical, including photocopying, recording, taping, or storage in an electronic retrieval system—without prior written permission of the copyright owner.
Software derived from copyrighted NetApp material is subject to the following license and disclaimer:
THIS SOFTWARE IS PROVIDED BY NETAPP “AS IS” AND WITHOUT ANY EXPRESS OR IMPLIED WARRANTIES, INCLUDING, BUT NOT LIMITED TO, THE IMPLIED WARRANTIES OF MERCHANTABILITY AND FITNESS FOR A PARTICULAR PURPOSE, WHICH ARE HEREBY DISCLAIMED. IN NO EVENT SHALL NETAPP BE LIABLE FOR ANY DIRECT, INDIRECT, INCIDENTAL, SPECIAL, EXEMPLARY, OR CONSEQUENTIAL DAMAGES (INCLUDING, BUT NOT LIMITED TO, PROCUREMENT OF SUBSTITUTE GOODS OR SERVICES; LOSS OF USE, DATA, OR PROFITS; OR BUSINESS INTERRUPTION) HOWEVER CAUSED AND ON ANY THEORY OF LIABILITY, WHETHER IN CONTRACT, STRICT LIABILITY, OR TORT (INCLUDING NEGLIGENCE OR OTHERWISE) ARISING IN ANY WAY OUT OF THE USE OF THIS SOFTWARE, EVEN IF ADVISED OF THE POSSIBILITY OF SUCH DAMAGE.
NetApp reserves the right to change any products described herein at any time, and without notice. NetApp assumes no responsibility or liability arising from the use of products described herein, except as expressly agreed to in writing by NetApp. The use or purchase of this product does not convey a license under any patent rights, trademark rights, or any other intellectual property rights of NetApp.
The product described in this manual may be protected by one or more U.S. patents, foreign patents, or pending applications.
RESTRICTED RIGHTS LEGEND: Use, duplication, or disclosure by the government is subject to restrictions as set forth in subparagraph (c)(1)(ii) of the Rights in Technical Data and Computer Software clause at DFARS 252.277-7103 (October 1988) and FAR 52-227-19 (June 1987).
Trademark Information
NETAPP, the NETAPP logo, and the marks listed at http://www.netapp.com/TM are trademarks of NetApp, Inc. Other company and product names may be trademarks of their respective owners.
Related Documents