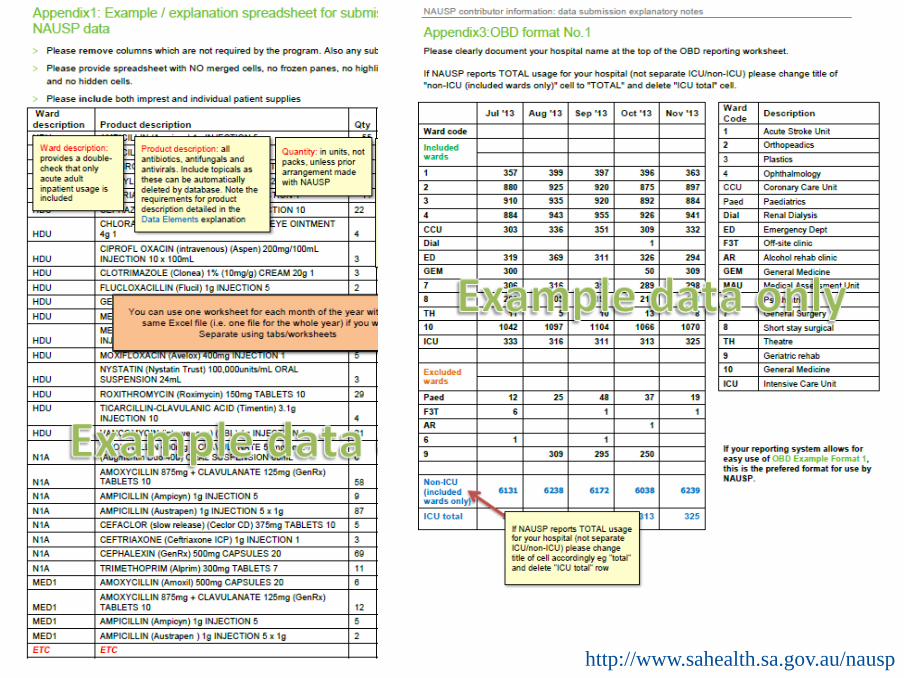
NAUSP and AMS at a Tertiary Hospital Using National Antimicrobial Utilisation Surveillance Program (NAUSP) reports to stimulate and support antimicrobial stewardship interventions Pam Konecny and Suman Adhikari St George Hospital

Welcome message from author
This document is posted to help you gain knowledge. Please leave a comment to let me know what you think about it! Share it to your friends and learn new things together.
Transcript
NAUSP and AMS at a Tertiary Hospital
Using National Antimicrobial Utilisation
Surveillance Program (NAUSP) reports
to stimulate and support antimicrobial
stewardship interventions
Pam Konecny and Suman Adhikari
St George Hospital
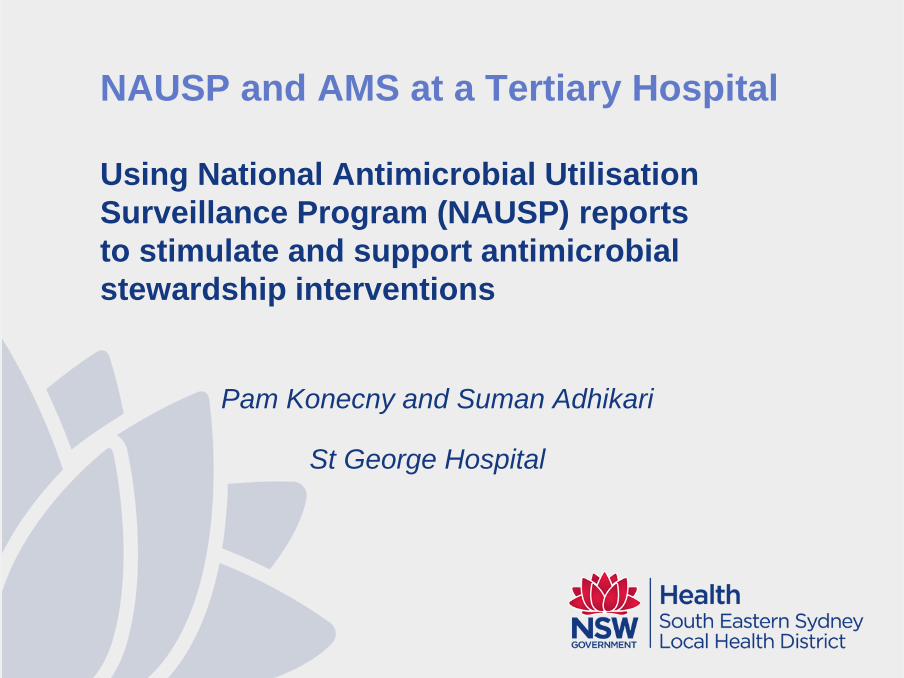
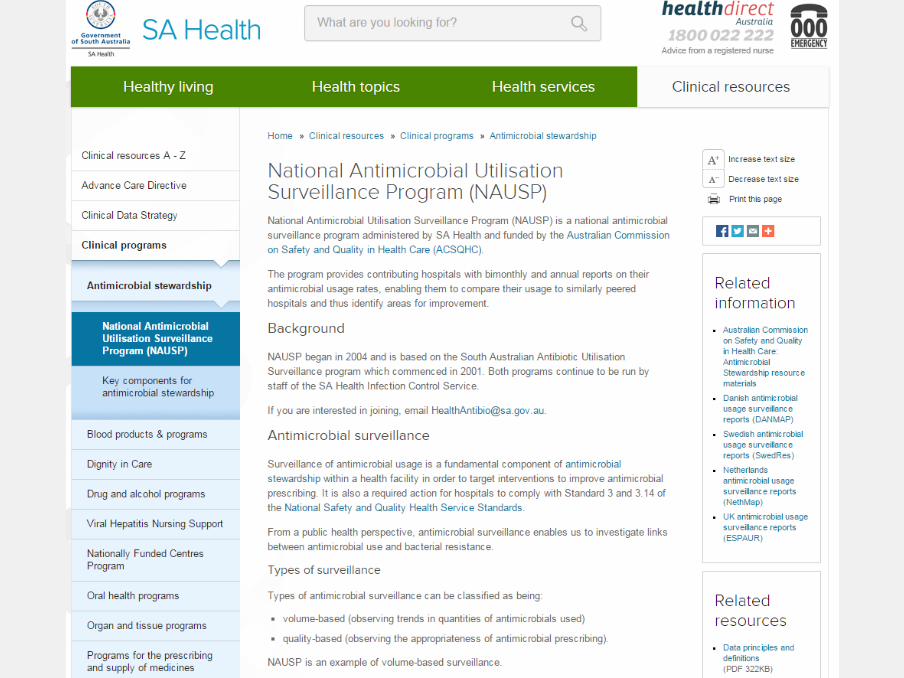
Background NAUSP
NAUSP reports antibiotic usage in Australian acute inpatient care
Funded by Australian government through Australian Commission on
Safety and Quality in HealthCare (ACSQHC)
Managed by the Infection Control Service, SA Health (2001- )
‘Contributors’ (contributing health facilities) provide total monthly
antimicrobial usage and bed occupancy data
Antibiotic usage rates derived from custom-built database
conversion of dispensing data
Data aggregated and de-identified distributed to contributors and
Dept Health and Ageing, and ACSQHC.
http://www.sahealth.sa.gov.au/nausp
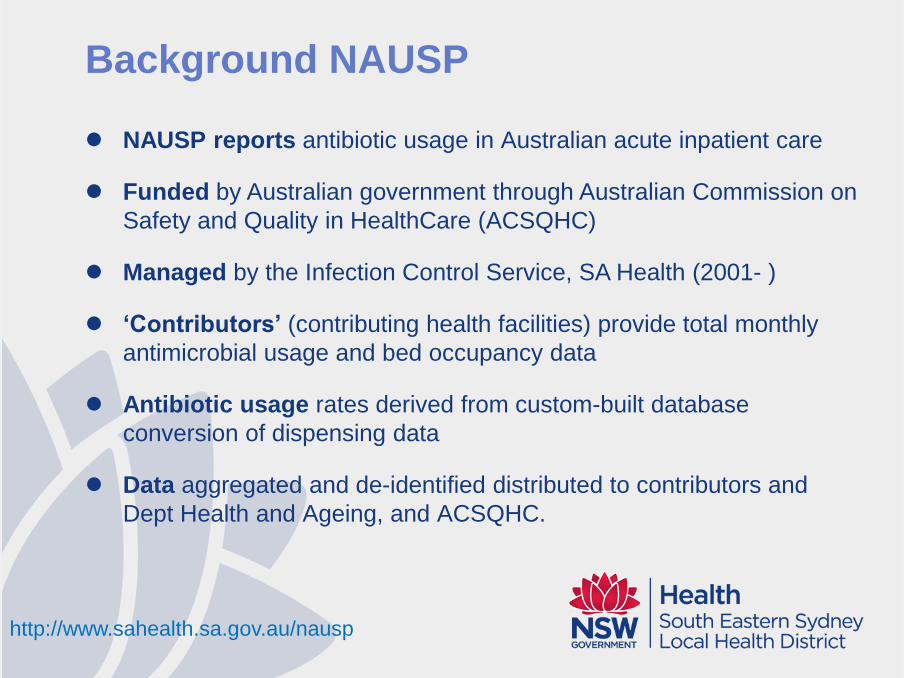
June 2015 - 130 hospitals (>50 beds) SGH
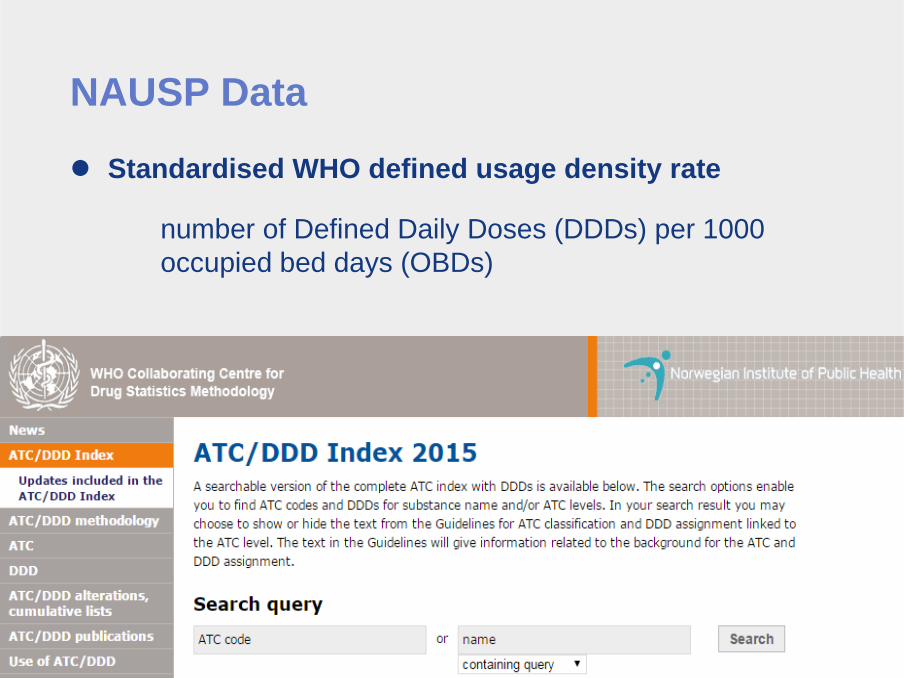
NAUSP Data
Standardised WHO defined usage density rate
number of Defined Daily Doses (DDDs) per 1000
occupied bed days (OBDs)
Internationally recognised parameter, developed by the
World Health Organization for epidemiological investigation
of medication usage
http://www.sahealth.sa.gov.au/nausp
NAUSP reports include a ‘national average’ to enable
contributors to benchmark usage with peer grouped hospitals
Peer grouping is guided by the Australian Institute of Health
and Welfare (AIHW) Classifications
Bi-monthly reports and Annual Report
NAUSP Reports
http://www.sahealth.sa.gov.au/nausp
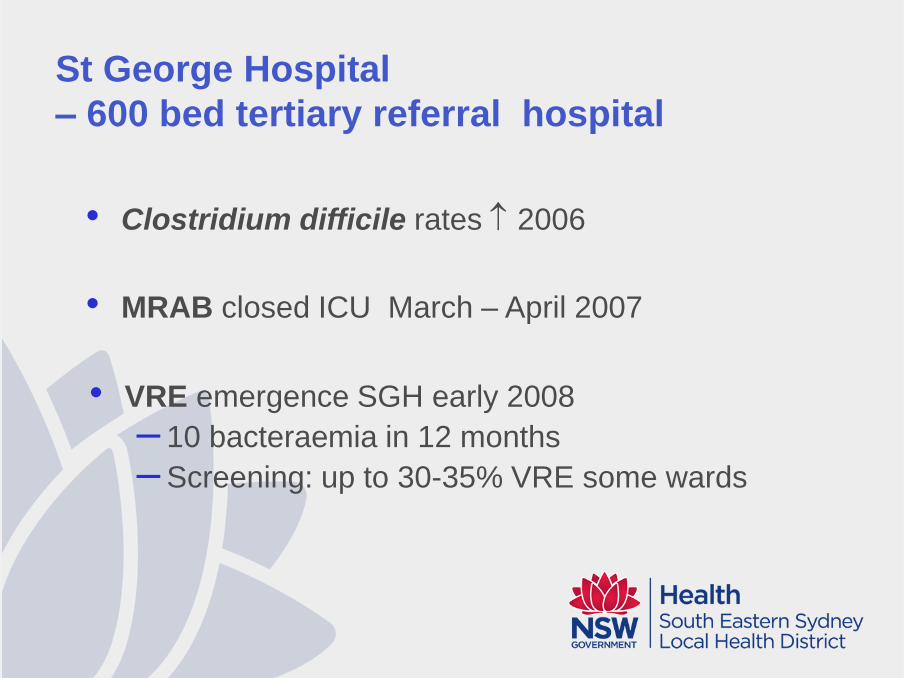
St George Hospital
– 600 bed tertiary referral hospital
• Clostridium difficile rates 2006
• MRAB closed ICU March – April 2007
• VRE emergence SGH early 2008
– 10 bacteraemia in 12 months
– Screening: up to 30-35% VRE some wards
SGH Executive”VRE Working party”: Included AMS
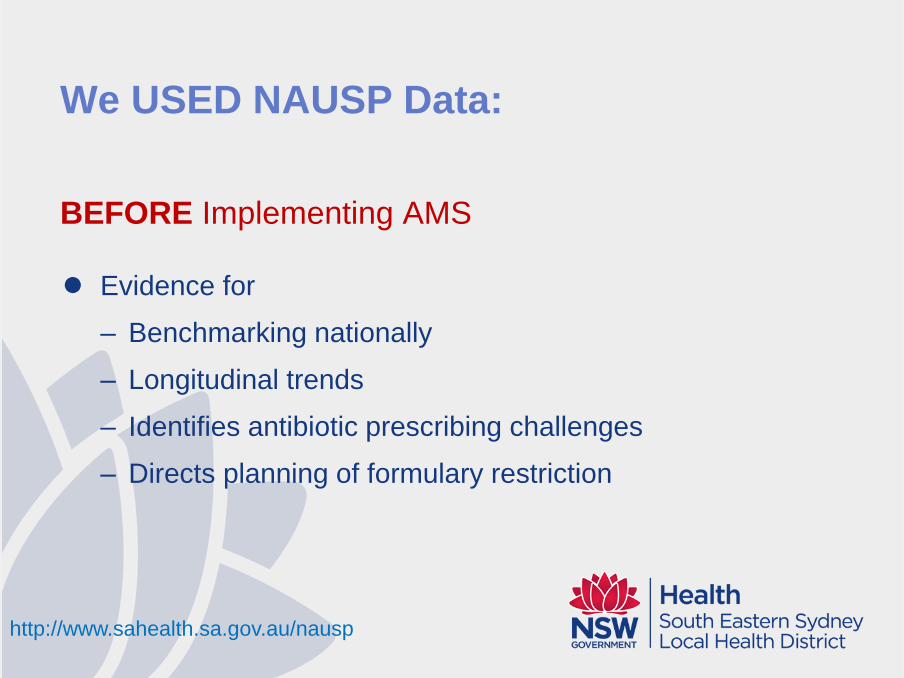
We USED NAUSP Data:
BEFORE Implementing AMS
Evidence for
– Benchmarking nationally
– Longitudinal trends
– Identifies antibiotic prescribing challenges
– Directs planning of formulary restriction
http://www.sahealth.sa.gov.au/nausp
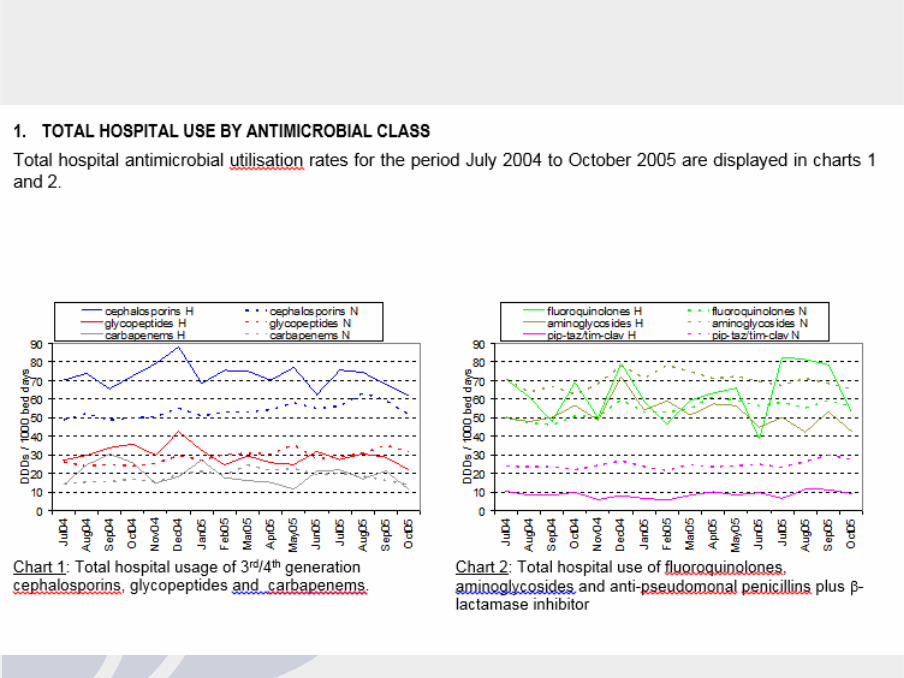
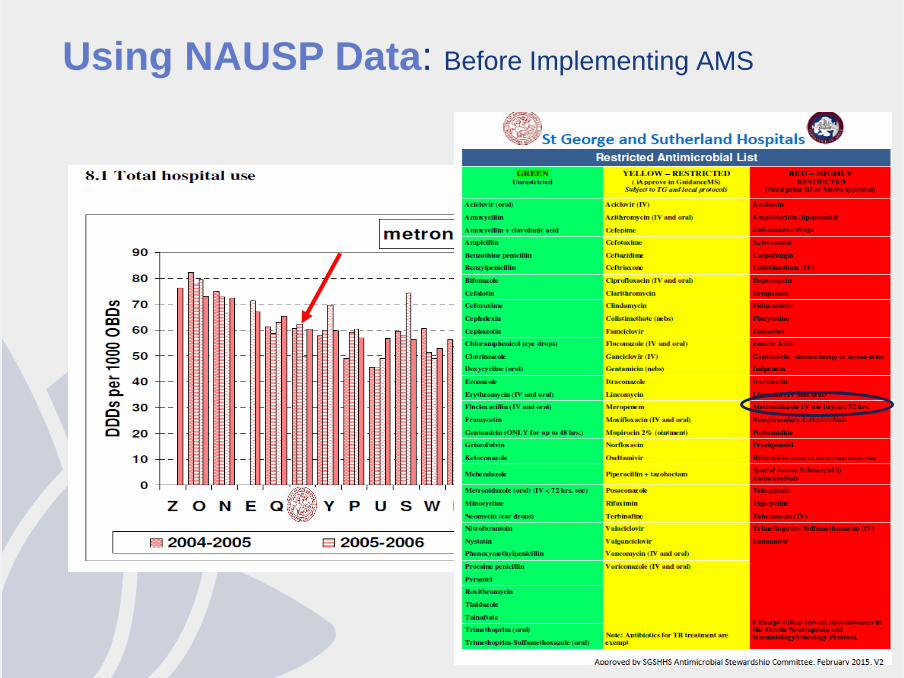
Using NAUSP Data: Before Implementing AMS
Using NAUSP Data:
Evaluating AMS intervention
Longitudinal usage trends
National benchmarking
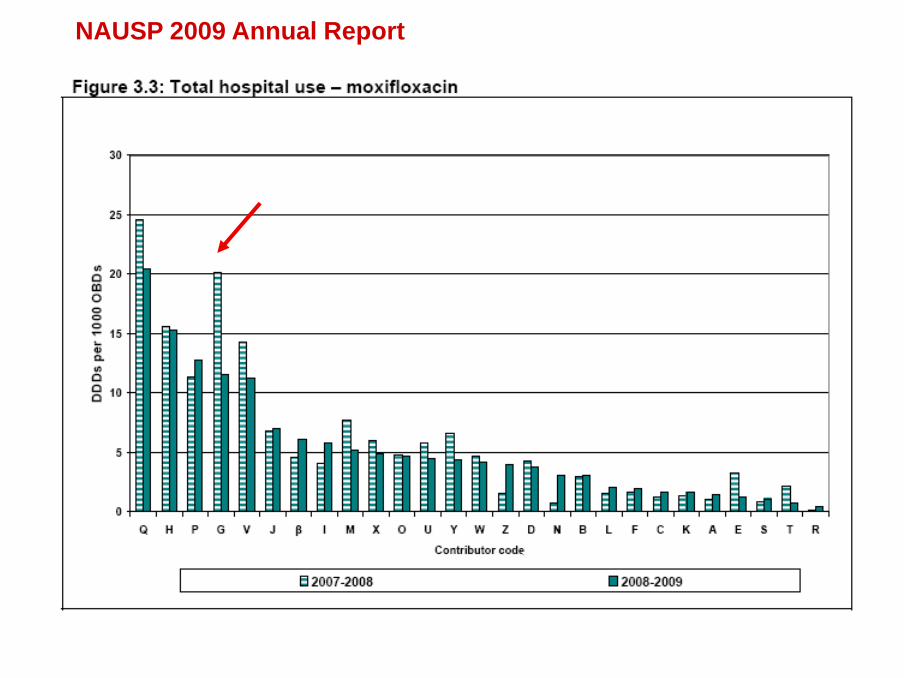
Individual antibiotic level usage
Target “hot spots” for intervention
→ AMS round
→ Guidance MS reports
→ Departmental report → Dept meeting
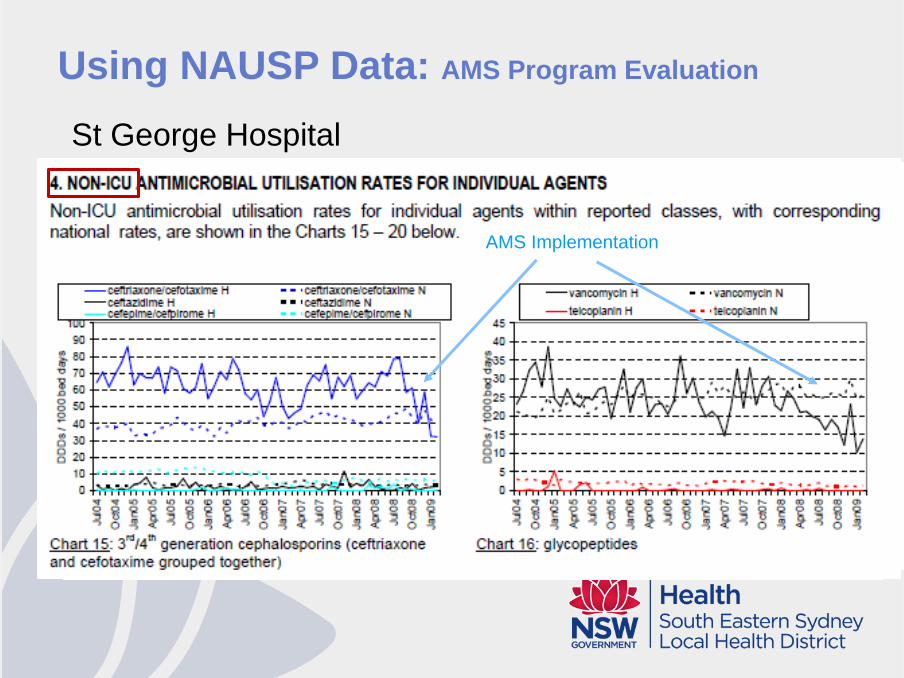
Using NAUSP Data: AMS Program Evaluation
St George Hospital
AMS Implementation AMS Implementation AMS Implementation
Using NAUSP Data:
AFTER AMS intervention - Informing
NAUSP data informs
– AMS Committee, Facility Executive, Local Health District
Clear dashboard data for easy viewing and distribution
Executive sponsorship sustainability
Facility comparisons identify AMS enablers and barriers
(CEC AMS Advisory Group)
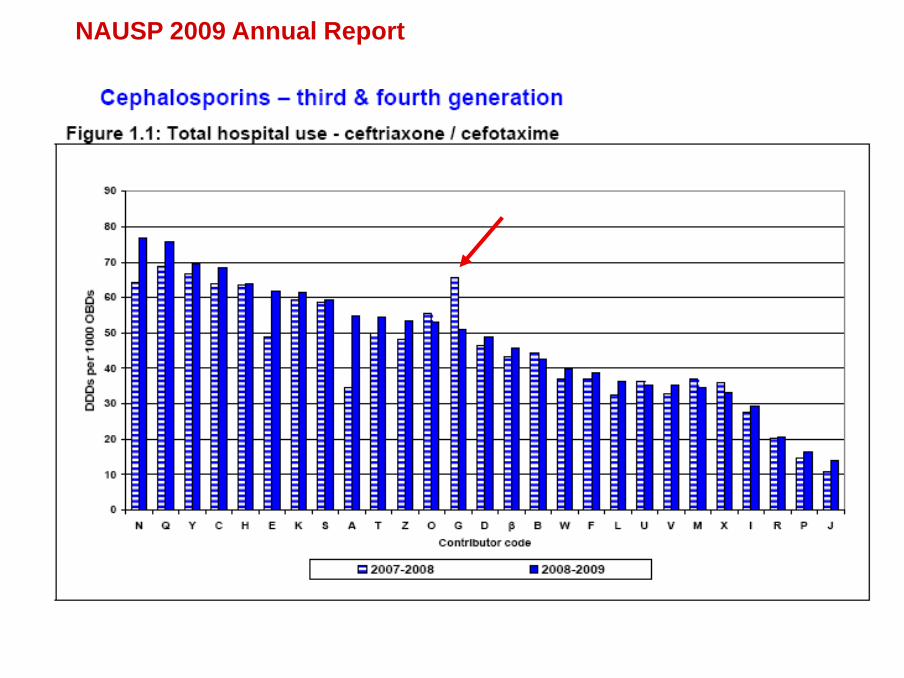
NAUSP 2009 Annual Report
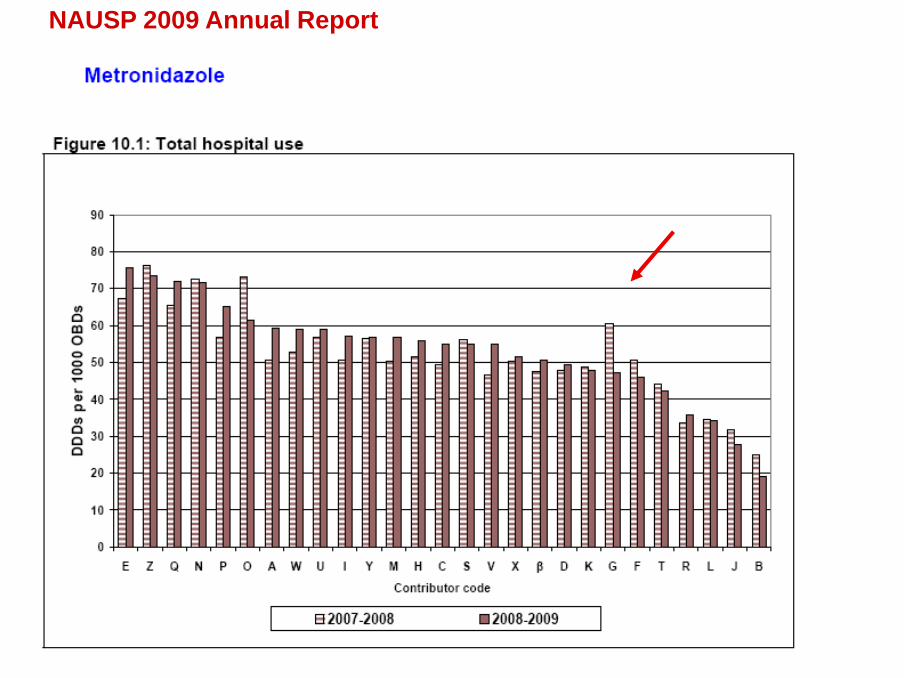
NAUSP 2009 Annual Report
NAUSP 2009 Annual Report
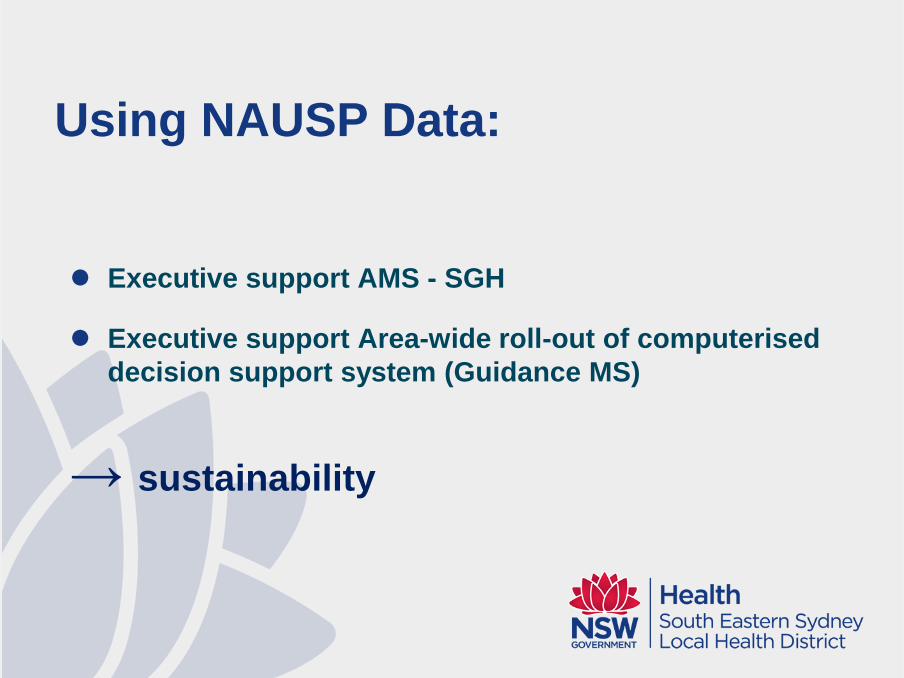
Using NAUSP Data:
Executive support AMS - SGH
Executive support Area-wide roll-out of computerised
decision support system (Guidance MS)
→ sustainability

Ensuring Data Integrity
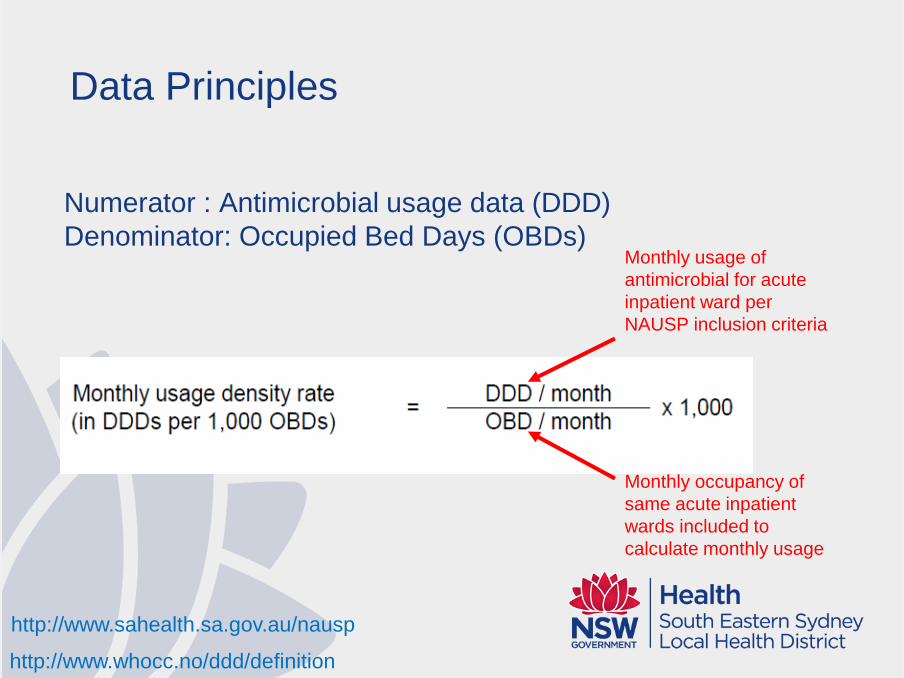
Data Principles
Numerator : Antimicrobial usage data (DDD)
Denominator: Occupied Bed Days (OBDs)
Monthly usage of
antimicrobial for acute
inpatient ward per
NAUSP inclusion criteria
Monthly occupancy of
same acute inpatient
wards included to
calculate monthly usage
http://www.sahealth.sa.gov.au/nausp
http://www.whocc.no/ddd/definition
http://www.sahealth.sa.gov.au/nausp
APPLYING Bimonthly NAUSP Data
Highlights trends for further investigation
Informs individual departmental reporting
Identifies potential programmatic issues
eg AMS ‘fatigue’, intervention review
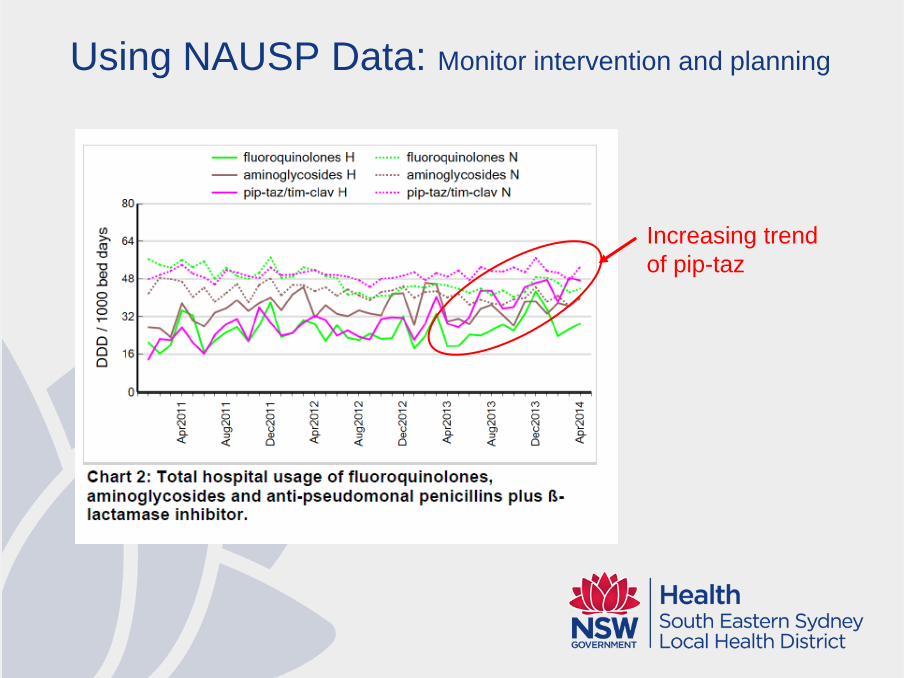
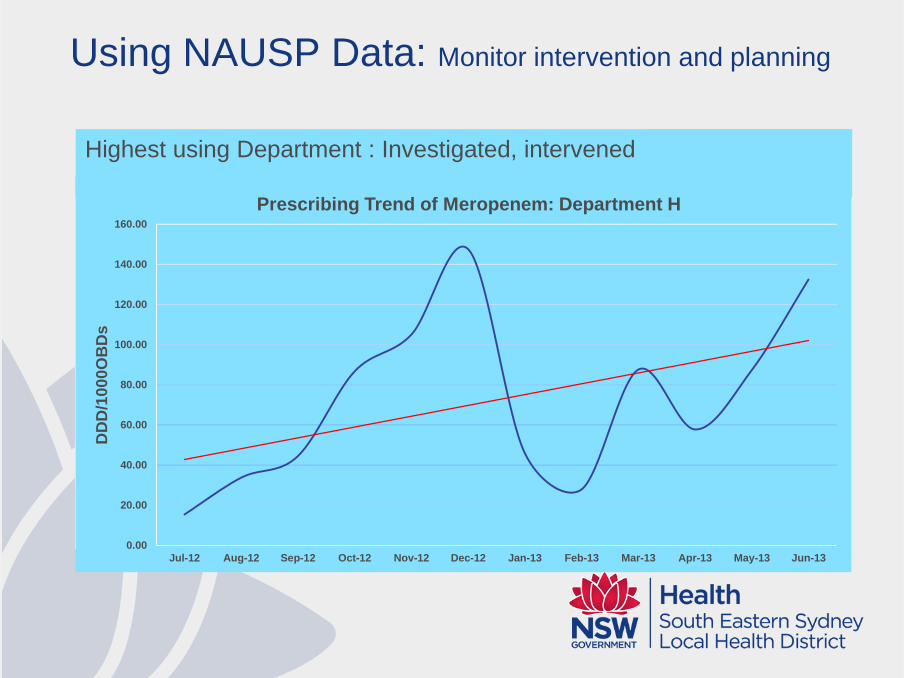
Using NAUSP Data: Monitor intervention and planning
Increasing trend
of pip-taz
Using NAUSP Data: Monitor intervention and planning
Increasing
trend of pip-taz
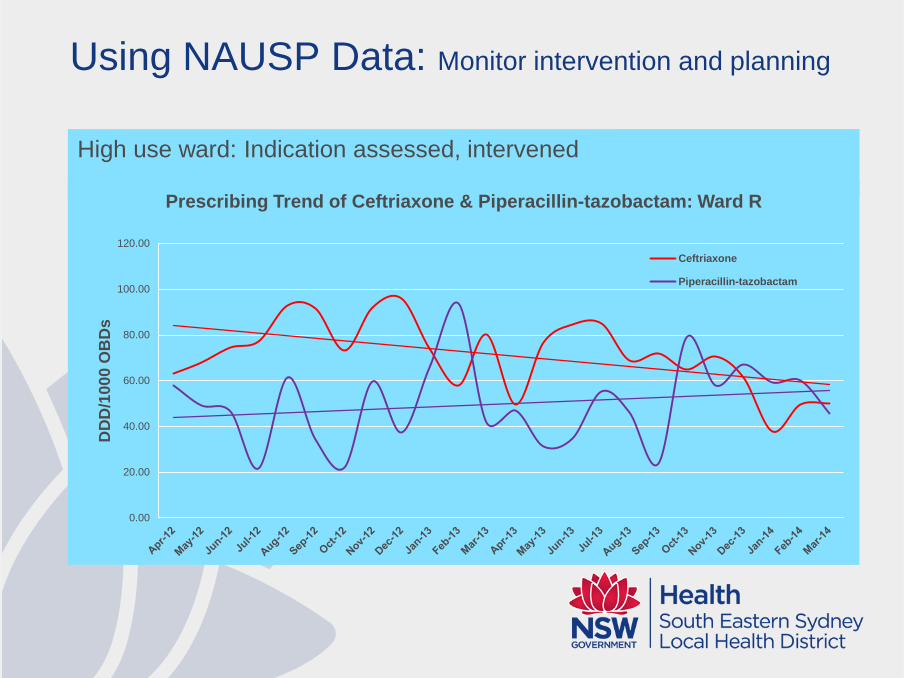
High use ward: Indication assessed, intervened
0.00
20.00
40.00
60.00
80.00
100.00
120.00
DD
D/1
00
0 O
BD
s
Prescribing Trend of Ceftriaxone & Piperacillin-tazobactam: Ward R
Ceftriaxone
Piperacillin-tazobactam
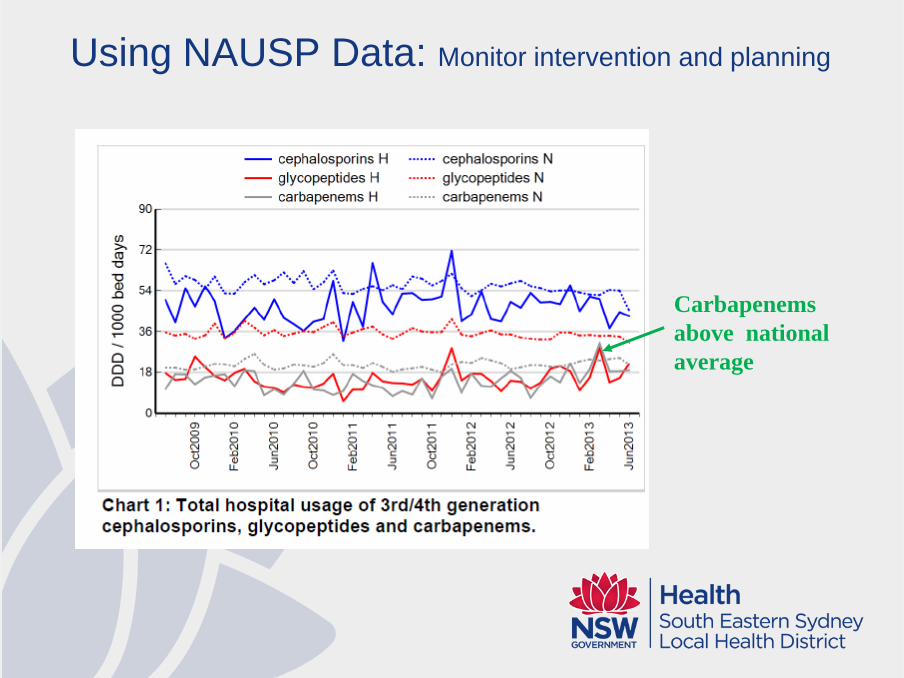
Using NAUSP Data: Monitor intervention and planning
Carbapenems
above national
average
Using NAUSP Data: Monitor intervention and planning
Carbapenems above
national average
0.00
20.00
40.00
60.00
80.00
100.00
120.00
140.00
160.00
Jul-12 Aug-12 Sep-12 Oct-12 Nov-12 Dec-12 Jan-13 Feb-13 Mar-13 Apr-13 May-13 Jun-13
DD
D/1
00
0O
BD
s
Prescribing Trend of Meropenem: Department H
Highest using Department : Investigated, intervened
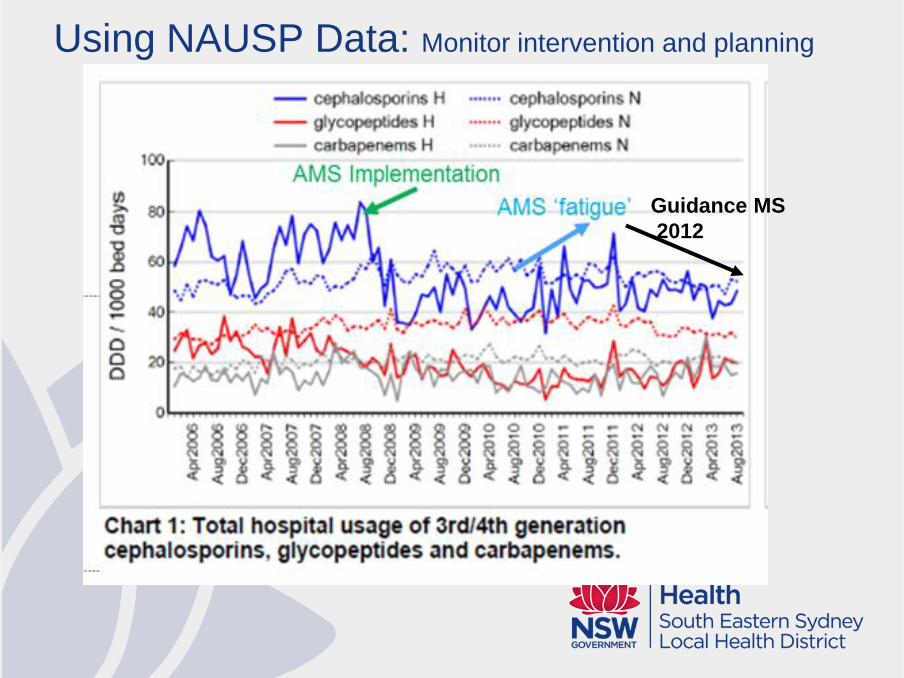
Guidance MS
2012
Using NAUSP Data: Monitor intervention and planning
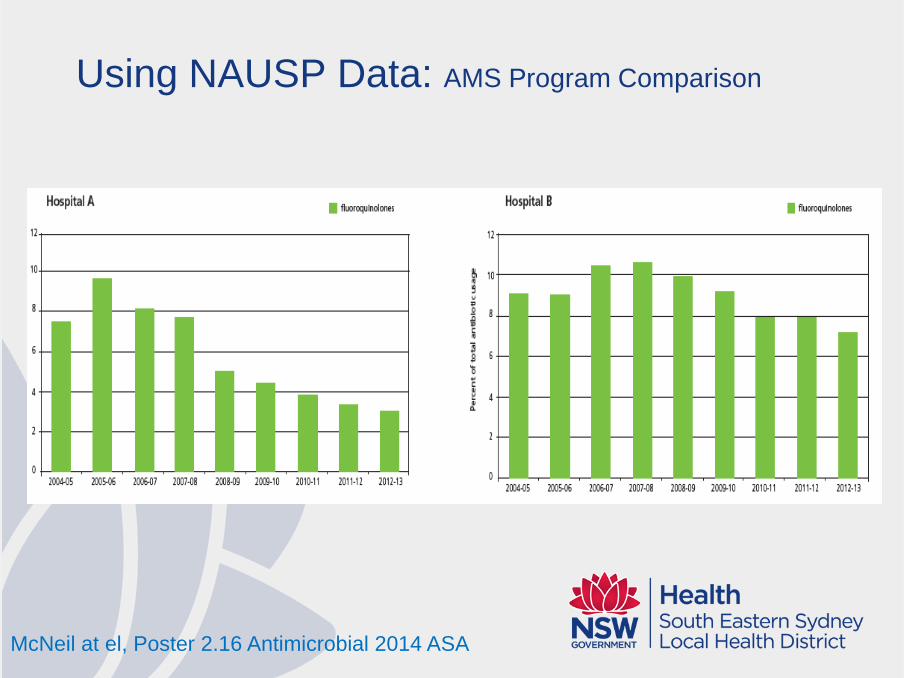
Using NAUSP Data: AMS Program Comparison
McNeil at el, Poster 2.16 Antimicrobial 2014 ASA
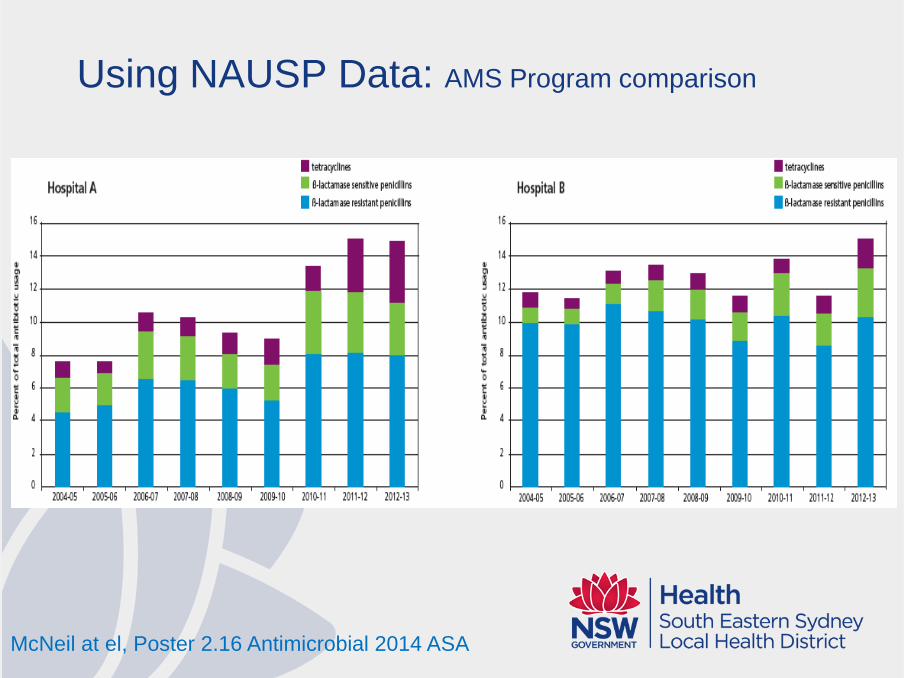
Using NAUSP Data: AMS Program comparison
McNeil at el, Poster 2.16 Antimicrobial 2014 ASA
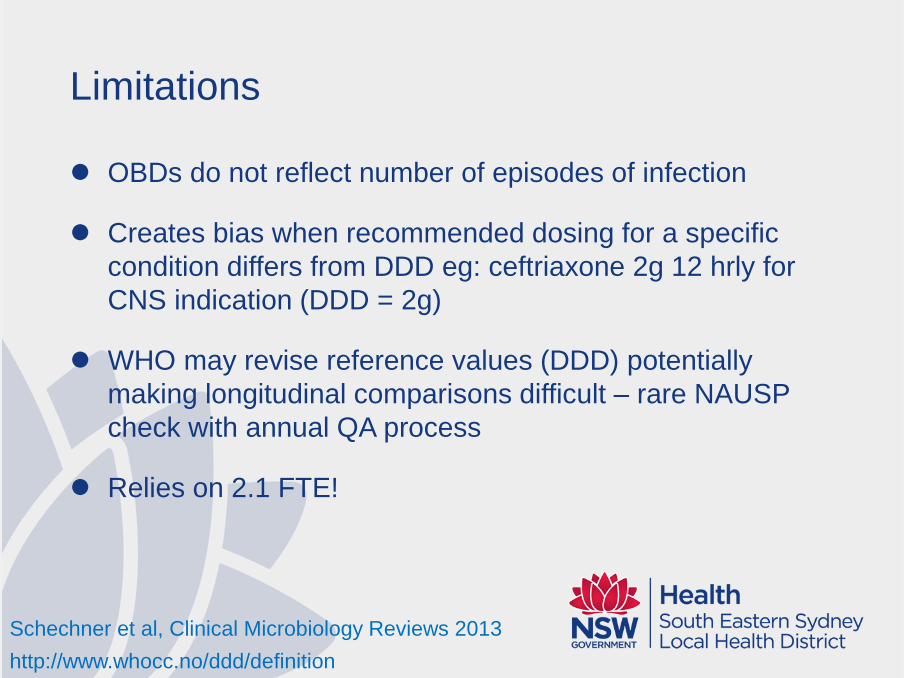
Limitations
OBDs do not reflect number of episodes of infection
Creates bias when recommended dosing for a specific
condition differs from DDD eg: ceftriaxone 2g 12 hrly for
CNS indication (DDD = 2g)
WHO may revise reference values (DDD) potentially
making longitudinal comparisons difficult – rare NAUSP
check with annual QA process
Relies on 2.1 FTE!
Schechner et al, Clinical Microbiology Reviews 2013
http://www.whocc.no/ddd/definition
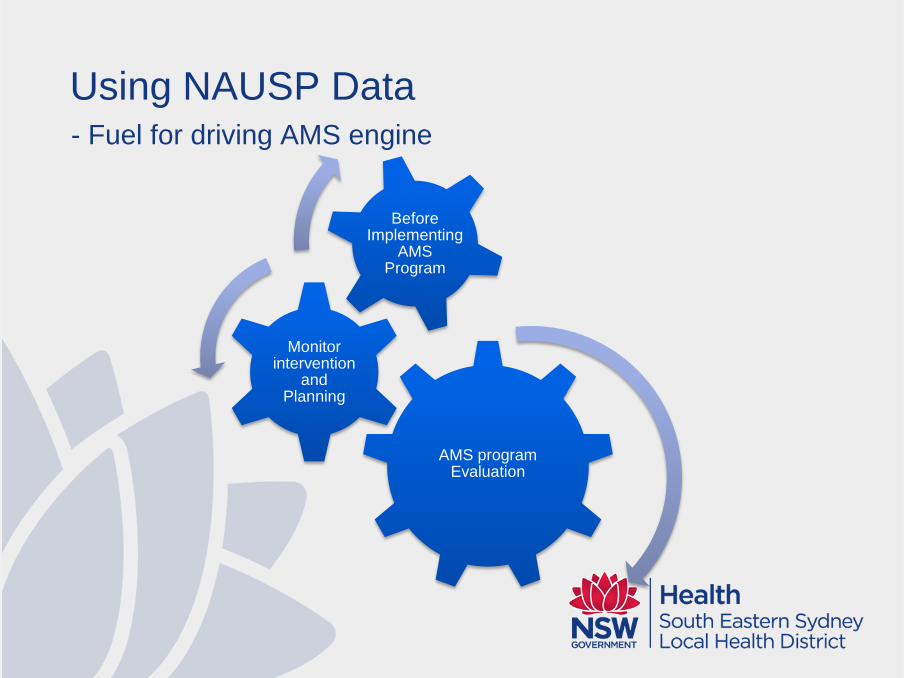
Using NAUSP Data
AMS program Evaluation
Monitor intervention
and Planning
Before Implementing
AMS Program
- Fuel for driving AMS engine
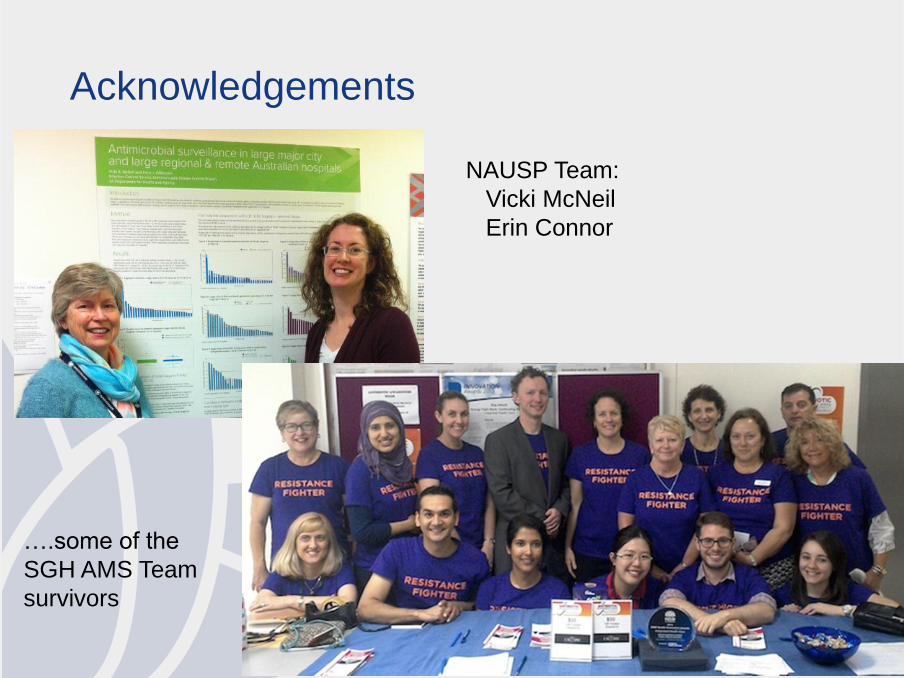
Acknowledgements
NAUSP Team:
Vicki McNeil
Erin Connor
….some of the
SGH AMS Team
survivors
Related Documents