Nature of Human Development in SAARC Region: A Panel Data Analysis Debesh Bhowmik Former Principal, Associated with IEA,TIES,BEA,EAB, UPUEA Email: [email protected]; [email protected] Received: 25 March 2019; Revised: 25 June 2019; Accepted: 15 Sept. 2019; Publication: 15 October 2019 Abstract: The paper relates education expenditure, health expenditure and GDP per capita of SAARC bloc with its human development index during 19902016 in panel data analysis. The growth rates of human development indices and its structural breaks were analysed through semilog linear model and BaiPerron model. Pedroni, Kao and Johansen models of cointegration were applied for long run association. Long run causality was verified by cointegrating equations and short run causality was tested by the Wald test. The paper concludes that HDI of SAARC have been increasing with upward structural breaks. HDI is negatively related with education and health expenditures and positively related with GDP per capita during 19902016. They have at least one cointegrating equation and there were significant long run causalities from education expenditure, health expenditure and GDP per capita to the human development index of SAARC but they had no short run causalities. Rather, there was short causality from human development index to the health expenditure of the SAARC nations. Key words: Human Development Index, education expenditure, health expenditure, random effect model, panel cointegration, panel vector error correction, short run causality, long run causality JEL classification: C22,C23,E24,F15,H15,I10,I18,J24,J64,O15,O40 1. Introduction Human capital is a multidimensional concept relating to health and educational characteristics which promote growth and technological progress including innovations. Better quality of education contributes significantly to the development of cognitive skills and plays an important role in increasing employment, productivity, and income growth. Continuous development of skills through preemployment and onthe job training is critical to sustaining growth in employment and labor productivity. The main engine of growth is the accumulation of human capital and/ or knowledge and the main source of difference in living standards among nations is a difference in human capital. The new growth theories tried to establish that economic growth and development cannot attain an optimum and selfsustenance path without the development of human resources Journal of Quantitative Finance and Economics. 2019, 1, 2 ARF INDIA Academic Open Access Publishing www. arfjournals. com

Welcome message from author
This document is posted to help you gain knowledge. Please leave a comment to let me know what you think about it! Share it to your friends and learn new things together.
Transcript
Nature of Human Development in SAARCRegion: A Panel Data Analysis
Debesh Bhowmik
Former Principal, Associated with IEA,TIES,BEA,EAB, UPUEAEmail: [email protected]; [email protected]
Received: 25 March 2019; Revised: 25 June 2019; Accepted: 15 Sept. 2019; Publication: 15 October 2019
Abstract: The paper relates education expenditure, health expenditure and GDP percapita of SAARC bloc with its human development index during 19902016 in paneldata analysis. The growth rates of human development indices and its structural breakswere analysed through semilog linear model and BaiPerron model. Pedroni, Kaoand Johansen models of cointegration were applied for long run association. Long runcausality was verified by cointegrating equations and short run causality was testedby the Wald test. The paper concludes that HDI of SAARC have been increasing withupward structural breaks. HDI is negatively related with education and healthexpenditures and positively related with GDP per capita during 19902016. They haveat least one cointegrating equation and there were significant long run causalities fromeducation expenditure, health expenditure and GDP per capita to the humandevelopment index of SAARC but they had no short run causalities. Rather, there wasshort causality from human development index to the health expenditure of the SAARCnations.
Key words: Human Development Index, education expenditure, health expenditure,random effect model, panel cointegration, panel vector error correction, short runcausality, long run causality
JEL classification: C22,C23,E24,F15,H15,I10,I18,J24,J64,O15,O40
1. Introduction
Human capital is a multidimensional concept relating to health andeducational characteristics which promote growth and technologicalprogress including innovations. Better quality of education contributessignificantly to the development of cognitive skills and plays an importantrole in increasing employment, productivity, and income growth.Continuous development of skills through preemployment and onthejob training is critical to sustaining growth in employment and laborproductivity.
The main engine of growth is the accumulation of human capital and/or knowledge and the main source of difference in living standards amongnations is a difference in human capital. The new growth theories tried toestablish that economic growth and development cannot attain an optimumand selfsustenance path without the development of human resources
Journal of Quantitative Finance and Economics. 2019, 1, 2 ARF INDIAAcademic Open Access Publishingwww. arfjournals. com
112 Journal of Quantitative Finance and Economics. 2019, 1, 2
(Romer, 1990, 1993a; Lucas, 1993; Stiglitz, 1993; Barro, 2001). Education andtraining enhances the skills and capabilities of the people and brings themto the center stage of economic development of a country (Agarwal, 2006).Stiglitz (1997) stated that improvements in education or health are not justmeans to an end of increased output, but are an ends in themselves. Growthwould suffer if government cuts investment in education through reducingdeficit spending. Based on a crosscountry analysis, Krueger (1968) showedthat human capital differences had the most important role in explainingpercapita income differences between the US and developing countries.Marshall (1920) emphasized that the men’s skills and knowledge have thecapacity to produce increasing returns. The implementation of newtechnology from abroad is a direct function of its domestic human capitalstock (Nelson and Phelps, 1966). Development is closely related withexpanding human capabilities (which is primary end and the principal meansof development) and enlarging human freedom which in turn, empower thepeople to make choices and lead the lives they have reason to value (Sen,2000). The very quality and sustainability of growth, eventually, depends onthe human development and viceversa. Investment in education and healthwere the central conception of development (Myrdal, 1968).
The SAARC as a bloc has been lagging behind in terms of humandevelopment. HDI of SAARC in world ranking did not improve to highlevel during a period of 15 years rather narrowed down their gap with thehigh HDI countries. Despite the fact, SAARC has attained a remarkableimprovement in certain indicators related to health and education. Theeducation gaps by income and gender are also very glaring in SAARCcountries. The low level of income, along with poor expenditure to educationand health, turns the situation from bad to worse. Astonishingly, theexpenditure on defense was higher than that on education and health, bothas percentage of GDP and percentage of central government expenditure.In such a scenario, there are twoway outs, [i] redistribution of the benefitsof growth with public policy intervention and [ii] making the very growthprocess more and more inclusive. The latter policy would require raisinghuman capabilities and, hence, it is a medium and longrun process. Thetwopronged policy recommendations would then be to strengthen theredistributive mechanism and empower the people with quality educationand health.
Of late, the SAARC countries have formulated reformed policies onboth health and education as their national goals but their expenditures oneducation and health are not quite fitted with the policy measures whichwere ultimately observed negative impact on human development indexof SAARC during the survey period from 1990 to 2016.
Nature of Human Development in SAARC Region: A Panel Data Analysis 113
In this context, the paper endeavors to explain the impact of health andeducation expenditure as well as impact of GDP per capita of SAARC onthe human development index of SAARC during the period from 1990 to2016. The paper attempts to fit econometric models of cointegration andvector error correction so that short term and longterm relationships areavailable. The random effect regression model of panel data can also verifytheir relationships in SAARC region.
2. Literature review
The relevant literatures have been discussed in brief. Ranis, Stewart andRamirez (2000) provided an initial exploration of the twoway relationshipbetween human development and economic growth. Boozer et al (2003)followed this model and asserted that education, health, and other aspectsof human development involve fixed costs that can create nonconvexitiesin the social returns to various levels of human development, and thusresult in low and high levels equilibria. Shomeand Tondon (2010) analyzedGDP and HDI relation in ASEAN5 during 20002009 with the help ofPearson Correlation coefficient and for individual economies. They foundthat there is a positive and significant correlation between HDI and GDP inASEAN5. Park (2012) estimated a panel of cross country data during 19702007 and found that investment in human capital and research anddevelopment have significant positive effects on total factor productivitygrowth i. e. a one year increase in average years of schooling led to anincrease in total factor productivity growth by about 0. 3% per year. Razmi,Abbasian and Mohammadi (2012) tried to show the relationship betweengovernment health expenditure and human development index in Iranduring 19902009 by OLS method and showed the positive and significantrelation. Elmi and Sadeghi(2012),using panel data from 1990 to 2009 of thedeveloping countries and applying cointegration, causality and vector errorcorrection model,showed that there is short run causality running fromGDP to health expenditure and bidirectional relationship in the long run.After analyzing the data, Poudel (2014) concluded that the differencebetween the SAARC countries’ HDI is very low because of the much higherdifferences in the education index and adult literacy rate. However, HDI inSAARC countries is not as high as it could be although the region has beenshowing continuous progress in HDI. Shah (2016) studied relation amongHDI and its determinants like GDP percapita, literacy rate, life expectancy,inflation rate, CO
2 emission, fertility rate, Gini index for 188 countries.
Regression analysis showed that GDP, life expectancy, literacy rate, influencedpositively and Gini, fertility rate, CO
2 emission and inflation rate influenced
negatively on HDI significantly. Mirahsani (2016) examined the relationship
114 Journal of Quantitative Finance and Economics. 2019, 1, 2
between human development index and health expenditure as a ratio of GDPin 25 South West Asian countries during 20002009 through OLS methodwith F test and found the relationship was significant and positive.
Dwivedi (2017) studied that the gender inequality index (GII) in theSouth Asian countries is gradually decreasing in which there are threedimensions of disparities such as reproductive health, empowerment, andlabor market participation. The gender disparity in education is consideredas the biggest hindrance in women empowerment. It has a direct impact oneconomic growth through lowering the average quality of human capital.Economic growth is indirectly affected through the impact of genderinequality on investment and population growth. Economically, South Asianwomen have limited access to resources and rely on male for any type offinancial decision. Historically, South Asian women are deprived by landrights. Simply by increasing the literacy level among girls and women,promoting woman’s labor participation and economic independency, andexpanding the female reproductive health right can significantly reducethe long persist inequality in this region. Nevertheless, equal access toeducation, health and employment can assure the women empowermentand gender equality in the long run. Zaidi (2017) emphasized on policyprescriptions such that in South Asia equitable access can be accelerated byhealth ministers through action on financing, governance or humanresources to direct health resources towards poor people or through actionon social determinants of health such as health insurance scheme andcontracting private sector services, improving risk pooling and reducingpoint of service payment. Lim(2018) explained the methods of the WorldBank and tried to link between investing in people and economic growthto accelerate financing for human capital investments. It estimatededucational attainment using 2522 censuses and household surveys takinglives of age 20 to 64 years and adjusted for educational attainment, learningor education quality, and functional health status using rates specific toeach time period, age, and sex for 195 countries from 1990 to 2016 andestimated on 1894 tests among schoolaged children using functional healthstatus on the prevalence of seven health conditions, which were taken fromthe Global Burden of Diseases, Injuries, and Risk Factors Study 2016 (GBD,2016). The study showed marked variation from less than 2 years of progressin 18 countries to more than 5 years of progress in 35 countries. Largerimprovements in expected human capital appeared to be associated withfaster economic growth. The top quartile of countries in terms of absolutechange in human capital from 1990 to 2016 had a median annualised growthin gross domestic product of 2·60% (IQR 1·85–3·69) compared with 1·45%(0·18–2·19) for countries in the bottom quartile.
Nature of Human Development in SAARC Region: A Panel Data Analysis 115
In 17 countries of SAARCASEAN region, Rahman et al(2018) estimatedfixed effect and random effect regression models during 55 years of datafrom the World Development Indicators and found that the effects of healthcare expenditure on life expectancy and on death rate are positive, and theestimated results of health care expenditures on infant mortality rate isnegative. The condition of public health expenditure (as a percentage ofgovernment expenditure) is very poor in South Asia. It is less than onethird of that of the OECD countries, and around half of that of South EastAsian countries. Bhowmik(2018) studied that HDI of India has beenincreasing with three upward structural breaks in 1996, 2004 and 2011respectively. One per cent increase in HDI of India led to 1. 41% increase inGDP growth rate during 19902016. Moreover, one per cent rise in HDI peryear led to 5. 86% rise in GDP at current prices, 4. 828% increase in GDP percapita and 0. 5028% decrease in unemployment rate per year respectivelyduring 19902016 in India. Even, HDI has unidirectional causality with GDPat current prices and GDP per capita. There is positive association amongGSDP and GSDP per capita with high and medium human developmentand low human development states of India for those years. In fixed effectmodel of panel data, the regression between all states’ HDI and GSDP percapita is positive. The paper finds sigma convergence of HDI of all states.Only four states showed negative growth of HDI in spite of their risingtrends of social sector expenditure. Bhowmik (2019) found that one percentincrease in GDP at current prices, education expenditure, and unemploymentrate per year led to 0. 105% increase, 0. 028% increase and 0. 027% decrease inHDI per year significantly and one percent increase in health expenditureled to 0. 0124% increase in HDI per year insignificantly in ASEAN (Associationof Southeast Asian Nations) during 19902016. Panel cointegration suggestedthat there are three cointegrating equations in which two are moving towardsequilibrium. There is significant long run association among healthexpenditure percentage of GDP and unemployment rate on the HumanDevelopment Index (HDI) of the ASEAN during 19902016.
Therefore, empirical studies in different countries and regions did notfind positive relation between HDI and education and health expendituresin all times.
3. Methodology and the source of data
Secondary data of SAARC countries’ human development indices,educationexpenditure per cent of GDP,health expenditure per cent of GDP and GDPper capita at current US dollar were taken from the World Bank. India’seducation expenditure from 19902000 were collected from CSO. Healthexpenditure of Pakistan was taken from www.data.un.org/data.
116 Journal of Quantitative Finance and Economics. 2019, 1, 2
The paper endeavors to find out econometric relations where some ofthe basic models have been used. The cross section random effect model ofpanel regression among human development index,education and healthexpenditure (as per cent of GDP) and GDP per capita (at current prices inUS Dollar) during 19902016 of SAARC have been applied. The Hausmantest (1978) has been utilized for acceptance or rejection of random effectmodel. Growth rates of human development indices were calculated bysemilog linear regression model. Structural breaks were calculated by BaiPerron model (2003). Kao and Chiang (1999), Pedroni (1999) and Fisher(1932)Johansen (1988) models of cointegration tests had been applied tofind the long run association among the said variables of SAARC region.Hansen and Doornik (1994) model verified the normality of residual test ofVECM. Wald test (1943) was used to justify the short run causality betweenthe variables and long run causality was verified through the cointegratingequation which was derived from the estimation of the system equationsof the VECM.
The Johansen Cointegration approach basically takes its starting pointin the vector autoregression (VAR) of order p given by
yt = µ + A
1y
t”1+……+ A
py
t”p+
t
where yt is a nx1 vector of variables that are integrated of order one –
commonly denoted I (1) – and t is a nx1 vector of innovations. This VAR
can be rewritten as
p 1t t 1 i 1 i t 1 ty μ y y
where p 1i 1 iA 1 and
pi j i 1 jA
If the coefficient matrix has reduced rank r < n then there exist nxrmatrices and with rank r such that = ´ and ´y
t is stationary,r is the
number of cointegrating relationship.The trace test and maximum eigenvalue test, shown in equations as
follows,
1 ln(1 )ntrace i rJ T t
Jmax
=Tln(1–t)
Here T is the sample size and i is the ith largest canonical correlation.
The trace test tests the null hypothesis of r cointegrating vectors againstthe alternative hypothesis of n cointegrating vectors. The maximumeigenvalue test, on the other hand, tests the null hypothesis of rcointegrating vectors against the alternative hypothesis of r +1cointegrating vectors.
Nature of Human Development in SAARC Region: A Panel Data Analysis 117
4. Observations of models and discussions
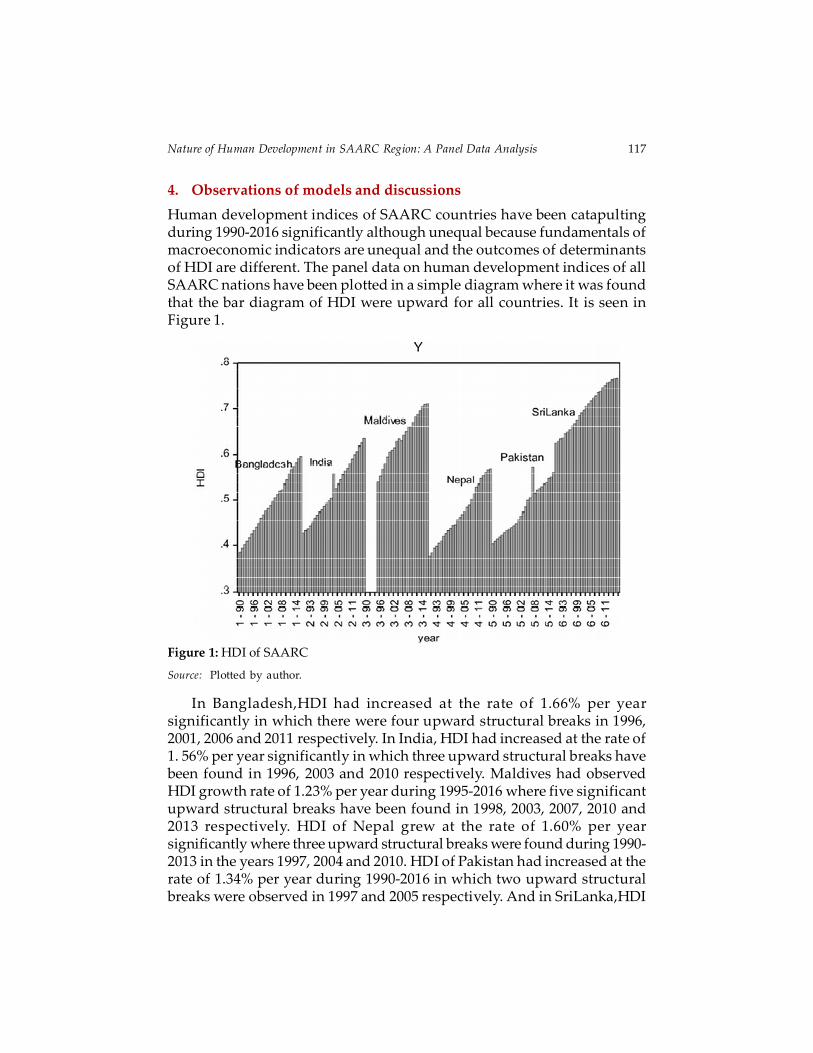
Human development indices of SAARC countries have been catapultingduring 19902016 significantly although unequal because fundamentals ofmacroeconomic indicators are unequal and the outcomes of determinantsof HDI are different. The panel data on human development indices of allSAARC nations have been plotted in a simple diagram where it was foundthat the bar diagram of HDI were upward for all countries. It is seen inFigure 1.
Figure 1: HDI of SAARC
Source: Plotted by author.
In Bangladesh,HDI had increased at the rate of 1.66% per yearsignificantly in which there were four upward structural breaks in 1996,2001, 2006 and 2011 respectively. In India, HDI had increased at the rate of1. 56% per year significantly in which three upward structural breaks havebeen found in 1996, 2003 and 2010 respectively. Maldives had observedHDI growth rate of 1.23% per year during 19952016 where five significantupward structural breaks have been found in 1998, 2003, 2007, 2010 and2013 respectively. HDI of Nepal grew at the rate of 1.60% per yearsignificantly where three upward structural breaks were found during 19902013 in the years 1997, 2004 and 2010. HDI of Pakistan had increased at therate of 1.34% per year during 19902016 in which two upward structuralbreaks were observed in 1997 and 2005 respectively. And in SriLanka,HDI
118 Journal of Quantitative Finance and Economics. 2019, 1, 2
had been rising at the rate of 0.85% per year during 19902016 in whichthere were four upward structural breaks in 1997, 2002, 2007 and 2012respectively. All these findings have been arranged in Table 1 and Table 2.
Table 1 : Progress of HDI in SAARC
Countries Period Growth rate of Results (*=significant at Sig/nonsigHDI per year 5% level)
Bangladesh 19902016 1. 66% Log(y1)=0. 954+0. 0166t Significant
(321. 40)*(0. 10)*R2=0. 99,y
1=HDI of Bangladesh,
India 19902016 1. 56% Log(y2)=0. 870+0. 0156t Significant
(152. 36)*(43. 74)*R2=0. 98,y
2=HDI of India
Maldives 19952016 1. 23% Log(y3)=0. 655+0. 0123t Significant
(78. 74)*(26. 20)*R2=0. 97,y
3=HDI of Maldives
Nepal 19902016 1. 60% Log(y4)= 0. 986+0. 0160t Significant
(293. 42)*(76. 42)*R2=. 99,y
4=HDI of Nepal
Pakistan 19902016 1. 34% Log(y5)=0. 926+0. 0134t Significant
(83. 17)*(19. 36)*R2=0. 93,y
5=HDI of Pakistan
Sri Lanka 19902016 0. 85% Log(y6)=0. 476+0. 0086t Significant
(168. 86)*(68. 68)*R2=0. 98,y
6=HDI of Sri Lanka
Source: Calculated by author
Table 2 : Structural breaks of HDI
Countries Period No. of Years of breaks Sig. /nonsig Upward/breaks downward
Bangladesh 19902016 4 1996, 2001, 2006, 2011 Significant UpwardIndia 19902016 3 1996, 2003, 2010 Significant UpwardMaldives 19952016 5 1998, 2003, 2007, Significant Upward
2010, 2013Nepal 19902016 3 1997, 2004, 2010 Significant UpwardPakistan 19902016 2 1997, 2005 Significant UpwardSri Lanka 19902016 4 1997, 2002, 2007, 2012 Significant Upward
Source: Calculated by author
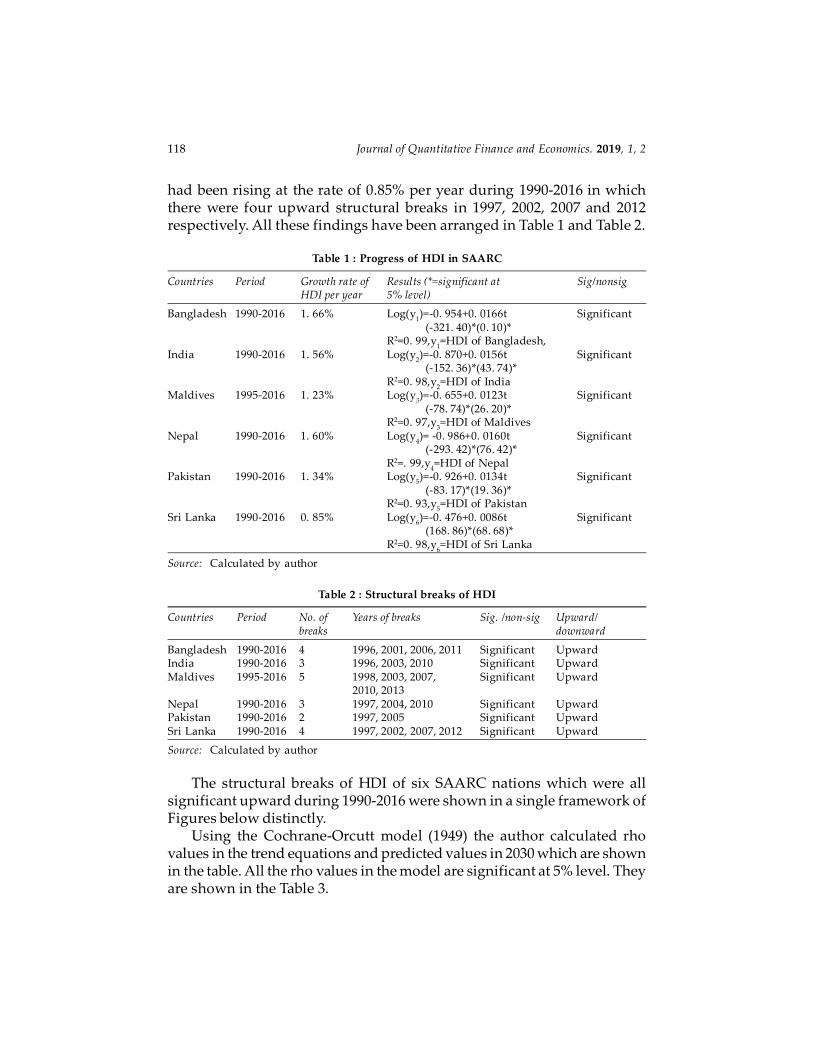
The structural breaks of HDI of six SAARC nations which were allsignificant upward during 19902016 were shown in a single framework ofFigures below distinctly.
Using the CochraneOrcutt model (1949) the author calculated rhovalues in the trend equations and predicted values in 2030 which are shownin the table. All the rho values in the model are significant at 5% level. Theyare shown in the Table 3.
Nature of Human Development in SAARC Region: A Panel Data Analysis 119
Fig
ure
2: N
atu
re o
f st
ruct
ura
l b
reak
s o
f H
DI
Sou
rce:
Plo
tted
by
au
tho
r
120 Journal of Quantitative Finance and Economics. 2019, 1, 2
Table 3: Rho values in 2030
SAARC region Estimated Rho values Rho values in 2030
Bangladesh 0. 00725 0. 3498India 0. 204418 0. 2654Maldives 0. 0258 0. 2879Nepal 0. 0267 0. 3654Pakistan 0. 087019 0. 4839Sri Lanka 0. 0577 0. 19327
Source: Calculated by author
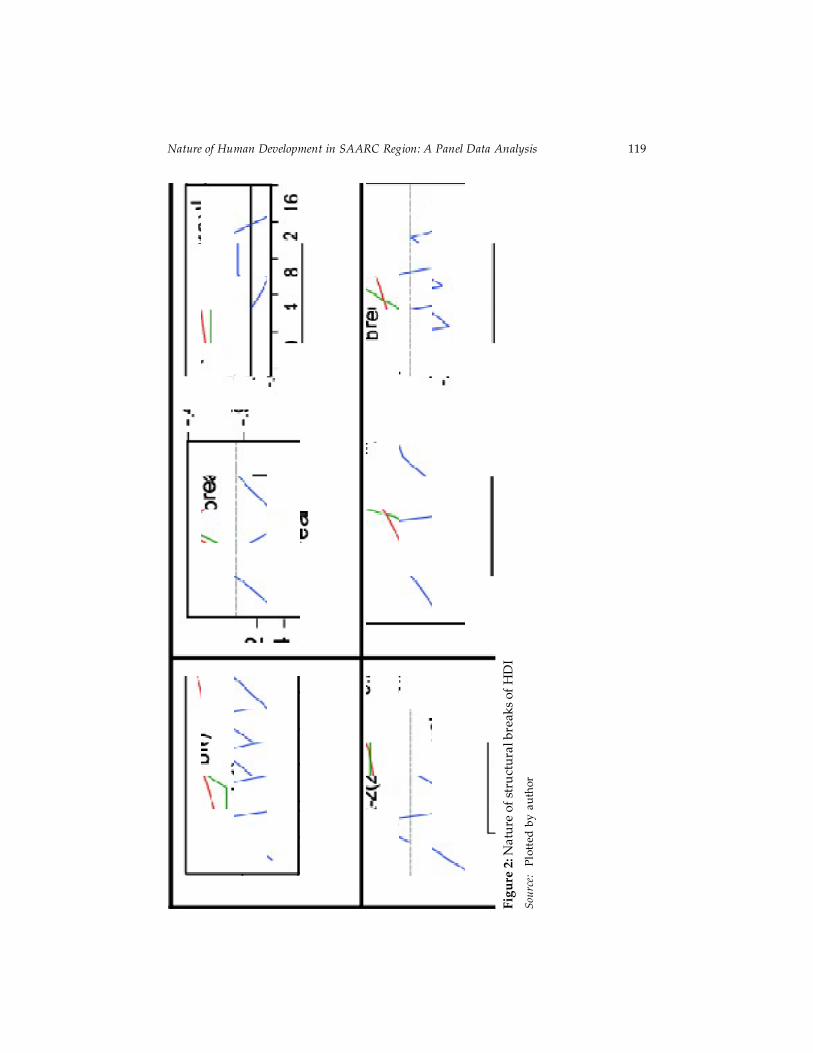
The predicted values of HDI in ARIMA(1,1,1) model for the SAARCcountries have been plotted in Figure 3 in which the vertical lines on thepredicted trendlines are shown at shown at 5% significant level i. e. upwardmovements are unaltered till 2030.
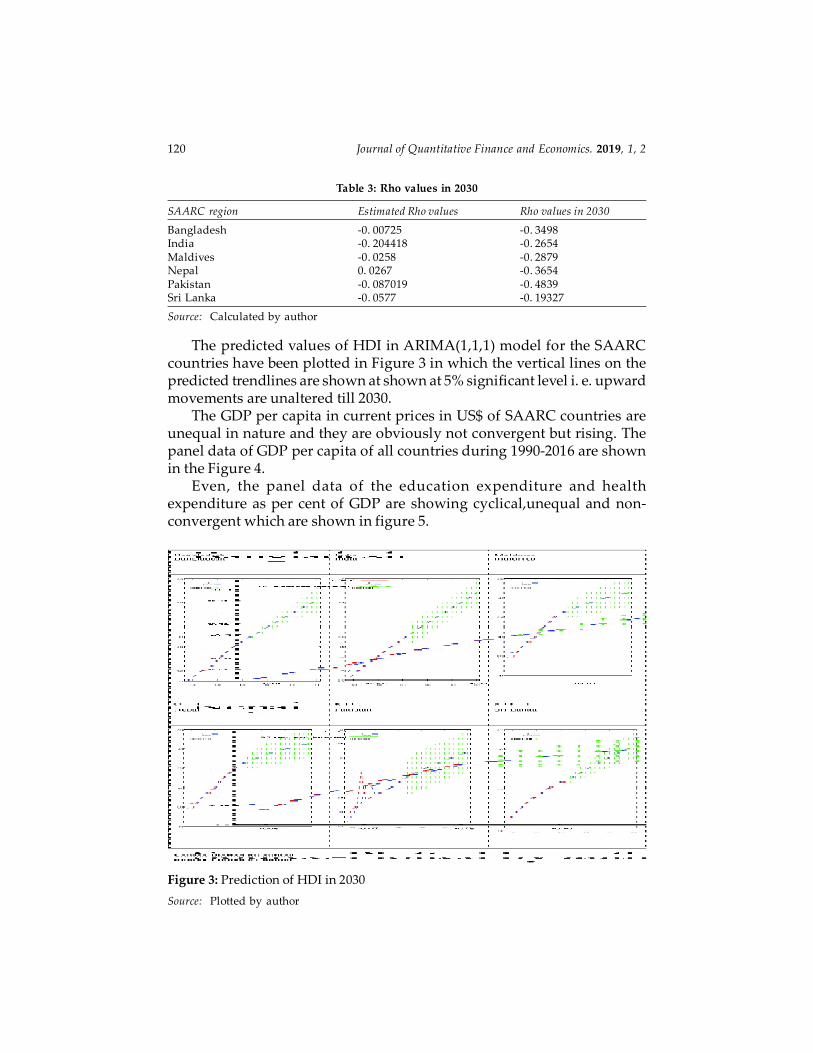
The GDP per capita in current prices in US$ of SAARC countries areunequal in nature and they are obviously not convergent but rising. Thepanel data of GDP per capita of all countries during 19902016 are shownin the Figure 4.
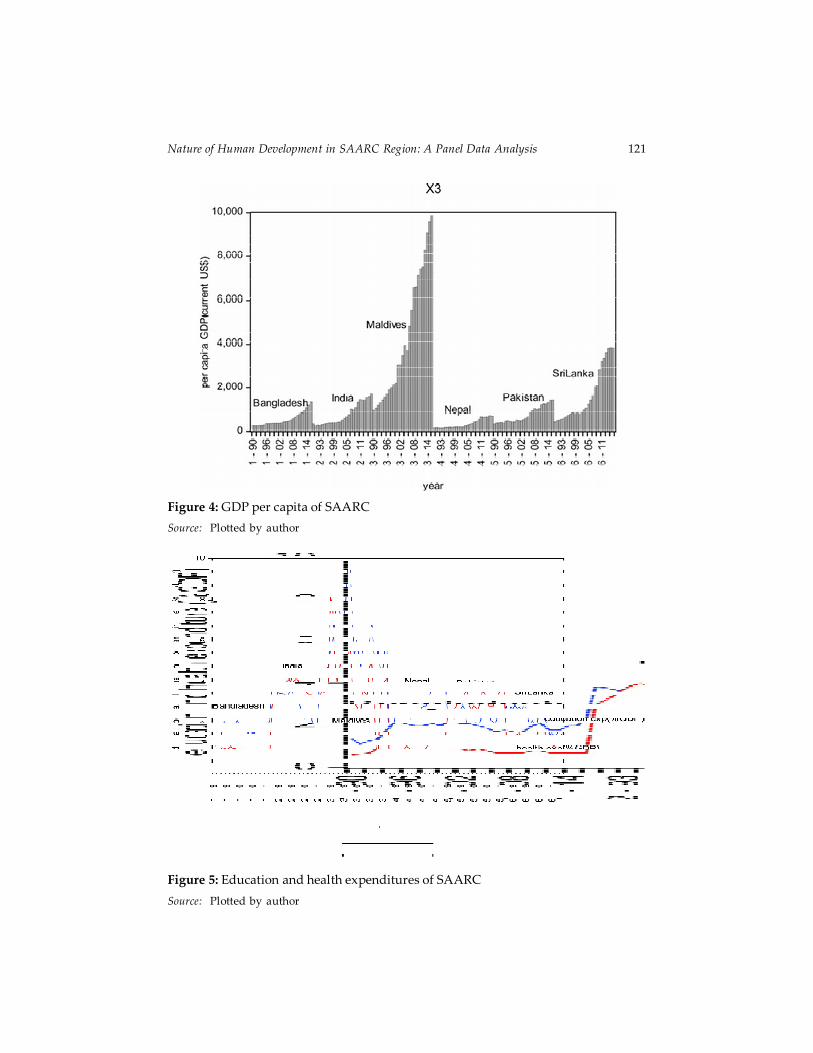
Even, the panel data of the education expenditure and healthexpenditure as per cent of GDP are showing cyclical,unequal and nonconvergent which are shown in figure 5.
Figure 3: Prediction of HDI in 2030
Source: Plotted by author
Nature of Human Development in SAARC Region: A Panel Data Analysis 121
Figure 4: GDP per capita of SAARC
Source: Plotted by author
Figure 5: Education and health expenditures of SAARC
Source: Plotted by author
122 Journal of Quantitative Finance and Economics. 2019, 1, 2
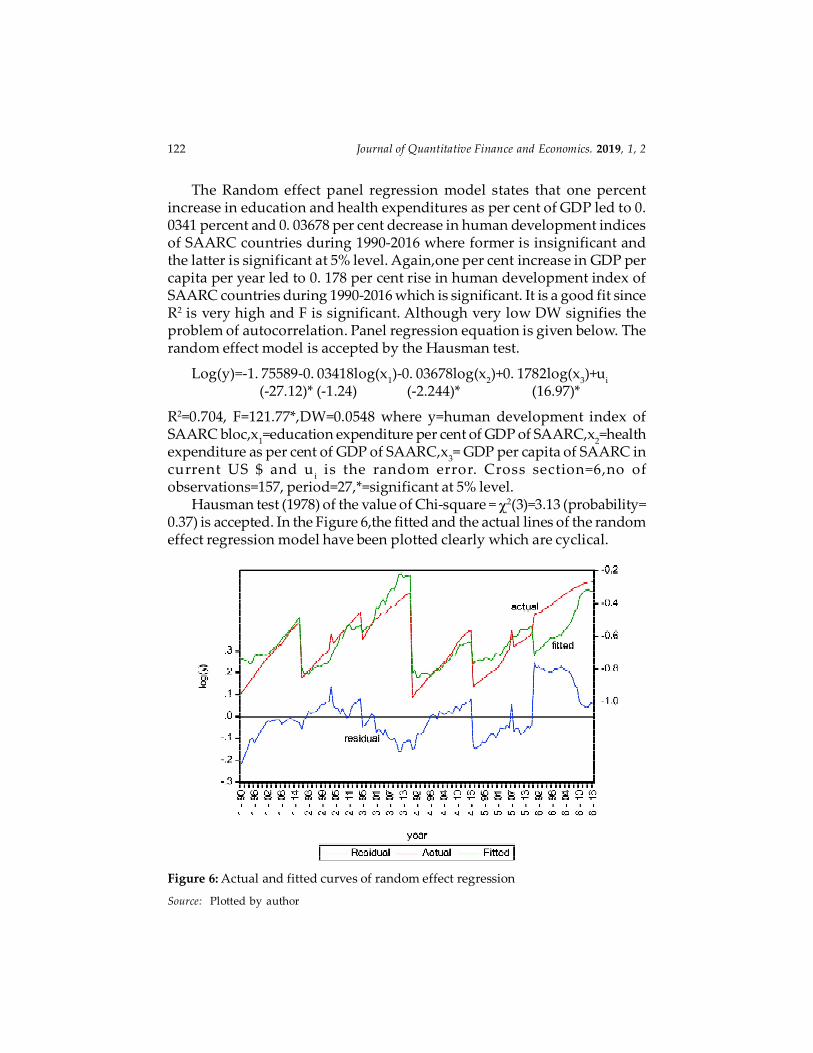
The Random effect panel regression model states that one percentincrease in education and health expenditures as per cent of GDP led to 0.0341 percent and 0. 03678 per cent decrease in human development indicesof SAARC countries during 19902016 where former is insignificant andthe latter is significant at 5% level. Again,one per cent increase in GDP percapita per year led to 0. 178 per cent rise in human development index ofSAARC countries during 19902016 which is significant. It is a good fit sinceR2 is very high and F is significant. Although very low DW signifies theproblem of autocorrelation. Panel regression equation is given below. Therandom effect model is accepted by the Hausman test.
Log(y)=1. 755890. 03418log(x1)0. 03678log(x
2)+0. 1782log(x
3)+u
i
(27.12)* (1.24) (2.244)* (16.97)*
R2=0.704, F=121.77*,DW=0.0548 where y=human development index ofSAARC bloc,x
1=education expenditure per cent of GDP of SAARC,x
2=health
expenditure as per cent of GDP of SAARC,x3= GDP per capita of SAARC in
current US $ and ui is the random error. Cross section=6,no of
observations=157, period=27,*=significant at 5% level.Hausman test (1978) of the value of Chisquare = 2(3)=3.13 (probability=
0.37) is accepted. In the Figure 6,the fitted and the actual lines of the randomeffect regression model have been plotted clearly which are cyclical.
Figure 6: Actual and fitted curves of random effect regression
Source: Plotted by author
Nature of Human Development in SAARC Region: A Panel Data Analysis 123
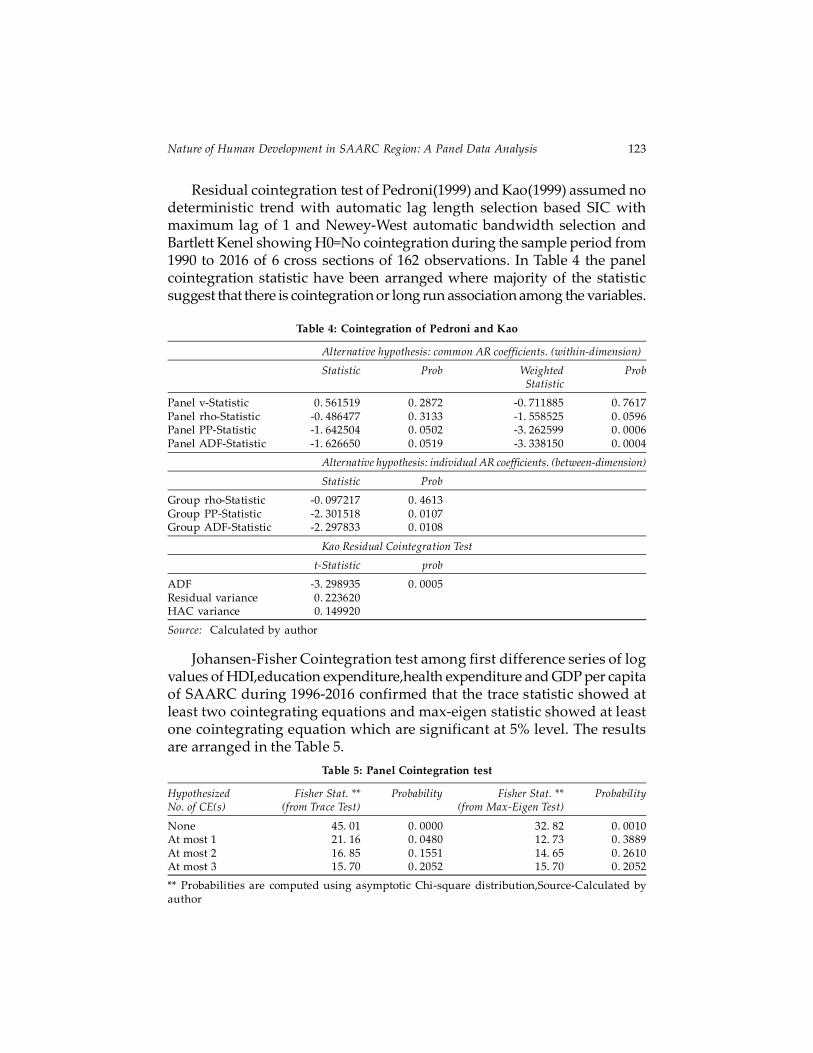
Residual cointegration test of Pedroni(1999) and Kao(1999) assumed nodeterministic trend with automatic lag length selection based SIC withmaximum lag of 1 and NeweyWest automatic bandwidth selection andBartlett Kenel showing H0=No cointegration during the sample period from1990 to 2016 of 6 cross sections of 162 observations. In Table 4 the panelcointegration statistic have been arranged where majority of the statisticsuggest that there is cointegration or long run association among the variables.
Table 4: Cointegration of Pedroni and Kao
Alternative hypothesis: common AR coefficients. (withindimension)
Statistic Prob Weighted ProbStatistic
Panel vStatistic 0. 561519 0. 2872 0. 711885 0. 7617Panel rhoStatistic 0. 486477 0. 3133 1. 558525 0. 0596Panel PPStatistic 1. 642504 0. 0502 3. 262599 0. 0006Panel ADFStatistic 1. 626650 0. 0519 3. 338150 0. 0004
Alternative hypothesis: individual AR coefficients. (betweendimension)
Statistic Prob
Group rhoStatistic 0. 097217 0. 4613Group PPStatistic 2. 301518 0. 0107Group ADFStatistic 2. 297833 0. 0108
Kao Residual Cointegration Test
tStatistic prob
ADF 3. 298935 0. 0005Residual variance 0. 223620HAC variance 0. 149920
Source: Calculated by author
JohansenFisher Cointegration test among first difference series of logvalues of HDI,education expenditure,health expenditure and GDP per capitaof SAARC during 19962016 confirmed that the trace statistic showed atleast two cointegrating equations and maxeigen statistic showed at leastone cointegrating equation which are significant at 5% level. The resultsare arranged in the Table 5.
Table 5: Panel Cointegration test
Hypothesized Fisher Stat. ** Probability Fisher Stat. ** ProbabilityNo. of CE(s) (from Trace Test) (from MaxEigen Test)
None 45. 01 0. 0000 32. 82 0. 0010At most 1 21. 16 0. 0480 12. 73 0. 3889At most 2 16. 85 0. 1551 14. 65 0. 2610At most 3 15. 70 0. 2052 15. 70 0. 2052
** Probabilities are computed using asymptotic Chisquare distribution,SourceCalculated byauthor
124 Journal of Quantitative Finance and Economics. 2019, 1, 2
Thus, all the cointegration tests conclude that the long run associationexist among HDI, education and health expenditures and GDP per capitain SAARC during 19902016 in India.
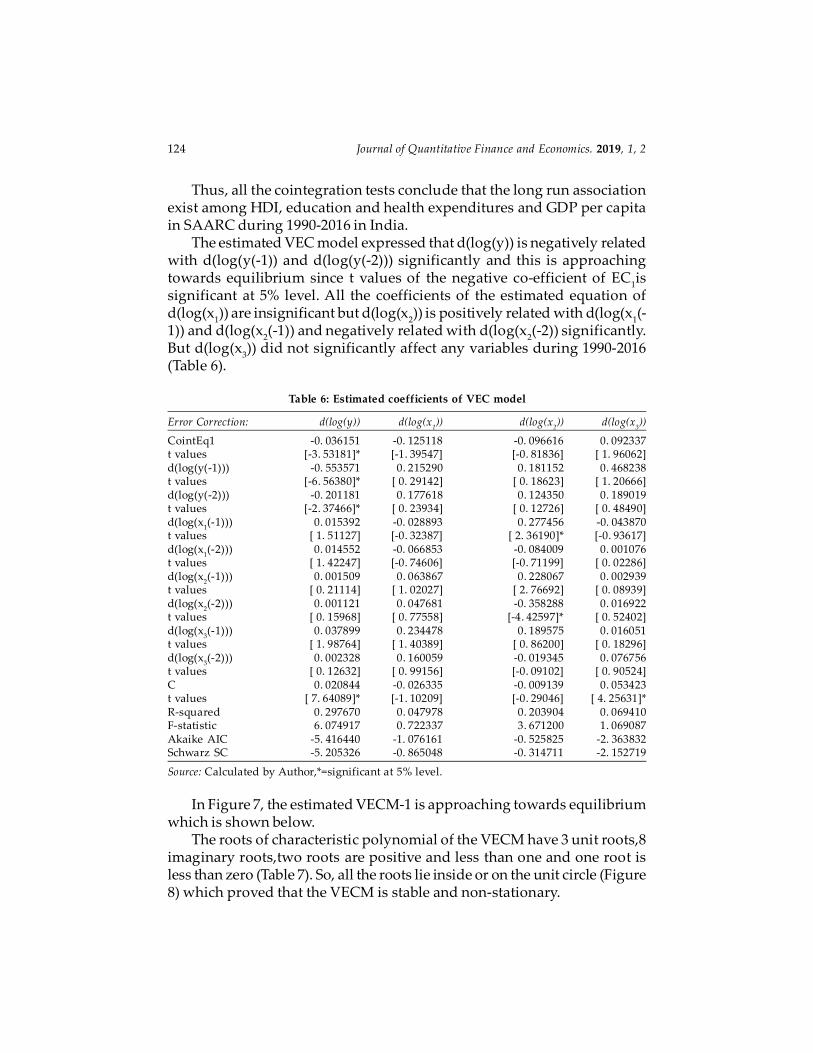
The estimated VEC model expressed that d(log(y)) is negatively relatedwith d(log(y(1)) and d(log(y(2))) significantly and this is approachingtowards equilibrium since t values of the negative coefficient of EC
1is
significant at 5% level. All the coefficients of the estimated equation ofd(log(x
1)) are insignificant but d(log(x
2)) is positively related with d(log(x
1(
1)) and d(log(x2(1)) and negatively related with d(log(x
2(2)) significantly.
But d(log(x3)) did not significantly affect any variables during 19902016
(Table 6).
Table 6: Estimated coefficients of VEC model
Error Correction: d(log(y)) d(log(x1)) d(log(x
2)) d(log(x
3))
CointEq1 0. 036151 0. 125118 0. 096616 0. 092337t values [3. 53181]* [1. 39547] [0. 81836] [ 1. 96062]d(log(y(1))) 0. 553571 0. 215290 0. 181152 0. 468238t values [6. 56380]* [ 0. 29142] [ 0. 18623] [ 1. 20666]d(log(y(2))) 0. 201181 0. 177618 0. 124350 0. 189019t values [2. 37466]* [ 0. 23934] [ 0. 12726] [ 0. 48490]d(log(x
1(1))) 0. 015392 0. 028893 0. 277456 0. 043870
t values [ 1. 51127] [0. 32387] [ 2. 36190]* [0. 93617]d(log(x
1(2))) 0. 014552 0. 066853 0. 084009 0. 001076
t values [ 1. 42247] [0. 74606] [0. 71199] [ 0. 02286]d(log(x
2(1))) 0. 001509 0. 063867 0. 228067 0. 002939
t values [ 0. 21114] [ 1. 02027] [ 2. 76692] [ 0. 08939]d(log(x
2(2))) 0. 001121 0. 047681 0. 358288 0. 016922
t values [ 0. 15968] [ 0. 77558] [4. 42597]* [ 0. 52402]d(log(x
3(1))) 0. 037899 0. 234478 0. 189575 0. 016051
t values [ 1. 98764] [ 1. 40389] [ 0. 86200] [ 0. 18296]d(log(x
3(2))) 0. 002328 0. 160059 0. 019345 0. 076756
t values [ 0. 12632] [ 0. 99156] [0. 09102] [ 0. 90524]C 0. 020844 0. 026335 0. 009139 0. 053423t values [ 7. 64089]* [1. 10209] [0. 29046] [ 4. 25631]*Rsquared 0. 297670 0. 047978 0. 203904 0. 069410Fstatistic 6. 074917 0. 722337 3. 671200 1. 069087Akaike AIC 5. 416440 1. 076161 0. 525825 2. 363832Schwarz SC 5. 205326 0. 865048 0. 314711 2. 152719
Source: Calculated by Author,*=significant at 5% level.
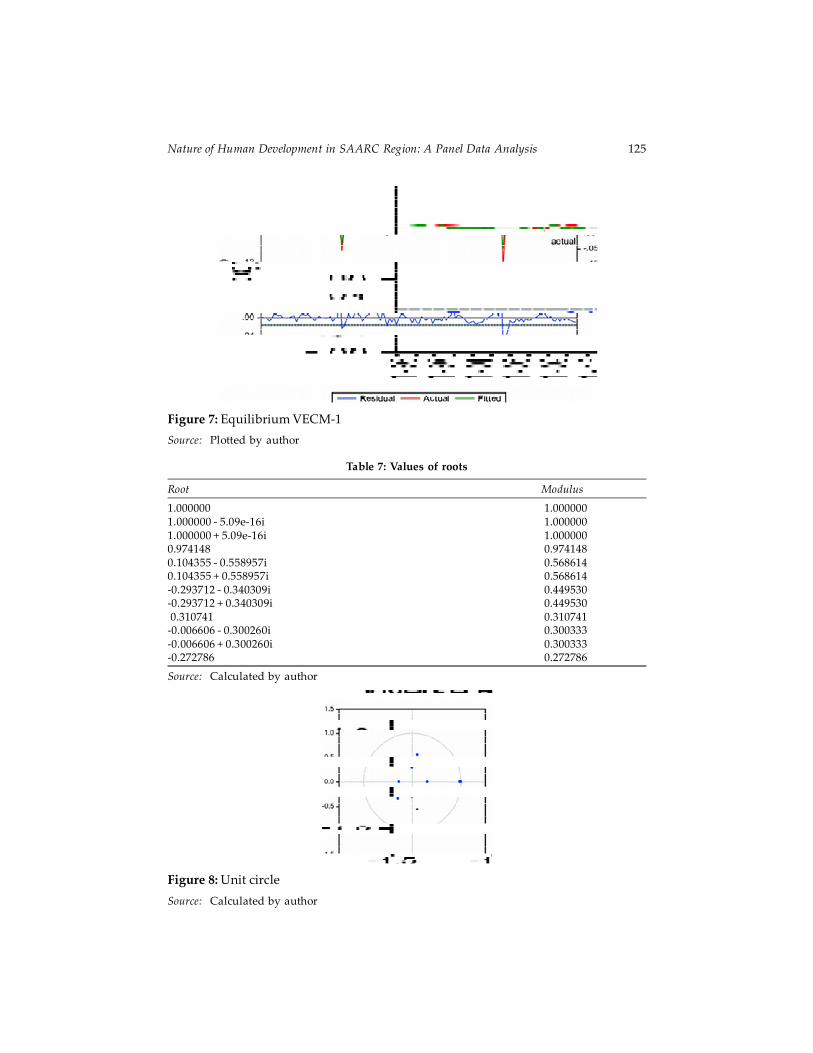
In Figure 7, the estimated VECM1 is approaching towards equilibriumwhich is shown below.
The roots of characteristic polynomial of the VECM have 3 unit roots,8imaginary roots,two roots are positive and less than one and one root isless than zero (Table 7). So, all the roots lie inside or on the unit circle (Figure8) which proved that the VECM is stable and nonstationary.
Nature of Human Development in SAARC Region: A Panel Data Analysis 125
Table 7: Values of roots
Root Modulus
1.000000 1.0000001.000000 5.09e16i 1.0000001.000000 + 5.09e16i 1.0000000.974148 0.9741480.104355 0.558957i 0.5686140.104355 + 0.558957i 0.5686140.293712 0.340309i 0.4495300.293712 + 0.340309i 0.449530 0.310741 0.3107410.006606 0.300260i 0.3003330.006606 + 0.300260i 0.3003330.272786 0.272786
Source: Calculated by author
Figure 7: Equilibrium VECM1
Source: Plotted by author
Figure 8: Unit circle
Source: Calculated by author
126 Journal of Quantitative Finance and Economics. 2019, 1, 2
Fig
ure
9: A
uto
corr
ela
tio
n
Sou
rce:
Plo
tted
by
au
tho
r
Nature of Human Development in SAARC Region: A Panel Data Analysis 127
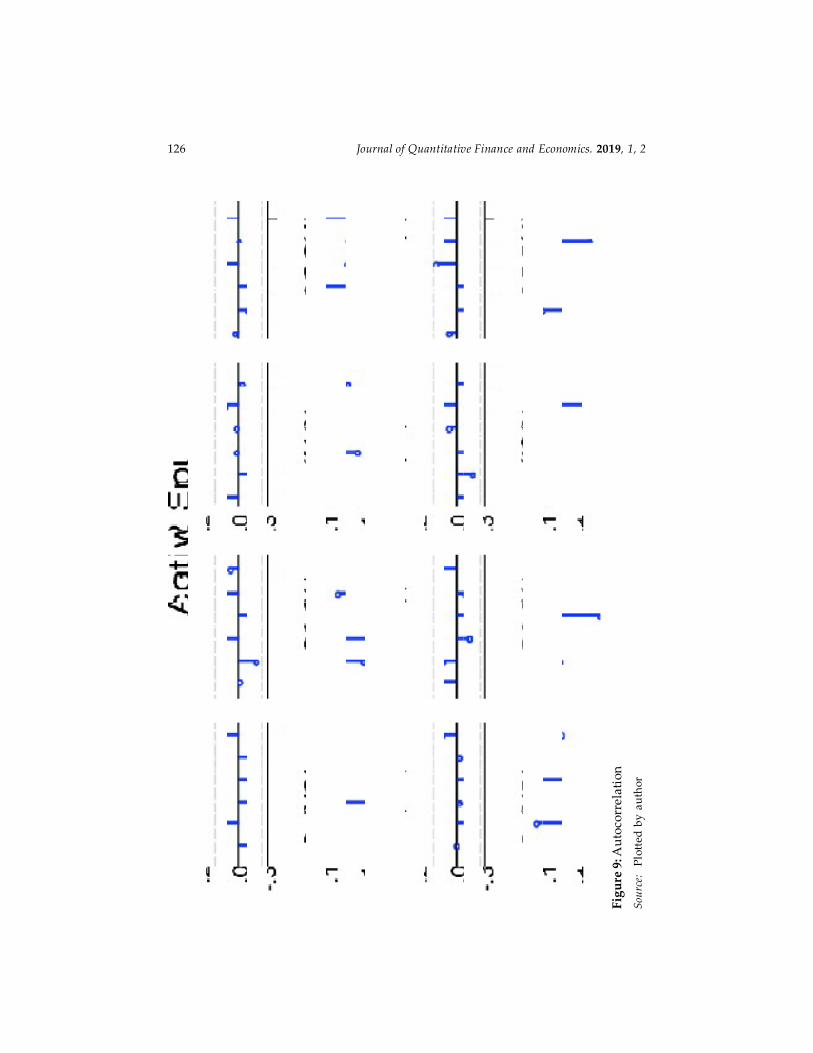
The residual test of VECM also showed that the model suffers fromautocorrelation problem which is shown in the Figure 9 where vertical linesindicate nonsymmetric.
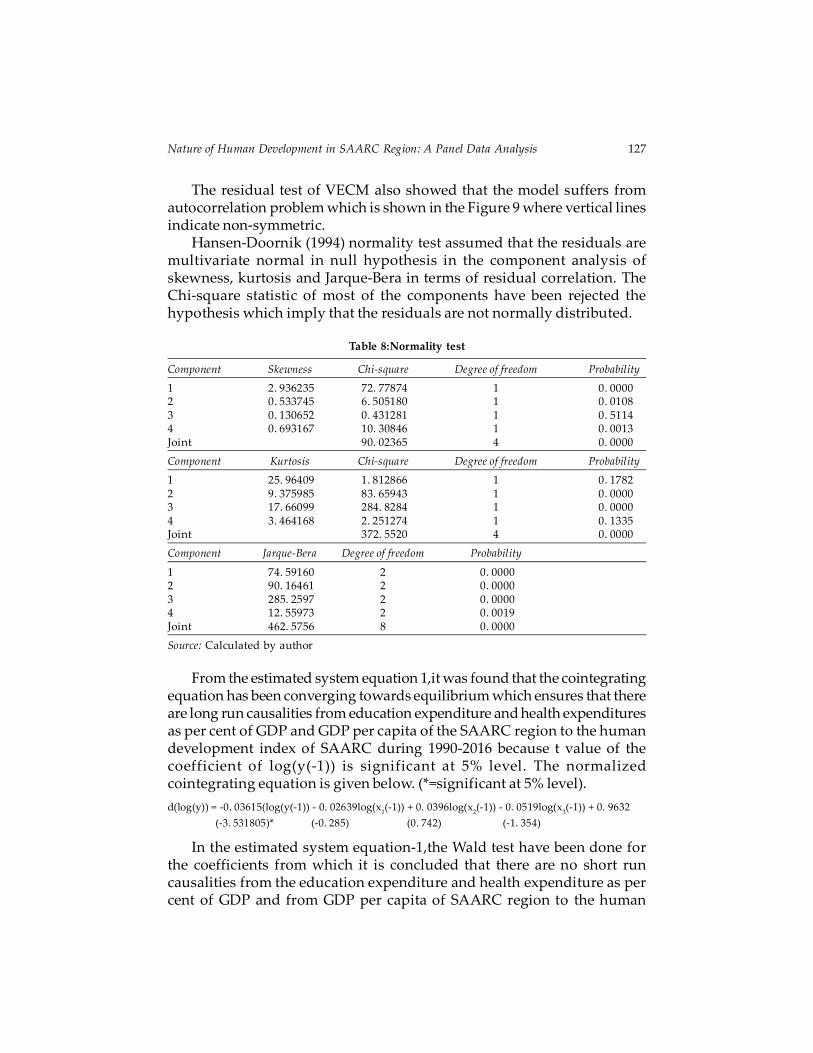
HansenDoornik (1994) normality test assumed that the residuals aremultivariate normal in null hypothesis in the component analysis ofskewness, kurtosis and JarqueBera in terms of residual correlation. TheChisquare statistic of most of the components have been rejected thehypothesis which imply that the residuals are not normally distributed.
Table 8:Normality test
Component Skewness Chisquare Degree of freedom Probability
1 2. 936235 72. 77874 1 0. 00002 0. 533745 6. 505180 1 0. 01083 0. 130652 0. 431281 1 0. 51144 0. 693167 10. 30846 1 0. 0013Joint 90. 02365 4 0. 0000
Component Kurtosis Chisquare Degree of freedom Probability
1 25. 96409 1. 812866 1 0. 17822 9. 375985 83. 65943 1 0. 00003 17. 66099 284. 8284 1 0. 00004 3. 464168 2. 251274 1 0. 1335Joint 372. 5520 4 0. 0000
Component JarqueBera Degree of freedom Probability
1 74. 59160 2 0. 00002 90. 16461 2 0. 00003 285. 2597 2 0. 00004 12. 55973 2 0. 0019Joint 462. 5756 8 0. 0000
Source: Calculated by author
From the estimated system equation 1,it was found that the cointegratingequation has been converging towards equilibrium which ensures that thereare long run causalities from education expenditure and health expendituresas per cent of GDP and GDP per capita of the SAARC region to the humandevelopment index of SAARC during 19902016 because t value of thecoefficient of log(y(1)) is significant at 5% level. The normalizedcointegrating equation is given below. (*=significant at 5% level).
d(log(y)) = 0. 03615(log(y(1)) 0. 02639log(x1(1)) + 0. 0396log(x
2(1)) 0. 0519log(x
3(1)) + 0. 9632
(3. 531805)* (0. 285) (0. 742) (1. 354)
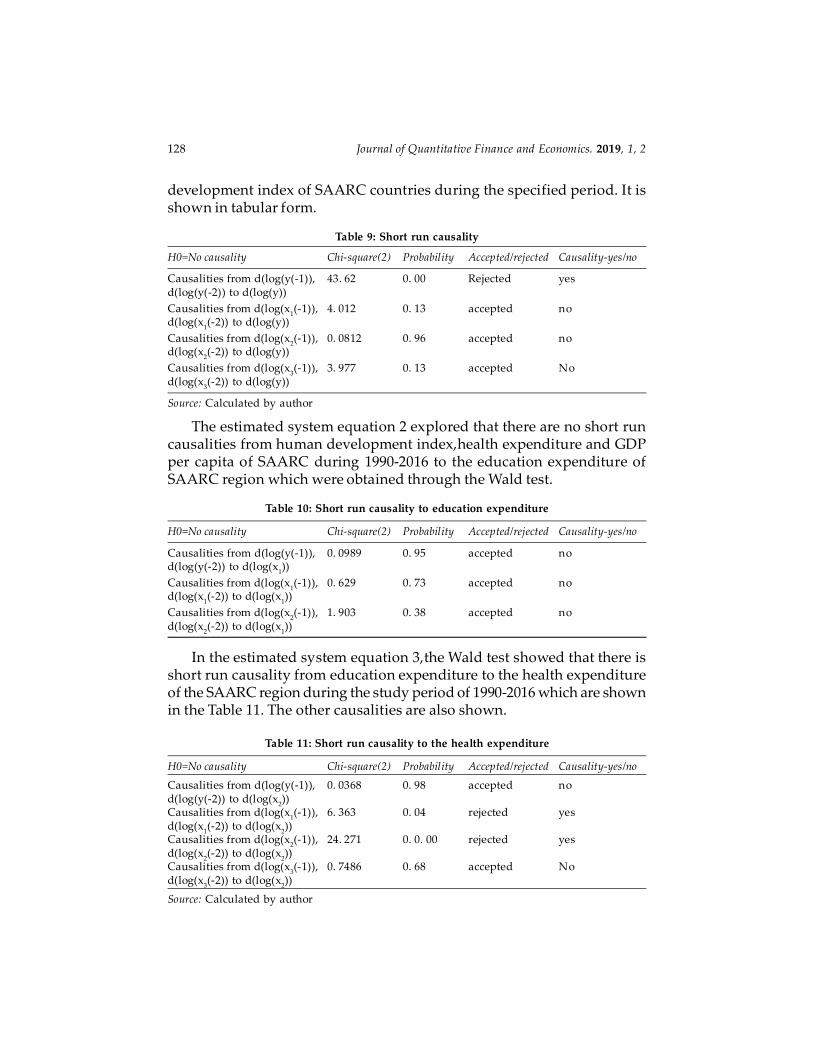
In the estimated system equation1,the Wald test have been done forthe coefficients from which it is concluded that there are no short runcausalities from the education expenditure and health expenditure as percent of GDP and from GDP per capita of SAARC region to the human
128 Journal of Quantitative Finance and Economics. 2019, 1, 2
development index of SAARC countries during the specified period. It isshown in tabular form.
Table 9: Short run causality
H0=No causality Chisquare(2) Probability Accepted/rejected Causalityyes/no
Causalities from d(log(y(1)), 43. 62 0. 00 Rejected yesd(log(y(2)) to d(log(y))
Causalities from d(log(x1(1)), 4. 012 0. 13 accepted no
d(log(x1(2)) to d(log(y))
Causalities from d(log(x2(1)), 0. 0812 0. 96 accepted no
d(log(x2(2)) to d(log(y))
Causalities from d(log(x3(1)), 3. 977 0. 13 accepted No
d(log(x3(2)) to d(log(y))
Source: Calculated by author
The estimated system equation 2 explored that there are no short runcausalities from human development index,health expenditure and GDPper capita of SAARC during 19902016 to the education expenditure ofSAARC region which were obtained through the Wald test.
Table 10: Short run causality to education expenditure
H0=No causality Chisquare(2) Probability Accepted/rejected Causalityyes/no
Causalities from d(log(y(1)), 0. 0989 0. 95 accepted nod(log(y(2)) to d(log(x
1))
Causalities from d(log(x1(1)), 0. 629 0. 73 accepted no
d(log(x1(2)) to d(log(x
1))
Causalities from d(log(x2(1)), 1. 903 0. 38 accepted no
d(log(x2(2)) to d(log(x
1))
In the estimated system equation 3,the Wald test showed that there isshort run causality from education expenditure to the health expenditureof the SAARC region during the study period of 19902016 which are shownin the Table 11. The other causalities are also shown.
Table 11: Short run causality to the health expenditure
H0=No causality Chisquare(2) Probability Accepted/rejected Causalityyes/no
Causalities from d(log(y(1)), 0. 0368 0. 98 accepted nod(log(y(2)) to d(log(x
2))
Causalities from d(log(x1(1)), 6. 363 0. 04 rejected yes
d(log(x1(2)) to d(log(x
2))
Causalities from d(log(x2(1)), 24. 271 0. 0. 00 rejected yes
d(log(x2(2)) to d(log(x
2))
Causalities from d(log(x3(1)), 0. 7486 0. 68 accepted No
d(log(x3(2)) to d(log(x
2))
Source: Calculated by author
Nature of Human Development in SAARC Region: A Panel Data Analysis 129
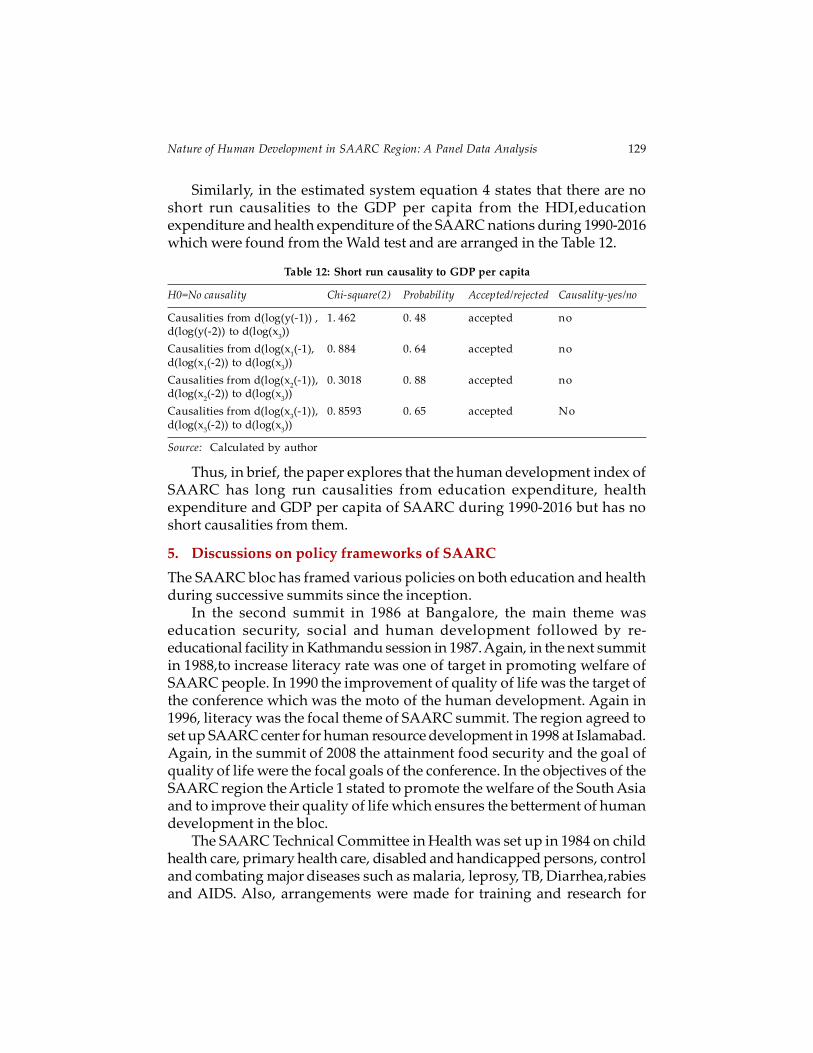
Similarly, in the estimated system equation 4 states that there are noshort run causalities to the GDP per capita from the HDI,educationexpenditure and health expenditure of the SAARC nations during 19902016which were found from the Wald test and are arranged in the Table 12.
Table 12: Short run causality to GDP per capita
H0=No causality Chisquare(2) Probability Accepted/rejected Causalityyes/no
Causalities from d(log(y(1)) , 1. 462 0. 48 accepted nod(log(y(2)) to d(log(x
3))
Causalities from d(log(x1(1), 0. 884 0. 64 accepted no
d(log(x1(2)) to d(log(x
3))
Causalities from d(log(x2(1)), 0. 3018 0. 88 accepted no
d(log(x2(2)) to d(log(x
3))
Causalities from d(log(x3(1)), 0. 8593 0. 65 accepted No
d(log(x3(2)) to d(log(x
3))
Source: Calculated by author
Thus, in brief, the paper explores that the human development index ofSAARC has long run causalities from education expenditure, healthexpenditure and GDP per capita of SAARC during 19902016 but has noshort causalities from them.
5. Discussions on policy frameworks of SAARC
The SAARC bloc has framed various policies on both education and healthduring successive summits since the inception.
In the second summit in 1986 at Bangalore, the main theme waseducation security, social and human development followed by reeducational facility in Kathmandu session in 1987. Again, in the next summitin 1988,to increase literacy rate was one of target in promoting welfare ofSAARC people. In 1990 the improvement of quality of life was the target ofthe conference which was the moto of the human development. Again in1996, literacy was the focal theme of SAARC summit. The region agreed toset up SAARC center for human resource development in 1998 at Islamabad.Again, in the summit of 2008 the attainment food security and the goal ofquality of life were the focal goals of the conference. In the objectives of theSAARC region the Article 1 stated to promote the welfare of the South Asiaand to improve their quality of life which ensures the betterment of humandevelopment in the bloc.
The SAARC Technical Committee in Health was set up in 1984 on childhealth care, primary health care, disabled and handicapped persons, controland combating major diseases such as malaria, leprosy, TB, Diarrhea,rabiesand AIDS. Also, arrangements were made for training and research for
130 Journal of Quantitative Finance and Economics. 2019, 1, 2
combating major diseases. Even, the SAARC TB center was established inKathmandu in 1982. The hike in investment in health and education wasemphasized to pursue a rapid expansion in employment to raise capabilitiesof the poor where trading of medical equipments should be emphasizedby SAFTA which was also encouraged to move teaching professionals ineducation under the article of SATIS and at last the South Asian Universitywas set up in 2010 in New Delhi (RIS, 2015).
In the 12th SAARC summit at Islamabad in 2004, the sustainabledevelopment goals of SAARC were formulated in which health sustainablegoals were in the number from 9 to 12 which were maternal health, childhealth care, affordable health care, improved hygiene and public health.On the other hand, the sustainable education goals were in the numbersfrom 13 to 16 which were access to primary /community schools for children,boys, girls, completion of primary education cycle, universal functionalliteracy, quality education at primary, secondary and vocational levels (CSO,2013).
As such SAARC region postulated a list of targets to catapult humandevelopment index such as priority to social sector, disadvantaged regionsand social groups,preparations of state and District HDI,strengtheningstatistical system, emphasis on SC, ST, minorities, disabled, improvinggender budgeting, gender disaggregated data and so on to fulfill MDGsand SDGs (HDR of India, 2010).
The panel cointegration and vector error correction models of SAARCduring 19902016 should undoubtedly prescribe to hike health expenditureand education expenditure as per cent of GDP upward continuously sothat positive association with HDI must be achieved. Moreover, increase insocial sector expenditure is also a prerequisite policy to obtain positiverelation among them in the SAARC region. More specifically,literacyrace,gross enrollment ratio,and skill development of girls and boys shouldbe increased. Public health services should be strengthened more to declinemortality rate and burden of diseases, to rise human efficiency, so that lifeexpectancy and productivity must increase.
6. Conclusion and remarks
The paper concludes that education expenditure as per cent of GDP hadinsignificant negative impact on human development index of SAARCregion, but health expenditure had significant negative effect on humandevelopment index and GDP per capita at current prices in US dollar hadsignificant positive impact on human development index of SAARC regionduring 19902016 as have been found from the random effect regressionmodel after verification of Hausman test. The cointegration tests suggested
Nature of Human Development in SAARC Region: A Panel Data Analysis 131
that the variables have at least one cointegrating equation. The vector errorcorrection model became stable, nonstationary, nonnormal and showingautocorrelation problems. There were significant long run causalities fromeducation expenditure, health expenditure and GDP per capita to the humandevelopment index of SAARC during the survey period but they had noshort run causalities. Rather,there was short causality from humandevelopment index to the health expenditure of the SAARC nations.
Besides, the paper suffers from shortcomings. To what extent healthexpenditure affects health index and how much education expenditureaffects education index are to be explored so that they can relate positivelywith the human development index of SAARC during the survey period.Unfortunately, the paper had missed the exact links which need to find thedeterminants of education and health indices of India. Future research inthis area might be given the fruitful answers.
References
Agarwal, P. , (2006). ‘Higher Education in India: The Need for Change’, WorkingPaperNo. 180, Indian Council for Research on International Economic Relations, NewDelhi.
Bai, Jushan., & Perron, P. , (2003). ‘Critical values for Multiple Structural Change Tests’,Econometrics Journal, 6, 7278.
Barro, Robert J. (2001). Human Capital and Growth. American Economic Review,91 (2),1217, Papers and proceedings.
Barro, R. J., & Lee, J. W., (1993). ‘International comparisons of educational attainment’,Journal of Monetary Economics, 32, 363–94.
Becker, G. S., (1964). Human capital. Chicago, IL: University of Chicago Press.
Bhowmik, Debesh., (2018). ‘Nexus between growth and human development index:Evidence from India and Indian States’, Assumption Universitye Journal ofInterdisciplinary Research (AUeJIR), 3(2).
Bhowmik, Debesh., (2019). ‘Factors of human development index in ASEAN: PanelCointegration Analysis’, International Journal on Recent Trends in Business andTourism, 3(1), ejournal.lucp.net
CSO, India., (2013). SAARC Development GoalsIndia Country Report2013.
www.indiaenvironmentportal.org. in/. . . /saarcdevelopmentgoalsindiacountryreport. . .
Cochrane, D. , & Orcutt, G. H., (1949). ‘Application of Least Squares Regression toRelationships Containing AutoCorrelated Error Terms’, Journal of the AmericanStatisticalAssociation, 44(245),32–61. doi:10. 1080/01621459. 1949. 10483290.
Dundar, H., Beteille, T., Riboud, M., & Deolalikar, A., (2014). Student Learning in SouthAsia: Challenges, Opportunities, and Policy Priorities. World Bank Publications.
Dwivedi, Sangit Sarita., (2017). ‘Understanding South Asian Vulnerability: Perspectivesof Regional Security’, Archaeology & Anthropology: Open Access. 1(3). December18, DOI: 10. 31031/AAOA. 2017. 01. 000515
132 Journal of Quantitative Finance and Economics. 2019, 1, 2
Elmi, Z. M. , & Sadeghis., (2012). ‘Health expenditures and economic growth indeveloping countries: Panel cointegration and causality’, Middle East Journal ofScience Research, 12(1), 8891.
Fisher, R. A., (1932). Statistical Methods for Research Workers, Edinburg: Oliver &Boyd. 12th Edition.
Hansen, H., & Doornik, J. A., (1994). ‘An omnibus test for univariate and multivariatenormality’, Discussion Paper, Nuffield College, Oxford University.
Hausman, J. A., (1978). ‘Specification Test in Econometrics’, Econometrica, 46(6),November, 12511271.
Johansen, S., (1988). ‘Statistical Analysis of Cointegrating Vectors’, Journal of EconomicDynamics and Control, 12, 231254
Kao, C. , & Chiang, M. H., (1999). ‘On the estimation and inference of a cointegratedregression in panel data’, (Center for Policy Research Working Papers2), Retrievedfrom https://econpapers. repec. org/RePEc:max:cprwps:2
Krueger, Anne O. , (1968). ‘Factor Endowments and Per Capita Income Differencesamong Countries’, Economic Journal, 78(311), 64159.
Mirahsani, Zahra., (2016). ‘The Relationship between health expenditure and humandevelopment index’, Journal of Research and Health, 6(3), 373377.
Nelson, Richard., & Edmund, Phelps., (1966). ‘Investment in Humans, technologicaldiffusion and economic growth’, American Economic Review, 61,6975.
Lim, Stephen S. et al., (2018). Measuring human capital: a systematic analysisof195countriesand territories, 1990–2016. September 24. http://dx. doi. org/10. 1016/S01406736(18)31941X
Lucas, R. E. Jr., (1993). ‘Making a miracle’, Econometrica, 61 (2), 25172.
Mahbub ul Haq Human Development Centre., (2008). Human Development in SouthAsia 2007, Karachi: Oxford University Press.
Marshall, Alfred., (1920). Principles of Economics. 8th Edition. London: MacmillanPublishers.
Myrdal, G., (1968). Asian Drama: An Inquiry into the Poverty of Nations. London:Penguin Press, Allen Lane.
Pedroni, P., (1999). ‘Critical values for cointegration test in heterogenous panels withmultiple regressors’, Oxford Bulletin of Economics and Statistics, 61(S1), 653670.
Park, J., (2012). ‘Total Factor Productivity Growth for 12 Asian Economies: The Pastand the Future’,Japan and the World Economy, 24(2), 114–27.
Poudel, Homa Nath., (2014). ‘State of Human Development: SAARC and Nepal’,Economic Literature, 12, December, 5055.
Rahman et al. , (2018). ‘Health care expenditure and health outcome nexus: Newevidence from the SAARCASEAN region’,Globalization and Health, 14(113), 111.https://doi. org/10. 1186/s1299201804301
Razmi, Javad Mohammad., Abbasian, Ezatollah., & Mohammadi, Sahar., (2012).‘Investigating the effect of government health expenditure on human developmentindex in Iran’, Journal of Knowledge Management, Economics and InformationTechnology, 2(5), 18.
Nature of Human Development in SAARC Region: A Panel Data Analysis 133
Ranis, Gustav., Frances, Stewart., & Alejandro, Ramirez., (2000). ‘Economic Growthand Human Development’. World Development, 28(2), 197219.
RIS., (2015). South Asia Development and Cooperation Report2015. www. ris. org. in/southasiadevelopmentandcooperationreport2015
Romer, Paul M., (1990). ‘Endogenous Technological Change’, Journal of Political Economy,98 (5), S71 S102.
Romer, Paul M., (1993a). ‘Idea Gaps and Object Gaps in Economic Development’, Journalof Monetary Economics, 32(3), 54373.
Shah, S., (2016). ‘Determinants of Human DevelopmentIndex: A Cross CountryEmpirical Analysis’, MPRAPaper 73759,September 16 University Library ofMunich. Retrieved From: https://mpra. ub. unimuenchen. de/73759/ 1/MPRA_paper_73759. pdf
Shome, S., & Tondon, S., (2010). ‘Balancing HumanDevelopment with EconomicGrowth: A Study ofASEAN5’, Annals of the University of Petroşani,Economics, 10(1),335348.
Schultz, T. W., (1961). ‘Investment in Human Capital’, American Economic Review, 51,January.
Stiglitz, Joseph E., (1993). ‘Comment on Towards a CounterCounterrevolution inDevelopment Theory’. In Krugman (ed.), Proceedings of the World Bank AnnualConference on Development Economics. (pp3949). Washington, D. C.
Stiglitz, Joseph E., (1997). ‘An Agenda for Development in the TwentyFirst Century’.Annual Conference on Development. In Pleskovic, Boris and Joseph E. Stiglitz (Eds.),Annual World Bank Conference on Development Economics, (pp. 1731).
Sen, Amartya., (2000). Development as Freedom. London: Oxford University, Press.
UNDP., (2010). ‘Human Development Report of India’2010. hdr. undp. org/en/content/humandevelopmentreport2010
Wald, Abraham., (1943). ‘Test of Statistical Hypothesis concerning several parameterswhen the number of observations is large’, Transactions of American MathematicalSociety, 54, 42682.
Zaidi, Shehla et al., (2017). ‘Expanding access to health care in South Asia’, BMJ, April11,457. https://www. bmj. com/content/357/bmj. j1645
Related Documents