CLINICAL IMMUNOLOGY AND IMMUNOPATHOLOGY 54, 103-116 (19%) Natural Killer Cell Activity in a Longitudinal Dietary Fat Intervention Trial’ JAMES R. HEBERT, **2 JEANINE BARONE,t MOHAN M. REDDY,$ AND JYE-YU CHEN BACKLUND? *Division of Preventive and Behavioral Medicine, University of Massachusetts Medical School, 55 Lake Avenue North, Worcester, Massachusetts 01655; tDivision of Epidemiology, American Health Foundation, 320 East 43rd Street, New York, New York 10017; and $R. A. Cooke Institute of Allergy, St. Luke’s-Roosevelt Hospital Center, 428 West 59th Street, New York, New York 10019 It has been hypothesized that dietary fat may affect natural killer (NK) cell activity, a factor of potential importance in early tumor surveillance. Fourteen men successfully completed an intervention trial designed to test the effect of dietary fat on NK activity in humans. Study subjects lowered their fat intake to an average of 22% of calories as fat and consumed two dietary supplements (of coconut and safflower oils), in a cross-over design. These supplements resulted in large changes in the ratio of polyunsaturated to saturated fatty acids (1.73 to 0.34, on average). Results of a general linear model in which we fitted covariates on exercise, body mass, intervention sequence, and various dietary predictors revealed a significant effect of decreased total dietary fat intake on increased NK activity at an E/T ratio of 1OO:l (about 0.7% increase for each absolute percent of calories as fat, P = 0.04). Similar results were obtained at E/T ratios of 50: 1 and 25: 1. No other nutritional predictor was significantly associated with NK activity at any E/T ratio. 0 19!20 Academic Press, Inc. INTRODUCTION Evidence from animal experiments and studies among humans provides evi- dence that high fat intake may be related to cancer incidence and mortality (1, 2). Although a mechanism or mechanisms by which dietary fat may enhance carci- nogenesis is not known (3-5), dietary fat might increase tumorigenesis by depress- ing the tumor surveillance capability of the immune system. Natural killer (NK) cells, a subpopulation of lymphocytes which differ from mature T or B cells or macrophages, are thought to play a significant role in immunosurveillance against viruses and tumors and in resistance against me- tastases to distant sites (6, 7). They kill directly without prior sensitization and have a selectivity for malignant cells (H-10). NK cells may be part of the first line of defense against cancer by destroying tumor cells before T cells and macro- phages can be mobilized (11). This study was conducted to test the hypothesis that NK activity is decreased ’ This research was supported by a grant from the Elsa U. Pardee Foundation, P.O. Box 1866, Midland, MI, 48641-1866 and supplements of dietary fat were supplied by Banner Gelatin Products Corp., 20730 Dearborn Street, Chatsworth, CA 91313-2157. ’ To whom reprint requests should be addressed. 103 0090-1229/90 $1.50 Copyright 0 1990 by Academic Press, Inc. All rights of reproduction in any form reserved.

Welcome message from author
This document is posted to help you gain knowledge. Please leave a comment to let me know what you think about it! Share it to your friends and learn new things together.
Transcript
CLINICAL IMMUNOLOGY AND IMMUNOPATHOLOGY 54, 103-116 (19%)
Natural Killer Cell Activity in a Longitudinal Dietary Fat Intervention Trial’
JAMES R. HEBERT, **2 JEANINE BARONE,t MOHAN M. REDDY,$ AND JYE-YU CHEN BACKLUND?
*Division of Preventive and Behavioral Medicine, University of Massachusetts Medical School, 55
Lake Avenue North, Worcester, Massachusetts 01655; tDivision of Epidemiology, American Health Foundation, 320 East 43rd Street, New York, New York 10017; and $R. A. Cooke Institute
of Allergy, St. Luke’s-Roosevelt Hospital Center, 428 West 59th Street, New York, New York 10019
It has been hypothesized that dietary fat may affect natural killer (NK) cell activity, a factor of potential importance in early tumor surveillance. Fourteen men successfully completed an intervention trial designed to test the effect of dietary fat on NK activity in humans. Study subjects lowered their fat intake to an average of 22% of calories as fat and consumed two dietary supplements (of coconut and safflower oils), in a cross-over design. These supplements resulted in large changes in the ratio of polyunsaturated to saturated fatty acids (1.73 to 0.34, on average). Results of a general linear model in which we fitted covariates on exercise, body mass, intervention sequence, and various dietary predictors revealed a significant effect of decreased total dietary fat intake on increased NK activity at an E/T ratio of 1OO:l (about 0.7% increase for each absolute percent of calories as fat, P = 0.04). Similar results were obtained at E/T ratios of 50: 1 and 25: 1. No other nutritional predictor was significantly associated with NK activity at any E/T ratio. 0 19!20 Academic Press, Inc.
INTRODUCTION
Evidence from animal experiments and studies among humans provides evi- dence that high fat intake may be related to cancer incidence and mortality (1, 2). Although a mechanism or mechanisms by which dietary fat may enhance carci- nogenesis is not known (3-5), dietary fat might increase tumorigenesis by depress- ing the tumor surveillance capability of the immune system.
Natural killer (NK) cells, a subpopulation of lymphocytes which differ from mature T or B cells or macrophages, are thought to play a significant role in immunosurveillance against viruses and tumors and in resistance against me- tastases to distant sites (6, 7). They kill directly without prior sensitization and have a selectivity for malignant cells (H-10). NK cells may be part of the first line of defense against cancer by destroying tumor cells before T cells and macro- phages can be mobilized (11).
This study was conducted to test the hypothesis that NK activity is decreased
’ This research was supported by a grant from the Elsa U. Pardee Foundation, P.O. Box 1866, Midland, MI, 48641-1866 and supplements of dietary fat were supplied by Banner Gelatin Products Corp., 20730 Dearborn Street, Chatsworth, CA 91313-2157.
’ To whom reprint requests should be addressed.
103 0090-1229/90 $1.50 Copyright 0 1990 by Academic Press, Inc. All rights of reproduction in any form reserved.
104 HEBERT ET AL.
by the presence of dietary linoleic acid (12). It is thought that linoleic acid exerts an immunosuppressive influence because of its role in producing PGE, through the cyclooxygenase pathway (3). In previous work (13) we had established that healthy young men counseled to decrease total dietary fat (on average from 32 to 23% of calories as fat) had significantly increased NK activity. In the earlier study, we observed a small nonsignificant drop in the polyunsaturated fatty acid (PUFA) to saturated fatty acid (SFA) (P:S) ratio of the diets. Here, while keeping the men on the low-fat (LF) diet, we attempted to drastically modify the P:S ratio total while moderately increasing dietary fat (by 15 g/day). We achieved this by supplementing the diet with safflower oil (high in linoleic acid) or coconut oil (very high in saturated fatty acid and therefore low in linoleic acid).
SUBJECTS AND METHODS
Subject Selection and Screening
Twenty-six healthy young men (mean age 3 I years) were originally enrolled into this dietary intervention trial. The subjects were recruited through advertisements in newspapers and flyers. Inclusion/eligibility criteria for subject recruitment were as follows: male, nonsmoking, nonoverweight (within 10% of ideal body weight), 21-39 years old, healthy (as assessed by medical history), no medication (includ- ing aspirin), and no allergies. Informed consent was obtained from the subjects. All procedures were approved by the Institutional Review Board of the American Health Foundation (AHF).
Demographic data, medical histories, height, weight, physical activity assess- ments, and life-style factors such as smoking, drinking, and use of nutritional supplements were collected through an interviewer-administered questionnaire.
Experimental Design
The experimental phases were preceded by a 1.5 to 2-month baseline period during which the subjects were familiarized with the LF eating plan. All subjects were assigned to the LF intervention for 3 months (13). This first (LF) phase was followed by two intervention phases aimed at altering the amount and type of fatty acids in the diet. Each of the participants in the study crossed-over from one supplement to the other and these intervention periods were separated by a l- month “washout” period in order to minimize any carry-over effect of the indi- vidual fatty acids. Subjects were instructed not to change exercise habits, engage in weight-reducing regimens, or begin using nutritional supplements or medica- tion. At the first symptoms of a cold or other infection, subjects were to inform research staff. Because of the effect of infection on NK activity (14), blood draw- ing was to be postponed for 2 weeks after the infection.
Nutrition Intervention and Monitoring
A semiquantitative food frequency questionnaire (FFQ) was administered by a trained nutritionist at the initial interview to establish baseline diet. Food models were used to help estimate portion sizes.
The FFQ previously had been validated for percentage of calories from fat (unpublished results) and was updated to include 102 food items that represent
DIETARY FAT AND NK CELL ACTIVITY 105
approximately 87% of total calories, 97% of total fat, and 97% of the three classes of fatty acids: saturated (SFA), monounsaturated (MUFA) (consisting mainly of oleic acid), and polyunsaturated (PUFA) (mainly linoleic acid), in the American diet (15, 16). Different types of cooking oils, margarines, nuts, tofu, and vegetable protein analogs that would affect fat intake also were included. This FFQ was pretested on 11 healthy subjects.
Study subjects were taught how to keep a 4-day food diary (FDFD), both as a way to validate other dietary data and as a way to sensitize them to their dietary intake. Individuals were familiarized with standard measuring cups and spoons. Scales for weighing foods were distributed to all individuals engaged in food preparation.
Data from the FDFD were used to correlate total calories, total fat, individual fatty acids, and proportion of calories as fat with estimates derived from the FFQ. Results indicated that total PUFA, MUFA, and SFA as well as proportion of calories from fat obtained from the FFQ were relatively highly correlated with the values from the FDFD. The highest correlation was for percent of calories from fat (r = 0.86) and the minimum was for MUFA (r = 0.58). Correlation between nutrient scores derived from these two methods compare favorably with those reported by other researchers (17-19). Therefore, the FFQ was considered ac- ceptable within conventional limits for the purposes of diet counseling at baseline.
Following the initial collection of data, subjects were counseled, in person, for 60-90 min (and additionally over the phone) on how to decrease dietary fat to approximately 20% of calories. Fat Portion Exchange Lists (20)-a nutrition ed- ucational tool designed to help individuals become aware of dietary fat-were distributed and explained to each subject.
Foods containing one fat portion (FP) contain approximately 5 g of fat. Based on total caloric intake, as assessed by baseline FFQ, each subject was prescribed the maximum number of FPs that would represent approximately 20% of total calories.
Sample low-fat menus consisting of approximately 20% of calories as fat were discussed with each individual. Other nutrition education materials included lists of the fat content in foods and instructions in how to eat out on a low-fat diet and how to modify recipes to conform to a 20% fat diet. Although the aim was to reduce to the 20% level, an inability to achieve a level less than 30%, correspond- ing to approximately the 10th percentile of the U.S. population (21), was judged as gross noncompliance.
For the duration of the study, a trained nutritionist randomly contacted subjects by phone at home or work between two and four times each month to obtain 24-hr food recalls. Problems with the diet were discussed at this time. Subjects also were asked to report the time spent that day on specific exercise activities (e.g., walking or cycling), and, where appropriate, the distance covered. During the last week of this intervention period, an FDFD (including 1 weekend day) was col- lected from each subject.
Immediately after concluding the LF intervention, 8 of the 17 men who suc- cessfully completed that portion of the study were assigned to take a supplement, in pill form, of 15 g (135 kcal) of safflower oil. The remaining men were assigned
106 HEBERT ET AL.
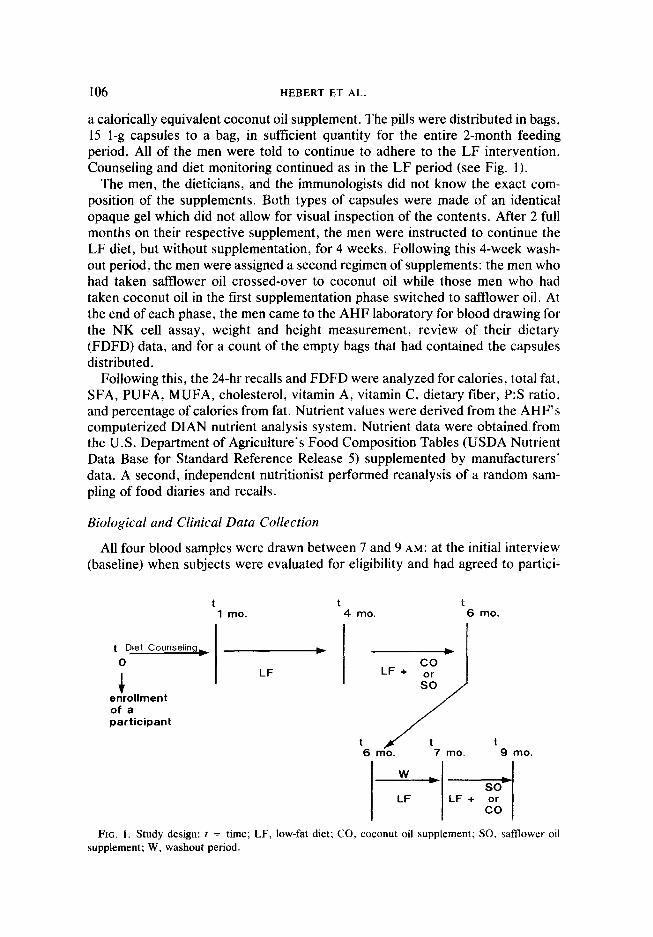
a calorically equivalent coconut oil supplement. The pills were distributed in bags, 15 l-g capsules to a bag, in sufficient quantity for the entire 2-month feeding period. All of the men were told to continue to adhere to the LF intervention. Counseling and diet monitoring continued as in the LF period (see Fig. 1).
The men, the dietitians, and the immunologists did not know the exact com- position of the supplements. Both types of capsules were made of an identical opaque gel which did not allow for visual inspection of the contents. After 2 full months on their respective supplement, the men were instructed to continue the LF diet, but without supplementation, for 4 weeks. Following this 4-week wash- out period, the men were assigned a second regimen of supplements: the men who had taken safflower oil crossed-over to coconut oil while those men who had taken coconut oil in the first supplementation phase switched to safflower oil. At the end of each phase, the men came to the AHF laboratory for blood drawing for the NK cell assay, weight and height measurement, review of their dietary (FDFD) data, and for a count of the empty bags that had contained the capsules distributed.
Following this, the 24-hr recalls and FDFD were analyzed for calories, total fat, SFA, PUFA, MUFA, cholesterol, vitamin A, vitamin C, dietary fiber, P:S ratio, and percentage of calories from fat. Nutrient values were derived from the AHF’s computerized DIAN nutrient analysis system. Nutrient data were obtained from the U.S. Department of Agriculture’s Food Composition Tables (USDA Nutrient Data Base for Standard Reference Release 5) supplemented by manufacturers’ data. A second, independent nutritionist performed reanalysis of a random sam- pling of food diaries and recalls.
Biological and Clinical Data Collection
All four blood samples were drawn between 7 and 9 AM: at the initial interview (baseline) when subjects were evaluated for eligibility and had agreed to partici-
t t t 1 mo. 4 mo. 6 mo.
t Diet Counseling
0
1 enrollment of a participant
co LF LF +
&
) ) t t t 6 mo. 7 mo. 9 n-to.
W
LF
FIG. I. Study design: t = time; LF, low-fat diet; CO, coconut oil supplement; SO, safflower oil supplement; W, washout period.
DIETARY FAT AND NK CELL ACTIVITY 107
pate in the study; 20 weeks later, after the subjects had been on the LF diet for at least 12 weeks; and after each of the supplement periods. For each patient, pe- ripheral blood was drawn into two green-top tubes containing heparin (Bectin- Dickinson, Vacutainer System, Rutherford, NJ). Blood samples were then coded and sent to the Immunology laboratory at St. Lukes/Roosevelt Hospital Center where they were analyzed for NK activity. All tests were conducted “blind,” i.e., the technician was unaware of the hypothesis to be tested, the design of the study, or the identity of the study subjects.
At the time of blood drawing, subjects were questioned again as to whether they had any colds, flu, or other infections during the previous 2 weeks. No subject reported infection during the LF period. In the second and third periods, one subject each had to be rescheduled due to suspected flu symptoms. The FDFD were examined for gross errors by a trained nutritionist at this time and they were subsequently analyzed.
Natural Killer Cell Assay
The NK activity was evaluated by means of a 4-hr ‘lCr-release cytotoxicity assay (22), with the highly sensitive myeloid leukemia cell line K562 as a target. These cells were cultured in suspension with RPM1 1640 medium (GIBCO, Grand Island, NY), supplemented with 10% heat-inactivated fetal calf serum (GIBCO), penicillin-streptomycin (GIBCO), L-glutamine (GIBCO), and 10 mM Hepes (GIBCO) and subsequently referred to as complete medium. To label target cells with “Cr, 2 x lo6 target cells suspended in 0.2 ml complete medium were incu- bated with 3.7 MBq 51Cr sodium chromate (New England Nuclear, Boston, MA) at 37°C in a 5% CO* incubator for 1 hr. After incubation, the target cells were washed three times in RPM1 with 10% fetal calf serum. Viable cells were counted and resuspended in complete medium.
Peripheral blood mononuclear cells were separated using Ficoll-Hypaque (Pharmacia, Piscataway, NJ) gradient centrifugation and washed three times. Vi- able cells were counted and resuspended in complete medium.
One hundred microliters each of effector mononuclear and “Cr-labeled target cell suspensions was added to wells of a U-bottom 96-well microtiter plate (Flow Labs, Inc., McLean, VA) to give ratios of 100: 1, 50: 1, and 25:l and incubated at 37°C in a humidified 5% CO* incubator for 4 hr. The plates were then centrifuged at 850 g for 10 min at 4”C, 100 l~,l of supernatant was removed, and radioactivity was determined in a Beckman gamma spectrometer. The spontaneous release was determined for target cells incubated in medium alone and maximum 51Cr release was determined by lysing 100 111 of target cells with 0.1 ml 5% Triton X.
The percentage-specific cytolysis was determined from the following formula: Cytotoxicity (% mediated cell lysis) = (cpm(experimenta1 release) - cpm(spon- taneous release)} X lOO/{cpm(maximum release) - cpm(spontaneous release)}.
To check the accuracy of the NK cell assay, normal controls, whose values had been previously defined, were run concurrently with subjects. One control was employed for each group of assays. The spontaneous release ranged from 3.4 to 6.5% of maximum release, with a mean of 4.8%.
108 HEBERT ET AL.
Subject Compliance
Compliance with LF dietary modifications (i.e., less than 30% of calories as fat) was assessed by repeated random 24-hr food recalls and the FDFD. Additionally, anyone who (i) was unable to be contacted at least twice/month: (ii) left for vacation or out of town without contacting us; or (iii) was unwilling or unable to take the dietary fat supplement, assessed either by self-admission or a faulty bag count, was considered to have poor overall compliance.
Seven subjects were initially dropped from the study due to extremely poor compliance with the LF diet, they were not able to be reached by phone, or they moved from New York City. Two additional subjects were dropped at the end of the LF phase due to their inconsistent compliance in reducing their fat intake below 30% of calories. During the LF + supplement phases, three men were dropped because of their unwillingness to provide complete dietary data or take the supplement or both.
Statistical Analysis
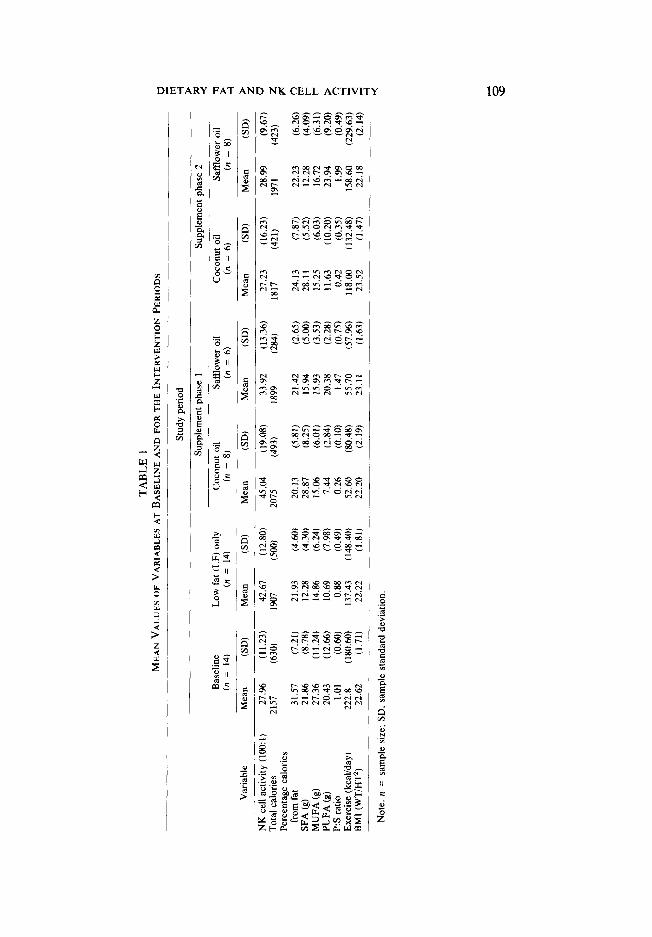
Exploratory data analyses were conducted to test for departures from the as- sumptions of the multiple regression models we would later use, i.e. normality, linearity, and independence (23). These descriptive analyses indicated no need to transform variables to meet regression assumptions. The mean values and stan- dard deviations of these predictors are shown in Table I.
As an exploratory technique, we fitted a stepwise regression procedure (for- ward selection to maximize R’) in which the difference in NK activity during each study period was regressed on the entire set of predictors shown in Table I. As our final analysis, we fitted a general linear model in which the change in NK activity was the dependent variable and selected nutritional variables consistent with testing our hypothesis (i.e., PUFA, MUFA, SFA, proportion of calories as fat, and total calories), physical activity, and the anthropometric measurements were the independent variables.
For the final analyses, we chose to use the nutrient levels estimated by 24-hr recalls. We concluded that data from 14 randomly selected days were a better descriptor of dietary intake over the 7 months of this study than data from 4 consecutive days of dietary data collected at the end of each intervention period (24. 25). Although, a single-day’s food diary is conventionally thought to be a better estimator of that day’s dietary intake than a single 24-hr diet recall (26, 27) and a number of multiple diaries are a more accurate estimator of long-term intake than an equivalent number of recalls, in this study, the men contributed a slightly larger intervention period average number of 24 recalls (i.e., mean = 14 days, SD = 2 days) than diaries (i.e., 12 days, SD = 0 days). For purposes of comparison. we also fitted models with the FDFD-derived data.
Physical activity was estimated by average kilocalories expended per day in exercise as documented on an appendix to the FFQ at baseline and on 24-hr recalls during the LF, LF + CO, and LF + SO interventions. From height and weight we computed Quetelet Index (BMI) according to the formula: weight(kg)/ height(m)‘. For the nutritional, exercise, and anthropometric variables, we used
TABL
E 1
MEAN
VA
LUES
O
F VA
RIAB
LES
AT
BASE
LINE
AND
FOR
THE
INTE
RVEN
TION
PE
RIOD
S
Stud
y pe
riod
Tota
l ca
lories
Pe
rcenta
ge
calor
ies
from
fa
t SF
A (9
) M
UFA
(g)
PUFA
(9
) P:
S ra
tio
Exer
cise
(kcal/
day)
BMI
(WT/
HT2)
2157
(63
0) 19
07
31.57
(7
.21)
21.93
21
.86
(8.78
) 12
.28
27.36
(1
1.24)
14
.86
20.43
(1
2.66)
10
.69
1.01
@.W
0.8
8 22
2.8
(180.6
0) 13
7.43
22.62
(1
.71)
22.22
Note.
n
= sa
mple
siz
e; SD
. sa
mple
sta
ndard
de
viatio
n.
Varia
ble
NK
cell
activ
ity
(1OO
:l)
Base
line
(n =
14)
Mean
(S
D)
27.96
(1
1.23)
Low
fat
(LF)
on
ly (n
= 14
)
Mean
W
)
42.61
(1
2.80)
(50
0) 45
.04
(19.0
8)
33.92
20
75
(493)
1899
(4.60
) 20
.13
(4.30
) 28
.87
(6.24
) 15
.06
(7.98
) 7.4
4 (0
.49)
0.26
(148.4
0) 52
.60
(1.81
) 22
.20
Supp
lemen
t ph
ase
1
Coco
nut
oil Sa
fflowe
r oil
(n =
8) (n
= 6)
Mean
(S
D)
Mean
(S
D)
(5.81
) 21
.42
(8.25
) 15
.94
(6.01
) 15
.93
(2.84
) 20
.38
(0.
IO)
1.47
(80.4
8)
55.70
(2
.19)
23.11
(13.3
6)
(284) (2
.65)
(5.00
) (3
.53)
(2.28
) (0
.75)
(57.%
) (1
.63)
Supp
lemen
t ph
ase
2
Coco
nut
oil Sa
fflowe
r oil
(n =
6) (n
= 8)
Mean
(S
D)
Mean
(S
D)
21.23
(1
6.23)
28
.99
(9.67
) 18
17
(421)
1971
(42
3)
24.13
(7
.87)
22.23
(6
.26)
28.11
(5
.52)
12.28
(4
.09)
15.25
(6
.03)
16.72
(6
.31)
11.63
(1
0.20)
23
.94
(9.20
) 0.4
2 (0
.35)
1.99
(0.49
) 11
8.00
(132.4
8) 15
8.60
(229.6
3) 23
.52
(1.47
) 22
.18
(2.14
)
110 HEBERT ET AL
the difference between the baseline and intervention period values as the predic- tors in the model. Because low baseline NK cell values might have a tendency to increase and high ones might tend to decrease (regression to the mean), we also fitted NK activity values from the preceding period in the model. Since data were collected from the same persons over the course of the study. we also fitted a variable which accounted for a time effect (i.e., I = LF. 2 = first supplement phase, and 3 = second supplement phase). Because of the relatively large number of intercorrelations among independent variables and the relatively small size of the study, we chose to tit the general linear model in two stages to deal with the possibility of collinearity while preserving needed degrees of freedom (28). In the first stage we fitted change in NK activity as the dependent variable and change in total calories, exercise, and Quetelet Index along with NK activity in the previous study period. In the second stage, we fitted the “linear predictor score.‘” summarizing the regression of change in NK activity on the variables in the first stage, along with the change in total fat, MUFA, and P:S ratio. This is a conser- vative technique which requires fitting the fat-related variables of interest only after the effect of calories, Quetelet Index (BMI), and exercise are allowed to explain the variability in change in NK activity. In addition to fitting the supple- ment values as contributors to the nutrient scores, we also fitted the supplement itself (CO = 1, SO = 2, LF alone = 0) as a nominal predictor in analyses. Since the fat supplements we had given the men were also natural dietary constituents. we felt that the most meaningful analysis, however. was that in which fatty acid exposure was expressed in quantitative terms. Besides fitting the fatty acid scores as independent predictors, we also entered them in the models as interaction terms.
RESULTS
Comparison of baseline and intervention average nutritional, weight, exercise. and NK activity data are shown in Table 1. Data for analyses are from the 14 male subjects who successfully completed every phase of the trial. The baseline nutri- ent values are based on the FFQ-derived data and the LF intervention values are derived from the multiple 24-hr recalls. The nutrient data based on multiple 24-hr recalls apparently were reliable since we observed a very high correlation (aver- age Y = 0.95) among total fat, SFA, and PUFA in the original analysis of 24-hr recalls during 1 randomly selected month and the values obtained from a second independent analysis by another nutritionist for the same period. We also com- pared dietary data from the FDFD administered at the end of the LF intervention period with the multiple 24-hr recall data and found that the corresponding nutri- ent values derived from the two methods were relatively highly correlated. The Pearson correlation coefficients for total calories, percentage calories as fat, and grams of SFA were 0.50, 0.39, and 0.59, respectively.
Analyses were conducted with NK activity assessed at all three E/T ratios: lOO:I, 50:1, and 25: 1. In general, results from the three ratios were similar. We report the findings based on the 1OO:l ratio and note divergence with the results for other E/T ratios where applicable.
For the exploratory stepwise models, change in NK activity during the period
DIETARY FAT AND NK CELL ACTIVITY 111
was the dependent variable and we fitted NK activity at the beginning of the measurement interval as an obligatory independent variable. Based on the 24-hr recall data we found that the proportion of calories as fat was the only significant predictor, producing a model R2 = 0.60, (B = -0.89, F = 8.36, P = 0.006). Inclusion of additional predictors increased the model R2 only marginally, i.e., at no stage was it increased by more than 0.02. Results for the corresponding step- wise model using the FDFD-derived data produced an R2 of 0.63 at the second stage where both variables selected, change in MUFA (B = -0.58, P = 0.008) and P:S ratio (B = 9.26, P = 0.05), were significant at the nominal (Y of 0.05. As with the stepwise models based on the 24-recall data, addition of other predictors only marginally improved the R2 (always less than 0.02). With these two predic- tors in the model, no other predictor had an F-statistic which was significant at (Y of 0.20. In the fourth and subsequent stages, with addition of other predictors, the P:S ratio failed to produce a significant contribution.
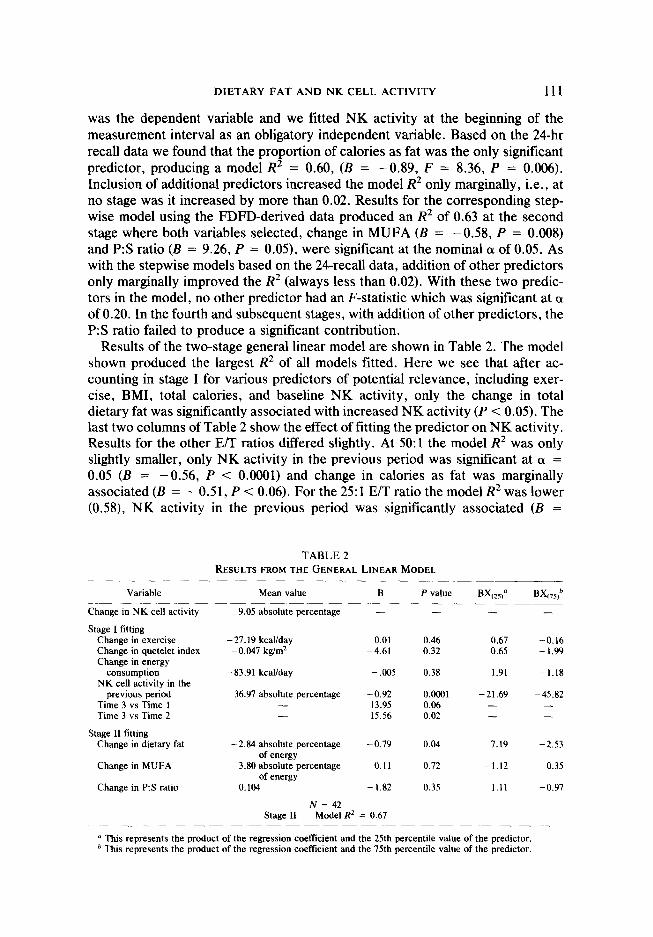
Results of the two-stage general linear model are shown in Table 2. The model shown produced the largest R2 of all models fitted. Here we see that after ac- counting in stage I for various predictors of potential relevance, including exer- cise, BMI, total calories, and baseline NK activity, only the change in total dietary fat was significantly associated with increased NK activity (P < 0.05). The last two columns of Table 2 show the effect of fitting the predictor on NK activity. Results for the other E/T ratios differed slightly. At 5O:l the model R2 was only slightly smaller, only NK activity in the previous period was significant at (Y = 0.05 (B = -0.56, P < 0.0001) and change in calories as fat was marginally associated (B = - 0.5 1, P < 0.06). For the 25: 1 E/T ratio the model R2 was lower (0.58), NK activity in the previous period was significantly associated (B =
TABLE 2 RESULTS FROM THE GENERAL LINEAR MODEL
Variable Mean value
Change in NK cell activity 9.05 absolute percentage - - - -
Stage I fitting Change in exercise - 27.19 kcaYday 0.01 0.46 0.67 -0.16 Change in quetelet index -0.047 kg/m2 -4.61 0.32 0.65 -1.99 Change in energy
consumption -83.91 kcakday - ,005 0.38 1.91 -1.18 NK cell activity in the
previous period 36.97 absolute percentage -0.92 0.0001 -21.69 -45.82 Time 3 vs Time 1 - 13.95 0.06 - - Time 3 vs Time 2 - 15.56 0.02 - -
Stage II fitting Change in dietary fat -2.84 absolute percentage -0.79 0.04 7.19 -2.53
of energy Change in MUFA - 3.80 absolute percentage 0.11 0.72 -1.12 0.35
of energy Change in P:S ratio 0.104 -1.82 0.35 1.11 -0.97
N = 42 Stage II Model RZ = 0.67
a This represents the product of the regression coefficient and the 25th percentile value of the predictor. b This represents the product of the regression coefftcient and the 75th percentile value of the predictor.
112 HEBERT ET AL.
-0.36, P < O.OOl), and change in calories as fat was marginally associated (B = -0.38, P = 0.10).
For the analyses based on the FDFD-derived data, we obtained a model R’ of 0.68, but none of the nutritional predictors was significantly associated with change in NK activity.
For both the 24-hr recall and the FDFD-derived data, we found a marginally significant interaction between PUFA and one other class of dietary fatty acids: for 24-hr data there was an interaction with MUFA (B = 0.03, P = 0.08) and for the FDFD data the interaction was with SFA (B = 0.06, P = 0.07). We attempted fitting a number of models to cross-sectional data but found no significant asso- ciation between any of the NK activity values and any of the nutritional or an- thropometric variables of interest.
DISCUSSION
The findings of this study suggest that lowering fat in the diet to the range of 20% of calories may improve one component of the immune system: NK activity. Although specific fatty acids could affect immune function (29). no individual fat fitted in our models was associated with change in NK activity. We feel that the manner in which we analyzed the data provided ample opportunity to detect an individual fatty acid effect or an interaction between various fat components, if it existed in these data.
The men’s reported compliance with the 15-g supplementation of dietary fat and their adherence to the LF diet throughout the study resulted in drastic changes in their P:S ratios over time. This is in marked contrast to the small change in P:S ratio observed with an LF diet without supplementation (13). Despite this. the dietary P:S ratio had no statistically significant effect on NK activity. A recent study indicates that the P:S ratio does not appear to predict NK activity (30). Since we did not measure other potentially relevant intermediary variables such as prostaglandins, we cannot know the mechanism(s) by which decreasing dietary fat produced the observed increase in NK activity.
In general, there seemed to be some regression in the final phase of the study, with the men increasing total fat intake slightly, moderately increasing exercise energy expenditures, and increasing BMI to a level slightly higher than the base- line average. In other analyses (manuscript currently under review), we found that intraperson sources of variability were much larger relative to interperson sources of variability during the first supplemental phase. For example, the intraperson source of variability in proportion of calories as fat was 61.2% of total variability in phase I versus 34.5% of total variability in phase II. The effect of increased average compliance in phase I and increased interindividual sources of variability in phase II might have produced the significant period effects we observed in the GLM.
Along with total fat, calories were also reduced during all phases of the inter- vention trial, relative to baseline. Numerous animal studies have indicated that calorically restricted diets may enhance some aspects of cellular immunity (3 1, 32). In laboratory mice fed a calorie-restricted (50 kcals/week) diet, baseline, OI
DIETARY FAT AND NK CELL ACTIVITY 113
preinduction, NK activity was lower compared to control mice fed 85 kcal/week. When challenged with polyinosinic:polycytidylic acid, which raises interferon levels and raises NK activity, calorie-restricted mice showed greatly increased NK activity relative to controls (33).
In the current study, we fitted change in calories in the stage I model and found it not to be significantly associated with change in NK activity (B = - 0.005, P = 0.38). In contrast, fat, which was fitted only after accounting for the effect of total calories, was significantly associated (B = -0.79, P = 0.04).
Although we attempted to model the relationships between specific types of dietary fats using the GLM, there may be specific fat effects that we were unable to detect. For example, there may be an interaction between the different types of dietary fats. This is plausible since we know that SFA affects immune responses, such as NK activity, that depend on membrane contact (29, 34) and that PGE, also affects the activity of NK cells (12). Problems of dietary recall or recording of intake may more seriously affect the estimates of individual fatty acid exposure than the estimate of overall fat intake. This might obscure a real fatty acid effect.
Although the use of a functional NK assay may have more biological relevance than phenotypic markers, it does have limitations (35). One major concern is that NK activity can vary substantially from day-to-day and over longer periods of time and there is a relatively large amount of analytic variability (36). For practical reasons, only a single NK cell assay was performed on each subject at baseline and after each intervention phase. Given the inherent variabilities in NK activity and the dietary variables, our results, showing a relationship between dietary fat and change in NK activity, are even more impressive than they otherwise might be. It is more difficult for an effect to be observed in a statistically “noisy” than a less “noisy” system (37).
Although a control was used for each assay, there is still the possibility of a “laboratory shift” in NK cell values that could have accounted for some of the variation in NK activity. The small sample size and problems with subject com- pliance were other factors that might have affected our results, Compliance is a factor that will be of concern in any study using human subjects and problems should be anticipated. Unlike the previous report (13), we were able to account for seasonal effects by using a cross-over study design. This also provided a degree of “control” (38) that was lacking in the LF study (13). However, we did find some effect of season on ability to comply with the intervention.
This study helped to confirm the result noted in the previous report, i.e., that there was an effect due to total fat that was neither a total energy effect nor the result of the action of specific fatty acids. Our results from exploratory analyses indicated a possible effect of MUFA as well as an interaction between PUFA and either MUFA or SFA.
Our original hypothesis was that PUFA, specifically omega-6 fatty acids, would inhibit NK activity. Although NK cell cytotoxicity appears to be regulated by several endogenous substances (39-41), including prostaglandins (42-45), whose synthesis is affected by intake of dietary fat (3), the observation that PUFA and PGE are not consistently inhibitors of cellular immunity (46,47) indicates that the role of omega-6 series fatty acids and their eicosanoid products is a complex one.
114 HEBERT ET AL
PUFA and PGE concentrations as well as the state of target cell activation and differentiation may play a role in determining whether PGE activates or inhibits NK activity (48, 49).
The link between dietary fat and some forms of cancer has been indicated in numerous human and animal studies (50,51). It has been hypothesized that cancer may be associated with a defective immune system, one unable to eradicate tumor cells as they arise (50). Because of the possible role of NK activity in early tumor detection, this has particular relevance to our results.
Despite our finding of a significant increase in NK activity with decreasing total dietary fat, it does represent an isolated immune function. It does not indicate the functioning of the immune system as a whole nor does it indicate whether there would be a decreased risk of tumorigenesis or viral infection with a decrease in fat intake.
ACKNOWLEDGMENTS
We are grateful to Karen Biener, MS., Maria Baldo, B.A., and Althea Engle, R.D.. M.S. for nutrient analyses and to Cheun-Lan Liang. M.S.A. for programming assistance.
REFERENCES
1. Broitman, S. A., Vitale, J. J., Vavrousek-Jakuba, E.. and Gottlieb, L. S.. Polyunsaturated fat. cholesterol and large bowel tumorigenesis. Cancer 40, 2455-2463, 1977.
2. Carroll, K. K., The role of dietary fat in carcinogenesis. In “Dietary Fats and Health” tE. G. Perkins and W. J. Visek, Eds.), Amer. Oil Chemists Sot.. Champaign, IL, 1983.
3. Johnston, P. V., Dietary fat, eicosanoids, and immunity. Adv. Lipid Res. 21, 103-141, 1985. 4. Willett, W. C., and MacMahon, B., Diet and cancer: An overview. N. Engl. /. Med. 310,697-703,
1984. 5. Newbeme, P. M., Dietary fat, immunological response and cancer in rats. Cancer Res. 41, 3783-
3785, 1981. 6. Hanna, N., Role of natural killer cells in host defense against cancer metastasis. In “Cancer
Invasion and Metastasis: Biologic and Therapeutic Aspects” (G. L. Nicolson and L. Milas, Eds.), Raven Press, New York, 1984.
7. Schattner, A., and Duggan. D. B., Natural killer cells: Toward clinical application. Amer. .J.
Hematol. 18, 435-443, 1985. 8. Herberman, R. B.. and Holden, H. T.. Natural killer cells and immunity. Adv. Cuncer Res. 27.
305-377, 1978. 9. Kiessling. R., and Wigzell, H. An analysis on the murine NK cells as to structure, function, and
biological relevance. Immunol Rev. 44, 165-208. 1979. 10. Herberman, R. B.. and Holden. H. T., Natural killer cells as antitumor effector cells. JNCI 62.
441-445, 1979. 11. Herberman, R., Possible roles of natural killer cells and other effector cells in immune surverllance
against cancer. J. Invest. Dermatol. 83, 137s-140s. 1984. 12. Barone, J.. and Hebert, J. R., Dietary fat and natural killer cell activity. Med. Hypotheses 25.
223-226, 1988. 13. Barone, J., Hebert, J. R., and Reddy, M. M., Dietary fat and natural killer cell activity. Amer. ./.
Clin. Nutr. 50, 861-867, 1989. 14. Merrill, J. E., CH5: The implications of aberrant natural killer (NK) cell activity in nonmalignant
chronic diseases. In “Immunobiology of Natural Killer Cells” (E. Lotzova and R. B. Herberman, Eds.), Vol. 2, CRC Press, Boca Raton. FL, 1986.
15. Block. G., Rosenberger, W. F., and Patterson, B. H.. Calories. fat and cholesterol: Intake pat- terns in the U.S. population by race, sex and age. Amer. J. Public Health 78, 1150-l 155. 1988.
16. Block, G., Dresser. C. M., Hartman, A. M., and Carroll, M. D., Nutrient sources in the Amer-
DIETARY FAT AND NK CELL ACTIVITY 115
ican diet: Quantitative data from the NHANES II survey. II. Macronutrients and fats. Amer. J.
Epidemiol. 122, 21-39, 1985. 17. Willett, W. C., Sampson, L., Stampfer, M. J., Rosner, B., Bain, C., Witschi, J., Hennekens,
C. H., and Speizer, F. E., Reproducibility and validity of a semiquantitative food frequency questionnaire. Amer. .I. Epidemiol. 122, 51-65, 1985.
18. Rohan, T. E., and Potter, J. D., Retrospective assessment of dietary intake. Amer. J. Epidemiol. 120, 876887, 1984.
19. Rasanen, L., and Pietinen, P., A short questionnaire method of evaluation of diets. Prev. Med. 11, 669-676, 1982.
20. Boyar, R. P., and Loughridge, J. R., The fat protein exchange list: A tool for teaching and evaluating low-fat diet. J. Amer. Diet Assoc. 85, 589-594, 1985.
21. Wynder, E. L., and Hebert, J. R., Homogeneity in nutritional exposures: An obstacle in cancer epidemiology. JNCZ 79, 605-607, 1987.
22. Reddy, M. M., Pinyavat, N., and Grieco, M. H., Interleukin II augmentation of natural killer cell activity in homosexual men with acquired immune deficiency. Infect. Zmmun. 44, 339-343, 1984.
23. Tukey, J. W., “Exploratory Data Analysis,” Addison-Wesley, Reading, MA, 1977. 24. Liu, K., Stamler, J., Dyer, A., McKeever, J., and McKeever, P., Statistical methods to assess and
minimize the role of intraindividual variability in observing the relationship between dietary lipids and serum cholesterol. J. Chronic 0%. 31, 399-418, 1978.
25. el Lozy, M., Dietary variability and its impact on nutritional epidemiology. J. Chronic Dis. 36,
237-249, 1983. 26. Marr, J. W., Individual dietary surveys: Purposes and methods. World Rev. Nutr. Diet. 13,
105-164, 1971. 27. Krantzler, N. J., Mullen, B. J., Schutz, G. H., Grivetti, L. E., Holden, M. S., and Meiselman,
H. L., Validity of telephoned diet recalls and records for assessment of individual food intake. Amer. J. Clin Nutr. 36, 1234-1242, 1982.
28. Hebert, J. R., Relationship of vegetarianism to child growth in South India. Amer. J. Clin. Nutr. 42, 1246-1254, 1985.
29. Kritchevsky, D., Diet and nutrition research. Cancer 62, 1839-1843, 1988. 30. Berry, E. M., Hirsch, J., Most, J., McNamara, D. J., and Cunningham-Rundles, S., Dietary fat,
plasma lipoproteins and immune function in middle-aged American men. Nutr. Cancer 9, 129-142, 1987.
31. Weindruch, R., Walford, R. L., Fligiel, S., and Guthrie, D., The retardation of aging in mice by dietary restriction: Longevity, cancer, immunity and lifetime energy intake. .Z. Nutr. 116,641-654,
1986. 32. Weindruch, R., Gottesman, S. R. S., and Walford, R. L., Modification of age-related immune
decline in mice dietarily restricted from and after mid-adulthood. Proc. Natl. Acad. Sci. USA 79,
898-902, 1982. 33. Weindruch, R., Devens, B. H., Ratf, H. V., and Walford, R. L., Influence of dietary restriction
and aging on natural killer cell activity in mice. J. Zmmunol. 130, 993-996, 1983. 34. Morrow, M. J., Ohashi, Y., Hall, J., et al., Dietary fat and immune function. I. Antibody re-
sponses, lymphocyte and accessory cell function in (NZB X NZW)Fl mice. J. Zmmunol. 135, 3857-3863, 1985.
35. Pross, H. F., and Baines, M. G., Studies of human natural killer cells. I. In vivo parameters affecting normal cytotoxic function. Znt. J. Cancer 29, 383-390, 1982.
36. Pross, H. F., Callewaert, D., and Rubin, P., CHl: Assays for NK cell cytotoxicity-their values and pitfalls. In “Immunobiology of Natural Killer Cells” (E. Lotzova, and R. B. Herberman. Eds.), Vol. 1, CRC Press, Boca Raton, FL, 1986.
37. Snedecor, G. W., and Cochran, W. G., “Statistical Methods, 6th ed., Iowa State Univ. Press. Ames, 1974.
38. Weiss, N. S., “Clinical Epidemiology: The Study of the Outcome of Illness,” Oxford, Univ. Press, New York, 1986.
39. Kadish, A. S., Doyle, A. T., Steinhauer, E. H., and Ghossein, N. A., Natural cytotoxicity and interferon production in human cancer: Deficient natural killer cell activity and normal interferon production in patients with advanced disease. J. Zmmunol. 127, 1817-1822, 1981.
116 HEBERT ET AL.
40. Kimber, I., and Moore, M., Mechanism and regulation of natural cytotoxicity. Exp. Cell B&l. 53, 84. 1985.
41. Onsrud, M.. and Thorsby, E.. Influence of in vivo hydrocortisone on some human blood lym- phocyte populations. Stand. J. Immunol. 13, 573-579, 1981.
42. Droller, M. J., Perlmann, P., and Schneider, M. V., Enhancement of natural and antibody- dependent lymphocyte cytotoxicity by drugs which inhibit prostaglandin production by tumor target cells. Cell. Immunol. 39, 15b-164, 1978.
43. Goto, T., Herberman, R. B., Malusih, A., and Strong, D. M.. Cyclic AMP as a medtator of prostaglandin E-induced suppression of human natural killer cell activity. J. Immunol. 130, 1350- 1355, 1983.
44. Hall, T. J., Chen. S.-H., Brostoff, J., and Lydyard, P. M., Modulation of human natural killer-cell activity by pharmacological mediators. Clin. Exp. Immunol. 54, 493-500, 1983.
45. Hall, T. J., and Brostoff, J., Inhibition of human natural killer cell activity by prostaglandin D2. Immunol. Lett. 7, 141-144. 1983.
46. Goodwin, J. S., and Ceuppens, J., Regulation of the immune response by prostaglandins. J. Uirr. Immunol. 3, 295-315, 1983.
47. Horrobin, D. F., The role of essential fatty acids and prostaglandins in breast cancer. 111 “Diet, Nutrition and Cancer.” Vol. I, “Macronutrients and Cancer” (B. S. Reddy, and L. A. Cohen. Eds.), CRC Press. Boca Raton, FL. 1986.
48. Gurr, M. I., The role of lipids in the regulation of the immune system. Yrog. Lipid Res. 22, 257-287. 1983.
49. Goodwin, J. S., and Webb, D. R., Regulation of the immune response by prostaglandins. C/in. Immunol. Immunopathol. 15, 106122, 1980.
50. Carroll, K. K.. and Khor, H. T., Dietary fat in relation to tumorigenesis. Prog. Biochem. Phar- macol. 10, 308-353, 1975.
51. O’Connor, T. P., Roebuck. B. D., and Campbell, T. C.. Dietary intervention during the postdos- ing phase of L-azaserine-induced preneoplastic lesions. JNCI 75, 955-957. 1985.
Received November 22. 1988; accepted with revision August I I. 1989
Related Documents