NATS 101-06 Lecture 6 Seasons and Temperature Variations

NATS 101-06 Lecture 6 Seasons and Temperature Variations.
Dec 20, 2015
Welcome message from author
This document is posted to help you gain knowledge. Please leave a comment to let me know what you think about it! Share it to your friends and learn new things together.
Transcript
NATS 101-06
Lecture 6Seasons
and Temperature Variations
Supplemental References for Supplemental References for Today’s Lecture on SeasonsToday’s Lecture on Seasons
Aguado, E. and J. E. Burt, 2001: Understanding Weather & Climate, 2nd Ed. 505 pp. Prentice Hall. (ISBN 0-13-027394-5)
Danielson, E. W., J. Levin and E. Abrams, 1998: Meteorology. 462 pp. McGraw-Hill. (ISBN 0-697-21711-6)
Gedzelman, S. D., 1980: The Science and Wonders of the Atmosphere. 535 pp. John-Wiley & Sons. (ISBN 0-471-02972-6)
Lutgens, F. K. and E. J. Tarbuck, 2001: The Atmosphere, An Intro-duction to the Atmosphere, 8th Ed. 484 pp. Prentice Hall. (ISBN 0-13-087957-6)
Wallace, J. M. and P. V. Hobbs, 1977: Atmospheric Science, An Introductory Survey. 467 pp. Academic Press. (ISBN 0-12-732950-1)
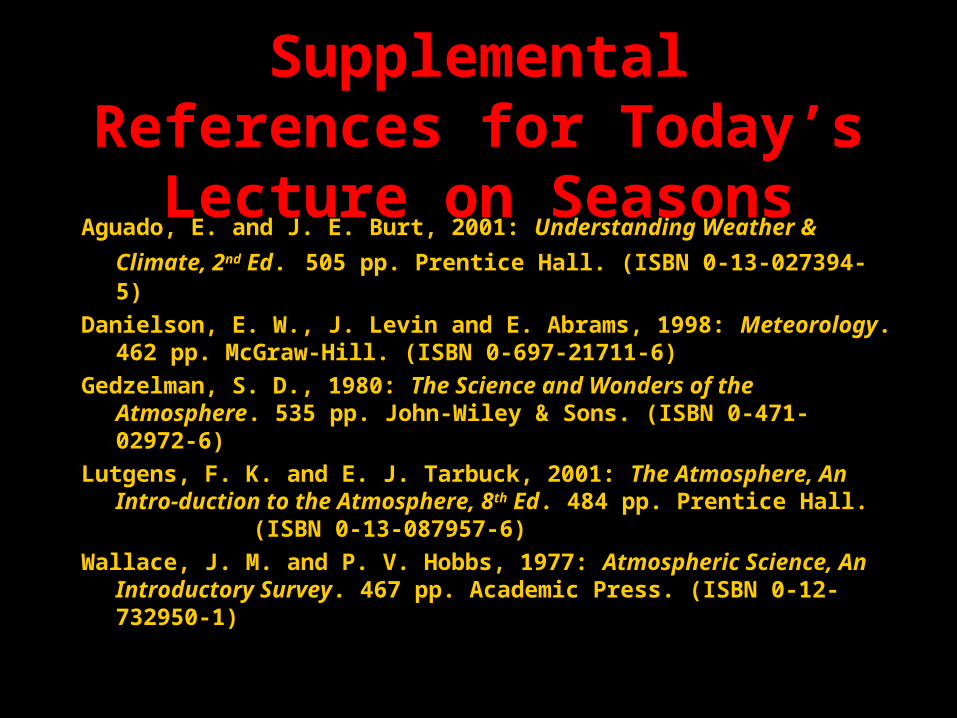
Reasons for Seasons
• Tilt of Earth’s Axis - Obliquity
Angle between the Equatorial Plane and the Orbital Plane
• Eccentricity of Earth’s Orbit
Elongation of Orbital Axis
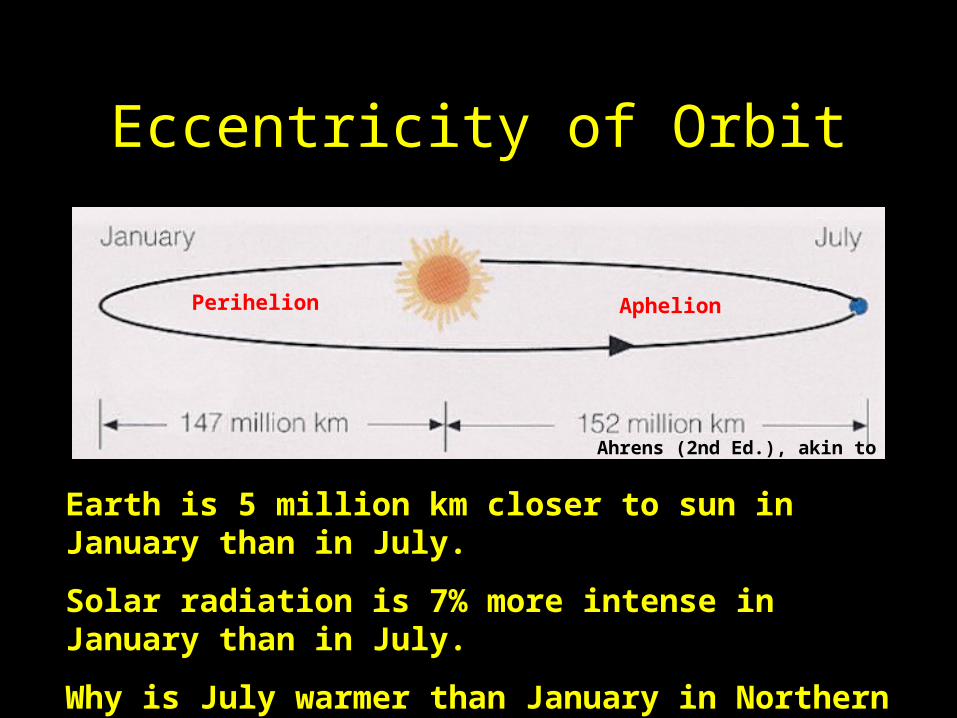
Earth is 5 million km closer to sun in January than in July.
Solar radiation is 7% more intense in January than in July.
Why is July warmer than January in Northern Hemisphere?
Eccentricity of Orbit
AphelionPerihelion
Ahrens (2nd Ed.), akin to Fig. 2.15
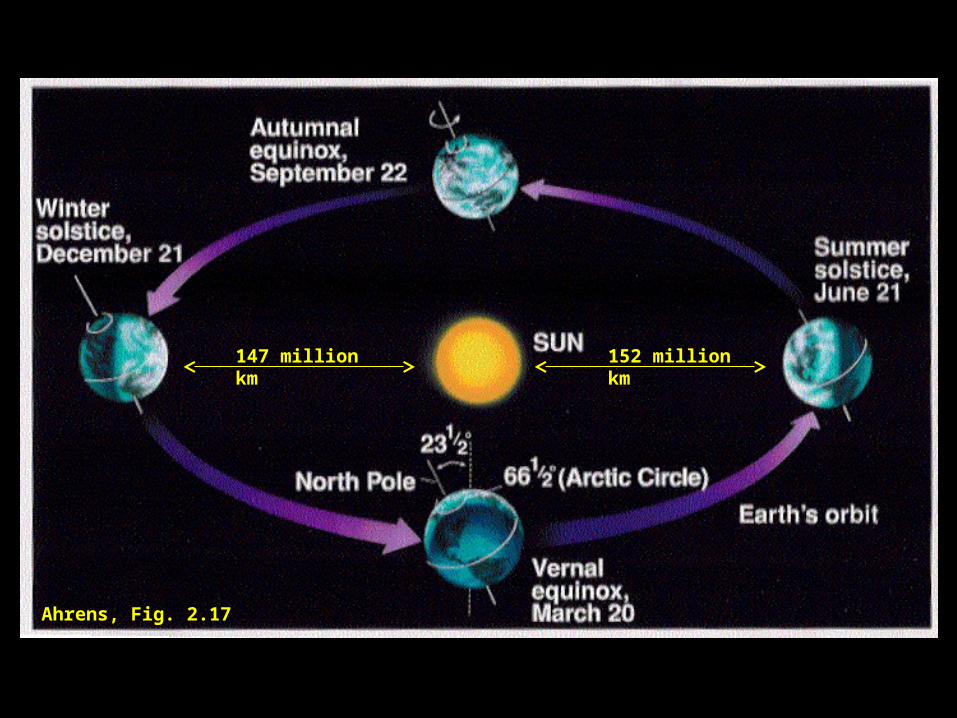
147 million km 152 million km
Ahrens, Fig. 2.17
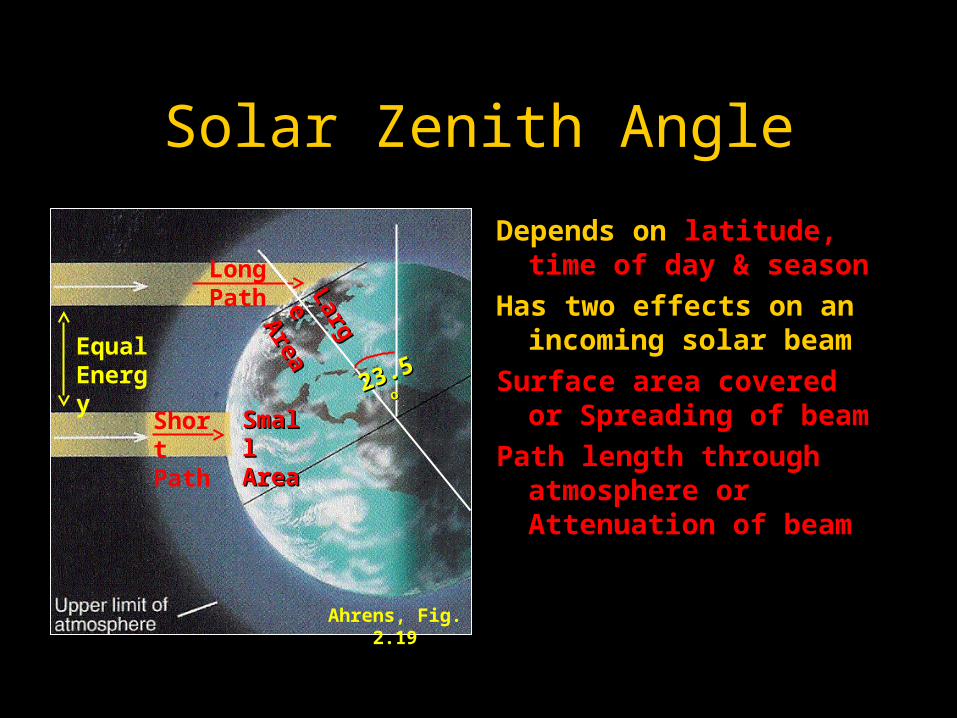
Solar Zenith Angle
Depends on latitude, time of day & season
Has two effects on an incoming solar beam
Surface area covered or Spreading of beam
Path length through atmosphere or Attenuation of beam
Ahrens, Fig. 2.19L
arge
Large
Area
Area
Small Small AreaArea
Short Path
Long Path
Equal Energy 23.523.5
oo
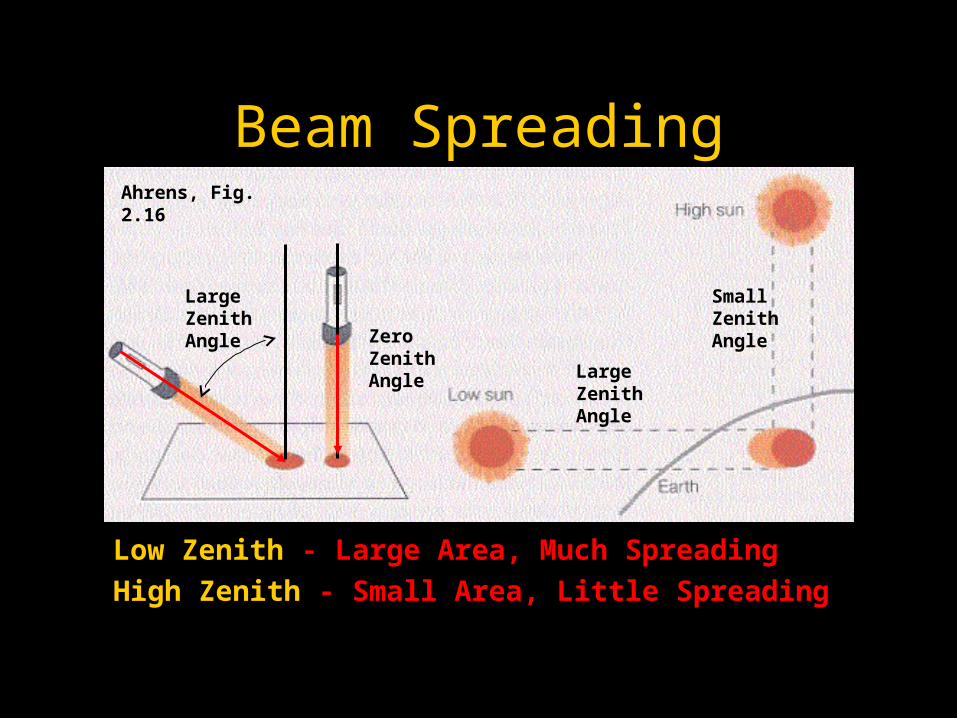
Beam Spreading
Low Zenith - Large Area, Much Spreading
High Zenith - Small Area, Little Spreading
Ahrens, Fig. 2.16
Large Zenith Angle Zero
Zenith Angle Large
Zenith Angle
Small Zenith Angle
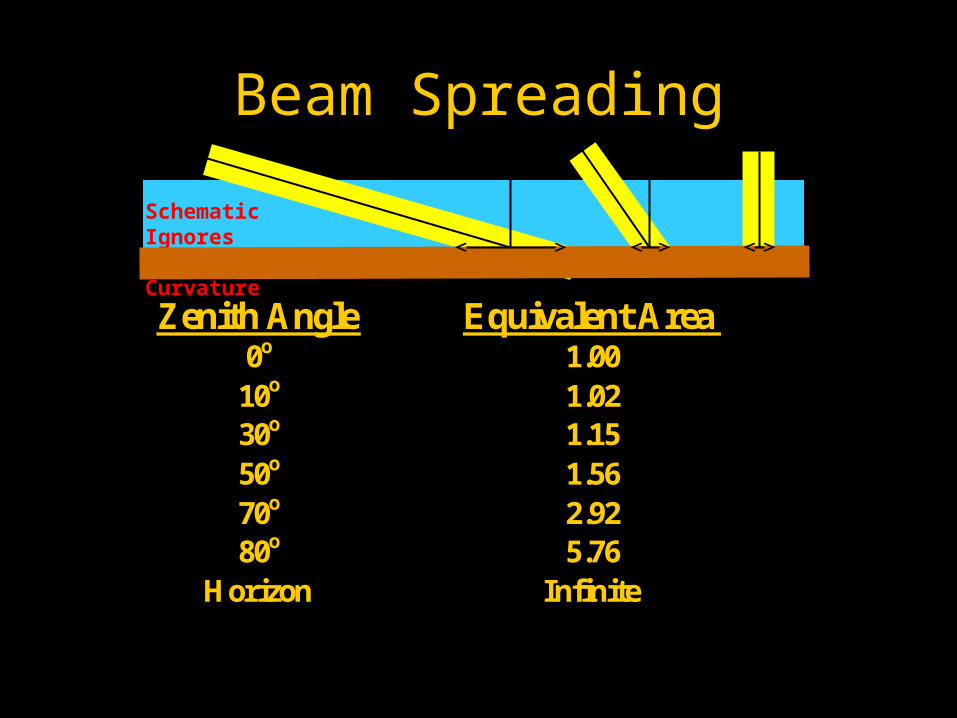
Beam Spreading
Zenith Angle Equivalent Area 0o 1.00
10o 1.02 30o 1.15 50o 1.56 70o 2.92 80o 5.76
Horizon Infinite
Schematic Ignores Earth’s Curvature
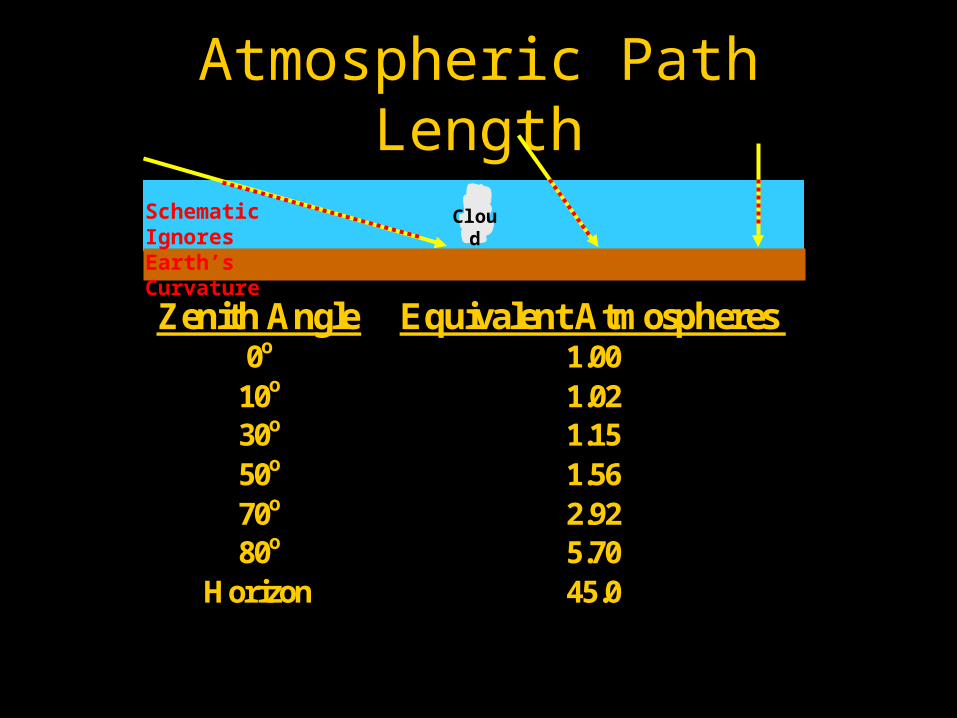
Atmospheric Path Length
Zenith Angle Equivalent Atmospheres 0o 1.00
10o 1.02 30o 1.15 50o 1.56 70o 2.92 80o 5.70
Horizon 45.0
Schematic Ignores Earth’s Curvature
Cloud
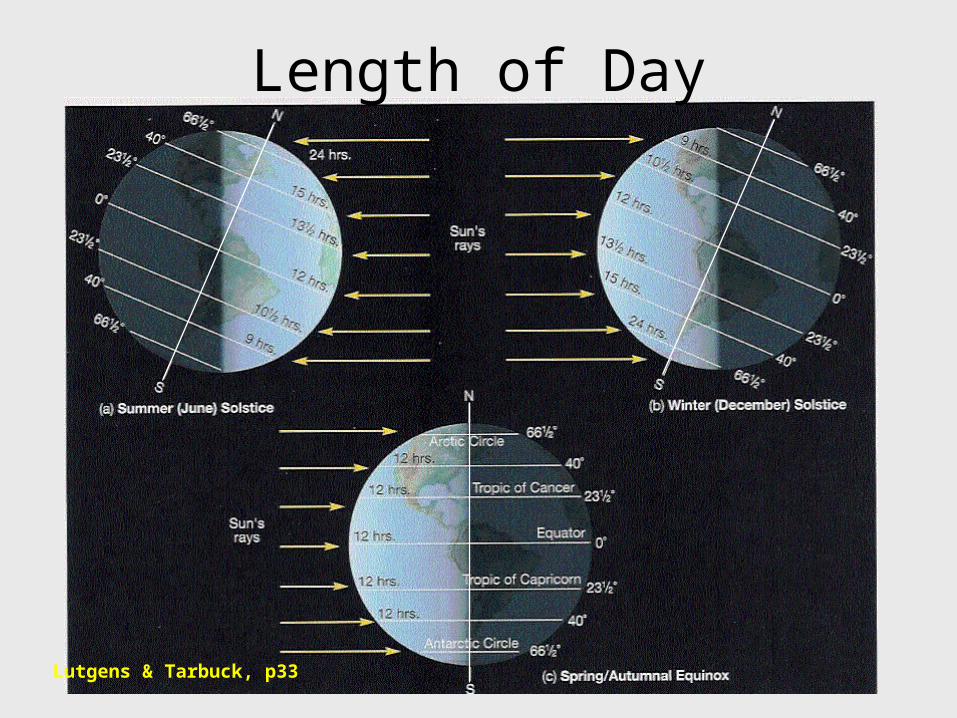
Length of Day
Lutgens & Tarbuck, p33
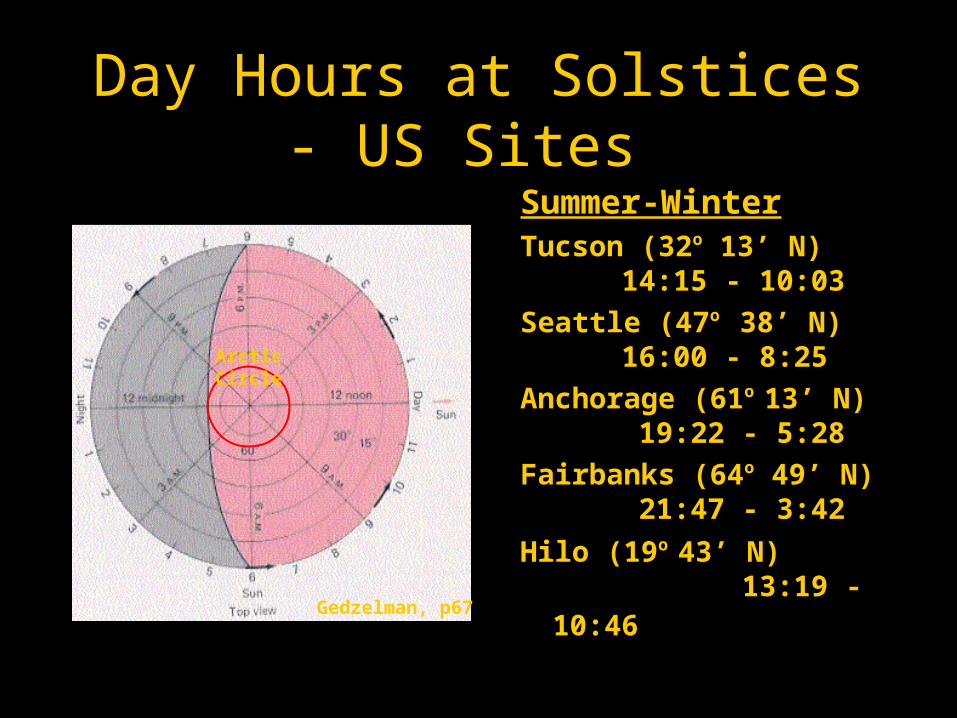
Day Hours at Solstices - US Sites
Summer-WinterTucson (32o 13’ N)
14:15 - 10:03
Seattle (47o 38’ N) 16:00 - 8:25
Anchorage (61o 13’ N) 19:22 - 5:28
Fairbanks (64o 49’ N) 21:47 - 3:42
Hilo (19o 43’ N) 13:19 - 10:46
Gedzelman, p67
Arctic Circle
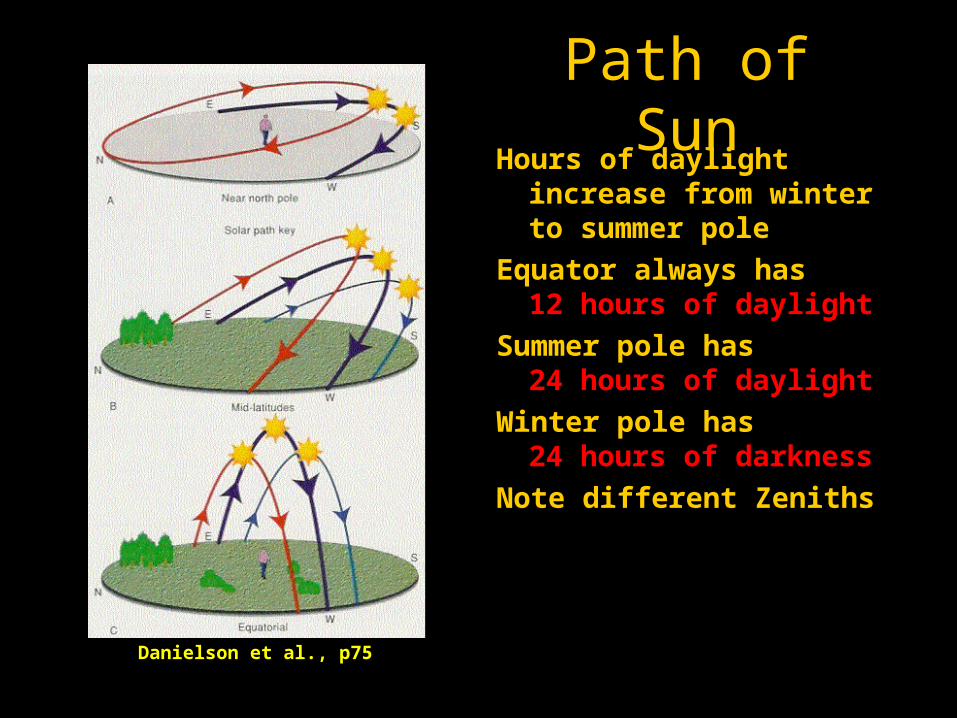
Path of SunHours of daylight increase
from winter to summer pole
Equator always has 12 hours of daylight
Summer pole has 24 hours of daylight
Winter pole has 24 hours of darkness
Note different Zeniths
Danielson et al., p75
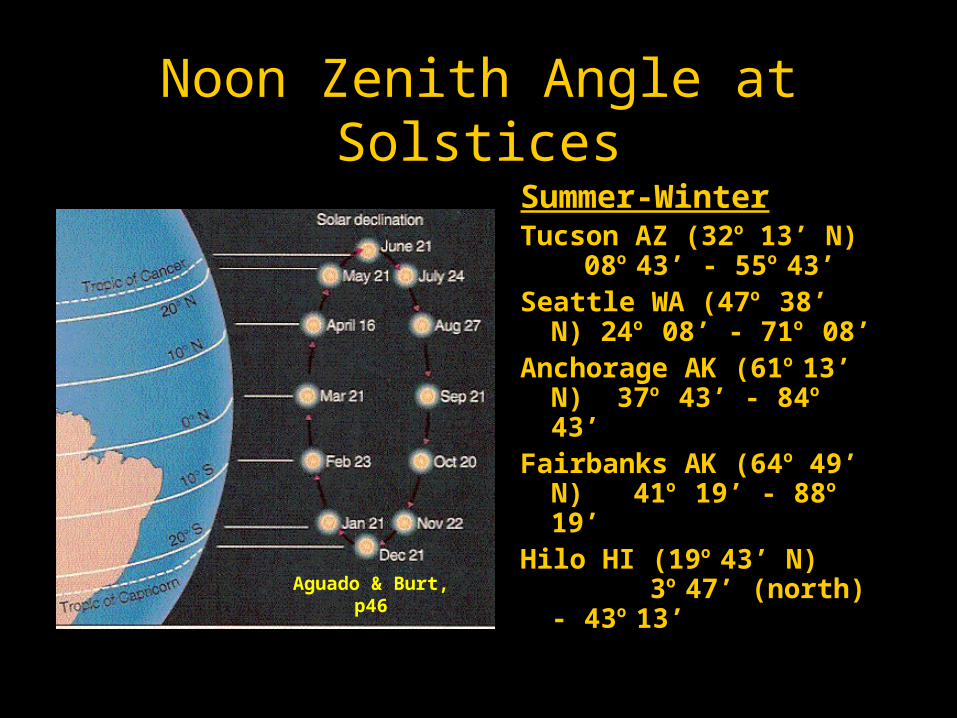
Noon Zenith Angle at Solstices
Summer-WinterTucson AZ (32o 13’ N)
08o 43’ - 55o 43’Seattle WA (47o 38’ N)
24o 08’ - 71o 08’ Anchorage AK (61o 13’ N)
37o 43’ - 84o 43’ Fairbanks AK (64o 49’ N)
41o 19’ - 88o 19’ Hilo HI (19o 43’ N)
3o 47’ (north) - 43o 13’Aguado & Burt, p46
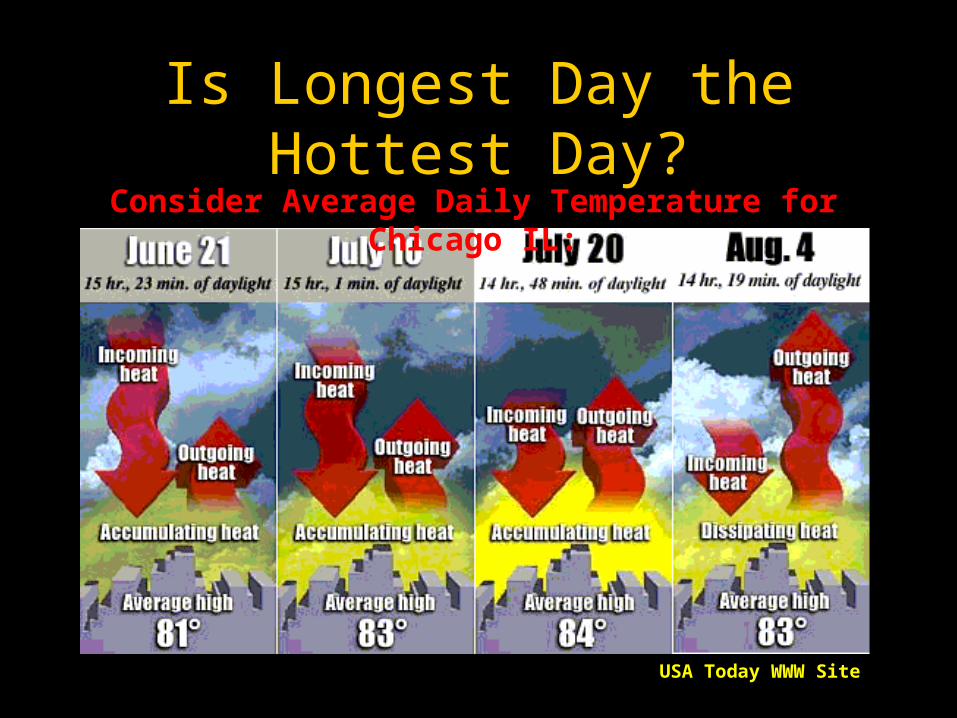
Is Longest Day the Hottest Day?
USA Today WWW Site
Consider Average Daily Temperature for Chicago IL:
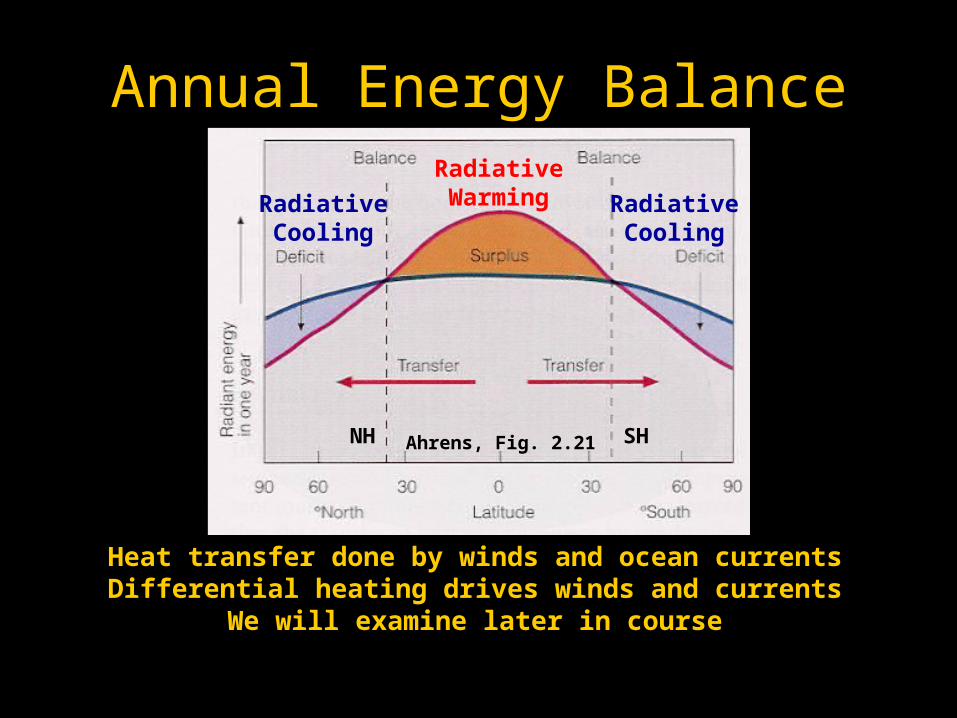
Annual Energy Balance
Heat transfer done by winds and ocean currentsDifferential heating drives winds and currents
We will examine later in course
NH SH
Radiative WarmingRadiative
CoolingRadiative Cooling
Ahrens, Fig. 2.21
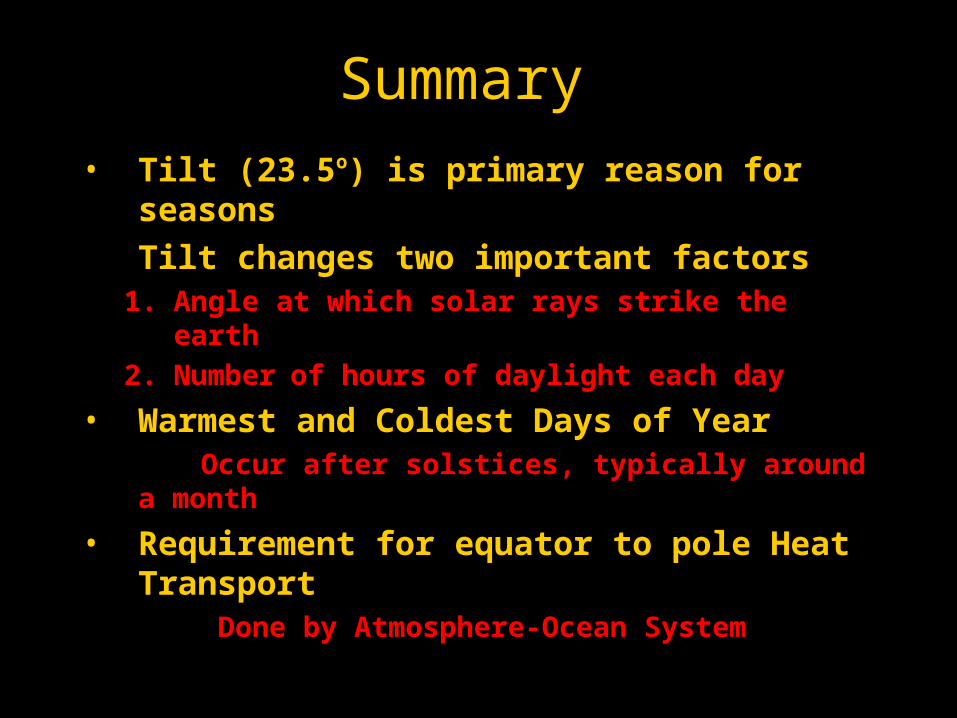
Summary
• Tilt (23.5o) is primary reason for seasons
Tilt changes two important factors 1. Angle at which solar rays strike the earth
2. Number of hours of daylight each day
• Warmest and Coldest Days of Year Occur after solstices, typically around a month
• Requirement for equator to pole Heat Transport
Done by Atmosphere-Ocean System
NATS 101-06
Now on to Temperature Variations
Supplemental Reference for Today’s Lecture on
Temperature Variations
Wallace, J. M. and P. V. Hobbs, 1977: Atmospheric Science, An Introductory Survey. 467 pp. Academic Press. (ISBN 0-12-732950-1)
Temperature Questions
• What causes diurnal temperature variations?
• What physical processes can influence daily temperature variations?
• Why is MAX temperature after solar noon?
• Why is MIN temperature just after sunrise?
• What is Wind Chill Factor? (if time allows)
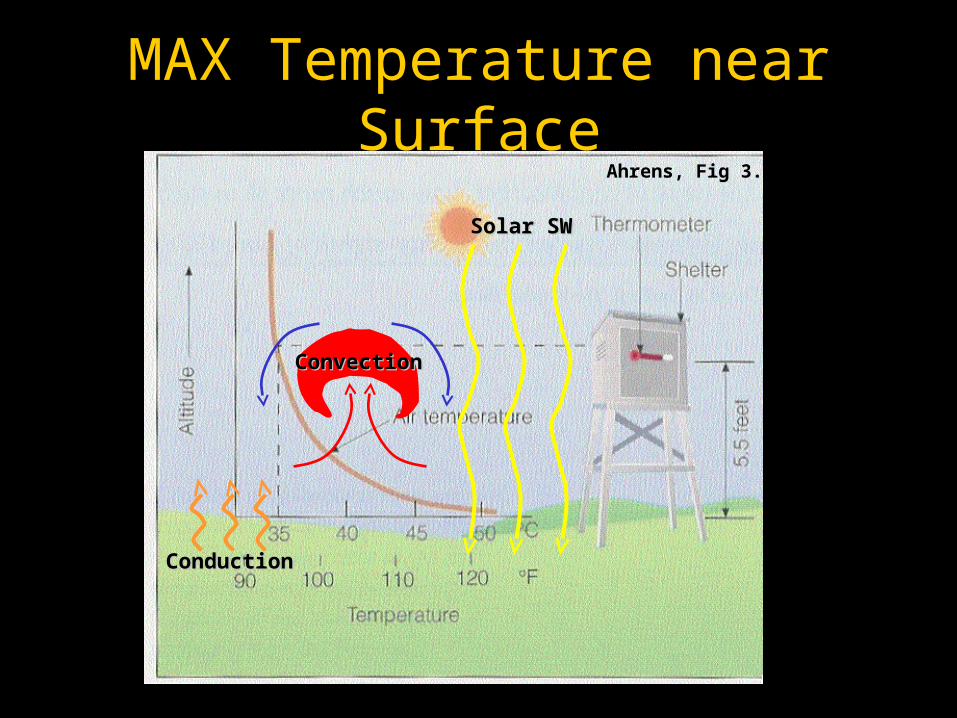
MAX Temperature near Surface
ConvectionConvection
ConductionConduction
Solar SWSolar SW
Ahrens, Fig 3.1
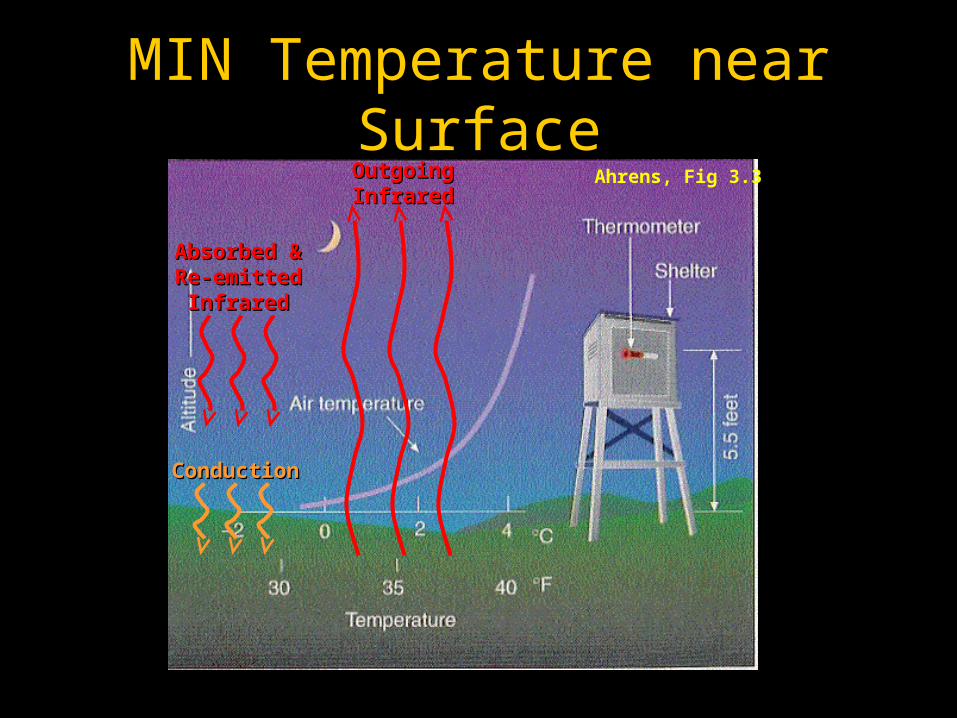
MIN Temperature near SurfaceAhrens, Fig 3.3Outgoing Outgoing
InfraredInfrared
Absorbed & Absorbed & Re-emitted Re-emitted
InfraredInfrared
ConductionConduction
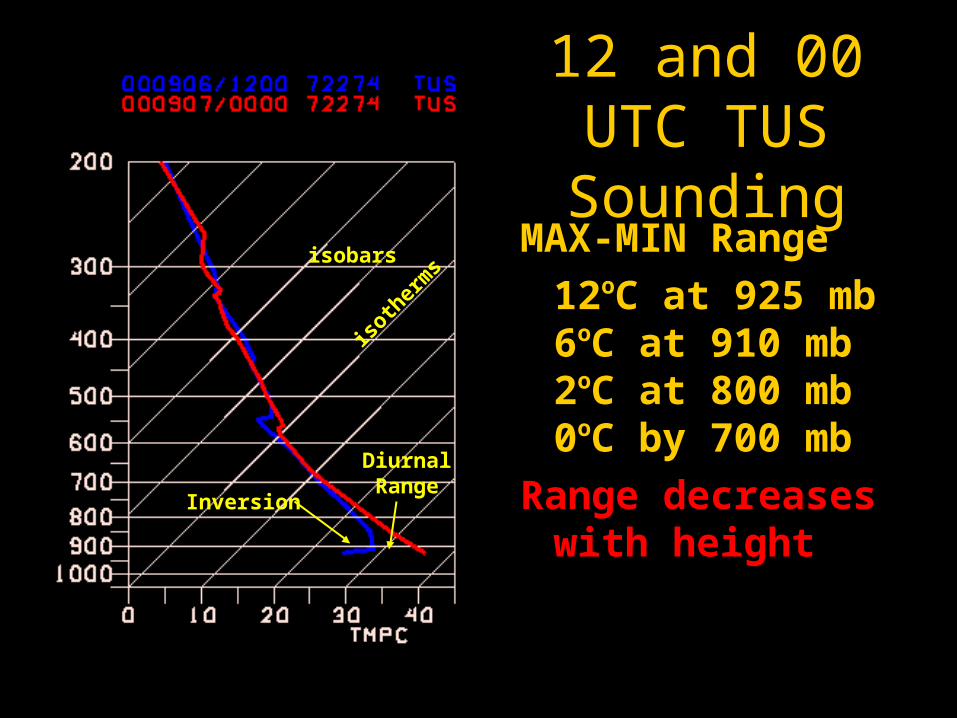
12 and 00 UTC TUS Sounding
MAX-MIN Range
12oC at 925 mb 6oC at 910 mb 2oC at 800 mb 0oC by 700 mb
Range decreases Range decreases with heightwith height
isoth
erm
sisobars
Diurnal Range
Inversion
Temperature
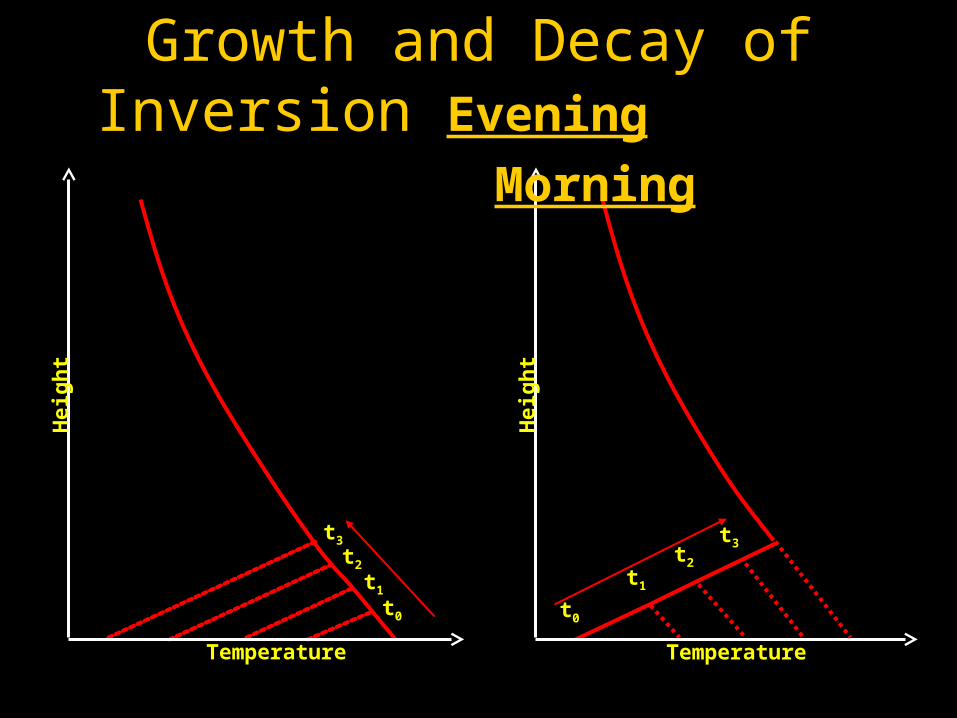
Hei
ght
t1
t2
t3
t0
Temperature
Hei
ght
t1
t2
t3
t0
Growth and Decay of Inversion Evening Morning
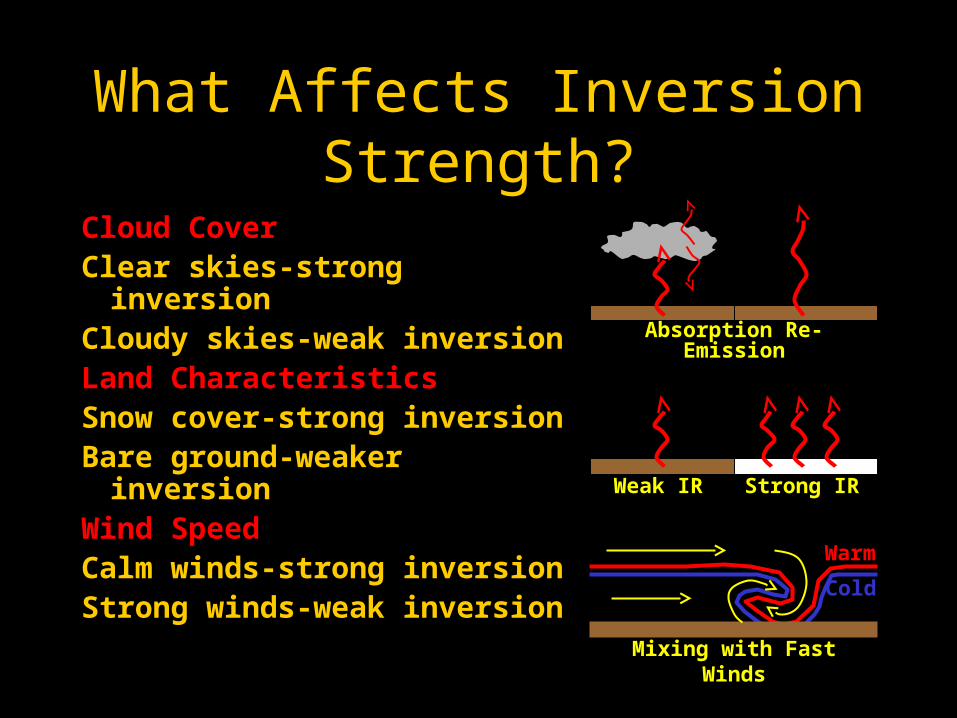
What Affects Inversion Strength?
Cloud CoverCloud CoverClear skies-strong inversionCloudy skies-weak inversionLand CharacteristicsLand CharacteristicsSnow cover-strong inversionBare ground-weaker inversionWind SpeedWind SpeedCalm winds-strong inversionStrong winds-weak inversion
Weak IR Strong IR
Absorption Re-Emission
Warm
Cold
Mixing with Fast Winds
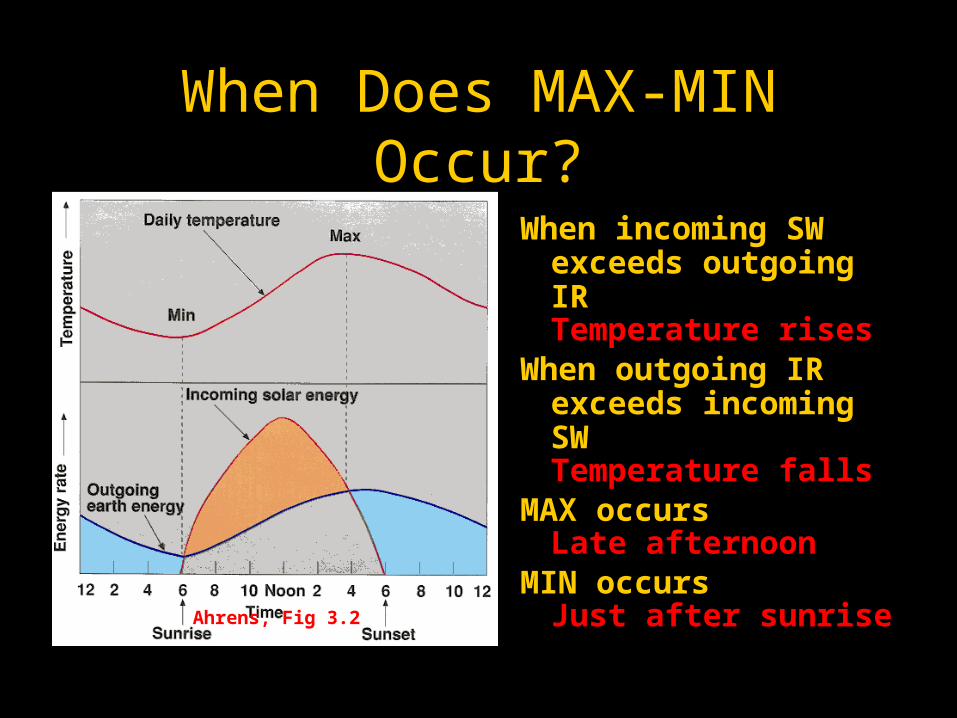
When Does MAX-MIN Occur?
When incoming SW exceeds outgoing IRTemperature rises
When outgoing IR exceeds incoming SWTemperature falls
MAX occurs Late afternoon
MIN occurs Just after sunriseAhrens, Fig 3.2
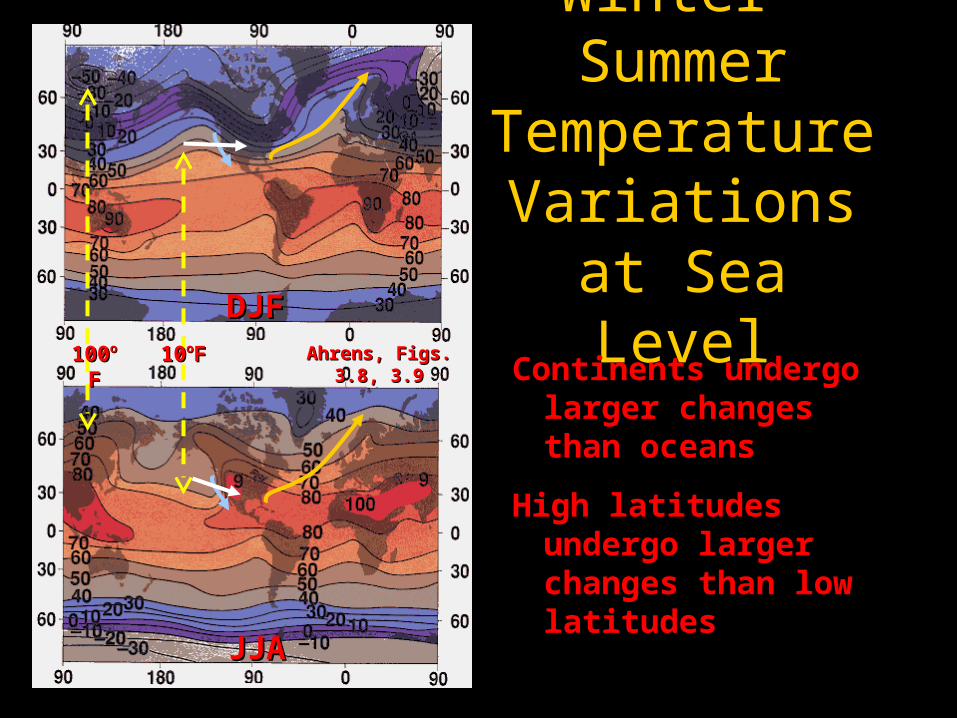
Winter-Summer Temperature Variations at
Sea Level
Continents undergo larger changes than oceans
High latitudes undergo larger changes than low latitudes
Ahrens, Figs. 3.8, 3.9Ahrens, Figs. 3.8, 3.9100100ooFF 1010ooFF
DJFDJF
JJAJJA

Controls of Temperature
• Latitude
Average temperatures in middle latitudes decrease by 5-10oC every 10o latitude
• Elevation
Lapse rate in troposphere is 6.5oC/km
Tucson (2,500 ft) July Max - 100oF
Mt. Lemmon (8,500 ft) July Max - 76oF
Controls of Temperature
• Ocean Currents and Prevailing Winds
Warm-Gulf Stream
Cold-California Current
• Land versus Water
Heat capacity of water is 5X that of land
Absorbed solar energy is distributed a greater depth in water than in land

Specific Heat Capacity
Heat required to raise temperature of 1 gm of mass 1oC.
Rock has lower heat capacity than water
Material Specific Heat Capacity (Cal gm -1 oC-1)
Still Water 1.00
Dry Air 0.24
Granite (Rock) 0.19
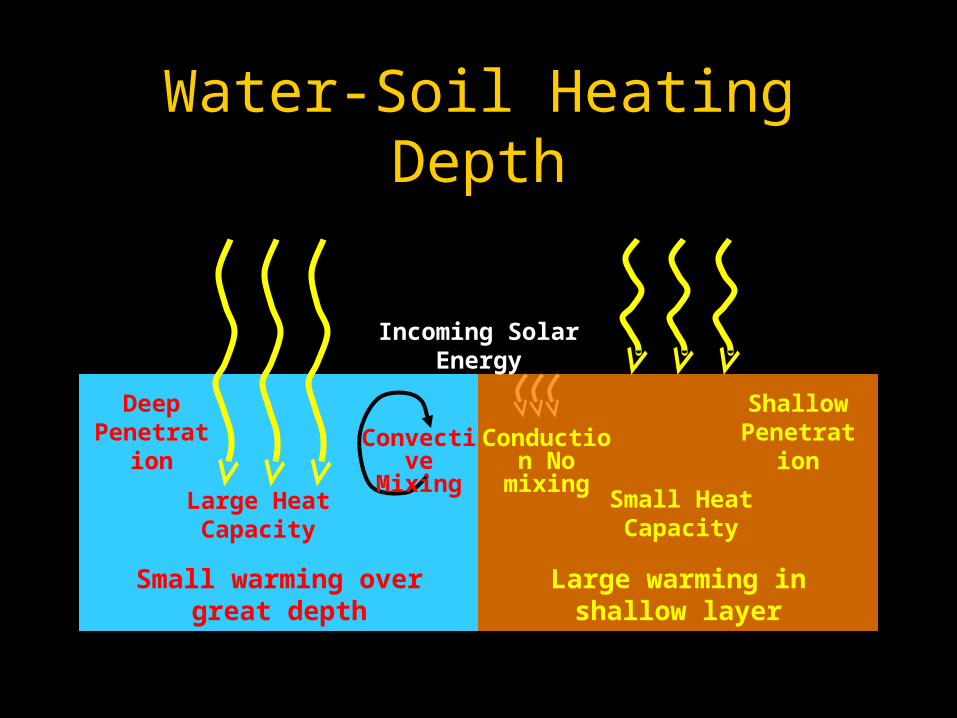
Water-Soil Heating Depth
Deep Penetration
Shallow Penetration
Incoming Solar Energy
Convective Mixing
Small warming over great depth Large warming in shallow layer
Conduction No mixing
Large Heat Capacity Small Heat Capacity
Wallace and Hobbs, p347
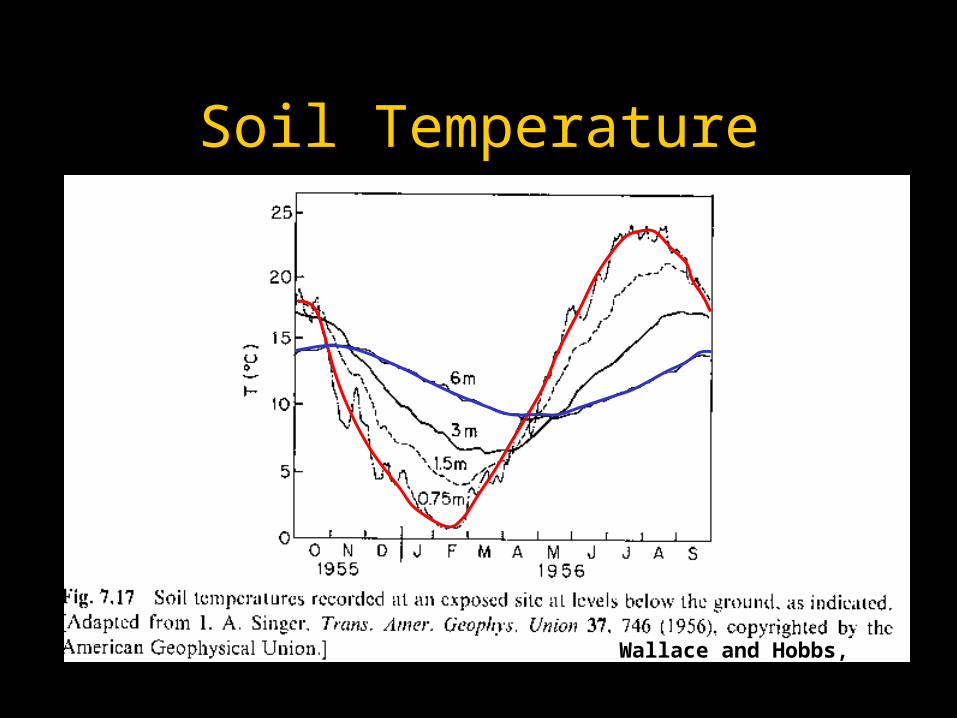
Soil Temperature
Wallace and Hobbs, p348
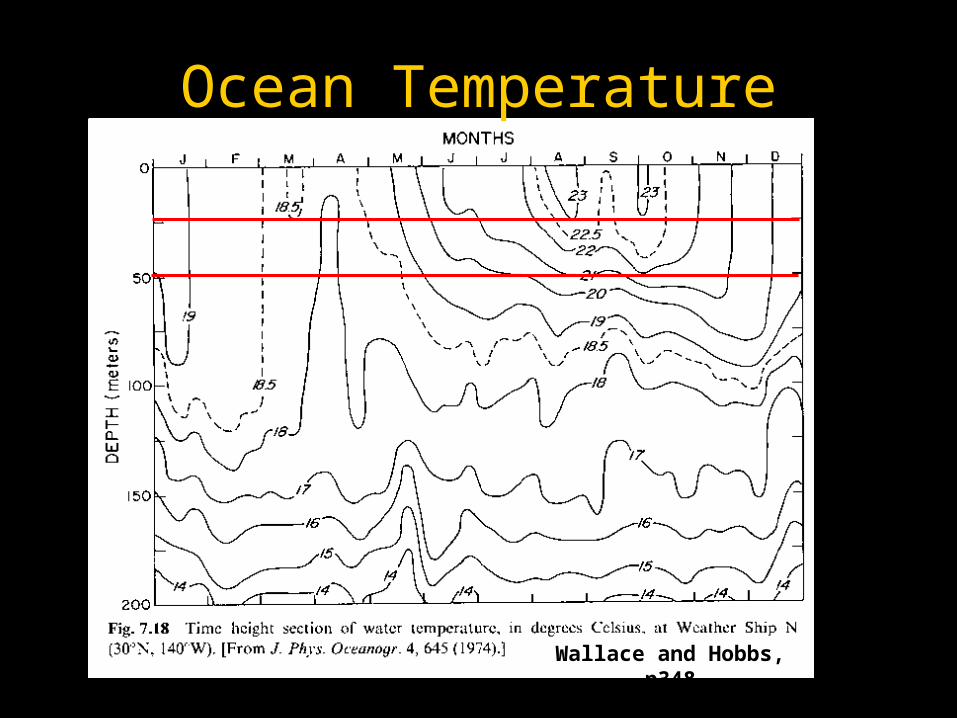
Ocean Temperature

Wind Chill
Still air is poor conductor; lack of wind allows insulating layer of still air to form near skin
Wind blows insulating layer of air from skin Forced convection or heat transport by advection
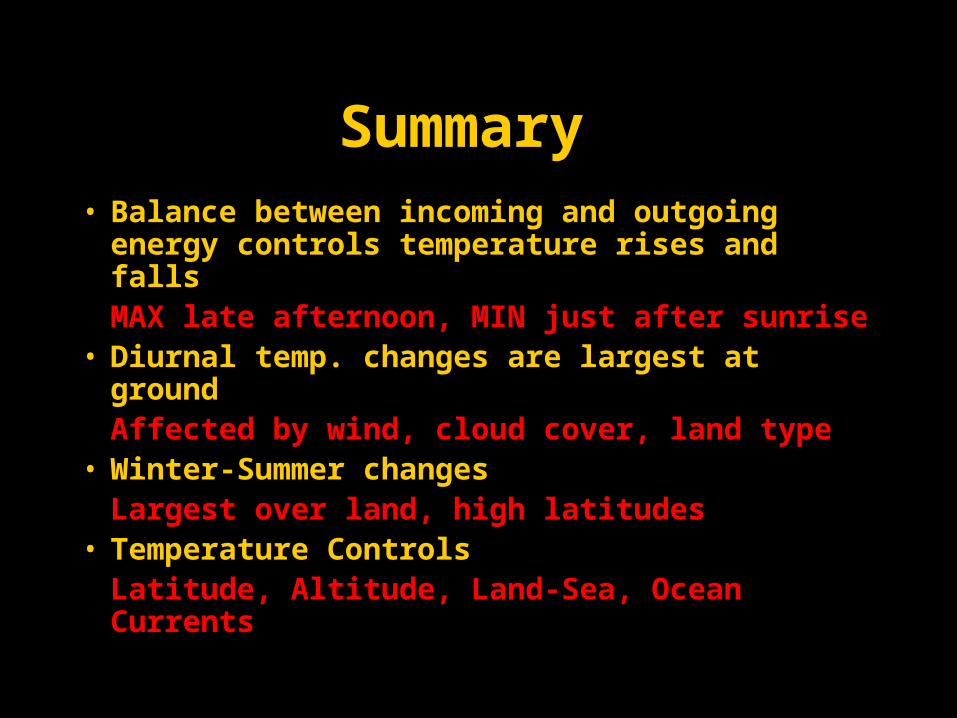
Summary • Balance between incoming and outgoing energy
controls temperature rises and fallsMAX late afternoon, MIN just after sunrise
• Diurnal temp. changes are largest at groundAffected by wind, cloud cover, land type
• Winter-Summer changesLargest over land, high latitudes
• Temperature ControlsLatitude, Altitude, Land-Sea, Ocean Currents
Assignment
• Ahrens
Atmospheric Moisture
Pages 77-89, B: 430, D: 433-436
Problems 4.1, 4.2, 4.5, 4.6, 4.9, 4.10
Related Documents