National Secondary Transition Technical Assistance Center Entering Adulthood: Assistance on the School- to-Work Community Transition of Adolescents with Disabilities OSEP Project Director’s Meeting July 16 - 18, 2007

National Secondary Transition Technical Assistance Center Entering Adulthood: Assistance on the School-to-Work Community Transition of Adolescents with.
Dec 16, 2015
Welcome message from author
This document is posted to help you gain knowledge. Please leave a comment to let me know what you think about it! Share it to your friends and learn new things together.
Transcript
National Secondary Transition
Technical Assistance Center
Entering Adulthood: Assistance on the School-to-Work
Community Transition of Adolescents with Disabilities
OSEP Project Director’s Meeting July 16 - 18, 2007
What We’ll Share
Our Missions
Our Resources
Conceptualizing coordinated TA

Our Challenge
How do we link what we’ve learned about secondary transition – including school completion, effective transition programs and services, & post-school outcomes with practices in our schools and communities?
Research
Practice
Compliance
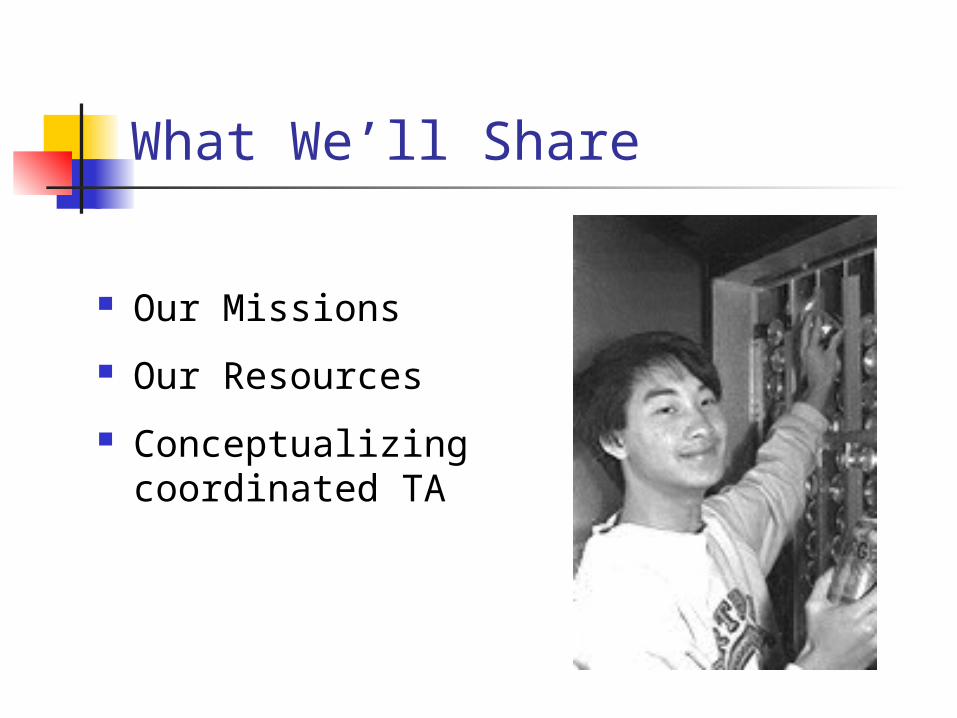
Critical Interrelationship
Quality IEPsStaying in
School
GraduatingAchieving
post-school outcomes

Using Transition Indicators to Improve What We DoPost-School Outcomes
~Indicator 14~ Postsecondary education and/or
training Employment Independent living
Dropping Out~Indicator 2~
Why? Appropriate programs? Address student and family
needs?
Graduation~Indicator 1~
Expectations and standards? Various pathways available? Linkage to post-school
environments?
What’s the Quality of Our IEPs?
~Indicator 13~ Measurable post-school and annual
goals Transition-related assessments Course of study, services, and
activities Coordination of services
Not so good?
Good?
Why? Why Not?Why? Why Not?

IDEA Purpose
(d)(1)(A) to ensure that all children with disabilities have available to them a free appropriate public education that emphasizes special education and related services designed to meet their unique needs and prepare them for further education, employment, and independent living.
IEP Requirements – 2004
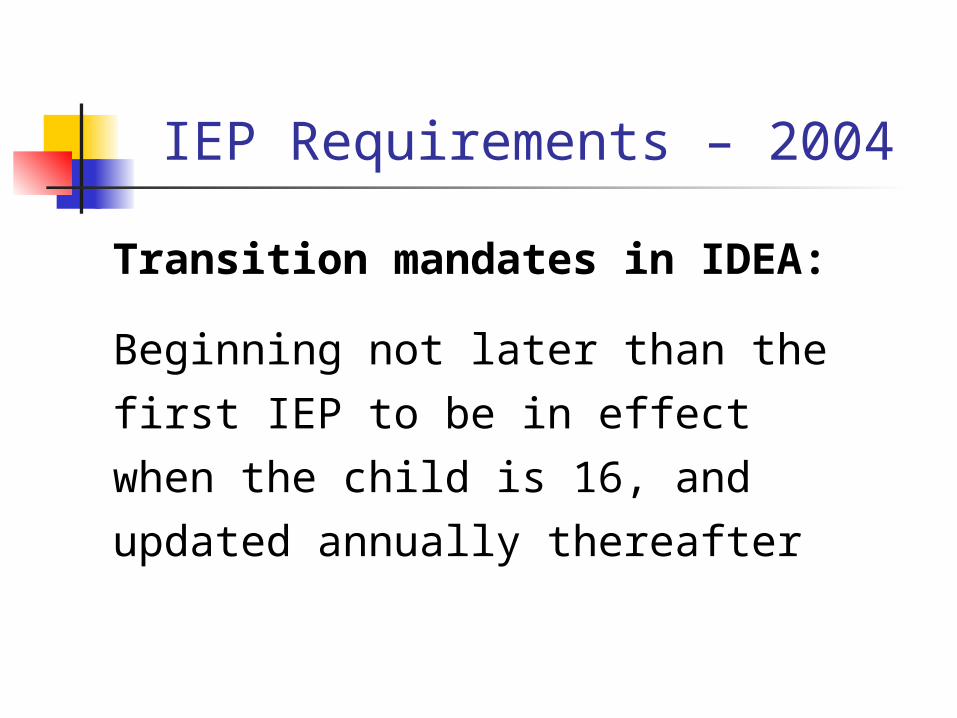
Transition mandates in IDEA:
Beginning not later than the first
IEP to be in effect when the child
is 16, and updated annually
thereafter
IEP Requirements – 2004
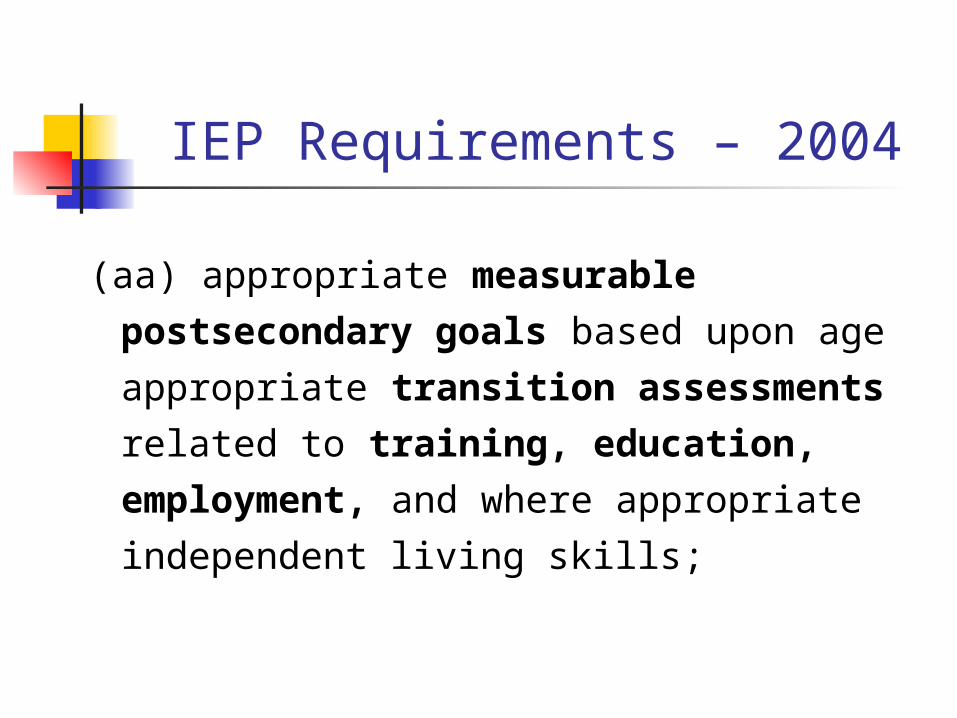
(aa) appropriate measurable
postsecondary goals based upon
age appropriate transition
assessments related to training,
education, employment, and where
appropriate independent living skills;
IEP Requirements – 2004
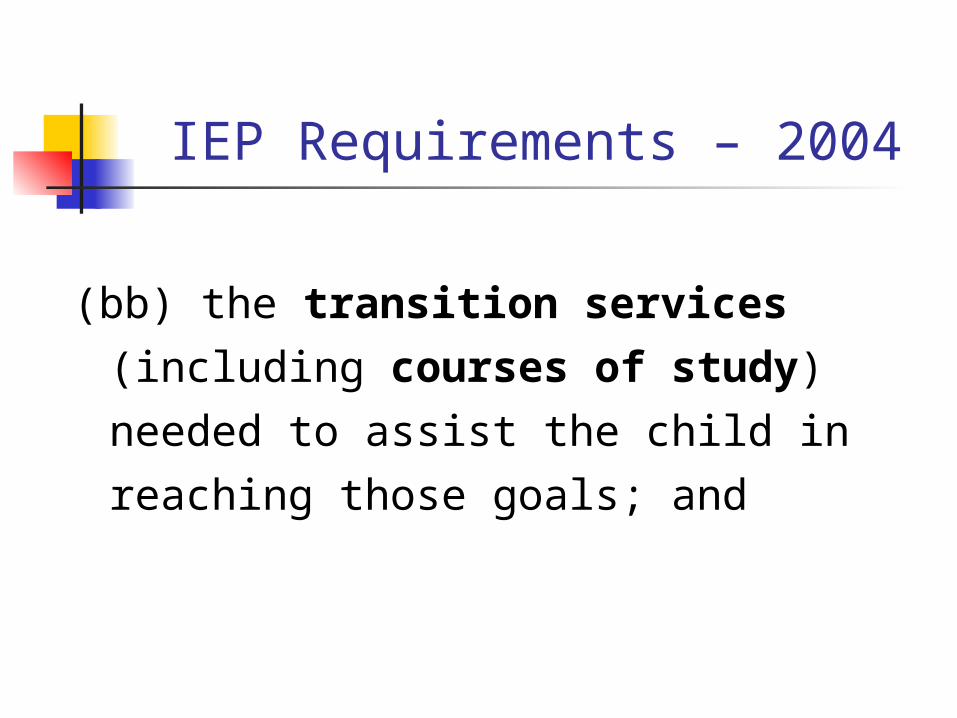
(bb) the transition services
(including courses of study)
needed to assist the child in
reaching those goals; and
SPP and APR
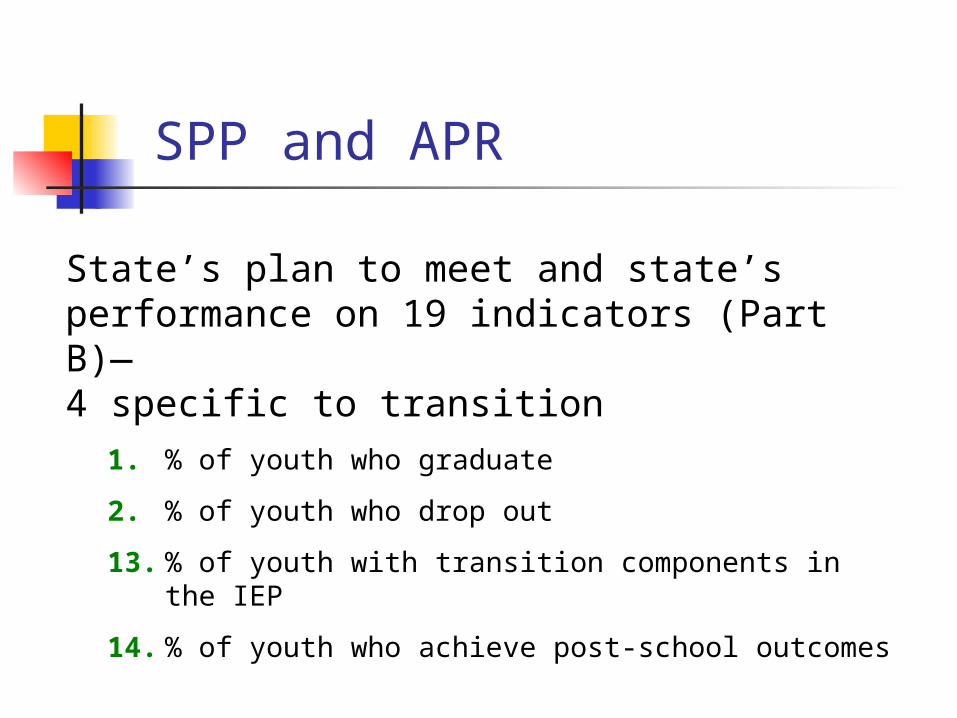
State’s plan to meet and state’s performance on 19 indicators (Part B)—4 specific to transition
1. % of youth who graduate
2. % of youth who drop out
13. % of youth with transition components in the IEP
14. % of youth who achieve post-school outcomes
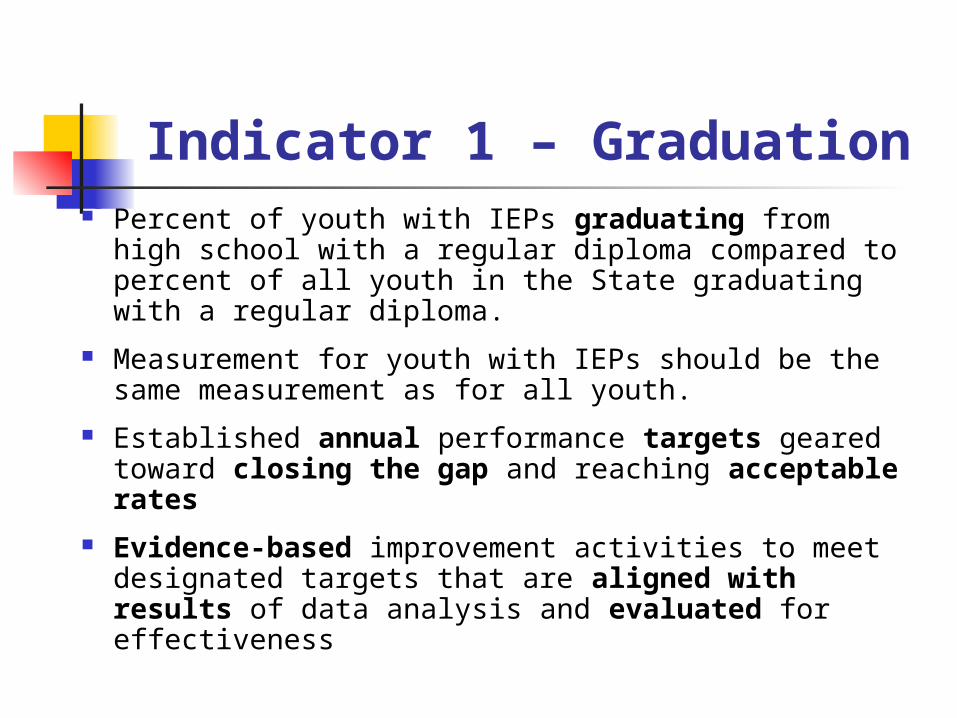
Indicator 1 – Graduation Percent of youth with IEPs graduating from high
school with a regular diploma compared to percent of all youth in the State graduating with a regular diploma.
Measurement for youth with IEPs should be the same measurement as for all youth.
Established annual performance targets geared toward closing the gap and reaching acceptable rates
Evidence-based improvement activities to meet designated targets that are aligned with results of data analysis and evaluated for effectiveness
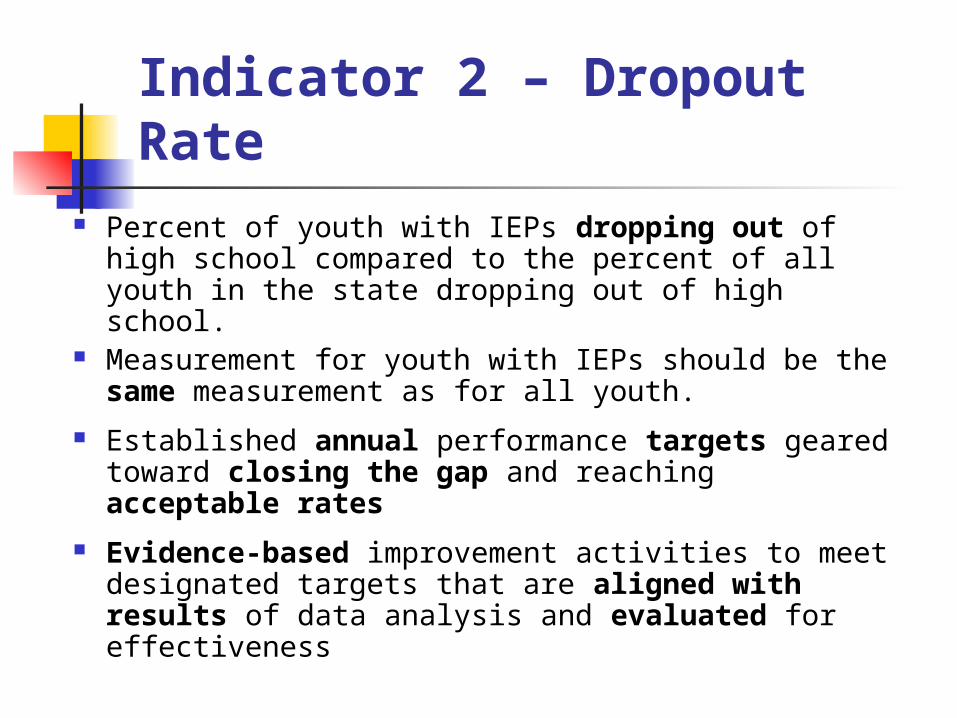
Indicator 2 – Dropout Rate Percent of youth with IEPs dropping out of high
school compared to the percent of all youth in the state dropping out of high school.
Measurement for youth with IEPs should be the same measurement as for all youth.
Established annual performance targets geared toward closing the gap and reaching acceptable rates
Evidence-based improvement activities to meet designated targets that are aligned with results of data analysis and evaluated for effectiveness
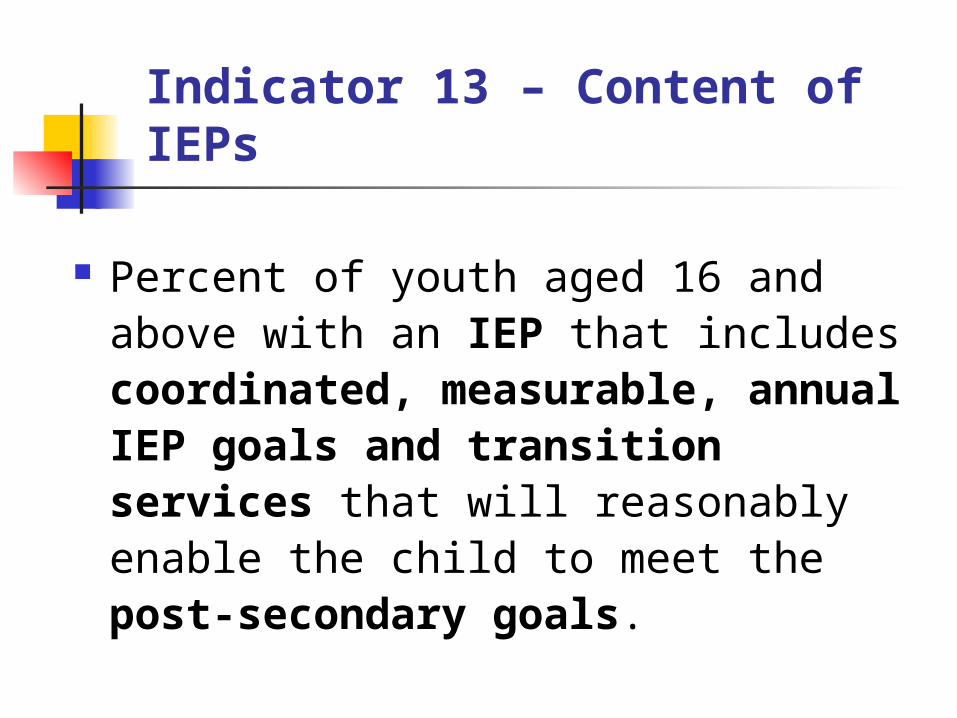
Indicator 13 – Content of IEPs
Percent of youth aged 16 and above with an IEP that includes coordinated, measurable, annual IEP goals and transition services that will reasonably enable the child to meet the post-secondary goals.
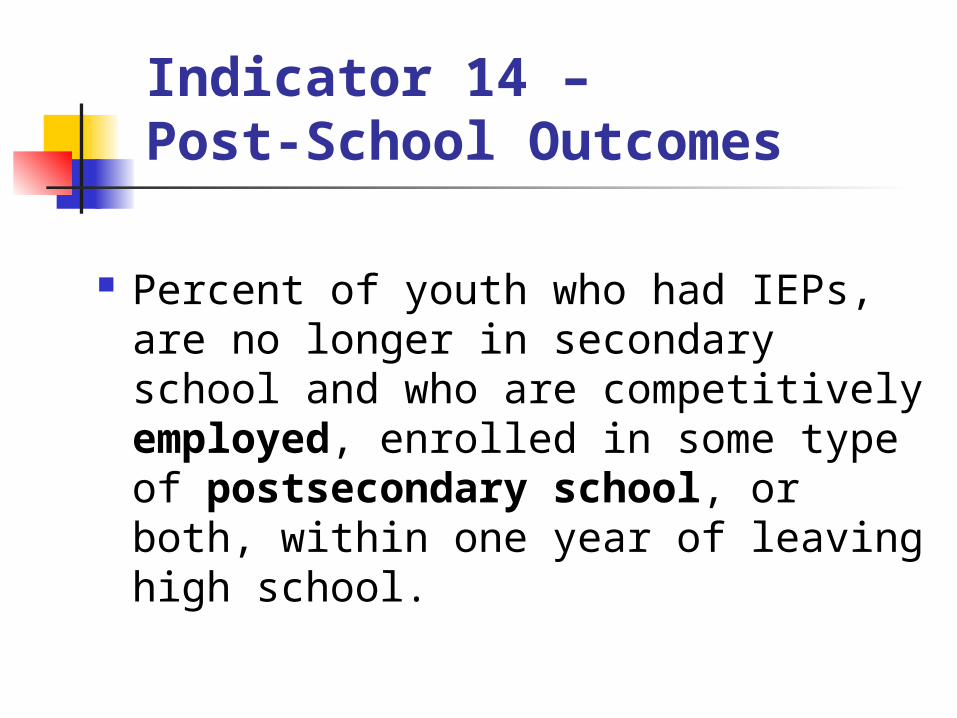
Indicator 14 –Post-School Outcomes
Percent of youth who had IEPs, are no longer in secondary school and who are competitively employed, enrolled in some type of postsecondary school, or both, within one year of leaving high school.

What’s Coordinated TA?
Three centers implementing their charges
NDPC-SD
NSTTAC
NPSO
National Dropout Prevention Center for Students with Disabilities
Established in 2004 by OSEP to build capacity to improve school completion rates for students with disabilities
Committed to providing evidence-based technical assistance to help states design and implement effective dropout prevention programs
www.ndpc-sd.org

NDPC-SD Strategies
Identifying evidence-based dropout prevention interventions, programs, and practices
Producing evidence-based knowledge that is useful to school practitioners
Providing targeted technical assistance to states in a variety of formats
NDPC-SD Strategies
Establishing collaborative partnerships with TA&D network partners and other organizations to leverage resources and help states build coordinated systems that improve post-school outcomes
Disseminating dropout prevention information through multiple methods and efficient use of a variety of technologies

NDPC-SD Dropout PreventionIntervention Framework
© 2007 National Dropout Prevention Center for Students
with Disabilities at Clemson University – All rights reserved
LESSONS LEARNED- Causes
Problem behaviors coupled with academic difficulties or prior academic failures are key risk factors that are predictive of school dropout.
Repeated use of exclusionary discipline practices, such as suspension, has been identified as one of the major factors contributing to dropout.
High absenteeism and retention are serious risk factors for dropping out that can be monitored by schools.
Academic progress and school completion are not equally distributed across disability, income, or ethnicity.

LESSONS LEARNED- Consequences
Dropouts are more likely to be unemployed or employed in low-skilled, lower-paying positions.
Dropouts are more likely than high school graduates to need the support of living with parents in early adulthood, experience health problems, engage in criminal activities, and become dependent on welfare and other government programs.
Dropouts are more likely to commit crimes as compared to students who complete school. Three to five years after dropping out, the cumulative arrest rate for youth with SED is 73%.
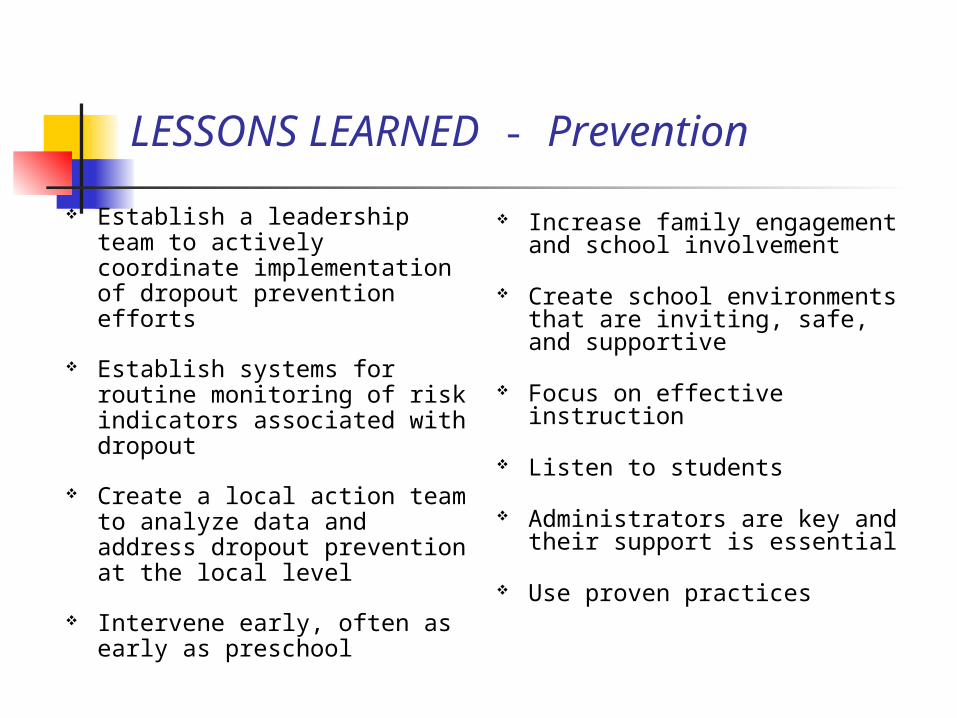
LESSONS LEARNED - Prevention
Establish a leadership team to actively coordinate implementation of dropout prevention efforts
Establish systems for routine monitoring of risk indicators associated with dropout
Create a local action team to analyze data and address dropout prevention at the local level
Intervene early, often as early as preschool
Increase family engagement and school involvement
Create school environments that are inviting, safe, and supportive
Focus on effective instruction
Listen to students
Administrators are key and their support is essential
Use proven practices
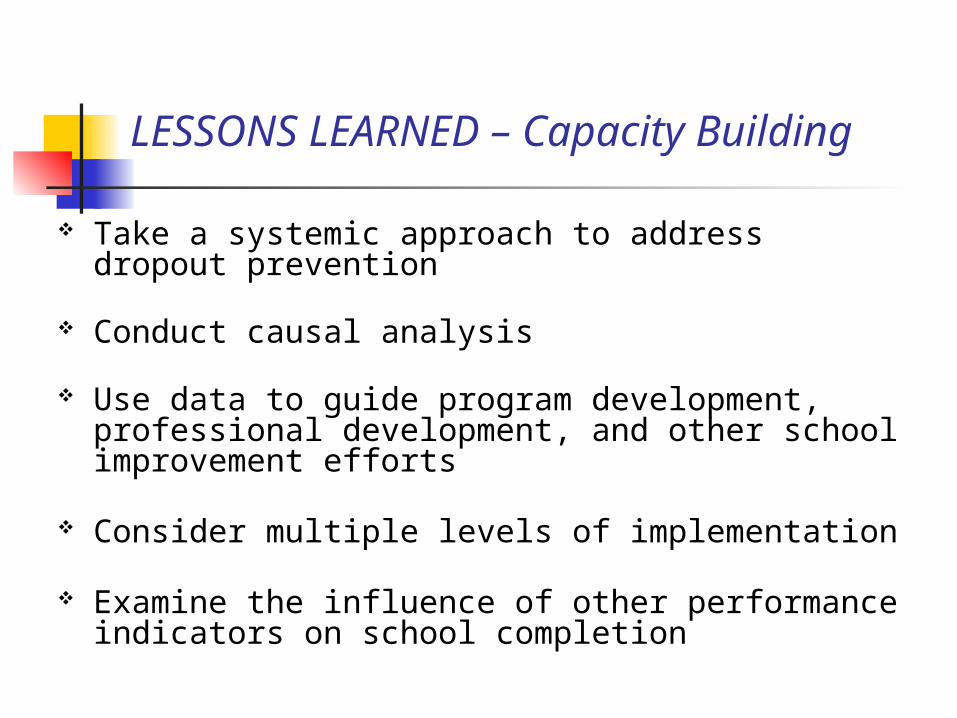
LESSONS LEARNED – Capacity Building
Take a systemic approach to address dropout prevention
Conduct causal analysis
Use data to guide program development, professional development, and other school improvement efforts
Consider multiple levels of implementation
Examine the influence of other performance indicators on school completion
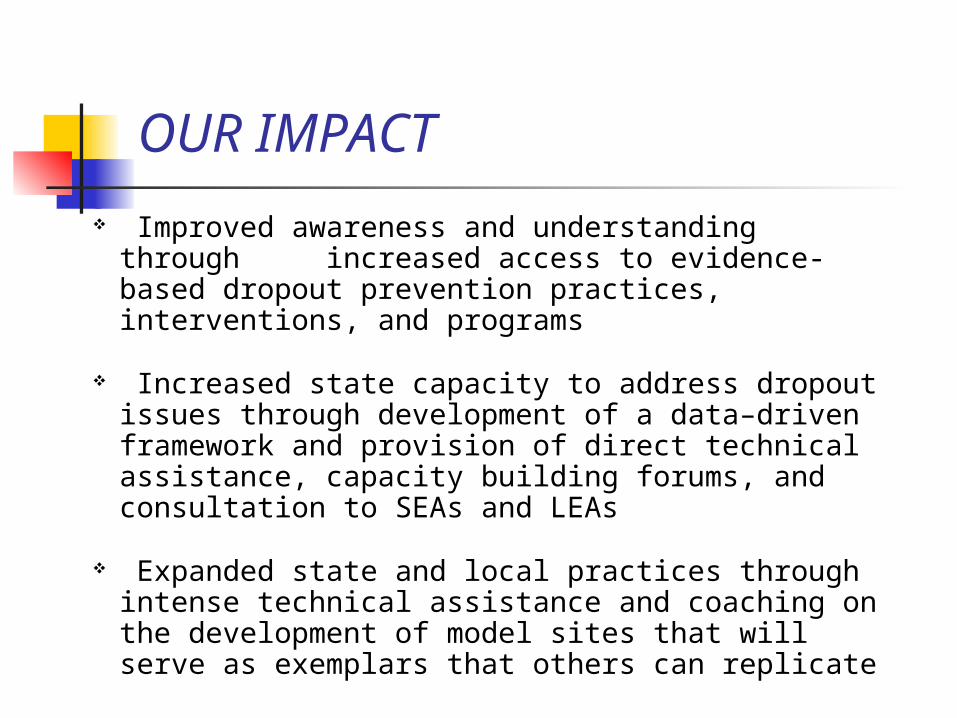
OUR IMPACT
Improved awareness and understanding through increased access to evidence-based dropout prevention practices, interventions, and programs
Increased state capacity to address dropout issues through development of a data–driven framework and provision of direct technical assistance, capacity building forums, and consultation to SEAs and LEAs
Expanded state and local practices through intense technical assistance and coaching on the development of model sites that will serve as exemplars that others can replicate
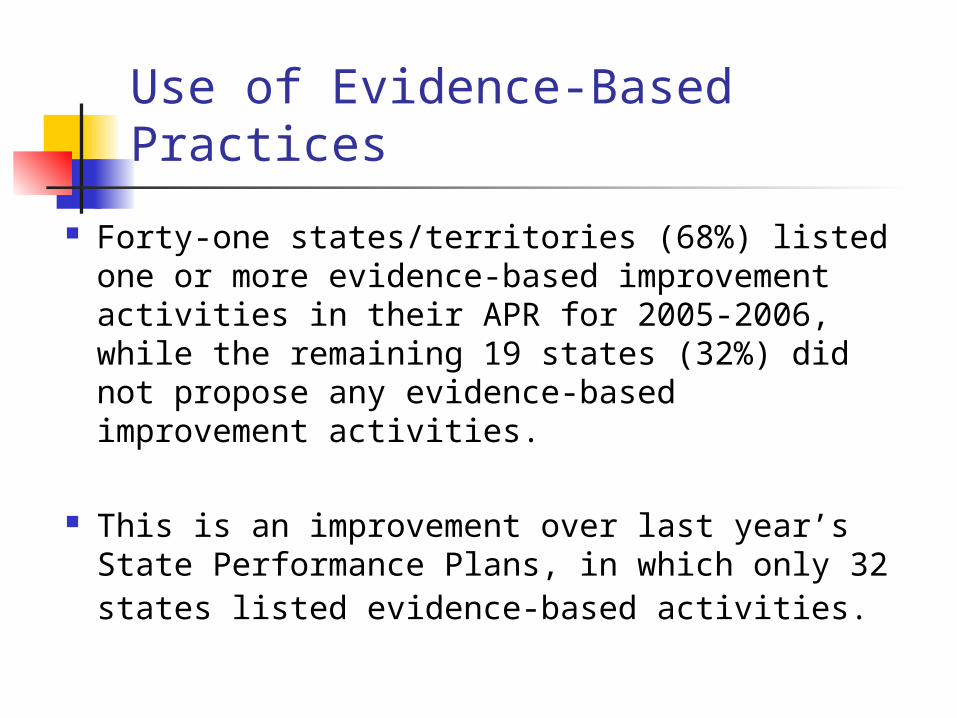
Use of Evidence-Based Practices
Forty-one states/territories (68%) listed one or more evidence-based improvement activities in their APR for 2005-2006, while the remaining 19 states (32%) did not propose any evidence-based improvement activities.
This is an improvement over last year’s State Performance Plans, in which only 32 states listed evidence-based activities.
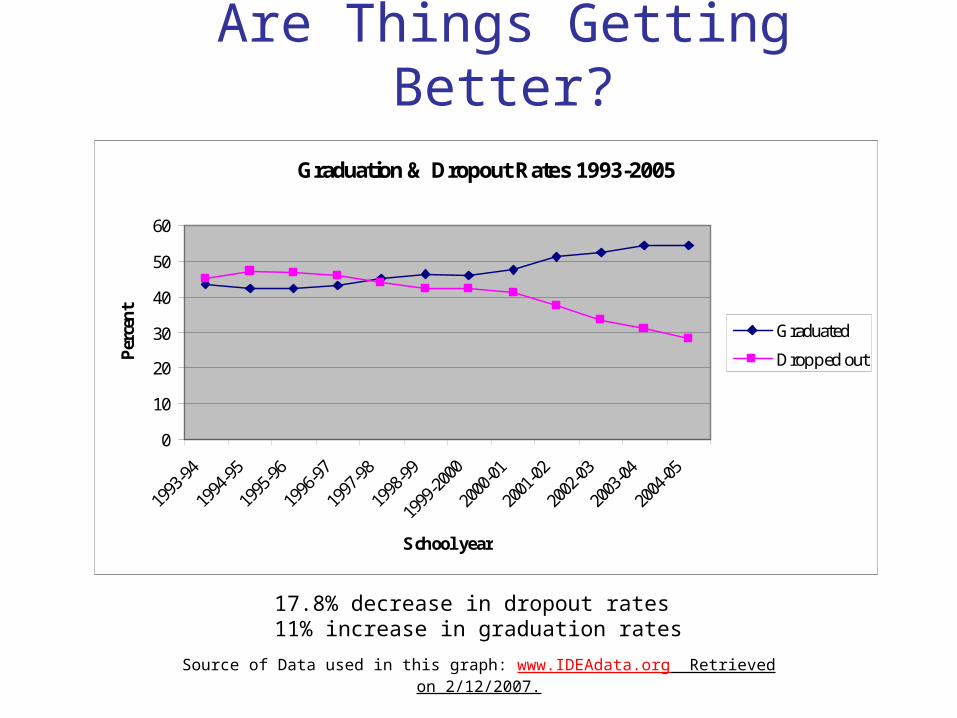
Are Things Getting Better?
Source of Data used in this graph: www.IDEAdata.org Retrieved on 2/12/2007.
17.8% decrease in dropout rates11% increase in graduation rates
Graduation & Dropout Rates 1993-2005
0
10
20
30
40
50
60
School year
Per
cen
t
Graduated
Dropped out
NSTTAC is a partnership focused on improving the lives of youth with disabilities and their families by helping them achieve their desired post-school outcomes.
NSTTAC’s purpose is to assist states to build capacity to support and improve transition planning, services, and outcomes for youth with disabilities.
Purpose
Mission –Three Components Generate knowledge Build capacity Disseminate information
Levels of Effort Some resources available to all sates Work with “selected states” to build their capacity Work with selected local sites within selected
states
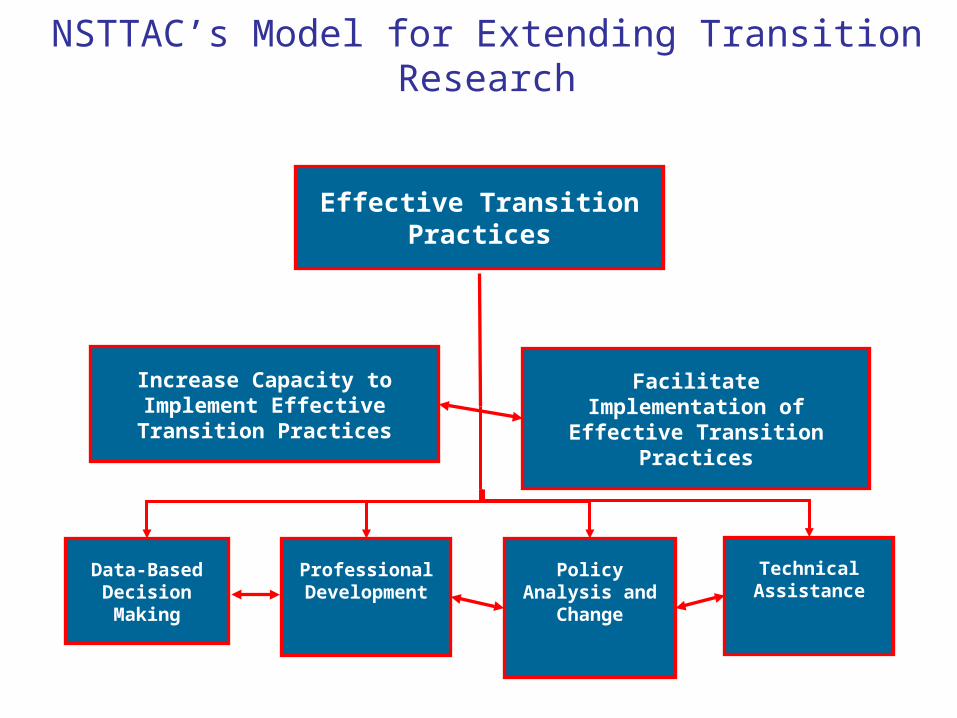
NSTTAC’s Model for Extending Transition Research
Effective Transition Practices
Increase Capacity to Implement Effective Transition Practices
Facilitate Implementation of Effective Transition
Practices
Data-Based Decision Making
Professional Development
Policy Analysis and
Change
Technical Assistance
Generate Knowledge: Literature Review
to determine the evidence-base for transition practices, disseminate information, and make recommendations to IES
primary audience is state and local transition personnel and researchers.
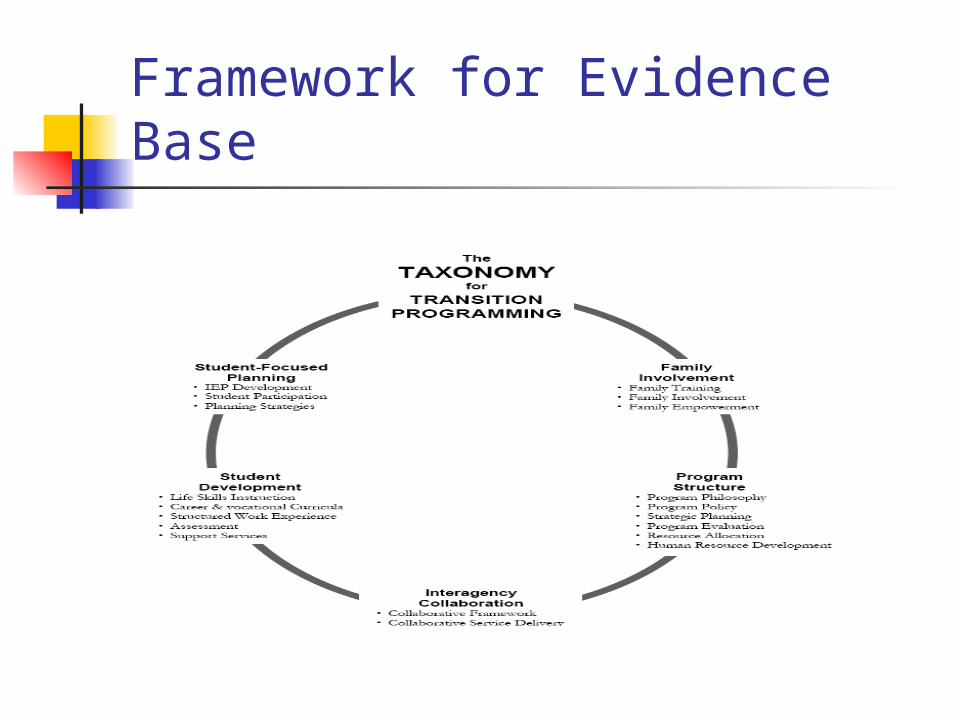
Framework for Evidence Base
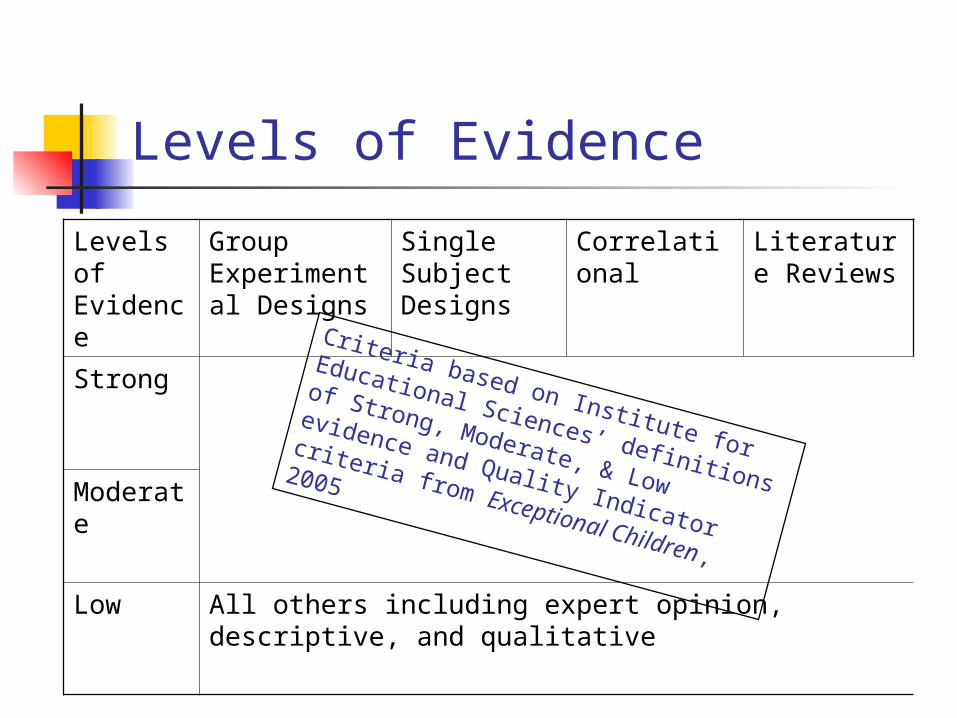
Levels of Evidence
Levels of Evidence
Group Experimental Designs
Single Subject Designs
Correlational
Literature Reviews
Strong
Moderate
Low All others including expert opinion, descriptive, and qualitative
Criteria based on Institute for
Educational Sciences’ definitions of
Strong, Moderate, & Low evidence and
Quality Indicator criteria from
Exceptional Children, 2005
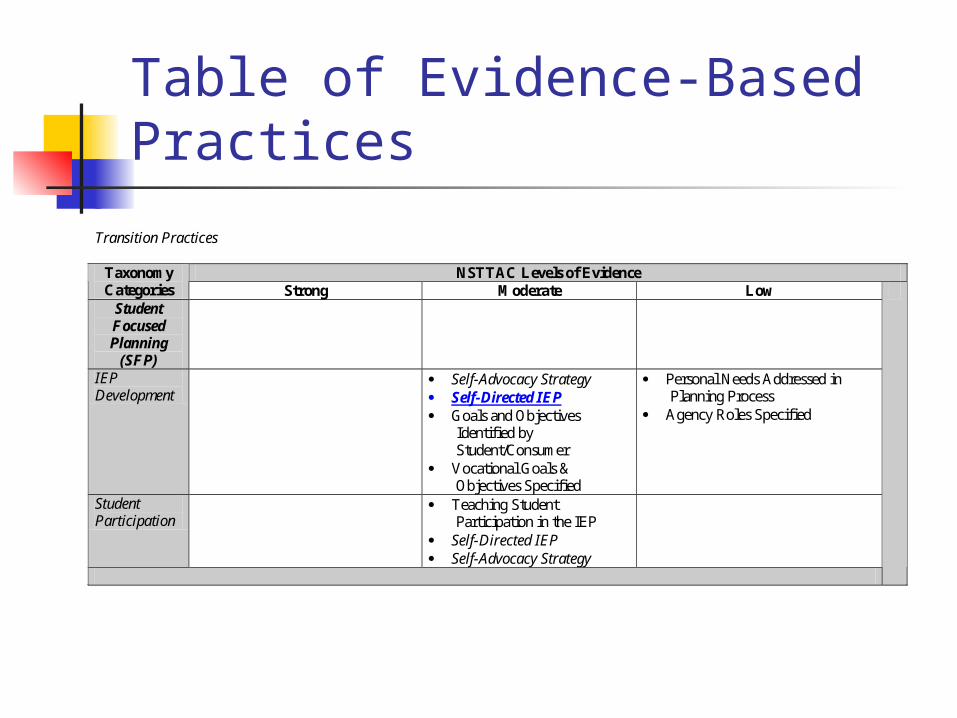
Table of Evidence-Based Practices
Transition Practices
NSTTAC Levels of Evidence Taxonomy Categories Strong Moderate Low
Student Focused Planning
(SFP)
IEP Development
Self-Advocacy Strategy Self-Directed IEP Goals and Objectives
Identified by Student/Consumer
Vocational Goals & Objectives Specified
Personal Needs Addressed in Planning Process
Agency Roles Specified
Student Participation
Teaching Student Participation in the IEP
Self-Directed IEP Self-Advocacy Strategy
Description of the PracticeSelf-Directed IEP:
What is the evidence?
What is the practice?
How has it been implemented?
With whom has it been implemented?
Where has it been implemented?
References:
Technical Assistance Available to All States
website semi-annual state planning institutes participation in “intensive” state institutes NSTTAC Notes teleconferences & webinars consultation national & regional events in collaboration
with partners linkages with other states’ transition
initiatives
Technical Assistance Available to NSTTAC
“Intensive” States 4 – 5 states chosen in partnership with OSEP Direct, on-going assistance Annual institute & follow-up cadre meetings Continuous progress monitoring Assistance with resource development Assistance in serving as “role models” for all
states Assistance helping selected local sites
implement their plans

Self-Determination Model
Modify Our Goals
Reflect on How and What We are Doing
Determine Our Strengths and Needs
Set Goals
Develop Plans and Implement
Identify and Seek Support
Assess Our Progress
Current Products
Indicator 13 Checklists & supporting products
Audio podcasts and PowerPoint presentations
Internet links to online secondary transition resources
NSTTAC Notes www.nsttac.org
Indicator 14 –Post-School Outcomes
Percent of youth who had IEPs, are no longer in secondary school and who are competitively employed, enrolled in some type of postsecondary school, or both, within one year of leaving high school.

WHY IS THIS HARD? Indicator #14 presents unique challenges to States
because
the young people to be included in this data collection are no longer “students” as they have left the public school system
How to find/contact individuals? Who is the best data source? Who is the most reliable data collector? Can outcome data be linked back to in-school data? Are the former student respondents representative of
the actual population?
HOW IS THIS USEFUL? Provide information on IDEA purpose at a
district and state level (employment/post-secondary enrollment) for programmatic improvement
Examine post-school outcomes linked to other Indicators (e.g., dropouts, diploma completion)
Examine post-school outcomes by demographic characteristics (e.g., gender ethnicity)
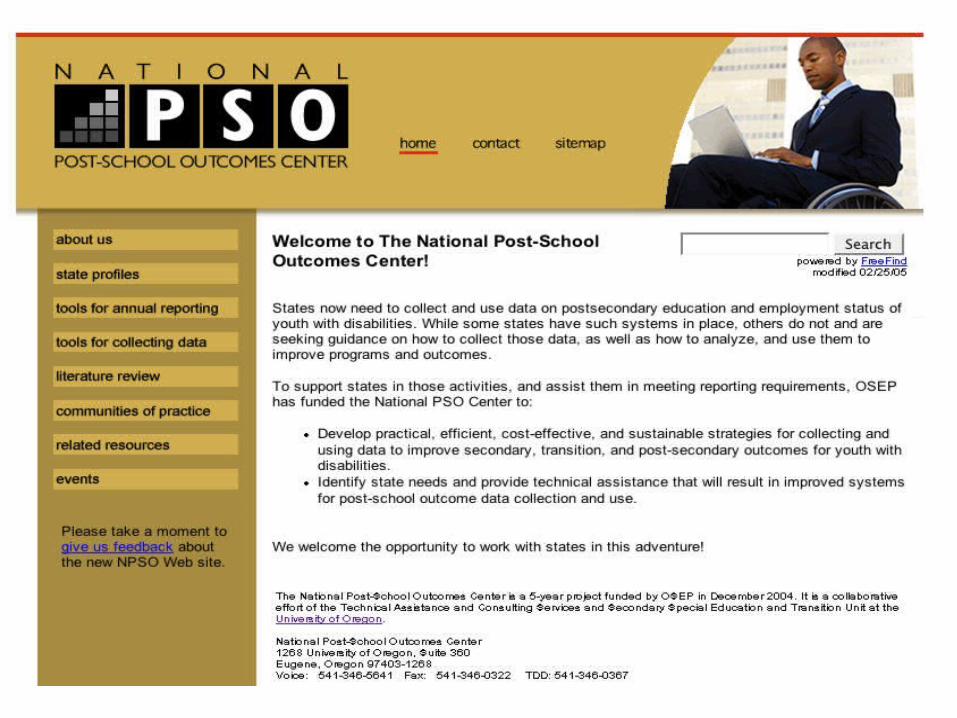
NPSO Mission
Assist states to develop rigorous, yet practical data collection systems to profile the post-school transition experiences of adolescents with disabilities as they enter adult life.
Results used for national, state, and local reporting and – most importantly – to improve transition services.
NPSO Strategies
Identifying evidence-based data collection, analysis, & reporting strategies to collect and use post-school outcome data
Producing products and tools states & localities can use
Providing technical assistance to states (information, state-to-state links, phone and on-site consultation)
NPSO Strategies
Establishing collaborative partnerships with TA&D network partners (e.g., RRCs) and other organizations to leverage resources and help states build coordinated systems that improve post-school outcomes

Technical Assistance
Targeted publications User-friendly Web site Community of Practice & listserve National, Regional, & State Conferences
in conjunction with other partners Skill building workshops Individual TA and Development Support

What’s Coordinated TA?
Three centers working together to help meet state needs
Aligning our work across connecting indicators to improve what we do
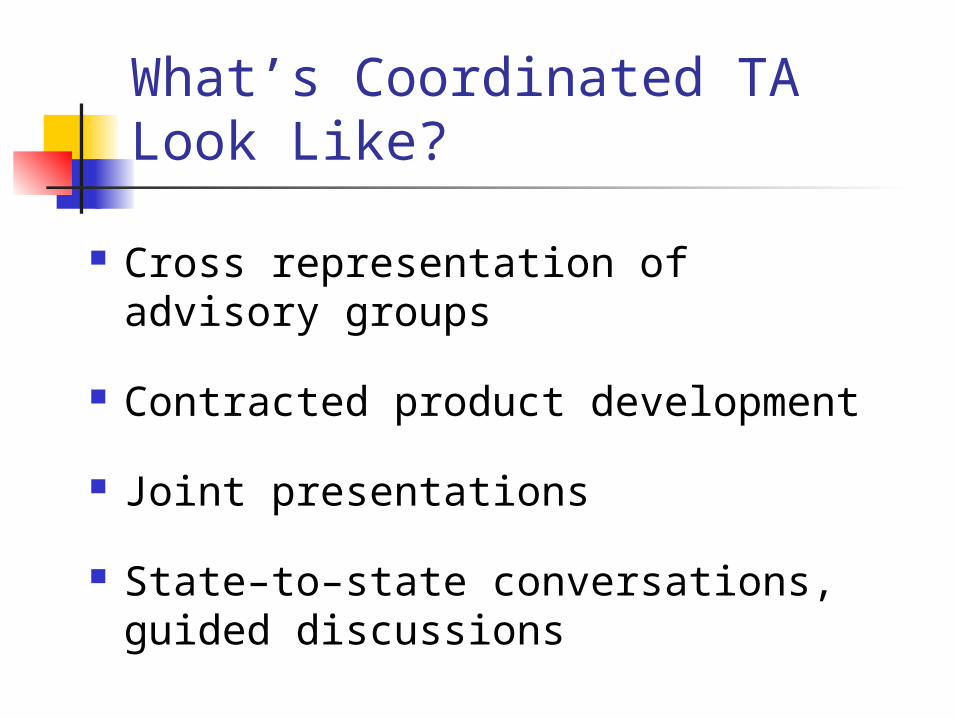
What’s Coordinated TA Look Like?
Cross representation of advisory groups
Contracted product development
Joint presentations
State–to–state conversations, guided discussions

Examples of Collaborative Work

Discussion Focus
Each State’s Activities
Data collection
Data reporting, sharing information
Using their data to improve performance
Ideas For “Improving”
Adopting different methods
Dissemination strategies
Capacity building needs and approaches
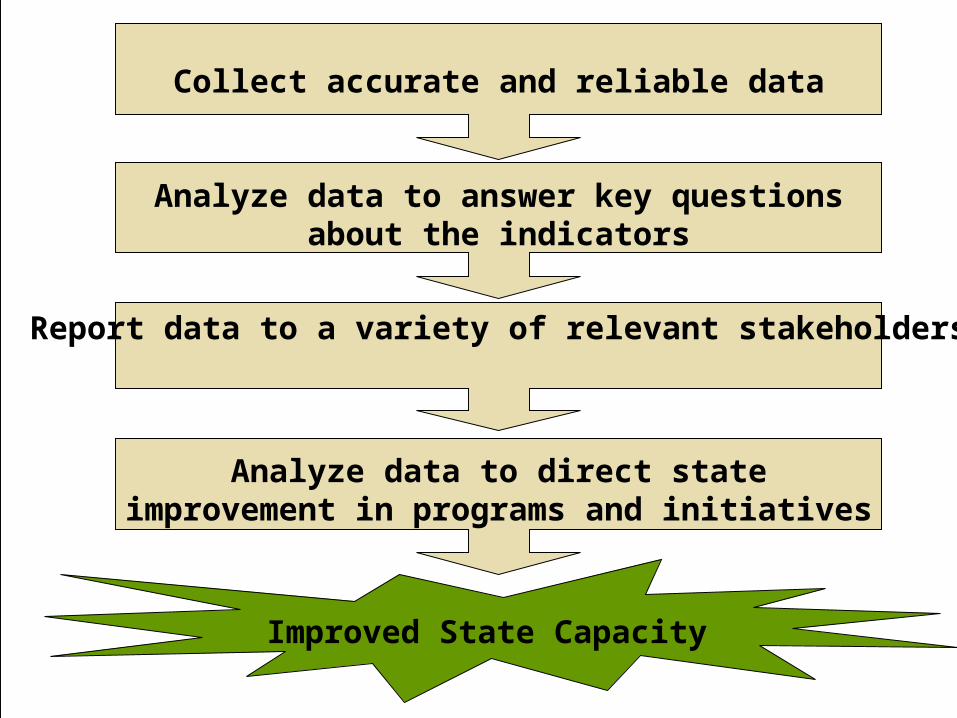
Analyze data to answer key questions about the indicators
Collect accurate and reliable data
Analyze data to direct state improvement in programs and initiatives
Report data to a variety of relevant stakeholders
Improved State Capacity

What’s Next?
OSERS Transition Initiative
Continue collaborative presentations
Design regional collaborative events around Indicators 1, 2, 13 and 14
Enhance coordination with other centers

Questions

Contact Information
National Dropout Prevention Center for Students with Disabilities Dr. Loujeania Williams Bost, Director
[email protected] National Secondary Transition Technical Assistance Center
Dr. David Test, Co-Principal Investigator [email protected]
Dr. Larry Kortering, Co-Principal Investigator [email protected]
National Post-School Outcomes Center Deanne Unruh, Ph.D., Knowledge Development
Associate & Internal Evaluator [email protected]
Show and Tell Time
Please divide into 3 groups that will rotate from center to center for small group presentations on each of the TA&D Centers
Related Documents