2015 National Autism Indicators Report Transition into Young Adulthood Life Course Outcomes Research Program A.J. DREXEL AUTISM INSTITUTE, DREXEL UNIVERSITY

Welcome message from author
This document is posted to help you gain knowledge. Please leave a comment to let me know what you think about it! Share it to your friends and learn new things together.
Transcript
2015
National Autism Indicators Report Transition into Young Adulthood
Life Course OutcomesResearch ProgramA.J. DREXEL AUTISM INSTITUTE, DREXEL UNIVERSITY


Life Course OutcomesResearch ProgramA.J. DREXEL AUTISM INSTITUTE, DREXEL UNIVERSITY
MissionThe A.J. Drexel Autism Institute is the first research organization built around a public health science approach to understanding and addressing the challenges of autism spectrum disorders (ASDs) across the lifespan.
The Autism Institute’s Life Course Outcomes Research Program (LCO) envisions a future where people on the autism spectrum are valued as contributing members of our communities who have roles to play and dreams to pursue. The LCO Research Program is building a base of knowledge about the things other than clinical interventions that promote positive outcomes for people on the autism spectrum and their families and communities.
For more information about us, please visit our website: drexel.edu/autisminstitute/LCO/
How to cite this report
Roux, Anne M., Shattuck, Paul T., Rast, Jessica E., Rava, Julianna A., and Anderson, Kristy, A. National Autism Indicators Report: Transition into Young Adulthood. Philadelphia, PA: Life Course Outcomes Research Program, A.J. Drexel Autism Institute, Drexel University, 2015.
©2015 Drexel University and the authors. All rights reserved. The publication may be copied and disseminated in part or whole as long as appropriate acknowledgement and citation is given.


National Autism Indicators Report: Transition into Young Adulthood 2015 | drexel.edu/autisminstitute/LCO/ | 5
A publication of A.J. Drexel Autism Institute’s Life Course Outcomes Research Program, Drexel University
Program Director Paul T. Shattuck, PhD
Authors Anne M. Roux, MPH, MA; Paul T. Shattuck, PhD, MSSW; Jessica E. Rast, MPH; Julianna A. Rava, BA; Kristy A. Anderson, MSW.
Acknowledgements
Graphic Design: Lisa Cain Data Visualization: Stephanie EvergreenEditing: Christina Hernandez Sherwood
Life Course Outcomes staff contributors:Amy D. Edwards, EdD; Angel Hogan, BA; and Collette Sosnowy, PhD
Report Advisory Panel
o Connie Anderson, PhD, Director, Post Baccalaureate Certificate Program in Autism Studies, Towson University
o Jennifer Bogin, MSed, BCBA, Director of Autism Services, Division of Autism Spectrum Services, State of Connecticut
o David Kearon, Director of Adult Services, Autism Speakso Angela Lello, MPAff, Director of Housing and Community Living, Autism Speakso Christina Nicolaidis, Co-Director, Academic Autism Spectrum Partnership in Research and Education
(AASPIRE), Professor and Senior Scholar in Social Determinants of Health - Portland State University, Adjunct Associate Professor - Oregon Health & Science University
o Merope Pavlides, Founder, Autism After 16o Denise D. Resnik, Co-Founder, Southwest Autism Research & Resource Center (SARRC), Founder,
First Placeo Chloe Rothschild, Autistic Global Initiative, Young Adult Leadero Stephen Shore, PhD, Assistant Professor of Special Education, Adelphi Universityo Lydia Wayman, Autistic Global Initiative, Young Adult Leader
Funding Acknowledgement: This report was produced through a generous private donation to the Life Course Outcomes Research Program.
This project was also supported by the Health Resources and Services Administration (HRSA) of the U.S. Department of Health and Human Services (HHS) under grant number, UA6MC27364, and title, Health Care Transitions Research Network for Youth and Young Adults with Autism Spectrum Disorders for the grant amount of $900,000. This information or content and conclusions are those of the author and should not be construed as the official position or policy of, nor should any endorsements be inferred by HRSA, HHS or the U.S. Government.
National Autism Indicators Report Transition into Young Adulthood2015
6 | National Autism Indicators Report: Transition into Young Adulthood 2015
Letter from the Program Director Paul T. Shattuck, PhD
The Importance of Indicators
Speedometer. Odometer. Gas gauge…
If you’ve ever driven a car then you already know what an indicator is. The speedometer indicates how fast you’re going. The odometer indicates how far you’ve gone. The gas gauge indicates how much fuel you’ve got. A driver relies on information from these indicators to help obey the speed limit, measure progress to reaching a destination, and know when more gas is needed to keep the car running.
Organizations, communities, states and countries also need indicators. Some familiar ones include local crime statistics, the number of accident-free days on a big construction site, and the national unemployment rate. Indicators help us know the scope and magnitude of problems, whether we have enough resources to fix a problem, and whether we are making progress toward solving problems.
When it comes to understanding how well our nation is helping youth affected by autism, our situation is like driving a car through the fog with no dashboard. We know we’re moving. We can feel the gas pedal under our foot, the steering wheel in our hands. But we do not have many indicators to tell us how fast we are going, whether we’re getting close to our goals, or what kind of mileage we are getting from the resources fueling our trip.
Indicators are also useful in the quest to help people on the autism spectrum thrive to the best of their abilities and enjoy a high quality of life. Some approaches to intervention, like applied behavior analysis, are very effective at creating indicators of progress and goal attainment for individuals. Some (but not all) organizations measure indicators that track the quality and impact of the services they provide. Unfortunately, we have very few useful indicators at city, county, school district, state, or national levels.
One thing we discovered early in this project is how little data is available to create meaningful indicators related to autism. The list of indicators we wish we had is a lot longer than what we could create for this first report.
Chinese philosopher Lao Tzu said the journey of a thousand miles begins with one step. We have a long journey ahead to create useful and high quality autism indicators for organizations and our nation. This report is a first step, not the final destination. Please forgive the shortcomings and gaps.
Please also consider supporting our ability to continue this journey. Generous donations from people like you have helped us get this far. We need your help to continue building and improving our ability to measure unmet needs and whether we are succeeding in our quest to support better outcomes.
Paul T. Shattuck
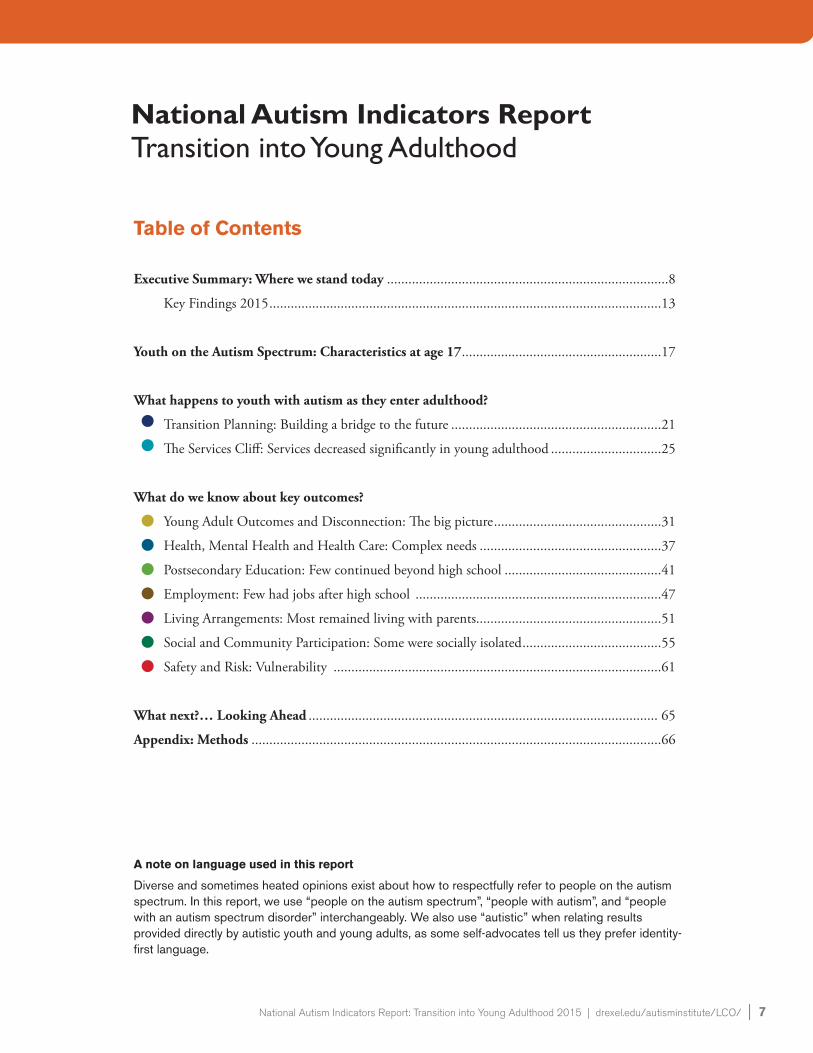
Table of Contents
Executive Summary: Where we stand today ...............................................................................8
Key Findings 2015 ..............................................................................................................13
Youth on the Autism Spectrum: Characteristics at age 17 ........................................................17
What happens to youth with autism as they enter adulthood?
Transition Planning: Building a bridge to the future ...........................................................21
The Services Cliff: Services decreased significantly in young adulthood ...............................25
What do we know about key outcomes?
Young Adult Outcomes and Disconnection: The big picture ...............................................31
Health, Mental Health and Health Care: Complex needs ...................................................37
Postsecondary Education: Few continued beyond high school ............................................41
Employment: Few had jobs after high school .....................................................................47
Living Arrangements: Most remained living with parents....................................................51
Social and Community Participation: Some were socially isolated .......................................55
Safety and Risk: Vulnerability ............................................................................................61
What next?… Looking Ahead .................................................................................................. 65
Appendix: Methods ...................................................................................................................66
National Autism Indicators Report Transition into Young Adulthood
A note on language used in this report
Diverse and sometimes heated opinions exist about how to respectfully refer to people on the autism spectrum. In this report, we use “people on the autism spectrum”, “people with autism”, and “people with an autism spectrum disorder” interchangeably. We also use “autistic” when relating results provided directly by autistic youth and young adults, as some self-advocates tell us they prefer identity-first language.
National Autism Indicators Report: Transition into Young Adulthood 2015 | drexel.edu/autisminstitute/LCO/ | 7

8 | National Autism Indicators Report: Transition into Young Adulthood 2015 | Executive Summary
Executive Summary National Autism Indicators Report: Transition into Young Adulthood - 2015
Where we stand todayYoung adults with autism have a difficult time following high school for almost any outcome you choose - working, continuing school, living independently, socializing and participating in the community, and staying healthy and safe. To complicate matters, many of these youth begin their journey into adulthood by stepping off a services cliff. Access to needed supports and services drops off dramatically after high school – with too many having no help at all.
The issues
Lifelong service and support needs Autism spectrum disorder (ASD) is a lifelong neurodevelopmental disorder. The effects of autism on cognition, emotional regulation, language and social communication, and relationship skills are present across the lifespan.
No two people on the autism spectrum are the same. The expression of characteristics, patterns of strengths and challenges, and severity of impairments differs widely across individuals on the autism spectrum. As a result, support and service needs vary greatly and continually change as individuals with autism age.
A growing demand for solutions
Autism spectrum disorder was once considered rare. The definition of autism has changed over several decades, and people with less severity of impairment now qualify for a diagnosis. Today, public awareness and early detection are more widespread, and it is hard to find a person who doesn’t know someone with autism. One in 68 children today has an autism spectrum disorder according to the most recent report from the Centers for Disease Control and Prevention.1
Children grow up, and autism does not end when children reach adulthood. About 50,000 youth with autism exit high school each year in the U.S. As the numbers continue to increase, so do the stories of pressing challenges families face as their loved ones enter adulthood – the developmental stage where the majority of life unfolds.
About a half million youth with autism will enter adulthood over the next decade. Most will continue to need some type of services or supports - even among the most cognitively able. Some will enter college. Many will seek employment. Some will not have the skills to do either.
Falling off a cliff
Parents often dread the transition from high school into adulthood, which is sometimes described as falling off a cliff. Here’s why.
Many high school students on the autism spectrum get help through special education. Each student has a team that decides what services are needed to prepare them for young adulthood. Federal law requires schools to offer these services.
Then, following the last day of high school, the legal mandate for help suddenly ends. There is no federal requirement for providing supportive services in adulthood. Youth and their families must apply for adult services that use different rules than in special education. Eligibility for many special supports in adulthood requires having an intellectual disability. However, the majority of today’s youth with ASD do not have an intellectual disability, although their communication and social impairments may significantly interfere with their ability to get a job, go to school, and socialize.
Transition services and supports are critical for guiding youth successfully toward their goals during this time of instability. Sometimes, though, help is not available. This leaves many families struggling to navigate on their own and results in too many youth failing to launch successfully into adulthood.
The creation of effective and affordable programming tailored to meet the needs of the 50,000 individuals with autism who leave high school each year - each with unique strengths, interests, and challenges - is an urgent task facing our society. In our previous work we found that nearly 40% of these youth do not receive any mental health counseling, speech therapy, case management, or medical services related to their disability once they reach early adulthood.2 Those from lower income households were even less likely to receive services.

Services for young people on the autism spectrum often seem least available when they are most needed. This is why parents feel like their children are about to fall off a cliff.
Vulnerability of transition-age youth
The years following high school completion are an “in-between age,” as youth are past some of the bumps of adolescence but are not yet mature adults. Some call this emerging adulthood – a period filled with changes and increased demands for youth to function on their own and advocate for their own needs.3
Decades ago, typically developing young adults would predictably move out of their parent’s house, get married, and establish a career in the years following high school. But over recent decades, these milestones have tended to happen later and not in a predictable order.4 Signs of independence now have less to do with moving out of a parent’s house and more to do with making decisions, managing finances, and taking on more personal responsibility.
Entrance into adulthood is a vulnerable time, especially for young adults on the autism spectrum. Even as they continue to experience issues with communication, social skills, behavioral challenges, organization, decision-making, planning, and co-occurring mental health problems, these youth are expected to move into the world of adult work, continued education, and new living situations – often without adequate preparation or help.
Young adults – and their families – must simultaneously adapt to new adult roles and responsibilities, new service systems, and changes in day-to-day schedules. This can be particularly challenging among those who rely on having a predictable routine and are used to having many supports which are suddenly no longer available in the world of adulthood.
As you will read in the pages ahead, over one-third of young adults with autism do not transition into either employment or continued education between high school and their early 20s– a problem that poses both financial and social costs to society, families, and individual well-being.
It is clear that we are not succeeding as a nation in helping autistic adults to thrive to the best of their abilities and attain a high quality of life. It is time for new approaches.
The critical need for information
The chapters ahead describe the small number of indicators we have about the transition into young adulthood. Unfortunately, these indicators don’t tell us why outcomes are worse for those with autism compared to youth with other disabilities. But this report is an important first step toward addressing the gaps in what we know, as we work to build an evidence base about how to help achieve better outcomes.
National Autism Indicators Report: Transition into Young Adulthood 2015 | drexel.edu/autisminstitute/LCO/ | 9
10 | National Autism Indicators Report: Transition into Young Adulthood 2015 | Executive Summary
The charge
Many youth, families and organizations are struggling through questions like these. They need useful information to understand what the future holds and make decisions. Service providers and policy makers are pressured to understand and address unmet needs, plan and evaluate programs, and allocate resources. Grassroots organizations and leaders in the autism community need information to raise awareness about problems and build support for effective and affordable solutions.
This report is an almanac of currently available national indicators detailing the transition from adolescence to young adulthood. These findings set the stage for discovering whether the transition into young adulthood is improving over time. They also highlight where investments are needed to improve our ability to collect better data.
There are many topics we wish we could provide information about in this report. However, the story is limited by the scarcity
of national-level data. The databases we used to produce this report are the best currently available. But we still don’t have answers to many essential questions — particularly about physical health, mental health, and health care transitions.
Most alarming is that we still can’t precisely say what percentage of youth will need intensive levels of daily support versus relatively light amounts of support. Our current inability to clearly describe how many youth will need which types and amounts of support makes it difficult to plan ahead.
This publication offers baseline information in a clearly communicated, widely accessible format. Our compilation of available indicators represents a critical step forward in expanding the conversation about what we know, and what we need to know, to improve quality of life for young adults on the autism spectrum.
What will happen after I finish high school?How can I help my son have a good life as an adult?How can our agency help the growing numbers of adults on the autism spectrum?What are the needs of this growing population?
Sources and analysis of national autism data
This report is based primarily on our analyses of data from the National Longitudinal Transition Study-2 (NLTS2). The NLTS2 was a national study begun in 2000-2001 that captured the experiences of youth who received special education from the time they were in high school into adulthood. The last wave of data collection in 2009, when youth were 21-25 years of age, is the best currently available source of national data about the experiences and outcomes of youth with disabilities, including autism.
We also used data from the 2011 Survey of Pathways to Diagnosis and Services (commonly referred to as Pathways) - a telephone survey sponsored by The National Institute of Mental Health as a follow-up to the 2009-2010 National Survey of Children with Special Health Care Needs (NS-CSHCN). The Pathways survey sought to better understand the health care and service needs and experiences of children with a variety of physical, developmental, mental and behavioral disorders at ages 6-17 years. We used Pathways data to examine mental health and health care
experiences of adolescents on the autism spectrum at 15-17 years.For further information about these surveys, and our analyses, see Appendix - Methods.
The estimates in this report may be slightly different from estimates found in some of our published scientific articles. These differences do not represent errors in reporting, but rather, variation in analytical methods such as how we handled missing data. As in our scientific articles, the outcomes figures in this report are primarily derived from the NLTS2 and generalize to all U.S. youth who were ages 13-16 and enrolled in special education at the study’s start in 2001.
Pros and cons of survey data
Surveys can collect information from a large number of respondents. The surveys used in this report are rich sources of information about youth and young adults on the autism spectrum.
However, the information surveys provide is limited to what questions were included in the survey and how they were asked. For example, it is useful to know that a significant portion of people said it required great effort to find services, but we are often left without knowing exactly what obstacles people faced and what helped some to eventually find what they needed – because the survey did not ask those questions.
The NLTS2 had important limitations. The study only gathered data from youth who were getting special education services in 2000 when the study began. Students were counted as having autism if they were in the autism special education eligibility category. This means our findings are not able to tell the story of youth with autism who were not in special education or who were served through other eligibility categories like intellectual disability. We suspect NLTS2 data under-represents youth with milder forms of autism who sometimes are not enrolled in special education – and thus were not included in the NLTS2 sample.
Understanding outcomes for groups
We report on outcomes of young adults in the areas of transition planning, services, health and mental health, postsecondary education, employment, living arrangements, social and community participation, and safety and risk. In each chapter we presented information on a main outcome, such as whether people had ever had a job during their early 20s. We then broke down the main outcomes by household income, conversational ability, and race/ethnicity and included graphs to display differences across groups. In some chapters, we also broke down outcomes by additional characteristics that were relevant for that topic. Breaking down outcomes by groups helps identify whether some need additional help.
The body of research on health disparities indicates that some groups are at greater risk for less positive outcomes based on historical economic and racial disadvantages, even though there is no biological reason to expect performance to differ by these characteristics. Our prior work has found inconsistent disparities in outcomes based on race/ethnicity.
We reported on the most frequently occurring race/ethnicity categories. People may have been counted in more than one category, for example, if they identified as both Hispanic and black. Similar to most nationally representative surveys, the amount of data available about people from racial and ethnic groups who don’t occur as frequently in the U.S. were combined into an Other category. In this report the Other group includes those who were Asian/Pacific Islander, American Indian/Alaska Native, other, and multiple races.
Disability comparison groups
We also looked to see how young adults on the autism spectrum fared compared to their peers who received special education services for other types of disabilities. The disability comparison groups were: learning disability, speech-language impairment, intellectual disability, and emotional disturbance. We selected these groups because they shared some of the same impairments (for example, communication difficulties) seen in students with autism spectrum disorder.
Youth and young adult voices
A frequently neglected source of information about the transition into young adulthood is autistic youth and young adults themselves. Their valuable perspectives are largely missing from current transition research.
Some high school students and young adults were capable of responding on their own to NLTS2 survey questions about their lives rather than parents responding for them. We refer to this group as self-responders throughout this report in sections marked In Their own Voices.
The NLTS2 collected responses to questions from youth in their late teens and early twenties when possible. Parents were asked whether the youth was capable of answering questions
about school, social activities, feelings, and jobs. If parents agreed and gave permission (in cases where youth were minors), attempts were made to contact the youth by phone - or by mail questionnaire (in cases where youth had significant communication problems).
What data came directly from youth and young adults?
We examined youth involvement in transition planning when they were 17 years old (See Transition Planning). We also looked at what young adults believed about the quality of their lives (See Young Adult Outcomes and Disconnection), how safe they felt and their behavioral risks (See Safety and Risk).
National Autism Indicators Report: Transition into Young Adulthood 2015 | drexel.edu/autisminstitute/LCO/ | 11

12 | National Autism Indicators Report: Transition into Young Adulthood 2015 | Executive Summary
About self-responders
Generally, youth in the NLTS2 who were able to respond for themselves tended to have higher functional abilities, better communication skills, and fewer services.5 Likewise, we found that self-responders with autism had higher functional and communication abilities than those who were not able to respond for themselves. Therefore, their responses should be interpreted as representing only a subset of people on the autism spectrum. For questions asked of youth when they were in high school, self-responders comprised 23% of all autistic teens at that point in time in the study. For questions asked of young adults in their 20s, self-responders comprised 38% of all autistic adults in the study. For more information on autistic self-responders, see Youth on the Autism Spectrum.
References
1. CDC. (2014). Prevalence of autism spectrum disorders among children aged 8 years: autism and developmental disabilities monitoring network, 11 sites, United States, 2010. MMWR Surveillance Summaries 63(2): 1-22.
2. Shattuck PT, Wagner M, Narendorf S, Sterzing P, and Hensley M. (2011). Post-high school service use among young adults with an autism spectrum disorder. Archives of Pediatric and Adolescent Medicine 165(2): 141-146.
3. Arnett JJ. (2000). Emerging adulthood: A theory of development from the late teens through the twenties. American Psychologist 55(5): 469-480.
4. Settersten RA Jr, and Ray B. (2010). What’s going on with young people today? The long and twisting path to adulthood. The Future of Children 20(1): 1550-1558.
5. Wagner M, Newman L, Cameto R, Levine P, and Marder C. (2007). Perceptions and expectations of youth with disabilities. A special topic report of findings from the National Longitudinal Transition Study-2 (NLTS2) (NCSER 2007-3006). Menlo Park, CA: SRI International.

Key Findings National Autism Indicators Report: Transition into Young Adulthood – 2015
National Autism Indicators Report: Transition into Young Adulthood 2015 | drexel.edu/autisminstitute/LCO/ | 13
We used federally funded national surveys to study the experiences and outcomes of youth on the autism spectrum during their transition into adulthood across a variety of topics. We summarize each issue below and present the top level findings of our analyses. Detailed information about each of these key findings can be found in the chapters that appear later in this report.
Transition Planning
In life, planning for major events does not ensure success but generally improves the likelihood that things will turn out as intended. This is why federal special education law requires every student who has an Individualized Education Program (IEP) to have a transition plan that supports postsecondary education, employment and independent living skills when appropriate.
Our key findings:
• 58% of youth with autism had a transition plan in place by the federally required age according to special education teachers.
• 60% of parents participated in transition planning. Over 80% felt the planning was useful.
• One-third of the group of autistic youth who were capable of responding to the survey said they wanted to be more involved in transition planning.
The Services Cliff
Autism does not end when children reach adulthood. Most will continue to need some type of services or supports - even among those who are the most cognitively able. When special education services end, many do not qualify for adult services. Families often refer to this as “falling off a cliff” — referring to the dramatic decline in access to services during the transition to adulthood.
Our key findings:
• During high school, over half of youth received speech-language therapy, occupational therapy, social work, case management, transportation and/or personal assistant services.
• However, receipt of these services decreased dramatically for youth between high school and their early 20s.
• Approximately 26% of young adults on the autism spectrum received no services – services which could help them become employed, continue their education, or live more independently.
• 28% of young adults who were not employed and also not attending higher education had no services.

14 | National Autism Indicators Report: Transition into Young Adulthood 2015 | Key Findings
Adult Outcomes and Disconnection
How we live, work and play are all connected. The various aspects of our adult lives don’t happen one at a time, so it is vital to examine outcomes together. When youth do not get a job or continue their education after high school, they are referred to as disconnected.
Our key findings:
• Over one-third of young adults were disconnected during their early 20s, meaning they never got a job or continued education after high school.
• Young adults on the autism spectrum had far higher rates of disconnection than their peers with other disabilities. Less than 8% of young adults with a learning disability, emotional disturbance, or speech-language impairment were disconnected, compared to 37% of those with autism.
Health, Mental Health and Health Care
It is rare to find youth on the autism spectrum who are only dealing with the challenges of autism. In most cases, these youth have at least one additional health or mental health condition. Dealing with these challenges complicates the transition into adulthood.
Our key findings:
• 60% of youth had at least two health or mental health conditions in addition to autism spectrum disorder.
• Three-quarters of youth on the autism spectrum took at least one kind of prescription medication on a regular basis for any type of health or mental health issue.
• Nearly all had health insurance, and over 75% received needed treatments and services.
• One in three parents said their pediatrician alerted them to the need to eventually change to an adult physician.
Postsecondary Education
Postsecondary education is a critical pathway to employment, and some with autism do go on to attend college or vocational/technical schools. Yet, compared to high school, there is a much smaller range of supports and services available to adults with autism in postsecondary school settings. Eligibility for many services requires students to formally document their status as having a disability.
Our key findings:
• 36% of young adults on the autism spectrum ever attended postsecondary education of any kind between high school and their early 20s, including 2-year or 4-year colleges or vocational education.
• Of those who continued their education, 70% attended a 2-year college at some point – making 2-year colleges the major gateway to continued education for this group.
• About 40% of those who disclosed their disability to their postsecondary school received accommodations or some type of help.
Key Findings (continued)
Employment
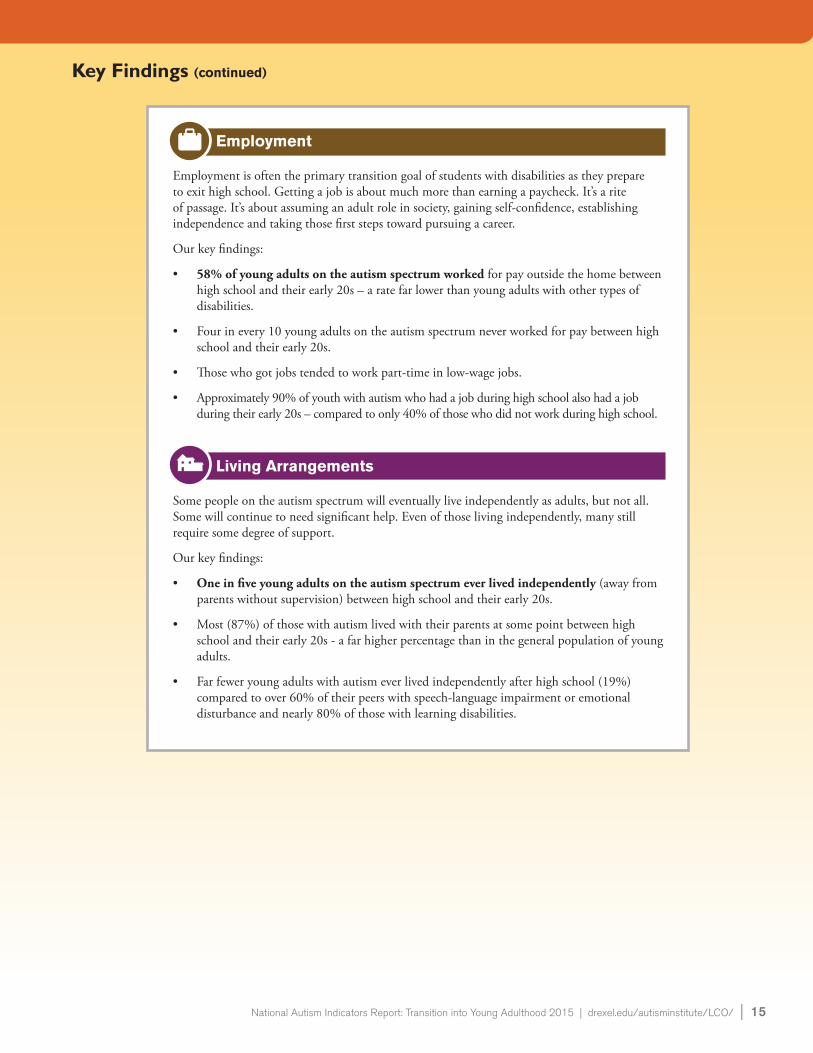
Employment is often the primary transition goal of students with disabilities as they prepare to exit high school. Getting a job is about much more than earning a paycheck. It’s a rite of passage. It’s about assuming an adult role in society, gaining self-confidence, establishing independence and taking those first steps toward pursuing a career.
Our key findings:
• 58% of young adults on the autism spectrum worked for pay outside the home between high school and their early 20s – a rate far lower than young adults with other types of disabilities.
• Four in every 10 young adults on the autism spectrum never worked for pay between high school and their early 20s.
• Those who got jobs tended to work part-time in low-wage jobs.
• Approximately 90% of youth with autism who had a job during high school also had a job during their early 20s – compared to only 40% of those who did not work during high school.
Living Arrangements
Some people on the autism spectrum will eventually live independently as adults, but not all. Some will continue to need significant help. Even of those living independently, many still require some degree of support.
Our key findings:
• One in five young adults on the autism spectrum ever lived independently (away from parents without supervision) between high school and their early 20s.
• Most (87%) of those with autism lived with their parents at some point between high school and their early 20s - a far higher percentage than in the general population of young adults.
• Far fewer young adults with autism ever lived independently after high school (19%) compared to over 60% of their peers with speech-language impairment or emotional disturbance and nearly 80% of those with learning disabilities.
Key Findings (continued)
National Autism Indicators Report: Transition into Young Adulthood 2015 | drexel.edu/autisminstitute/LCO/ | 15

Social and Community Participation
Difficulty with communication and social interaction can make community participation difficult and friendships hard to attain. When young adults on the autism spectrum are disconnected from work and continued schooling, sometimes opportunities for socialization, friendships, and community participation may be absent as well.
Our key findings:
• Approximately one in four young adults with autism were socially isolated. They never saw or talked with friends and were never invited to social activities within the past year.
• Young adults had lower rates of social isolation if they had better conversational skills, were from higher income households, or if they ever lived with parents after high school.
• Nearly one in three young adults had no community participation in the past year – no volunteer or community service activities, no lessons or classes outside of school, or no other community activities outside of school.
Safety and Risk
People with developmental disabilities are vulnerable to abuse of all kinds. In general, there is little published research on the topics of safety and risk for youth and young adults with autism. The behavior of people on the autism spectrum often differs from that of their peers and can easily be misinterpreted, placing them at risk.
Our key findings:
• Nearly half of youth on the autism spectrum were victims of bullying during high school.
• Over one-quarter (27%) of adolescents engaged in some type of wandering behavior in which they impulsively left a supervised situation, increasing their risk of becoming lost and going missing.
• Young adults reported very low rates of criminal justice involvement. Approximately 4% of young adults reported being stopped and questioned by police.
• Approximately one-quarter of autistic young adults who were able to self-report said they ever had sexual intercourse. Around one-third of these used protection or birth control.
16 | National Autism Indicators Report: Transition into Young Adulthood 2015 | Key Findings
Key Findings (continued)

Youth on the Autism Spectrum
Characteristics at age 17
If you’ve met one person with autism, then you’ve met one person with autism. Each and every person on the autism spectrum is unique in his or her strengths, challenges, life circumstances, and outcomes.
People of all races, ethnicities, income levels and geographic regions are diagnosed with autism. While all have challenges that affect their daily functioning, the severity level of those challenges is very different across individuals. The degree to which people have additional health and mental health disabilities also varies widely.
We examined the characteristics of youth on the autism spectrum at age 17.
How do we know?
We used data from the National Longitudinal Transition Study-2 (NLTS2) to study the demographics and impairment characteristics of youth on the autism spectrum when they were 17 years old.
26%
21%
30%
23%
11%
12%
23%
65%
85%
More than $75K
$50K to $75K
$25K to $50K
Up to $25K
Hispanic
Other race(s)
Black
White
Male
Percent of youth with autism
Race/ ethnicity
Household income
Source: National Longitudinal Transition Study-2
Most youth with autism in the NLTS2 were male, white, and from a wide range of household incomes.
National Autism Indicators Report: Transition into Young Adulthood 2015 | drexel.edu/autisminstitute/LCO/ | 17
Over half had great difficulty conversing.We looked at ability to understand language, communicate by any means and converse with others. Most youth (80%) were able to understand what people say to them with little to no trouble. Three-fourths were able to communicate by some means (not necessarily by speaking) with only a little trouble or no trouble. However, over half (51%) had difficulty with conversational skills.
Ability to understand and express thoughts is necessary for conversation but also requires social skills like knowing how to initiate, maintain, and conclude conversations. Of youth who were able to start a conversation, nearly 70% reported they sometimes or often started conversations rather than relying on others to initiate them.
16% 35%
22%
20%
36%
43%
60%
13%
35%
20%
A little trouble
A lot of trouble Not able to No trouble
Source: National Longitudinal Transition Study-2
Ability to understand and communicate exceeded youth's ability to converse.
Ability to understand
Ability to converse
Ability to communicate

18 | National Autism Indicators Report: Transition into Young Adulthood 2015 | Youth on the Autism Spectrum
36%
20%
26%
11%
19%
26%
15%
10%
18%
21%
14%
19%
28%
33%
45%
60%
A little trouble
A lot of trouble Not able to No trouble
Source: National Longitudinal Transition Study-2
Many could understand common signs and tell time. Half or fewer could count change and use the phone with little or no trouble.
Read and understand common signs
Count change
Tell time on a clock with hands
Look up a number in a phonebook and use the phone
Wide variation in functional skillsWe examined how well youth could perform various functional skills. Functional abilities varied depending on which skill we examined. In addition to the skills shown in the graph below, about 47% were able to get to places outside the home on their own pretty well or very well, while 40% were not able to navigate very well or at all, and 13% were not allowed to go places outside the home.

Behavioral challenges but emerging emotional regulationYouth on the autism spectrum often have difficulty with verbal communication and may express themselves through behaviors. These behaviors can be disruptive at times. Many parents reported that youth behaved in a way that sometimes or often caused problems for the family. Half of youth got into situations that sometimes or often resulted in trouble. However, most youth were sometimes or often able to control their temper when arguing with peers, end disagreements calmly, and receive criticism well.
Emerging social skills but difficulty making friendsOver one-third of youth had great difficulty with social skills. However, more than 60% of youth sometimes or often joined group activities independently. Almost 70% seemed to feel self-confident in social situations sometimes or often. Yet, over 40% never made friends easily. These findings suggest that young adults do develop some social skills yet remain somewhat isolated.
49%
23%
42%
60%
8%
17%
Often Sometimes Never
Source: National Longitudinal Transition Study-2
Many adolescents had behavioral challenges at home...
Behaves at home in a way that
causes problems Gets into situations that result in trouble
26%
16%
14%
58%
54%
45%
17%
31%
42%
Often Sometimes Never
Source: National Longitudinal Transition Study-2
...but many were able to exert self-control at least sometimes during disagreements and arguments.
Controls temper when arguing with peers other than sibling
Ends disagreements
calmly
Receives criticism well
43%
33%
37%
41%
47%
47%
17%
20%
16%
Often Sometimes Never
Source: National Longitudinal Transition Study-2
Over one-third of youth never joined group activities, felt self-confident socially or made friends easily.
Joins group activities without
being told to
Seems self-confident in social
situations
Makes friends easily
National Autism Indicators Report: Transition into Young Adulthood 2015 | drexel.edu/autisminstitute/LCO/ | 19

20 | National Autism Indicators Report: Transition into Young Adulthood 2015 | Youth on the Autism Spectrum
36%
13%
20%
5%
26%
7%
11%
19%
19%
26%
26%
15%
12%
10%
18%
25%
21%
17%
14%
19%
19%
16%
28%
44%
33%
53%
45%
63%
60%
82%
A little trouble
No trouble
Source: National Longitudinal Transition Study-2
Self-responders
All youth with autism
Self-responders
Self-responders
Self-responders
Self-responders could understand common signs, tell time, count change, and look up phone numbers more often than all youth on the autism spectrum.
All youth with autism
All youth with autism
All youth with autism
Can read and understand common signs
Can tell time on a clock with hands
Can count change
Can look up a number in a phonebook and use the phone
Not able to A lot of trouble
16% 35%
22%
22%
20%
9%
36%
55%
43%
43%
60%
65%
13%
21%
35%
54%
20%
26%
A little trouble A lot of trouble
Not able to No trouble
Source: National Longitudinal Transition Study-2
Self-responders were able to communicate, converse, and understand with little or no trouble more often than all youth on the autism spectrum.
Self-responders
Self-responders
Self-responders
All youth with autism
All youth with autism
All youth with autism
Ability to understand
Ability to communicate
Ability to converse
Differences in youth who responded to the survey on their own

Transition Planning: Special Education and Services
Building a bridge to the future
Transition matters. Imagine if a business tried to open additional stores without having a plan for expansion. Lack of planning would significantly increase the risk for failure. The same logic explains why federal special education law requires every student with an Individualized Education Program (IEP) to have a transition plan that supports achieving postsecondary education, employment and independent living upon leaving high school.
Despite federal requirements, transition planning does not always happen as specified. Only four in 10 special education students have plans that meet federal timelines and contain measurable goals.1 Data from the National Longitudinal Transition Study-2 (NLTS2) indicates that 58% of youth on the autism spectrum received transition planning by the required age (which was 14 at the time youth were surveyed, but is now 16 years).
Our key findings• 58% of youth with autism had a transition plan
in place by the federally required age according to special education teachers.
• 60% of parents participated in transition planning. Over 80% felt the planning was useful.
• One-third of the group of autistic youth who were capable of responding to the survey said they wanted to be more involved in transition planning.
58% of youth with autism had a transition plan by the required age according to their teachers.
Federal law requires schools to have a transition plan for every special education student exiting high school.
What is transition planning?In terms of special education, planning for the transition to adulthood is supposed to include determining student strengths and interests, assessing possible target outcomes that match these strengths and interests, setting goals for building skills necessary to attain targeted outcomes, and delivering services to teach these skills. From the perspective of the family, transition planning might also include financial planning for the future and thinking about where the youth will live in adulthood.
Planning may be a more in depth process for some students depending on levels of need. Regardless of intensity, planning should actively involve parents, students and non-school agencies (such as publicly funded vocational services for adults) whenever appropriate.
Most special education students say that employment is their primary intended outcome after high school, so transition planning often focuses on preparing for future employment.2
Other times the plan puts more emphasis on continued education if the youth intends to go to a 2-year or 4-year college or a vocational/technical education program. Sometimes the transition plan concentrates on ways to support youth to live as independently as possible in their adult lives.
National Autism Indicators Report: Transition into Young Adulthood 2015 | drexel.edu/autisminstitute/LCO/ | 21

22 | National Autism Indicators Report: Transition into Young Adulthood 2015 | Transition Planning: Special Education and Services
Participation counts.Even for students who receive transition planning on time, quality of transition planning can be an issue. One component of quality is participation of required team members. Special education law requires that families and students be invited to participate in the transition planning process. Approximately 60% of parents in the NLTS2 reported that they participated in transition planning. Over 80% of these parents felt that transition planning was somewhat or very useful. According to parents, 45% of youth ever met with teachers to plan for transition goals. Of these, 46% of students provided some input or took a leadership role in the transition planning process.
In their own voices
Youth self-responders wanted more involvement in transition planning.We looked at what the group of youth on the autism spectrum who were capable of responding to NLTS2 questions reported about their transition planning experiences at the age of 17. Nearly 80% of students said that they had ever participated in transition planning. Over half (56%) of students who participated in the NLTS2 reported that their IEP goals were very or pretty challenging and right for them.
How do we know?
We used data from the National Longitudinal Transition Study-2 (NLTS2) to study the transition planning experiences of youth on the autism spectrum.
10%
34%
56%
Percentage of youth self-responders Source: National Longitudinal Transition Study-2
One-third of autistic youth self-responders said they wanted to be more involved in their transition planning.
Involved the right amount
Wanted to be more involved
Wanted to be less involved
Transition planning happened late for some.At the time the NLTS2 began in the early 2000s, transition planning was required to begin at age 14 per federal special education law. In 2004, the federal law changed and the required age for transition planning increased to 16 years. Some states still require transition planning to begin at age 14.
The average age of transition planning for youth with autism in the NLTS2 data was 14.6 years. Approximately 58% students with autism did not receive timely transition planning beginning at age 14 (as per the law at the time of the survey), although 95% had a transition plan by the age of 16.

Level of impairment, household income and race/ethnicity were associated with timely transition planning.How well youth were able to converse affected timeliness of transition planning. Fewer of those who had better conversational skills received transition planning on time.
Economic disadvantage and race also affected timeliness of transition planning. Fewer young adults on the autism spectrum who were from lower income households received transition planning that was initiated on time, as did fewer black youth.
63% 58% 57% 48%
Perc
ent r
ecei
ved
trans
ition
pla
nnin
g on
tim
e
Conversation ability
Source: National Longitudinal Transition Study-2
Fewer youth with autism who had no trouble conversing received timely transition planning.
Unable to converse
A lot of trouble
A little trouble
No trouble conversing
45% 40%
78%
60%
Perc
ent r
ecei
ved
trans
iiton
pla
nnin
g on
tim
e
Household income Source: National Longitudinal Transition Study-2
Less than half of youth with autism from lower income households received timely transition planning.
Up to $25K
$25K to $50K
$50K to $75K
More than $75K
77%
46%
66% 60%
Perc
ent w
ith t
imel
y tra
nsiti
on p
lann
ing
Race/Ethnicity Source: National Longitudinal Transition Study-2
Fewer black youth with autism received transition planning on time.
Hispanic Black Other race
White
National Autism Indicators Report: Transition into Young Adulthood 2015 | drexel.edu/autisminstitute/LCO/ | 23
Looking aheadPlease refer to the Looking Ahead chapter for discussion of research gaps and next steps in learning more about Transition Planning and other topics.
References
1. Landmark LJ, and Zhang D. (2013). Compliance and practices in transition planning: A review of individualized education program documents. Remedial and Special Education 34(2):113-125.
2. Cameto R, Levine P, and Wagner M. (2004). Transition planning for students with disabilities. A special topic report of findings from the National Longitudinal Transition Study-2 (NLTS2). Menlo Park, CA: SRI International.

24 | National Autism Indicators Report: Transition into Young Adulthood 2015 | Transition Planning: Special Education and Services

The Services Cliff
Services decreased significantly in young adulthood.
Our key findings• During high school, over half of youth received speech-
language therapy, occupational therapy, social work, case management, transportation and/or personal assistant services.
• However, receipt of these services all decreased dramatically for these youth between high school and their early 20s.
• Approximately 26% of young adults on the autism spectrum received no services – services which could help them become employed, continue their education, or live more independently.
• 28% of young adults who were not employed and also not attending higher education had no services.
26% of young adults received no services during their early 20s.
Autism does not end when children reach adulthood. Most will need some type of services or supports.
Services matter.Autism does not end when children reach adulthood. Most will continue to need some type of services or supports - even among the most cognitively able. About a half million youth on the autism spectrum will age out of eligibility for special education supports over the next decade.
During high school, all of the youth represented in this report received special education services. Many also received related services like speech-language therapy, occupational therapy, vocational services or career counseling, or mental health. Yet, once youth left high school, the legal mandate to provide services ended.
Parents often speak of the entry into adulthood as falling off a cliff, referring to the dramatic decline in availability of services after leaving high school. Data from the National Longitudinal Transition Study-2 (NLTS2) confirm this parental perception. Approximately one in four young adults with autism received no services during their early 20s. Even among young adults who were disconnected from both work and continued education, 26% received no services during their early 20s to help them become employed or go to school.
Not receiving services in adulthood is not necessarily a bad thing. Some people may no longer need help. But because autism is a lifelong disorder, it is reasonable to expect that many youth still need some or many services during adulthood. In particular, those who do not transition into either work or postsecondary education in the years after high school likely have a strong need for services.
Increasing continuity in service delivery from high school into young adulthood may improve adult outcomes for some. Still, we can’t precisely say what percentage of youth will need intensive levels of daily support versus relatively light amounts of support. Inability to clearly describe how many youth will need which types and amounts of support makes it difficult to plan ahead.
National Autism Indicators Report: Transition into Young Adulthood 2015 | drexel.edu/autisminstitute/LCO/ | 25

26 | National Autism Indicators Report: Transition into Young Adulthood 2015 | The Services Cliff
The services cliffServices are typically recommended based on an individual’s functional needs, personal goals, and unique impairment characteristics. Individuals with autism may require some assistance to find and keep a job, function in a school environment, and live as independently as possible. Some may need more intensive help, such as assistance to perform tasks of daily living. Others may thrive with help provided by family, friends, and community members and only require support with tasks like financial management or scheduling.
The NLTS2 examined 12 services that youth may have received during high school including: • Therapeutic services (speech-language therapy, occupational
or life skills therapy, physical therapy, vocational services)• Health-related services like diagnostic medical services • Personal counseling (psychological or mental health, or
social work)• Access/mobility services (transportation, assistive technology
services/devices) • Personal assistance (personal assistant, in-home or classroom
aide, or respite care)• Case management
We looked at which services youth received during high school when they were 17 years old. Over half of youth received these services: speech-language therapy, personal assistant services, social work, case management, transportation and occupational therapy. We then looked to see which services they received between high school and their early 20s. Less than one-third received these same services during their early 20s– with exception of case management which was more frequent. In fact, every type of service decreased in frequency between adolescence and adulthood (see next page).
As youth entered adulthood, dramatic increases occurred in the number of people who received no services at all. During high school, 97% of youth received at least one of the services listed in the bullets above. By the time they reached their early 20s, nearly 26% received none of these 12 services. We don’t know why these particular services
tend to decrease in frequency. Maybe fewer people need them, or maybe fewer people are able to access them.
How do we know?
We used data from the National Longitudinal Transition Study-2 (NLTS2) to study the services experiences of youth and young adults on the autism spectrum.

Services consistently decreased following high school.
58%
22% 0%
100%
At Age 17 Since HighSchool
Social work
51% 32%
0%
100%
At Age 17 Since HighSchool
Occupational or life skills therapy
37% 28%
0%
100%
At Age 17 Since HighSchool
Diagnostic medical services
Percent who received service at age 17 compared to percent who ever received service after high school. Source: National Longitudinal Transition Study-2
15% 6% 0%
100%
At Age 17 Since HighSchool
Assistive technology
14% 7% 0%
100%
At Age 17 Since HighSchool
Physical therapy
23% 13%
0%
100%
At Age 17 Since HighSchool
Respite care
41% 30%
0%
100%
At Age 17 Since HighSchool
Psychological or mental health
67%
42%
0%
100%
At Age 17 Since HighSchool
Case management
50% 30%
0%
100%
At Age 17 Since HighSchool
Transportation
54%
12% 0%
100%
At Age 17 Since HighSchool
Personal assistant
66%
10% 0%
100%
At Age 17 Since HighSchool
Speech-language therapy
National Autism Indicators Report: Transition into Young Adulthood 2015 | drexel.edu/autisminstitute/LCO/ | 27

28 | National Autism Indicators Report: Transition into Young Adulthood 2015 | The Services Cliff
Disconnected from work, school, and servicesOver one-third of young adults on the autism spectrum were disconnected – meaning they did not transition into either employment or continued education after high school (See Adult Outcomes and Disconnection). We don’t know why disconnection happens, but we can reasonably guess that these young adults may have needed some help to become connected. Yet, 28% of young adults who were disconnected did not receive any services.
Some never received services to support employment.The amounts and types of services people need may change as they age. They also change with life circumstances and according to youths’ goals. Vocational and life skills services are particularly important for people who need help to become employed, continue their education, or live more independently. Despite low rates of employment, postsecondary education and independent living, few young adults with autism received the vocational or life skills services that might have improved these outcomes. Over half of young adults never received these services during their early 20s.
Approximately 58% of young adults and their parents said they needed services other than what they were receiving. The most common service needs were vocational or job training (37%) and life skills services (32%).
28% of young adults who were disconnected received no services during their early 20s.
Young adults who were disconnected (never had a job or continued school) likely needed services.
37% 32%
53%
Perc
ent r
ecei
ved
serv
ice
afte
r hig
h sc
hool
Type of adult services received
Source: National Longitudinal Transition Study-2
Over half of young adults with autism received no vocational or life skills services during their early 20s.
Vocational services or job training
Life skills or occupational therapy
No vocational or life skills services

Accessing adult services may require great effort.The amount of effort needed to access services also changed as youth entered adulthood. While half of families reported needing some or a great deal of effort to find and access services when the youth was 17 years old, after high school this number jumped to more than 70%.
Spotlight: Case managementCase management services are designed to help people find the services they need and coordinate the ones they have. Two thirds (67%) of youth received case management services during high school. Less than half (42%) received case management during their early 20s - even though case management was the most frequent service received during adulthood. This decline in assistance happened right as people were leaving the support of the special education system. Therefore, fewer had the services they needed to navigate the adult service system, understand changes in eligibility criteria and locate new providers. The increased amount of effort required to find services in adulthood could be related to this decrease in case management services.
Spotlight: Life Skills training and supports for independent livingFew adults received direct services like life skills training. In the first several years after leaving high school, one-third (33%) of young adults with autism ever received occupational or life skills therapy, which is helpful for building skills to increase independence within one’s living arrangement. These life skills services focused on: home care skills such as cooking and cleaning (39%), relationship skills such as getting along with others (32%), self-care skills such as brushing teeth (31%), financial issues such as managing money (19%) and using transportation (19%).
Looking aheadPlease refer to the Looking Ahead chapter for discussion of research gaps and next steps in learning more about Services and other topics.
51%
71%
0%
100%
At Age 17 Since HighSchool
Percent families of young adults with autism Source: National Longitudinal Transition Study-2
The percentage of families who reported some or great effort to access services increased following high school.
National Autism Indicators Report: Transition into Young Adulthood 2015 | drexel.edu/autisminstitute/LCO/ | 29

30 | National Autism Indicators Report: Transition into Young Adulthood 2015 | The Services Cliff

Young Adult Outcomes and Disconnection
Outcomes matter.This chapter – the most important in the report – is about life, taken as a whole. In the remaining chapters you can read in-depth about adult outcomes for health and mental health, employment, education, living arrangements, social and community participation, and safety and risk. But real life doesn’t unfold in separate parts. Real life is integrated across its parts. Education impacts employment… employment impacts living arrangements… living arrangements affect your social life… and so on. We will never truly move the needle on quality of life for adults on the autism spectrum if we don’t consider the sum of the individual areas of life together – in addition to considering how people feel about their lives.
Federal law requires schools to prepare special education students for employment, further education, and independent living.1 As you will see in this chapter, too often these outcomes are never realized.
The big picture
Our key findings• Over one-third of young adults were disconnected
during their early 20s, meaning they never got a job or continued education after high school.
• Young adults on the autism spectrum had far higher rates of disconnection than their peers with other disabilities. Less than 8% of young adults with a learning disability, emotional disturbance, or speech-language impairment were disconnected, compared to 37% of those with autism.
37% of young adults with autism were disconnected from both work and education after high school.
The purpose of transition planning is to connect students to work, continued education, or other outcomes.
When youth do not get a job or continue their education after high school, they are referred to as disconnected. Data from the National Longitudinal Transition Study-2 (NLTS2) indicate that half of youth on the autism spectrum were disconnected from work and continued education during the first two years after high school. Approximately 37% of youth on the autism spectrum were disconnected beyond these first two years and into their early 20s. The rate of disconnection was higher for young adults on the autism spectrum than their peers in other disability groups. It took several years for disconnection rates to improve.
How do we know?
We used data from the National Longitudinal Transition Study-2 (NLTS2) to study the outcomes of young adults on the autism spectrum.
National Autism Indicators Report: Transition into Young Adulthood 2015 | drexel.edu/autisminstitute/LCO/ | 31

32 | National Autism Indicators Report: Transition into Young Adulthood 2015 | Young Adult Outcomes and Disconnection
The connection among outcomes How we live, work and play are all connected. Where we live and our ability to navigate within our communities affects where we work. Workplaces provide opportunities for social connections, which affect our mental well-being and generate more opportunities for community involvement. The sum total of the parts of our lives contributes to our quality of life. This is true for everyone – not just people with disabilities.
It is a great concern when youth leave high school and don’t have access to opportunities that will help them live as independently as possible. In the general population, the longer people are out of work, the harder it is for them to find employment. Likewise, the longer people are out of a school routine, the tougher it may be for them to continue their education. Missing the connections after high school to jobs, continued education, and opportunities for independence makes it difficult for youth to begin establishing a quality adult life.
Unintended outcomes - the flip side of the storyWhen we track outcomes, we often think in terms of what people achieved. We can also think about outcomes in the reverse. Examining unintended outcomes – what people did not achieve – can provide clues about priorities for program and policy development and targets for innovative transition planning.
In the chapters that follow, we explain more about each of these outcomes in depth.
Quality of Life
Feelings and Beliefs
Health and Mental Health
SocialParticipation
Safety
EmploymentContinued Education
Living Arrangements
24%
26%
32%
42%
64%
68%
81%
Percent experienced during their early 20s Source: National Longitudinal Transition Study-2
Never lived independently
Never lived apart from parents
No postsecondary education
No employment
No community participation
No services
Social isolation
Which outcomes were difficult for young adults with autism to achieve between high school and their early 20s?

What happened after high school across key outcomes?
Education
Attended any postsecondary education
36%Ever attended 2 or 4 year
college, or vocational/technical school
Attended any college
30%Ever attended 2- or 4-year college
Employment
Had a job for pay
58%Ever had a job for pay outside
of the home
Had a job soon after high school
32%Ever had a job for pay outside of
the home within the first two years after leaving high school
Living Arrangements
Lived independently
19%Ever lived away from parents
without supervision
Lived apart from parents
31%Ever lived away from parents with
or without supervision
Social & Community Participation
Any socialization
76%Ever (in the past year) saw
friends, called friends, or was invited to activities
Any community participation
68%Ever (in the past year) was
involved in volunteer activities, community activities, or took
classes or lessons
Access to Services
Received any services
74%Ever received at least one service after high school
Received vocational services
37%Ever received any vocational services or job training after
high school
Health and Safety
Co-occurring conditions
60%of adolescents had two or more
additional health or mental health conditions.
Bullying victimization
47%of youth were victims of bullying
during high school.
National Autism Indicators Report: Transition into Young Adulthood 2015 | drexel.edu/autisminstitute/LCO/ | 33

34 | National Autism Indicators Report: Transition into Young Adulthood 2015 | Young Adult Outcomes and Disconnection
In their own voices
Beliefs of autistic young adult self-respondersWhether a person works or lives apart from his or her parents only provides a few clues about a person’s quality of life. So, when we think about outcomes, it is important to also examine subjective indicators of quality of life – such as your outlook on life and how you feel about yourself as a person. To date, there has been little research on how autistic young adults feel about their quality of life.
The subgroup of autistic young adults who were capable of participating in the NLTS2 responded to a variety of self-belief statements regarding how they felt about themselves and their lives. The overwhelming majority (94%) said they felt supported by their parents and families, while 71% said they felt supported by their friends. Well over half identified with positive self-belief statements about being a nice person, feeling proud, knowing how to get information, and feeling useful and important. Less than half felt that they could handle things, that life was interesting, or that they could make friends easily.
Nearly 60% indicated that in the past week they felt enjoyment of life, and about half felt hopeful about the future. At the same time, nearly 60% indicated they felt depressed, and a little less than half identified with feeling lonely and disliked by others. It is important to note that these statements are not indicators of clinical depression.
45%
48%
48%
57%
59%
61%
68%
Source: National Longitudinal Transition Study-2
You are a nice person.
You are proud of who you are.
You know how to get information.
You feel useful and important.
You can handle things.
You life is full of interesting things to do.
You can make friends easily.
Many autistic young adult self-responders had positive self-beliefs. Fewer believed they could handle things and make friends easily.
Percentage of young adult self-responders who felt this statement sounded very much like them:
45%
48%
57%
48%
59%
Disliked by people
Lonely
Depressed
Hopeful about the future
That they enjoyed life
Source: National Longitudinal Transition Study-2
Percentage of young adult self-responders who felt this way a lot or most of the time during the past week:
Autistic young adults experienced a wide range of outlooks.

More disconnection for those with autismFar more young adults on the autism spectrum were disconnected from both work and education during their early 20s compared to their peers with other types of disabilities. While over one-third of those on the autism spectrum experienced disconnection, very few with learning disability, emotional disturbance, or speech-language impairment were disconnected.
Many were disconnected in the first years after high school. Over 66% of youth on the autism spectrum did not transition into either employment or education in the first two years after leaving high school. Over 42% were disconnected from work or school between two and four years after leaving high school. Rates of disconnection decreased once young adults had been out of high school at least four years.
Even when young adults eventually connect to jobs and continued education, this does not mean that everything turns out fine. Having one job, or being in school for a brief period, is not the same as continuous, stable employment.
7%
7%
8%
34%
37%
Percent never worked or went to school
Source: National Longitudinal Transition Study-2
More young adults with autism were disconnected from both work and education than their peers with other disabilities.
Autism
Intellectual disability
Speech/Language impairment
Emotional disturbance
Learning disability
66%
42%
23%
3%
0-2 years 2-4 years 4-6 years 6-10 years
Perc
ent n
ever
wor
ked
or c
ontin
ued
educ
atio
n
Time since high school Source: National Longitudinal Transition Study-2
Many young adults with autism experienced disconnection in the first two years after high school.
Higher rate of disconnection compared to peersYoung adults on the autism spectrum experienced a rate of disconnection from employment and education in the first two years after high school that was more than double the rate of their peers with intellectual disabilities. Their rate of disconnection did not match the rate of those with intellectual disabilities until more than four years after leaving high school. We don’t know why youth with intellectual disabilities experience less disconnection right after high school than those with autism.
66%
42% 23%
3%
46%
45%
24%
31%
0-2 years 2-4 years 4-6 years 6-8 years
Perc
ent n
ever
wor
ked
or c
ontin
ued
educ
atio
n
Source: National Longitudinal Transition Study-2
Number of years since leaving high school
Young adults with autism had higher rates of disconnection following high school than their peers with intellectual disability (ID).
Autism
ID
National Autism Indicators Report: Transition into Young Adulthood 2015 | drexel.edu/autisminstitute/LCO/ | 35

36 | National Autism Indicators Report: Transition into Young Adulthood 2015 | Young Adult Outcomes and Disconnection
Level of impairment, household income and race/ethnicity were associated with disconnection.When people have difficulties with social skills, challenging behaviors, intellectual functioning, or communication, it may be harder for them to work or continue their education. The rate of disconnection for young adults with autism with the greatest difficulty conversing was more than 10 times the rate of disconnection for with autism who had no problems conversing.
Economic disadvantage and historical disadvantages due to race and ethnicity may also affect access to jobs and the likelihood of continuing education. Young adults on the autism spectrum who were from lower income households had a rate of disconnection twice that of those from higher income households. Nearly half as many white young adults ever experienced disconnection compared to those who were Hispanic or black.
74%
49%
19% 7%
Not able toconverse
A lot oftrouble
A littletrouble
No troubleconversing
Perc
ent e
ver d
isco
nnec
ted
Conversation ability Source: National Longitudinal Transition Study-2
As conversation ability increased, the percentage of young adults who were disconnected decreased.
64%
34% 32% 20%
Perc
ent e
ver d
isco
nnec
ted
Household income Source: National Longitudinal Transition Study-2
Twice as many young adults from low income households were disconnected than those from any other level of household income.
Up to $25K
$25K to $50K
$50K to $75K
More than $75K
56% 60% 49%
29%
Perc
ent e
ver d
isco
nnec
ted
Race/Ethnicity Source: National Longitudinal Transition Study-2
Fewer white young adults with autism were ever disconnected during their early 20s.
Hispanic Black Other race
White
Looking aheadPlease refer to the Looking Ahead chapter for discussion of research gaps and next steps in learning more about Adult Outcomes and other topics.
References
1. IDEA 2004 Reauthorization [34 CFR 300.1(a)] [20 U.S.C. 1400(d)(1)(A)]. www.idea.ed.gov

Health, Mental Health and Health Care
Mental health and health care matters.It is rare to find youth on the autism spectrum who are only dealing with the challenges of having an autism spectrum disorder. Dealing with multiple conditions complicates health care needs and sometimes requires multiple medications, treatments, and service providers to address all of the youth’s needs. During adolescence, parents might also have to begin the search for adult health care providers if their pediatrician does not see children over the age of 18. They may encounter problems with accessing care just as health care needs intensify.
We have virtually no data on health, mental health, and health care for young adults with autism. The richest source of nationally-representative data we currently have on these topics is surveys of the parents of teens. In this chapter we present the information we have about the health, mental health and health care of adolescents with autism.
Complex needs
Our key findings• 60% of youth had at least two health or
mental health conditions in addition to autism spectrum disorder.
• Three-quarters of youth on the autism spectrum took at least one kind of medication on a regular basis for any health or mental health issue.
• Nearly all had health insurance. Three-quarters received needed treatments and services.
• One in three parents said their pediatrician warned them of the need to change to an adult physician.
60% of youth ages 15-17 years had at least two health or mental health conditions in addition to autism.
Youth with autism have complex health needs due to co-occurring conditions.
The data about the youth in this chapter came from the Survey of Pathways to Diagnosis and Services (commonly referred to as Pathways). The 2011 Pathways survey was conducted in follow-up to the 2009-2010 National Survey of Children with Special Health Care Needs (NS-CSHCN). We used Pathways survey data for a more in depth look at the mental health and health care experiences of adolescents on the autism spectrum. We analyzed survey responses for youth who were ages 15 -17 who had a current diagnosis of autism spectrum disorder and were receiving special education services. For more information on these surveys, see Appendix -Methods.
National Autism Indicators Report: Transition into Young Adulthood 2015 | drexel.edu/autisminstitute/LCO/ | 37

38 | National Autism Indicators Report: Transition into Young Adulthood 2015 | Health, Mental Health and Health Care
Youth demographics (at ages 15-17 years)Youth on the autism spectrum represented in the Pathways data had demographic characteristics that were similar to youth in the NLTS2 (See Youth on the Autism Spectrum). These youth were overwhelmingly male and white and from households with a wide range of incomes.
Many had co-occurring conditions in adolescence.
The Pathways survey asked parents of youth on the autism spectrum whether the youth currently had other health, behavioral, and mental health conditions. Over half of parents reported that youth ages 15-17 years had Attention Deficit Disorder or Attention Deficit
Hyperactivity Disorder (ADD/ADHD) and/or anxiety problems that co-occurred with the youth’s autism diagnosis. Nearly 13% reported that the youth had a seizure disorder. It was possible for parents to report more than one co-occurring condition. Over 60% of youth had at least two conditions in addition to autism.
13%
24%
37%
38%
51%
53%
Seizure disorder
Depression
Behavioral problems
Intellectual disability
Anxiety
ADD/ADHD
Percent of 15- to 17-year-old youth with autism
Source: Survey of Pathways to Diagnosis and Services
Over half of youth had ADD/ADHD and anxiety issues in addition to autism.
13% 27%
19% 19% 15% 6% 1%
0 1 2 3 4 5 6Number of other conditions in addition to autism
Source: Survey of Pathways to Diagnosis and Services
Conditions included intellectual disability, ADD or ADHD, depression, anxiety, seizure disorder, and behavioral or conduct problems.
Many 15- to 17-year-old youth had multiple health, behavioral, or mental health conditions in addition to autism.
How do we know?
We used data from the Survey of Pathways to Diagnosis and Services to study the health, mental health and health care experiences of youth on the autism spectrum.
34% 24%
22% 20%
4% 14% 13%
73% 83%
more than $75K$50K to $75K$25K to $50K
up to $25KHispanic
Other raceBlackWhiteMale
Percentage of 15- to17-year-old youth with autism
Ethnicity
Source: Survey of Pathways to Diagnosis and Services
Household Income
Race
Most youth with autism were male, white, and from varied household incomes.

Good health care access — but gaps in treatment coverage Nearly all (97%) parents reported in the Pathways survey that their adolescent had some type of health care coverage including health insurance, prepaid plans such as HMOs, or government plans such as Medicaid. Three-fourths (76%) said that the youth received all treatment and services needed to support development in the past year.
Parents were asked about treatments, services, or service providers that were not covered by the youth’s health insurance. Of those who reported a need for services that were not covered by insurance, psychological services was the single most frequent unmet need. Approximately one in 10 parents reported unmet services needs in an other category.
High levels of medication useOver 77% of parents who participated in the Pathways survey reported that their youth was taking some type of prescription medication (other than vitamins) on a regular basis when they took the NS-CSHCN survey. The Pathways survey explored which types of medication these adolescents were currently taking. Nearly one-quarter to one-third were currently taking stimulants, anti-depressants, and/or anti-anxiety or mood stabilizing medications. It was possible for parents to report that the youth was taking more than one type of medication.
10%
6%
11%
13%
15%
23%
Source: Survey of Pathways to Diagnosis and Services
Psychological services
Speech/ language therapy
Occupational therapy
Behavior management services
Medication/ pharmacy services
Other
Psychological services most common service not covered by insurance.
Percent needed services not covered by insurance
16%
20%
23%
31%
31%
40%
Anti-seizure
Anti-psychotics
Sleep medications
Anti-depressants
Stimulants
Anti-anxiety or mood
Percentage of 15- to 17-year-old youth with autism
Source: Survey of Pathways to Diagnosis and Services
Many youth took at least one type of medication for conditions that co-occurred with autism.
National Autism Indicators Report: Transition into Young Adulthood 2015 | drexel.edu/autisminstitute/LCO/ | 39

40 | National Autism Indicators Report: Transition into Young Adulthood 2015 | Health, Mental Health and Health Care
27% 21% 12% 40%
Source: Survey of Pathways to Diagnosis and Services (parent responses to NS-CSHCN 2009-2010)
Always Usually Sometimes Never
Many health care providers encouraged youth to take some level of responsibility for their own health care.
Providers encouraged youth to take responsibility for
health care.
Looking aheadPlease refer to the Looking Ahead chapter for discussion of research gaps and next steps in learning more about Health and Mental Health and other topics.
Little help to prepare for health care transitionIt is not unusual to hear parents express problems with continuity of care during the transition to adult health care, and providers may have limited awareness of how to best prepare youth for health care transitions. Most youth (74%) received health care from providers who only treat children and adolescents, according to parents who took the Pathways survey (as indicated in their responses to the 2009-2010 NS-CSHCN survey). About 45% of parents reported that the youth’s doctor talked with them about new health care needs the youth might experience as he entered adulthood, but few were told about changes in health care coverage at adulthood and ways to prevent gaps in coverage. One in three parents said their pediatrician discussed the need to eventually transition to an adult physician.
Very little early health care transition activity happened for these families. However, there was evidence that providers were encouraging youth to take more responsibility for their health care as they approached the transition to adulthood.
21%
30%
45%
Percentage of 15- to 17-year-old youth with autism
Few had early health care transition experiences.
Source: Survey of Pathways to Diagnosis and Services (parent responses to NS-CSHCN 2009-2010)
Doctors discussed health care needs as youth
becomes an adult
Discussed eventually seeing other doctors who treat adults
Someone discussed health insurance coverage as youth
becomes an adult
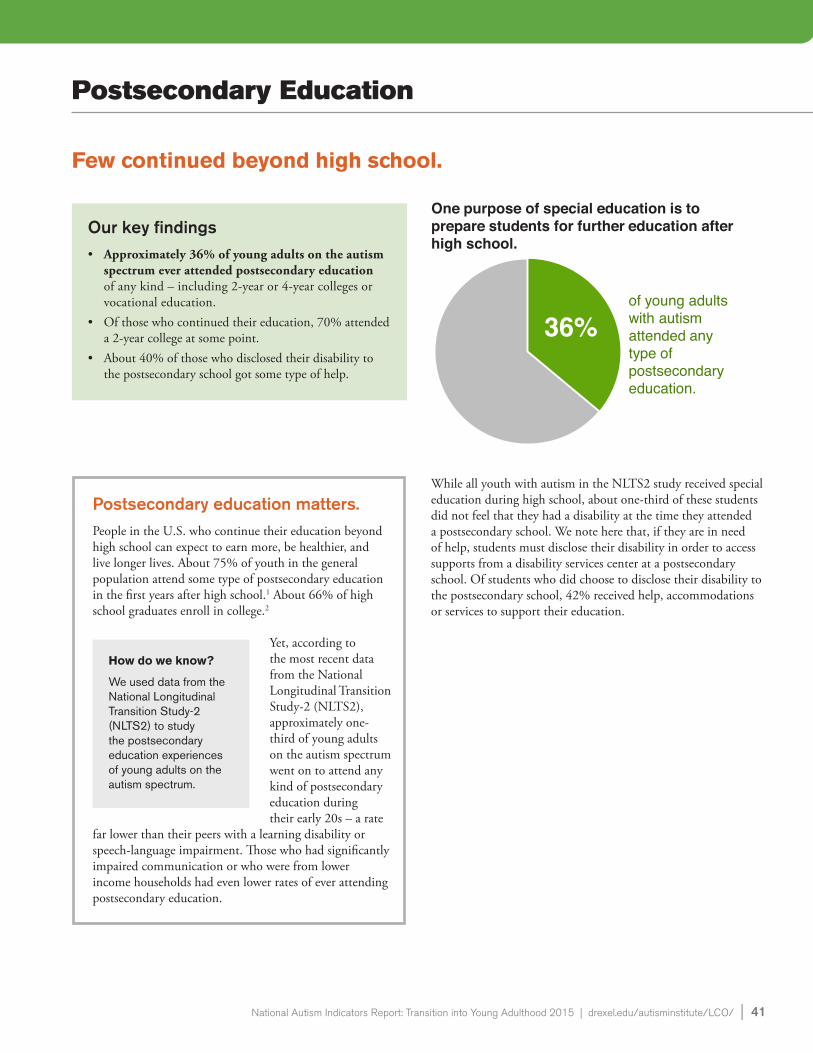
Postsecondary Education
Postsecondary education matters.People in the U.S. who continue their education beyond high school can expect to earn more, be healthier, and live longer lives. About 75% of youth in the general population attend some type of postsecondary education in the first years after high school.1 About 66% of high school graduates enroll in college.2
Yet, according to the most recent data from the National Longitudinal Transition Study-2 (NLTS2), approximately one-third of young adults on the autism spectrum went on to attend any kind of postsecondary education during their early 20s – a rate
far lower than their peers with a learning disability or speech-language impairment. Those who had significantly impaired communication or who were from lower income households had even lower rates of ever attending postsecondary education.
Few continued beyond high school.
Our key findings• Approximately 36% of young adults on the autism
spectrum ever attended postsecondary education of any kind – including 2-year or 4-year colleges or vocational education.
• Of those who continued their education, 70% attended a 2-year college at some point.
• About 40% of those who disclosed their disability to the postsecondary school got some type of help.
36% of young adults with autism attended any type of postsecondary education.
One purpose of special education is to prepare students for further education after high school.
How do we know?
We used data from the National Longitudinal Transition Study-2 (NLTS2) to study the postsecondary education experiences of young adults on the autism spectrum.
While all youth with autism in the NLTS2 study received special education during high school, about one-third of these students did not feel that they had a disability at the time they attended a postsecondary school. We note here that, if they are in need of help, students must disclose their disability in order to access supports from a disability services center at a postsecondary school. Of students who did choose to disclose their disability to the postsecondary school, 42% received help, accommodations or services to support their education.
National Autism Indicators Report: Transition into Young Adulthood 2015 | drexel.edu/autisminstitute/LCO/ | 41

42 | National Autism Indicators Report: Transition into Young Adulthood 2015 | Postsecondary Education
One-third with autism ever attended some type of postsecondary education.An increasing number of programs are available to assist students with disabilities to attend postsecondary education. According to NLTS2 data, approximately 36% of young adults with autism received additional education after high school. Less than one-third went to college of some kind. One-quarter attended a 2-year college at some point. Fewer attended a vocational/technical school, a 4-year college, or both 2-year and 4-year colleges.
Many attended 2-year colleges.Of students on the autism spectrum who ever attended postsecondary education, approximately 85% went to some type of college. Two-year colleges play an important role for students on the autism spectrum, since 70% of those who received postsecondary education attended a 2-year college at some point. Some use 2-year colleges as a stepping stone to a 4-year college. For others, it is their sole college experience. One-third attended a vocational/technical school or a 4-year college. Fewer attended both 2-year and 4-year colleges.
6%
11%
12%
25%
30%
36%
Types of postsecondary education among all young adults with autism
Sums to > 100% as may have attended more than one setting. Source: National Longitudinal Transition Study-2
What percentage of young adults with autism attended different types of postsecondary education?
Any kind of postsecondary education
Any kind of college
Any 2-year college
Vocational, business, or technical school
Any 4-year college
Both 2-year and 4-year college
16%
32%
33%
70%
Types of programs among students with autism who attended postsecondary
Sums to > 100% as may have attended more than one setting Source: National Longitudinal Transition Study-2
Of students on the autism spectrum who attended postsecondary education, what type of programs did they attend?
Ever attended 2-year college
Vocational, business, or technical school
Ever attended 4-year college
Attended 2-year and 4-year college
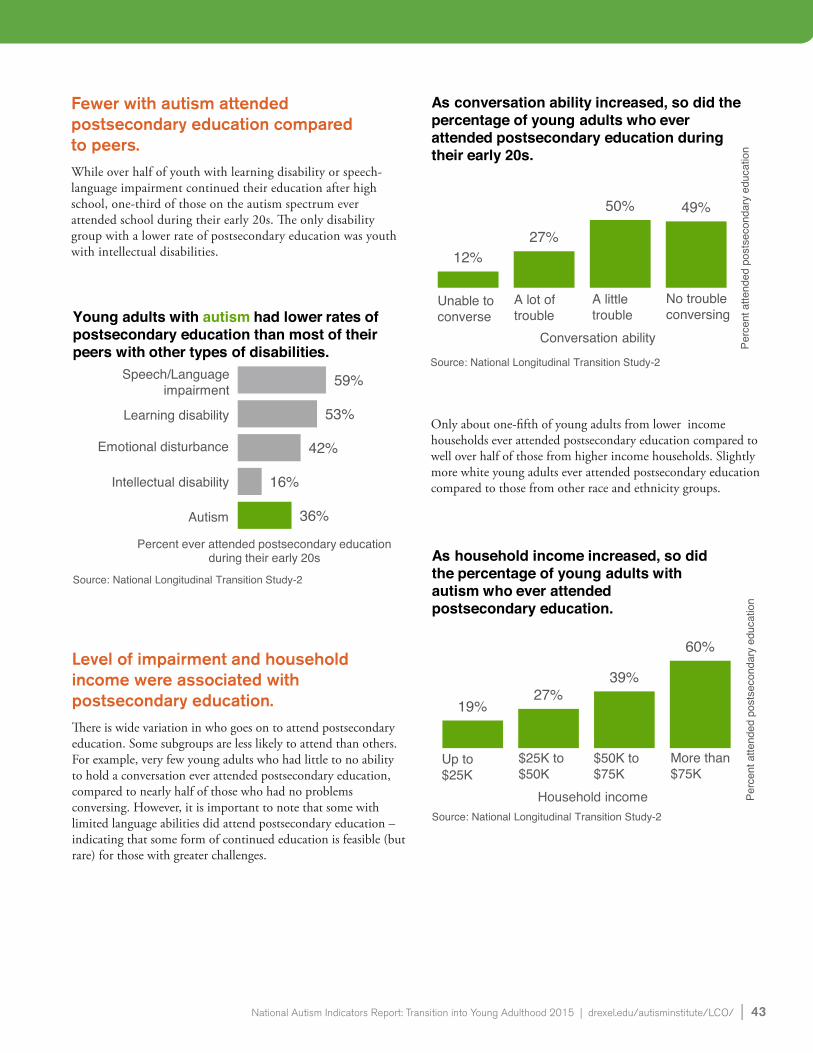
Fewer with autism attended postsecondary education compared to peers.While over half of youth with learning disability or speech-language impairment continued their education after high school, one-third of those on the autism spectrum ever attended school during their early 20s. The only disability group with a lower rate of postsecondary education was youth with intellectual disabilities.
Level of impairment and household income were associated with postsecondary education.There is wide variation in who goes on to attend postsecondary education. Some subgroups are less likely to attend than others. For example, very few young adults who had little to no ability to hold a conversation ever attended postsecondary education, compared to nearly half of those who had no problems conversing. However, it is important to note that some with limited language abilities did attend postsecondary education – indicating that some form of continued education is feasible (but rare) for those with greater challenges.
Only about one-fifth of young adults from lower income households ever attended postsecondary education compared to well over half of those from higher income households. Slightly more white young adults ever attended postsecondary education compared to those from other race and ethnicity groups.
36%
16%
42%
53%
59%
Percent ever attended postsecondary education during their early 20s
Source: National Longitudinal Transition Study-2
Young adults with autism had lower rates of postsecondary education than most of their peers with other types of disabilities.
Autism
Intellectual disability
Speech/Language impairment
Emotional disturbance
Learning disability
12% 27%
50% 49%
Perc
ent a
ttend
ed p
osts
econ
dary
edu
catio
n
Conversation ability Source: National Longitudinal Transition Study-2
As conversation ability increased, so did the percentage of young adults who ever attended postsecondary education during their early 20s.
Unable to converse
A lot of trouble
A little trouble
No trouble conversing
19% 27%
39%
60%
Perc
ent a
ttend
ed p
osts
econ
dary
edu
catio
n
Household income Source: National Longitudinal Transition Study-2
As household income increased, so did the percentage of young adults with autism who ever attended postsecondary education.
Up to $25K
$25K to $50K
$50K to $75K
More than $75K
National Autism Indicators Report: Transition into Young Adulthood 2015 | drexel.edu/autisminstitute/LCO/ | 43

44 | National Autism Indicators Report: Transition into Young Adulthood 2015 | Postsecondary Education
29% 23% 31%
41%
Perc
ent a
ttend
ed p
osts
econ
dary
Race/Ethnicity Source: National Longitudinal Transition Study-2
More white young adults with autism ever attended postsecondary education during their early 20s.
Hispanic Black Other race White
Parent education was associated with outcomes.Over 75% of youth in the NLTS2 had at least one parent with postsecondary education. The rate of postsecondary education during adulthood was three times as high for those whose parents had any education beyond high school. Approximately 44% of youth who attended postsecondary education during their early 20s had at least one parent who had any postsecondary education. In homes where neither parent had any postsecondary education, only 14% of young adults on the autism spectrum attended postsecondary education during their early 20s.
44%
14%
Perc
enta
ge o
f you
th w
ho a
ttend
ed
post
seco
ndar
y ed
ucat
ion
Parent postsecondary education Source: National Longitudinal Transition Study-2
More young adults continued their education if their parents had any postsecondary education.
Parents had any postsecondary education
Parents had no postsecondary education

Most attended school full-time and had a wide variety of educational interests.Students on the autism spectrum who attend postsecondary education represent a wide range of conversational and functional abilities. Therefore, their patterns of attendance, the concentration of their course work, and whether they are degree-seeking or non-degree-seeking also varies widely.
Experiences at postsecondary schools
Full-time attendance differed by setting. Over 63% of those who ever attended a 2-year college attended school full-time. Rates of full-time attendance were higher for those who ever attended a 4-year college (84%) or a vocational-technical school (81%).
Approximately 30% of those who ever attended a 2-year college were focused on a science, technology, engineering, or mathematics (STEM) course of study, while 50% of those who ever attended a 4-year college reported majoring in a STEM field. STEM majors included: agriculture, computer science, engineering, mathematics, science and social sciences.
2%
24%
37%
37%
Personal interest*
Academic and vocational
Mostly academic
Mostly vocational
Percentage of those who attended 2-year school
*Personal interest courses were neither academic nor vocational. Source: National Longitudinal Transition Study-2
Most students on the autism spectrum attended 2-year programs and had a range of course work concentrations.
National Autism Indicators Report: Transition into Young Adulthood 2015 | drexel.edu/autisminstitute/LCO/ | 45

46 | National Autism Indicators Report: Transition into Young Adulthood 2015 | Postsecondary Education
Fewer than half of those who disclosed their disability received accommodations.Of students who did choose to disclose their disability to the postsecondary school, 42% received help, accommodations, or services to support their education. Of students with autism who received any type of supports (either based on their disability status or available to all students) in college and vocational/technical settings, 90% felt they received enough help, services or accommodations between their in-school and private supports. However, only 73% of 2-year and 4-year college students with autism, and 66% of vocational/technical students, felt the services and accommodations they received were helpful.
Help, accommodations, and services at postsecondary schools
Looking aheadPlease refer to the Looking Ahead chapter for discussion of research gaps and next steps in learning more about Postsecondary Education and other topics.
References
1. ACT Inc. (2005). Courses count: Preparing students for postsecondary success. ACT Policy Report. www.act.org/research/policy/index.html
2. Bureau of Labor Statistics. (2014). College enrollment and work activity of 2013 high school graduates. U.S. Department of Labor. http://www.bls.gov/news.release/hsgec.nr0.htm
24%
31%
33%
47%
62%
Percentage of autistic youth who received accommodations
Source: National Longitudinal Transition Study-2
Top 5 accommodations at postsecondary schools
Testing accommodations
Human aides
Assignment accommodations
Materials/technical adaptations
Physical adaptations

Employment
Few had jobs after high school.
Employment matters.Each year 50,000 students on the autism spectrum leave high school – many hoping to find jobs. Some may go to school instead. But many will have no job or continued education, and it will take years to launch into adult social roles.
Employment provides an important link to financial independence, health insurance, benefits, and social relationships. In the U.S., having some work experience is almost universal in the general population. Nearly 99% of young adults in America will work at some point between ages 21 to 25 years.1 Employment is the primary transition goal of students with disabilities as they prepare to exit high school,2 and the majority of parents of youth on the autism spectrum believe that their children will transition into work.
Data from the National Longitudinal Transition Study-2 (NLTS2) indicates that 58% of young adults on the autism spectrum ever worked for pay outside of the home between high school and their early 20s – a rate far lower than young adults with other types of disabilities. Those from lower income households and those with significantly impaired communication had even lower rates of employment.
In this report, a job means work for pay, done outside the home, and does not include volunteer jobs.
Our key findings• 58% of young adults on the autism spectrum worked
for pay outside the home between high school and their early 20s - a rate far lower than young adults with other types of disabilities.
• Four in every 10 young adults with autism never worked for pay between high school and their early 20s.
• Those who worked tended to work part-time in low-wage jobs.
• Approximately 90% of youth with autism who worked for pay during high school also had a paid job during their early 20s – compared to only 40% of those who did not work for pay during high school.
58%
of young adults with autism ever worked between high school and their early 20s.
One purpose of special education is to prepare students for employment after high school.
National Autism Indicators Report: Transition into Young Adulthood 2015 | drexel.edu/autisminstitute/LCO/ | 47

48 | National Autism Indicators Report: Transition into Young Adulthood 2015 | Employment
Job rate lowest right after high schoolYoung adults on the autism spectrum experienced a delayed launch into the world of work. Only about one-third were employed during the first two years after high school. It took many years for the employment rate of these young adults to match that of their peers with emotional disturbance, learning disability, or speech-language impairment.
Low wages, part-time jobsYoung adults with autism who worked after high school held an average of about three jobs total during their early 20s. The average length of the longest job held was 26 months. Nearly 83% worked at their longest continuous job for more than one year.
58%
74%
91%
91%
95%
Percent ever worked after high school Source: National Longitudinal Transition Study-2
Learning disability
Speech/language impairment
Emotional disturbance
Autism
Intellectual disability
In their early 20s, young adults with autism had far lower rates of employment than their peers.
32% 46%
76%
93%
Perc
ent e
ver e
mpl
oyed
Time since high school Source: National Longitudinal Transition Study-2
0-2 years
2-4 years
4-6 years
6-8 years
As time passed after high school, the percentage of young adults with autism who had ever been employed increased.
Part-time 79%
Full-time 21%
$9.11
$8.08 per hour on average. 35+ hrs per week
Source: National Longitudinal Transition Study-2
Most young adults with autism worked part-time, averaging $9.11/hour. Full-time employees made less.
per hour on average. <35 hrs per week
Lowest employment rate across disabilitiesCompared to their peers with other types of disabilities, young adults on the autism spectrum had the lowest rate of employment – 58% ever worked during their early 20s. In contrast, over 90% of young adults with emotional disturbance, speech impairment, or a learning disability ever worked during their early 20s, as well as 74% of those with intellectual disability.
How do we know?
We used data from the National Longitudinal Transition Study-2 (NLTS2) to study the employment experiences of young adults on the autism spectrum.

Level of impairment, household income and race/ethnicity were related to work experiences.When people have difficulties with social skills, intellectual functioning or communication, it may be harder for them to find and keep a job. It is not surprising that young adults with autism who had little to no ability to hold a conversation had an employment rate far below those who had no problems conversing. An important point is that some young adults with more significant impairments did find jobs – demonstrating the feasibility of employment even among those with severe difficulties.
Economic disadvantage can also affect access to jobs and ability to find supports for maintaining employment. Young adults on the autism spectrum who were from lower income households had an employment rate less than half that of those from higher income households. Young adults with autism who were Hispanic or black had employment rates during their early 20s that were roughly half that of white young adults with autism.
15%
45%
78% 88%
Perc
ent e
ver e
mpl
oyed
Conversation ability Source: National Longitudinal Transition Study-2
As conversation ability increased, so did the percentage of young adults who ever had a job during their early 20s.
Unable to converse
A lot of trouble
A little trouble
No trouble conversing
34% 37% 43%
66%
Perc
ent e
ver e
mpl
oyed
Race/Ethnicity
Source: National Longitudinal Transition Study-2
More white young adults with autism ever had a job during their early 20s.
Hispanic Black Other race
White
33%
62% 66% 72%
Perc
ent e
ver e
mpl
oyed
Household income Source: National Longitudinal Transition Study-2
As parent income increased, so did the percentage of young adults with autism who ever had a job during their early 20s.
Up to $25K
$25K to $50K
$50K to $75K
More than $75K
National Autism Indicators Report: Transition into Young Adulthood 2015 | drexel.edu/autisminstitute/LCO/ | 49

50 | National Autism Indicators Report: Transition into Young Adulthood 2015 | Employment
High school work experience paid off. The rate of employment during adulthood was over twice as high for those who worked for pay during high school versus those who did not. Only 40% of those who did not have a paid job during high school ever worked during their early 20s. However, nearly 90% of youth on the autism spectrum who worked for pay during high school also worked at some point during their early 20s.
Range of job typesAbout 32% of young adults on the autism spectrum were currently employed at the time of the NLTS2 survey in 2009. One-third worked in a place where most other workers had a disability.
In the workplaceYouth and young adults with autism often need help to find and keep jobs. Nearly 70% of those with jobs reported that their employer was aware of their disability. Of these, 39% received accommodations to support their success in the workplace. Accommodations included help to find a job (45%), testing regarding work interests or abilities (37%), career counseling to identify career matches (34%), training in basic work skills (counting change, telling time, using transportation) (34%) or training in specific job skills (e.g., food services, computer skills) (32%). One-quarter received job shadowing in which a coach observed the person working.
Some young adults with autism need additional employment-related services. During their early 20s, approximately 37% of young adults received vocational services or job training (See also The Services Cliff).
40%
90% Pe
rcen
t eve
r wor
ked
afte
r hig
h sc
hool
Work experience during high school Source: National Longitudinal Transition Study-2
Most who worked for pay during high school went on to have a job during their early 20s.
Did not work during high school
Worked during high school
Looking aheadPlease refer to the Looking Ahead chapter for discussion of research gaps and next steps in learning more about Employment and other topics.
References
1. Bureau of Labor Statistics. (2013). America’s Young Adults at 25: School enrollment, number of jobs held and labor market activity: results of a longitudinal survey. Washington DC: U.S. Department of Labor.
2. Cameto R., Levine P., and Wagner M. (2004). Transition planning for students with disabilities. A special topic report from the National Longitudinal Transition Study-2 (NLTS2). Menlo Park, CA: SRI International.
6%
11%
12%
13%
14%
19%
24%
Percentage of adults with autism who worked (at their current or most recent job)
Source: National Longitudinal Transition Study-2
What type of jobs did young adults with autism tend to have?
Office and administrative support
Production/ manufacturing
Food services Building/ ground cleaning/
maintenance Sales
Other types of jobs
Transportation and material moving

Most lived with parents at some point.While 21% of all young adults in the U.S. lived at home with a parent while in their early 20s,1 87% of young adults on the autism spectrum lived with a parent at some time since leaving high school. Five times as many young adults with autism ever lived with a parent or guardian in their early 20s, compared with those who lived independently or in a supervised living arrangement. Overall, few lived in supervised settings (group homes, correctional facilities, medical facilities, boarding schools) or independently (on his/her own, with a spouse or roommate, college housing). It is important to note that some people who lived in independent settings may have received supportive services to do so.
Living Arrangements
Living arrangements matter.Some young adults in the U.S have their first taste of independent living after leaving high school. They may move out of their parent’s home and begin living in a college dorm with a roommate or on their own. Data from the National Longitudinal Transition Study-2 (NLTS2) indicates that the majority of young adults on the autism spectrum, however, continue to live with a parent or guardian in the first years after high school.
Many of these young adults have difficulty finding services that might help them live more independently. To date, there is little information published about where young adults with autism prefer to live and which services would best support them to live as independently as they would like to.
Most remained living with parents.
Our key findings• One in five young adults on the autism spectrum
ever lived independently (away from parents without supervision) between high school and their early 20s.
• Most (87%) of those with autism lived with their parents at some point between high school and their early 20s - a far higher percentage than in the general population of young adults.
• Far fewer young adults with autism ever lived independently after high school (19%) compared to over 60% of their peers with speech-language impairment or emotional disturbance and nearly 80% of those with learning disabilities.
How do we know?
We used data from the National Longitudinal Transition Study-2 (NLTS2) to study the transition planning experiences of youth on the autism spectrum.
19% of young adults ever lived independently - away from parents without supervision.
One purpose of special education is to prepare students for independent living.
87%
14% 19%
Perc
ent e
ver l
ived
in s
ettin
g af
ter
high
sch
ool
Living Arrangement Source: National Longitudinal Transition Study-2
Most young adults with autism lived with parents at some point after high school, but few ever lived independently.
With a parent or guardian
Supervised setting
Independent living
National Autism Indicators Report: Transition into Young Adulthood 2015 | drexel.edu/autisminstitute/LCO/ | 51

52 | National Autism Indicators Report: Transition into Young Adulthood 2015 | Living Arrangements
Level of impairment, household income and race/ethnicity were related to independent living.Severity of a disability, economic disadvantage, and race/ethnicity can all influence where people live. Fewer young adults who had great difficulty conversing ever lived on their own after high school compared to those who had few problems conversing with others. Young adults from lower income households had a far lower rate of independent living compared to those from higher income households. No Hispanic or young adults who identified as another race ever lived independently after high school, and very few black young adults, compared to those who were white.
0% 11%
25%
45%
Perc
ent e
ver l
ived
inde
pend
ently
Conversation ability Source: National Longitudinal Transition Study-2
As conversational skills increased, so did the percentage of young adults who ever lived independently.
Unable to converse
A lot of trouble
A little trouble
No trouble conversing
6% 20% 14%
39%
Perc
ent e
ver l
ived
inde
pend
ently
Household income Source: National Longitudinal Transition Study-2
Fewer young adults from lower income households ever lived independently.
Up to $25K
$25K to $50K
$50K to $75K
More than $75K
0% 0% 3%
27%
Perc
ent e
ver l
ived
inde
pend
ently
Race/Ethnicity Source: National Longitudinal Transition Study-2
More white young adults with autism ever lived independently during their early 20s.
Hispanic Black Other race White
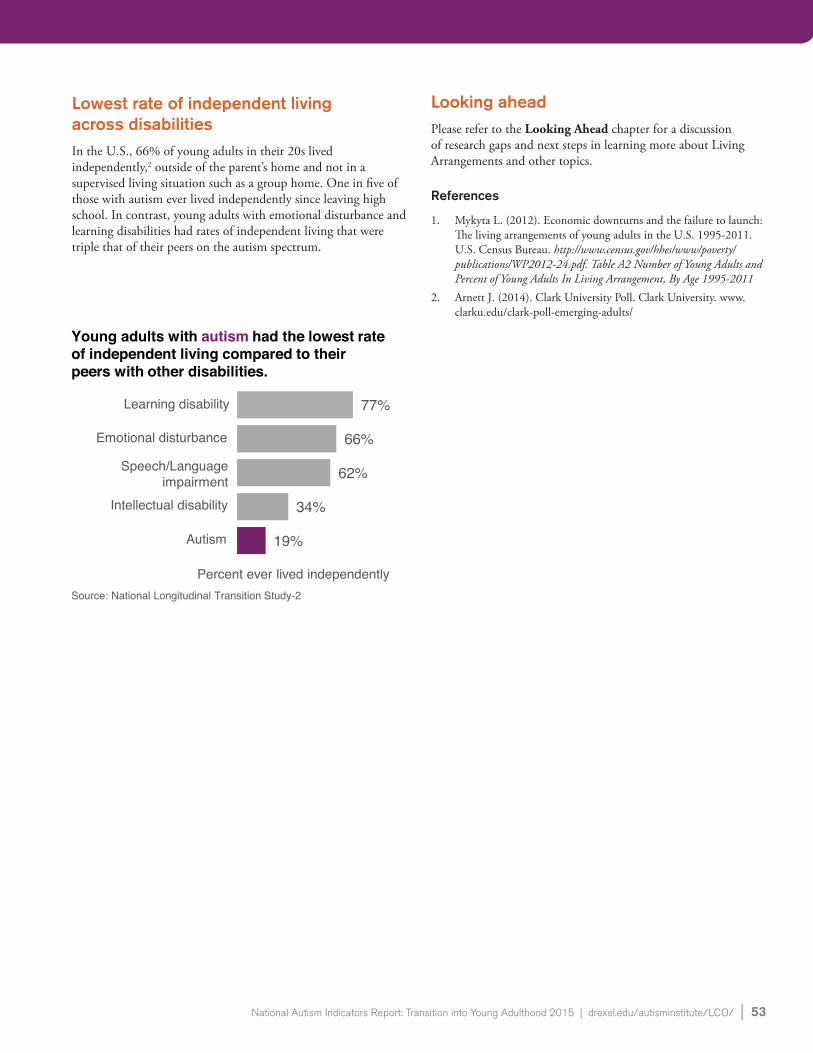
Lowest rate of independent living across disabilitiesIn the U.S., 66% of young adults in their 20s lived independently,2 outside of the parent’s home and not in a supervised living situation such as a group home. One in five of those with autism ever lived independently since leaving high school. In contrast, young adults with emotional disturbance and learning disabilities had rates of independent living that were triple that of their peers on the autism spectrum.
19%
34%
62%
66%
77%
Percent ever lived independently Source: National Longitudinal Transition Study-2
Young adults with autism had the lowest rate of independent living compared to their peers with other disabilities.
Learning disability
Emotional disturbance
Speech/Language impairment
Intellectual disability
Autism
Looking aheadPlease refer to the Looking Ahead chapter for a discussion of research gaps and next steps in learning more about Living Arrangements and other topics.
References
1. Mykyta L. (2012). Economic downturns and the failure to launch: The living arrangements of young adults in the U.S. 1995-2011. U.S. Census Bureau. http://www.census.gov/hhes/www/poverty/publications/WP2012-24.pdf. Table A2 Number of Young Adults and Percent of Young Adults In Living Arrangement, By Age 1995-2011
2. Arnett J. (2014). Clark University Poll. Clark University. www.clarku.edu/clark-poll-emerging-adults/
National Autism Indicators Report: Transition into Young Adulthood 2015 | drexel.edu/autisminstitute/LCO/ | 53

54 | National Autism Indicators Report: Transition into Young Adulthood 2015 | Living Arrangements

54 | National Autism Indicators Report: Transition into Young Adulthood 2015 | Living Arrangements
Social and Community Participation
Data from the National Longitudinal Transition Study-2 (NLTS2) indicates that 24% of young adults with autism experienced social isolation in the 12 months prior to taking the survey, and 32% had no participation in community or extracurricular activities. We note here that autistic adults may have a range of ideas about how much and what types of social interaction and community participation are important for their own quality of life.
Rates of social isolation and no community participation remained about the same between the high school years and young adulthood. Young adults had lower rates of social isolation if they had better conversational skills, were from higher income households, or ever lived with parents after high school.
Social and community participation matters. In previous chapters we talked about the importance of viewing life as an integrated whole. Social and community participation are prime examples about how the parts of our lives work together. When we interact with others in our daily lives at work or at school, we may find peers who share our interests. We might be invited to social activities in the community with colleagues who then become our friends. We also might get a chance to give back to our community.
When young adults on the autism spectrum are disconnected from work and continued schooling, sometimes opportunities for socialization, friendships and community participation may be absent as well. Those who cannot drive or use public transportation may have even more limited access to leisure activities outside
the home. On the flip side, our social networks expand our career and educational opportunities. Young adults who have less social and community participation likely have fewer opportunities to find out about jobs, schools, or training programs to further their learning.
Some were socially isolated.
Our key findings• Approximately one in four young adults with autism
was socially isolated. They never saw or talked with friends, and were never invited to social activities within the past year.
• Young adults had lower rates of social isolation if they had better conversational skills, were from higher income households, or ever lived with parents after high school.
• Nearly one in three young adults had no community participation in the past year – no volunteer or community service activities, no lessons or classes outside of school, or no other community activities outside of school.
24% of young adults with autism were socially isolated.
Some never saw or talked with friends, and were never invited to social activities, within the past year.
How do we know?
We used data from the National Longitudinal Transition Study-2 (NLTS2) to study the social and community participation of young adults on the autism spectrum.
National Autism Indicators Report: Transition into Young Adulthood 2015 | drexel.edu/autisminstitute/LCO/ | 55

56 | National Autism Indicators Report: Transition into Young Adulthood 2015 | Social and Community Participation0
Some participated in social and community activities within the past year.We examined whether young adults participated in key social and community activities within the past year. Approximately 76% of young adults participated in at least one type of social activity during the previous year, and 68% participated in at least one type of community activity.
Some had no participation in social and community activities within the past year.We also examined the absence of participation. Nearly half of young adults on the autism spectrum were never invited to social activities with friends and never talked with friends by phone within the prior 12 months. Well over half of young adults participated in no community activities over the past year, and close to 70% took no lessons or classes outside of school and did no volunteer service.
We looked at how young adults fared across social and community participation indicators. We considered young adults to be socially isolated if they never were invited to social activities, and never saw friends, and never talked with friends on the phone in the last 12 months. Approximately one in four young adults on the autism spectrum was socially isolated. We considered young adults to have no community participation if they never volunteered or performed community service, never took lessons or classes outside of school, and never attended community activities outside of school in the last 12 months. Approximately one in three young adults on the autism spectrum had no community participation.
46%
31%
35%
52%
61%
52%
Percent participated in activities in past year Source: National Longitudinal Transition Study-2
Over half of young adults with autism had any social interaction during the past year. Fewer had any community participation.
Invited to social activities with friends
Saw friends sometimes or often
Talked with friends on phone sometimes or often
Peformed volunteer or community service
Took lessons or classes outside of school
Participated in any community activities outside of school
54%
69%
65%
48%
39%
48%
Percent with no participation in past year Source: National Longitudinal Transition Study-2
Rates or no community participation in the past year were ever higher than rates of no social interaction.
Not invited to social activities with friends
Never saw friends
Never talked with friends on phone
No volunteer or community service
Never took lessons or classes outside of school
No participation in community activities outside of school
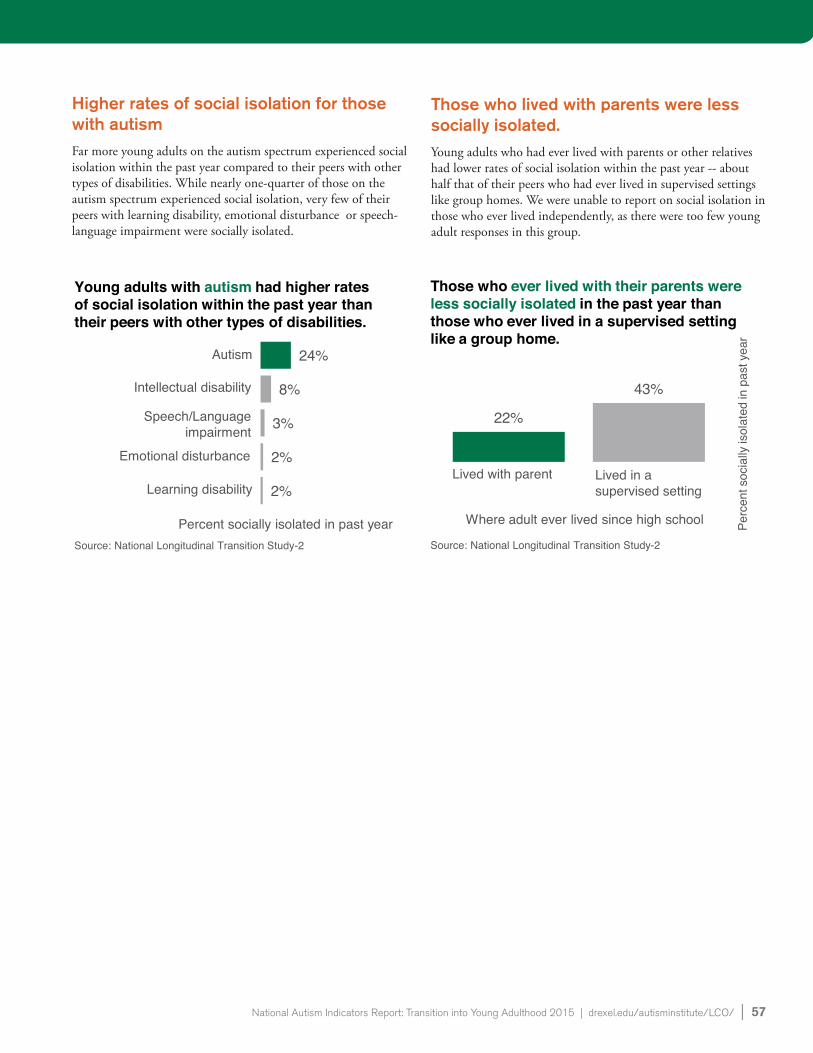
Higher rates of social isolation for those with autismFar more young adults on the autism spectrum experienced social isolation within the past year compared to their peers with other types of disabilities. While nearly one-quarter of those on the autism spectrum experienced social isolation, very few of their peers with learning disability, emotional disturbance or speech-language impairment were socially isolated.
Those who lived with parents were less socially isolated.Young adults who had ever lived with parents or other relatives had lower rates of social isolation within the past year -- about half that of their peers who had ever lived in supervised settings like group homes. We were unable to report on social isolation in those who ever lived independently, as there were too few young adult responses in this group.
2%
2%
3%
8%
24%
Percent socially isolated in past year Source: National Longitudinal Transition Study-2
Young adults with autism had higher rates of social isolation within the past year than their peers with other types of disabilities.
Autism
Intellectual disability
Speech/Language impairment
Emotional disturbance
Learning disability
22%
43%
Perc
ent s
ocia
lly is
olat
ed in
pas
t yea
r
Where adult ever lived since high school
Source: National Longitudinal Transition Study-2
Those who ever lived with their parents were less socially isolated in the past year than those who ever lived in a supervised setting like a group home.
Lived with parent Lived in a supervised setting
National Autism Indicators Report: Transition into Young Adulthood 2015 | drexel.edu/autisminstitute/LCO/ | 57

58 | National Autism Indicators Report: Transition into Young Adulthood 2015 | Social and Community Participation
44% 31%
14% 7%
Perc
ent s
ocia
lly is
olat
ed
Conversation ability Source: National Longitudinal Transition Study-2
As conversation ability increased, the percentage of young adults with autism who were socially isolated in the past year decreased.
Unable to converse
A lot of trouble
A little trouble
No trouble conversing
Level of impairment, household income and race/ethnicity were associated with social isolation.When people have difficulties with social skills, challenging behaviors, or communication, it may be harder for them to socially participate in their communities. Young adults who had greater difficulty with conversational abilities experienced a rate of social isolation that was six times that of their peers who had no difficulty conversing.
Economic disadvantage may also affect access to opportunities for social participation. Young adults on the autism spectrum who were from lower income households had a rate of social isolation twice that of those from higher income households. Young adults who were Hispanic, or who identified as a race other than black or white, had higher rates of social isolation within the past year.
33% 30% 21% 15%
Perc
ent s
ocia
lly is
olat
ed
Household income Source: National Longitudinal Transition Study-2
As household income increased, the percentage of young adults with autism who were socially isolated within the past year decreased.
Up to $25K
$25K to $50K
$50K to $75K
More than $75K
42%
18%
39% 23%
Perc
ent s
ocia
lly is
olat
ed
Race/Ethnicity Source: National Longitudinal Transition Study-2
Hispanic young adults had the highest rate of social isolation within the past year.
Hispanic Black Other race White

Wide variety of leisure activitiesIt is not uncommon to hear parents of young adults on the autism spectrum express alarm that their young adult is spending large amounts of time at home playing video games instead of working or attending school. We examined what parents and young adults reported about how autistic young adults spent their time and found a variety of activities. We do not know whether these activities were done with other people or alone.
Half of young adults had driving privileges and one-third were registered to vote.While ability to drive is not necessary for social interaction and community participation, it does enhance independence and access to activities as well as eliminating a barrier to employment. Civic participation is another key form of adult independence as well as community participation. NLTS2 data indicates that nearly 30% of young adults on the autism spectrum had a driver’s license or their learner’s permit. Over half were registered to vote.
10%
12%
17%
17%
20%
23%
24%
25%
28%
50%
Chores, cooking, gardening
With friends or on dates
Outdoor or physical activities
Did homework or studied
Read books, wrote, library
Visited with family members
Electronic games
Used computer
Listened to music
Watched TV
Percent did activity over past week Source: National Longitudinal Transition Study-2
Young adults with autism spent their leisure time in a variety of ways.
51% of young adults with autism were registered to vote.
Civic participation is a key form of adult independence and community participation.
29% of young adults with autism had a driver's license or a learner's permit.
Ability to drive enhances independence and access to social and community activities.
Looking aheadPlease refer to the Looking Ahead chapter for discussion of research gaps and next steps in learning more about Social and Community Participation and other topics.
National Autism Indicators Report: Transition into Young Adulthood 2015 | drexel.edu/autisminstitute/LCO/ | 59

60 | National Autism Indicators Report: Transition into Young Adulthood 2015 | Social and Community Participation

Safety and Risk
Safety matters.In general, there is little published research on the topics of safety and risk for youth and young adults with autism. Safety and risk concerns occur in many settings. In this chapter, we provide baseline statistics on a range of topics including bullying, wandering behavior, individual risk behaviors and criminal justice involvement.
We used data from the National Longitudinal Transition Study-2 (NLTS2) to examine bullying involvement during the high school years, risk behaviors in adulthood, and criminal justice involvement. Safety and risk behaviors statistics came from reports by a smaller group of young adults who were capable of responding to the NLTS2 questions.
We also used data from the Survey of Pathways to Diagnosis and Services (Pathways) to report on wandering behavior in adolescents.
Vulnerability
Our key findings• Nearly half of youth on the autism spectrum were
victims of bullying during high school.• Over one-quarter (27%) of adolescents engaged
in some type of wandering behavior in which they impulsively left a supervised situation, increasing their risk of becoming lost and going missing.
• Young adults reported very low rates of criminal justice involvement. Approximately 4% of young adults reported being stopped and questioned by police.
• Approximately one-quarter of autistic young adults who were able to self-report said they ever had sexual intercourse. Around one-third of these used protection or birth control.
47% of youth with autism were victims of bullying during high school.
Being bullied is associated with higher rates of depression, anxiety, and loneliness.
Youth experienced high rates of teasing and bullying.One of the few topics in this chapter with existing research is bullying. Our prior work found that nearly half of adolescents with autism were victims of bullying and almost 15% were perpetrators of bullying.1 This victimization rate is higher than the 28% of youth in the general population who report being bullied.2
NLTS2 data indicates that nearly 47% of youth with autism were victims of bullying during high school. We defined bullying as including both physical bullying and verbal teasing. Teasing and name calling was the most frequent type of bullying experience. One in four reported being bullied or picked on by other students either at school or on the way to/from school. Fewer said they were physically attacked or in fights at school or on the way to/from school. Over one in 10 reported that they engaged in bullying or teasing other students.
National Autism Indicators Report: Transition into Young Adulthood 2015 | drexel.edu/autisminstitute/LCO/ | 61

62 | National Autism Indicators Report: Transition into Young Adulthood 2015 | Safety and Risk
11%
17%
17%
27%
44%
47%
Percent experienced threat Source: National Longitudinal Transition Study-2
Was teased or called names at school
Was bullied or picked on
Had things stolen at school
Was physically attacked or in fights at school
Youth bullied or picked on others at school
Was bullied or teased at school
Nearly half of youth with autism experienced threats and bullying.
High rates of wandering in adolescenceWandering, or impulsively leaving a supervised situation and sometimes becoming lost, is another serious topic we know little about. A recent study found that 27% of 8- to 11-year-old youth with autism wandered – a behavior which continued at lower rates into the teenage years and was more frequent in those with lower levels of intellectual and communication abilities.3 Wandering is dangerous for people with autism as they may have difficulty sensing malicious intent from others, may not be able to realize they need help or ask for help, and sometimes become lost and go missing.
Parents of adolescents with autism (ages 15-17 years) answered Pathways survey questions about wandering behaviors of youth within the previous year. We looked at four types of wandering: wandering from public places, from home, from school/day care/summer camp, or from someone else’s home. Youth with autism most often wandered off or became
lost in public places like stores, restaurants, playgrounds, and campsites. Some also wandered away from home and others from school, day care, or summer camp. Fewer wandered off or became lost from someone else’s home such as a relative, friend, neighbor, or babysitter. Over 27% of adolescents engaged in at least one of these types of wandering within the previous year.
One-quarter of parents of adolescents with autism said they used fences, gates, locks, alarms, or other barriers to prevent wandering or becoming lost at home. Over 3% reported that their youth wore a tracking device to help locate the youth if he or she wandered off.
3%
25%
Percentage of parents of 15-17 year olds
Source: Survey of Pathways to Services and Diagnosis
Added fences or barriers to prevent wandering
Child wore a tracking device
Parents of adolescents with autism mostly used fences or other barriers to prevent youth from wandering.
How do we know?
We used data from the National Longitudinal Transition Study-2 (NLTS2) and the Survey of Pathways to Diagnosis and Services (Pathways) to study the safety and risk experiences of youth and young adults on the autism spectrum.
7%
10%
14%
16%
Percent wandered in last 12 months
Source: Survey of Pathways to Services and Diagnosis
Store or public place
School
Home
Someone else's home
15- to 17-year-old youth with autism wandered more often from public places and school.

In Their own Voices
Perceived safety and risk behaviors in young adulthoodA strong majority (93%) of autistic young adults who were capable of completing the NLTS2 reported feeling safe in their own neighborhood. The NLTS2 did not ask young adults about their experiences with bullying or harassment.
Autistic young adults who were capable of responding to NLTS2 questions were asked about a wider range of high-risk behaviors. About one-third (31%) reported having at least one drink of alcohol in the past month, and 15% reported smoking cigarettes in the past month. Nearly 14% had carried a weapon in the last 30 days. Approximately 8% of young adults said they had used marijuana, cocaine, or other illegal drugs in the past 30 days (which were illegal at the time of the survey). Approximately one-quarter (22%) of young adults reported they had ever had sexual intercourse. Of these, 37% reported using a condom and 54% reported use of birth control.
Nearly 80% of autistic young adults engaged in no risk behaviors (62%) or one (17%).
62%
17% 7% 3%
11%
0 1 2 3 4
Source: National Longitudinal Transition Study-2
Most young adults who self-reported risk behaviors said they engaged in none of the risk behaviors on the survey.
Number of reported risk behaviors
Low rates of involvement with criminal justice Autistic young adults also reported on their involvement with the criminal justice system. Rates of criminal justice involvement were very low. Similar to youth, very few young adults experienced being arrested within the past two years (<1%) or since leaving high school (<2%). The number of young adults who stayed overnight in jail in the last two years was too low to report, and only .5% had been on probation or parole. However, nearly 4% reported being stopped and questioned by police within the past two years.
It is important to note that statistics on criminal justice involvement may be higher when examining whether young adults have ever had interactions with law enforcement, which may be important to consider given that criminal justice records have some bearing on future employment, schooling, and living arrangements.
Looking aheadPlease refer to the Looking Ahead chapter for discussion of research gaps and next steps in learning more about Safety and Risk and other topics.
References
1. Sterzing PR, Shattuck PT, Narendorf SC, Wagner MW, and Cooper BP. (2012). Bullying involvement and autism spectrum disorders: Prevalence and correlates of bullying involvement among adolescents with an autism spectrum disorder. Archives of Pediatric and Adolescent Medicine 166(11):1058-1064.
2. Robers S, Kemp J, and Truman J. (2013). Indicators of School Crime and Safety: 2012 (NCES 2013-036/ NCJ 241446). National Center for Education Statistics, U.S. Department of Education, and Bureau of Justice Statistics, Office of Justice Programs, U.S. Department of Justice. Washington, DC.
3. Anderson C, Law JK, Daniels A, Rice C, Mandell DS, Hagopian L, and Law PA. (2012). Occurrence and family impact of elopement in children with autism spectrum disorders. Pediatrics 130: 870-877.
National Autism Indicators Report: Transition into Young Adulthood 2015 | drexel.edu/autisminstitute/LCO/ | 63

64 | National Autism Indicators Report: Transition into Young Adulthood 2015 | Safety and Risk

What next?… Looking Ahead
Research gaps
National level challenges require national level data to develop and evaluate solutions. Improving systems of care depends on having useful information about who needs what and whether people receive the help they may need.
Indicators are a vital tool in the quest to help people on the autism spectrum thrive to the best of their abilities and enjoy a high quality of life. They help us track outcomes and needs in relation to the quality and impact of services. They help us detect trends and changes at the population level, improve programs and policies, and monitor progress toward goals at a national level. They tell us whether things are truly getting better over time.
Without a rich array of national level indicators we lack the evidence-base needed to inform decisions and systems change efforts. Unfortunately, we do not have a system of routinely updated, current and useful indicators that report specifically about the experiences of people with autism.
This edition of the National Autism Indicators Report details some of what we do know about transition-age youth with autism as they age into young adulthood. In each chapter of this report, we highlighted the best national level indicators at our disposal for knowing how we are doing with serving adults with autism. Between these few data points lay gaping holes in our knowledge.
We conclude this report by noting the most significant research gaps.
• Our current indicators of how young adults with autism are doing largely fail to consider what young adults want for themselves, how they feel about their lives, and other important measures of quality of life.
• We do not know why so many youth are not connecting to work and continued education after high school. We need additional research to discover the things that lead to better outcomes and prevent disconnection.
• We have few indicators about health and mental health. We have hints that the rate of co-occurring disorders in adulthood is high, and we can surmise that these additional challenges likely affect functioning and outcomes. However, we have no way to know how co-occurring disorders specifically affect people and how to best help them.
• We have very little information about safety and risk issues that people with autism encounter in their daily lives. Yet, this information is vital for improving our communities to be more welcoming of those on the autism spectrum.
• Our knowledge base virtually ends at the age of 25.
We believe that people on the autism spectrum are valuable members of our communities. We urge the creation of a better system of population-level indicators that can track whether our nation is making meaningful progress to help people with autism have more meaningful social roles and achieve their full potential to be contributing members of society.
National Autism Indicators Report: Transition into Young Adulthood 2015 | drexel.edu/autisminstitute/LCO/ | 65

66 | National Autism Indicators Report: Transition into Young Adulthood 2015 | Appendix – Methods
Appendix — Methods
Data sourcesWhat data did we use for this report?
All data for this report came from federally funded national surveys.
The National Longitudinal Transition Study – 2 (NLTS2) was funded by the Institute of Education Sciences (IES) and followed secondary school students with disabilities into young adulthood from 2000-2009. The NLTS2 phone interviews and mail surveys gathered a combination of youth and parent responses. In the case that youth were unable to complete the interview or survey process themselves, parent responses were used. The survey asked about high school experiences, academic performance, extracurricular activities, postsecondary education and training, adult services, employment, independent living, community participation, and other topics. To learn more about the NLTS2, visit http://www.nlts2.org/
The 2011 Survey of Pathways to Diagnosis and Services (Pathways) studied children with special health care needs ages 6 -17 years as a follow-up study to the 2009-2010 National Survey of Children with Special Health Care Needs (NS-CSHCN). The study was meant to help understand the diagnostic and treatment experiences of children who were ever diagnosed with an autism spectrum disorder, developmental delay, or intellectual disability. We used Pathways data from parents of children with ASD who were ages 15-17 years and who were getting special education services. We also looked back to some of the answers that parents gave during the NS-CSHCN to learn more about their health care transition experiences. For more information about the Pathways survey, visit http://www.cdc.gov/nchs/slaits/spds.htm or http://childhealthdata.org/learn/topics_questions
Data analysisHow did we analyze the NLTS2 data for this report?
We presented descriptive data for key indicators in this report. We used percentages to convey how often characteristics, experiences, and outcomes happen. The findings do not tell us whether the differences between groups were statistically significant, but they do provide baseline information that will help us understand changes over time.
To read more about NLTS2 methods, visit http://www.nlts2.org/reports/2011_09_02/nlts2_report_2011_09_02_ch1.pdf
The estimates in this report may be slightly different from estimates found in some of our published scientific articles. These differences do not represent errors in reporting, but rather, variation in analytical methods such as how we handled missing data. As in our scientific articles, the outcomes figures in this report are primarily derived from the NLTS2 and generalize to all U.S. youth who were ages 13-16 and enrolled in special education at the study’s start in 2001.


Life Course OutcomesResearch ProgramA.J. DREXEL AUTISM INSTITUTE, DREXEL UNIVERSITY
Life Course Outcomes Research ProgramA.J. Drexel Autism Institute3020 Market St., Suite 560Philadelphia, PA 19104-3734drexel.edu/autisminstitute/LCO/ www.facebook.com/autismlco @autismlco
Related Documents