Welcome message from author
This document is posted to help you gain knowledge. Please leave a comment to let me know what you think about it! Share it to your friends and learn new things together.
Transcript
i
National Oral Health Survey Sri Lanka
2015-2016
Ministry of Health, Nutrition and Indigenous Medicine Suwasiripaya,
385, Rev. Baddegama Wimalawansa Thero Mawatha,
Colombo 10, Sri Lanka.
2018
iiNational Oral Health Survey Sri Lanka 2015-2016
ii
National Oral Health Survey Sri Lanka 2015-2016
© Ministry of Health, Nutrition and Indigenous Medicine
This work is copyright. It may be reproduced in whole or in part for study or training purposes subject to the inclusion of an acknowledgement of the source and no commercial usage or sale. Reproduction other than those indicated above requires written permission from the Ministry of Health, Nutrition and Indigenous Medicine.
Published by:
Ministry of Health, Nutrition and Indigenous Medicine, 385, Rev. Baddegama Wimalawansa Thero Mawatha, Colombo 10, Sri Lanka
December 2018
Copies can be obtained from:
Hard copies:
Deputy Director General (Dental Services), Ministry of Health, Nutrition and Indigenous Medicine, 385, Rev. Baddegama Wimalawansa Thero Mawatha, Colombo 10, Sri Lanka
Web: http://www.moh.gov.lk
Library catalog-in-publication:
Suggested citation:
National Oral Health Survey Sri Lanka 2015-2016. Colombo: Ministry of Health, Nutrition and Indigenous Medicine (Sri Lanka); 2018
Bibliography:
ISBN 978-955-3666-29-1
1. Oral disease pattern-Sri Lanka 2. Dental public health-Sri Lanka 3. Oral health surveys-Sri Lanka 4. Dental service utilization-Sri Lanka 5. Oral health practices-Sri Lanka 6. Oral health habits-Sri Lanka
Printing: Deepanee Printers and Publishers Ltd. 464, Highlevel Road, Gangodawila, Nugegoda, Sri Lanka
iiiNational Oral Health Survey Sri Lanka 2015-2016
iii
Message from the Director General of Health Services
It is with immense pleasure I forward this message to the report of the 4th National Oral Health Survey of Sri Lanka.
With the vision of building a healthier nation, Ministry of Health identified the importance of providing oral health services in order to reduce the oral disease burden in this country.
Periodic evaluation of oral health status of the population is important for any country. National Oral Health Surveys reveals a snapshot view of prevalence and severity of main oral diseases, habits related to oral health and oral health care utilization pattern of the country. Such information is important in planning, implementation, monitoring and evaluation of national oral health programmes. Furthermore, such information is useful for policymakers to assess disease trends which could be used in policy formulation with regards to future oral health needs of a country.
Sri Lanka has conducted three National Oral Health Surveys in years 1983-1984, 1994-1995 and 2002-2003. The current survey, which is the fourth one, was conducted in the years 2015-2016 unveils the updated oral health status of the Sri Lankan population. The socio-economic, demographic and other changes in the social strata encountered during the past decade will be reflected in the findings of this report.
I take this opportunity to commend the service rendered by the team who worked tirelessly towards the success of the fourth National Oral Health Survey. I appreciate the dedicated service rendered by Dr J. M. W. Jayasundara Bandara former Director General of Health Services. Finally, I would like to thank the WHO country office for assistance given for the survey.
Dr. Anil Jasinghe
Director General of Health Services
ii
National Oral Health Survey Sri Lanka 2015-2016
© Ministry of Health, Nutrition and Indigenous Medicine
This work is copyright. It may be reproduced in whole or in part for study or training purposes subject to the inclusion of an acknowledgement of the source and no commercial usage or sale. Reproduction other than those indicated above requires written permission from the Ministry of Health, Nutrition and Indigenous Medicine.
Published by:
Ministry of Health, Nutrition and Indigenous Medicine, 385, Rev. Baddegama Wimalawansa Thero Mawatha, Colombo 10, Sri Lanka
December 2018
Copies can be obtained from:
Hard copies:
Deputy Director General (Dental Services), Ministry of Health, Nutrition and Indigenous Medicine, 385, Rev. Baddegama Wimalawansa Thero Mawatha, Colombo 10, Sri Lanka
Web: http://www.moh.gov.lk
Library catalog-in-publication:
Suggested citation:
National Oral Health Survey Sri Lanka 2015-2016. Colombo: Ministry of Health, Nutrition and Indigenous Medicine (Sri Lanka); 2018
Bibliography:
ISBN 978-955-3666-29-1
1. Oral disease pattern-Sri Lanka 2. Dental public health-Sri Lanka 3. Oral health surveys-Sri Lanka 4. Dental service utilization-Sri Lanka 5. Oral health practices-Sri Lanka 6. Oral health habits-Sri Lanka
Printing: Deepanee Printers and Publishers Ltd. 464, Highlevel Road, Gangodawila, Nugegoda, Sri Lanka
ivNational Oral Health Survey Sri Lanka 2015-2016
iv
Executive summary
Oral health is an integral part of general health and therefore essential for the wellbeing and quality of life of an individual. Moreover, high prevalence of oral disease combined with limited availability of oral health services to manage these conditions lead to a significant socio-economic burden on the society. Therefore in view of avoiding these adverse effects, it is important to have sound oral health policies and essential oral healthcare services to the society combined with sound monitoring mechanisms. For this purpose, regular assessment of oral disease burden and dental service utilization pattern of the society is essential.
In order to fulfill this vital task, the Ministry of Health Sri Lanka has been conducting National Oral Health Surveys periodically since 1984. Three surveys had already been conducted and this report presents the summarized results of the 4th National Oral Health Survey, which was conducted in 2015-2016.
The results provide a snap-shot view of oral disease burden and dental service utilization pattern of the society. In addition, these results will also supplement and update the existing oral health databases on the Sri Lankan population. Therefore, the results could be useful to assess the effectiveness of the oral healthcare services provided, for planning of oral health services at national, provincial and district levels as well as to compare the oral disease trends over the years.
Ten thousand (10000) participants, comprising 2000 each from 5-year-old, 12-year-old, 15-year-old, 35-44-year-old and 65-74-year-old age groups were selected as the sample. Selection of age groups, assessment criteria of oral health status and its associated factors were principally based on the guidelines recommended by the World Health Organization; presented in Oral Health Surveys Basic Methods 5th Edition. However, few modifications were made to suit the country requirements. Multi-stage sampling technique was used for selection of participants. In the first stage, 100 clusters (schools) were selected using Probability Proportionate to Size (PPS) sampling technique representing all administrative districts of the country. A school was considered as the primary cluster-unit. In the second stage, participants were identified from the selected clusters. Systematic sampling technique was used to select 5-year-olds, 12-year-olds and 15-year-olds from schools. The other two groups; 35-44-year-olds and 65-74-year-olds were selected from the vicinity of the selected school by house-to-house visits while maintaining the sex ratio of the country.
Data were collected by the means of an interviewer administered questionnaire and a clinical oral examination. The clinical examination was performed under natural light using sterile instruments while the subject was in seated position on a normal school/household chair. Twenty nine (29) dental surgeons with postgraduate qualifications in Community Dentistry functioned as examiners and school dental therapists functioned as data recorders. All were trained and calibrated for the survey criteria and methods before data collection. Administrative clearance for the survey was obtained from relevant authorities.
Data entry and analysis were performed by using Census and Survey Processing system (CSPro) and Statistical Package for the Social Sciences (SPSS) software respectively. After data cleaning and editing, data from a total of 9935 participants were available for analysis. Data were presented as percentages and mean values (with SD) whenever appropriate. Considering country requirements, sub-sector variations; sex, ethnicity, sector (urban/rural) and district variations, were also presented.
Key findings of the survey are given in the Table A. When compared with the findings of previous National Oral Health Surveys, there was a reduction in the oral disease burden, improvement in oral health habits and the use of oral healthcare services. However, the prevalence of untreated disease was still substantially high among all age groups. It was also evident that dental service utilization was mainly for obtaining emergency care. Moreover, Tamils and rural population had a higher disease burden and poor oral health habits than other ethnic groups; Sinhalese and Muslims, and urban population respectively. Hence, the above issues need to be addressed to improve oral health status of the Sri Lankan population.
vNational Oral Health Survey Sri Lanka 2015-2016
iv
Executive summary
Oral health is an integral part of general health and therefore essential for the wellbeing and quality of life of an individual. Moreover, high prevalence of oral disease combined with limited availability of oral health services to manage these conditions lead to a significant socio-economic burden on the society. Therefore in view of avoiding these adverse effects, it is important to have sound oral health policies and essential oral healthcare services to the society combined with sound monitoring mechanisms. For this purpose, regular assessment of oral disease burden and dental service utilization pattern of the society is essential.
In order to fulfill this vital task, the Ministry of Health Sri Lanka has been conducting National Oral Health Surveys periodically since 1984. Three surveys had already been conducted and this report presents the summarized results of the 4th National Oral Health Survey, which was conducted in 2015-2016.
The results provide a snap-shot view of oral disease burden and dental service utilization pattern of the society. In addition, these results will also supplement and update the existing oral health databases on the Sri Lankan population. Therefore, the results could be useful to assess the effectiveness of the oral healthcare services provided, for planning of oral health services at national, provincial and district levels as well as to compare the oral disease trends over the years.
Ten thousand (10000) participants, comprising 2000 each from 5-year-old, 12-year-old, 15-year-old, 35-44-year-old and 65-74-year-old age groups were selected as the sample. Selection of age groups, assessment criteria of oral health status and its associated factors were principally based on the guidelines recommended by the World Health Organization; presented in Oral Health Surveys Basic Methods 5th Edition. However, few modifications were made to suit the country requirements. Multi-stage sampling technique was used for selection of participants. In the first stage, 100 clusters (schools) were selected using Probability Proportionate to Size (PPS) sampling technique representing all administrative districts of the country. A school was considered as the primary cluster-unit. In the second stage, participants were identified from the selected clusters. Systematic sampling technique was used to select 5-year-olds, 12-year-olds and 15-year-olds from schools. The other two groups; 35-44-year-olds and 65-74-year-olds were selected from the vicinity of the selected school by house-to-house visits while maintaining the sex ratio of the country.
Data were collected by the means of an interviewer administered questionnaire and a clinical oral examination. The clinical examination was performed under natural light using sterile instruments while the subject was in seated position on a normal school/household chair. Twenty nine (29) dental surgeons with postgraduate qualifications in Community Dentistry functioned as examiners and school dental therapists functioned as data recorders. All were trained and calibrated for the survey criteria and methods before data collection. Administrative clearance for the survey was obtained from relevant authorities.
Data entry and analysis were performed by using Census and Survey Processing system (CSPro) and Statistical Package for the Social Sciences (SPSS) software respectively. After data cleaning and editing, data from a total of 9935 participants were available for analysis. Data were presented as percentages and mean values (with SD) whenever appropriate. Considering country requirements, sub-sector variations; sex, ethnicity, sector (urban/rural) and district variations, were also presented.
Key findings of the survey are given in the Table A. When compared with the findings of previous National Oral Health Surveys, there was a reduction in the oral disease burden, improvement in oral health habits and the use of oral healthcare services. However, the prevalence of untreated disease was still substantially high among all age groups. It was also evident that dental service utilization was mainly for obtaining emergency care. Moreover, Tamils and rural population had a higher disease burden and poor oral health habits than other ethnic groups; Sinhalese and Muslims, and urban population respectively. Hence, the above issues need to be addressed to improve oral health status of the Sri Lankan population.
v
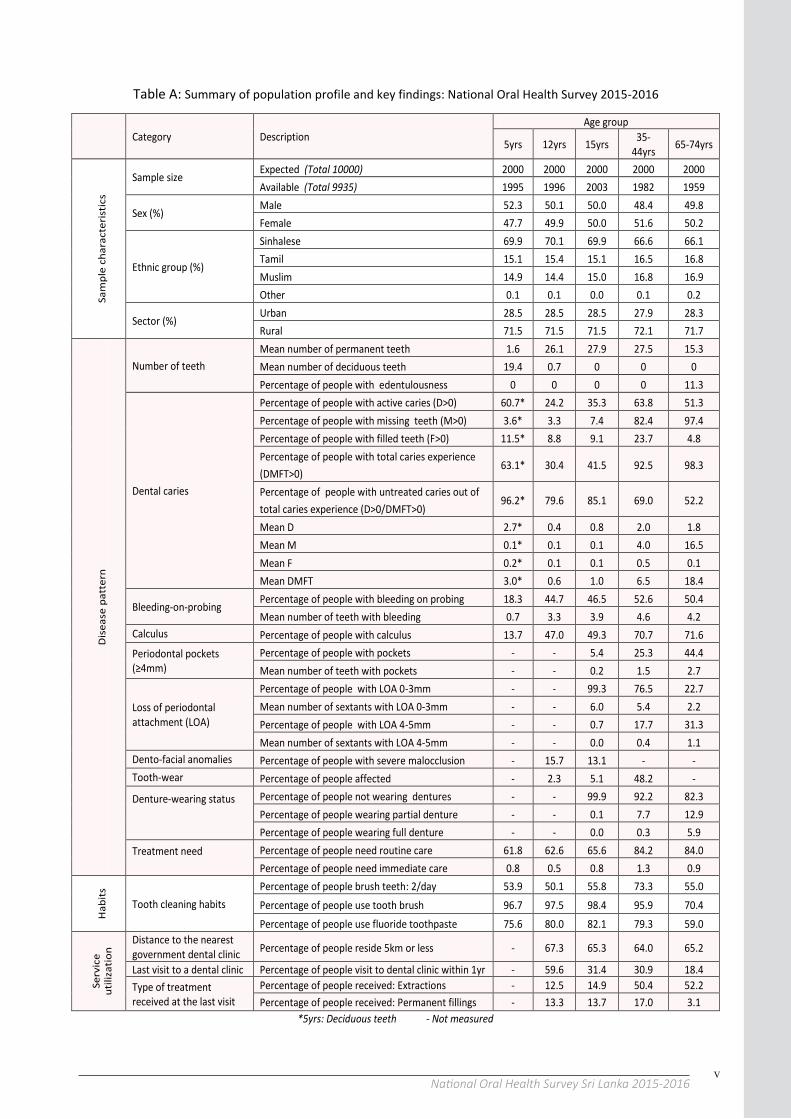
Table A: Summary of population profile and key findings: National Oral Health Survey 2015-2016
Category Description Age group
5yrs 12yrs 15yrs 35-44yrs 65-74yrs
Sam
ple
char
acte
ristic
s
Sample size Expected (Total 10000) 2000 2000 2000 2000 2000 Available (Total 9935) 1995 1996 2003 1982 1959
Sex (%) Male 52.3 50.1 50.0 48.4 49.8 Female 47.7 49.9 50.0 51.6 50.2
Ethnic group (%)
Sinhalese 69.9 70.1 69.9 66.6 66.1 Tamil 15.1 15.4 15.1 16.5 16.8 Muslim 14.9 14.4 15.0 16.8 16.9 Other 0.1 0.1 0.0 0.1 0.2
Sector (%) Urban 28.5 28.5 28.5 27.9 28.3 Rural 71.5 71.5 71.5 72.1 71.7
Dise
ase
patt
ern
Number of teeth Mean number of permanent teeth 1.6 26.1 27.9 27.5 15.3 Mean number of deciduous teeth 19.4 0.7 0 0 0 Percentage of people with edentulousness 0 0 0 0 11.3
Dental caries
Percentage of people with active caries (D>0) 60.7* 24.2 35.3 63.8 51.3 Percentage of people with missing teeth (M>0) 3.6* 3.3 7.4 82.4 97.4 Percentage of people with filled teeth (F>0) 11.5* 8.8 9.1 23.7 4.8 Percentage of people with total caries experience (DMFT>0)
63.1* 30.4 41.5 92.5 98.3
Percentage of people with untreated caries out of total caries experience (D>0/DMFT>0)
96.2* 79.6 85.1 69.0 52.2
Mean D 2.7* 0.4 0.8 2.0 1.8 Mean M 0.1* 0.1 0.1 4.0 16.5 Mean F 0.2* 0.1 0.1 0.5 0.1 Mean DMFT 3.0* 0.6 1.0 6.5 18.4
Bleeding-on-probing Percentage of people with bleeding on probing 18.3 44.7 46.5 52.6 50.4 Mean number of teeth with bleeding 0.7 3.3 3.9 4.6 4.2
Calculus Percentage of people with calculus 13.7 47.0 49.3 70.7 71.6 Periodontal pockets (≥4mm)
Percentage of people with pockets - - 5.4 25.3 44.4 Mean number of teeth with pockets - - 0.2 1.5 2.7
Loss of periodontal attachment (LOA)
Percentage of people with LOA 0-3mm - - 99.3 76.5 22.7 Mean number of sextants with LOA 0-3mm - - 6.0 5.4 2.2 Percentage of people with LOA 4-5mm - - 0.7 17.7 31.3 Mean number of sextants with LOA 4-5mm - - 0.0 0.4 1.1
Dento-facial anomalies Percentage of people with severe malocclusion - 15.7 13.1 - - Tooth-wear Percentage of people affected - 2.3 5.1 48.2 -
Denture-wearing status
Percentage of people not wearing dentures - - 99.9 92.2 82.3 Percentage of people wearing partial denture - - 0.1 7.7 12.9 Percentage of people wearing full denture - - 0.0 0.3 5.9
Treatment need
Percentage of people need routine care 61.8 62.6 65.6 84.2 84.0 Percentage of people need immediate care 0.8 0.5 0.8 1.3 0.9
Habi
ts
Tooth cleaning habits Percentage of people brush teeth: 2/day 53.9 50.1 55.8 73.3 55.0 Percentage of people use tooth brush 96.7 97.5 98.4 95.9 70.4 Percentage of people use fluoride toothpaste 75.6 80.0 82.1 79.3 59.0
Serv
ice
utili
zatio
n
Distance to the nearest government dental clinic Percentage of people reside 5km or less - 67.3 65.3 64.0 65.2
Last visit to a dental clinic Percentage of people visit to dental clinic within 1yr - 59.6 31.4 30.9 18.4 Type of treatment received at the last visit
Percentage of people received: Extractions - 12.5 14.9 50.4 52.2 Percentage of people received: Permanent fillings - 13.3 13.7 17.0 3.1
*5yrs: Deciduous teeth - Not measured
v
Table A: Summary of population profile and key findings: National Oral Health Survey 2015-2016
Category Description Age group
5yrs 12yrs 15yrs 35-44yrs 65-74yrs
Sam
ple
char
acte
ristic
s
Sample size Expected (Total 10000) 2000 2000 2000 2000 2000 Available (Total 9935) 1995 1996 2003 1982 1959
Sex (%) Male 52.3 50.1 50.0 48.4 49.8 Female 47.7 49.9 50.0 51.6 50.2
Ethnic group (%)
Sinhalese 69.9 70.1 69.9 66.6 66.1 Tamil 15.1 15.4 15.1 16.5 16.8 Muslim 14.9 14.4 15.0 16.8 16.9 Other 0.1 0.1 0.0 0.1 0.2
Sector (%) Urban 28.5 28.5 28.5 27.9 28.3 Rural 71.5 71.5 71.5 72.1 71.7
Dis
ease
pat
tern
Number of teeth Mean number of permanent teeth 1.6 26.1 27.9 27.5 15.3 Mean number of deciduous teeth 19.4 0.7 0 0 0 Percentage of people with edentulousness 0 0 0 0 11.3
Dental caries
Percentage of people with active caries (D>0) 60.7* 24.2 35.3 63.8 51.3 Percentage of people with missing teeth (M>0) 3.6* 3.3 7.4 82.4 97.4 Percentage of people with filled teeth (F>0) 11.5* 8.8 9.1 23.7 4.8 Percentage of people with total caries experience (DMFT>0)
63.1* 30.4 41.5 92.5 98.3
Percentage of people with untreated caries out of total caries experience (D>0/DMFT>0)
96.2* 79.6 85.1 69.0 52.2
Mean D 2.7* 0.4 0.8 2.0 1.8 Mean M 0.1* 0.1 0.1 4.0 16.5 Mean F 0.2* 0.1 0.1 0.5 0.1 Mean DMFT 3.0* 0.6 1.0 6.5 18.4
Bleeding-on-probing Percentage of people with bleeding on probing 18.3 44.7 46.5 52.6 50.4 Mean number of teeth with bleeding 0.7 3.3 3.9 4.6 4.2
Calculus Percentage of people with calculus 13.7 47.0 49.3 70.7 71.6 Periodontal pockets (≥4mm)
Percentage of people with pockets - - 5.4 25.3 44.4 Mean number of teeth with pockets - - 0.2 1.5 2.7
Loss of periodontal attachment (LOA)
Percentage of people with LOA 0-3mm - - 99.3 76.5 22.7 Mean number of sextants with LOA 0-3mm - - 6.0 5.4 2.2 Percentage of people with LOA 4-5mm - - 0.7 17.7 31.3 Mean number of sextants with LOA 4-5mm - - 0.0 0.4 1.1
Dento-facial anomalies Percentage of people with severe malocclusion - 15.7 13.1 - - Tooth-wear Percentage of people affected - 2.3 5.1 48.2 -
Denture-wearing status
Percentage of people not wearing dentures - - 99.9 92.2 82.3 Percentage of people wearing partial denture - - 0.1 7.7 12.9 Percentage of people wearing full denture - - 0.0 0.3 5.9
Treatment need
Percentage of people need routine care 61.8 62.6 65.6 84.2 84.0 Percentage of people need immediate care 0.8 0.5 0.8 1.3 0.9
Hab
its
Tooth cleaning habits Percentage of people brush teeth: 2/day 53.9 50.1 55.8 73.3 55.0 Percentage of people use tooth brush 96.7 97.5 98.4 95.9 70.4 Percentage of people use fluoride toothpaste 75.6 80.0 82.1 79.3 59.0
Serv
ice
utili
zatio
n
Distance to the nearest government dental clinic Percentage of people reside 5km or less - 67.3 65.3 64.0 65.2
Last visit to a dental clinic Percentage of people visit to dental clinic within 1yr - 59.6 31.4 30.9 18.4 Type of treatment received at the last visit
Percentage of people received: Extractions - 12.5 14.9 50.4 52.2 Percentage of people received: Permanent fillings - 13.3 13.7 17.0 3.1
*5yrs: Deciduous teeth - Not measured
viNational Oral Health Survey Sri Lanka 2015-2016
vi
National Oral Health Survey team 2015-2016 Principal Investigator
Dr. U.S. Usgodaarachchi MD, MSc(Com.Dent.) Consultant in Community Dentistry Advisory Committee
Professor S.L. Ekanayake Professor of Community Dentistry, University of Peradeniya Dr. J.M.W. Jayasundara Bandara Fmr.Deputy Director General (Dental Services), Ministry of Health Dr. U.S. Usgodaarachchi MD, MSc(Com.Dent.) Consultant in Community Dentistry Dr. N.C. Ratnayake MD, MSc(Com.Dent.) Consultant in Community Dentistry Dr. A.A.H.K. Amarasinghe MD, MSc(Com.Dent.) Consultant in Community Dentistry Dr. E.A. Fernando MD, MSc(Com.Dent.) Consultant in Community Dentistry Dr. S.R.U. Wimalaratne MD, MSc(Com.Dent.) Consultant in Community Dentistry Dr. I.R. Perera MD, MSc(Com.Dent.) Consultant in Community Dentistry Dr. R.D.F.C Kanthi MD, MSc(Com.Dent.) Consultant in Community Dentistry Dr. D.de Silva MD, MSc(Com.Dent.) Consultant in Community Dentistry Dr. K.A.K.D. Perera MD, MSc(Com.Dent.) Consultant in Community Dentistry
Examiners Dr. P.S. Abeyruwan MSc(Com.Dent.) Dr. W.P.M.M. Abeysekara MSc(Com.Dent.) Dr. A.A.H.K. Amarasinghe MD, MSc(Com.Dent.) Dr. A.M.U. Amilani MSc(Com.Dent.) Dr. A.D. Bollegala MSc(Com.Dent.) Dr. D.S. Delpachitra MSc(Com.Dent.) Dr. H.H.M. Dhanpriyanka MSc(Com.Dent.) Dr. H.N.R.K. Dissanayake MSc(Com.Dent.) Dr. R.M. Hettiarachchi MSc(Com.Dent.) Dr. P.L.P. Jayashantha MD, MSc(Com.Dent.) Dr. K.A.R. Jayathilake MSc(Com.Dent.) Dr. N. Karunachandra MSc(Com.Dent.) Dr. A.S.D.P. Karunaratne MSc(Com.Dent.) Dr. K.M.S.H. Kosgallana MSc(Com.Dent.) Dr. N.A.R. Nanayakkara MSc(Com.Dent.)
Dr. N.V.K. Nanayakkara MD, MSc(Com.Dent.) Dr. K.A.K.D. Perera MD, MSc(Com.Dent.) Dr. I.R. Perera MD, MSc(Com.Dent.) Dr. N. Ranasinghe MSc(Com.Dent.) Dr. N.C. Ratnayake MD, MSc(Com.Dent.) Dr. C.A. Rupasinghe MSc(Com.Dent.) Dr. S.M.A.D.C.G. Sammandapperuma MSc(Com.Dent.) Dr. B.K.G. Tilakaratne MSc(Com.Dent.) Dr. S.R.M.I. Udayamalee MSc(Com.Dent.) Dr. S.R. Weerasuriya MSc(Com.Dent.) Dr. N.C. Wellappuli MSc(Com.Dent.) Dr. D. Wickramasinghe MSc(Com.Dent.) Dr. W.M.P.N.R. Wickramasinghe MSc(Com.Dent.) Dr. H.G.T.I.D. Wijesiri MSc(Com.Dent.)
Data analysis
Dr. U.S. Usgodaarachchi
Report writing Dr. U.S. Usgodaarachchi Dr. N.C. Ratnayake Dr. A.A.H.K. Amarasinghe
Activity managers Dr. J.M.W. Jayasundara Bandara Dr. N.C. Ratnayake Dr. A.A.H.K. Amarasinghe
Technical and secretarial assistance Dr. W.P.M.M. Abeysekara, Ms. M.M.G.D. Manamperi, Medical Statistician, Ministry of Health Dr. K.L.A.K.K.K. Atapattu, Dr. D. Wickramasinghe, Dr. A.M.U. Amilani, Dr. K.M.S.H. Kosgallana, Training Unit IOH, Maharagama Dr. G.U. Pahalavithana, Dr. S.R.M.I. Udayamalee, Dr. K.A.R. Jayathilake, Research and Surveillance Unit, IOH Maharagama
viiNational Oral Health Survey Sri Lanka 2015-2016
vii
Acknowledgement
This survey would have been impossible without the support of following personnel and organizations. Services and cooperation rendered by them are highly appreciated and acknowledged.
Former DDG/DS Dr. J.M.W. Jayasundara Bandara for the initiation and encouragement extended during the planning and implementation of the survey
Professor S.L. Ekanayake, Professor of Community Dentistry, University of Peradeniya for the valuable guidance extended during planning stage of the survey, data analysis and report writing
The advisory committee of the NOHS 2015-2016 for their guidance in conduction of the survey
All Provincial and Regional Directors of Health, Regional Dental Surgeons, Medical Officers of Health, education authorities in respective districts, and school principals and teachers of selected schools for their cooperation during data collection
The examiners and recorders of the survey for their untiring effort and commitment displayed during data collection
Primary healthcare workers, drivers and other supporting staff for their encouraging support during data collection
The school children and adults who participated in this survey
Staff of the Research and Surveillance Unit and the Training Unit of the Institute of Oral Health, Manharagama for compilation of records and organizing the survey
Dr. C. Weerabaddhana, Medical Officer - Health Informatics, Ms K.A.S. Kodikara Chief Medical Statistician, Ministry of Health and data entry operators for developing data entry programme, statistical advice and data entry respectively
The Deputy Director and the office staff of the Institute of Oral Heath, Maharagma and the office staff of the DDG/DS, Ministry of Health for their administrative and secretarial assistance
World Health Organization for shared financial assistance
Deepanee Printers and Publishers Ltd. for their excellent work
Dr. U.S. Usgodaarachchi
Principal Investigator - NOHS 2015-2016
December 2018

viiiNational Oral Health Survey Sri Lanka 2015-2016
viii
ixNational Oral Health Survey Sri Lanka 2015-2016
ix
Index
Page number
Message from the Director General of the Health Services iii Executive summary iv National Oral Health Survey team 2015-2016 vi Acknowledgement vii Index ix List of tables xi List of figures xiii List of abbreviations xiv Chapter 1 Introduction 1
1.1 Country profile and vital statistics 1 1.2 Health services in Sri Lanka 1 1.3 Oral healthcare services in Sri Lanka 2 1.4 Oral disease burden in Sri Lanka 3 1.5 Purpose of the survey 4
Chapter 2 Materials and methods 7 2.1 Factors considered in developing the survey methodology 7 2.2 Sampling procedure 8 2.3 Selection of the sample 8 2.4 Oral health assessment form 10 2.5 Examiner training, calibration and maintenance of data quality 10 2.6 Administrative requirements 11 2.7 Data collection 11 2.8 Data entry, analysis and presentation 12 2.9 Expenditure of the survey 12
Chapter 3 Results 15 3.1 Sample characteristics 15 3.2 Oral health habits 17 3.3 Oral and mucosal lesions 29 3.4 Number of teeth present 31 3.5 Dental caries 33 3.6 Root exposure (presence of gingival recession) and root caries 39 3.7 Periodontal condition 41 3.8 Dento-facial anomalies 49 3.9 Enamel fluorosis 50 3.10 Presence of tooth-wear 52 3.11 Denture-wearing status 53 3.12 Treatment need for oral diseases 54 3.13 Patterns of utilization of dental services 55
Chapter 4 Discussion 59 Chapter 5 Conclusions and recommendations 61 Chapter 6 District–based results 63 Chapter 7 References 97 Chapter 8 Annexure 99
xNational Oral Health Survey Sri Lanka 2015-2016
x
xiNational Oral Health Survey Sri Lanka 2015-2016
xi
List of tables
Page number
Executive Summary
Table A v
Chapter 1 Introduction
Table 1.1: Health and social indicators in Sri Lanka (for selected years) 1 Table 1.2: Dental manpower in Sri Lanka (for selected years) 2 Table 1.3: Oral diseases trends in Sri Lanka (selected indicators based on NOHS reports) 3 Table 1.4: Tobacco and alcohol use of Sri Lankan population in the year 2015 (selected age groups) 4
Chapter 2 Materials and methods
Table 2.1: Summary of survey methodology used in past National Oral Health Surveys 7
Chapter3 Results
Table 3.1: Percentage distribution of participants according to age groups, sex, ethnicity, sector and educational status 15
Table 3.2: Number and percentage distribution of participants in the sample according to districts 16 Table 3.3: Percentage distribution of participants according to the frequency of tooth cleaning 17 Table 3.4: Percentage distribution of participants according to the mode of tooth cleaning 18 Table 3.5: Percentage distribution of participants according to the type of ingredients used for tooth cleaning 19 Table 3.6: Percentage distribution of participants according to the consumption of fruits 20 Table 3.7: Percentage distribution of participants according to the consumption of biscuits/buns/cake 21 Table 3.8: Percentage distribution of participants according to the consumption of candy/toffee 22 Table 3.9: Percentage distribution of participants according to the consumption of fizzy-drinks 23 Table 3.10: Percentage distribution of participants according to the habit of betel chewing 24 Table 3.11: Percentage distribution of participants according to the ingredients used in the betel quid 25 Table 3.12: Percentage distribution of participants according to the use of areca-nut in packet form 26 Table 3.13: Percentage distribution of participants according to the consumption of alcohol 27 Table 3.14: Percentage distribution of participants according to the habit of smoking 28 Table 3.15: Distribution of participants according to the presence of oral and mucosal lesions 29 Table 3.16: Distribution of participants according to the type and the site of oral mucosal lesions 30 Table 3.17: Distribution of participants according to the number of teeth present 31 Table 3.18: Percentage distribution of participants according to the number of teeth present 32 Table 3.19: Percentage distribution of participants according to the prevalence of dental caries 33 Table 3.20: Distribution of participants according to the severity of dental caries 35 Table 3.21: Percentage distribution of participants of selected index age groups according to the
severity of dental caries 38 Table 3.22: Percentage distribution of participants according to the status of root exposure 39 Table 3.23: Distribution of participants according to the status of root caries 40 Table 3.24: Percentage distribution of participants according to the prevalence of gingival bleeding-on-probing 41 Table 3.25: Distribution of participants according to the mean and the percentage of teeth with gingival
bleeding-on-probing 42 Table 3.26: Percentage distribution of participants according to the presence of calculus 43 Table 3.27: Percentage distribution of participants according to the prevalence of periodontal pockets 44
xiiNational Oral Health Survey Sri Lanka 2015-2016
xii
Page number
Table 3.28: Distribution of participants according to the mean and the percentage of teeth with periodontal pockets 46
Table 3.29: Percentage distribution of participants according to the loss of periodontal attachment 47 Table 3.30: Distribution of participants according to the mean number of sextants with loss of periodontal
attachment per person 48 Table 3.31: Percentage distribution of participants according to the presence of malocclusion 49 Table 3.32: Percentage distribution of participants according to the presence of enamel fluorosis 50 Table 3.33: Percentage distribution of participants according to the presence of tooth-wear 52 Table 3.34: Percentage distribution of participants according to the denture-wearing status 53 Table 3.35: Percentage distribution of participants according to the need of dental treatment 54 Table 3.36: Percentage distribution of participants according to ‘access to the nearest government
dental clinic’ 55 Table 3.37: Percentage distribution of participants according to the ‘last visit to a dental clinic’ 56 Table 3.38: Percentage distribution of participants according to the ‘type of dental clinic last visited’ 57 Table 3.39: Percentage distribution of participants according to the type of dental treatment received
at the last visit 58
Chapter 6 District-based results
Table 6.1: Percentage distribution of participants according to the frequency of tooth cleaning 63 Table 6.2: Percentage distribution of participant according to the mode of tooth cleaning 65 Table 6.3: Percentage distribution of participants according to the type of ingredients used for tooth cleaning 67 Table 6.4: Distribution of participants according to the mean and the total number of teeth 69 Table 6.5: Percentage distribution of participants according to the prevalence dental caries 71 Table 6.6: Distribution of participants according to the severity of dental caries 73 Table 6.7: Distribution participants according to the status of gingival bleeding-on-probing 75 Table 6.8: Percentage distribution of participants according to the presence of calculus 77 Table 6.9: Distribution of participants according to the status of periodontal pockets 78 Table 6.10: Percentage distribution of participants and the mean number of sextants according to the
loss of periodontal attachment 80 Table 6.11: Percentage distribution of participants according to the presence of malocclusion 82 Table 6.12: Percentage distribution of participants according to the presence of enamel fluorosis 83 Table 6.13: Percentage distribution of participants according to the presence of tooth-wear 85 Table 6.14: Percentage distribution of participants according to the denture-wearing status 86 Table 6.15: Percentage distribution of participants according to the need of dental treatment 88 Table 6.16: Percentage distribution of participants according to ‘access to the nearest government
dental clinic’ 90 Table 6.17: Percentage distribution of participants according to the ‘last visit to a dental clinic’ 92 Table 6.18: Percentage distribution of participants according to the ‘type of dental clinic last visited’ 94
Chapter 8 Annexure
Table 8.1: Distribution of clusters according to districts 99 Table 8.2: List of schools visited 100 Table 8.3: Examiner calibration - interclass correlations for selected variables 116 Table 8.4: Number of examiners participated in the survey and their total number of examinations 117
xiiiNational Oral Health Survey Sri Lanka 2015-2016
xiii
List of figures
Page number
Chapter 1 Introduction
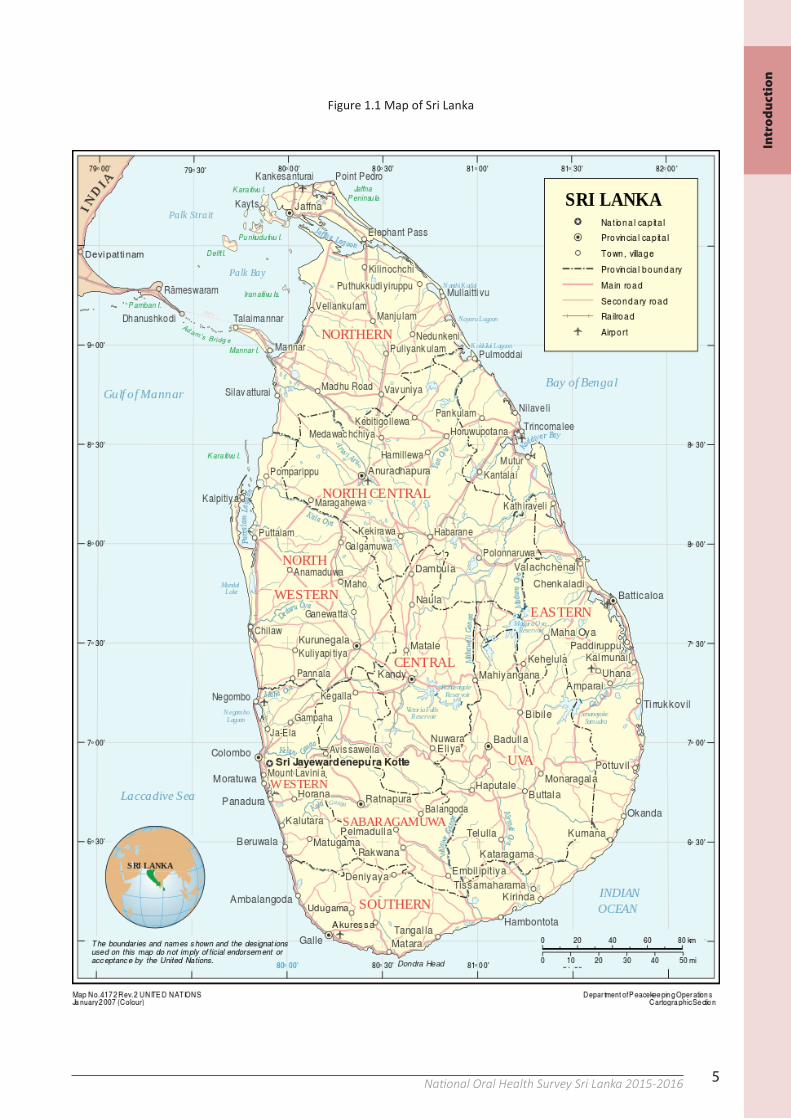
Figure 1.1: Map of Sri Lanka 5
Chapter 2 Materials and methods
Figure 2.1: Cluster distribution of the National Oral Health Survey 2015-2016 13 Figure 2.2: Enumeration kit 13 Figure 2.3: Survey team for a cluster (4 examination units) 14 Figure 2.4: Examination: School setting 14 Figure 2.5: Examination: House-to-house visits 14
Chapter 3 Results
Figure 3.1: Mean dmft according to districts: 5-year-olds 36 Figure 3.2: Mean DMFT according to districts: 12-year-olds 36 Figure 3.3: Mean DMFT according to districts: 15-year-olds 36 Figure 3.4: Mean DMFT according to districts: 35-44-year-olds 37 Figure 3.5: Mean DMFT according to districts: 65-74-year-olds 37 Figure 3.6: Percentage distribution of participants with periodontal pockets ≥4mm according to
districts: 15-year-olds 45 Figure 3.7: Percentage distribution of participants with periodontal pockets ≥4mm according to
districts: 35-44-year-olds 45 Figure 3.8: Percentage distribution of participants with periodontal pockets ≥4mm according to
districts: 65-74-year-olds 45 Figure 3.9: Percentage distribution of participants with enamel fluorosis according to districts: 12-year-olds 51 Figure 3.10: Percentage distribution of participants with enamel fluorosis according to districts: 15-year-olds 51 Figure 3.11: Percentage distribution of participants with enamel fluorosis according to districts: 35-44-year-olds 51
xivNational Oral Health Survey Sri Lanka 2015-2016
xv
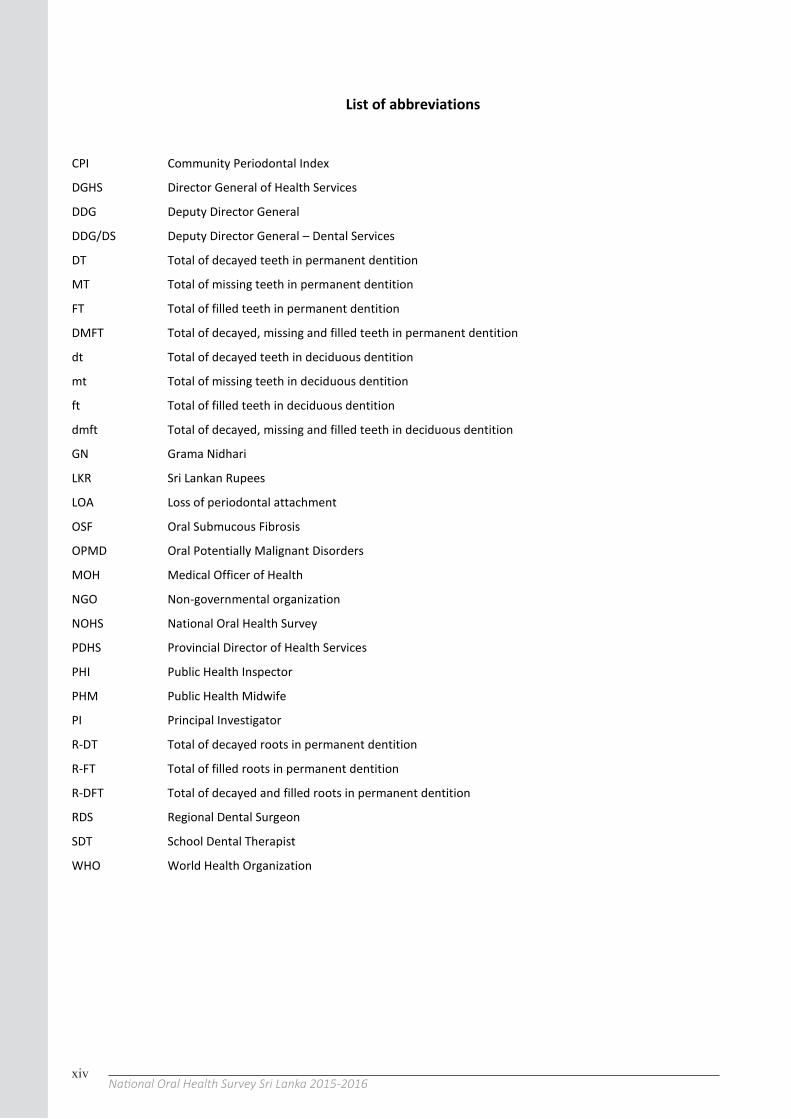
List of abbreviations
CPI Community Periodontal Index
DGHS Director General of Health Services
DDG Deputy Director General
DDG/DS Deputy Director General – Dental Services
DT Total of decayed teeth in permanent dentition
MT Total of missing teeth in permanent dentition
FT Total of filled teeth in permanent dentition
DMFT Total of decayed, missing and filled teeth in permanent dentition
dt Total of decayed teeth in deciduous dentition
mt Total of missing teeth in deciduous dentition
ft Total of filled teeth in deciduous dentition
dmft Total of decayed, missing and filled teeth in deciduous dentition
GN Grama Nidhari
LKR Sri Lankan Rupees
LOA Loss of periodontal attachment
OSF Oral Submucous Fibrosis
OPMD Oral Potentially Malignant Disorders
MOH Medical Officer of Health
NGO Non-governmental organization
NOHS National Oral Health Survey
PDHS Provincial Director of Health Services
PHI Public Health Inspector
PHM Public Health Midwife
PI Principal Investigator
R-DT Total of decayed roots in permanent dentition
R-FT Total of filled roots in permanent dentition
R-DFT Total of decayed and filled roots in permanent dentition
RDS Regional Dental Surgeon
SDT School Dental Therapist
WHO World Health Organization
1National Oral Health Survey Sri Lanka 2015-20161
Chapter 1
Introduction
1.1 Country profile and vital statistics
Democratic Socialist Republic of Sri Lanka is a tropical country situated in the Indian ocean between 50 to 90 of Northern-latitudes and 790 to 820 Eastern longitudes with a land area of 65 610 square kilometres1. Sri Lanka is a multi-ethnic society with 74.9% of Sinhalese, 15.3% of Tamils and 9.3% of Muslims2.
For the purpose of administration, the country is divided into 09 provinces, 25 districts and 322 divisional secretary areas. A divisional secretary area is further divided into several Grama Niladhari (GN) divisions which are the smallest local administrative unit. The urban-rural classification of the country is based on administrative boundaries. In this context, areas governed by municipal or urban councils are categorized as urban areas while areas covered by ‘Pradeshiya Sabhas’ considered as rural areas. Areas primarily consisting of tea and rubber plantations are considered as the estate sector. According to the latest census, approximately 18.2% of the total population lives in urban areas, 4.4% in the estate sector, while the majority, 77.4%, lives in rural areas2.
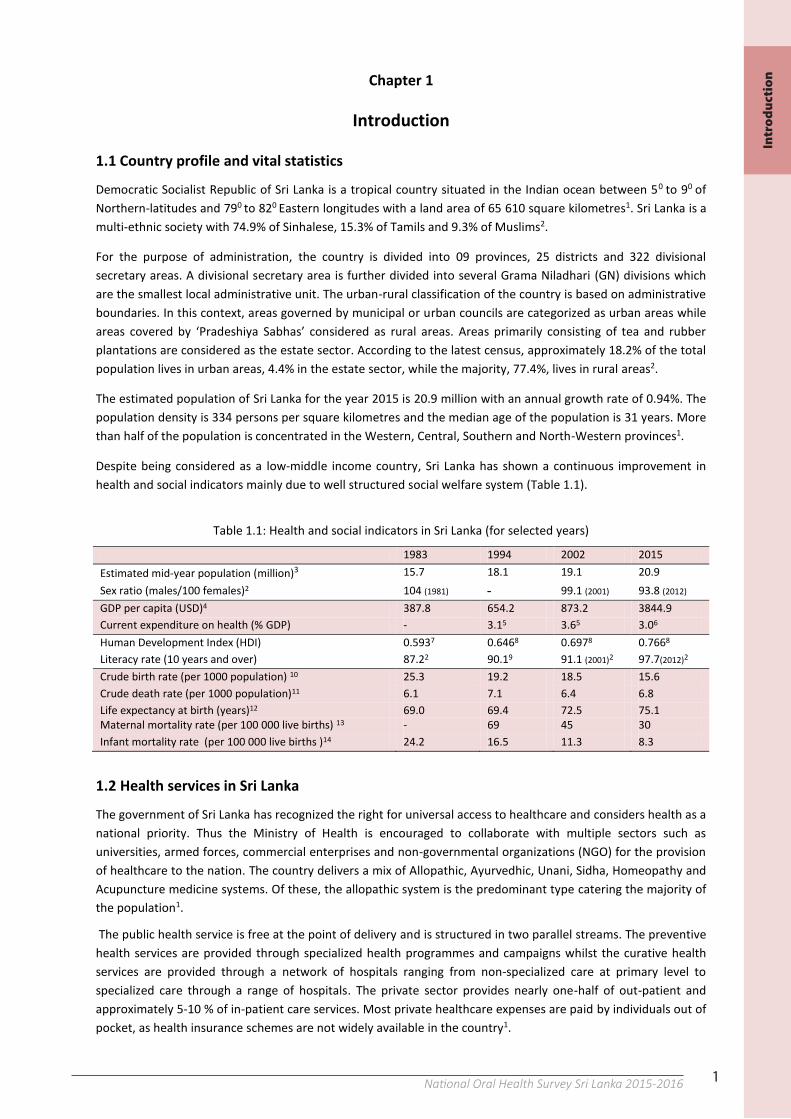
The estimated population of Sri Lanka for the year 2015 is 20.9 million with an annual growth rate of 0.94%. The population density is 334 persons per square kilometres and the median age of the population is 31 years. More than half of the population is concentrated in the Western, Central, Southern and North-Western provinces1. Despite being considered as a low-middle income country, Sri Lanka has shown a continuous improvement in health and social indicators mainly due to well structured social welfare system (Table 1.1).
Table 1.1: Health and social indicators in Sri Lanka (for selected years)
1983 1994 2002 2015 Estimated mid-year population (million)3 15.7 18.1 19.1 20.9
Sex ratio (males/100 females)2 104 (1981) - 99.1 (2001) 93.8 (2012) GDP per capita (USD)4 387.8 654.2 873.2 3844.9 Current expenditure on health (% GDP) - 3.15 3.65 3.06
Human Development Index (HDI) 0.5937 0.6468 0.6978 0.7668 Literacy rate (10 years and over) 87.22 90.19 91.1 (2001)2 97.7(2012)2
Crude birth rate (per 1000 population) 10 25.3 19.2 18.5 15.6 Crude death rate (per 1000 population)11 6.1 7.1 6.4 6.8 Life expectancy at birth (years)12 69.0 69.4 72.5 75.1 Maternal mortality rate (per 100 000 live births) 13 - 69 45 30 Infant mortality rate (per 100 000 live births )14 24.2 16.5 11.3 8.3
1.2 Health services in Sri Lanka
The government of Sri Lanka has recognized the right for universal access to healthcare and considers health as a national priority. Thus the Ministry of Health is encouraged to collaborate with multiple sectors such as universities, armed forces, commercial enterprises and non-governmental organizations (NGO) for the provision of healthcare to the nation. The country delivers a mix of Allopathic, Ayurvedhic, Unani, Sidha, Homeopathy and Acupuncture medicine systems. Of these, the allopathic system is the predominant type catering the majority of the population1.
The public health service is free at the point of delivery and is structured in two parallel streams. The preventive health services are provided through specialized health programmes and campaigns whilst the curative health services are provided through a network of hospitals ranging from non-specialized care at primary level to specialized care through a range of hospitals. The private sector provides nearly one-half of out-patient and approximately 5-10 % of in-patient care services. Most private healthcare expenses are paid by individuals out of pocket, as health insurance schemes are not widely available in the country1.
Intr
od
uct
ion
2 National Oral Health Survey Sri Lanka 2015-20162
The Ministry of Health provides the stewardship to health service development and delivery by policy formulation and regulation of the services. The Ministry of Health also involves in training and development of certain categories of human resources as well as the management of large public hospitals and specialized health programmes and campaigns. The rest of the public health services are managed by the decentralized provincial system. The Director General of Health Service (DGHS) at the Ministry of Health coordinates the health services. Supporting the DGHS, a group of Deputy Director Generals (DDG) and Directors coordinate the various aspects of health services. At the provincial level, Provincial Director of Health Services (PDHS) coordinates the health services and the PDHS is supported by Regional Director of Health Services (RDHS) at district level and Medical Officer of Health (MOH) at smaller divisional units called MOH areas. All hospitals are managed either by Hospital Directors, Medical Superintends, District Medical Officers or Medical Officer In-charges1.
1.3 Oral healthcare services in Sri Lanka
Dental services of the country are delivered through the medical service infrastructure. The Deputy Director General-Dental Services (DDG/DS) is the focal point of administration of oral health services in the Ministry of Health. When considering the type of care delivered, the curative services are provided through network of public and private dental clinics. The preventive oral healthcare services are predominantly delivered through dental clinics situated in schools and community centres. School Dental Therapists (SDTs) at school dental clinics provide oral healthcare for children between 3-13 years of age. Community dental clinics and some school based (adolescent) dental clinics are managed by dental surgeons who also involved in providing preventive oral healthcare. Mobile dental services for inaccessible groups are provided through a network of mobile dental units located at regional offices. Specialist services are provided by consultants in Oral and Maxillo-Facial Surgery, Orthodontics, Restorative Dentistry, Community Dentistry and Oral Pathology through a network of specialist dental clinics in respective disciplines1.
Oral healthcare services to the nation are also delivered through multi-sector collaborative activities. Basic information related to good oral health practices is introduced into school curricular and the school dental programme is integrated with the school medical inspection. Similarly, ‘oral health package’ is introduced into existing family health services and cancer control programmes. Moreover, assistance from NGOs and commercial enterprises is encouraged for public awareness and mobile dental programmes as well as the development and marketing of consumer products that are conducive to promote oral health such as fluoridated toothpaste1.
1.3.1 Manpower and facilities of dental services
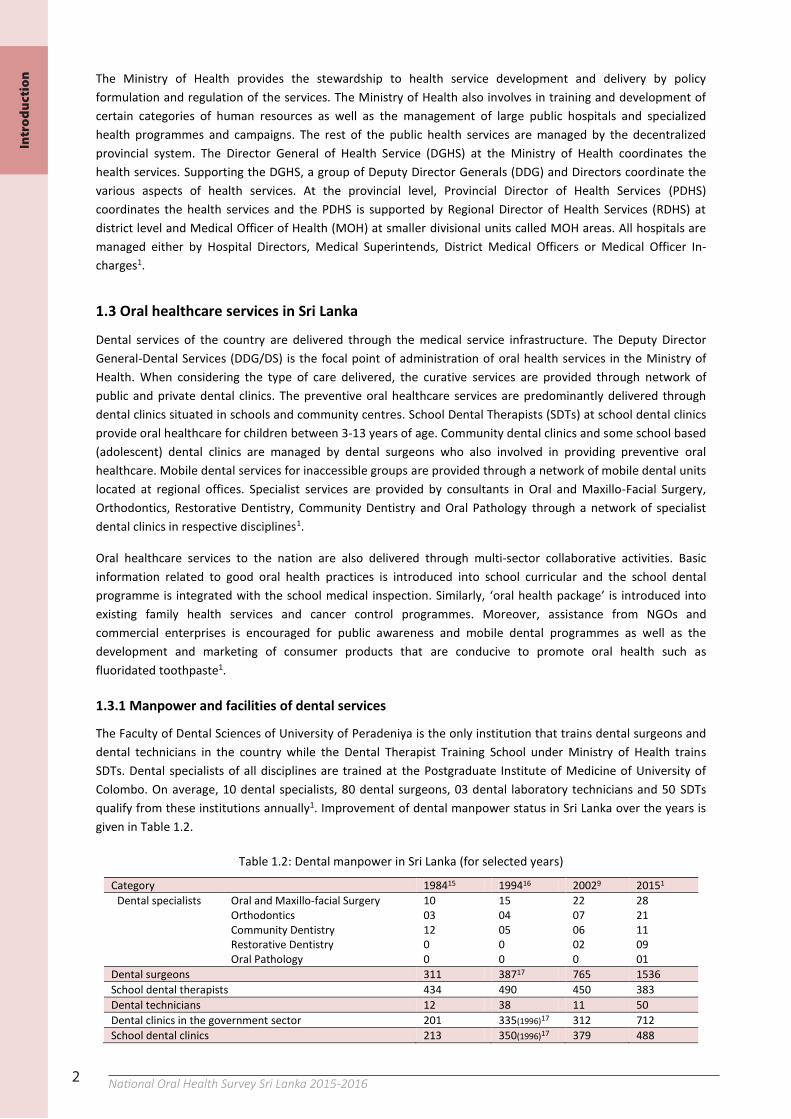
The Faculty of Dental Sciences of University of Peradeniya is the only institution that trains dental surgeons and dental technicians in the country while the Dental Therapist Training School under Ministry of Health trains SDTs. Dental specialists of all disciplines are trained at the Postgraduate Institute of Medicine of University of Colombo. On average, 10 dental specialists, 80 dental surgeons, 03 dental laboratory technicians and 50 SDTs qualify from these institutions annually1. Improvement of dental manpower status in Sri Lanka over the years is given in Table 1.2.
Table 1.2: Dental manpower in Sri Lanka (for selected years)
Category 198415 199416 20029 20151
Dental specialists
Oral and Maxillo-facial Surgery Orthodontics Community Dentistry Restorative Dentistry Oral Pathology
10 03 12 0 0
15 04 05 0 0
22 07 06 02 0
28 21 11 09 01
Dental surgeons 311 38717 765 1536 School dental therapists 434 490 450 383 Dental technicians 12 38 11 50 Dental clinics in the government sector 201 335(1996)17 312 712 School dental clinics 213 350(1996)17 379 488
Intr
od
uct
ion
3National Oral Health Survey Sri Lanka 2015-20162
The Ministry of Health provides the stewardship to health service development and delivery by policy formulation and regulation of the services. The Ministry of Health also involves in training and development of certain categories of human resources as well as the management of large public hospitals and specialized health programmes and campaigns. The rest of the public health services are managed by the decentralized provincial system. The Director General of Health Service (DGHS) at the Ministry of Health coordinates the health services. Supporting the DGHS, a group of Deputy Director Generals (DDG) and Directors coordinate the various aspects of health services. At the provincial level, Provincial Director of Health Services (PDHS) coordinates the health services and the PDHS is supported by Regional Director of Health Services (RDHS) at district level and Medical Officer of Health (MOH) at smaller divisional units called MOH areas. All hospitals are managed either by Hospital Directors, Medical Superintends, District Medical Officers or Medical Officer In-charges1.
1.3 Oral healthcare services in Sri Lanka
Dental services of the country are delivered through the medical service infrastructure. The Deputy Director General-Dental Services (DDG/DS) is the focal point of administration of oral health services in the Ministry of Health. When considering the type of care delivered, the curative services are provided through network of public and private dental clinics. The preventive oral healthcare services are predominantly delivered through dental clinics situated in schools and community centres. School Dental Therapists (SDTs) at school dental clinics provide oral healthcare for children between 3-13 years of age. Community dental clinics and some school based (adolescent) dental clinics are managed by dental surgeons who also involved in providing preventive oral healthcare. Mobile dental services for inaccessible groups are provided through a network of mobile dental units located at regional offices. Specialist services are provided by consultants in Oral and Maxillo-Facial Surgery, Orthodontics, Restorative Dentistry, Community Dentistry and Oral Pathology through a network of specialist dental clinics in respective disciplines1.
Oral healthcare services to the nation are also delivered through multi-sector collaborative activities. Basic information related to good oral health practices is introduced into school curricular and the school dental programme is integrated with the school medical inspection. Similarly, ‘oral health package’ is introduced into existing family health services and cancer control programmes. Moreover, assistance from NGOs and commercial enterprises is encouraged for public awareness and mobile dental programmes as well as the development and marketing of consumer products that are conducive to promote oral health such as fluoridated toothpaste1.
1.3.1 Manpower and facilities of dental services
The Faculty of Dental Sciences of University of Peradeniya is the only institution that trains dental surgeons and dental technicians in the country while the Dental Therapist Training School under Ministry of Health trains SDTs. Dental specialists of all disciplines are trained at the Postgraduate Institute of Medicine of University of Colombo. On average, 10 dental specialists, 80 dental surgeons, 03 dental laboratory technicians and 50 SDTs qualify from these institutions annually1. Improvement of dental manpower status in Sri Lanka over the years is given in Table 1.2.
Table 1.2: Dental manpower in Sri Lanka (for selected years)
Category 198415 199416 20029 20151
Dental specialists
Oral and Maxillo-facial Surgery Orthodontics Community Dentistry Restorative Dentistry Oral Pathology
10 03 12 0 0
15 04 05 0 0
22 07 06 02 0
28 21 11 09 01
Dental surgeons 311 38717 765 1536 School dental therapists 434 490 450 383 Dental technicians 12 38 11 50 Dental clinics in the government sector 201 335(1996)17 312 712 School dental clinics 213 350(1996)17 379 488
3
Due to inadequate numbers, dental professionals and dental technicians in the government sector are allowed to engage in private practice after their duty hours.
1.4 Oral disease burden in Sri Lanka
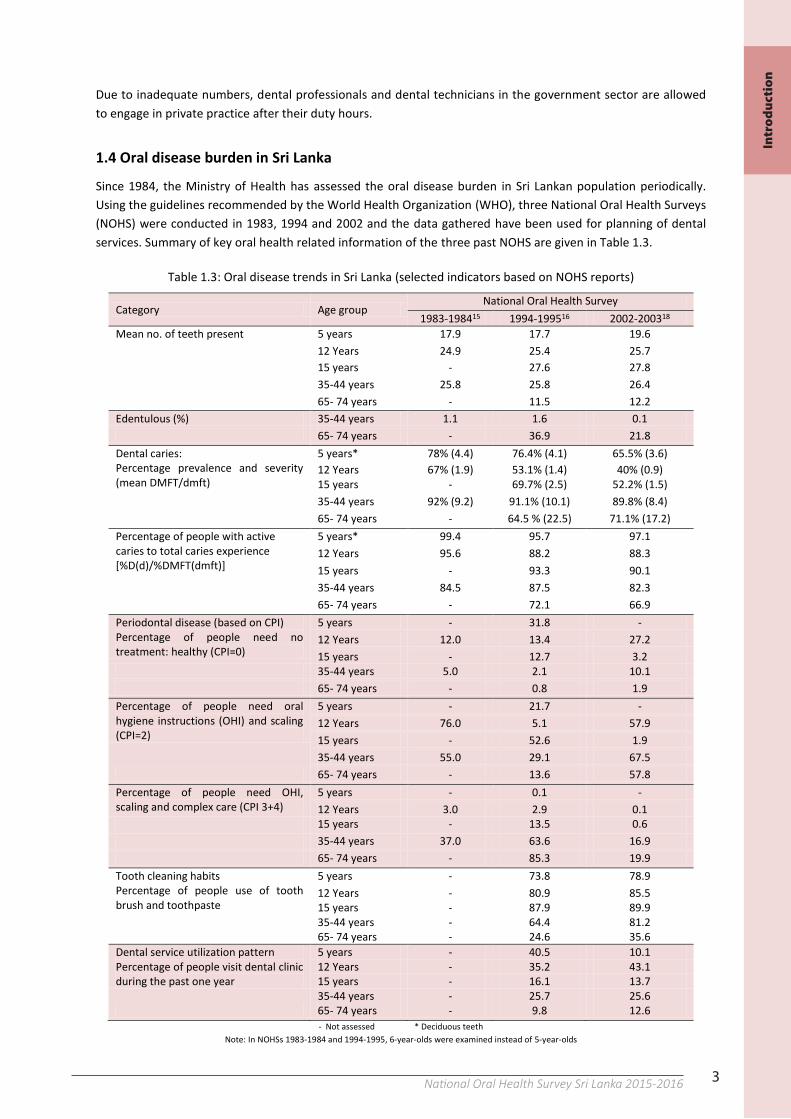
Since 1984, the Ministry of Health has assessed the oral disease burden in Sri Lankan population periodically. Using the guidelines recommended by the World Health Organization (WHO), three National Oral Health Surveys (NOHS) were conducted in 1983, 1994 and 2002 and the data gathered have been used for planning of dental services. Summary of key oral health related information of the three past NOHS are given in Table 1.3.
Table 1.3: Oral disease trends in Sri Lanka (selected indicators based on NOHS reports)
Category Age group National Oral Health Survey
1983-198415 1994-199516 2002-200318
Mean no. of teeth present 5 years 17.9 17.7 19.6 12 Years 24.9 25.4 25.7 15 years - 27.6 27.8 35-44 years 25.8 25.8 26.4 65- 74 years - 11.5 12.2 Edentulous (%) 35-44 years 1.1 1.6 0.1 65- 74 years - 36.9 21.8 Dental caries: Percentage prevalence and severity (mean DMFT/dmft)
5 years* 78% (4.4) 76.4% (4.1) 65.5% (3.6) 12 Years 67% (1.9) 53.1% (1.4) 40% (0.9) 15 years - 69.7% (2.5) 52.2% (1.5) 35-44 years 92% (9.2) 91.1% (10.1) 89.8% (8.4)
65- 74 years - 64.5 % (22.5) 71.1% (17.2) Percentage of people with active caries to total caries experience [%D(d)/%DMFT(dmft)]
5 years* 99.4 95.7 97.1 12 Years 95.6 88.2 88.3 15 years - 93.3 90.1 35-44 years 84.5 87.5 82.3 65- 74 years - 72.1 66.9
Periodontal disease (based on CPI) Percentage of people need no treatment: healthy (CPI=0)
5 years - 31.8 - 12 Years 12.0 13.4 27.2 15 years - 12.7 3.2
35-44 years 5.0 2.1 10.1 65- 74 years - 0.8 1.9 Percentage of people need oral hygiene instructions (OHI) and scaling (CPI=2)
5 years - 21.7 - 12 Years 76.0 5.1 57.9 15 years - 52.6 1.9 35-44 years 55.0 29.1 67.5
65- 74 years - 13.6 57.8 Percentage of people need OHI, scaling and complex care (CPI 3+4)
5 years - 0.1 - 12 Years 3.0 2.9 0.1
15 years - 13.5 0.6 35-44 years 37.0 63.6 16.9 65- 74 years - 85.3 19.9 Tooth cleaning habits Percentage of people use of tooth brush and toothpaste
5 years - 73.8 78.9 12 Years - 80.9 85.5 15 years - 87.9 89.9 35-44 years - 64.4 81.2 65- 74 years - 24.6 35.6
Dental service utilization pattern Percentage of people visit dental clinic during the past one year
5 years - 40.5 10.1
12 Years - 35.2 43.1 15 years - 16.1 13.7 35-44 years - 25.7 25.6
65- 74 years - 9.8 12.6 - Not assessed * Deciduous teeth
Note: In NOHSs 1983-1984 and 1994-1995, 6-year-olds were examined instead of 5-year-olds
Intr
od
uct
ion
4 National Oral Health Survey Sri Lanka 2015-20164
The results show a declining trend in the prevalence and severity of dental caries and gum disease over the years among all age groups coupled with an increasing trend in the mean number of teeth present. However, a substantial burden of oral disease still prevails. The figures also show that the oral health related habits have improved with time.
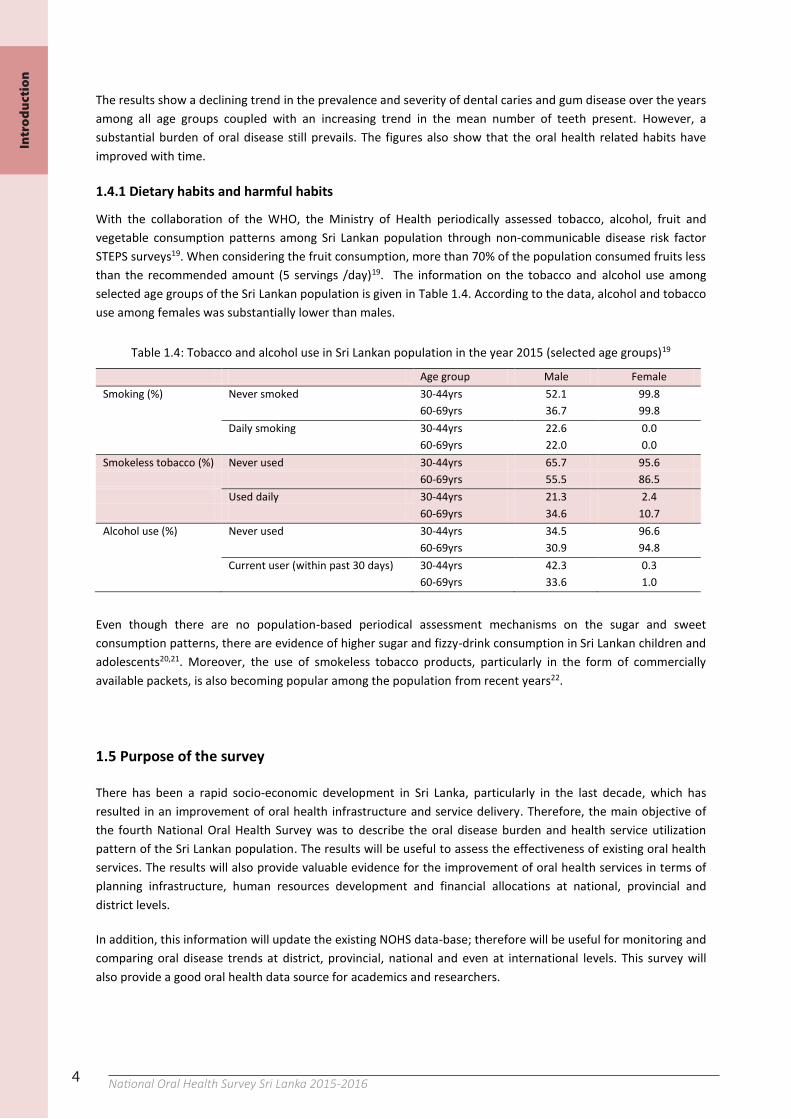
1.4.1 Dietary habits and harmful habits
With the collaboration of the WHO, the Ministry of Health periodically assessed tobacco, alcohol, fruit and vegetable consumption patterns among Sri Lankan population through non-communicable disease risk factor STEPS surveys19. When considering the fruit consumption, more than 70% of the population consumed fruits less than the recommended amount (5 servings /day)19. The information on the tobacco and alcohol use among selected age groups of the Sri Lankan population is given in Table 1.4. According to the data, alcohol and tobacco use among females was substantially lower than males.
Table 1.4: Tobacco and alcohol use in Sri Lankan population in the year 2015 (selected age groups)19
Age group Male Female Smoking (%) Never smoked 30-44yrs 52.1 99.8
60-69yrs 36.7 99.8 Daily smoking 30-44yrs 22.6 0.0 60-69yrs 22.0 0.0 Smokeless tobacco (%) Never used 30-44yrs 65.7 95.6 60-69yrs 55.5 86.5 Used daily 30-44yrs 21.3 2.4 60-69yrs 34.6 10.7 Alcohol use (%) Never used 30-44yrs 34.5 96.6 60-69yrs 30.9 94.8 Current user (within past 30 days) 30-44yrs 42.3 0.3 60-69yrs 33.6 1.0
Even though there are no population-based periodical assessment mechanisms on the sugar and sweet consumption patterns, there are evidence of higher sugar and fizzy-drink consumption in Sri Lankan children and adolescents20,21. Moreover, the use of smokeless tobacco products, particularly in the form of commercially available packets, is also becoming popular among the population from recent years22.
1.5 Purpose of the survey
There has been a rapid socio-economic development in Sri Lanka, particularly in the last decade, which has resulted in an improvement of oral health infrastructure and service delivery. Therefore, the main objective of the fourth National Oral Health Survey was to describe the oral disease burden and health service utilization pattern of the Sri Lankan population. The results will be useful to assess the effectiveness of existing oral health services. The results will also provide valuable evidence for the improvement of oral health services in terms of planning infrastructure, human resources development and financial allocations at national, provincial and district levels.
In addition, this information will update the existing NOHS data-base; therefore will be useful for monitoring and comparing oral disease trends at district, provincial, national and even at international levels. This survey will also provide a good oral health data source for academics and researchers.
Intr
od
uct
ion
5National Oral Health Survey Sri Lanka 2015-20164
The results show a declining trend in the prevalence and severity of dental caries and gum disease over the years among all age groups coupled with an increasing trend in the mean number of teeth present. However, a substantial burden of oral disease still prevails. The figures also show that the oral health related habits have improved with time.
1.4.1 Dietary habits and harmful habits
With the collaboration of the WHO, the Ministry of Health periodically assessed tobacco, alcohol, fruit and vegetable consumption patterns among Sri Lankan population through non-communicable disease risk factor STEPS surveys19. When considering the fruit consumption, more than 70% of the population consumed fruits less than the recommended amount (5 servings /day)19. The information on the tobacco and alcohol use among selected age groups of the Sri Lankan population is given in Table 1.4. According to the data, alcohol and tobacco use among females was substantially lower than males.
Table 1.4: Tobacco and alcohol use in Sri Lankan population in the year 2015 (selected age groups)19
Age group Male Female Smoking (%) Never smoked 30-44yrs 52.1 99.8
60-69yrs 36.7 99.8 Daily smoking 30-44yrs 22.6 0.0 60-69yrs 22.0 0.0 Smokeless tobacco (%) Never used 30-44yrs 65.7 95.6 60-69yrs 55.5 86.5 Used daily 30-44yrs 21.3 2.4 60-69yrs 34.6 10.7 Alcohol use (%) Never used 30-44yrs 34.5 96.6 60-69yrs 30.9 94.8 Current user (within past 30 days) 30-44yrs 42.3 0.3 60-69yrs 33.6 1.0
Even though there are no population-based periodical assessment mechanisms on the sugar and sweet consumption patterns, there are evidence of higher sugar and fizzy-drink consumption in Sri Lankan children and adolescents20,21. Moreover, the use of smokeless tobacco products, particularly in the form of commercially available packets, is also becoming popular among the population from recent years22.
1.5 Purpose of the survey
There has been a rapid socio-economic development in Sri Lanka, particularly in the last decade, which has resulted in an improvement of oral health infrastructure and service delivery. Therefore, the main objective of the fourth National Oral Health Survey was to describe the oral disease burden and health service utilization pattern of the Sri Lankan population. The results will be useful to assess the effectiveness of existing oral health services. The results will also provide valuable evidence for the improvement of oral health services in terms of planning infrastructure, human resources development and financial allocations at national, provincial and district levels.
In addition, this information will update the existing NOHS data-base; therefore will be useful for monitoring and comparing oral disease trends at district, provincial, national and even at international levels. This survey will also provide a good oral health data source for academics and researchers.
5
Figure 1.1 Map of Sri Lanka
Intr
od
uct
ion
6 National Oral Health Survey Sri Lanka 2015-2016
Intr
od
uct
ion
7National Oral Health Survey Sri Lanka 2015-20167
Chapter 2
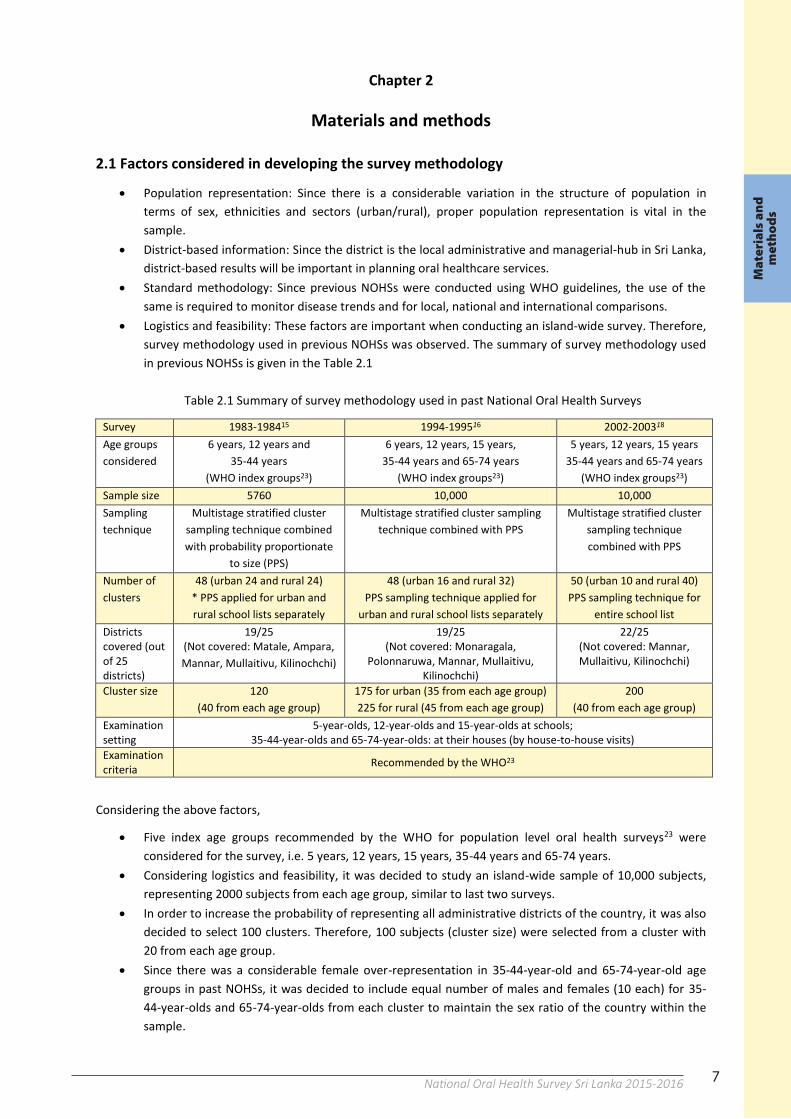
Materials and methods 2.1 Factors considered in developing the survey methodology
Population representation: Since there is a considerable variation in the structure of population in terms of sex, ethnicities and sectors (urban/rural), proper population representation is vital in the sample.
District-based information: Since the district is the local administrative and managerial-hub in Sri Lanka, district-based results will be important in planning oral healthcare services.
Standard methodology: Since previous NOHSs were conducted using WHO guidelines, the use of the same is required to monitor disease trends and for local, national and international comparisons.
Logistics and feasibility: These factors are important when conducting an island-wide survey. Therefore, survey methodology used in previous NOHSs was observed. The summary of survey methodology used in previous NOHSs is given in the Table 2.1
Table 2.1 Summary of survey methodology used in past National Oral Health Surveys
Survey 1983-198415 1994-199516 2002-200318
Age groups considered
6 years, 12 years and 35-44 years
(WHO index groups23)
6 years, 12 years, 15 years, 35-44 years and 65-74 years
(WHO index groups23)
5 years, 12 years, 15 years 35-44 years and 65-74 years
(WHO index groups23) Sample size 5760 10,000 10,000 Sampling technique
Multistage stratified cluster sampling technique combined with probability proportionate
to size (PPS)
Multistage stratified cluster sampling technique combined with PPS
Multistage stratified cluster sampling technique combined with PPS
Number of clusters
48 (urban 24 and rural 24) * PPS applied for urban and rural school lists separately
48 (urban 16 and rural 32) PPS sampling technique applied for
urban and rural school lists separately
50 (urban 10 and rural 40) PPS sampling technique for
entire school list Districts covered (out of 25 districts)
19/25 (Not covered: Matale, Ampara, Mannar, Mullaitivu, Kilinochchi)
19/25 (Not covered: Monaragala,
Polonnaruwa, Mannar, Mullaitivu, Kilinochchi)
22/25 (Not covered: Mannar, Mullaitivu, Kilinochchi)
Cluster size
120 (40 from each age group)
175 for urban (35 from each age group) 225 for rural (45 from each age group)
200 (40 from each age group)
Examination setting
5-year-olds, 12-year-olds and 15-year-olds at schools; 35-44-year-olds and 65-74-year-olds: at their houses (by house-to-house visits)
Examination criteria Recommended by the WHO23
Considering the above factors,
Five index age groups recommended by the WHO for population level oral health surveys23 were considered for the survey, i.e. 5 years, 12 years, 15 years, 35-44 years and 65-74 years.
Considering logistics and feasibility, it was decided to study an island-wide sample of 10,000 subjects, representing 2000 subjects from each age group, similar to last two surveys.
In order to increase the probability of representing all administrative districts of the country, it was also decided to select 100 clusters. Therefore, 100 subjects (cluster size) were selected from a cluster with 20 from each age group.
Since there was a considerable female over-representation in 35-44-year-old and 65-74-year-old age groups in past NOHSs, it was decided to include equal number of males and females (10 each) for 35-44-year-olds and 65-74-year-olds from each cluster to maintain the sex ratio of the country within the sample.
Mat
eria
ls a
nd
m
eth
od
s
8 National Oral Health Survey Sri Lanka 2015-20168
Multi-stage stratified cluster sampling technique was employed to select the sample. To achieve proper representation of the population, cluster sampling combined with probability proportionate to size (PPS) technique was used.
2.2 Sampling procedure
2.2.1 Sampling error
Since the sample size was not calculated according to the prevalence of the diseases, the error that could be tolerated for the national value obtained for a given age group at 95% confidence level was calculated using the following formula24.
D = 1.96 x SE = 1.96 x {[P x Q] / N}1/2
When; D = Estimated error, P = Expected prevalence of the disease (maximum is 50% prevalence, i.e. 0.5) Q = (1 – P) = 0.5 N = Sample size = 2000, SE = Standard error at 95 % confidence interval = 1.96
Therefore, maximum error (D) that has to be tolerated for a national value (2000 participants) of a disease was: D = 1.96 x {[0.5 x 0.5]/2000}1/2 = 0.0219 = 2.2%
For a district, assuming that one cluster would be selected (n=100), the maximum error for a given age group (20 participants) that has to be tolerated was: D = 1.96 x {[0.5 x 0.5] / 20}1/2 = 0.2191 = 21.9% 2.2.2 Sampling frame
Considering following facts it was decided to use the list of schools maintained by the Ministry of Education as the sampling frame.
Out of the five index age groups, 6-year-old, 12-year-old, and 15-year-old age groups consist of children attending school.
In Sri Lanka, more than 90% of 6-year-olds, 12-year-olds and 15-year-old olds attend schools. Schools are readily accessible; therefore provide a feasible and convenient setting for data collection
form children. The Ministry of Education routinely maintains an updated database of schools with the number of
children. There was no other reliable source of information available at local level.
A soft copy of the updated list of schools of Sri Lanka for the year 2011 was obtained from the Ministry of Education. This comprehensive list contained all the schools in the country arranged in the order of province, district, type of local authority and education division. For each school, the list also gave the address of school and the number of children in a school according to the grades.
2.3 Selection of the sample
Selection of the sample was done in two stages. In the first stage, clusters were identified using PPS sampling technique. In the second stage, subjects were selected for each age group from the identified clusters. Stage 1 – Selecting the clusters
A school was considered as the cluster. Eligible students in the index groups; namely 5-year-olds, 12-year-olds, and 15-year-olds, were recruited from the selected cluster school. For 35-44-year-olds and 65-74-year-olds, the cluster was the closest area to the selected school and within the same GN division.
Mat
eria
ls a
nd
m
eth
od
s
9National Oral Health Survey Sri Lanka 2015-20168
Multi-stage stratified cluster sampling technique was employed to select the sample. To achieve proper representation of the population, cluster sampling combined with probability proportionate to size (PPS) technique was used.
2.2 Sampling procedure
2.2.1 Sampling error
Since the sample size was not calculated according to the prevalence of the diseases, the error that could be tolerated for the national value obtained for a given age group at 95% confidence level was calculated using the following formula24.
D = 1.96 x SE = 1.96 x {[P x Q] / N}1/2
When; D = Estimated error, P = Expected prevalence of the disease (maximum is 50% prevalence, i.e. 0.5) Q = (1 – P) = 0.5 N = Sample size = 2000, SE = Standard error at 95 % confidence interval = 1.96
Therefore, maximum error (D) that has to be tolerated for a national value (2000 participants) of a disease was: D = 1.96 x {[0.5 x 0.5]/2000}1/2 = 0.0219 = 2.2%
For a district, assuming that one cluster would be selected (n=100), the maximum error for a given age group (20 participants) that has to be tolerated was: D = 1.96 x {[0.5 x 0.5] / 20}1/2 = 0.2191 = 21.9% 2.2.2 Sampling frame
Considering following facts it was decided to use the list of schools maintained by the Ministry of Education as the sampling frame.
Out of the five index age groups, 6-year-old, 12-year-old, and 15-year-old age groups consist of children attending school.
In Sri Lanka, more than 90% of 6-year-olds, 12-year-olds and 15-year-old olds attend schools. Schools are readily accessible; therefore provide a feasible and convenient setting for data collection
form children. The Ministry of Education routinely maintains an updated database of schools with the number of
children. There was no other reliable source of information available at local level.
A soft copy of the updated list of schools of Sri Lanka for the year 2011 was obtained from the Ministry of Education. This comprehensive list contained all the schools in the country arranged in the order of province, district, type of local authority and education division. For each school, the list also gave the address of school and the number of children in a school according to the grades.
2.3 Selection of the sample
Selection of the sample was done in two stages. In the first stage, clusters were identified using PPS sampling technique. In the second stage, subjects were selected for each age group from the identified clusters. Stage 1 – Selecting the clusters
A school was considered as the cluster. Eligible students in the index groups; namely 5-year-olds, 12-year-olds, and 15-year-olds, were recruited from the selected cluster school. For 35-44-year-olds and 65-74-year-olds, the cluster was the closest area to the selected school and within the same GN division.
9
To identify 100 cluster schools, the following method was adopted. Firstly, the cumulative total of school children was calculated for the entire list. For this, the same order of arrangement of schools in the list provided by the Ministry of Education was used. According to this list, there were 3,940,072 children in 9685 schools in 25 administrative districts. To obtain the sampling interval, the total number of children was divided by the number of clusters required (100). Thus the sampling interval was: 3,940,072/100 = 39,400 Next, a random number (19330), which is less than the sampling interval, was selected to decide the first cluster school from the top of the list. The school that had the 19330th student in the cumulative total was considered as the first cluster. The second cluster was selected by adding the sampling interval to the random number. Remaining clusters were selected by adding the sampling interval to the previously selected number. This method yielded 28 urban and 72 rural clusters representing all administrative districts in Sri Lanka. The distribution of clusters by districts and the sector (urban/rural) are given in Figure 2.1 and Annexure 1 Then, in all selected schools, the index grades were identified; grade 1 for 5-year-olds, grade 8 for 12-year-olds and grade 11 for 15-year-olds. After that, the total number of children in index grades was determined. If the required number of students (i.e. 20) in any index grade was not available in the selected school, the next school with sufficient number of students was selected as an additional school. Both schools were given 3 random numbers each for each index age group.
Stage 2 – Random selection of subjects from selected clusters
a. Selection of 5-year-old, 12-year-old and 15-year-old age groups
To determine the available number of students for the recruitment to the sample in index grades of a particular school was difficult in some times due to several reasons.
The list of schools used was updated in 2011, thus may not be accurate. Absenteeism on the day of examination. As the index age groups were determined based on the assumption that the 5-year-olds are in grade 1,
there is a possibility of over-aged students in a given class due to following reasons. o Possibility of delayed admissions, particularly in rural areas. o If the examination is done during the second-half of the calendar year, there is a possibility
that the majority of students in an index grade are over-age. Therefore, the following procedure was adopted.
On the day of examination, for a given school, examiners were asked to prepare the list of all eligible and available students for three index age groups separately. Because of the possibility of having over-age and under-age students, examiners were also instructed to look for eligible students in the grade above and in the grade below the index grade and prepare the list in the order of index grade, grade below and grade above it. When the eligible students were more than the number needed (i.e. >20), the examiners were asked to use the systematic sampling technique to obtain the required number. Firstly, they had to calculate the sampling interval. Then using the given random number, they had to select the first child from the list of eligible students and then by adding the sampling interval repeatedly they had to recruit the remaining number of students. When the eligible number was less than the required number needed (i.e. <20), the examiners were asked to recruit all of them and move to the next school given in the list to take the balance. List of visited schools is given in Annexure 2. The procedure of selecting children is described with examples in Annexure 3.
Mat
eria
ls a
nd
m
eth
od
s
10 National Oral Health Survey Sri Lanka 2015-201610
b. Selection of 35-44-year-old and 65-74-year-old age groups
35-44-year-old and 65-74-year-old age groups were selected from the neighbourhood of the school. The examiners were advised not to cross the boundary of the GN division in which the school is located to ensure the sector (urban/rural) variation is intact.
The first household was the physically nearest to the school, measured from the main entrance of the school to the main entrance of the house. Once the examiners completed the data collection of eligible individuals in a house, they were advised to move to the next closest house. People who were not residing in the area (visitors etc.) were excluded. They were advised to follow this procedure until they completed the required number of subjects, i.e. 20 from each index groups. Furthermore, they were advised to ensure sex ratio intact by recruiting 10 males and 10 females for each age group.
Details of selecting adult and elderly age groups with examples are given in Annexure 3.
2.4 Oral health assessment form
2.4.1 Layout and content
The oral health assessment form consisted of several sections (Annexure 4). It was based on the ‘Oral Health Assessment Form’ recommended by the WHO for population surveys23. However, to suit local requirement of the country, few modifications were made.
Sections A, B, C and O consisted of questions on socio-demographic factors, habits and dental service utilization pattern in the form of an interviewer-administered questionnaire.
Sections D, E, F, G, H, I, J, K, L, M and N consisted of a data record sheet for clinical oral examination. Oral mucosal conditions, enamel fluorosis, tooth-wear, dental trauma, dento-facial anomalies, dentition status, periodontal status, loss of attachment, calculus, treatment need and denture-wearing status were recorded during clinical examination.
The size of the form was restricted to two A4 size pages for easy handling and recording. All the cages of the form were coded to facilitate data entry. 2.4.2 Clinical examination criteria, questions and codes
A separate guideline was formulated for examiners, which consisted of instructions on administering questionnaire, criteria for clinical examination and respective codes (Annexure 5). The examiners were instructed to read the guideline thoroughly and familiarize themselves with the questions, clinical procedures and codes.
2.5 Examiner training, calibration and maintenance of data quality
A total of 29 examiners who possess MSc in Community Dentistry were selected as examiners for the survey. They were trained and calibrated against gold-standards (03 Consultants in Community Dentistry who also had experience as examiners in previous NOHS) to minimize the examiner variability. Intra and inter examiner variability was assessed throughout the survey by duplicating the examinations and interviews. Examiner training and calibration session were conducted in two identical episodes two days apart. The calibration was based on tooth-by-tooth assessments of caries (DMFT/dmft scores) and periodontal (gingival bleeding-on-probing and periodontal pockets) status of a given patient. All examiners were allocated patients and examination findings were compared between examiners as well as with the findings of the experts to ensure validity and reliability. If any examiner failed to achieve a satisfactory level of consistency, he/she was further calibrated against the experts.
Mat
eria
ls a
nd
m
eth
od
s
11National Oral Health Survey Sri Lanka 2015-201610
b. Selection of 35-44-year-old and 65-74-year-old age groups
35-44-year-old and 65-74-year-old age groups were selected from the neighbourhood of the school. The examiners were advised not to cross the boundary of the GN division in which the school is located to ensure the sector (urban/rural) variation is intact.
The first household was the physically nearest to the school, measured from the main entrance of the school to the main entrance of the house. Once the examiners completed the data collection of eligible individuals in a house, they were advised to move to the next closest house. People who were not residing in the area (visitors etc.) were excluded. They were advised to follow this procedure until they completed the required number of subjects, i.e. 20 from each index groups. Furthermore, they were advised to ensure sex ratio intact by recruiting 10 males and 10 females for each age group.
Details of selecting adult and elderly age groups with examples are given in Annexure 3.
2.4 Oral health assessment form
2.4.1 Layout and content
The oral health assessment form consisted of several sections (Annexure 4). It was based on the ‘Oral Health Assessment Form’ recommended by the WHO for population surveys23. However, to suit local requirement of the country, few modifications were made.
Sections A, B, C and O consisted of questions on socio-demographic factors, habits and dental service utilization pattern in the form of an interviewer-administered questionnaire.
Sections D, E, F, G, H, I, J, K, L, M and N consisted of a data record sheet for clinical oral examination. Oral mucosal conditions, enamel fluorosis, tooth-wear, dental trauma, dento-facial anomalies, dentition status, periodontal status, loss of attachment, calculus, treatment need and denture-wearing status were recorded during clinical examination.
The size of the form was restricted to two A4 size pages for easy handling and recording. All the cages of the form were coded to facilitate data entry. 2.4.2 Clinical examination criteria, questions and codes
A separate guideline was formulated for examiners, which consisted of instructions on administering questionnaire, criteria for clinical examination and respective codes (Annexure 5). The examiners were instructed to read the guideline thoroughly and familiarize themselves with the questions, clinical procedures and codes.
2.5 Examiner training, calibration and maintenance of data quality
A total of 29 examiners who possess MSc in Community Dentistry were selected as examiners for the survey. They were trained and calibrated against gold-standards (03 Consultants in Community Dentistry who also had experience as examiners in previous NOHS) to minimize the examiner variability. Intra and inter examiner variability was assessed throughout the survey by duplicating the examinations and interviews. Examiner training and calibration session were conducted in two identical episodes two days apart. The calibration was based on tooth-by-tooth assessments of caries (DMFT/dmft scores) and periodontal (gingival bleeding-on-probing and periodontal pockets) status of a given patient. All examiners were allocated patients and examination findings were compared between examiners as well as with the findings of the experts to ensure validity and reliability. If any examiner failed to achieve a satisfactory level of consistency, he/she was further calibrated against the experts.
11
In addition, at progress-review meetings, the identified issues related to data collection during the survey were further discussed and rectified.
Consistency of examinations was also measured by instructing examiners to make duplicate examinations on samples of 5-year-olds, 12-year-olds and 15-year-olds. Interclass-correlations of those examinations were calculated to measure the consistency of examinations. Variables that were subjected to errors during examiner calibration were used for this exercise. Details of the examiner training and calibration are given in Annexure 6. SDTs (and in few instances dental surgeons) functioned as data recorders. They were selected from the area where the cluster was located and trained by the respective examiners at the field setting. Prior to data collection, they were briefed about the survey guidelines and the data collection form. During the survey, the examiners constantly monitored the entries to ensure accuracy of the recording. 2.6 Administrative requirements
Permission was obtained from the Secretary, Ministry of Education to conduct the survey in schools island-wide. Relevant provincial, zonal and divisional education directors and the school principals were informed prior to visiting the schools. Moreover, all RDHSs, RDSs and relevant MOHs were also informed. Furthermore, all the examiners were provided with a letter by the DGHS authorizing them to engage in data collection for the survey with an identity card signed by the DDG/DS. 2.7 Data collection
The survey team was instructed to visit the selected school initially for examination of 5-year-olds, 12-year-olds, and 15-year-olds and then to move to the field for examination of the 35-44-year-olds and 65-74-year-olds. The team was advised to introduce themselves, explain the purpose, the survey procedure and obtain consent from the participants before examinations and interviews. To facilitate data collection, ‘examination-units’ were formed; each consisted of an examiner, a data recorder and an assistant. Each examiner was provided with an ‘enumeration-kit’ which consisted of a survey guideline, set of survey forms, pencils, pencil sharpener and erasers (Figure 2.2). All the interviews and examinations were performed by trained and calibrated examiners and data were recorded by SDTs or dental surgeons who are serving in the survey area. During the clinical examinations, assistance was provided by trained health assistants. In general, 03 examination-units were allocated per cluster. However, depending on the logistics in terms of travelling distance and the population density, 02-04 examination-units were assigned for some clusters. Public Health Midwives (PHMs) and Public Health Inspectors (PHIs) of a given area provided assistance during the house-to-house visits searching for 35-44-year-olds and 65-74-year-olds. Logistic support was arranged by the RDSs and MOHs of the area. (The members of a survey team is given in Figure 2.3) Examinations were carried out under the daylight, while the subject was seated on a normal chair. A mouth mirror, Community Periodontal Index (CPI) probe, a pair of tweezers and a piece of gauze were used for the oral examination. Sterile instruments were used for all the subjects and the standard precautions in infection control were adopted (Figures 2.4 and 2.5). At the end of data collection, the participant was informed about his/her oral health status with appropriate referrals where necessary. Also all examiners were instructed to check the data entries before leaving the participant. The list of examiners who participated in the survey and their total number of examinations are given in Annexure 7.
Mat
eria
ls a
nd
m
eth
od
s
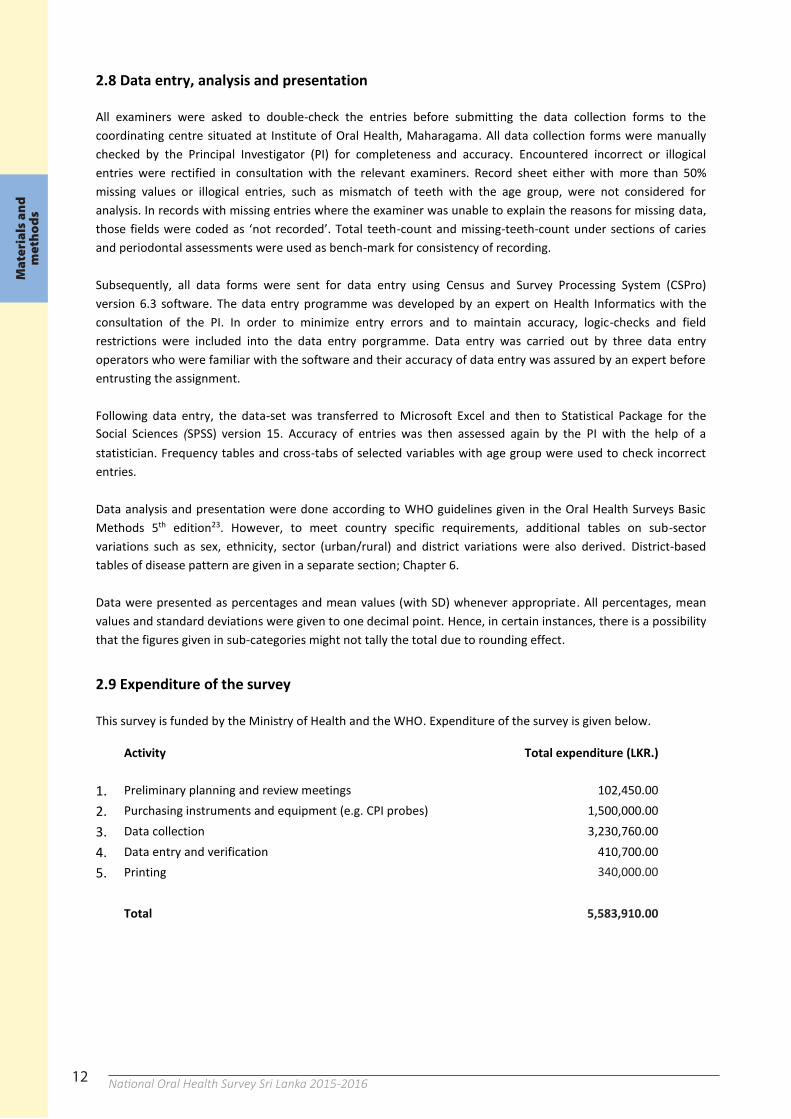
12 National Oral Health Survey Sri Lanka 2015-201612
2.8 Data entry, analysis and presentation
All examiners were asked to double-check the entries before submitting the data collection forms to the coordinating centre situated at Institute of Oral Health, Maharagama. All data collection forms were manually checked by the Principal Investigator (PI) for completeness and accuracy. Encountered incorrect or illogical entries were rectified in consultation with the relevant examiners. Record sheet either with more than 50% missing values or illogical entries, such as mismatch of teeth with the age group, were not considered for analysis. In records with missing entries where the examiner was unable to explain the reasons for missing data, those fields were coded as ‘not recorded’. Total teeth-count and missing-teeth-count under sections of caries and periodontal assessments were used as bench-mark for consistency of recording. Subsequently, all data forms were sent for data entry using Census and Survey Processing System (CSPro) version 6.3 software. The data entry programme was developed by an expert on Health Informatics with the consultation of the PI. In order to minimize entry errors and to maintain accuracy, logic-checks and field restrictions were included into the data entry porgramme. Data entry was carried out by three data entry operators who were familiar with the software and their accuracy of data entry was assured by an expert before entrusting the assignment. Following data entry, the data-set was transferred to Microsoft Excel and then to Statistical Package for the Social Sciences (SPSS) version 15. Accuracy of entries was then assessed again by the PI with the help of a statistician. Frequency tables and cross-tabs of selected variables with age group were used to check incorrect entries. Data analysis and presentation were done according to WHO guidelines given in the Oral Health Surveys Basic Methods 5th edition23. However, to meet country specific requirements, additional tables on sub-sector variations such as sex, ethnicity, sector (urban/rural) and district variations were also derived. District-based tables of disease pattern are given in a separate section; Chapter 6. Data were presented as percentages and mean values (with SD) whenever appropriate. All percentages, mean values and standard deviations were given to one decimal point. Hence, in certain instances, there is a possibility that the figures given in sub-categories might not tally the total due to rounding effect.
2.9 Expenditure of the survey
This survey is funded by the Ministry of Health and the WHO. Expenditure of the survey is given below.
Activity
Total expenditure (LKR.)
1. Preliminary planning and review meetings 102,450.00 2. Purchasing instruments and equipment (e.g. CPI probes) 1,500,000.00 3. Data collection 3,230,760.00 4. Data entry and verification 410,700.00 5. Printing 600,000.00 Total 5,843,910.00
13
Figure 2.1 Cluster distribution of the National Oral Health Survey 2015-2016
Figure 2.2: Enumeration kit
Mat
eria
ls a
nd
m
eth
od
s
12 12
2.8 Data entry, analysis and presentation
All examiners were asked to double-check the entries before submitting the data collection forms to the coordinating centre situated at Institute of Oral Health, Maharagama. All data collection forms were manually checked by the Principal Investigator (PI) for completeness and accuracy. Encountered incorrect or illogical entries were rectified in consultation with the relevant examiners. Record sheet either with more than 50% missing values or illogical entries, such as mismatch of teeth with the age group, were not considered for analysis. In records with missing entries where the examiner was unable to explain the reasons for missing data, those fields were coded as ‘not recorded’. Total teeth-count and missing-teeth-count under sections of caries and periodontal assessments were used as bench-mark for consistency of recording. Subsequently, all data forms were sent for data entry using Census and Survey Processing System (CSPro) version 6.3 software. The data entry programme was developed by an expert on Health Informatics with the consultation of the PI. In order to minimize entry errors and to maintain accuracy, logic-checks and field restrictions were included into the data entry porgramme. Data entry was carried out by three data entry operators who were familiar with the software and their accuracy of data entry was assured by an expert before entrusting the assignment. Following data entry, the data-set was transferred to Microsoft Excel and then to Statistical Package for the Social Sciences (SPSS) version 15. Accuracy of entries was then assessed again by the PI with the help of a statistician. Frequency tables and cross-tabs of selected variables with age group were used to check incorrect entries. Data analysis and presentation were done according to WHO guidelines given in the Oral Health Surveys Basic Methods 5th edition23. However, to meet country specific requirements, additional tables on sub-sector variations such as sex, ethnicity, sector (urban/rural) and district variations were also derived. District-based tables of disease pattern are given in a separate section; Chapter 6. Data were presented as percentages and mean values (with SD) whenever appropriate. All percentages, mean values and standard deviations were given to one decimal point. Hence, in certain instances, there is a possibility that the figures given in sub-categories might not tally the total due to rounding effect.
2.9 Expenditure of the survey
This survey is funded by the Ministry of Health and the WHO. Expenditure of the survey is given below.
Activity
Total expenditure (LKR.)
1. Preliminary planning and review meetings 102,450.00
2. Purchasing instruments and equipment (e.g. CPI probes) 1,500,000.00
3. Data collection 3,230,760.00
4. Data entry and verification 410,700.00
5. Printing 340,000.00
Total 5,583,910.00
Mat
eria
ls a
nd
m
eth
od
s
5,583,910.00
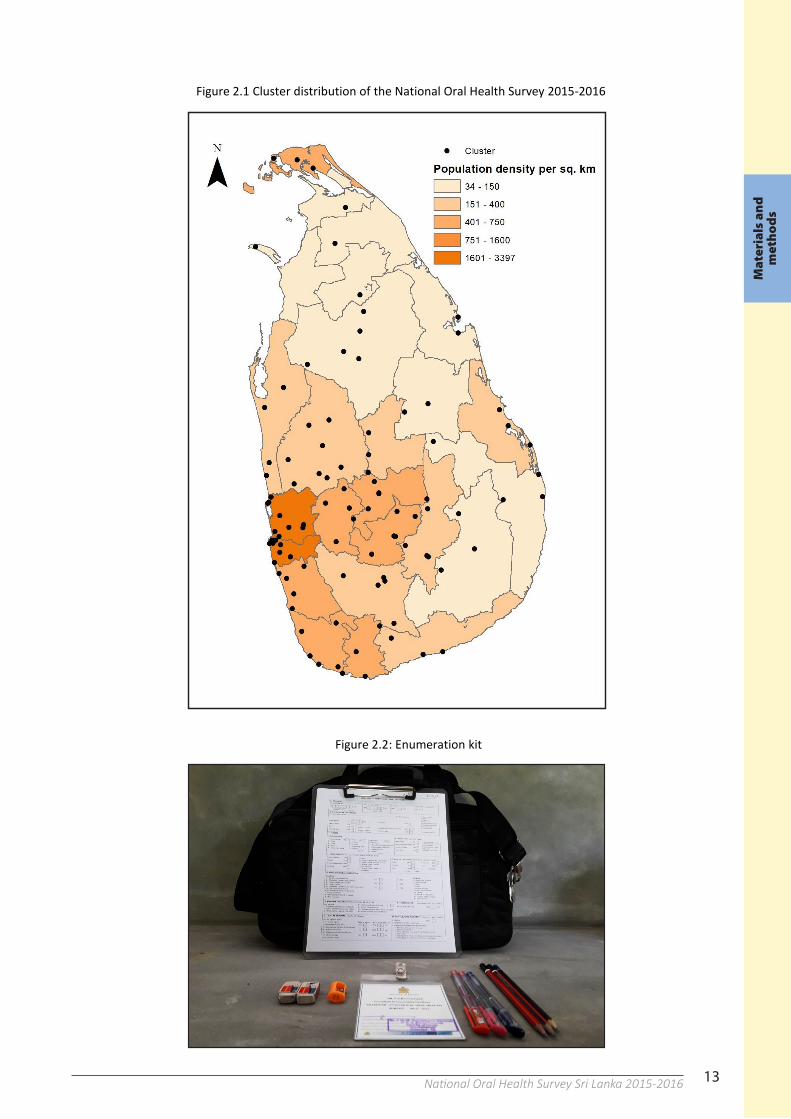
13National Oral Health Survey Sri Lanka 2015-201612
2.8 Data entry, analysis and presentation
All examiners were asked to double-check the entries before submitting the data collection forms to the coordinating centre situated at Institute of Oral Health, Maharagama. All data collection forms were manually checked by the Principal Investigator (PI) for completeness and accuracy. Encountered incorrect or illogical entries were rectified in consultation with the relevant examiners. Record sheet either with more than 50% missing values or illogical entries, such as mismatch of teeth with the age group, were not considered for analysis. In records with missing entries where the examiner was unable to explain the reasons for missing data, those fields were coded as ‘not recorded’. Total teeth-count and missing-teeth-count under sections of caries and periodontal assessments were used as bench-mark for consistency of recording. Subsequently, all data forms were sent for data entry using Census and Survey Processing System (CSPro) version 6.3 software. The data entry programme was developed by an expert on Health Informatics with the consultation of the PI. In order to minimize entry errors and to maintain accuracy, logic-checks and field restrictions were included into the data entry porgramme. Data entry was carried out by three data entry operators who were familiar with the software and their accuracy of data entry was assured by an expert before entrusting the assignment. Following data entry, the data-set was transferred to Microsoft Excel and then to Statistical Package for the Social Sciences (SPSS) version 15. Accuracy of entries was then assessed again by the PI with the help of a statistician. Frequency tables and cross-tabs of selected variables with age group were used to check incorrect entries. Data analysis and presentation were done according to WHO guidelines given in the Oral Health Surveys Basic Methods 5th edition23. However, to meet country specific requirements, additional tables on sub-sector variations such as sex, ethnicity, sector (urban/rural) and district variations were also derived. District-based tables of disease pattern are given in a separate section; Chapter 6. Data were presented as percentages and mean values (with SD) whenever appropriate. All percentages, mean values and standard deviations were given to one decimal point. Hence, in certain instances, there is a possibility that the figures given in sub-categories might not tally the total due to rounding effect.
2.9 Expenditure of the survey
This survey is funded by the Ministry of Health and the WHO. Expenditure of the survey is given below.
Activity
Total expenditure (LKR.)
1. Preliminary planning and review meetings 102,450.00 2. Purchasing instruments and equipment (e.g. CPI probes) 1,500,000.00 3. Data collection 3,230,760.00 4. Data entry and verification 410,700.00 5. Printing 600,000.00 Total 5,843,910.00
13
Figure 2.1 Cluster distribution of the National Oral Health Survey 2015-2016
Figure 2.2: Enumeration kit
13
Figure 2.1 Cluster distribution of the National Oral Health Survey 2015-2016
Figure 2.2: Enumeration kit
Mat
eria
ls a
nd
m
eth
od
s
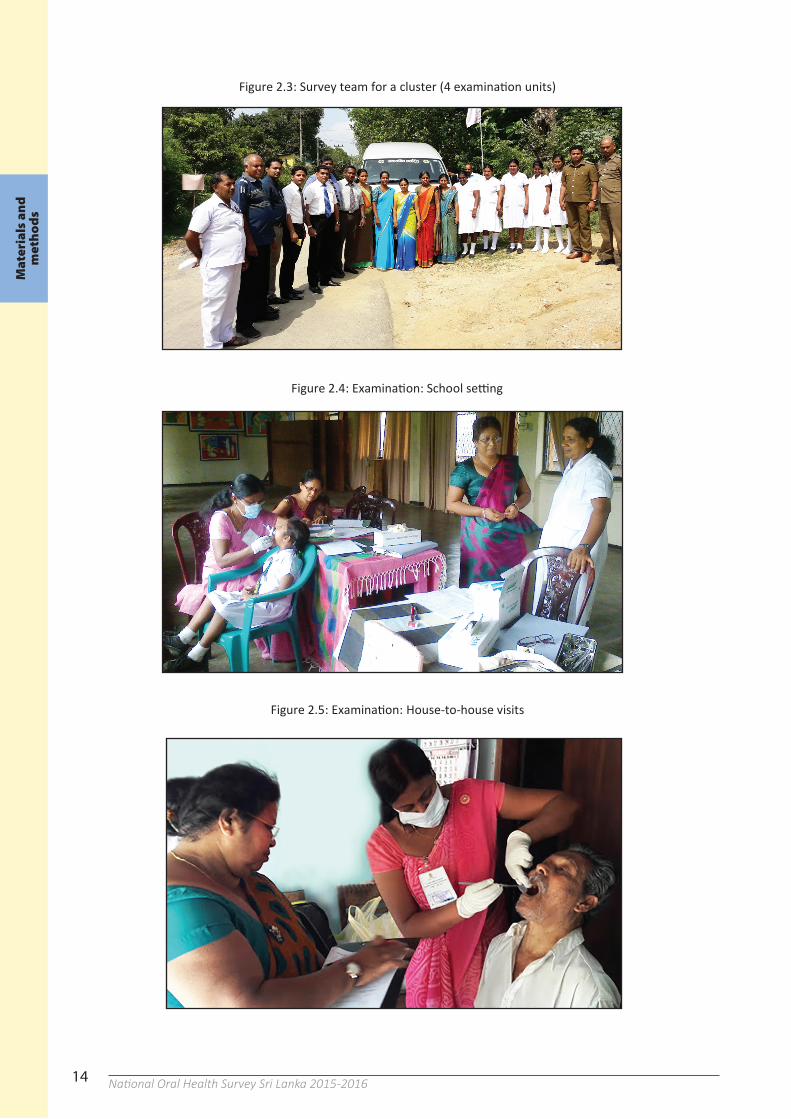
14 National Oral Health Survey Sri Lanka 2015-201614
Figure 2.3: Survey team for a cluster (4 examination units)
Figure 2.4: Examination: School setting
Figure 2.5: Examination: House-to-house visits
14
Figure 2.3: Survey team for a cluster (4 examination units)
Figure 2.4: Examination: School setting
Figure 2.5: Examination: House-to-house visits
14
Figure 2.3: Survey team for a cluster (4 examination units)
Figure 2.4: Examination: School setting
Figure 2.5: Examination: House-to-house visits
Mat
eria
ls a
nd
m
eth
od
sM
ater
ials
an
d
met
ho
ds
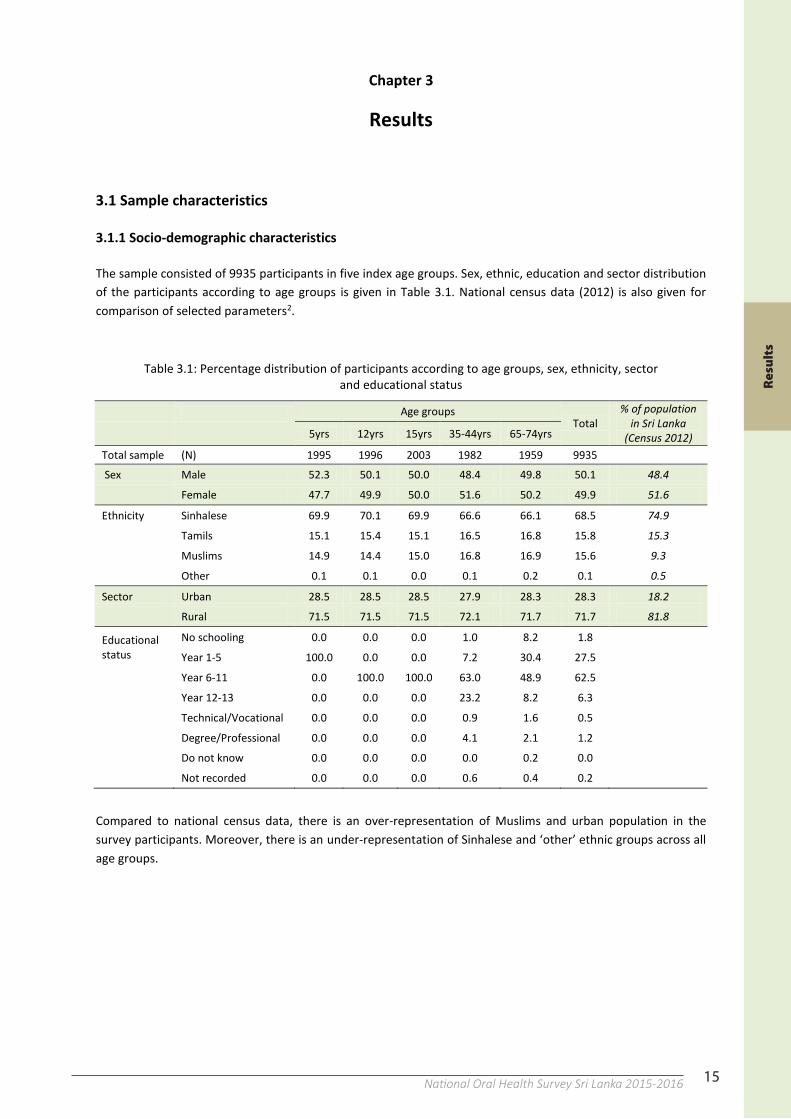
15National Oral Health Survey Sri Lanka 2015-201615
Chapter 3
Results
3.1 Sample characteristics
3.1.1 Socio-demographic characteristics
The sample consisted of 9935 participants in five index age groups. Sex, ethnic, education and sector distribution of the participants according to age groups is given in Table 3.1. National census data (2012) is also given for comparison of selected parameters2.
Table 3.1: Percentage distribution of participants according to age groups, sex, ethnicity, sector and educational status
Age groups
Total % of population
in Sri Lanka (Census 2012)
5yrs 12yrs 15yrs 35-44yrs 65-74yrs
Total sample (N) 1995 1996 2003 1982 1959 9935 Sex Male 52.3 50.1 50.0 48.4 49.8 50.1 48.4
Female 47.7 49.9 50.0 51.6 50.2 49.9 51.6
Ethnicity Sinhalese 69.9 70.1 69.9 66.6 66.1 68.5 74.9
Tamils 15.1 15.4 15.1 16.5 16.8 15.8 15.3
Muslims 14.9 14.4 15.0 16.8 16.9 15.6 9.3
Other 0.1 0.1 0.0 0.1 0.2 0.1 0.5
Sector Urban 28.5 28.5 28.5 27.9 28.3 28.3 18.2
Rural 71.5 71.5 71.5 72.1 71.7 71.7 81.8
Educational status
No schooling 0.0 0.0 0.0 1.0 8.2 1.8
Year 1-5 100.0 0.0 0.0 7.2 30.4 27.5
Year 6-11 0.0 100.0 100.0 63.0 48.9 62.5
Year 12-13 0.0 0.0 0.0 23.2 8.2 6.3
Technical/Vocational 0.0 0.0 0.0 0.9 1.6 0.5
Degree/Professional 0.0 0.0 0.0 4.1 2.1 1.2
Do not know 0.0 0.0 0.0 0.0 0.2 0.0
Not recorded 0.0 0.0 0.0 0.6 0.4 0.2
Compared to national census data, there is an over-representation of Muslims and urban population in the survey participants. Moreover, there is an under-representation of Sinhalese and ‘other’ ethnic groups across all age groups.
Res
ult
s
14
Figure 2.3: Survey team for a cluster (4 examination units)
Figure 2.4: Examination: School setting
Figure 2.5: Examination: House-to-house visits
14
Figure 2.3: Survey team for a cluster (4 examination units)
Figure 2.4: Examination: School setting
Figure 2.5: Examination: House-to-house visits
14
Figure 2.3: Survey team for a cluster (4 examination units)
Figure 2.4: Examination: School setting
Figure 2.5: Examination: House-to-house visits
Mat
eria
ls a
nd
m
eth
od
s
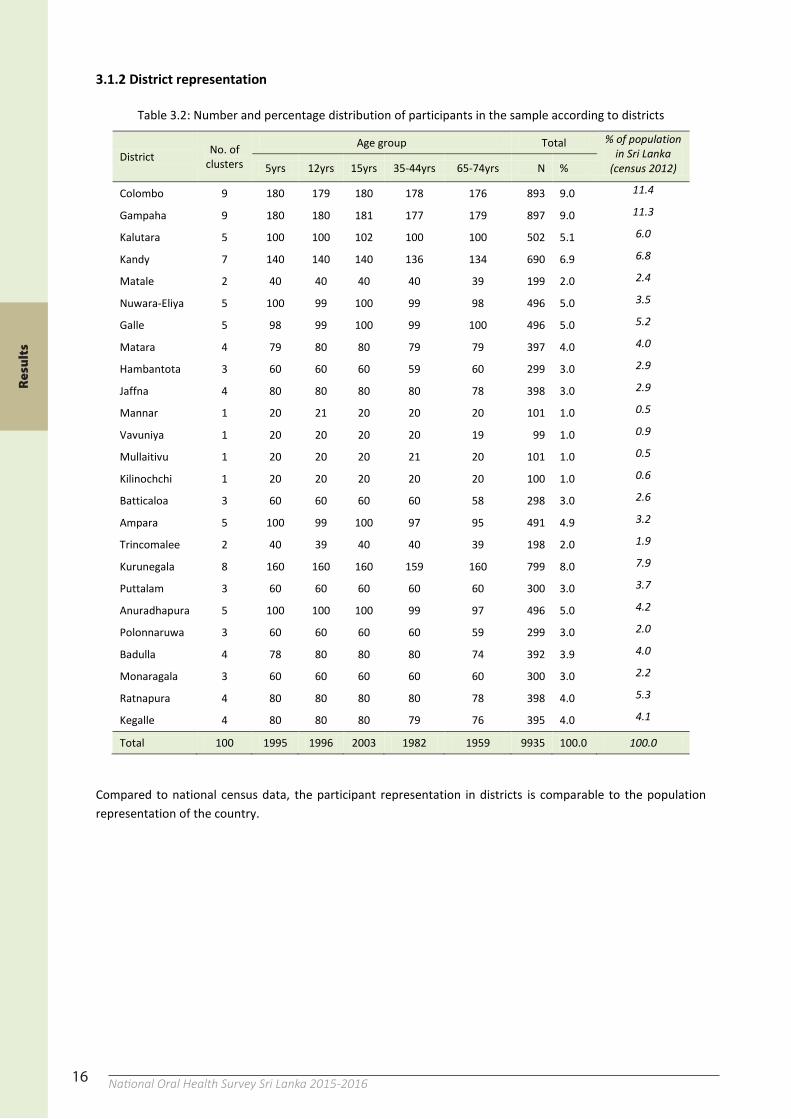
16 National Oral Health Survey Sri Lanka 2015-201616
3.1.2 District representation
Table 3.2: Number and percentage distribution of participants in the sample according to districts
District No. of clusters
Age group Total % of population in Sri Lanka
(census 2012) 5yrs 12yrs 15yrs 35-44yrs 65-74yrs N %
Colombo 9 180 179 180 178 176 893 9.0 11.4
Gampaha 9 180 180 181 177 179 897 9.0 11.3
Kalutara 5 100 100 102 100 100 502 5.1 6.0
Kandy 7 140 140 140 136 134 690 6.9 6.8
Matale 2 40 40 40 40 39 199 2.0 2.4
Nuwara-Eliya 5 100 99 100 99 98 496 5.0 3.5
Galle 5 98 99 100 99 100 496 5.0 5.2
Matara 4 79 80 80 79 79 397 4.0 4.0
Hambantota 3 60 60 60 59 60 299 3.0 2.9
Jaffna 4 80 80 80 80 78 398 3.0 2.9
Mannar 1 20 21 20 20 20 101 1.0 0.5
Vavuniya 1 20 20 20 20 19 99 1.0 0.9
Mullaitivu 1 20 20 20 21 20 101 1.0 0.5
Kilinochchi 1 20 20 20 20 20 100 1.0 0.6
Batticaloa 3 60 60 60 60 58 298 3.0 2.6
Ampara 5 100 99 100 97 95 491 4.9 3.2
Trincomalee 2 40 39 40 40 39 198 2.0 1.9
Kurunegala 8 160 160 160 159 160 799 8.0 7.9
Puttalam 3 60 60 60 60 60 300 3.0 3.7
Anuradhapura 5 100 100 100 99 97 496 5.0 4.2
Polonnaruwa 3 60 60 60 60 59 299 3.0 2.0
Badulla 4 78 80 80 80 74 392 3.9 4.0
Monaragala 3 60 60 60 60 60 300 3.0 2.2
Ratnapura 4 80 80 80 80 78 398 4.0 5.3
Kegalle 4 80 80 80 79 76 395 4.0 4.1
Total 100 1995 1996 2003 1982 1959 9935 100.0 100.0
Compared to national census data, the participant representation in districts is comparable to the population representation of the country.
Res
ult
s
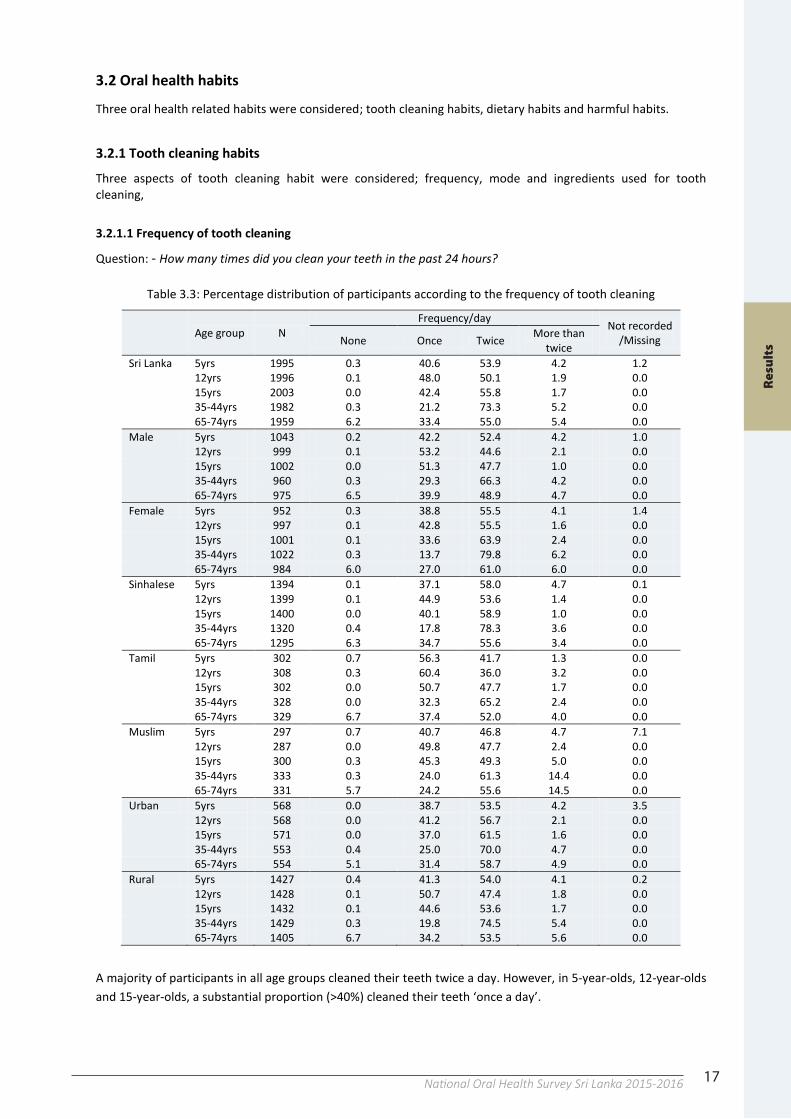
17National Oral Health Survey Sri Lanka 2015-201616
3.1.2 District representation
Table 3.2: Number and percentage distribution of participants in the sample according to districts
District No. of clusters
Age group Total % of population in Sri Lanka
(census 2012) 5yrs 12yrs 15yrs 35-44yrs 65-74yrs N %
Colombo 9 180 179 180 178 176 893 9.0 11.4
Gampaha 9 180 180 181 177 179 897 9.0 11.3
Kalutara 5 100 100 102 100 100 502 5.1 6.0
Kandy 7 140 140 140 136 134 690 6.9 6.8
Matale 2 40 40 40 40 39 199 2.0 2.4
Nuwara-Eliya 5 100 99 100 99 98 496 5.0 3.5
Galle 5 98 99 100 99 100 496 5.0 5.2
Matara 4 79 80 80 79 79 397 4.0 4.0
Hambantota 3 60 60 60 59 60 299 3.0 2.9
Jaffna 4 80 80 80 80 78 398 3.0 2.9
Mannar 1 20 21 20 20 20 101 1.0 0.5
Vavuniya 1 20 20 20 20 19 99 1.0 0.9
Mullaitivu 1 20 20 20 21 20 101 1.0 0.5
Kilinochchi 1 20 20 20 20 20 100 1.0 0.6
Batticaloa 3 60 60 60 60 58 298 3.0 2.6
Ampara 5 100 99 100 97 95 491 4.9 3.2
Trincomalee 2 40 39 40 40 39 198 2.0 1.9
Kurunegala 8 160 160 160 159 160 799 8.0 7.9
Puttalam 3 60 60 60 60 60 300 3.0 3.7
Anuradhapura 5 100 100 100 99 97 496 5.0 4.2
Polonnaruwa 3 60 60 60 60 59 299 3.0 2.0
Badulla 4 78 80 80 80 74 392 3.9 4.0
Monaragala 3 60 60 60 60 60 300 3.0 2.2
Ratnapura 4 80 80 80 80 78 398 4.0 5.3
Kegalle 4 80 80 80 79 76 395 4.0 4.1
Total 100 1995 1996 2003 1982 1959 9935 100.0 100.0
Compared to national census data, the participant representation in districts is comparable to the population representation of the country.
17
3.2 Oral health habits
Three oral health related habits were considered; tooth cleaning habits, dietary habits and harmful habits.
3.2.1 Tooth cleaning habits
Three aspects of tooth cleaning habit were considered; frequency, mode and ingredients used for tooth cleaning,
3.2.1.1 Frequency of tooth cleaning
Question: - How many times did you clean your teeth in the past 24 hours?
Table 3.3: Percentage distribution of participants according to the frequency of tooth cleaning
Age group N Frequency/day Not recorded
/Missing None Once Twice More than twice
Sri Lanka 5yrs 1995 0.3 40.6 53.9 4.2 1.2
12yrs 1996 0.1 48.0 50.1 1.9 0.0
15yrs 2003 0.0 42.4 55.8 1.7 0.0
35-44yrs 1982 0.3 21.2 73.3 5.2 0.0
65-74yrs 1959 6.2 33.4 55.0 5.4 0.0 Male 5yrs 1043 0.2 42.2 52.4 4.2 1.0
12yrs 999 0.1 53.2 44.6 2.1 0.0
15yrs 1002 0.0 51.3 47.7 1.0 0.0
35-44yrs 960 0.3 29.3 66.3 4.2 0.0
65-74yrs 975 6.5 39.9 48.9 4.7 0.0 Female 5yrs 952 0.3 38.8 55.5 4.1 1.4
12yrs 997 0.1 42.8 55.5 1.6 0.0
15yrs 1001 0.1 33.6 63.9 2.4 0.0
35-44yrs 1022 0.3 13.7 79.8 6.2 0.0
65-74yrs 984 6.0 27.0 61.0 6.0 0.0 Sinhalese 5yrs 1394 0.1 37.1 58.0 4.7 0.1
12yrs 1399 0.1 44.9 53.6 1.4 0.0
15yrs 1400 0.0 40.1 58.9 1.0 0.0
35-44yrs 1320 0.4 17.8 78.3 3.6 0.0
65-74yrs 1295 6.3 34.7 55.6 3.4 0.0 Tamil 5yrs 302 0.7 56.3 41.7 1.3 0.0
12yrs 308 0.3 60.4 36.0 3.2 0.0
15yrs 302 0.0 50.7 47.7 1.7 0.0
35-44yrs 328 0.0 32.3 65.2 2.4 0.0
65-74yrs 329 6.7 37.4 52.0 4.0 0.0 Muslim 5yrs 297 0.7 40.7 46.8 4.7 7.1
12yrs 287 0.0 49.8 47.7 2.4 0.0
15yrs 300 0.3 45.3 49.3 5.0 0.0
35-44yrs 333 0.3 24.0 61.3 14.4 0.0
65-74yrs 331 5.7 24.2 55.6 14.5 0.0 Urban 5yrs 568 0.0 38.7 53.5 4.2 3.5
12yrs 568 0.0 41.2 56.7 2.1 0.0
15yrs 571 0.0 37.0 61.5 1.6 0.0
35-44yrs 553 0.4 25.0 70.0 4.7 0.0
65-74yrs 554 5.1 31.4 58.7 4.9 0.0 Rural 5yrs 1427 0.4 41.3 54.0 4.1 0.2
12yrs 1428 0.1 50.7 47.4 1.8 0.0
15yrs 1432 0.1 44.6 53.6 1.7 0.0
35-44yrs 1429 0.3 19.8 74.5 5.4 0.0
65-74yrs 1405 6.7 34.2 53.5 5.6 0.0
A majority of participants in all age groups cleaned their teeth twice a day. However, in 5-year-olds, 12-year-olds and 15-year-olds, a substantial proportion (>40%) cleaned their teeth ‘once a day’.
Res
ult
s
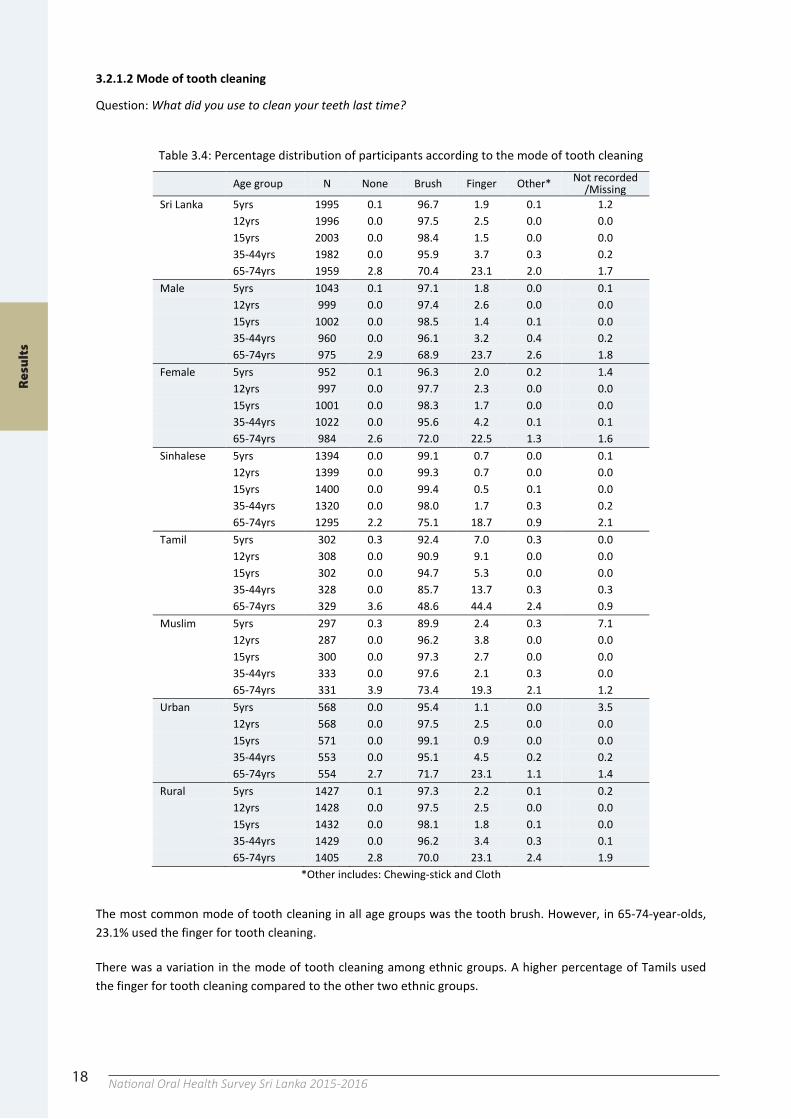
18 National Oral Health Survey Sri Lanka 2015-201618
3.2.1.2 Mode of tooth cleaning
Question: What did you use to clean your teeth last time?
Table 3.4: Percentage distribution of participants according to the mode of tooth cleaning
Age group N None Brush Finger Other* Not recorded /Missing
Sri Lanka 5yrs 1995 0.1 96.7 1.9 0.1 1.2
12yrs 1996 0.0 97.5 2.5 0.0 0.0
15yrs 2003 0.0 98.4 1.5 0.0 0.0
35-44yrs 1982 0.0 95.9 3.7 0.3 0.2
65-74yrs 1959 2.8 70.4 23.1 2.0 1.7 Male 5yrs 1043 0.1 97.1 1.8 0.0 0.1
12yrs 999 0.0 97.4 2.6 0.0 0.0
15yrs 1002 0.0 98.5 1.4 0.1 0.0
35-44yrs 960 0.0 96.1 3.2 0.4 0.2
65-74yrs 975 2.9 68.9 23.7 2.6 1.8 Female 5yrs 952 0.1 96.3 2.0 0.2 1.4
12yrs 997 0.0 97.7 2.3 0.0 0.0
15yrs 1001 0.0 98.3 1.7 0.0 0.0
35-44yrs 1022 0.0 95.6 4.2 0.1 0.1
65-74yrs 984 2.6 72.0 22.5 1.3 1.6 Sinhalese 5yrs 1394 0.0 99.1 0.7 0.0 0.1
12yrs 1399 0.0 99.3 0.7 0.0 0.0
15yrs 1400 0.0 99.4 0.5 0.1 0.0
35-44yrs 1320 0.0 98.0 1.7 0.3 0.2
65-74yrs 1295 2.2 75.1 18.7 0.9 2.1 Tamil 5yrs 302 0.3 92.4 7.0 0.3 0.0
12yrs 308 0.0 90.9 9.1 0.0 0.0
15yrs 302 0.0 94.7 5.3 0.0 0.0
35-44yrs 328 0.0 85.7 13.7 0.3 0.3
65-74yrs 329 3.6 48.6 44.4 2.4 0.9 Muslim 5yrs 297 0.3 89.9 2.4 0.3 7.1
12yrs 287 0.0 96.2 3.8 0.0 0.0
15yrs 300 0.0 97.3 2.7 0.0 0.0
35-44yrs 333 0.0 97.6 2.1 0.3 0.0
65-74yrs 331 3.9 73.4 19.3 2.1 1.2 Urban 5yrs 568 0.0 95.4 1.1 0.0 3.5
12yrs 568 0.0 97.5 2.5 0.0 0.0
15yrs 571 0.0 99.1 0.9 0.0 0.0
35-44yrs 553 0.0 95.1 4.5 0.2 0.2
65-74yrs 554 2.7 71.7 23.1 1.1 1.4 Rural 5yrs 1427 0.1 97.3 2.2 0.1 0.2
12yrs 1428 0.0 97.5 2.5 0.0 0.0
15yrs 1432 0.0 98.1 1.8 0.1 0.0
35-44yrs 1429 0.0 96.2 3.4 0.3 0.1
65-74yrs 1405 2.8 70.0 23.1 2.4 1.9 *Other includes: Chewing-stick and Cloth
The most common mode of tooth cleaning in all age groups was the tooth brush. However, in 65-74-year-olds, 23.1% used the finger for tooth cleaning.
There was a variation in the mode of tooth cleaning among ethnic groups. A higher percentage of Tamils used the finger for tooth cleaning compared to the other two ethnic groups.
Res
ult
s
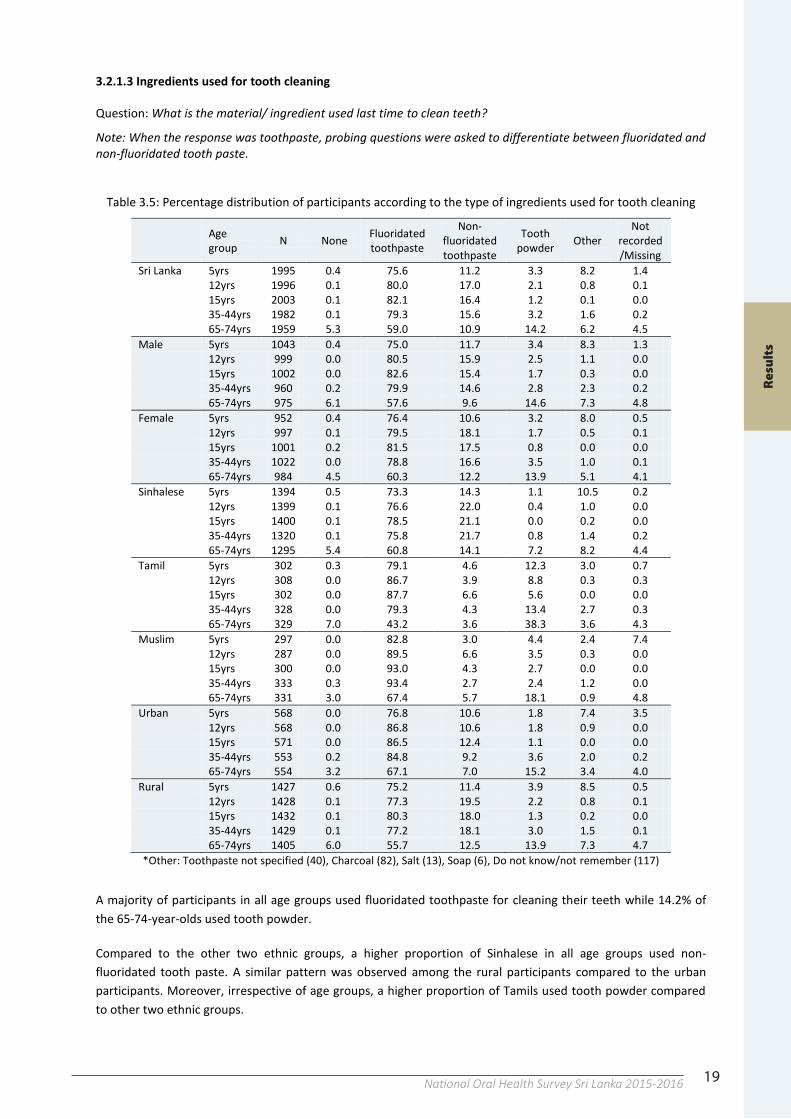
19National Oral Health Survey Sri Lanka 2015-201618
3.2.1.2 Mode of tooth cleaning
Question: What did you use to clean your teeth last time?
Table 3.4: Percentage distribution of participants according to the mode of tooth cleaning
Age group N None Brush Finger Other* Not recorded /Missing
Sri Lanka 5yrs 1995 0.1 96.7 1.9 0.1 1.2
12yrs 1996 0.0 97.5 2.5 0.0 0.0
15yrs 2003 0.0 98.4 1.5 0.0 0.0
35-44yrs 1982 0.0 95.9 3.7 0.3 0.2
65-74yrs 1959 2.8 70.4 23.1 2.0 1.7 Male 5yrs 1043 0.1 97.1 1.8 0.0 0.1
12yrs 999 0.0 97.4 2.6 0.0 0.0
15yrs 1002 0.0 98.5 1.4 0.1 0.0
35-44yrs 960 0.0 96.1 3.2 0.4 0.2
65-74yrs 975 2.9 68.9 23.7 2.6 1.8 Female 5yrs 952 0.1 96.3 2.0 0.2 1.4
12yrs 997 0.0 97.7 2.3 0.0 0.0
15yrs 1001 0.0 98.3 1.7 0.0 0.0
35-44yrs 1022 0.0 95.6 4.2 0.1 0.1
65-74yrs 984 2.6 72.0 22.5 1.3 1.6 Sinhalese 5yrs 1394 0.0 99.1 0.7 0.0 0.1
12yrs 1399 0.0 99.3 0.7 0.0 0.0
15yrs 1400 0.0 99.4 0.5 0.1 0.0
35-44yrs 1320 0.0 98.0 1.7 0.3 0.2
65-74yrs 1295 2.2 75.1 18.7 0.9 2.1 Tamil 5yrs 302 0.3 92.4 7.0 0.3 0.0
12yrs 308 0.0 90.9 9.1 0.0 0.0
15yrs 302 0.0 94.7 5.3 0.0 0.0
35-44yrs 328 0.0 85.7 13.7 0.3 0.3
65-74yrs 329 3.6 48.6 44.4 2.4 0.9 Muslim 5yrs 297 0.3 89.9 2.4 0.3 7.1
12yrs 287 0.0 96.2 3.8 0.0 0.0
15yrs 300 0.0 97.3 2.7 0.0 0.0
35-44yrs 333 0.0 97.6 2.1 0.3 0.0
65-74yrs 331 3.9 73.4 19.3 2.1 1.2 Urban 5yrs 568 0.0 95.4 1.1 0.0 3.5
12yrs 568 0.0 97.5 2.5 0.0 0.0
15yrs 571 0.0 99.1 0.9 0.0 0.0
35-44yrs 553 0.0 95.1 4.5 0.2 0.2
65-74yrs 554 2.7 71.7 23.1 1.1 1.4 Rural 5yrs 1427 0.1 97.3 2.2 0.1 0.2
12yrs 1428 0.0 97.5 2.5 0.0 0.0
15yrs 1432 0.0 98.1 1.8 0.1 0.0
35-44yrs 1429 0.0 96.2 3.4 0.3 0.1
65-74yrs 1405 2.8 70.0 23.1 2.4 1.9 *Other includes: Chewing-stick and Cloth
The most common mode of tooth cleaning in all age groups was the tooth brush. However, in 65-74-year-olds, 23.1% used the finger for tooth cleaning.
There was a variation in the mode of tooth cleaning among ethnic groups. A higher percentage of Tamils used the finger for tooth cleaning compared to the other two ethnic groups.
19
3.2.1.3 Ingredients used for tooth cleaning
Question: What is the material/ ingredient used last time to clean teeth?
Note: When the response was toothpaste, probing questions were asked to differentiate between fluoridated and non-fluoridated tooth paste.
Table 3.5: Percentage distribution of participants according to the type of ingredients used for tooth cleaning
Age group N None Fluoridated
toothpaste
Non-fluoridated toothpaste
Tooth powder Other
Not recorded /Missing
Sri Lanka 5yrs 1995 0.4 75.6 11.2 3.3 8.2 1.4
12yrs 1996 0.1 80.0 17.0 2.1 0.8 0.1
15yrs 2003 0.1 82.1 16.4 1.2 0.1 0.0
35-44yrs 1982 0.1 79.3 15.6 3.2 1.6 0.2
65-74yrs 1959 5.3 59.0 10.9 14.2 6.2 4.5 Male 5yrs 1043 0.4 75.0 11.7 3.4 8.3 1.3
12yrs 999 0.0 80.5 15.9 2.5 1.1 0.0
15yrs 1002 0.0 82.6 15.4 1.7 0.3 0.0
35-44yrs 960 0.2 79.9 14.6 2.8 2.3 0.2
65-74yrs 975 6.1 57.6 9.6 14.6 7.3 4.8 Female 5yrs 952 0.4 76.4 10.6 3.2 8.0 0.5
12yrs 997 0.1 79.5 18.1 1.7 0.5 0.1
15yrs 1001 0.2 81.5 17.5 0.8 0.0 0.0
35-44yrs 1022 0.0 78.8 16.6 3.5 1.0 0.1
65-74yrs 984 4.5 60.3 12.2 13.9 5.1 4.1 Sinhalese 5yrs 1394 0.5 73.3 14.3 1.1 10.5 0.2
12yrs 1399 0.1 76.6 22.0 0.4 1.0 0.0
15yrs 1400 0.1 78.5 21.1 0.0 0.2 0.0
35-44yrs 1320 0.1 75.8 21.7 0.8 1.4 0.2
65-74yrs 1295 5.4 60.8 14.1 7.2 8.2 4.4 Tamil 5yrs 302 0.3 79.1 4.6 12.3 3.0 0.7
12yrs 308 0.0 86.7 3.9 8.8 0.3 0.3
15yrs 302 0.0 87.7 6.6 5.6 0.0 0.0
35-44yrs 328 0.0 79.3 4.3 13.4 2.7 0.3
65-74yrs 329 7.0 43.2 3.6 38.3 3.6 4.3 Muslim 5yrs 297 0.0 82.8 3.0 4.4 2.4 7.4
12yrs 287 0.0 89.5 6.6 3.5 0.3 0.0
15yrs 300 0.0 93.0 4.3 2.7 0.0 0.0
35-44yrs 333 0.3 93.4 2.7 2.4 1.2 0.0
65-74yrs 331 3.0 67.4 5.7 18.1 0.9 4.8 Urban 5yrs 568 0.0 76.8 10.6 1.8 7.4 3.5
12yrs 568 0.0 86.8 10.6 1.8 0.9 0.0
15yrs 571 0.0 86.5 12.4 1.1 0.0 0.0
35-44yrs 553 0.2 84.8 9.2 3.6 2.0 0.2
65-74yrs 554 3.2 67.1 7.0 15.2 3.4 4.0 Rural 5yrs 1427 0.6 75.2 11.4 3.9 8.5 0.5
12yrs 1428 0.1 77.3 19.5 2.2 0.8 0.1
15yrs 1432 0.1 80.3 18.0 1.3 0.2 0.0
35-44yrs 1429 0.1 77.2 18.1 3.0 1.5 0.1
65-74yrs 1405 6.0 55.7 12.5 13.9 7.3 4.7 *Other: Toothpaste not specified (40), Charcoal (82), Salt (13), Soap (6), Do not know/not remember (117)
A majority of participants in all age groups used fluoridated toothpaste for cleaning their teeth while 14.2% of the 65-74-year-olds used tooth powder.
Compared to the other two ethnic groups, a higher proportion of Sinhalese in all age groups used non-fluoridated tooth paste. A similar pattern was observed among the rural participants compared to the urban participants. Moreover, irrespective of age groups, a higher proportion of Tamils used tooth powder compared to other two ethnic groups.
Res
ult
s
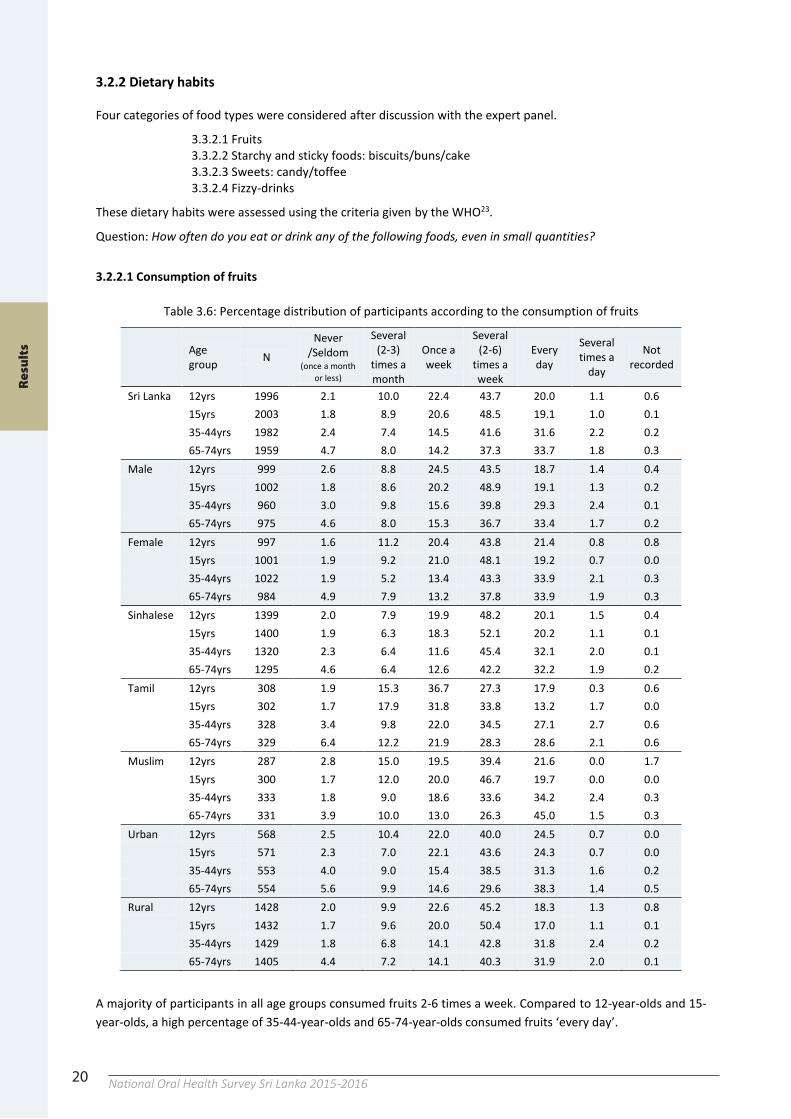
20 National Oral Health Survey Sri Lanka 2015-201620
3.2.2 Dietary habits
Four categories of food types were considered after discussion with the expert panel.
3.3.2.1 Fruits 3.3.2.2 Starchy and sticky foods: biscuits/buns/cake 3.3.2.3 Sweets: candy/toffee 3.3.2.4 Fizzy-drinks
These dietary habits were assessed using the criteria given by the WHO23.
Question: How often do you eat or drink any of the following foods, even in small quantities?
3.2.2.1 Consumption of fruits
Table 3.6: Percentage distribution of participants according to the consumption of fruits
Age group N
Never /Seldom
(once a month or less)
Several (2-3)
times a month
Once a week
Several (2-6)
times a week
Every day
Several times a
day
Not recorded
Sri Lanka 12yrs 1996 2.1 10.0 22.4 43.7 20.0 1.1 0.6
15yrs 2003 1.8 8.9 20.6 48.5 19.1 1.0 0.1
35-44yrs 1982 2.4 7.4 14.5 41.6 31.6 2.2 0.2
65-74yrs 1959 4.7 8.0 14.2 37.3 33.7 1.8 0.3 Male 12yrs 999 2.6 8.8 24.5 43.5 18.7 1.4 0.4
15yrs 1002 1.8 8.6 20.2 48.9 19.1 1.3 0.2
35-44yrs 960 3.0 9.8 15.6 39.8 29.3 2.4 0.1
65-74yrs 975 4.6 8.0 15.3 36.7 33.4 1.7 0.2 Female 12yrs 997 1.6 11.2 20.4 43.8 21.4 0.8 0.8
15yrs 1001 1.9 9.2 21.0 48.1 19.2 0.7 0.0
35-44yrs 1022 1.9 5.2 13.4 43.3 33.9 2.1 0.3
65-74yrs 984 4.9 7.9 13.2 37.8 33.9 1.9 0.3 Sinhalese 12yrs 1399 2.0 7.9 19.9 48.2 20.1 1.5 0.4
15yrs 1400 1.9 6.3 18.3 52.1 20.2 1.1 0.1
35-44yrs 1320 2.3 6.4 11.6 45.4 32.1 2.0 0.1
65-74yrs 1295 4.6 6.4 12.6 42.2 32.2 1.9 0.2 Tamil 12yrs 308 1.9 15.3 36.7 27.3 17.9 0.3 0.6
15yrs 302 1.7 17.9 31.8 33.8 13.2 1.7 0.0
35-44yrs 328 3.4 9.8 22.0 34.5 27.1 2.7 0.6
65-74yrs 329 6.4 12.2 21.9 28.3 28.6 2.1 0.6 Muslim 12yrs 287 2.8 15.0 19.5 39.4 21.6 0.0 1.7
15yrs 300 1.7 12.0 20.0 46.7 19.7 0.0 0.0
35-44yrs 333 1.8 9.0 18.6 33.6 34.2 2.4 0.3
65-74yrs 331 3.9 10.0 13.0 26.3 45.0 1.5 0.3 Urban 12yrs 568 2.5 10.4 22.0 40.0 24.5 0.7 0.0
15yrs 571 2.3 7.0 22.1 43.6 24.3 0.7 0.0
35-44yrs 553 4.0 9.0 15.4 38.5 31.3 1.6 0.2
65-74yrs 554 5.6 9.9 14.6 29.6 38.3 1.4 0.5 Rural 12yrs 1428 2.0 9.9 22.6 45.2 18.3 1.3 0.8
15yrs 1432 1.7 9.6 20.0 50.4 17.0 1.1 0.1
35-44yrs 1429 1.8 6.8 14.1 42.8 31.8 2.4 0.2
65-74yrs 1405 4.4 7.2 14.1 40.3 31.9 2.0 0.1
A majority of participants in all age groups consumed fruits 2-6 times a week. Compared to 12-year-olds and 15-year-olds, a high percentage of 35-44-year-olds and 65-74-year-olds consumed fruits ‘every day’.
Res
ult
s
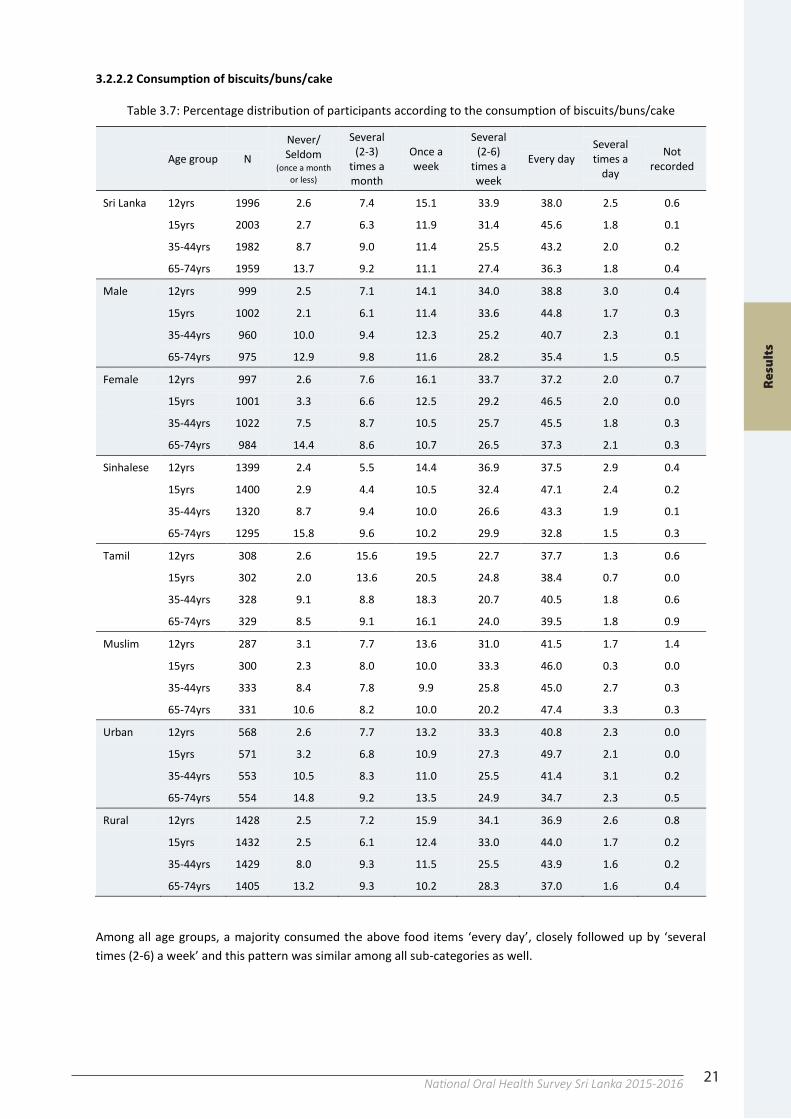
21National Oral Health Survey Sri Lanka 2015-201620
3.2.2 Dietary habits
Four categories of food types were considered after discussion with the expert panel.
3.3.2.1 Fruits 3.3.2.2 Starchy and sticky foods: biscuits/buns/cake 3.3.2.3 Sweets: candy/toffee 3.3.2.4 Fizzy-drinks
These dietary habits were assessed using the criteria given by the WHO23.
Question: How often do you eat or drink any of the following foods, even in small quantities?
3.2.2.1 Consumption of fruits
Table 3.6: Percentage distribution of participants according to the consumption of fruits
Age group N
Never /Seldom
(once a month or less)
Several (2-3)
times a month
Once a week
Several (2-6)
times a week
Every day
Several times a
day
Not recorded
Sri Lanka 12yrs 1996 2.1 10.0 22.4 43.7 20.0 1.1 0.6
15yrs 2003 1.8 8.9 20.6 48.5 19.1 1.0 0.1
35-44yrs 1982 2.4 7.4 14.5 41.6 31.6 2.2 0.2
65-74yrs 1959 4.7 8.0 14.2 37.3 33.7 1.8 0.3 Male 12yrs 999 2.6 8.8 24.5 43.5 18.7 1.4 0.4
15yrs 1002 1.8 8.6 20.2 48.9 19.1 1.3 0.2
35-44yrs 960 3.0 9.8 15.6 39.8 29.3 2.4 0.1
65-74yrs 975 4.6 8.0 15.3 36.7 33.4 1.7 0.2 Female 12yrs 997 1.6 11.2 20.4 43.8 21.4 0.8 0.8
15yrs 1001 1.9 9.2 21.0 48.1 19.2 0.7 0.0
35-44yrs 1022 1.9 5.2 13.4 43.3 33.9 2.1 0.3
65-74yrs 984 4.9 7.9 13.2 37.8 33.9 1.9 0.3 Sinhalese 12yrs 1399 2.0 7.9 19.9 48.2 20.1 1.5 0.4
15yrs 1400 1.9 6.3 18.3 52.1 20.2 1.1 0.1
35-44yrs 1320 2.3 6.4 11.6 45.4 32.1 2.0 0.1
65-74yrs 1295 4.6 6.4 12.6 42.2 32.2 1.9 0.2 Tamil 12yrs 308 1.9 15.3 36.7 27.3 17.9 0.3 0.6
15yrs 302 1.7 17.9 31.8 33.8 13.2 1.7 0.0
35-44yrs 328 3.4 9.8 22.0 34.5 27.1 2.7 0.6
65-74yrs 329 6.4 12.2 21.9 28.3 28.6 2.1 0.6 Muslim 12yrs 287 2.8 15.0 19.5 39.4 21.6 0.0 1.7
15yrs 300 1.7 12.0 20.0 46.7 19.7 0.0 0.0
35-44yrs 333 1.8 9.0 18.6 33.6 34.2 2.4 0.3
65-74yrs 331 3.9 10.0 13.0 26.3 45.0 1.5 0.3 Urban 12yrs 568 2.5 10.4 22.0 40.0 24.5 0.7 0.0
15yrs 571 2.3 7.0 22.1 43.6 24.3 0.7 0.0
35-44yrs 553 4.0 9.0 15.4 38.5 31.3 1.6 0.2
65-74yrs 554 5.6 9.9 14.6 29.6 38.3 1.4 0.5 Rural 12yrs 1428 2.0 9.9 22.6 45.2 18.3 1.3 0.8
15yrs 1432 1.7 9.6 20.0 50.4 17.0 1.1 0.1
35-44yrs 1429 1.8 6.8 14.1 42.8 31.8 2.4 0.2
65-74yrs 1405 4.4 7.2 14.1 40.3 31.9 2.0 0.1
A majority of participants in all age groups consumed fruits 2-6 times a week. Compared to 12-year-olds and 15-year-olds, a high percentage of 35-44-year-olds and 65-74-year-olds consumed fruits ‘every day’.
21
3.2.2.2 Consumption of biscuits/buns/cake
Table 3.7: Percentage distribution of participants according to the consumption of biscuits/buns/cake
Age group N Never/ Seldom
(once a month or less)
Several (2-3)
times a month
Once a week
Several (2-6)
times a week
Every day Several times a
day
Not recorded
Sri Lanka 12yrs 1996 2.6 7.4 15.1 33.9 38.0 2.5 0.6
15yrs 2003 2.7 6.3 11.9 31.4 45.6 1.8 0.1
35-44yrs 1982 8.7 9.0 11.4 25.5 43.2 2.0 0.2
65-74yrs 1959 13.7 9.2 11.1 27.4 36.3 1.8 0.4
Male 12yrs 999 2.5 7.1 14.1 34.0 38.8 3.0 0.4
15yrs 1002 2.1 6.1 11.4 33.6 44.8 1.7 0.3
35-44yrs 960 10.0 9.4 12.3 25.2 40.7 2.3 0.1
65-74yrs 975 12.9 9.8 11.6 28.2 35.4 1.5 0.5
Female 12yrs 997 2.6 7.6 16.1 33.7 37.2 2.0 0.7
15yrs 1001 3.3 6.6 12.5 29.2 46.5 2.0 0.0
35-44yrs 1022 7.5 8.7 10.5 25.7 45.5 1.8 0.3
65-74yrs 984 14.4 8.6 10.7 26.5 37.3 2.1 0.3
Sinhalese 12yrs 1399 2.4 5.5 14.4 36.9 37.5 2.9 0.4
15yrs 1400 2.9 4.4 10.5 32.4 47.1 2.4 0.2
35-44yrs 1320 8.7 9.4 10.0 26.6 43.3 1.9 0.1
65-74yrs 1295 15.8 9.6 10.2 29.9 32.8 1.5 0.3
Tamil 12yrs 308 2.6 15.6 19.5 22.7 37.7 1.3 0.6
15yrs 302 2.0 13.6 20.5 24.8 38.4 0.7 0.0
35-44yrs 328 9.1 8.8 18.3 20.7 40.5 1.8 0.6
65-74yrs 329 8.5 9.1 16.1 24.0 39.5 1.8 0.9
Muslim 12yrs 287 3.1 7.7 13.6 31.0 41.5 1.7 1.4
15yrs 300 2.3 8.0 10.0 33.3 46.0 0.3 0.0
35-44yrs 333 8.4 7.8 9.9 25.8 45.0 2.7 0.3
65-74yrs 331 10.6 8.2 10.0 20.2 47.4 3.3 0.3
Urban 12yrs 568 2.6 7.7 13.2 33.3 40.8 2.3 0.0
15yrs 571 3.2 6.8 10.9 27.3 49.7 2.1 0.0
35-44yrs 553 10.5 8.3 11.0 25.5 41.4 3.1 0.2
65-74yrs 554 14.8 9.2 13.5 24.9 34.7 2.3 0.5
Rural 12yrs 1428 2.5 7.2 15.9 34.1 36.9 2.6 0.8
15yrs 1432 2.5 6.1 12.4 33.0 44.0 1.7 0.2
35-44yrs 1429 8.0 9.3 11.5 25.5 43.9 1.6 0.2
65-74yrs 1405 13.2 9.3 10.2 28.3 37.0 1.6 0.4
Among all age groups, a majority consumed the above food items ‘every day’, closely followed up by ‘several times (2-6) a week’ and this pattern was similar among all sub-categories as well.
Res
ult
s
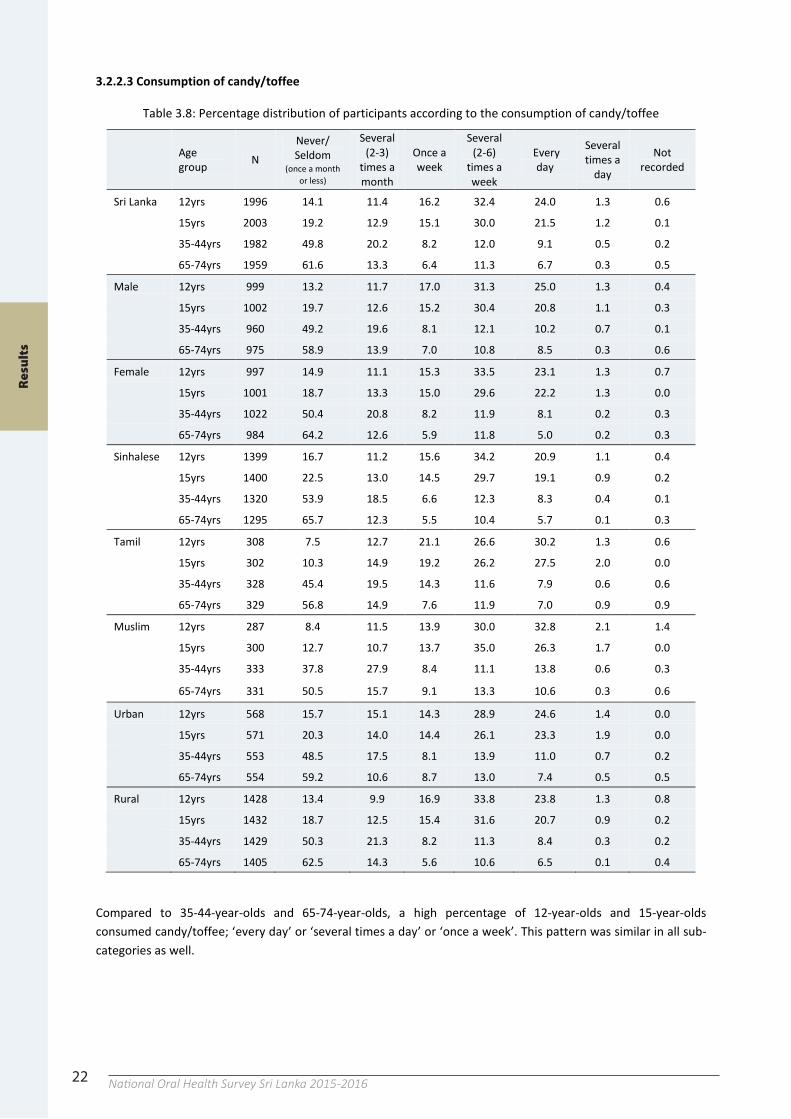
22 National Oral Health Survey Sri Lanka 2015-201622
3.2.2.3 Consumption of candy/toffee
Table 3.8: Percentage distribution of participants according to the consumption of candy/toffee
Age group N
Never/ Seldom
(once a month or less)
Several (2-3)
times a month
Once a week
Several (2-6)
times a week
Every day
Several times a
day
Not recorded
Sri Lanka 12yrs 1996 14.1 11.4 16.2 32.4 24.0 1.3 0.6
15yrs 2003 19.2 12.9 15.1 30.0 21.5 1.2 0.1
35-44yrs 1982 49.8 20.2 8.2 12.0 9.1 0.5 0.2
65-74yrs 1959 61.6 13.3 6.4 11.3 6.7 0.3 0.5
Male 12yrs 999 13.2 11.7 17.0 31.3 25.0 1.3 0.4
15yrs 1002 19.7 12.6 15.2 30.4 20.8 1.1 0.3
35-44yrs 960 49.2 19.6 8.1 12.1 10.2 0.7 0.1
65-74yrs 975 58.9 13.9 7.0 10.8 8.5 0.3 0.6
Female 12yrs 997 14.9 11.1 15.3 33.5 23.1 1.3 0.7
15yrs 1001 18.7 13.3 15.0 29.6 22.2 1.3 0.0
35-44yrs 1022 50.4 20.8 8.2 11.9 8.1 0.2 0.3
65-74yrs 984 64.2 12.6 5.9 11.8 5.0 0.2 0.3
Sinhalese 12yrs 1399 16.7 11.2 15.6 34.2 20.9 1.1 0.4
15yrs 1400 22.5 13.0 14.5 29.7 19.1 0.9 0.2
35-44yrs 1320 53.9 18.5 6.6 12.3 8.3 0.4 0.1
65-74yrs 1295 65.7 12.3 5.5 10.4 5.7 0.1 0.3
Tamil 12yrs 308 7.5 12.7 21.1 26.6 30.2 1.3 0.6
15yrs 302 10.3 14.9 19.2 26.2 27.5 2.0 0.0
35-44yrs 328 45.4 19.5 14.3 11.6 7.9 0.6 0.6
65-74yrs 329 56.8 14.9 7.6 11.9 7.0 0.9 0.9
Muslim 12yrs 287 8.4 11.5 13.9 30.0 32.8 2.1 1.4
15yrs 300 12.7 10.7 13.7 35.0 26.3 1.7 0.0
35-44yrs 333 37.8 27.9 8.4 11.1 13.8 0.6 0.3
65-74yrs 331 50.5 15.7 9.1 13.3 10.6 0.3 0.6
Urban 12yrs 568 15.7 15.1 14.3 28.9 24.6 1.4 0.0
15yrs 571 20.3 14.0 14.4 26.1 23.3 1.9 0.0
35-44yrs 553 48.5 17.5 8.1 13.9 11.0 0.7 0.2
65-74yrs 554 59.2 10.6 8.7 13.0 7.4 0.5 0.5
Rural 12yrs 1428 13.4 9.9 16.9 33.8 23.8 1.3 0.8
15yrs 1432 18.7 12.5 15.4 31.6 20.7 0.9 0.2
35-44yrs 1429 50.3 21.3 8.2 11.3 8.4 0.3 0.2
65-74yrs 1405 62.5 14.3 5.6 10.6 6.5 0.1 0.4
Compared to 35-44-year-olds and 65-74-year-olds, a high percentage of 12-year-olds and 15-year-olds consumed candy/toffee; ‘every day’ or ‘several times a day’ or ‘once a week’. This pattern was similar in all sub-categories as well.
Res
ult
s
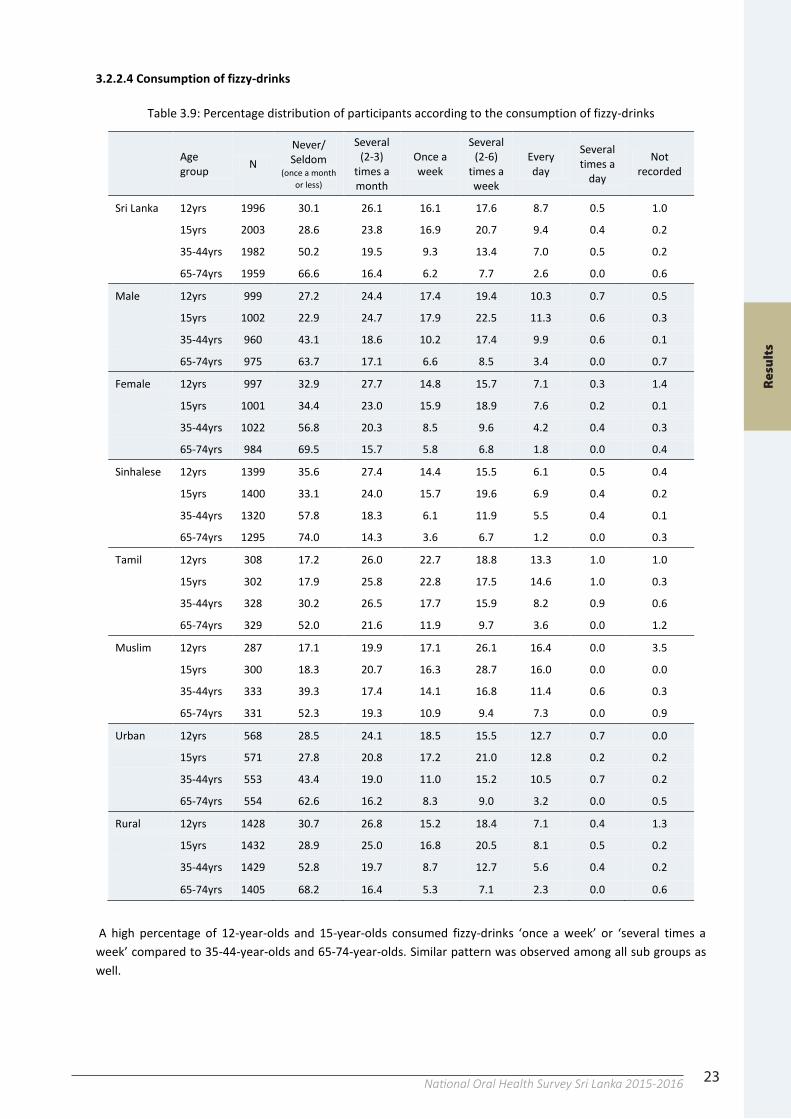
23National Oral Health Survey Sri Lanka 2015-201622
3.2.2.3 Consumption of candy/toffee
Table 3.8: Percentage distribution of participants according to the consumption of candy/toffee
Age group N
Never/ Seldom
(once a month or less)
Several (2-3)
times a month
Once a week
Several (2-6)
times a week
Every day
Several times a
day
Not recorded
Sri Lanka 12yrs 1996 14.1 11.4 16.2 32.4 24.0 1.3 0.6
15yrs 2003 19.2 12.9 15.1 30.0 21.5 1.2 0.1
35-44yrs 1982 49.8 20.2 8.2 12.0 9.1 0.5 0.2
65-74yrs 1959 61.6 13.3 6.4 11.3 6.7 0.3 0.5
Male 12yrs 999 13.2 11.7 17.0 31.3 25.0 1.3 0.4
15yrs 1002 19.7 12.6 15.2 30.4 20.8 1.1 0.3
35-44yrs 960 49.2 19.6 8.1 12.1 10.2 0.7 0.1
65-74yrs 975 58.9 13.9 7.0 10.8 8.5 0.3 0.6
Female 12yrs 997 14.9 11.1 15.3 33.5 23.1 1.3 0.7
15yrs 1001 18.7 13.3 15.0 29.6 22.2 1.3 0.0
35-44yrs 1022 50.4 20.8 8.2 11.9 8.1 0.2 0.3
65-74yrs 984 64.2 12.6 5.9 11.8 5.0 0.2 0.3
Sinhalese 12yrs 1399 16.7 11.2 15.6 34.2 20.9 1.1 0.4
15yrs 1400 22.5 13.0 14.5 29.7 19.1 0.9 0.2
35-44yrs 1320 53.9 18.5 6.6 12.3 8.3 0.4 0.1
65-74yrs 1295 65.7 12.3 5.5 10.4 5.7 0.1 0.3
Tamil 12yrs 308 7.5 12.7 21.1 26.6 30.2 1.3 0.6
15yrs 302 10.3 14.9 19.2 26.2 27.5 2.0 0.0
35-44yrs 328 45.4 19.5 14.3 11.6 7.9 0.6 0.6
65-74yrs 329 56.8 14.9 7.6 11.9 7.0 0.9 0.9
Muslim 12yrs 287 8.4 11.5 13.9 30.0 32.8 2.1 1.4
15yrs 300 12.7 10.7 13.7 35.0 26.3 1.7 0.0
35-44yrs 333 37.8 27.9 8.4 11.1 13.8 0.6 0.3
65-74yrs 331 50.5 15.7 9.1 13.3 10.6 0.3 0.6
Urban 12yrs 568 15.7 15.1 14.3 28.9 24.6 1.4 0.0
15yrs 571 20.3 14.0 14.4 26.1 23.3 1.9 0.0
35-44yrs 553 48.5 17.5 8.1 13.9 11.0 0.7 0.2
65-74yrs 554 59.2 10.6 8.7 13.0 7.4 0.5 0.5
Rural 12yrs 1428 13.4 9.9 16.9 33.8 23.8 1.3 0.8
15yrs 1432 18.7 12.5 15.4 31.6 20.7 0.9 0.2
35-44yrs 1429 50.3 21.3 8.2 11.3 8.4 0.3 0.2
65-74yrs 1405 62.5 14.3 5.6 10.6 6.5 0.1 0.4
Compared to 35-44-year-olds and 65-74-year-olds, a high percentage of 12-year-olds and 15-year-olds consumed candy/toffee; ‘every day’ or ‘several times a day’ or ‘once a week’. This pattern was similar in all sub-categories as well.
23
3.2.2.4 Consumption of fizzy-drinks
Table 3.9: Percentage distribution of participants according to the consumption of fizzy-drinks
Age group N
Never/ Seldom
(once a month or less)
Several (2-3)
times a month
Once a week
Several (2-6)
times a week
Every day
Several times a
day
Not recorded
Sri Lanka 12yrs 1996 30.1 26.1 16.1 17.6 8.7 0.5 1.0
15yrs 2003 28.6 23.8 16.9 20.7 9.4 0.4 0.2
35-44yrs 1982 50.2 19.5 9.3 13.4 7.0 0.5 0.2
65-74yrs 1959 66.6 16.4 6.2 7.7 2.6 0.0 0.6
Male 12yrs 999 27.2 24.4 17.4 19.4 10.3 0.7 0.5
15yrs 1002 22.9 24.7 17.9 22.5 11.3 0.6 0.3
35-44yrs 960 43.1 18.6 10.2 17.4 9.9 0.6 0.1
65-74yrs 975 63.7 17.1 6.6 8.5 3.4 0.0 0.7
Female 12yrs 997 32.9 27.7 14.8 15.7 7.1 0.3 1.4
15yrs 1001 34.4 23.0 15.9 18.9 7.6 0.2 0.1
35-44yrs 1022 56.8 20.3 8.5 9.6 4.2 0.4 0.3
65-74yrs 984 69.5 15.7 5.8 6.8 1.8 0.0 0.4
Sinhalese 12yrs 1399 35.6 27.4 14.4 15.5 6.1 0.5 0.4
15yrs 1400 33.1 24.0 15.7 19.6 6.9 0.4 0.2
35-44yrs 1320 57.8 18.3 6.1 11.9 5.5 0.4 0.1
65-74yrs 1295 74.0 14.3 3.6 6.7 1.2 0.0 0.3
Tamil 12yrs 308 17.2 26.0 22.7 18.8 13.3 1.0 1.0
15yrs 302 17.9 25.8 22.8 17.5 14.6 1.0 0.3
35-44yrs 328 30.2 26.5 17.7 15.9 8.2 0.9 0.6
65-74yrs 329 52.0 21.6 11.9 9.7 3.6 0.0 1.2
Muslim 12yrs 287 17.1 19.9 17.1 26.1 16.4 0.0 3.5
15yrs 300 18.3 20.7 16.3 28.7 16.0 0.0 0.0
35-44yrs 333 39.3 17.4 14.1 16.8 11.4 0.6 0.3
65-74yrs 331 52.3 19.3 10.9 9.4 7.3 0.0 0.9
Urban 12yrs 568 28.5 24.1 18.5 15.5 12.7 0.7 0.0
15yrs 571 27.8 20.8 17.2 21.0 12.8 0.2 0.2
35-44yrs 553 43.4 19.0 11.0 15.2 10.5 0.7 0.2
65-74yrs 554 62.6 16.2 8.3 9.0 3.2 0.0 0.5
Rural 12yrs 1428 30.7 26.8 15.2 18.4 7.1 0.4 1.3
15yrs 1432 28.9 25.0 16.8 20.5 8.1 0.5 0.2
35-44yrs 1429 52.8 19.7 8.7 12.7 5.6 0.4 0.2
65-74yrs 1405 68.2 16.4 5.3 7.1 2.3 0.0 0.6
A high percentage of 12-year-olds and 15-year-olds consumed fizzy-drinks ‘once a week’ or ‘several times a week’ compared to 35-44-year-olds and 65-74-year-olds. Similar pattern was observed among all sub groups as well.
Res
ult
s
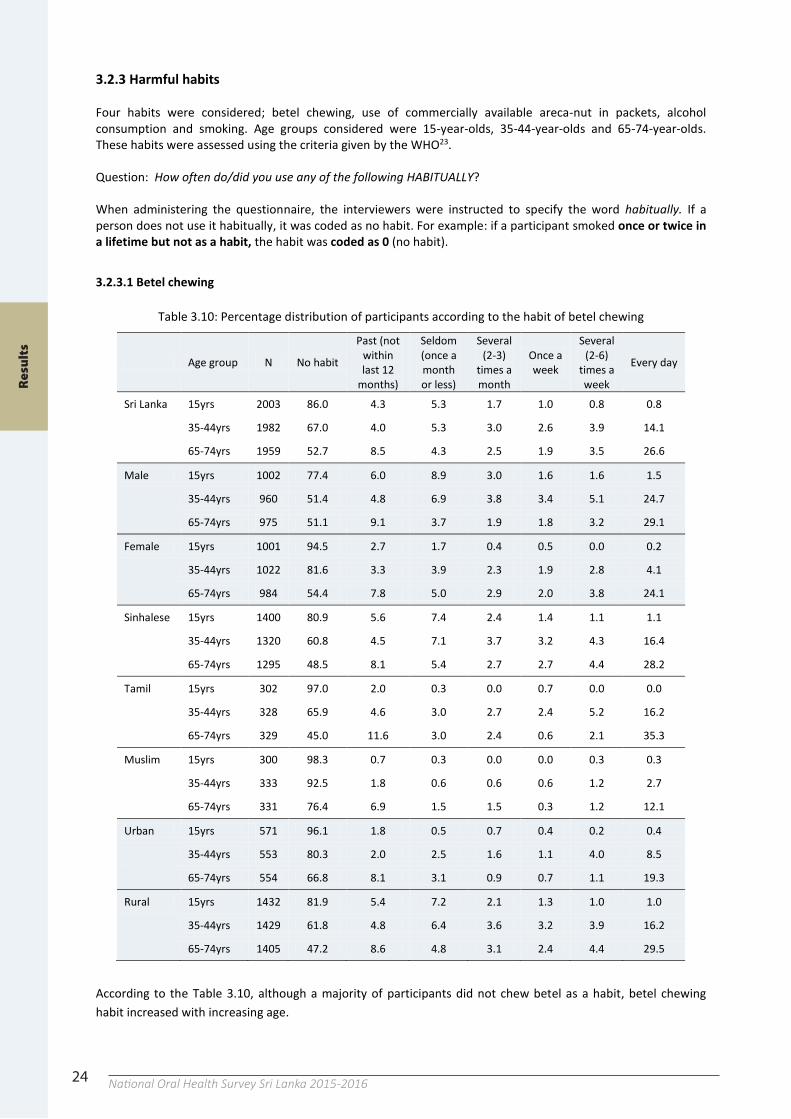
24 National Oral Health Survey Sri Lanka 2015-201624
3.2.3 Harmful habits
Four habits were considered; betel chewing, use of commercially available areca-nut in packets, alcohol consumption and smoking. Age groups considered were 15-year-olds, 35-44-year-olds and 65-74-year-olds. These habits were assessed using the criteria given by the WHO23.
Question: How often do/did you use any of the following HABITUALLY?
When administering the questionnaire, the interviewers were instructed to specify the word habitually. If a person does not use it habitually, it was coded as no habit. For example: if a participant smoked once or twice in a lifetime but not as a habit, the habit was coded as 0 (no habit).
3.2.3.1 Betel chewing
Table 3.10: Percentage distribution of participants according to the habit of betel chewing
Age group N No habit
Past (not within last 12
months)
Seldom (once a month or less)
Several (2-3)
times a month
Once a week
Several (2-6)
times a week
Every day
Sri Lanka 15yrs 2003 86.0 4.3 5.3 1.7 1.0 0.8 0.8
35-44yrs 1982 67.0 4.0 5.3 3.0 2.6 3.9 14.1
65-74yrs 1959 52.7 8.5 4.3 2.5 1.9 3.5 26.6
Male 15yrs 1002 77.4 6.0 8.9 3.0 1.6 1.6 1.5
35-44yrs 960 51.4 4.8 6.9 3.8 3.4 5.1 24.7
65-74yrs 975 51.1 9.1 3.7 1.9 1.8 3.2 29.1
Female 15yrs 1001 94.5 2.7 1.7 0.4 0.5 0.0 0.2
35-44yrs 1022 81.6 3.3 3.9 2.3 1.9 2.8 4.1
65-74yrs 984 54.4 7.8 5.0 2.9 2.0 3.8 24.1
Sinhalese 15yrs 1400 80.9 5.6 7.4 2.4 1.4 1.1 1.1
35-44yrs 1320 60.8 4.5 7.1 3.7 3.2 4.3 16.4
65-74yrs 1295 48.5 8.1 5.4 2.7 2.7 4.4 28.2
Tamil 15yrs 302 97.0 2.0 0.3 0.0 0.7 0.0 0.0
35-44yrs 328 65.9 4.6 3.0 2.7 2.4 5.2 16.2
65-74yrs 329 45.0 11.6 3.0 2.4 0.6 2.1 35.3
Muslim 15yrs 300 98.3 0.7 0.3 0.0 0.0 0.3 0.3
35-44yrs 333 92.5 1.8 0.6 0.6 0.6 1.2 2.7
65-74yrs 331 76.4 6.9 1.5 1.5 0.3 1.2 12.1
Urban 15yrs 571 96.1 1.8 0.5 0.7 0.4 0.2 0.4
35-44yrs 553 80.3 2.0 2.5 1.6 1.1 4.0 8.5
65-74yrs 554 66.8 8.1 3.1 0.9 0.7 1.1 19.3
Rural 15yrs 1432 81.9 5.4 7.2 2.1 1.3 1.0 1.0
35-44yrs 1429 61.8 4.8 6.4 3.6 3.2 3.9 16.2
65-74yrs 1405 47.2 8.6 4.8 3.1 2.4 4.4 29.5
According to the Table 3.10, although a majority of participants did not chew betel as a habit, betel chewing habit increased with increasing age.
Res
ult
s
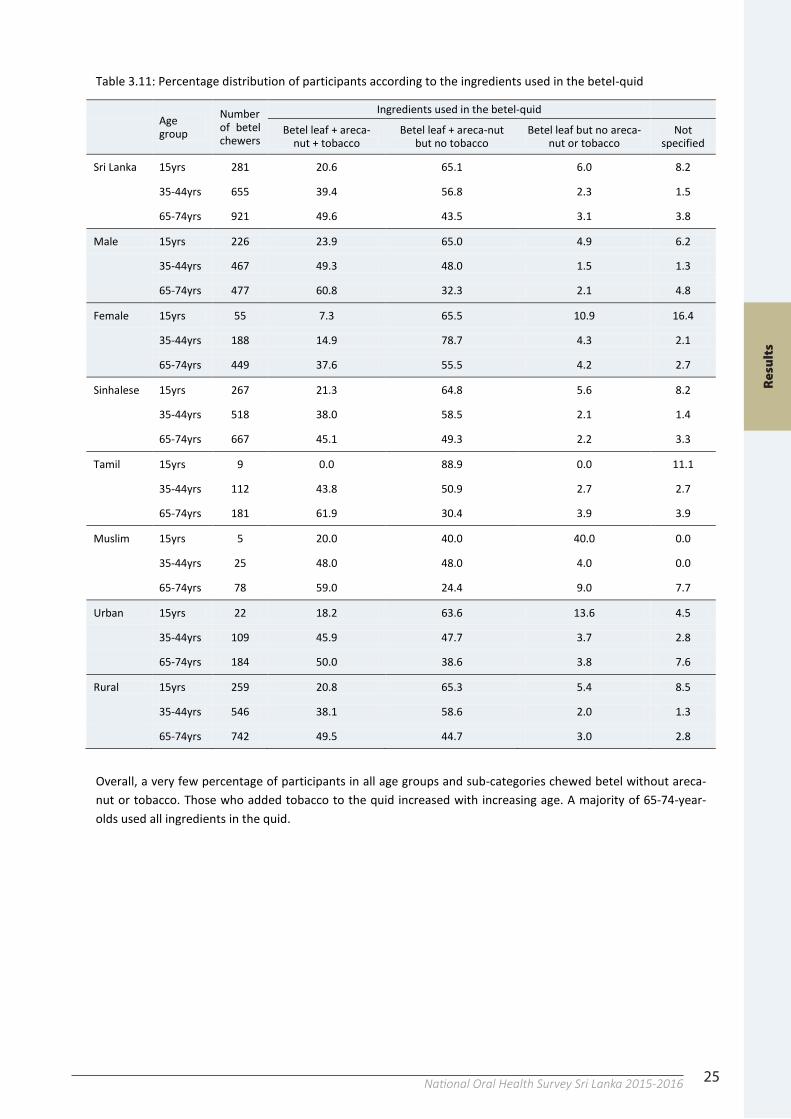
25National Oral Health Survey Sri Lanka 2015-201624
3.2.3 Harmful habits
Four habits were considered; betel chewing, use of commercially available areca-nut in packets, alcohol consumption and smoking. Age groups considered were 15-year-olds, 35-44-year-olds and 65-74-year-olds. These habits were assessed using the criteria given by the WHO23.
Question: How often do/did you use any of the following HABITUALLY?
When administering the questionnaire, the interviewers were instructed to specify the word habitually. If a person does not use it habitually, it was coded as no habit. For example: if a participant smoked once or twice in a lifetime but not as a habit, the habit was coded as 0 (no habit).
3.2.3.1 Betel chewing
Table 3.10: Percentage distribution of participants according to the habit of betel chewing
Age group N No habit
Past (not within last 12
months)
Seldom (once a month or less)
Several (2-3)
times a month
Once a week
Several (2-6)
times a week
Every day
Sri Lanka 15yrs 2003 86.0 4.3 5.3 1.7 1.0 0.8 0.8
35-44yrs 1982 67.0 4.0 5.3 3.0 2.6 3.9 14.1
65-74yrs 1959 52.7 8.5 4.3 2.5 1.9 3.5 26.6
Male 15yrs 1002 77.4 6.0 8.9 3.0 1.6 1.6 1.5
35-44yrs 960 51.4 4.8 6.9 3.8 3.4 5.1 24.7
65-74yrs 975 51.1 9.1 3.7 1.9 1.8 3.2 29.1
Female 15yrs 1001 94.5 2.7 1.7 0.4 0.5 0.0 0.2
35-44yrs 1022 81.6 3.3 3.9 2.3 1.9 2.8 4.1
65-74yrs 984 54.4 7.8 5.0 2.9 2.0 3.8 24.1
Sinhalese 15yrs 1400 80.9 5.6 7.4 2.4 1.4 1.1 1.1
35-44yrs 1320 60.8 4.5 7.1 3.7 3.2 4.3 16.4
65-74yrs 1295 48.5 8.1 5.4 2.7 2.7 4.4 28.2
Tamil 15yrs 302 97.0 2.0 0.3 0.0 0.7 0.0 0.0
35-44yrs 328 65.9 4.6 3.0 2.7 2.4 5.2 16.2
65-74yrs 329 45.0 11.6 3.0 2.4 0.6 2.1 35.3
Muslim 15yrs 300 98.3 0.7 0.3 0.0 0.0 0.3 0.3
35-44yrs 333 92.5 1.8 0.6 0.6 0.6 1.2 2.7
65-74yrs 331 76.4 6.9 1.5 1.5 0.3 1.2 12.1
Urban 15yrs 571 96.1 1.8 0.5 0.7 0.4 0.2 0.4
35-44yrs 553 80.3 2.0 2.5 1.6 1.1 4.0 8.5
65-74yrs 554 66.8 8.1 3.1 0.9 0.7 1.1 19.3
Rural 15yrs 1432 81.9 5.4 7.2 2.1 1.3 1.0 1.0
35-44yrs 1429 61.8 4.8 6.4 3.6 3.2 3.9 16.2
65-74yrs 1405 47.2 8.6 4.8 3.1 2.4 4.4 29.5
According to the Table 3.10, although a majority of participants did not chew betel as a habit, betel chewing habit increased with increasing age.
25
Table 3.11: Percentage distribution of participants according to the ingredients used in the betel-quid
Age group
Number of betel chewers
Ingredients used in the betel-quid
Betel leaf + areca-
nut + tobacco Betel leaf + areca-nut
but no tobacco Betel leaf but no areca-
nut or tobacco Not
specified
Sri Lanka 15yrs 281 20.6 65.1 6.0 8.2
35-44yrs 655 39.4 56.8 2.3 1.5
65-74yrs 921 49.6 43.5 3.1 3.8
Male 15yrs 226 23.9 65.0 4.9 6.2
35-44yrs 467 49.3 48.0 1.5 1.3
65-74yrs 477 60.8 32.3 2.1 4.8
Female 15yrs 55 7.3 65.5 10.9 16.4
35-44yrs 188 14.9 78.7 4.3 2.1
65-74yrs 449 37.6 55.5 4.2 2.7
Sinhalese 15yrs 267 21.3 64.8 5.6 8.2
35-44yrs 518 38.0 58.5 2.1 1.4
65-74yrs 667 45.1 49.3 2.2 3.3
Tamil 15yrs 9 0.0 88.9 0.0 11.1
35-44yrs 112 43.8 50.9 2.7 2.7
65-74yrs 181 61.9 30.4 3.9 3.9
Muslim 15yrs 5 20.0 40.0 40.0 0.0
35-44yrs 25 48.0 48.0 4.0 0.0
65-74yrs 78 59.0 24.4 9.0 7.7
Urban 15yrs 22 18.2 63.6 13.6 4.5
35-44yrs 109 45.9 47.7 3.7 2.8
65-74yrs 184 50.0 38.6 3.8 7.6
Rural 15yrs 259 20.8 65.3 5.4 8.5
35-44yrs 546 38.1 58.6 2.0 1.3
65-74yrs 742 49.5 44.7 3.0 2.8
Overall, a very few percentage of participants in all age groups and sub-categories chewed betel without areca-nut or tobacco. Those who added tobacco to the quid increased with increasing age. A majority of 65-74-year-olds used all ingredients in the quid.
Res
ult
s
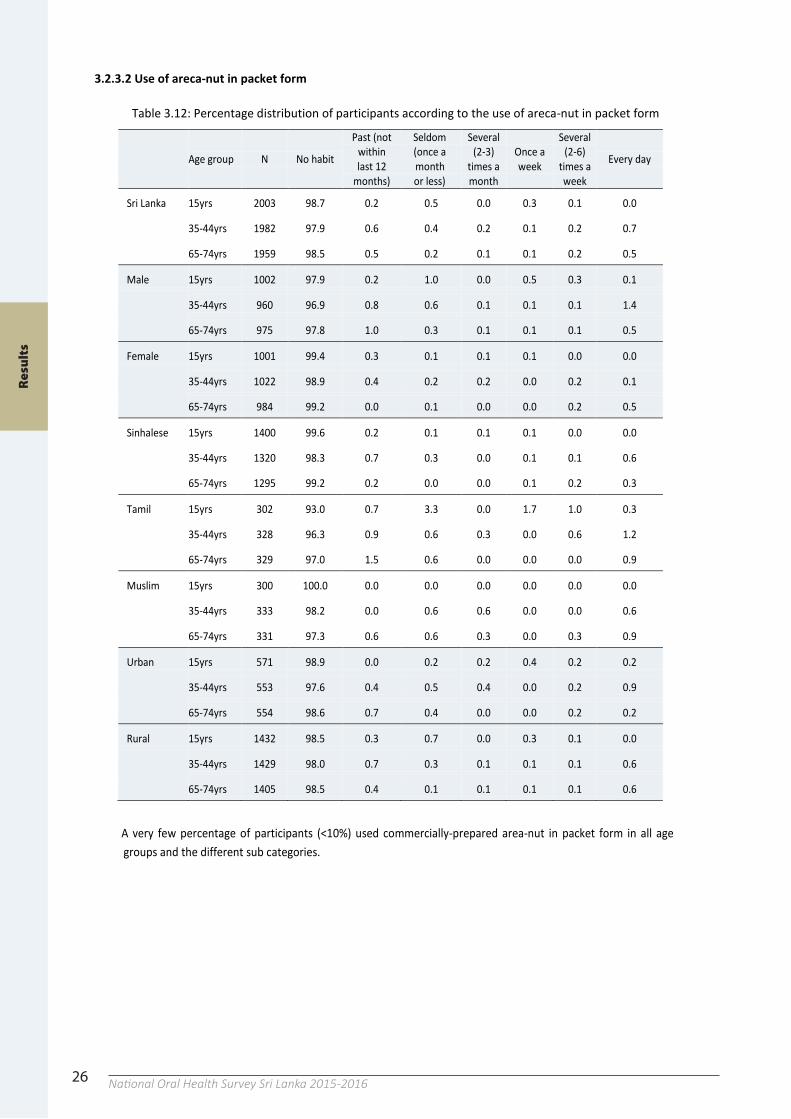
26 National Oral Health Survey Sri Lanka 2015-201626
3.2.3.2 Use of areca-nut in packet form
Table 3.12: Percentage distribution of participants according to the use of areca-nut in packet form
Age group N No habit
Past (not within last 12
months)
Seldom (once a month or less)
Several (2-3)
times a month
Once a week
Several (2-6)
times a week
Every day
Sri Lanka 15yrs 2003 98.7 0.2 0.5 0.0 0.3 0.1 0.0
35-44yrs 1982 97.9 0.6 0.4 0.2 0.1 0.2 0.7
65-74yrs 1959 98.5 0.5 0.2 0.1 0.1 0.2 0.5
Male 15yrs 1002 97.9 0.2 1.0 0.0 0.5 0.3 0.1
35-44yrs 960 96.9 0.8 0.6 0.1 0.1 0.1 1.4
65-74yrs 975 97.8 1.0 0.3 0.1 0.1 0.1 0.5
Female 15yrs 1001 99.4 0.3 0.1 0.1 0.1 0.0 0.0
35-44yrs 1022 98.9 0.4 0.2 0.2 0.0 0.2 0.1
65-74yrs 984 99.2 0.0 0.1 0.0 0.0 0.2 0.5
Sinhalese 15yrs 1400 99.6 0.2 0.1 0.1 0.1 0.0 0.0
35-44yrs 1320 98.3 0.7 0.3 0.0 0.1 0.1 0.6
65-74yrs 1295 99.2 0.2 0.0 0.0 0.1 0.2 0.3
Tamil 15yrs 302 93.0 0.7 3.3 0.0 1.7 1.0 0.3
35-44yrs 328 96.3 0.9 0.6 0.3 0.0 0.6 1.2
65-74yrs 329 97.0 1.5 0.6 0.0 0.0 0.0 0.9
Muslim 15yrs 300 100.0 0.0 0.0 0.0 0.0 0.0 0.0
35-44yrs 333 98.2 0.0 0.6 0.6 0.0 0.0 0.6
65-74yrs 331 97.3 0.6 0.6 0.3 0.0 0.3 0.9
Urban 15yrs 571 98.9 0.0 0.2 0.2 0.4 0.2 0.2
35-44yrs 553 97.6 0.4 0.5 0.4 0.0 0.2 0.9
65-74yrs 554 98.6 0.7 0.4 0.0 0.0 0.2 0.2
Rural 15yrs 1432 98.5 0.3 0.7 0.0 0.3 0.1 0.0
35-44yrs 1429 98.0 0.7 0.3 0.1 0.1 0.1 0.6
65-74yrs 1405 98.5 0.4 0.1 0.1 0.1 0.1 0.6
A very few percentage of participants (<10%) used commercially-prepared area-nut in packet form in all age groups and the different sub categories.
26
3.2.3.2 Use of areca-nut in packet form
Table 3.12: Percentage distribution of participants according to the use of areca-nut in packet form
Age group N No habit
Past (not within last 12
months)
Seldom (once a month or less)
Several (2-3)
times a month
Once a week
Several (2-6)
times a week
Every day
Sri Lanka 15yrs 2003 98.7 0.2 0.5 0.0 0.3 0.1 0.0
35-44yrs 1982 97.9 0.6 0.4 0.2 0.1 0.2 0.7
65-74yrs 1959 98.5 0.5 0.2 0.1 0.1 0.2 0.5
Male 15yrs 1002 97.9 0.2 1.0 0.0 0.5 0.3 0.1
35-44yrs 960 96.9 0.8 0.6 0.1 0.1 0.1 1.4
65-74yrs 975 97.8 1.0 0.3 0.1 0.1 0.1 0.5
Female 15yrs 1001 99.4 0.3 0.1 0.1 0.1 0.0 0.0
35-44yrs 1022 98.9 0.4 0.2 0.2 0.0 0.2 0.1
65-74yrs 984 99.2 0.0 0.1 0.0 0.0 0.2 0.5
Sinhalese 15yrs 1400 99.6 0.2 0.1 0.1 0.1 0.0 0.0
35-44yrs 1320 98.3 0.7 0.3 0.0 0.1 0.1 0.6
65-74yrs 1295 99.2 0.2 0.0 0.0 0.1 0.2 0.3
Tamil 15yrs 302 93.0 0.7 3.3 0.0 1.7 1.0 0.3
35-44yrs 328 96.3 0.9 0.6 0.3 0.0 0.6 1.2
65-74yrs 329 97.0 1.5 0.6 0.0 0.0 0.0 0.9
Muslim 15yrs 300 100.0 0.0 0.0 0.0 0.0 0.0 0.0
35-44yrs 333 98.2 0.0 0.6 0.6 0.0 0.0 0.6
65-74yrs 331 97.3 0.6 0.6 0.3 0.0 0.3 0.9
Urban 15yrs 571 98.9 0.0 0.2 0.2 0.4 0.2 0.2
35-44yrs 553 97.6 0.4 0.5 0.4 0.0 0.2 0.9
65-74yrs 554 98.6 0.7 0.4 0.0 0.0 0.2 0.2
Rural 15yrs 1432 98.5 0.3 0.7 0.0 0.3 0.1 0.0
35-44yrs 1429 98.0 0.7 0.3 0.1 0.1 0.1 0.6
65-74yrs 1405 98.5 0.4 0.1 0.1 0.1 0.1 0.6
A very few percentage of participants (<10%) used commercially-prepared area-nut in packet form in all age groups and the different sub categories.
Res
ult
s
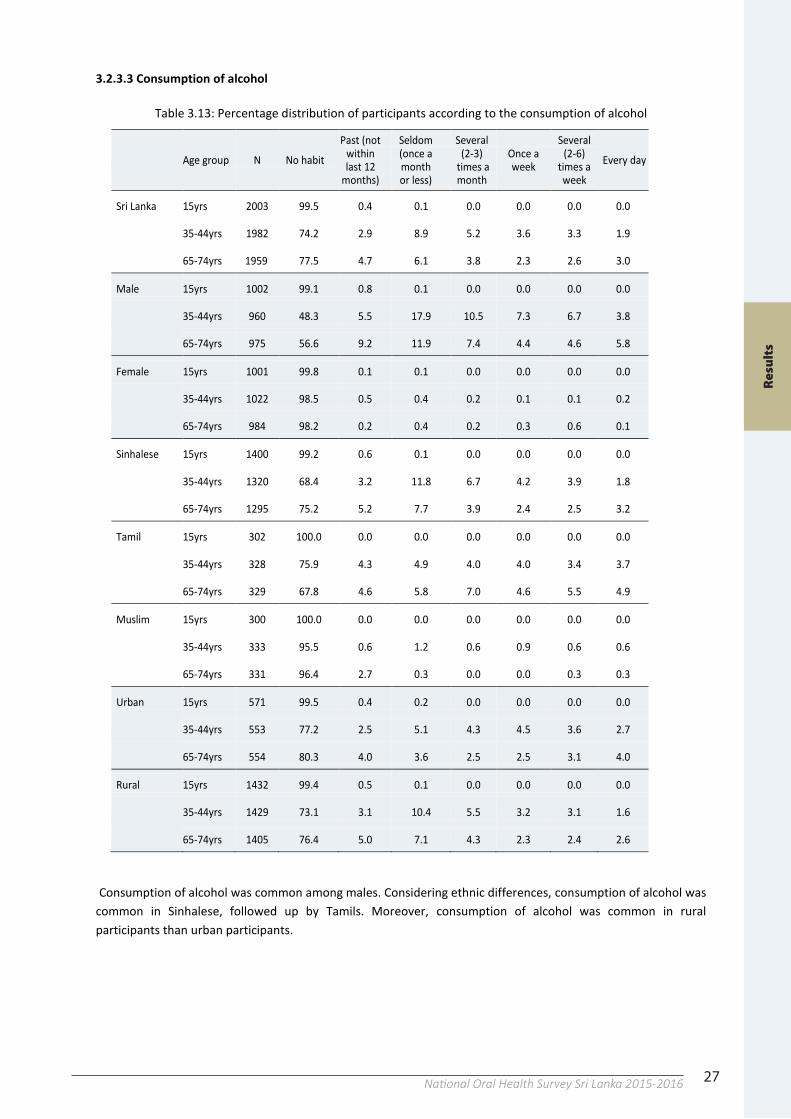
27National Oral Health Survey Sri Lanka 2015-201627
3.2.3.3 Consumption of alcohol
Table 3.13: Percentage distribution of participants according to the consumption of alcohol
Age group N No habit
Past (not within last 12
months)
Seldom (once a month or less)
Several (2-3)
times a month
Once a week
Several (2-6)
times a week
Every day
Sri Lanka 15yrs 2003 99.5 0.4 0.1 0.0 0.0 0.0 0.0
35-44yrs 1982 74.2 2.9 8.9 5.2 3.6 3.3 1.9
65-74yrs 1959 77.5 4.7 6.1 3.8 2.3 2.6 3.0
Male 15yrs 1002 99.1 0.8 0.1 0.0 0.0 0.0 0.0
35-44yrs 960 48.3 5.5 17.9 10.5 7.3 6.7 3.8
65-74yrs 975 56.6 9.2 11.9 7.4 4.4 4.6 5.8
Female 15yrs 1001 99.8 0.1 0.1 0.0 0.0 0.0 0.0
35-44yrs 1022 98.5 0.5 0.4 0.2 0.1 0.1 0.2
65-74yrs 984 98.2 0.2 0.4 0.2 0.3 0.6 0.1
Sinhalese 15yrs 1400 99.2 0.6 0.1 0.0 0.0 0.0 0.0
35-44yrs 1320 68.4 3.2 11.8 6.7 4.2 3.9 1.8
65-74yrs 1295 75.2 5.2 7.7 3.9 2.4 2.5 3.2
Tamil 15yrs 302 100.0 0.0 0.0 0.0 0.0 0.0 0.0
35-44yrs 328 75.9 4.3 4.9 4.0 4.0 3.4 3.7
65-74yrs 329 67.8 4.6 5.8 7.0 4.6 5.5 4.9
Muslim 15yrs 300 100.0 0.0 0.0 0.0 0.0 0.0 0.0
35-44yrs 333 95.5 0.6 1.2 0.6 0.9 0.6 0.6
65-74yrs 331 96.4 2.7 0.3 0.0 0.0 0.3 0.3
Urban 15yrs 571 99.5 0.4 0.2 0.0 0.0 0.0 0.0
35-44yrs 553 77.2 2.5 5.1 4.3 4.5 3.6 2.7
65-74yrs 554 80.3 4.0 3.6 2.5 2.5 3.1 4.0
Rural 15yrs 1432 99.4 0.5 0.1 0.0 0.0 0.0 0.0
35-44yrs 1429 73.1 3.1 10.4 5.5 3.2 3.1 1.6
65-74yrs 1405 76.4 5.0 7.1 4.3 2.3 2.4 2.6
Consumption of alcohol was common among males. Considering ethnic differences, consumption of alcohol was common in Sinhalese, followed up by Tamils. Moreover, consumption of alcohol was common in rural participants than urban participants.
27
3.2.3.3 Consumption of alcohol
Table 3.13: Percentage distribution of participants according to the consumption of alcohol
Age group N No habit
Past (not within last 12
months)
Seldom (once a month or less)
Several (2-3)
times a month
Once a week
Several (2-6)
times a week
Every day
Sri Lanka 15yrs 2003 99.5 0.4 0.1 0.0 0.0 0.0 0.0
35-44yrs 1982 74.2 2.9 8.9 5.2 3.6 3.3 1.9
65-74yrs 1959 77.5 4.7 6.1 3.8 2.3 2.6 3.0
Male 15yrs 1002 99.1 0.8 0.1 0.0 0.0 0.0 0.0
35-44yrs 960 48.3 5.5 17.9 10.5 7.3 6.7 3.8
65-74yrs 975 56.6 9.2 11.9 7.4 4.4 4.6 5.8
Female 15yrs 1001 99.8 0.1 0.1 0.0 0.0 0.0 0.0
35-44yrs 1022 98.5 0.5 0.4 0.2 0.1 0.1 0.2
65-74yrs 984 98.2 0.2 0.4 0.2 0.3 0.6 0.1
Sinhalese 15yrs 1400 99.2 0.6 0.1 0.0 0.0 0.0 0.0
35-44yrs 1320 68.4 3.2 11.8 6.7 4.2 3.9 1.8
65-74yrs 1295 75.2 5.2 7.7 3.9 2.4 2.5 3.2
Tamil 15yrs 302 100.0 0.0 0.0 0.0 0.0 0.0 0.0
35-44yrs 328 75.9 4.3 4.9 4.0 4.0 3.4 3.7
65-74yrs 329 67.8 4.6 5.8 7.0 4.6 5.5 4.9
Muslim 15yrs 300 100.0 0.0 0.0 0.0 0.0 0.0 0.0
35-44yrs 333 95.5 0.6 1.2 0.6 0.9 0.6 0.6
65-74yrs 331 96.4 2.7 0.3 0.0 0.0 0.3 0.3
Urban 15yrs 571 99.5 0.4 0.2 0.0 0.0 0.0 0.0
35-44yrs 553 77.2 2.5 5.1 4.3 4.5 3.6 2.7
65-74yrs 554 80.3 4.0 3.6 2.5 2.5 3.1 4.0
Rural 15yrs 1432 99.4 0.5 0.1 0.0 0.0 0.0 0.0
35-44yrs 1429 73.1 3.1 10.4 5.5 3.2 3.1 1.6
65-74yrs 1405 76.4 5.0 7.1 4.3 2.3 2.4 2.6
Consumption of alcohol was common among males. Considering ethnic differences, consumption of alcohol was common in Sinhalese, followed up by Tamils. Moreover, consumption of alcohol was common in rural participants than urban participants.
Res
ult
s
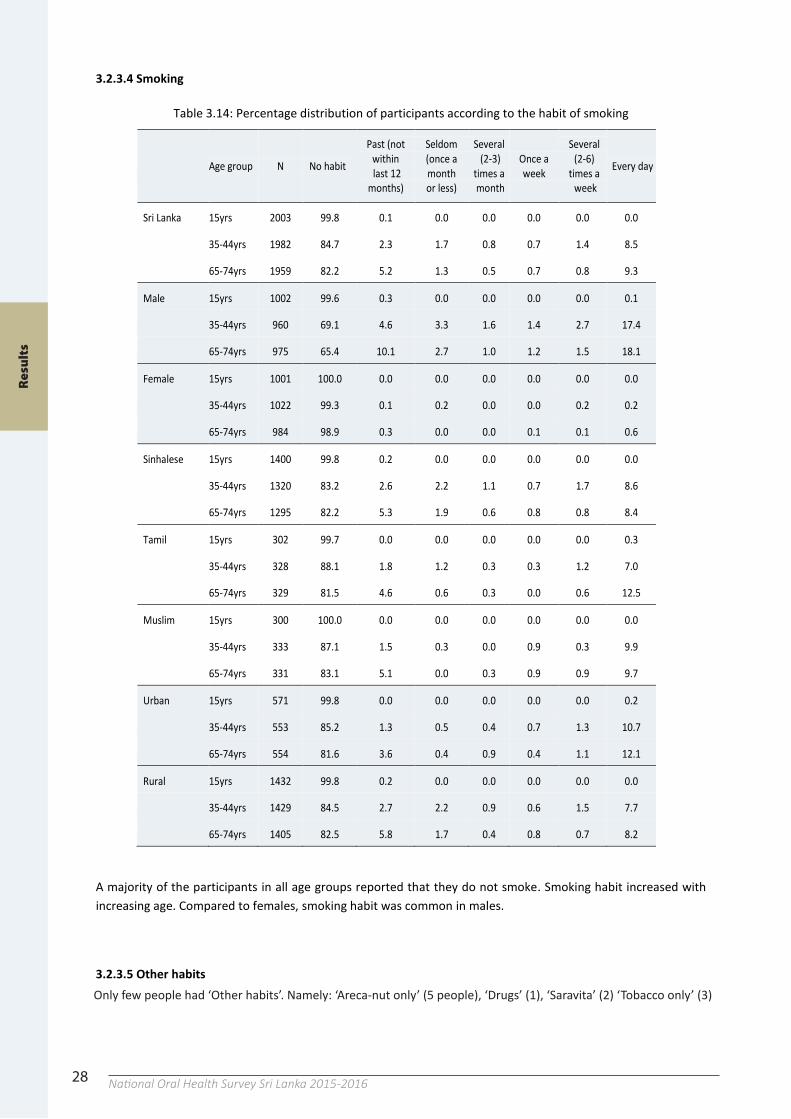
28 National Oral Health Survey Sri Lanka 2015-201628
3.2.3.4 Smoking
Table 3.14: Percentage distribution of participants according to the habit of smoking
Age group N No habit
Past (not within last 12
months)
Seldom (once a month or less)
Several (2-3)
times a month
Once a week
Several (2-6)
times a week
Every day
Sri Lanka 15yrs 2003 99.8 0.1 0.0 0.0 0.0 0.0 0.0
35-44yrs 1982 84.7 2.3 1.7 0.8 0.7 1.4 8.5
65-74yrs 1959 82.2 5.2 1.3 0.5 0.7 0.8 9.3
Male 15yrs 1002 99.6 0.3 0.0 0.0 0.0 0.0 0.1
35-44yrs 960 69.1 4.6 3.3 1.6 1.4 2.7 17.4
65-74yrs 975 65.4 10.1 2.7 1.0 1.2 1.5 18.1
Female 15yrs 1001 100.0 0.0 0.0 0.0 0.0 0.0 0.0
35-44yrs 1022 99.3 0.1 0.2 0.0 0.0 0.2 0.2
65-74yrs 984 98.9 0.3 0.0 0.0 0.1 0.1 0.6
Sinhalese 15yrs 1400 99.8 0.2 0.0 0.0 0.0 0.0 0.0
35-44yrs 1320 83.2 2.6 2.2 1.1 0.7 1.7 8.6
65-74yrs 1295 82.2 5.3 1.9 0.6 0.8 0.8 8.4
Tamil 15yrs 302 99.7 0.0 0.0 0.0 0.0 0.0 0.3
35-44yrs 328 88.1 1.8 1.2 0.3 0.3 1.2 7.0
65-74yrs 329 81.5 4.6 0.6 0.3 0.0 0.6 12.5
Muslim 15yrs 300 100.0 0.0 0.0 0.0 0.0 0.0 0.0
35-44yrs 333 87.1 1.5 0.3 0.0 0.9 0.3 9.9
65-74yrs 331 83.1 5.1 0.0 0.3 0.9 0.9 9.7
Urban 15yrs 571 99.8 0.0 0.0 0.0 0.0 0.0 0.2
35-44yrs 553 85.2 1.3 0.5 0.4 0.7 1.3 10.7
65-74yrs 554 81.6 3.6 0.4 0.9 0.4 1.1 12.1
Rural 15yrs 1432 99.8 0.2 0.0 0.0 0.0 0.0 0.0
35-44yrs 1429 84.5 2.7 2.2 0.9 0.6 1.5 7.7
65-74yrs 1405 82.5 5.8 1.7 0.4 0.8 0.7 8.2
A majority of the participants in all age groups reported that they do not smoke. Smoking habit increased with increasing age. Compared to females, smoking habit was common in males.
3.2.3.5 Other habits
Only few people had ‘Other habits’. Namely: ‘Areca-nut only’ (5 people), ‘Drugs’ (1), ‘Saravita’ (2) ‘Tobacco only’ (3)
28
3.2.3.4 Smoking
Table 3.14: Percentage distribution of participants according to the habit of smoking
Age group N No habit
Past (not within last 12
months)
Seldom (once a month or less)
Several (2-3)
times a month
Once a week
Several (2-6)
times a week
Every day
Sri Lanka 15yrs 2003 99.8 0.1 0.0 0.0 0.0 0.0 0.0
35-44yrs 1982 84.7 2.3 1.7 0.8 0.7 1.4 8.5
65-74yrs 1959 82.2 5.2 1.3 0.5 0.7 0.8 9.3
Male 15yrs 1002 99.6 0.3 0.0 0.0 0.0 0.0 0.1
35-44yrs 960 69.1 4.6 3.3 1.6 1.4 2.7 17.4
65-74yrs 975 65.4 10.1 2.7 1.0 1.2 1.5 18.1
Female 15yrs 1001 100.0 0.0 0.0 0.0 0.0 0.0 0.0
35-44yrs 1022 99.3 0.1 0.2 0.0 0.0 0.2 0.2
65-74yrs 984 98.9 0.3 0.0 0.0 0.1 0.1 0.6
Sinhalese 15yrs 1400 99.8 0.2 0.0 0.0 0.0 0.0 0.0
35-44yrs 1320 83.2 2.6 2.2 1.1 0.7 1.7 8.6
65-74yrs 1295 82.2 5.3 1.9 0.6 0.8 0.8 8.4
Tamil 15yrs 302 99.7 0.0 0.0 0.0 0.0 0.0 0.3
35-44yrs 328 88.1 1.8 1.2 0.3 0.3 1.2 7.0
65-74yrs 329 81.5 4.6 0.6 0.3 0.0 0.6 12.5
Muslim 15yrs 300 100.0 0.0 0.0 0.0 0.0 0.0 0.0
35-44yrs 333 87.1 1.5 0.3 0.0 0.9 0.3 9.9
65-74yrs 331 83.1 5.1 0.0 0.3 0.9 0.9 9.7
Urban 15yrs 571 99.8 0.0 0.0 0.0 0.0 0.0 0.2
35-44yrs 553 85.2 1.3 0.5 0.4 0.7 1.3 10.7
65-74yrs 554 81.6 3.6 0.4 0.9 0.4 1.1 12.1
Rural 15yrs 1432 99.8 0.2 0.0 0.0 0.0 0.0 0.0
35-44yrs 1429 84.5 2.7 2.2 0.9 0.6 1.5 7.7
65-74yrs 1405 82.5 5.8 1.7 0.4 0.8 0.7 8.2
A majority of the participants in all age groups reported that they do not smoke. Smoking habit increased with increasing age. Compared to females, smoking habit was common in males.
3.2.3.5 Other habits
Only few people had ‘Other habits’. Namely: ‘Areca-nut only’ (5 people), ‘Drugs’ (1), ‘Saravita’ (2) ‘Tobacco only’ (3)
Only few people had ‘Other habits’. Namely: ‘Areca-nut only’ (5 people), ‘Drugs’ (1), ‘Saravita’ (2) ‘Tobacco only’ (3)
Res
ult
s
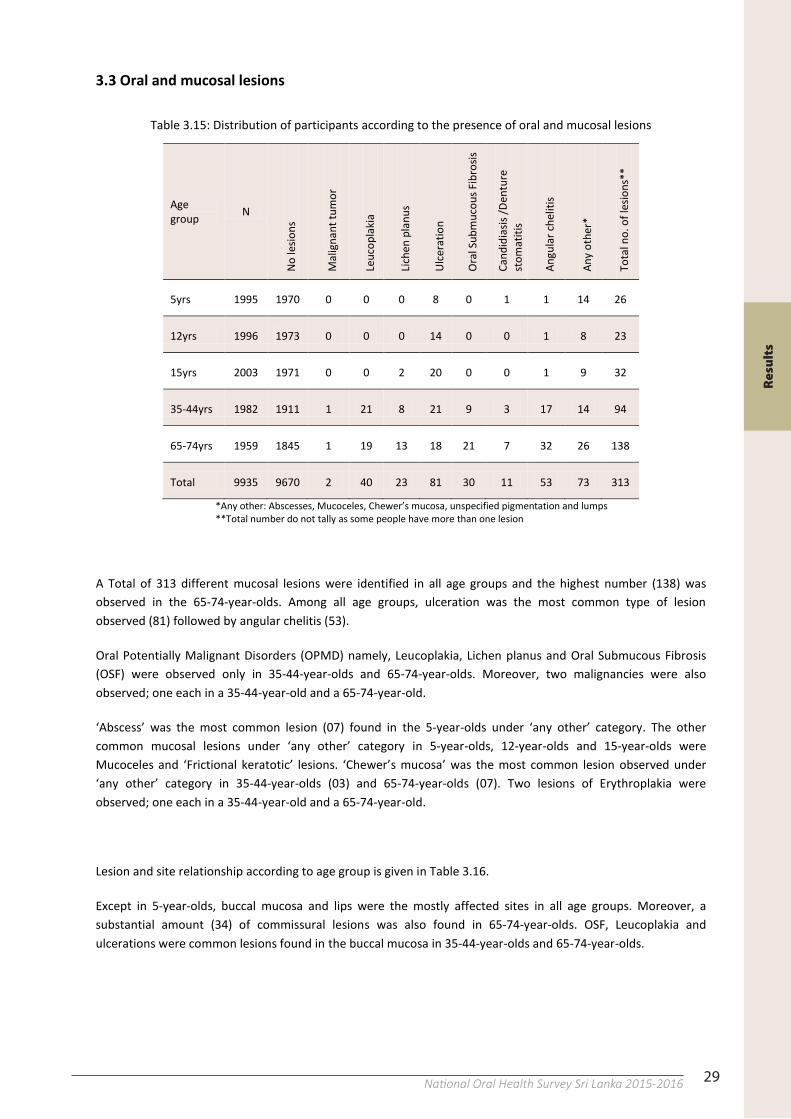
29National Oral Health Survey Sri Lanka 2015-201628
3.2.3.4 Smoking
Table 3.14: Percentage distribution of participants according to the habit of smoking
Age group N No habit
Past (not within last 12
months)
Seldom (once a month or less)
Several (2-3)
times a month
Once a week
Several (2-6)
times a week
Every day
Sri Lanka 15yrs 2003 99.8 0.1 0.0 0.0 0.0 0.0 0.0
35-44yrs 1982 84.7 2.3 1.7 0.8 0.7 1.4 8.5
65-74yrs 1959 82.2 5.2 1.3 0.5 0.7 0.8 9.3
Male 15yrs 1002 99.6 0.3 0.0 0.0 0.0 0.0 0.1
35-44yrs 960 69.1 4.6 3.3 1.6 1.4 2.7 17.4
65-74yrs 975 65.4 10.1 2.7 1.0 1.2 1.5 18.1
Female 15yrs 1001 100.0 0.0 0.0 0.0 0.0 0.0 0.0
35-44yrs 1022 99.3 0.1 0.2 0.0 0.0 0.2 0.2
65-74yrs 984 98.9 0.3 0.0 0.0 0.1 0.1 0.6
Sinhalese 15yrs 1400 99.8 0.2 0.0 0.0 0.0 0.0 0.0
35-44yrs 1320 83.2 2.6 2.2 1.1 0.7 1.7 8.6
65-74yrs 1295 82.2 5.3 1.9 0.6 0.8 0.8 8.4
Tamil 15yrs 302 99.7 0.0 0.0 0.0 0.0 0.0 0.3
35-44yrs 328 88.1 1.8 1.2 0.3 0.3 1.2 7.0
65-74yrs 329 81.5 4.6 0.6 0.3 0.0 0.6 12.5
Muslim 15yrs 300 100.0 0.0 0.0 0.0 0.0 0.0 0.0
35-44yrs 333 87.1 1.5 0.3 0.0 0.9 0.3 9.9
65-74yrs 331 83.1 5.1 0.0 0.3 0.9 0.9 9.7
Urban 15yrs 571 99.8 0.0 0.0 0.0 0.0 0.0 0.2
35-44yrs 553 85.2 1.3 0.5 0.4 0.7 1.3 10.7
65-74yrs 554 81.6 3.6 0.4 0.9 0.4 1.1 12.1
Rural 15yrs 1432 99.8 0.2 0.0 0.0 0.0 0.0 0.0
35-44yrs 1429 84.5 2.7 2.2 0.9 0.6 1.5 7.7
65-74yrs 1405 82.5 5.8 1.7 0.4 0.8 0.7 8.2
A majority of the participants in all age groups reported that they do not smoke. Smoking habit increased with increasing age. Compared to females, smoking habit was common in males.
3.2.3.5 Other habits
Only few people had ‘Other habits’. Namely: ‘Areca-nut only’ (5 people), ‘Drugs’ (1), ‘Saravita’ (2) ‘Tobacco only’ (3)
29
3.3 Oral and mucosal lesions
Table 3.15: Distribution of participants according to the presence of oral and mucosal lesions
Age group N
No le
sions
Mal
igna
nt tu
mor
Leuc
opla
kia
Liche
n pl
anus
Ulce
ratio
n
Ora
l Sub
muc
ous F
ibro
sis
Cand
idia
sis /D
entu
re
stom
atiti
s
Angu
lar c
helit
is
Any
othe
r*
Tota
l no.
of l
esio
ns**
5yrs 1995 1970 0 0 0 8 0 1 1 14 26
12yrs 1996 1973 0 0 0 14 0 0 1 8 23
15yrs 2003 1971 0 0 2 20 0 0 1 9 32
35-44yrs 1982 1911 1 21 8 21 9 3 17 14 94
65-74yrs 1959 1845 1 19 13 18 21 7 32 26 138
Total 9935 9670 2 40 23 81 30 11 53 73 313
*Any other: Abscesses, Mucoceles, Chewer’s mucosa, unspecified pigmentation and lumps **Total number do not tally as some people have more than one lesion
A Total of 313 different mucosal lesions were identified in all age groups and the highest number (138) was observed in the 65-74-year-olds. Among all age groups, ulceration was the most common type of lesion observed (81) followed by angular chelitis (53).
Oral Potentially Malignant Disorders (OPMD) namely, Leucoplakia, Lichen planus and Oral Submucous Fibrosis (OSF) were observed only in 35-44-year-olds and 65-74-year-olds. Moreover, two malignancies were also observed; one each in a 35-44-year-old and a 65-74-year-old.
‘Abscess’ was the most common lesion (07) found in the 5-year-olds under ‘any other’ category. The other common mucosal lesions under ‘any other’ category in 5-year-olds, 12-year-olds and 15-year-olds were Mucoceles and ‘Frictional keratotic’ lesions. ‘Chewer’s mucosa’ was the most common lesion observed under ‘any other’ category in 35-44-year-olds (03) and 65-74-year-olds (07). Two lesions of Erythroplakia were observed; one each in a 35-44-year-old and a 65-74-year-old.
Lesion and site relationship according to age group is given in Table 3.16.
Except in 5-year-olds, buccal mucosa and lips were the mostly affected sites in all age groups. Moreover, a substantial amount (34) of commissural lesions was also found in 65-74-year-olds. OSF, Leucoplakia and ulcerations were common lesions found in the buccal mucosa in 35-44-year-olds and 65-74-year-olds.
28
3.2.3.4 Smoking
Table 3.14: Percentage distribution of participants according to the habit of smoking
Age group N No habit
Past (not within last 12
months)
Seldom (once a month or less)
Several (2-3)
times a month
Once a week
Several (2-6)
times a week
Every day
Sri Lanka 15yrs 2003 99.8 0.1 0.0 0.0 0.0 0.0 0.0
35-44yrs 1982 84.7 2.3 1.7 0.8 0.7 1.4 8.5
65-74yrs 1959 82.2 5.2 1.3 0.5 0.7 0.8 9.3
Male 15yrs 1002 99.6 0.3 0.0 0.0 0.0 0.0 0.1
35-44yrs 960 69.1 4.6 3.3 1.6 1.4 2.7 17.4
65-74yrs 975 65.4 10.1 2.7 1.0 1.2 1.5 18.1
Female 15yrs 1001 100.0 0.0 0.0 0.0 0.0 0.0 0.0
35-44yrs 1022 99.3 0.1 0.2 0.0 0.0 0.2 0.2
65-74yrs 984 98.9 0.3 0.0 0.0 0.1 0.1 0.6
Sinhalese 15yrs 1400 99.8 0.2 0.0 0.0 0.0 0.0 0.0
35-44yrs 1320 83.2 2.6 2.2 1.1 0.7 1.7 8.6
65-74yrs 1295 82.2 5.3 1.9 0.6 0.8 0.8 8.4
Tamil 15yrs 302 99.7 0.0 0.0 0.0 0.0 0.0 0.3
35-44yrs 328 88.1 1.8 1.2 0.3 0.3 1.2 7.0
65-74yrs 329 81.5 4.6 0.6 0.3 0.0 0.6 12.5
Muslim 15yrs 300 100.0 0.0 0.0 0.0 0.0 0.0 0.0
35-44yrs 333 87.1 1.5 0.3 0.0 0.9 0.3 9.9
65-74yrs 331 83.1 5.1 0.0 0.3 0.9 0.9 9.7
Urban 15yrs 571 99.8 0.0 0.0 0.0 0.0 0.0 0.2
35-44yrs 553 85.2 1.3 0.5 0.4 0.7 1.3 10.7
65-74yrs 554 81.6 3.6 0.4 0.9 0.4 1.1 12.1
Rural 15yrs 1432 99.8 0.2 0.0 0.0 0.0 0.0 0.0
35-44yrs 1429 84.5 2.7 2.2 0.9 0.6 1.5 7.7
65-74yrs 1405 82.5 5.8 1.7 0.4 0.8 0.7 8.2
A majority of the participants in all age groups reported that they do not smoke. Smoking habit increased with increasing age. Compared to females, smoking habit was common in males.
3.2.3.5 Other habits
Only few people had ‘Other habits’. Namely: ‘Areca-nut only’ (5 people), ‘Drugs’ (1), ‘Saravita’ (2) ‘Tobacco only’ (3)
Res
ult
s
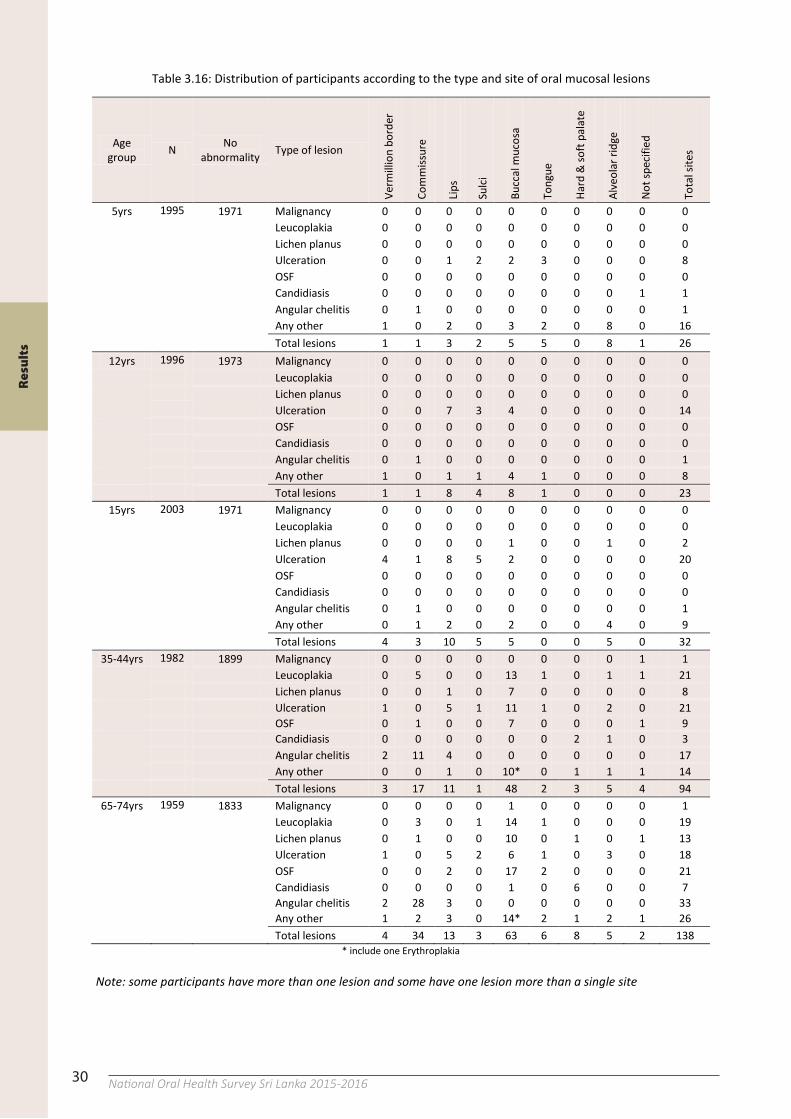
30 National Oral Health Survey Sri Lanka 2015-201630
Table 3.16: Distribution of participants according to the type and site of oral mucosal lesions
Age group N No
abnormality Type of lesion
Ver
mill
ion
bord
er
Com
miss
ure
Lips
Sul
ci
Buc
cal m
ucos
a
Ton
gue
Har
d &
soft
pala
te
Alv
eola
r rid
ge
Not
spec
ified
Tot
al si
tes
5yrs 1995 1971 Malignancy 0 0 0 0 0 0 0 0 0 0
Leucoplakia 0 0 0 0 0 0 0 0 0 0
Lichen planus 0 0 0 0 0 0 0 0 0 0
Ulceration 0 0 1 2 2 3 0 0 0 8
OSF 0 0 0 0 0 0 0 0 0 0
Candidiasis 0 0 0 0 0 0 0 0 1 1
Angular chelitis 0 1 0 0 0 0 0 0 0 1
Any other 1 0 2 0 3 2 0 8 0 16
Total lesions 1 1 3 2 5 5 0 8 1 26
12yrs 1996 1973 Malignancy 0 0 0 0 0 0 0 0 0 0
Leucoplakia 0 0 0 0 0 0 0 0 0 0
Lichen planus 0 0 0 0 0 0 0 0 0 0
Ulceration 0 0 7 3 4 0 0 0 0 14
OSF 0 0 0 0 0 0 0 0 0 0
Candidiasis 0 0 0 0 0 0 0 0 0 0
Angular chelitis 0 1 0 0 0 0 0 0 0 1
Any other 1 0 1 1 4 1 0 0 0 8
Total lesions 1 1 8 4 8 1 0 0 0 23
15yrs 2003 1971 Malignancy 0 0 0 0 0 0 0 0 0 0
Leucoplakia 0 0 0 0 0 0 0 0 0 0
Lichen planus 0 0 0 0 1 0 0 1 0 2
Ulceration 4 1 8 5 2 0 0 0 0 20
OSF 0 0 0 0 0 0 0 0 0 0
Candidiasis 0 0 0 0 0 0 0 0 0 0
Angular chelitis 0 1 0 0 0 0 0 0 0 1
Any other 0 1 2 0 2 0 0 4 0 9
Total lesions 4 3 10 5 5 0 0 5 0 32
35-44yrs 1982 1899 Malignancy 0 0 0 0 0 0 0 0 1 1
Leucoplakia 0 5 0 0 13 1 0 1 1 21
Lichen planus 0 0 1 0 7 0 0 0 0 8
Ulceration 1 0 5 1 11 1 0 2 0 21
OSF 0 1 0 0 7 0 0 0 1 9
Candidiasis 0 0 0 0 0 0 2 1 0 3
Angular chelitis 2 11 4 0 0 0 0 0 0 17
Any other 0 0 1 0 10* 0 1 1 1 14
Total lesions 3 17 11 1 48 2 3 5 4 94
65-74yrs 1959 1833 Malignancy 0 0 0 0 1 0 0 0 0 1
Leucoplakia 0 3 0 1 14 1 0 0 0 19
Lichen planus 0 1 0 0 10 0 1 0 1 13
Ulceration 1 0 5 2 6 1 0 3 0 18
OSF 0 0 2 0 17 2 0 0 0 21
Candidiasis 0 0 0 0 1 0 6 0 0 7
Angular chelitis 2 28 3 0 0 0 0 0 0 33
Any other 1 2 3 0 14* 2 1 2 1 26
Total lesions 4 34 13 3 63 6 8 5 2 138
* include one Erythroplakia
Note: some participants have more than one lesion and some have one lesion more than a single site
Res
ult
s
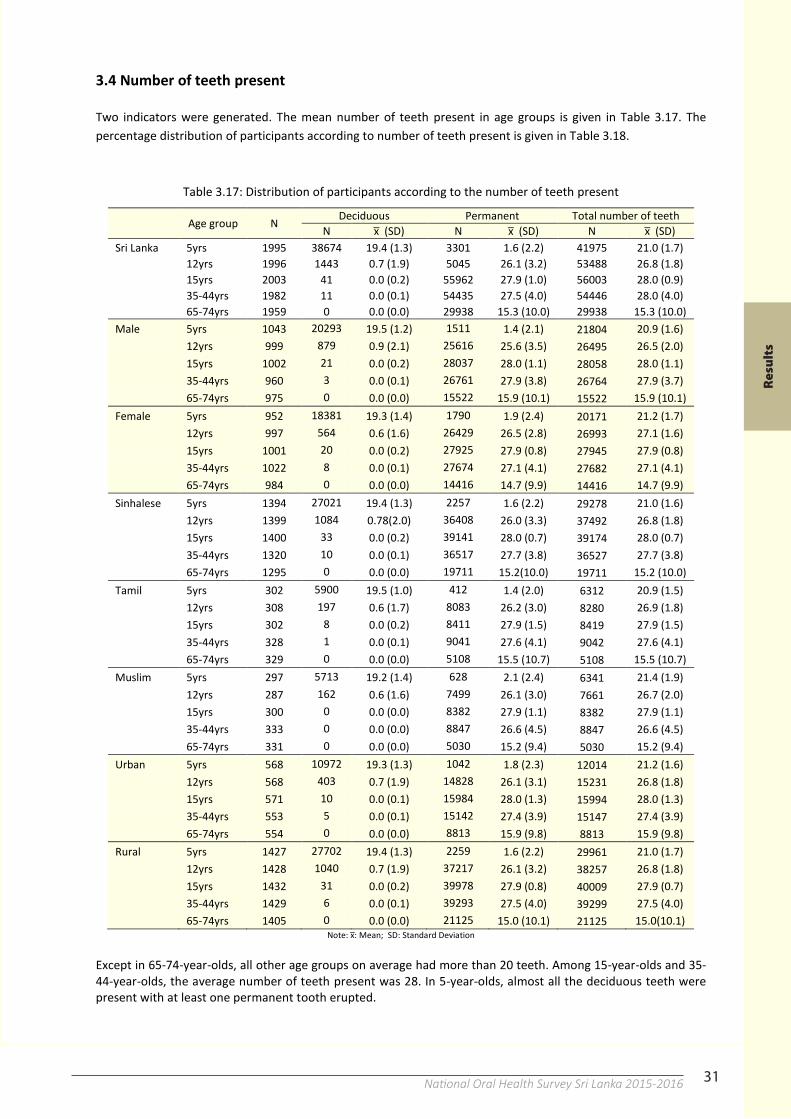
31National Oral Health Survey Sri Lanka 2015-201630
Table 3.16: Distribution of participants according to the type and site of oral mucosal lesions
Age group N No
abnormality Type of lesion
Ver
mill
ion
bord
er
Com
miss
ure
Lips
Sul
ci
Buc
cal m
ucos
a
Ton
gue
Har
d &
soft
pala
te
Alv
eola
r rid
ge
Not
spec
ified
Tot
al si
tes
5yrs 1995 1971 Malignancy 0 0 0 0 0 0 0 0 0 0
Leucoplakia 0 0 0 0 0 0 0 0 0 0
Lichen planus 0 0 0 0 0 0 0 0 0 0
Ulceration 0 0 1 2 2 3 0 0 0 8
OSF 0 0 0 0 0 0 0 0 0 0
Candidiasis 0 0 0 0 0 0 0 0 1 1
Angular chelitis 0 1 0 0 0 0 0 0 0 1
Any other 1 0 2 0 3 2 0 8 0 16
Total lesions 1 1 3 2 5 5 0 8 1 26
12yrs 1996 1973 Malignancy 0 0 0 0 0 0 0 0 0 0
Leucoplakia 0 0 0 0 0 0 0 0 0 0
Lichen planus 0 0 0 0 0 0 0 0 0 0
Ulceration 0 0 7 3 4 0 0 0 0 14
OSF 0 0 0 0 0 0 0 0 0 0
Candidiasis 0 0 0 0 0 0 0 0 0 0
Angular chelitis 0 1 0 0 0 0 0 0 0 1
Any other 1 0 1 1 4 1 0 0 0 8
Total lesions 1 1 8 4 8 1 0 0 0 23
15yrs 2003 1971 Malignancy 0 0 0 0 0 0 0 0 0 0
Leucoplakia 0 0 0 0 0 0 0 0 0 0
Lichen planus 0 0 0 0 1 0 0 1 0 2
Ulceration 4 1 8 5 2 0 0 0 0 20
OSF 0 0 0 0 0 0 0 0 0 0
Candidiasis 0 0 0 0 0 0 0 0 0 0
Angular chelitis 0 1 0 0 0 0 0 0 0 1
Any other 0 1 2 0 2 0 0 4 0 9
Total lesions 4 3 10 5 5 0 0 5 0 32
35-44yrs 1982 1899 Malignancy 0 0 0 0 0 0 0 0 1 1
Leucoplakia 0 5 0 0 13 1 0 1 1 21
Lichen planus 0 0 1 0 7 0 0 0 0 8
Ulceration 1 0 5 1 11 1 0 2 0 21
OSF 0 1 0 0 7 0 0 0 1 9
Candidiasis 0 0 0 0 0 0 2 1 0 3
Angular chelitis 2 11 4 0 0 0 0 0 0 17
Any other 0 0 1 0 10* 0 1 1 1 14
Total lesions 3 17 11 1 48 2 3 5 4 94
65-74yrs 1959 1833 Malignancy 0 0 0 0 1 0 0 0 0 1
Leucoplakia 0 3 0 1 14 1 0 0 0 19
Lichen planus 0 1 0 0 10 0 1 0 1 13
Ulceration 1 0 5 2 6 1 0 3 0 18
OSF 0 0 2 0 17 2 0 0 0 21
Candidiasis 0 0 0 0 1 0 6 0 0 7
Angular chelitis 2 28 3 0 0 0 0 0 0 33
Any other 1 2 3 0 14* 2 1 2 1 26
Total lesions 4 34 13 3 63 6 8 5 2 138
* include one Erythroplakia
Note: some participants have more than one lesion and some have one lesion more than a single site
31
3.4 Number of teeth present
Two indicators were generated. The mean number of teeth present in age groups is given in Table 3.17. The percentage distribution of participants according to number of teeth present is given in Table 3.18.
Table 3.17: Distribution of participants according to the number of teeth present
Age group N Deciduous Permanent Total number of teeth
N x ̅ (SD) N x ̅ (SD) N x ̅ (SD) Sri Lanka 5yrs 1995 38674 19.4 (1.3) 3301 1.6 (2.2) 41975 21.0 (1.7)
12yrs 1996 1443 0.7 (1.9) 5045 26.1 (3.2) 53488 26.8 (1.8)
15yrs 2003 41 0.0 (0.2) 55962 27.9 (1.0) 56003 28.0 (0.9)
35-44yrs 1982 11 0.0 (0.1) 54435 27.5 (4.0) 54446 28.0 (4.0)
65-74yrs 1959 0 0.0 (0.0) 29938 15.3 (10.0) 29938 15.3 (10.0)
Male 5yrs 1043 20293 19.5 (1.2) 1511 1.4 (2.1) 21804 20.9 (1.6)
12yrs 999 879 0.9 (2.1) 25616 25.6 (3.5) 26495 26.5 (2.0)
15yrs 1002 21 0.0 (0.2) 28037 28.0 (1.1) 28058 28.0 (1.1)
35-44yrs 960 3 0.0 (0.1) 26761 27.9 (3.8) 26764 27.9 (3.7)
65-74yrs 975 0 0.0 (0.0) 15522 15.9 (10.1) 15522 15.9 (10.1)
Female 5yrs 952 18381 19.3 (1.4) 1790 1.9 (2.4) 20171 21.2 (1.7)
12yrs 997 564 0.6 (1.6) 26429 26.5 (2.8) 26993 27.1 (1.6)
15yrs 1001 20 0.0 (0.2) 27925 27.9 (0.8) 27945 27.9 (0.8)
35-44yrs 1022 8 0.0 (0.1) 27674 27.1 (4.1) 27682 27.1 (4.1)
65-74yrs 984 0 0.0 (0.0) 14416 14.7 (9.9) 14416 14.7 (9.9)
Sinhalese 5yrs 1394 27021 19.4 (1.3) 2257 1.6 (2.2) 29278 21.0 (1.6)
12yrs 1399 1084 0.78(2.0) 36408 26.0 (3.3) 37492 26.8 (1.8)
15yrs 1400 33 0.0 (0.2) 39141 28.0 (0.7) 39174 28.0 (0.7)
35-44yrs 1320 10 0.0 (0.1) 36517 27.7 (3.8) 36527 27.7 (3.8)
65-74yrs 1295 0 0.0 (0.0) 19711 15.2(10.0) 19711 15.2 (10.0)
Tamil 5yrs 302 5900 19.5 (1.0) 412 1.4 (2.0) 6312 20.9 (1.5)
12yrs 308 197 0.6 (1.7) 8083 26.2 (3.0) 8280 26.9 (1.8)
15yrs 302 8 0.0 (0.2) 8411 27.9 (1.5) 8419 27.9 (1.5)
35-44yrs 328 1 0.0 (0.1) 9041 27.6 (4.1) 9042 27.6 (4.1)
65-74yrs 329 0 0.0 (0.0) 5108 15.5 (10.7) 5108 15.5 (10.7)
Muslim 5yrs 297 5713 19.2 (1.4) 628 2.1 (2.4) 6341 21.4 (1.9)
12yrs 287 162 0.6 (1.6) 7499 26.1 (3.0) 7661 26.7 (2.0)
15yrs 300 0 0.0 (0.0) 8382 27.9 (1.1) 8382 27.9 (1.1)
35-44yrs 333 0 0.0 (0.0) 8847 26.6 (4.5) 8847 26.6 (4.5)
65-74yrs 331 0 0.0 (0.0) 5030 15.2 (9.4) 5030 15.2 (9.4)
Urban 5yrs 568 10972 19.3 (1.3) 1042 1.8 (2.3) 12014 21.2 (1.6)
12yrs 568 403 0.7 (1.9) 14828 26.1 (3.1) 15231 26.8 (1.8)
15yrs 571 10 0.0 (0.1) 15984 28.0 (1.3) 15994 28.0 (1.3)
35-44yrs 553 5 0.0 (0.1) 15142 27.4 (3.9) 15147 27.4 (3.9)
65-74yrs 554 0 0.0 (0.0) 8813 15.9 (9.8) 8813 15.9 (9.8)
Rural 5yrs 1427 27702 19.4 (1.3) 2259 1.6 (2.2) 29961 21.0 (1.7)
12yrs 1428 1040 0.7 (1.9) 37217 26.1 (3.2) 38257 26.8 (1.8)
15yrs 1432 31 0.0 (0.2) 39978 27.9 (0.8) 40009 27.9 (0.7)
35-44yrs 1429 6 0.0 (0.1) 39293 27.5 (4.0) 39299 27.5 (4.0)
65-74yrs 1405 0 0.0 (0.0) 21125 15.0 (10.1) 21125 15.0(10.1)
Note: x:̅ Mean; SD: Standard Deviation
Except in 65-74-year-olds, all other age groups on average had more than 20 teeth. Among 15-year-olds and 35-44-year-olds, the average number of teeth present was 28. In 5-year-olds, almost all the deciduous teeth were present with at least one permanent tooth erupted.
Res
ult
s
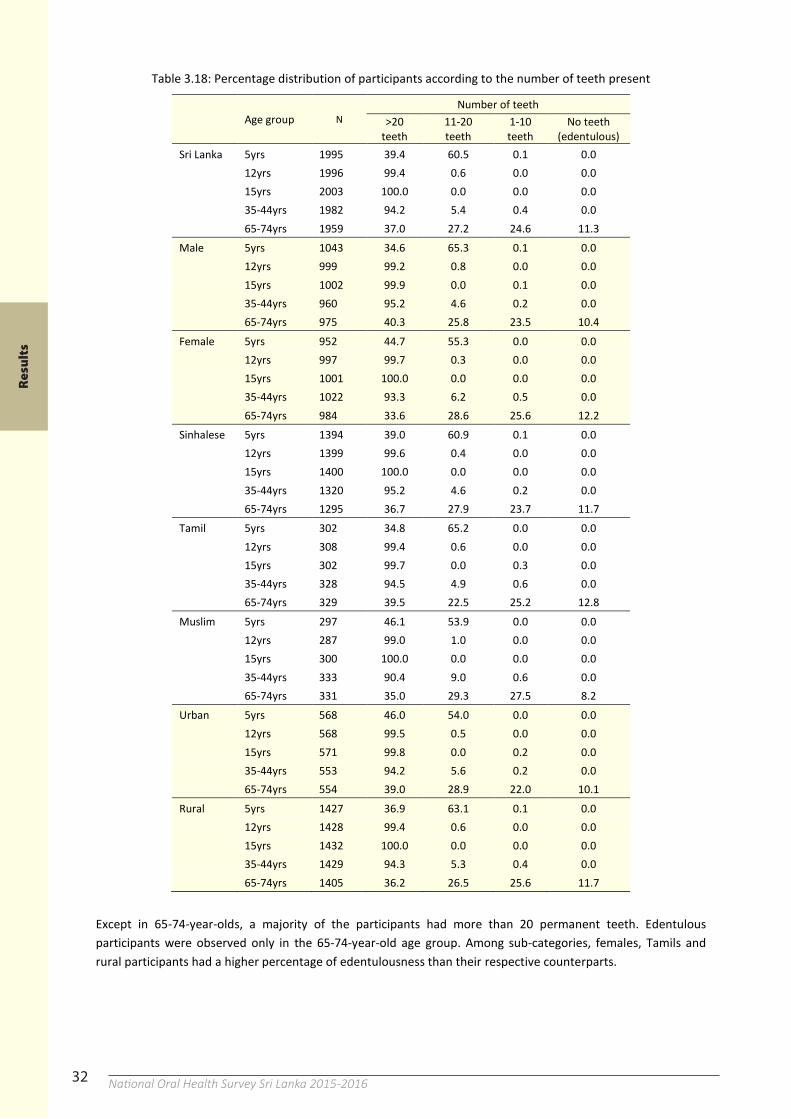
32 National Oral Health Survey Sri Lanka 2015-201632
Table 3.18: Percentage distribution of participants according to the number of teeth present
Age group N Number of teeth
>20
teeth 11-20 teeth
1-10 teeth
No teeth (edentulous)
Sri Lanka 5yrs 1995 39.4 60.5 0.1 0.0
12yrs 1996 99.4 0.6 0.0 0.0
15yrs 2003 100.0 0.0 0.0 0.0
35-44yrs 1982 94.2 5.4 0.4 0.0
65-74yrs 1959 37.0 27.2 24.6 11.3
Male 5yrs 1043 34.6 65.3 0.1 0.0
12yrs 999 99.2 0.8 0.0 0.0
15yrs 1002 99.9 0.0 0.1 0.0
35-44yrs 960 95.2 4.6 0.2 0.0
65-74yrs 975 40.3 25.8 23.5 10.4
Female 5yrs 952 44.7 55.3 0.0 0.0
12yrs 997 99.7 0.3 0.0 0.0
15yrs 1001 100.0 0.0 0.0 0.0
35-44yrs 1022 93.3 6.2 0.5 0.0
65-74yrs 984 33.6 28.6 25.6 12.2
Sinhalese 5yrs 1394 39.0 60.9 0.1 0.0
12yrs 1399 99.6 0.4 0.0 0.0
15yrs 1400 100.0 0.0 0.0 0.0
35-44yrs 1320 95.2 4.6 0.2 0.0
65-74yrs 1295 36.7 27.9 23.7 11.7
Tamil 5yrs 302 34.8 65.2 0.0 0.0
12yrs 308 99.4 0.6 0.0 0.0
15yrs 302 99.7 0.0 0.3 0.0
35-44yrs 328 94.5 4.9 0.6 0.0
65-74yrs 329 39.5 22.5 25.2 12.8
Muslim 5yrs 297 46.1 53.9 0.0 0.0
12yrs 287 99.0 1.0 0.0 0.0
15yrs 300 100.0 0.0 0.0 0.0
35-44yrs 333 90.4 9.0 0.6 0.0
65-74yrs 331 35.0 29.3 27.5 8.2
Urban 5yrs 568 46.0 54.0 0.0 0.0
12yrs 568 99.5 0.5 0.0 0.0
15yrs 571 99.8 0.0 0.2 0.0
35-44yrs 553 94.2 5.6 0.2 0.0
65-74yrs 554 39.0 28.9 22.0 10.1
Rural 5yrs 1427 36.9 63.1 0.1 0.0
12yrs 1428 99.4 0.6 0.0 0.0
15yrs 1432 100.0 0.0 0.0 0.0
35-44yrs 1429 94.3 5.3 0.4 0.0
65-74yrs 1405 36.2 26.5 25.6 11.7
Except in 65-74-year-olds, a majority of the participants had more than 20 permanent teeth. Edentulous participants were observed only in the 65-74-year-old age group. Among sub-categories, females, Tamils and rural participants had a higher percentage of edentulousness than their respective counterparts.
33
3.5 Dental caries
Dental caries was measured in all age groups according to the guidelines given by the WHO23.
3.5.1 Prevalence of dental caries
The prevalence of dental caries among the participants is given in the Table 3.19.
Table 3.19: Percentage distribution of participants according to the prevalence of dental caries
Age
group N
Total caries DMFT>0
Active caries
DT>0
Missing teeth MT>0)
Filled teeth FT>0
Active caries to
total caries (%DT/%DMFT)
Missing teeth to
total caries (%MT/%DMFT)
Filled teeth to total caries
(%FT/%DMFT) Sri Lanka 5yrs 1995 Deci* 63.1 60.7 3.6 11.5 96.2 5.6 18.2
Perm** 1.5 1.5 0.0 0.0 100.0 0.0 0.0
12yrs 1996 30.4 24.2 3.3 8.8 79.6 10.9 29.0
15yrs 2003 41.5 35.3 7.4 9.1 85.1 17.9 22.0
35-44yrs 1982 92.5 63.8 82.4 23.7 69.0 89.1 25.6
65-74yrs 1959 98.3 51.3 97.4 4.8 52.2 99.2 4.9 Male 5yrs 1043 Deci* 62.6 61.0 3.4 10.8 97.4 5.4 17.3
Perm** 1.5 1.5 0.0 0.0 100.0 0.0 0.0
12yrs 999 29.0 23.3 2.4 8.5 80.3 8.3 29.3
15yrs 1002 38.6 33.1 6.8 7.4 85.8 17.6 19.1
35-44yrs 960 90.0 58.1 81.0 24.6 64.6 90.0 27.3
65-74yrs 975 81.6 47.7 97.0 4.4 58.4 118.8 5.4 Female 5yrs 952 Deci* 63.6 60.4 3.8 12.2 95.0 6.0 19.2
Perm** 1.5 1.5 0.0 0.0 100.0 0.0 0.0
12yrs 997 31.8 25.1 4.2 9.1 78.9 13.2 28.7
15yrs 1001 44.5 37.6 8.1 10.9 84.5 18.2 24.5
35-44yrs 1022 93.8 69.1 83.7 22.9 73.6 89.2 24.4
65-74yrs 984 98.8 54.9 97.9 5.2 55.6 99.1 5.2 Sinhalese 5yrs 1394 Deci* 59.1 56.4 3.7 12.9 95.4 6.2 21.8
Perm** 1.6 1.6 0.0 0.0 100.0 0.0 0.0
12yrs 1399 28.8 22.1 2.1 9.5 76.7 7.4 33.0
15yrs 1400 39.0 32.8 5.5 10.2 84.1 14.1 26.2
35-44yrs 1320 92.5 62.7 81.5 29.2 67.8 88.1 31.6
65-74yrs 1295 98.2 50.3 97.5 5.6 51.2 99.2 5.7 Tamil 5yrs 302 Deci* 71.2 70.5 1.7 6.3 99.1 2.3 8.8
Perm** 1.0 1.0 0.0 0.0 100.0 0.0 0.0
12yrs 308 29.5 27.6 3.9 3.2 93.4 13.2 11.0
15yrs 302 44.7 40.1 8.6 5.3 89.6 19.3 11.9
35-44yrs 328 91.2 66.5 81.7 6.4 72.9 89.6 7.0
65-74yrs 329 97.3 47.4 96.4 1.8 48.8 99.1 1.9 Muslim 5yrs 297 Deci* 73.1 70.7 5.1 10.1 96.8 6.9 13.8
Perm** 1.7 1.7 0.0 0.0 100.0 0.0 0.0
12yrs 287 39.0 31.0 8.4 11.1 79.5 21.4 28.6
15yrs 300 50.3 42.7 15.3 8.0 84.8 30.5 15.9
35-44yrs 333 93.7 65.5 86.5 18.6 69.9 92.3 19.9
65-74yrs 331 99.4 58.9 98.5 3.9 59.3 99.1 4.0 Urban 5yrs 568 Deci* 63.2 61.1 4.4 11.4 96.7 7.0 18.1
Perm** 2.1 2.1 0.0 0.0 100.0 0.0 0.0
12yrs 568 28.2 22.2 3.9 9.9 78.8 13.8 35.0
15yrs 571 38.9 31.2 6.3 11.4 80.2 16.2 29.3
35-44yrs 553 92.6 64.4 82.8 21.7 69.5 89.5 23.4
65-74yrs 554 98.6 54.7 97.8 6.7 55.5 99.3 6.8 Rural 5yrs 1427 Deci* 63.0 60.5 3.2 11.5 96.1 5.1 18.2
Perm** 1.3 1.3 0.0 0.0 100.0 0.0 0.0
12yrs 1428 31.3 25.0 3.1 8.4 79.9 9.8 26.8
15yrs 1432 42.6 37.0 7.9 8.2 86.9 18.5 19.3
35-44yrs 1429 92.4 63.5 82.2 24.5 68.7 88.9 26.5
65-74yrs 1405 98.1 50.0 97.3 4.1 50.9 99.1 4.1 *Deci: Deciduous teeth; **Perm: Permanent teeth Note: For deciduous teeth in 5-year-olds, d,m,f and dmft values were given instead of D,M,F and DMFT
Res
ult
s
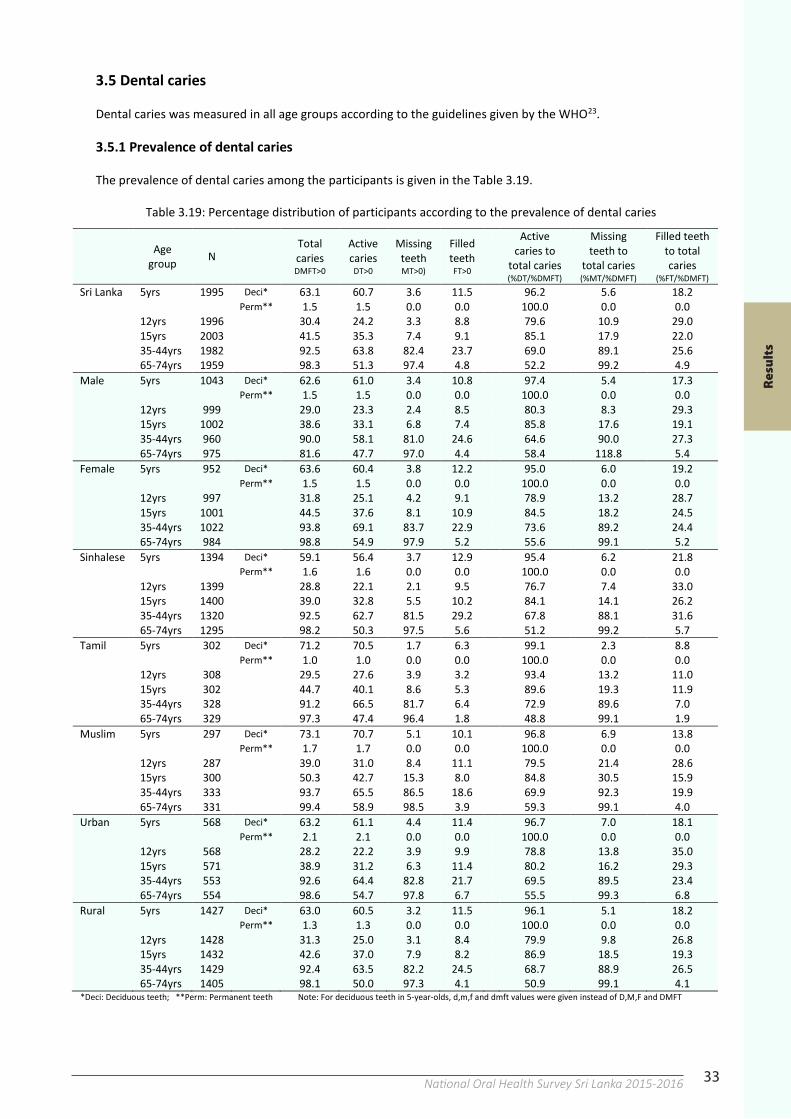
33National Oral Health Survey Sri Lanka 2015-201632
Table 3.18: Percentage distribution of participants according to the number of teeth present
Age group N Number of teeth
>20
teeth 11-20 teeth
1-10 teeth
No teeth (edentulous)
Sri Lanka 5yrs 1995 39.4 60.5 0.1 0.0
12yrs 1996 99.4 0.6 0.0 0.0
15yrs 2003 100.0 0.0 0.0 0.0
35-44yrs 1982 94.2 5.4 0.4 0.0
65-74yrs 1959 37.0 27.2 24.6 11.3
Male 5yrs 1043 34.6 65.3 0.1 0.0
12yrs 999 99.2 0.8 0.0 0.0
15yrs 1002 99.9 0.0 0.1 0.0
35-44yrs 960 95.2 4.6 0.2 0.0
65-74yrs 975 40.3 25.8 23.5 10.4
Female 5yrs 952 44.7 55.3 0.0 0.0
12yrs 997 99.7 0.3 0.0 0.0
15yrs 1001 100.0 0.0 0.0 0.0
35-44yrs 1022 93.3 6.2 0.5 0.0
65-74yrs 984 33.6 28.6 25.6 12.2
Sinhalese 5yrs 1394 39.0 60.9 0.1 0.0
12yrs 1399 99.6 0.4 0.0 0.0
15yrs 1400 100.0 0.0 0.0 0.0
35-44yrs 1320 95.2 4.6 0.2 0.0
65-74yrs 1295 36.7 27.9 23.7 11.7
Tamil 5yrs 302 34.8 65.2 0.0 0.0
12yrs 308 99.4 0.6 0.0 0.0
15yrs 302 99.7 0.0 0.3 0.0
35-44yrs 328 94.5 4.9 0.6 0.0
65-74yrs 329 39.5 22.5 25.2 12.8
Muslim 5yrs 297 46.1 53.9 0.0 0.0
12yrs 287 99.0 1.0 0.0 0.0
15yrs 300 100.0 0.0 0.0 0.0
35-44yrs 333 90.4 9.0 0.6 0.0
65-74yrs 331 35.0 29.3 27.5 8.2
Urban 5yrs 568 46.0 54.0 0.0 0.0
12yrs 568 99.5 0.5 0.0 0.0
15yrs 571 99.8 0.0 0.2 0.0
35-44yrs 553 94.2 5.6 0.2 0.0
65-74yrs 554 39.0 28.9 22.0 10.1
Rural 5yrs 1427 36.9 63.1 0.1 0.0
12yrs 1428 99.4 0.6 0.0 0.0
15yrs 1432 100.0 0.0 0.0 0.0
35-44yrs 1429 94.3 5.3 0.4 0.0
65-74yrs 1405 36.2 26.5 25.6 11.7
Except in 65-74-year-olds, a majority of the participants had more than 20 permanent teeth. Edentulous participants were observed only in the 65-74-year-old age group. Among sub-categories, females, Tamils and rural participants had a higher percentage of edentulousness than their respective counterparts.
33
3.5 Dental caries
Dental caries was measured in all age groups according to the guidelines given by the WHO23.
3.5.1 Prevalence of dental caries
The prevalence of dental caries among the participants is given in the Table 3.19.
Table 3.19: Percentage distribution of participants according to the prevalence of dental caries
Age
group N
Total caries DMFT>0
Active caries
DT>0
Missing teeth MT>0)
Filled teeth FT>0
Active caries to
total caries (%DT/%DMFT)
Missing teeth to
total caries (%MT/%DMFT)
Filled teeth to total caries
(%FT/%DMFT) Sri Lanka 5yrs 1995 Deci* 63.1 60.7 3.6 11.5 96.2 5.6 18.2
Perm** 1.5 1.5 0.0 0.0 100.0 0.0 0.0
12yrs 1996 30.4 24.2 3.3 8.8 79.6 10.9 29.0
15yrs 2003 41.5 35.3 7.4 9.1 85.1 17.9 22.0
35-44yrs 1982 92.5 63.8 82.4 23.7 69.0 89.1 25.6
65-74yrs 1959 98.3 51.3 97.4 4.8 52.2 99.2 4.9 Male 5yrs 1043 Deci* 62.6 61.0 3.4 10.8 97.4 5.4 17.3
Perm** 1.5 1.5 0.0 0.0 100.0 0.0 0.0
12yrs 999 29.0 23.3 2.4 8.5 80.3 8.3 29.3
15yrs 1002 38.6 33.1 6.8 7.4 85.8 17.6 19.1
35-44yrs 960 90.0 58.1 81.0 24.6 64.6 90.0 27.3
65-74yrs 975 81.6 47.7 97.0 4.4 58.4 118.8 5.4 Female 5yrs 952 Deci* 63.6 60.4 3.8 12.2 95.0 6.0 19.2
Perm** 1.5 1.5 0.0 0.0 100.0 0.0 0.0
12yrs 997 31.8 25.1 4.2 9.1 78.9 13.2 28.7
15yrs 1001 44.5 37.6 8.1 10.9 84.5 18.2 24.5
35-44yrs 1022 93.8 69.1 83.7 22.9 73.6 89.2 24.4
65-74yrs 984 98.8 54.9 97.9 5.2 55.6 99.1 5.2 Sinhalese 5yrs 1394 Deci* 59.1 56.4 3.7 12.9 95.4 6.2 21.8
Perm** 1.6 1.6 0.0 0.0 100.0 0.0 0.0
12yrs 1399 28.8 22.1 2.1 9.5 76.7 7.4 33.0
15yrs 1400 39.0 32.8 5.5 10.2 84.1 14.1 26.2
35-44yrs 1320 92.5 62.7 81.5 29.2 67.8 88.1 31.6
65-74yrs 1295 98.2 50.3 97.5 5.6 51.2 99.2 5.7 Tamil 5yrs 302 Deci* 71.2 70.5 1.7 6.3 99.1 2.3 8.8
Perm** 1.0 1.0 0.0 0.0 100.0 0.0 0.0
12yrs 308 29.5 27.6 3.9 3.2 93.4 13.2 11.0
15yrs 302 44.7 40.1 8.6 5.3 89.6 19.3 11.9
35-44yrs 328 91.2 66.5 81.7 6.4 72.9 89.6 7.0
65-74yrs 329 97.3 47.4 96.4 1.8 48.8 99.1 1.9 Muslim 5yrs 297 Deci* 73.1 70.7 5.1 10.1 96.8 6.9 13.8
Perm** 1.7 1.7 0.0 0.0 100.0 0.0 0.0
12yrs 287 39.0 31.0 8.4 11.1 79.5 21.4 28.6
15yrs 300 50.3 42.7 15.3 8.0 84.8 30.5 15.9
35-44yrs 333 93.7 65.5 86.5 18.6 69.9 92.3 19.9
65-74yrs 331 99.4 58.9 98.5 3.9 59.3 99.1 4.0 Urban 5yrs 568 Deci* 63.2 61.1 4.4 11.4 96.7 7.0 18.1
Perm** 2.1 2.1 0.0 0.0 100.0 0.0 0.0
12yrs 568 28.2 22.2 3.9 9.9 78.8 13.8 35.0
15yrs 571 38.9 31.2 6.3 11.4 80.2 16.2 29.3
35-44yrs 553 92.6 64.4 82.8 21.7 69.5 89.5 23.4
65-74yrs 554 98.6 54.7 97.8 6.7 55.5 99.3 6.8 Rural 5yrs 1427 Deci* 63.0 60.5 3.2 11.5 96.1 5.1 18.2
Perm** 1.3 1.3 0.0 0.0 100.0 0.0 0.0
12yrs 1428 31.3 25.0 3.1 8.4 79.9 9.8 26.8
15yrs 1432 42.6 37.0 7.9 8.2 86.9 18.5 19.3
35-44yrs 1429 92.4 63.5 82.2 24.5 68.7 88.9 26.5
65-74yrs 1405 98.1 50.0 97.3 4.1 50.9 99.1 4.1 *Deci: Deciduous teeth; **Perm: Permanent teeth Note: For deciduous teeth in 5-year-olds, d,m,f and dmft values were given instead of D,M,F and DMFT
Res
ult
s
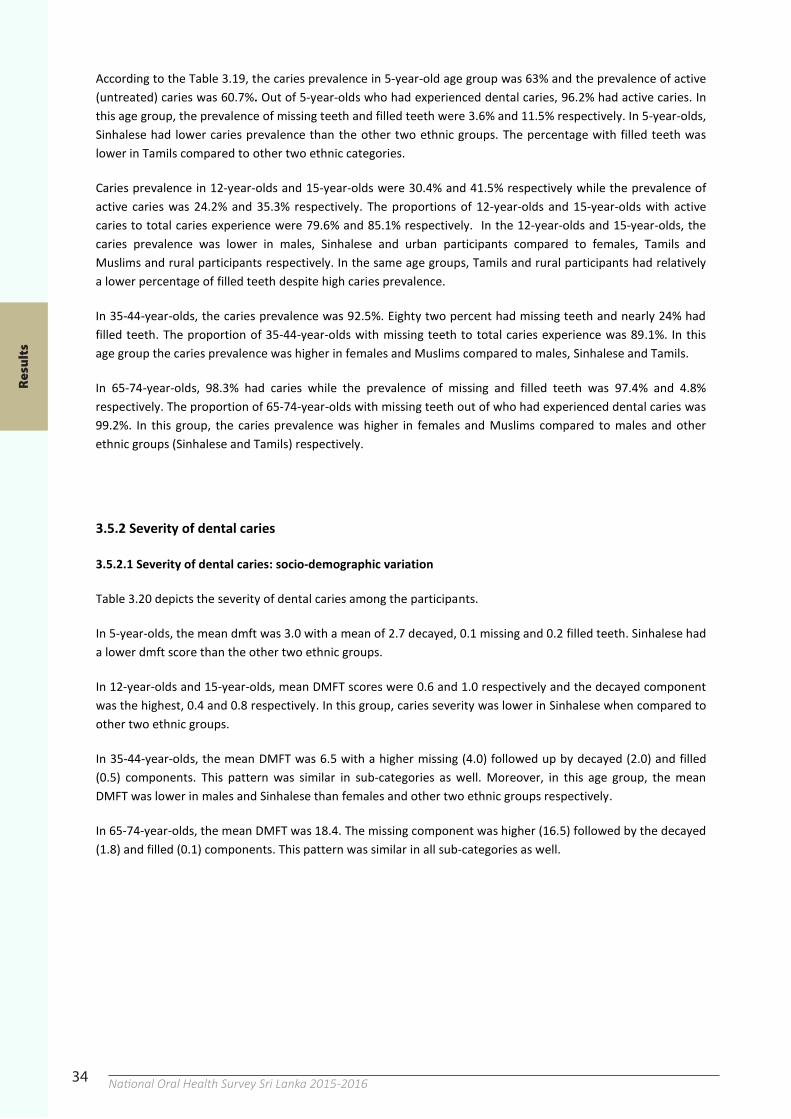
34 National Oral Health Survey Sri Lanka 2015-201634
According to the Table 3.19, the caries prevalence in 5-year-old age group was 63% and the prevalence of active (untreated) caries was 60.7%. Out of 5-year-olds who had experienced dental caries, 96.2% had active caries. In this age group, the prevalence of missing teeth and filled teeth were 3.6% and 11.5% respectively. In 5-year-olds, Sinhalese had lower caries prevalence than the other two ethnic groups. The percentage with filled teeth was lower in Tamils compared to other two ethnic categories.
Caries prevalence in 12-year-olds and 15-year-olds were 30.4% and 41.5% respectively while the prevalence of active caries was 24.2% and 35.3% respectively. The proportions of 12-year-olds and 15-year-olds with active caries to total caries experience were 79.6% and 85.1% respectively. In the 12-year-olds and 15-year-olds, the caries prevalence was lower in males, Sinhalese and urban participants compared to females, Tamils and Muslims and rural participants respectively. In the same age groups, Tamils and rural participants had relatively a lower percentage of filled teeth despite high caries prevalence.
In 35-44-year-olds, the caries prevalence was 92.5%. Eighty two percent had missing teeth and nearly 24% had filled teeth. The proportion of 35-44-year-olds with missing teeth to total caries experience was 89.1%. In this age group the caries prevalence was higher in females and Muslims compared to males, Sinhalese and Tamils.
In 65-74-year-olds, 98.3% had caries while the prevalence of missing and filled teeth was 97.4% and 4.8% respectively. The proportion of 65-74-year-olds with missing teeth out of who had experienced dental caries was 99.2%. In this group, the caries prevalence was higher in females and Muslims compared to males and other ethnic groups (Sinhalese and Tamils) respectively.
3.5.2 Severity of dental caries
3.5.2.1 Severity of dental caries: socio-demographic variation
Table 3.20 depicts the severity of dental caries among the participants.
In 5-year-olds, the mean dmft was 3.0 with a mean of 2.7 decayed, 0.1 missing and 0.2 filled teeth. Sinhalese had a lower dmft score than the other two ethnic groups.
In 12-year-olds and 15-year-olds, mean DMFT scores were 0.6 and 1.0 respectively and the decayed component was the highest, 0.4 and 0.8 respectively. In this group, caries severity was lower in Sinhalese when compared to other two ethnic groups.
In 35-44-year-olds, the mean DMFT was 6.5 with a higher missing (4.0) followed up by decayed (2.0) and filled (0.5) components. This pattern was similar in sub-categories as well. Moreover, in this age group, the mean DMFT was lower in males and Sinhalese than females and other two ethnic groups respectively.
In 65-74-year-olds, the mean DMFT was 18.4. The missing component was higher (16.5) followed by the decayed (1.8) and filled (0.1) components. This pattern was similar in all sub-categories as well.
Res
ult
s
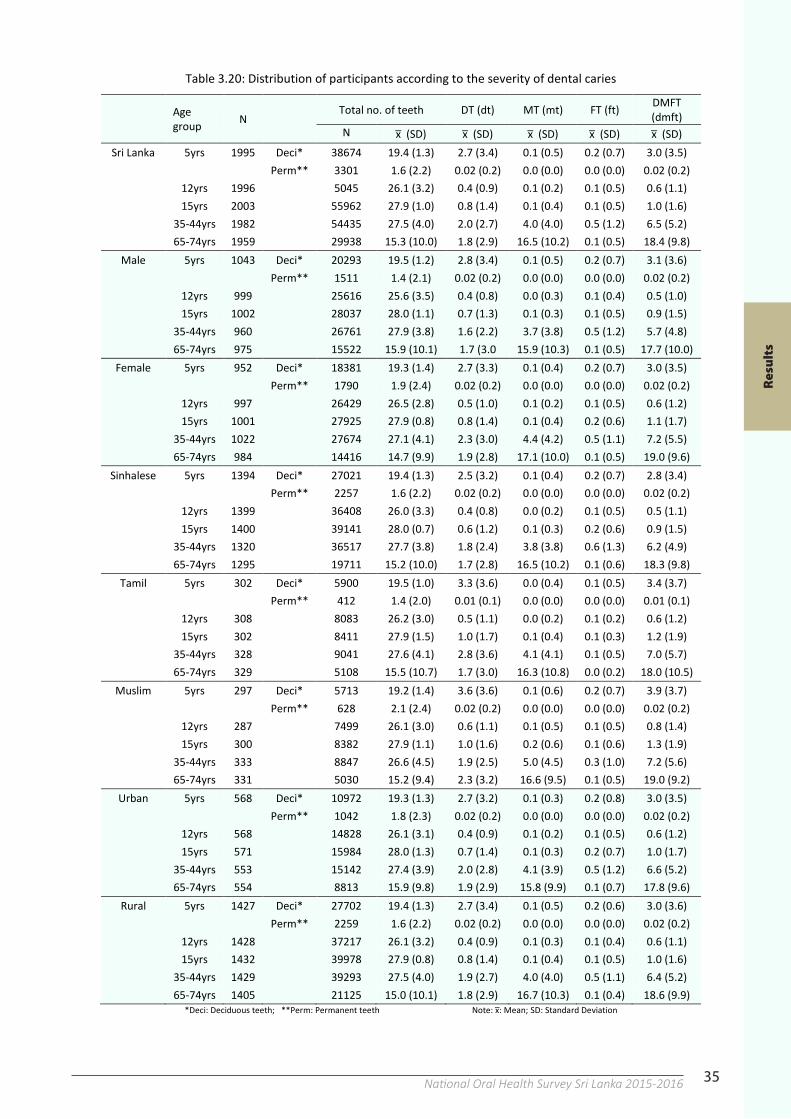
35National Oral Health Survey Sri Lanka 2015-201634
According to the Table 3.19, the caries prevalence in 5-year-old age group was 63% and the prevalence of active (untreated) caries was 60.7%. Out of 5-year-olds who had experienced dental caries, 96.2% had active caries. In this age group, the prevalence of missing teeth and filled teeth were 3.6% and 11.5% respectively. In 5-year-olds, Sinhalese had lower caries prevalence than the other two ethnic groups. The percentage with filled teeth was lower in Tamils compared to other two ethnic categories.
Caries prevalence in 12-year-olds and 15-year-olds were 30.4% and 41.5% respectively while the prevalence of active caries was 24.2% and 35.3% respectively. The proportions of 12-year-olds and 15-year-olds with active caries to total caries experience were 79.6% and 85.1% respectively. In the 12-year-olds and 15-year-olds, the caries prevalence was lower in males, Sinhalese and urban participants compared to females, Tamils and Muslims and rural participants respectively. In the same age groups, Tamils and rural participants had relatively a lower percentage of filled teeth despite high caries prevalence.
In 35-44-year-olds, the caries prevalence was 92.5%. Eighty two percent had missing teeth and nearly 24% had filled teeth. The proportion of 35-44-year-olds with missing teeth to total caries experience was 89.1%. In this age group the caries prevalence was higher in females and Muslims compared to males, Sinhalese and Tamils.
In 65-74-year-olds, 98.3% had caries while the prevalence of missing and filled teeth was 97.4% and 4.8% respectively. The proportion of 65-74-year-olds with missing teeth out of who had experienced dental caries was 99.2%. In this group, the caries prevalence was higher in females and Muslims compared to males and other ethnic groups (Sinhalese and Tamils) respectively.
3.5.2 Severity of dental caries
3.5.2.1 Severity of dental caries: socio-demographic variation
Table 3.20 depicts the severity of dental caries among the participants.
In 5-year-olds, the mean dmft was 3.0 with a mean of 2.7 decayed, 0.1 missing and 0.2 filled teeth. Sinhalese had a lower dmft score than the other two ethnic groups.
In 12-year-olds and 15-year-olds, mean DMFT scores were 0.6 and 1.0 respectively and the decayed component was the highest, 0.4 and 0.8 respectively. In this group, caries severity was lower in Sinhalese when compared to other two ethnic groups.
In 35-44-year-olds, the mean DMFT was 6.5 with a higher missing (4.0) followed up by decayed (2.0) and filled (0.5) components. This pattern was similar in sub-categories as well. Moreover, in this age group, the mean DMFT was lower in males and Sinhalese than females and other two ethnic groups respectively.
In 65-74-year-olds, the mean DMFT was 18.4. The missing component was higher (16.5) followed by the decayed (1.8) and filled (0.1) components. This pattern was similar in all sub-categories as well.
35
Table 3.20: Distribution of participants according to the severity of dental caries
Age group N Total no. of teeth DT (dt) MT (mt) FT (ft) DMFT
(dmft)
N x ̅ (SD) x ̅ (SD) x ̅ (SD) x ̅ (SD) x ̅ (SD)
Sri Lanka 5yrs 1995 Deci* 38674 19.4 (1.3) 2.7 (3.4) 0.1 (0.5) 0.2 (0.7) 3.0 (3.5)
Perm** 3301 1.6 (2.2) 0.02 (0.2) 0.0 (0.0) 0.0 (0.0) 0.02 (0.2)
12yrs 1996 5045 26.1 (3.2) 0.4 (0.9) 0.1 (0.2) 0.1 (0.5) 0.6 (1.1)
15yrs 2003 55962 27.9 (1.0) 0.8 (1.4) 0.1 (0.4) 0.1 (0.5) 1.0 (1.6)
35-44yrs 1982 54435 27.5 (4.0) 2.0 (2.7) 4.0 (4.0) 0.5 (1.2) 6.5 (5.2)
65-74yrs 1959 29938 15.3 (10.0) 1.8 (2.9) 16.5 (10.2) 0.1 (0.5) 18.4 (9.8) Male 5yrs 1043 Deci* 20293 19.5 (1.2) 2.8 (3.4) 0.1 (0.5) 0.2 (0.7) 3.1 (3.6)
Perm** 1511 1.4 (2.1) 0.02 (0.2) 0.0 (0.0) 0.0 (0.0) 0.02 (0.2)
12yrs 999 25616 25.6 (3.5) 0.4 (0.8) 0.0 (0.3) 0.1 (0.4) 0.5 (1.0)
15yrs 1002 28037 28.0 (1.1) 0.7 (1.3) 0.1 (0.3) 0.1 (0.5) 0.9 (1.5)
35-44yrs 960 26761 27.9 (3.8) 1.6 (2.2) 3.7 (3.8) 0.5 (1.2) 5.7 (4.8)
65-74yrs 975 15522 15.9 (10.1) 1.7 (3.0 15.9 (10.3) 0.1 (0.5) 17.7 (10.0) Female 5yrs 952 Deci* 18381 19.3 (1.4) 2.7 (3.3) 0.1 (0.4) 0.2 (0.7) 3.0 (3.5)
Perm** 1790 1.9 (2.4) 0.02 (0.2) 0.0 (0.0) 0.0 (0.0) 0.02 (0.2)
12yrs 997 26429 26.5 (2.8) 0.5 (1.0) 0.1 (0.2) 0.1 (0.5) 0.6 (1.2)
15yrs 1001 27925 27.9 (0.8) 0.8 (1.4) 0.1 (0.4) 0.2 (0.6) 1.1 (1.7)
35-44yrs 1022 27674 27.1 (4.1) 2.3 (3.0) 4.4 (4.2) 0.5 (1.1) 7.2 (5.5)
65-74yrs 984 14416 14.7 (9.9) 1.9 (2.8) 17.1 (10.0) 0.1 (0.5) 19.0 (9.6) Sinhalese 5yrs 1394 Deci* 27021 19.4 (1.3) 2.5 (3.2) 0.1 (0.4) 0.2 (0.7) 2.8 (3.4)
Perm** 2257 1.6 (2.2) 0.02 (0.2) 0.0 (0.0) 0.0 (0.0) 0.02 (0.2)
12yrs 1399 36408 26.0 (3.3) 0.4 (0.8) 0.0 (0.2) 0.1 (0.5) 0.5 (1.1)
15yrs 1400 39141 28.0 (0.7) 0.6 (1.2) 0.1 (0.3) 0.2 (0.6) 0.9 (1.5)
35-44yrs 1320 36517 27.7 (3.8) 1.8 (2.4) 3.8 (3.8) 0.6 (1.3) 6.2 (4.9)
65-74yrs 1295 19711 15.2 (10.0) 1.7 (2.8) 16.5 (10.2) 0.1 (0.6) 18.3 (9.8) Tamil 5yrs 302 Deci* 5900 19.5 (1.0) 3.3 (3.6) 0.0 (0.4) 0.1 (0.5) 3.4 (3.7)
Perm** 412 1.4 (2.0) 0.01 (0.1) 0.0 (0.0) 0.0 (0.0) 0.01 (0.1)
12yrs 308 8083 26.2 (3.0) 0.5 (1.1) 0.0 (0.2) 0.1 (0.2) 0.6 (1.2)
15yrs 302 8411 27.9 (1.5) 1.0 (1.7) 0.1 (0.4) 0.1 (0.3) 1.2 (1.9)
35-44yrs 328 9041 27.6 (4.1) 2.8 (3.6) 4.1 (4.1) 0.1 (0.5) 7.0 (5.7)
65-74yrs 329 5108 15.5 (10.7) 1.7 (3.0) 16.3 (10.8) 0.0 (0.2) 18.0 (10.5) Muslim 5yrs 297 Deci* 5713 19.2 (1.4) 3.6 (3.6) 0.1 (0.6) 0.2 (0.7) 3.9 (3.7)
Perm** 628 2.1 (2.4) 0.02 (0.2) 0.0 (0.0) 0.0 (0.0) 0.02 (0.2)
12yrs 287 7499 26.1 (3.0) 0.6 (1.1) 0.1 (0.5) 0.1 (0.5) 0.8 (1.4)
15yrs 300 8382 27.9 (1.1) 1.0 (1.6) 0.2 (0.6) 0.1 (0.6) 1.3 (1.9)
35-44yrs 333 8847 26.6 (4.5) 1.9 (2.5) 5.0 (4.5) 0.3 (1.0) 7.2 (5.6)
65-74yrs 331 5030 15.2 (9.4) 2.3 (3.2) 16.6 (9.5) 0.1 (0.5) 19.0 (9.2) Urban 5yrs 568 Deci* 10972 19.3 (1.3) 2.7 (3.2) 0.1 (0.3) 0.2 (0.8) 3.0 (3.5)
Perm** 1042 1.8 (2.3) 0.02 (0.2) 0.0 (0.0) 0.0 (0.0) 0.02 (0.2)
12yrs 568 14828 26.1 (3.1) 0.4 (0.9) 0.1 (0.2) 0.1 (0.5) 0.6 (1.2)
15yrs 571 15984 28.0 (1.3) 0.7 (1.4) 0.1 (0.3) 0.2 (0.7) 1.0 (1.7)
35-44yrs 553 15142 27.4 (3.9) 2.0 (2.8) 4.1 (3.9) 0.5 (1.2) 6.6 (5.2)
65-74yrs 554 8813 15.9 (9.8) 1.9 (2.9) 15.8 (9.9) 0.1 (0.7) 17.8 (9.6) Rural 5yrs 1427 Deci* 27702 19.4 (1.3) 2.7 (3.4) 0.1 (0.5) 0.2 (0.6) 3.0 (3.6)
Perm** 2259 1.6 (2.2) 0.02 (0.2) 0.0 (0.0) 0.0 (0.0) 0.02 (0.2)
12yrs 1428 37217 26.1 (3.2) 0.4 (0.9) 0.1 (0.3) 0.1 (0.4) 0.6 (1.1)
15yrs 1432 39978 27.9 (0.8) 0.8 (1.4) 0.1 (0.4) 0.1 (0.5) 1.0 (1.6)
35-44yrs 1429 39293 27.5 (4.0) 1.9 (2.7) 4.0 (4.0) 0.5 (1.1) 6.4 (5.2)
65-74yrs 1405 21125 15.0 (10.1) 1.8 (2.9) 16.7 (10.3) 0.1 (0.4) 18.6 (9.9) *Deci: Deciduous teeth; **Perm: Permanent teeth Note: x:̅ Mean; SD: Standard Deviation
Res
ult
s
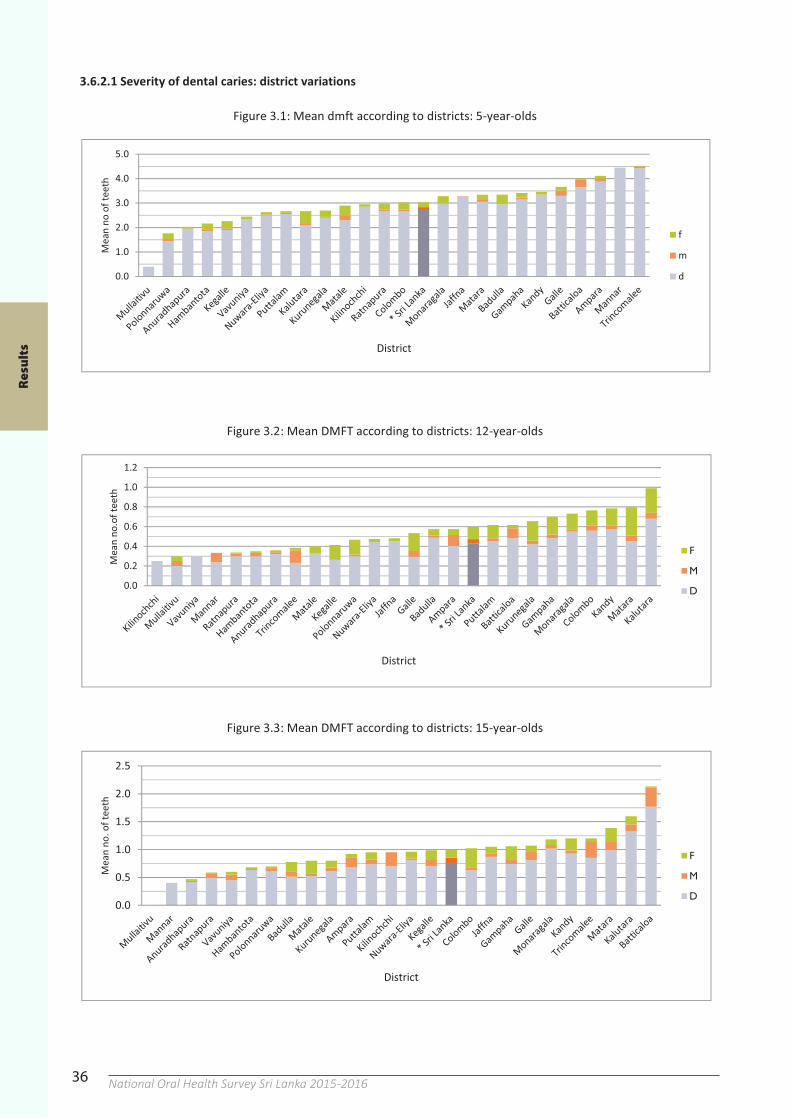
36 National Oral Health Survey Sri Lanka 2015-2016
Mullait iv
u
Bat t ica
loa
Mullait iv
u
Mullait iv
u
Bat t ica
loa
Bat t ica
loa
Bat t ica
loa
Bat t ica
loa
Mullait iv
u
Mullait iv
u
Res
ult
s
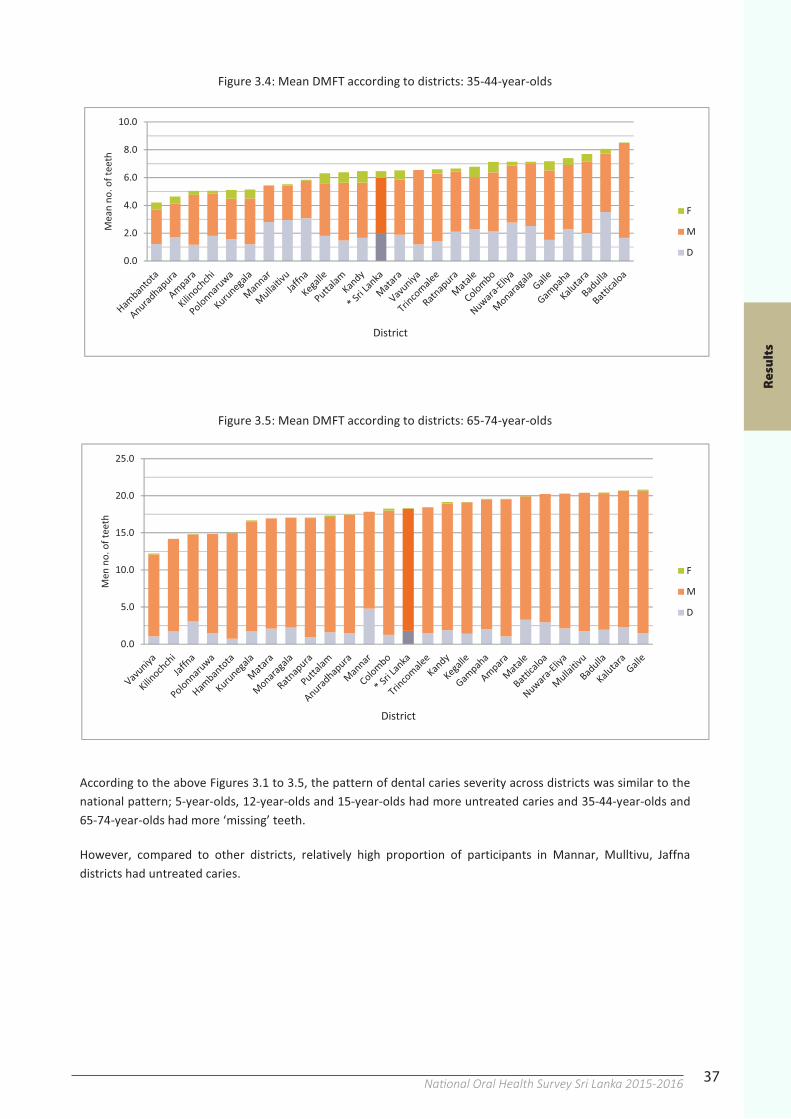
37National Oral Health Survey Sri Lanka 2015-2016
Bat t ica
loa
Bat t ica
loa
Mullait iv
u
Mullait iv
u
Res
ult
s
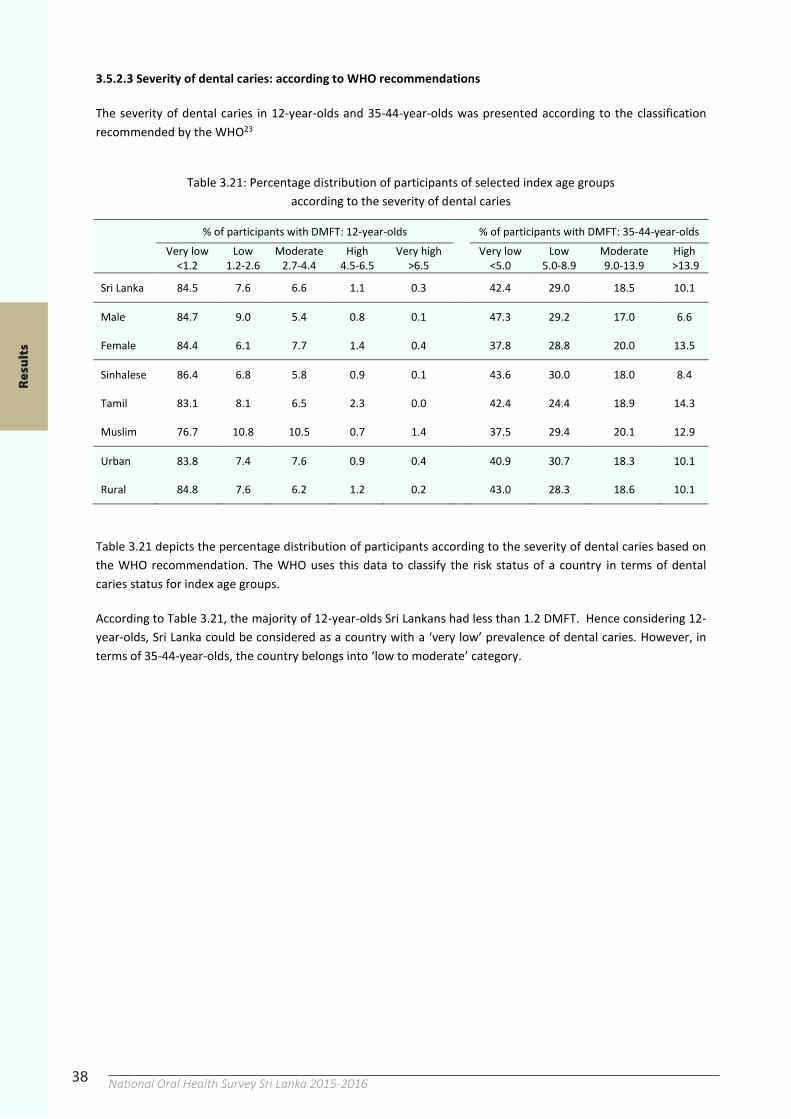
38 National Oral Health Survey Sri Lanka 2015-201638
3.5.2.3 Severity of dental caries: according to WHO recommendations
The severity of dental caries in 12-year-olds and 35-44-year-olds was presented according to the classification recommended by the WHO23
Table 3.21: Percentage distribution of participants of selected index age groups
according to the severity of dental caries
% of participants with DMFT: 12-year-olds % of participants with DMFT: 35-44-year-olds
Very low
<1.2 Low
1.2-2.6 Moderate
2.7-4.4 High
4.5-6.5 Very high
>6.5 Very low <5.0
Low 5.0-8.9
Moderate 9.0-13.9
High >13.9
Sri Lanka 84.5 7.6 6.6 1.1 0.3 42.4 29.0 18.5 10.1
Male 84.7 9.0 5.4 0.8 0.1 47.3 29.2 17.0 6.6
Female 84.4 6.1 7.7 1.4 0.4 37.8 28.8 20.0 13.5
Sinhalese 86.4 6.8 5.8 0.9 0.1 43.6 30.0 18.0 8.4
Tamil 83.1 8.1 6.5 2.3 0.0 42.4 24.4 18.9 14.3
Muslim 76.7 10.8 10.5 0.7 1.4 37.5 29.4 20.1 12.9
Urban 83.8 7.4 7.6 0.9 0.4 40.9 30.7 18.3 10.1
Rural 84.8 7.6 6.2 1.2 0.2 43.0 28.3 18.6 10.1
Table 3.21 depicts the percentage distribution of participants according to the severity of dental caries based on the WHO recommendation. The WHO uses this data to classify the risk status of a country in terms of dental caries status for index age groups.
According to Table 3.21, the majority of 12-year-olds Sri Lankans had less than 1.2 DMFT. Hence considering 12-year-olds, Sri Lanka could be considered as a country with a ‘very low’ prevalence of dental caries. However, in terms of 35-44-year-olds, the country belongs into ‘low to moderate’ category.
Res
ult
s
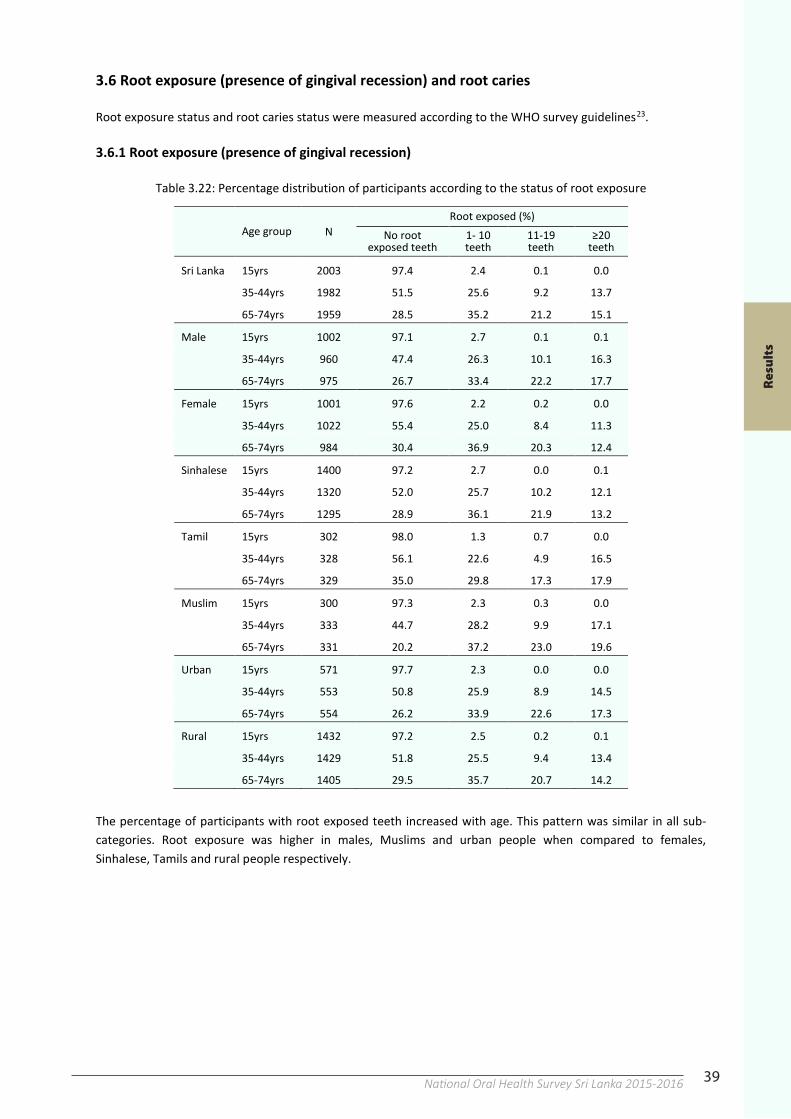
39National Oral Health Survey Sri Lanka 2015-201638
3.5.2.3 Severity of dental caries: according to WHO recommendations
The severity of dental caries in 12-year-olds and 35-44-year-olds was presented according to the classification recommended by the WHO23
Table 3.21: Percentage distribution of participants of selected index age groups
according to the severity of dental caries
% of participants with DMFT: 12-year-olds % of participants with DMFT: 35-44-year-olds
Very low
<1.2 Low
1.2-2.6 Moderate
2.7-4.4 High
4.5-6.5 Very high
>6.5 Very low <5.0
Low 5.0-8.9
Moderate 9.0-13.9
High >13.9
Sri Lanka 84.5 7.6 6.6 1.1 0.3 42.4 29.0 18.5 10.1
Male 84.7 9.0 5.4 0.8 0.1 47.3 29.2 17.0 6.6
Female 84.4 6.1 7.7 1.4 0.4 37.8 28.8 20.0 13.5
Sinhalese 86.4 6.8 5.8 0.9 0.1 43.6 30.0 18.0 8.4
Tamil 83.1 8.1 6.5 2.3 0.0 42.4 24.4 18.9 14.3
Muslim 76.7 10.8 10.5 0.7 1.4 37.5 29.4 20.1 12.9
Urban 83.8 7.4 7.6 0.9 0.4 40.9 30.7 18.3 10.1
Rural 84.8 7.6 6.2 1.2 0.2 43.0 28.3 18.6 10.1
Table 3.21 depicts the percentage distribution of participants according to the severity of dental caries based on the WHO recommendation. The WHO uses this data to classify the risk status of a country in terms of dental caries status for index age groups.
According to Table 3.21, the majority of 12-year-olds Sri Lankans had less than 1.2 DMFT. Hence considering 12-year-olds, Sri Lanka could be considered as a country with a ‘very low’ prevalence of dental caries. However, in terms of 35-44-year-olds, the country belongs into ‘low to moderate’ category.
39
3.6 Root exposure (presence of gingival recession) and root caries
Root exposure status and root caries status were measured according to the WHO survey guidelines23.
3.6.1 Root exposure (presence of gingival recession)
Table 3.22: Percentage distribution of participants according to the status of root exposure
Age group N Root exposed (%)
No root exposed teeth
1- 10 teeth
11-19 teeth
≥20 teeth
Sri Lanka 15yrs 2003 97.4 2.4 0.1 0.0
35-44yrs 1982 51.5 25.6 9.2 13.7
65-74yrs 1959 28.5 35.2 21.2 15.1
Male 15yrs 1002 97.1 2.7 0.1 0.1
35-44yrs 960 47.4 26.3 10.1 16.3
65-74yrs 975 26.7 33.4 22.2 17.7
Female 15yrs 1001 97.6 2.2 0.2 0.0
35-44yrs 1022 55.4 25.0 8.4 11.3
65-74yrs 984 30.4 36.9 20.3 12.4
Sinhalese 15yrs 1400 97.2 2.7 0.0 0.1
35-44yrs 1320 52.0 25.7 10.2 12.1
65-74yrs 1295 28.9 36.1 21.9 13.2
Tamil 15yrs 302 98.0 1.3 0.7 0.0
35-44yrs 328 56.1 22.6 4.9 16.5
65-74yrs 329 35.0 29.8 17.3 17.9
Muslim 15yrs 300 97.3 2.3 0.3 0.0
35-44yrs 333 44.7 28.2 9.9 17.1
65-74yrs 331 20.2 37.2 23.0 19.6
Urban 15yrs 571 97.7 2.3 0.0 0.0
35-44yrs 553 50.8 25.9 8.9 14.5
65-74yrs 554 26.2 33.9 22.6 17.3
Rural 15yrs 1432 97.2 2.5 0.2 0.1
35-44yrs 1429 51.8 25.5 9.4 13.4
65-74yrs 1405 29.5 35.7 20.7 14.2
The percentage of participants with root exposed teeth increased with age. This pattern was similar in all sub-categories. Root exposure was higher in males, Muslims and urban people when compared to females, Sinhalese, Tamils and rural people respectively.
Res
ult
s
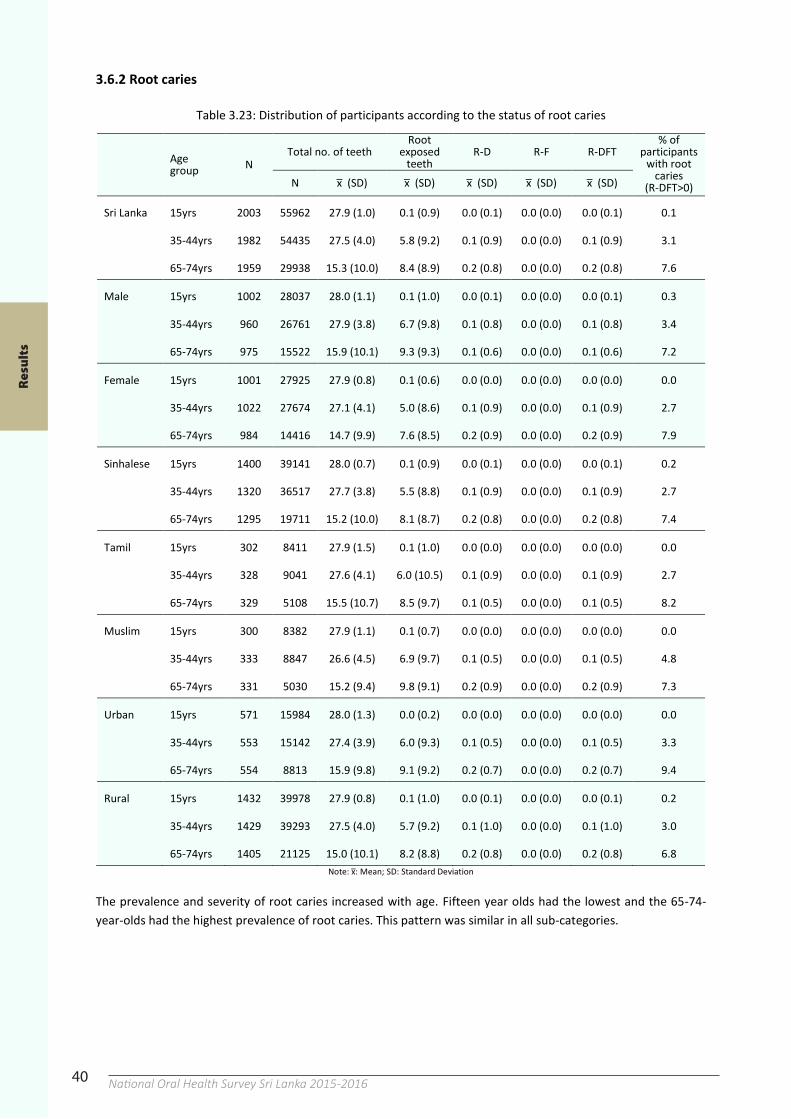
40 National Oral Health Survey Sri Lanka 2015-201640
3.6.2 Root caries
Table 3.23: Distribution of participants according to the status of root caries
Age group N
Total no. of teeth Root
exposed teeth
R-D R-F R-DFT % of
participants with root
caries (R-DFT>0) N x ̅ (SD) x ̅ (SD) x ̅ (SD) x ̅ (SD) x ̅ (SD)
Sri Lanka 15yrs 2003 55962 27.9 (1.0) 0.1 (0.9) 0.0 (0.1) 0.0 (0.0) 0.0 (0.1) 0.1
35-44yrs 1982 54435 27.5 (4.0) 5.8 (9.2) 0.1 (0.9) 0.0 (0.0) 0.1 (0.9) 3.1
65-74yrs 1959 29938 15.3 (10.0) 8.4 (8.9) 0.2 (0.8) 0.0 (0.0) 0.2 (0.8) 7.6
Male 15yrs 1002 28037 28.0 (1.1) 0.1 (1.0) 0.0 (0.1) 0.0 (0.0) 0.0 (0.1) 0.3
35-44yrs 960 26761 27.9 (3.8) 6.7 (9.8) 0.1 (0.8) 0.0 (0.0) 0.1 (0.8) 3.4
65-74yrs 975 15522 15.9 (10.1) 9.3 (9.3) 0.1 (0.6) 0.0 (0.0) 0.1 (0.6) 7.2
Female 15yrs 1001 27925 27.9 (0.8) 0.1 (0.6) 0.0 (0.0) 0.0 (0.0) 0.0 (0.0) 0.0
35-44yrs 1022 27674 27.1 (4.1) 5.0 (8.6) 0.1 (0.9) 0.0 (0.0) 0.1 (0.9) 2.7
65-74yrs 984 14416 14.7 (9.9) 7.6 (8.5) 0.2 (0.9) 0.0 (0.0) 0.2 (0.9) 7.9
Sinhalese 15yrs 1400 39141 28.0 (0.7) 0.1 (0.9) 0.0 (0.1) 0.0 (0.0) 0.0 (0.1) 0.2
35-44yrs 1320 36517 27.7 (3.8) 5.5 (8.8) 0.1 (0.9) 0.0 (0.0) 0.1 (0.9) 2.7
65-74yrs 1295 19711 15.2 (10.0) 8.1 (8.7) 0.2 (0.8) 0.0 (0.0) 0.2 (0.8) 7.4
Tamil 15yrs 302 8411 27.9 (1.5) 0.1 (1.0) 0.0 (0.0) 0.0 (0.0) 0.0 (0.0) 0.0
35-44yrs 328 9041 27.6 (4.1) 6.0 (10.5) 0.1 (0.9) 0.0 (0.0) 0.1 (0.9) 2.7
65-74yrs 329 5108 15.5 (10.7) 8.5 (9.7) 0.1 (0.5) 0.0 (0.0) 0.1 (0.5) 8.2
Muslim 15yrs 300 8382 27.9 (1.1) 0.1 (0.7) 0.0 (0.0) 0.0 (0.0) 0.0 (0.0) 0.0
35-44yrs 333 8847 26.6 (4.5) 6.9 (9.7) 0.1 (0.5) 0.0 (0.0) 0.1 (0.5) 4.8
65-74yrs 331 5030 15.2 (9.4) 9.8 (9.1) 0.2 (0.9) 0.0 (0.0) 0.2 (0.9) 7.3
Urban 15yrs 571 15984 28.0 (1.3) 0.0 (0.2) 0.0 (0.0) 0.0 (0.0) 0.0 (0.0) 0.0
35-44yrs 553 15142 27.4 (3.9) 6.0 (9.3) 0.1 (0.5) 0.0 (0.0) 0.1 (0.5) 3.3
65-74yrs 554 8813 15.9 (9.8) 9.1 (9.2) 0.2 (0.7) 0.0 (0.0) 0.2 (0.7) 9.4
Rural 15yrs 1432 39978 27.9 (0.8) 0.1 (1.0) 0.0 (0.1) 0.0 (0.0) 0.0 (0.1) 0.2
35-44yrs 1429 39293 27.5 (4.0) 5.7 (9.2) 0.1 (1.0) 0.0 (0.0) 0.1 (1.0) 3.0
65-74yrs 1405 21125 15.0 (10.1) 8.2 (8.8) 0.2 (0.8) 0.0 (0.0) 0.2 (0.8) 6.8
Note: x:̅ Mean; SD: Standard Deviation
The prevalence and severity of root caries increased with age. Fifteen year olds had the lowest and the 65-74-year-olds had the highest prevalence of root caries. This pattern was similar in all sub-categories.
Res
ult
s
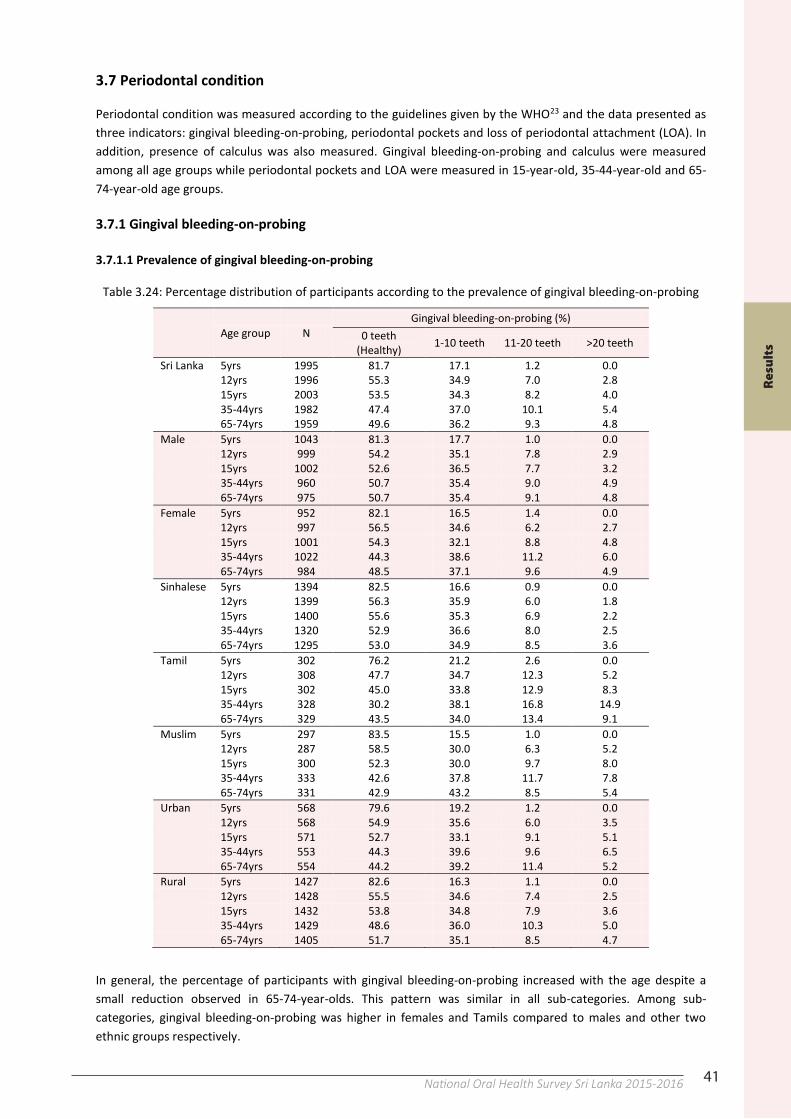
41National Oral Health Survey Sri Lanka 2015-201640
3.6.2 Root caries
Table 3.23: Distribution of participants according to the status of root caries
Age group N
Total no. of teeth Root
exposed teeth
R-D R-F R-DFT % of
participants with root
caries (R-DFT>0) N x ̅ (SD) x ̅ (SD) x ̅ (SD) x ̅ (SD) x ̅ (SD)
Sri Lanka 15yrs 2003 55962 27.9 (1.0) 0.1 (0.9) 0.0 (0.1) 0.0 (0.0) 0.0 (0.1) 0.1
35-44yrs 1982 54435 27.5 (4.0) 5.8 (9.2) 0.1 (0.9) 0.0 (0.0) 0.1 (0.9) 3.1
65-74yrs 1959 29938 15.3 (10.0) 8.4 (8.9) 0.2 (0.8) 0.0 (0.0) 0.2 (0.8) 7.6
Male 15yrs 1002 28037 28.0 (1.1) 0.1 (1.0) 0.0 (0.1) 0.0 (0.0) 0.0 (0.1) 0.3
35-44yrs 960 26761 27.9 (3.8) 6.7 (9.8) 0.1 (0.8) 0.0 (0.0) 0.1 (0.8) 3.4
65-74yrs 975 15522 15.9 (10.1) 9.3 (9.3) 0.1 (0.6) 0.0 (0.0) 0.1 (0.6) 7.2
Female 15yrs 1001 27925 27.9 (0.8) 0.1 (0.6) 0.0 (0.0) 0.0 (0.0) 0.0 (0.0) 0.0
35-44yrs 1022 27674 27.1 (4.1) 5.0 (8.6) 0.1 (0.9) 0.0 (0.0) 0.1 (0.9) 2.7
65-74yrs 984 14416 14.7 (9.9) 7.6 (8.5) 0.2 (0.9) 0.0 (0.0) 0.2 (0.9) 7.9
Sinhalese 15yrs 1400 39141 28.0 (0.7) 0.1 (0.9) 0.0 (0.1) 0.0 (0.0) 0.0 (0.1) 0.2
35-44yrs 1320 36517 27.7 (3.8) 5.5 (8.8) 0.1 (0.9) 0.0 (0.0) 0.1 (0.9) 2.7
65-74yrs 1295 19711 15.2 (10.0) 8.1 (8.7) 0.2 (0.8) 0.0 (0.0) 0.2 (0.8) 7.4
Tamil 15yrs 302 8411 27.9 (1.5) 0.1 (1.0) 0.0 (0.0) 0.0 (0.0) 0.0 (0.0) 0.0
35-44yrs 328 9041 27.6 (4.1) 6.0 (10.5) 0.1 (0.9) 0.0 (0.0) 0.1 (0.9) 2.7
65-74yrs 329 5108 15.5 (10.7) 8.5 (9.7) 0.1 (0.5) 0.0 (0.0) 0.1 (0.5) 8.2
Muslim 15yrs 300 8382 27.9 (1.1) 0.1 (0.7) 0.0 (0.0) 0.0 (0.0) 0.0 (0.0) 0.0
35-44yrs 333 8847 26.6 (4.5) 6.9 (9.7) 0.1 (0.5) 0.0 (0.0) 0.1 (0.5) 4.8
65-74yrs 331 5030 15.2 (9.4) 9.8 (9.1) 0.2 (0.9) 0.0 (0.0) 0.2 (0.9) 7.3
Urban 15yrs 571 15984 28.0 (1.3) 0.0 (0.2) 0.0 (0.0) 0.0 (0.0) 0.0 (0.0) 0.0
35-44yrs 553 15142 27.4 (3.9) 6.0 (9.3) 0.1 (0.5) 0.0 (0.0) 0.1 (0.5) 3.3
65-74yrs 554 8813 15.9 (9.8) 9.1 (9.2) 0.2 (0.7) 0.0 (0.0) 0.2 (0.7) 9.4
Rural 15yrs 1432 39978 27.9 (0.8) 0.1 (1.0) 0.0 (0.1) 0.0 (0.0) 0.0 (0.1) 0.2
35-44yrs 1429 39293 27.5 (4.0) 5.7 (9.2) 0.1 (1.0) 0.0 (0.0) 0.1 (1.0) 3.0
65-74yrs 1405 21125 15.0 (10.1) 8.2 (8.8) 0.2 (0.8) 0.0 (0.0) 0.2 (0.8) 6.8
Note: x:̅ Mean; SD: Standard Deviation
The prevalence and severity of root caries increased with age. Fifteen year olds had the lowest and the 65-74-year-olds had the highest prevalence of root caries. This pattern was similar in all sub-categories.
41
3.7 Periodontal condition
Periodontal condition was measured according to the guidelines given by the WHO23 and the data presented as three indicators: gingival bleeding-on-probing, periodontal pockets and loss of periodontal attachment (LOA). In addition, presence of calculus was also measured. Gingival bleeding-on-probing and calculus were measured among all age groups while periodontal pockets and LOA were measured in 15-year-old, 35-44-year-old and 65-74-year-old age groups.
3.7.1 Gingival bleeding-on-probing
3.7.1.1 Prevalence of gingival bleeding-on-probing
Table 3.24: Percentage distribution of participants according to the prevalence of gingival bleeding-on-probing
Age group N Gingival bleeding-on-probing (%)
0 teeth (Healthy) 1-10 teeth 11-20 teeth >20 teeth
Sri Lanka 5yrs 1995 81.7 17.1 1.2 0.0
12yrs 1996 55.3 34.9 7.0 2.8
15yrs 2003 53.5 34.3 8.2 4.0
35-44yrs 1982 47.4 37.0 10.1 5.4
65-74yrs 1959 49.6 36.2 9.3 4.8 Male 5yrs 1043 81.3 17.7 1.0 0.0
12yrs 999 54.2 35.1 7.8 2.9
15yrs 1002 52.6 36.5 7.7 3.2
35-44yrs 960 50.7 35.4 9.0 4.9
65-74yrs 975 50.7 35.4 9.1 4.8 Female 5yrs 952 82.1 16.5 1.4 0.0
12yrs 997 56.5 34.6 6.2 2.7
15yrs 1001 54.3 32.1 8.8 4.8
35-44yrs 1022 44.3 38.6 11.2 6.0
65-74yrs 984 48.5 37.1 9.6 4.9 Sinhalese 5yrs 1394 82.5 16.6 0.9 0.0
12yrs 1399 56.3 35.9 6.0 1.8
15yrs 1400 55.6 35.3 6.9 2.2
35-44yrs 1320 52.9 36.6 8.0 2.5
65-74yrs 1295 53.0 34.9 8.5 3.6 Tamil 5yrs 302 76.2 21.2 2.6 0.0
12yrs 308 47.7 34.7 12.3 5.2
15yrs 302 45.0 33.8 12.9 8.3
35-44yrs 328 30.2 38.1 16.8 14.9
65-74yrs 329 43.5 34.0 13.4 9.1 Muslim 5yrs 297 83.5 15.5 1.0 0.0
12yrs 287 58.5 30.0 6.3 5.2
15yrs 300 52.3 30.0 9.7 8.0
35-44yrs 333 42.6 37.8 11.7 7.8
65-74yrs 331 42.9 43.2 8.5 5.4 Urban 5yrs 568 79.6 19.2 1.2 0.0
12yrs 568 54.9 35.6 6.0 3.5
15yrs 571 52.7 33.1 9.1 5.1
35-44yrs 553 44.3 39.6 9.6 6.5
65-74yrs 554 44.2 39.2 11.4 5.2 Rural 5yrs 1427 82.6 16.3 1.1 0.0
12yrs 1428 55.5 34.6 7.4 2.5
15yrs 1432 53.8 34.8 7.9 3.6
35-44yrs 1429 48.6 36.0 10.3 5.0
65-74yrs 1405 51.7 35.1 8.5 4.7
In general, the percentage of participants with gingival bleeding-on-probing increased with the age despite a small reduction observed in 65-74-year-olds. This pattern was similar in all sub-categories. Among sub-categories, gingival bleeding-on-probing was higher in females and Tamils compared to males and other two ethnic groups respectively.
Res
ult
s
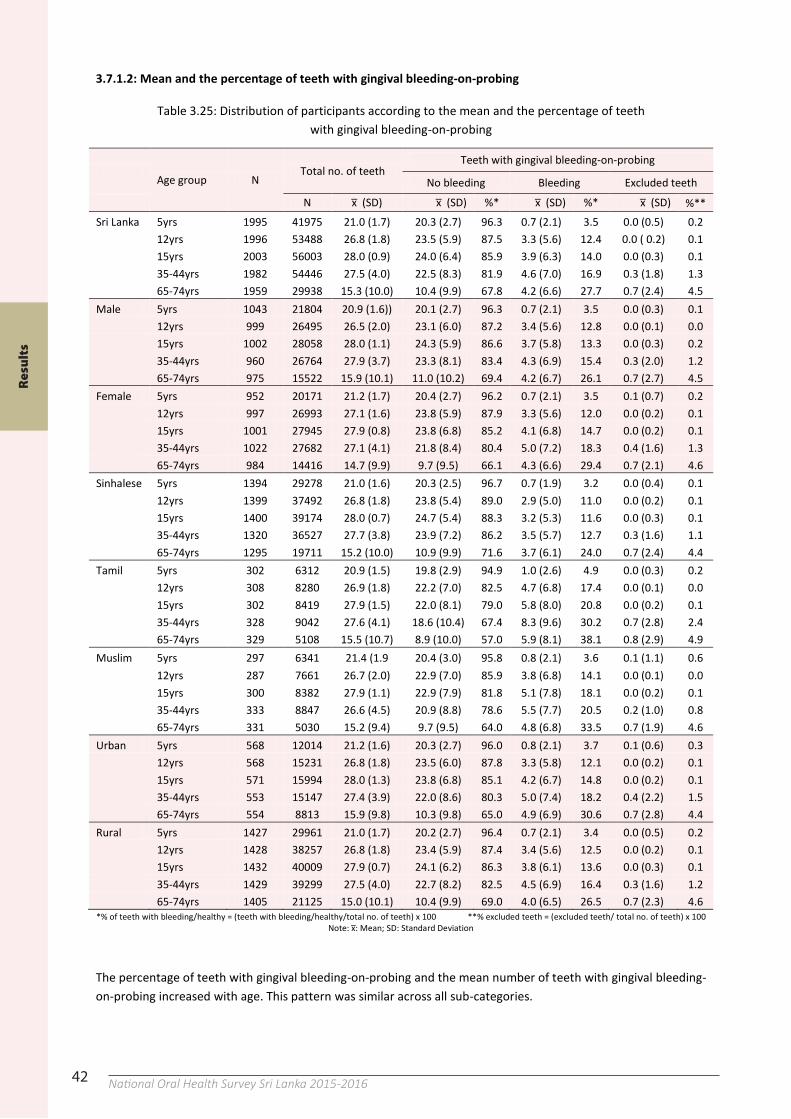
42 National Oral Health Survey Sri Lanka 2015-201642
3.7.1.2: Mean and the percentage of teeth with gingival bleeding-on-probing
Table 3.25: Distribution of participants according to the mean and the percentage of teeth with gingival bleeding-on-probing
Age group N
Total no. of teeth Teeth with gingival bleeding-on-probing
No bleeding Bleeding Excluded teeth
N x ̅ (SD) x ̅ (SD) %* x ̅ (SD) %* x ̅ (SD) %**
Sri Lanka 5yrs 1995 41975 21.0 (1.7) 20.3 (2.7) 96.3 0.7 (2.1) 3.5 0.0 (0.5) 0.2
12yrs 1996 53488 26.8 (1.8) 23.5 (5.9) 87.5 3.3 (5.6) 12.4 0.0 ( 0.2) 0.1
15yrs 2003 56003 28.0 (0.9) 24.0 (6.4) 85.9 3.9 (6.3) 14.0 0.0 (0.3) 0.1
35-44yrs 1982 54446 27.5 (4.0) 22.5 (8.3) 81.9 4.6 (7.0) 16.9 0.3 (1.8) 1.3
65-74yrs 1959 29938 15.3 (10.0) 10.4 (9.9) 67.8 4.2 (6.6) 27.7 0.7 (2.4) 4.5
Male 5yrs 1043 21804 20.9 (1.6)) 20.1 (2.7) 96.3 0.7 (2.1) 3.5 0.0 (0.3) 0.1
12yrs 999 26495 26.5 (2.0) 23.1 (6.0) 87.2 3.4 (5.6) 12.8 0.0 (0.1) 0.0
15yrs 1002 28058 28.0 (1.1) 24.3 (5.9) 86.6 3.7 (5.8) 13.3 0.0 (0.3) 0.2
35-44yrs 960 26764 27.9 (3.7) 23.3 (8.1) 83.4 4.3 (6.9) 15.4 0.3 (2.0) 1.2
65-74yrs 975 15522 15.9 (10.1) 11.0 (10.2) 69.4 4.2 (6.7) 26.1 0.7 (2.7) 4.5
Female 5yrs 952 20171 21.2 (1.7) 20.4 (2.7) 96.2 0.7 (2.1) 3.5 0.1 (0.7) 0.2
12yrs 997 26993 27.1 (1.6) 23.8 (5.9) 87.9 3.3 (5.6) 12.0 0.0 (0.2) 0.1
15yrs 1001 27945 27.9 (0.8) 23.8 (6.8) 85.2 4.1 (6.8) 14.7 0.0 (0.2) 0.1
35-44yrs 1022 27682 27.1 (4.1) 21.8 (8.4) 80.4 5.0 (7.2) 18.3 0.4 (1.6) 1.3
65-74yrs 984 14416 14.7 (9.9) 9.7 (9.5) 66.1 4.3 (6.6) 29.4 0.7 (2.1) 4.6
Sinhalese 5yrs 1394 29278 21.0 (1.6) 20.3 (2.5) 96.7 0.7 (1.9) 3.2 0.0 (0.4) 0.1
12yrs 1399 37492 26.8 (1.8) 23.8 (5.4) 89.0 2.9 (5.0) 11.0 0.0 (0.2) 0.1
15yrs 1400 39174 28.0 (0.7) 24.7 (5.4) 88.3 3.2 (5.3) 11.6 0.0 (0.3) 0.1
35-44yrs 1320 36527 27.7 (3.8) 23.9 (7.2) 86.2 3.5 (5.7) 12.7 0.3 (1.6) 1.1
65-74yrs 1295 19711 15.2 (10.0) 10.9 (9.9) 71.6 3.7 (6.1) 24.0 0.7 (2.4) 4.4
Tamil 5yrs 302 6312 20.9 (1.5) 19.8 (2.9) 94.9 1.0 (2.6) 4.9 0.0 (0.3) 0.2
12yrs 308 8280 26.9 (1.8) 22.2 (7.0) 82.5 4.7 (6.8) 17.4 0.0 (0.1) 0.0
15yrs 302 8419 27.9 (1.5) 22.0 (8.1) 79.0 5.8 (8.0) 20.8 0.0 (0.2) 0.1
35-44yrs 328 9042 27.6 (4.1) 18.6 (10.4) 67.4 8.3 (9.6) 30.2 0.7 (2.8) 2.4
65-74yrs 329 5108 15.5 (10.7) 8.9 (10.0) 57.0 5.9 (8.1) 38.1 0.8 (2.9) 4.9
Muslim 5yrs 297 6341 21.4 (1.9 20.4 (3.0) 95.8 0.8 (2.1) 3.6 0.1 (1.1) 0.6
12yrs 287 7661 26.7 (2.0) 22.9 (7.0) 85.9 3.8 (6.8) 14.1 0.0 (0.1) 0.0
15yrs 300 8382 27.9 (1.1) 22.9 (7.9) 81.8 5.1 (7.8) 18.1 0.0 (0.2) 0.1
35-44yrs 333 8847 26.6 (4.5) 20.9 (8.8) 78.6 5.5 (7.7) 20.5 0.2 (1.0) 0.8
65-74yrs 331 5030 15.2 (9.4) 9.7 (9.5) 64.0 4.8 (6.8) 33.5 0.7 (1.9) 4.6
Urban 5yrs 568 12014 21.2 (1.6) 20.3 (2.7) 96.0 0.8 (2.1) 3.7 0.1 (0.6) 0.3
12yrs 568 15231 26.8 (1.8) 23.5 (6.0) 87.8 3.3 (5.8) 12.1 0.0 (0.2) 0.1
15yrs 571 15994 28.0 (1.3) 23.8 (6.8) 85.1 4.2 (6.7) 14.8 0.0 (0.2) 0.1
35-44yrs 553 15147 27.4 (3.9) 22.0 (8.6) 80.3 5.0 (7.4) 18.2 0.4 (2.2) 1.5
65-74yrs 554 8813 15.9 (9.8) 10.3 (9.8) 65.0 4.9 (6.9) 30.6 0.7 (2.8) 4.4
Rural 5yrs 1427 29961 21.0 (1.7) 20.2 (2.7) 96.4 0.7 (2.1) 3.4 0.0 (0.5) 0.2
12yrs 1428 38257 26.8 (1.8) 23.4 (5.9) 87.4 3.4 (5.6) 12.5 0.0 (0.2) 0.1
15yrs 1432 40009 27.9 (0.7) 24.1 (6.2) 86.3 3.8 (6.1) 13.6 0.0 (0.3) 0.1
35-44yrs 1429 39299 27.5 (4.0) 22.7 (8.2) 82.5 4.5 (6.9) 16.4 0.3 (1.6) 1.2
65-74yrs 1405 21125 15.0 (10.1) 10.4 (9.9) 69.0 4.0 (6.5) 26.5 0.7 (2.3) 4.6
*% of teeth with bleeding/healthy = (teeth with bleeding/healthy/total no. of teeth) x 100 **% excluded teeth = (excluded teeth/ total no. of teeth) x 100 Note: x:̅ Mean; SD: Standard Deviation
The percentage of teeth with gingival bleeding-on-probing and the mean number of teeth with gingival bleeding-on-probing increased with age. This pattern was similar across all sub-categories.
Res
ult
s
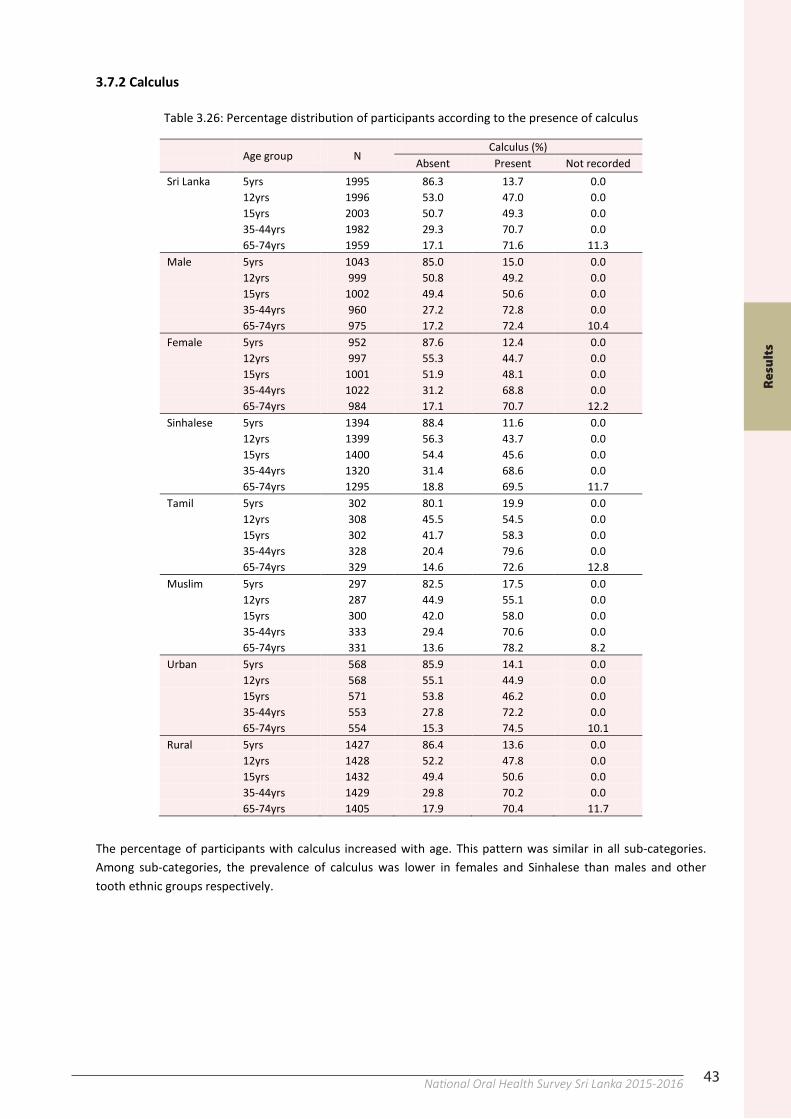
43National Oral Health Survey Sri Lanka 2015-201642
3.7.1.2: Mean and the percentage of teeth with gingival bleeding-on-probing
Table 3.25: Distribution of participants according to the mean and the percentage of teeth with gingival bleeding-on-probing
Age group N
Total no. of teeth Teeth with gingival bleeding-on-probing
No bleeding Bleeding Excluded teeth
N x ̅ (SD) x ̅ (SD) %* x ̅ (SD) %* x ̅ (SD) %**
Sri Lanka 5yrs 1995 41975 21.0 (1.7) 20.3 (2.7) 96.3 0.7 (2.1) 3.5 0.0 (0.5) 0.2
12yrs 1996 53488 26.8 (1.8) 23.5 (5.9) 87.5 3.3 (5.6) 12.4 0.0 ( 0.2) 0.1
15yrs 2003 56003 28.0 (0.9) 24.0 (6.4) 85.9 3.9 (6.3) 14.0 0.0 (0.3) 0.1
35-44yrs 1982 54446 27.5 (4.0) 22.5 (8.3) 81.9 4.6 (7.0) 16.9 0.3 (1.8) 1.3
65-74yrs 1959 29938 15.3 (10.0) 10.4 (9.9) 67.8 4.2 (6.6) 27.7 0.7 (2.4) 4.5
Male 5yrs 1043 21804 20.9 (1.6)) 20.1 (2.7) 96.3 0.7 (2.1) 3.5 0.0 (0.3) 0.1
12yrs 999 26495 26.5 (2.0) 23.1 (6.0) 87.2 3.4 (5.6) 12.8 0.0 (0.1) 0.0
15yrs 1002 28058 28.0 (1.1) 24.3 (5.9) 86.6 3.7 (5.8) 13.3 0.0 (0.3) 0.2
35-44yrs 960 26764 27.9 (3.7) 23.3 (8.1) 83.4 4.3 (6.9) 15.4 0.3 (2.0) 1.2
65-74yrs 975 15522 15.9 (10.1) 11.0 (10.2) 69.4 4.2 (6.7) 26.1 0.7 (2.7) 4.5
Female 5yrs 952 20171 21.2 (1.7) 20.4 (2.7) 96.2 0.7 (2.1) 3.5 0.1 (0.7) 0.2
12yrs 997 26993 27.1 (1.6) 23.8 (5.9) 87.9 3.3 (5.6) 12.0 0.0 (0.2) 0.1
15yrs 1001 27945 27.9 (0.8) 23.8 (6.8) 85.2 4.1 (6.8) 14.7 0.0 (0.2) 0.1
35-44yrs 1022 27682 27.1 (4.1) 21.8 (8.4) 80.4 5.0 (7.2) 18.3 0.4 (1.6) 1.3
65-74yrs 984 14416 14.7 (9.9) 9.7 (9.5) 66.1 4.3 (6.6) 29.4 0.7 (2.1) 4.6
Sinhalese 5yrs 1394 29278 21.0 (1.6) 20.3 (2.5) 96.7 0.7 (1.9) 3.2 0.0 (0.4) 0.1
12yrs 1399 37492 26.8 (1.8) 23.8 (5.4) 89.0 2.9 (5.0) 11.0 0.0 (0.2) 0.1
15yrs 1400 39174 28.0 (0.7) 24.7 (5.4) 88.3 3.2 (5.3) 11.6 0.0 (0.3) 0.1
35-44yrs 1320 36527 27.7 (3.8) 23.9 (7.2) 86.2 3.5 (5.7) 12.7 0.3 (1.6) 1.1
65-74yrs 1295 19711 15.2 (10.0) 10.9 (9.9) 71.6 3.7 (6.1) 24.0 0.7 (2.4) 4.4
Tamil 5yrs 302 6312 20.9 (1.5) 19.8 (2.9) 94.9 1.0 (2.6) 4.9 0.0 (0.3) 0.2
12yrs 308 8280 26.9 (1.8) 22.2 (7.0) 82.5 4.7 (6.8) 17.4 0.0 (0.1) 0.0
15yrs 302 8419 27.9 (1.5) 22.0 (8.1) 79.0 5.8 (8.0) 20.8 0.0 (0.2) 0.1
35-44yrs 328 9042 27.6 (4.1) 18.6 (10.4) 67.4 8.3 (9.6) 30.2 0.7 (2.8) 2.4
65-74yrs 329 5108 15.5 (10.7) 8.9 (10.0) 57.0 5.9 (8.1) 38.1 0.8 (2.9) 4.9
Muslim 5yrs 297 6341 21.4 (1.9 20.4 (3.0) 95.8 0.8 (2.1) 3.6 0.1 (1.1) 0.6
12yrs 287 7661 26.7 (2.0) 22.9 (7.0) 85.9 3.8 (6.8) 14.1 0.0 (0.1) 0.0
15yrs 300 8382 27.9 (1.1) 22.9 (7.9) 81.8 5.1 (7.8) 18.1 0.0 (0.2) 0.1
35-44yrs 333 8847 26.6 (4.5) 20.9 (8.8) 78.6 5.5 (7.7) 20.5 0.2 (1.0) 0.8
65-74yrs 331 5030 15.2 (9.4) 9.7 (9.5) 64.0 4.8 (6.8) 33.5 0.7 (1.9) 4.6
Urban 5yrs 568 12014 21.2 (1.6) 20.3 (2.7) 96.0 0.8 (2.1) 3.7 0.1 (0.6) 0.3
12yrs 568 15231 26.8 (1.8) 23.5 (6.0) 87.8 3.3 (5.8) 12.1 0.0 (0.2) 0.1
15yrs 571 15994 28.0 (1.3) 23.8 (6.8) 85.1 4.2 (6.7) 14.8 0.0 (0.2) 0.1
35-44yrs 553 15147 27.4 (3.9) 22.0 (8.6) 80.3 5.0 (7.4) 18.2 0.4 (2.2) 1.5
65-74yrs 554 8813 15.9 (9.8) 10.3 (9.8) 65.0 4.9 (6.9) 30.6 0.7 (2.8) 4.4
Rural 5yrs 1427 29961 21.0 (1.7) 20.2 (2.7) 96.4 0.7 (2.1) 3.4 0.0 (0.5) 0.2
12yrs 1428 38257 26.8 (1.8) 23.4 (5.9) 87.4 3.4 (5.6) 12.5 0.0 (0.2) 0.1
15yrs 1432 40009 27.9 (0.7) 24.1 (6.2) 86.3 3.8 (6.1) 13.6 0.0 (0.3) 0.1
35-44yrs 1429 39299 27.5 (4.0) 22.7 (8.2) 82.5 4.5 (6.9) 16.4 0.3 (1.6) 1.2
65-74yrs 1405 21125 15.0 (10.1) 10.4 (9.9) 69.0 4.0 (6.5) 26.5 0.7 (2.3) 4.6
*% of teeth with bleeding/healthy = (teeth with bleeding/healthy/total no. of teeth) x 100 **% excluded teeth = (excluded teeth/ total no. of teeth) x 100 Note: x:̅ Mean; SD: Standard Deviation
The percentage of teeth with gingival bleeding-on-probing and the mean number of teeth with gingival bleeding-on-probing increased with age. This pattern was similar across all sub-categories.
43
3.7.2 Calculus
Table 3.26: Percentage distribution of participants according to the presence of calculus
Age group N
Calculus (%) Absent Present Not recorded
Sri Lanka 5yrs 1995 86.3 13.7 0.0
12yrs 1996 53.0 47.0 0.0
15yrs 2003 50.7 49.3 0.0
35-44yrs 1982 29.3 70.7 0.0
65-74yrs 1959 17.1 71.6 11.3
Male 5yrs 1043 85.0 15.0 0.0
12yrs 999 50.8 49.2 0.0
15yrs 1002 49.4 50.6 0.0
35-44yrs 960 27.2 72.8 0.0
65-74yrs 975 17.2 72.4 10.4
Female 5yrs 952 87.6 12.4 0.0
12yrs 997 55.3 44.7 0.0
15yrs 1001 51.9 48.1 0.0
35-44yrs 1022 31.2 68.8 0.0
65-74yrs 984 17.1 70.7 12.2
Sinhalese 5yrs 1394 88.4 11.6 0.0
12yrs 1399 56.3 43.7 0.0
15yrs 1400 54.4 45.6 0.0
35-44yrs 1320 31.4 68.6 0.0
65-74yrs 1295 18.8 69.5 11.7
Tamil 5yrs 302 80.1 19.9 0.0
12yrs 308 45.5 54.5 0.0
15yrs 302 41.7 58.3 0.0
35-44yrs 328 20.4 79.6 0.0
65-74yrs 329 14.6 72.6 12.8
Muslim 5yrs 297 82.5 17.5 0.0
12yrs 287 44.9 55.1 0.0
15yrs 300 42.0 58.0 0.0
35-44yrs 333 29.4 70.6 0.0
65-74yrs 331 13.6 78.2 8.2
Urban 5yrs 568 85.9 14.1 0.0
12yrs 568 55.1 44.9 0.0
15yrs 571 53.8 46.2 0.0
35-44yrs 553 27.8 72.2 0.0
65-74yrs 554 15.3 74.5 10.1
Rural 5yrs 1427 86.4 13.6 0.0
12yrs 1428 52.2 47.8 0.0
15yrs 1432 49.4 50.6 0.0
35-44yrs 1429 29.8 70.2 0.0
65-74yrs 1405 17.9 70.4 11.7
The percentage of participants with calculus increased with age. This pattern was similar in all sub-categories. Among sub-categories, the prevalence of calculus was lower in females and Sinhalese than males and other tooth ethnic groups respectively.
Res
ult
s
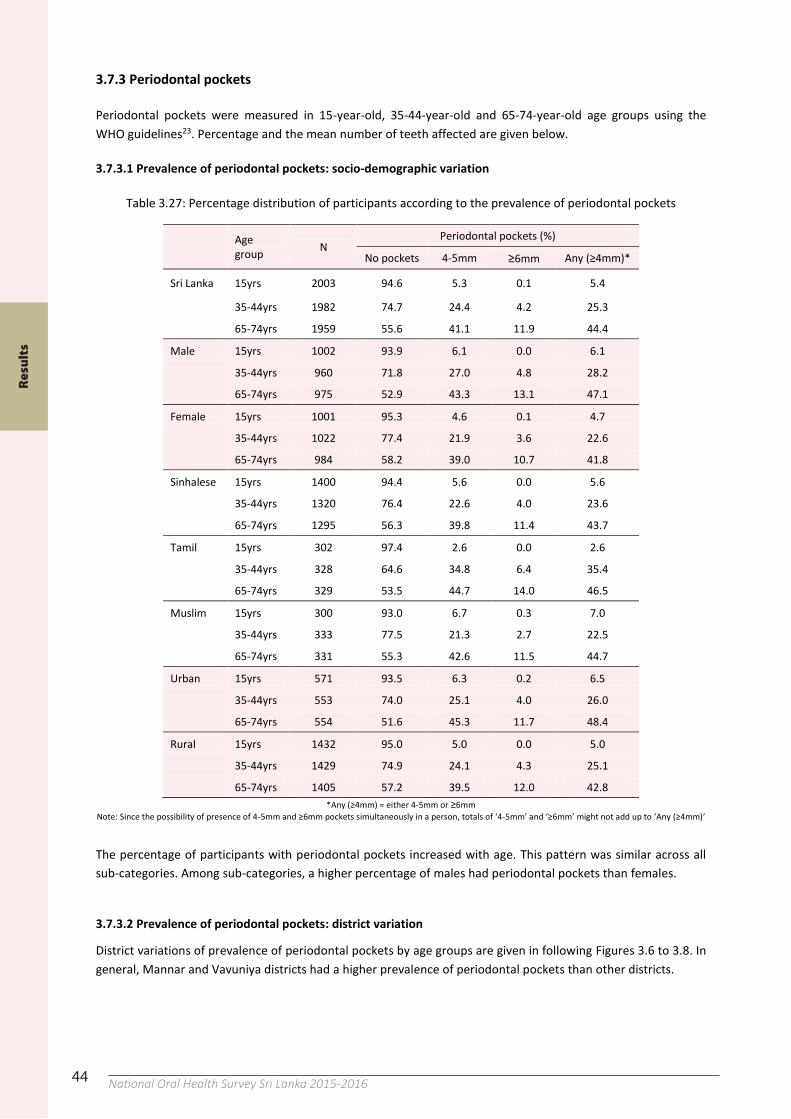
44 National Oral Health Survey Sri Lanka 2015-2016
Mull
ait ivu
Mull
ait ivu
Mull
ait ivu
Bat t ic
aloa
Bat t ic
aloa
Bat t ic
aloa
44
3.7.3 Periodontal pockets
Periodontal pockets were measured in 15-year-old, 35-44-year-old and 65-74-year-old age groups using the WHO guidelines23. Percentage and the mean number of teeth affected are given below.
3.7.3.1 Prevalence of periodontal pockets: socio-demographic variation
Table 3.27: Percentage distribution of participants according to the prevalence of periodontal pockets
Age group N
Periodontal pockets (%)
No pockets 4-5mm ≥6mm Any (≥4mm)*
Sri Lanka 15yrs 2003 94.6 5.3 0.1 5.4
35-44yrs 1982 74.7 24.4 4.2 25.3
65-74yrs 1959 55.6 41.1 11.9 44.4
Male 15yrs 1002 93.9 6.1 0.0 6.1
35-44yrs 960 71.8 27.0 4.8 28.2
65-74yrs 975 52.9 43.3 13.1 47.1
Female 15yrs 1001 95.3 4.6 0.1 4.7
35-44yrs 1022 77.4 21.9 3.6 22.6
65-74yrs 984 58.2 39.0 10.7 41.8
Sinhalese 15yrs 1400 94.4 5.6 0.0 5.6
35-44yrs 1320 76.4 22.6 4.0 23.6
65-74yrs 1295 56.3 39.8 11.4 43.7
Tamil 15yrs 302 97.4 2.6 0.0 2.6
35-44yrs 328 64.6 34.8 6.4 35.4
65-74yrs 329 53.5 44.7 14.0 46.5
Muslim 15yrs 300 93.0 6.7 0.3 7.0
35-44yrs 333 77.5 21.3 2.7 22.5
65-74yrs 331 55.3 42.6 11.5 44.7
Urban 15yrs 571 93.5 6.3 0.2 6.5
35-44yrs 553 74.0 25.1 4.0 26.0
65-74yrs 554 51.6 45.3 11.7 48.4
Rural 15yrs 1432 95.0 5.0 0.0 5.0
35-44yrs 1429 74.9 24.1 4.3 25.1
65-74yrs 1405 57.2 39.5 12.0 42.8
*Any (≥4mm) = either 4-5mm or ≥6mm Note: Since the possibility of presence of 4-5mm and ≥6mm pockets simultaneously in a person, totals of ‘4-5mm’ and ‘≥6mm’ might not add up to ‘Any (≥4mm)’
The percentage of participants with periodontal pockets increased with age. This pattern was similar across all sub-categories. Among sub-categories, a higher percentage of males had periodontal pockets than females.
3.7.3.2 Prevalence of periodontal pockets: district variation
District variations of prevalence of periodontal pockets by age groups are given in following Figures 3.6 to 3.8. In general, Mannar and Vavuniya districts had a higher prevalence of periodontal pockets than other districts.
Res
ult
s
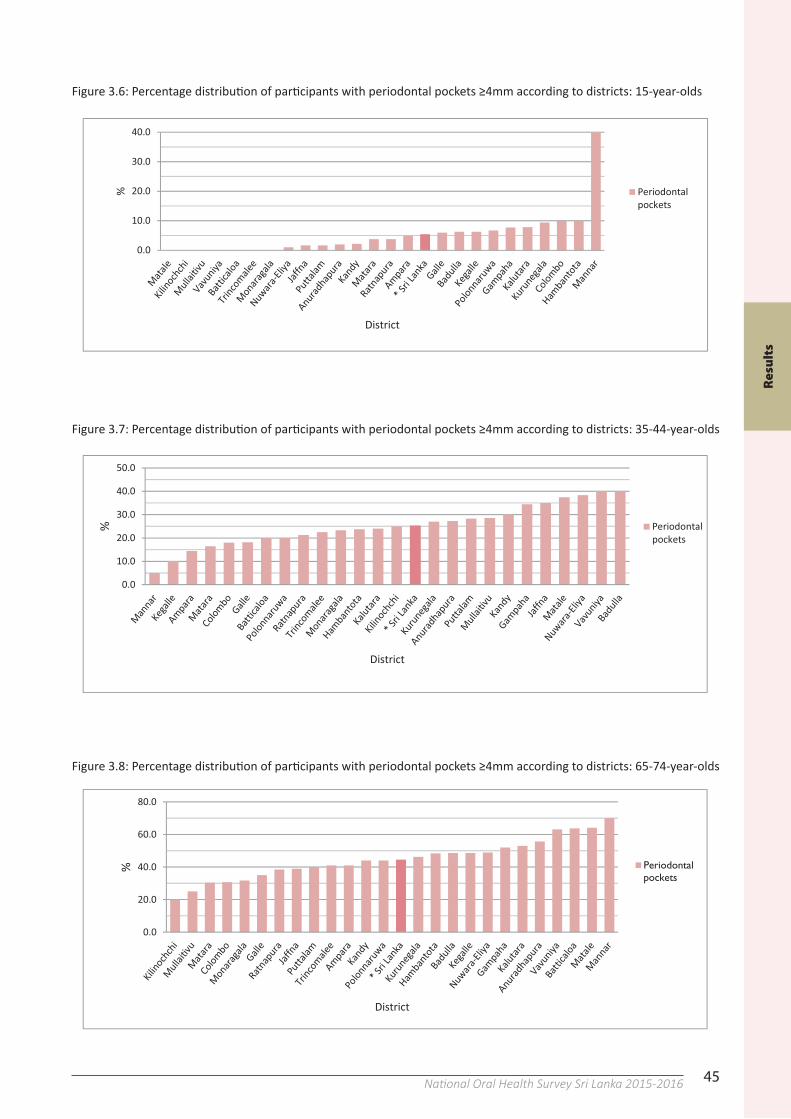
45National Oral Health Survey Sri Lanka 2015-2016
Mull
ait ivu
Mull
ait ivu
Mull
ait ivu
Bat t ic
aloa
Bat t ic
aloa
Bat t ic
aloa
44
3.7.3 Periodontal pockets
Periodontal pockets were measured in 15-year-old, 35-44-year-old and 65-74-year-old age groups using the WHO guidelines23. Percentage and the mean number of teeth affected are given below.
3.7.3.1 Prevalence of periodontal pockets: socio-demographic variation
Table 3.27: Percentage distribution of participants according to the prevalence of periodontal pockets
Age group N
Periodontal pockets (%)
No pockets 4-5mm ≥6mm Any (≥4mm)*
Sri Lanka 15yrs 2003 94.6 5.3 0.1 5.4
35-44yrs 1982 74.7 24.4 4.2 25.3
65-74yrs 1959 55.6 41.1 11.9 44.4
Male 15yrs 1002 93.9 6.1 0.0 6.1
35-44yrs 960 71.8 27.0 4.8 28.2
65-74yrs 975 52.9 43.3 13.1 47.1
Female 15yrs 1001 95.3 4.6 0.1 4.7
35-44yrs 1022 77.4 21.9 3.6 22.6
65-74yrs 984 58.2 39.0 10.7 41.8
Sinhalese 15yrs 1400 94.4 5.6 0.0 5.6
35-44yrs 1320 76.4 22.6 4.0 23.6
65-74yrs 1295 56.3 39.8 11.4 43.7
Tamil 15yrs 302 97.4 2.6 0.0 2.6
35-44yrs 328 64.6 34.8 6.4 35.4
65-74yrs 329 53.5 44.7 14.0 46.5
Muslim 15yrs 300 93.0 6.7 0.3 7.0
35-44yrs 333 77.5 21.3 2.7 22.5
65-74yrs 331 55.3 42.6 11.5 44.7
Urban 15yrs 571 93.5 6.3 0.2 6.5
35-44yrs 553 74.0 25.1 4.0 26.0
65-74yrs 554 51.6 45.3 11.7 48.4
Rural 15yrs 1432 95.0 5.0 0.0 5.0
35-44yrs 1429 74.9 24.1 4.3 25.1
65-74yrs 1405 57.2 39.5 12.0 42.8
*Any (≥4mm) = either 4-5mm or ≥6mm Note: Since the possibility of presence of 4-5mm and ≥6mm pockets simultaneously in a person, totals of ‘4-5mm’ and ‘≥6mm’ might not add up to ‘Any (≥4mm)’
The percentage of participants with periodontal pockets increased with age. This pattern was similar across all sub-categories. Among sub-categories, a higher percentage of males had periodontal pockets than females.
3.7.3.2 Prevalence of periodontal pockets: district variation
District variations of prevalence of periodontal pockets by age groups are given in following Figures 3.6 to 3.8. In general, Mannar and Vavuniya districts had a higher prevalence of periodontal pockets than other districts.
Figure 3.6: Percentage distribution of participants with periodontal pockets ≥4mm according to districts: 15-year-olds
Figure 3.7: Percentage distribution of participants with periodontal pockets ≥4mm according to districts: 35-44-year-olds
Figure 3.8: Percentage distribution of participants with periodontal pockets ≥4mm according to districts: 65-74-year-oldsR
esu
lts
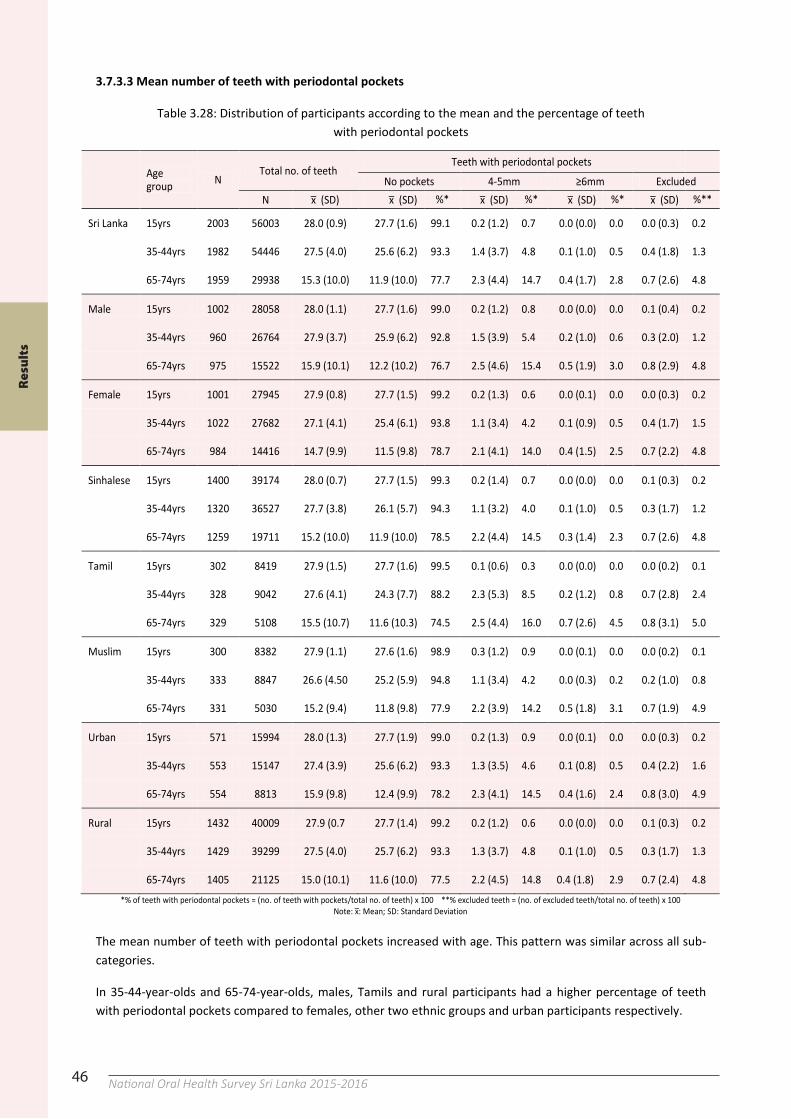
46 National Oral Health Survey Sri Lanka 2015-201646
3.7.3.3 Mean number of teeth with periodontal pockets
Table 3.28: Distribution of participants according to the mean and the percentage of teeth with periodontal pockets
Age group N
Total no. of teeth Teeth with periodontal pockets
No pockets 4-5mm ≥6mm Excluded
N x ̅ (SD) x ̅ (SD) %* x ̅ (SD) %* x ̅ (SD) %* x ̅ (SD) %**
Sri Lanka 15yrs 2003 56003 28.0 (0.9) 27.7 (1.6) 99.1 0.2 (1.2) 0.7 0.0 (0.0) 0.0 0.0 (0.3) 0.2
35-44yrs 1982 54446 27.5 (4.0) 25.6 (6.2) 93.3 1.4 (3.7) 4.8 0.1 (1.0) 0.5 0.4 (1.8) 1.3
65-74yrs 1959 29938 15.3 (10.0) 11.9 (10.0) 77.7 2.3 (4.4) 14.7 0.4 (1.7) 2.8 0.7 (2.6) 4.8
Male 15yrs 1002 28058 28.0 (1.1) 27.7 (1.6) 99.0 0.2 (1.2) 0.8 0.0 (0.0) 0.0 0.1 (0.4) 0.2
35-44yrs 960 26764 27.9 (3.7) 25.9 (6.2) 92.8 1.5 (3.9) 5.4 0.2 (1.0) 0.6 0.3 (2.0) 1.2
65-74yrs 975 15522 15.9 (10.1) 12.2 (10.2) 76.7 2.5 (4.6) 15.4 0.5 (1.9) 3.0 0.8 (2.9) 4.8
Female 15yrs 1001 27945 27.9 (0.8) 27.7 (1.5) 99.2 0.2 (1.3) 0.6 0.0 (0.1) 0.0 0.0 (0.3) 0.2
35-44yrs 1022 27682 27.1 (4.1) 25.4 (6.1) 93.8 1.1 (3.4) 4.2 0.1 (0.9) 0.5 0.4 (1.7) 1.5
65-74yrs 984 14416 14.7 (9.9) 11.5 (9.8) 78.7 2.1 (4.1) 14.0 0.4 (1.5) 2.5 0.7 (2.2) 4.8
Sinhalese 15yrs 1400 39174 28.0 (0.7) 27.7 (1.5) 99.3 0.2 (1.4) 0.7 0.0 (0.0) 0.0 0.1 (0.3) 0.2
35-44yrs 1320 36527 27.7 (3.8) 26.1 (5.7) 94.3 1.1 (3.2) 4.0 0.1 (1.0) 0.5 0.3 (1.7) 1.2
65-74yrs 1259 19711 15.2 (10.0) 11.9 (10.0) 78.5 2.2 (4.4) 14.5 0.3 (1.4) 2.3 0.7 (2.6) 4.8
Tamil 15yrs 302 8419 27.9 (1.5) 27.7 (1.6) 99.5 0.1 (0.6) 0.3 0.0 (0.0) 0.0 0.0 (0.2) 0.1
35-44yrs 328 9042 27.6 (4.1) 24.3 (7.7) 88.2 2.3 (5.3) 8.5 0.2 (1.2) 0.8 0.7 (2.8) 2.4
65-74yrs 329 5108 15.5 (10.7) 11.6 (10.3) 74.5 2.5 (4.4) 16.0 0.7 (2.6) 4.5 0.8 (3.1) 5.0
Muslim 15yrs 300 8382 27.9 (1.1) 27.6 (1.6) 98.9 0.3 (1.2) 0.9 0.0 (0.1) 0.0 0.0 (0.2) 0.1
35-44yrs 333 8847 26.6 (4.50 25.2 (5.9) 94.8 1.1 (3.4) 4.2 0.0 (0.3) 0.2 0.2 (1.0) 0.8
65-74yrs 331 5030 15.2 (9.4) 11.8 (9.8) 77.9 2.2 (3.9) 14.2 0.5 (1.8) 3.1 0.7 (1.9) 4.9
Urban 15yrs 571 15994 28.0 (1.3) 27.7 (1.9) 99.0 0.2 (1.3) 0.9 0.0 (0.1) 0.0 0.0 (0.3) 0.2
35-44yrs 553 15147 27.4 (3.9) 25.6 (6.2) 93.3 1.3 (3.5) 4.6 0.1 (0.8) 0.5 0.4 (2.2) 1.6
65-74yrs 554 8813 15.9 (9.8) 12.4 (9.9) 78.2 2.3 (4.1) 14.5 0.4 (1.6) 2.4 0.8 (3.0) 4.9
Rural 15yrs 1432 40009 27.9 (0.7 27.7 (1.4) 99.2 0.2 (1.2) 0.6 0.0 (0.0) 0.0 0.1 (0.3) 0.2
35-44yrs 1429 39299 27.5 (4.0) 25.7 (6.2) 93.3 1.3 (3.7) 4.8 0.1 (1.0) 0.5 0.3 (1.7) 1.3
65-74yrs 1405 21125 15.0 (10.1) 11.6 (10.0) 77.5 2.2 (4.5) 14.8 0.4 (1.8) 2.9 0.7 (2.4) 4.8 *% of teeth with periodontal pockets = (no. of teeth with pockets/total no. of teeth) x 100 **% excluded teeth = (no. of excluded teeth/total no. of teeth) x 100
Note: x:̅ Mean; SD: Standard Deviation
The mean number of teeth with periodontal pockets increased with age. This pattern was similar across all sub-categories.
In 35-44-year-olds and 65-74-year-olds, males, Tamils and rural participants had a higher percentage of teeth with periodontal pockets compared to females, other two ethnic groups and urban participants respectively.
46
3.7.3.3 Mean number of teeth with periodontal pockets
Table 3.28: Distribution of participants according to the mean and the percentage of teeth with periodontal pockets
Age group N
Total no. of teeth Teeth with periodontal pockets
No pockets 4-5mm ≥6mm Excluded
N x ̅ (SD) x ̅ (SD) %* x ̅ (SD) %* x ̅ (SD) %* x ̅ (SD) %**
Sri Lanka 15yrs 2003 56003 28.0 (0.9) 27.7 (1.6) 99.1 0.2 (1.2) 0.7 0.0 (0.0) 0.0 0.0 (0.3) 0.2
35-44yrs 1982 54446 27.5 (4.0) 25.6 (6.2) 93.3 1.4 (3.7) 4.8 0.1 (1.0) 0.5 0.4 (1.8) 1.3
65-74yrs 1959 29938 15.3 (10.0) 11.9 (10.0) 77.7 2.3 (4.4) 14.7 0.4 (1.7) 2.8 0.7 (2.6) 4.8
Male 15yrs 1002 28058 28.0 (1.1) 27.7 (1.6) 99.0 0.2 (1.2) 0.8 0.0 (0.0) 0.0 0.1 (0.4) 0.2
35-44yrs 960 26764 27.9 (3.7) 25.9 (6.2) 92.8 1.5 (3.9) 5.4 0.2 (1.0) 0.6 0.3 (2.0) 1.2
65-74yrs 975 15522 15.9 (10.1) 12.2 (10.2) 76.7 2.5 (4.6) 15.4 0.5 (1.9) 3.0 0.8 (2.9) 4.8
Female 15yrs 1001 27945 27.9 (0.8) 27.7 (1.5) 99.2 0.2 (1.3) 0.6 0.0 (0.1) 0.0 0.0 (0.3) 0.2
35-44yrs 1022 27682 27.1 (4.1) 25.4 (6.1) 93.8 1.1 (3.4) 4.2 0.1 (0.9) 0.5 0.4 (1.7) 1.5
65-74yrs 984 14416 14.7 (9.9) 11.5 (9.8) 78.7 2.1 (4.1) 14.0 0.4 (1.5) 2.5 0.7 (2.2) 4.8
Sinhalese 15yrs 1400 39174 28.0 (0.7) 27.7 (1.5) 99.3 0.2 (1.4) 0.7 0.0 (0.0) 0.0 0.1 (0.3) 0.2
35-44yrs 1320 36527 27.7 (3.8) 26.1 (5.7) 94.3 1.1 (3.2) 4.0 0.1 (1.0) 0.5 0.3 (1.7) 1.2
65-74yrs 1259 19711 15.2 (10.0) 11.9 (10.0) 78.5 2.2 (4.4) 14.5 0.3 (1.4) 2.3 0.7 (2.6) 4.8
Tamil 15yrs 302 8419 27.9 (1.5) 27.7 (1.6) 99.5 0.1 (0.6) 0.3 0.0 (0.0) 0.0 0.0 (0.2) 0.1
35-44yrs 328 9042 27.6 (4.1) 24.3 (7.7) 88.2 2.3 (5.3) 8.5 0.2 (1.2) 0.8 0.7 (2.8) 2.4
65-74yrs 329 5108 15.5 (10.7) 11.6 (10.3) 74.5 2.5 (4.4) 16.0 0.7 (2.6) 4.5 0.8 (3.1) 5.0
Muslim 15yrs 300 8382 27.9 (1.1) 27.6 (1.6) 98.9 0.3 (1.2) 0.9 0.0 (0.1) 0.0 0.0 (0.2) 0.1
35-44yrs 333 8847 26.6 (4.50 25.2 (5.9) 94.8 1.1 (3.4) 4.2 0.0 (0.3) 0.2 0.2 (1.0) 0.8
65-74yrs 331 5030 15.2 (9.4) 11.8 (9.8) 77.9 2.2 (3.9) 14.2 0.5 (1.8) 3.1 0.7 (1.9) 4.9
Urban 15yrs 571 15994 28.0 (1.3) 27.7 (1.9) 99.0 0.2 (1.3) 0.9 0.0 (0.1) 0.0 0.0 (0.3) 0.2
35-44yrs 553 15147 27.4 (3.9) 25.6 (6.2) 93.3 1.3 (3.5) 4.6 0.1 (0.8) 0.5 0.4 (2.2) 1.6
65-74yrs 554 8813 15.9 (9.8) 12.4 (9.9) 78.2 2.3 (4.1) 14.5 0.4 (1.6) 2.4 0.8 (3.0) 4.9
Rural 15yrs 1432 40009 27.9 (0.7 27.7 (1.4) 99.2 0.2 (1.2) 0.6 0.0 (0.0) 0.0 0.1 (0.3) 0.2
35-44yrs 1429 39299 27.5 (4.0) 25.7 (6.2) 93.3 1.3 (3.7) 4.8 0.1 (1.0) 0.5 0.3 (1.7) 1.3
65-74yrs 1405 21125 15.0 (10.1) 11.6 (10.0) 77.5 2.2 (4.5) 14.8 0.4 (1.8) 2.9 0.7 (2.4) 4.8 *% of teeth with periodontal pockets = (no. of teeth with pockets/total no. of teeth) x 100 **% excluded teeth = (no. of excluded teeth/total no. of teeth) x 100
Note: x:̅ Mean; SD: Standard Deviation
The mean number of teeth with periodontal pockets increased with age. This pattern was similar across all sub-categories.
In 35-44-year-olds and 65-74-year-olds, males, Tamils and rural participants had a higher percentage of teeth with periodontal pockets compared to females, other two ethnic groups and urban participants respectively.
Res
ult
s
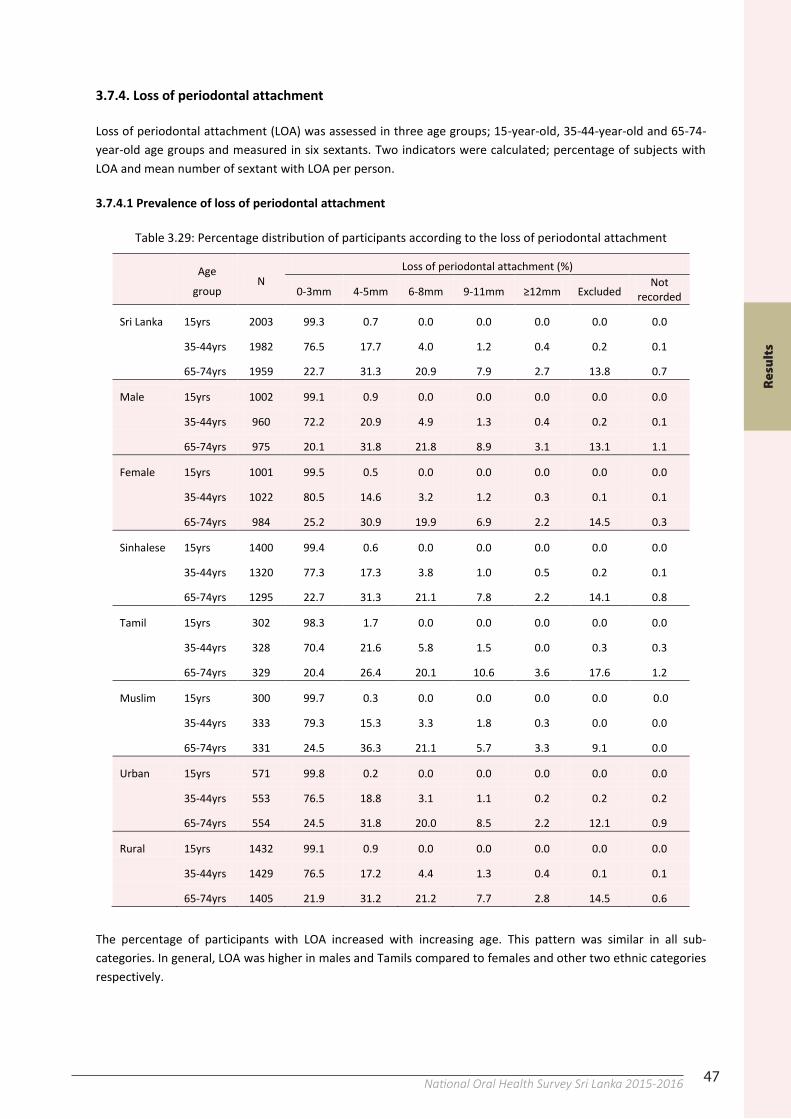
47National Oral Health Survey Sri Lanka 2015-201646
3.7.3.3 Mean number of teeth with periodontal pockets
Table 3.28: Distribution of participants according to the mean and the percentage of teeth with periodontal pockets
Age group N
Total no. of teeth Teeth with periodontal pockets
No pockets 4-5mm ≥6mm Excluded
N x ̅ (SD) x ̅ (SD) %* x ̅ (SD) %* x ̅ (SD) %* x ̅ (SD) %**
Sri Lanka 15yrs 2003 56003 28.0 (0.9) 27.7 (1.6) 99.1 0.2 (1.2) 0.7 0.0 (0.0) 0.0 0.0 (0.3) 0.2
35-44yrs 1982 54446 27.5 (4.0) 25.6 (6.2) 93.3 1.4 (3.7) 4.8 0.1 (1.0) 0.5 0.4 (1.8) 1.3
65-74yrs 1959 29938 15.3 (10.0) 11.9 (10.0) 77.7 2.3 (4.4) 14.7 0.4 (1.7) 2.8 0.7 (2.6) 4.8
Male 15yrs 1002 28058 28.0 (1.1) 27.7 (1.6) 99.0 0.2 (1.2) 0.8 0.0 (0.0) 0.0 0.1 (0.4) 0.2
35-44yrs 960 26764 27.9 (3.7) 25.9 (6.2) 92.8 1.5 (3.9) 5.4 0.2 (1.0) 0.6 0.3 (2.0) 1.2
65-74yrs 975 15522 15.9 (10.1) 12.2 (10.2) 76.7 2.5 (4.6) 15.4 0.5 (1.9) 3.0 0.8 (2.9) 4.8
Female 15yrs 1001 27945 27.9 (0.8) 27.7 (1.5) 99.2 0.2 (1.3) 0.6 0.0 (0.1) 0.0 0.0 (0.3) 0.2
35-44yrs 1022 27682 27.1 (4.1) 25.4 (6.1) 93.8 1.1 (3.4) 4.2 0.1 (0.9) 0.5 0.4 (1.7) 1.5
65-74yrs 984 14416 14.7 (9.9) 11.5 (9.8) 78.7 2.1 (4.1) 14.0 0.4 (1.5) 2.5 0.7 (2.2) 4.8
Sinhalese 15yrs 1400 39174 28.0 (0.7) 27.7 (1.5) 99.3 0.2 (1.4) 0.7 0.0 (0.0) 0.0 0.1 (0.3) 0.2
35-44yrs 1320 36527 27.7 (3.8) 26.1 (5.7) 94.3 1.1 (3.2) 4.0 0.1 (1.0) 0.5 0.3 (1.7) 1.2
65-74yrs 1259 19711 15.2 (10.0) 11.9 (10.0) 78.5 2.2 (4.4) 14.5 0.3 (1.4) 2.3 0.7 (2.6) 4.8
Tamil 15yrs 302 8419 27.9 (1.5) 27.7 (1.6) 99.5 0.1 (0.6) 0.3 0.0 (0.0) 0.0 0.0 (0.2) 0.1
35-44yrs 328 9042 27.6 (4.1) 24.3 (7.7) 88.2 2.3 (5.3) 8.5 0.2 (1.2) 0.8 0.7 (2.8) 2.4
65-74yrs 329 5108 15.5 (10.7) 11.6 (10.3) 74.5 2.5 (4.4) 16.0 0.7 (2.6) 4.5 0.8 (3.1) 5.0
Muslim 15yrs 300 8382 27.9 (1.1) 27.6 (1.6) 98.9 0.3 (1.2) 0.9 0.0 (0.1) 0.0 0.0 (0.2) 0.1
35-44yrs 333 8847 26.6 (4.50 25.2 (5.9) 94.8 1.1 (3.4) 4.2 0.0 (0.3) 0.2 0.2 (1.0) 0.8
65-74yrs 331 5030 15.2 (9.4) 11.8 (9.8) 77.9 2.2 (3.9) 14.2 0.5 (1.8) 3.1 0.7 (1.9) 4.9
Urban 15yrs 571 15994 28.0 (1.3) 27.7 (1.9) 99.0 0.2 (1.3) 0.9 0.0 (0.1) 0.0 0.0 (0.3) 0.2
35-44yrs 553 15147 27.4 (3.9) 25.6 (6.2) 93.3 1.3 (3.5) 4.6 0.1 (0.8) 0.5 0.4 (2.2) 1.6
65-74yrs 554 8813 15.9 (9.8) 12.4 (9.9) 78.2 2.3 (4.1) 14.5 0.4 (1.6) 2.4 0.8 (3.0) 4.9
Rural 15yrs 1432 40009 27.9 (0.7 27.7 (1.4) 99.2 0.2 (1.2) 0.6 0.0 (0.0) 0.0 0.1 (0.3) 0.2
35-44yrs 1429 39299 27.5 (4.0) 25.7 (6.2) 93.3 1.3 (3.7) 4.8 0.1 (1.0) 0.5 0.3 (1.7) 1.3
65-74yrs 1405 21125 15.0 (10.1) 11.6 (10.0) 77.5 2.2 (4.5) 14.8 0.4 (1.8) 2.9 0.7 (2.4) 4.8 *% of teeth with periodontal pockets = (no. of teeth with pockets/total no. of teeth) x 100 **% excluded teeth = (no. of excluded teeth/total no. of teeth) x 100
Note: x:̅ Mean; SD: Standard Deviation
The mean number of teeth with periodontal pockets increased with age. This pattern was similar across all sub-categories.
In 35-44-year-olds and 65-74-year-olds, males, Tamils and rural participants had a higher percentage of teeth with periodontal pockets compared to females, other two ethnic groups and urban participants respectively.
47
3.7.4. Loss of periodontal attachment
Loss of periodontal attachment (LOA) was assessed in three age groups; 15-year-old, 35-44-year-old and 65-74-year-old age groups and measured in six sextants. Two indicators were calculated; percentage of subjects with LOA and mean number of sextant with LOA per person.
3.7.4.1 Prevalence of loss of periodontal attachment
Table 3.29: Percentage distribution of participants according to the loss of periodontal attachment
Age
group N
Loss of periodontal attachment (%)
0-3mm 4-5mm 6-8mm 9-11mm ≥12mm Excluded Not
recorded
Sri Lanka 15yrs 2003 99.3 0.7 0.0 0.0 0.0 0.0 0.0
35-44yrs 1982 76.5 17.7 4.0 1.2 0.4 0.2 0.1
65-74yrs 1959 22.7 31.3 20.9 7.9 2.7 13.8 0.7
Male 15yrs 1002 99.1 0.9 0.0 0.0 0.0 0.0 0.0
35-44yrs 960 72.2 20.9 4.9 1.3 0.4 0.2 0.1
65-74yrs 975 20.1 31.8 21.8 8.9 3.1 13.1 1.1
Female 15yrs 1001 99.5 0.5 0.0 0.0 0.0 0.0 0.0
35-44yrs 1022 80.5 14.6 3.2 1.2 0.3 0.1 0.1
65-74yrs 984 25.2 30.9 19.9 6.9 2.2 14.5 0.3
Sinhalese 15yrs 1400 99.4 0.6 0.0 0.0 0.0 0.0 0.0
35-44yrs 1320 77.3 17.3 3.8 1.0 0.5 0.2 0.1
65-74yrs 1295 22.7 31.3 21.1 7.8 2.2 14.1 0.8
Tamil 15yrs 302 98.3 1.7 0.0 0.0 0.0 0.0 0.0
35-44yrs 328 70.4 21.6 5.8 1.5 0.0 0.3 0.3
65-74yrs 329 20.4 26.4 20.1 10.6 3.6 17.6 1.2
Muslim 15yrs 300 99.7 0.3 0.0 0.0 0.0 0.0 0.0
35-44yrs 333 79.3 15.3 3.3 1.8 0.3 0.0 0.0
65-74yrs 331 24.5 36.3 21.1 5.7 3.3 9.1 0.0
Urban 15yrs 571 99.8 0.2 0.0 0.0 0.0 0.0 0.0
35-44yrs 553 76.5 18.8 3.1 1.1 0.2 0.2 0.2
65-74yrs 554 24.5 31.8 20.0 8.5 2.2 12.1 0.9
Rural 15yrs 1432 99.1 0.9 0.0 0.0 0.0 0.0 0.0
35-44yrs 1429 76.5 17.2 4.4 1.3 0.4 0.1 0.1
65-74yrs 1405 21.9 31.2 21.2 7.7 2.8 14.5 0.6
The percentage of participants with LOA increased with increasing age. This pattern was similar in all sub-categories. In general, LOA was higher in males and Tamils compared to females and other two ethnic categories respectively.
46
3.7.3.3 Mean number of teeth with periodontal pockets
Table 3.28: Distribution of participants according to the mean and the percentage of teeth with periodontal pockets
Age group N
Total no. of teeth Teeth with periodontal pockets
No pockets 4-5mm ≥6mm Excluded
N x ̅ (SD) x ̅ (SD) %* x ̅ (SD) %* x ̅ (SD) %* x ̅ (SD) %**
Sri Lanka 15yrs 2003 56003 28.0 (0.9) 27.7 (1.6) 99.1 0.2 (1.2) 0.7 0.0 (0.0) 0.0 0.0 (0.3) 0.2
35-44yrs 1982 54446 27.5 (4.0) 25.6 (6.2) 93.3 1.4 (3.7) 4.8 0.1 (1.0) 0.5 0.4 (1.8) 1.3
65-74yrs 1959 29938 15.3 (10.0) 11.9 (10.0) 77.7 2.3 (4.4) 14.7 0.4 (1.7) 2.8 0.7 (2.6) 4.8
Male 15yrs 1002 28058 28.0 (1.1) 27.7 (1.6) 99.0 0.2 (1.2) 0.8 0.0 (0.0) 0.0 0.1 (0.4) 0.2
35-44yrs 960 26764 27.9 (3.7) 25.9 (6.2) 92.8 1.5 (3.9) 5.4 0.2 (1.0) 0.6 0.3 (2.0) 1.2
65-74yrs 975 15522 15.9 (10.1) 12.2 (10.2) 76.7 2.5 (4.6) 15.4 0.5 (1.9) 3.0 0.8 (2.9) 4.8
Female 15yrs 1001 27945 27.9 (0.8) 27.7 (1.5) 99.2 0.2 (1.3) 0.6 0.0 (0.1) 0.0 0.0 (0.3) 0.2
35-44yrs 1022 27682 27.1 (4.1) 25.4 (6.1) 93.8 1.1 (3.4) 4.2 0.1 (0.9) 0.5 0.4 (1.7) 1.5
65-74yrs 984 14416 14.7 (9.9) 11.5 (9.8) 78.7 2.1 (4.1) 14.0 0.4 (1.5) 2.5 0.7 (2.2) 4.8
Sinhalese 15yrs 1400 39174 28.0 (0.7) 27.7 (1.5) 99.3 0.2 (1.4) 0.7 0.0 (0.0) 0.0 0.1 (0.3) 0.2
35-44yrs 1320 36527 27.7 (3.8) 26.1 (5.7) 94.3 1.1 (3.2) 4.0 0.1 (1.0) 0.5 0.3 (1.7) 1.2
65-74yrs 1259 19711 15.2 (10.0) 11.9 (10.0) 78.5 2.2 (4.4) 14.5 0.3 (1.4) 2.3 0.7 (2.6) 4.8
Tamil 15yrs 302 8419 27.9 (1.5) 27.7 (1.6) 99.5 0.1 (0.6) 0.3 0.0 (0.0) 0.0 0.0 (0.2) 0.1
35-44yrs 328 9042 27.6 (4.1) 24.3 (7.7) 88.2 2.3 (5.3) 8.5 0.2 (1.2) 0.8 0.7 (2.8) 2.4
65-74yrs 329 5108 15.5 (10.7) 11.6 (10.3) 74.5 2.5 (4.4) 16.0 0.7 (2.6) 4.5 0.8 (3.1) 5.0
Muslim 15yrs 300 8382 27.9 (1.1) 27.6 (1.6) 98.9 0.3 (1.2) 0.9 0.0 (0.1) 0.0 0.0 (0.2) 0.1
35-44yrs 333 8847 26.6 (4.50 25.2 (5.9) 94.8 1.1 (3.4) 4.2 0.0 (0.3) 0.2 0.2 (1.0) 0.8
65-74yrs 331 5030 15.2 (9.4) 11.8 (9.8) 77.9 2.2 (3.9) 14.2 0.5 (1.8) 3.1 0.7 (1.9) 4.9
Urban 15yrs 571 15994 28.0 (1.3) 27.7 (1.9) 99.0 0.2 (1.3) 0.9 0.0 (0.1) 0.0 0.0 (0.3) 0.2
35-44yrs 553 15147 27.4 (3.9) 25.6 (6.2) 93.3 1.3 (3.5) 4.6 0.1 (0.8) 0.5 0.4 (2.2) 1.6
65-74yrs 554 8813 15.9 (9.8) 12.4 (9.9) 78.2 2.3 (4.1) 14.5 0.4 (1.6) 2.4 0.8 (3.0) 4.9
Rural 15yrs 1432 40009 27.9 (0.7 27.7 (1.4) 99.2 0.2 (1.2) 0.6 0.0 (0.0) 0.0 0.1 (0.3) 0.2
35-44yrs 1429 39299 27.5 (4.0) 25.7 (6.2) 93.3 1.3 (3.7) 4.8 0.1 (1.0) 0.5 0.3 (1.7) 1.3
65-74yrs 1405 21125 15.0 (10.1) 11.6 (10.0) 77.5 2.2 (4.5) 14.8 0.4 (1.8) 2.9 0.7 (2.4) 4.8 *% of teeth with periodontal pockets = (no. of teeth with pockets/total no. of teeth) x 100 **% excluded teeth = (no. of excluded teeth/total no. of teeth) x 100
Note: x:̅ Mean; SD: Standard Deviation
The mean number of teeth with periodontal pockets increased with age. This pattern was similar across all sub-categories.
In 35-44-year-olds and 65-74-year-olds, males, Tamils and rural participants had a higher percentage of teeth with periodontal pockets compared to females, other two ethnic groups and urban participants respectively.
Res
ult
s
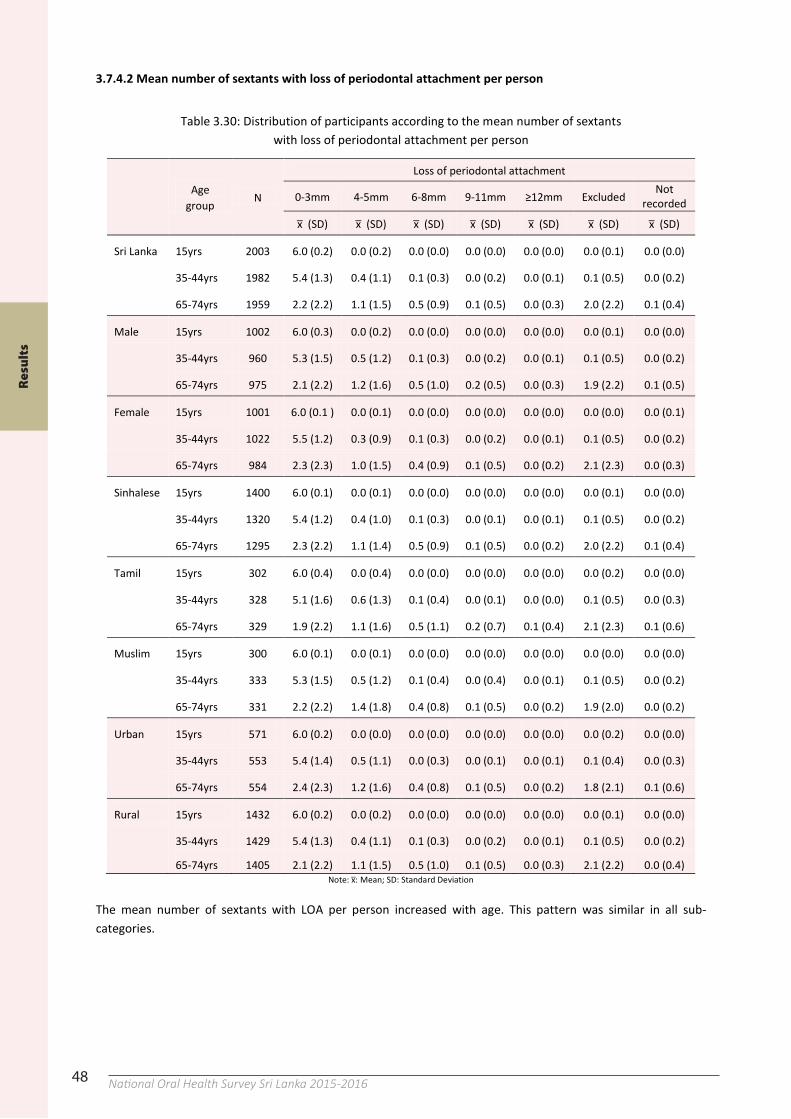
48 National Oral Health Survey Sri Lanka 2015-201648
3.7.4.2 Mean number of sextants with loss of periodontal attachment per person
Table 3.30: Distribution of participants according to the mean number of sextants with loss of periodontal attachment per person
Age
group N
Loss of periodontal attachment
0-3mm 4-5mm 6-8mm 9-11mm ≥12mm Excluded Not
recorded
x ̅ (SD) x ̅ (SD) x ̅ (SD) x ̅ (SD) x ̅ (SD) x ̅ (SD) x ̅ (SD)
Sri Lanka 15yrs 2003 6.0 (0.2) 0.0 (0.2) 0.0 (0.0) 0.0 (0.0) 0.0 (0.0) 0.0 (0.1) 0.0 (0.0)
35-44yrs 1982 5.4 (1.3) 0.4 (1.1) 0.1 (0.3) 0.0 (0.2) 0.0 (0.1) 0.1 (0.5) 0.0 (0.2)
65-74yrs 1959 2.2 (2.2) 1.1 (1.5) 0.5 (0.9) 0.1 (0.5) 0.0 (0.3) 2.0 (2.2) 0.1 (0.4)
Male 15yrs 1002 6.0 (0.3) 0.0 (0.2) 0.0 (0.0) 0.0 (0.0) 0.0 (0.0) 0.0 (0.1) 0.0 (0.0)
35-44yrs 960 5.3 (1.5) 0.5 (1.2) 0.1 (0.3) 0.0 (0.2) 0.0 (0.1) 0.1 (0.5) 0.0 (0.2)
65-74yrs 975 2.1 (2.2) 1.2 (1.6) 0.5 (1.0) 0.2 (0.5) 0.0 (0.3) 1.9 (2.2) 0.1 (0.5)
Female 15yrs 1001 6.0 (0.1 ) 0.0 (0.1) 0.0 (0.0) 0.0 (0.0) 0.0 (0.0) 0.0 (0.0) 0.0 (0.1)
35-44yrs 1022 5.5 (1.2) 0.3 (0.9) 0.1 (0.3) 0.0 (0.2) 0.0 (0.1) 0.1 (0.5) 0.0 (0.2)
65-74yrs 984 2.3 (2.3) 1.0 (1.5) 0.4 (0.9) 0.1 (0.5) 0.0 (0.2) 2.1 (2.3) 0.0 (0.3)
Sinhalese 15yrs 1400 6.0 (0.1) 0.0 (0.1) 0.0 (0.0) 0.0 (0.0) 0.0 (0.0) 0.0 (0.1) 0.0 (0.0)
35-44yrs 1320 5.4 (1.2) 0.4 (1.0) 0.1 (0.3) 0.0 (0.1) 0.0 (0.1) 0.1 (0.5) 0.0 (0.2)
65-74yrs 1295 2.3 (2.2) 1.1 (1.4) 0.5 (0.9) 0.1 (0.5) 0.0 (0.2) 2.0 (2.2) 0.1 (0.4)
Tamil 15yrs 302 6.0 (0.4) 0.0 (0.4) 0.0 (0.0) 0.0 (0.0) 0.0 (0.0) 0.0 (0.2) 0.0 (0.0)
35-44yrs 328 5.1 (1.6) 0.6 (1.3) 0.1 (0.4) 0.0 (0.1) 0.0 (0.0) 0.1 (0.5) 0.0 (0.3)
65-74yrs 329 1.9 (2.2) 1.1 (1.6) 0.5 (1.1) 0.2 (0.7) 0.1 (0.4) 2.1 (2.3) 0.1 (0.6)
Muslim 15yrs 300 6.0 (0.1) 0.0 (0.1) 0.0 (0.0) 0.0 (0.0) 0.0 (0.0) 0.0 (0.0) 0.0 (0.0)
35-44yrs 333 5.3 (1.5) 0.5 (1.2) 0.1 (0.4) 0.0 (0.4) 0.0 (0.1) 0.1 (0.5) 0.0 (0.2)
65-74yrs 331 2.2 (2.2) 1.4 (1.8) 0.4 (0.8) 0.1 (0.5) 0.0 (0.2) 1.9 (2.0) 0.0 (0.2)
Urban 15yrs 571 6.0 (0.2) 0.0 (0.0) 0.0 (0.0) 0.0 (0.0) 0.0 (0.0) 0.0 (0.2) 0.0 (0.0)
35-44yrs 553 5.4 (1.4) 0.5 (1.1) 0.0 (0.3) 0.0 (0.1) 0.0 (0.1) 0.1 (0.4) 0.0 (0.3)
65-74yrs 554 2.4 (2.3) 1.2 (1.6) 0.4 (0.8) 0.1 (0.5) 0.0 (0.2) 1.8 (2.1) 0.1 (0.6)
Rural 15yrs 1432 6.0 (0.2) 0.0 (0.2) 0.0 (0.0) 0.0 (0.0) 0.0 (0.0) 0.0 (0.1) 0.0 (0.0)
35-44yrs 1429 5.4 (1.3) 0.4 (1.1) 0.1 (0.3) 0.0 (0.2) 0.0 (0.1) 0.1 (0.5) 0.0 (0.2)
65-74yrs 1405 2.1 (2.2) 1.1 (1.5) 0.5 (1.0) 0.1 (0.5) 0.0 (0.3) 2.1 (2.2) 0.0 (0.4)
Note: x:̅ Mean; SD: Standard Deviation
The mean number of sextants with LOA per person increased with age. This pattern was similar in all sub-categories.
Res
ult
s
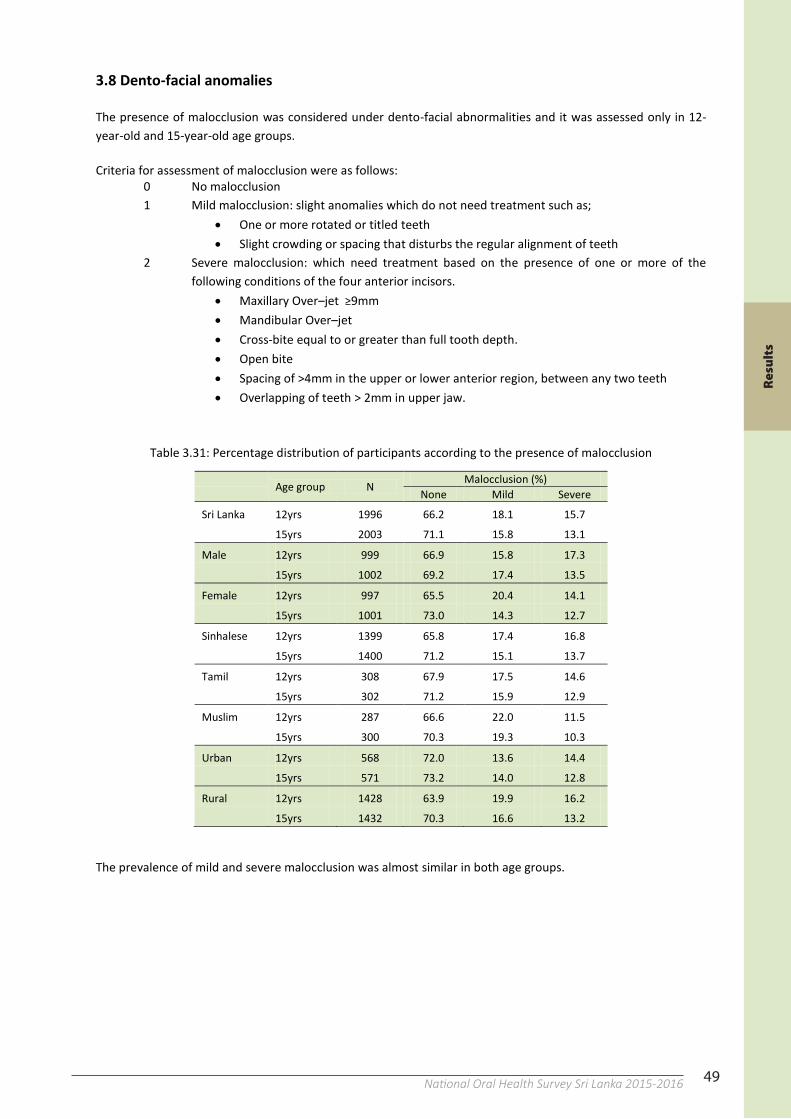
49National Oral Health Survey Sri Lanka 2015-201648
3.7.4.2 Mean number of sextants with loss of periodontal attachment per person
Table 3.30: Distribution of participants according to the mean number of sextants with loss of periodontal attachment per person
Age
group N
Loss of periodontal attachment
0-3mm 4-5mm 6-8mm 9-11mm ≥12mm Excluded Not
recorded
x ̅ (SD) x ̅ (SD) x ̅ (SD) x ̅ (SD) x ̅ (SD) x ̅ (SD) x ̅ (SD)
Sri Lanka 15yrs 2003 6.0 (0.2) 0.0 (0.2) 0.0 (0.0) 0.0 (0.0) 0.0 (0.0) 0.0 (0.1) 0.0 (0.0)
35-44yrs 1982 5.4 (1.3) 0.4 (1.1) 0.1 (0.3) 0.0 (0.2) 0.0 (0.1) 0.1 (0.5) 0.0 (0.2)
65-74yrs 1959 2.2 (2.2) 1.1 (1.5) 0.5 (0.9) 0.1 (0.5) 0.0 (0.3) 2.0 (2.2) 0.1 (0.4)
Male 15yrs 1002 6.0 (0.3) 0.0 (0.2) 0.0 (0.0) 0.0 (0.0) 0.0 (0.0) 0.0 (0.1) 0.0 (0.0)
35-44yrs 960 5.3 (1.5) 0.5 (1.2) 0.1 (0.3) 0.0 (0.2) 0.0 (0.1) 0.1 (0.5) 0.0 (0.2)
65-74yrs 975 2.1 (2.2) 1.2 (1.6) 0.5 (1.0) 0.2 (0.5) 0.0 (0.3) 1.9 (2.2) 0.1 (0.5)
Female 15yrs 1001 6.0 (0.1 ) 0.0 (0.1) 0.0 (0.0) 0.0 (0.0) 0.0 (0.0) 0.0 (0.0) 0.0 (0.1)
35-44yrs 1022 5.5 (1.2) 0.3 (0.9) 0.1 (0.3) 0.0 (0.2) 0.0 (0.1) 0.1 (0.5) 0.0 (0.2)
65-74yrs 984 2.3 (2.3) 1.0 (1.5) 0.4 (0.9) 0.1 (0.5) 0.0 (0.2) 2.1 (2.3) 0.0 (0.3)
Sinhalese 15yrs 1400 6.0 (0.1) 0.0 (0.1) 0.0 (0.0) 0.0 (0.0) 0.0 (0.0) 0.0 (0.1) 0.0 (0.0)
35-44yrs 1320 5.4 (1.2) 0.4 (1.0) 0.1 (0.3) 0.0 (0.1) 0.0 (0.1) 0.1 (0.5) 0.0 (0.2)
65-74yrs 1295 2.3 (2.2) 1.1 (1.4) 0.5 (0.9) 0.1 (0.5) 0.0 (0.2) 2.0 (2.2) 0.1 (0.4)
Tamil 15yrs 302 6.0 (0.4) 0.0 (0.4) 0.0 (0.0) 0.0 (0.0) 0.0 (0.0) 0.0 (0.2) 0.0 (0.0)
35-44yrs 328 5.1 (1.6) 0.6 (1.3) 0.1 (0.4) 0.0 (0.1) 0.0 (0.0) 0.1 (0.5) 0.0 (0.3)
65-74yrs 329 1.9 (2.2) 1.1 (1.6) 0.5 (1.1) 0.2 (0.7) 0.1 (0.4) 2.1 (2.3) 0.1 (0.6)
Muslim 15yrs 300 6.0 (0.1) 0.0 (0.1) 0.0 (0.0) 0.0 (0.0) 0.0 (0.0) 0.0 (0.0) 0.0 (0.0)
35-44yrs 333 5.3 (1.5) 0.5 (1.2) 0.1 (0.4) 0.0 (0.4) 0.0 (0.1) 0.1 (0.5) 0.0 (0.2)
65-74yrs 331 2.2 (2.2) 1.4 (1.8) 0.4 (0.8) 0.1 (0.5) 0.0 (0.2) 1.9 (2.0) 0.0 (0.2)
Urban 15yrs 571 6.0 (0.2) 0.0 (0.0) 0.0 (0.0) 0.0 (0.0) 0.0 (0.0) 0.0 (0.2) 0.0 (0.0)
35-44yrs 553 5.4 (1.4) 0.5 (1.1) 0.0 (0.3) 0.0 (0.1) 0.0 (0.1) 0.1 (0.4) 0.0 (0.3)
65-74yrs 554 2.4 (2.3) 1.2 (1.6) 0.4 (0.8) 0.1 (0.5) 0.0 (0.2) 1.8 (2.1) 0.1 (0.6)
Rural 15yrs 1432 6.0 (0.2) 0.0 (0.2) 0.0 (0.0) 0.0 (0.0) 0.0 (0.0) 0.0 (0.1) 0.0 (0.0)
35-44yrs 1429 5.4 (1.3) 0.4 (1.1) 0.1 (0.3) 0.0 (0.2) 0.0 (0.1) 0.1 (0.5) 0.0 (0.2)
65-74yrs 1405 2.1 (2.2) 1.1 (1.5) 0.5 (1.0) 0.1 (0.5) 0.0 (0.3) 2.1 (2.2) 0.0 (0.4)
Note: x:̅ Mean; SD: Standard Deviation
The mean number of sextants with LOA per person increased with age. This pattern was similar in all sub-categories.
49
3.8 Dento-facial anomalies
The presence of malocclusion was considered under dento-facial abnormalities and it was assessed only in 12-year-old and 15-year-old age groups.
Criteria for assessment of malocclusion were as follows: 0 No malocclusion 1 Mild malocclusion: slight anomalies which do not need treatment such as;
One or more rotated or titled teeth Slight crowding or spacing that disturbs the regular alignment of teeth
2 Severe malocclusion: which need treatment based on the presence of one or more of the following conditions of the four anterior incisors.
Maxillary Over–jet ≥9mm Mandibular Over–jet Cross-bite equal to or greater than full tooth depth. Open bite Spacing of >4mm in the upper or lower anterior region, between any two teeth Overlapping of teeth > 2mm in upper jaw.
Table 3.31: Percentage distribution of participants according to the presence of malocclusion
Age group N Malocclusion (%)
None Mild Severe
Sri Lanka 12yrs 1996 66.2 18.1 15.7
15yrs 2003 71.1 15.8 13.1
Male 12yrs 999 66.9 15.8 17.3
15yrs 1002 69.2 17.4 13.5
Female 12yrs 997 65.5 20.4 14.1
15yrs 1001 73.0 14.3 12.7
Sinhalese 12yrs 1399 65.8 17.4 16.8
15yrs 1400 71.2 15.1 13.7
Tamil 12yrs 308 67.9 17.5 14.6
15yrs 302 71.2 15.9 12.9
Muslim 12yrs 287 66.6 22.0 11.5
15yrs 300 70.3 19.3 10.3
Urban 12yrs 568 72.0 13.6 14.4
15yrs 571 73.2 14.0 12.8
Rural 12yrs 1428 63.9 19.9 16.2
15yrs 1432 70.3 16.6 13.2
The prevalence of mild and severe malocclusion was almost similar in both age groups.
Res
ult
s
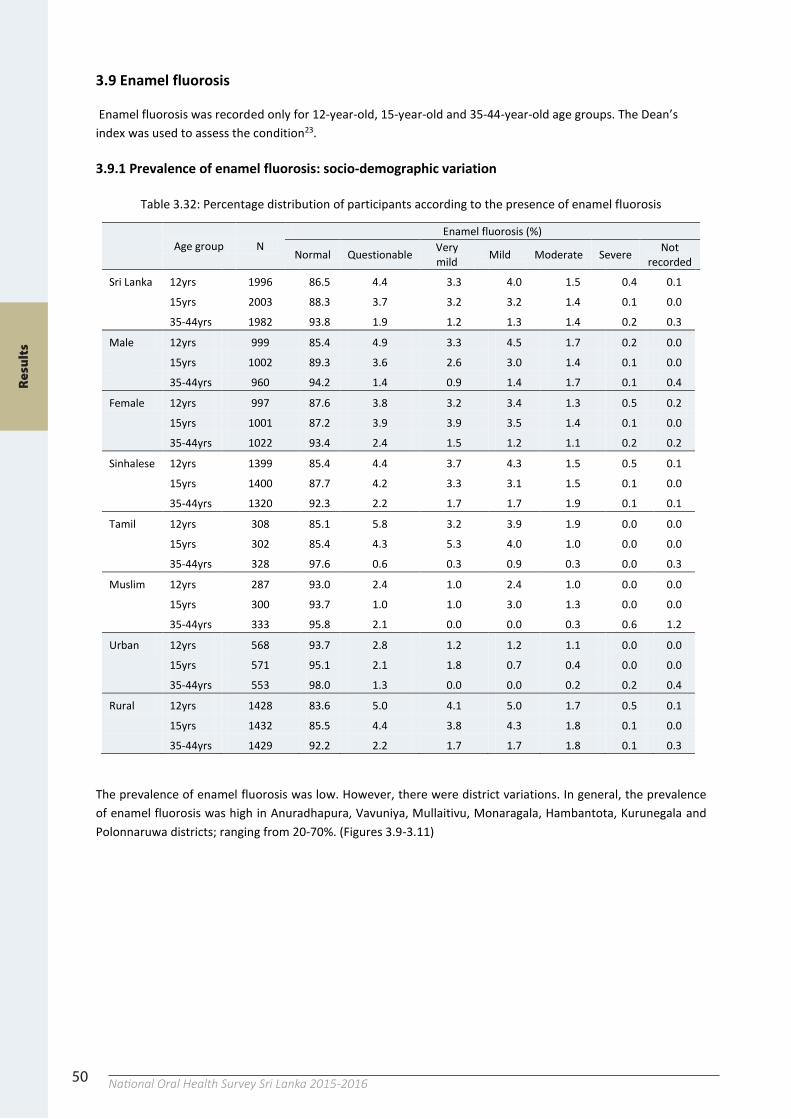
50 National Oral Health Survey Sri Lanka 2015-201650
3.9 Enamel fluorosis
Enamel fluorosis was recorded only for 12-year-old, 15-year-old and 35-44-year-old age groups. The Dean’s index was used to assess the condition23.
3.9.1 Prevalence of enamel fluorosis: socio-demographic variation
Table 3.32: Percentage distribution of participants according to the presence of enamel fluorosis
Age group N Enamel fluorosis (%)
Normal Questionable Very mild Mild Moderate Severe Not
recorded
Sri Lanka 12yrs 1996 86.5 4.4 3.3 4.0 1.5 0.4 0.1
15yrs 2003 88.3 3.7 3.2 3.2 1.4 0.1 0.0
35-44yrs 1982 93.8 1.9 1.2 1.3 1.4 0.2 0.3
Male 12yrs 999 85.4 4.9 3.3 4.5 1.7 0.2 0.0
15yrs 1002 89.3 3.6 2.6 3.0 1.4 0.1 0.0
35-44yrs 960 94.2 1.4 0.9 1.4 1.7 0.1 0.4
Female 12yrs 997 87.6 3.8 3.2 3.4 1.3 0.5 0.2
15yrs 1001 87.2 3.9 3.9 3.5 1.4 0.1 0.0
35-44yrs 1022 93.4 2.4 1.5 1.2 1.1 0.2 0.2
Sinhalese 12yrs 1399 85.4 4.4 3.7 4.3 1.5 0.5 0.1
15yrs 1400 87.7 4.2 3.3 3.1 1.5 0.1 0.0
35-44yrs 1320 92.3 2.2 1.7 1.7 1.9 0.1 0.1
Tamil 12yrs 308 85.1 5.8 3.2 3.9 1.9 0.0 0.0
15yrs 302 85.4 4.3 5.3 4.0 1.0 0.0 0.0
35-44yrs 328 97.6 0.6 0.3 0.9 0.3 0.0 0.3
Muslim 12yrs 287 93.0 2.4 1.0 2.4 1.0 0.0 0.0
15yrs 300 93.7 1.0 1.0 3.0 1.3 0.0 0.0
35-44yrs 333 95.8 2.1 0.0 0.0 0.3 0.6 1.2
Urban 12yrs 568 93.7 2.8 1.2 1.2 1.1 0.0 0.0
15yrs 571 95.1 2.1 1.8 0.7 0.4 0.0 0.0
35-44yrs 553 98.0 1.3 0.0 0.0 0.2 0.2 0.4
Rural 12yrs 1428 83.6 5.0 4.1 5.0 1.7 0.5 0.1
15yrs 1432 85.5 4.4 3.8 4.3 1.8 0.1 0.0
35-44yrs 1429 92.2 2.2 1.7 1.7 1.8 0.1 0.3
The prevalence of enamel fluorosis was low. However, there were district variations. In general, the prevalence of enamel fluorosis was high in Anuradhapura, Vavuniya, Mullaitivu, Monaragala, Hambantota, Kurunegala and Polonnaruwa districts; ranging from 20-70%. (Figures 3.9-3.11)
51
3.9.2 Prevalence of enamel fluorosis: district variation
Figure 3.9: Percentage distribution of participants with enamel fluorosis according to districts: 12-year-olds
Figure 3.10: Percentage distribution of participants with enamel fluorosis according to districts: 15-year-olds
Figure 3.11: Percentage distribution of participants with enamel fluorosis according to districts: 35-44-year-olds
0
20
40
60
80
%
District
Severe
Moderate
Mild
Very mild
Questionable
0
20
40
60
80
%
District
Severe
Moderate
Mild
Very mild
Questionable
0
20
40
60
%
District
Not recorded
Severe
Moderate
Mild
Very mild
Questionable
Res
ult
s
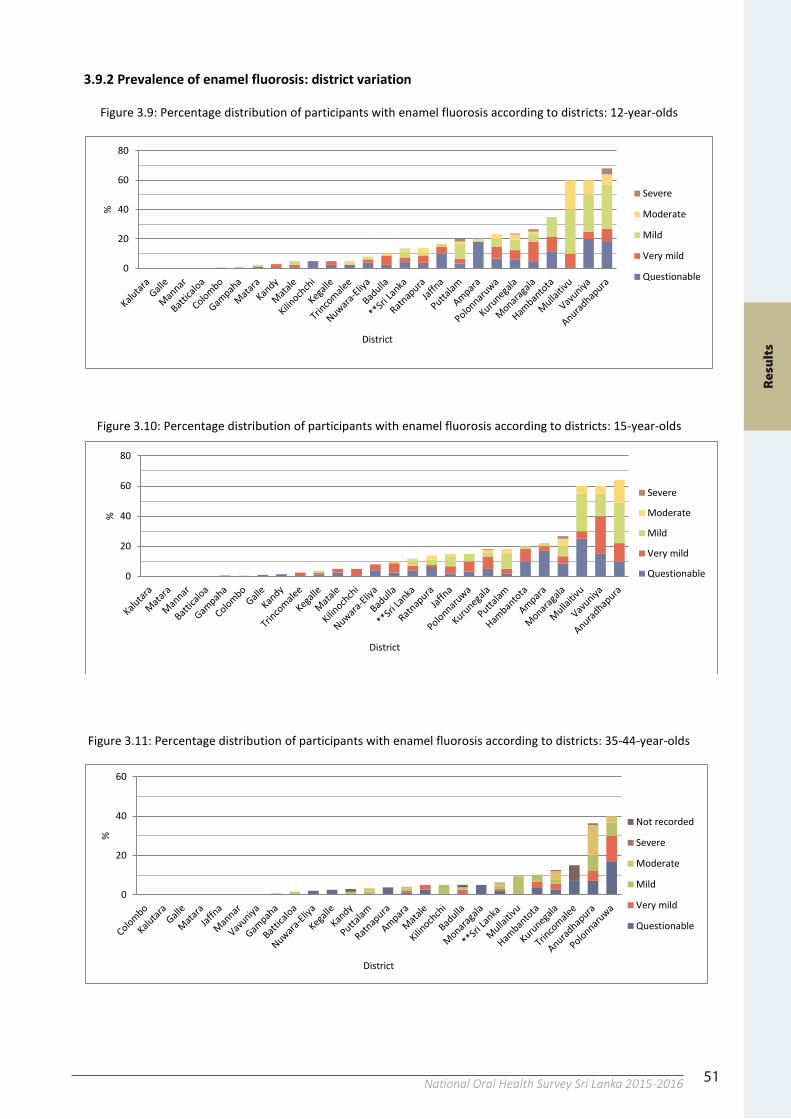
51National Oral Health Survey Sri Lanka 2015-201650
3.9 Enamel fluorosis
Enamel fluorosis was recorded only for 12-year-old, 15-year-old and 35-44-year-old age groups. The Dean’s index was used to assess the condition23.
3.9.1 Prevalence of enamel fluorosis: socio-demographic variation
Table 3.32: Percentage distribution of participants according to the presence of enamel fluorosis
Age group N Enamel fluorosis (%)
Normal Questionable Very mild Mild Moderate Severe Not
recorded
Sri Lanka 12yrs 1996 86.5 4.4 3.3 4.0 1.5 0.4 0.1
15yrs 2003 88.3 3.7 3.2 3.2 1.4 0.1 0.0
35-44yrs 1982 93.8 1.9 1.2 1.3 1.4 0.2 0.3
Male 12yrs 999 85.4 4.9 3.3 4.5 1.7 0.2 0.0
15yrs 1002 89.3 3.6 2.6 3.0 1.4 0.1 0.0
35-44yrs 960 94.2 1.4 0.9 1.4 1.7 0.1 0.4
Female 12yrs 997 87.6 3.8 3.2 3.4 1.3 0.5 0.2
15yrs 1001 87.2 3.9 3.9 3.5 1.4 0.1 0.0
35-44yrs 1022 93.4 2.4 1.5 1.2 1.1 0.2 0.2
Sinhalese 12yrs 1399 85.4 4.4 3.7 4.3 1.5 0.5 0.1
15yrs 1400 87.7 4.2 3.3 3.1 1.5 0.1 0.0
35-44yrs 1320 92.3 2.2 1.7 1.7 1.9 0.1 0.1
Tamil 12yrs 308 85.1 5.8 3.2 3.9 1.9 0.0 0.0
15yrs 302 85.4 4.3 5.3 4.0 1.0 0.0 0.0
35-44yrs 328 97.6 0.6 0.3 0.9 0.3 0.0 0.3
Muslim 12yrs 287 93.0 2.4 1.0 2.4 1.0 0.0 0.0
15yrs 300 93.7 1.0 1.0 3.0 1.3 0.0 0.0
35-44yrs 333 95.8 2.1 0.0 0.0 0.3 0.6 1.2
Urban 12yrs 568 93.7 2.8 1.2 1.2 1.1 0.0 0.0
15yrs 571 95.1 2.1 1.8 0.7 0.4 0.0 0.0
35-44yrs 553 98.0 1.3 0.0 0.0 0.2 0.2 0.4
Rural 12yrs 1428 83.6 5.0 4.1 5.0 1.7 0.5 0.1
15yrs 1432 85.5 4.4 3.8 4.3 1.8 0.1 0.0
35-44yrs 1429 92.2 2.2 1.7 1.7 1.8 0.1 0.3
The prevalence of enamel fluorosis was low. However, there were district variations. In general, the prevalence of enamel fluorosis was high in Anuradhapura, Vavuniya, Mullaitivu, Monaragala, Hambantota, Kurunegala and Polonnaruwa districts; ranging from 20-70%. (Figures 3.9-3.11)
51
3.9.2 Prevalence of enamel fluorosis: district variation
Figure 3.9: Percentage distribution of participants with enamel fluorosis according to districts: 12-year-olds
Figure 3.10: Percentage distribution of participants with enamel fluorosis according to districts: 15-year-olds
Figure 3.11: Percentage distribution of participants with enamel fluorosis according to districts: 35-44-year-olds
0
20
40
60
80
%
District
Severe
Moderate
Mild
Very mild
Questionable
0
20
40
60
80
%
District
Severe
Moderate
Mild
Very mild
Questionable
0
20
40
60
%
District
Not recorded
Severe
Moderate
Mild
Very mild
Questionable
Res
ult
s
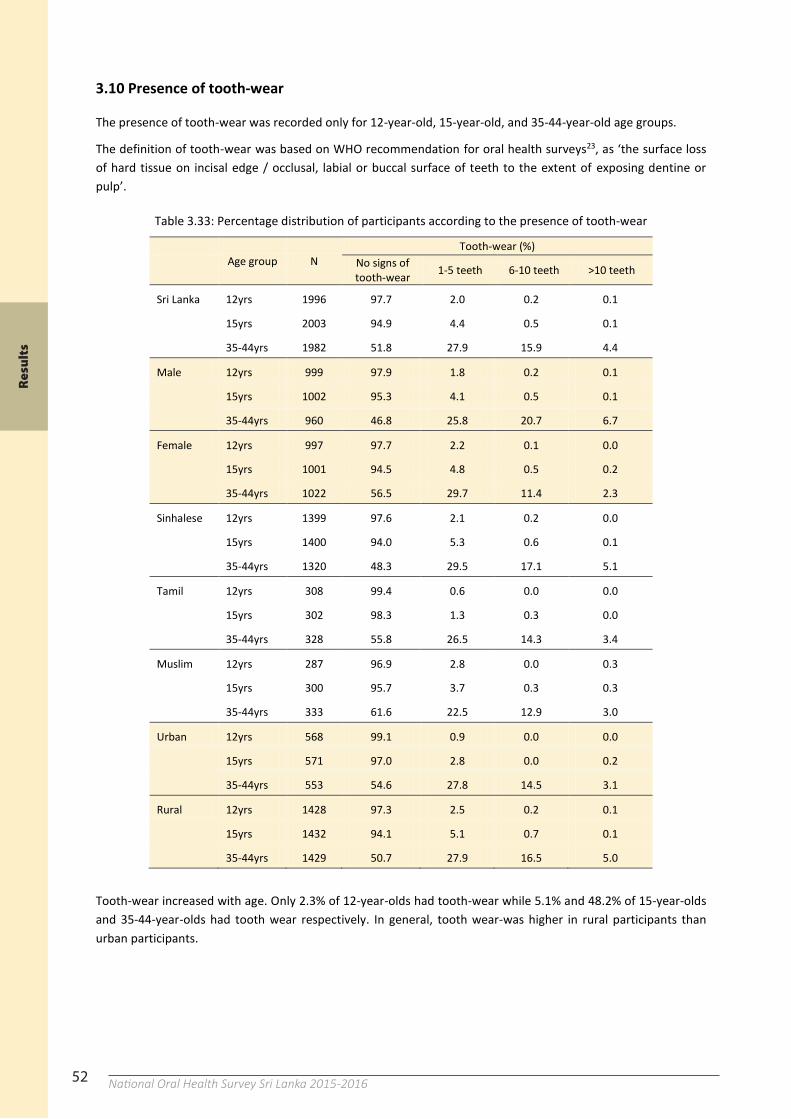
52 National Oral Health Survey Sri Lanka 2015-201652
3.10 Presence of tooth-wear
The presence of tooth-wear was recorded only for 12-year-old, 15-year-old, and 35-44-year-old age groups.
The definition of tooth-wear was based on WHO recommendation for oral health surveys23, as ‘the surface loss of hard tissue on incisal edge / occlusal, labial or buccal surface of teeth to the extent of exposing dentine or pulp’.
Table 3.33: Percentage distribution of participants according to the presence of tooth-wear
Age group N Tooth-wear (%)
No signs of tooth-wear 1-5 teeth 6-10 teeth >10 teeth
Sri Lanka 12yrs 1996 97.7 2.0 0.2 0.1
15yrs 2003 94.9 4.4 0.5 0.1
35-44yrs 1982 51.8 27.9 15.9 4.4
Male 12yrs 999 97.9 1.8 0.2 0.1
15yrs 1002 95.3 4.1 0.5 0.1
35-44yrs 960 46.8 25.8 20.7 6.7
Female 12yrs 997 97.7 2.2 0.1 0.0
15yrs 1001 94.5 4.8 0.5 0.2
35-44yrs 1022 56.5 29.7 11.4 2.3
Sinhalese 12yrs 1399 97.6 2.1 0.2 0.0
15yrs 1400 94.0 5.3 0.6 0.1
35-44yrs 1320 48.3 29.5 17.1 5.1
Tamil 12yrs 308 99.4 0.6 0.0 0.0
15yrs 302 98.3 1.3 0.3 0.0
35-44yrs 328 55.8 26.5 14.3 3.4
Muslim 12yrs 287 96.9 2.8 0.0 0.3
15yrs 300 95.7 3.7 0.3 0.3
35-44yrs 333 61.6 22.5 12.9 3.0
Urban 12yrs 568 99.1 0.9 0.0 0.0
15yrs 571 97.0 2.8 0.0 0.2
35-44yrs 553 54.6 27.8 14.5 3.1
Rural 12yrs 1428 97.3 2.5 0.2 0.1
15yrs 1432 94.1 5.1 0.7 0.1
35-44yrs 1429 50.7 27.9 16.5 5.0
Tooth-wear increased with age. Only 2.3% of 12-year-olds had tooth-wear while 5.1% and 48.2% of 15-year-olds and 35-44-year-olds had tooth wear respectively. In general, tooth wear-was higher in rural participants than urban participants.
Res
ult
s
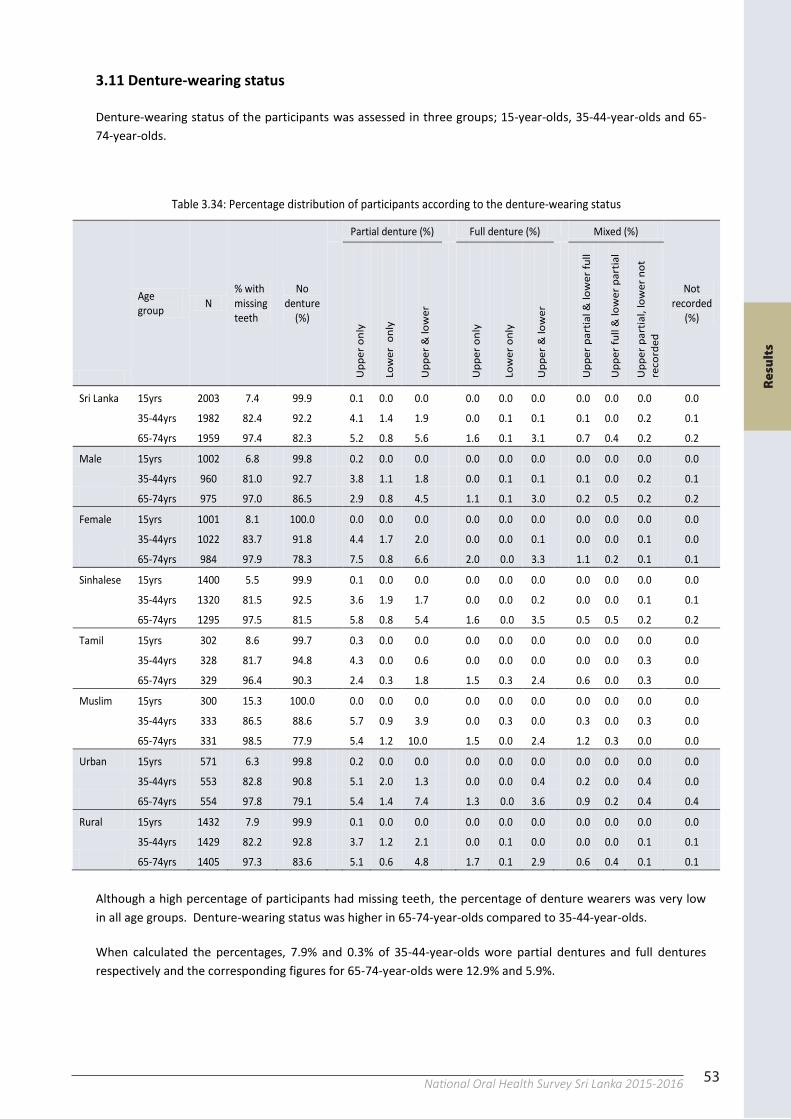
53National Oral Health Survey Sri Lanka 2015-201652
3.10 Presence of tooth-wear
The presence of tooth-wear was recorded only for 12-year-old, 15-year-old, and 35-44-year-old age groups.
The definition of tooth-wear was based on WHO recommendation for oral health surveys23, as ‘the surface loss of hard tissue on incisal edge / occlusal, labial or buccal surface of teeth to the extent of exposing dentine or pulp’.
Table 3.33: Percentage distribution of participants according to the presence of tooth-wear
Age group N Tooth-wear (%)
No signs of tooth-wear 1-5 teeth 6-10 teeth >10 teeth
Sri Lanka 12yrs 1996 97.7 2.0 0.2 0.1
15yrs 2003 94.9 4.4 0.5 0.1
35-44yrs 1982 51.8 27.9 15.9 4.4
Male 12yrs 999 97.9 1.8 0.2 0.1
15yrs 1002 95.3 4.1 0.5 0.1
35-44yrs 960 46.8 25.8 20.7 6.7
Female 12yrs 997 97.7 2.2 0.1 0.0
15yrs 1001 94.5 4.8 0.5 0.2
35-44yrs 1022 56.5 29.7 11.4 2.3
Sinhalese 12yrs 1399 97.6 2.1 0.2 0.0
15yrs 1400 94.0 5.3 0.6 0.1
35-44yrs 1320 48.3 29.5 17.1 5.1
Tamil 12yrs 308 99.4 0.6 0.0 0.0
15yrs 302 98.3 1.3 0.3 0.0
35-44yrs 328 55.8 26.5 14.3 3.4
Muslim 12yrs 287 96.9 2.8 0.0 0.3
15yrs 300 95.7 3.7 0.3 0.3
35-44yrs 333 61.6 22.5 12.9 3.0
Urban 12yrs 568 99.1 0.9 0.0 0.0
15yrs 571 97.0 2.8 0.0 0.2
35-44yrs 553 54.6 27.8 14.5 3.1
Rural 12yrs 1428 97.3 2.5 0.2 0.1
15yrs 1432 94.1 5.1 0.7 0.1
35-44yrs 1429 50.7 27.9 16.5 5.0
Tooth-wear increased with age. Only 2.3% of 12-year-olds had tooth-wear while 5.1% and 48.2% of 15-year-olds and 35-44-year-olds had tooth wear respectively. In general, tooth wear-was higher in rural participants than urban participants.
53
3.11 Denture-wearing status
Denture-wearing status of the participants was assessed in three groups; 15-year-olds, 35-44-year-olds and 65-74-year-olds.
Table 3.34: Percentage distribution of participants according to the denture-wearing status
Age group N
% with missing teeth
No denture
(%)
Partial denture (%) Full denture (%) Mixed (%)
Not recorded
(%) Up
per o
nly
Low
er o
nly
Uppe
r & lo
wer
Uppe
r onl
y
Low
er o
nly
Uppe
r & lo
wer
Uppe
r par
tial &
low
er fu
ll
Uppe
r ful
l & lo
wer
par
tial
Uppe
r par
tial,
low
er n
ot
reco
rded
Sri Lanka 15yrs 2003 7.4 99.9 0.1 0.0 0.0 0.0 0.0 0.0 0.0 0.0 0.0 0.0
35-44yrs 1982 82.4 92.2 4.1 1.4 1.9 0.0 0.1 0.1 0.1 0.0 0.2 0.1
65-74yrs 1959 97.4 82.3 5.2 0.8 5.6 1.6 0.1 3.1 0.7 0.4 0.2 0.2
Male 15yrs 1002 6.8 99.8 0.2 0.0 0.0 0.0 0.0 0.0 0.0 0.0 0.0 0.0
35-44yrs 960 81.0 92.7 3.8 1.1 1.8 0.0 0.1 0.1 0.1 0.0 0.2 0.1
65-74yrs 975 97.0 86.5 2.9 0.8 4.5 1.1 0.1 3.0 0.2 0.5 0.2 0.2
Female 15yrs 1001 8.1 100.0 0.0 0.0 0.0 0.0 0.0 0.0 0.0 0.0 0.0 0.0
35-44yrs 1022 83.7 91.8 4.4 1.7 2.0 0.0 0.0 0.1 0.0 0.0 0.1 0.0
65-74yrs 984 97.9 78.3 7.5 0.8 6.6 2.0 0.0 3.3 1.1 0.2 0.1 0.1
Sinhalese 15yrs 1400 5.5 99.9 0.1 0.0 0.0 0.0 0.0 0.0 0.0 0.0 0.0 0.0
35-44yrs 1320 81.5 92.5 3.6 1.9 1.7 0.0 0.0 0.2 0.0 0.0 0.1 0.1
65-74yrs 1295 97.5 81.5 5.8 0.8 5.4 1.6 0.0 3.5 0.5 0.5 0.2 0.2
Tamil 15yrs 302 8.6 99.7 0.3 0.0 0.0 0.0 0.0 0.0 0.0 0.0 0.0 0.0
35-44yrs 328 81.7 94.8 4.3 0.0 0.6 0.0 0.0 0.0 0.0 0.0 0.3 0.0
65-74yrs 329 96.4 90.3 2.4 0.3 1.8 1.5 0.3 2.4 0.6 0.0 0.3 0.0
Muslim 15yrs 300 15.3 100.0 0.0 0.0 0.0 0.0 0.0 0.0 0.0 0.0 0.0 0.0
35-44yrs 333 86.5 88.6 5.7 0.9 3.9 0.0 0.3 0.0 0.3 0.0 0.3 0.0
65-74yrs 331 98.5 77.9 5.4 1.2 10.0 1.5 0.0 2.4 1.2 0.3 0.0 0.0
Urban 15yrs 571 6.3 99.8 0.2 0.0 0.0 0.0 0.0 0.0 0.0 0.0 0.0 0.0
35-44yrs 553 82.8 90.8 5.1 2.0 1.3 0.0 0.0 0.4 0.2 0.0 0.4 0.0
65-74yrs 554 97.8 79.1 5.4 1.4 7.4 1.3 0.0 3.6 0.9 0.2 0.4 0.4
Rural 15yrs 1432 7.9 99.9 0.1 0.0 0.0 0.0 0.0 0.0 0.0 0.0 0.0 0.0
35-44yrs 1429 82.2 92.8 3.7 1.2 2.1 0.0 0.1 0.0 0.0 0.0 0.1 0.1
65-74yrs 1405 97.3 83.6 5.1 0.6 4.8 1.7 0.1 2.9 0.6 0.4 0.1 0.1
Although a high percentage of participants had missing teeth, the percentage of denture wearers was very low in all age groups. Denture-wearing status was higher in 65-74-year-olds compared to 35-44-year-olds.
When calculated the percentages, 7.9% and 0.3% of 35-44-year-olds wore partial dentures and full dentures respectively and the corresponding figures for 65-74-year-olds were 12.9% and 5.9%.
53
3.11 Denture-wearing status
Denture-wearing status of the participants was assessed in three groups; 15-year-olds, 35-44-year-olds and 65-74-year-olds.
Table 3.34: Percentage distribution of participants according to the denture-wearing status
Age group N
% with missing teeth
No denture
(%)
Partial denture (%) Full denture (%) Mixed (%)
Not recorded
(%)
Upp
er o
nly
Low
er o
nly
Upp
er &
low
er
Upp
er o
nly
Low
er o
nly
Upp
er &
low
er
Upp
er p
artia
l & lo
wer
full
Upp
er fu
ll &
low
er p
artia
l
Upp
er p
artia
l, lo
wer
not
re
cord
ed
Sri Lanka 15yrs 2003 7.4 99.9 0.1 0.0 0.0 0.0 0.0 0.0 0.0 0.0 0.0 0.0
35-44yrs 1982 82.4 92.2 4.1 1.4 1.9 0.0 0.1 0.1 0.1 0.0 0.2 0.1
65-74yrs 1959 97.4 82.3 5.2 0.8 5.6 1.6 0.1 3.1 0.7 0.4 0.2 0.2
Male 15yrs 1002 6.8 99.8 0.2 0.0 0.0 0.0 0.0 0.0 0.0 0.0 0.0 0.0
35-44yrs 960 81.0 92.7 3.8 1.1 1.8 0.0 0.1 0.1 0.1 0.0 0.2 0.1
65-74yrs 975 97.0 86.5 2.9 0.8 4.5 1.1 0.1 3.0 0.2 0.5 0.2 0.2
Female 15yrs 1001 8.1 100.0 0.0 0.0 0.0 0.0 0.0 0.0 0.0 0.0 0.0 0.0
35-44yrs 1022 83.7 91.8 4.4 1.7 2.0 0.0 0.0 0.1 0.0 0.0 0.1 0.0
65-74yrs 984 97.9 78.3 7.5 0.8 6.6 2.0 0.0 3.3 1.1 0.2 0.1 0.1
Sinhalese 15yrs 1400 5.5 99.9 0.1 0.0 0.0 0.0 0.0 0.0 0.0 0.0 0.0 0.0
35-44yrs 1320 81.5 92.5 3.6 1.9 1.7 0.0 0.0 0.2 0.0 0.0 0.1 0.1
65-74yrs 1295 97.5 81.5 5.8 0.8 5.4 1.6 0.0 3.5 0.5 0.5 0.2 0.2
Tamil 15yrs 302 8.6 99.7 0.3 0.0 0.0 0.0 0.0 0.0 0.0 0.0 0.0 0.0
35-44yrs 328 81.7 94.8 4.3 0.0 0.6 0.0 0.0 0.0 0.0 0.0 0.3 0.0
65-74yrs 329 96.4 90.3 2.4 0.3 1.8 1.5 0.3 2.4 0.6 0.0 0.3 0.0
Muslim 15yrs 300 15.3 100.0 0.0 0.0 0.0 0.0 0.0 0.0 0.0 0.0 0.0 0.0
35-44yrs 333 86.5 88.6 5.7 0.9 3.9 0.0 0.3 0.0 0.3 0.0 0.3 0.0
65-74yrs 331 98.5 77.9 5.4 1.2 10.0 1.5 0.0 2.4 1.2 0.3 0.0 0.0
Urban 15yrs 571 6.3 99.8 0.2 0.0 0.0 0.0 0.0 0.0 0.0 0.0 0.0 0.0
35-44yrs 553 82.8 90.8 5.1 2.0 1.3 0.0 0.0 0.4 0.2 0.0 0.4 0.0
65-74yrs 554 97.8 79.1 5.4 1.4 7.4 1.3 0.0 3.6 0.9 0.2 0.4 0.4
Rural 15yrs 1432 7.9 99.9 0.1 0.0 0.0 0.0 0.0 0.0 0.0 0.0 0.0 0.0
35-44yrs 1429 82.2 92.8 3.7 1.2 2.1 0.0 0.1 0.0 0.0 0.0 0.1 0.1
65-74yrs 1405 97.3 83.6 5.1 0.6 4.8 1.7 0.1 2.9 0.6 0.4 0.1 0.1
Although a high percentage of participants had missing teeth, the percentage of denture wearers was very low in all age groups. Denture-wearing status was higher in 65-74-year-olds compared to 35-44-year-olds.
When calculated the percentages, 7.9% and 0.3% of 35-44-year-olds wore partial dentures and full dentures respectively and the corresponding figures for 65-74-year-olds were 12.9% and 5.9%.
53
3.11 Denture-wearing status
Denture-wearing status of the participants was assessed in three groups; 15-year-olds, 35-44-year-olds and 65-74-year-olds.
Table 3.34: Percentage distribution of participants according to the denture-wearing status
Age group N
% with missing teeth
No denture
(%)
Partial denture (%) Full denture (%) Mixed (%)
Not recorded
(%)
Uppe
r onl
y
Low
er o
nly
Uppe
r & lo
wer
Uppe
r onl
y
Low
er o
nly
Uppe
r & lo
wer
Uppe
r par
tial &
low
er fu
ll
Uppe
r ful
l & lo
wer
par
tial
Uppe
r par
tial,
low
er n
ot
reco
rded
Sri Lanka 15yrs 2003 7.4 99.9 0.1 0.0 0.0 0.0 0.0 0.0 0.0 0.0 0.0 0.0
35-44yrs 1982 82.4 92.2 4.1 1.4 1.9 0.0 0.1 0.1 0.1 0.0 0.2 0.1
65-74yrs 1959 97.4 82.3 5.2 0.8 5.6 1.6 0.1 3.1 0.7 0.4 0.2 0.2
Male 15yrs 1002 6.8 99.8 0.2 0.0 0.0 0.0 0.0 0.0 0.0 0.0 0.0 0.0
35-44yrs 960 81.0 92.7 3.8 1.1 1.8 0.0 0.1 0.1 0.1 0.0 0.2 0.1
65-74yrs 975 97.0 86.5 2.9 0.8 4.5 1.1 0.1 3.0 0.2 0.5 0.2 0.2
Female 15yrs 1001 8.1 100.0 0.0 0.0 0.0 0.0 0.0 0.0 0.0 0.0 0.0 0.0
35-44yrs 1022 83.7 91.8 4.4 1.7 2.0 0.0 0.0 0.1 0.0 0.0 0.1 0.0
65-74yrs 984 97.9 78.3 7.5 0.8 6.6 2.0 0.0 3.3 1.1 0.2 0.1 0.1
Sinhalese 15yrs 1400 5.5 99.9 0.1 0.0 0.0 0.0 0.0 0.0 0.0 0.0 0.0 0.0
35-44yrs 1320 81.5 92.5 3.6 1.9 1.7 0.0 0.0 0.2 0.0 0.0 0.1 0.1
65-74yrs 1295 97.5 81.5 5.8 0.8 5.4 1.6 0.0 3.5 0.5 0.5 0.2 0.2
Tamil 15yrs 302 8.6 99.7 0.3 0.0 0.0 0.0 0.0 0.0 0.0 0.0 0.0 0.0
35-44yrs 328 81.7 94.8 4.3 0.0 0.6 0.0 0.0 0.0 0.0 0.0 0.3 0.0
65-74yrs 329 96.4 90.3 2.4 0.3 1.8 1.5 0.3 2.4 0.6 0.0 0.3 0.0
Muslim 15yrs 300 15.3 100.0 0.0 0.0 0.0 0.0 0.0 0.0 0.0 0.0 0.0 0.0
35-44yrs 333 86.5 88.6 5.7 0.9 3.9 0.0 0.3 0.0 0.3 0.0 0.3 0.0
65-74yrs 331 98.5 77.9 5.4 1.2 10.0 1.5 0.0 2.4 1.2 0.3 0.0 0.0
Urban 15yrs 571 6.3 99.8 0.2 0.0 0.0 0.0 0.0 0.0 0.0 0.0 0.0 0.0
35-44yrs 553 82.8 90.8 5.1 2.0 1.3 0.0 0.0 0.4 0.2 0.0 0.4 0.0
65-74yrs 554 97.8 79.1 5.4 1.4 7.4 1.3 0.0 3.6 0.9 0.2 0.4 0.4
Rural 15yrs 1432 7.9 99.9 0.1 0.0 0.0 0.0 0.0 0.0 0.0 0.0 0.0 0.0
35-44yrs 1429 82.2 92.8 3.7 1.2 2.1 0.0 0.1 0.0 0.0 0.0 0.1 0.1
65-74yrs 1405 97.3 83.6 5.1 0.6 4.8 1.7 0.1 2.9 0.6 0.4 0.1 0.1
Although a high percentage of participants had missing teeth, the percentage of denture wearers was very low in all age groups. Denture-wearing status was higher in 65-74-year-olds compared to 35-44-year-olds.
When calculated the percentages, 7.9% and 0.3% of 35-44-year-olds wore partial dentures and full dentures respectively and the corresponding figures for 65-74-year-olds were 12.9% and 5.9%.
Res
ult
s
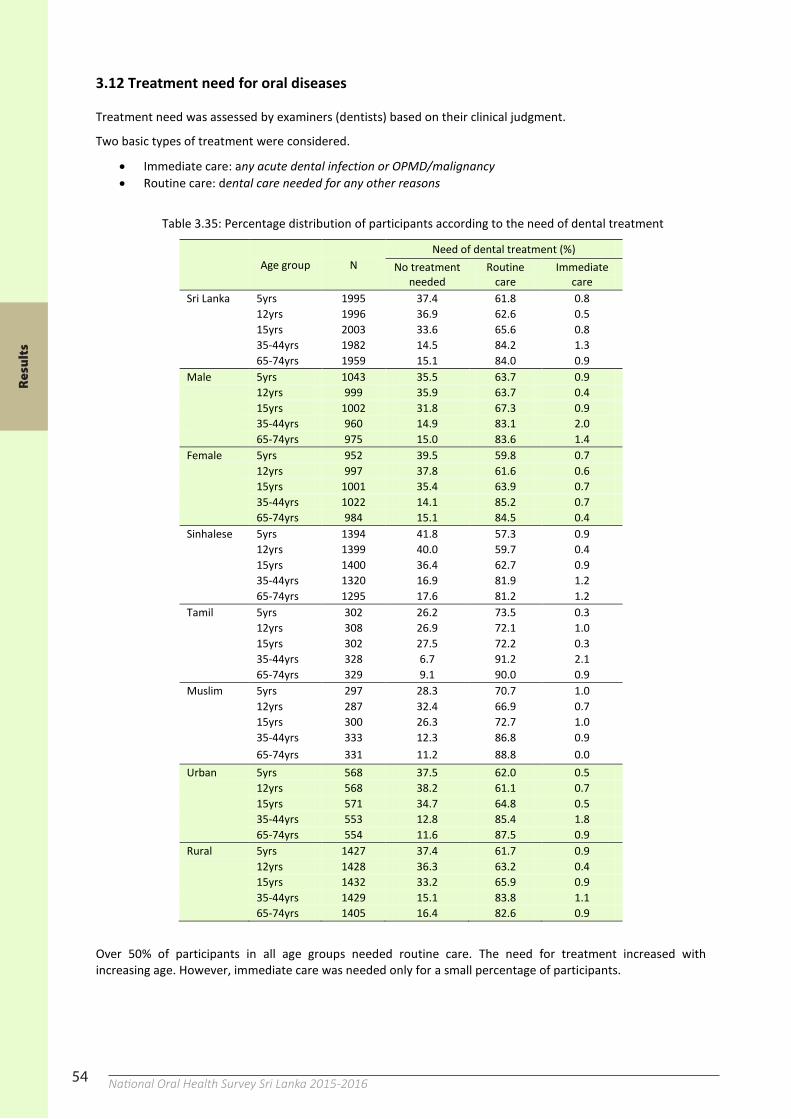
54 National Oral Health Survey Sri Lanka 2015-201654
3.12 Treatment need for oral diseases
Treatment need was assessed by examiners (dentists) based on their clinical judgment.
Two basic types of treatment were considered.
Immediate care: any acute dental infection or OPMD/malignancy Routine care: dental care needed for any other reasons
Table 3.35: Percentage distribution of participants according to the need of dental treatment
Age group N Need of dental treatment (%)
No treatment needed
Routine care
Immediate care
Sri Lanka 5yrs 1995 37.4 61.8 0.8
12yrs 1996 36.9 62.6 0.5
15yrs 2003 33.6 65.6 0.8
35-44yrs 1982 14.5 84.2 1.3
65-74yrs 1959 15.1 84.0 0.9 Male 5yrs 1043 35.5 63.7 0.9
12yrs 999 35.9 63.7 0.4
15yrs 1002 31.8 67.3 0.9
35-44yrs 960 14.9 83.1 2.0
65-74yrs 975 15.0 83.6 1.4 Female 5yrs 952 39.5 59.8 0.7
12yrs 997 37.8 61.6 0.6
15yrs 1001 35.4 63.9 0.7
35-44yrs 1022 14.1 85.2 0.7
65-74yrs 984 15.1 84.5 0.4 Sinhalese 5yrs 1394 41.8 57.3 0.9
12yrs 1399 40.0 59.7 0.4
15yrs 1400 36.4 62.7 0.9
35-44yrs 1320 16.9 81.9 1.2
65-74yrs 1295 17.6 81.2 1.2 Tamil 5yrs 302 26.2 73.5 0.3
12yrs 308 26.9 72.1 1.0
15yrs 302 27.5 72.2 0.3
35-44yrs 328 6.7 91.2 2.1
65-74yrs 329 9.1 90.0 0.9 Muslim 5yrs 297 28.3 70.7 1.0
12yrs 287 32.4 66.9 0.7
15yrs 300 26.3 72.7 1.0
35-44yrs 333 12.3 86.8 0.9
65-74yrs 331 11.2 88.8 0.0 Urban 5yrs 568 37.5 62.0 0.5
12yrs 568 38.2 61.1 0.7
15yrs 571 34.7 64.8 0.5
35-44yrs 553 12.8 85.4 1.8
65-74yrs 554 11.6 87.5 0.9 Rural 5yrs 1427 37.4 61.7 0.9
12yrs 1428 36.3 63.2 0.4
15yrs 1432 33.2 65.9 0.9
35-44yrs 1429 15.1 83.8 1.1
65-74yrs 1405 16.4 82.6 0.9
Over 50% of participants in all age groups needed routine care. The need for treatment increased with increasing age. However, immediate care was needed only for a small percentage of participants.
Res
ult
s
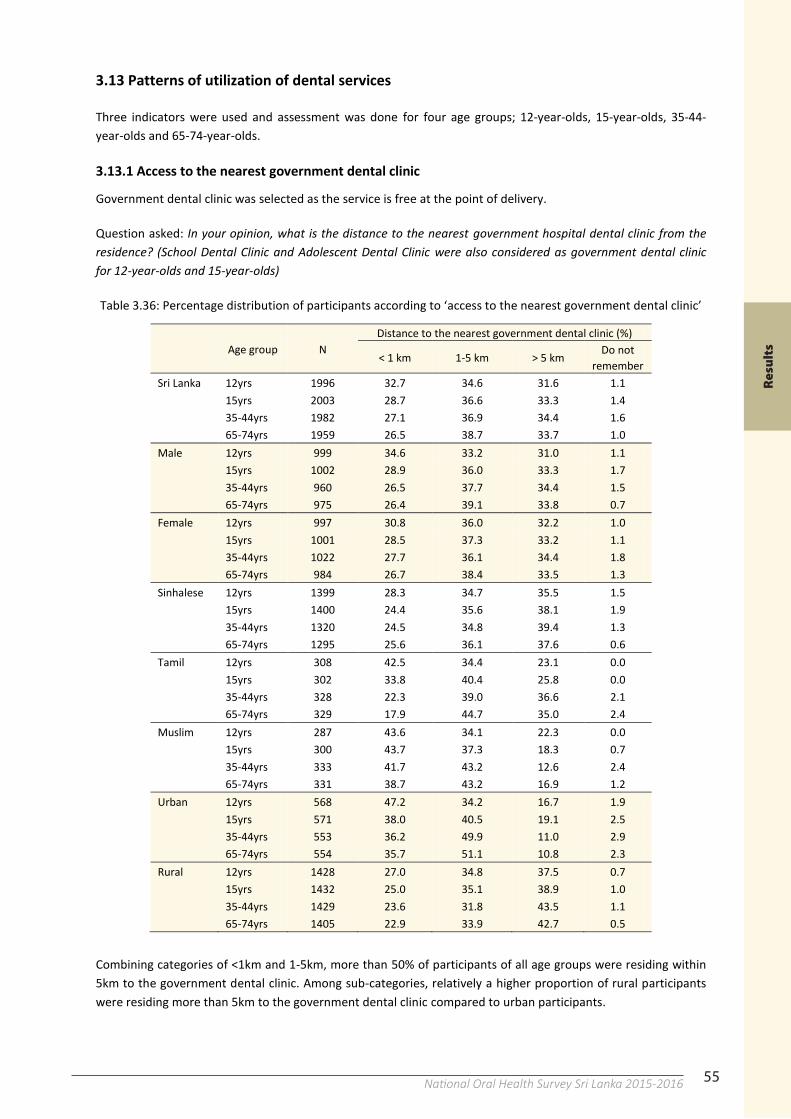
55National Oral Health Survey Sri Lanka 2015-201654
3.12 Treatment need for oral diseases
Treatment need was assessed by examiners (dentists) based on their clinical judgment.
Two basic types of treatment were considered.
Immediate care: any acute dental infection or OPMD/malignancy Routine care: dental care needed for any other reasons
Table 3.35: Percentage distribution of participants according to the need of dental treatment
Age group N Need of dental treatment (%)
No treatment needed
Routine care
Immediate care
Sri Lanka 5yrs 1995 37.4 61.8 0.8
12yrs 1996 36.9 62.6 0.5
15yrs 2003 33.6 65.6 0.8
35-44yrs 1982 14.5 84.2 1.3
65-74yrs 1959 15.1 84.0 0.9 Male 5yrs 1043 35.5 63.7 0.9
12yrs 999 35.9 63.7 0.4
15yrs 1002 31.8 67.3 0.9
35-44yrs 960 14.9 83.1 2.0
65-74yrs 975 15.0 83.6 1.4 Female 5yrs 952 39.5 59.8 0.7
12yrs 997 37.8 61.6 0.6
15yrs 1001 35.4 63.9 0.7
35-44yrs 1022 14.1 85.2 0.7
65-74yrs 984 15.1 84.5 0.4 Sinhalese 5yrs 1394 41.8 57.3 0.9
12yrs 1399 40.0 59.7 0.4
15yrs 1400 36.4 62.7 0.9
35-44yrs 1320 16.9 81.9 1.2
65-74yrs 1295 17.6 81.2 1.2 Tamil 5yrs 302 26.2 73.5 0.3
12yrs 308 26.9 72.1 1.0
15yrs 302 27.5 72.2 0.3
35-44yrs 328 6.7 91.2 2.1
65-74yrs 329 9.1 90.0 0.9 Muslim 5yrs 297 28.3 70.7 1.0
12yrs 287 32.4 66.9 0.7
15yrs 300 26.3 72.7 1.0
35-44yrs 333 12.3 86.8 0.9
65-74yrs 331 11.2 88.8 0.0 Urban 5yrs 568 37.5 62.0 0.5
12yrs 568 38.2 61.1 0.7
15yrs 571 34.7 64.8 0.5
35-44yrs 553 12.8 85.4 1.8
65-74yrs 554 11.6 87.5 0.9 Rural 5yrs 1427 37.4 61.7 0.9
12yrs 1428 36.3 63.2 0.4
15yrs 1432 33.2 65.9 0.9
35-44yrs 1429 15.1 83.8 1.1
65-74yrs 1405 16.4 82.6 0.9
Over 50% of participants in all age groups needed routine care. The need for treatment increased with increasing age. However, immediate care was needed only for a small percentage of participants.
55
3.13 Patterns of utilization of dental services
Three indicators were used and assessment was done for four age groups; 12-year-olds, 15-year-olds, 35-44-year-olds and 65-74-year-olds.
3.13.1 Access to the nearest government dental clinic
Government dental clinic was selected as the service is free at the point of delivery.
Question asked: In your opinion, what is the distance to the nearest government hospital dental clinic from the residence? (School Dental Clinic and Adolescent Dental Clinic were also considered as government dental clinic for 12-year-olds and 15-year-olds)
Table 3.36: Percentage distribution of participants according to ‘access to the nearest government dental clinic’
Age group N Distance to the nearest government dental clinic (%)
< 1 km 1-5 km > 5 km Do not
remember Sri Lanka 12yrs 1996 32.7 34.6 31.6 1.1
15yrs 2003 28.7 36.6 33.3 1.4
35-44yrs 1982 27.1 36.9 34.4 1.6
65-74yrs 1959 26.5 38.7 33.7 1.0
Male 12yrs 999 34.6 33.2 31.0 1.1
15yrs 1002 28.9 36.0 33.3 1.7
35-44yrs 960 26.5 37.7 34.4 1.5
65-74yrs 975 26.4 39.1 33.8 0.7
Female 12yrs 997 30.8 36.0 32.2 1.0
15yrs 1001 28.5 37.3 33.2 1.1
35-44yrs 1022 27.7 36.1 34.4 1.8
65-74yrs 984 26.7 38.4 33.5 1.3
Sinhalese 12yrs 1399 28.3 34.7 35.5 1.5
15yrs 1400 24.4 35.6 38.1 1.9
35-44yrs 1320 24.5 34.8 39.4 1.3
65-74yrs 1295 25.6 36.1 37.6 0.6
Tamil 12yrs 308 42.5 34.4 23.1 0.0
15yrs 302 33.8 40.4 25.8 0.0
35-44yrs 328 22.3 39.0 36.6 2.1
65-74yrs 329 17.9 44.7 35.0 2.4
Muslim 12yrs 287 43.6 34.1 22.3 0.0
15yrs 300 43.7 37.3 18.3 0.7
35-44yrs 333 41.7 43.2 12.6 2.4
65-74yrs 331 38.7 43.2 16.9 1.2
Urban 12yrs 568 47.2 34.2 16.7 1.9
15yrs 571 38.0 40.5 19.1 2.5
35-44yrs 553 36.2 49.9 11.0 2.9
65-74yrs 554 35.7 51.1 10.8 2.3
Rural 12yrs 1428 27.0 34.8 37.5 0.7
15yrs 1432 25.0 35.1 38.9 1.0
35-44yrs 1429 23.6 31.8 43.5 1.1
65-74yrs 1405 22.9 33.9 42.7 0.5
Combining categories of <1km and 1-5km, more than 50% of participants of all age groups were residing within 5km to the government dental clinic. Among sub-categories, relatively a higher proportion of rural participants were residing more than 5km to the government dental clinic compared to urban participants.
Res
ult
s

56 National Oral Health Survey Sri Lanka 2015-201656
3.13.2 Last visit to a dental clinic
Question asked: When did you last visit to a dental clinic?
Table 3.37: Percentage distribution of participants according to the ‘last visit to a dental clinic’
Age group N Last visit to a dental clinic (%)
Never visited
Within the last year
More than one year ago
Do not remember
Sri Lanka 12yrs 1996 14.7 59.6 22.0 3.8
15yrs 2003 15.2 31.4 46.6 6.8
35-44yrs 1982 9.7 30.9 53.9 5.4
65-74yrs 1959 19.7 18.4 46.9 15.0
Male 12yrs 999 15.5 58.7 22.5 3.3
15yrs 1002 15.4 27.4 50.2 7.0
35-44yrs 960 12.1 27.5 54.0 6.5
65-74yrs 975 21.0 17.7 46.1 15.2
Female 12yrs 997 13.8 60.5 21.5 4.2
15yrs 1001 15.0 35.4 43.1 6.6
35-44yrs 1022 7.5 34.1 53.8 4.5
65-74yrs 984 18.4 19.0 47.8 14.8
Sinhalese 12yrs 1399 8.6 64.1 22.7 4.5
15yrs 1400 9.8 31.9 51.3 7.1
35-44yrs 1320 8.0 30.7 55.6 5.8
65-74yrs 1295 16.8 18.4 49.2 15.6
Tamil 12yrs 308 30.2 49.7 18.2 1.9
15yrs 302 29.1 31.8 31.8 7.3
35-44yrs 328 17.4 28.0 48.5 6.1
65-74yrs 329 33.7 13.7 38.6 14.0
Muslim 12yrs 287 27.5 48.1 22.3 2.1
15yrs 300 26.3 29.0 39.7 5.0
35-44yrs 333 9.3 34.8 52.3 3.6
65-74yrs 331 17.2 23.0 46.5 13.3
Urban 12yrs 568 12.9 62.1 21.7 3.3
15yrs 571 16.3 35.2 42.7 5.8
35-44yrs 553 10.8 34.0 49.5 5.6
65-74yrs 554 21.3 19.9 45.5 13.4
Rural 12yrs 1428 15.4 58.5 22.1 3.9
15yrs 1432 14.7 29.9 48.2 7.2
35-44yrs 1429 9.3 29.7 55.6 5.4
65-74yrs 1405 19.1 17.8 47.5 15.7
In 12-year-olds, a majority had visited a dental clinic within the last year. In the other age groups, the majority had visited a dental clinic over a year ago.
Moreover, approximately 10-20% of participants in all age groups had never visited a dental clinic. Among sub-categories, this proportion was higher among Tamils compared to other two ethnic groups.
Res
ult
s
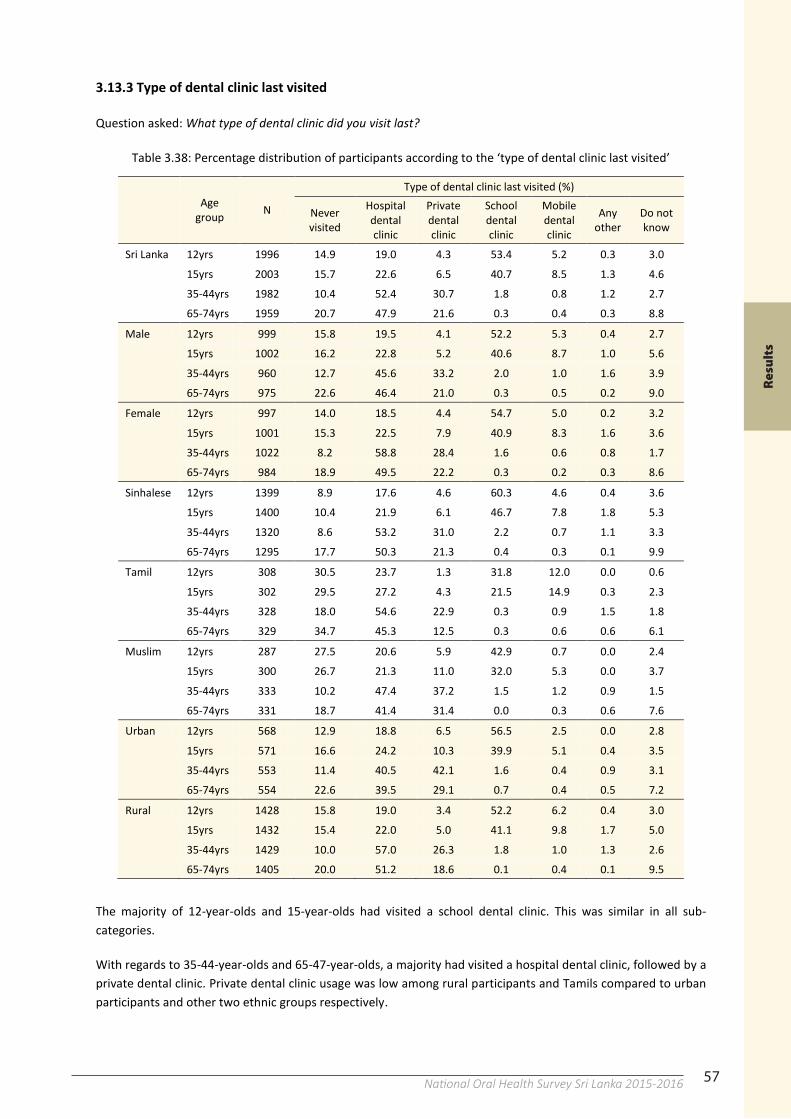
57National Oral Health Survey Sri Lanka 2015-201656
3.13.2 Last visit to a dental clinic
Question asked: When did you last visit to a dental clinic?
Table 3.37: Percentage distribution of participants according to the ‘last visit to a dental clinic’
Age group N Last visit to a dental clinic (%)
Never visited
Within the last year
More than one year ago
Do not remember
Sri Lanka 12yrs 1996 14.7 59.6 22.0 3.8
15yrs 2003 15.2 31.4 46.6 6.8
35-44yrs 1982 9.7 30.9 53.9 5.4
65-74yrs 1959 19.7 18.4 46.9 15.0
Male 12yrs 999 15.5 58.7 22.5 3.3
15yrs 1002 15.4 27.4 50.2 7.0
35-44yrs 960 12.1 27.5 54.0 6.5
65-74yrs 975 21.0 17.7 46.1 15.2
Female 12yrs 997 13.8 60.5 21.5 4.2
15yrs 1001 15.0 35.4 43.1 6.6
35-44yrs 1022 7.5 34.1 53.8 4.5
65-74yrs 984 18.4 19.0 47.8 14.8
Sinhalese 12yrs 1399 8.6 64.1 22.7 4.5
15yrs 1400 9.8 31.9 51.3 7.1
35-44yrs 1320 8.0 30.7 55.6 5.8
65-74yrs 1295 16.8 18.4 49.2 15.6
Tamil 12yrs 308 30.2 49.7 18.2 1.9
15yrs 302 29.1 31.8 31.8 7.3
35-44yrs 328 17.4 28.0 48.5 6.1
65-74yrs 329 33.7 13.7 38.6 14.0
Muslim 12yrs 287 27.5 48.1 22.3 2.1
15yrs 300 26.3 29.0 39.7 5.0
35-44yrs 333 9.3 34.8 52.3 3.6
65-74yrs 331 17.2 23.0 46.5 13.3
Urban 12yrs 568 12.9 62.1 21.7 3.3
15yrs 571 16.3 35.2 42.7 5.8
35-44yrs 553 10.8 34.0 49.5 5.6
65-74yrs 554 21.3 19.9 45.5 13.4
Rural 12yrs 1428 15.4 58.5 22.1 3.9
15yrs 1432 14.7 29.9 48.2 7.2
35-44yrs 1429 9.3 29.7 55.6 5.4
65-74yrs 1405 19.1 17.8 47.5 15.7
In 12-year-olds, a majority had visited a dental clinic within the last year. In the other age groups, the majority had visited a dental clinic over a year ago.
Moreover, approximately 10-20% of participants in all age groups had never visited a dental clinic. Among sub-categories, this proportion was higher among Tamils compared to other two ethnic groups.
57
3.13.3 Type of dental clinic last visited
Question asked: What type of dental clinic did you visit last?
Table 3.38: Percentage distribution of participants according to the ‘type of dental clinic last visited’
Age
group N
Type of dental clinic last visited (%)
Never visited
Hospital dental clinic
Private dental clinic
School dental clinic
Mobile dental clinic
Any other
Do not know
Sri Lanka 12yrs 1996 14.9 19.0 4.3 53.4 5.2 0.3 3.0
15yrs 2003 15.7 22.6 6.5 40.7 8.5 1.3 4.6
35-44yrs 1982 10.4 52.4 30.7 1.8 0.8 1.2 2.7
65-74yrs 1959 20.7 47.9 21.6 0.3 0.4 0.3 8.8
Male 12yrs 999 15.8 19.5 4.1 52.2 5.3 0.4 2.7
15yrs 1002 16.2 22.8 5.2 40.6 8.7 1.0 5.6
35-44yrs 960 12.7 45.6 33.2 2.0 1.0 1.6 3.9
65-74yrs 975 22.6 46.4 21.0 0.3 0.5 0.2 9.0
Female 12yrs 997 14.0 18.5 4.4 54.7 5.0 0.2 3.2
15yrs 1001 15.3 22.5 7.9 40.9 8.3 1.6 3.6
35-44yrs 1022 8.2 58.8 28.4 1.6 0.6 0.8 1.7
65-74yrs 984 18.9 49.5 22.2 0.3 0.2 0.3 8.6
Sinhalese 12yrs 1399 8.9 17.6 4.6 60.3 4.6 0.4 3.6
15yrs 1400 10.4 21.9 6.1 46.7 7.8 1.8 5.3
35-44yrs 1320 8.6 53.2 31.0 2.2 0.7 1.1 3.3
65-74yrs 1295 17.7 50.3 21.3 0.4 0.3 0.1 9.9
Tamil 12yrs 308 30.5 23.7 1.3 31.8 12.0 0.0 0.6
15yrs 302 29.5 27.2 4.3 21.5 14.9 0.3 2.3
35-44yrs 328 18.0 54.6 22.9 0.3 0.9 1.5 1.8
65-74yrs 329 34.7 45.3 12.5 0.3 0.6 0.6 6.1
Muslim 12yrs 287 27.5 20.6 5.9 42.9 0.7 0.0 2.4
15yrs 300 26.7 21.3 11.0 32.0 5.3 0.0 3.7
35-44yrs 333 10.2 47.4 37.2 1.5 1.2 0.9 1.5
65-74yrs 331 18.7 41.4 31.4 0.0 0.3 0.6 7.6
Urban 12yrs 568 12.9 18.8 6.5 56.5 2.5 0.0 2.8
15yrs 571 16.6 24.2 10.3 39.9 5.1 0.4 3.5
35-44yrs 553 11.4 40.5 42.1 1.6 0.4 0.9 3.1
65-74yrs 554 22.6 39.5 29.1 0.7 0.4 0.5 7.2
Rural 12yrs 1428 15.8 19.0 3.4 52.2 6.2 0.4 3.0
15yrs 1432 15.4 22.0 5.0 41.1 9.8 1.7 5.0
35-44yrs 1429 10.0 57.0 26.3 1.8 1.0 1.3 2.6
65-74yrs 1405 20.0 51.2 18.6 0.1 0.4 0.1 9.5
The majority of 12-year-olds and 15-year-olds had visited a school dental clinic. This was similar in all sub-categories.
With regards to 35-44-year-olds and 65-47-year-olds, a majority had visited a hospital dental clinic, followed by a private dental clinic. Private dental clinic usage was low among rural participants and Tamils compared to urban participants and other two ethnic groups respectively.
Res
ult
s
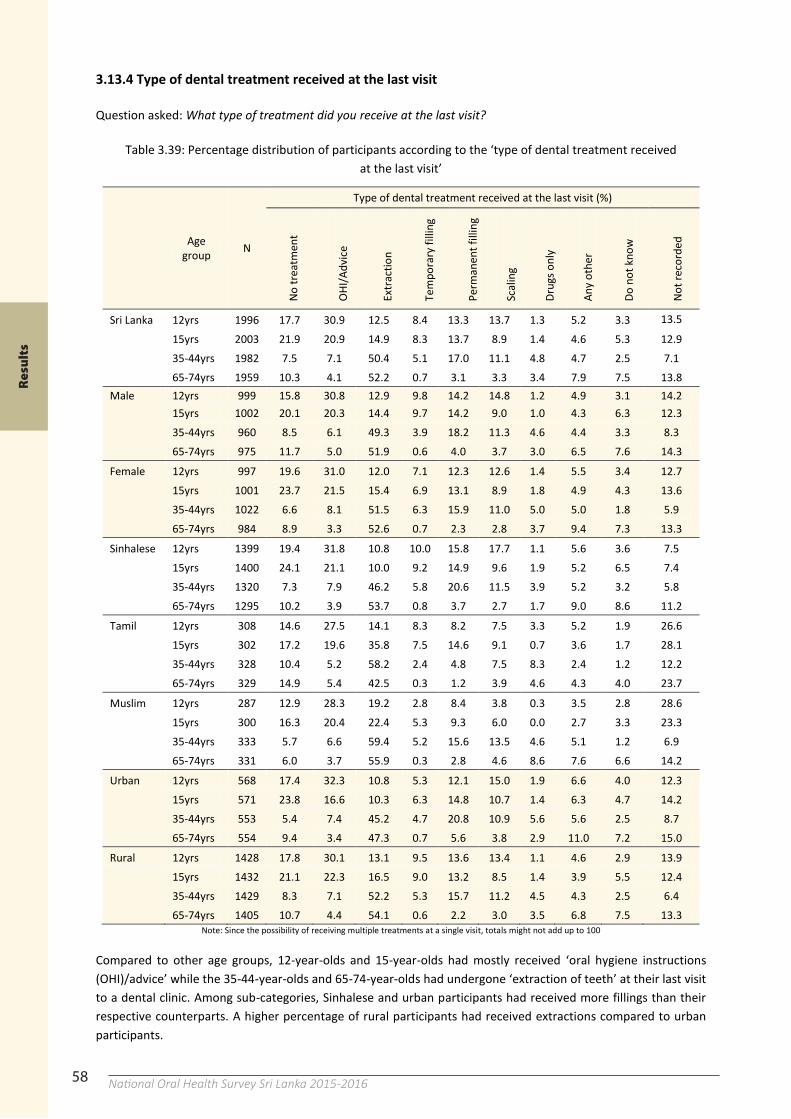
58 National Oral Health Survey Sri Lanka 2015-201658
3.13.4 Type of dental treatment received at the last visit
Question asked: What type of treatment did you receive at the last visit?
Table 3.39: Percentage distribution of participants according to the ‘type of dental treatment received at the last visit’
Age group N
Type of dental treatment received at the last visit (%)
No tr
eatm
ent
OHI/A
dvice
Extr
actio
n
Tem
pora
ry fi
lling
Perm
anen
t fill
ing
Scal
ing
Drug
s onl
y
Any
othe
r
Do n
ot k
now
Not r
ecor
ded
Sri Lanka 12yrs 1996 17.7 30.9 12.5 8.4 13.3 13.7 1.3 5.2 3.3 13.5
15yrs 2003 21.9 20.9 14.9 8.3 13.7 8.9 1.4 4.6 5.3 12.9
35-44yrs 1982 7.5 7.1 50.4 5.1 17.0 11.1 4.8 4.7 2.5 7.1
65-74yrs 1959 10.3 4.1 52.2 0.7 3.1 3.3 3.4 7.9 7.5 13.8
Male 12yrs 999 15.8 30.8 12.9 9.8 14.2 14.8 1.2 4.9 3.1 14.2
15yrs 1002 20.1 20.3 14.4 9.7 14.2 9.0 1.0 4.3 6.3 12.3
35-44yrs 960 8.5 6.1 49.3 3.9 18.2 11.3 4.6 4.4 3.3 8.3
65-74yrs 975 11.7 5.0 51.9 0.6 4.0 3.7 3.0 6.5 7.6 14.3
Female 12yrs 997 19.6 31.0 12.0 7.1 12.3 12.6 1.4 5.5 3.4 12.7
15yrs 1001 23.7 21.5 15.4 6.9 13.1 8.9 1.8 4.9 4.3 13.6
35-44yrs 1022 6.6 8.1 51.5 6.3 15.9 11.0 5.0 5.0 1.8 5.9
65-74yrs 984 8.9 3.3 52.6 0.7 2.3 2.8 3.7 9.4 7.3 13.3
Sinhalese 12yrs 1399 19.4 31.8 10.8 10.0 15.8 17.7 1.1 5.6 3.6 7.5
15yrs 1400 24.1 21.1 10.0 9.2 14.9 9.6 1.9 5.2 6.5 7.4
35-44yrs 1320 7.3 7.9 46.2 5.8 20.6 11.5 3.9 5.2 3.2 5.8
65-74yrs 1295 10.2 3.9 53.7 0.8 3.7 2.7 1.7 9.0 8.6 11.2
Tamil 12yrs 308 14.6 27.5 14.1 8.3 8.2 7.5 3.3 5.2 1.9 26.6
15yrs 302 17.2 19.6 35.8 7.5 14.6 9.1 0.7 3.6 1.7 28.1
35-44yrs 328 10.4 5.2 58.2 2.4 4.8 7.5 8.3 2.4 1.2 12.2
65-74yrs 329 14.9 5.4 42.5 0.3 1.2 3.9 4.6 4.3 4.0 23.7
Muslim 12yrs 287 12.9 28.3 19.2 2.8 8.4 3.8 0.3 3.5 2.8 28.6
15yrs 300 16.3 20.4 22.4 5.3 9.3 6.0 0.0 2.7 3.3 23.3
35-44yrs 333 5.7 6.6 59.4 5.2 15.6 13.5 4.6 5.1 1.2 6.9
65-74yrs 331 6.0 3.7 55.9 0.3 2.8 4.6 8.6 7.6 6.6 14.2
Urban 12yrs 568 17.4 32.3 10.8 5.3 12.1 15.0 1.9 6.6 4.0 12.3
15yrs 571 23.8 16.6 10.3 6.3 14.8 10.7 1.4 6.3 4.7 14.2
35-44yrs 553 5.4 7.4 45.2 4.7 20.8 10.9 5.6 5.6 2.5 8.7
65-74yrs 554 9.4 3.4 47.3 0.7 5.6 3.8 2.9 11.0 7.2 15.0
Rural 12yrs 1428 17.8 30.1 13.1 9.5 13.6 13.4 1.1 4.6 2.9 13.9
15yrs 1432 21.1 22.3 16.5 9.0 13.2 8.5 1.4 3.9 5.5 12.4
35-44yrs 1429 8.3 7.1 52.2 5.3 15.7 11.2 4.5 4.3 2.5 6.4
65-74yrs 1405 10.7 4.4 54.1 0.6 2.2 3.0 3.5 6.8 7.5 13.3
Note: Since the possibility of receiving multiple treatments at a single visit, totals might not add up to 100
Compared to other age groups, 12-year-olds and 15-year-olds had mostly received ‘oral hygiene instructions (OHI)/advice’ while the 35-44-year-olds and 65-74-year-olds had undergone ‘extraction of teeth’ at their last visit to a dental clinic. Among sub-categories, Sinhalese and urban participants had received more fillings than their respective counterparts. A higher percentage of rural participants had received extractions compared to urban participants.
Res
ult
s
59National Oral Health Survey Sri Lanka 2015-201658
3.13.4 Type of dental treatment received at the last visit
Question asked: What type of treatment did you receive at the last visit?
Table 3.39: Percentage distribution of participants according to the ‘type of dental treatment received at the last visit’
Age group N
Type of dental treatment received at the last visit (%)
No tr
eatm
ent
OHI/A
dvice
Extr
actio
n
Tem
pora
ry fi
lling
Perm
anen
t fill
ing
Scal
ing
Drug
s onl
y
Any
othe
r
Do n
ot k
now
Not r
ecor
ded
Sri Lanka 12yrs 1996 17.7 30.9 12.5 8.4 13.3 13.7 1.3 5.2 3.3 13.5
15yrs 2003 21.9 20.9 14.9 8.3 13.7 8.9 1.4 4.6 5.3 12.9
35-44yrs 1982 7.5 7.1 50.4 5.1 17.0 11.1 4.8 4.7 2.5 7.1
65-74yrs 1959 10.3 4.1 52.2 0.7 3.1 3.3 3.4 7.9 7.5 13.8
Male 12yrs 999 15.8 30.8 12.9 9.8 14.2 14.8 1.2 4.9 3.1 14.2
15yrs 1002 20.1 20.3 14.4 9.7 14.2 9.0 1.0 4.3 6.3 12.3
35-44yrs 960 8.5 6.1 49.3 3.9 18.2 11.3 4.6 4.4 3.3 8.3
65-74yrs 975 11.7 5.0 51.9 0.6 4.0 3.7 3.0 6.5 7.6 14.3
Female 12yrs 997 19.6 31.0 12.0 7.1 12.3 12.6 1.4 5.5 3.4 12.7
15yrs 1001 23.7 21.5 15.4 6.9 13.1 8.9 1.8 4.9 4.3 13.6
35-44yrs 1022 6.6 8.1 51.5 6.3 15.9 11.0 5.0 5.0 1.8 5.9
65-74yrs 984 8.9 3.3 52.6 0.7 2.3 2.8 3.7 9.4 7.3 13.3
Sinhalese 12yrs 1399 19.4 31.8 10.8 10.0 15.8 17.7 1.1 5.6 3.6 7.5
15yrs 1400 24.1 21.1 10.0 9.2 14.9 9.6 1.9 5.2 6.5 7.4
35-44yrs 1320 7.3 7.9 46.2 5.8 20.6 11.5 3.9 5.2 3.2 5.8
65-74yrs 1295 10.2 3.9 53.7 0.8 3.7 2.7 1.7 9.0 8.6 11.2
Tamil 12yrs 308 14.6 27.5 14.1 8.3 8.2 7.5 3.3 5.2 1.9 26.6
15yrs 302 17.2 19.6 35.8 7.5 14.6 9.1 0.7 3.6 1.7 28.1
35-44yrs 328 10.4 5.2 58.2 2.4 4.8 7.5 8.3 2.4 1.2 12.2
65-74yrs 329 14.9 5.4 42.5 0.3 1.2 3.9 4.6 4.3 4.0 23.7
Muslim 12yrs 287 12.9 28.3 19.2 2.8 8.4 3.8 0.3 3.5 2.8 28.6
15yrs 300 16.3 20.4 22.4 5.3 9.3 6.0 0.0 2.7 3.3 23.3
35-44yrs 333 5.7 6.6 59.4 5.2 15.6 13.5 4.6 5.1 1.2 6.9
65-74yrs 331 6.0 3.7 55.9 0.3 2.8 4.6 8.6 7.6 6.6 14.2
Urban 12yrs 568 17.4 32.3 10.8 5.3 12.1 15.0 1.9 6.6 4.0 12.3
15yrs 571 23.8 16.6 10.3 6.3 14.8 10.7 1.4 6.3 4.7 14.2
35-44yrs 553 5.4 7.4 45.2 4.7 20.8 10.9 5.6 5.6 2.5 8.7
65-74yrs 554 9.4 3.4 47.3 0.7 5.6 3.8 2.9 11.0 7.2 15.0
Rural 12yrs 1428 17.8 30.1 13.1 9.5 13.6 13.4 1.1 4.6 2.9 13.9
15yrs 1432 21.1 22.3 16.5 9.0 13.2 8.5 1.4 3.9 5.5 12.4
35-44yrs 1429 8.3 7.1 52.2 5.3 15.7 11.2 4.5 4.3 2.5 6.4
65-74yrs 1405 10.7 4.4 54.1 0.6 2.2 3.0 3.5 6.8 7.5 13.3
Note: Since the possibility of receiving multiple treatments at a single visit, totals might not add up to 100
Compared to other age groups, 12-year-olds and 15-year-olds had mostly received ‘oral hygiene instructions (OHI)/advice’ while the 35-44-year-olds and 65-74-year-olds had undergone ‘extraction of teeth’ at their last visit to a dental clinic. Among sub-categories, Sinhalese and urban participants had received more fillings than their respective counterparts. A higher percentage of rural participants had received extractions compared to urban participants.
59
Chapter 4
Discussion
The aim of this survey was to describe the oral disease patterns, treatment needs, oral health related practices and dental service utilization pattern in Sri Lankans. However, as these results will update the existing oral health databases on the Sri Lankan population, the results could be useful to assess the effectiveness of the oral healthcare services provided over the past years, for planning of oral health services at national, provincial and district levels as well as to compare the oral disease trends.
The survey guideline was based on the WHO Oral Health Survey Basic Methods 5th edition with some modifications to suit the requirements of the country. As a result, besides national figures, sex, ethnic, sector (urban/rural) and district variations of oral health status are also presented for better comparison.
When comparing the results of the present survey with previous oral health surveys, it is evident that there has been a reduction in the overall oral disease burden with an improvement in teeth cleaning habits in the Sri Lankan population. This is further substantiated by the fact that more people had their natural teeth and a reduction in the percentage of edentulousness. Moreover, the majority of the population resides within 5km of a government dental clinic and there has been an improvement in dental service utilization patterns.
Improvements in the awareness of the importance of oral health among the population with the availability of oral healthcare services over the years could be possible reasons for these observations. Further, involvement of multiple stakeholders in public awareness, screening, treatment provision programmes as well as the availability and increased use of fluoridated toothpastes could be major contributory factors.
However, according to the results, it was observed that extraction of tooth was the most common mode of treatment received by 35-44-year-olds and 65-74-year-olds and only a small percentage of the same age groups were wearing dentures despite a high percentage with missing teeth. In addition, over 50% of participants in all age groups needed routine dental care and only a few were in need of emergency dental care. Based on these results, it is reasonable to assume that Sri Lankan adults seek dental care only for emergencies, mostly when there is a need for extractions.
Since the present National Oral Health Survey was the first to assess dietary habits, the findings could be used as a bench mark for comparison of similar results in future surveys. However, when considering alcohol and tobacco usage, the results are consistent with other national studies conducted in Sri Lanka19. Low alcohol consumption and smoking habits among Sri Lankan females are known facts. Although the use of areca-nut in packets is an emerging trend among Sri Lankans, a low prevalence was observed in this survey. Under-reporting due to social stigma could be considered as a reason for this finding.
When considering age groups, a majority of 5-year-olds and 12-year-olds and substantial proportion of 15-year-olds had visited a government (school) dental clinic within the past year and most of them had received oral hygiene instructions or advice. However, there was still a considerable proportion of untreated dental disease in these age groups. The prevalence of calculus was nearly 50% and the proportion with active caries out of those who had experienced dental caries was approximately 80%. Compared to previous National Oral Health Surveys this was only a marginal reduction.
In contrast to urban participants, in general, rural participants had a higher oral disease burden, poor oral health practices and also received relatively more extractions over fillings for their oral diseases. Moreover, despite a higher proportion of rural participants residing more than 5km distance to government dental clinics compared to the urban participants, they still utilize public services to obtain dental treatments. Similar pattern was observed in Tamils when compared to other two ethnic groups.
Dis
cuss
ion
60 National Oral Health Survey Sri Lanka 2015-201660
Delayed presentation to the services due to poor awareness about appropriate treatment options, inadequacy of treatment facilities at oral healthcare delivery points that they received dental treatment, poor affordability of services at private dental clinics could be possible reasons for the above observations. However, since the present survey was only providing a snap-shot view of the picture, detailed studies are necessary to make conclusions.
There are a few limitations to this survey. Due to clustering effect and relatively small cluster size (20 from each age group), the error margin for district-based values are comparatively high for some districts where only one cluster was selected. Therefore, district-based results on such districts should be interpreted cautiously.
Enamel fluorosis status of the population may not have been reflected correctly due to its endemic nature as well as the pattern of distribution of the condition is not based on district boundaries. Therefore, district-based results on enamel fluorosis presented in this report should be interpreted carefully. Moreover, even though broad patterns were observed, this survey may not give an accurate estimate of diseases with low prevalence (oral mucosal lesions, root caries, tooth-wear) due to inadequate sample sizes for certain sub-categories. Furthermore, since the assessment of oral health related habit patterns were based on a single interviewer-administered question, there is possibility of recall-bias and/or under-reporting due to social desirability bias affecting this information.
Dis
cuss
ion
61National Oral Health Survey Sri Lanka 2015-201660
Delayed presentation to the services due to poor awareness about appropriate treatment options, inadequacy of treatment facilities at oral healthcare delivery points that they received dental treatment, poor affordability of services at private dental clinics could be possible reasons for the above observations. However, since the present survey was only providing a snap-shot view of the picture, detailed studies are necessary to make conclusions.
There are a few limitations to this survey. Due to clustering effect and relatively small cluster size (20 from each age group), the error margin for district-based values are comparatively high for some districts where only one cluster was selected. Therefore, district-based results on such districts should be interpreted cautiously.
Enamel fluorosis status of the population may not have been reflected correctly due to its endemic nature as well as the pattern of distribution of the condition is not based on district boundaries. Therefore, district-based results on enamel fluorosis presented in this report should be interpreted carefully. Moreover, even though broad patterns were observed, this survey may not give an accurate estimate of diseases with low prevalence (oral mucosal lesions, root caries, tooth-wear) due to inadequate sample sizes for certain sub-categories. Furthermore, since the assessment of oral health related habit patterns were based on a single interviewer-administered question, there is possibility of recall-bias and/or under-reporting due to social desirability bias affecting this information.
61
Chapter 5
Conclusions and recommendations
When compared to the previous National Oral Health Surveys, there has been a reduction in the oral disease burden and an improvement in oral health related habits of the Sri Lankan population irrespective of age, sex, ethnic and sector variations. Moreover, there has been an improvement in oral healthcare seeking pattern of the population. It was also noticed that the majority of the population reside within 5km distance to a government dental clinic.
However, some observations need considerable attention. The untreated disease proportion of population appeared to be high and they essentially seek treatments for dental emergencies. When comparing with similar figures of previous National Oral Health Surveys, this was only a marginal reduction. Moreover, rural population and Tamils had higher disease burden and poor oral health practices compared to urban population and other two ethnic groups respectively. Therefore, the above issues should be addressed to improve oral health status of the Sri Lankan population.
Considering the methodology of the survey, refined assessment criteria and sampling methodology are warranted for future surveys to capture detailed district variations of disease burden and related habits.
Co
ncl
usi
on
s an
d
reco
mm
end
atio
n
62 National Oral Health Survey Sri Lanka 2015-2016
Co
ncl
usi
on
s an
d
reco
mm
end
atio
n
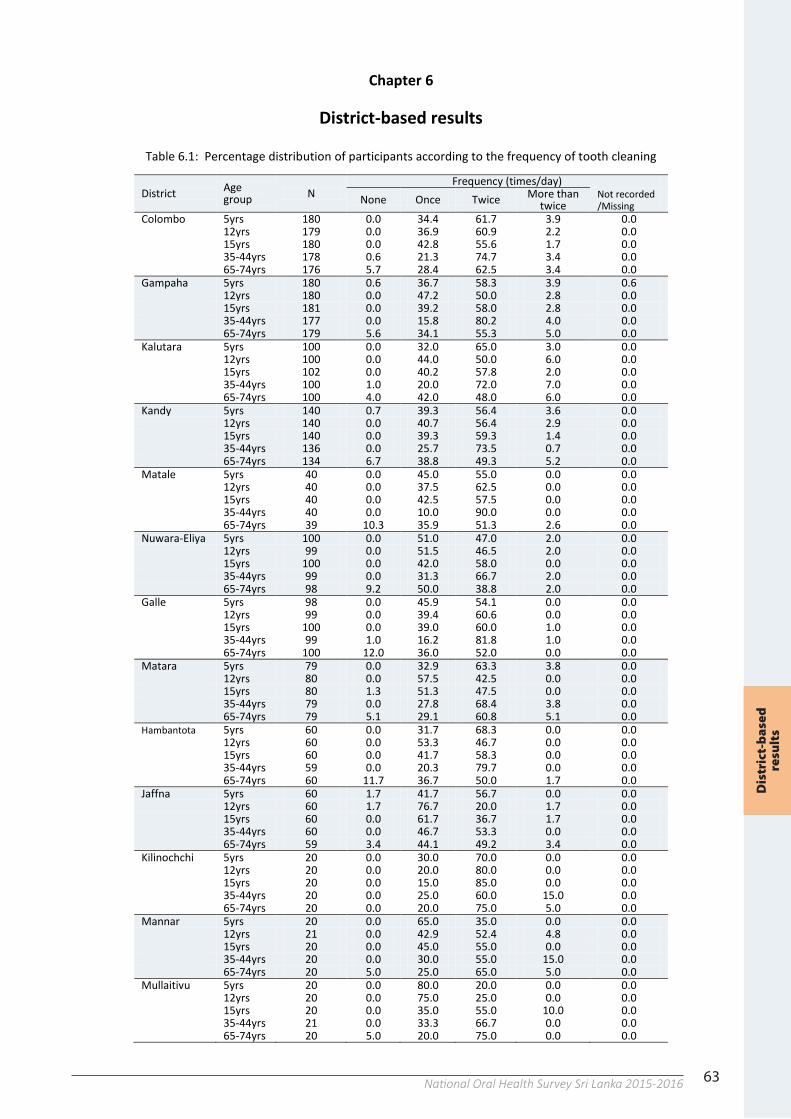
63National Oral Health Survey Sri Lanka 2015-201663
Chapter 6
District-based results
Table 6.1: Percentage distribution of participants according to the frequency of tooth cleaning
District Age group N
Frequency (times/day) None Once Twice More than
twice Not recorded /Missing
Colombo 5yrs 180 0.0 34.4 61.7 3.9 0.0 12yrs 179 0.0 36.9 60.9 2.2 0.0 15yrs 180 0.0 42.8 55.6 1.7 0.0 35-44yrs 178 0.6 21.3 74.7 3.4 0.0 65-74yrs 176 5.7 28.4 62.5 3.4 0.0 Gampaha 5yrs 180 0.6 36.7 58.3 3.9 0.6 12yrs 180 0.0 47.2 50.0 2.8 0.0 15yrs 181 0.0 39.2 58.0 2.8 0.0 35-44yrs 177 0.0 15.8 80.2 4.0 0.0 65-74yrs 179 5.6 34.1 55.3 5.0 0.0 Kalutara 5yrs 100 0.0 32.0 65.0 3.0 0.0 12yrs 100 0.0 44.0 50.0 6.0 0.0 15yrs 102 0.0 40.2 57.8 2.0 0.0 35-44yrs 100 1.0 20.0 72.0 7.0 0.0 65-74yrs 100 4.0 42.0 48.0 6.0 0.0 Kandy 5yrs 140 0.7 39.3 56.4 3.6 0.0 12yrs 140 0.0 40.7 56.4 2.9 0.0 15yrs 140 0.0 39.3 59.3 1.4 0.0 35-44yrs 136 0.0 25.7 73.5 0.7 0.0 65-74yrs 134 6.7 38.8 49.3 5.2 0.0 Matale 5yrs 40 0.0 45.0 55.0 0.0 0.0 12yrs 40 0.0 37.5 62.5 0.0 0.0 15yrs 40 0.0 42.5 57.5 0.0 0.0 35-44yrs 40 0.0 10.0 90.0 0.0 0.0 65-74yrs 39 10.3 35.9 51.3 2.6 0.0 Nuwara-Eliya 5yrs 100 0.0 51.0 47.0 2.0 0.0 12yrs 99 0.0 51.5 46.5 2.0 0.0 15yrs 100 0.0 42.0 58.0 0.0 0.0 35-44yrs 99 0.0 31.3 66.7 2.0 0.0 65-74yrs 98 9.2 50.0 38.8 2.0 0.0 Galle 5yrs 98 0.0 45.9 54.1 0.0 0.0 12yrs 99 0.0 39.4 60.6 0.0 0.0 15yrs 100 0.0 39.0 60.0 1.0 0.0 35-44yrs 99 1.0 16.2 81.8 1.0 0.0 65-74yrs 100 12.0 36.0 52.0 0.0 0.0 Matara 5yrs 79 0.0 32.9 63.3 3.8 0.0 12yrs 80 0.0 57.5 42.5 0.0 0.0 15yrs 80 1.3 51.3 47.5 0.0 0.0 35-44yrs 79 0.0 27.8 68.4 3.8 0.0 65-74yrs 79 5.1 29.1 60.8 5.1 0.0 Hambantota 5yrs 60 0.0 31.7 68.3 0.0 0.0 12yrs 60 0.0 53.3 46.7 0.0 0.0 15yrs 60 0.0 41.7 58.3 0.0 0.0 35-44yrs 59 0.0 20.3 79.7 0.0 0.0 65-74yrs 60 11.7 36.7 50.0 1.7 0.0 Jaffna 5yrs 60 1.7 41.7 56.7 0.0 0.0 12yrs 60 1.7 76.7 20.0 1.7 0.0 15yrs 60 0.0 61.7 36.7 1.7 0.0 35-44yrs 60 0.0 46.7 53.3 0.0 0.0 65-74yrs 59 3.4 44.1 49.2 3.4 0.0 Kilinochchi 5yrs 20 0.0 30.0 70.0 0.0 0.0 12yrs 20 0.0 20.0 80.0 0.0 0.0 15yrs 20 0.0 15.0 85.0 0.0 0.0 35-44yrs 20 0.0 25.0 60.0 15.0 0.0 65-74yrs 20 0.0 20.0 75.0 5.0 0.0 Mannar 5yrs 20 0.0 65.0 35.0 0.0 0.0 12yrs 21 0.0 42.9 52.4 4.8 0.0 15yrs 20 0.0 45.0 55.0 0.0 0.0 35-44yrs 20 0.0 30.0 55.0 15.0 0.0 65-74yrs 20 5.0 25.0 65.0 5.0 0.0 Mullaitivu 5yrs 20 0.0 80.0 20.0 0.0 0.0 12yrs 20 0.0 75.0 25.0 0.0 0.0 15yrs 20 0.0 35.0 55.0 10.0 0.0 35-44yrs 21 0.0 33.3 66.7 0.0 0.0 65-74yrs 20 5.0 20.0 75.0 0.0 0.0
Res
ult
sR
esu
lts
Dis
tric
t-b
ased
re
sult
s
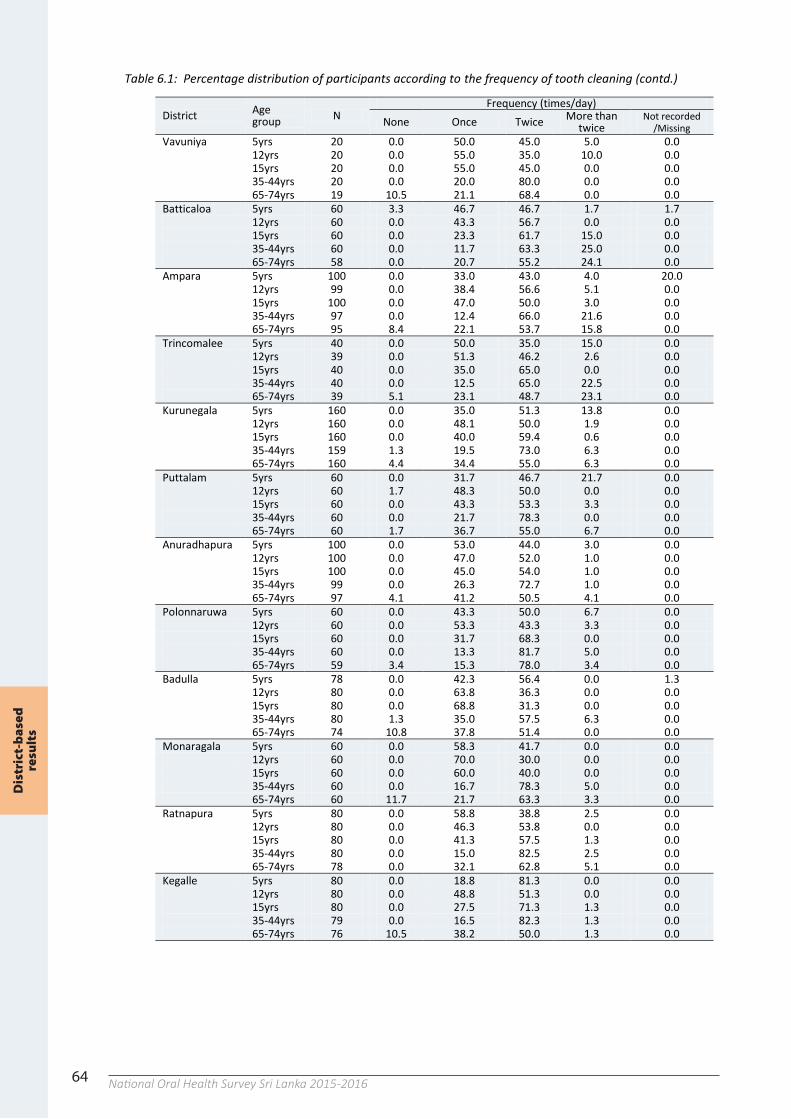
64 National Oral Health Survey Sri Lanka 2015-201664
Table 6.1: Percentage distribution of participants according to the frequency of tooth cleaning (contd.)
District Age group N
Frequency (times/day) None Once Twice More than
twice Not recorded
/Missing Vavuniya 5yrs 20 0.0 50.0 45.0 5.0 0.0 12yrs 20 0.0 55.0 35.0 10.0 0.0 15yrs 20 0.0 55.0 45.0 0.0 0.0 35-44yrs 20 0.0 20.0 80.0 0.0 0.0 65-74yrs 19 10.5 21.1 68.4 0.0 0.0 Batticaloa 5yrs 60 3.3 46.7 46.7 1.7 1.7 12yrs 60 0.0 43.3 56.7 0.0 0.0 15yrs 60 0.0 23.3 61.7 15.0 0.0 35-44yrs 60 0.0 11.7 63.3 25.0 0.0 65-74yrs 58 0.0 20.7 55.2 24.1 0.0 Ampara 5yrs 100 0.0 33.0 43.0 4.0 20.0 12yrs 99 0.0 38.4 56.6 5.1 0.0 15yrs 100 0.0 47.0 50.0 3.0 0.0 35-44yrs 97 0.0 12.4 66.0 21.6 0.0 65-74yrs 95 8.4 22.1 53.7 15.8 0.0 Trincomalee 5yrs 40 0.0 50.0 35.0 15.0 0.0 12yrs 39 0.0 51.3 46.2 2.6 0.0 15yrs 40 0.0 35.0 65.0 0.0 0.0 35-44yrs 40 0.0 12.5 65.0 22.5 0.0 65-74yrs 39 5.1 23.1 48.7 23.1 0.0 Kurunegala 5yrs 160 0.0 35.0 51.3 13.8 0.0 12yrs 160 0.0 48.1 50.0 1.9 0.0 15yrs 160 0.0 40.0 59.4 0.6 0.0 35-44yrs 159 1.3 19.5 73.0 6.3 0.0 65-74yrs 160 4.4 34.4 55.0 6.3 0.0 Puttalam 5yrs 60 0.0 31.7 46.7 21.7 0.0 12yrs 60 1.7 48.3 50.0 0.0 0.0 15yrs 60 0.0 43.3 53.3 3.3 0.0 35-44yrs 60 0.0 21.7 78.3 0.0 0.0 65-74yrs 60 1.7 36.7 55.0 6.7 0.0 Anuradhapura 5yrs 100 0.0 53.0 44.0 3.0 0.0 12yrs 100 0.0 47.0 52.0 1.0 0.0 15yrs 100 0.0 45.0 54.0 1.0 0.0 35-44yrs 99 0.0 26.3 72.7 1.0 0.0 65-74yrs 97 4.1 41.2 50.5 4.1 0.0 Polonnaruwa 5yrs 60 0.0 43.3 50.0 6.7 0.0 12yrs 60 0.0 53.3 43.3 3.3 0.0 15yrs 60 0.0 31.7 68.3 0.0 0.0 35-44yrs 60 0.0 13.3 81.7 5.0 0.0 65-74yrs 59 3.4 15.3 78.0 3.4 0.0 Badulla 5yrs 78 0.0 42.3 56.4 0.0 1.3 12yrs 80 0.0 63.8 36.3 0.0 0.0 15yrs 80 0.0 68.8 31.3 0.0 0.0 35-44yrs 80 1.3 35.0 57.5 6.3 0.0 65-74yrs 74 10.8 37.8 51.4 0.0 0.0 Monaragala 5yrs 60 0.0 58.3 41.7 0.0 0.0 12yrs 60 0.0 70.0 30.0 0.0 0.0 15yrs 60 0.0 60.0 40.0 0.0 0.0 35-44yrs 60 0.0 16.7 78.3 5.0 0.0 65-74yrs 60 11.7 21.7 63.3 3.3 0.0 Ratnapura 5yrs 80 0.0 58.8 38.8 2.5 0.0 12yrs 80 0.0 46.3 53.8 0.0 0.0 15yrs 80 0.0 41.3 57.5 1.3 0.0 35-44yrs 80 0.0 15.0 82.5 2.5 0.0 65-74yrs 78 0.0 32.1 62.8 5.1 0.0 Kegalle 5yrs 80 0.0 18.8 81.3 0.0 0.0 12yrs 80 0.0 48.8 51.3 0.0 0.0 15yrs 80 0.0 27.5 71.3 1.3 0.0 35-44yrs 79 0.0 16.5 82.3 1.3 0.0 65-74yrs 76 10.5 38.2 50.0 1.3 0.0
Dis
tric
t-b
ased
re
sult
s
65National Oral Health Survey Sri Lanka 2015-201664
Table 6.1: Percentage distribution of participants according to the frequency of tooth cleaning (contd.)
District Age group N
Frequency (times/day) None Once Twice More than
twice Not recorded
/Missing Vavuniya 5yrs 20 0.0 50.0 45.0 5.0 0.0 12yrs 20 0.0 55.0 35.0 10.0 0.0 15yrs 20 0.0 55.0 45.0 0.0 0.0 35-44yrs 20 0.0 20.0 80.0 0.0 0.0 65-74yrs 19 10.5 21.1 68.4 0.0 0.0 Batticaloa 5yrs 60 3.3 46.7 46.7 1.7 1.7 12yrs 60 0.0 43.3 56.7 0.0 0.0 15yrs 60 0.0 23.3 61.7 15.0 0.0 35-44yrs 60 0.0 11.7 63.3 25.0 0.0 65-74yrs 58 0.0 20.7 55.2 24.1 0.0 Ampara 5yrs 100 0.0 33.0 43.0 4.0 20.0 12yrs 99 0.0 38.4 56.6 5.1 0.0 15yrs 100 0.0 47.0 50.0 3.0 0.0 35-44yrs 97 0.0 12.4 66.0 21.6 0.0 65-74yrs 95 8.4 22.1 53.7 15.8 0.0 Trincomalee 5yrs 40 0.0 50.0 35.0 15.0 0.0 12yrs 39 0.0 51.3 46.2 2.6 0.0 15yrs 40 0.0 35.0 65.0 0.0 0.0 35-44yrs 40 0.0 12.5 65.0 22.5 0.0 65-74yrs 39 5.1 23.1 48.7 23.1 0.0 Kurunegala 5yrs 160 0.0 35.0 51.3 13.8 0.0 12yrs 160 0.0 48.1 50.0 1.9 0.0 15yrs 160 0.0 40.0 59.4 0.6 0.0 35-44yrs 159 1.3 19.5 73.0 6.3 0.0 65-74yrs 160 4.4 34.4 55.0 6.3 0.0 Puttalam 5yrs 60 0.0 31.7 46.7 21.7 0.0 12yrs 60 1.7 48.3 50.0 0.0 0.0 15yrs 60 0.0 43.3 53.3 3.3 0.0 35-44yrs 60 0.0 21.7 78.3 0.0 0.0 65-74yrs 60 1.7 36.7 55.0 6.7 0.0 Anuradhapura 5yrs 100 0.0 53.0 44.0 3.0 0.0 12yrs 100 0.0 47.0 52.0 1.0 0.0 15yrs 100 0.0 45.0 54.0 1.0 0.0 35-44yrs 99 0.0 26.3 72.7 1.0 0.0 65-74yrs 97 4.1 41.2 50.5 4.1 0.0 Polonnaruwa 5yrs 60 0.0 43.3 50.0 6.7 0.0 12yrs 60 0.0 53.3 43.3 3.3 0.0 15yrs 60 0.0 31.7 68.3 0.0 0.0 35-44yrs 60 0.0 13.3 81.7 5.0 0.0 65-74yrs 59 3.4 15.3 78.0 3.4 0.0 Badulla 5yrs 78 0.0 42.3 56.4 0.0 1.3 12yrs 80 0.0 63.8 36.3 0.0 0.0 15yrs 80 0.0 68.8 31.3 0.0 0.0 35-44yrs 80 1.3 35.0 57.5 6.3 0.0 65-74yrs 74 10.8 37.8 51.4 0.0 0.0 Monaragala 5yrs 60 0.0 58.3 41.7 0.0 0.0 12yrs 60 0.0 70.0 30.0 0.0 0.0 15yrs 60 0.0 60.0 40.0 0.0 0.0 35-44yrs 60 0.0 16.7 78.3 5.0 0.0 65-74yrs 60 11.7 21.7 63.3 3.3 0.0 Ratnapura 5yrs 80 0.0 58.8 38.8 2.5 0.0 12yrs 80 0.0 46.3 53.8 0.0 0.0 15yrs 80 0.0 41.3 57.5 1.3 0.0 35-44yrs 80 0.0 15.0 82.5 2.5 0.0 65-74yrs 78 0.0 32.1 62.8 5.1 0.0 Kegalle 5yrs 80 0.0 18.8 81.3 0.0 0.0 12yrs 80 0.0 48.8 51.3 0.0 0.0 15yrs 80 0.0 27.5 71.3 1.3 0.0 35-44yrs 79 0.0 16.5 82.3 1.3 0.0 65-74yrs 76 10.5 38.2 50.0 1.3 0.0
65
Table 6.2: Percentage distribution of participants according to the mode of tooth cleaning
District Age group N None Brush Finger Other* Not
recorded /Missing
Colombo 5yrs 180 0.0 99.4 0.6 0.0 0.0
12yrs 179 0.0 98.9 1.1 0.0 0.0
15yrs 180 0.0 98.9 1.1 0.0 0.0
35-44yrs 178 0.0 97.8 1.7 0.6 0.0
65-74yrs 176 2.3 76.7 18.2 2.3 0.6 Gampaha 5yrs 180 0.0 99.4 0.0 0.0 0.6
12yrs 180 0.0 97.8 2.2 0.0 0.0
15yrs 181 0.0 99.4 0.6 0.0 0.0
35-44yrs 177 0.0 97.7 2.3 0.0 0.0
65-74yrs 179 0.6 78.2 17.3 1.1 2.8 Kalutara 5yrs 100 0.0 99.0 1.0 0.0 0.0
12yrs 100 0.0 98.0 2.0 0.0 0.0
15yrs 102 0.0 100.0 0.0 0.0 0.0
35-44yrs 100 0.0 98.0 1.0 1.0 0.0
65-74yrs 100 3.0 76.0 16.0 5.0 0.0 Kandy 5yrs 140 0.0 99.3 0.7 0.0 0.0
12yrs 140 0.0 99.3 0.7 0.0 0.0
15yrs 140 0.0 100.0 0.0 0.0 0.0
35-44yrs 136 0.0 100.0 0.0 0.0 0.0
65-74yrs 134 3.0 74.6 18.7 0.0 3.7 Matale 5yrs 40 0.0 100.0 0.0 0.0 0.0
12yrs 40 0.0 100.0 0.0 0.0 0.0
15yrs 40 0.0 100.0 0.0 0.0 0.0
35-44yrs 40 0.0 100.0 0.0 0.0 0.0
65-74yrs 39 10.3 64.1 25.6 0.0 0.0 Nuwara-Eliya 5yrs 100 0.0 100.0 0.0 0.0 0.0
12yrs 99 0.0 100.0 0.0 0.0 0.0
15yrs 100 0.0 100.0 0.0 0.0 0.0
35-44yrs 99 0.0 88.9 11.1 0.0 0.0
65-74yrs 98 1.0 57.1 34.7 0.0 7.1 Galle 5yrs 98 0.0 99.0 1.0 0.0 0.0
12yrs 99 0.0 100.0 0.0 0.0 0.0
15yrs 100 0.0 100.0 0.0 0.0 0.0
35-44yrs 99 0.0 97.0 1.0 1.0 1.0
65-74yrs 100 4.0 69.0 20.0 4.0 3.0 Matara 5yrs 79 0.0 98.7 1.3 0.0 0.0
12yrs 80 0.0 100.0 0.0 0.0 0.0
15yrs 80 0.0 100.0 0.0 0.0 0.0
35-44yrs 79 0.0 98.7 1.3 0.0 0.0
65-74yrs 79 3.8 81.0 11.4 2.5 1.3 Hambantota 5yrs 60 0.0 100.0 0.0 0.0 0.0
12yrs 60 0.0 100.0 0.0 0.0 0.0
15yrs 60 0.0 100.0 0.0 0.0 0.0
35-44yrs 59 0.0 100.0 0.0 0.0 0.0
65-74yrs 60 6.7 56.7 30.0 5.0 1.7 Jaffna 5yrs 60 0.0 81.7 16.7 1.7 0.0
12yrs 60 0.0 75.0 25.0 0.0 0.0
15yrs 60 0.0 81.7 18.3 0.0 0.0
35-44yrs 60 0.0 55.0 43.3 0.0 1.7
65-74yrs 59 1.7 57.6 40.7 0.0 0.0 Kilinochchi 5yrs 20 0.0 85.0 15.0 0.0 0.0
12yrs 20 0.0 95.0 5.0 0.0 0.0
15yrs 20 0.0 100.0 0.0 0.0 0.0
35-44yrs 20 0.0 100.0 0.0 0.0 0.0
65-74yrs 20 0.0 65.0 35.0 0.0 0.0 Mannar 5yrs 20 0.0 100.0 0.0 0.0 0.0
12yrs 21 0.0 85.7 14.3 0.0 0.0
15yrs 20 0.0 100.0 0.0 0.0 0.0
35-44yrs 20 0.0 95.0 5.0 0.0 0.0
65-74yrs 20 5.0 50.0 40.0 5.0 0.0 Mullaitivu 5yrs 20 0.0 85.0 15.0 0.0 0.0
12yrs 20 0.0 65.0 35.0 0.0 0.0
15yrs 20 0.0 75.0 25.0 0.0 0.0
35-44yrs 21 0.0 85.7 9.5 4.8 0.0
65-74yrs 20 0.0 20.0 75.0 5.0 0.0
Dis
tric
t-b
ased
re
sult
s
66 National Oral Health Survey Sri Lanka 2015-201666
Table 6.2: Percentage of distribution of participants according to the mode of tooth cleaning (contd.)
District Age group N None Brush Finger Other*
Not recorded /Missing
Vavuniya 5yrs 20 0.0 100.0 0.0 0.0 0.0
12yrs 20 0.0 95.0 5.0 0.0 0.0
15yrs 20 0.0 100.0 0.0 0.0 0.0
35-44yrs 20 0.0 100.0 0.0 0.0 0.0
65-74yrs 19 10.5 31.6 57.9 0.0 0.0 Batticaloa 5yrs 60 3.3 83.3 11.7 0.0 1.7
12yrs 60 0.0 95.0 5.0 0.0 0.0
15yrs 60 0.0 96.7 3.3 0.0 0.0
35-44yrs 60 0.0 96.7 1.7 1.7 0.0
65-74yrs 58 0.0 50.0 43.1 6.9 0.0 Ampara 5yrs 100 0.0 77.0 3.0 0.0 20.0
12yrs 99 0.0 97.0 3.0 0.0 0.0
15yrs 100 0.0 100.0 0.0 0.0 0.0
35-44yrs 97 0.0 97.9 2.1 0.0 0.0
65-74yrs 95 3.2 70.5 21.1 0.0 2.1 Trincomalee 5yrs 40 0.0 97.5 2.5 0.0 0.0
12yrs 39 0.0 87.2 12.8 0.0 0.0
15yrs 40 0.0 87.5 12.5 0.0 0.0
35-44yrs 40 0.0 97.5 2.5 0.0 0.0
65-74yrs 39 2.6 61.5 33.3 0.0 2.6 Kurunegala 5yrs 160 0.0 99.4 0.6 0.0 0.0
12yrs 160 0.0 99.4 0.6 0.0 0.0
15yrs 160 0.0 99.4 0.0 0.6 0.0
35-44yrs 159 0.0 96.2 3.1 0.0 0.6
65-74yrs 160 0.0 78.1 18.1 0.0 1.9 Puttalam 5yrs 60 0.0 100.0 0.0 0.0 0.0
12yrs 60 0.0 100.0 0.0 0.0 0.0
15yrs 60 0.0 98.3 1.7 0.0 0.0
35-44yrs 60 0.0 93.3 6.7 0.0 0.0
65-74yrs 60 0.0 78.3 21.7 0.0 0.0 Anuradhapura 5yrs 100 0.0 97.0 2.0 1.0 0.0
12yrs 100 0.0 100.0 0.0 0.0 0.0
15yrs 100 0.0 99.0 1.0 0.0 0.0
35-44yrs 99 0.0 97.0 3.0 0.0 0.0
65-74yrs 97 1.0 74.2 20.6 3.1 1.0 Polonnaruwa 5yrs 60 0.0 100.0 0.0 0.0 0.0
12yrs 60 0.0 100.0 0.0 0.0 0.0
15yrs 60 0.0 98.3 1.7 0.0 0.0
35-44yrs 60 0.0 100.0 0.0 0.0 0.0
65-74yrs 59 3.4 83.1 13.6 0.0 0.0 Badulla 5yrs 78 0.0 97.4 1.3 0.0 1.3
12yrs 80 0.0 100.0 0.0 0.0 0.0
15yrs 80 0.0 98.8 1.3 0.0 0.0
35-44yrs 80 0.0 96.3 3.8 0.0 0.0
65-74yrs 74 5.4 68.9 21.6 1.4 2.7 Monaragala 5yrs 60 0.0 96.7 3.3 0.0 0.0
12yrs 60 0.0 100.0 0.0 0.0 0.0
15yrs 60 0.0 100.0 0.0 0.0 0.0
35-44yrs 60 0.0 98.3 1.7 0.0 0.0
65-74yrs 60 8.3 71.7 16.7 0.0 3.3 Ratnapura 5yrs 80 0.0 100.0 0.0 0.0 0.0
12yrs 80 0.0 98.8 1.3 0.0 0.0
15yrs 80 0.0 100.0 0.0 0.0 0.0
35-44yrs 80 0.0 96.3 3.8 0.0 0.0
65-74yrs 78 0.0 67.9 32.1 0.0 0.0 Kegalle 5yrs 80 0.0 100.0 0.0 0.0 0.0
12yrs 80 0.0 100.0 0.0 0.0 0.0
15yrs 80 0.0 98.8 1.3 0.0 0.0
35-44yrs 79 0.0 98.7 1.3 0.0 0.0
65-74yrs 76 7.9 71.1 17.1 3.96 0.0
67
Table 6.3: Percentage distribution of participants according to the type of ingredients used for tooth cleaning
District Age group N None Fluoridated toothpaste
Non-fluoridated toothpaste
Tooth powder Other Not recorded
/Missing Colombo 5yrs 180 0.0 77.8 12.8 1.7 7.8 0.0
12yrs 179 0.0 85.5 11.2 1.1 2.2 0.0
15yrs 180 0.0 84.4 15.6 0.0 0.0 0.0
35-44yrs 178 0.6 85.4 12.4 0.6 1.1 0.0
65-74yrs 176 4.0 67.6 10.2 7.4 8.0 2.8 Gampaha 5yrs 180 0.0 78.3 9.4 1.1 10.6 0.6
12yrs 180 0.0 71.1 27.2 0.6 1.1 0.0
15yrs 181 0.0 87.3 12.2 0.0 0.6 0.0
35-44yrs 177 0.0 86.4 10.7 1.7 1.1 0.0
65-74yrs 179 6.7 68.7 12.3 5.6 3.4 3.4 Kalutara 5yrs 100 0.0 76.0 12.0 1.0 11.0 0.0
12yrs 100 0.0 83.0 16.0 0.0 1.0 0.0
15yrs 102 0.0 76.5 23.5 0.0 0.0 0.0
35-44yrs 100 0.0 78.0 17.0 1.0 4.0 0.0
65-74yrs 100 2.0 74.0 8.0 4.0 9.0 3.0 Kandy 5yrs 140 0.0 80.0 14.3 1.4 4.3 0.0
12yrs 140 0.0 84.3 15.0 0.0 0.7 0.0
15yrs 140 0.0 86.4 13.6 0.0 0.0 0.0
35-44yrs 136 0.0 84.6 15.4 0.0 0.0 0.0
65-74yrs 134 4.5 65.7 9.0 11.9 2.2 6.7 Matale 5yrs 40 0.0 95.0 2.5 0.0 2.5 0.0
12yrs 40 0.0 80.0 20.0 0.0 0.0 0.0
15yrs 40 0.0 80.0 20.0 0.0 0.0 0.0
35-44yrs 40 0.0 80.0 20.0 0.0 0.0 0.0
65-74yrs 39 5.1 48.7 7.7 10.3 17.9 10.3 Nuwara-Eliya 5yrs 100 0.0 83.0 12.0 0.0 5.0 0.0
12yrs 99 0.0 84.8 12.1 2.0 1.0 0.0
15yrs 100 0.0 85.0 14.0 0.0 1.0 0.0
35-44yrs 99 0.0 73.7 15.2 6.1 5.1 0.0
65-74yrs 98 6.1 45.9 10.2 26.5 4.1 7.1 Galle 5yrs 98 1.0 69.4 17.3 2.0 10.2 0.0
12yrs 99 0.0 86.9 13.1 0.0 0.0 0.0
15yrs 100 0.0 82.0 18.0 0.0 0.0 0.0
35-44yrs 99 0.0 77.8 19.2 0.0 2.0 1.0
65-74yrs 100 10.0 55.0 12.0 8.0 8.0 7.0 Matara 5yrs 79 0.0 88.6 3.8 0.0 7.6 0.0
12yrs 80 0.0 90.0 10.0 0.0 0.0 0.0
15yrs 80 1.3 88.8 10.0 0.0 0.0 0.0
35-44yrs 79 0.0 84.8 10.1 0.0 5.1 0.0
65-74yrs 79 5.1 70.9 10.1 6.3 2.5 5.1 Hambantota 5yrs 60 0.0 78.3 16.7 1.7 3.3 0.0
12yrs 60 0.0 75.0 25.0 0.0 0.0 0.0
15yrs 60 0.0 80.0 20.0 0.0 0.0 0.0
35-44yrs 59 0.0 76.3 22.0 1.7 0.0 0.0
65-74yrs 60 6.7 55.0 10.0 13.3 6.7 8.3 Jaffna 5yrs 60 0.0 63.3 0.0 35.0 1.7 0.0
12yrs 60 0.0 66.7 3.3 28.3 0.0 1.7
15yrs 60 0.0 68.3 5.0 26.7 0.0 0.0
35-44yrs 60 0.0 46.7 3.3 45.0 3.3 1.7
65-74yrs 59 1.7 35.6 3.4 54.2 3.4 1.7 Kilinochchi 5yrs 20 0.0 85.0 5.0 10.0 0.0 0.0
12yrs 20 0.0 100.0 0.0 0.0 0.0 0.0
15yrs 20 0.0 100.0 0.0 0.0 0.0 0.0
35-44yrs 20 0.0 85.0 0.0 15.0 0.0 0.0
65-74yrs 20 0.0 70.0 0.0 30.0 0.0 0.0 Mannar 5yrs 20 0.0 95.0 0.0 5.0 0.0 0.0
12yrs 21 0.0 90.5 4.8 4.8 0.0 0.0
15yrs 20 0.0 100.0 0.0 0.0 0.0 0.0
35-44yrs 20 0.0 95.0 0.0 5.0 0.0 0.0
65-74yrs 20 0.0 40.0 5.0 50.0 0.0 5.0 Mullaitivu 5yrs 20 0.0 70.0 0.0 30.0 0.0 0.0
12yrs 20 0.0 75.0 0.0 25.0 0.0 0.0
15yrs 20 0.0 90.0 5.0 5.0 0.0 0.0
35-44yrs 21 0.0 81.0 0.0 9.5 9.5 0.0
65-74yrs 20 15.0 20.0 0.0 55.0 10.0 0.0
Dis
tric
t-b
ased
re
sult
s
67National Oral Health Survey Sri Lanka 2015-201666
Table 6.2: Percentage of distribution of participants according to the mode of tooth cleaning (contd.)
District Age group N None Brush Finger Other*
Not recorded /Missing
Vavuniya 5yrs 20 0.0 100.0 0.0 0.0 0.0
12yrs 20 0.0 95.0 5.0 0.0 0.0
15yrs 20 0.0 100.0 0.0 0.0 0.0
35-44yrs 20 0.0 100.0 0.0 0.0 0.0
65-74yrs 19 10.5 31.6 57.9 0.0 0.0 Batticaloa 5yrs 60 3.3 83.3 11.7 0.0 1.7
12yrs 60 0.0 95.0 5.0 0.0 0.0
15yrs 60 0.0 96.7 3.3 0.0 0.0
35-44yrs 60 0.0 96.7 1.7 1.7 0.0
65-74yrs 58 0.0 50.0 43.1 6.9 0.0 Ampara 5yrs 100 0.0 77.0 3.0 0.0 20.0
12yrs 99 0.0 97.0 3.0 0.0 0.0
15yrs 100 0.0 100.0 0.0 0.0 0.0
35-44yrs 97 0.0 97.9 2.1 0.0 0.0
65-74yrs 95 3.2 70.5 21.1 0.0 2.1 Trincomalee 5yrs 40 0.0 97.5 2.5 0.0 0.0
12yrs 39 0.0 87.2 12.8 0.0 0.0
15yrs 40 0.0 87.5 12.5 0.0 0.0
35-44yrs 40 0.0 97.5 2.5 0.0 0.0
65-74yrs 39 2.6 61.5 33.3 0.0 2.6 Kurunegala 5yrs 160 0.0 99.4 0.6 0.0 0.0
12yrs 160 0.0 99.4 0.6 0.0 0.0
15yrs 160 0.0 99.4 0.0 0.6 0.0
35-44yrs 159 0.0 96.2 3.1 0.0 0.6
65-74yrs 160 0.0 78.1 18.1 0.0 1.9 Puttalam 5yrs 60 0.0 100.0 0.0 0.0 0.0
12yrs 60 0.0 100.0 0.0 0.0 0.0
15yrs 60 0.0 98.3 1.7 0.0 0.0
35-44yrs 60 0.0 93.3 6.7 0.0 0.0
65-74yrs 60 0.0 78.3 21.7 0.0 0.0 Anuradhapura 5yrs 100 0.0 97.0 2.0 1.0 0.0
12yrs 100 0.0 100.0 0.0 0.0 0.0
15yrs 100 0.0 99.0 1.0 0.0 0.0
35-44yrs 99 0.0 97.0 3.0 0.0 0.0
65-74yrs 97 1.0 74.2 20.6 3.1 1.0 Polonnaruwa 5yrs 60 0.0 100.0 0.0 0.0 0.0
12yrs 60 0.0 100.0 0.0 0.0 0.0
15yrs 60 0.0 98.3 1.7 0.0 0.0
35-44yrs 60 0.0 100.0 0.0 0.0 0.0
65-74yrs 59 3.4 83.1 13.6 0.0 0.0 Badulla 5yrs 78 0.0 97.4 1.3 0.0 1.3
12yrs 80 0.0 100.0 0.0 0.0 0.0
15yrs 80 0.0 98.8 1.3 0.0 0.0
35-44yrs 80 0.0 96.3 3.8 0.0 0.0
65-74yrs 74 5.4 68.9 21.6 1.4 2.7 Monaragala 5yrs 60 0.0 96.7 3.3 0.0 0.0
12yrs 60 0.0 100.0 0.0 0.0 0.0
15yrs 60 0.0 100.0 0.0 0.0 0.0
35-44yrs 60 0.0 98.3 1.7 0.0 0.0
65-74yrs 60 8.3 71.7 16.7 0.0 3.3 Ratnapura 5yrs 80 0.0 100.0 0.0 0.0 0.0
12yrs 80 0.0 98.8 1.3 0.0 0.0
15yrs 80 0.0 100.0 0.0 0.0 0.0
35-44yrs 80 0.0 96.3 3.8 0.0 0.0
65-74yrs 78 0.0 67.9 32.1 0.0 0.0 Kegalle 5yrs 80 0.0 100.0 0.0 0.0 0.0
12yrs 80 0.0 100.0 0.0 0.0 0.0
15yrs 80 0.0 98.8 1.3 0.0 0.0
35-44yrs 79 0.0 98.7 1.3 0.0 0.0
65-74yrs 76 7.9 71.1 17.1 3.96 0.0
67
Table 6.3: Percentage distribution of participants according to the type of ingredients used for tooth cleaning
District Age group N None Fluoridated toothpaste
Non-fluoridated toothpaste
Tooth powder Other Not recorded
/Missing Colombo 5yrs 180 0.0 77.8 12.8 1.7 7.8 0.0
12yrs 179 0.0 85.5 11.2 1.1 2.2 0.0
15yrs 180 0.0 84.4 15.6 0.0 0.0 0.0
35-44yrs 178 0.6 85.4 12.4 0.6 1.1 0.0
65-74yrs 176 4.0 67.6 10.2 7.4 8.0 2.8 Gampaha 5yrs 180 0.0 78.3 9.4 1.1 10.6 0.6
12yrs 180 0.0 71.1 27.2 0.6 1.1 0.0
15yrs 181 0.0 87.3 12.2 0.0 0.6 0.0
35-44yrs 177 0.0 86.4 10.7 1.7 1.1 0.0
65-74yrs 179 6.7 68.7 12.3 5.6 3.4 3.4 Kalutara 5yrs 100 0.0 76.0 12.0 1.0 11.0 0.0
12yrs 100 0.0 83.0 16.0 0.0 1.0 0.0
15yrs 102 0.0 76.5 23.5 0.0 0.0 0.0
35-44yrs 100 0.0 78.0 17.0 1.0 4.0 0.0
65-74yrs 100 2.0 74.0 8.0 4.0 9.0 3.0 Kandy 5yrs 140 0.0 80.0 14.3 1.4 4.3 0.0
12yrs 140 0.0 84.3 15.0 0.0 0.7 0.0
15yrs 140 0.0 86.4 13.6 0.0 0.0 0.0
35-44yrs 136 0.0 84.6 15.4 0.0 0.0 0.0
65-74yrs 134 4.5 65.7 9.0 11.9 2.2 6.7 Matale 5yrs 40 0.0 95.0 2.5 0.0 2.5 0.0
12yrs 40 0.0 80.0 20.0 0.0 0.0 0.0
15yrs 40 0.0 80.0 20.0 0.0 0.0 0.0
35-44yrs 40 0.0 80.0 20.0 0.0 0.0 0.0
65-74yrs 39 5.1 48.7 7.7 10.3 17.9 10.3 Nuwara-Eliya 5yrs 100 0.0 83.0 12.0 0.0 5.0 0.0
12yrs 99 0.0 84.8 12.1 2.0 1.0 0.0
15yrs 100 0.0 85.0 14.0 0.0 1.0 0.0
35-44yrs 99 0.0 73.7 15.2 6.1 5.1 0.0
65-74yrs 98 6.1 45.9 10.2 26.5 4.1 7.1 Galle 5yrs 98 1.0 69.4 17.3 2.0 10.2 0.0
12yrs 99 0.0 86.9 13.1 0.0 0.0 0.0
15yrs 100 0.0 82.0 18.0 0.0 0.0 0.0
35-44yrs 99 0.0 77.8 19.2 0.0 2.0 1.0
65-74yrs 100 10.0 55.0 12.0 8.0 8.0 7.0 Matara 5yrs 79 0.0 88.6 3.8 0.0 7.6 0.0
12yrs 80 0.0 90.0 10.0 0.0 0.0 0.0
15yrs 80 1.3 88.8 10.0 0.0 0.0 0.0
35-44yrs 79 0.0 84.8 10.1 0.0 5.1 0.0
65-74yrs 79 5.1 70.9 10.1 6.3 2.5 5.1 Hambantota 5yrs 60 0.0 78.3 16.7 1.7 3.3 0.0
12yrs 60 0.0 75.0 25.0 0.0 0.0 0.0
15yrs 60 0.0 80.0 20.0 0.0 0.0 0.0
35-44yrs 59 0.0 76.3 22.0 1.7 0.0 0.0
65-74yrs 60 6.7 55.0 10.0 13.3 6.7 8.3 Jaffna 5yrs 60 0.0 63.3 0.0 35.0 1.7 0.0
12yrs 60 0.0 66.7 3.3 28.3 0.0 1.7
15yrs 60 0.0 68.3 5.0 26.7 0.0 0.0
35-44yrs 60 0.0 46.7 3.3 45.0 3.3 1.7
65-74yrs 59 1.7 35.6 3.4 54.2 3.4 1.7 Kilinochchi 5yrs 20 0.0 85.0 5.0 10.0 0.0 0.0
12yrs 20 0.0 100.0 0.0 0.0 0.0 0.0
15yrs 20 0.0 100.0 0.0 0.0 0.0 0.0
35-44yrs 20 0.0 85.0 0.0 15.0 0.0 0.0
65-74yrs 20 0.0 70.0 0.0 30.0 0.0 0.0 Mannar 5yrs 20 0.0 95.0 0.0 5.0 0.0 0.0
12yrs 21 0.0 90.5 4.8 4.8 0.0 0.0
15yrs 20 0.0 100.0 0.0 0.0 0.0 0.0
35-44yrs 20 0.0 95.0 0.0 5.0 0.0 0.0
65-74yrs 20 0.0 40.0 5.0 50.0 0.0 5.0 Mullaitivu 5yrs 20 0.0 70.0 0.0 30.0 0.0 0.0
12yrs 20 0.0 75.0 0.0 25.0 0.0 0.0
15yrs 20 0.0 90.0 5.0 5.0 0.0 0.0
35-44yrs 21 0.0 81.0 0.0 9.5 9.5 0.0
65-74yrs 20 15.0 20.0 0.0 55.0 10.0 0.0
Dis
tric
t-b
ased
re
sult
s
68 National Oral Health Survey Sri Lanka 2015-201668
Table 6.3: Percentage distribution of participants according to the type of ingredients used for tooth cleaning (contd.)
District Age group N None Fluoridated toothpaste
Non-fluoridated toothpaste
Tooth powder Other Not recorded
/Missing Vavuniya 5yrs 20 0.0 95.0 0.0 0.0 5.0 0.0
12yrs 20 0.0 85.0 5.0 5.0 5.0 0.0
15yrs 20 0.0 90.0 10.0 0.0 0.0 0.0
35-44yrs 20 0.0 100.0 0.0 0.0 0.0 0.0
65-74yrs 19 0.0 47.4 0.0 42.1 0.0 10.5 Batticaloa 5yrs 60 1.7 73.3 16.7 3.3 0.0 5.0
12yrs 60 0.0 95.0 3.3 1.7 0.0 0.0
15yrs 60 0.0 93.3 6.7 0.0 0.0 0.0
35-44yrs 60 0.0 88.3 6.7 5.0 0.0 0.0
65-74yrs 58 10.3 41.4 5.2 41.4 1.7 0.0 Ampara 5yrs 100 0.0 54.0 17.0 7.0 2.0 20.0
12yrs 99 0.0 74.7 20.2 4.0 1.0 0.0
15yrs 100 0.0 80.0 19.0 1.0 0.0 0.0
35-44yrs 97 0.0 75.3 21.6 3.1 0.0 0.0
65-74yrs 95 5.3 63.2 8.4 14.7 4.2 4.2 Trincomalee 5yrs 40 0.0 85.0 2.5 12.5 0.0 0.0
12yrs 39 0.0 87.2 0.0 12.8 0.0 0.0
15yrs 40 0.0 85.0 0.0 15.0 0.0 0.0
35-44yrs 40 0.0 92.5 2.5 2.5 2.5 0.0
65-74yrs 39 0.0 59.0 2.6 33.3 0.0 5.1 Kurunegala 5yrs 160 0.0 74.4 8.8 1.3 15.6 0.0
12yrs 160 0.0 76.3 23.1 0.0 0.6 0.0
15yrs 160 0.0 80.6 19.4 0.0 0.0 0.0
35-44yrs 159 0.0 83.6 13.2 0.6 1.9 0.6
65-74yrs 160 5.0 61.3 15.0 5.6 10.6 2.5 Puttalam 5yrs 60 0.0 85.0 11.7 1.7 1.7 0.0
12yrs 60 0.0 75.0 18.3 3.3 3.3 0.0
15yrs 60 0.0 73.3 25.0 0.0 1.7 0.0
35-44yrs 60 0.0 76.7 21.7 0.0 1.7 0.0
65-74yrs 60 5.0 56.7 23.3 10.0 5.0 0.0 Anuradhapura 5yrs 100 0.0 75.0 20.0 1.0 4.0 0.0
12yrs 100 0.0 69.0 31.0 0.0 0.0 0.0
15yrs 100 0.0 69.0 30.0 1.0 0.0 0.0
35-44yrs 99 0.0 59.6 37.4 2.0 1.0 0.0
65-74yrs 97 5.2 49.5 16.5 13.4 13.4 2.1 Polonnaruwa 5yrs 60 1.7 65.0 13.3 3.3 16.7 0.0
12yrs 60 0.0 70.0 30.0 0.0 0.0 0.0
15yrs 60 0.0 75.0 25.0 0.0 0.0 0.0
35-44yrs 60 0.0 61.7 38.3 0.0 0.0 0.0
65-74yrs 59 1.7 52.5 23.7 13.6 5.1 3.4 Badulla 5yrs 78 0.0 67.9 15.4 2.6 12.8 1.3
12yrs 80 0.0 76.3 22.5 1.3 0.0 0.0
15yrs 80 0.0 90.0 10.0 0.0 0.0 0.0
35-44yrs 80 1.3 86.3 8.8 1.3 2.5 0.0
65-74yrs 74 8.1 47.3 14.9 10.8 10.8 8.1 Monaragala 5yrs 60 0.0 81.7 15.0 0.0 0.0 3.3
12yrs 60 1.7 80.0 18.3 0.0 0.0 0.0
15yrs 60 0.0 81.7 18.3 0.0 0.0 0.0
35-44yrs 60 0.0 85.0 11.7 3.3 0.0 0.0
65-74yrs 60 1.7 71.7 6.7 1.7 6.7 11.7 Ratnapura 5yrs 80 0.0 73.8 7.5 1.3 17.5 0.0
12yrs 80 0.0 78.8 20.0 0.0 1.3 0.0
15yrs 80 0.0 75.0 25.0 0.0 0.0 0.0
35-44yrs 80 0.0 71.3 23.8 3.8 1.3 0.0
65-74yrs 78 10.3 51.3 15.4 16.7 6.4 0.0 Kegalle 5yrs 80 6.3 62.5 3.8 1.3 26.3 0.0
12yrs 80 0.0 87.5 11.3 0.0 1.3 0.0
15yrs 80 1.3 77.5 21.3 0.0 0.0 0.0
35-44yrs 79 0.0 81.0 16.5 2.5 0.0 0.0
65-74yrs 76 3.9 67.1 6.6 11.8 2.6 7.9
Dis
tric
t-b
ased
re
sult
s
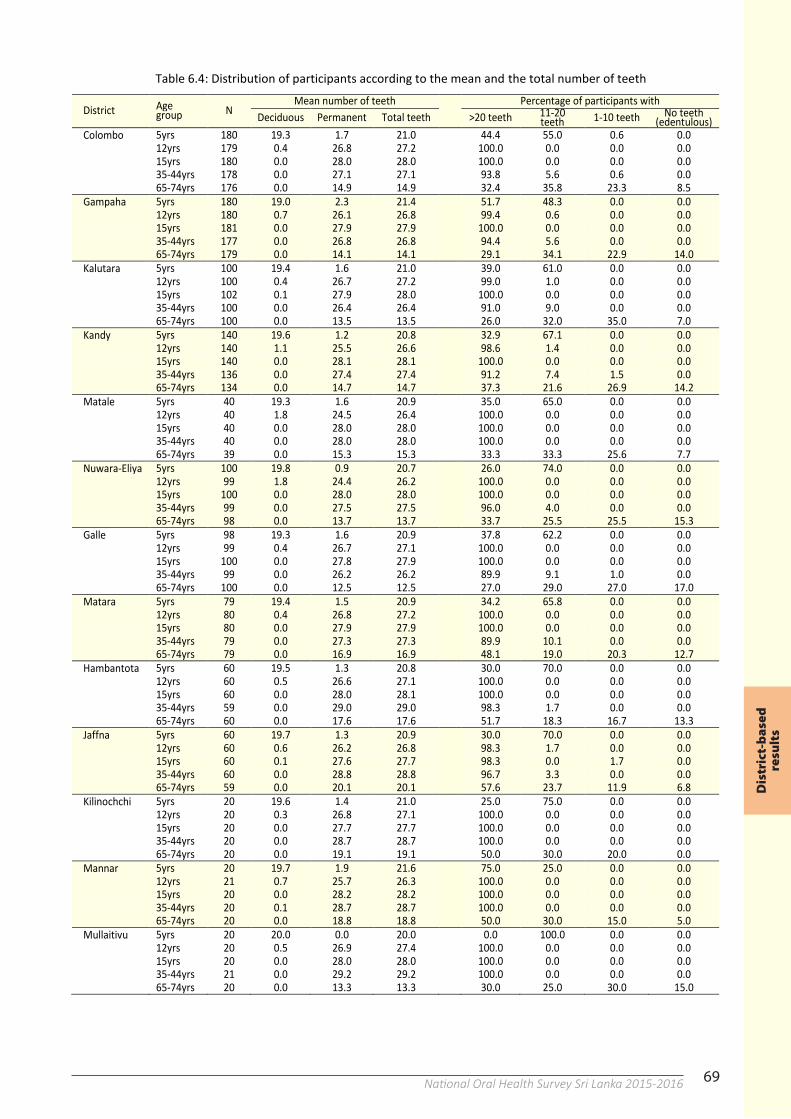
69National Oral Health Survey Sri Lanka 2015-201669
Table 6.4: Distribution of participants according to the mean and the total number of teeth
District Age group N
Mean number of teeth Percentage of participants with Deciduous Permanent Total teeth >20 teeth 11-20
teeth 1-10 teeth No teeth (edentulous)
Colombo 5yrs 180 19.3 1.7 21.0 44.4 55.0 0.6 0.0
12yrs 179 0.4 26.8 27.2 100.0 0.0 0.0 0.0
15yrs 180 0.0 28.0 28.0 100.0 0.0 0.0 0.0
35-44yrs 178 0.0 27.1 27.1 93.8 5.6 0.6 0.0
65-74yrs 176 0.0 14.9 14.9 32.4 35.8 23.3 8.5 Gampaha 5yrs 180 19.0 2.3 21.4 51.7 48.3 0.0 0.0
12yrs 180 0.7 26.1 26.8 99.4 0.6 0.0 0.0
15yrs 181 0.0 27.9 27.9 100.0 0.0 0.0 0.0
35-44yrs 177 0.0 26.8 26.8 94.4 5.6 0.0 0.0
65-74yrs 179 0.0 14.1 14.1 29.1 34.1 22.9 14.0 Kalutara 5yrs 100 19.4 1.6 21.0 39.0 61.0 0.0 0.0
12yrs 100 0.4 26.7 27.2 99.0 1.0 0.0 0.0
15yrs 102 0.1 27.9 28.0 100.0 0.0 0.0 0.0
35-44yrs 100 0.0 26.4 26.4 91.0 9.0 0.0 0.0
65-74yrs 100 0.0 13.5 13.5 26.0 32.0 35.0 7.0 Kandy 5yrs 140 19.6 1.2 20.8 32.9 67.1 0.0 0.0
12yrs 140 1.1 25.5 26.6 98.6 1.4 0.0 0.0
15yrs 140 0.0 28.1 28.1 100.0 0.0 0.0 0.0
35-44yrs 136 0.0 27.4 27.4 91.2 7.4 1.5 0.0
65-74yrs 134 0.0 14.7 14.7 37.3 21.6 26.9 14.2 Matale 5yrs 40 19.3 1.6 20.9 35.0 65.0 0.0 0.0
12yrs 40 1.8 24.5 26.4 100.0 0.0 0.0 0.0
15yrs 40 0.0 28.0 28.0 100.0 0.0 0.0 0.0
35-44yrs 40 0.0 28.0 28.0 100.0 0.0 0.0 0.0
65-74yrs 39 0.0 15.3 15.3 33.3 33.3 25.6 7.7 Nuwara-Eliya 5yrs 100 19.8 0.9 20.7 26.0 74.0 0.0 0.0
12yrs 99 1.8 24.4 26.2 100.0 0.0 0.0 0.0
15yrs 100 0.0 28.0 28.0 100.0 0.0 0.0 0.0
35-44yrs 99 0.0 27.5 27.5 96.0 4.0 0.0 0.0
65-74yrs 98 0.0 13.7 13.7 33.7 25.5 25.5 15.3 Galle 5yrs 98 19.3 1.6 20.9 37.8 62.2 0.0 0.0
12yrs 99 0.4 26.7 27.1 100.0 0.0 0.0 0.0
15yrs 100 0.0 27.8 27.9 100.0 0.0 0.0 0.0
35-44yrs 99 0.0 26.2 26.2 89.9 9.1 1.0 0.0
65-74yrs 100 0.0 12.5 12.5 27.0 29.0 27.0 17.0 Matara 5yrs 79 19.4 1.5 20.9 34.2 65.8 0.0 0.0
12yrs 80 0.4 26.8 27.2 100.0 0.0 0.0 0.0
15yrs 80 0.0 27.9 27.9 100.0 0.0 0.0 0.0
35-44yrs 79 0.0 27.3 27.3 89.9 10.1 0.0 0.0
65-74yrs 79 0.0 16.9 16.9 48.1 19.0 20.3 12.7 Hambantota 5yrs 60 19.5 1.3 20.8 30.0 70.0 0.0 0.0
12yrs 60 0.5 26.6 27.1 100.0 0.0 0.0 0.0
15yrs 60 0.0 28.0 28.1 100.0 0.0 0.0 0.0
35-44yrs 59 0.0 29.0 29.0 98.3 1.7 0.0 0.0
65-74yrs 60 0.0 17.6 17.6 51.7 18.3 16.7 13.3 Jaffna 5yrs 60 19.7 1.3 20.9 30.0 70.0 0.0 0.0
12yrs 60 0.6 26.2 26.8 98.3 1.7 0.0 0.0
15yrs 60 0.1 27.6 27.7 98.3 0.0 1.7 0.0
35-44yrs 60 0.0 28.8 28.8 96.7 3.3 0.0 0.0
65-74yrs 59 0.0 20.1 20.1 57.6 23.7 11.9 6.8 Kilinochchi 5yrs 20 19.6 1.4 21.0 25.0 75.0 0.0 0.0
12yrs 20 0.3 26.8 27.1 100.0 0.0 0.0 0.0
15yrs 20 0.0 27.7 27.7 100.0 0.0 0.0 0.0
35-44yrs 20 0.0 28.7 28.7 100.0 0.0 0.0 0.0
65-74yrs 20 0.0 19.1 19.1 50.0 30.0 20.0 0.0 Mannar 5yrs 20 19.7 1.9 21.6 75.0 25.0 0.0 0.0
12yrs 21 0.7 25.7 26.3 100.0 0.0 0.0 0.0
15yrs 20 0.0 28.2 28.2 100.0 0.0 0.0 0.0
35-44yrs 20 0.1 28.7 28.7 100.0 0.0 0.0 0.0
65-74yrs 20 0.0 18.8 18.8 50.0 30.0 15.0 5.0 Mullaitivu 5yrs 20 20.0 0.0 20.0 0.0 100.0 0.0 0.0
12yrs 20 0.5 26.9 27.4 100.0 0.0 0.0 0.0
15yrs 20 0.0 28.0 28.0 100.0 0.0 0.0 0.0
35-44yrs 21 0.0 29.2 29.2 100.0 0.0 0.0 0.0
65-74yrs 20 0.0 13.3 13.3 30.0 25.0 30.0 15.0
69
Table 6.4: Distribution of participants according to the mean and the total number of teeth
District Age group N
Mean number of teeth Percentage of participants with Deciduous Permanent Total teeth >20 teeth 11-20
teeth 1-10 teeth No teeth (edentulous)
Colombo 5yrs 180 19.3 1.7 21.0 44.4 55.0 0.6 0.0
12yrs 179 0.4 26.8 27.2 100.0 0.0 0.0 0.0
15yrs 180 0.0 28.0 28.0 100.0 0.0 0.0 0.0
35-44yrs 178 0.0 27.1 27.1 93.8 5.6 0.6 0.0
65-74yrs 176 0.0 14.9 14.9 32.4 35.8 23.3 8.5 Gampaha 5yrs 180 19.0 2.3 21.4 51.7 48.3 0.0 0.0
12yrs 180 0.7 26.1 26.8 99.4 0.6 0.0 0.0
15yrs 181 0.0 27.9 27.9 100.0 0.0 0.0 0.0
35-44yrs 177 0.0 26.8 26.8 94.4 5.6 0.0 0.0
65-74yrs 179 0.0 14.1 14.1 29.1 34.1 22.9 14.0 Kalutara 5yrs 100 19.4 1.6 21.0 39.0 61.0 0.0 0.0
12yrs 100 0.4 26.7 27.2 99.0 1.0 0.0 0.0
15yrs 102 0.1 27.9 28.0 100.0 0.0 0.0 0.0
35-44yrs 100 0.0 26.4 26.4 91.0 9.0 0.0 0.0
65-74yrs 100 0.0 13.5 13.5 26.0 32.0 35.0 7.0 Kandy 5yrs 140 19.6 1.2 20.8 32.9 67.1 0.0 0.0
12yrs 140 1.1 25.5 26.6 98.6 1.4 0.0 0.0
15yrs 140 0.0 28.1 28.1 100.0 0.0 0.0 0.0
35-44yrs 136 0.0 27.4 27.4 91.2 7.4 1.5 0.0
65-74yrs 134 0.0 14.7 14.7 37.3 21.6 26.9 14.2 Matale 5yrs 40 19.3 1.6 20.9 35.0 65.0 0.0 0.0
12yrs 40 1.8 24.5 26.4 100.0 0.0 0.0 0.0
15yrs 40 0.0 28.0 28.0 100.0 0.0 0.0 0.0
35-44yrs 40 0.0 28.0 28.0 100.0 0.0 0.0 0.0
65-74yrs 39 0.0 15.3 15.3 33.3 33.3 25.6 7.7 Nuwara-Eliya 5yrs 100 19.8 0.9 20.7 26.0 74.0 0.0 0.0
12yrs 99 1.8 24.4 26.2 100.0 0.0 0.0 0.0
15yrs 100 0.0 28.0 28.0 100.0 0.0 0.0 0.0
35-44yrs 99 0.0 27.5 27.5 96.0 4.0 0.0 0.0
65-74yrs 98 0.0 13.7 13.7 33.7 25.5 25.5 15.3 Galle 5yrs 98 19.3 1.6 20.9 37.8 62.2 0.0 0.0
12yrs 99 0.4 26.7 27.1 100.0 0.0 0.0 0.0
15yrs 100 0.0 27.8 27.9 100.0 0.0 0.0 0.0
35-44yrs 99 0.0 26.2 26.2 89.9 9.1 1.0 0.0
65-74yrs 100 0.0 12.5 12.5 27.0 29.0 27.0 17.0 Matara 5yrs 79 19.4 1.5 20.9 34.2 65.8 0.0 0.0
12yrs 80 0.4 26.8 27.2 100.0 0.0 0.0 0.0
15yrs 80 0.0 27.9 27.9 100.0 0.0 0.0 0.0
35-44yrs 79 0.0 27.3 27.3 89.9 10.1 0.0 0.0
65-74yrs 79 0.0 16.9 16.9 48.1 19.0 20.3 12.7 Hambantota 5yrs 60 19.5 1.3 20.8 30.0 70.0 0.0 0.0
12yrs 60 0.5 26.6 27.1 100.0 0.0 0.0 0.0
15yrs 60 0.0 28.0 28.1 100.0 0.0 0.0 0.0
35-44yrs 59 0.0 29.0 29.0 98.3 1.7 0.0 0.0
65-74yrs 60 0.0 17.6 17.6 51.7 18.3 16.7 13.3 Jaffna 5yrs 60 19.7 1.3 20.9 30.0 70.0 0.0 0.0
12yrs 60 0.6 26.2 26.8 98.3 1.7 0.0 0.0
15yrs 60 0.1 27.6 27.7 98.3 0.0 1.7 0.0
35-44yrs 60 0.0 28.8 28.8 96.7 3.3 0.0 0.0
65-74yrs 59 0.0 20.1 20.1 57.6 23.7 11.9 6.8 Kilinochchi 5yrs 20 19.6 1.4 21.0 25.0 75.0 0.0 0.0
12yrs 20 0.3 26.8 27.1 100.0 0.0 0.0 0.0
15yrs 20 0.0 27.7 27.7 100.0 0.0 0.0 0.0
35-44yrs 20 0.0 28.7 28.7 100.0 0.0 0.0 0.0
65-74yrs 20 0.0 19.1 19.1 50.0 30.0 20.0 0.0 Mannar 5yrs 20 19.7 1.9 21.6 75.0 25.0 0.0 0.0
12yrs 21 0.7 25.7 26.3 100.0 0.0 0.0 0.0
15yrs 20 0.0 28.2 28.2 100.0 0.0 0.0 0.0
35-44yrs 20 0.1 28.7 28.7 100.0 0.0 0.0 0.0
65-74yrs 20 0.0 18.8 18.8 50.0 30.0 15.0 5.0 Mullaitivu 5yrs 20 20.0 0.0 20.0 0.0 100.0 0.0 0.0
12yrs 20 0.5 26.9 27.4 100.0 0.0 0.0 0.0
15yrs 20 0.0 28.0 28.0 100.0 0.0 0.0 0.0
35-44yrs 21 0.0 29.2 29.2 100.0 0.0 0.0 0.0
65-74yrs 20 0.0 13.3 13.3 30.0 25.0 30.0 15.0
Dis
tric
t-b
ased
re
sult
s
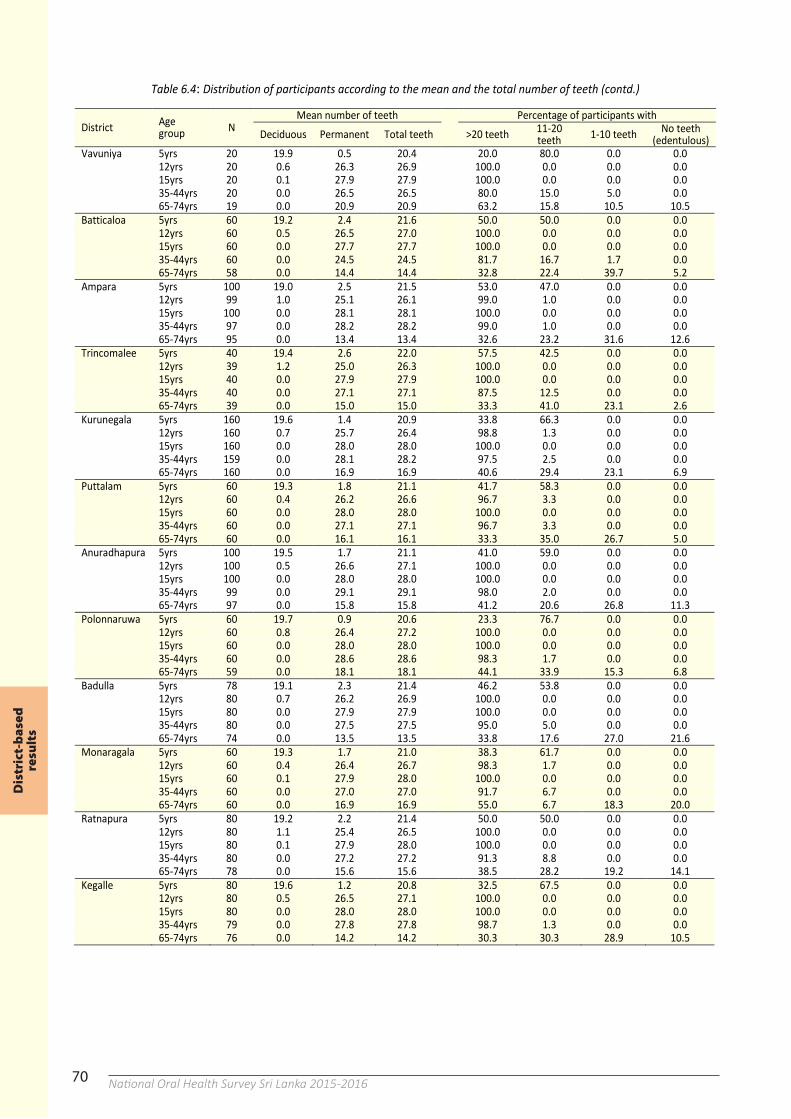
70 National Oral Health Survey Sri Lanka 2015-2016 70
Table 6.4: Distribution of participants according to the mean and the total number of teeth (contd.)
District Age group N
Mean number of teeth Percentage of participants with Deciduous Permanent Total teeth >20 teeth 11-20
teeth 1-10 teeth No teeth (edentulous)
Vavuniya 5yrs 20 19.9 0.5 20.4 20.0 80.0 0.0 0.0 12yrs 20 0.6 26.3 26.9 100.0 0.0 0.0 0.0 15yrs 20 0.1 27.9 27.9 100.0 0.0 0.0 0.0 35-44yrs 20 0.0 26.5 26.5 80.0 15.0 5.0 0.0 65-74yrs 19 0.0 20.9 20.9 63.2 15.8 10.5 10.5 Batticaloa 5yrs 60 19.2 2.4 21.6 50.0 50.0 0.0 0.0 12yrs 60 0.5 26.5 27.0 100.0 0.0 0.0 0.0 15yrs 60 0.0 27.7 27.7 100.0 0.0 0.0 0.0 35-44yrs 60 0.0 24.5 24.5 81.7 16.7 1.7 0.0 65-74yrs 58 0.0 14.4 14.4 32.8 22.4 39.7 5.2 Ampara 5yrs 100 19.0 2.5 21.5 53.0 47.0 0.0 0.0 12yrs 99 1.0 25.1 26.1 99.0 1.0 0.0 0.0 15yrs 100 0.0 28.1 28.1 100.0 0.0 0.0 0.0 35-44yrs 97 0.0 28.2 28.2 99.0 1.0 0.0 0.0 65-74yrs 95 0.0 13.4 13.4 32.6 23.2 31.6 12.6 Trincomalee 5yrs 40 19.4 2.6 22.0 57.5 42.5 0.0 0.0 12yrs 39 1.2 25.0 26.3 100.0 0.0 0.0 0.0 15yrs 40 0.0 27.9 27.9 100.0 0.0 0.0 0.0 35-44yrs 40 0.0 27.1 27.1 87.5 12.5 0.0 0.0 65-74yrs 39 0.0 15.0 15.0 33.3 41.0 23.1 2.6 Kurunegala 5yrs 160 19.6 1.4 20.9 33.8 66.3 0.0 0.0 12yrs 160 0.7 25.7 26.4 98.8 1.3 0.0 0.0 15yrs 160 0.0 28.0 28.0 100.0 0.0 0.0 0.0 35-44yrs 159 0.0 28.1 28.2 97.5 2.5 0.0 0.0 65-74yrs 160 0.0 16.9 16.9 40.6 29.4 23.1 6.9 Puttalam 5yrs 60 19.3 1.8 21.1 41.7 58.3 0.0 0.0 12yrs 60 0.4 26.2 26.6 96.7 3.3 0.0 0.0 15yrs 60 0.0 28.0 28.0 100.0 0.0 0.0 0.0 35-44yrs 60 0.0 27.1 27.1 96.7 3.3 0.0 0.0 65-74yrs 60 0.0 16.1 16.1 33.3 35.0 26.7 5.0 Anuradhapura 5yrs 100 19.5 1.7 21.1 41.0 59.0 0.0 0.0 12yrs 100 0.5 26.6 27.1 100.0 0.0 0.0 0.0 15yrs 100 0.0 28.0 28.0 100.0 0.0 0.0 0.0 35-44yrs 99 0.0 29.1 29.1 98.0 2.0 0.0 0.0 65-74yrs 97 0.0 15.8 15.8 41.2 20.6 26.8 11.3 Polonnaruwa 5yrs 60 19.7 0.9 20.6 23.3 76.7 0.0 0.0 12yrs 60 0.8 26.4 27.2 100.0 0.0 0.0 0.0 15yrs 60 0.0 28.0 28.0 100.0 0.0 0.0 0.0 35-44yrs 60 0.0 28.6 28.6 98.3 1.7 0.0 0.0 65-74yrs 59 0.0 18.1 18.1 44.1 33.9 15.3 6.8 Badulla 5yrs 78 19.1 2.3 21.4 46.2 53.8 0.0 0.0 12yrs 80 0.7 26.2 26.9 100.0 0.0 0.0 0.0 15yrs 80 0.0 27.9 27.9 100.0 0.0 0.0 0.0 35-44yrs 80 0.0 27.5 27.5 95.0 5.0 0.0 0.0 65-74yrs 74 0.0 13.5 13.5 33.8 17.6 27.0 21.6 Monaragala 5yrs 60 19.3 1.7 21.0 38.3 61.7 0.0 0.0 12yrs 60 0.4 26.4 26.7 98.3 1.7 0.0 0.0 15yrs 60 0.1 27.9 28.0 100.0 0.0 0.0 0.0 35-44yrs 60 0.0 27.0 27.0 91.7 6.7 0.0 0.0 65-74yrs 60 0.0 16.9 16.9 55.0 6.7 18.3 20.0 Ratnapura 5yrs 80 19.2 2.2 21.4 50.0 50.0 0.0 0.0 12yrs 80 1.1 25.4 26.5 100.0 0.0 0.0 0.0 15yrs 80 0.1 27.9 28.0 100.0 0.0 0.0 0.0 35-44yrs 80 0.0 27.2 27.2 91.3 8.8 0.0 0.0 65-74yrs 78 0.0 15.6 15.6 38.5 28.2 19.2 14.1 Kegalle 5yrs 80 19.6 1.2 20.8 32.5 67.5 0.0 0.0 12yrs 80 0.5 26.5 27.1 100.0 0.0 0.0 0.0 15yrs 80 0.0 28.0 28.0 100.0 0.0 0.0 0.0 35-44yrs 79 0.0 27.8 27.8 98.7 1.3 0.0 0.0 65-74yrs 76 0.0 14.2 14.2 30.3 30.3 28.9 10.5
71
Table 6.5: Percentage distribution of participants according to the prevalence of dental caries
District Age group N
Caries Active
caries Missing teeth
Filled teeth
Root caries
Colombo 5yrs 180 Deci* 60.0 57.2 3.9 13.3 -
Perm** 6.7 6.7 0.0 0.0 -
12yrs 179
32.4 25.7 4.5 11.7 -
15yrs 180
36.1 26.1 4.4 16.1 0.6
35-44yrs 178
93.8 68.0 84.8 34.3 5.6
65-74yrs 176
99.4 48.9 98.9 11.9 9.7
Gampaha 5yrs 180 Deci* 64.4 62.2 6.1 10.6 -
Perm** 2.2 2.2 0.0 0.0 -
12yrs 180
34.4 27.8 3.3 10.6 -
15yrs 181
44.8 37.6 7.7 12.7 1.1
35-44yrs 177
95.5 67.8 91.5 20.9 2.8
65-74yrs 179
100.0 59.2 100.0 5.6 8.4
Kalutara 5yrs 100 Deci* 53.0 50.0 3.0 23.0 -
Perm** 1.0 1.0 0.0 0.0 -
12yrs 100
44.0 35.0 5.0 17.0 -
15yrs 102
51.0 48.0 10.8 12.7 0.0
35-44yrs 100
97.0 68.0 93.0 29.0 0.0
65-74yrs 100
100.0 56.0 99.0 4.0 12.0
Kandy 5yrs 140 Deci* 65.0 65.0 0.0 8.6 -
Perm** 0.0 0.0 0.0 0.0 -
12yrs 140
35.0 30.0 3.6 10.7 -
15yrs 140
49.3 41.4 4.3 12.9 0.0
35-44yrs 136
94.9 58.1 80.9 34.6 4.4
65-74yrs 134
99.3 42.5 98.5 9.7 9.0
Matale 5yrs 40 Deci* 70.0 65.0 5.0 22.5 -
Perm** 5.0 5.0 0.0 0.0 -
12yrs 40
27.5 22.5 0.0 7.5 -
15yrs 40
32.5 27.5 5.0 15.0 0.0
35-44yrs 40
95.0 67.5 82.5 42.5 2.5
65-74yrs 39
97.4 69.2 97.4 2.6 0.0
Nuwara-Eliya 5yrs 100 Deci* 70.0 67.0 3.0 6.0 -
Perm** 1.0 1.0 0.0 0.0 -
12yrs 99
27.3 25.3 0.0 3.0 -
15yrs 100
47.0 42.0 3.0 9.0 0.0
35-44yrs 99
94.9 75.8 83.8 14.1 2.0
65-74yrs 98
100.0 57.1 100.0 3.1 3.1
Galle 5yrs 98 Deci* 63.3 62.2 9.2 8.2 -
Perm** 1.0 1.0 0.0 0.0 -
12yrs 99
32.3 21.2 5.1 13.1 -
15yrs 100
44.0 41.0 10.0 6.0 0.0
35-44yrs 99
93.9 63.6 86.9 26.3 3.0
65-74yrs 100
99.0 48.0 99.0 5.0 15.0
Matara 5yrs 79 Deci* 74.7 72.2 2.5 10.1 -
Perm** 1.3 1.3 0.0 0.0 -
12yrs 80
40.0 27.5 3.8 21.3 -
15yrs 80
53.8 45.0 10.0 16.3 0.0
35-44yrs 79
89.9 68.4 82.3 32.9 5.1
65-74yrs 79
97.5 59.5 93.7 0.0 12.7
Hambantota 5yrs 60 Deci* 60.0 56.7 5.0 11.7 -
Perm** 0.0 0.0 0.0 0.0 -
12yrs 60
20.0 15.0 3.3 1.7 -
15yrs 60
31.7 30.0 1.7 1.7 0.0
35-44yrs 59
86.4 55.9 72.9 25.4 3.4
65-74yrs 60
96.7 35.0 96.7 1.7 8.3
Jaffna 5yrs 60 Deci* 73.3 73.3 1.7 0.0 -
Perm** 0.0 0.0 0.0 0.0 -
12yrs 60
28.3 25.0 0.0 3.3 -
15yrs 60
48.3 41.7 5.0 6.7 0.0
35-44yrs 60
90.0 70.0 75.0 1.7 1.7
65-74yrs 59
98.3 64.4 93.2 3.4 16.9
Kilinochchi 5yrs 20 Deci* 55.0 55.0 0.0 10.0 -
Perm** 0.0 0.0 0.0 0.0 -
12yrs 20
15.0 15.0 0.0 0.0 -
15yrs 20
40.0 40.0 20.0 0.0 0.0
35-44yrs 20
95.0 55.0 85.0 15.0 10.0
65-74yrs 20
95.0 50.0 95.0 0.0 20.0
Mannar 5yrs 20 Deci* 85.0 85.0 0.0 0.0 -
Perm** 0.0 0.0 0.0 0.0 -
12yrs 21
9.5 9.5 9.5 0.0 -
15yrs 20
25.0 25.0 0.0 0.0 0.0
35-44yrs 20
85.0 70.0 80.0 5.0 0.0
65-74yrs 20
100.0 75.0 100.0 0.0 10.0
Mullaitivu 5yrs 20 Deci* 25.0 25.0 0.0 0.0 -
Perm** 0.0 0.0 0.0 0.0 -
12yrs 20
25.0 20.0 5.0 5.0 -
15yrs 20
0.0 0.0 0.0 0.0 0.0
35-44yrs 21
90.5 66.7 71.4 9.5 0.0
65-74yrs 20
95.0 40.0 95.0 0.0 5.0
*Deci: Deciduous teeth; **Perm: Permanent teeth
Dis
tric
t-b
ased
re
sult
s
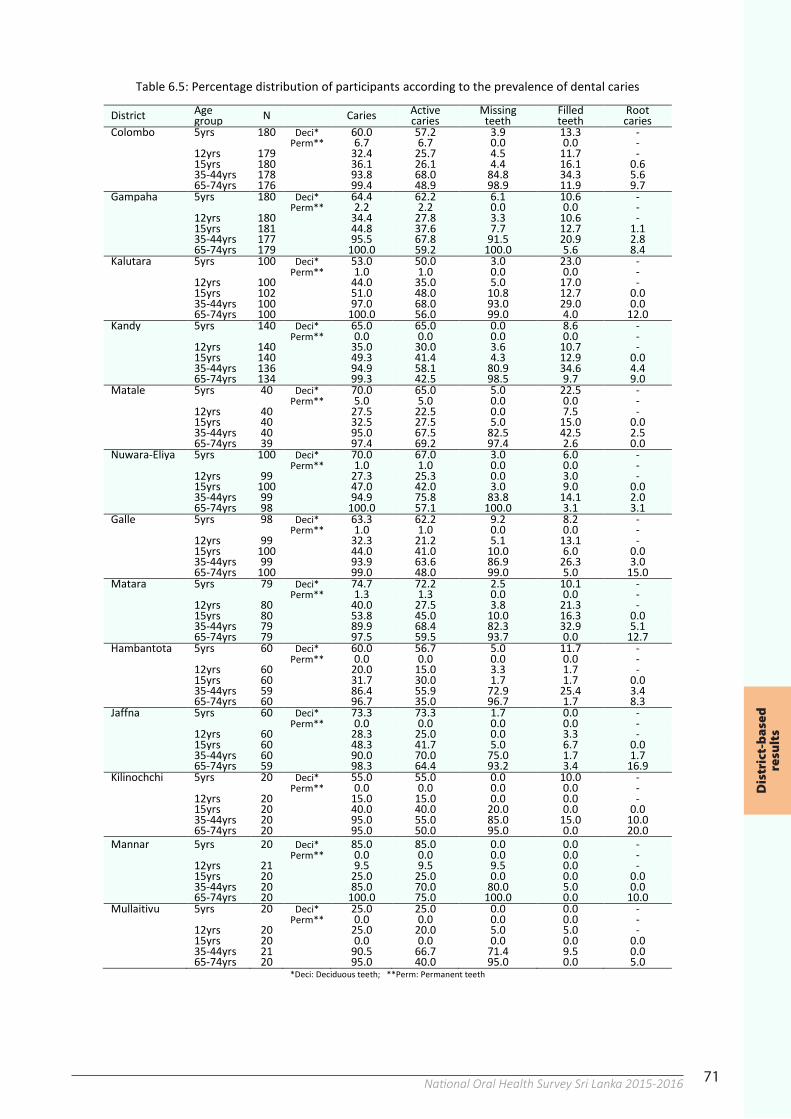
71National Oral Health Survey Sri Lanka 2015-201671
Table 6.5: Percentage distribution of participants according to the prevalence of dental caries
District Age group N
Caries Active
caries Missing teeth
Filled teeth
Root caries
Colombo 5yrs 180 Deci* 60.0 57.2 3.9 13.3 -
Perm** 6.7 6.7 0.0 0.0 -
12yrs 179
32.4 25.7 4.5 11.7 -
15yrs 180
36.1 26.1 4.4 16.1 0.6
35-44yrs 178
93.8 68.0 84.8 34.3 5.6
65-74yrs 176
99.4 48.9 98.9 11.9 9.7
Gampaha 5yrs 180 Deci* 64.4 62.2 6.1 10.6 -
Perm** 2.2 2.2 0.0 0.0 -
12yrs 180
34.4 27.8 3.3 10.6 -
15yrs 181
44.8 37.6 7.7 12.7 1.1
35-44yrs 177
95.5 67.8 91.5 20.9 2.8
65-74yrs 179
100.0 59.2 100.0 5.6 8.4
Kalutara 5yrs 100 Deci* 53.0 50.0 3.0 23.0 -
Perm** 1.0 1.0 0.0 0.0 -
12yrs 100
44.0 35.0 5.0 17.0 -
15yrs 102
51.0 48.0 10.8 12.7 0.0
35-44yrs 100
97.0 68.0 93.0 29.0 0.0
65-74yrs 100
100.0 56.0 99.0 4.0 12.0
Kandy 5yrs 140 Deci* 65.0 65.0 0.0 8.6 -
Perm** 0.0 0.0 0.0 0.0 -
12yrs 140
35.0 30.0 3.6 10.7 -
15yrs 140
49.3 41.4 4.3 12.9 0.0
35-44yrs 136
94.9 58.1 80.9 34.6 4.4
65-74yrs 134
99.3 42.5 98.5 9.7 9.0
Matale 5yrs 40 Deci* 70.0 65.0 5.0 22.5 -
Perm** 5.0 5.0 0.0 0.0 -
12yrs 40
27.5 22.5 0.0 7.5 -
15yrs 40
32.5 27.5 5.0 15.0 0.0
35-44yrs 40
95.0 67.5 82.5 42.5 2.5
65-74yrs 39
97.4 69.2 97.4 2.6 0.0
Nuwara-Eliya 5yrs 100 Deci* 70.0 67.0 3.0 6.0 -
Perm** 1.0 1.0 0.0 0.0 -
12yrs 99
27.3 25.3 0.0 3.0 -
15yrs 100
47.0 42.0 3.0 9.0 0.0
35-44yrs 99
94.9 75.8 83.8 14.1 2.0
65-74yrs 98
100.0 57.1 100.0 3.1 3.1
Galle 5yrs 98 Deci* 63.3 62.2 9.2 8.2 -
Perm** 1.0 1.0 0.0 0.0 -
12yrs 99
32.3 21.2 5.1 13.1 -
15yrs 100
44.0 41.0 10.0 6.0 0.0
35-44yrs 99
93.9 63.6 86.9 26.3 3.0
65-74yrs 100
99.0 48.0 99.0 5.0 15.0
Matara 5yrs 79 Deci* 74.7 72.2 2.5 10.1 -
Perm** 1.3 1.3 0.0 0.0 -
12yrs 80
40.0 27.5 3.8 21.3 -
15yrs 80
53.8 45.0 10.0 16.3 0.0
35-44yrs 79
89.9 68.4 82.3 32.9 5.1
65-74yrs 79
97.5 59.5 93.7 0.0 12.7
Hambantota 5yrs 60 Deci* 60.0 56.7 5.0 11.7 -
Perm** 0.0 0.0 0.0 0.0 -
12yrs 60
20.0 15.0 3.3 1.7 -
15yrs 60
31.7 30.0 1.7 1.7 0.0
35-44yrs 59
86.4 55.9 72.9 25.4 3.4
65-74yrs 60
96.7 35.0 96.7 1.7 8.3
Jaffna 5yrs 60 Deci* 73.3 73.3 1.7 0.0 -
Perm** 0.0 0.0 0.0 0.0 -
12yrs 60
28.3 25.0 0.0 3.3 -
15yrs 60
48.3 41.7 5.0 6.7 0.0
35-44yrs 60
90.0 70.0 75.0 1.7 1.7
65-74yrs 59
98.3 64.4 93.2 3.4 16.9
Kilinochchi 5yrs 20 Deci* 55.0 55.0 0.0 10.0 -
Perm** 0.0 0.0 0.0 0.0 -
12yrs 20
15.0 15.0 0.0 0.0 -
15yrs 20
40.0 40.0 20.0 0.0 0.0
35-44yrs 20
95.0 55.0 85.0 15.0 10.0
65-74yrs 20
95.0 50.0 95.0 0.0 20.0
Mannar 5yrs 20 Deci* 85.0 85.0 0.0 0.0 -
Perm** 0.0 0.0 0.0 0.0 -
12yrs 21
9.5 9.5 9.5 0.0 -
15yrs 20
25.0 25.0 0.0 0.0 0.0
35-44yrs 20
85.0 70.0 80.0 5.0 0.0
65-74yrs 20
100.0 75.0 100.0 0.0 10.0
Mullaitivu 5yrs 20 Deci* 25.0 25.0 0.0 0.0 -
Perm** 0.0 0.0 0.0 0.0 -
12yrs 20
25.0 20.0 5.0 5.0 -
15yrs 20
0.0 0.0 0.0 0.0 0.0
35-44yrs 21
90.5 66.7 71.4 9.5 0.0
65-74yrs 20
95.0 40.0 95.0 0.0 5.0
*Deci: Deciduous teeth; **Perm: Permanent teeth
Dis
tric
t-b
ased
re
sult
s
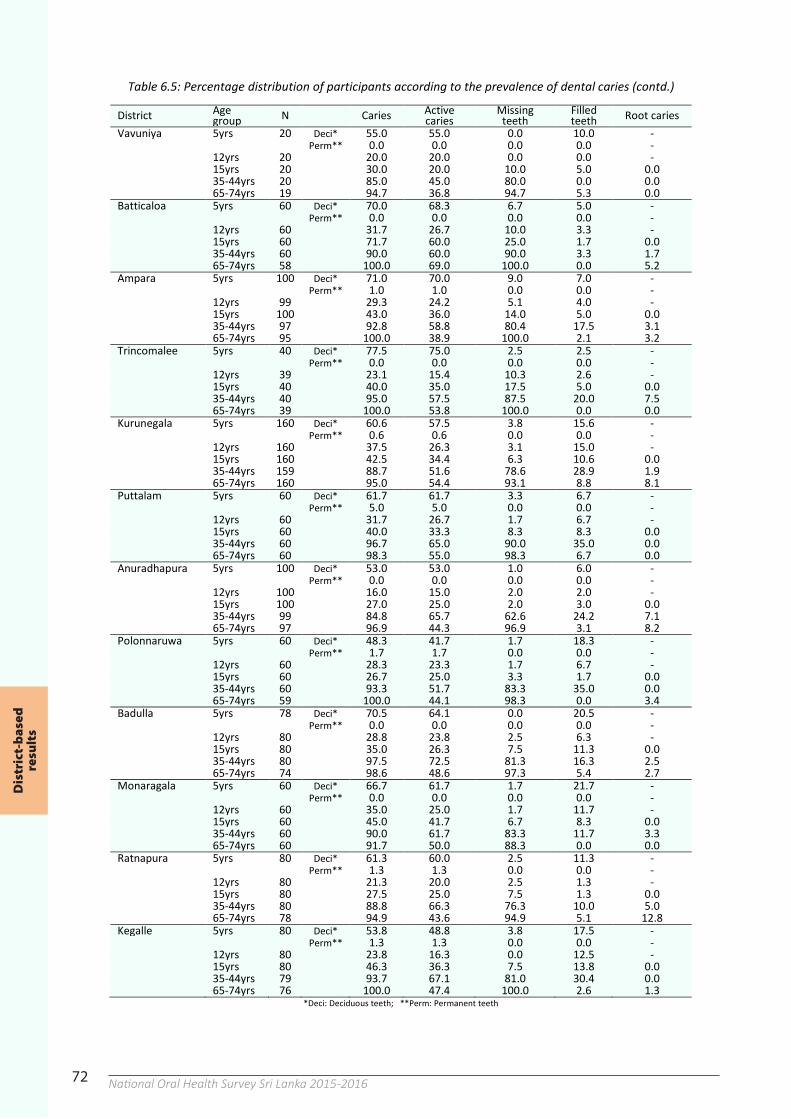
72 National Oral Health Survey Sri Lanka 2015-201672
Table 6.5: Percentage distribution of participants according to the prevalence of dental caries (contd.)
District Age group N Caries Active
caries Missing
teeth Filled teeth Root caries
Vavuniya 5yrs 20 Deci* 55.0 55.0 0.0 10.0 -
Perm** 0.0 0.0 0.0 0.0 -
12yrs 20 20.0 20.0 0.0 0.0 -
15yrs 20 30.0 20.0 10.0 5.0 0.0
35-44yrs 20 85.0 45.0 80.0 0.0 0.0
65-74yrs 19 94.7 36.8 94.7 5.3 0.0
Batticaloa 5yrs 60 Deci* 70.0 68.3 6.7 5.0 -
Perm** 0.0 0.0 0.0 0.0 -
12yrs 60 31.7 26.7 10.0 3.3 -
15yrs 60 71.7 60.0 25.0 1.7 0.0
35-44yrs 60 90.0 60.0 90.0 3.3 1.7
65-74yrs 58 100.0 69.0 100.0 0.0 5.2
Ampara 5yrs 100 Deci* 71.0 70.0 9.0 7.0 -
Perm** 1.0 1.0 0.0 0.0 -
12yrs 99 29.3 24.2 5.1 4.0 -
15yrs 100 43.0 36.0 14.0 5.0 0.0
35-44yrs 97 92.8 58.8 80.4 17.5 3.1
65-74yrs 95 100.0 38.9 100.0 2.1 3.2
Trincomalee 5yrs 40 Deci* 77.5 75.0 2.5 2.5 -
Perm** 0.0 0.0 0.0 0.0 -
12yrs 39 23.1 15.4 10.3 2.6 -
15yrs 40 40.0 35.0 17.5 5.0 0.0
35-44yrs 40 95.0 57.5 87.5 20.0 7.5
65-74yrs 39 100.0 53.8 100.0 0.0 0.0
Kurunegala 5yrs 160 Deci* 60.6 57.5 3.8 15.6 -
Perm** 0.6 0.6 0.0 0.0 -
12yrs 160 37.5 26.3 3.1 15.0 -
15yrs 160 42.5 34.4 6.3 10.6 0.0
35-44yrs 159 88.7 51.6 78.6 28.9 1.9
65-74yrs 160 95.0 54.4 93.1 8.8 8.1
Puttalam 5yrs 60 Deci* 61.7 61.7 3.3 6.7 -
Perm** 5.0 5.0 0.0 0.0 -
12yrs 60 31.7 26.7 1.7 6.7 -
15yrs 60 40.0 33.3 8.3 8.3 0.0
35-44yrs 60 96.7 65.0 90.0 35.0 0.0
65-74yrs 60 98.3 55.0 98.3 6.7 0.0
Anuradhapura 5yrs 100 Deci* 53.0 53.0 1.0 6.0 -
Perm** 0.0 0.0 0.0 0.0 -
12yrs 100 16.0 15.0 2.0 2.0 -
15yrs 100 27.0 25.0 2.0 3.0 0.0
35-44yrs 99 84.8 65.7 62.6 24.2 7.1
65-74yrs 97 96.9 44.3 96.9 3.1 8.2
Polonnaruwa 5yrs 60 Deci* 48.3 41.7 1.7 18.3 -
Perm** 1.7 1.7 0.0 0.0 -
12yrs 60 28.3 23.3 1.7 6.7 -
15yrs 60 26.7 25.0 3.3 1.7 0.0
35-44yrs 60 93.3 51.7 83.3 35.0 0.0
65-74yrs 59 100.0 44.1 98.3 0.0 3.4
Badulla 5yrs 78 Deci* 70.5 64.1 0.0 20.5 -
Perm** 0.0 0.0 0.0 0.0 -
12yrs 80 28.8 23.8 2.5 6.3 -
15yrs 80 35.0 26.3 7.5 11.3 0.0
35-44yrs 80 97.5 72.5 81.3 16.3 2.5
65-74yrs 74 98.6 48.6 97.3 5.4 2.7
Monaragala 5yrs 60 Deci* 66.7 61.7 1.7 21.7 -
Perm** 0.0 0.0 0.0 0.0 -
12yrs 60 35.0 25.0 1.7 11.7 -
15yrs 60 45.0 41.7 6.7 8.3 0.0
35-44yrs 60 90.0 61.7 83.3 11.7 3.3
65-74yrs 60 91.7 50.0 88.3 0.0 0.0
Ratnapura 5yrs 80 Deci* 61.3 60.0 2.5 11.3 -
Perm** 1.3 1.3 0.0 0.0 -
12yrs 80 21.3 20.0 2.5 1.3 -
15yrs 80 27.5 25.0 7.5 1.3 0.0
35-44yrs 80 88.8 66.3 76.3 10.0 5.0
65-74yrs 78 94.9 43.6 94.9 5.1 12.8
Kegalle 5yrs 80 Deci* 53.8 48.8 3.8 17.5 -
Perm** 1.3 1.3 0.0 0.0 -
12yrs 80 23.8 16.3 0.0 12.5 -
15yrs 80 46.3 36.3 7.5 13.8 0.0
35-44yrs 79 93.7 67.1 81.0 30.4 0.0
65-74yrs 76 100.0 47.4 100.0 2.6 1.3 *Deci: Deciduous teeth; **Perm: Permanent teeth
73
Table 6.6: Distribution of participants according to the severity of dental caries
District Age group N Total teeth
x ̅ Mean number of teeth with
DT MT FT DMFT Root exposed R-DT R-FT R-DFT
Colombo 5yrs 180 Deci* 19.3 2.7 0.1 0.3 3.0 - - - - Perm** 1.7 0.1 0.0 0.0 0.1 - - - - 12yrs 179 26.8 0.6 0.1 0.2 0.8 - - - - 15yrs 180 28.0 0.6 0.1 0.3 1.0 0.0 0.0 0.0 0.0 35-44yrs 178 27.1 2.1 4.3 0.8 7.1 5.2 0.2 0.0 0.2 65-74yrs 176 14.9 1.3 16.8 0.3 18.3 7.7 0.2 0.0 0.2 Gampaha 5yrs 180 Deci* 19.0 3.2 0.1 0.2 3.4 - - - -
Perm** 2.3 0.0 0.0 0.0 0.0 - - - - 12yrs 180 26.1 0.5 0.0 0.2 0.7 - - - - 15yrs 181 27.9 0.7 0.1 0.2 1.1 0.1 0.0 0.0 0.0 35-44yrs 177 26.8 2.3 4.6 0.5 7.4 6.1 0.0 0.0 0.0 65-74yrs 179 14.1 2.0 17.4 0.1 19.6 8.6 0.2 0.0 0.2 Kalutara 5yrs 100 Deci* 19.4 2.1 0.1 0.5 2.7 - - - - Perm** 1.6 0.0 0.0 0.0 0.0 - - - - 12yrs 100 26.7 0.7 0.1 0.3 1.0 - - - - 15yrs 102 27.9 1.3 0.1 0.1 1.6 0.2 0.0 0.0 0.0 35-44yrs 100 26.4 2.0 5.1 0.6 7.7 5.8 0.0 0.0 0.0 65-74yrs 100 13.5 2.3 18.4 0.0 20.7 8.6 0.3 0.0 0.3 Kandy 5yrs 140 Deci* 19.6 3.4 0.0 0.1 3.5 - - - - Perm** 1.2 0.0 0.0 0.0 0.0 - - - - 12yrs 140 25.5 0.6 0.0 0.2 0.8 - - - - 15yrs 140 28.1 0.9 0.1 0.2 1.2 0.2 0.0 0.0 0.0 35-44yrs 136 27.4 1.7 4.0 0.8 6.5 1.7 0.1 0.0 0.1 65-74yrs 134 14.7 1.9 17.1 0.2 19.2 5.3 0.2 0.0 0.2 Matale 5yrs 40 Deci* 19.3 2.3 0.2 0.4 2.9 - - - - Perm** 1.6 0.1 0.0 0.0 0.1 - - - - 12yrs 40 24.5 0.3 0.0 0.1 0.4 - - - - 15yrs 40 28.0 0.5 0.1 0.2 0.8 0.0 0.0 0.0 0.0 35-44yrs 40 28.0 2.3 3.7 0.8 6.8 1.0 0.0 0.0 0.0 65-74yrs 39 15.3 3.3 16.6 0.0 19.9 2.6 0.0 0.0 0.0 Nuwara-Eliya 5yrs 100 Deci* 19.8 2.5 0.0 0.1 2.6 - - - - Perm** 0.9 0.0 0.0 0.0 0.0 - - - - 12yrs 99 24.4 0.4 0.0 0.0 0.5 - - - - 15yrs 100 28.0 0.8 0.0 0.1 1.0 0.1 0.0 0.0 0.0 35-44yrs 99 27.5 2.8 4.1 0.3 7.1 0.3 0.0 0.0 0.0 65-74yrs 98 13.7 2.1 18.1 0.1 20.3 2.2 0.0 0.0 0.0 Galle 5yrs 98 Deci* 19.3 3.3 0.2 0.2 3.7 - - - - Perm** 1.6 0.0 0.0 0.0 0.0 - - - - 12yrs 99 26.7 0.3 0.1 0.2 0.5 - - - - 15yrs 100 27.8 0.8 0.2 0.1 1.1 0.1 0.0 0.0 0.0 35-44yrs 99 26.2 1.5 5.0 0.7 7.2 8.2 0.1 0.0 0.1 65-74yrs 100 12.5 1.5 19.2 0.2 20.8 8.1 0.3 0.0 0.3 Matara 5yrs 79 Deci* 19.4 3.1 0.1 0.2 3.3 - - - - Perm** 1.5 0.0 0.0 0.0 0.0 - - - - 12yrs 80 26.8 0.5 0.1 0.3 0.8 - - - - 15yrs 80 27.9 1.0 0.2 0.2 1.4 0.1 0.0 0.0 0.0 35-44yrs 79 27.3 1.9 4.0 0.6 6.5 9.5 0.1 0.0 0.1 65-74yrs 79 16.9 2.1 14.9 0.0 16.9 13.3 0.3 0.0 0.3 Hambantota 5yrs 60 Deci* 19.5 1.9 0.1 0.3 2.2 - - - - Perm** 1.3 0.0 0.0 0.0 0.0 - - - - 12yrs 60 26.6 0.3 0.0 0.0 0.4 - - - - 15yrs 60 28.0 0.6 0.0 0.0 0.7 0.1 0.0 0.0 0.0 35-44yrs 59 29.0 1.2 2.5 0.5 4.2 11.3 0.1 0.0 0.1 65-74yrs 60 17.6 0.7 14.3 0.0 15.0 13.6 0.2 0.0 0.2 Jaffna 5yrs 60 Deci* 19.7 3.3 0.0 0.0 3.3 - - - - Perm** 1.3 0.0 0.0 0.0 0.0 - - - - 12yrs 60 26.2 0.5 0.0 0.0 0.5 - - - - 15yrs 60 27.6 0.9 0.1 0.1 1.1 0.2 0.0 0.0 0.0 35-44yrs 60 28.8 3.1 2.7 0.1 5.9 17.5 0.0 0.0 0.0 65-74yrs 59 20.1 3.1 11.7 0.1 14.8 16.1 0.2 0.0 0.2 Kilinochchi 5yrs 20 Deci* 19.6 2.9 0.0 0.1 3.0 - - - - Perm** 1.4 0.0 0.0 0.0 0.0 - - - - 12yrs 20 26.8 0.3 0.0 0.0 0.3 - - - - 15yrs 20 27.7 0.7 0.3 0.0 1.0 0.1 0.0 0.0 0.0 35-44yrs 20 28.7 1.8 3.1 0.2 5.1 2.3 0.2 0.0 0.2 65-74yrs 20 19.1 1.7 12.5 0.0 14.2 12.3 0.2 0.0 0.2 Mannar 5yrs 20 Deci* 19.7 4.5 0.0 0.0 4.5 - - - - Perm** 1.9 0.0 0.0 0.0 0.0 - - - - 12yrs 21 25.7 0.2 0.1 0.0 0.3 - - - - 15yrs 20 28.2 0.4 0.0 0.0 0.4 0.0 0.0 0.0 0.0 35-44yrs 20 28.7 2.8 2.6 0.1 5.5 20.5 0.0 0.0 0.0 65-74yrs 20 18.8 4.8 13.1 0.0 17.9 18.7 0.1 0.0 0.1 Mullaitivu 5yrs 20 Deci* 20.0 0.4 0.0 0.0 0.4 - - - - Perm** 0.0 0.0 0.0 0.0 0.0 - - - - 12yrs 20 26.9 0.2 0.1 0.1 0.3 - - - - 15yrs 20 28.0 0.0 0.0 0.0 0.0 0.0 0.0 0.0 0.0 35-44yrs 21 29.2 3.0 2.5 0.1 5.5 8.4 0.0 0.0 0.0 65-74yrs 20 13.3 1.8 18.7 0.0 20.4 8.0 0.1 0.0 0.1
*Deci: Deciduous teeth; **Perm: Permanent teeth
Dis
tric
t-b
ased
re
sult
s
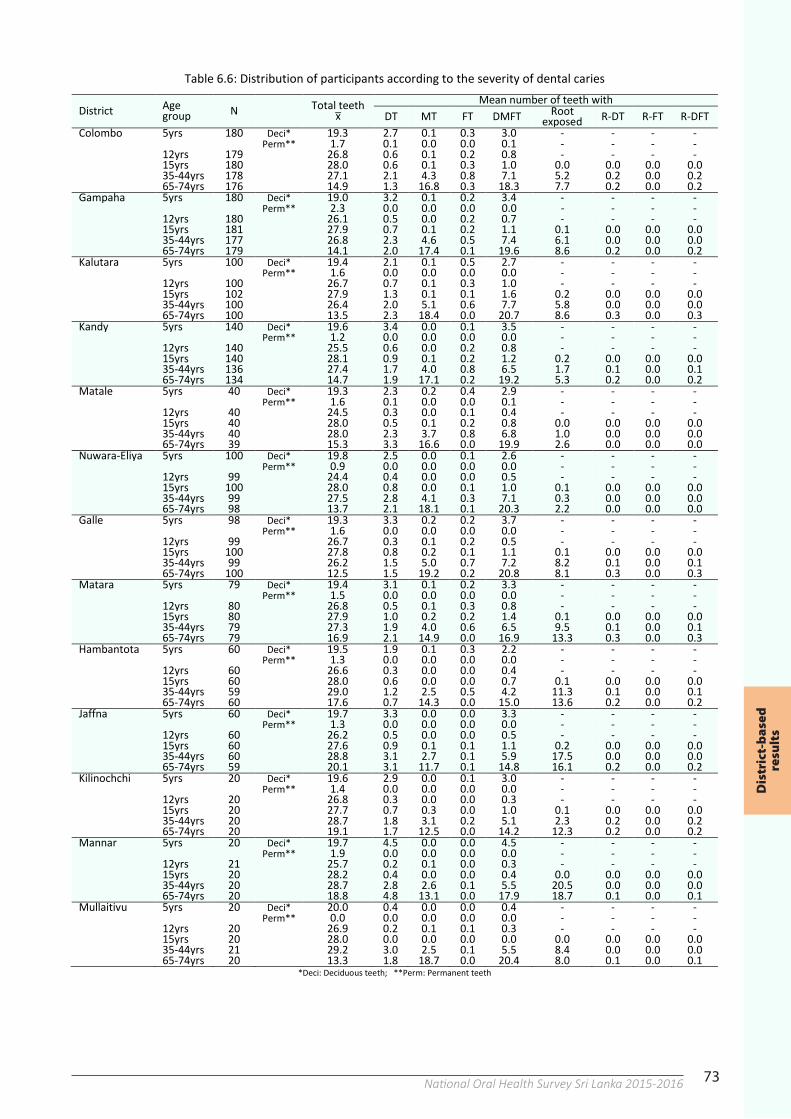
73National Oral Health Survey Sri Lanka 2015-201672
Table 6.5: Percentage distribution of participants according to the prevalence of dental caries (contd.)
District Age group N Caries Active
caries Missing
teeth Filled teeth Root caries
Vavuniya 5yrs 20 Deci* 55.0 55.0 0.0 10.0 -
Perm** 0.0 0.0 0.0 0.0 -
12yrs 20 20.0 20.0 0.0 0.0 -
15yrs 20 30.0 20.0 10.0 5.0 0.0
35-44yrs 20 85.0 45.0 80.0 0.0 0.0
65-74yrs 19 94.7 36.8 94.7 5.3 0.0
Batticaloa 5yrs 60 Deci* 70.0 68.3 6.7 5.0 -
Perm** 0.0 0.0 0.0 0.0 -
12yrs 60 31.7 26.7 10.0 3.3 -
15yrs 60 71.7 60.0 25.0 1.7 0.0
35-44yrs 60 90.0 60.0 90.0 3.3 1.7
65-74yrs 58 100.0 69.0 100.0 0.0 5.2
Ampara 5yrs 100 Deci* 71.0 70.0 9.0 7.0 -
Perm** 1.0 1.0 0.0 0.0 -
12yrs 99 29.3 24.2 5.1 4.0 -
15yrs 100 43.0 36.0 14.0 5.0 0.0
35-44yrs 97 92.8 58.8 80.4 17.5 3.1
65-74yrs 95 100.0 38.9 100.0 2.1 3.2
Trincomalee 5yrs 40 Deci* 77.5 75.0 2.5 2.5 -
Perm** 0.0 0.0 0.0 0.0 -
12yrs 39 23.1 15.4 10.3 2.6 -
15yrs 40 40.0 35.0 17.5 5.0 0.0
35-44yrs 40 95.0 57.5 87.5 20.0 7.5
65-74yrs 39 100.0 53.8 100.0 0.0 0.0
Kurunegala 5yrs 160 Deci* 60.6 57.5 3.8 15.6 -
Perm** 0.6 0.6 0.0 0.0 -
12yrs 160 37.5 26.3 3.1 15.0 -
15yrs 160 42.5 34.4 6.3 10.6 0.0
35-44yrs 159 88.7 51.6 78.6 28.9 1.9
65-74yrs 160 95.0 54.4 93.1 8.8 8.1
Puttalam 5yrs 60 Deci* 61.7 61.7 3.3 6.7 -
Perm** 5.0 5.0 0.0 0.0 -
12yrs 60 31.7 26.7 1.7 6.7 -
15yrs 60 40.0 33.3 8.3 8.3 0.0
35-44yrs 60 96.7 65.0 90.0 35.0 0.0
65-74yrs 60 98.3 55.0 98.3 6.7 0.0
Anuradhapura 5yrs 100 Deci* 53.0 53.0 1.0 6.0 -
Perm** 0.0 0.0 0.0 0.0 -
12yrs 100 16.0 15.0 2.0 2.0 -
15yrs 100 27.0 25.0 2.0 3.0 0.0
35-44yrs 99 84.8 65.7 62.6 24.2 7.1
65-74yrs 97 96.9 44.3 96.9 3.1 8.2
Polonnaruwa 5yrs 60 Deci* 48.3 41.7 1.7 18.3 -
Perm** 1.7 1.7 0.0 0.0 -
12yrs 60 28.3 23.3 1.7 6.7 -
15yrs 60 26.7 25.0 3.3 1.7 0.0
35-44yrs 60 93.3 51.7 83.3 35.0 0.0
65-74yrs 59 100.0 44.1 98.3 0.0 3.4
Badulla 5yrs 78 Deci* 70.5 64.1 0.0 20.5 -
Perm** 0.0 0.0 0.0 0.0 -
12yrs 80 28.8 23.8 2.5 6.3 -
15yrs 80 35.0 26.3 7.5 11.3 0.0
35-44yrs 80 97.5 72.5 81.3 16.3 2.5
65-74yrs 74 98.6 48.6 97.3 5.4 2.7
Monaragala 5yrs 60 Deci* 66.7 61.7 1.7 21.7 -
Perm** 0.0 0.0 0.0 0.0 -
12yrs 60 35.0 25.0 1.7 11.7 -
15yrs 60 45.0 41.7 6.7 8.3 0.0
35-44yrs 60 90.0 61.7 83.3 11.7 3.3
65-74yrs 60 91.7 50.0 88.3 0.0 0.0
Ratnapura 5yrs 80 Deci* 61.3 60.0 2.5 11.3 -
Perm** 1.3 1.3 0.0 0.0 -
12yrs 80 21.3 20.0 2.5 1.3 -
15yrs 80 27.5 25.0 7.5 1.3 0.0
35-44yrs 80 88.8 66.3 76.3 10.0 5.0
65-74yrs 78 94.9 43.6 94.9 5.1 12.8
Kegalle 5yrs 80 Deci* 53.8 48.8 3.8 17.5 -
Perm** 1.3 1.3 0.0 0.0 -
12yrs 80 23.8 16.3 0.0 12.5 -
15yrs 80 46.3 36.3 7.5 13.8 0.0
35-44yrs 79 93.7 67.1 81.0 30.4 0.0
65-74yrs 76 100.0 47.4 100.0 2.6 1.3 *Deci: Deciduous teeth; **Perm: Permanent teeth
73
Table 6.6: Distribution of participants according to the severity of dental caries
District Age group N Total teeth
x ̅ Mean number of teeth with
DT MT FT DMFT Root exposed R-DT R-FT R-DFT
Colombo 5yrs 180 Deci* 19.3 2.7 0.1 0.3 3.0 - - - - Perm** 1.7 0.1 0.0 0.0 0.1 - - - - 12yrs 179 26.8 0.6 0.1 0.2 0.8 - - - - 15yrs 180 28.0 0.6 0.1 0.3 1.0 0.0 0.0 0.0 0.0 35-44yrs 178 27.1 2.1 4.3 0.8 7.1 5.2 0.2 0.0 0.2 65-74yrs 176 14.9 1.3 16.8 0.3 18.3 7.7 0.2 0.0 0.2 Gampaha 5yrs 180 Deci* 19.0 3.2 0.1 0.2 3.4 - - - -
Perm** 2.3 0.0 0.0 0.0 0.0 - - - - 12yrs 180 26.1 0.5 0.0 0.2 0.7 - - - - 15yrs 181 27.9 0.7 0.1 0.2 1.1 0.1 0.0 0.0 0.0 35-44yrs 177 26.8 2.3 4.6 0.5 7.4 6.1 0.0 0.0 0.0 65-74yrs 179 14.1 2.0 17.4 0.1 19.6 8.6 0.2 0.0 0.2 Kalutara 5yrs 100 Deci* 19.4 2.1 0.1 0.5 2.7 - - - - Perm** 1.6 0.0 0.0 0.0 0.0 - - - - 12yrs 100 26.7 0.7 0.1 0.3 1.0 - - - - 15yrs 102 27.9 1.3 0.1 0.1 1.6 0.2 0.0 0.0 0.0 35-44yrs 100 26.4 2.0 5.1 0.6 7.7 5.8 0.0 0.0 0.0 65-74yrs 100 13.5 2.3 18.4 0.0 20.7 8.6 0.3 0.0 0.3 Kandy 5yrs 140 Deci* 19.6 3.4 0.0 0.1 3.5 - - - - Perm** 1.2 0.0 0.0 0.0 0.0 - - - - 12yrs 140 25.5 0.6 0.0 0.2 0.8 - - - - 15yrs 140 28.1 0.9 0.1 0.2 1.2 0.2 0.0 0.0 0.0 35-44yrs 136 27.4 1.7 4.0 0.8 6.5 1.7 0.1 0.0 0.1 65-74yrs 134 14.7 1.9 17.1 0.2 19.2 5.3 0.2 0.0 0.2 Matale 5yrs 40 Deci* 19.3 2.3 0.2 0.4 2.9 - - - - Perm** 1.6 0.1 0.0 0.0 0.1 - - - - 12yrs 40 24.5 0.3 0.0 0.1 0.4 - - - - 15yrs 40 28.0 0.5 0.1 0.2 0.8 0.0 0.0 0.0 0.0 35-44yrs 40 28.0 2.3 3.7 0.8 6.8 1.0 0.0 0.0 0.0 65-74yrs 39 15.3 3.3 16.6 0.0 19.9 2.6 0.0 0.0 0.0 Nuwara-Eliya 5yrs 100 Deci* 19.8 2.5 0.0 0.1 2.6 - - - - Perm** 0.9 0.0 0.0 0.0 0.0 - - - - 12yrs 99 24.4 0.4 0.0 0.0 0.5 - - - - 15yrs 100 28.0 0.8 0.0 0.1 1.0 0.1 0.0 0.0 0.0 35-44yrs 99 27.5 2.8 4.1 0.3 7.1 0.3 0.0 0.0 0.0 65-74yrs 98 13.7 2.1 18.1 0.1 20.3 2.2 0.0 0.0 0.0 Galle 5yrs 98 Deci* 19.3 3.3 0.2 0.2 3.7 - - - - Perm** 1.6 0.0 0.0 0.0 0.0 - - - - 12yrs 99 26.7 0.3 0.1 0.2 0.5 - - - - 15yrs 100 27.8 0.8 0.2 0.1 1.1 0.1 0.0 0.0 0.0 35-44yrs 99 26.2 1.5 5.0 0.7 7.2 8.2 0.1 0.0 0.1 65-74yrs 100 12.5 1.5 19.2 0.2 20.8 8.1 0.3 0.0 0.3 Matara 5yrs 79 Deci* 19.4 3.1 0.1 0.2 3.3 - - - - Perm** 1.5 0.0 0.0 0.0 0.0 - - - - 12yrs 80 26.8 0.5 0.1 0.3 0.8 - - - - 15yrs 80 27.9 1.0 0.2 0.2 1.4 0.1 0.0 0.0 0.0 35-44yrs 79 27.3 1.9 4.0 0.6 6.5 9.5 0.1 0.0 0.1 65-74yrs 79 16.9 2.1 14.9 0.0 16.9 13.3 0.3 0.0 0.3 Hambantota 5yrs 60 Deci* 19.5 1.9 0.1 0.3 2.2 - - - - Perm** 1.3 0.0 0.0 0.0 0.0 - - - - 12yrs 60 26.6 0.3 0.0 0.0 0.4 - - - - 15yrs 60 28.0 0.6 0.0 0.0 0.7 0.1 0.0 0.0 0.0 35-44yrs 59 29.0 1.2 2.5 0.5 4.2 11.3 0.1 0.0 0.1 65-74yrs 60 17.6 0.7 14.3 0.0 15.0 13.6 0.2 0.0 0.2 Jaffna 5yrs 60 Deci* 19.7 3.3 0.0 0.0 3.3 - - - - Perm** 1.3 0.0 0.0 0.0 0.0 - - - - 12yrs 60 26.2 0.5 0.0 0.0 0.5 - - - - 15yrs 60 27.6 0.9 0.1 0.1 1.1 0.2 0.0 0.0 0.0 35-44yrs 60 28.8 3.1 2.7 0.1 5.9 17.5 0.0 0.0 0.0 65-74yrs 59 20.1 3.1 11.7 0.1 14.8 16.1 0.2 0.0 0.2 Kilinochchi 5yrs 20 Deci* 19.6 2.9 0.0 0.1 3.0 - - - - Perm** 1.4 0.0 0.0 0.0 0.0 - - - - 12yrs 20 26.8 0.3 0.0 0.0 0.3 - - - - 15yrs 20 27.7 0.7 0.3 0.0 1.0 0.1 0.0 0.0 0.0 35-44yrs 20 28.7 1.8 3.1 0.2 5.1 2.3 0.2 0.0 0.2 65-74yrs 20 19.1 1.7 12.5 0.0 14.2 12.3 0.2 0.0 0.2 Mannar 5yrs 20 Deci* 19.7 4.5 0.0 0.0 4.5 - - - - Perm** 1.9 0.0 0.0 0.0 0.0 - - - - 12yrs 21 25.7 0.2 0.1 0.0 0.3 - - - - 15yrs 20 28.2 0.4 0.0 0.0 0.4 0.0 0.0 0.0 0.0 35-44yrs 20 28.7 2.8 2.6 0.1 5.5 20.5 0.0 0.0 0.0 65-74yrs 20 18.8 4.8 13.1 0.0 17.9 18.7 0.1 0.0 0.1 Mullaitivu 5yrs 20 Deci* 20.0 0.4 0.0 0.0 0.4 - - - - Perm** 0.0 0.0 0.0 0.0 0.0 - - - - 12yrs 20 26.9 0.2 0.1 0.1 0.3 - - - - 15yrs 20 28.0 0.0 0.0 0.0 0.0 0.0 0.0 0.0 0.0 35-44yrs 21 29.2 3.0 2.5 0.1 5.5 8.4 0.0 0.0 0.0 65-74yrs 20 13.3 1.8 18.7 0.0 20.4 8.0 0.1 0.0 0.1
*Deci: Deciduous teeth; **Perm: Permanent teeth
Dis
tric
t-b
ased
re
sult
s
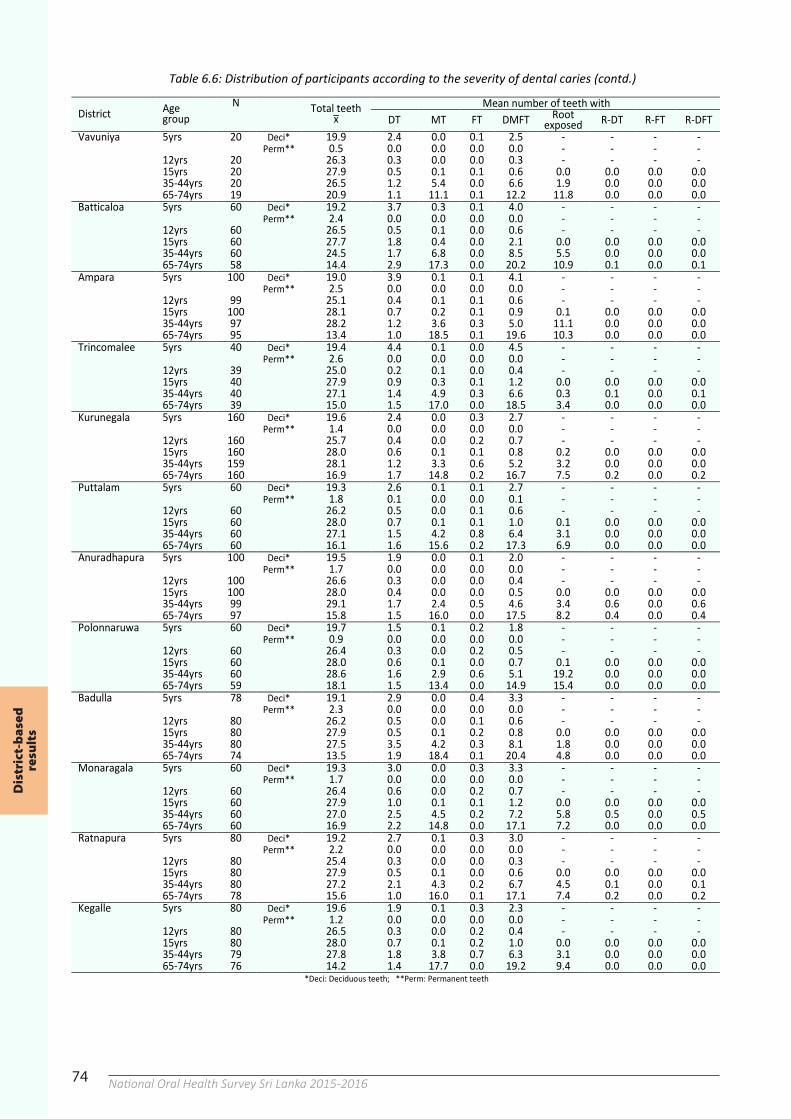
74 National Oral Health Survey Sri Lanka 2015-201674
Table 6.6: Distribution of participants according to the severity of dental caries (contd.)
District Age group
N Total teeth x ̅
Mean number of teeth with DT MT FT DMFT Root
exposed R-DT R-FT R-DFT Vavuniya 5yrs 20 Deci* 19.9 2.4 0.0 0.1 2.5 - - - - Perm** 0.5 0.0 0.0 0.0 0.0 - - - - 12yrs 20 26.3 0.3 0.0 0.0 0.3 - - - - 15yrs 20 27.9 0.5 0.1 0.1 0.6 0.0 0.0 0.0 0.0 35-44yrs 20 26.5 1.2 5.4 0.0 6.6 1.9 0.0 0.0 0.0 65-74yrs 19 20.9 1.1 11.1 0.1 12.2 11.8 0.0 0.0 0.0 Batticaloa 5yrs 60 Deci* 19.2 3.7 0.3 0.1 4.0 - - - - Perm** 2.4 0.0 0.0 0.0 0.0 - - - - 12yrs 60 26.5 0.5 0.1 0.0 0.6 - - - - 15yrs 60 27.7 1.8 0.4 0.0 2.1 0.0 0.0 0.0 0.0 35-44yrs 60 24.5 1.7 6.8 0.0 8.5 5.5 0.0 0.0 0.0 65-74yrs 58 14.4 2.9 17.3 0.0 20.2 10.9 0.1 0.0 0.1 Ampara 5yrs 100 Deci* 19.0 3.9 0.1 0.1 4.1 - - - - Perm** 2.5 0.0 0.0 0.0 0.0 - - - - 12yrs 99 25.1 0.4 0.1 0.1 0.6 - - - - 15yrs 100 28.1 0.7 0.2 0.1 0.9 0.1 0.0 0.0 0.0 35-44yrs 97 28.2 1.2 3.6 0.3 5.0 11.1 0.0 0.0 0.0 65-74yrs 95 13.4 1.0 18.5 0.1 19.6 10.3 0.0 0.0 0.0 Trincomalee 5yrs 40 Deci* 19.4 4.4 0.1 0.0 4.5 - - - - Perm** 2.6 0.0 0.0 0.0 0.0 - - - - 12yrs 39 25.0 0.2 0.1 0.0 0.4 - - - - 15yrs 40 27.9 0.9 0.3 0.1 1.2 0.0 0.0 0.0 0.0 35-44yrs 40 27.1 1.4 4.9 0.3 6.6 0.3 0.1 0.0 0.1 65-74yrs 39 15.0 1.5 17.0 0.0 18.5 3.4 0.0 0.0 0.0 Kurunegala 5yrs 160 Deci* 19.6 2.4 0.0 0.3 2.7 - - - - Perm** 1.4 0.0 0.0 0.0 0.0 - - - - 12yrs 160 25.7 0.4 0.0 0.2 0.7 - - - - 15yrs 160 28.0 0.6 0.1 0.1 0.8 0.2 0.0 0.0 0.0 35-44yrs 159 28.1 1.2 3.3 0.6 5.2 3.2 0.0 0.0 0.0 65-74yrs 160 16.9 1.7 14.8 0.2 16.7 7.5 0.2 0.0 0.2 Puttalam 5yrs 60 Deci* 19.3 2.6 0.1 0.1 2.7 - - - - Perm** 1.8 0.1 0.0 0.0 0.1 - - - - 12yrs 60 26.2 0.5 0.0 0.1 0.6 - - - - 15yrs 60 28.0 0.7 0.1 0.1 1.0 0.1 0.0 0.0 0.0 35-44yrs 60 27.1 1.5 4.2 0.8 6.4 3.1 0.0 0.0 0.0 65-74yrs 60 16.1 1.6 15.6 0.2 17.3 6.9 0.0 0.0 0.0 Anuradhapura 5yrs 100 Deci* 19.5 1.9 0.0 0.1 2.0 - - - - Perm** 1.7 0.0 0.0 0.0 0.0 - - - - 12yrs 100 26.6 0.3 0.0 0.0 0.4 - - - - 15yrs 100 28.0 0.4 0.0 0.0 0.5 0.0 0.0 0.0 0.0 35-44yrs 99 29.1 1.7 2.4 0.5 4.6 3.4 0.6 0.0 0.6 65-74yrs 97 15.8 1.5 16.0 0.0 17.5 8.2 0.4 0.0 0.4 Polonnaruwa 5yrs 60 Deci* 19.7 1.5 0.1 0.2 1.8 - - - - Perm** 0.9 0.0 0.0 0.0 0.0 - - - - 12yrs 60 26.4 0.3 0.0 0.2 0.5 - - - - 15yrs 60 28.0 0.6 0.1 0.0 0.7 0.1 0.0 0.0 0.0 35-44yrs 60 28.6 1.6 2.9 0.6 5.1 19.2 0.0 0.0 0.0 65-74yrs 59 18.1 1.5 13.4 0.0 14.9 15.4 0.0 0.0 0.0 Badulla 5yrs 78 Deci* 19.1 2.9 0.0 0.4 3.3 - - - - Perm** 2.3 0.0 0.0 0.0 0.0 - - - - 12yrs 80 26.2 0.5 0.0 0.1 0.6 - - - - 15yrs 80 27.9 0.5 0.1 0.2 0.8 0.0 0.0 0.0 0.0 35-44yrs 80 27.5 3.5 4.2 0.3 8.1 1.8 0.0 0.0 0.0 65-74yrs 74 13.5 1.9 18.4 0.1 20.4 4.8 0.0 0.0 0.0 Monaragala 5yrs 60 Deci* 19.3 3.0 0.0 0.3 3.3 - - - - Perm** 1.7 0.0 0.0 0.0 0.0 - - - - 12yrs 60 26.4 0.6 0.0 0.2 0.7 - - - - 15yrs 60 27.9 1.0 0.1 0.1 1.2 0.0 0.0 0.0 0.0 35-44yrs 60 27.0 2.5 4.5 0.2 7.2 5.8 0.5 0.0 0.5 65-74yrs 60 16.9 2.2 14.8 0.0 17.1 7.2 0.0 0.0 0.0 Ratnapura 5yrs 80 Deci* 19.2 2.7 0.1 0.3 3.0 - - - - Perm** 2.2 0.0 0.0 0.0 0.0 - - - - 12yrs 80 25.4 0.3 0.0 0.0 0.3 - - - - 15yrs 80 27.9 0.5 0.1 0.0 0.6 0.0 0.0 0.0 0.0 35-44yrs 80 27.2 2.1 4.3 0.2 6.7 4.5 0.1 0.0 0.1 65-74yrs 78 15.6 1.0 16.0 0.1 17.1 7.4 0.2 0.0 0.2 Kegalle 5yrs 80 Deci* 19.6 1.9 0.1 0.3 2.3 - - - - Perm** 1.2 0.0 0.0 0.0 0.0 - - - - 12yrs 80 26.5 0.3 0.0 0.2 0.4 - - - - 15yrs 80 28.0 0.7 0.1 0.2 1.0 0.0 0.0 0.0 0.0 35-44yrs 79 27.8 1.8 3.8 0.7 6.3 3.1 0.0 0.0 0.0 65-74yrs 76 14.2 1.4 17.7 0.0 19.2 9.4 0.0 0.0 0.0
*Deci: Deciduous teeth; **Perm: Permanent teeth
74
Table 6.6: Distribution of participants according to the severity of dental caries (contd.)
District Age group
N Total teeth x ̅
Mean number of teeth with DT MT FT DMFT Root
exposed R-DT R-FT R-DFT Vavuniya 5yrs 20 Deci* 19.9 2.4 0.0 0.1 2.5 - - - - Perm** 0.5 0.0 0.0 0.0 0.0 - - - - 12yrs 20 26.3 0.3 0.0 0.0 0.3 - - - - 15yrs 20 27.9 0.5 0.1 0.1 0.6 0.0 0.0 0.0 0.0 35-44yrs 20 26.5 1.2 5.4 0.0 6.6 1.9 0.0 0.0 0.0 65-74yrs 19 20.9 1.1 11.1 0.1 12.2 11.8 0.0 0.0 0.0 Batticaloa 5yrs 60 Deci* 19.2 3.7 0.3 0.1 4.0 - - - - Perm** 2.4 0.0 0.0 0.0 0.0 - - - - 12yrs 60 26.5 0.5 0.1 0.0 0.6 - - - - 15yrs 60 27.7 1.8 0.4 0.0 2.1 0.0 0.0 0.0 0.0 35-44yrs 60 24.5 1.7 6.8 0.0 8.5 5.5 0.0 0.0 0.0 65-74yrs 58 14.4 2.9 17.3 0.0 20.2 10.9 0.1 0.0 0.1 Ampara 5yrs 100 Deci* 19.0 3.9 0.1 0.1 4.1 - - - - Perm** 2.5 0.0 0.0 0.0 0.0 - - - - 12yrs 99 25.1 0.4 0.1 0.1 0.6 - - - - 15yrs 100 28.1 0.7 0.2 0.1 0.9 0.1 0.0 0.0 0.0 35-44yrs 97 28.2 1.2 3.6 0.3 5.0 11.1 0.0 0.0 0.0 65-74yrs 95 13.4 1.0 18.5 0.1 19.6 10.3 0.0 0.0 0.0 Trincomalee 5yrs 40 Deci* 19.4 4.4 0.1 0.0 4.5 - - - - Perm** 2.6 0.0 0.0 0.0 0.0 - - - - 12yrs 39 25.0 0.2 0.1 0.0 0.4 - - - - 15yrs 40 27.9 0.9 0.3 0.1 1.2 0.0 0.0 0.0 0.0 35-44yrs 40 27.1 1.4 4.9 0.3 6.6 0.3 0.1 0.0 0.1 65-74yrs 39 15.0 1.5 17.0 0.0 18.5 3.4 0.0 0.0 0.0 Kurunegala 5yrs 160 Deci* 19.6 2.4 0.0 0.3 2.7 - - - - Perm** 1.4 0.0 0.0 0.0 0.0 - - - - 12yrs 160 25.7 0.4 0.0 0.2 0.7 - - - - 15yrs 160 28.0 0.6 0.1 0.1 0.8 0.2 0.0 0.0 0.0 35-44yrs 159 28.1 1.2 3.3 0.6 5.2 3.2 0.0 0.0 0.0 65-74yrs 160 16.9 1.7 14.8 0.2 16.7 7.5 0.2 0.0 0.2 Puttalam 5yrs 60 Deci* 19.3 2.6 0.1 0.1 2.7 - - - - Perm** 1.8 0.1 0.0 0.0 0.1 - - - - 12yrs 60 26.2 0.5 0.0 0.1 0.6 - - - - 15yrs 60 28.0 0.7 0.1 0.1 1.0 0.1 0.0 0.0 0.0 35-44yrs 60 27.1 1.5 4.2 0.8 6.4 3.1 0.0 0.0 0.0 65-74yrs 60 16.1 1.6 15.6 0.2 17.3 6.9 0.0 0.0 0.0 Anuradhapura 5yrs 100 Deci* 19.5 1.9 0.0 0.1 2.0 - - - - Perm** 1.7 0.0 0.0 0.0 0.0 - - - - 12yrs 100 26.6 0.3 0.0 0.0 0.4 - - - - 15yrs 100 28.0 0.4 0.0 0.0 0.5 0.0 0.0 0.0 0.0 35-44yrs 99 29.1 1.7 2.4 0.5 4.6 3.4 0.6 0.0 0.6 65-74yrs 97 15.8 1.5 16.0 0.0 17.5 8.2 0.4 0.0 0.4 Polonnaruwa 5yrs 60 Deci* 19.7 1.5 0.1 0.2 1.8 - - - - Perm** 0.9 0.0 0.0 0.0 0.0 - - - - 12yrs 60 26.4 0.3 0.0 0.2 0.5 - - - - 15yrs 60 28.0 0.6 0.1 0.0 0.7 0.1 0.0 0.0 0.0 35-44yrs 60 28.6 1.6 2.9 0.6 5.1 19.2 0.0 0.0 0.0 65-74yrs 59 18.1 1.5 13.4 0.0 14.9 15.4 0.0 0.0 0.0 Badulla 5yrs 78 Deci* 19.1 2.9 0.0 0.4 3.3 - - - - Perm** 2.3 0.0 0.0 0.0 0.0 - - - - 12yrs 80 26.2 0.5 0.0 0.1 0.6 - - - - 15yrs 80 27.9 0.5 0.1 0.2 0.8 0.0 0.0 0.0 0.0 35-44yrs 80 27.5 3.5 4.2 0.3 8.1 1.8 0.0 0.0 0.0 65-74yrs 74 13.5 1.9 18.4 0.1 20.4 4.8 0.0 0.0 0.0 Monaragala 5yrs 60 Deci* 19.3 3.0 0.0 0.3 3.3 - - - - Perm** 1.7 0.0 0.0 0.0 0.0 - - - - 12yrs 60 26.4 0.6 0.0 0.2 0.7 - - - - 15yrs 60 27.9 1.0 0.1 0.1 1.2 0.0 0.0 0.0 0.0 35-44yrs 60 27.0 2.5 4.5 0.2 7.2 5.8 0.5 0.0 0.5 65-74yrs 60 16.9 2.2 14.8 0.0 17.1 7.2 0.0 0.0 0.0 Ratnapura 5yrs 80 Deci* 19.2 2.7 0.1 0.3 3.0 - - - - Perm** 2.2 0.0 0.0 0.0 0.0 - - - - 12yrs 80 25.4 0.3 0.0 0.0 0.3 - - - - 15yrs 80 27.9 0.5 0.1 0.0 0.6 0.0 0.0 0.0 0.0 35-44yrs 80 27.2 2.1 4.3 0.2 6.7 4.5 0.1 0.0 0.1 65-74yrs 78 15.6 1.0 16.0 0.1 17.1 7.4 0.2 0.0 0.2 Kegalle 5yrs 80 Deci* 19.6 1.9 0.1 0.3 2.3 - - - - Perm** 1.2 0.0 0.0 0.0 0.0 - - - - 12yrs 80 26.5 0.3 0.0 0.2 0.4 - - - - 15yrs 80 28.0 0.7 0.1 0.2 1.0 0.0 0.0 0.0 0.0 35-44yrs 79 27.8 1.8 3.8 0.7 6.3 3.1 0.0 0.0 0.0 65-74yrs 76 14.2 1.4 17.7 0.0 19.2 9.4 0.0 0.0 0.0
*Deci: Deciduous teeth; **Perm: Permanent teeth
75
`Table 6.7: Distribution of participants according to the status of gingival bleeding-on-probing
District Age group N
% of participants with gingival bleeding-on-probing Total
teeth x ̅
Mean no. of teeth with gingival bleeding-on-probing
0 teeth (healthy)
1-10 teeth
11-20 teeth
> 20 teeth
Healthy (no
bleeding) Bleeding Excluded
Colombo 5yrs 180 68.9 28.3 2.8 0.0 21.0 19.7 1.3 0.0 12yrs 179 44.7 35.8 12.3 7.3 27.2 22.0 5.2 0.1 15yrs 180 42.2 38.3 12.2 7.2 28.0 22.7 5.3 0.0 35-44yrs 178 51.7 33.1 9.0 6.2 27.1 22.1 4.5 0.5 65-74yrs 176 52.8 32.4 11.4 3.4 14.9 9.9 4.2 0.8 Gampaha 5yrs 180 72.2 27.2 0.6 0.0 21.4 20.3 1.0 0.1 12yrs 180 47.8 41.7 9.4 1.1 26.8 23.1 3.7 0.0 15yrs 181 49.2 39.2 9.9 1.7 27.9 24.1 3.7 0.0 35-44yrs 177 44.1 40.7 10.7 4.5 26.8 21.8 4.7 0.4 65-74yrs 179 46.4 41.9 9.5 2.2 14.1 9.4 3.8 0.9 Kalutara 5yrs 100 85.0 14.0 1.0 0.0 21.0 20.4 0.6 0.0 12yrs 100 57.0 37.0 4.0 2.0 27.2 24.5 2.7 0.0 15yrs 102 52.9 37.3 8.8 1.0 28.0 24.9 3.0 0.1 35-44yrs 100 51.0 35.0 8.0 6.0 26.4 21.5 4.2 0.7 65-74yrs 100 51.0 36.0 7.0 6.0 13.5 8.4 4.1 1.0 Kandy 5yrs 140 62.1 37.1 0.7 0.0 20.8 19.2 1.4 0.2 12yrs 140 45.7 50.0 3.6 0.7 26.6 23.3 3.2 0.0 15yrs 140 53.6 33.6 8.6 4.3 28.1 24.2 3.8 0.1 35-44yrs 136 38.2 49.3 9.6 2.9 27.4 22.8 4.3 0.3 65-74yrs 134 44.8 45.5 6.7 3.0 14.7 10.5 3.5 0.8 Matale 5yrs 40 62.5 37.5 0.0 0.0 20.9 19.8 1.0 0.0 12yrs 40 35.0 52.5 12.5 0.0 26.4 22.6 3.7 0.1 15yrs 40 42.5 52.5 5.0 0.0 28.0 25.0 3.0 0.0 35-44yrs 40 22.5 55.0 17.5 5.0 28.0 21.6 5.9 0.5 65-74yrs 39 28.2 53.8 15.4 2.6 15.3 7.9 5.4 2.1 Nuwara-Eliya 5yrs 100 76.0 22.0 2.0 0.0 20.7 19.6 1.1 0.0 12yrs 99 29.3 45.5 21.2 4.0 26.2 19.7 6.5 0.0 15yrs 100 31.0 44.0 20.0 5.0 28.0 21.4 6.6 0.0 35-44yrs 99 26.3 37.4 26.3 10.1 27.5 18.7 8.1 0.7 65-74yrs 98 39.8 33.7 20.4 6.1 13.7 7.0 6.0 0.7 Galle 5yrs 98 86.7 13.3 0.0 0.0 20.9 20.6 0.3 0.0 12yrs 99 69.7 29.3 1.0 0.0 27.1 25.7 1.4 0.0 15yrs 100 71.0 28.0 1.0 0.0 27.9 26.6 1.2 0.0 35-44yrs 99 70.7 28.3 1.0 0.0 26.2 24.8 1.3 0.2 65-74yrs 100 68.0 22.0 8.0 2.0 12.5 9.7 2.5 0.3 Matara 5yrs 79 94.9 5.1 0.0 0.0 20.9 20.8 0.1 0.0 12yrs 80 77.5 20.0 1.3 1.3 27.2 25.7 1.5 0.0 15yrs 80 57.5 35.0 5.0 2.5 27.9 25.0 2.9 0.0 35-44yrs 79 36.7 40.5 16.5 6.3 27.3 21.0 6.3 0.0 65-74yrs 79 55.7 32.9 3.8 7.6 16.9 12.4 4.5 0.0 Hambantota 5yrs 60 83.3 16.7 0.0 0.0 20.8 20.1 0.7 0.0 12yrs 60 60.0 31.7 6.7 1.7 27.1 24.2 3.0 0.0 15yrs 60 60.0 30.0 8.3 1.7 28.1 24.6 3.4 0.1 35-44yrs 59 59.3 32.2 8.5 0.0 29.0 26.3 2.6 0.2 65-74yrs 60 66.7 25.0 6.7 1.7 17.6 13.8 2.2 1.7 Jaffna 5yrs 60 78.3 21.7 0.0 0.0 20.9 20.1 0.8 0.0 12yrs 60 48.3 35.0 11.7 5.0 26.8 22.2 4.6 0.0 15yrs 60 31.7 35.0 20.0 13.3 27.7 18.9 8.8 0.0 35-44yrs 60 31.7 36.7 15.0 16.7 28.8 19.0 8.7 1.1 65-74yrs 59 44.1 22.0 15.3 18.6 20.1 11.6 8.0 0.5 Kilinochchi 5yrs 20 95.0 5.0 0.0 0.0 21.0 20.9 0.1 0.0 12yrs 20 80.0 15.0 0.0 5.0 27.1 25.1 2.0 0.0 15yrs 20 70.0 15.0 10.0 5.0 27.7 24.1 3.5 0.1 35-44yrs 20 5.0 35.0 30.0 30.0 28.7 12.8 15.6 0.4 65-74yrs 20 25.0 30.0 20.0 25.0 19.1 6.7 11.3 1.2 Mannar 5yrs 20 75.0 20.0 5.0 0.0 21.6 20.5 1.1 0.0 12yrs 21 33.3 33.3 19.0 14.3 26.3 18.1 8.2 0.0
15yrs 20 30.0 20.0 20.0 30.0 28.2 16.2 12.1 0.0
35-44yrs 20 10.0 25.0 20.0 45.0 28.7 11.7 17.1 0.0 65-74yrs 20 15.0 15.0 25.0 45.0 18.8 2.6 16.1 0.1 Mullaitivu 5yrs 20 90.0 10.0 0.0 0.0 20.0 19.9 0.1 0.0 12yrs 20 40.0 45.0 10.0 5.0 27.4 21.8 5.6 0.0 15yrs 20 55.0 35.0 5.0 5.0 28.0 24.2 3.9 0.0 35-44yrs 21 23.8 42.9 14.3 19.0 29.2 19.0 10.3 0.0 65-74yrs 20 55.0 35.0 10.0 0.0 13.3 10.3 2.8 0.2
Dis
tric
t-b
ased
re
sult
s
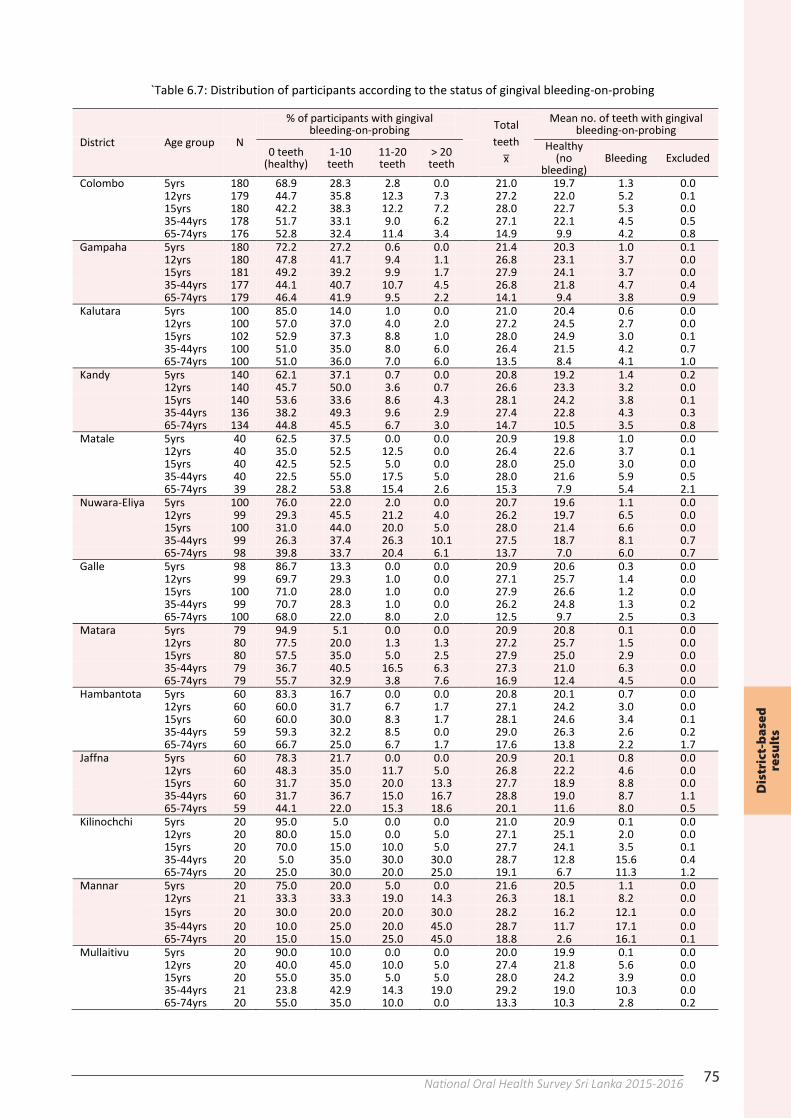
75National Oral Health Survey Sri Lanka 2015-201674
Table 6.6: Distribution of participants according to the severity of dental caries (contd.)
District Age group
N Total teeth x ̅
Mean number of teeth with DT MT FT DMFT Root
exposed R-DT R-FT R-DFT Vavuniya 5yrs 20 Deci* 19.9 2.4 0.0 0.1 2.5 - - - - Perm** 0.5 0.0 0.0 0.0 0.0 - - - - 12yrs 20 26.3 0.3 0.0 0.0 0.3 - - - - 15yrs 20 27.9 0.5 0.1 0.1 0.6 0.0 0.0 0.0 0.0 35-44yrs 20 26.5 1.2 5.4 0.0 6.6 1.9 0.0 0.0 0.0 65-74yrs 19 20.9 1.1 11.1 0.1 12.2 11.8 0.0 0.0 0.0 Batticaloa 5yrs 60 Deci* 19.2 3.7 0.3 0.1 4.0 - - - - Perm** 2.4 0.0 0.0 0.0 0.0 - - - - 12yrs 60 26.5 0.5 0.1 0.0 0.6 - - - - 15yrs 60 27.7 1.8 0.4 0.0 2.1 0.0 0.0 0.0 0.0 35-44yrs 60 24.5 1.7 6.8 0.0 8.5 5.5 0.0 0.0 0.0 65-74yrs 58 14.4 2.9 17.3 0.0 20.2 10.9 0.1 0.0 0.1 Ampara 5yrs 100 Deci* 19.0 3.9 0.1 0.1 4.1 - - - - Perm** 2.5 0.0 0.0 0.0 0.0 - - - - 12yrs 99 25.1 0.4 0.1 0.1 0.6 - - - - 15yrs 100 28.1 0.7 0.2 0.1 0.9 0.1 0.0 0.0 0.0 35-44yrs 97 28.2 1.2 3.6 0.3 5.0 11.1 0.0 0.0 0.0 65-74yrs 95 13.4 1.0 18.5 0.1 19.6 10.3 0.0 0.0 0.0 Trincomalee 5yrs 40 Deci* 19.4 4.4 0.1 0.0 4.5 - - - - Perm** 2.6 0.0 0.0 0.0 0.0 - - - - 12yrs 39 25.0 0.2 0.1 0.0 0.4 - - - - 15yrs 40 27.9 0.9 0.3 0.1 1.2 0.0 0.0 0.0 0.0 35-44yrs 40 27.1 1.4 4.9 0.3 6.6 0.3 0.1 0.0 0.1 65-74yrs 39 15.0 1.5 17.0 0.0 18.5 3.4 0.0 0.0 0.0 Kurunegala 5yrs 160 Deci* 19.6 2.4 0.0 0.3 2.7 - - - - Perm** 1.4 0.0 0.0 0.0 0.0 - - - - 12yrs 160 25.7 0.4 0.0 0.2 0.7 - - - - 15yrs 160 28.0 0.6 0.1 0.1 0.8 0.2 0.0 0.0 0.0 35-44yrs 159 28.1 1.2 3.3 0.6 5.2 3.2 0.0 0.0 0.0 65-74yrs 160 16.9 1.7 14.8 0.2 16.7 7.5 0.2 0.0 0.2 Puttalam 5yrs 60 Deci* 19.3 2.6 0.1 0.1 2.7 - - - - Perm** 1.8 0.1 0.0 0.0 0.1 - - - - 12yrs 60 26.2 0.5 0.0 0.1 0.6 - - - - 15yrs 60 28.0 0.7 0.1 0.1 1.0 0.1 0.0 0.0 0.0 35-44yrs 60 27.1 1.5 4.2 0.8 6.4 3.1 0.0 0.0 0.0 65-74yrs 60 16.1 1.6 15.6 0.2 17.3 6.9 0.0 0.0 0.0 Anuradhapura 5yrs 100 Deci* 19.5 1.9 0.0 0.1 2.0 - - - - Perm** 1.7 0.0 0.0 0.0 0.0 - - - - 12yrs 100 26.6 0.3 0.0 0.0 0.4 - - - - 15yrs 100 28.0 0.4 0.0 0.0 0.5 0.0 0.0 0.0 0.0 35-44yrs 99 29.1 1.7 2.4 0.5 4.6 3.4 0.6 0.0 0.6 65-74yrs 97 15.8 1.5 16.0 0.0 17.5 8.2 0.4 0.0 0.4 Polonnaruwa 5yrs 60 Deci* 19.7 1.5 0.1 0.2 1.8 - - - - Perm** 0.9 0.0 0.0 0.0 0.0 - - - - 12yrs 60 26.4 0.3 0.0 0.2 0.5 - - - - 15yrs 60 28.0 0.6 0.1 0.0 0.7 0.1 0.0 0.0 0.0 35-44yrs 60 28.6 1.6 2.9 0.6 5.1 19.2 0.0 0.0 0.0 65-74yrs 59 18.1 1.5 13.4 0.0 14.9 15.4 0.0 0.0 0.0 Badulla 5yrs 78 Deci* 19.1 2.9 0.0 0.4 3.3 - - - - Perm** 2.3 0.0 0.0 0.0 0.0 - - - - 12yrs 80 26.2 0.5 0.0 0.1 0.6 - - - - 15yrs 80 27.9 0.5 0.1 0.2 0.8 0.0 0.0 0.0 0.0 35-44yrs 80 27.5 3.5 4.2 0.3 8.1 1.8 0.0 0.0 0.0 65-74yrs 74 13.5 1.9 18.4 0.1 20.4 4.8 0.0 0.0 0.0 Monaragala 5yrs 60 Deci* 19.3 3.0 0.0 0.3 3.3 - - - - Perm** 1.7 0.0 0.0 0.0 0.0 - - - - 12yrs 60 26.4 0.6 0.0 0.2 0.7 - - - - 15yrs 60 27.9 1.0 0.1 0.1 1.2 0.0 0.0 0.0 0.0 35-44yrs 60 27.0 2.5 4.5 0.2 7.2 5.8 0.5 0.0 0.5 65-74yrs 60 16.9 2.2 14.8 0.0 17.1 7.2 0.0 0.0 0.0 Ratnapura 5yrs 80 Deci* 19.2 2.7 0.1 0.3 3.0 - - - - Perm** 2.2 0.0 0.0 0.0 0.0 - - - - 12yrs 80 25.4 0.3 0.0 0.0 0.3 - - - - 15yrs 80 27.9 0.5 0.1 0.0 0.6 0.0 0.0 0.0 0.0 35-44yrs 80 27.2 2.1 4.3 0.2 6.7 4.5 0.1 0.0 0.1 65-74yrs 78 15.6 1.0 16.0 0.1 17.1 7.4 0.2 0.0 0.2 Kegalle 5yrs 80 Deci* 19.6 1.9 0.1 0.3 2.3 - - - - Perm** 1.2 0.0 0.0 0.0 0.0 - - - - 12yrs 80 26.5 0.3 0.0 0.2 0.4 - - - - 15yrs 80 28.0 0.7 0.1 0.2 1.0 0.0 0.0 0.0 0.0 35-44yrs 79 27.8 1.8 3.8 0.7 6.3 3.1 0.0 0.0 0.0 65-74yrs 76 14.2 1.4 17.7 0.0 19.2 9.4 0.0 0.0 0.0
*Deci: Deciduous teeth; **Perm: Permanent teeth
75
`Table 6.7: Distribution of participants according to the status of gingival bleeding-on-probing
District Age group N
% of participants with gingival bleeding-on-probing Total
teeth x ̅
Mean no. of teeth with gingival bleeding-on-probing
0 teeth (healthy)
1-10 teeth
11-20 teeth
> 20 teeth
Healthy (no
bleeding) Bleeding Excluded
Colombo 5yrs 180 68.9 28.3 2.8 0.0 21.0 19.7 1.3 0.0 12yrs 179 44.7 35.8 12.3 7.3 27.2 22.0 5.2 0.1 15yrs 180 42.2 38.3 12.2 7.2 28.0 22.7 5.3 0.0 35-44yrs 178 51.7 33.1 9.0 6.2 27.1 22.1 4.5 0.5 65-74yrs 176 52.8 32.4 11.4 3.4 14.9 9.9 4.2 0.8 Gampaha 5yrs 180 72.2 27.2 0.6 0.0 21.4 20.3 1.0 0.1 12yrs 180 47.8 41.7 9.4 1.1 26.8 23.1 3.7 0.0 15yrs 181 49.2 39.2 9.9 1.7 27.9 24.1 3.7 0.0 35-44yrs 177 44.1 40.7 10.7 4.5 26.8 21.8 4.7 0.4 65-74yrs 179 46.4 41.9 9.5 2.2 14.1 9.4 3.8 0.9 Kalutara 5yrs 100 85.0 14.0 1.0 0.0 21.0 20.4 0.6 0.0 12yrs 100 57.0 37.0 4.0 2.0 27.2 24.5 2.7 0.0 15yrs 102 52.9 37.3 8.8 1.0 28.0 24.9 3.0 0.1 35-44yrs 100 51.0 35.0 8.0 6.0 26.4 21.5 4.2 0.7 65-74yrs 100 51.0 36.0 7.0 6.0 13.5 8.4 4.1 1.0 Kandy 5yrs 140 62.1 37.1 0.7 0.0 20.8 19.2 1.4 0.2 12yrs 140 45.7 50.0 3.6 0.7 26.6 23.3 3.2 0.0 15yrs 140 53.6 33.6 8.6 4.3 28.1 24.2 3.8 0.1 35-44yrs 136 38.2 49.3 9.6 2.9 27.4 22.8 4.3 0.3 65-74yrs 134 44.8 45.5 6.7 3.0 14.7 10.5 3.5 0.8 Matale 5yrs 40 62.5 37.5 0.0 0.0 20.9 19.8 1.0 0.0 12yrs 40 35.0 52.5 12.5 0.0 26.4 22.6 3.7 0.1 15yrs 40 42.5 52.5 5.0 0.0 28.0 25.0 3.0 0.0 35-44yrs 40 22.5 55.0 17.5 5.0 28.0 21.6 5.9 0.5 65-74yrs 39 28.2 53.8 15.4 2.6 15.3 7.9 5.4 2.1 Nuwara-Eliya 5yrs 100 76.0 22.0 2.0 0.0 20.7 19.6 1.1 0.0 12yrs 99 29.3 45.5 21.2 4.0 26.2 19.7 6.5 0.0 15yrs 100 31.0 44.0 20.0 5.0 28.0 21.4 6.6 0.0 35-44yrs 99 26.3 37.4 26.3 10.1 27.5 18.7 8.1 0.7 65-74yrs 98 39.8 33.7 20.4 6.1 13.7 7.0 6.0 0.7 Galle 5yrs 98 86.7 13.3 0.0 0.0 20.9 20.6 0.3 0.0 12yrs 99 69.7 29.3 1.0 0.0 27.1 25.7 1.4 0.0 15yrs 100 71.0 28.0 1.0 0.0 27.9 26.6 1.2 0.0 35-44yrs 99 70.7 28.3 1.0 0.0 26.2 24.8 1.3 0.2 65-74yrs 100 68.0 22.0 8.0 2.0 12.5 9.7 2.5 0.3 Matara 5yrs 79 94.9 5.1 0.0 0.0 20.9 20.8 0.1 0.0 12yrs 80 77.5 20.0 1.3 1.3 27.2 25.7 1.5 0.0 15yrs 80 57.5 35.0 5.0 2.5 27.9 25.0 2.9 0.0 35-44yrs 79 36.7 40.5 16.5 6.3 27.3 21.0 6.3 0.0 65-74yrs 79 55.7 32.9 3.8 7.6 16.9 12.4 4.5 0.0 Hambantota 5yrs 60 83.3 16.7 0.0 0.0 20.8 20.1 0.7 0.0 12yrs 60 60.0 31.7 6.7 1.7 27.1 24.2 3.0 0.0 15yrs 60 60.0 30.0 8.3 1.7 28.1 24.6 3.4 0.1 35-44yrs 59 59.3 32.2 8.5 0.0 29.0 26.3 2.6 0.2 65-74yrs 60 66.7 25.0 6.7 1.7 17.6 13.8 2.2 1.7 Jaffna 5yrs 60 78.3 21.7 0.0 0.0 20.9 20.1 0.8 0.0 12yrs 60 48.3 35.0 11.7 5.0 26.8 22.2 4.6 0.0 15yrs 60 31.7 35.0 20.0 13.3 27.7 18.9 8.8 0.0 35-44yrs 60 31.7 36.7 15.0 16.7 28.8 19.0 8.7 1.1 65-74yrs 59 44.1 22.0 15.3 18.6 20.1 11.6 8.0 0.5 Kilinochchi 5yrs 20 95.0 5.0 0.0 0.0 21.0 20.9 0.1 0.0 12yrs 20 80.0 15.0 0.0 5.0 27.1 25.1 2.0 0.0 15yrs 20 70.0 15.0 10.0 5.0 27.7 24.1 3.5 0.1 35-44yrs 20 5.0 35.0 30.0 30.0 28.7 12.8 15.6 0.4 65-74yrs 20 25.0 30.0 20.0 25.0 19.1 6.7 11.3 1.2 Mannar 5yrs 20 75.0 20.0 5.0 0.0 21.6 20.5 1.1 0.0 12yrs 21 33.3 33.3 19.0 14.3 26.3 18.1 8.2 0.0
15yrs 20 30.0 20.0 20.0 30.0 28.2 16.2 12.1 0.0
35-44yrs 20 10.0 25.0 20.0 45.0 28.7 11.7 17.1 0.0 65-74yrs 20 15.0 15.0 25.0 45.0 18.8 2.6 16.1 0.1 Mullaitivu 5yrs 20 90.0 10.0 0.0 0.0 20.0 19.9 0.1 0.0 12yrs 20 40.0 45.0 10.0 5.0 27.4 21.8 5.6 0.0 15yrs 20 55.0 35.0 5.0 5.0 28.0 24.2 3.9 0.0 35-44yrs 21 23.8 42.9 14.3 19.0 29.2 19.0 10.3 0.0 65-74yrs 20 55.0 35.0 10.0 0.0 13.3 10.3 2.8 0.2
Dis
tric
t-b
ased
re
sult
s
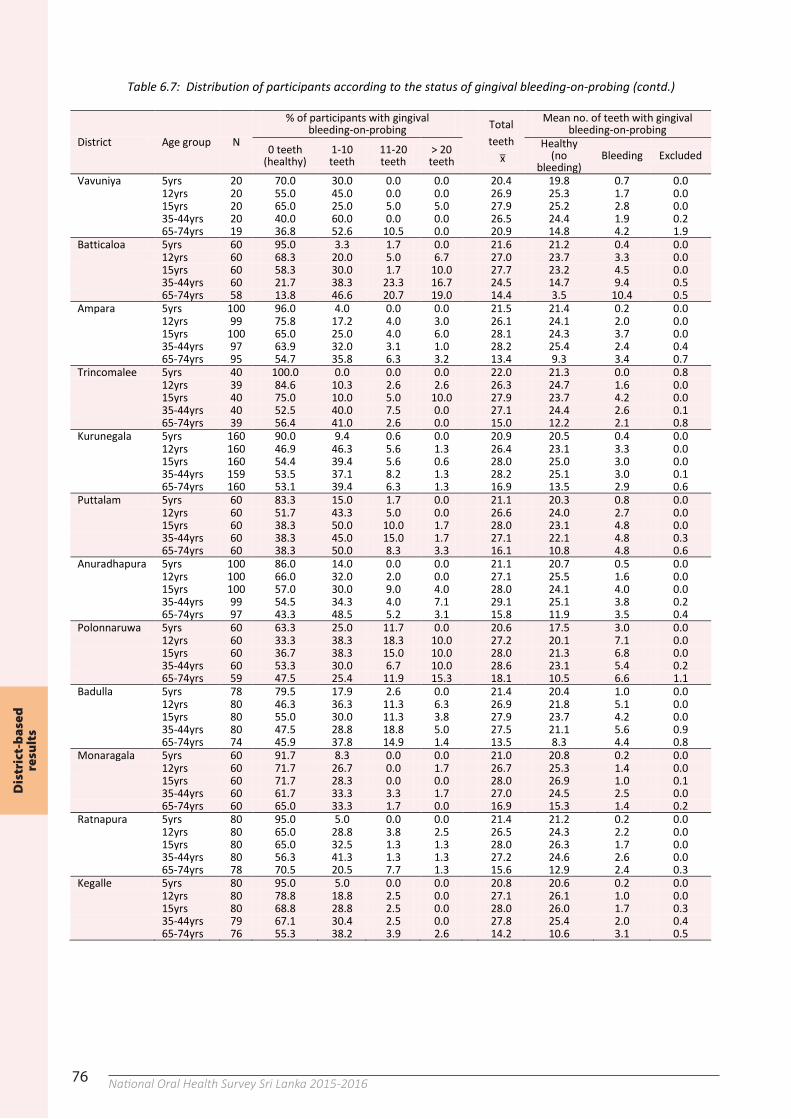
76 National Oral Health Survey Sri Lanka 2015-201676
Table 6.7: Distribution of participants according to the status of gingival bleeding-on-probing (contd.)
District Age group N
% of participants with gingival bleeding-on-probing Total
teeth x ̅
Mean no. of teeth with gingival bleeding-on-probing
0 teeth (healthy)
1-10 teeth
11-20 teeth
> 20 teeth
Healthy (no
bleeding) Bleeding Excluded
Vavuniya 5yrs 20 70.0 30.0 0.0 0.0 20.4 19.8 0.7 0.0 12yrs 20 55.0 45.0 0.0 0.0 26.9 25.3 1.7 0.0 15yrs 20 65.0 25.0 5.0 5.0 27.9 25.2 2.8 0.0 35-44yrs 20 40.0 60.0 0.0 0.0 26.5 24.4 1.9 0.2 65-74yrs 19 36.8 52.6 10.5 0.0 20.9 14.8 4.2 1.9 Batticaloa 5yrs 60 95.0 3.3 1.7 0.0 21.6 21.2 0.4 0.0 12yrs 60 68.3 20.0 5.0 6.7 27.0 23.7 3.3 0.0 15yrs 60 58.3 30.0 1.7 10.0 27.7 23.2 4.5 0.0 35-44yrs 60 21.7 38.3 23.3 16.7 24.5 14.7 9.4 0.5 65-74yrs 58 13.8 46.6 20.7 19.0 14.4 3.5 10.4 0.5 Ampara 5yrs 100 96.0 4.0 0.0 0.0 21.5 21.4 0.2 0.0 12yrs 99 75.8 17.2 4.0 3.0 26.1 24.1 2.0 0.0 15yrs 100 65.0 25.0 4.0 6.0 28.1 24.3 3.7 0.0 35-44yrs 97 63.9 32.0 3.1 1.0 28.2 25.4 2.4 0.4 65-74yrs 95 54.7 35.8 6.3 3.2 13.4 9.3 3.4 0.7 Trincomalee 5yrs 40 100.0 0.0 0.0 0.0 22.0 21.3 0.0 0.8 12yrs 39 84.6 10.3 2.6 2.6 26.3 24.7 1.6 0.0 15yrs 40 75.0 10.0 5.0 10.0 27.9 23.7 4.2 0.0 35-44yrs 40 52.5 40.0 7.5 0.0 27.1 24.4 2.6 0.1 65-74yrs 39 56.4 41.0 2.6 0.0 15.0 12.2 2.1 0.8 Kurunegala 5yrs 160 90.0 9.4 0.6 0.0 20.9 20.5 0.4 0.0 12yrs 160 46.9 46.3 5.6 1.3 26.4 23.1 3.3 0.0 15yrs 160 54.4 39.4 5.6 0.6 28.0 25.0 3.0 0.0 35-44yrs 159 53.5 37.1 8.2 1.3 28.2 25.1 3.0 0.1 65-74yrs 160 53.1 39.4 6.3 1.3 16.9 13.5 2.9 0.6 Puttalam 5yrs 60 83.3 15.0 1.7 0.0 21.1 20.3 0.8 0.0 12yrs 60 51.7 43.3 5.0 0.0 26.6 24.0 2.7 0.0 15yrs 60 38.3 50.0 10.0 1.7 28.0 23.1 4.8 0.0 35-44yrs 60 38.3 45.0 15.0 1.7 27.1 22.1 4.8 0.3 65-74yrs 60 38.3 50.0 8.3 3.3 16.1 10.8 4.8 0.6 Anuradhapura 5yrs 100 86.0 14.0 0.0 0.0 21.1 20.7 0.5 0.0 12yrs 100 66.0 32.0 2.0 0.0 27.1 25.5 1.6 0.0 15yrs 100 57.0 30.0 9.0 4.0 28.0 24.1 4.0 0.0 35-44yrs 99 54.5 34.3 4.0 7.1 29.1 25.1 3.8 0.2 65-74yrs 97 43.3 48.5 5.2 3.1 15.8 11.9 3.5 0.4 Polonnaruwa 5yrs 60 63.3 25.0 11.7 0.0 20.6 17.5 3.0 0.0 12yrs 60 33.3 38.3 18.3 10.0 27.2 20.1 7.1 0.0 15yrs 60 36.7 38.3 15.0 10.0 28.0 21.3 6.8 0.0 35-44yrs 60 53.3 30.0 6.7 10.0 28.6 23.1 5.4 0.2 65-74yrs 59 47.5 25.4 11.9 15.3 18.1 10.5 6.6 1.1 Badulla 5yrs 78 79.5 17.9 2.6 0.0 21.4 20.4 1.0 0.0 12yrs 80 46.3 36.3 11.3 6.3 26.9 21.8 5.1 0.0 15yrs 80 55.0 30.0 11.3 3.8 27.9 23.7 4.2 0.0 35-44yrs 80 47.5 28.8 18.8 5.0 27.5 21.1 5.6 0.9 65-74yrs 74 45.9 37.8 14.9 1.4 13.5 8.3 4.4 0.8 Monaragala 5yrs 60 91.7 8.3 0.0 0.0 21.0 20.8 0.2 0.0 12yrs 60 71.7 26.7 0.0 1.7 26.7 25.3 1.4 0.0 15yrs 60 71.7 28.3 0.0 0.0 28.0 26.9 1.0 0.1 35-44yrs 60 61.7 33.3 3.3 1.7 27.0 24.5 2.5 0.0 65-74yrs 60 65.0 33.3 1.7 0.0 16.9 15.3 1.4 0.2 Ratnapura 5yrs 80 95.0 5.0 0.0 0.0 21.4 21.2 0.2 0.0 12yrs 80 65.0 28.8 3.8 2.5 26.5 24.3 2.2 0.0 15yrs 80 65.0 32.5 1.3 1.3 28.0 26.3 1.7 0.0 35-44yrs 80 56.3 41.3 1.3 1.3 27.2 24.6 2.6 0.0 65-74yrs 78 70.5 20.5 7.7 1.3 15.6 12.9 2.4 0.3 Kegalle 5yrs 80 95.0 5.0 0.0 0.0 20.8 20.6 0.2 0.0 12yrs 80 78.8 18.8 2.5 0.0 27.1 26.1 1.0 0.0 15yrs 80 68.8 28.8 2.5 0.0 28.0 26.0 1.7 0.3 35-44yrs 79 67.1 30.4 2.5 0.0 27.8 25.4 2.0 0.4 65-74yrs 76 55.3 38.2 3.9 2.6 14.2 10.6 3.1 0.5
76
Table 6.7: Distribution of participants according to the status of gingival bleeding-on-probing (contd.)
District Age group N
% of participants with gingival bleeding-on-probing Total
teeth x ̅
Mean no. of teeth with gingival bleeding-on-probing
0 teeth (healthy)
1-10 teeth
11-20 teeth
> 20 teeth
Healthy (no
bleeding) Bleeding Excluded
Vavuniya 5yrs 20 70.0 30.0 0.0 0.0 20.4 19.8 0.7 0.0 12yrs 20 55.0 45.0 0.0 0.0 26.9 25.3 1.7 0.0 15yrs 20 65.0 25.0 5.0 5.0 27.9 25.2 2.8 0.0 35-44yrs 20 40.0 60.0 0.0 0.0 26.5 24.4 1.9 0.2 65-74yrs 19 36.8 52.6 10.5 0.0 20.9 14.8 4.2 1.9 Batticaloa 5yrs 60 95.0 3.3 1.7 0.0 21.6 21.2 0.4 0.0 12yrs 60 68.3 20.0 5.0 6.7 27.0 23.7 3.3 0.0 15yrs 60 58.3 30.0 1.7 10.0 27.7 23.2 4.5 0.0 35-44yrs 60 21.7 38.3 23.3 16.7 24.5 14.7 9.4 0.5 65-74yrs 58 13.8 46.6 20.7 19.0 14.4 3.5 10.4 0.5 Ampara 5yrs 100 96.0 4.0 0.0 0.0 21.5 21.4 0.2 0.0 12yrs 99 75.8 17.2 4.0 3.0 26.1 24.1 2.0 0.0 15yrs 100 65.0 25.0 4.0 6.0 28.1 24.3 3.7 0.0 35-44yrs 97 63.9 32.0 3.1 1.0 28.2 25.4 2.4 0.4 65-74yrs 95 54.7 35.8 6.3 3.2 13.4 9.3 3.4 0.7 Trincomalee 5yrs 40 100.0 0.0 0.0 0.0 22.0 21.3 0.0 0.8 12yrs 39 84.6 10.3 2.6 2.6 26.3 24.7 1.6 0.0 15yrs 40 75.0 10.0 5.0 10.0 27.9 23.7 4.2 0.0 35-44yrs 40 52.5 40.0 7.5 0.0 27.1 24.4 2.6 0.1 65-74yrs 39 56.4 41.0 2.6 0.0 15.0 12.2 2.1 0.8 Kurunegala 5yrs 160 90.0 9.4 0.6 0.0 20.9 20.5 0.4 0.0 12yrs 160 46.9 46.3 5.6 1.3 26.4 23.1 3.3 0.0 15yrs 160 54.4 39.4 5.6 0.6 28.0 25.0 3.0 0.0 35-44yrs 159 53.5 37.1 8.2 1.3 28.2 25.1 3.0 0.1 65-74yrs 160 53.1 39.4 6.3 1.3 16.9 13.5 2.9 0.6 Puttalam 5yrs 60 83.3 15.0 1.7 0.0 21.1 20.3 0.8 0.0 12yrs 60 51.7 43.3 5.0 0.0 26.6 24.0 2.7 0.0 15yrs 60 38.3 50.0 10.0 1.7 28.0 23.1 4.8 0.0 35-44yrs 60 38.3 45.0 15.0 1.7 27.1 22.1 4.8 0.3 65-74yrs 60 38.3 50.0 8.3 3.3 16.1 10.8 4.8 0.6 Anuradhapura 5yrs 100 86.0 14.0 0.0 0.0 21.1 20.7 0.5 0.0 12yrs 100 66.0 32.0 2.0 0.0 27.1 25.5 1.6 0.0 15yrs 100 57.0 30.0 9.0 4.0 28.0 24.1 4.0 0.0 35-44yrs 99 54.5 34.3 4.0 7.1 29.1 25.1 3.8 0.2 65-74yrs 97 43.3 48.5 5.2 3.1 15.8 11.9 3.5 0.4 Polonnaruwa 5yrs 60 63.3 25.0 11.7 0.0 20.6 17.5 3.0 0.0 12yrs 60 33.3 38.3 18.3 10.0 27.2 20.1 7.1 0.0 15yrs 60 36.7 38.3 15.0 10.0 28.0 21.3 6.8 0.0 35-44yrs 60 53.3 30.0 6.7 10.0 28.6 23.1 5.4 0.2 65-74yrs 59 47.5 25.4 11.9 15.3 18.1 10.5 6.6 1.1 Badulla 5yrs 78 79.5 17.9 2.6 0.0 21.4 20.4 1.0 0.0 12yrs 80 46.3 36.3 11.3 6.3 26.9 21.8 5.1 0.0 15yrs 80 55.0 30.0 11.3 3.8 27.9 23.7 4.2 0.0 35-44yrs 80 47.5 28.8 18.8 5.0 27.5 21.1 5.6 0.9 65-74yrs 74 45.9 37.8 14.9 1.4 13.5 8.3 4.4 0.8 Monaragala 5yrs 60 91.7 8.3 0.0 0.0 21.0 20.8 0.2 0.0 12yrs 60 71.7 26.7 0.0 1.7 26.7 25.3 1.4 0.0 15yrs 60 71.7 28.3 0.0 0.0 28.0 26.9 1.0 0.1 35-44yrs 60 61.7 33.3 3.3 1.7 27.0 24.5 2.5 0.0 65-74yrs 60 65.0 33.3 1.7 0.0 16.9 15.3 1.4 0.2 Ratnapura 5yrs 80 95.0 5.0 0.0 0.0 21.4 21.2 0.2 0.0 12yrs 80 65.0 28.8 3.8 2.5 26.5 24.3 2.2 0.0 15yrs 80 65.0 32.5 1.3 1.3 28.0 26.3 1.7 0.0 35-44yrs 80 56.3 41.3 1.3 1.3 27.2 24.6 2.6 0.0 65-74yrs 78 70.5 20.5 7.7 1.3 15.6 12.9 2.4 0.3 Kegalle 5yrs 80 95.0 5.0 0.0 0.0 20.8 20.6 0.2 0.0 12yrs 80 78.8 18.8 2.5 0.0 27.1 26.1 1.0 0.0 15yrs 80 68.8 28.8 2.5 0.0 28.0 26.0 1.7 0.3 35-44yrs 79 67.1 30.4 2.5 0.0 27.8 25.4 2.0 0.4 65-74yrs 76 55.3 38.2 3.9 2.6 14.2 10.6 3.1 0.5
Dis
tric
t-b
ased
re
sult
s
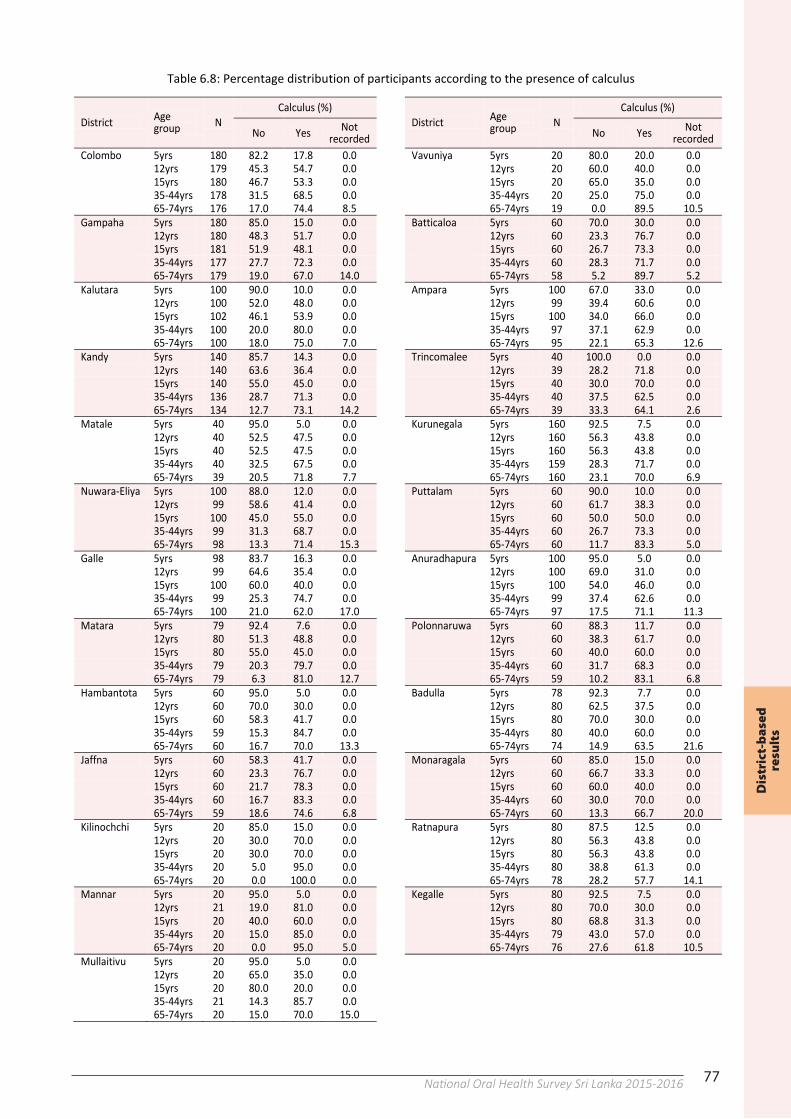
77National Oral Health Survey Sri Lanka 2015-201676
Table 6.7: Distribution of participants according to the status of gingival bleeding-on-probing (contd.)
District Age group N
% of participants with gingival bleeding-on-probing Total
teeth x ̅
Mean no. of teeth with gingival bleeding-on-probing
0 teeth (healthy)
1-10 teeth
11-20 teeth
> 20 teeth
Healthy (no
bleeding) Bleeding Excluded
Vavuniya 5yrs 20 70.0 30.0 0.0 0.0 20.4 19.8 0.7 0.0 12yrs 20 55.0 45.0 0.0 0.0 26.9 25.3 1.7 0.0 15yrs 20 65.0 25.0 5.0 5.0 27.9 25.2 2.8 0.0 35-44yrs 20 40.0 60.0 0.0 0.0 26.5 24.4 1.9 0.2 65-74yrs 19 36.8 52.6 10.5 0.0 20.9 14.8 4.2 1.9 Batticaloa 5yrs 60 95.0 3.3 1.7 0.0 21.6 21.2 0.4 0.0 12yrs 60 68.3 20.0 5.0 6.7 27.0 23.7 3.3 0.0 15yrs 60 58.3 30.0 1.7 10.0 27.7 23.2 4.5 0.0 35-44yrs 60 21.7 38.3 23.3 16.7 24.5 14.7 9.4 0.5 65-74yrs 58 13.8 46.6 20.7 19.0 14.4 3.5 10.4 0.5 Ampara 5yrs 100 96.0 4.0 0.0 0.0 21.5 21.4 0.2 0.0 12yrs 99 75.8 17.2 4.0 3.0 26.1 24.1 2.0 0.0 15yrs 100 65.0 25.0 4.0 6.0 28.1 24.3 3.7 0.0 35-44yrs 97 63.9 32.0 3.1 1.0 28.2 25.4 2.4 0.4 65-74yrs 95 54.7 35.8 6.3 3.2 13.4 9.3 3.4 0.7 Trincomalee 5yrs 40 100.0 0.0 0.0 0.0 22.0 21.3 0.0 0.8 12yrs 39 84.6 10.3 2.6 2.6 26.3 24.7 1.6 0.0 15yrs 40 75.0 10.0 5.0 10.0 27.9 23.7 4.2 0.0 35-44yrs 40 52.5 40.0 7.5 0.0 27.1 24.4 2.6 0.1 65-74yrs 39 56.4 41.0 2.6 0.0 15.0 12.2 2.1 0.8 Kurunegala 5yrs 160 90.0 9.4 0.6 0.0 20.9 20.5 0.4 0.0 12yrs 160 46.9 46.3 5.6 1.3 26.4 23.1 3.3 0.0 15yrs 160 54.4 39.4 5.6 0.6 28.0 25.0 3.0 0.0 35-44yrs 159 53.5 37.1 8.2 1.3 28.2 25.1 3.0 0.1 65-74yrs 160 53.1 39.4 6.3 1.3 16.9 13.5 2.9 0.6 Puttalam 5yrs 60 83.3 15.0 1.7 0.0 21.1 20.3 0.8 0.0 12yrs 60 51.7 43.3 5.0 0.0 26.6 24.0 2.7 0.0 15yrs 60 38.3 50.0 10.0 1.7 28.0 23.1 4.8 0.0 35-44yrs 60 38.3 45.0 15.0 1.7 27.1 22.1 4.8 0.3 65-74yrs 60 38.3 50.0 8.3 3.3 16.1 10.8 4.8 0.6 Anuradhapura 5yrs 100 86.0 14.0 0.0 0.0 21.1 20.7 0.5 0.0 12yrs 100 66.0 32.0 2.0 0.0 27.1 25.5 1.6 0.0 15yrs 100 57.0 30.0 9.0 4.0 28.0 24.1 4.0 0.0 35-44yrs 99 54.5 34.3 4.0 7.1 29.1 25.1 3.8 0.2 65-74yrs 97 43.3 48.5 5.2 3.1 15.8 11.9 3.5 0.4 Polonnaruwa 5yrs 60 63.3 25.0 11.7 0.0 20.6 17.5 3.0 0.0 12yrs 60 33.3 38.3 18.3 10.0 27.2 20.1 7.1 0.0 15yrs 60 36.7 38.3 15.0 10.0 28.0 21.3 6.8 0.0 35-44yrs 60 53.3 30.0 6.7 10.0 28.6 23.1 5.4 0.2 65-74yrs 59 47.5 25.4 11.9 15.3 18.1 10.5 6.6 1.1 Badulla 5yrs 78 79.5 17.9 2.6 0.0 21.4 20.4 1.0 0.0 12yrs 80 46.3 36.3 11.3 6.3 26.9 21.8 5.1 0.0 15yrs 80 55.0 30.0 11.3 3.8 27.9 23.7 4.2 0.0 35-44yrs 80 47.5 28.8 18.8 5.0 27.5 21.1 5.6 0.9 65-74yrs 74 45.9 37.8 14.9 1.4 13.5 8.3 4.4 0.8 Monaragala 5yrs 60 91.7 8.3 0.0 0.0 21.0 20.8 0.2 0.0 12yrs 60 71.7 26.7 0.0 1.7 26.7 25.3 1.4 0.0 15yrs 60 71.7 28.3 0.0 0.0 28.0 26.9 1.0 0.1 35-44yrs 60 61.7 33.3 3.3 1.7 27.0 24.5 2.5 0.0 65-74yrs 60 65.0 33.3 1.7 0.0 16.9 15.3 1.4 0.2 Ratnapura 5yrs 80 95.0 5.0 0.0 0.0 21.4 21.2 0.2 0.0 12yrs 80 65.0 28.8 3.8 2.5 26.5 24.3 2.2 0.0 15yrs 80 65.0 32.5 1.3 1.3 28.0 26.3 1.7 0.0 35-44yrs 80 56.3 41.3 1.3 1.3 27.2 24.6 2.6 0.0 65-74yrs 78 70.5 20.5 7.7 1.3 15.6 12.9 2.4 0.3 Kegalle 5yrs 80 95.0 5.0 0.0 0.0 20.8 20.6 0.2 0.0 12yrs 80 78.8 18.8 2.5 0.0 27.1 26.1 1.0 0.0 15yrs 80 68.8 28.8 2.5 0.0 28.0 26.0 1.7 0.3 35-44yrs 79 67.1 30.4 2.5 0.0 27.8 25.4 2.0 0.4 65-74yrs 76 55.3 38.2 3.9 2.6 14.2 10.6 3.1 0.5
77
Table 6.8: Percentage distribution of participants according to the presence of calculus
District Age group N
Calculus (%) District Age
group N Calculus (%)
No Yes Not recorded No Yes Not
recorded Colombo 5yrs 180 82.2 17.8 0.0 Vavuniya 5yrs 20 80.0 20.0 0.0
12yrs 179 45.3 54.7 0.0 12yrs 20 60.0 40.0 0.0
15yrs 180 46.7 53.3 0.0 15yrs 20 65.0 35.0 0.0
35-44yrs 178 31.5 68.5 0.0 35-44yrs 20 25.0 75.0 0.0
65-74yrs 176 17.0 74.4 8.5 65-74yrs 19 0.0 89.5 10.5 Gampaha 5yrs 180 85.0 15.0 0.0 Batticaloa 5yrs 60 70.0 30.0 0.0
12yrs 180 48.3 51.7 0.0 12yrs 60 23.3 76.7 0.0
15yrs 181 51.9 48.1 0.0 15yrs 60 26.7 73.3 0.0
35-44yrs 177 27.7 72.3 0.0 35-44yrs 60 28.3 71.7 0.0
65-74yrs 179 19.0 67.0 14.0 65-74yrs 58 5.2 89.7 5.2 Kalutara 5yrs 100 90.0 10.0 0.0 Ampara 5yrs 100 67.0 33.0 0.0
12yrs 100 52.0 48.0 0.0 12yrs 99 39.4 60.6 0.0
15yrs 102 46.1 53.9 0.0 15yrs 100 34.0 66.0 0.0
35-44yrs 100 20.0 80.0 0.0 35-44yrs 97 37.1 62.9 0.0
65-74yrs 100 18.0 75.0 7.0 65-74yrs 95 22.1 65.3 12.6 Kandy 5yrs 140 85.7 14.3 0.0 Trincomalee 5yrs 40 100.0 0.0 0.0
12yrs 140 63.6 36.4 0.0 12yrs 39 28.2 71.8 0.0
15yrs 140 55.0 45.0 0.0 15yrs 40 30.0 70.0 0.0
35-44yrs 136 28.7 71.3 0.0 35-44yrs 40 37.5 62.5 0.0
65-74yrs 134 12.7 73.1 14.2 65-74yrs 39 33.3 64.1 2.6 Matale 5yrs 40 95.0 5.0 0.0 Kurunegala 5yrs 160 92.5 7.5 0.0
12yrs 40 52.5 47.5 0.0 12yrs 160 56.3 43.8 0.0
15yrs 40 52.5 47.5 0.0 15yrs 160 56.3 43.8 0.0
35-44yrs 40 32.5 67.5 0.0 35-44yrs 159 28.3 71.7 0.0
65-74yrs 39 20.5 71.8 7.7 65-74yrs 160 23.1 70.0 6.9 Nuwara-Eliya 5yrs 100 88.0 12.0 0.0 Puttalam 5yrs 60 90.0 10.0 0.0
12yrs 99 58.6 41.4 0.0 12yrs 60 61.7 38.3 0.0
15yrs 100 45.0 55.0 0.0 15yrs 60 50.0 50.0 0.0
35-44yrs 99 31.3 68.7 0.0 35-44yrs 60 26.7 73.3 0.0
65-74yrs 98 13.3 71.4 15.3 65-74yrs 60 11.7 83.3 5.0 Galle 5yrs 98 83.7 16.3 0.0 Anuradhapura 5yrs 100 95.0 5.0 0.0
12yrs 99 64.6 35.4 0.0 12yrs 100 69.0 31.0 0.0
15yrs 100 60.0 40.0 0.0 15yrs 100 54.0 46.0 0.0
35-44yrs 99 25.3 74.7 0.0 35-44yrs 99 37.4 62.6 0.0
65-74yrs 100 21.0 62.0 17.0 65-74yrs 97 17.5 71.1 11.3 Matara 5yrs 79 92.4 7.6 0.0 Polonnaruwa 5yrs 60 88.3 11.7 0.0
12yrs 80 51.3 48.8 0.0 12yrs 60 38.3 61.7 0.0
15yrs 80 55.0 45.0 0.0 15yrs 60 40.0 60.0 0.0
35-44yrs 79 20.3 79.7 0.0 35-44yrs 60 31.7 68.3 0.0
65-74yrs 79 6.3 81.0 12.7 65-74yrs 59 10.2 83.1 6.8 Hambantota 5yrs 60 95.0 5.0 0.0 Badulla 5yrs 78 92.3 7.7 0.0
12yrs 60 70.0 30.0 0.0 12yrs 80 62.5 37.5 0.0
15yrs 60 58.3 41.7 0.0 15yrs 80 70.0 30.0 0.0
35-44yrs 59 15.3 84.7 0.0 35-44yrs 80 40.0 60.0 0.0
65-74yrs 60 16.7 70.0 13.3 65-74yrs 74 14.9 63.5 21.6 Jaffna 5yrs 60 58.3 41.7 0.0 Monaragala 5yrs 60 85.0 15.0 0.0
12yrs 60 23.3 76.7 0.0 12yrs 60 66.7 33.3 0.0
15yrs 60 21.7 78.3 0.0 15yrs 60 60.0 40.0 0.0
35-44yrs 60 16.7 83.3 0.0 35-44yrs 60 30.0 70.0 0.0
65-74yrs 59 18.6 74.6 6.8 65-74yrs 60 13.3 66.7 20.0 Kilinochchi 5yrs 20 85.0 15.0 0.0 Ratnapura 5yrs 80 87.5 12.5 0.0
12yrs 20 30.0 70.0 0.0 12yrs 80 56.3 43.8 0.0
15yrs 20 30.0 70.0 0.0 15yrs 80 56.3 43.8 0.0
35-44yrs 20 5.0 95.0 0.0 35-44yrs 80 38.8 61.3 0.0
65-74yrs 20 0.0 100.0 0.0 65-74yrs 78 28.2 57.7 14.1 Mannar 5yrs 20 95.0 5.0 0.0 Kegalle 5yrs 80 92.5 7.5 0.0
12yrs 21 19.0 81.0 0.0 12yrs 80 70.0 30.0 0.0
15yrs 20 40.0 60.0 0.0 15yrs 80 68.8 31.3 0.0
35-44yrs 20 15.0 85.0 0.0 35-44yrs 79 43.0 57.0 0.0
65-74yrs 20 0.0 95.0 5.0 65-74yrs 76 27.6 61.8 10.5 Mullaitivu 5yrs 20 95.0 5.0 0.0 12yrs 20 65.0 35.0 0.0 15yrs 20 80.0 20.0 0.0 35-44yrs 21 14.3 85.7 0.0 65-74yrs 20 15.0 70.0 15.0
Dis
tric
t-b
ased
re
sult
s
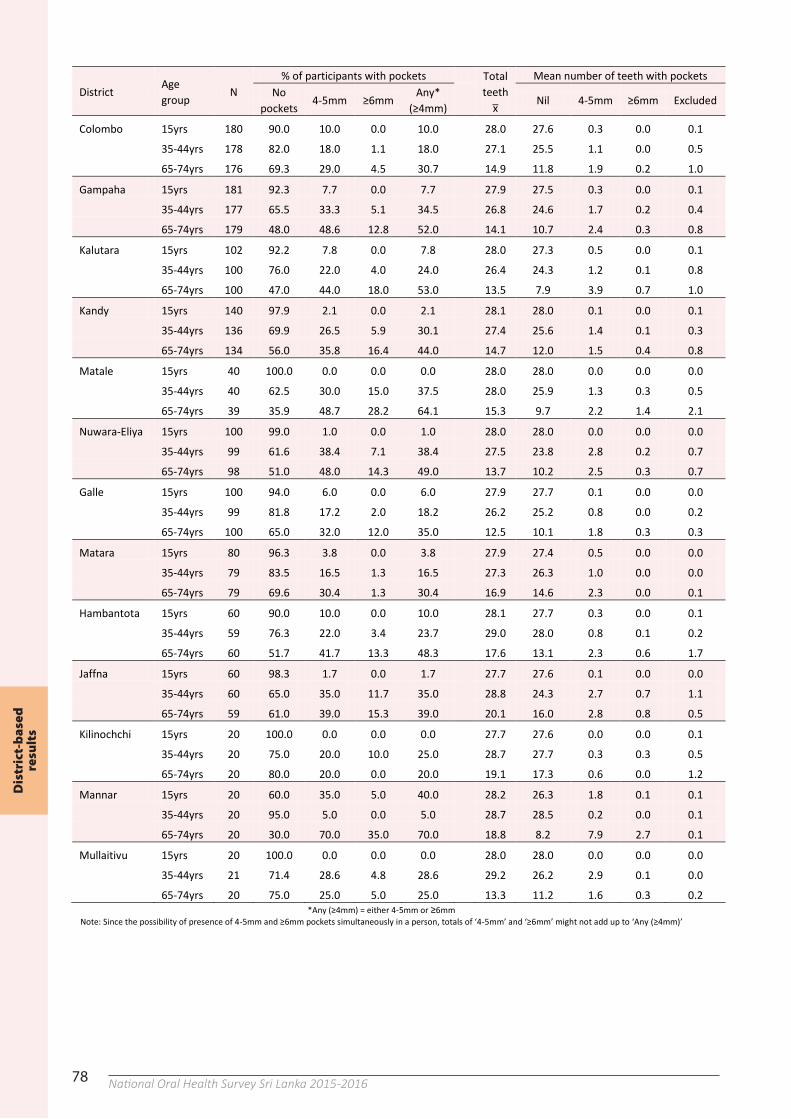
78 National Oral Health Survey Sri Lanka 2015-2016 79
Table 6.9: Distribution of participants according to the status of periodontal pockets (contd.)
District Age group
N % of participants with pockets
Total teeth
x ̅
Mean number of teeth with pockets No
pockets 4-5mm ≥6mm
Any* (≥4mm)
Nil 4-5mm ≥6mm Excluded
Vavuniya 15yrs 20 100.0 0.0 0.0 0.0
27.9 27.9 0.0 0.0 0.0
35-44yrs 20 60.0 40.0 5.0 40.0
26.5 25.1 1.0 0.3 0.2
65-74yrs 19 36.8 63.2 21.1 63.2
20.9 15.8 2.7 0.5 1.9
Batticaloa 15yrs 60 100.0 0.0 0.0 0.0
27.7 27.7 0.0 0.0 0.0
35-44yrs 60 80.0 18.3 3.3 20.0
24.5 22.9 1.0 0.1 0.5
65-74yrs 58 36.2 56.9 44.8 63.8
14.4 7.3 4.0 2.7 0.6
Ampara 15yrs 100 95.0 5.0 0.0 5.0
28.1 27.9 0.2 0.0 0.0
35-44yrs 97 85.6 14.4 0.0 14.4
28.2 27.1 0.7 0.0 0.4
65-74yrs 95 58.9 40.0 10.5 41.1
13.4 10.4 2.0 0.3 0.8
Trincomalee 15yrs 40 100.0 0.0 0.0 0.0
27.9 27.9 0.0 0.0 0.0
35-44yrs 40 77.5 22.5 0.0 22.5
27.1 26.3 0.8 0.0 0.1
65-74yrs 39 59.0 41.0 0.0 41.0
15.0 12.7 1.5 0.0 0.8
Kurunegala 15yrs 160 90.6 9.4 0.0 9.4
28.0 27.8 0.2 0.0 0.0
35-44yrs 159 73.0 25.8 5.7 27.0
28.2 26.7 1.2 0.1 0.1
65-74yrs 160 53.8 43.8 10.6 46.3
16.9 14.1 1.9 0.4 0.6
Puttalam 15yrs 60 98.3 1.7 0.0 1.7
28.0 27.9 0.0 0.0 0.0
35-44yrs 60 71.7 28.3 5.0 28.3
27.1 25.2 1.2 0.3 0.4
65-74yrs 60 60.0 40.0 10.0 40.0
16.1 13.7 1.6 0.2 0.6
Anuradhapura 15yrs 100 98.0 2.0 0.0 2.0
28.0 27.9 0.1 0.0 0.0
35-44yrs 99 72.7 26.3 6.1 27.3
29.1 26.6 1.8 0.4 0.3
65-74yrs 97 44.3 54.6 4.1 55.7
15.8 12.8 2.5 0.0 0.5
Polonnaruwa 15yrs 60 93.3 6.7 0.0 6.7
28.0 27.8 0.2 0.0 0.0
35-44yrs 60 80.0 20.0 0.0 20.0
28.6 27.4 1.1 0.0 0.2
65-74yrs 59 55.9 37.3 8.5 44.1
18.1 13.7 2.4 0.3 1.7
Badulla 15yrs 80 93.8 6.3 0.0 6.3
27.9 27.5 0.4 0.0 0.0
35-44yrs 80 60.0 40.0 6.3 40.0
27.5 23.3 3.0 0.3 0.9
65-74yrs 74 51.4 47.3 5.4 48.6
13.5 10.1 2.5 0.1 0.8
Monaragala 15yrs 60 100.0 0.0 0.0 0.0
28.0 27.8 0.0 0.0 0.1
35-44yrs 60 76.7 23.3 1.7 23.3
27.0 26.2 0.7 0.0 0.1
65-74yrs 60 68.3 31.7 3.3 31.7
16.9 15.3 1.4 0.1 0.2
Ratnapura 15yrs 80 96.3 3.8 0.0 3.8
28.0 27.9 0.0 0.0 0.1
35-44yrs 80 78.8 21.3 3.8 21.3
27.2 26.4 0.6 0.2 0.0
65-74yrs 78 61.5 34.6 10.3 38.5
15.6 13.5 1.4 0.4 0.3
Kegalle 15yrs 80 93.8 6.3 0.0 6.3
28.0 27.5 0.1 0.0 0.3
35-44yrs 79 89.9 10.1 2.5 10.1
27.8 26.9 0.4 0.1 0.4
65-74yrs 76 51.3 44.7 17.1 48.7
14.2 10.8 2.3 0.6 0.5
*Any (≥4mm) = either 4-5mm or ≥6mm Note: Since the possibility of presence of 4-5mm and ≥6mm pockets simultaneously in a person, totals of ‘4-5mm’ and ‘≥6mm’ might not add up to ‘Any (≥4mm)’
78
Table 6.9: Distribution of participants according to the status of periodontal pockets
District Age group
N % of participants with pockets Total
teeth x ̅
Mean number of teeth with pockets No
pockets 4-5mm ≥6mm
Any* (≥4mm)
Nil 4-5mm ≥6mm Excluded
Colombo 15yrs 180 90.0 10.0 0.0 10.0
28.0 27.6 0.3 0.0 0.1
35-44yrs 178 82.0 18.0 1.1 18.0
27.1 25.5 1.1 0.0 0.5
65-74yrs 176 69.3 29.0 4.5 30.7
14.9 11.8 1.9 0.2 1.0
Gampaha 15yrs 181 92.3 7.7 0.0 7.7
27.9 27.5 0.3 0.0 0.1
35-44yrs 177 65.5 33.3 5.1 34.5
26.8 24.6 1.7 0.2 0.4
65-74yrs 179 48.0 48.6 12.8 52.0
14.1 10.7 2.4 0.3 0.8
Kalutara 15yrs 102 92.2 7.8 0.0 7.8
28.0 27.3 0.5 0.0 0.1
35-44yrs 100 76.0 22.0 4.0 24.0
26.4 24.3 1.2 0.1 0.8
65-74yrs 100 47.0 44.0 18.0 53.0
13.5 7.9 3.9 0.7 1.0
Kandy 15yrs 140 97.9 2.1 0.0 2.1
28.1 28.0 0.1 0.0 0.1
35-44yrs 136 69.9 26.5 5.9 30.1
27.4 25.6 1.4 0.1 0.3
65-74yrs 134 56.0 35.8 16.4 44.0
14.7 12.0 1.5 0.4 0.8
Matale 15yrs 40 100.0 0.0 0.0 0.0
28.0 28.0 0.0 0.0 0.0
35-44yrs 40 62.5 30.0 15.0 37.5
28.0 25.9 1.3 0.3 0.5
65-74yrs 39 35.9 48.7 28.2 64.1
15.3 9.7 2.2 1.4 2.1
Nuwara-Eliya 15yrs 100 99.0 1.0 0.0 1.0
28.0 28.0 0.0 0.0 0.0
35-44yrs 99 61.6 38.4 7.1 38.4
27.5 23.8 2.8 0.2 0.7
65-74yrs 98 51.0 48.0 14.3 49.0
13.7 10.2 2.5 0.3 0.7
Galle 15yrs 100 94.0 6.0 0.0 6.0
27.9 27.7 0.1 0.0 0.0
35-44yrs 99 81.8 17.2 2.0 18.2
26.2 25.2 0.8 0.0 0.2
65-74yrs 100 65.0 32.0 12.0 35.0
12.5 10.1 1.8 0.3 0.3
Matara 15yrs 80 96.3 3.8 0.0 3.8
27.9 27.4 0.5 0.0 0.0
35-44yrs 79 83.5 16.5 1.3 16.5
27.3 26.3 1.0 0.0 0.0
65-74yrs 79 69.6 30.4 1.3 30.4
16.9 14.6 2.3 0.0 0.1
Hambantota 15yrs 60 90.0 10.0 0.0 10.0
28.1 27.7 0.3 0.0 0.1
35-44yrs 59 76.3 22.0 3.4 23.7
29.0 28.0 0.8 0.1 0.2
65-74yrs 60 51.7 41.7 13.3 48.3
17.6 13.1 2.3 0.6 1.7
Jaffna 15yrs 60 98.3 1.7 0.0 1.7
27.7 27.6 0.1 0.0 0.0
35-44yrs 60 65.0 35.0 11.7 35.0
28.8 24.3 2.7 0.7 1.1
65-74yrs 59 61.0 39.0 15.3 39.0
20.1 16.0 2.8 0.8 0.5
Kilinochchi 15yrs 20 100.0 0.0 0.0 0.0
27.7 27.6 0.0 0.0 0.1
35-44yrs 20 75.0 20.0 10.0 25.0
28.7 27.7 0.3 0.3 0.5
65-74yrs 20 80.0 20.0 0.0 20.0
19.1 17.3 0.6 0.0 1.2
Mannar 15yrs 20 60.0 35.0 5.0 40.0
28.2 26.3 1.8 0.1 0.1
35-44yrs 20 95.0 5.0 0.0 5.0
28.7 28.5 0.2 0.0 0.1
65-74yrs 20 30.0 70.0 35.0 70.0
18.8 8.2 7.9 2.7 0.1
Mullaitivu 15yrs 20 100.0 0.0 0.0 0.0
28.0 28.0 0.0 0.0 0.0
35-44yrs 21 71.4 28.6 4.8 28.6
29.2 26.2 2.9 0.1 0.0
65-74yrs 20 75.0 25.0 5.0 25.0
13.3 11.2 1.6 0.3 0.2
*Any (≥4mm) = either 4-5mm or ≥6mm Note: Since the possibility of presence of 4-5mm and ≥6mm pockets simultaneously in a person, totals of ‘4-5mm’ and ‘≥6mm’ might not add up to ‘Any (≥4mm)’
Dis
tric
t-b
ased
re
sult
s
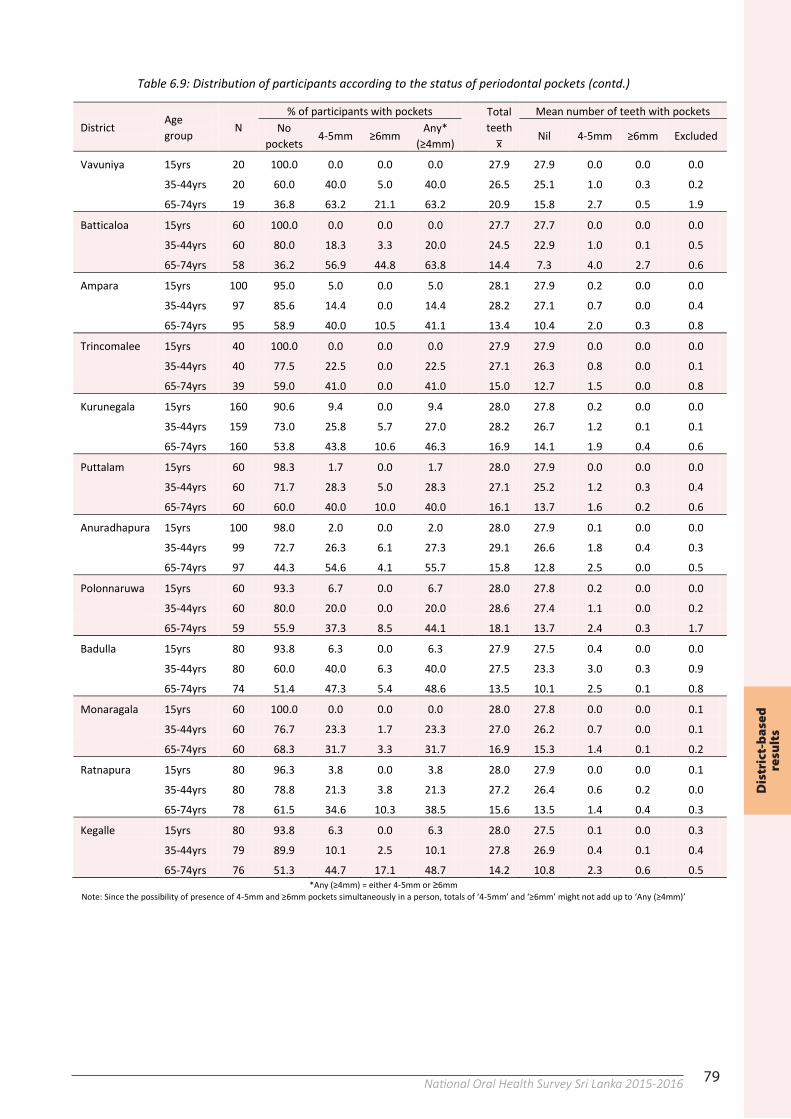
79National Oral Health Survey Sri Lanka 2015-201679
Table 6.9: Distribution of participants according to the status of periodontal pockets (contd.)
District Age group
N % of participants with pockets
Total teeth
x ̅
Mean number of teeth with pockets No
pockets 4-5mm ≥6mm
Any* (≥4mm)
Nil 4-5mm ≥6mm Excluded
Vavuniya 15yrs 20 100.0 0.0 0.0 0.0
27.9 27.9 0.0 0.0 0.0
35-44yrs 20 60.0 40.0 5.0 40.0
26.5 25.1 1.0 0.3 0.2
65-74yrs 19 36.8 63.2 21.1 63.2
20.9 15.8 2.7 0.5 1.9
Batticaloa 15yrs 60 100.0 0.0 0.0 0.0
27.7 27.7 0.0 0.0 0.0
35-44yrs 60 80.0 18.3 3.3 20.0
24.5 22.9 1.0 0.1 0.5
65-74yrs 58 36.2 56.9 44.8 63.8
14.4 7.3 4.0 2.7 0.6
Ampara 15yrs 100 95.0 5.0 0.0 5.0
28.1 27.9 0.2 0.0 0.0
35-44yrs 97 85.6 14.4 0.0 14.4
28.2 27.1 0.7 0.0 0.4
65-74yrs 95 58.9 40.0 10.5 41.1
13.4 10.4 2.0 0.3 0.8
Trincomalee 15yrs 40 100.0 0.0 0.0 0.0
27.9 27.9 0.0 0.0 0.0
35-44yrs 40 77.5 22.5 0.0 22.5
27.1 26.3 0.8 0.0 0.1
65-74yrs 39 59.0 41.0 0.0 41.0
15.0 12.7 1.5 0.0 0.8
Kurunegala 15yrs 160 90.6 9.4 0.0 9.4
28.0 27.8 0.2 0.0 0.0
35-44yrs 159 73.0 25.8 5.7 27.0
28.2 26.7 1.2 0.1 0.1
65-74yrs 160 53.8 43.8 10.6 46.3
16.9 14.1 1.9 0.4 0.6
Puttalam 15yrs 60 98.3 1.7 0.0 1.7
28.0 27.9 0.0 0.0 0.0
35-44yrs 60 71.7 28.3 5.0 28.3
27.1 25.2 1.2 0.3 0.4
65-74yrs 60 60.0 40.0 10.0 40.0
16.1 13.7 1.6 0.2 0.6
Anuradhapura 15yrs 100 98.0 2.0 0.0 2.0
28.0 27.9 0.1 0.0 0.0
35-44yrs 99 72.7 26.3 6.1 27.3
29.1 26.6 1.8 0.4 0.3
65-74yrs 97 44.3 54.6 4.1 55.7
15.8 12.8 2.5 0.0 0.5
Polonnaruwa 15yrs 60 93.3 6.7 0.0 6.7
28.0 27.8 0.2 0.0 0.0
35-44yrs 60 80.0 20.0 0.0 20.0
28.6 27.4 1.1 0.0 0.2
65-74yrs 59 55.9 37.3 8.5 44.1
18.1 13.7 2.4 0.3 1.7
Badulla 15yrs 80 93.8 6.3 0.0 6.3
27.9 27.5 0.4 0.0 0.0
35-44yrs 80 60.0 40.0 6.3 40.0
27.5 23.3 3.0 0.3 0.9
65-74yrs 74 51.4 47.3 5.4 48.6
13.5 10.1 2.5 0.1 0.8
Monaragala 15yrs 60 100.0 0.0 0.0 0.0
28.0 27.8 0.0 0.0 0.1
35-44yrs 60 76.7 23.3 1.7 23.3
27.0 26.2 0.7 0.0 0.1
65-74yrs 60 68.3 31.7 3.3 31.7
16.9 15.3 1.4 0.1 0.2
Ratnapura 15yrs 80 96.3 3.8 0.0 3.8
28.0 27.9 0.0 0.0 0.1
35-44yrs 80 78.8 21.3 3.8 21.3
27.2 26.4 0.6 0.2 0.0
65-74yrs 78 61.5 34.6 10.3 38.5
15.6 13.5 1.4 0.4 0.3
Kegalle 15yrs 80 93.8 6.3 0.0 6.3
28.0 27.5 0.1 0.0 0.3
35-44yrs 79 89.9 10.1 2.5 10.1
27.8 26.9 0.4 0.1 0.4
65-74yrs 76 51.3 44.7 17.1 48.7
14.2 10.8 2.3 0.6 0.5
*Any (≥4mm) = either 4-5mm or ≥6mm Note: Since the possibility of presence of 4-5mm and ≥6mm pockets simultaneously in a person, totals of ‘4-5mm’ and ‘≥6mm’ might not add up to ‘Any (≥4mm)’
Dis
tric
t-b
ased
re
sult
s
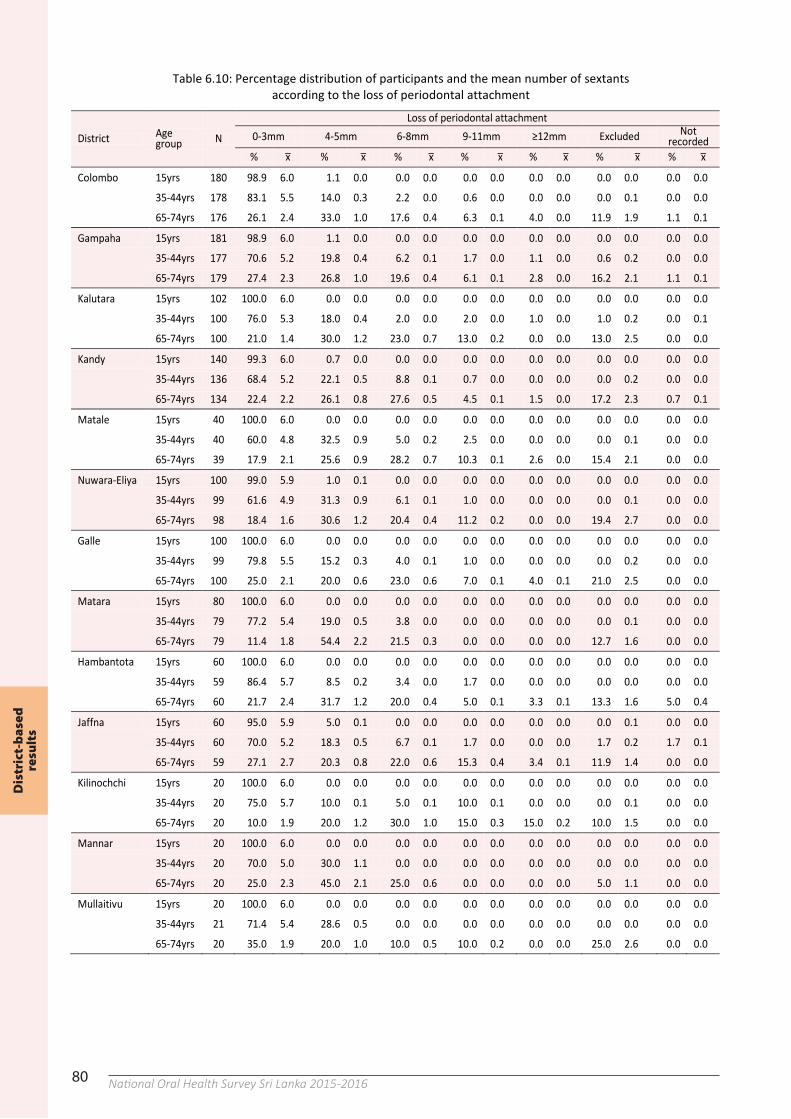
80 National Oral Health Survey Sri Lanka 2015-201680
Table 6.10: Percentage distribution of participants and the mean number of sextants according to the loss of periodontal attachment
District Age group N
Loss of periodontal attachment 0-3mm 4-5mm 6-8mm 9-11mm ≥12mm Excluded Not
recorded % x ̅ % x ̅ % x ̅ % x ̅ % x ̅ % x ̅ % x ̅
Colombo 15yrs 180 98.9 6.0 1.1 0.0 0.0 0.0 0.0 0.0 0.0 0.0 0.0 0.0 0.0 0.0
35-44yrs 178 83.1 5.5 14.0 0.3 2.2 0.0 0.6 0.0 0.0 0.0 0.0 0.1 0.0 0.0
65-74yrs 176 26.1 2.4 33.0 1.0 17.6 0.4 6.3 0.1 4.0 0.0 11.9 1.9 1.1 0.1
Gampaha 15yrs 181 98.9 6.0 1.1 0.0 0.0 0.0 0.0 0.0 0.0 0.0 0.0 0.0 0.0 0.0
35-44yrs 177 70.6 5.2 19.8 0.4 6.2 0.1 1.7 0.0 1.1 0.0 0.6 0.2 0.0 0.0
65-74yrs 179 27.4 2.3 26.8 1.0 19.6 0.4 6.1 0.1 2.8 0.0 16.2 2.1 1.1 0.1
Kalutara 15yrs 102 100.0 6.0 0.0 0.0 0.0 0.0 0.0 0.0 0.0 0.0 0.0 0.0 0.0 0.0
35-44yrs 100 76.0 5.3 18.0 0.4 2.0 0.0 2.0 0.0 1.0 0.0 1.0 0.2 0.0 0.1
65-74yrs 100 21.0 1.4 30.0 1.2 23.0 0.7 13.0 0.2 0.0 0.0 13.0 2.5 0.0 0.0
Kandy 15yrs 140 99.3 6.0 0.7 0.0 0.0 0.0 0.0 0.0 0.0 0.0 0.0 0.0 0.0 0.0
35-44yrs 136 68.4 5.2 22.1 0.5 8.8 0.1 0.7 0.0 0.0 0.0 0.0 0.2 0.0 0.0
65-74yrs 134 22.4 2.2 26.1 0.8 27.6 0.5 4.5 0.1 1.5 0.0 17.2 2.3 0.7 0.1
Matale 15yrs 40 100.0 6.0 0.0 0.0 0.0 0.0 0.0 0.0 0.0 0.0 0.0 0.0 0.0 0.0
35-44yrs 40 60.0 4.8 32.5 0.9 5.0 0.2 2.5 0.0 0.0 0.0 0.0 0.1 0.0 0.0
65-74yrs 39 17.9 2.1 25.6 0.9 28.2 0.7 10.3 0.1 2.6 0.0 15.4 2.1 0.0 0.0
Nuwara-Eliya 15yrs 100 99.0 5.9 1.0 0.1 0.0 0.0 0.0 0.0 0.0 0.0 0.0 0.0 0.0 0.0
35-44yrs 99 61.6 4.9 31.3 0.9 6.1 0.1 1.0 0.0 0.0 0.0 0.0 0.1 0.0 0.0
65-74yrs 98 18.4 1.6 30.6 1.2 20.4 0.4 11.2 0.2 0.0 0.0 19.4 2.7 0.0 0.0
Galle 15yrs 100 100.0 6.0 0.0 0.0 0.0 0.0 0.0 0.0 0.0 0.0 0.0 0.0 0.0 0.0
35-44yrs 99 79.8 5.5 15.2 0.3 4.0 0.1 1.0 0.0 0.0 0.0 0.0 0.2 0.0 0.0
65-74yrs 100 25.0 2.1 20.0 0.6 23.0 0.6 7.0 0.1 4.0 0.1 21.0 2.5 0.0 0.0
Matara 15yrs 80 100.0 6.0 0.0 0.0 0.0 0.0 0.0 0.0 0.0 0.0 0.0 0.0 0.0 0.0
35-44yrs 79 77.2 5.4 19.0 0.5 3.8 0.0 0.0 0.0 0.0 0.0 0.0 0.1 0.0 0.0
65-74yrs 79 11.4 1.8 54.4 2.2 21.5 0.3 0.0 0.0 0.0 0.0 12.7 1.6 0.0 0.0
Hambantota 15yrs 60 100.0 6.0 0.0 0.0 0.0 0.0 0.0 0.0 0.0 0.0 0.0 0.0 0.0 0.0
35-44yrs 59 86.4 5.7 8.5 0.2 3.4 0.0 1.7 0.0 0.0 0.0 0.0 0.0 0.0 0.0
65-74yrs 60 21.7 2.4 31.7 1.2 20.0 0.4 5.0 0.1 3.3 0.1 13.3 1.6 5.0 0.4
Jaffna 15yrs 60 95.0 5.9 5.0 0.1 0.0 0.0 0.0 0.0 0.0 0.0 0.0 0.1 0.0 0.0
35-44yrs 60 70.0 5.2 18.3 0.5 6.7 0.1 1.7 0.0 0.0 0.0 1.7 0.2 1.7 0.1
65-74yrs 59 27.1 2.7 20.3 0.8 22.0 0.6 15.3 0.4 3.4 0.1 11.9 1.4 0.0 0.0
Kilinochchi 15yrs 20 100.0 6.0 0.0 0.0 0.0 0.0 0.0 0.0 0.0 0.0 0.0 0.0 0.0 0.0
35-44yrs 20 75.0 5.7 10.0 0.1 5.0 0.1 10.0 0.1 0.0 0.0 0.0 0.1 0.0 0.0
65-74yrs 20 10.0 1.9 20.0 1.2 30.0 1.0 15.0 0.3 15.0 0.2 10.0 1.5 0.0 0.0
Mannar 15yrs 20 100.0 6.0 0.0 0.0 0.0 0.0 0.0 0.0 0.0 0.0 0.0 0.0 0.0 0.0
35-44yrs 20 70.0 5.0 30.0 1.1 0.0 0.0 0.0 0.0 0.0 0.0 0.0 0.0 0.0 0.0
65-74yrs 20 25.0 2.3 45.0 2.1 25.0 0.6 0.0 0.0 0.0 0.0 5.0 1.1 0.0 0.0
Mullaitivu 15yrs 20 100.0 6.0 0.0 0.0 0.0 0.0 0.0 0.0 0.0 0.0 0.0 0.0 0.0 0.0
35-44yrs 21 71.4 5.4 28.6 0.5 0.0 0.0 0.0 0.0 0.0 0.0 0.0 0.0 0.0 0.0
65-74yrs 20 35.0 1.9 20.0 1.0 10.0 0.5 10.0 0.2 0.0 0.0 25.0 2.6 0.0 0.0
80
Table 6.10: Percentage distribution of participants and the mean number of sextants according to the loss of periodontal attachment
District Age group N
Loss of periodontal attachment 0-3mm 4-5mm 6-8mm 9-11mm ≥12mm Excluded Not
recorded % x ̅ % x ̅ % x ̅ % x ̅ % x ̅ % x ̅ % x ̅
Colombo 15yrs 180 98.9 6.0 1.1 0.0 0.0 0.0 0.0 0.0 0.0 0.0 0.0 0.0 0.0 0.0
35-44yrs 178 83.1 5.5 14.0 0.3 2.2 0.0 0.6 0.0 0.0 0.0 0.0 0.1 0.0 0.0
65-74yrs 176 26.1 2.4 33.0 1.0 17.6 0.4 6.3 0.1 4.0 0.0 11.9 1.9 1.1 0.1
Gampaha 15yrs 181 98.9 6.0 1.1 0.0 0.0 0.0 0.0 0.0 0.0 0.0 0.0 0.0 0.0 0.0
35-44yrs 177 70.6 5.2 19.8 0.4 6.2 0.1 1.7 0.0 1.1 0.0 0.6 0.2 0.0 0.0
65-74yrs 179 27.4 2.3 26.8 1.0 19.6 0.4 6.1 0.1 2.8 0.0 16.2 2.1 1.1 0.1
Kalutara 15yrs 102 100.0 6.0 0.0 0.0 0.0 0.0 0.0 0.0 0.0 0.0 0.0 0.0 0.0 0.0
35-44yrs 100 76.0 5.3 18.0 0.4 2.0 0.0 2.0 0.0 1.0 0.0 1.0 0.2 0.0 0.1
65-74yrs 100 21.0 1.4 30.0 1.2 23.0 0.7 13.0 0.2 0.0 0.0 13.0 2.5 0.0 0.0
Kandy 15yrs 140 99.3 6.0 0.7 0.0 0.0 0.0 0.0 0.0 0.0 0.0 0.0 0.0 0.0 0.0
35-44yrs 136 68.4 5.2 22.1 0.5 8.8 0.1 0.7 0.0 0.0 0.0 0.0 0.2 0.0 0.0
65-74yrs 134 22.4 2.2 26.1 0.8 27.6 0.5 4.5 0.1 1.5 0.0 17.2 2.3 0.7 0.1
Matale 15yrs 40 100.0 6.0 0.0 0.0 0.0 0.0 0.0 0.0 0.0 0.0 0.0 0.0 0.0 0.0
35-44yrs 40 60.0 4.8 32.5 0.9 5.0 0.2 2.5 0.0 0.0 0.0 0.0 0.1 0.0 0.0
65-74yrs 39 17.9 2.1 25.6 0.9 28.2 0.7 10.3 0.1 2.6 0.0 15.4 2.1 0.0 0.0
Nuwara-Eliya 15yrs 100 99.0 5.9 1.0 0.1 0.0 0.0 0.0 0.0 0.0 0.0 0.0 0.0 0.0 0.0
35-44yrs 99 61.6 4.9 31.3 0.9 6.1 0.1 1.0 0.0 0.0 0.0 0.0 0.1 0.0 0.0
65-74yrs 98 18.4 1.6 30.6 1.2 20.4 0.4 11.2 0.2 0.0 0.0 19.4 2.7 0.0 0.0
Galle 15yrs 100 100.0 6.0 0.0 0.0 0.0 0.0 0.0 0.0 0.0 0.0 0.0 0.0 0.0 0.0
35-44yrs 99 79.8 5.5 15.2 0.3 4.0 0.1 1.0 0.0 0.0 0.0 0.0 0.2 0.0 0.0
65-74yrs 100 25.0 2.1 20.0 0.6 23.0 0.6 7.0 0.1 4.0 0.1 21.0 2.5 0.0 0.0
Matara 15yrs 80 100.0 6.0 0.0 0.0 0.0 0.0 0.0 0.0 0.0 0.0 0.0 0.0 0.0 0.0
35-44yrs 79 77.2 5.4 19.0 0.5 3.8 0.0 0.0 0.0 0.0 0.0 0.0 0.1 0.0 0.0
65-74yrs 79 11.4 1.8 54.4 2.2 21.5 0.3 0.0 0.0 0.0 0.0 12.7 1.6 0.0 0.0
Hambantota 15yrs 60 100.0 6.0 0.0 0.0 0.0 0.0 0.0 0.0 0.0 0.0 0.0 0.0 0.0 0.0
35-44yrs 59 86.4 5.7 8.5 0.2 3.4 0.0 1.7 0.0 0.0 0.0 0.0 0.0 0.0 0.0
65-74yrs 60 21.7 2.4 31.7 1.2 20.0 0.4 5.0 0.1 3.3 0.1 13.3 1.6 5.0 0.4
Jaffna 15yrs 60 95.0 5.9 5.0 0.1 0.0 0.0 0.0 0.0 0.0 0.0 0.0 0.1 0.0 0.0
35-44yrs 60 70.0 5.2 18.3 0.5 6.7 0.1 1.7 0.0 0.0 0.0 1.7 0.2 1.7 0.1
65-74yrs 59 27.1 2.7 20.3 0.8 22.0 0.6 15.3 0.4 3.4 0.1 11.9 1.4 0.0 0.0
Kilinochchi 15yrs 20 100.0 6.0 0.0 0.0 0.0 0.0 0.0 0.0 0.0 0.0 0.0 0.0 0.0 0.0
35-44yrs 20 75.0 5.7 10.0 0.1 5.0 0.1 10.0 0.1 0.0 0.0 0.0 0.1 0.0 0.0
65-74yrs 20 10.0 1.9 20.0 1.2 30.0 1.0 15.0 0.3 15.0 0.2 10.0 1.5 0.0 0.0
Mannar 15yrs 20 100.0 6.0 0.0 0.0 0.0 0.0 0.0 0.0 0.0 0.0 0.0 0.0 0.0 0.0
35-44yrs 20 70.0 5.0 30.0 1.1 0.0 0.0 0.0 0.0 0.0 0.0 0.0 0.0 0.0 0.0
65-74yrs 20 25.0 2.3 45.0 2.1 25.0 0.6 0.0 0.0 0.0 0.0 5.0 1.1 0.0 0.0
Mullaitivu 15yrs 20 100.0 6.0 0.0 0.0 0.0 0.0 0.0 0.0 0.0 0.0 0.0 0.0 0.0 0.0
35-44yrs 21 71.4 5.4 28.6 0.5 0.0 0.0 0.0 0.0 0.0 0.0 0.0 0.0 0.0 0.0
65-74yrs 20 35.0 1.9 20.0 1.0 10.0 0.5 10.0 0.2 0.0 0.0 25.0 2.6 0.0 0.0
Dis
tric
t-b
ased
re
sult
s
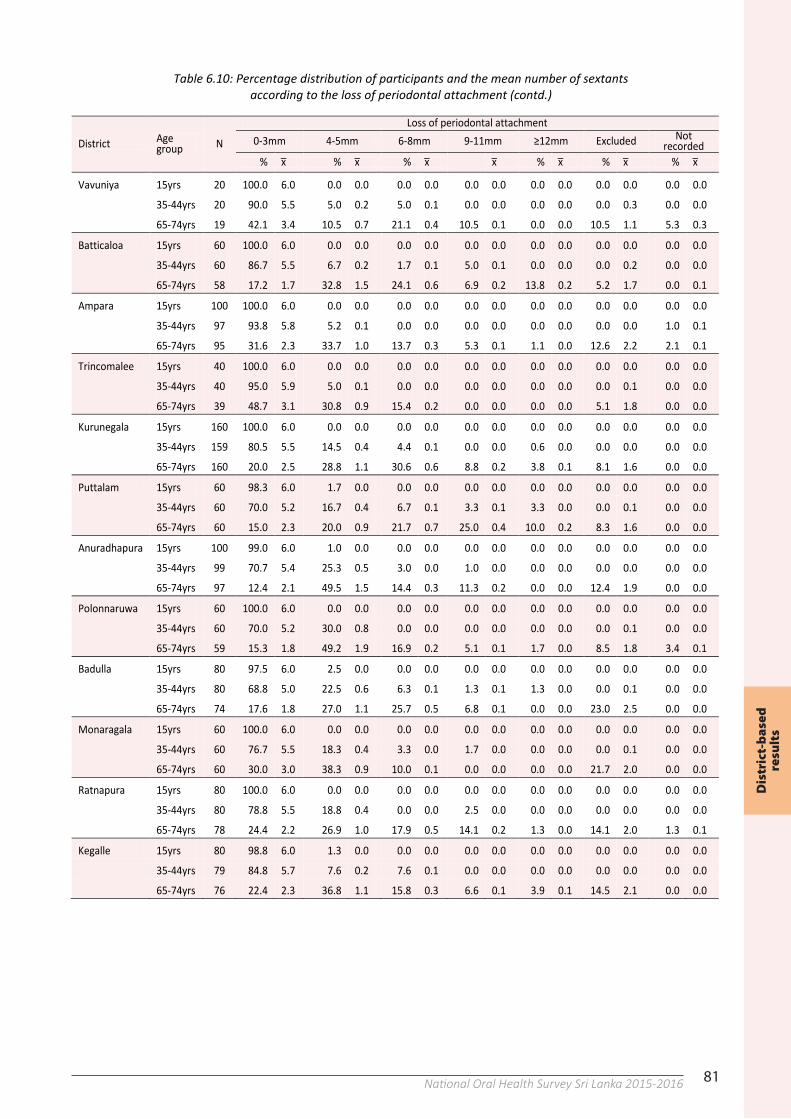
81National Oral Health Survey Sri Lanka 2015-201681
Table 6.10: Percentage distribution of participants and the mean number of sextants according to the loss of periodontal attachment (contd.)
District Age group N
Loss of periodontal attachment 0-3mm 4-5mm 6-8mm 9-11mm ≥12mm Excluded Not
recorded % x ̅ % x ̅ % x ̅ x ̅ % x ̅ % x ̅ % x ̅
Vavuniya 15yrs 20 100.0 6.0 0.0 0.0 0.0 0.0 0.0 0.0 0.0 0.0 0.0 0.0 0.0 0.0
35-44yrs 20 90.0 5.5 5.0 0.2 5.0 0.1 0.0 0.0 0.0 0.0 0.0 0.3 0.0 0.0
65-74yrs 19 42.1 3.4 10.5 0.7 21.1 0.4 10.5 0.1 0.0 0.0 10.5 1.1 5.3 0.3
Batticaloa 15yrs 60 100.0 6.0 0.0 0.0 0.0 0.0 0.0 0.0 0.0 0.0 0.0 0.0 0.0 0.0
35-44yrs 60 86.7 5.5 6.7 0.2 1.7 0.1 5.0 0.1 0.0 0.0 0.0 0.2 0.0 0.0
65-74yrs 58 17.2 1.7 32.8 1.5 24.1 0.6 6.9 0.2 13.8 0.2 5.2 1.7 0.0 0.1
Ampara 15yrs 100 100.0 6.0 0.0 0.0 0.0 0.0 0.0 0.0 0.0 0.0 0.0 0.0 0.0 0.0
35-44yrs 97 93.8 5.8 5.2 0.1 0.0 0.0 0.0 0.0 0.0 0.0 0.0 0.0 1.0 0.1
65-74yrs 95 31.6 2.3 33.7 1.0 13.7 0.3 5.3 0.1 1.1 0.0 12.6 2.2 2.1 0.1
Trincomalee 15yrs 40 100.0 6.0 0.0 0.0 0.0 0.0 0.0 0.0 0.0 0.0 0.0 0.0 0.0 0.0
35-44yrs 40 95.0 5.9 5.0 0.1 0.0 0.0 0.0 0.0 0.0 0.0 0.0 0.1 0.0 0.0
65-74yrs 39 48.7 3.1 30.8 0.9 15.4 0.2 0.0 0.0 0.0 0.0 5.1 1.8 0.0 0.0
Kurunegala 15yrs 160 100.0 6.0 0.0 0.0 0.0 0.0 0.0 0.0 0.0 0.0 0.0 0.0 0.0 0.0
35-44yrs 159 80.5 5.5 14.5 0.4 4.4 0.1 0.0 0.0 0.6 0.0 0.0 0.0 0.0 0.0
65-74yrs 160 20.0 2.5 28.8 1.1 30.6 0.6 8.8 0.2 3.8 0.1 8.1 1.6 0.0 0.0
Puttalam 15yrs 60 98.3 6.0 1.7 0.0 0.0 0.0 0.0 0.0 0.0 0.0 0.0 0.0 0.0 0.0
35-44yrs 60 70.0 5.2 16.7 0.4 6.7 0.1 3.3 0.1 3.3 0.0 0.0 0.1 0.0 0.0
65-74yrs 60 15.0 2.3 20.0 0.9 21.7 0.7 25.0 0.4 10.0 0.2 8.3 1.6 0.0 0.0
Anuradhapura 15yrs 100 99.0 6.0 1.0 0.0 0.0 0.0 0.0 0.0 0.0 0.0 0.0 0.0 0.0 0.0
35-44yrs 99 70.7 5.4 25.3 0.5 3.0 0.0 1.0 0.0 0.0 0.0 0.0 0.0 0.0 0.0
65-74yrs 97 12.4 2.1 49.5 1.5 14.4 0.3 11.3 0.2 0.0 0.0 12.4 1.9 0.0 0.0
Polonnaruwa 15yrs 60 100.0 6.0 0.0 0.0 0.0 0.0 0.0 0.0 0.0 0.0 0.0 0.0 0.0 0.0
35-44yrs 60 70.0 5.2 30.0 0.8 0.0 0.0 0.0 0.0 0.0 0.0 0.0 0.1 0.0 0.0
65-74yrs 59 15.3 1.8 49.2 1.9 16.9 0.2 5.1 0.1 1.7 0.0 8.5 1.8 3.4 0.1
Badulla 15yrs 80 97.5 6.0 2.5 0.0 0.0 0.0 0.0 0.0 0.0 0.0 0.0 0.0 0.0 0.0
35-44yrs 80 68.8 5.0 22.5 0.6 6.3 0.1 1.3 0.1 1.3 0.0 0.0 0.1 0.0 0.0
65-74yrs 74 17.6 1.8 27.0 1.1 25.7 0.5 6.8 0.1 0.0 0.0 23.0 2.5 0.0 0.0
Monaragala 15yrs 60 100.0 6.0 0.0 0.0 0.0 0.0 0.0 0.0 0.0 0.0 0.0 0.0 0.0 0.0
35-44yrs 60 76.7 5.5 18.3 0.4 3.3 0.0 1.7 0.0 0.0 0.0 0.0 0.1 0.0 0.0
65-74yrs 60 30.0 3.0 38.3 0.9 10.0 0.1 0.0 0.0 0.0 0.0 21.7 2.0 0.0 0.0
Ratnapura 15yrs 80 100.0 6.0 0.0 0.0 0.0 0.0 0.0 0.0 0.0 0.0 0.0 0.0 0.0 0.0
35-44yrs 80 78.8 5.5 18.8 0.4 0.0 0.0 2.5 0.0 0.0 0.0 0.0 0.0 0.0 0.0
65-74yrs 78 24.4 2.2 26.9 1.0 17.9 0.5 14.1 0.2 1.3 0.0 14.1 2.0 1.3 0.1
Kegalle 15yrs 80 98.8 6.0 1.3 0.0 0.0 0.0 0.0 0.0 0.0 0.0 0.0 0.0 0.0 0.0
35-44yrs 79 84.8 5.7 7.6 0.2 7.6 0.1 0.0 0.0 0.0 0.0 0.0 0.0 0.0 0.0
65-74yrs 76 22.4 2.3 36.8 1.1 15.8 0.3 6.6 0.1 3.9 0.1 14.5 2.1 0.0 0.0
81
Table 6.10: Percentage distribution of participants and the mean number of sextants according to the loss of periodontal attachment (contd.)
District Age group N
Loss of periodontal attachment 0-3mm 4-5mm 6-8mm 9-11mm ≥12mm Excluded Not
recorded % x ̅ % x ̅ % x ̅ x ̅ % x ̅ % x ̅ % x ̅
Vavuniya 15yrs 20 100.0 6.0 0.0 0.0 0.0 0.0 0.0 0.0 0.0 0.0 0.0 0.0 0.0 0.0
35-44yrs 20 90.0 5.5 5.0 0.2 5.0 0.1 0.0 0.0 0.0 0.0 0.0 0.3 0.0 0.0
65-74yrs 19 42.1 3.4 10.5 0.7 21.1 0.4 10.5 0.1 0.0 0.0 10.5 1.1 5.3 0.3
Batticaloa 15yrs 60 100.0 6.0 0.0 0.0 0.0 0.0 0.0 0.0 0.0 0.0 0.0 0.0 0.0 0.0
35-44yrs 60 86.7 5.5 6.7 0.2 1.7 0.1 5.0 0.1 0.0 0.0 0.0 0.2 0.0 0.0
65-74yrs 58 17.2 1.7 32.8 1.5 24.1 0.6 6.9 0.2 13.8 0.2 5.2 1.7 0.0 0.1
Ampara 15yrs 100 100.0 6.0 0.0 0.0 0.0 0.0 0.0 0.0 0.0 0.0 0.0 0.0 0.0 0.0
35-44yrs 97 93.8 5.8 5.2 0.1 0.0 0.0 0.0 0.0 0.0 0.0 0.0 0.0 1.0 0.1
65-74yrs 95 31.6 2.3 33.7 1.0 13.7 0.3 5.3 0.1 1.1 0.0 12.6 2.2 2.1 0.1
Trincomalee 15yrs 40 100.0 6.0 0.0 0.0 0.0 0.0 0.0 0.0 0.0 0.0 0.0 0.0 0.0 0.0
35-44yrs 40 95.0 5.9 5.0 0.1 0.0 0.0 0.0 0.0 0.0 0.0 0.0 0.1 0.0 0.0
65-74yrs 39 48.7 3.1 30.8 0.9 15.4 0.2 0.0 0.0 0.0 0.0 5.1 1.8 0.0 0.0
Kurunegala 15yrs 160 100.0 6.0 0.0 0.0 0.0 0.0 0.0 0.0 0.0 0.0 0.0 0.0 0.0 0.0
35-44yrs 159 80.5 5.5 14.5 0.4 4.4 0.1 0.0 0.0 0.6 0.0 0.0 0.0 0.0 0.0
65-74yrs 160 20.0 2.5 28.8 1.1 30.6 0.6 8.8 0.2 3.8 0.1 8.1 1.6 0.0 0.0
Puttalam 15yrs 60 98.3 6.0 1.7 0.0 0.0 0.0 0.0 0.0 0.0 0.0 0.0 0.0 0.0 0.0
35-44yrs 60 70.0 5.2 16.7 0.4 6.7 0.1 3.3 0.1 3.3 0.0 0.0 0.1 0.0 0.0
65-74yrs 60 15.0 2.3 20.0 0.9 21.7 0.7 25.0 0.4 10.0 0.2 8.3 1.6 0.0 0.0
Anuradhapura 15yrs 100 99.0 6.0 1.0 0.0 0.0 0.0 0.0 0.0 0.0 0.0 0.0 0.0 0.0 0.0
35-44yrs 99 70.7 5.4 25.3 0.5 3.0 0.0 1.0 0.0 0.0 0.0 0.0 0.0 0.0 0.0
65-74yrs 97 12.4 2.1 49.5 1.5 14.4 0.3 11.3 0.2 0.0 0.0 12.4 1.9 0.0 0.0
Polonnaruwa 15yrs 60 100.0 6.0 0.0 0.0 0.0 0.0 0.0 0.0 0.0 0.0 0.0 0.0 0.0 0.0
35-44yrs 60 70.0 5.2 30.0 0.8 0.0 0.0 0.0 0.0 0.0 0.0 0.0 0.1 0.0 0.0
65-74yrs 59 15.3 1.8 49.2 1.9 16.9 0.2 5.1 0.1 1.7 0.0 8.5 1.8 3.4 0.1
Badulla 15yrs 80 97.5 6.0 2.5 0.0 0.0 0.0 0.0 0.0 0.0 0.0 0.0 0.0 0.0 0.0
35-44yrs 80 68.8 5.0 22.5 0.6 6.3 0.1 1.3 0.1 1.3 0.0 0.0 0.1 0.0 0.0
65-74yrs 74 17.6 1.8 27.0 1.1 25.7 0.5 6.8 0.1 0.0 0.0 23.0 2.5 0.0 0.0
Monaragala 15yrs 60 100.0 6.0 0.0 0.0 0.0 0.0 0.0 0.0 0.0 0.0 0.0 0.0 0.0 0.0
35-44yrs 60 76.7 5.5 18.3 0.4 3.3 0.0 1.7 0.0 0.0 0.0 0.0 0.1 0.0 0.0
65-74yrs 60 30.0 3.0 38.3 0.9 10.0 0.1 0.0 0.0 0.0 0.0 21.7 2.0 0.0 0.0
Ratnapura 15yrs 80 100.0 6.0 0.0 0.0 0.0 0.0 0.0 0.0 0.0 0.0 0.0 0.0 0.0 0.0
35-44yrs 80 78.8 5.5 18.8 0.4 0.0 0.0 2.5 0.0 0.0 0.0 0.0 0.0 0.0 0.0
65-74yrs 78 24.4 2.2 26.9 1.0 17.9 0.5 14.1 0.2 1.3 0.0 14.1 2.0 1.3 0.1
Kegalle 15yrs 80 98.8 6.0 1.3 0.0 0.0 0.0 0.0 0.0 0.0 0.0 0.0 0.0 0.0 0.0
35-44yrs 79 84.8 5.7 7.6 0.2 7.6 0.1 0.0 0.0 0.0 0.0 0.0 0.0 0.0 0.0
65-74yrs 76 22.4 2.3 36.8 1.1 15.8 0.3 6.6 0.1 3.9 0.1 14.5 2.1 0.0 0.0
80
Table 6.10: Percentage distribution of participants and the mean number of sextants according to the loss of periodontal attachment
District Age group N
Loss of periodontal attachment 0-3mm 4-5mm 6-8mm 9-11mm ≥12mm Excluded Not
recorded % x ̅ % x ̅ % x ̅ % x ̅ % x ̅ % x ̅ % x ̅
Colombo 15yrs 180 98.9 6.0 1.1 0.0 0.0 0.0 0.0 0.0 0.0 0.0 0.0 0.0 0.0 0.0
35-44yrs 178 83.1 5.5 14.0 0.3 2.2 0.0 0.6 0.0 0.0 0.0 0.0 0.1 0.0 0.0
65-74yrs 176 26.1 2.4 33.0 1.0 17.6 0.4 6.3 0.1 4.0 0.0 11.9 1.9 1.1 0.1
Gampaha 15yrs 181 98.9 6.0 1.1 0.0 0.0 0.0 0.0 0.0 0.0 0.0 0.0 0.0 0.0 0.0
35-44yrs 177 70.6 5.2 19.8 0.4 6.2 0.1 1.7 0.0 1.1 0.0 0.6 0.2 0.0 0.0
65-74yrs 179 27.4 2.3 26.8 1.0 19.6 0.4 6.1 0.1 2.8 0.0 16.2 2.1 1.1 0.1
Kalutara 15yrs 102 100.0 6.0 0.0 0.0 0.0 0.0 0.0 0.0 0.0 0.0 0.0 0.0 0.0 0.0
35-44yrs 100 76.0 5.3 18.0 0.4 2.0 0.0 2.0 0.0 1.0 0.0 1.0 0.2 0.0 0.1
65-74yrs 100 21.0 1.4 30.0 1.2 23.0 0.7 13.0 0.2 0.0 0.0 13.0 2.5 0.0 0.0
Kandy 15yrs 140 99.3 6.0 0.7 0.0 0.0 0.0 0.0 0.0 0.0 0.0 0.0 0.0 0.0 0.0
35-44yrs 136 68.4 5.2 22.1 0.5 8.8 0.1 0.7 0.0 0.0 0.0 0.0 0.2 0.0 0.0
65-74yrs 134 22.4 2.2 26.1 0.8 27.6 0.5 4.5 0.1 1.5 0.0 17.2 2.3 0.7 0.1
Matale 15yrs 40 100.0 6.0 0.0 0.0 0.0 0.0 0.0 0.0 0.0 0.0 0.0 0.0 0.0 0.0
35-44yrs 40 60.0 4.8 32.5 0.9 5.0 0.2 2.5 0.0 0.0 0.0 0.0 0.1 0.0 0.0
65-74yrs 39 17.9 2.1 25.6 0.9 28.2 0.7 10.3 0.1 2.6 0.0 15.4 2.1 0.0 0.0
Nuwara-Eliya 15yrs 100 99.0 5.9 1.0 0.1 0.0 0.0 0.0 0.0 0.0 0.0 0.0 0.0 0.0 0.0
35-44yrs 99 61.6 4.9 31.3 0.9 6.1 0.1 1.0 0.0 0.0 0.0 0.0 0.1 0.0 0.0
65-74yrs 98 18.4 1.6 30.6 1.2 20.4 0.4 11.2 0.2 0.0 0.0 19.4 2.7 0.0 0.0
Galle 15yrs 100 100.0 6.0 0.0 0.0 0.0 0.0 0.0 0.0 0.0 0.0 0.0 0.0 0.0 0.0
35-44yrs 99 79.8 5.5 15.2 0.3 4.0 0.1 1.0 0.0 0.0 0.0 0.0 0.2 0.0 0.0
65-74yrs 100 25.0 2.1 20.0 0.6 23.0 0.6 7.0 0.1 4.0 0.1 21.0 2.5 0.0 0.0
Matara 15yrs 80 100.0 6.0 0.0 0.0 0.0 0.0 0.0 0.0 0.0 0.0 0.0 0.0 0.0 0.0
35-44yrs 79 77.2 5.4 19.0 0.5 3.8 0.0 0.0 0.0 0.0 0.0 0.0 0.1 0.0 0.0
65-74yrs 79 11.4 1.8 54.4 2.2 21.5 0.3 0.0 0.0 0.0 0.0 12.7 1.6 0.0 0.0
Hambantota 15yrs 60 100.0 6.0 0.0 0.0 0.0 0.0 0.0 0.0 0.0 0.0 0.0 0.0 0.0 0.0
35-44yrs 59 86.4 5.7 8.5 0.2 3.4 0.0 1.7 0.0 0.0 0.0 0.0 0.0 0.0 0.0
65-74yrs 60 21.7 2.4 31.7 1.2 20.0 0.4 5.0 0.1 3.3 0.1 13.3 1.6 5.0 0.4
Jaffna 15yrs 60 95.0 5.9 5.0 0.1 0.0 0.0 0.0 0.0 0.0 0.0 0.0 0.1 0.0 0.0
35-44yrs 60 70.0 5.2 18.3 0.5 6.7 0.1 1.7 0.0 0.0 0.0 1.7 0.2 1.7 0.1
65-74yrs 59 27.1 2.7 20.3 0.8 22.0 0.6 15.3 0.4 3.4 0.1 11.9 1.4 0.0 0.0
Kilinochchi 15yrs 20 100.0 6.0 0.0 0.0 0.0 0.0 0.0 0.0 0.0 0.0 0.0 0.0 0.0 0.0
35-44yrs 20 75.0 5.7 10.0 0.1 5.0 0.1 10.0 0.1 0.0 0.0 0.0 0.1 0.0 0.0
65-74yrs 20 10.0 1.9 20.0 1.2 30.0 1.0 15.0 0.3 15.0 0.2 10.0 1.5 0.0 0.0
Mannar 15yrs 20 100.0 6.0 0.0 0.0 0.0 0.0 0.0 0.0 0.0 0.0 0.0 0.0 0.0 0.0
35-44yrs 20 70.0 5.0 30.0 1.1 0.0 0.0 0.0 0.0 0.0 0.0 0.0 0.0 0.0 0.0
65-74yrs 20 25.0 2.3 45.0 2.1 25.0 0.6 0.0 0.0 0.0 0.0 5.0 1.1 0.0 0.0
Mullaitivu 15yrs 20 100.0 6.0 0.0 0.0 0.0 0.0 0.0 0.0 0.0 0.0 0.0 0.0 0.0 0.0
35-44yrs 21 71.4 5.4 28.6 0.5 0.0 0.0 0.0 0.0 0.0 0.0 0.0 0.0 0.0 0.0
65-74yrs 20 35.0 1.9 20.0 1.0 10.0 0.5 10.0 0.2 0.0 0.0 25.0 2.6 0.0 0.0
Dis
tric
t-b
ased
re
sult
s
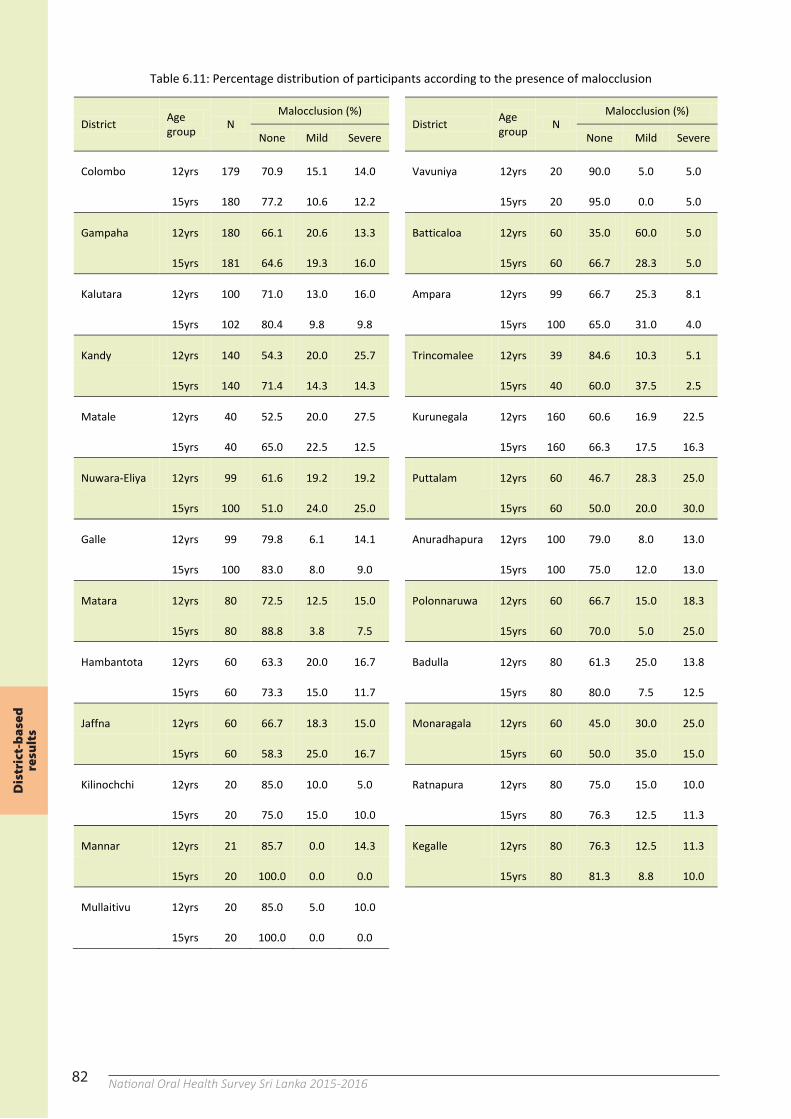
82 National Oral Health Survey Sri Lanka 2015-201682
Table 6.11: Percentage distribution of participants according to the presence of malocclusion
District Age group N
Malocclusion (%) District Age group N
Malocclusion (%)
None Mild Severe None Mild Severe
Colombo 12yrs 179 70.9 15.1 14.0 Vavuniya 12yrs 20 90.0 5.0 5.0
15yrs 180 77.2 10.6 12.2 15yrs 20 95.0 0.0 5.0
Gampaha 12yrs 180 66.1 20.6 13.3 Batticaloa 12yrs 60 35.0 60.0 5.0
15yrs 181 64.6 19.3 16.0 15yrs 60 66.7 28.3 5.0
Kalutara 12yrs 100 71.0 13.0 16.0 Ampara 12yrs 99 66.7 25.3 8.1
15yrs 102 80.4 9.8 9.8 15yrs 100 65.0 31.0 4.0
Kandy 12yrs 140 54.3 20.0 25.7 Trincomalee 12yrs 39 84.6 10.3 5.1
15yrs 140 71.4 14.3 14.3 15yrs 40 60.0 37.5 2.5
Matale 12yrs 40 52.5 20.0 27.5 Kurunegala 12yrs 160 60.6 16.9 22.5
15yrs 40 65.0 22.5 12.5 15yrs 160 66.3 17.5 16.3
Nuwara-Eliya 12yrs 99 61.6 19.2 19.2 Puttalam 12yrs 60 46.7 28.3 25.0
15yrs 100 51.0 24.0 25.0 15yrs 60 50.0 20.0 30.0
Galle 12yrs 99 79.8 6.1 14.1 Anuradhapura 12yrs 100 79.0 8.0 13.0
15yrs 100 83.0 8.0 9.0 15yrs 100 75.0 12.0 13.0
Matara 12yrs 80 72.5 12.5 15.0 Polonnaruwa 12yrs 60 66.7 15.0 18.3
15yrs 80 88.8 3.8 7.5 15yrs 60 70.0 5.0 25.0
Hambantota 12yrs 60 63.3 20.0 16.7 Badulla 12yrs 80 61.3 25.0 13.8
15yrs 60 73.3 15.0 11.7 15yrs 80 80.0 7.5 12.5
Jaffna 12yrs 60 66.7 18.3 15.0 Monaragala 12yrs 60 45.0 30.0 25.0
15yrs 60 58.3 25.0 16.7 15yrs 60 50.0 35.0 15.0
Kilinochchi 12yrs 20 85.0 10.0 5.0 Ratnapura 12yrs 80 75.0 15.0 10.0
15yrs 20 75.0 15.0 10.0 15yrs 80 76.3 12.5 11.3
Mannar 12yrs 21 85.7 0.0 14.3 Kegalle 12yrs 80 76.3 12.5 11.3
15yrs 20 100.0 0.0 0.0 15yrs 80 81.3 8.8 10.0
Mullaitivu 12yrs 20 85.0 5.0 10.0
15yrs 20 100.0 0.0 0.0
83
Table 6.12: Percentage distribution of participants according to the presence of enamel fluorosis
District Age group
Enamel fluorosis (%)
N Normal Questi- onable
Very mild Mild Mode-
rate Severe Not recorded
Colombo 12yrs 179 99.4 0.0 0.6 0.0 0.0 0.0 0.0
15yrs 180 99.4 0.0 0.0 0.6 0.0 0.0 0.0
35-44yrs 178 100.0 0.0 0.0 0.0 0.0 0.0 0.0
Gampaha 12yrs 180 98.9 0.6 0.0 0.6 0.0 0.0 0.0
15yrs 181 99.4 0.6 0.0 0.0 0.0 0.0 0.0
35-44yrs 177 99.4 0.0 0.0 0.0 0.0 0.6 0.0
Kalutara 12yrs 100 100.0 0.0 0.0 0.0 0.0 0.0 0.0
15yrs 102 100.0 0.0 0.0 0.0 0.0 0.0 0.0
35-44yrs 100 100.0 0.0 0.0 0.0 0.0 0.0 0.0
Kandy 12yrs 140 97.1 0.0 2.9 0.0 0.0 0.0 0.0
15yrs 140 98.6 1.4 0.0 0.0 0.0 0.0 0.0
35-44yrs 136 97.1 0.0 0.0 1.5 0.0 0.0 1.5
Matale 12yrs 40 95.0 0.0 2.5 2.5 0.0 0.0 0.0
15yrs 40 95.0 2.5 2.5 0.0 0.0 0.0 0.0
35-44yrs 40 95.0 2.5 2.5 0.0 0.0 0.0 0.0
Nuwara-Eliya 12yrs 99 91.9 4.0 2.0 1.0 1.0 0.0 0.0
15yrs 100 92.0 4.0 4.0 0.0 0.0 0.0 0.0
35-44yrs 99 98.0 2.0 0.0 0.0 0.0 0.0 0.0
Galle 12yrs 99 100.0 0.0 0.0 0.0 0.0 0.0 0.0
15yrs 100 99.0 1.0 0.0 0.0 0.0 0.0 0.0
35-44yrs 99 100.0 0.0 0.0 0.0 0.0 0.0 0.0
Matara 12yrs 80 97.5 1.3 0.0 1.3 0.0 0.0 0.0
15yrs 80 100.0 0.0 0.0 0.0 0.0 0.0 0.0
35-44yrs 79 100.0 0.0 0.0 0.0 0.0 0.0 0.0
Hambantota 12yrs 60 65.0 11.7 10.0 13.3 0.0 0.0 0.0
15yrs 60 80.0 10.0 8.3 1.7 0.0 0.0 0.0
35-44yrs 59 89.8 3.4 3.4 3.4 0.0 0.0 0.0
Jaffna 12yrs 60 83.3 10.0 5.0 1.7 0.0 0.0 0.0
15yrs 60 85.0 1.7 5.0 6.7 1.7 0.0 0.0
35-44yrs 60 100.0 0.0 0.0 0.0 0.0 0.0 0.0
Kilinochchi 12yrs 20 95.0 5.0 0.0 0.0 0.0 0.0 0.0
15yrs 20 95.0 0.0 5.0 0.0 0.0 0.0 0.0
35-44yrs 20 95.0 0.0 0.0 5.0 0.0 0.0 0.0
Mannar 12yrs 21 100.0 0.0 0.0 0.0 0.0 0.0 0.0
15yrs 20 100.0 0.0 0.0 0.0 0.0 0.0 0.0
35-44yrs 20 100.0 0.0 0.0 0.0 0.0 0.0 0.0
Mullaitivu 12yrs 20 40.0 0.0 10.0 30.0 20.0 0.0 0.0
15yrs 20 40.0 25.0 5.0 25.0 5.0 0.0 0.0
35-44yrs 21 90.5 0.0 0.0 9.5 0.0 0.0 0.0
82
Table 6.11: Percentage distribution of participants according to the presence of malocclusion
District Age group N
Malocclusion (%) District Age group N
Malocclusion (%)
None Mild Severe None Mild Severe
Colombo 12yrs 179 70.9 15.1 14.0 Vavuniya 12yrs 20 90.0 5.0 5.0
15yrs 180 77.2 10.6 12.2 15yrs 20 95.0 0.0 5.0
Gampaha 12yrs 180 66.1 20.6 13.3 Batticaloa 12yrs 60 35.0 60.0 5.0
15yrs 181 64.6 19.3 16.0 15yrs 60 66.7 28.3 5.0
Kalutara 12yrs 100 71.0 13.0 16.0 Ampara 12yrs 99 66.7 25.3 8.1
15yrs 102 80.4 9.8 9.8 15yrs 100 65.0 31.0 4.0
Kandy 12yrs 140 54.3 20.0 25.7 Trincomalee 12yrs 39 84.6 10.3 5.1
15yrs 140 71.4 14.3 14.3 15yrs 40 60.0 37.5 2.5
Matale 12yrs 40 52.5 20.0 27.5 Kurunegala 12yrs 160 60.6 16.9 22.5
15yrs 40 65.0 22.5 12.5 15yrs 160 66.3 17.5 16.3
Nuwara-Eliya 12yrs 99 61.6 19.2 19.2 Puttalam 12yrs 60 46.7 28.3 25.0
15yrs 100 51.0 24.0 25.0 15yrs 60 50.0 20.0 30.0
Galle 12yrs 99 79.8 6.1 14.1 Anuradhapura 12yrs 100 79.0 8.0 13.0
15yrs 100 83.0 8.0 9.0 15yrs 100 75.0 12.0 13.0
Matara 12yrs 80 72.5 12.5 15.0 Polonnaruwa 12yrs 60 66.7 15.0 18.3
15yrs 80 88.8 3.8 7.5 15yrs 60 70.0 5.0 25.0
Hambantota 12yrs 60 63.3 20.0 16.7 Badulla 12yrs 80 61.3 25.0 13.8
15yrs 60 73.3 15.0 11.7 15yrs 80 80.0 7.5 12.5
Jaffna 12yrs 60 66.7 18.3 15.0 Monaragala 12yrs 60 45.0 30.0 25.0
15yrs 60 58.3 25.0 16.7 15yrs 60 50.0 35.0 15.0
Kilinochchi 12yrs 20 85.0 10.0 5.0 Ratnapura 12yrs 80 75.0 15.0 10.0
15yrs 20 75.0 15.0 10.0 15yrs 80 76.3 12.5 11.3
Mannar 12yrs 21 85.7 0.0 14.3 Kegalle 12yrs 80 76.3 12.5 11.3
15yrs 20 100.0 0.0 0.0 15yrs 80 81.3 8.8 10.0
Mullaitivu 12yrs 20 85.0 5.0 10.0
15yrs 20 100.0 0.0 0.0
Dis
tric
t-b
ased
re
sult
s
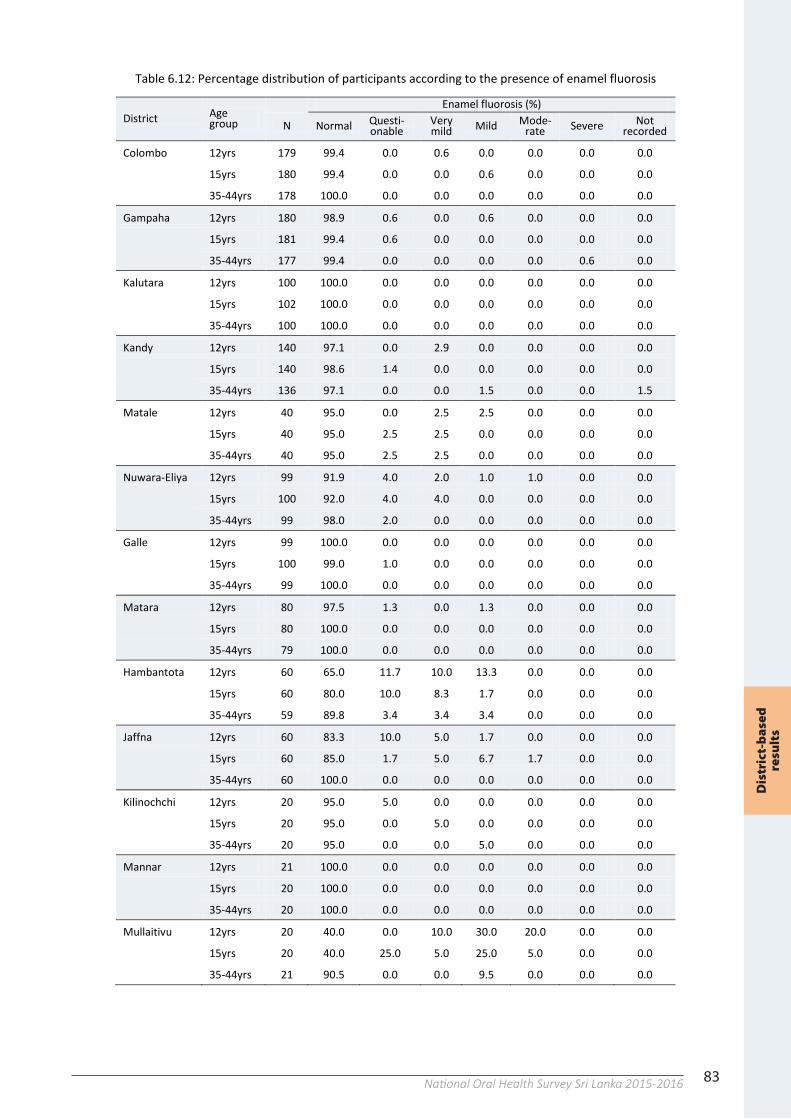
83National Oral Health Survey Sri Lanka 2015-201683
Table 6.12: Percentage distribution of participants according to the presence of enamel fluorosis
District Age group
Enamel fluorosis (%)
N Normal Questi- onable
Very mild Mild Mode-
rate Severe Not recorded
Colombo 12yrs 179 99.4 0.0 0.6 0.0 0.0 0.0 0.0
15yrs 180 99.4 0.0 0.0 0.6 0.0 0.0 0.0
35-44yrs 178 100.0 0.0 0.0 0.0 0.0 0.0 0.0
Gampaha 12yrs 180 98.9 0.6 0.0 0.6 0.0 0.0 0.0
15yrs 181 99.4 0.6 0.0 0.0 0.0 0.0 0.0
35-44yrs 177 99.4 0.0 0.0 0.0 0.0 0.6 0.0
Kalutara 12yrs 100 100.0 0.0 0.0 0.0 0.0 0.0 0.0
15yrs 102 100.0 0.0 0.0 0.0 0.0 0.0 0.0
35-44yrs 100 100.0 0.0 0.0 0.0 0.0 0.0 0.0
Kandy 12yrs 140 97.1 0.0 2.9 0.0 0.0 0.0 0.0
15yrs 140 98.6 1.4 0.0 0.0 0.0 0.0 0.0
35-44yrs 136 97.1 0.0 0.0 1.5 0.0 0.0 1.5
Matale 12yrs 40 95.0 0.0 2.5 2.5 0.0 0.0 0.0
15yrs 40 95.0 2.5 2.5 0.0 0.0 0.0 0.0
35-44yrs 40 95.0 2.5 2.5 0.0 0.0 0.0 0.0
Nuwara-Eliya 12yrs 99 91.9 4.0 2.0 1.0 1.0 0.0 0.0
15yrs 100 92.0 4.0 4.0 0.0 0.0 0.0 0.0
35-44yrs 99 98.0 2.0 0.0 0.0 0.0 0.0 0.0
Galle 12yrs 99 100.0 0.0 0.0 0.0 0.0 0.0 0.0
15yrs 100 99.0 1.0 0.0 0.0 0.0 0.0 0.0
35-44yrs 99 100.0 0.0 0.0 0.0 0.0 0.0 0.0
Matara 12yrs 80 97.5 1.3 0.0 1.3 0.0 0.0 0.0
15yrs 80 100.0 0.0 0.0 0.0 0.0 0.0 0.0
35-44yrs 79 100.0 0.0 0.0 0.0 0.0 0.0 0.0
Hambantota 12yrs 60 65.0 11.7 10.0 13.3 0.0 0.0 0.0
15yrs 60 80.0 10.0 8.3 1.7 0.0 0.0 0.0
35-44yrs 59 89.8 3.4 3.4 3.4 0.0 0.0 0.0
Jaffna 12yrs 60 83.3 10.0 5.0 1.7 0.0 0.0 0.0
15yrs 60 85.0 1.7 5.0 6.7 1.7 0.0 0.0
35-44yrs 60 100.0 0.0 0.0 0.0 0.0 0.0 0.0
Kilinochchi 12yrs 20 95.0 5.0 0.0 0.0 0.0 0.0 0.0
15yrs 20 95.0 0.0 5.0 0.0 0.0 0.0 0.0
35-44yrs 20 95.0 0.0 0.0 5.0 0.0 0.0 0.0
Mannar 12yrs 21 100.0 0.0 0.0 0.0 0.0 0.0 0.0
15yrs 20 100.0 0.0 0.0 0.0 0.0 0.0 0.0
35-44yrs 20 100.0 0.0 0.0 0.0 0.0 0.0 0.0
Mullaitivu 12yrs 20 40.0 0.0 10.0 30.0 20.0 0.0 0.0
15yrs 20 40.0 25.0 5.0 25.0 5.0 0.0 0.0
35-44yrs 21 90.5 0.0 0.0 9.5 0.0 0.0 0.0
82
Table 6.11: Percentage distribution of participants according to the presence of malocclusion
District Age group N
Malocclusion (%) District Age group N
Malocclusion (%)
None Mild Severe None Mild Severe
Colombo 12yrs 179 70.9 15.1 14.0 Vavuniya 12yrs 20 90.0 5.0 5.0
15yrs 180 77.2 10.6 12.2 15yrs 20 95.0 0.0 5.0
Gampaha 12yrs 180 66.1 20.6 13.3 Batticaloa 12yrs 60 35.0 60.0 5.0
15yrs 181 64.6 19.3 16.0 15yrs 60 66.7 28.3 5.0
Kalutara 12yrs 100 71.0 13.0 16.0 Ampara 12yrs 99 66.7 25.3 8.1
15yrs 102 80.4 9.8 9.8 15yrs 100 65.0 31.0 4.0
Kandy 12yrs 140 54.3 20.0 25.7 Trincomalee 12yrs 39 84.6 10.3 5.1
15yrs 140 71.4 14.3 14.3 15yrs 40 60.0 37.5 2.5
Matale 12yrs 40 52.5 20.0 27.5 Kurunegala 12yrs 160 60.6 16.9 22.5
15yrs 40 65.0 22.5 12.5 15yrs 160 66.3 17.5 16.3
Nuwara-Eliya 12yrs 99 61.6 19.2 19.2 Puttalam 12yrs 60 46.7 28.3 25.0
15yrs 100 51.0 24.0 25.0 15yrs 60 50.0 20.0 30.0
Galle 12yrs 99 79.8 6.1 14.1 Anuradhapura 12yrs 100 79.0 8.0 13.0
15yrs 100 83.0 8.0 9.0 15yrs 100 75.0 12.0 13.0
Matara 12yrs 80 72.5 12.5 15.0 Polonnaruwa 12yrs 60 66.7 15.0 18.3
15yrs 80 88.8 3.8 7.5 15yrs 60 70.0 5.0 25.0
Hambantota 12yrs 60 63.3 20.0 16.7 Badulla 12yrs 80 61.3 25.0 13.8
15yrs 60 73.3 15.0 11.7 15yrs 80 80.0 7.5 12.5
Jaffna 12yrs 60 66.7 18.3 15.0 Monaragala 12yrs 60 45.0 30.0 25.0
15yrs 60 58.3 25.0 16.7 15yrs 60 50.0 35.0 15.0
Kilinochchi 12yrs 20 85.0 10.0 5.0 Ratnapura 12yrs 80 75.0 15.0 10.0
15yrs 20 75.0 15.0 10.0 15yrs 80 76.3 12.5 11.3
Mannar 12yrs 21 85.7 0.0 14.3 Kegalle 12yrs 80 76.3 12.5 11.3
15yrs 20 100.0 0.0 0.0 15yrs 80 81.3 8.8 10.0
Mullaitivu 12yrs 20 85.0 5.0 10.0
15yrs 20 100.0 0.0 0.0
Dis
tric
t-b
ased
re
sult
s
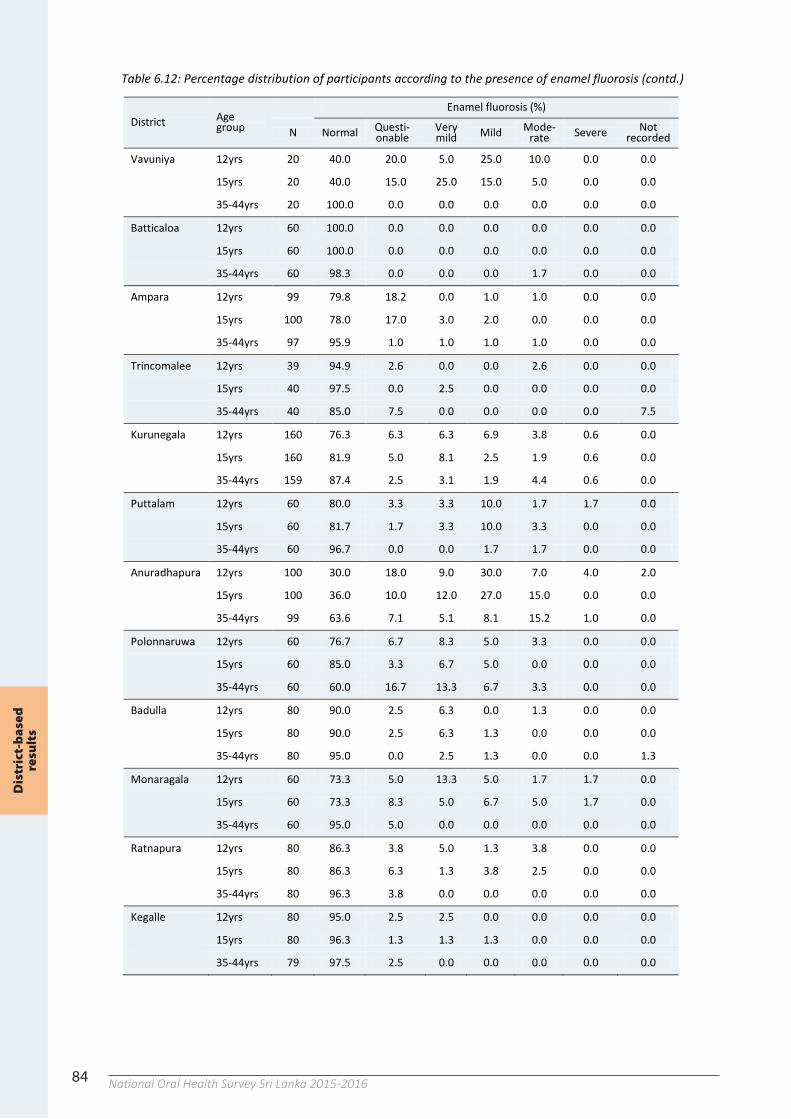
84 National Oral Health Survey Sri Lanka 2015-201684
Table 6.12: Percentage distribution of participants according to the presence of enamel fluorosis (contd.)
District Age group
Enamel fluorosis (%)
N Normal Questi- onable
Very mild Mild Mode-
rate Severe Not recorded
Vavuniya 12yrs 20 40.0 20.0 5.0 25.0 10.0 0.0 0.0
15yrs 20 40.0 15.0 25.0 15.0 5.0 0.0 0.0
35-44yrs 20 100.0 0.0 0.0 0.0 0.0 0.0 0.0
Batticaloa 12yrs 60 100.0 0.0 0.0 0.0 0.0 0.0 0.0
15yrs 60 100.0 0.0 0.0 0.0 0.0 0.0 0.0
35-44yrs 60 98.3 0.0 0.0 0.0 1.7 0.0 0.0
Ampara 12yrs 99 79.8 18.2 0.0 1.0 1.0 0.0 0.0
15yrs 100 78.0 17.0 3.0 2.0 0.0 0.0 0.0
35-44yrs 97 95.9 1.0 1.0 1.0 1.0 0.0 0.0
Trincomalee 12yrs 39 94.9 2.6 0.0 0.0 2.6 0.0 0.0
15yrs 40 97.5 0.0 2.5 0.0 0.0 0.0 0.0
35-44yrs 40 85.0 7.5 0.0 0.0 0.0 0.0 7.5
Kurunegala 12yrs 160 76.3 6.3 6.3 6.9 3.8 0.6 0.0
15yrs 160 81.9 5.0 8.1 2.5 1.9 0.6 0.0
35-44yrs 159 87.4 2.5 3.1 1.9 4.4 0.6 0.0
Puttalam 12yrs 60 80.0 3.3 3.3 10.0 1.7 1.7 0.0
15yrs 60 81.7 1.7 3.3 10.0 3.3 0.0 0.0
35-44yrs 60 96.7 0.0 0.0 1.7 1.7 0.0 0.0
Anuradhapura 12yrs 100 30.0 18.0 9.0 30.0 7.0 4.0 2.0
15yrs 100 36.0 10.0 12.0 27.0 15.0 0.0 0.0
35-44yrs 99 63.6 7.1 5.1 8.1 15.2 1.0 0.0
Polonnaruwa 12yrs 60 76.7 6.7 8.3 5.0 3.3 0.0 0.0
15yrs 60 85.0 3.3 6.7 5.0 0.0 0.0 0.0
35-44yrs 60 60.0 16.7 13.3 6.7 3.3 0.0 0.0
Badulla 12yrs 80 90.0 2.5 6.3 0.0 1.3 0.0 0.0
15yrs 80 90.0 2.5 6.3 1.3 0.0 0.0 0.0
35-44yrs 80 95.0 0.0 2.5 1.3 0.0 0.0 1.3
Monaragala 12yrs 60 73.3 5.0 13.3 5.0 1.7 1.7 0.0
15yrs 60 73.3 8.3 5.0 6.7 5.0 1.7 0.0
35-44yrs 60 95.0 5.0 0.0 0.0 0.0 0.0 0.0
Ratnapura 12yrs 80 86.3 3.8 5.0 1.3 3.8 0.0 0.0
15yrs 80 86.3 6.3 1.3 3.8 2.5 0.0 0.0
35-44yrs 80 96.3 3.8 0.0 0.0 0.0 0.0 0.0
Kegalle 12yrs 80 95.0 2.5 2.5 0.0 0.0 0.0 0.0
15yrs 80 96.3 1.3 1.3 1.3 0.0 0.0 0.0
35-44yrs 79 97.5 2.5 0.0 0.0 0.0 0.0 0.0
Dis
tric
t-b
ased
re
sult
s
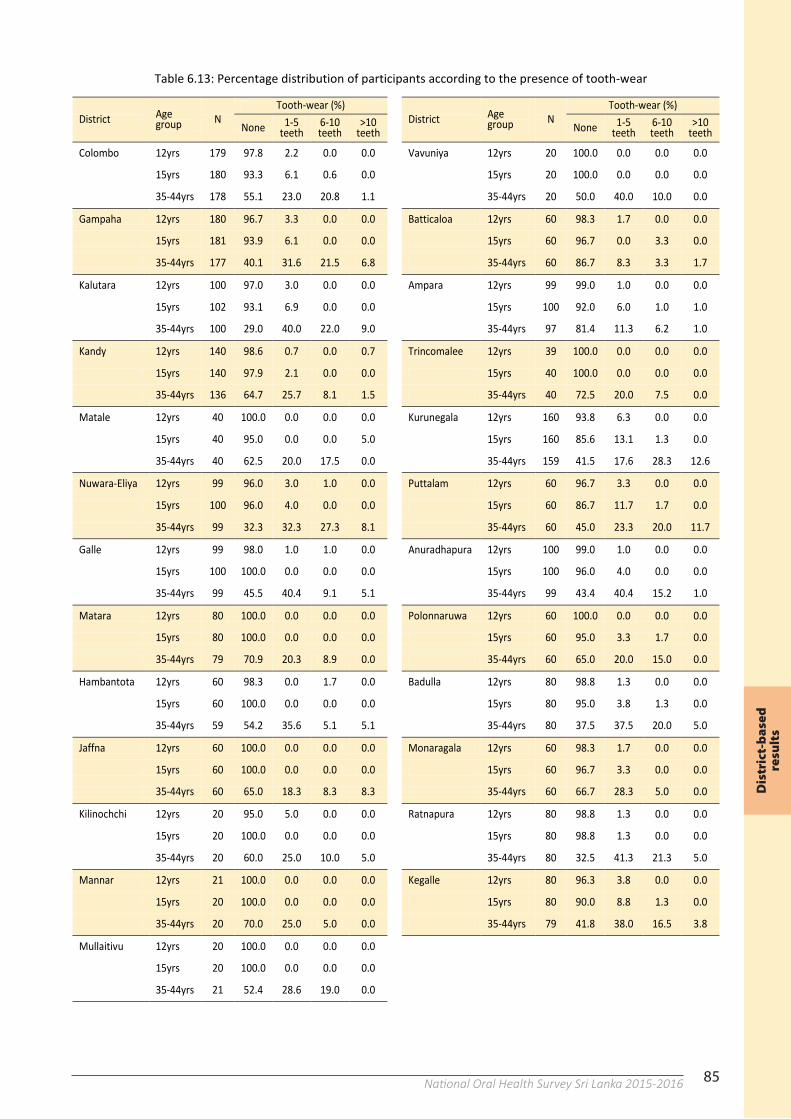
85National Oral Health Survey Sri Lanka 2015-201684
Table 6.12: Percentage distribution of participants according to the presence of enamel fluorosis (contd.)
District Age group
Enamel fluorosis (%)
N Normal Questi- onable
Very mild Mild Mode-
rate Severe Not recorded
Vavuniya 12yrs 20 40.0 20.0 5.0 25.0 10.0 0.0 0.0
15yrs 20 40.0 15.0 25.0 15.0 5.0 0.0 0.0
35-44yrs 20 100.0 0.0 0.0 0.0 0.0 0.0 0.0
Batticaloa 12yrs 60 100.0 0.0 0.0 0.0 0.0 0.0 0.0
15yrs 60 100.0 0.0 0.0 0.0 0.0 0.0 0.0
35-44yrs 60 98.3 0.0 0.0 0.0 1.7 0.0 0.0
Ampara 12yrs 99 79.8 18.2 0.0 1.0 1.0 0.0 0.0
15yrs 100 78.0 17.0 3.0 2.0 0.0 0.0 0.0
35-44yrs 97 95.9 1.0 1.0 1.0 1.0 0.0 0.0
Trincomalee 12yrs 39 94.9 2.6 0.0 0.0 2.6 0.0 0.0
15yrs 40 97.5 0.0 2.5 0.0 0.0 0.0 0.0
35-44yrs 40 85.0 7.5 0.0 0.0 0.0 0.0 7.5
Kurunegala 12yrs 160 76.3 6.3 6.3 6.9 3.8 0.6 0.0
15yrs 160 81.9 5.0 8.1 2.5 1.9 0.6 0.0
35-44yrs 159 87.4 2.5 3.1 1.9 4.4 0.6 0.0
Puttalam 12yrs 60 80.0 3.3 3.3 10.0 1.7 1.7 0.0
15yrs 60 81.7 1.7 3.3 10.0 3.3 0.0 0.0
35-44yrs 60 96.7 0.0 0.0 1.7 1.7 0.0 0.0
Anuradhapura 12yrs 100 30.0 18.0 9.0 30.0 7.0 4.0 2.0
15yrs 100 36.0 10.0 12.0 27.0 15.0 0.0 0.0
35-44yrs 99 63.6 7.1 5.1 8.1 15.2 1.0 0.0
Polonnaruwa 12yrs 60 76.7 6.7 8.3 5.0 3.3 0.0 0.0
15yrs 60 85.0 3.3 6.7 5.0 0.0 0.0 0.0
35-44yrs 60 60.0 16.7 13.3 6.7 3.3 0.0 0.0
Badulla 12yrs 80 90.0 2.5 6.3 0.0 1.3 0.0 0.0
15yrs 80 90.0 2.5 6.3 1.3 0.0 0.0 0.0
35-44yrs 80 95.0 0.0 2.5 1.3 0.0 0.0 1.3
Monaragala 12yrs 60 73.3 5.0 13.3 5.0 1.7 1.7 0.0
15yrs 60 73.3 8.3 5.0 6.7 5.0 1.7 0.0
35-44yrs 60 95.0 5.0 0.0 0.0 0.0 0.0 0.0
Ratnapura 12yrs 80 86.3 3.8 5.0 1.3 3.8 0.0 0.0
15yrs 80 86.3 6.3 1.3 3.8 2.5 0.0 0.0
35-44yrs 80 96.3 3.8 0.0 0.0 0.0 0.0 0.0
Kegalle 12yrs 80 95.0 2.5 2.5 0.0 0.0 0.0 0.0
15yrs 80 96.3 1.3 1.3 1.3 0.0 0.0 0.0
35-44yrs 79 97.5 2.5 0.0 0.0 0.0 0.0 0.0
85
Table 6.13: Percentage distribution of participants according to the presence of tooth-wear
District Age group N
Tooth-wear (%) District Age
group N Tooth-wear (%)
None 1-5 teeth
6-10 teeth
>10 teeth
None 1-5
teeth 6-10 teeth
>10 teeth
Colombo 12yrs 179 97.8 2.2 0.0 0.0 Vavuniya 12yrs 20 100.0 0.0 0.0 0.0
15yrs 180 93.3 6.1 0.6 0.0 15yrs 20 100.0 0.0 0.0 0.0
35-44yrs 178 55.1 23.0 20.8 1.1 35-44yrs 20 50.0 40.0 10.0 0.0
Gampaha 12yrs 180 96.7 3.3 0.0 0.0 Batticaloa 12yrs 60 98.3 1.7 0.0 0.0
15yrs 181 93.9 6.1 0.0 0.0 15yrs 60 96.7 0.0 3.3 0.0
35-44yrs 177 40.1 31.6 21.5 6.8 35-44yrs 60 86.7 8.3 3.3 1.7
Kalutara 12yrs 100 97.0 3.0 0.0 0.0 Ampara 12yrs 99 99.0 1.0 0.0 0.0
15yrs 102 93.1 6.9 0.0 0.0 15yrs 100 92.0 6.0 1.0 1.0
35-44yrs 100 29.0 40.0 22.0 9.0 35-44yrs 97 81.4 11.3 6.2 1.0
Kandy 12yrs 140 98.6 0.7 0.0 0.7 Trincomalee 12yrs 39 100.0 0.0 0.0 0.0
15yrs 140 97.9 2.1 0.0 0.0 15yrs 40 100.0 0.0 0.0 0.0
35-44yrs 136 64.7 25.7 8.1 1.5 35-44yrs 40 72.5 20.0 7.5 0.0
Matale 12yrs 40 100.0 0.0 0.0 0.0 Kurunegala 12yrs 160 93.8 6.3 0.0 0.0
15yrs 40 95.0 0.0 0.0 5.0 15yrs 160 85.6 13.1 1.3 0.0
35-44yrs 40 62.5 20.0 17.5 0.0 35-44yrs 159 41.5 17.6 28.3 12.6
Nuwara-Eliya 12yrs 99 96.0 3.0 1.0 0.0 Puttalam 12yrs 60 96.7 3.3 0.0 0.0
15yrs 100 96.0 4.0 0.0 0.0 15yrs 60 86.7 11.7 1.7 0.0
35-44yrs 99 32.3 32.3 27.3 8.1 35-44yrs 60 45.0 23.3 20.0 11.7
Galle 12yrs 99 98.0 1.0 1.0 0.0 Anuradhapura 12yrs 100 99.0 1.0 0.0 0.0
15yrs 100 100.0 0.0 0.0 0.0 15yrs 100 96.0 4.0 0.0 0.0
35-44yrs 99 45.5 40.4 9.1 5.1 35-44yrs 99 43.4 40.4 15.2 1.0
Matara 12yrs 80 100.0 0.0 0.0 0.0 Polonnaruwa 12yrs 60 100.0 0.0 0.0 0.0
15yrs 80 100.0 0.0 0.0 0.0 15yrs 60 95.0 3.3 1.7 0.0
35-44yrs 79 70.9 20.3 8.9 0.0 35-44yrs 60 65.0 20.0 15.0 0.0
Hambantota 12yrs 60 98.3 0.0 1.7 0.0 Badulla 12yrs 80 98.8 1.3 0.0 0.0
15yrs 60 100.0 0.0 0.0 0.0 15yrs 80 95.0 3.8 1.3 0.0
35-44yrs 59 54.2 35.6 5.1 5.1 35-44yrs 80 37.5 37.5 20.0 5.0
Jaffna 12yrs 60 100.0 0.0 0.0 0.0 Monaragala 12yrs 60 98.3 1.7 0.0 0.0
15yrs 60 100.0 0.0 0.0 0.0 15yrs 60 96.7 3.3 0.0 0.0
35-44yrs 60 65.0 18.3 8.3 8.3 35-44yrs 60 66.7 28.3 5.0 0.0
Kilinochchi 12yrs 20 95.0 5.0 0.0 0.0 Ratnapura 12yrs 80 98.8 1.3 0.0 0.0
15yrs 20 100.0 0.0 0.0 0.0 15yrs 80 98.8 1.3 0.0 0.0
35-44yrs 20 60.0 25.0 10.0 5.0 35-44yrs 80 32.5 41.3 21.3 5.0
Mannar 12yrs 21 100.0 0.0 0.0 0.0 Kegalle 12yrs 80 96.3 3.8 0.0 0.0
15yrs 20 100.0 0.0 0.0 0.0 15yrs 80 90.0 8.8 1.3 0.0
35-44yrs 20 70.0 25.0 5.0 0.0 35-44yrs 79 41.8 38.0 16.5 3.8
Mullaitivu 12yrs 20 100.0 0.0 0.0 0.0
15yrs 20 100.0 0.0 0.0 0.0
35-44yrs 21 52.4 28.6 19.0 0.0
Dis
tric
t-b
ased
re
sult
s
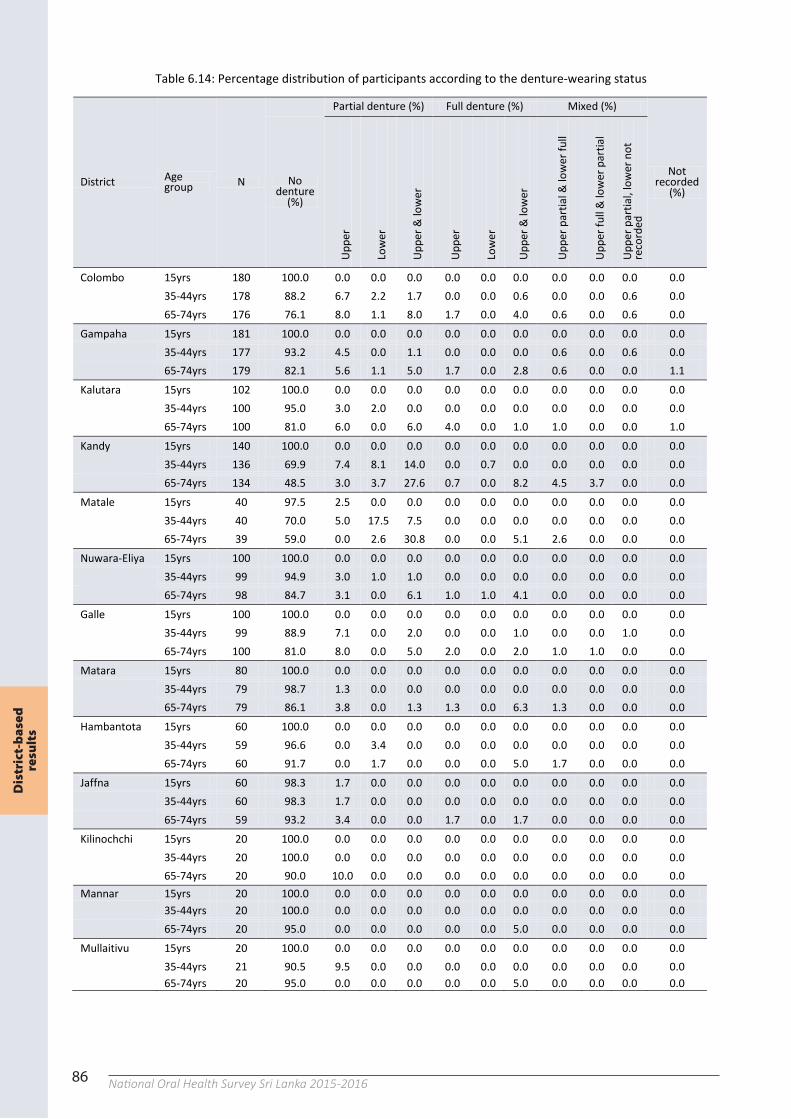
86 National Oral Health Survey Sri Lanka 2015-201686
Table 6.14: Percentage distribution of participants according to the denture-wearing status
District Age group N
Partial denture (%) Full denture (%) Mixed (%)
Not recorded
(%) No
denture (%)
Uppe
r
Low
er
Uppe
r & lo
wer
Uppe
r
Low
er
Uppe
r & lo
wer
Uppe
r par
tial &
low
er fu
ll
Uppe
r ful
l & lo
wer
par
tial
Uppe
r par
tial,
low
er n
ot
reco
rded
Colombo 15yrs 180 100.0 0.0 0.0 0.0 0.0 0.0 0.0 0.0 0.0 0.0 0.0
35-44yrs 178 88.2 6.7 2.2 1.7 0.0 0.0 0.6 0.0 0.0 0.6 0.0
65-74yrs 176 76.1 8.0 1.1 8.0 1.7 0.0 4.0 0.6 0.0 0.6 0.0 Gampaha 15yrs 181 100.0 0.0 0.0 0.0 0.0 0.0 0.0 0.0 0.0 0.0 0.0
35-44yrs 177 93.2 4.5 0.0 1.1 0.0 0.0 0.0 0.6 0.0 0.6 0.0
65-74yrs 179 82.1 5.6 1.1 5.0 1.7 0.0 2.8 0.6 0.0 0.0 1.1 Kalutara 15yrs 102 100.0 0.0 0.0 0.0 0.0 0.0 0.0 0.0 0.0 0.0 0.0
35-44yrs 100 95.0 3.0 2.0 0.0 0.0 0.0 0.0 0.0 0.0 0.0 0.0
65-74yrs 100 81.0 6.0 0.0 6.0 4.0 0.0 1.0 1.0 0.0 0.0 1.0 Kandy 15yrs 140 100.0 0.0 0.0 0.0 0.0 0.0 0.0 0.0 0.0 0.0 0.0
35-44yrs 136 69.9 7.4 8.1 14.0 0.0 0.7 0.0 0.0 0.0 0.0 0.0
65-74yrs 134 48.5 3.0 3.7 27.6 0.7 0.0 8.2 4.5 3.7 0.0 0.0 Matale 15yrs 40 97.5 2.5 0.0 0.0 0.0 0.0 0.0 0.0 0.0 0.0 0.0
35-44yrs 40 70.0 5.0 17.5 7.5 0.0 0.0 0.0 0.0 0.0 0.0 0.0
65-74yrs 39 59.0 0.0 2.6 30.8 0.0 0.0 5.1 2.6 0.0 0.0 0.0 Nuwara-Eliya 15yrs 100 100.0 0.0 0.0 0.0 0.0 0.0 0.0 0.0 0.0 0.0 0.0
35-44yrs 99 94.9 3.0 1.0 1.0 0.0 0.0 0.0 0.0 0.0 0.0 0.0
65-74yrs 98 84.7 3.1 0.0 6.1 1.0 1.0 4.1 0.0 0.0 0.0 0.0 Galle 15yrs 100 100.0 0.0 0.0 0.0 0.0 0.0 0.0 0.0 0.0 0.0 0.0
35-44yrs 99 88.9 7.1 0.0 2.0 0.0 0.0 1.0 0.0 0.0 1.0 0.0
65-74yrs 100 81.0 8.0 0.0 5.0 2.0 0.0 2.0 1.0 1.0 0.0 0.0 Matara 15yrs 80 100.0 0.0 0.0 0.0 0.0 0.0 0.0 0.0 0.0 0.0 0.0
35-44yrs 79 98.7 1.3 0.0 0.0 0.0 0.0 0.0 0.0 0.0 0.0 0.0
65-74yrs 79 86.1 3.8 0.0 1.3 1.3 0.0 6.3 1.3 0.0 0.0 0.0 Hambantota 15yrs 60 100.0 0.0 0.0 0.0 0.0 0.0 0.0 0.0 0.0 0.0 0.0
35-44yrs 59 96.6 0.0 3.4 0.0 0.0 0.0 0.0 0.0 0.0 0.0 0.0
65-74yrs 60 91.7 0.0 1.7 0.0 0.0 0.0 5.0 1.7 0.0 0.0 0.0 Jaffna 15yrs 60 98.3 1.7 0.0 0.0 0.0 0.0 0.0 0.0 0.0 0.0 0.0
35-44yrs 60 98.3 1.7 0.0 0.0 0.0 0.0 0.0 0.0 0.0 0.0 0.0
65-74yrs 59 93.2 3.4 0.0 0.0 1.7 0.0 1.7 0.0 0.0 0.0 0.0 Kilinochchi 15yrs 20 100.0 0.0 0.0 0.0 0.0 0.0 0.0 0.0 0.0 0.0 0.0
35-44yrs 20 100.0 0.0 0.0 0.0 0.0 0.0 0.0 0.0 0.0 0.0 0.0
65-74yrs 20 90.0 10.0 0.0 0.0 0.0 0.0 0.0 0.0 0.0 0.0 0.0 Mannar 15yrs 20 100.0 0.0 0.0 0.0 0.0 0.0 0.0 0.0 0.0 0.0 0.0
35-44yrs 20 100.0 0.0 0.0 0.0 0.0 0.0 0.0 0.0 0.0 0.0 0.0
65-74yrs 20 95.0 0.0 0.0 0.0 0.0 0.0 5.0 0.0 0.0 0.0 0.0 Mullaitivu 15yrs 20 100.0 0.0 0.0 0.0 0.0 0.0 0.0 0.0 0.0 0.0 0.0
35-44yrs 21 90.5 9.5 0.0 0.0 0.0 0.0 0.0 0.0 0.0 0.0 0.0
65-74yrs 20 95.0 0.0 0.0 0.0 0.0 0.0 5.0 0.0 0.0 0.0 0.0
87
Table 6.14: Percentage distribution of participants according to the denture-wearing status (contd).
District Age group N
Partial denture (%) Full denture (%) Mixed (%)
Not recorded
(%) No
denture (%)
Uppe
r
Low
er
Uppe
r & lo
wer
Uppe
r
Low
er
Uppe
r & lo
wer
Uppe
r par
tial &
low
er fu
ll
Uppe
r ful
l & lo
wer
par
tial
Uppe
r par
tial,
low
er n
ot
reco
rded
Vavuniya 15yrs 20 100.0 0.0 0.0 0.0 0.0 0.0 0.0 0.0 0.0 0.0 0.0
35-44yrs 20 90.0 5.0 0.0 5.0 0.0 0.0 0.0 0.0 0.0 0.0 0.0
65-74yrs 19 94.7 5.3 0.0 0.0 0.0 0.0 0.0 0.0 0.0 0.0 0.0
Batticaloa 15yrs 60 100.0 0.0 0.0 0.0 0.0 0.0 0.0 0.0 0.0 0.0 0.0
35-44yrs 60 86.7 10.0 1.7 1.7 0.0 0.0 0.0 0.0 0.0 0.0 0.0
65-74yrs 58 91.4 1.7 0.0 3.4 3.4 0.0 0.0 0.0 0.0 0.0 0.0
Ampara 15yrs 100 100.0 0.0 0.0 0.0 0.0 0.0 0.0 0.0 0.0 0.0 0.0
35-44yrs 97 99.0 0.0 0.0 1.0 0.0 0.0 0.0 0.0 0.0 0.0 0.0
65-74yrs 95 86.3 7.4 0.0 3.2 1.1 0.0 1.1 0.0 0.0 1.1 0.0
Trincomalee 15yrs 40 100.0 0.0 0.0 0.0 0.0 0.0 0.0 0.0 0.0 0.0 0.0
35-44yrs 40 92.5 7.5 0.0 0.0 0.0 0.0 0.0 0.0 0.0 0.0 0.0
65-74yrs 39 89.7 5.1 2.6 0.0 0.0 0.0 2.6 0.0 0.0 0.0 0.0
Kurunegala 15yrs 160 100.0 0.0 0.0 0.0 0.0 0.0 0.0 0.0 0.0 0.0 0.0
35-44yrs 159 96.2 3.8 0.0 0.0 0.0 0.0 0.0 0.0 0.0 0.0 0.0
65-74yrs 160 85.0 9.4 0.0 1.3 2.5 0.0 1.9 0.0 0.0 0.0 0.0
Puttalam 15yrs 60 100.0 0.0 0.0 0.0 0.0 0.0 0.0 0.0 0.0 0.0 0.0
35-44yrs 60 96.7 1.7 0.0 1.7 0.0 0.0 0.0 0.0 0.0 0.0 0.0
65-74yrs 60 86.7 10.0 0.0 0.0 1.7 0.0 1.7 0.0 0.0 0.0 0.0
Anuradhapura 15yrs 100 100.0 0.0 0.0 0.0 0.0 0.0 0.0 0.0 0.0 0.0 0.0
35-44yrs 99 100.0 0.0 0.0 0.0 0.0 0.0 0.0 0.0 0.0 0.0 0.0
65-74yrs 97 85.6 6.2 1.0 5.2 1.0 0.0 1.0 0.0 0.0 0.0 0.0
Polonnaruwa 15yrs 60 100.0 0.0 0.0 0.0 0.0 0.0 0.0 0.0 0.0 0.0 0.0
35-44yrs 60 90.0 8.3 0.0 0.0 0.0 0.0 0.0 0.0 0.0 0.0 1.7
65-74yrs 59 94.9 5.1 0.0 0.0 0.0 0.0 0.0 0.0 0.0 0.0 0.0
Badulla 15yrs 80 100.0 0.0 0.0 0.0 0.0 0.0 0.0 0.0 0.0 0.0 0.0
35-44yrs 80 98.8 1.3 0.0 0.0 0.0 0.0 0.0 0.0 0.0 0.0 0.0
65-74yrs 74 87.8 2.7 0.0 1.4 4.1 0.0 2.7 0.0 1.4 0.0 0.0
Monaragala 15yrs 60 100.0 0.0 0.0 0.0 0.0 0.0 0.0 0.0 0.0 0.0 0.0
35-44yrs 60 96.7 1.7 0.0 1.7 0.0 0.0 0.0 0.0 0.0 0.0 0.0
65-74yrs 60 91.7 1.7 0.0 1.7 0.0 0.0 5.0 0.0 0.0 0.0 0.0
Ratnapura 15yrs 80 100.0 0.0 0.0 0.0 0.0 0.0 0.0 0.0 0.0 0.0 0.0
35-44yrs 80 88.8 8.8 0.0 2.5 0.0 0.0 0.0 0.0 0.0 0.0 0.0
65-74yrs 78 82.1 3.8 3.8 2.6 1.3 0.0 5.1 0.0 0.0 1.3 0.0
Kegalle 15yrs 80 100.0 0.0 0.0 0.0 0.0 0.0 0.0 0.0 0.0 0.0 0.0
35-44yrs 79 98.7 1.3 0.0 0.0 0.0 0.0 0.0 0.0 0.0 0.0 0.0
65-74yrs 76 86.8 3.9 0.0 3.9 2.6 0.0 2.6 0.0 0.0 0.0 0.0
86
Table 6.14: Percentage distribution of participants according to the denture-wearing status
District Age group N
Partial denture (%) Full denture (%) Mixed (%)
Not recorded
(%) No
denture (%)
Uppe
r
Low
er
Uppe
r & lo
wer
Uppe
r
Low
er
Uppe
r & lo
wer
Uppe
r par
tial &
low
er fu
ll
Uppe
r ful
l & lo
wer
par
tial
Uppe
r par
tial,
low
er n
ot
reco
rded
Colombo 15yrs 180 100.0 0.0 0.0 0.0 0.0 0.0 0.0 0.0 0.0 0.0 0.0
35-44yrs 178 88.2 6.7 2.2 1.7 0.0 0.0 0.6 0.0 0.0 0.6 0.0
65-74yrs 176 76.1 8.0 1.1 8.0 1.7 0.0 4.0 0.6 0.0 0.6 0.0 Gampaha 15yrs 181 100.0 0.0 0.0 0.0 0.0 0.0 0.0 0.0 0.0 0.0 0.0
35-44yrs 177 93.2 4.5 0.0 1.1 0.0 0.0 0.0 0.6 0.0 0.6 0.0
65-74yrs 179 82.1 5.6 1.1 5.0 1.7 0.0 2.8 0.6 0.0 0.0 1.1 Kalutara 15yrs 102 100.0 0.0 0.0 0.0 0.0 0.0 0.0 0.0 0.0 0.0 0.0
35-44yrs 100 95.0 3.0 2.0 0.0 0.0 0.0 0.0 0.0 0.0 0.0 0.0
65-74yrs 100 81.0 6.0 0.0 6.0 4.0 0.0 1.0 1.0 0.0 0.0 1.0 Kandy 15yrs 140 100.0 0.0 0.0 0.0 0.0 0.0 0.0 0.0 0.0 0.0 0.0
35-44yrs 136 69.9 7.4 8.1 14.0 0.0 0.7 0.0 0.0 0.0 0.0 0.0
65-74yrs 134 48.5 3.0 3.7 27.6 0.7 0.0 8.2 4.5 3.7 0.0 0.0 Matale 15yrs 40 97.5 2.5 0.0 0.0 0.0 0.0 0.0 0.0 0.0 0.0 0.0
35-44yrs 40 70.0 5.0 17.5 7.5 0.0 0.0 0.0 0.0 0.0 0.0 0.0
65-74yrs 39 59.0 0.0 2.6 30.8 0.0 0.0 5.1 2.6 0.0 0.0 0.0 Nuwara-Eliya 15yrs 100 100.0 0.0 0.0 0.0 0.0 0.0 0.0 0.0 0.0 0.0 0.0
35-44yrs 99 94.9 3.0 1.0 1.0 0.0 0.0 0.0 0.0 0.0 0.0 0.0
65-74yrs 98 84.7 3.1 0.0 6.1 1.0 1.0 4.1 0.0 0.0 0.0 0.0 Galle 15yrs 100 100.0 0.0 0.0 0.0 0.0 0.0 0.0 0.0 0.0 0.0 0.0
35-44yrs 99 88.9 7.1 0.0 2.0 0.0 0.0 1.0 0.0 0.0 1.0 0.0
65-74yrs 100 81.0 8.0 0.0 5.0 2.0 0.0 2.0 1.0 1.0 0.0 0.0 Matara 15yrs 80 100.0 0.0 0.0 0.0 0.0 0.0 0.0 0.0 0.0 0.0 0.0
35-44yrs 79 98.7 1.3 0.0 0.0 0.0 0.0 0.0 0.0 0.0 0.0 0.0
65-74yrs 79 86.1 3.8 0.0 1.3 1.3 0.0 6.3 1.3 0.0 0.0 0.0 Hambantota 15yrs 60 100.0 0.0 0.0 0.0 0.0 0.0 0.0 0.0 0.0 0.0 0.0
35-44yrs 59 96.6 0.0 3.4 0.0 0.0 0.0 0.0 0.0 0.0 0.0 0.0
65-74yrs 60 91.7 0.0 1.7 0.0 0.0 0.0 5.0 1.7 0.0 0.0 0.0 Jaffna 15yrs 60 98.3 1.7 0.0 0.0 0.0 0.0 0.0 0.0 0.0 0.0 0.0
35-44yrs 60 98.3 1.7 0.0 0.0 0.0 0.0 0.0 0.0 0.0 0.0 0.0
65-74yrs 59 93.2 3.4 0.0 0.0 1.7 0.0 1.7 0.0 0.0 0.0 0.0 Kilinochchi 15yrs 20 100.0 0.0 0.0 0.0 0.0 0.0 0.0 0.0 0.0 0.0 0.0
35-44yrs 20 100.0 0.0 0.0 0.0 0.0 0.0 0.0 0.0 0.0 0.0 0.0
65-74yrs 20 90.0 10.0 0.0 0.0 0.0 0.0 0.0 0.0 0.0 0.0 0.0 Mannar 15yrs 20 100.0 0.0 0.0 0.0 0.0 0.0 0.0 0.0 0.0 0.0 0.0
35-44yrs 20 100.0 0.0 0.0 0.0 0.0 0.0 0.0 0.0 0.0 0.0 0.0
65-74yrs 20 95.0 0.0 0.0 0.0 0.0 0.0 5.0 0.0 0.0 0.0 0.0 Mullaitivu 15yrs 20 100.0 0.0 0.0 0.0 0.0 0.0 0.0 0.0 0.0 0.0 0.0
35-44yrs 21 90.5 9.5 0.0 0.0 0.0 0.0 0.0 0.0 0.0 0.0 0.0
65-74yrs 20 95.0 0.0 0.0 0.0 0.0 0.0 5.0 0.0 0.0 0.0 0.0
Dis
tric
t-b
ased
re
sult
s
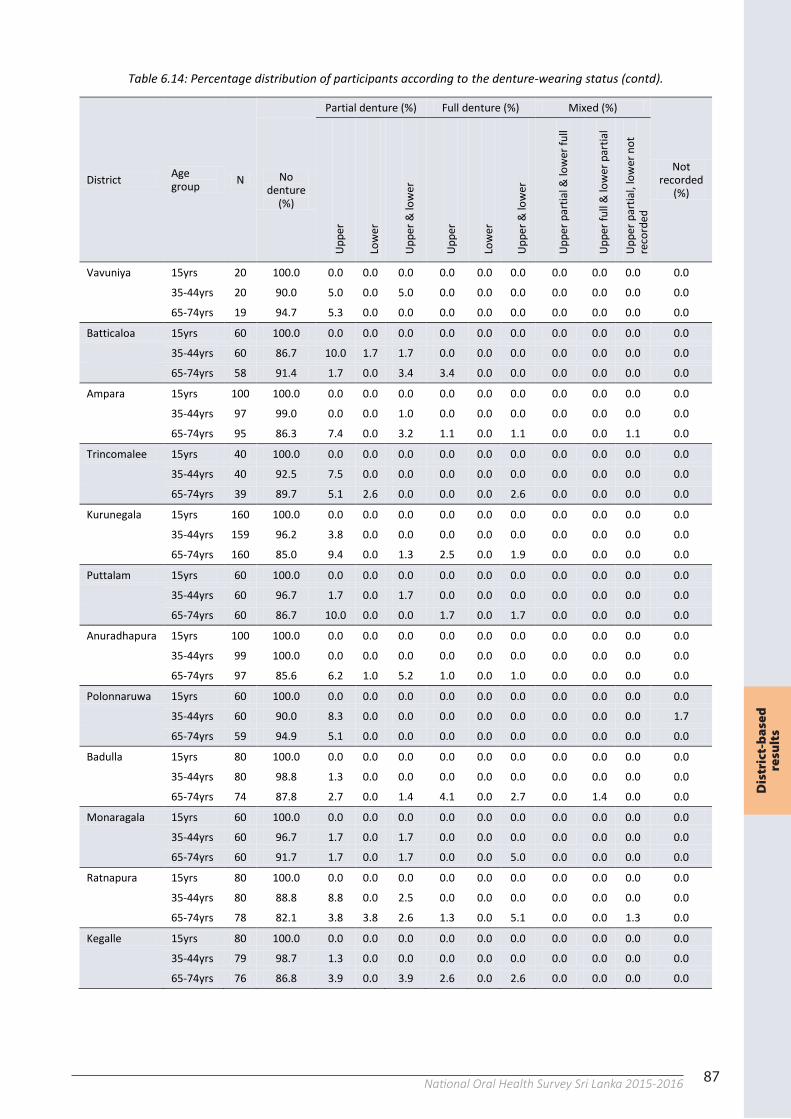
87National Oral Health Survey Sri Lanka 2015-201687
Table 6.14: Percentage distribution of participants according to the denture-wearing status (contd).
District Age group N
Partial denture (%) Full denture (%) Mixed (%)
Not recorded
(%) No
denture (%)
Uppe
r
Low
er
Uppe
r & lo
wer
Uppe
r
Low
er
Uppe
r & lo
wer
Uppe
r par
tial &
low
er fu
ll
Uppe
r ful
l & lo
wer
par
tial
Uppe
r par
tial,
low
er n
ot
reco
rded
Vavuniya 15yrs 20 100.0 0.0 0.0 0.0 0.0 0.0 0.0 0.0 0.0 0.0 0.0
35-44yrs 20 90.0 5.0 0.0 5.0 0.0 0.0 0.0 0.0 0.0 0.0 0.0
65-74yrs 19 94.7 5.3 0.0 0.0 0.0 0.0 0.0 0.0 0.0 0.0 0.0
Batticaloa 15yrs 60 100.0 0.0 0.0 0.0 0.0 0.0 0.0 0.0 0.0 0.0 0.0
35-44yrs 60 86.7 10.0 1.7 1.7 0.0 0.0 0.0 0.0 0.0 0.0 0.0
65-74yrs 58 91.4 1.7 0.0 3.4 3.4 0.0 0.0 0.0 0.0 0.0 0.0
Ampara 15yrs 100 100.0 0.0 0.0 0.0 0.0 0.0 0.0 0.0 0.0 0.0 0.0
35-44yrs 97 99.0 0.0 0.0 1.0 0.0 0.0 0.0 0.0 0.0 0.0 0.0
65-74yrs 95 86.3 7.4 0.0 3.2 1.1 0.0 1.1 0.0 0.0 1.1 0.0
Trincomalee 15yrs 40 100.0 0.0 0.0 0.0 0.0 0.0 0.0 0.0 0.0 0.0 0.0
35-44yrs 40 92.5 7.5 0.0 0.0 0.0 0.0 0.0 0.0 0.0 0.0 0.0
65-74yrs 39 89.7 5.1 2.6 0.0 0.0 0.0 2.6 0.0 0.0 0.0 0.0
Kurunegala 15yrs 160 100.0 0.0 0.0 0.0 0.0 0.0 0.0 0.0 0.0 0.0 0.0
35-44yrs 159 96.2 3.8 0.0 0.0 0.0 0.0 0.0 0.0 0.0 0.0 0.0
65-74yrs 160 85.0 9.4 0.0 1.3 2.5 0.0 1.9 0.0 0.0 0.0 0.0
Puttalam 15yrs 60 100.0 0.0 0.0 0.0 0.0 0.0 0.0 0.0 0.0 0.0 0.0
35-44yrs 60 96.7 1.7 0.0 1.7 0.0 0.0 0.0 0.0 0.0 0.0 0.0
65-74yrs 60 86.7 10.0 0.0 0.0 1.7 0.0 1.7 0.0 0.0 0.0 0.0
Anuradhapura 15yrs 100 100.0 0.0 0.0 0.0 0.0 0.0 0.0 0.0 0.0 0.0 0.0
35-44yrs 99 100.0 0.0 0.0 0.0 0.0 0.0 0.0 0.0 0.0 0.0 0.0
65-74yrs 97 85.6 6.2 1.0 5.2 1.0 0.0 1.0 0.0 0.0 0.0 0.0
Polonnaruwa 15yrs 60 100.0 0.0 0.0 0.0 0.0 0.0 0.0 0.0 0.0 0.0 0.0
35-44yrs 60 90.0 8.3 0.0 0.0 0.0 0.0 0.0 0.0 0.0 0.0 1.7
65-74yrs 59 94.9 5.1 0.0 0.0 0.0 0.0 0.0 0.0 0.0 0.0 0.0
Badulla 15yrs 80 100.0 0.0 0.0 0.0 0.0 0.0 0.0 0.0 0.0 0.0 0.0
35-44yrs 80 98.8 1.3 0.0 0.0 0.0 0.0 0.0 0.0 0.0 0.0 0.0
65-74yrs 74 87.8 2.7 0.0 1.4 4.1 0.0 2.7 0.0 1.4 0.0 0.0
Monaragala 15yrs 60 100.0 0.0 0.0 0.0 0.0 0.0 0.0 0.0 0.0 0.0 0.0
35-44yrs 60 96.7 1.7 0.0 1.7 0.0 0.0 0.0 0.0 0.0 0.0 0.0
65-74yrs 60 91.7 1.7 0.0 1.7 0.0 0.0 5.0 0.0 0.0 0.0 0.0
Ratnapura 15yrs 80 100.0 0.0 0.0 0.0 0.0 0.0 0.0 0.0 0.0 0.0 0.0
35-44yrs 80 88.8 8.8 0.0 2.5 0.0 0.0 0.0 0.0 0.0 0.0 0.0
65-74yrs 78 82.1 3.8 3.8 2.6 1.3 0.0 5.1 0.0 0.0 1.3 0.0
Kegalle 15yrs 80 100.0 0.0 0.0 0.0 0.0 0.0 0.0 0.0 0.0 0.0 0.0
35-44yrs 79 98.7 1.3 0.0 0.0 0.0 0.0 0.0 0.0 0.0 0.0 0.0
65-74yrs 76 86.8 3.9 0.0 3.9 2.6 0.0 2.6 0.0 0.0 0.0 0.0
86
Table 6.14: Percentage distribution of participants according to the denture-wearing status
District Age group N
Partial denture (%) Full denture (%) Mixed (%)
Not recorded
(%) No
denture (%)
Uppe
r
Low
er
Uppe
r & lo
wer
Uppe
r
Low
er
Uppe
r & lo
wer
Uppe
r par
tial &
low
er fu
ll
Uppe
r ful
l & lo
wer
par
tial
Uppe
r par
tial,
low
er n
ot
reco
rded
Colombo 15yrs 180 100.0 0.0 0.0 0.0 0.0 0.0 0.0 0.0 0.0 0.0 0.0
35-44yrs 178 88.2 6.7 2.2 1.7 0.0 0.0 0.6 0.0 0.0 0.6 0.0
65-74yrs 176 76.1 8.0 1.1 8.0 1.7 0.0 4.0 0.6 0.0 0.6 0.0 Gampaha 15yrs 181 100.0 0.0 0.0 0.0 0.0 0.0 0.0 0.0 0.0 0.0 0.0
35-44yrs 177 93.2 4.5 0.0 1.1 0.0 0.0 0.0 0.6 0.0 0.6 0.0
65-74yrs 179 82.1 5.6 1.1 5.0 1.7 0.0 2.8 0.6 0.0 0.0 1.1 Kalutara 15yrs 102 100.0 0.0 0.0 0.0 0.0 0.0 0.0 0.0 0.0 0.0 0.0
35-44yrs 100 95.0 3.0 2.0 0.0 0.0 0.0 0.0 0.0 0.0 0.0 0.0
65-74yrs 100 81.0 6.0 0.0 6.0 4.0 0.0 1.0 1.0 0.0 0.0 1.0 Kandy 15yrs 140 100.0 0.0 0.0 0.0 0.0 0.0 0.0 0.0 0.0 0.0 0.0
35-44yrs 136 69.9 7.4 8.1 14.0 0.0 0.7 0.0 0.0 0.0 0.0 0.0
65-74yrs 134 48.5 3.0 3.7 27.6 0.7 0.0 8.2 4.5 3.7 0.0 0.0 Matale 15yrs 40 97.5 2.5 0.0 0.0 0.0 0.0 0.0 0.0 0.0 0.0 0.0
35-44yrs 40 70.0 5.0 17.5 7.5 0.0 0.0 0.0 0.0 0.0 0.0 0.0
65-74yrs 39 59.0 0.0 2.6 30.8 0.0 0.0 5.1 2.6 0.0 0.0 0.0 Nuwara-Eliya 15yrs 100 100.0 0.0 0.0 0.0 0.0 0.0 0.0 0.0 0.0 0.0 0.0
35-44yrs 99 94.9 3.0 1.0 1.0 0.0 0.0 0.0 0.0 0.0 0.0 0.0
65-74yrs 98 84.7 3.1 0.0 6.1 1.0 1.0 4.1 0.0 0.0 0.0 0.0 Galle 15yrs 100 100.0 0.0 0.0 0.0 0.0 0.0 0.0 0.0 0.0 0.0 0.0
35-44yrs 99 88.9 7.1 0.0 2.0 0.0 0.0 1.0 0.0 0.0 1.0 0.0
65-74yrs 100 81.0 8.0 0.0 5.0 2.0 0.0 2.0 1.0 1.0 0.0 0.0 Matara 15yrs 80 100.0 0.0 0.0 0.0 0.0 0.0 0.0 0.0 0.0 0.0 0.0
35-44yrs 79 98.7 1.3 0.0 0.0 0.0 0.0 0.0 0.0 0.0 0.0 0.0
65-74yrs 79 86.1 3.8 0.0 1.3 1.3 0.0 6.3 1.3 0.0 0.0 0.0 Hambantota 15yrs 60 100.0 0.0 0.0 0.0 0.0 0.0 0.0 0.0 0.0 0.0 0.0
35-44yrs 59 96.6 0.0 3.4 0.0 0.0 0.0 0.0 0.0 0.0 0.0 0.0
65-74yrs 60 91.7 0.0 1.7 0.0 0.0 0.0 5.0 1.7 0.0 0.0 0.0 Jaffna 15yrs 60 98.3 1.7 0.0 0.0 0.0 0.0 0.0 0.0 0.0 0.0 0.0
35-44yrs 60 98.3 1.7 0.0 0.0 0.0 0.0 0.0 0.0 0.0 0.0 0.0
65-74yrs 59 93.2 3.4 0.0 0.0 1.7 0.0 1.7 0.0 0.0 0.0 0.0 Kilinochchi 15yrs 20 100.0 0.0 0.0 0.0 0.0 0.0 0.0 0.0 0.0 0.0 0.0
35-44yrs 20 100.0 0.0 0.0 0.0 0.0 0.0 0.0 0.0 0.0 0.0 0.0
65-74yrs 20 90.0 10.0 0.0 0.0 0.0 0.0 0.0 0.0 0.0 0.0 0.0 Mannar 15yrs 20 100.0 0.0 0.0 0.0 0.0 0.0 0.0 0.0 0.0 0.0 0.0
35-44yrs 20 100.0 0.0 0.0 0.0 0.0 0.0 0.0 0.0 0.0 0.0 0.0
65-74yrs 20 95.0 0.0 0.0 0.0 0.0 0.0 5.0 0.0 0.0 0.0 0.0 Mullaitivu 15yrs 20 100.0 0.0 0.0 0.0 0.0 0.0 0.0 0.0 0.0 0.0 0.0
35-44yrs 21 90.5 9.5 0.0 0.0 0.0 0.0 0.0 0.0 0.0 0.0 0.0
65-74yrs 20 95.0 0.0 0.0 0.0 0.0 0.0 5.0 0.0 0.0 0.0 0.0
Dis
tric
t-b
ased
re
sult
s
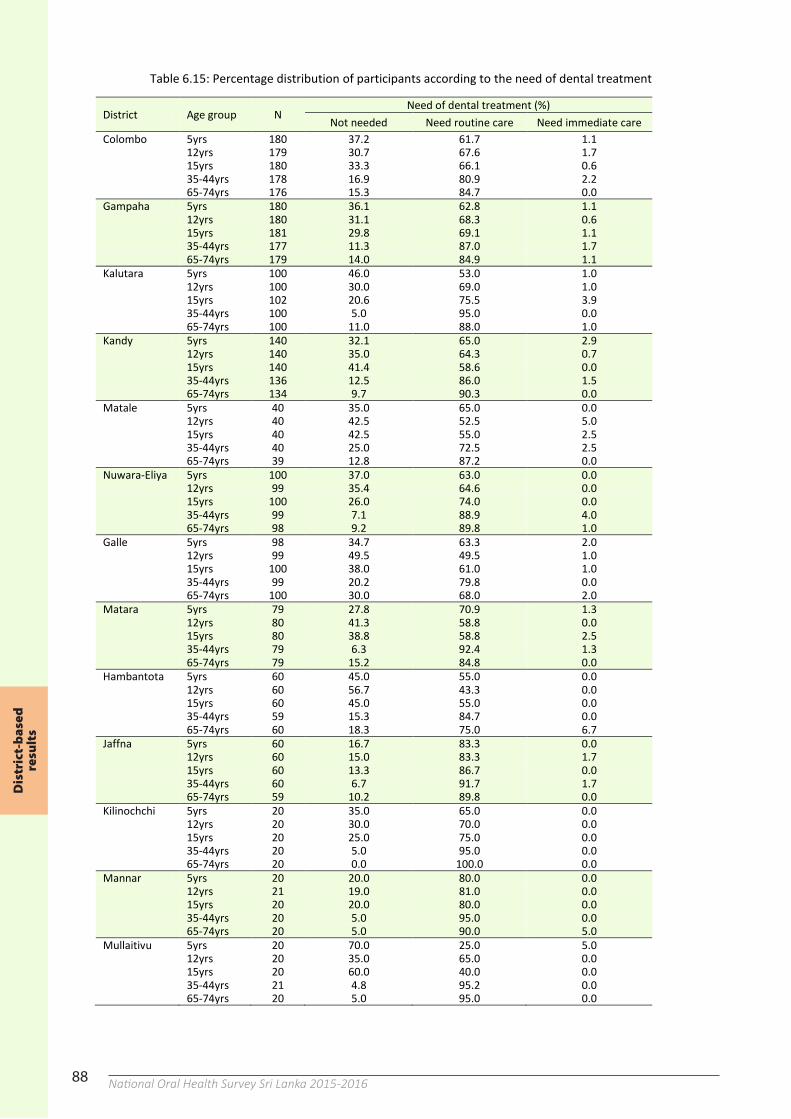
88 National Oral Health Survey Sri Lanka 2015-201688
Table 6.15: Percentage distribution of participants according to the need of dental treatment
District Age group N Need of dental treatment (%)
Not needed Need routine care Need immediate care Colombo 5yrs 180 37.2 61.7 1.1
12yrs 179 30.7 67.6 1.7
15yrs 180 33.3 66.1 0.6
35-44yrs 178 16.9 80.9 2.2
65-74yrs 176 15.3 84.7 0.0
Gampaha 5yrs 180 36.1 62.8 1.1
12yrs 180 31.1 68.3 0.6
15yrs 181 29.8 69.1 1.1
35-44yrs 177 11.3 87.0 1.7
65-74yrs 179 14.0 84.9 1.1
Kalutara 5yrs 100 46.0 53.0 1.0
12yrs 100 30.0 69.0 1.0
15yrs 102 20.6 75.5 3.9
35-44yrs 100 5.0 95.0 0.0
65-74yrs 100 11.0 88.0 1.0
Kandy 5yrs 140 32.1 65.0 2.9
12yrs 140 35.0 64.3 0.7
15yrs 140 41.4 58.6 0.0
35-44yrs 136 12.5 86.0 1.5
65-74yrs 134 9.7 90.3 0.0
Matale 5yrs 40 35.0 65.0 0.0
12yrs 40 42.5 52.5 5.0
15yrs 40 42.5 55.0 2.5
35-44yrs 40 25.0 72.5 2.5
65-74yrs 39 12.8 87.2 0.0
Nuwara-Eliya 5yrs 100 37.0 63.0 0.0
12yrs 99 35.4 64.6 0.0
15yrs 100 26.0 74.0 0.0
35-44yrs 99 7.1 88.9 4.0
65-74yrs 98 9.2 89.8 1.0
Galle 5yrs 98 34.7 63.3 2.0
12yrs 99 49.5 49.5 1.0
15yrs 100 38.0 61.0 1.0
35-44yrs 99 20.2 79.8 0.0
65-74yrs 100 30.0 68.0 2.0
Matara 5yrs 79 27.8 70.9 1.3
12yrs 80 41.3 58.8 0.0
15yrs 80 38.8 58.8 2.5
35-44yrs 79 6.3 92.4 1.3
65-74yrs 79 15.2 84.8 0.0
Hambantota 5yrs 60 45.0 55.0 0.0
12yrs 60 56.7 43.3 0.0
15yrs 60 45.0 55.0 0.0
35-44yrs 59 15.3 84.7 0.0
65-74yrs 60 18.3 75.0 6.7
Jaffna 5yrs 60 16.7 83.3 0.0
12yrs 60 15.0 83.3 1.7
15yrs 60 13.3 86.7 0.0
35-44yrs 60 6.7 91.7 1.7
65-74yrs 59 10.2 89.8 0.0
Kilinochchi 5yrs 20 35.0 65.0 0.0
12yrs 20 30.0 70.0 0.0
15yrs 20 25.0 75.0 0.0
35-44yrs 20 5.0 95.0 0.0
65-74yrs 20 0.0 100.0 0.0
Mannar 5yrs 20 20.0 80.0 0.0
12yrs 21 19.0 81.0 0.0
15yrs 20 20.0 80.0 0.0
35-44yrs 20 5.0 95.0 0.0
65-74yrs 20 5.0 90.0 5.0
Mullaitivu 5yrs 20 70.0 25.0 5.0
12yrs 20 35.0 65.0 0.0
15yrs 20 60.0 40.0 0.0
35-44yrs 21 4.8 95.2 0.0
65-74yrs 20 5.0 95.0 0.0
Dis
tric
t-b
ased
re
sult
s
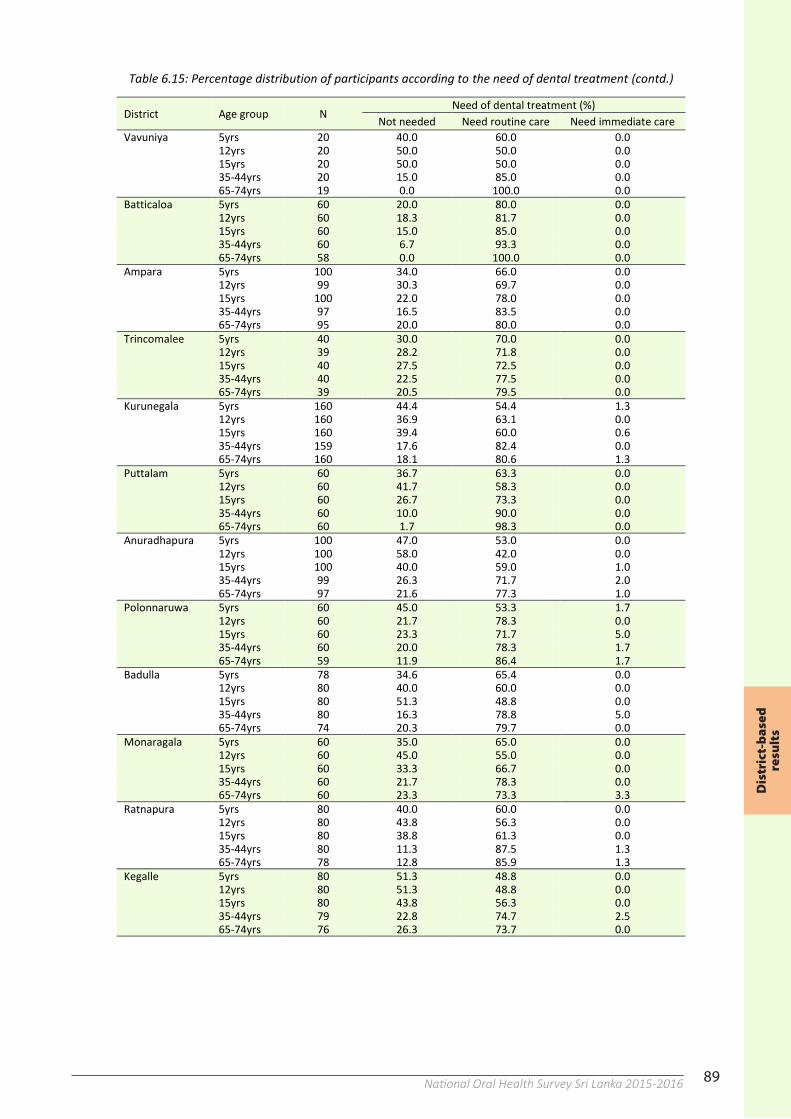
89National Oral Health Survey Sri Lanka 2015-201688
Table 6.15: Percentage distribution of participants according to the need of dental treatment
District Age group N Need of dental treatment (%)
Not needed Need routine care Need immediate care Colombo 5yrs 180 37.2 61.7 1.1
12yrs 179 30.7 67.6 1.7
15yrs 180 33.3 66.1 0.6
35-44yrs 178 16.9 80.9 2.2
65-74yrs 176 15.3 84.7 0.0
Gampaha 5yrs 180 36.1 62.8 1.1
12yrs 180 31.1 68.3 0.6
15yrs 181 29.8 69.1 1.1
35-44yrs 177 11.3 87.0 1.7
65-74yrs 179 14.0 84.9 1.1
Kalutara 5yrs 100 46.0 53.0 1.0
12yrs 100 30.0 69.0 1.0
15yrs 102 20.6 75.5 3.9
35-44yrs 100 5.0 95.0 0.0
65-74yrs 100 11.0 88.0 1.0
Kandy 5yrs 140 32.1 65.0 2.9
12yrs 140 35.0 64.3 0.7
15yrs 140 41.4 58.6 0.0
35-44yrs 136 12.5 86.0 1.5
65-74yrs 134 9.7 90.3 0.0
Matale 5yrs 40 35.0 65.0 0.0
12yrs 40 42.5 52.5 5.0
15yrs 40 42.5 55.0 2.5
35-44yrs 40 25.0 72.5 2.5
65-74yrs 39 12.8 87.2 0.0
Nuwara-Eliya 5yrs 100 37.0 63.0 0.0
12yrs 99 35.4 64.6 0.0
15yrs 100 26.0 74.0 0.0
35-44yrs 99 7.1 88.9 4.0
65-74yrs 98 9.2 89.8 1.0
Galle 5yrs 98 34.7 63.3 2.0
12yrs 99 49.5 49.5 1.0
15yrs 100 38.0 61.0 1.0
35-44yrs 99 20.2 79.8 0.0
65-74yrs 100 30.0 68.0 2.0
Matara 5yrs 79 27.8 70.9 1.3
12yrs 80 41.3 58.8 0.0
15yrs 80 38.8 58.8 2.5
35-44yrs 79 6.3 92.4 1.3
65-74yrs 79 15.2 84.8 0.0
Hambantota 5yrs 60 45.0 55.0 0.0
12yrs 60 56.7 43.3 0.0
15yrs 60 45.0 55.0 0.0
35-44yrs 59 15.3 84.7 0.0
65-74yrs 60 18.3 75.0 6.7
Jaffna 5yrs 60 16.7 83.3 0.0
12yrs 60 15.0 83.3 1.7
15yrs 60 13.3 86.7 0.0
35-44yrs 60 6.7 91.7 1.7
65-74yrs 59 10.2 89.8 0.0
Kilinochchi 5yrs 20 35.0 65.0 0.0
12yrs 20 30.0 70.0 0.0
15yrs 20 25.0 75.0 0.0
35-44yrs 20 5.0 95.0 0.0
65-74yrs 20 0.0 100.0 0.0
Mannar 5yrs 20 20.0 80.0 0.0
12yrs 21 19.0 81.0 0.0
15yrs 20 20.0 80.0 0.0
35-44yrs 20 5.0 95.0 0.0
65-74yrs 20 5.0 90.0 5.0
Mullaitivu 5yrs 20 70.0 25.0 5.0
12yrs 20 35.0 65.0 0.0
15yrs 20 60.0 40.0 0.0
35-44yrs 21 4.8 95.2 0.0
65-74yrs 20 5.0 95.0 0.0
89
Table 6.15: Percentage distribution of participants according to the need of dental treatment (contd.)
District Age group N Need of dental treatment (%)
Not needed Need routine care Need immediate care Vavuniya 5yrs 20 40.0 60.0 0.0 12yrs 20 50.0 50.0 0.0 15yrs 20 50.0 50.0 0.0 35-44yrs 20 15.0 85.0 0.0 65-74yrs 19 0.0 100.0 0.0 Batticaloa 5yrs 60 20.0 80.0 0.0 12yrs 60 18.3 81.7 0.0 15yrs 60 15.0 85.0 0.0 35-44yrs 60 6.7 93.3 0.0 65-74yrs 58 0.0 100.0 0.0 Ampara 5yrs 100 34.0 66.0 0.0 12yrs 99 30.3 69.7 0.0 15yrs 100 22.0 78.0 0.0 35-44yrs 97 16.5 83.5 0.0 65-74yrs 95 20.0 80.0 0.0 Trincomalee 5yrs 40 30.0 70.0 0.0 12yrs 39 28.2 71.8 0.0 15yrs 40 27.5 72.5 0.0 35-44yrs 40 22.5 77.5 0.0 65-74yrs 39 20.5 79.5 0.0 Kurunegala 5yrs 160 44.4 54.4 1.3 12yrs 160 36.9 63.1 0.0 15yrs 160 39.4 60.0 0.6 35-44yrs 159 17.6 82.4 0.0 65-74yrs 160 18.1 80.6 1.3 Puttalam 5yrs 60 36.7 63.3 0.0 12yrs 60 41.7 58.3 0.0 15yrs 60 26.7 73.3 0.0 35-44yrs 60 10.0 90.0 0.0 65-74yrs 60 1.7 98.3 0.0 Anuradhapura 5yrs 100 47.0 53.0 0.0 12yrs 100 58.0 42.0 0.0 15yrs 100 40.0 59.0 1.0 35-44yrs 99 26.3 71.7 2.0 65-74yrs 97 21.6 77.3 1.0 Polonnaruwa 5yrs 60 45.0 53.3 1.7 12yrs 60 21.7 78.3 0.0 15yrs 60 23.3 71.7 5.0 35-44yrs 60 20.0 78.3 1.7 65-74yrs 59 11.9 86.4 1.7 Badulla 5yrs 78 34.6 65.4 0.0 12yrs 80 40.0 60.0 0.0 15yrs 80 51.3 48.8 0.0 35-44yrs 80 16.3 78.8 5.0 65-74yrs 74 20.3 79.7 0.0 Monaragala 5yrs 60 35.0 65.0 0.0 12yrs 60 45.0 55.0 0.0 15yrs 60 33.3 66.7 0.0 35-44yrs 60 21.7 78.3 0.0 65-74yrs 60 23.3 73.3 3.3 Ratnapura 5yrs 80 40.0 60.0 0.0 12yrs 80 43.8 56.3 0.0 15yrs 80 38.8 61.3 0.0 35-44yrs 80 11.3 87.5 1.3 65-74yrs 78 12.8 85.9 1.3 Kegalle 5yrs 80 51.3 48.8 0.0 12yrs 80 51.3 48.8 0.0 15yrs 80 43.8 56.3 0.0 35-44yrs 79 22.8 74.7 2.5 65-74yrs 76 26.3 73.7 0.0
Dis
tric
t-b
ased
re
sult
s
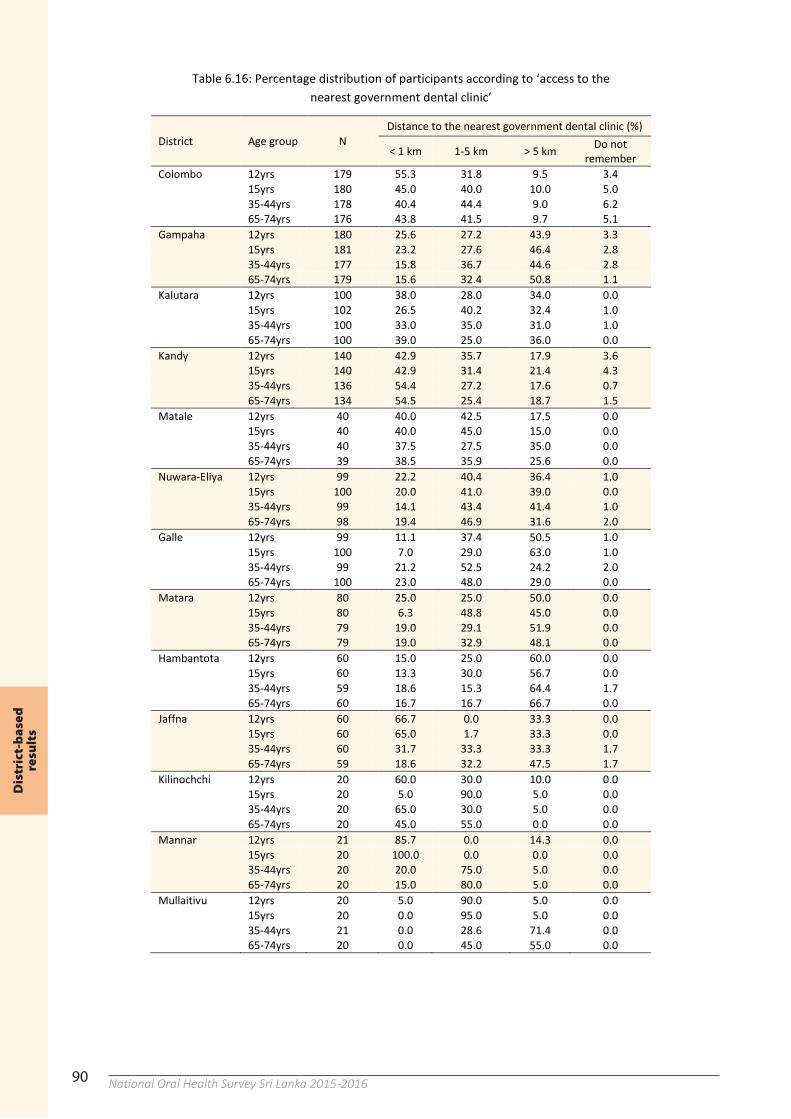
90 National Oral Health Survey Sri Lanka 2015-201690
Table 6.16: Percentage distribution of participants according to ‘access to the nearest government dental clinic’
District Age group N Distance to the nearest government dental clinic (%)
< 1 km 1-5 km > 5 km Do not remember
Colombo 12yrs 179 55.3 31.8 9.5 3.4
15yrs 180 45.0 40.0 10.0 5.0
35-44yrs 178 40.4 44.4 9.0 6.2
65-74yrs 176 43.8 41.5 9.7 5.1 Gampaha 12yrs 180 25.6 27.2 43.9 3.3
15yrs 181 23.2 27.6 46.4 2.8
35-44yrs 177 15.8 36.7 44.6 2.8
65-74yrs 179 15.6 32.4 50.8 1.1 Kalutara 12yrs 100 38.0 28.0 34.0 0.0
15yrs 102 26.5 40.2 32.4 1.0
35-44yrs 100 33.0 35.0 31.0 1.0
65-74yrs 100 39.0 25.0 36.0 0.0 Kandy 12yrs 140 42.9 35.7 17.9 3.6
15yrs 140 42.9 31.4 21.4 4.3
35-44yrs 136 54.4 27.2 17.6 0.7
65-74yrs 134 54.5 25.4 18.7 1.5 Matale 12yrs 40 40.0 42.5 17.5 0.0
15yrs 40 40.0 45.0 15.0 0.0
35-44yrs 40 37.5 27.5 35.0 0.0
65-74yrs 39 38.5 35.9 25.6 0.0 Nuwara-Eliya 12yrs 99 22.2 40.4 36.4 1.0
15yrs 100 20.0 41.0 39.0 0.0
35-44yrs 99 14.1 43.4 41.4 1.0
65-74yrs 98 19.4 46.9 31.6 2.0 Galle 12yrs 99 11.1 37.4 50.5 1.0
15yrs 100 7.0 29.0 63.0 1.0
35-44yrs 99 21.2 52.5 24.2 2.0
65-74yrs 100 23.0 48.0 29.0 0.0 Matara 12yrs 80 25.0 25.0 50.0 0.0
15yrs 80 6.3 48.8 45.0 0.0
35-44yrs 79 19.0 29.1 51.9 0.0
65-74yrs 79 19.0 32.9 48.1 0.0 Hambantota 12yrs 60 15.0 25.0 60.0 0.0
15yrs 60 13.3 30.0 56.7 0.0
35-44yrs 59 18.6 15.3 64.4 1.7
65-74yrs 60 16.7 16.7 66.7 0.0 Jaffna 12yrs 60 66.7 0.0 33.3 0.0
15yrs 60 65.0 1.7 33.3 0.0
35-44yrs 60 31.7 33.3 33.3 1.7
65-74yrs 59 18.6 32.2 47.5 1.7 Kilinochchi 12yrs 20 60.0 30.0 10.0 0.0
15yrs 20 5.0 90.0 5.0 0.0
35-44yrs 20 65.0 30.0 5.0 0.0
65-74yrs 20 45.0 55.0 0.0 0.0 Mannar 12yrs 21 85.7 0.0 14.3 0.0
15yrs 20 100.0 0.0 0.0 0.0
35-44yrs 20 20.0 75.0 5.0 0.0
65-74yrs 20 15.0 80.0 5.0 0.0 Mullaitivu 12yrs 20 5.0 90.0 5.0 0.0
15yrs 20 0.0 95.0 5.0 0.0
35-44yrs 21 0.0 28.6 71.4 0.0
65-74yrs 20 0.0 45.0 55.0 0.0
Dis
tric
t-b
ased
re
sult
s
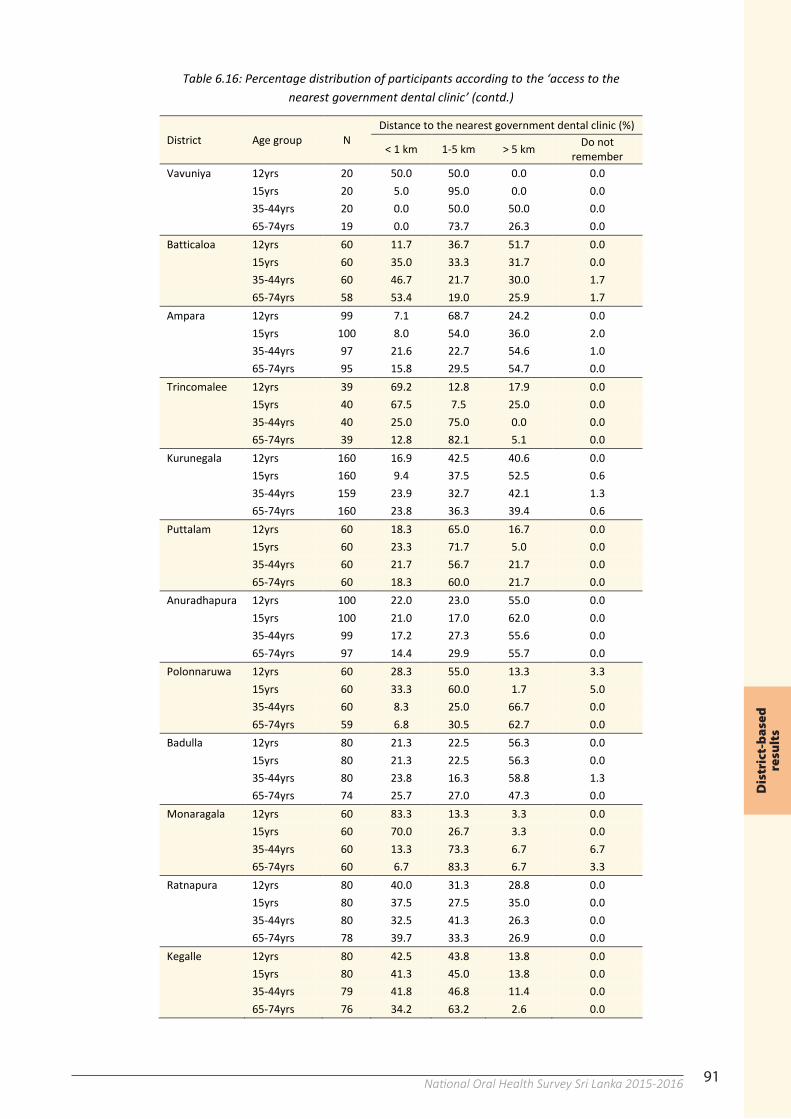
91National Oral Health Survey Sri Lanka 2015-201690
Table 6.16: Percentage distribution of participants according to ‘access to the nearest government dental clinic’
District Age group N Distance to the nearest government dental clinic (%)
< 1 km 1-5 km > 5 km Do not remember
Colombo 12yrs 179 55.3 31.8 9.5 3.4
15yrs 180 45.0 40.0 10.0 5.0
35-44yrs 178 40.4 44.4 9.0 6.2
65-74yrs 176 43.8 41.5 9.7 5.1 Gampaha 12yrs 180 25.6 27.2 43.9 3.3
15yrs 181 23.2 27.6 46.4 2.8
35-44yrs 177 15.8 36.7 44.6 2.8
65-74yrs 179 15.6 32.4 50.8 1.1 Kalutara 12yrs 100 38.0 28.0 34.0 0.0
15yrs 102 26.5 40.2 32.4 1.0
35-44yrs 100 33.0 35.0 31.0 1.0
65-74yrs 100 39.0 25.0 36.0 0.0 Kandy 12yrs 140 42.9 35.7 17.9 3.6
15yrs 140 42.9 31.4 21.4 4.3
35-44yrs 136 54.4 27.2 17.6 0.7
65-74yrs 134 54.5 25.4 18.7 1.5 Matale 12yrs 40 40.0 42.5 17.5 0.0
15yrs 40 40.0 45.0 15.0 0.0
35-44yrs 40 37.5 27.5 35.0 0.0
65-74yrs 39 38.5 35.9 25.6 0.0 Nuwara-Eliya 12yrs 99 22.2 40.4 36.4 1.0
15yrs 100 20.0 41.0 39.0 0.0
35-44yrs 99 14.1 43.4 41.4 1.0
65-74yrs 98 19.4 46.9 31.6 2.0 Galle 12yrs 99 11.1 37.4 50.5 1.0
15yrs 100 7.0 29.0 63.0 1.0
35-44yrs 99 21.2 52.5 24.2 2.0
65-74yrs 100 23.0 48.0 29.0 0.0 Matara 12yrs 80 25.0 25.0 50.0 0.0
15yrs 80 6.3 48.8 45.0 0.0
35-44yrs 79 19.0 29.1 51.9 0.0
65-74yrs 79 19.0 32.9 48.1 0.0 Hambantota 12yrs 60 15.0 25.0 60.0 0.0
15yrs 60 13.3 30.0 56.7 0.0
35-44yrs 59 18.6 15.3 64.4 1.7
65-74yrs 60 16.7 16.7 66.7 0.0 Jaffna 12yrs 60 66.7 0.0 33.3 0.0
15yrs 60 65.0 1.7 33.3 0.0
35-44yrs 60 31.7 33.3 33.3 1.7
65-74yrs 59 18.6 32.2 47.5 1.7 Kilinochchi 12yrs 20 60.0 30.0 10.0 0.0
15yrs 20 5.0 90.0 5.0 0.0
35-44yrs 20 65.0 30.0 5.0 0.0
65-74yrs 20 45.0 55.0 0.0 0.0 Mannar 12yrs 21 85.7 0.0 14.3 0.0
15yrs 20 100.0 0.0 0.0 0.0
35-44yrs 20 20.0 75.0 5.0 0.0
65-74yrs 20 15.0 80.0 5.0 0.0 Mullaitivu 12yrs 20 5.0 90.0 5.0 0.0
15yrs 20 0.0 95.0 5.0 0.0
35-44yrs 21 0.0 28.6 71.4 0.0
65-74yrs 20 0.0 45.0 55.0 0.0
91
Table 6.16: Percentage distribution of participants according to the ‘access to the nearest government dental clinic’ (contd.)
District Age group N Distance to the nearest government dental clinic (%)
< 1 km 1-5 km > 5 km Do not remember
Vavuniya 12yrs 20 50.0 50.0 0.0 0.0
15yrs 20 5.0 95.0 0.0 0.0
35-44yrs 20 0.0 50.0 50.0 0.0
65-74yrs 19 0.0 73.7 26.3 0.0 Batticaloa 12yrs 60 11.7 36.7 51.7 0.0
15yrs 60 35.0 33.3 31.7 0.0
35-44yrs 60 46.7 21.7 30.0 1.7
65-74yrs 58 53.4 19.0 25.9 1.7 Ampara 12yrs 99 7.1 68.7 24.2 0.0
15yrs 100 8.0 54.0 36.0 2.0
35-44yrs 97 21.6 22.7 54.6 1.0
65-74yrs 95 15.8 29.5 54.7 0.0 Trincomalee 12yrs 39 69.2 12.8 17.9 0.0
15yrs 40 67.5 7.5 25.0 0.0
35-44yrs 40 25.0 75.0 0.0 0.0
65-74yrs 39 12.8 82.1 5.1 0.0 Kurunegala 12yrs 160 16.9 42.5 40.6 0.0
15yrs 160 9.4 37.5 52.5 0.6
35-44yrs 159 23.9 32.7 42.1 1.3
65-74yrs 160 23.8 36.3 39.4 0.6 Puttalam 12yrs 60 18.3 65.0 16.7 0.0
15yrs 60 23.3 71.7 5.0 0.0
35-44yrs 60 21.7 56.7 21.7 0.0
65-74yrs 60 18.3 60.0 21.7 0.0 Anuradhapura 12yrs 100 22.0 23.0 55.0 0.0
15yrs 100 21.0 17.0 62.0 0.0
35-44yrs 99 17.2 27.3 55.6 0.0
65-74yrs 97 14.4 29.9 55.7 0.0 Polonnaruwa 12yrs 60 28.3 55.0 13.3 3.3
15yrs 60 33.3 60.0 1.7 5.0
35-44yrs 60 8.3 25.0 66.7 0.0
65-74yrs 59 6.8 30.5 62.7 0.0 Badulla 12yrs 80 21.3 22.5 56.3 0.0
15yrs 80 21.3 22.5 56.3 0.0
35-44yrs 80 23.8 16.3 58.8 1.3
65-74yrs 74 25.7 27.0 47.3 0.0 Monaragala 12yrs 60 83.3 13.3 3.3 0.0
15yrs 60 70.0 26.7 3.3 0.0
35-44yrs 60 13.3 73.3 6.7 6.7
65-74yrs 60 6.7 83.3 6.7 3.3 Ratnapura 12yrs 80 40.0 31.3 28.8 0.0
15yrs 80 37.5 27.5 35.0 0.0
35-44yrs 80 32.5 41.3 26.3 0.0
65-74yrs 78 39.7 33.3 26.9 0.0 Kegalle 12yrs 80 42.5 43.8 13.8 0.0
15yrs 80 41.3 45.0 13.8 0.0
35-44yrs 79 41.8 46.8 11.4 0.0
65-74yrs 76 34.2 63.2 2.6 0.0
Dis
tric
t-b
ased
re
sult
s
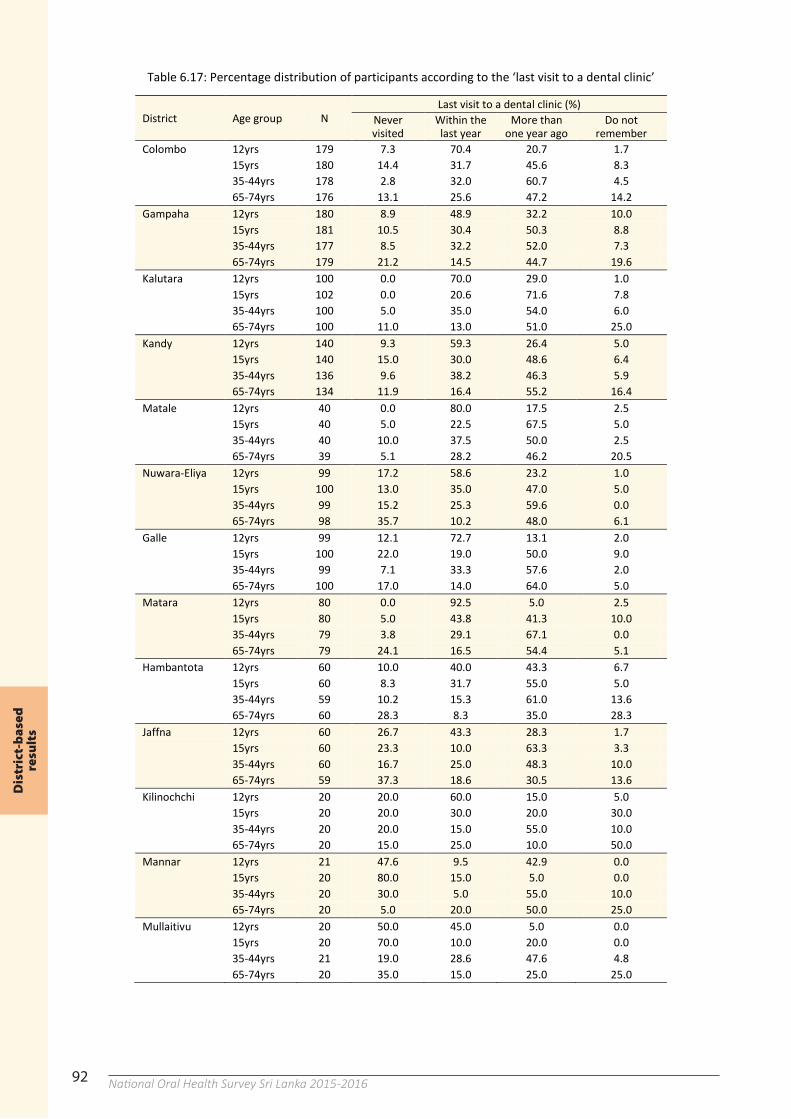
92 National Oral Health Survey Sri Lanka 2015-201692
Table 6.17: Percentage distribution of participants according to the ‘last visit to a dental clinic’
District Age group N Last visit to a dental clinic (%)
Never visited
Within the last year
More than one year ago
Do not remember
Colombo 12yrs 179 7.3 70.4 20.7 1.7
15yrs 180 14.4 31.7 45.6 8.3
35-44yrs 178 2.8 32.0 60.7 4.5
65-74yrs 176 13.1 25.6 47.2 14.2 Gampaha 12yrs 180 8.9 48.9 32.2 10.0
15yrs 181 10.5 30.4 50.3 8.8
35-44yrs 177 8.5 32.2 52.0 7.3
65-74yrs 179 21.2 14.5 44.7 19.6 Kalutara 12yrs 100 0.0 70.0 29.0 1.0
15yrs 102 0.0 20.6 71.6 7.8
35-44yrs 100 5.0 35.0 54.0 6.0
65-74yrs 100 11.0 13.0 51.0 25.0 Kandy 12yrs 140 9.3 59.3 26.4 5.0
15yrs 140 15.0 30.0 48.6 6.4
35-44yrs 136 9.6 38.2 46.3 5.9
65-74yrs 134 11.9 16.4 55.2 16.4 Matale 12yrs 40 0.0 80.0 17.5 2.5
15yrs 40 5.0 22.5 67.5 5.0
35-44yrs 40 10.0 37.5 50.0 2.5
65-74yrs 39 5.1 28.2 46.2 20.5 Nuwara-Eliya 12yrs 99 17.2 58.6 23.2 1.0
15yrs 100 13.0 35.0 47.0 5.0
35-44yrs 99 15.2 25.3 59.6 0.0
65-74yrs 98 35.7 10.2 48.0 6.1 Galle 12yrs 99 12.1 72.7 13.1 2.0
15yrs 100 22.0 19.0 50.0 9.0
35-44yrs 99 7.1 33.3 57.6 2.0
65-74yrs 100 17.0 14.0 64.0 5.0 Matara 12yrs 80 0.0 92.5 5.0 2.5
15yrs 80 5.0 43.8 41.3 10.0
35-44yrs 79 3.8 29.1 67.1 0.0
65-74yrs 79 24.1 16.5 54.4 5.1 Hambantota 12yrs 60 10.0 40.0 43.3 6.7
15yrs 60 8.3 31.7 55.0 5.0
35-44yrs 59 10.2 15.3 61.0 13.6
65-74yrs 60 28.3 8.3 35.0 28.3 Jaffna 12yrs 60 26.7 43.3 28.3 1.7
15yrs 60 23.3 10.0 63.3 3.3
35-44yrs 60 16.7 25.0 48.3 10.0
65-74yrs 59 37.3 18.6 30.5 13.6 Kilinochchi 12yrs 20 20.0 60.0 15.0 5.0
15yrs 20 20.0 30.0 20.0 30.0
35-44yrs 20 20.0 15.0 55.0 10.0
65-74yrs 20 15.0 25.0 10.0 50.0 Mannar 12yrs 21 47.6 9.5 42.9 0.0
15yrs 20 80.0 15.0 5.0 0.0
35-44yrs 20 30.0 5.0 55.0 10.0
65-74yrs 20 5.0 20.0 50.0 25.0 Mullaitivu 12yrs 20 50.0 45.0 5.0 0.0
15yrs 20 70.0 10.0 20.0 0.0
35-44yrs 21 19.0 28.6 47.6 4.8
65-74yrs 20 35.0 15.0 25.0 25.0
Dis
tric
t-b
ased
re
sult
s
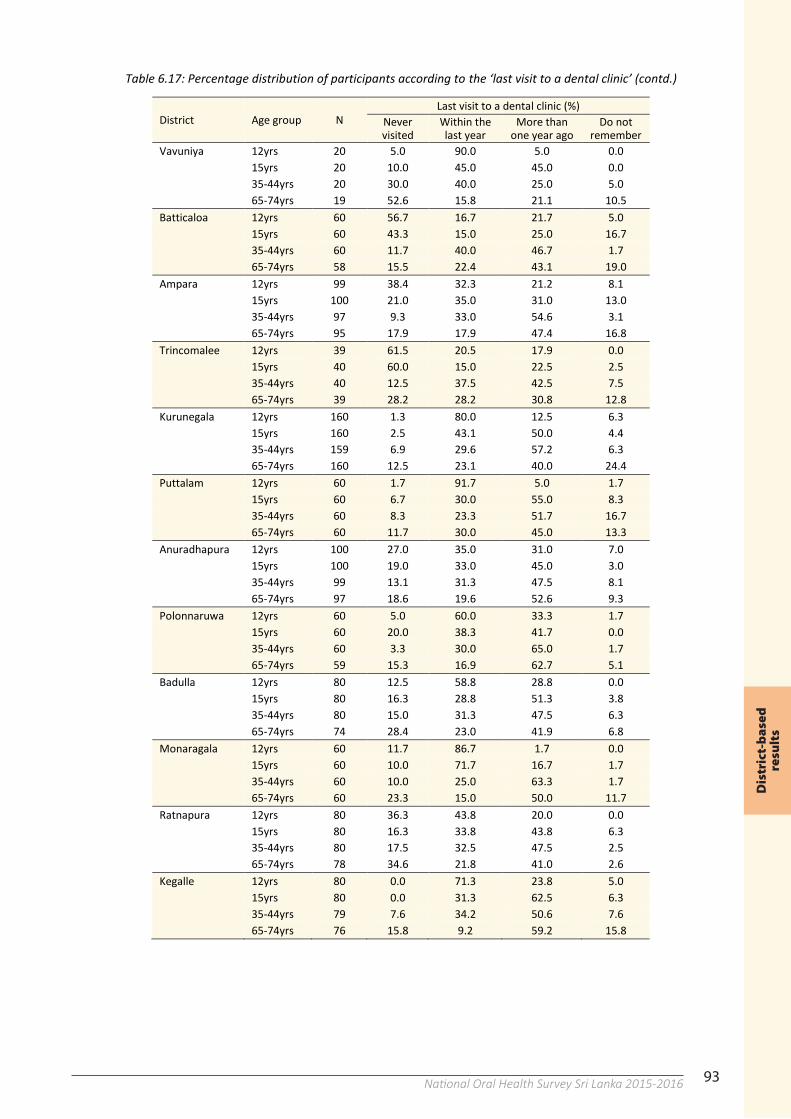
93National Oral Health Survey Sri Lanka 2015-201692
Table 6.17: Percentage distribution of participants according to the ‘last visit to a dental clinic’
District Age group N Last visit to a dental clinic (%)
Never visited
Within the last year
More than one year ago
Do not remember
Colombo 12yrs 179 7.3 70.4 20.7 1.7
15yrs 180 14.4 31.7 45.6 8.3
35-44yrs 178 2.8 32.0 60.7 4.5
65-74yrs 176 13.1 25.6 47.2 14.2 Gampaha 12yrs 180 8.9 48.9 32.2 10.0
15yrs 181 10.5 30.4 50.3 8.8
35-44yrs 177 8.5 32.2 52.0 7.3
65-74yrs 179 21.2 14.5 44.7 19.6 Kalutara 12yrs 100 0.0 70.0 29.0 1.0
15yrs 102 0.0 20.6 71.6 7.8
35-44yrs 100 5.0 35.0 54.0 6.0
65-74yrs 100 11.0 13.0 51.0 25.0 Kandy 12yrs 140 9.3 59.3 26.4 5.0
15yrs 140 15.0 30.0 48.6 6.4
35-44yrs 136 9.6 38.2 46.3 5.9
65-74yrs 134 11.9 16.4 55.2 16.4 Matale 12yrs 40 0.0 80.0 17.5 2.5
15yrs 40 5.0 22.5 67.5 5.0
35-44yrs 40 10.0 37.5 50.0 2.5
65-74yrs 39 5.1 28.2 46.2 20.5 Nuwara-Eliya 12yrs 99 17.2 58.6 23.2 1.0
15yrs 100 13.0 35.0 47.0 5.0
35-44yrs 99 15.2 25.3 59.6 0.0
65-74yrs 98 35.7 10.2 48.0 6.1 Galle 12yrs 99 12.1 72.7 13.1 2.0
15yrs 100 22.0 19.0 50.0 9.0
35-44yrs 99 7.1 33.3 57.6 2.0
65-74yrs 100 17.0 14.0 64.0 5.0 Matara 12yrs 80 0.0 92.5 5.0 2.5
15yrs 80 5.0 43.8 41.3 10.0
35-44yrs 79 3.8 29.1 67.1 0.0
65-74yrs 79 24.1 16.5 54.4 5.1 Hambantota 12yrs 60 10.0 40.0 43.3 6.7
15yrs 60 8.3 31.7 55.0 5.0
35-44yrs 59 10.2 15.3 61.0 13.6
65-74yrs 60 28.3 8.3 35.0 28.3 Jaffna 12yrs 60 26.7 43.3 28.3 1.7
15yrs 60 23.3 10.0 63.3 3.3
35-44yrs 60 16.7 25.0 48.3 10.0
65-74yrs 59 37.3 18.6 30.5 13.6 Kilinochchi 12yrs 20 20.0 60.0 15.0 5.0
15yrs 20 20.0 30.0 20.0 30.0
35-44yrs 20 20.0 15.0 55.0 10.0
65-74yrs 20 15.0 25.0 10.0 50.0 Mannar 12yrs 21 47.6 9.5 42.9 0.0
15yrs 20 80.0 15.0 5.0 0.0
35-44yrs 20 30.0 5.0 55.0 10.0
65-74yrs 20 5.0 20.0 50.0 25.0 Mullaitivu 12yrs 20 50.0 45.0 5.0 0.0
15yrs 20 70.0 10.0 20.0 0.0
35-44yrs 21 19.0 28.6 47.6 4.8
65-74yrs 20 35.0 15.0 25.0 25.0
93
Table 6.17: Percentage distribution of participants according to the ‘last visit to a dental clinic’ (contd.)
District Age group N Last visit to a dental clinic (%)
Never visited
Within the last year
More than one year ago
Do not remember
Vavuniya 12yrs 20 5.0 90.0 5.0 0.0
15yrs 20 10.0 45.0 45.0 0.0
35-44yrs 20 30.0 40.0 25.0 5.0
65-74yrs 19 52.6 15.8 21.1 10.5 Batticaloa 12yrs 60 56.7 16.7 21.7 5.0
15yrs 60 43.3 15.0 25.0 16.7
35-44yrs 60 11.7 40.0 46.7 1.7
65-74yrs 58 15.5 22.4 43.1 19.0 Ampara 12yrs 99 38.4 32.3 21.2 8.1
15yrs 100 21.0 35.0 31.0 13.0
35-44yrs 97 9.3 33.0 54.6 3.1
65-74yrs 95 17.9 17.9 47.4 16.8 Trincomalee 12yrs 39 61.5 20.5 17.9 0.0
15yrs 40 60.0 15.0 22.5 2.5
35-44yrs 40 12.5 37.5 42.5 7.5
65-74yrs 39 28.2 28.2 30.8 12.8 Kurunegala 12yrs 160 1.3 80.0 12.5 6.3
15yrs 160 2.5 43.1 50.0 4.4
35-44yrs 159 6.9 29.6 57.2 6.3
65-74yrs 160 12.5 23.1 40.0 24.4 Puttalam 12yrs 60 1.7 91.7 5.0 1.7
15yrs 60 6.7 30.0 55.0 8.3
35-44yrs 60 8.3 23.3 51.7 16.7
65-74yrs 60 11.7 30.0 45.0 13.3 Anuradhapura 12yrs 100 27.0 35.0 31.0 7.0
15yrs 100 19.0 33.0 45.0 3.0
35-44yrs 99 13.1 31.3 47.5 8.1
65-74yrs 97 18.6 19.6 52.6 9.3 Polonnaruwa 12yrs 60 5.0 60.0 33.3 1.7
15yrs 60 20.0 38.3 41.7 0.0
35-44yrs 60 3.3 30.0 65.0 1.7
65-74yrs 59 15.3 16.9 62.7 5.1 Badulla 12yrs 80 12.5 58.8 28.8 0.0
15yrs 80 16.3 28.8 51.3 3.8
35-44yrs 80 15.0 31.3 47.5 6.3
65-74yrs 74 28.4 23.0 41.9 6.8 Monaragala 12yrs 60 11.7 86.7 1.7 0.0
15yrs 60 10.0 71.7 16.7 1.7
35-44yrs 60 10.0 25.0 63.3 1.7
65-74yrs 60 23.3 15.0 50.0 11.7 Ratnapura 12yrs 80 36.3 43.8 20.0 0.0
15yrs 80 16.3 33.8 43.8 6.3
35-44yrs 80 17.5 32.5 47.5 2.5
65-74yrs 78 34.6 21.8 41.0 2.6 Kegalle 12yrs 80 0.0 71.3 23.8 5.0
15yrs 80 0.0 31.3 62.5 6.3
35-44yrs 79 7.6 34.2 50.6 7.6
65-74yrs 76 15.8 9.2 59.2 15.8
Dis
tric
t-b
ased
re
sult
s
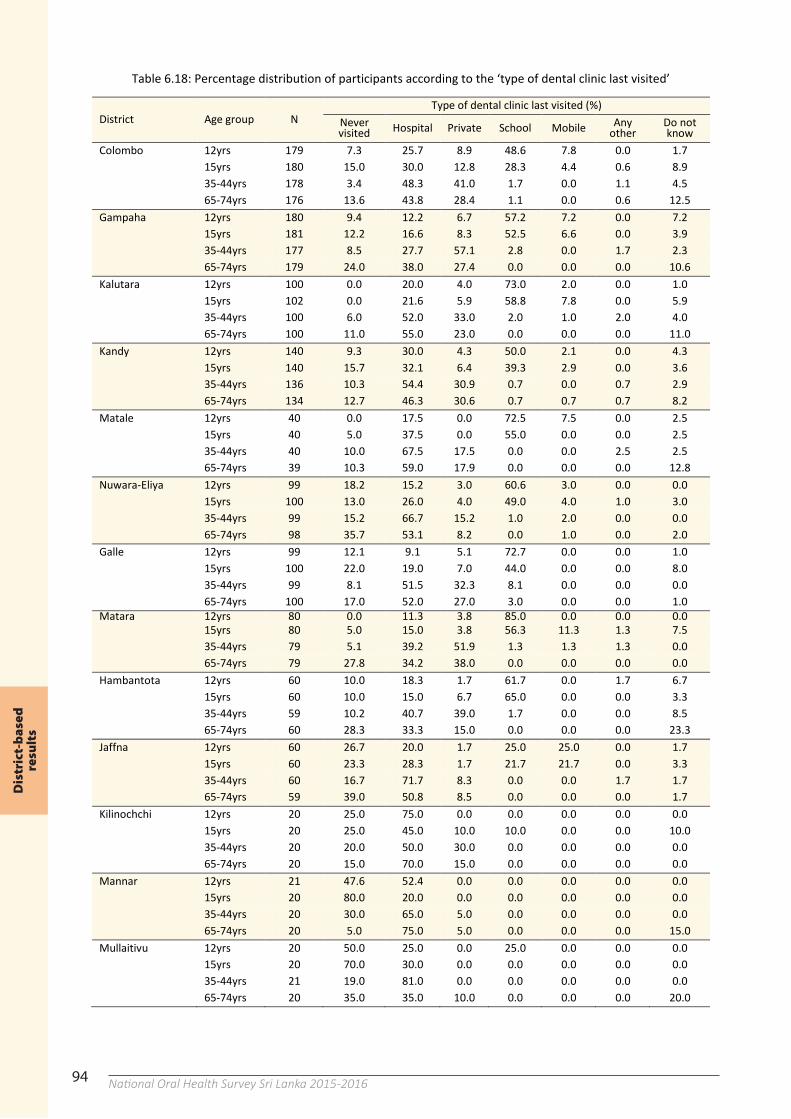
94 National Oral Health Survey Sri Lanka 2015-201694
Table 6.18: Percentage distribution of participants according to the ‘type of dental clinic last visited’
District Age group N Type of dental clinic last visited (%)
Never visited Hospital Private School Mobile Any
other Do not know
Colombo 12yrs 179 7.3 25.7 8.9 48.6 7.8 0.0 1.7
15yrs 180 15.0 30.0 12.8 28.3 4.4 0.6 8.9
35-44yrs 178 3.4 48.3 41.0 1.7 0.0 1.1 4.5
65-74yrs 176 13.6 43.8 28.4 1.1 0.0 0.6 12.5 Gampaha 12yrs 180 9.4 12.2 6.7 57.2 7.2 0.0 7.2
15yrs 181 12.2 16.6 8.3 52.5 6.6 0.0 3.9
35-44yrs 177 8.5 27.7 57.1 2.8 0.0 1.7 2.3
65-74yrs 179 24.0 38.0 27.4 0.0 0.0 0.0 10.6 Kalutara 12yrs 100 0.0 20.0 4.0 73.0 2.0 0.0 1.0
15yrs 102 0.0 21.6 5.9 58.8 7.8 0.0 5.9
35-44yrs 100 6.0 52.0 33.0 2.0 1.0 2.0 4.0
65-74yrs 100 11.0 55.0 23.0 0.0 0.0 0.0 11.0 Kandy 12yrs 140 9.3 30.0 4.3 50.0 2.1 0.0 4.3
15yrs 140 15.7 32.1 6.4 39.3 2.9 0.0 3.6
35-44yrs 136 10.3 54.4 30.9 0.7 0.0 0.7 2.9
65-74yrs 134 12.7 46.3 30.6 0.7 0.7 0.7 8.2 Matale 12yrs 40 0.0 17.5 0.0 72.5 7.5 0.0 2.5
15yrs 40 5.0 37.5 0.0 55.0 0.0 0.0 2.5
35-44yrs 40 10.0 67.5 17.5 0.0 0.0 2.5 2.5
65-74yrs 39 10.3 59.0 17.9 0.0 0.0 0.0 12.8 Nuwara-Eliya 12yrs 99 18.2 15.2 3.0 60.6 3.0 0.0 0.0
15yrs 100 13.0 26.0 4.0 49.0 4.0 1.0 3.0
35-44yrs 99 15.2 66.7 15.2 1.0 2.0 0.0 0.0
65-74yrs 98 35.7 53.1 8.2 0.0 1.0 0.0 2.0 Galle 12yrs 99 12.1 9.1 5.1 72.7 0.0 0.0 1.0
15yrs 100 22.0 19.0 7.0 44.0 0.0 0.0 8.0
35-44yrs 99 8.1 51.5 32.3 8.1 0.0 0.0 0.0
65-74yrs 100 17.0 52.0 27.0 3.0 0.0 0.0 1.0 Matara 12yrs 80 0.0 11.3 3.8 85.0 0.0 0.0 0.0 15yrs 80 5.0 15.0 3.8 56.3 11.3 1.3 7.5
35-44yrs 79 5.1 39.2 51.9 1.3 1.3 1.3 0.0
65-74yrs 79 27.8 34.2 38.0 0.0 0.0 0.0 0.0 Hambantota 12yrs 60 10.0 18.3 1.7 61.7 0.0 1.7 6.7
15yrs 60 10.0 15.0 6.7 65.0 0.0 0.0 3.3
35-44yrs 59 10.2 40.7 39.0 1.7 0.0 0.0 8.5
65-74yrs 60 28.3 33.3 15.0 0.0 0.0 0.0 23.3 Jaffna 12yrs 60 26.7 20.0 1.7 25.0 25.0 0.0 1.7
15yrs 60 23.3 28.3 1.7 21.7 21.7 0.0 3.3
35-44yrs 60 16.7 71.7 8.3 0.0 0.0 1.7 1.7
65-74yrs 59 39.0 50.8 8.5 0.0 0.0 0.0 1.7 Kilinochchi 12yrs 20 25.0 75.0 0.0 0.0 0.0 0.0 0.0
15yrs 20 25.0 45.0 10.0 10.0 0.0 0.0 10.0
35-44yrs 20 20.0 50.0 30.0 0.0 0.0 0.0 0.0
65-74yrs 20 15.0 70.0 15.0 0.0 0.0 0.0 0.0 Mannar 12yrs 21 47.6 52.4 0.0 0.0 0.0 0.0 0.0
15yrs 20 80.0 20.0 0.0 0.0 0.0 0.0 0.0
35-44yrs 20 30.0 65.0 5.0 0.0 0.0 0.0 0.0
65-74yrs 20 5.0 75.0 5.0 0.0 0.0 0.0 15.0 Mullaitivu 12yrs 20 50.0 25.0 0.0 25.0 0.0 0.0 0.0
15yrs 20 70.0 30.0 0.0 0.0 0.0 0.0 0.0
35-44yrs 21 19.0 81.0 0.0 0.0 0.0 0.0 0.0
65-74yrs 20 35.0 35.0 10.0 0.0 0.0 0.0 20.0
Dis
tric
t-b
ased
re
sult
s
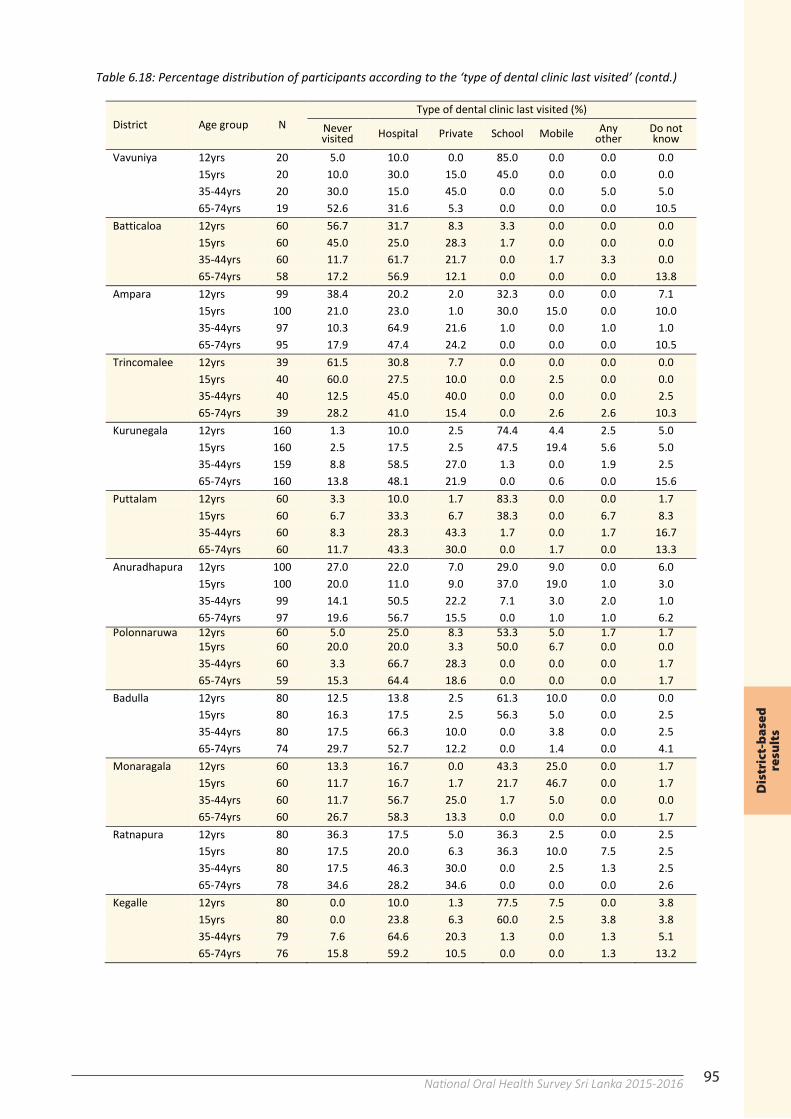
95National Oral Health Survey Sri Lanka 2015-201694
Table 6.18: Percentage distribution of participants according to the ‘type of dental clinic last visited’
District Age group N Type of dental clinic last visited (%)
Never visited Hospital Private School Mobile Any
other Do not know
Colombo 12yrs 179 7.3 25.7 8.9 48.6 7.8 0.0 1.7
15yrs 180 15.0 30.0 12.8 28.3 4.4 0.6 8.9
35-44yrs 178 3.4 48.3 41.0 1.7 0.0 1.1 4.5
65-74yrs 176 13.6 43.8 28.4 1.1 0.0 0.6 12.5 Gampaha 12yrs 180 9.4 12.2 6.7 57.2 7.2 0.0 7.2
15yrs 181 12.2 16.6 8.3 52.5 6.6 0.0 3.9
35-44yrs 177 8.5 27.7 57.1 2.8 0.0 1.7 2.3
65-74yrs 179 24.0 38.0 27.4 0.0 0.0 0.0 10.6 Kalutara 12yrs 100 0.0 20.0 4.0 73.0 2.0 0.0 1.0
15yrs 102 0.0 21.6 5.9 58.8 7.8 0.0 5.9
35-44yrs 100 6.0 52.0 33.0 2.0 1.0 2.0 4.0
65-74yrs 100 11.0 55.0 23.0 0.0 0.0 0.0 11.0 Kandy 12yrs 140 9.3 30.0 4.3 50.0 2.1 0.0 4.3
15yrs 140 15.7 32.1 6.4 39.3 2.9 0.0 3.6
35-44yrs 136 10.3 54.4 30.9 0.7 0.0 0.7 2.9
65-74yrs 134 12.7 46.3 30.6 0.7 0.7 0.7 8.2 Matale 12yrs 40 0.0 17.5 0.0 72.5 7.5 0.0 2.5
15yrs 40 5.0 37.5 0.0 55.0 0.0 0.0 2.5
35-44yrs 40 10.0 67.5 17.5 0.0 0.0 2.5 2.5
65-74yrs 39 10.3 59.0 17.9 0.0 0.0 0.0 12.8 Nuwara-Eliya 12yrs 99 18.2 15.2 3.0 60.6 3.0 0.0 0.0
15yrs 100 13.0 26.0 4.0 49.0 4.0 1.0 3.0
35-44yrs 99 15.2 66.7 15.2 1.0 2.0 0.0 0.0
65-74yrs 98 35.7 53.1 8.2 0.0 1.0 0.0 2.0 Galle 12yrs 99 12.1 9.1 5.1 72.7 0.0 0.0 1.0
15yrs 100 22.0 19.0 7.0 44.0 0.0 0.0 8.0
35-44yrs 99 8.1 51.5 32.3 8.1 0.0 0.0 0.0
65-74yrs 100 17.0 52.0 27.0 3.0 0.0 0.0 1.0 Matara 12yrs 80 0.0 11.3 3.8 85.0 0.0 0.0 0.0 15yrs 80 5.0 15.0 3.8 56.3 11.3 1.3 7.5
35-44yrs 79 5.1 39.2 51.9 1.3 1.3 1.3 0.0
65-74yrs 79 27.8 34.2 38.0 0.0 0.0 0.0 0.0 Hambantota 12yrs 60 10.0 18.3 1.7 61.7 0.0 1.7 6.7
15yrs 60 10.0 15.0 6.7 65.0 0.0 0.0 3.3
35-44yrs 59 10.2 40.7 39.0 1.7 0.0 0.0 8.5
65-74yrs 60 28.3 33.3 15.0 0.0 0.0 0.0 23.3 Jaffna 12yrs 60 26.7 20.0 1.7 25.0 25.0 0.0 1.7
15yrs 60 23.3 28.3 1.7 21.7 21.7 0.0 3.3
35-44yrs 60 16.7 71.7 8.3 0.0 0.0 1.7 1.7
65-74yrs 59 39.0 50.8 8.5 0.0 0.0 0.0 1.7 Kilinochchi 12yrs 20 25.0 75.0 0.0 0.0 0.0 0.0 0.0
15yrs 20 25.0 45.0 10.0 10.0 0.0 0.0 10.0
35-44yrs 20 20.0 50.0 30.0 0.0 0.0 0.0 0.0
65-74yrs 20 15.0 70.0 15.0 0.0 0.0 0.0 0.0 Mannar 12yrs 21 47.6 52.4 0.0 0.0 0.0 0.0 0.0
15yrs 20 80.0 20.0 0.0 0.0 0.0 0.0 0.0
35-44yrs 20 30.0 65.0 5.0 0.0 0.0 0.0 0.0
65-74yrs 20 5.0 75.0 5.0 0.0 0.0 0.0 15.0 Mullaitivu 12yrs 20 50.0 25.0 0.0 25.0 0.0 0.0 0.0
15yrs 20 70.0 30.0 0.0 0.0 0.0 0.0 0.0
35-44yrs 21 19.0 81.0 0.0 0.0 0.0 0.0 0.0
65-74yrs 20 35.0 35.0 10.0 0.0 0.0 0.0 20.0
95
Table 6.18: Percentage distribution of participants according to the ‘type of dental clinic last visited’ (contd.)
District Age group N Type of dental clinic last visited (%)
Never visited Hospital Private School Mobile Any
other Do not know
Vavuniya 12yrs 20 5.0 10.0 0.0 85.0 0.0 0.0 0.0
15yrs 20 10.0 30.0 15.0 45.0 0.0 0.0 0.0
35-44yrs 20 30.0 15.0 45.0 0.0 0.0 5.0 5.0
65-74yrs 19 52.6 31.6 5.3 0.0 0.0 0.0 10.5 Batticaloa 12yrs 60 56.7 31.7 8.3 3.3 0.0 0.0 0.0
15yrs 60 45.0 25.0 28.3 1.7 0.0 0.0 0.0
35-44yrs 60 11.7 61.7 21.7 0.0 1.7 3.3 0.0
65-74yrs 58 17.2 56.9 12.1 0.0 0.0 0.0 13.8 Ampara 12yrs 99 38.4 20.2 2.0 32.3 0.0 0.0 7.1
15yrs 100 21.0 23.0 1.0 30.0 15.0 0.0 10.0
35-44yrs 97 10.3 64.9 21.6 1.0 0.0 1.0 1.0
65-74yrs 95 17.9 47.4 24.2 0.0 0.0 0.0 10.5 Trincomalee 12yrs 39 61.5 30.8 7.7 0.0 0.0 0.0 0.0
15yrs 40 60.0 27.5 10.0 0.0 2.5 0.0 0.0
35-44yrs 40 12.5 45.0 40.0 0.0 0.0 0.0 2.5
65-74yrs 39 28.2 41.0 15.4 0.0 2.6 2.6 10.3 Kurunegala 12yrs 160 1.3 10.0 2.5 74.4 4.4 2.5 5.0
15yrs 160 2.5 17.5 2.5 47.5 19.4 5.6 5.0
35-44yrs 159 8.8 58.5 27.0 1.3 0.0 1.9 2.5
65-74yrs 160 13.8 48.1 21.9 0.0 0.6 0.0 15.6 Puttalam 12yrs 60 3.3 10.0 1.7 83.3 0.0 0.0 1.7
15yrs 60 6.7 33.3 6.7 38.3 0.0 6.7 8.3
35-44yrs 60 8.3 28.3 43.3 1.7 0.0 1.7 16.7
65-74yrs 60 11.7 43.3 30.0 0.0 1.7 0.0 13.3 Anuradhapura 12yrs 100 27.0 22.0 7.0 29.0 9.0 0.0 6.0
15yrs 100 20.0 11.0 9.0 37.0 19.0 1.0 3.0
35-44yrs 99 14.1 50.5 22.2 7.1 3.0 2.0 1.0
65-74yrs 97 19.6 56.7 15.5 0.0 1.0 1.0 6.2 Polonnaruwa 12yrs 60 5.0 25.0 8.3 53.3 5.0 1.7 1.7 15yrs 60 20.0 20.0 3.3 50.0 6.7 0.0 0.0
35-44yrs 60 3.3 66.7 28.3 0.0 0.0 0.0 1.7
65-74yrs 59 15.3 64.4 18.6 0.0 0.0 0.0 1.7 Badulla 12yrs 80 12.5 13.8 2.5 61.3 10.0 0.0 0.0
15yrs 80 16.3 17.5 2.5 56.3 5.0 0.0 2.5
35-44yrs 80 17.5 66.3 10.0 0.0 3.8 0.0 2.5
65-74yrs 74 29.7 52.7 12.2 0.0 1.4 0.0 4.1 Monaragala 12yrs 60 13.3 16.7 0.0 43.3 25.0 0.0 1.7
15yrs 60 11.7 16.7 1.7 21.7 46.7 0.0 1.7
35-44yrs 60 11.7 56.7 25.0 1.7 5.0 0.0 0.0
65-74yrs 60 26.7 58.3 13.3 0.0 0.0 0.0 1.7 Ratnapura 12yrs 80 36.3 17.5 5.0 36.3 2.5 0.0 2.5
15yrs 80 17.5 20.0 6.3 36.3 10.0 7.5 2.5
35-44yrs 80 17.5 46.3 30.0 0.0 2.5 1.3 2.5
65-74yrs 78 34.6 28.2 34.6 0.0 0.0 0.0 2.6 Kegalle 12yrs 80 0.0 10.0 1.3 77.5 7.5 0.0 3.8
15yrs 80 0.0 23.8 6.3 60.0 2.5 3.8 3.8
35-44yrs 79 7.6 64.6 20.3 1.3 0.0 1.3 5.1
65-74yrs 76 15.8 59.2 10.5 0.0 0.0 1.3 13.2
Dis
tric
t-b
ased
re
sult
s
96 National Oral Health Survey Sri Lanka 2015-2016
Dis
tric
t-b
ased
re
sult
s
97National Oral Health Survey Sri Lanka 2015-201697
Chapter 7
References
1 Annual Health Bulletin 2015. Colombo: Ministry of Health, Nutrition and Indigenous Medicine (Sri Lanka); 2017.
2 Population of Sri Lanka by district: Census of Population and Housing 2011. Colombo: Department of census and statistics (Sri Lanka); 2012.
3 World Bank. Population total. [online] Available from: https://data.worldbank.org/indicator/SP.POP.TOTL?locations=LK [Accessed on 20th October 2018]
4 World Bank. Sri Lanka/GDP per capita. [online] Available from: https://data.worldbank.org/country/Sri-Lanka [Accessed on: 25th August 2018].
5 Amarasinghe SN, Thowfeek FR, Anuranga C, Dalpatadu KCS, and Rannan-Eliya RP. Sri Lanka Health Accounts: National Health Expenditure 1990–2014. Health Expenditure Series No.4. Colombo: Institute for Health Policy (Sri Lanka); 2015.
6 World Bank. Current health expenditure (% of GDP) [online] Available from: https://data.worldbank.org/indicator/SH.XPD.CHEX.GD.ZS?locations=LK [Accessed on 20th October 2018]
7 HDI Cartagena-Human Development Reports-UNDP [online] Available from: http://hdr.undp.org/sites/default/hdi_series_cartagena.xlsx [Accessed on 17th October 2018]
8 Human Development Data (1990-2017) [online] Available from: http://hdr.undp.org/en/data [Accessed on: 17th October 2018]
9 Annual Health Bulletin 2002. Colombo: Ministry of Health (Sri Lanka), 2003.
10 World Bank. Birth rate, crude (per 1000 people) [online] Available from: https://data.worldbank.org/indicator/SP.DYN.CBRT.IN?locations=LK [Accessed on 20th October 2018]
11 World Bank. Death rate, crude (per 1000 people) [online] Available from: https://data.worldbank.org/indicator/SP.DYN.CDRT.IN?locations=LK [Accessed on 20th October 2018]
12 World Bank. Life expectancy at birth-total (years) [online] Available from: https://data.worldbank.org/indicator/SP.DYN.LE00.IN?locations=LK [Accessed on 20th October 2018]
13 World Bank. Maternal mortality ratio (modeled estimate, per 100,000 live births). [online] Available from: https://data.worldbank.org/indicator/SH.STA.MMRT?locations=LK [Accessed on 20th October 2018]
14 World Bank. Mortality rate, infant (per 1,000 live births). [online] Available from: https://data.worldbank.org/indicator/SP.DYN.IMRT.IN?locations=LK [Accessed on 20th October 2018]
15 National Oral Health Survey Sri Lanka 1983-84. Colombo: Ministry of Health (Sri Lanka); 1985.
16 National Oral Health Survey Sri Lanka 1994/95. Colombo: Ministry of Health (Sri Lanka); 1997.
17 Annual Health Bulletin 1996. Colombo: Ministry of Health (Sri Lanka); 1997.
18 National Oral Health Survey Sri Lanka 2002-2003, Colombo: Ministry of Healthcare and Nutrition (Sri Lanka); 2009.
19 Non Communicable Disease Risk Factor Survey Sri Lanka. Colombo: Ministry of Health (Sri Lanka); 2012.
20 Ratnayake N, Ekanayake L. Soft drink consumption in Sri Lankan adolescents. Public Health Nutrition. 2012 Aug; 15(8): 1333-7. Available from: DOI: 10.1017/S1368980012001061
21 Jayawardena R, Byrne NM, Soares MJ, Katulanda P, Hills AP. Food consumption of Sri Lankan adults: an appraisal of serving characteristics. [online] Public Health Nutrition. 2013 Apr;16(4):653-8. Available from: DOI: 10.1017/S1368980012003011.
22 Somatunga LC, Sinha DN, Sumanasekera P, Galapatti K, Rinchen S, Kahandaliyanage A, Mehta FR, Jayasuriya-Dissanayake NL.[online] Smokeless tobacco use in Sri Lanka. Journal of Cancer October-December 2012;49(4) Downloaded free from: http://www.indianjcancer.com on Monday, October 22, 2018, IP: 112.134.105.47
23 Oral Health Surveys: Basic Methods – 5th edition. Geneva: World Health Organization; 2013.
24 Lwanga SK, Lemeshow S. Sample size determination in health studies. A practical manual. Geneva: World Health Organization; 1991.
Ref
eren
ces
98 National Oral Health Survey Sri Lanka 2015-2016
98
99
Chapter 8
Annexure
Annexure 1: Distribution of clusters according to districts
Table 8.1: Distribution of clusters according to districts
Cluster No. District Total student
population Cumulative
total No. of clusters
Total Urban Rural % Urban clusters 1 Colombo 361,661 - 9 6 3 66%
2 Gampaha 343,911 705,572 9 3 6 33% 3 Kalutara 210,300 915,872 5 1 4 20% 4 Kandy 270,687 1,186,559 7 2 5 28.5% 5 Matale 95,240 1,281,799 2 0 2 0% 6 Nuwara-Eliya 156,366 1,438,165 5 2 3 40% 7 Galle 217,676 1,655,841 5 1 4 20%
8 Matara 160,489 1,816,330 4 2 2 50% 9 Hambantota 126,006 1,942,336 3 1 2 33%
10 Jaffna 130,468 2,072,804 3 1 2 33% 11 Kilinochchi 26,158 2,098,962 1 0 1 0% 12 Mannar 27,820 2,126,782 1 1 0 100% 13 Mullaithivu 12,020 2,138,802 1 0 1 0% 14 Vavuniya 43,199 2,182,001 1 1 0 100% 15 Batticaloa 130,770 2,312,771 3 0 3 0% 16 Ampara 160,299 2,473,070 4 1 3 25% 17 Trincomalee 99,468 2,572,538 2 1 1 50% 18 Kurunegala 312,757 2,885,295 8 1 7 12.5%
19 Puttlam 160,079 3,045,374 4 0 4 0% 20 Anuradhapura 175,710 3,221,084 5 1 4 20% 21 Polonnaruwa 73,691 3,294,775 2 0 2 0% 22 Badulla 182,211 3,476,986 4 0 4 0%
23 Monaragala 94,905 3,571,891 3 0 3 0% 24 Ratnapura 208,864 3,780,755 5 3 2 60% 25 Kegalle 159,317 3,940,072 4 0 4 0%
TOTAL 3,940,072 - 100 28 72 28% Sampling interval = 3,940,072/100 = 39,400 Random number = 19,330
Ref
eren
ces
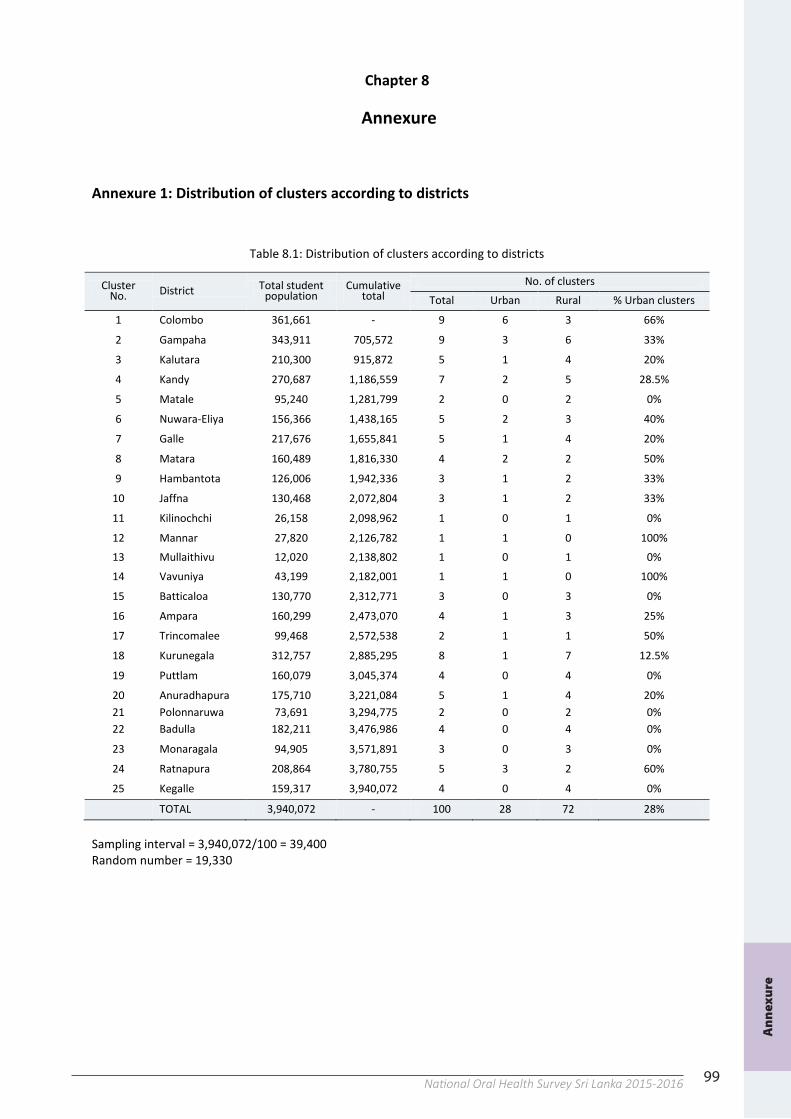
99National Oral Health Survey Sri Lanka 2015-2016
98
99
Chapter 8
Annexure
Annexure 1: Distribution of clusters according to districts
Table 8.1: Distribution of clusters according to districts
Cluster No. District Total student
population Cumulative
total No. of clusters
Total Urban Rural % Urban clusters 1 Colombo 361,661 - 9 6 3 66%
2 Gampaha 343,911 705,572 9 3 6 33% 3 Kalutara 210,300 915,872 5 1 4 20% 4 Kandy 270,687 1,186,559 7 2 5 28.5% 5 Matale 95,240 1,281,799 2 0 2 0% 6 Nuwara-Eliya 156,366 1,438,165 5 2 3 40% 7 Galle 217,676 1,655,841 5 1 4 20%
8 Matara 160,489 1,816,330 4 2 2 50% 9 Hambantota 126,006 1,942,336 3 1 2 33%
10 Jaffna 130,468 2,072,804 3 1 2 33% 11 Kilinochchi 26,158 2,098,962 1 0 1 0% 12 Mannar 27,820 2,126,782 1 1 0 100% 13 Mullaithivu 12,020 2,138,802 1 0 1 0% 14 Vavuniya 43,199 2,182,001 1 1 0 100% 15 Batticaloa 130,770 2,312,771 3 0 3 0% 16 Ampara 160,299 2,473,070 4 1 3 25% 17 Trincomalee 99,468 2,572,538 2 1 1 50% 18 Kurunegala 312,757 2,885,295 8 1 7 12.5%
19 Puttlam 160,079 3,045,374 4 0 4 0% 20 Anuradhapura 175,710 3,221,084 5 1 4 20% 21 Polonnaruwa 73,691 3,294,775 2 0 2 0% 22 Badulla 182,211 3,476,986 4 0 4 0%
23 Monaragala 94,905 3,571,891 3 0 3 0% 24 Ratnapura 208,864 3,780,755 5 3 2 60% 25 Kegalle 159,317 3,940,072 4 0 4 0%
TOTAL 3,940,072 - 100 28 72 28% Sampling interval = 3,940,072/100 = 39,400 Random number = 19,330
An
nex
ure
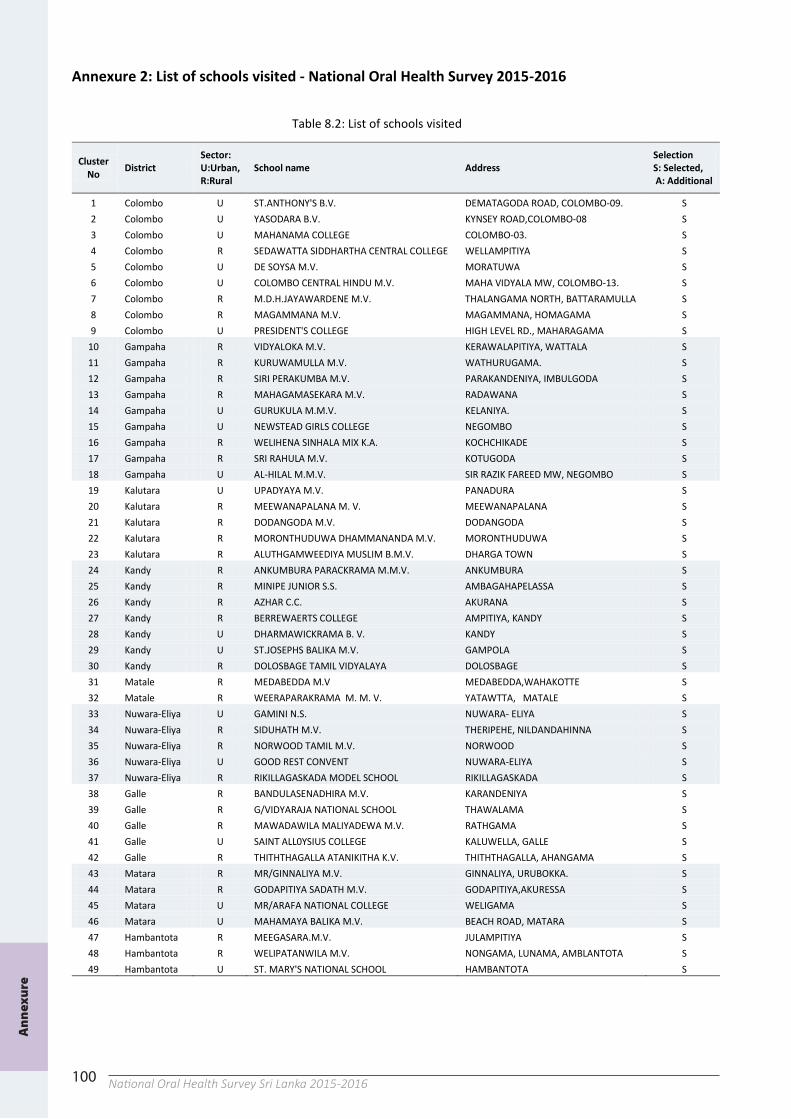
100 National Oral Health Survey Sri Lanka 2015-2016100
Annexure 2: List of schools visited - National Oral Health Survey 2015-2016
Table 8.2: List of schools visited
Cluster No District
Sector: U:Urban, R:Rural
School name Address Selection S: Selected, A: Additional
1 Colombo U ST.ANTHONY'S B.V. DEMATAGODA ROAD, COLOMBO-09. S 2 Colombo U YASODARA B.V. KYNSEY ROAD,COLOMBO-08 S 3 Colombo U MAHANAMA COLLEGE COLOMBO-03. S 4 Colombo R SEDAWATTA SIDDHARTHA CENTRAL COLLEGE WELLAMPITIYA S 5 Colombo U DE SOYSA M.V. MORATUWA S 6 Colombo U COLOMBO CENTRAL HINDU M.V. MAHA VIDYALA MW, COLOMBO-13. S 7 Colombo R M.D.H.JAYAWARDENE M.V. THALANGAMA NORTH, BATTARAMULLA S 8 Colombo R MAGAMMANA M.V. MAGAMMANA, HOMAGAMA S 9 Colombo U PRESIDENT'S COLLEGE HIGH LEVEL RD., MAHARAGAMA S
10 Gampaha R VIDYALOKA M.V. KERAWALAPITIYA, WATTALA S 11 Gampaha R KURUWAMULLA M.V. WATHURUGAMA. S 12 Gampaha R SIRI PERAKUMBA M.V. PARAKANDENIYA, IMBULGODA S 13 Gampaha R MAHAGAMASEKARA M.V. RADAWANA S 14 Gampaha U GURUKULA M.M.V. KELANIYA. S 15 Gampaha U NEWSTEAD GIRLS COLLEGE NEGOMBO S 16 Gampaha R WELIHENA SINHALA MIX K.A. KOCHCHIKADE S 17 Gampaha R SRI RAHULA M.V. KOTUGODA S 18 Gampaha U AL-HILAL M.M.V. SIR RAZIK FAREED MW, NEGOMBO S 19 Kalutara U UPADYAYA M.V. PANADURA S 20 Kalutara R MEEWANAPALANA M. V. MEEWANAPALANA S 21 Kalutara R DODANGODA M.V. DODANGODA S 22 Kalutara R MORONTHUDUWA DHAMMANANDA M.V. MORONTHUDUWA S 23 Kalutara R ALUTHGAMWEEDIYA MUSLIM B.M.V. DHARGA TOWN S 24 Kandy R ANKUMBURA PARACKRAMA M.M.V. ANKUMBURA S 25 Kandy R MINIPE JUNIOR S.S. AMBAGAHAPELASSA S 26 Kandy R AZHAR C.C. AKURANA S 27 Kandy R BERREWAERTS COLLEGE AMPITIYA, KANDY S 28 Kandy U DHARMAWICKRAMA B. V. KANDY S 29 Kandy U ST.JOSEPHS BALIKA M.V. GAMPOLA S 30 Kandy R DOLOSBAGE TAMIL VIDYALAYA DOLOSBAGE S 31 Matale R MEDABEDDA M.V MEDABEDDA,WAHAKOTTE S 32 Matale R WEERAPARAKRAMA M. M. V. YATAWTTA, MATALE S 33 Nuwara-Eliya U GAMINI N.S. NUWARA- ELIYA S 34 Nuwara-Eliya R SIDUHATH M.V. THERIPEHE, NILDANDAHINNA S 35 Nuwara-Eliya R NORWOOD TAMIL M.V. NORWOOD S 36 Nuwara-Eliya U GOOD REST CONVENT NUWARA-ELIYA S 37 Nuwara-Eliya R RIKILLAGASKADA MODEL SCHOOL RIKILLAGASKADA S 38 Galle R BANDULASENADHIRA M.V. KARANDENIYA S 39 Galle R G/VIDYARAJA NATIONAL SCHOOL THAWALAMA S 40 Galle R MAWADAWILA MALIYADEWA M.V. RATHGAMA S 41 Galle U SAINT ALL0YSIUS COLLEGE KALUWELLA, GALLE S 42 Galle R THITHTHAGALLA ATANIKITHA K.V. THITHTHAGALLA, AHANGAMA S 43 Matara R MR/GINNALIYA M.V. GINNALIYA, URUBOKKA. S 44 Matara R GODAPITIYA SADATH M.V. GODAPITIYA,AKURESSA S 45 Matara U MR/ARAFA NATIONAL COLLEGE WELIGAMA S 46 Matara U MAHAMAYA BALIKA M.V. BEACH ROAD, MATARA S 47 Hambantota R MEEGASARA.M.V. JULAMPITIYA S 48 Hambantota R WELIPATANWILA M.V. NONGAMA, LUNAMA, AMBLANTOTA S 49 Hambantota U ST. MARY'S NATIONAL SCHOOL HAMBANTOTA S
101
Table 8.2: List of schools visited (cont.)
Cluster No District
Sector: U:Urban, R:Rural
School name Address Selection S: Selected, A: Additional
50 Jaffna R J/DR.A.THIYAGARAJAH M.M.V. KARAINAGAR S 51 Jaffna R J/VAYAVILAN M.M.V. URUMPIRAI S 52 Jaffna U DRIEBERG COLLEGE KANDY ROAD, CHAVAKACHCHERI S 53 Kilinochchi R KN/KILINOCHCHI CENTRAL COLLEGE ANANTHANAGAR WEST,KILINOCHCHI S 54 Mannar U TALAIMANNAR PIER G.T.M.S. TALAIMANNAR S 55 Vavuniya U VAVUNIYA HINDU COLLEGE KOVILPUTHUKULAM,VAVUNIYA S 56 Mulaitivu R MU/PALINAGAR M.V. PALINAGAR VAVUNIKKULAM S 57 Batticaloa R BT/AL AZHAR VIDYALAYA KADDUPPALLI ROAD, ERAVUR. S 58 Batticaloa R BT/PUTHUKUDIYIRUPPU KANNAKI M.V. PUTHUKKUDIYIRUPPU (30158) S 59 Batticaloa R BT/ODDAMAVADY FATHIMA B.M.V. ODDAMAVADY-02 S 60 Ampara R AM/ POLWATHTHA M.V. POLWAGA JANAPADAYA- AMPARA S 61 Ampara U KM/ZAHIRA COLLEGE (N.S) ZAHIRA COLLEGE ROAD,KALMUNAI S 62 Ampara R AN-NOOR VIDYALAYA ADDALAICHCHENAI 32350 S
R AL-ARHAM VIDYALAYA ADDALAICHCHENAI A
63 Ampara R AM/DEHI/KUDAGALA M.V. KUDAGALA,DEHIATTAKANDIYA S 64 Trincomalee U ZAHIRA C. MOOR STREET, TRINCOMALEE S 65 Trincomalee R T/AL-HITHAYA M.V. MUTTUR S 66 Kurunegala R KU/WADAKADA M.V. WADAKADA S 67 Kurunegala R SRI GNANODAYA M.M.V. WARIYAPOLA S 68 Kurunegala R MAYURAPADA K.V. NARAMMALA S 69 Kurunegala U KU/HISBULLA C.C. THELIYAGONNA, KURUNEGALA. S 70 Kurunegala R BARAGEDARA M.M.V. ATHUNGAHAKOTUWA S 71 Kurunegala R ELABADAGAMA SINHALA M.V. ELABADAGAMA S 72 Kurunegala R VIJABA M.M.V. MAHO S 73 Kurunegala R HULUGALLA M.V. NIKAWERATIYA S 74 Puttalam R THABBOWA M.V. THABBOWA, PUTTALAM S 75 Puttalam R KADAYAMOTTE K.V. MADURANKULIYA S 76 Puttalam R KARUKKUWA SUGATHANANDA M.V. MADAMPE S 77 Puttalam R MARAWILA BOYS K.V. MARAWILA S 78 Anuradhapura R MAHADIVULWEWA V. MAHADIVULWEWA,ETAWEERAGOLLEWA S 79 Anuradhapura U A/SWARNAPALI B.M.V. ANURADHAPURA S 80 Anuradhapura R VIDYARTHA MAHA VIDYALAYA PAHALAMARAGAHAWEWA S 81 Anuradhapura R GALKULAMA DAMMADINNA M.V. GALKULAMA S 82 Anuradhapura R IKIRIGOLLEWA MUSLIM M.V. IKIRIGOLLEWA, WAHAMALGOLLEWA S 83 Polonnaruwa R ROYAL CENTAL COLLEGE NEW TOWN,POLONNARUWA S 84 Polonnaruwa R RADAVIGEOYA K.V. ATTANAKADAWALA,POLONNARUWA S 85 Badulla R D.S.SENANAYAKA JATIKA PASALA KANDAKETIYA S 86 Badulla R BANDARAWELA M.M.V. KINEGAMA, BANDARAWELA S 87 Badulla R B/PRAGHNASENA M.V. NUWARAELIYA ROAD, BORAGAS S 88 Badulla R CRAIG T.M.V. DOOLGOLLA S.P.O, BANDARAWELA S
R BANDARAWELA T.V. BANDARAWELA A
89 Monaragala R MO/DODAMGOLLA M.V. DODAMGOLLA-BIBILE S 90 Monaragala R MALWATTAWALA M.M.V. WELLAWAYA. S 91 Monaragala R VIPULANANDA T.M.V. MONARAGALA S 92 Ratnapura U ST.ALOYSIUS NATIONAL SCHOOL CHURCH ROAD, RATHNAPURA S 93 Ratnapura U SRI BUDDHA JAYANTHI M.M.V. BALANGODA S 94 Ratnapura R UDAWELA M.V. OPANAYAKA S 95 Ratnapura R WALALGODA V. PANAMURA S 96 Ratnapura U BALANGODA T.M.V. RASSAGALA ROAD, BALANGODA S 97 Kegalle R DERANIYAGALA K.V. DERANIYAGALA S 98 Kegalle R SUJTHA K.V. DALUGGALA,RAMBUKKANA S 99 Kegalle R HATHGAMPOLA M.V. HATHGAMPOLA,ARANAYAKA S
100 Kegalle R BELIGALA BODIRAJA M.V. BELIGALA S
100
Annexure 2: List of schools visited - National Oral Health Survey 2015-2016
Table 8.2: List of schools visited
Cluster No District
Sector: U:Urban, R:Rural
School name Address Selection S: Selected, A: Additional
1 Colombo U ST.ANTHONY'S B.V. DEMATAGODA ROAD, COLOMBO-09. S 2 Colombo U YASODARA B.V. KYNSEY ROAD,COLOMBO-08 S 3 Colombo U MAHANAMA COLLEGE COLOMBO-03. S 4 Colombo R SEDAWATTA SIDDHARTHA CENTRAL COLLEGE WELLAMPITIYA S 5 Colombo U DE SOYSA M.V. MORATUWA S 6 Colombo U COLOMBO CENTRAL HINDU M.V. MAHA VIDYALA MW, COLOMBO-13. S 7 Colombo R M.D.H.JAYAWARDENE M.V. THALANGAMA NORTH, BATTARAMULLA S 8 Colombo R MAGAMMANA M.V. MAGAMMANA, HOMAGAMA S 9 Colombo U PRESIDENT'S COLLEGE HIGH LEVEL RD., MAHARAGAMA S
10 Gampaha R VIDYALOKA M.V. KERAWALAPITIYA, WATTALA S 11 Gampaha R KURUWAMULLA M.V. WATHURUGAMA. S 12 Gampaha R SIRI PERAKUMBA M.V. PARAKANDENIYA, IMBULGODA S 13 Gampaha R MAHAGAMASEKARA M.V. RADAWANA S 14 Gampaha U GURUKULA M.M.V. KELANIYA. S 15 Gampaha U NEWSTEAD GIRLS COLLEGE NEGOMBO S 16 Gampaha R WELIHENA SINHALA MIX K.A. KOCHCHIKADE S 17 Gampaha R SRI RAHULA M.V. KOTUGODA S 18 Gampaha U AL-HILAL M.M.V. SIR RAZIK FAREED MW, NEGOMBO S 19 Kalutara U UPADYAYA M.V. PANADURA S 20 Kalutara R MEEWANAPALANA M. V. MEEWANAPALANA S 21 Kalutara R DODANGODA M.V. DODANGODA S 22 Kalutara R MORONTHUDUWA DHAMMANANDA M.V. MORONTHUDUWA S 23 Kalutara R ALUTHGAMWEEDIYA MUSLIM B.M.V. DHARGA TOWN S 24 Kandy R ANKUMBURA PARACKRAMA M.M.V. ANKUMBURA S 25 Kandy R MINIPE JUNIOR S.S. AMBAGAHAPELASSA S 26 Kandy R AZHAR C.C. AKURANA S 27 Kandy R BERREWAERTS COLLEGE AMPITIYA, KANDY S 28 Kandy U DHARMAWICKRAMA B. V. KANDY S 29 Kandy U ST.JOSEPHS BALIKA M.V. GAMPOLA S 30 Kandy R DOLOSBAGE TAMIL VIDYALAYA DOLOSBAGE S 31 Matale R MEDABEDDA M.V MEDABEDDA,WAHAKOTTE S 32 Matale R WEERAPARAKRAMA M. M. V. YATAWTTA, MATALE S 33 Nuwara-Eliya U GAMINI N.S. NUWARA- ELIYA S 34 Nuwara-Eliya R SIDUHATH M.V. THERIPEHE, NILDANDAHINNA S 35 Nuwara-Eliya R NORWOOD TAMIL M.V. NORWOOD S 36 Nuwara-Eliya U GOOD REST CONVENT NUWARA-ELIYA S 37 Nuwara-Eliya R RIKILLAGASKADA MODEL SCHOOL RIKILLAGASKADA S 38 Galle R BANDULASENADHIRA M.V. KARANDENIYA S 39 Galle R G/VIDYARAJA NATIONAL SCHOOL THAWALAMA S 40 Galle R MAWADAWILA MALIYADEWA M.V. RATHGAMA S 41 Galle U SAINT ALL0YSIUS COLLEGE KALUWELLA, GALLE S 42 Galle R THITHTHAGALLA ATANIKITHA K.V. THITHTHAGALLA, AHANGAMA S 43 Matara R MR/GINNALIYA M.V. GINNALIYA, URUBOKKA. S 44 Matara R GODAPITIYA SADATH M.V. GODAPITIYA,AKURESSA S 45 Matara U MR/ARAFA NATIONAL COLLEGE WELIGAMA S 46 Matara U MAHAMAYA BALIKA M.V. BEACH ROAD, MATARA S 47 Hambantota R MEEGASARA.M.V. JULAMPITIYA S 48 Hambantota R WELIPATANWILA M.V. NONGAMA, LUNAMA, AMBLANTOTA S 49 Hambantota U ST. MARY'S NATIONAL SCHOOL HAMBANTOTA S
An
nex
ure
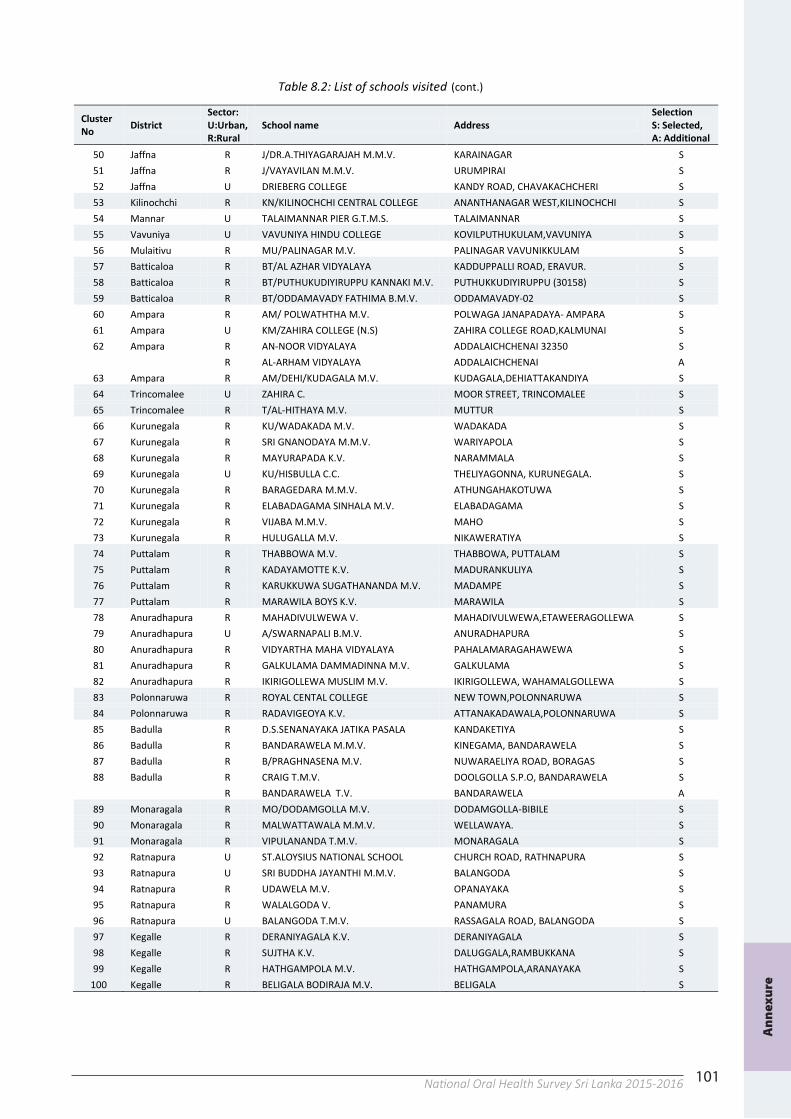
101National Oral Health Survey Sri Lanka 2015-2016101
Table 8.2: List of schools visited (cont.)
Cluster No District
Sector: U:Urban, R:Rural
School name Address Selection S: Selected, A: Additional
50 Jaffna R J/DR.A.THIYAGARAJAH M.M.V. KARAINAGAR S 51 Jaffna R J/VAYAVILAN M.M.V. URUMPIRAI S 52 Jaffna U DRIEBERG COLLEGE KANDY ROAD, CHAVAKACHCHERI S 53 Kilinochchi R KN/KILINOCHCHI CENTRAL COLLEGE ANANTHANAGAR WEST,KILINOCHCHI S 54 Mannar U TALAIMANNAR PIER G.T.M.S. TALAIMANNAR S 55 Vavuniya U VAVUNIYA HINDU COLLEGE KOVILPUTHUKULAM,VAVUNIYA S 56 Mulaitivu R MU/PALINAGAR M.V. PALINAGAR VAVUNIKKULAM S 57 Batticaloa R BT/AL AZHAR VIDYALAYA KADDUPPALLI ROAD, ERAVUR. S 58 Batticaloa R BT/PUTHUKUDIYIRUPPU KANNAKI M.V. PUTHUKKUDIYIRUPPU (30158) S 59 Batticaloa R BT/ODDAMAVADY FATHIMA B.M.V. ODDAMAVADY-02 S 60 Ampara R AM/ POLWATHTHA M.V. POLWAGA JANAPADAYA- AMPARA S 61 Ampara U KM/ZAHIRA COLLEGE (N.S) ZAHIRA COLLEGE ROAD,KALMUNAI S 62 Ampara R AN-NOOR VIDYALAYA ADDALAICHCHENAI 32350 S
R AL-ARHAM VIDYALAYA ADDALAICHCHENAI A
63 Ampara R AM/DEHI/KUDAGALA M.V. KUDAGALA,DEHIATTAKANDIYA S 64 Trincomalee U ZAHIRA C. MOOR STREET, TRINCOMALEE S 65 Trincomalee R T/AL-HITHAYA M.V. MUTTUR S 66 Kurunegala R KU/WADAKADA M.V. WADAKADA S 67 Kurunegala R SRI GNANODAYA M.M.V. WARIYAPOLA S 68 Kurunegala R MAYURAPADA K.V. NARAMMALA S 69 Kurunegala U KU/HISBULLA C.C. THELIYAGONNA, KURUNEGALA. S 70 Kurunegala R BARAGEDARA M.M.V. ATHUNGAHAKOTUWA S 71 Kurunegala R ELABADAGAMA SINHALA M.V. ELABADAGAMA S 72 Kurunegala R VIJABA M.M.V. MAHO S 73 Kurunegala R HULUGALLA M.V. NIKAWERATIYA S 74 Puttalam R THABBOWA M.V. THABBOWA, PUTTALAM S 75 Puttalam R KADAYAMOTTE K.V. MADURANKULIYA S 76 Puttalam R KARUKKUWA SUGATHANANDA M.V. MADAMPE S 77 Puttalam R MARAWILA BOYS K.V. MARAWILA S 78 Anuradhapura R MAHADIVULWEWA V. MAHADIVULWEWA,ETAWEERAGOLLEWA S 79 Anuradhapura U A/SWARNAPALI B.M.V. ANURADHAPURA S 80 Anuradhapura R VIDYARTHA MAHA VIDYALAYA PAHALAMARAGAHAWEWA S 81 Anuradhapura R GALKULAMA DAMMADINNA M.V. GALKULAMA S 82 Anuradhapura R IKIRIGOLLEWA MUSLIM M.V. IKIRIGOLLEWA, WAHAMALGOLLEWA S 83 Polonnaruwa R ROYAL CENTAL COLLEGE NEW TOWN,POLONNARUWA S 84 Polonnaruwa R RADAVIGEOYA K.V. ATTANAKADAWALA,POLONNARUWA S 85 Badulla R D.S.SENANAYAKA JATIKA PASALA KANDAKETIYA S 86 Badulla R BANDARAWELA M.M.V. KINEGAMA, BANDARAWELA S 87 Badulla R B/PRAGHNASENA M.V. NUWARAELIYA ROAD, BORAGAS S 88 Badulla R CRAIG T.M.V. DOOLGOLLA S.P.O, BANDARAWELA S
R BANDARAWELA T.V. BANDARAWELA A
89 Monaragala R MO/DODAMGOLLA M.V. DODAMGOLLA-BIBILE S 90 Monaragala R MALWATTAWALA M.M.V. WELLAWAYA. S 91 Monaragala R VIPULANANDA T.M.V. MONARAGALA S 92 Ratnapura U ST.ALOYSIUS NATIONAL SCHOOL CHURCH ROAD, RATHNAPURA S 93 Ratnapura U SRI BUDDHA JAYANTHI M.M.V. BALANGODA S 94 Ratnapura R UDAWELA M.V. OPANAYAKA S 95 Ratnapura R WALALGODA V. PANAMURA S 96 Ratnapura U BALANGODA T.M.V. RASSAGALA ROAD, BALANGODA S 97 Kegalle R DERANIYAGALA K.V. DERANIYAGALA S 98 Kegalle R SUJTHA K.V. DALUGGALA,RAMBUKKANA S 99 Kegalle R HATHGAMPOLA M.V. HATHGAMPOLA,ARANAYAKA S
100 Kegalle R BELIGALA BODIRAJA M.V. BELIGALA S
An
nex
ure
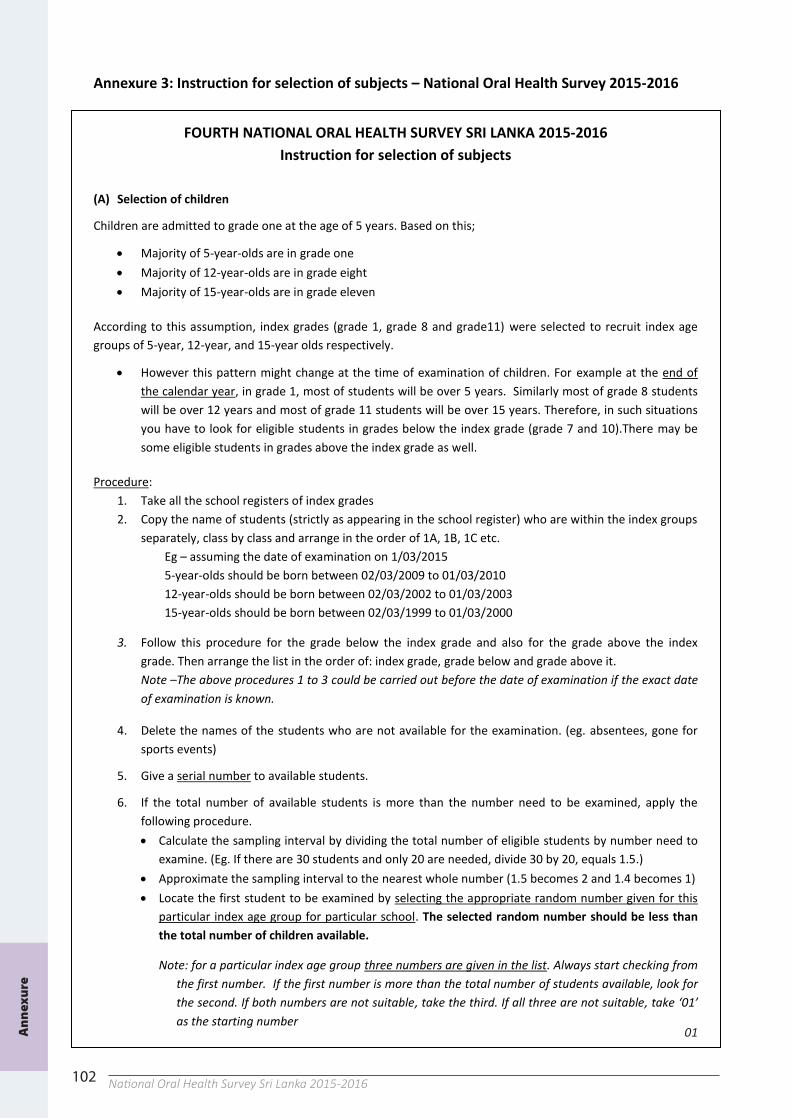
102 National Oral Health Survey Sri Lanka 2015-2016
102
Annexure 3: Instruction for selection of subjects – National Oral Health Survey 2015-2016
FOURTH NATIONAL ORAL HEALTH SURVEY SRI LANKA 2015-2016 Instruction for selection of subjects
(A) Selection of children
Children are admitted to grade one at the age of 5 years. Based on this;
Majority of 5-year-olds are in grade one Majority of 12-year-olds are in grade eight Majority of 15-year-olds are in grade eleven
According to this assumption, index grades (grade 1, grade 8 and grade11) were selected to recruit index age groups of 5-year, 12-year, and 15-year olds respectively.
However this pattern might change at the time of examination of children. For example at the end of the calendar year, in grade 1, most of students will be over 5 years. Similarly most of grade 8 students will be over 12 years and most of grade 11 students will be over 15 years. Therefore, in such situations you have to look for eligible students in grades below the index grade (grade 7 and 10).There may be some eligible students in grades above the index grade as well.
Procedure: 1. Take all the school registers of index grades 2. Copy the name of students (strictly as appearing in the school register) who are within the index groups
separately, class by class and arrange in the order of 1A, 1B, 1C etc. Eg – assuming the date of examination on 1/03/2015 5-year-olds should be born between 02/03/2009 to 01/03/2010 12-year-olds should be born between 02/03/2002 to 01/03/2003 15-year-olds should be born between 02/03/1999 to 01/03/2000
3. Follow this procedure for the grade below the index grade and also for the grade above the index grade. Then arrange the list in the order of: index grade, grade below and grade above it. Note –The above procedures 1 to 3 could be carried out before the date of examination if the exact date of examination is known.
4. Delete the names of the students who are not available for the examination. (eg. absentees, gone for sports events)
5. Give a serial number to available students.
6. If the total number of available students is more than the number need to be examined, apply the following procedure. Calculate the sampling interval by dividing the total number of eligible students by number need to
examine. (Eg. If there are 30 students and only 20 are needed, divide 30 by 20, equals 1.5.) Approximate the sampling interval to the nearest whole number (1.5 becomes 2 and 1.4 becomes 1) Locate the first student to be examined by selecting the appropriate random number given for this
particular index age group for particular school. The selected random number should be less than the total number of children available.
Note: for a particular index age group three numbers are given in the list. Always start checking from the first number. If the first number is more than the total number of students available, look for the second. If both numbers are not suitable, take the third. If all three are not suitable, take ‘01’ as the starting number
103
Select the remaining number of students by adding the sampling interval to the starting number Note: During the procedure, in some instances you may have to pass the starting point of the list and sometimes you may not have to go through the entire list to get the required number of children. (See examples)
7. If the total number of eligible students is less than the required number, examine all of them in that particular school. Then visit the next school given in the list and take the balance. You have to follow the above steps 1 to 6 to select those students.
Example 1 Assume in school ‘A’, there are 25 eligible students for 15-year-old age group and we need to select 20 out of them Calculate the sampling interval: 25/20 = 1.25 Approximate to the nearest whole number: 1.25 becomes 1 Select the appropriate random number: assume it is 12 Select the first child: 12th student in the list Add the sampling interval to locate the rest: 12,13,14,15,16,,17,18,19,20,21,22,23,24,25,1,2,3,4,5,6 There is no chance for the selection of students from 7 to 11
Example 2 Assume in school ‘B’, there are 50 eligible students for 5-year-old age group (and we need 20). Calculate the sampling interval: 50/20 = 2.5 Approximate to the nearest whole number: 2.5 becomes 3 Select the appropriate random number: assume it is 12 Select the first child: 12th child in the list Add the sampling interval to locate the rest : 12,15,18,21,24,27,30,33,36,39,42,45,48,1,4,7,10,13,16,19 There is no chance for the selection of children from 20 to 11
(B) Selection of adults
1. Visit the physically nearest house to the selected school. 2. Eligible people for examination are those who aged 35 – 44 years and 65 – 74 years on the day of
examination. 3. Second house will be the one physically nearest to the first measured from main entrance to the main
entrance 4. Third house is the one physically nearest to second and so on… Exclusion for the selection: Households outside the selected GN area Military establishments Institutions such as prisons, hospitals, lodges, hostels
Note: Especially in urban areas there will be a difficulty to determine the nearest house from the house just completed. In such situation, use the following procedure.
When two houses appear to be at the same distance from the house immediately completed before, select the house on the left if the examination is taking place on odd dates.(eg. 1, 3, 5, 7 )and if the examination is on even dates ( eg. 2, 4, 6, 8, etc) select the house on the right side.
In blocks of flats, complete the examination of all the houses in the ground floor by applying the above criteria and then move to the floor immediately above.
N.B. For adults, within a cluster male-female balance should be maintained, i.e. for each index age group, 10 males and 10 females should be examined.
01An
nex
ure
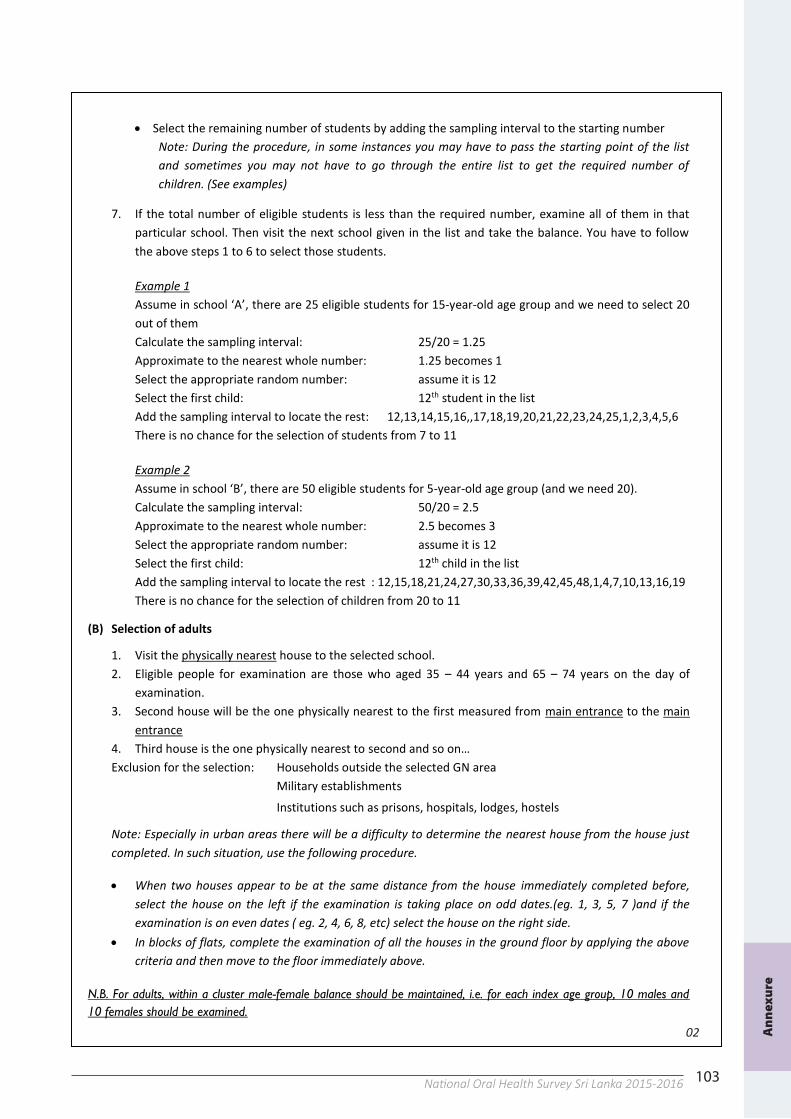
103National Oral Health Survey Sri Lanka 2015-2016103
Select the remaining number of students by adding the sampling interval to the starting number Note: During the procedure, in some instances you may have to pass the starting point of the list and sometimes you may not have to go through the entire list to get the required number of children. (See examples)
7. If the total number of eligible students is less than the required number, examine all of them in that particular school. Then visit the next school given in the list and take the balance. You have to follow the above steps 1 to 6 to select those students.
Example 1 Assume in school ‘A’, there are 25 eligible students for 15-year-old age group and we need to select 20 out of them Calculate the sampling interval: 25/20 = 1.25 Approximate to the nearest whole number: 1.25 becomes 1 Select the appropriate random number: assume it is 12 Select the first child: 12th student in the list Add the sampling interval to locate the rest: 12,13,14,15,16,,17,18,19,20,21,22,23,24,25,1,2,3,4,5,6 There is no chance for the selection of students from 7 to 11
Example 2 Assume in school ‘B’, there are 50 eligible students for 5-year-old age group (and we need 20). Calculate the sampling interval: 50/20 = 2.5 Approximate to the nearest whole number: 2.5 becomes 3 Select the appropriate random number: assume it is 12 Select the first child: 12th child in the list Add the sampling interval to locate the rest : 12,15,18,21,24,27,30,33,36,39,42,45,48,1,4,7,10,13,16,19 There is no chance for the selection of children from 20 to 11
(B) Selection of adults
1. Visit the physically nearest house to the selected school. 2. Eligible people for examination are those who aged 35 – 44 years and 65 – 74 years on the day of
examination. 3. Second house will be the one physically nearest to the first measured from main entrance to the main
entrance 4. Third house is the one physically nearest to second and so on… Exclusion for the selection: Households outside the selected GN area Military establishments Institutions such as prisons, hospitals, lodges, hostels
Note: Especially in urban areas there will be a difficulty to determine the nearest house from the house just completed. In such situation, use the following procedure.
When two houses appear to be at the same distance from the house immediately completed before, select the house on the left if the examination is taking place on odd dates.(eg. 1, 3, 5, 7 )and if the examination is on even dates ( eg. 2, 4, 6, 8, etc) select the house on the right side.
In blocks of flats, complete the examination of all the houses in the ground floor by applying the above criteria and then move to the floor immediately above.
N.B. For adults, within a cluster male-female balance should be maintained, i.e. for each index age group, 10 males and 10 females should be examined.
02 An
nex
ure
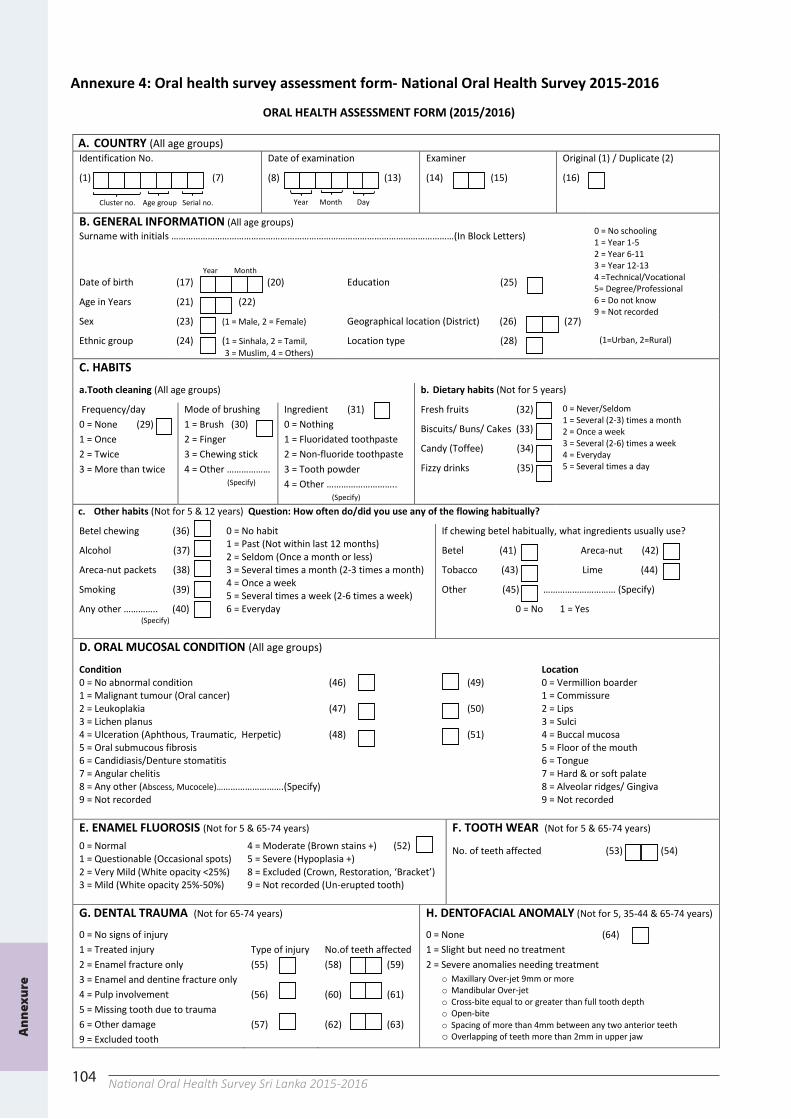
104 National Oral Health Survey Sri Lanka 2015-2016104
Annexure 4: Oral health survey assessment form- National Oral Health Survey 2015-2016
ORAL HEALTH ASSESSMENT FORM (2015/2016)
A. COUNTRY (All age groups) Identification No.
(1) (7) Cluster no. Age group Serial no.
Date of examination
(8) (13)
Year Month Day
Examiner
(14) (15)
Original (1) / Duplicate (2)
(16)
B. GENERAL INFORMATION (All age groups) Surname with initials ………………………………………………………………………………………………………(In Block Letters) Year Month
0 = No schooling 1 = Year 1-5 2 = Year 6-11 3 = Year 12-13 4 =Technical/Vocational 5= Degree/Professional 6 = Do not know 9 = Not recorded
Date of birth (17) (20) Education (25)
Age in Years (21) (22)
Sex (23) (1 = Male, 2 = Female) Geographical location (District) (26) (27)
Ethnic group (24) (1 = Sinhala, 2 = Tamil, 3 = Muslim, 4 = Others)
Location type (28) (1=Urban, 2=Rural)
C. HABITS
a. Tooth cleaning (All age groups) b. Dietary habits (Not for 5 years)
Frequency/day 0 = None (29) 1 = Once 2 = Twice 3 = More than twice
Mode of brushing 1 = Brush (30) 2 = Finger 3 = Chewing stick 4 = Other ……………… (Specify)
Ingredient (31) 0 = Nothing 1 = Fluoridated toothpaste 2 = Non-fluoride toothpaste 3 = Tooth powder 4 = Other ………………………..
(Specify)
Fresh fruits (32)
Biscuits/ Buns/ Cakes (33)
Candy (Toffee) (34)
Fizzy drinks (35)
0 = Never/Seldom 1 = Several (2-3) times a month 2 = Once a week 3 = Several (2-6) times a week 4 = Everyday 5 = Several times a day
c. Other habits (Not for 5 & 12 years) Question: How often do/did you use any of the flowing habitually?
Betel chewing (36)
Alcohol (37)
Areca-nut packets (38)
Smoking (39)
Any other ………….. (40) (Specify)
0 = No habit 1 = Past (Not within last 12 months) 2 = Seldom (Once a month or less) 3 = Several times a month (2-3 times a month) 4 = Once a week 5 = Several times a week (2-6 times a week) 6 = Everyday
If chewing betel habitually, what ingredients usually use?
Betel (41) Areca-nut (42)
Tobacco (43) Lime (44)
Other (45) ………………………… (Specify)
0 = No 1 = Yes
D. ORAL MUCOSAL CONDITION (All age groups)
Condition 0 = No abnormal condition 1 = Malignant tumour (Oral cancer) 2 = Leukoplakia 3 = Lichen planus 4 = Ulceration (Aphthous, Traumatic, Herpetic) 5 = Oral submucous fibrosis 6 = Candidiasis/Denture stomatitis 7 = Angular chelitis 8 = Any other (Abscess, Mucocele)……………………….(Specify) 9 = Not recorded
(46) (49) (47) (50) (48) (51)
Location 0 = Vermillion boarder 1 = Commissure 2 = Lips 3 = Sulci 4 = Buccal mucosa 5 = Floor of the mouth 6 = Tongue 7 = Hard & or soft palate 8 = Alveolar ridges/ Gingiva 9 = Not recorded
E. ENAMEL FLUOROSIS (Not for 5 & 65-74 years) F. TOOTH WEAR (Not for 5 & 65-74 years)
No. of teeth affected (53) (54) 0 = Normal 1 = Questionable (Occasional spots) 2 = Very Mild (White opacity <25%) 3 = Mild (White opacity 25%-50%)
4 = Moderate (Brown stains +) (52) 5 = Severe (Hypoplasia +) 8 = Excluded (Crown, Restoration, ‘Bracket’) 9 = Not recorded (Un-erupted tooth)
G. DENTAL TRAUMA (Not for 65-74 years)
H. DENTOFACIAL ANOMALY (Not for 5, 35-44 & 65-74 years)
0 = No signs of injury 1 = Treated injury 2 = Enamel fracture only 3 = Enamel and dentine fracture only 4 = Pulp involvement 5 = Missing tooth due to trauma 6 = Other damage 9 = Excluded tooth
Type of injury (55) (56) (57)
No.of teeth affected (58) (59) (60) (61) (62) (63)
0 = None (64) 1 = Slight but need no treatment 2 = Severe anomalies needing treatment
o Maxillary Over-jet 9mm or more o Mandibular Over-jet o Cross-bite equal to or greater than full tooth depth o Open-bite o Spacing of more than 4mm between any two anterior teeth o Overlapping of teeth more than 2mm in upper jaw A
nn
exu
re
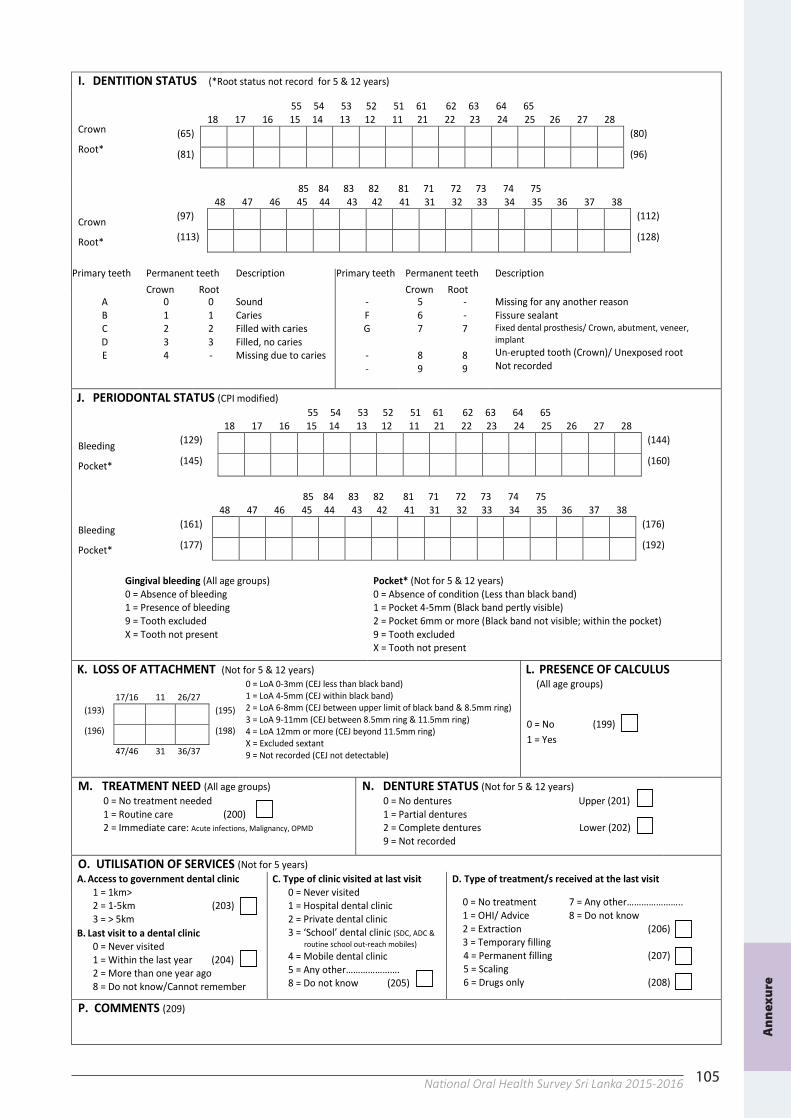
105National Oral Health Survey Sri Lanka 2015-2016
I. DENTITION STATUS (*Root status not record for 5 & 12 years)
Crown
Root*
55 54 53 52 51 61 62 63 64 65 18 17 16 15 14 13 12 11 21 22 23 24 25 26 27 28
(65) (80)
(81) (96)
Crown
Root*
85 84 83 82 81 71 72 73 74 75 48 47 46 45 44 43 42 41 31 32 33 34 35 36 37 38
(97) (112)
(113) (128)
Primary teeth Permanent teeth Description Primary teeth Permanent teeth Description
Crown Root Crown Root A B C D E
0 1 2 3 4
0 1 2 3 -
Sound Caries Filled with caries Filled, no caries Missing due to caries
- F G - -
5 6 7
8 9
- - 7
8 9
Missing for any another reason Fissure sealant Fixed dental prosthesis/ Crown, abutment, veneer, implant Un-erupted tooth (Crown)/ Unexposed root Not recorded
J. PERIODONTAL STATUS (CPI modified)
Bleeding
Pocket*
55 54 53 52 51 61 62 63 64 65 18 17 16 15 14 13 12 11 21 22 23 24 25 26 27 28
(129) (144)
(145) (160)
Bleeding
Pocket*
85 84 83 82 81 71 72 73 74 75 48 47 46 45 44 43 42 41 31 32 33 34 35 36 37 38
(161) (176)
(177) (192)
Gingival bleeding (All age groups)
0 = Absence of bleeding 1 = Presence of bleeding 9 = Tooth excluded X = Tooth not present
Pocket* (Not for 5 & 12 years) 0 = Absence of condition (Less than black band) 1 = Pocket 4-5mm (Black band pertly visible) 2 = Pocket 6mm or more (Black band not visible; within the pocket) 9 = Tooth excluded X = Tooth not present
K. LOSS OF ATTACHMENT (Not for 5 & 12 years) L. PRESENCE OF CALCULUS (All age groups)
0 = No (199) 1 = Yes
17/16 11 26/27 (193) (195)
(196) (198)
47/46 31 36/37
0 = LoA 0-3mm (CEJ less than black band) 1 = LoA 4-5mm (CEJ within black band) 2 = LoA 6-8mm (CEJ between upper limit of black band & 8.5mm ring) 3 = LoA 9-11mm (CEJ between 8.5mm ring & 11.5mm ring) 4 = LoA 12mm or more (CEJ beyond 11.5mm ring) X = Excluded sextant 9 = Not recorded (CEJ not detectable)
M. TREATMENT NEED (All age groups) 0 = No treatment needed 1 = Routine care (200) 2 = Immediate care: Acute infections, Malignancy, OPMD
N. DENTURE STATUS (Not for 5 & 12 years) 0 = No dentures Upper (201) 1 = Partial dentures 2 = Complete dentures Lower (202) 9 = Not recorded
O. UTILISATION OF SERVICES (Not for 5 years) A. Access to government dental clinic
1 = 1km> 2 = 1-5km (203) 3 = > 5km
C. Type of clinic visited at last visit 0 = Never visited 1 = Hospital dental clinic 2 = Private dental clinic 3 = ‘School’ dental clinic (SDC, ADC &
routine school out-reach mobiles) 4 = Mobile dental clinic 5 = Any other…………………. 8 = Do not know (205)
D. Type of treatment/s received at the last visit
0 = No treatment 1 = OHI/ Advice 2 = Extraction 3 = Temporary filling 4 = Permanent filling 5 = Scaling 6 = Drugs only
7 = Any other………………….. 8 = Do not know (206)
(207) (208)
B. Last visit to a dental clinic 0 = Never visited 1 = Within the last year (204) 2 = More than one year ago 8 = Do not know/Cannot remember
P. COMMENTS (209)
An
nex
ure
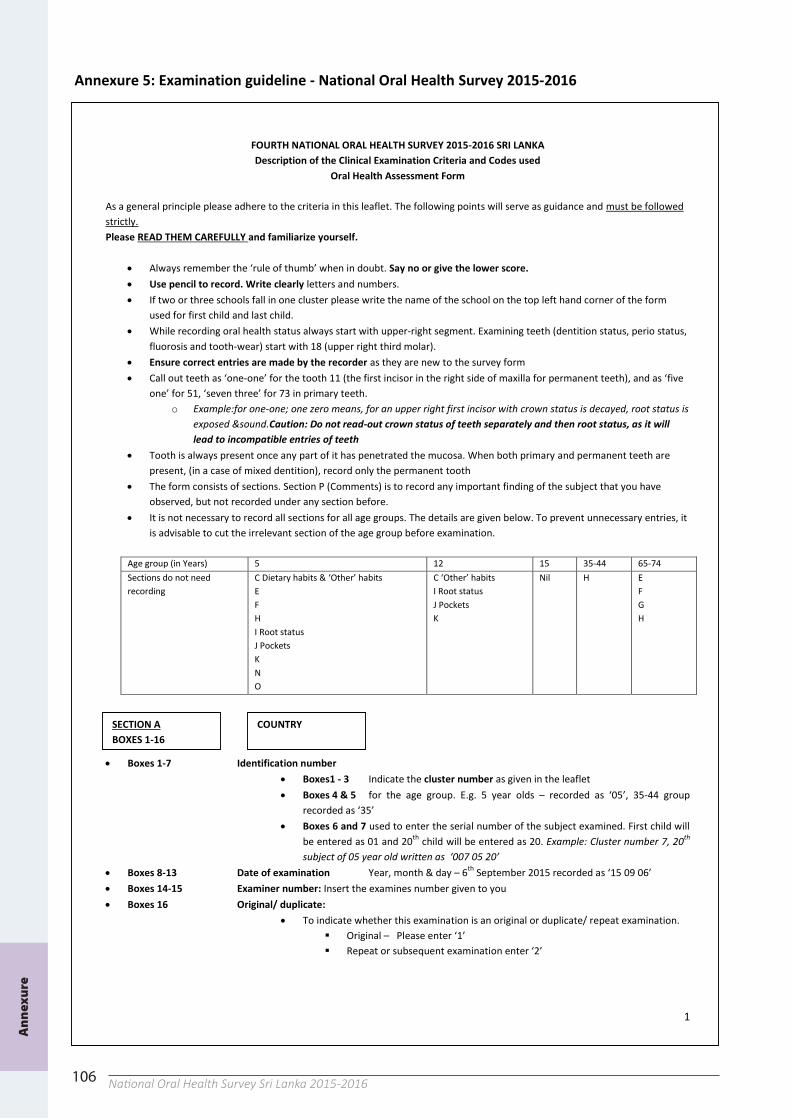
106 National Oral Health Survey Sri Lanka 2015-2016106
Annexure 5: Examination guideline - National Oral Health Survey 2015-2016
1
FOURTH NATIONAL ORAL HEALTH SURVEY 2015-2016 SRI LANKA Description of the Clinical Examination Criteria and Codes used
Oral Health Assessment Form As a general principle please adhere to the criteria in this leaflet. The following points will serve as guidance and must be followed strictly. Please READ THEM CAREFULLY and familiarize yourself.
Always remember the ‘rule of thumb’ when in doubt. Say no or give the lower score. Use pencil to record. Write clearly letters and numbers. If two or three schools fall in one cluster please write the name of the school on the top left hand corner of the form
used for first child and last child. While recording oral health status always start with upper-right segment. Examining teeth (dentition status, perio status,
fluorosis and tooth-wear) start with 18 (upper right third molar). Ensure correct entries are made by the recorder as they are new to the survey form Call out teeth as ‘one-one’ for the tooth 11 (the first incisor in the right side of maxilla for permanent teeth), and as ‘five
one’ for 51, ‘seven three’ for 73 in primary teeth. o Example:for one-one; one zero means, for an upper right first incisor with crown status is decayed, root status is
exposed &sound.Caution: Do not read-out crown status of teeth separately and then root status, as it will lead to incompatible entries of teeth
Tooth is always present once any part of it has penetrated the mucosa. When both primary and permanent teeth are present, (in a case of mixed dentition), record only the permanent tooth
The form consists of sections. Section P (Comments) is to record any important finding of the subject that you have observed, but not recorded under any section before.
It is not necessary to record all sections for all age groups. The details are given below. To prevent unnecessary entries, it is advisable to cut the irrelevant section of the age group before examination.
Age group (in Years) 5 12 15 35-44 65-74 Sections do not need recording
C Dietary habits & ‘Other’ habits E F H I Root status J Pockets K N O
C ‘Other’ habits I Root status J Pockets K
Nil H E F G H
Boxes 1-7 Identification number
Boxes1 - 3 Indicate the cluster number as given in the leaflet Boxes 4 & 5 for the age group. E.g. 5 year olds – recorded as ‘05’, 35-44 group
recorded as ‘35’ Boxes 6 and 7 used to enter the serial number of the subject examined. First child will
be entered as 01 and 20th child will be entered as 20. Example: Cluster number 7, 20th subject of 05 year old written as ‘007 05 20’
Boxes 8-13 Date of examination Year, month & day – 6th September 2015 recorded as ‘15 09 06’ Boxes 14-15 Examiner number: Insert the examines number given to you Boxes 16 Original/ duplicate:
To indicate whether this examination is an original or duplicate/ repeat examination. Original – Please enter ‘1’ Repeat or subsequent examination enter ‘2’
SECTION A BOXES 1-16
COUNTRY
An
nex
ure
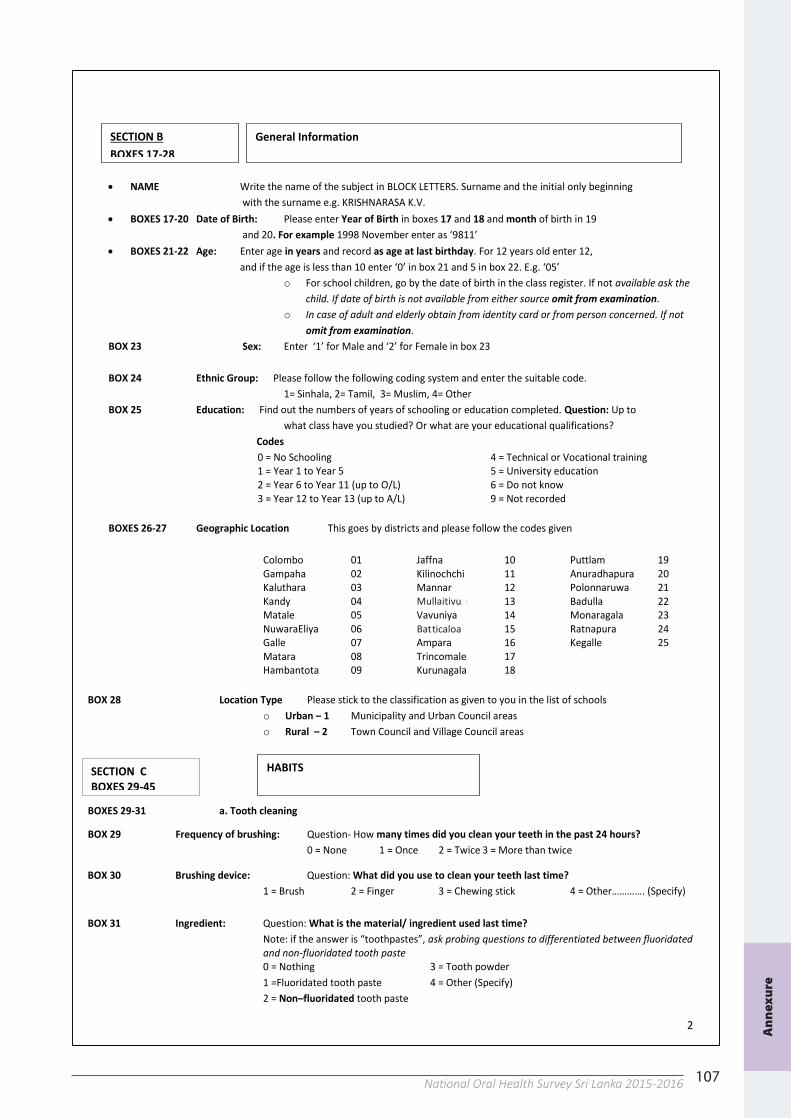
107National Oral Health Survey Sri Lanka 2015-2016
2
NAME Write the name of the subject in BLOCK LETTERS. Surname and the initial only beginning
with the surname e.g. KRISHNARASA K.V. BOXES 17-20 Date of Birth: Please enter Year of Birth in boxes 17 and 18 and month of birth in 19
and 20. For example 1998 November enter as ‘9811’ BOXES 21-22 Age: Enter age in years and record as age at last birthday. For 12 years old enter 12,
and if the age is less than 10 enter ‘0’ in box 21 and 5 in box 22. E.g. ‘05’ o For school children, go by the date of birth in the class register. If not available ask the
child. If date of birth is not available from either source omit from examination. o In case of adult and elderly obtain from identity card or from person concerned. If not
omit from examination. BOX 23 Sex: Enter ‘1’ for Male and ‘2’ for Female in box 23 BOX 24 Ethnic Group: Please follow the following coding system and enter the suitable code.
1= Sinhala, 2= Tamil, 3= Muslim, 4= Other BOX 25 Education: Find out the numbers of years of schooling or education completed. Question: Up to what class have you studied? Or what are your educational qualifications?
Codes 0 = No Schooling 1 = Year 1 to Year 5 2 = Year 6 to Year 11 (up to O/L) 3 = Year 12 to Year 13 (up to A/L)
4 = Technical or Vocational training 5 = University education 6 = Do not know 9 = Not recorded
BOXES 26-27 Geographic Location This goes by districts and please follow the codes given
Colombo 01 Gampaha 02 Kaluthara 03 Kandy 04 Matale 05 NuwaraEliya 06 Galle 07 Matara 08 Hambantota 09
Jaffna 10 Kilinochchi 11 Mannar 12 Mullaithivu 13 Vavuniya 14 Batticoloa 15 Ampara 16 Trincomale 17 Kurunagala 18
Puttlam 19 Anuradhapura 20 Polonnaruwa 21 Badulla 22 Monaragala 23 Ratnapura 24 Kegalle 25
BOX 28 Location Type Please stick to the classification as given to you in the list of schools
o Urban – 1 Municipality and Urban Council areas o Rural – 2 Town Council and Village Council areas
BOXES 29-31 a. Tooth cleaning
BOX 29 Frequency of brushing: Question- How many times did you clean your teeth in the past 24 hours? 0 = None 1 = Once 2 = Twice 3 = More than twice
BOX 30 Brushing device: Question: What did you use to clean your teeth last time? 1 = Brush 2 = Finger 3 = Chewing stick 4 = Other…………. (Specify)
BOX 31 Ingredient: Question: What is the material/ ingredient used last time? Note: if the answer is “toothpastes”, ask probing questions to differentiated between fluoridated and non-fluoridated tooth paste 0 = Nothing 1 =Fluoridated tooth paste 2 = Non–fluoridated tooth paste
3 = Tooth powder 4 = Other (Specify)
SECTION B BOXES 17-28
General Information
SECTION C BOXES 29-45
HABITS
Bat t icaloa
Mullait ivu
An
nex
ure
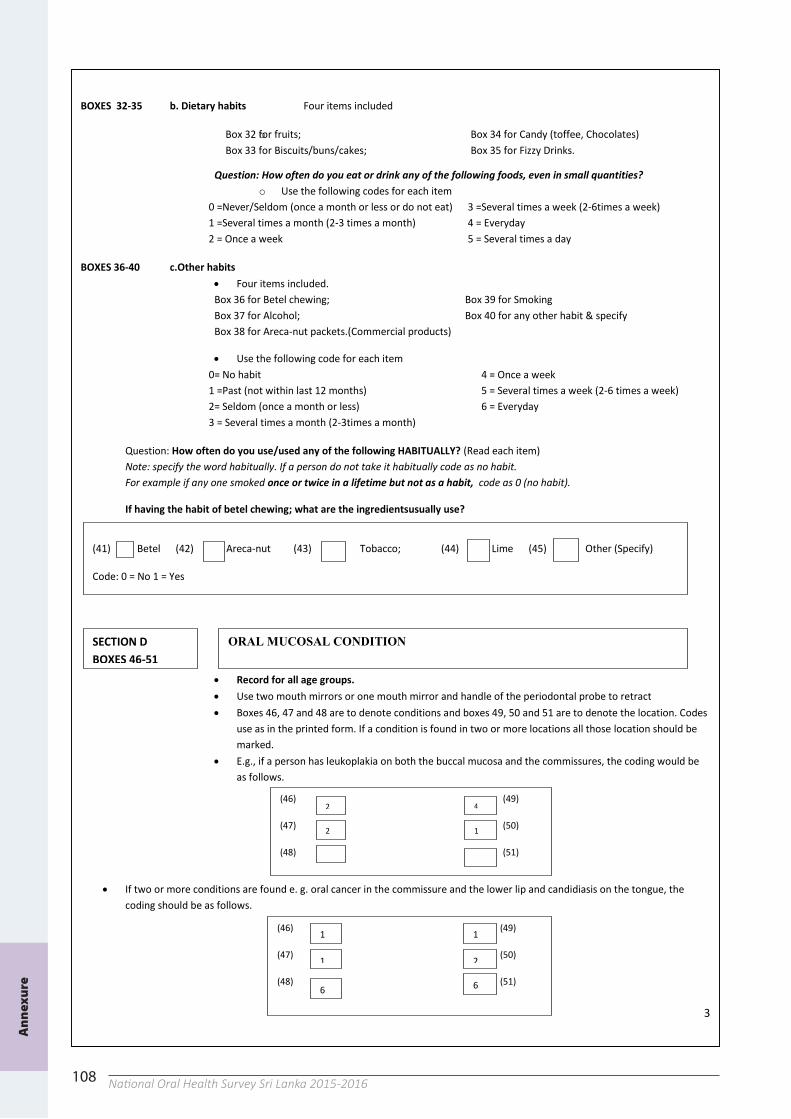
108 National Oral Health Survey Sri Lanka 2015-2016
3
BOXES 32-35 b. Dietary habits Four items included
o Box 32 for fruits; Box 33 for Biscuits/buns/cakes;
Box 34 for Candy (toffee, Chocolates) Box 35 for Fizzy Drinks.
Question: How often do you eat or drink any of the following foods, even in small quantities? o Use the following codes for each item
0 =Never/Seldom (once a month or less or do not eat) 1 =Several times a month (2-3 times a month) 2 = Once a week
3 =Several times a week (2-6times a week) 4 = Everyday 5 = Several times a day
BOXES 36-40 c.Other habits
Four items included. Box 36 for Betel chewing; Box 37 for Alcohol; Box 38 for Areca-nut packets.(Commercial products)
Box 39 for Smoking Box 40 for any other habit & specify
Use the following code for each item 0= No habit 1 =Past (not within last 12 months) 2= Seldom (once a month or less) 3 = Several times a month (2-3times a month)
4 = Once a week 5 = Several times a week (2-6 times a week) 6 = Everyday
Question: How often do you use/used any of the following HABITUALLY? (Read each item) Note: specify the word habitually. If a person do not take it habitually code as no habit. For example if any one smoked once or twice in a lifetime but not as a habit, code as 0 (no habit).
If having the habit of betel chewing; what are the ingredientsusually use?
CLINICAL EXAMINATION
Record for all age groups. Use two mouth mirrors or one mouth mirror and handle of the periodontal probe to retract Boxes 46, 47 and 48 are to denote conditions and boxes 49, 50 and 51 are to denote the location. Codes
use as in the printed form. If a condition is found in two or more locations all those location should be marked.
E.g., if a person has leukoplakia on both the buccal mucosa and the commissures, the coding would be as follows.
If two or more conditions are found e. g. oral cancer in the commissure and the lower lip and candidiasis on the tongue, the coding should be as follows.
SECTION D BOXES 46-51
ORAL MUCOSAL CONDITION
(46) (49)
(47) (50)
(48) (51)
2
2
4
2 1
(46) (49)
(47) (50)
(48) (51)
1 1
1 2
6 6
(41) Betel (42) Areca-nut (43) Tobacco; (44) Lime (45) Other (Specify) Code: 0 = No 1 = Yes
An
nex
ure
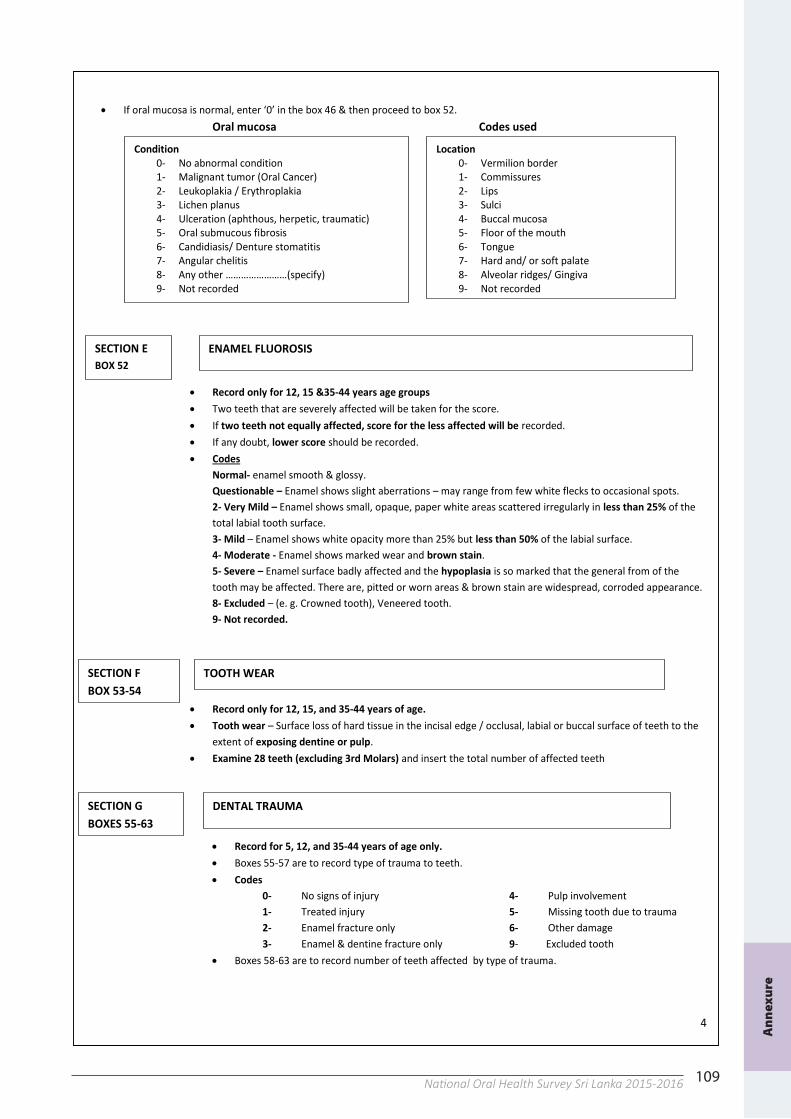
109National Oral Health Survey Sri Lanka 2015-2016
4
If oral mucosa is normal, enter ‘0’ in the box 46 & then proceed to box 52. Oral mucosa Codes used
Record only for 12, 15 &35-44 years age groups Two teeth that are severely affected will be taken for the score. If two teeth not equally affected, score for the less affected will be recorded. If any doubt, lower score should be recorded. Codes
Normal- enamel smooth & glossy. Questionable – Enamel shows slight aberrations – may range from few white flecks to occasional spots. 2- Very Mild – Enamel shows small, opaque, paper white areas scattered irregularly in less than 25% of the total labial tooth surface. 3- Mild – Enamel shows white opacity more than 25% but less than 50% of the labial surface. 4- Moderate - Enamel shows marked wear and brown stain. 5- Severe – Enamel surface badly affected and the hypoplasia is so marked that the general from of the tooth may be affected. There are, pitted or worn areas & brown stain are widespread, corroded appearance. 8- Excluded – (e. g. Crowned tooth), Veneered tooth. 9- Not recorded.
Record only for 12, 15, and 35-44 years of age. Tooth wear – Surface loss of hard tissue in the incisal edge / occlusal, labial or buccal surface of teeth to the
extent of exposing dentine or pulp. Examine 28 teeth (excluding 3rd Molars) and insert the total number of affected teeth
Record for 5, 12, and 35-44 years of age only. Boxes 55-57 are to record type of trauma to teeth. Codes
0- No signs of injury 1- Treated injury 2- Enamel fracture only 3- Enamel & dentine fracture only
4- Pulp involvement 5- Missing tooth due to trauma 6- Other damage 9- Excluded tooth
Boxes 58-63 are to record number of teeth affected by type of trauma.
Condition 0- No abnormal condition 1- Malignant tumor (Oral Cancer) 2- Leukoplakia / Erythroplakia 3- Lichen planus 4- Ulceration (aphthous, herpetic, traumatic) 5- Oral submucous fibrosis 6- Candidiasis/ Denture stomatitis 7- Angular chelitis 8- Any other ……………………(specify) 9- Not recorded
Location 0- Vermilion border 1- Commissures 2- Lips 3- Sulci 4- Buccal mucosa 5- Floor of the mouth 6- Tongue 7- Hard and/ or soft palate 8- Alveolar ridges/ Gingiva 9- Not recorded
ENAMEL FLUOROSIS
SECTION F BOX 53-54
TOOTH WEAR
SECTION G BOXES 55-63
DENTAL TRAUMA
SECTION E BOX 52
An
nex
ure
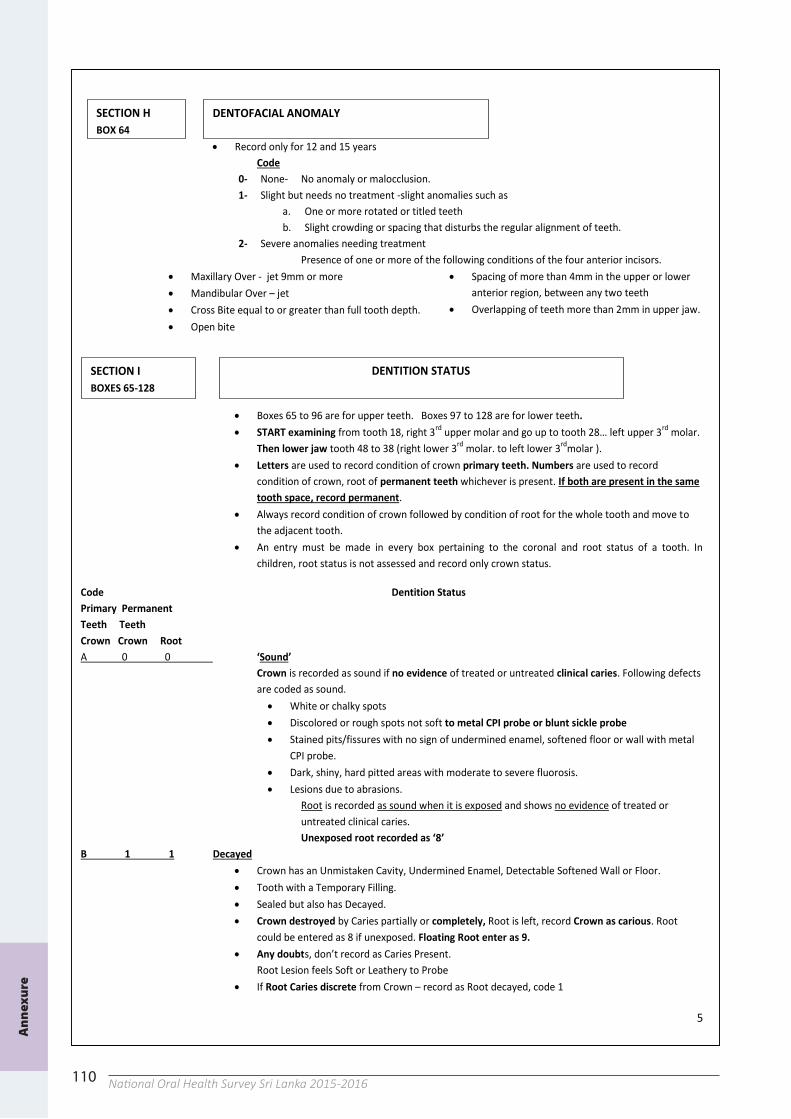
110 National Oral Health Survey Sri Lanka 2015-2016
5
Record only for 12 and 15 years Code
0- None- No anomaly or malocclusion. 1- Slight but needs no treatment -slight anomalies such as
a. One or more rotated or titled teeth b. Slight crowding or spacing that disturbs the regular alignment of teeth.
2- Severe anomalies needing treatment Presence of one or more of the following conditions of the four anterior incisors.
Maxillary Over - jet 9mm or more Mandibular Over – jet Cross Bite equal to or greater than full tooth depth. Open bite
Spacing of more than 4mm in the upper or lower anterior region, between any two teeth
Overlapping of teeth more than 2mm in upper jaw.
Boxes 65 to 96 are for upper teeth. Boxes 97 to 128 are for lower teeth. START examining from tooth 18, right 3rd upper molar and go up to tooth 28… left upper 3rd molar.
Then lower jaw tooth 48 to 38 (right lower 3rd molar. to left lower 3rdmolar ). Letters are used to record condition of crown primary teeth. Numbers are used to record
condition of crown, root of permanent teeth whichever is present. If both are present in the same tooth space, record permanent.
Always record condition of crown followed by condition of root for the whole tooth and move to the adjacent tooth.
An entry must be made in every box pertaining to the coronal and root status of a tooth. In children, root status is not assessed and record only crown status.
Code Dentition Status Primary Permanent Teeth Teeth Crown Crown Root A 0 0 ‘Sound’
Crown is recorded as sound if no evidence of treated or untreated clinical caries. Following defects are coded as sound.
White or chalky spots Discolored or rough spots not soft to metal CPI probe or blunt sickle probe Stained pits/fissures with no sign of undermined enamel, softened floor or wall with metal
CPI probe. Dark, shiny, hard pitted areas with moderate to severe fluorosis. Lesions due to abrasions.
Root is recorded as sound when it is exposed and shows no evidence of treated or untreated clinical caries. Unexposed root recorded as ‘8’
B 1 1 Decayed Crown has an Unmistaken Cavity, Undermined Enamel, Detectable Softened Wall or Floor. Tooth with a Temporary Filling. Sealed but also has Decayed. Crown destroyed by Caries partially or completely, Root is left, record Crown as carious. Root
could be entered as 8 if unexposed. Floating Root enter as 9. Any doubts, don’t record as Caries Present.
Root Lesion feels Soft or Leathery to Probe If Root Caries discrete from Crown – record as Root decayed, code 1
SECTION H BOX 64
SECTION I BOXES 65-128
DENTITION STATUS
DENTOFACIAL ANOMALY
An
nex
ure
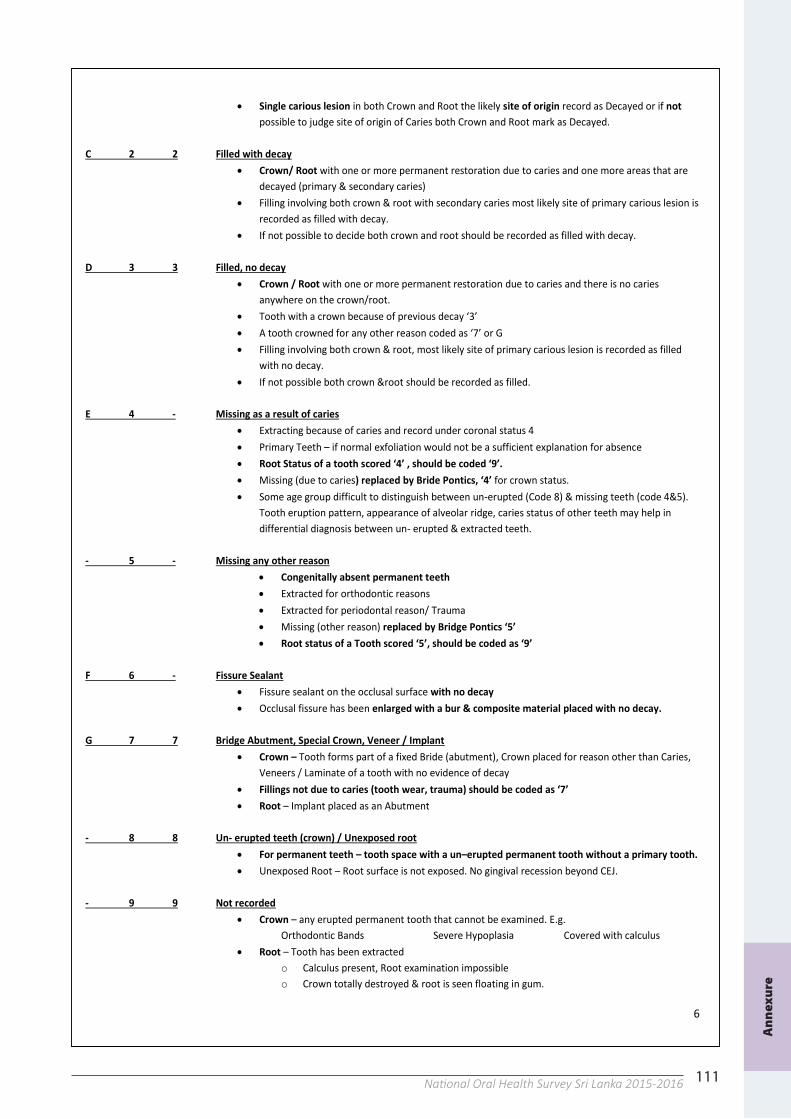
111National Oral Health Survey Sri Lanka 2015-2016
6
Single carious lesion in both Crown and Root the likely site of origin record as Decayed or if not possible to judge site of origin of Caries both Crown and Root mark as Decayed.
C 2 2 Filled with decay
Crown/ Root with one or more permanent restoration due to caries and one more areas that are decayed (primary & secondary caries)
Filling involving both crown & root with secondary caries most likely site of primary carious lesion is recorded as filled with decay.
If not possible to decide both crown and root should be recorded as filled with decay. D 3 3 Filled, no decay
Crown / Root with one or more permanent restoration due to caries and there is no caries anywhere on the crown/root.
Tooth with a crown because of previous decay ‘3’ A tooth crowned for any other reason coded as ‘7’ or G Filling involving both crown & root, most likely site of primary carious lesion is recorded as filled
with no decay. If not possible both crown &root should be recorded as filled.
E 4 - Missing as a result of caries
Extracting because of caries and record under coronal status 4 Primary Teeth – if normal exfoliation would not be a sufficient explanation for absence Root Status of a tooth scored ‘4’ , should be coded ‘9’. Missing (due to caries) replaced by Bride Pontics, ‘4’ for crown status. Some age group difficult to distinguish between un-erupted (Code 8) & missing teeth (code 4&5).
Tooth eruption pattern, appearance of alveolar ridge, caries status of other teeth may help in differential diagnosis between un- erupted & extracted teeth.
- 5 - Missing any other reason
Congenitally absent permanent teeth Extracted for orthodontic reasons Extracted for periodontal reason/ Trauma Missing (other reason) replaced by Bridge Pontics ‘5’ Root status of a Tooth scored ‘5’, should be coded as ‘9’
F 6 - Fissure Sealant
Fissure sealant on the occlusal surface with no decay Occlusal fissure has been enlarged with a bur & composite material placed with no decay.
G 7 7 Bridge Abutment, Special Crown, Veneer / Implant
Crown – Tooth forms part of a fixed Bride (abutment), Crown placed for reason other than Caries, Veneers / Laminate of a tooth with no evidence of decay
Fillings not due to caries (tooth wear, trauma) should be coded as ‘7’ Root – Implant placed as an Abutment
- 8 8 Un- erupted teeth (crown) / Unexposed root
For permanent teeth – tooth space with a un–erupted permanent tooth without a primary tooth. Unexposed Root – Root surface is not exposed. No gingival recession beyond CEJ.
- 9 9 Not recorded
Crown – any erupted permanent tooth that cannot be examined. E.g. Orthodontic Bands Severe Hypoplasia Covered with calculus
Root – Tooth has been extracted o Calculus present, Root examination impossible o Crown totally destroyed & root is seen floating in gum.
An
nex
ure
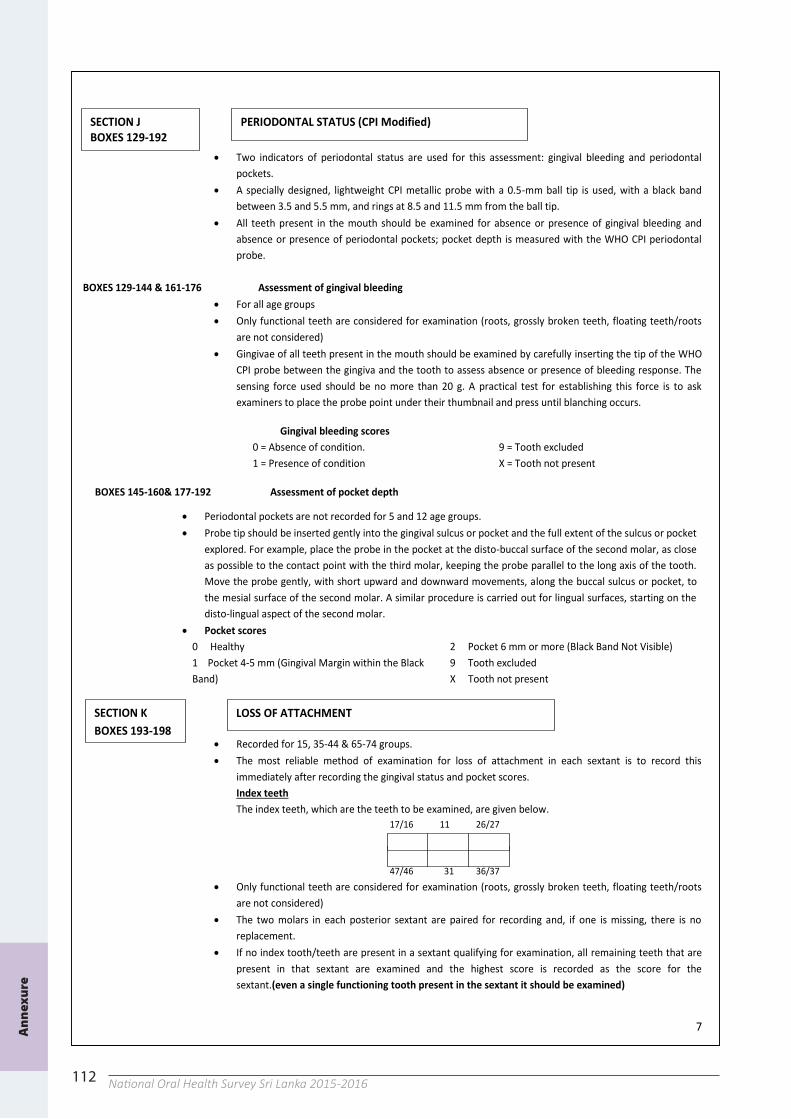
112 National Oral Health Survey Sri Lanka 2015-2016
7
Two indicators of periodontal status are used for this assessment: gingival bleeding and periodontal pockets.
A specially designed, lightweight CPI metallic probe with a 0.5-mm ball tip is used, with a black band between 3.5 and 5.5 mm, and rings at 8.5 and 11.5 mm from the ball tip.
All teeth present in the mouth should be examined for absence or presence of gingival bleeding and absence or presence of periodontal pockets; pocket depth is measured with the WHO CPI periodontal probe.
BOXES 129-144 & 161-176 Assessment of gingival bleeding
For all age groups Only functional teeth are considered for examination (roots, grossly broken teeth, floating teeth/roots
are not considered) Gingivae of all teeth present in the mouth should be examined by carefully inserting the tip of the WHO
CPI probe between the gingiva and the tooth to assess absence or presence of bleeding response. The sensing force used should be no more than 20 g. A practical test for establishing this force is to ask examiners to place the probe point under their thumbnail and press until blanching occurs.
Gingival bleeding scores
0 = Absence of condition. 1 = Presence of condition
9 = Tooth excluded X = Tooth not present
BOXES 145-160& 177-192 Assessment of pocket depth
Periodontal pockets are not recorded for 5 and 12 age groups. Probe tip should be inserted gently into the gingival sulcus or pocket and the full extent of the sulcus or pocket
explored. For example, place the probe in the pocket at the disto-buccal surface of the second molar, as close as possible to the contact point with the third molar, keeping the probe parallel to the long axis of the tooth. Move the probe gently, with short upward and downward movements, along the buccal sulcus or pocket, to the mesial surface of the second molar. A similar procedure is carried out for lingual surfaces, starting on the disto-lingual aspect of the second molar.
Pocket scores 0 Healthy 1 Pocket 4-5 mm (Gingival Margin within the Black Band)
2 Pocket 6 mm or more (Black Band Not Visible) 9 Tooth excluded X Tooth not present
Recorded for 15, 35-44 & 65-74 groups. The most reliable method of examination for loss of attachment in each sextant is to record this
immediately after recording the gingival status and pocket scores. Index teeth The index teeth, which are the teeth to be examined, are given below.
17/16 11 26/27 47/46 31 36/37
Only functional teeth are considered for examination (roots, grossly broken teeth, floating teeth/roots are not considered)
The two molars in each posterior sextant are paired for recording and, if one is missing, there is no replacement.
If no index tooth/teeth are present in a sextant qualifying for examination, all remaining teeth that are present in that sextant are examined and the highest score is recorded as the score for the sextant.(even a single functioning tooth present in the sextant it should be examined)
SECTION J BOXES 129-192
SECTION K BOXES 193-198
PERIODONTAL STATUS (CPI Modified)
LOSS OF ATTACHMENT
An
nex
ure
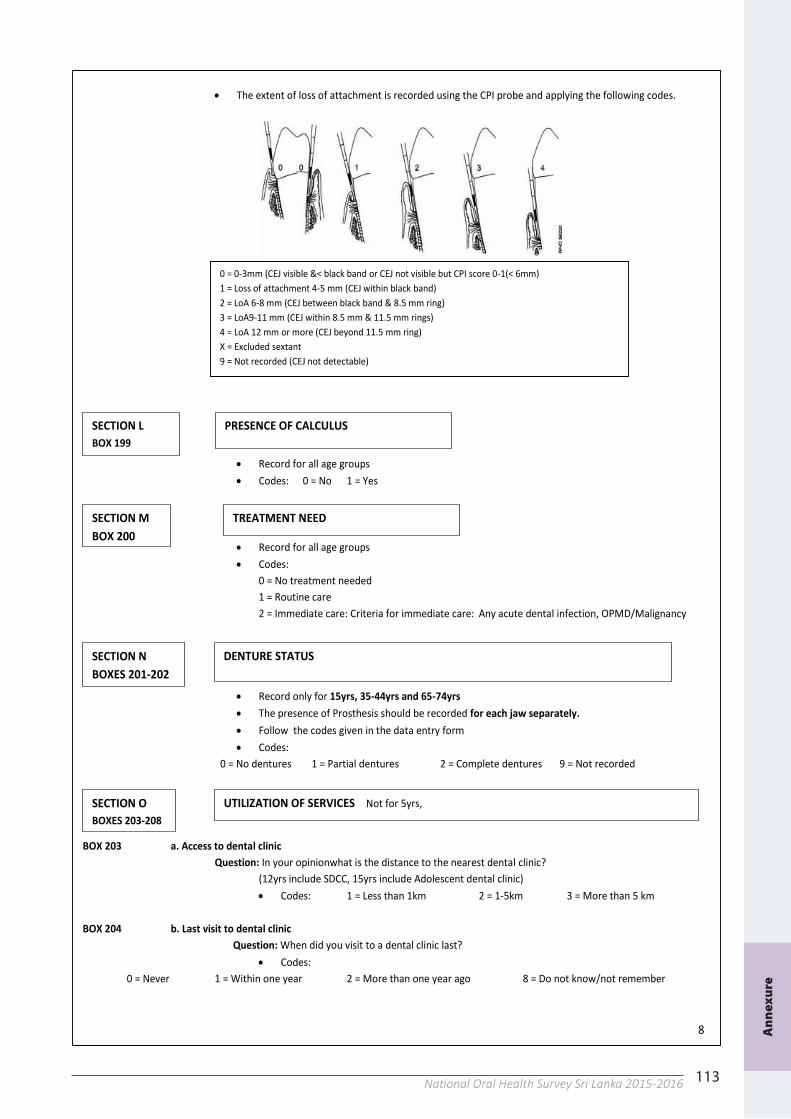
113National Oral Health Survey Sri Lanka 2015-2016
8
The extent of loss of attachment is recorded using the CPI probe and applying the following codes.
Record for all age groups Codes: 0 = No 1 = Yes
Record for all age groups Codes:
0 = No treatment needed 1 = Routine care 2 = Immediate care: Criteria for immediate care: Any acute dental infection, OPMD/Malignancy
Record only for 15yrs, 35-44yrs and 65-74yrs The presence of Prosthesis should be recorded for each jaw separately. Follow the codes given in the data entry form Codes:
0 = No dentures 1 = Partial dentures 2 = Complete dentures 9 = Not recorded BOX 203 a. Access to dental clinic
Question: In your opinionwhat is the distance to the nearest dental clinic? (12yrs include SDCC, 15yrs include Adolescent dental clinic) Codes: 1 = Less than 1km 2 = 1-5km 3 = More than 5 km
BOX 204 b. Last visit to dental clinic
Question: When did you visit to a dental clinic last? Codes:
0 = Never 1 = Within one year 2 = More than one year ago 8 = Do not know/not remember
SECTION N BOXES 201-202
DENTURE STATUS
SECTION L BOX 199
PRESENCE OF CALCULUS
SECTION O BOXES 203-208
UTILIZATION OF SERVICES Not for 5yrs,
0 = 0-3mm (CEJ visible &< black band or CEJ not visible but CPI score 0-1(< 6mm) 1 = Loss of attachment 4-5 mm (CEJ within black band) 2 = LoA 6-8 mm (CEJ between black band & 8.5 mm ring) 3 = LoA9-11 mm (CEJ within 8.5 mm & 11.5 mm rings) 4 = LoA 12 mm or more (CEJ beyond 11.5 mm ring) X = Excluded sextant 9 = Not recorded (CEJ not detectable)
SECTION M BOX 200
TREATMENT NEED
An
nex
ure
114 National Oral Health Survey Sri Lanka 2015-2016
9
BOX 205 c. Type of Dental Clinic visited Question: What type of dental clinic did you visited last?
Codes: 0 = Never visited 1 = Hospital Dental Clinic 2 = Private Dental Clinic 3 = School Dental clinic (ADC & routine school mobiles)
4 = Mobile Dental Clinic 5 = Any other (Specify ………………………………) 8 = Do not Know/not remember
Code 3: School dental clinic includes Adolescent dental clinics and any mobile dental (out-reach) clinic set-up
in schools under school dental programme. Code 4 includes any mobile clinic specially conducted for people other than routine school dental programme.
BOXES 206- 208 d. Type of treatment
Question: What type of treatment did you received at the last visit? Codes
0 = No treatment 1 = OHI//advices 2 = Extraction
3 = Temporary filling 4 = Permanent Filling 5 = Scaling
6 = Drugs only 7 = Any other (Please specify …) 8 = Do not know
Indicate any special findings of the subject
SECTION P BOX 209
COMMENTS
An
nex
ure
115National Oral Health Survey Sri Lanka 2015-2016115
Annexure 6: Examiner training and calibration
The examiner training and calibration was carried out during a 02-day programme and the PI and two senior examiners who participated in the National Oral Health Survey in 2003 were considered as the gold-standard. The schedule of the programme is given below.
Day 1 Day 2
An introductory lecture by the PI on the purpose of the survey, examination criteria and recording forms (02hrs)
Discussion on the identified errors (02hrs)
Calibration exercise 1 (02hrs) (details given below) Calibration exercise 03 (02hrs)
Discussion (01hr) Calibration exercise 04 (02hrs)
Calibration exercise 02 (02hrs) Discussion (02hrs)
Discussion (01hr)
Calibration exercise:
Due to difficulty in finding patients and minimizing repeated examination of a given patient, the following method was used for the calibration exercise.
Two 05-patient-sets (total 10 patients) were taken from the hospital out-patient department. In order to represent index ages, the selection was restricted to either a child with the mixed dentition or an adult between 35-75 year olds. All selected patients were examined by one of the senior examiners.
Subsequently, all examiners (20 were in the first training session) were divided into 10 groups with 02 examiners in a group. A group was given 02 patients and was requested to mark the clinical measurements. One examiner conducted the examination while the other functioned as the data recorder. For the next patient, the procedure was reversed. Examiners were arranged in a systematic way so that each examiner had to examine one child and an adult. A similar procedure was followed for the second patient set. Examiners who could not examine either a child or an adult was given an additional patient of the relevant age category (e.g. for examiners H & I - no child patient as given in the example).
Example (for one patient-examiner set)
05 patients: A1,A2,C3,C4,A5, (A: Adult, C: Child) 05 examiner groups: AB, CD, EF, GH, IJ 04 examination rounds: each patient was examined by 04 examiners
Pt A1 Pt A2 Pt C3 Pt C4 Pt A5 ROUND 1 A C E G I ROUND 2 J B D F H ROUND 3 G I A C E ROUND 4 F H J B D
All examiners were asked to double-check data entries before submitting them to the senior examiners. The accuracy of their examination was then compared with the senior examiner’s records and also between examiners. The calibration exercise was confined to caries and periodontal disease only. Tooth by tooth comparison was done. The common problems (>60%) identified were related to the ‘DMFT’ count due to misclassification of un-erupted teeth as ‘missing’ and bleeding counts; probably due to repeated measurements or due to excessive force used when probing.
On the second day a similar procedure was followed. In addition, the examiners were briefed on how to rectify errors that occurred on the previous day. If an examiner did not achieve the required degree of consistency, additional patients were given for such an examiner. At the end of the second day, it was ensured that each examiner had examined a minimum of 04 children and 04 adults. A
nn
exu
re
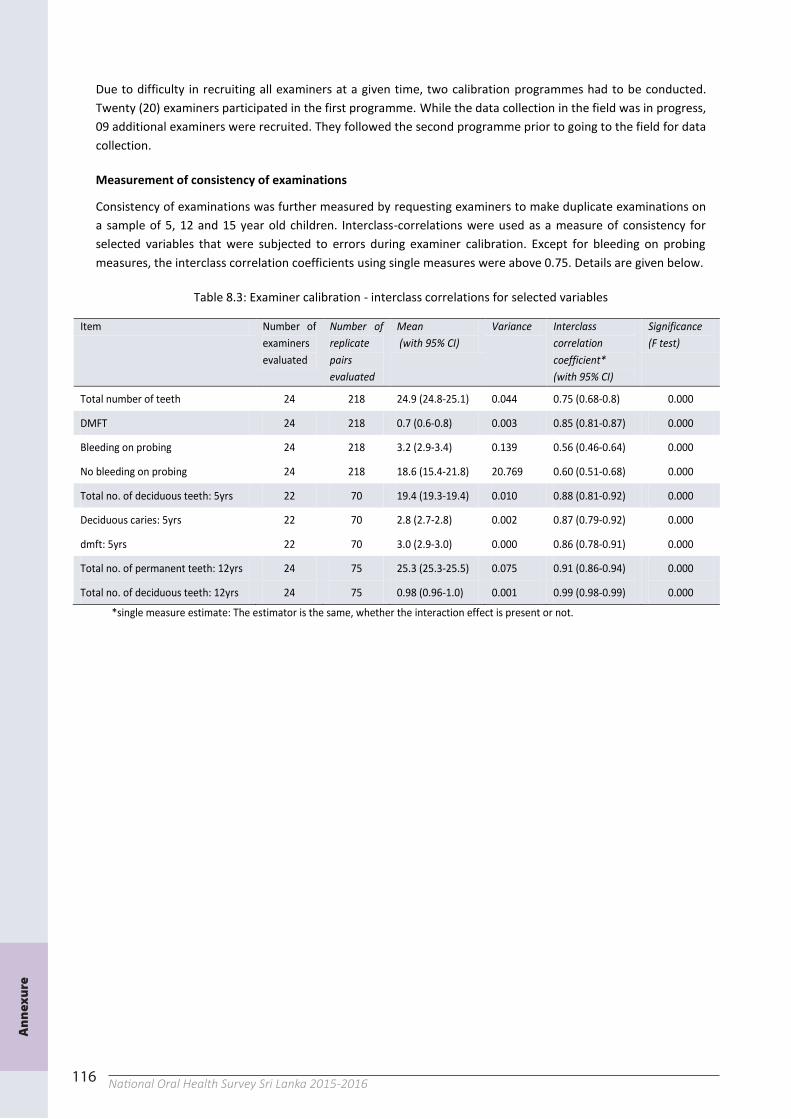
116 National Oral Health Survey Sri Lanka 2015-2016 116
Due to difficulty in recruiting all examiners at a given time, two calibration programmes had to be conducted. Twenty (20) examiners participated in the first programme. While the data collection in the field was in progress, 09 additional examiners were recruited. They followed the second programme prior to going to the field for data collection.
Measurement of consistency of examinations
Consistency of examinations was further measured by requesting examiners to make duplicate examinations on a sample of 5, 12 and 15 year old children. Interclass-correlations were used as a measure of consistency for selected variables that were subjected to errors during examiner calibration. Except for bleeding on probing measures, the interclass correlation coefficients using single measures were above 0.75. Details are given below.
Table 8.3: Examiner calibration - interclass correlations for selected variables
Item Number of examiners evaluated
Number of replicate pairs evaluated
Mean (with 95% CI)
Variance Interclass correlation coefficient* (with 95% CI)
Significance (F test)
Total number of teeth 24 218 24.9 (24.8-25.1) 0.044 0.75 (0.68-0.8) 0.000
DMFT 24 218 0.7 (0.6-0.8) 0.003 0.85 (0.81-0.87) 0.000
Bleeding on probing 24 218 3.2 (2.9-3.4) 0.139 0.56 (0.46-0.64) 0.000
No bleeding on probing 24 218 18.6 (15.4-21.8) 20.769 0.60 (0.51-0.68) 0.000
Total no. of deciduous teeth: 5yrs 22 70 19.4 (19.3-19.4) 0.010 0.88 (0.81-0.92) 0.000
Deciduous caries: 5yrs 22 70 2.8 (2.7-2.8) 0.002 0.87 (0.79-0.92) 0.000
dmft: 5yrs 22 70 3.0 (2.9-3.0) 0.000 0.86 (0.78-0.91) 0.000
Total no. of permanent teeth: 12yrs 24 75 25.3 (25.3-25.5) 0.075 0.91 (0.86-0.94) 0.000
Total no. of deciduous teeth: 12yrs 24 75 0.98 (0.96-1.0) 0.001 0.99 (0.98-0.99) 0.000
*single measure estimate: The estimator is the same, whether the interaction effect is present or not.
116
Due to difficulty in recruiting all examiners at a given time, two calibration programmes had to be conducted. Twenty (20) examiners participated in the first programme. While the data collection in the field was in progress, 09 additional examiners were recruited. They followed the second programme prior to going to the field for data collection.
Measurement of consistency of examinations
Consistency of examinations was further measured by requesting examiners to make duplicate examinations on a sample of 5, 12 and 15 year old children. Interclass-correlations were used as a measure of consistency for selected variables that were subjected to errors during examiner calibration. Except for bleeding on probing measures, the interclass correlation coefficients using single measures were above 0.75. Details are given below.
Table 8.3: Examiner calibration - interclass correlations for selected variables
Item Number of examiners evaluated
Number of replicate pairs evaluated
Mean (with 95% CI)
Variance Interclass correlation coefficient* (with 95% CI)
Significance (F test)
Total number of teeth 24 218 24.9 (24.8-25.1) 0.044 0.75 (0.68-0.8) 0.000
DMFT 24 218 0.7 (0.6-0.8) 0.003 0.85 (0.81-0.87) 0.000
Bleeding on probing 24 218 3.2 (2.9-3.4) 0.139 0.56 (0.46-0.64) 0.000
No bleeding on probing 24 218 18.6 (15.4-21.8) 20.769 0.60 (0.51-0.68) 0.000
Total no. of deciduous teeth: 5yrs 22 70 19.4 (19.3-19.4) 0.010 0.88 (0.81-0.92) 0.000
Deciduous caries: 5yrs 22 70 2.8 (2.7-2.8) 0.002 0.87 (0.79-0.92) 0.000
dmft: 5yrs 22 70 3.0 (2.9-3.0) 0.000 0.86 (0.78-0.91) 0.000
Total no. of permanent teeth: 12yrs 24 75 25.3 (25.3-25.5) 0.075 0.91 (0.86-0.94) 0.000
Total no. of deciduous teeth: 12yrs 24 75 0.98 (0.96-1.0) 0.001 0.99 (0.98-0.99) 0.000
*single measure estimate: The estimator is the same, whether the interaction effect is present or not.
An
nex
ure
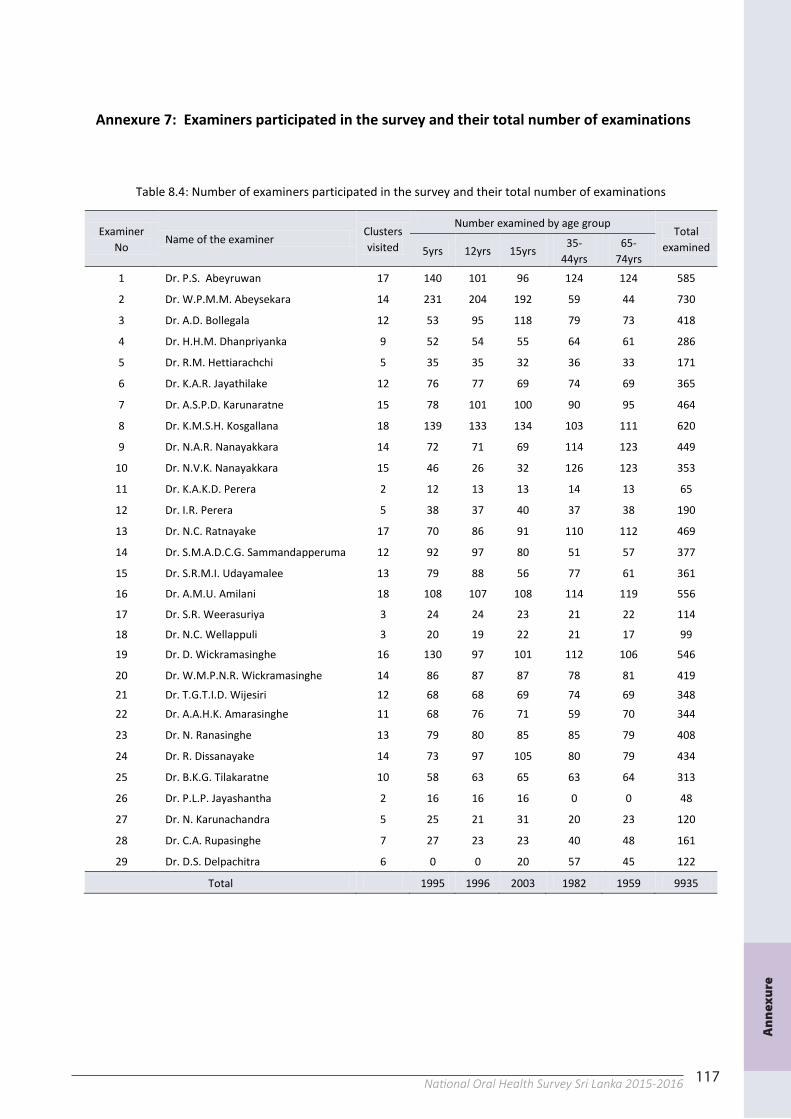
117National Oral Health Survey Sri Lanka 2015-2016116
Due to difficulty in recruiting all examiners at a given time, two calibration programmes had to be conducted. Twenty (20) examiners participated in the first programme. While the data collection in the field was in progress, 09 additional examiners were recruited. They followed the second programme prior to going to the field for data collection.
Measurement of consistency of examinations
Consistency of examinations was further measured by requesting examiners to make duplicate examinations on a sample of 5, 12 and 15 year old children. Interclass-correlations were used as a measure of consistency for selected variables that were subjected to errors during examiner calibration. Except for bleeding on probing measures, the interclass correlation coefficients using single measures were above 0.75. Details are given below.
Table 8.3: Examiner calibration - interclass correlations for selected variables
Item Number of examiners evaluated
Number of replicate pairs evaluated
Mean (with 95% CI)
Variance Interclass correlation coefficient* (with 95% CI)
Significance (F test)
Total number of teeth 24 218 24.9 (24.8-25.1) 0.044 0.75 (0.68-0.8) 0.000
DMFT 24 218 0.7 (0.6-0.8) 0.003 0.85 (0.81-0.87) 0.000
Bleeding on probing 24 218 3.2 (2.9-3.4) 0.139 0.56 (0.46-0.64) 0.000
No bleeding on probing 24 218 18.6 (15.4-21.8) 20.769 0.60 (0.51-0.68) 0.000
Total no. of deciduous teeth: 5yrs 22 70 19.4 (19.3-19.4) 0.010 0.88 (0.81-0.92) 0.000
Deciduous caries: 5yrs 22 70 2.8 (2.7-2.8) 0.002 0.87 (0.79-0.92) 0.000
dmft: 5yrs 22 70 3.0 (2.9-3.0) 0.000 0.86 (0.78-0.91) 0.000
Total no. of permanent teeth: 12yrs 24 75 25.3 (25.3-25.5) 0.075 0.91 (0.86-0.94) 0.000
Total no. of deciduous teeth: 12yrs 24 75 0.98 (0.96-1.0) 0.001 0.99 (0.98-0.99) 0.000
*single measure estimate: The estimator is the same, whether the interaction effect is present or not.
117
Annexure 7: Examiners participated in the survey and their total number of examinations
Table 8.4: Number of examiners participated in the survey and their total number of examinations
Examiner No
Name of the examiner Clusters visited
Number examined by age group Total
examined 5yrs 12yrs 15yrs 35-
44yrs 65-
74yrs 1 Dr. P.S. Abeyruwan 17 140 101 96 124 124 585
2 Dr. W.P.M.M. Abeysekara 14 231 204 192 59 44 730
3 Dr. A.D. Bollegala 12 53 95 118 79 73 418
4 Dr. H.H.M. Dhanpriyanka 9 52 54 55 64 61 286
5 Dr. R.M. Hettiarachchi 5 35 35 32 36 33 171
6 Dr. K.A.R. Jayathilake 12 76 77 69 74 69 365
7 Dr. A.S.P.D. Karunaratne 15 78 101 100 90 95 464
8 Dr. K.M.S.H. Kosgallana 18 139 133 134 103 111 620
9 Dr. N.A.R. Nanayakkara 14 72 71 69 114 123 449
10 Dr. N.V.K. Nanayakkara 15 46 26 32 126 123 353
11 Dr. K.A.K.D. Perera 2 12 13 13 14 13 65
12 Dr. I.R. Perera 5 38 37 40 37 38 190
13 Dr. N.C. Ratnayake 17 70 86 91 110 112 469
14 Dr. S.M.A.D.C.G. Sammandapperuma 12 92 97 80 51 57 377
15 Dr. S.R.M.I. Udayamalee 13 79 88 56 77 61 361
16 Dr. A.M.U. Amilani 18 108 107 108 114 119 556
17 Dr. S.R. Weerasuriya 3 24 24 23 21 22 114
18 Dr. N.C. Wellappuli 3 20 19 22 21 17 99
19 Dr. D. Wickramasinghe 16 130 97 101 112 106 546
20 Dr. W.M.P.N.R. Wickramasinghe 14 86 87 87 78 81 419 21 Dr. T.G.T.I.D. Wijesiri 12 68 68 69 74 69 348 22 Dr. A.A.H.K. Amarasinghe 11 68 76 71 59 70 344
23 Dr. N. Ranasinghe 13 79 80 85 85 79 408
24 Dr. R. Dissanayake 14 73 97 105 80 79 434
25 Dr. B.K.G. Tilakaratne 10 58 63 65 63 64 313
26 Dr. P.L.P. Jayashantha 2 16 16 16 0 0 48
27 Dr. N. Karunachandra 5 25 21 31 20 23 120
28 Dr. C.A. Rupasinghe 7 27 23 23 40 48 161
29 Dr. D.S. Delpachitra 6 0 0 20 57 45 122
Total 1995 1996 2003 1982 1959 9935
An
nex
ure
118 National Oral Health Survey Sri Lanka 2015-2016118
Notes
Related Documents