LGI / Resources / Ethnic relations NATIONAL AND SOCIAL INCLUSION/EXCLUSION IN FORMER YUGOSLAVIA BEFORE THE WAR OF 1991 1 • 2 • 3 • 4 • 5 • 6 • 7 • 8 • 9 Vratu{a-@unji}, Vera Faculty of Philosophy, Department of Sociology ^ika Ljubina 18-20, 11000 Belgrade, Yugoslavia Phone: + 38111 - 3282-777 ; Fax: + 38111 - 639-356 EMAIL: [email protected] or [email protected] (updated email!!!: [email protected] ) The paper explores possibilities of comparative research of the relationship between national and social inclusion/exclusion few years before the violent destruction of the former Yugoslavia. Through tragic interplay of internal and external causes, it became the privileged ground just for such investigation. Research empirical foundation is the 1989-1990 data base of the Consortium of Yugoslav social sciences’ institutes. The answers to the selected questions were used as indicators of national and social distance and inclusion/exclusion. Answer modalities to five questions ranging from complete agreement to complete disagreement with the attribution of importance to national component in social intercourse, were pondered and scaled. Respondents classified according to their self-identification with one of the nine most numerous ethnic, confessional and national groups in former Yugoslavia, were ranked according to frequency of the particular answer modalities’ choice, implicating different degrees of inclusionist or exclusionist orientation towards co-nationals and others. The existence of a ranking pattern is discovered. Albanians, Slovenes and Macedonians found themselves without exception on one of the first three places near the exclusionist extreme of all five scales. Yugoslavs, Hungarians and Muslims, with few exceptions, found themselves on one of the top three places near the scales’ inclusionist extreme. In the middle of the five scales, respondents Croats, Serbs and Montenegrins most often interchanged on the places closer to the inclusionist or the exclusionist scales’ extreme, depending on the particular question’s content. Underlying structural and historical factors of the observed pattern were analyzed. The main finding of the paper is that the propensity to express the feeling of national and social inclusion/exclusion by respondents was not influenced exclusively by their national identification as such. The concrete cultural, social, economic and political situation in their living environment, especially the minority/majority status and the place in social division of labor, proved to

Welcome message from author
This document is posted to help you gain knowledge. Please leave a comment to let me know what you think about it! Share it to your friends and learn new things together.
Transcript
LGI / Resources / Ethnic relations
NATIONAL AND SOCIAL INCLUSION/EXCLUSION IN FORMER YUGOSLAVIA BEFORE THE WAR OF 1991
1 • 2 • 3 • 4 • 5 • 6 • 7 • 8 • 9
Vratu{a-@unji}, VeraFaculty of Philosophy, Department of Sociology^ika Ljubina 18-20, 11000 Belgrade, YugoslaviaPhone: + 38111 - 3282-777 ; Fax: + 38111 - 639-356EMAIL: [email protected] or [email protected]
(updated email!!!: [email protected] )
The paper explores possibilities of comparative research of the relationship between national and social inclusion/exclusion few years before the violent destruction of the former Yugoslavia. Through tragic interplay of internal and external causes, it became the privileged ground just for such investigation.
Research empirical foundation is the 1989-1990 data base of the Consortium of Yugoslav social sciences’ institutes. The answers to the selected questions were used as indicators of national and social distance and inclusion/exclusion.
Answer modalities to five questions ranging from complete agreement to complete disagreement with the attribution of importance to national component in social intercourse, were pondered and scaled. Respondents classified according to their self-identification with one of the nine most numerous ethnic, confessional and national groups in former Yugoslavia, were ranked according to frequency of the particular answer modalities’ choice, implicating different degrees of inclusionist or exclusionist orientation towards co-nationals and others.
The existence of a ranking pattern is discovered. Albanians, Slovenes and Macedonians found themselves without exception on one of the first three places near the exclusionist extreme of all five scales. Yugoslavs, Hungarians and Muslims, with few exceptions, found themselves on one of the top three places nearthe scales’ inclusionist extreme. In the middle of the five scales, respondents Croats, Serbs and Montenegrins most often interchanged on the places closer to theinclusionist or the exclusionist scales’ extreme, depending on the particular question’s content. Underlying structural and historical factors of the observed pattern were analyzed.
The main finding of the paper is that the propensity to express the feeling of national and social inclusion/exclusion by respondents was not influenced exclusively by their national identification as such. The concrete cultural, social, economic and political situation in their living environment, especially the minority/majority status and the place in social division of labor, proved to

be the important co-determinants as well. Exceptions from the observed regularities are studied as indicators of "trouble spots". They are methodologically fruitful tool for inter-ethnic conflict potential diagnosis, identification of the main social actors and even prediction.
The 1981 census data, the last comprehensive data available for entire former Yugoslavia, were used to construct the representation index of different national groups in the most desired occupations. They were compared with survey data in order to determine validity of generalizations from the sample to the population at large.
Theoretical and methodological framework of the study
Introduction
This paper represents the continuation of the study on the possibilities and limits of comparative secondary analysis of survey data for the understanding and explanation of the former Yugoslavia’s violent breakup. "Balkanization" into five states (for the time being, at least), made this bygone multi-national federation into a privileged ground for comparative research of national and social inclusion/exclusion.
Slash between the last two concepts with opposite meanings is appropriate as a reminder of the reflexive and contradictory character of social relationships through which not only the individual, but also the collective self-identity is formed. The picture that one social group has of itself is mediated through the picture that others have about it. Those that feel themselves to be looked down upon and excluded by others, react often in self-defense by depreciating and excluding those that according to their feeling reject them. Resulting incorporation of some people as "insiders", implies by definition exclusion of other people as "outsiders". This phenomenon has often been labelled as ethnocentrism.
Questions
It is well known tenent of social psyhology that individual’s inclination to act and think in certain manner is influenced, among other factors, by objective characteristics of their life situation. In this paper I would like to find the answer to the following questions: 1) Are there differences between ethnic groups in former Yugoslavia in the extent to which they favour to interact with each other; or conversely the extent to which they prefer to avoid social interchange? 2) Are there differences within ethnic groups in the extent to which they prefer to avoid ethnic intercommunication, according to structural characteristics such as their social position? This paper focuses only on the examination of the existence and intensity of the correlation between respondents’ national belongingand their place in the social division of labor, on the one hand, and their tendency to have an supporting or rejecting attitude toward inter-ethnic social relationships, on the other.
Data and measurements
Empirical foundation of the research is once more the data base from the research ¢ ¢ Social structure and the quality of living¢ ¢ carried out by the Consortium ofYugoslav social sciences’ institutes in 1989-1990. This was actually the first andthe last all-Yugoslav research project. Data for Slovenia were gathered somewhat later than in other five former Yugoslav Republics and two Provinces. This fact reflected the atmosphere of progressive disintegration of cooperation between different Yugoslav peoples inhabiting its socio-political and administrative units. Affected were all spheres of social activity, from politics and economics to culture and science. Because of this, data for all administrative units are notcompletely comparable. In spite of these shortfalls, I have included all data in this research believing that it is better to have imperfectly comparable data thanno data at all.
The 1989/90 stratified sample was fairly representative in terms of ethnic/national composition of former Yugoslavia. In the 1981 census, the last comprehensive statistics available for entire former Yugoslavia (Albanians refusedto be registered in 1991), there were 2.6% Montenegrins, 19.7% Croats, 6.0% Macedonians, 8.0 Muslims, 7.8 Slovenes, 36.3 Serbs, 7.7% Albanians, 1.9% Hungarians, 5.4% Yugoslavs, and 4.6% of other nationalities in entire population. When we compare this data with the column "nationality" in the Tables presented inthe Appendix, we can see that less numerous ethnic and national groups were over-represented (Montenegrins by 3.6%, Yugoslavs by 1.5%, Muslims by 1.1%, Slovenes by1.0%, Macedonians by 0.8%, Albanians by 0.5%), while more numerous ones were under-represented (Serbs by 3.0% and Croats by 1.8%). This can be explained by theover-proportional enlargement of the samples for smaller administrative units likeMontenegro and Kosovo and Metohiya in order to make possible the data analysis within them taken separately. Under-representation of Hungarians by 0.8% is due tothe "mistake in the realization of the planned sample for Voyvodina (Hod`i}, Alija, 1991: 425)
How much are we justified to generalize survey findings concerning social bearers of the exclusionist orientation onto the general population? In order to answer this question we must examine closer the representativeness of the sample through comparison of survey data and census data.
Survey data presented in Table 6 and census data presented in Table 7 point out tothe existence of characteristic differences between members of different nationalities regarding their position in socio-professional structure and therefore also in social power distribution.
In the category of unemployed or "active population not exercising an occupation",Slovenes have the lowest index of participation and Albanians the highest (41 : 265, Table 6; 45:187, Table 7). This finding can be explained by the fact that Slovenes are geographically concentrated in the industrially most developed parts of the former Yugoslavia with the lowest rate of unemployment, while Albanians areconcentrated the most in K&M, industrially the least developed region in former Yugoslavia. In spite of considerable differences in concrete figures, the rank of

other nationalities’ members according to their participation indexes’ in the jobless group are similar in both Tables and correspond as a rule to the overall economic situation in R/P where the particular nationality is concentrated the most. It is interesting to point out that according to both sources Yugoslavs are together with Montenegrins, Macedonians and Muslims overrepresented also in the category of unemployed.
In the category peasants Muslims are not at all over-represented as it is suggested by survey findings, (214), but are in fact under-represented in it (77).Even from survey data in Table 6, however, it is obvious that greater percentage of Serbs are peasants than it is the case by Muslims. This can be elucidated through historical fact that Serbs were less urbanized than Turks and Islamized Serbs and Croats, who were privileged during the Osmanly occupation and lived in administrative centers. Rank of other nationalities is similar in both Tables, andis positively correlated with the degree of industrial development of respective R/P. Yugoslavs are according to both data sources among the least represented in the category of peasants.
In the occupational category "workers", only respondents Muslims and Slovenians are significantly over-represented in it according to both survey data (126 and 128), and census data (136 and 127). Having in mind that census data are not subdivided according to qualifications, it is not possible to check unexpected andun-probable survey finding that Muslims are the most over-represented in the category of more qualified workers, (143) and that Slovenians are among the most under-represented in this category of work places (72), immediately after Albanians (63). Historical and economic reasons for this doubt are already mentioned.
The findings for the category of artisans and private businesspersons from the sample (respondents Croats, Motenegrins and Macedonians the most under representedwith indexes around 70, and Slovenians the most overrepresented with index of 205)could not be compared and thus checked against the corresponding category in census data. The 1981 census, namely, did not include ownership as the social status determination criterion of rising importance, even though the "overflow" ofstate and social resources onto the private accounts of economic, political and cultural elite in the foreign banks had begun already in the middle of sixties after the economic reform of 1965. It is true that at the time very small portion of the work force was officially employed in the private sector. Numerous journal articles and unsystematized first hand experience suggested however that "informalsector" and "gray economy" were thriving. Insistence only on the "social sector" in census data therefore resulted in underrepresentation of all nationalities, butespecially Albanians in the categories of "trade" and "services’ workers" (indexes68 and 61). The 1989/90 survey sample did not contribute enough to the correction of the census data flaws for it failed to include sufficing number of respondents representing small, middle and big private entrepreneurs especially among Hungarians and Macedonians (just 3 and 8 respondents). .
: In the category of officials, Yugoslavs and Montenegrins are among the most over-represented according to both data sources (from first to third rank with

indexes 177, 124 in Table 6, and 173,147 in Table 7). Hungarians are not over-represented in it as careless observer might conclude from the Table 6 (127), if he did not notice that just 14 respondents Hungarians fall into this category. In reality index of Hungarians’ participation in "officials" amounted only to 70 according to census data (Table 7), just 14 index points more than for Albanians.
Survey data on the category of experts employed in industry are corroborated by census data on chemists, physicists, technicians, technologues, traffic experts and natural scientists as far as the over-representation of Slovenians and Yugoslavs, on the one hand, and under-representation of Hungarians and Muslims in this category is concerned. This time just two respondents Hungarians and 15 respondents Muslims falling into the category of experts employed in industry wereenough to suggest the correct conclusion on their underrepresentation in this category (73 and 65 in Table 6, 55 and 68 in Table 7).
Surely, it is impossible to guess when it is allowed to generalize survey results in spite of insufficient number of respondents that can be classified in particular category. The safest thing to do is therefore to control the survey data whenever it is possible through census data.
One of the most serious difficulties connected with the use and secondary analysisof other researchers’ survey data, is the absence of the possibility to influence the creation of research instruments. They are mostly constructed for entirely different exploration interests (quality of living in this case). Aware of this problem, I have nevertheless chosen among available survey questions those that seemed to be valid instruments for the examination of the relationship between theethnic and social inclusion/exclusion.
Among the available 300 items, the answers to the following questions were used asindicators of readiness to socialize with members of other ethnic groups or to keep away from them on the contrary: I. How much is for You personally important the national belonging while choosing the spouse? II. With members of which nationamong the cited ones would You like to work with the most? III. Do You agree and to what extent with the statement: A person can feel completely safe only when he/she lives in the milieu where exists the majority of its nation’s members?; IV.Do You agree and to what extent with the statement: Among nations good cooperationcan be materialized, but never also the complete trust?.
Statements concerning the importance of national belonging in everyday interactions were becoming potentially controversial theme at the time of researchin 1989/90 because the creation of independent national states by elites of particular ethnic groups having demographic majority in the realm of correspondingterritorial units was in full swing. It implied the loss of the status of the "constitutive nation" for members of minority ethnic group in the given territorial unit. In the atmosphere of heightened inter-ethnic tensions, even the best trained interviewers could not completely melt away distrust among the members of local ethnic minority while answering such disputable questions. The uncertain reliability and validity of these research instruments must be thereforekept in mind while deciphering the survey results.

The scales of inclusion/exclusion were constructed by using answer modalities to chosen questions, ranging between complete refusal and complete acceptance of the importance of national belonging for social intercourse, as quasi ponders. Scale scores or the average answer modalities for each nationality of respondents in entire former Yugoslavia were calculated as the ratio between the sum of frequencies for each answer modality multiplied by 1,2,3 or 4, depending on the answer modalities’ formulation, on the one hand, and the total number of that nation’s members in the sample, on the other (see Tables 1,2,3,4 and 5 in the Appendix).
The category of national belonging in this research is defined through self-identification of respondents. They could choose between 18 names of different nationalities or add their own name.
The category of the position in social division of labor is operationalized on thebasis of the occupations’ typology of the Federal Bureau of Statistics. It is elaborated by taking into account the qualifications of the respondents occupying various work places (see Table 6). Thus it largely incorporates in itself several other important factors like educational attainment, social prestige, political power. Even respondents’ age (in the category of others are represented the most retired people and students) and the place of residence in the city or in the countryside (peasants or industrial workers) can be deduced from data on the "workplace".
As can be seen through the comparison of cited 1981 census data (Table 7) and 1989/90 research data from (Table 6), the category of management personnel was over-proportionally represented in stratified samples. This was done on purpose toenable closer examination of the economic and political elite’s attitudes. While interpreting the research results, it should be also kept in mind that in the samples the categories of peasants and workers were under-proportionally represented, especially in the sample for the so called Central Serbia without Provinces Voyvodina and Kosovo and Metohiya. At the same time, the "other" category was over-represented. Survey data are therefore deficient when they are classified according to work place of respondents. In the sample for Slovenia, forinstance, exist only two political functionaries, while the entire sample for Serbia is smaller than it should be, on the one hand, but 15.2% of respondents, again in the sample for Slovenia, fall into the category "without answer", on the other, so that respondents non-Slovenians contribute to this last category only 6.9% in entire sample for former Yugoslavia.
In order to check the hypothesis that place in the international and local division of labor can contribute to the explanation of differences in inclusionist/exclusionist orientation of the given nationalities' members toward members of other nationalities, the representation index of particular ethnic groups in specific socio-professional categories was constructed. It is calculatedas the ratio between the percentage participation of particular ethnic group’s members in a specific occupation group, and the percentage participation of the same ethnic group’s members in the sample (survey data) or in active population (census data).

Because of deficiencies of survey data, more reliable basis for the calculation ofthe participation index of different nationalities in various occupations are therefore 1981 census data (see Table 7). It must be kept in mind, however, that during more than eight years that passed between the census and the survey research, some changes in ocupational structure could have taken place.
Absence of sufficient number of respondents of different nationalities in all socio-professional categories in the samples for particular R/Ps necessary for valid statistical conclusions, forced me to include in the analyzes the answers toselected questions of all respondents that identify themselves as members of the particular nationality in entire former Yugoslavia. Having in mind geographic concentration of these nationalities in particular R/P where they have absolute orrelative demographic majority, it is still possible to deduce some inferences as to which socio-professional group of respondents within each nationality contributed the most to the expression of exclusionist attitudes toward members ofother nationalities in specific R/P.
It must be emphasized, however, that even this decision to join all respondents ofthe same nationality irrespective of the region where they live was not sufficientin the case of small nationality groups (only 158 respondents Hungarians for instance), or in the case of particular occupational categories (sub-groups of workers or experts for example, or technicians and very specific and interesting category of security personnel) even in the bigger samples. In such cases recodingof data was done. In the cases where conditions for valid statistical conclusions were not met (at least 20 or more respondents for the occupation category), data in Tables from 1a to 5a are put into parentheses as a warning against rash generalizations.
Considering that variables in this research are nominal, not having numeric properties of meaningful distance between the values, zero point, relative size orsymmetry, it is understandable that the tables of contingency and ranking were used as main tools of statistical description of the state of examined relationships at the time of research.
Cramer’s variant of the Chi-square-based coefficient of contingency, that can attain the maximum of 1 for tables of any dimension, thus making different tables comparable, is used as the main measure of association between national belonging and place in the social division of labor, on the one hand, with national and social exclusion, as indicated by readiness to express the attitude implying national and social (dis)affection, (in)security and (mis)trust, on the other. It is complemented by the Goodman and Kruskal’s symmetric and asymmetric Lambda variant of the proportional reduction of prediction error measurement.
Longitudinal data on the changes of the respondents’ attitudes toward the importance of national belonging through time not being available, it was only possible to resort to the use of comparative method through space. Such contrasting can also contribute to the checking of the reliability and validity ofthe chosen research instruments. Whenever there existed sufficient number of respondents for valid statistical conclusions, the answers of the members of the
particular ethnic group in the situation of local demographic majority, were compared with the answers of the same ethnic group’s members being in the situation of local minority.
Research results
The main research findings will be exposed separately for each question-indicator,going from those characterizing the state of interethnic closeness or distance in the most significant primary social relationships, toward the ones pointing out tothe degree of inclusionist and exclusionist orientation among respondents identifying with different nationalities in wider social milieu and in the global society.
Question I. "How much is for You personally important the national belonging whilechoosing the spouse?"
Survey data presented in the Table 1. confirm the hypothesis that there exists statistically significant connection between respondents’ national affiliation andtheir readiness to enter into matrimony with members of other nationalities (Cramer’s V .249). Four fifths of respondents Albanians and around one third of respondents Macedonians and Slovenians (81.8%, 38.2% and 28.9% respectively) answered that the nationality of the spouse was very important. Taking into account their percentage participation in entire sample, it comes out that respondents belonging to these three nationalities were over-proportionally represented in the extreme exclusionist answer modality (indexes of representation333, 156 and 118 respectively). From the Table 1 it is also visible that around four fifths of respondents Hungarians and Yugoslavs (72.2% and 83.3%) answered that the nationality of the spouse was not important. They were the most over-represented in the extreme inclusionist answer modality (indexes 155 and 181 respectively). It is therefore not surprising that on the scale of inclusion/exclusion ranging from 1 to 4, respondents Albanians, Macedonians, Slovenians attained the highest scores (3.63, 2.74, and 2.49 respectively), whilstrespondents Hungarians and Yugoslavs achieved the smallest scores (1.44 and 1.27 respectively). Other examined nationalities had below-average scores, amounting to2.16 for the whole sample: Muslims (2.14), Montenegrins (2.04), Croats (1.98) and Serbs (1.94) in descending order.
Such ranking can be explained in part by the strong correlation between national, religious and confessional identification of respondents. First ranked respondentsAlbanians, namely, declared to be persuaded believers in 25.3% of cases and identified themselves with Islamic confession in more than nine tenth of cases (93.1%) (Vratu{a-@unji}, Vera, 1996c: Table 1, p. 498). Islamic confession is known to regulate more strictly conjugal relationships of the believers than otherconfessions (it is forbidden to Muslim women to marry "infidel" man for instance).Fourth rank of respondents Muslims (in the meaning of nationality according to theconstitutional law of 1971), could be explicated by the fact that they identified less often with Muslim confession (76.2%) and less often declared to be persuaded believers (18.2%) than Albanians. The lowest (ninth) ranked respondents Yugoslavs on the other hand, defined as nationally not-determined in population censuses,
most often declared not to belong to any confession (63.0%) and claimed to be persuaded believers in only 1.4% of cases (Vratu{a-@unji}, Vera, 1996c: Ibid).
Distinct confessional and religious self-identification of respondents affiliated to different nationalities, however, can not account for the finding that respondents Slovenians and Hungarians, that both identified with the same confession (Catholicism) in four fifths of cases (80,7% and 82.3%) and declared tobe persuaded believers in one sixths of cases (14.5% and 15.2%), found themselves on the opposite ends of the inclusion/exclusion scale.
A look at the Table 9. column No.I, containing the distribution of the extreme exclusionist oriented answer modality to the first question classified according to the nationality of respondents and to the Republic/Province (R/P) in which theylive, suggests one of the possible additional explanations. It indicates that irrespective of their national affiliation, respondents that live in the situationof the demographic minority in a given R/P, have a tendency to answer that the nationality of the spouse is "very important" less often than the members of localmajority nationality and their co-nationals in "mother" R/P. Thus respondents Serbs in Croatia, for instance, opted for the extreme exclusionist answer modalityin 3.3% of cases, more than five times less often than respondents Croats (17.5%) and more than six times less often than respondents Serbs in Serbia (20.0%). Respondents Muslims in Croatia have attributed great importance to the nationalityof the spouse less often (11.9%) than respondents Croats in Croatia, respondents Montenegrins in Montenegro (12.7%:15.2%) and respondents Muslims in Bosnia and Herzegovina (B&H) (18.6%) as well. Thus they implicitly expressed readiness to assimilate into the majority nationality or to enlarge the group of nationally not-determined Yugoslavs through inter-ethnic marriages. The choice of exclusionist answer modality by respondents members of majority nationalities, on the contrary, could be seen as the expression of their tendency to retain numeric preponderance on the basis of nationally homogenous marriages. Small number of respondents Slovenians and Macedonians in the samples of other R/P does not allow to check whether members of these nationalities remain so much preoccupied with the nationality of the spouse (29.4% and 40.0%) and consequently with the ethnic "cleanliness" of the posterity. when they reside outside their "mother" republics.
In Voyvodina, with the smallest percentage of average agreement with the importance of spouse’s nationality (9%), respondents Croats and Hungarians lagged behind local respondents Serbs in this respect just by two insignificant percentages (9.0%, 8.7% and 11.2% respectively).
Noticeable deviation from this rule are the cases of respondents Croats in B&H, Muslims in Serbia, Serbs in Montenegro and Albanians in Montenegro and Macedonia, who declared that the nationality of the spouse was "very important" approximatelytwo times more often (28.8%, 46.4%, 31.4%, 33.3% and 81.0%) than respondents Muslims, Serbs, Motenegrins and Macedonians having relative or absolute demographic majority in respective republics (18.6%, 20.0%, 15.2%, 13.3% and 39.6%, Table 9). Their exclusionist answers indicate the tendency to close up within the circle of co-nationals when the primary relationships are concerned. Such attitude is the result of complex feedback in interethnic relations, both
positive action to preserve one’s national identity. and reaction to the feeling of being excluded.
Already mentioned explanation pointing out to the specificity of Islamic marital norms is obviously not sufficient to account for the differences in attitudes between respondents identifying with Christianizm. Thus Macedonians, who accordingto their allegation very little believed in religious teachings (4.4%), opted for the extreme exclusionist answer modality twice as often (39.6%) as respondents Serbs (20.0) who declared to be persuaded believers more often than Macedonians (8.5%) (Vratu{a-@unji}, Vera, 1996c: Ibid).
The explanation of these differences in the attribution of importance to national dimension in primary social intercourse should be therefore sought also in wider historical context and in the actual social power relationships both between different nationalities and within the same ones in a particular R/P at the time of research. Tried and true way to begin the examination of inter- and intra-national social power relationships in a given pluri-ethnic society is to analyze general life situation of its members as influenced by their place in social hierarchy.
Data in Table 1a, containing the occurrences of the answer modality stating that the nationality of the spouse is "very important" classified by respondents’ nationality and workplace, confirms the thesis that respondents’ place in social division of labor and their attitudes. toward the importance of spouse’s nationality are related (Cramer’s V variates between the lowest .102 and .115 in the case of respondents Yugoslavs and Serbs, and the highest .230 and .190 in the case of respondents Macedonians and Montenegrins). Respondents of all nationalities active in occupations near the bottom of the social ladder, especially respondents peasants, tied to natural rhythms and tradition by their way of living, as well as workers of lower qualifications, tend to be over-represented in exclusionist oriented answer modalities (index 146 and 138) and thus less opened toward members of other nationalities than those near the top of this ladder. Data corroborates the expectation that exclusionist orientation is the least manifested among respondents professional politicians, "responsible" forat least verbal support to the official legitimization ideology of "unity and brotherhood" between different nationalities in former Yugoslavia (index 44).
A number of exceptions to this rule exist, however, that should be pointed out. From the Table 1a it is visible that respondents managers Albanians and Montenegrins, specialist employed in administration Muslims, security personnel Croats and Yugoslavs, have slightly more often, or at least as often, chosen exclusionist answer modality to this question.(79.1% and 13.0%, 19.5%, 21.7% and 3.7% respectively) than their co-nationals higher qualified workers and peasants (78.0% and 13.1, 17.8%, 18.0% and 3.2% respectively).
1 • 2 • 3 • 4 • 5 • 6 • 7 • 8 • 9
LGI / Resources / Ethnic relations

OCT DEC JAN
12007 2008 2009
20captures
28Feb01- 1Dec08
CloseHelp
LGI / Resources / Ethnic relations
NATIONAL AND SOCIAL INCLUSION/EXCLUSION IN FORMER YUGOSLAVIA BEFORE THE WAR OF 1991
1 • 2 • 3 • 4 • 5 • 6 • 7 • 8 • 9
Question II: With members of which nation would You like to work with the most?
Data in the Table 2. corroborate the assumption that respondents’ national affiliation is related to their preferences concerning the nationality of the workcolleague (Cramer’s V .401). Elements of inter-ethnic exclusion, as measured by the search for the coworker exclusively within one’s own nationality group, are present the most among respondents Slovenians (70.9%), Albanians (58.0%), Montenegrins (36.2%), Macedonians (34.3%) and Croats (30.5%). Only respondents Serbs, Yugoslavs, Hungarians and Muslims, opted for their co-nationals in less than one quarter of cases (24.6%, 20.8%, 12.7% and 9.3% respectively). When all answer modalities were taken into account, only respondents Macedonians and Montenegrins switched their third and fourth ranking places, while respondents Hungarians and Muslims switched their two last ranking places on the scale of inclusion/exclusion ranging from 1 to 3.
From the Table 2 it is obvious that immediately after respondents’ own co-nationals, Yugoslavs are the most wanted for coworkers among respondents of all nationalities, This is especially expressed among respondents Muslims, who chose Yugoslavs even more often (18.8%) than conationals (9.3%). Another exception are respondents Albanians, who opted more often for Slovenians (3.3%), the second mostpopular nationality, than for Yugoslavs (0.7%). The Respondents Yugoslavs and Slovenians from their side rarely reciprocated this sympathy. The first insisted that nationality of the work colleague is not important (62.9%), while the second chose their conationals in three fourths of cases.
Asymmetric sympathy characterizes also the relations between respondents of other nationalities. Respondents Muslims for instance, expressed preference for Croats and Serbs more often (4.9% and 4.3%) than respondents Croats and Serbs have done

that for Muslims (1.2% and 0.6%). Respondents Serbs as well chose Croats slightly more often (1.4%) than respondents Croats chose Serbs (0.9%). Relationship betweenrespondents Serbs and Albanians could be characterized as mutual ignoration - just0.1% of both nationalities opted for the other. In fact only Muslims chose Albanians in one full percentage of cases. Therefore the nationality of those respondents who selected Albanians as the preferred coworker is in 96.1% of cases Albanian. This research on national and social inclusion/exclusion has confirmed the findings of earlier studies on interethnic distance that respondents Albaniansthemselves expressed the greatest degree of distance toward members of other nationalities and were also exposed to the greatest expression of implicit exclusion by the members of other nationalities (Panti}, Dragomir, 1991).
Finding that respondents of all nationalities, except for Albanians and Muslims, tended to attribute greater importance to the nationality of the coworker than to the nationality of the spouse could be explained by the direct formulation of the question. Answer modality negating the importance of nationality of the coworker was offered the last, after the whole list of twenty nationalities preceding it. If we think of social distance in the terms of greatest degree of exclusion, it might be good idea to conceptualize the corresponding survey item in even more blunt way, asking for instance: "With members of which nationality you would not like to work with?". The importance of survey item phrasing is very important methodological point that must be kept in mind in all research phases.
In the manner of black humor it could be surmised that respondents believe that itis easier to change the spouse if it comes out that their choice of life partner was mistaken, than to change the work colleague in the conditions of law mobility of employed and ever higher rates of unemployment. Part of the explanation could be also found in the ubiquitous search for "connections" among conationals placed in influential positions.
Data in Table 9. column No.II, containing the distribution of the extreme exclusionist oriented answer modality according to R/P of respondents’ residence, attest that respondents living in the position of the local relative or absolute demographic minority, are less prone to narrow the recruitment pool of favored coworkers to their own nationality group, than members of local majority. It is interesting to note that respondents Albanians in Macedonia and Montenegro and Croats in B&H, where they present numerous minorities having majority in localities where they live very much concentrated, are joined by respondents Yugoslavs living dispersed in B&H and in Voyvodina, as exceptions to this principle. Yugoslavs in these two former federal units preferred to cooperate at work with other Yugoslavs more often (22.3% and 18.8%) than Muslims in B&H with other Muslims, or Serbs in Voyvodina with other Serbs (18.6% and 17.3% respectively). This explains why respondents Yugoslavs did not end up at the extreme inclusionist end of the scale ranging from 1 to 3. They scored 1.47 points, considerably less than first ranked Slovenians and Albanians (2.40 and 2.09), but still slightly more than last ranked Muslims and Hungarians (1.46 and 1.34, Table 2).

Data in Table 2a, column No. II, offer new examples of deviation from the rule that respondents placed in higher positions in social hierarchy are more opened toward members of other nationalities at workplace, than their lower placed co-nationals. Among respondents Albanians, specialist employed in social services have preferred co-national for coworker more often (70.8%) than any other occupational category, except for higher qualified workers (72.3%). The same sub-group of respondents specialists identifying with Muslim, Macedonian, Slovenian nationality, also expressed exclusionist attitude more often than their less qualified workers conationals. Somewhat unexpectedly, among respondents Yugoslavs it were members of security personnel and directors who preferred Yugoslavs for coworkers more often (29.7% and 29.6%) than both less and more qualified workers Yugoslavs (17.5% and 25.5%). Another curiosity presents the finding that respondents peasants and unemployed have shown in general more openness toward members of other nationalities at work place even though they are not in a situation to put this attitude into practice.
Question III: Do You agree and to what extent with the statement: A person can feel completely safe only when he/she lives in the milieu where exists the majority of its nation’s members?
Look at the Table 3 provides additional proves for the connection between respondents nationality and inclination to express or not express the feeling of insecurity outside the surrounding of their conationals (Cramer’s V .225). The tendency to do so is the most manifested by respondents Albanians, Slovenians and Macedonians (71.8%, 63.1%, 50.2%), and the least manifested by respondents Yugoslavs and Muslims (13.2%, 13.1%). In the middle of the scale of inclusion/exclusion ranging from 1 to 3, respondents Serbs for the first time attained higher score (1.87, 39.4% of agreement with the statement on safety) thanrespondents Croats (1.62, 27.2% of agreement). Beside respondents Serbs, respondents Albanians, Macedonians and Hungarians tend as well to assign greater significance to the national composition of wider living environment than to the national belonging of their coworker. Respondents of all examined nationalities except Albanians and Muslims, are as well less concerned, from two to three times less, for the nationality of the spouse than for the ethnic structure of their place of residence.
Data in Table 9, column No.III, affirm once again that respondents really living in the situation of minority less often express the agreement with the statement that status of national majority is the prerequisite for the feeling of security, than respondents who really live in a situation of national majority. Agreement percentages of respondents Serbs in Croatia and Croats in Voyvodina with (in)security statement are 9.7% and 12.8%, while the same percentages of respondents Serbs and Croats in "mother" R/P were 50.6% and 29.9%.
Table 3a submits additional evidence to the fact that striving to reside in the surrounding of one’s conationals is not characteristic exclusively for the respondents having no access to social positions of power, feeling therefore more

vulnerable to discrimination exercised by the affiliates of the majority nationality. Respondents specialists employed in state administration Muslims and Yugoslavs, specialists employed in economy Serbs, security personnel Montenegrins,directors Macedonians have more often or at least as often agreed with this statement (19.0% and 13.5, 39.2%, 40.0%, 44.5% respectively) than their conationals higher or even lower qualified workers and peasants (15.5% and 9.5%, 38.4, 35.7%, 44.4% respectively). These findings point out that one part of state officials and educated elites felt insecure on their controlling and managing positions.
Question IV: "Among nations good cooperation can be realized but never complete trust".
Data in Table 4 reiterate that respondents national identification is related to their preparedness to report or maybe to conceal their feelings of mistrust towardmembers of other nationalities. This time, however, the measure of association is the smallest so far (Cramer’s V: .161). The difference in acceptance percentage ofthe examined statement between first ranked Slovenians, Albanians and Macedonians (71.0% ,70.3%, and 60.2%, scale scores 2.55, 2.56 and 2.33 out of maximum 3) and last ranked Muslims. Montenegrins and Yugoslavs (40.0, 41.0% and 36.7%, scale sores 1.92, 1.91 and 1.75) is less than 1:2, while in the case of previous questions it sometimes overpasses 1:20. In the middle of the scale respondents Serbs retained higher score (2.24) than Croats (2.16), while Montenegrins this time moved to the inclusionist end of the scale with the scale score of 1.91.
The inconsistency of attaching less importance to the national element in everydaysocial intercourse in the family and at the work place, on the one hand, and the attribution of great importance to national element in the neighborhood and in theglobal society is the most visible in the case of this question.
Data in Table 9, column No.IV demonstrates that respondents who live in the situation of national minority outside their "home" Republics have shown no vacillation at all or at least much less hesitation than in the case of previous questions, to express their attitude of mistrust towards other nations’ members. This time respondents Serbs in Croatia lagged behind respondents Croats in acceptance of extreme exclusionist answer modality by only 30 index points (109-79or 53.9% - 39.3%), in contrast to the previous questions where difference was muchgreater (123-40 or 29.9% - 9.7%, 128-25 or 17.5% - 3.3%). Difference between respondents Muslims in Croatia and respondents Croats practically disappeared (109- 107, or 53.9%-52.4%), while respondents Motenegrins in Serbia and Serbs in K&M for the first time and respondents Serbs in Montenegro for the third time agreed with the examined statement more often than Albanians, Serbs or Montenegrins (62.6%-63.6%;71.1%-89.8%;38.6-48.6%). These deviations from the pattern indicate where the "trouble spots" are located and the existence of tensions not only between respondents affiliated to nationalities identifying predominantly with different confessions, but also between the respondents identifying with the same confession. Even around two fifths of low ranked respondents Yugoslavs in B&H and
Voyvodina, otherwise the most inclusionist oriented, this time agreed that complete trust between nations was not possible. This survey item therefore appears to be the most reliable instrument for measuring the real degree of mutualexclusion between different ethnic groups’ members. In spite of the ambiguous formulation of the question the two parts of which have opposite meanings and mention nations instead of their members. Researchers that participated in data gathering in the field, claim on the basis of so attained first hand experience that "respondents in great majority understood well that the accent was put on thesupposed absence of the possibility to establish relations devoid of all suspicionbetween members of different ethnic groups" (Ili}, Vladimir, Cveji}, Slobodan, 1993:541). The apodictic formulation of this statement ("complete" trust) did not prevent the absolute majority of all respondents to agree with this statement (54.5%).
In Table 4a can be found the great number of the exceptions to the rule that respondents with controlling and managing work functions are more inclusionist oriented toward members of other nationalities. Sample for the entire former Yugoslavia allows to accept as valid the finding that respondents belonging to security personnel Slovenes, Croats, Montenegrins and Muslims, agreed with the statement on (mis)trust more often than their conationals peasants and both lower and higher qualified workers, while respondents Serbs of the same occupation as often as their co-nationals peasants. This is namely not possible within each national group of respondents taken separately, because of the insufficient numberin the sample. This is very important finding having in mind the constitutional duty of security personnel to defend the integrity of the Yugoslavia and equal rights of all its citizens and nationalities. Data in Table 4. also point out to the respondents directors Slovenians, Montenegrin and Muslims, specialists employed in state administration and in social services Slovenes and Montenegrins,specialists employed in industry Serbs as the main social bearers and disseminators of the exclusionist orientation toward members of other nationalities among their co-nationals on the lower levels of the occupations’ hierarchy, who agreed less often with the statement on (mis)trust at the time of research.
Comparing survey and census data on socio-professional structure and implicit social power distribution
Survey data deviate from census data suggesting that Albanians are the most over-represented in the category of experts employed in industry (174), and Montenegrins the most-underrepresented in it (50). Census data reveal the opposite- index above 40 for Albanians, and above 130 for Montenegrins. It is possible that in the period that passed after the 1981 census until the 1989/90 survey research, new educated generations of Albanians were employed in industry.
Data in both Tables accord that Albanians are among the most over-represented in the category of experts employed in social services (130 in Table 6), especially in education (188, Table 7). This finding supports the previous thesis that

education is propelling force of rapid occupational structure change for Albanians. Muslims and Serbs are according to both data sources the most under-represented in the category of experts employed in social services and education (74 and 84 Table 6, 64 and 84, Table 7). Survey data deviate from census data in the Case of Croats, who are not overrepresented in this category as suggested by Table 6 (133), but slightly under-represented (98, Table 7).
Both survey and census data show that Montenegrins, Yugoslavs and Albanians are the most over-represented in the category of experts employed in state administration, as managers of economic chambers and various associations, and that Hungarians and Muslims are the most under-represented in it. Survey data diverge from census data in the case of Slovenians and Serbs. The first are not infact gravely under-represented in it (49), but comfortably over-represented (114),while the second are not slightly over-represented in it (105 in Table 6), but on the contrary under-represented (91 in Table 7).
Category of defense personnel is heterogeneous, for it contains in itself entire hierarchy of state repressive apparatus, from night watchmen to generals. According to both data sources, Montenegrins and Yugoslavs are among the most over-represented in it, while Croats ad Slovenes are among the most under-represented in it. In contrast to survey data, Albanians in a 1981 census were notunderrepresented (83) but over-represented (129). Contrary to widespread prejudiceabout the overrepresentation of Serbs in army and police, they are according to both sources just slightly over-represented (104, Table 6, 102, Table 7). The principle of national parity was strictly observed at the top of army and police power structure. Only rank and file cadres were recruited primarily in regions with higher rates of unemployment, while young people in more developed parts of the country avoided these occupations.
In the category of directors, both data sources confirm over-representation of Montenegrins and Yugoslavs, and underrepresentation of Hungarians and Muslims. Much like in the case of experts employed in industry, survey data suggest that Albanians were overrepresented in it (112), while they were according to survey data very much under-represented in this category (39). The time that passed between census and survey can contribute to the explanation of this inconsistency once again. In the case of another deviation in opposite direction concerning Slovenians, explanation of their under-representation in the category of directorsin survey data (33) and over-representation in census data (144) must be searched for in inadequate structure of the sample for Slovenia. In contrast to survey data, according to which Croats are twelve index- points under-represented and Serbs just three index points underrepresented (Table 6) in the category of directors, census data suggest that Croats are in fact slightly over-represented in this category (105) and Serbs eleven index points under-represented (89, Table 7).
Situation in the category of political functionaries is very similar to the preceding one. Bad sampling explains practical absence of Slovenians from this category in survey data (3). while they were in fact comfortably over-represented in it according to census data (141), occupying third rank behind Montenegrins
(183) and Yugoslavs (150), while Macedonians were fourth (117). In this important occupation category Albanians were according to both survey and census data overrepresented (113 and 102), while the most numerous nationalities, Serbs, Croats and Muslims, were under-represented. This is due to the application of parity principle in the selection of key managing cadres according to the "national key" within each territorial unit.
The fact that respondents Yugoslavs often found themselves over-represented near the top of occupations’ hierarchy in the most prestigious and desired occupations,it might be interesting to examine their ethnic origin. According to survey data the nationality of the fathers of respondents that declared themselves as Yugoslavs was the most often Serb (34.7%, index 104, while sons of fathers Serbs in 92.1% of cases remained Serb or self-reproduced themselves). Other nationality affiliations of Yugoslav respondents’ fathers are as follows: Yugoslav 28.3% (index 121, self-reproduction 83.3%); Muslim 12.7% (index 136, self-reproduction 89.5%); Croat 12.6% (index 26, self-reproduction 93.7%); Montenegrin 4.4% (index 74, self-reproduction 92.1%); Macedonian 1.3%; (index 19, self-reproduction 98.0%); Hungarian 1.2% (index 109, self reproduction 89.4); Slovenian 0.5% (index 6, 97.7% self-reproduction) Albanian 0.5% (index 4, self-reproduction 98.8%). These findings should be controlled through the comparison with census data.
Conclusions
It is impossible to elaborate in just one paper all the implications of data in Tables from 1 to 4 in the Appendix. They contain pondered and scaled answer modalities to inter-ethnic social distance questions regarding importance of national belonging while choosing one¢ s spouse and the colleague at work, the (in)possibility of feeling safe outside the surrounding of the one¢ s own nationality affiliates and (in)possibility of full confidence realization between different nations. They range from the attribution of the greatest importance to the national component in social intercourse to the negation of its significance. Respondents, classified according to their national self-identification in entire former Yugoslavia, were ranked according to the frequency of their choice of particular answer modalities, implicating different degrees of inclusionist or exclusionist orientation towards co-nationals and others.
The most important inference that can be deduced from these Tables is the existence of the ranking pattern. Respondents Albanians, Slovenes and Macedonians found themselves without exception on one of the first three places near the exclusionist extreme of all five scales. Respondents Yugoslavs, Hungarians and Muslims, with few exemptions, found themselves on one of the top three places nearthe scales’ inclusionist extreme. In the middle of the five scales respondents Croats, Serbs and Montenegrins most often interchanged on the fourth, fifth and sixth place, closer to the inclusionist or the exclusionist scales’ extreme, depending on the particular question’s content.
The exceptional fourth rank of respondents Muslims and seventh rank of respondentsSerbs concerning the question on the importance of the spouse’s nationality (Table1) was previously partly explained from the culturalist perspective of specific

religiously inspired marital norms and differential degrees of confessional and religious identification of these respondents. In this section I will attempt to shed more light on the underlying socio-economic factors of the observed pattern.
Data in Table 9, containing in the last column synthetic scale scores for all questions of respondents identifying with one of the nine largest ethnic, confessional and national groups in entire sample for former Yugoslavia, confirm that the observed regularity is really present. On the scale ranging from the minimum 1 point at the inclusionist extreme, to the maximum 3.2 points at its exclusionist extreme, respondents Albanians, Slovenians and Macedonians scored 2.73, 2.40 and 2.17 points. Montenegrins, Croats and Serbs follow with 1.82, 1.81 and 1.80 points respectively. The smallest score was attained by Muslims, Hungarians and Yugoslavs (1.62, 1.55 and 1.40).
Having in mind geographic concentration of particular national groups in corresponding Republics and Provinces, it is not surprising that the rank of Republics and Provinces (R/P) according to the percentage of the respondents’ expressed agreement with the most exclusionist oriented answer modalities is largely constant as well. Kosovo and Metohiya (K&M), Slovenia and Macedonia, interchange on the first, second and third place on the scale of "exclusionist orientation". Montenegro, Croatia and Serbia, alternate in the middle of this scale, depending on the content of particular survey item. Voyvodina and Bosnia and Herzegovina (B&H), where Yugoslavs and/or Muslims, together with Serbs are concentrated the most, take shifts near the inclusionist scale extreme (see Table 9, questions I to IV).
From the comparison of average values of selected indicators in different Republics and Provinces it is possible to infer assumptions about the phase to which the process of national estrangement and uncertainty has advanced in a givenmilieu at the time of research, two years before the outbreak of the war.
In one of the previous studies (Vera Vratu{a-@unji}, 1995b) very similar sequence was established when the average percentage of respondents' complete and partial agreement with the statement "Every nation must have its state" was concerned (seeTable 5 and Table 9, question V in the Appendix). This statement presents the basic allegation of every nation-state legitimization ideology and its realizationin the multi-ethnic and multi-confessional milieu must mean the fight for territories, mutual extermination and forced mass migrations of the populace. On the first place was Kosovo and Metohiya (K&M) with 84.7%. Slovenia (48.8%), Macedonia (40.4%), Croatia (20.6%), Montenegro (l8.0%), Serbia (14.3%), and Voyvodina (8.6%) followed. Bosnia and Herzegovina (B&H) was on the last place with6.7%. This sequence fairly closely conforms to the sequence in which the real conflict manifested itself. It is the long-standing latent conflict of provincial,Republican and federal power elites over privatization of social and state property on "their" territory and their transformation into sovereign rulers of independent national states. Primitive accumulation of capital has always been connected with the nation state creation and consolidation of national markets protected for the sake of emerging local bourgeoisie in both industrially

underdeveloped and relatively developed societies (Vratu{a-@unji}, Vera, 1997, 194ff).
Regularity of this sequence testifies to the fact that it is not haphazard. The questions concerning the importance of national belonging in social intercourse indicate in fact the degree to which the important psychological sources of the appearance and of the acceptance of the demand for independent nation state creation were present in the given R/P at the time of research: inter-ethnic exclusion and a sensation of insecurity and mistrust.
This aspiration to political organization within a sovereign national state was particularly strong among Slovene and Croat elites that joined of their own free will Serb elites in the so called First Yugoslavia after the World War One. At thetime, Slovene and Croat elites were allies of the side that lost the war and were therefore threatened by war reparations’ payment and annexationist pretensions of neighboring powers, especially Italy. They did not succeed to restore their national independence lost in the middle ages to foreign occupiers, like Serb elites have accomplished in XIX century through massive mobilization of wide layers of Serb population in liberation struggle against the Turks. Yearning toward national state was also powerful among those segments of population that were not even recognized as separate ethnic groups (Macedonians, Montenegrins, Muslims) in the First Yugoslavia. Eagerness to create nation state became ever stronger also among the members of ethnic minorities in the milieus where they hadbecome demographic majorities (especially Albanians in Kosovo and Metohiya).
Homogenization of the population on ethnic basis can largely be explained by the geographic concentration of particular ethnic groups in the regions with a markedly uneven degree of general development and with unequal positions in domestic and international division of labor (Vratu{a-@unji}, Vera, 1995a: 115-156). Those who had the most favorable positions in the social division of labor, measured by their index of participation in the most desirable managing occupations, strove to keep them, while those less satisfied with their place in this division, attempted to improve it (see Table 6 with survey data and especially Table 7 with census data).
On the basis of the comparison of 1989/90 survey and 1981 census data in this paper, we can conclude that both sources suggest rather consistent ranking of particular nationalities in occupational structure. Albanians, Hungarians and Muslims are over-proportionately represented in the predominantly manual, executing ad repetitive jobs, Yugoslavs and Montenegrins are on the contrary over-participating in controlling and commanding work functions. Serbs found themselvesin the middle of the occupational hierarchy, seaming to be better off according tosurvey data, but being in fact worse of according to census data. Croats also found themselves in the middle. In their case, however, there exists an opposite tendency for underestimation of their place in occupational hierarchy according tosurvey data.

It is interesting to note that in the category of political functionaries, if we take into consideration only the most numerous "constitutive nations"’ affiliates (census data 1981, Table 7), Croats were the most under-represented (79), followedby Serbs (85), while Muslims were the least under-represented (98). According to survey data in Table 6 more than eight years later, their rank changed: upside down: the most under-represented were Muslims (80), followed by Serbs (93), while Croats were the least under-represented (97). Unavailability of complete census data from 1991 prevents us from checking whether it came to real changes in the participation of these three nationalities in the category of politicians in the meantime.
It can not be excluded that the 1983 court processes against Muslim nationalists, hairs of the Second World War organization "Mladi Muslimani" ("Young Muslims") among whom was Alija Izetbegovi}, provoked decline in representation index of Muslim political elites toward the end of eighties. The greatest part of this organization’s members "participated in the 1990 creation of Stranke demokratske akcije (SDA, Party of Democratic Action)" according to words of Alija Izetbegovi},Ned`ib [a}irbegovi} and others themselves (Klju~anin, Zihad, ed., 1991, .68ff). Its fundamentalist wing does not shrink from violent means in order to realize the1943. program of "Islam power" and creation of the Muslim state in B&H, with the ample help of Mujahedines from Islamic countries.
Croat political elites, on the contrary, possibly "recovered" after the court processes against their nationalists at the beginning of seventies, among whom wasFranjo Tu|man. Together with one part of Ustasha extremist emigration, they were the main organizers of Hrvatske demokratske zajednice (HDZ, Croat Democratic Unionin 1990). During the crucial days before the violent breakup of former Yugoslavia,president of the Federal state was Croat Stipe Mesi}, who swore to be the last president of Yugoslavia, while another two Croats, Ante Markovi} and Budimir Lon~ar, were the Prime Minister and the Minister of foreign affaires respectively.
It should be noted that contrary to widespread accusations that Serbs held hegemonic power in former Yugoslavia, according to both data sources Serbs were never over-represented and never even the least under-represented in the category of political functionaries. Different parts of Serbian political elites were persecuted successively - supporters of monarchist exile government after II Second World War, supporters of Staljin in 1948, supporters of Slobodan Rankovi}, Serbian chief of the police and Marshal Tito’s closest collaborator until the beginning of sixties, supporters of "anarcho-liberals" at the beginning of seventies. After the triumph of Slobodan Milo{evi}’s "wing" within the Communist Party of Sertbia, the main social bearers of the national program in Serbia becameformer communists that became socialists.
Data in Tables 1a to 5a illustrate the considerable capabilities of surveys to identify main social actors contributing the most to the creation of atmosphere ofsocial inclusion or exclusion. Deviation from the theoretical expectations and observed regularity that respondents occupied in routine manual jobs have inclination to attribute greater importance to national element in social intercourse than respondents specialists, managers and politicians is unfailing

methodological tool for detection of social groups the most interested in the realization of national program and creation of national state within particular national group. Especially data in Table 4a and 5a demonstrate that among respondents Slovenians, Albanians and Muslims, it were specialists employed in social services or in the economy; among Croats and Macedonians, beside specialists it were also directors; among Macedonians and Serbs it were politicians. The most telling is the finding that respondents employed as securitypersonnel have in the entire sample higher index of representation in the agreement with the statement that full trust between nations is not possible and that every nation should have its state (107), than both peasants and higher and lower qualified worker. At the bottom of the occupation category, greater index ofrepresentation in this type of answer modality had only unemployed respondents (111), susceptible to turn their anger in the situation of economic crisis not against local power elites but against members of other nationalities as competitors for ever scarcer jobs,
It is visible from Table 9, however, that significant differences exist between the attitudes of the same ethnic/confessional group’s members toward examined statements depending on whether they reside in "home" or other Republics and Provinces. This suggests the conclusion that the opinions of the respondents are not influenced only by their national belonging as such., but by their concrete situation in their living environment as well.
One important aspect of this life situation is the fact of being in a situation oflocal ethnic majority or minority. Finding that respondents in the situation of minority have a tendency to chose less exclusionist oriented answer modalities than local majority affiliates can be explained as an attempt to rationalize the minority status outside "mother" R/P and to integrate into the social environment..
It must be added that greater attribution of the importance to the national element by the members of the most numerous local ethnicity, can be ascribed to their greater frankness. They are less reticent to express their real opinion. On the other hand, more "internationalist" and "cosmopolitan" attitude among the samenationality affiliates when they find themselves in a position of demographic minority in the given surrounding, does not necessarily reflect their real minds. The interviewed often give answers which they think are expected from them, because they do not want to be exposed as the partisans of "nationalistic" ideas in the milieu of the majority ethnic group. This explains in great deal why is theaverage percentage of the agreement with the particular statement for almost each ethnic group in entire former Yugoslavia somewhat smaller than the percentage of agreement with this statement in "mother" Republic or Province. Only exceptions are Muslims, whose low average in B&H are raising Muslims outside of it, especially those in Serbia and Montenegro (see Table 9).
. When the feeling of insecurity passes the threshold of tolerability, there always remains the solution of emigration towards one’s conationals. In this way in "mother" R/P increases the number of those who demonstrated in practice their
agreement with "security only among conationals" statement and actually carry out its implicit recommendation.
Movements of population toward "mother republics" were intensified from the beginning of seventies, after the enactment of constitutional amendments promotingMuslim confession affiliates into nation, enlarging the political and territorial autonomy of Republics at the expense of dispowered former Yugoslav Federation, as well as augmenting the para-etatistic ingerences of Provinces within the Republic of Serbia at the expense of the so called Central Serbia. On the basis of comparison between the number of inhabitants of the given R/P according to the birthplace and according to the place of residence within entire former Yugoslaviain 1981, it was established that in the so called Central Serbia and Voyvodina immigrated 119.717 + 97.353 = 217.070 inhabitants born in Croatia and 125.502 + 188.040 = 313.542 inhabitants born in B&H. At the same time into Croatia immigrated 38.181 + 38.929 = 77.110 inhabitants born in Central Serbia and Voyvodina and into B&H 46.817 + 15.731 = 62.548 (@ulji}, Stako, 1989, 46,64).
Large positive saldo of immigration is obviously "in favor" of Serbia. The experience of emigration trauma largely explains fourth rank of respondents Serbs,in front of Croats and Muslims, while answering the questions concerning the possibility of security and trust between nations. If the emigration from B&H could be explained in part through economic reasons, this is not possible for the emigration from industrially more developed Croatia into Central Serbia having lower BNP.
There are indicative exceptions to the "minority rule" like respondents Croats in Voyvodina and B&H, Muslims in Serbia and Albanians in Montenegro and Macedonia. Absence of the rationalization of the minority status among respondents identifying with these nationalities is understandable in the light of the fact that they live concentrated in particular localities where they have demographic majority. Deviation from the "minority rule" is the sign of latent or already manifested inter-national exclusion that can swiftly transform itself into conflict. Therefore it should be used as indicator of "trouble spots"’s location. Exemptions from the observed regularities or theoretical expectations is fruitful methodological tool for inter-ethnic conflict potential diagnosis and even prediction of future tensions.
Table 9 is full of such indications, and many were commented in previous sections of the paper. One of the most specific deviations from the ‘minority rule" is the research finding that respondents Serbs, political and constitutional majority butdemographic minority in the Province K&M, agreed with the statement on impossibility of full trust between nations slightly more often than Albanians (71.1% and 69.8%). The finding that both respondent Serbs and Albanians in K&M opted for the most exclusionist oriented answer modalities, points out that this Province was the epicenter of social and inter-ethnic conflict of historic and demographic right over the same territory at the time of research. It also warns that exclusion/counter-exclusion cycle might have very long duration in the futureas well.

This cycle historically began at the time of massive emigration of Serbs from K&M running away from unbearable repression by Turkish occupiers aided by Islamized Albanians towards the end of Ottoman empire. Mass emigration of Serbs and Montenegrins from K&M, including entire peasant families, was renewed at the end of sixties and early seventies, simultaneously with uncontrolled immigration of Albanians from Albania. It caused the rapid change of ethnic structure. The percentage of Serbs in K&M fell from 23.6% in 1948 and 23.5% in 1961 to 18.3% in 1971, 13.2% in 1981 and 9.9% in 1991.
One possible theme for further research in the field of majority - minority relationships, is to find out whether there exists the critical turning point in the national composition of the population when the local majority ethnic group has a tendency to discriminate against members of a minority group, or minority affiliates cease to abide by the "minority rule" and start to insist on separationand political organization within independent national state.
The ranking of respondents from B&H near the inclusionist extreme of the scale seams at the first sight to cast greatest doubts as to the predictive capacities of 1989/90 survey. Less than two years after it, bloody civil war with ethnic and religious overtones broke out. Low percentage of agreement of all respondents withnationalistic stereotypes could be explained by the still latent character of the conflict at the time of research. Differences in the representation of different nationalities’ members in the most attractive managing occupations, frequent source of conflict in multiethnic communities, in B&H were comparatively the smallest in former Yugoslavia. One part of the explanation is also the fact that nationally based political parties were formed somewhat later than in other Republics. It is possible therefore that the main protagonists of the nationalistic exclusionist ideology were not "captured" by the sample. The last but not the least reason is that in B&H, as in "small Yugoslavia", people were more aware than elsewhere that the creation of nationally based independent stateswould mean armed fight for the territories (Vratu{a-@unji}, Vera, 1995b).
Closer look at the data in Table 9, offers indications that interethnic relations were not so harmonious as it appears at the first glance. One of them is the already mentioned finding that respondents Croats had always attributed greater importance to national element than Muslims, having a relative demographic majority, and the second most numerous Serbs. The second is important enough to beunderlined once again; respondents Yugoslavs, otherwise expressing the most inclusionist oriented attitudes, in B&H had the highest percentage of self-choice for the preferred coworker (22.3%), even more than Croats (16.3%), and together with Muslims, Serbs and Croats in almost two fifths of cases (36.5%), agreed that full trust between nations was impossible.
Longitudinal data on the eventual changes of this widely dispersed feeling of mistrust between different nations’ members still have to be collected. It is not probable that at this moment already exist required minimal conditions for the retake of 1989/90 survey. Methodological preparations for it, however, can and should begin immediately. Modest contribution to these preparations is detailed secondary analysis of the available data in order to use again its strong points

and to find ways to avoid its flows and weaknesses in future comparative researches.
Prioritary preparatory tasks include the creation of common research instrument for comparative research on Europe. The content and phrasing of its items should be well sought out to make them valid and reliable tool for gathering comparable data in regular intervals from five to ten years. Sociologists should also try to influence more than so far the census questionnaires. Already existing census datashould also be used more than before to get acquainted with the basic socio-demographic characteristics of European population affiliated to different ethnic,confessional, religious, cultural, national, sex, age, occupational, educational, deviational .... sub-populations. Calculation of representation indexes of specific groups in examined sub-populations through the comparison with their participation in global population, is fruitful first step. Such index, optimal for comparation purposes, is itself a good indicator of social inclusion/exclusion, measuring the accessibility of particular positions in socialdivision of labor, that are the most connected with better material rewards, political power and social prestige, to different social groups.
REFERENCES:
Blagojevi} Marina, 1996: "Iseljavanje sa Kosova" ("Emigration from Kosovo") in Srpska strana rata (Serbian Side of the War) , BIGZ, Beograd, 232-264
Cveji}, Slobodan, Ili} Vladimir, 1994: "Nacionalizam na Kosovu - jedna sekundarna analiza" ("Nationalism in Kosovo - A Secondary Analysis") , Sociolo{ki pregled, (Sociological Review) No.3
Ili}, Vladimir, Cveji}, Slobodan, 1993: "Vojvo|ani i nacionalizam" ("The People ofVojvodina and Nationalism"), Sociologija (Sociology), No. 4, 533-548
Hod`i}, Alija, 1991: "Dru{tvena struktura i kvalitet `ivota - osnovne karakteristike uzorka", Sociologija, No.3,
Klju~anin Zilhad., (ed.) 1991: Mladi Muslimani (Young Muslims), Sarajevo 1991
Panti}, Dragomir, 1991: "Nacionalna distanca gra|ana Jugoslavije"("National Distance of the Yugoslav Citizens"), in Ba}evi} Ljiljana and others: Jugoslavija na kriznoj prekretnici (Yugoslavia on the Crisis Crossroad), IDN, Beograd, 168-186
Vratu{a-@unji}, Vera, 1993a: "Rat i razvoj" ("War and Development"), Sociologija, No.4, str. 517-531.
1993b: "Protagonisti svojinske transformacije u dru{tvenim sistemima isto~ne, centralne i jugoisto~ne Evrope s posebnim osvrtom na slu~aj Jugoslavije" ("The protagonists of Ownership Transformation in Social Systems of Eastern, Central andSouth-Eastern Europe, With a Special Focus on the Case of Yugoslavia"), Sociologija, No.1, str. 53-68

1995a: "Promena unutar-dru{tvene i me|unarodne podele rada kao faktor ratnog sukobljavanja - slu~aj verskih ratova na po~etku modernog doba" i "Kriza razvoja, rat i religija na kraju XX veka" u Razvoj, religija, rat (Development, Religion, War), Beograd, Institut za sociolo{ka istra`ivanja Filozofskog fakulteta u Beogradu
1995b: "Clash of Civilizations, Nations or Social Classes", Sociolo{ki pregled: Selected articles by Serbian Sociologists Presented at the Second European Conference for Sociology, Budapest, 30. VIII -2.IX 1995, No.2, 205-223
1996a: "Mogu}nost anketnog istra`ivanja uloge religije u raspadu Jugoslavije", in Religija, Crkva, Nacija (Religion, Church, Nation), JUNIR, Ni{
1996b: "The change from self-management to nation-state legitimization in the former Yugoslavia", 8th IAFEP Conference in Praha, August 22-24, 1996 - Program & Abstracts, 122
1996c "Stanje religioznosti u biv{oj Jugoslaviji neposredno pred rat 1991" ("The state of religiosity in former Yugoslavia just before the war of 1991"), No.4, 495-511
1997: "Balkan in Transition - Social actors and Strategies", in Transition in Central and Eastern Europe, in Transition in Central and Eastern Europe, Yasf, Belgrade, 183-200
@ulji}, Stanko, 1989: Narodnosna struktura Jugoslavije i tokovi promjena (Nationality Structure of Yugoslavia and Change Currents), Zagreb)
1 • 2 • 3 • 4 • 5 • 6 • 7 • 8 • 9
LGI / Resources / Ethnic relations
OCT DEC JAN
12007 2008 2009
24captures
28Feb01- 1Dec08
CloseHelp
LGI / Resources / Ethnic relations
NATIONAL AND SOCIAL INCLUSION/EXCLUSION IN FORMER YUGOSLAVIA BEFORE THE WAR OF 1991
1 • 2 • 3 • 4 • 5 • 6 • 7 • 8 • 9
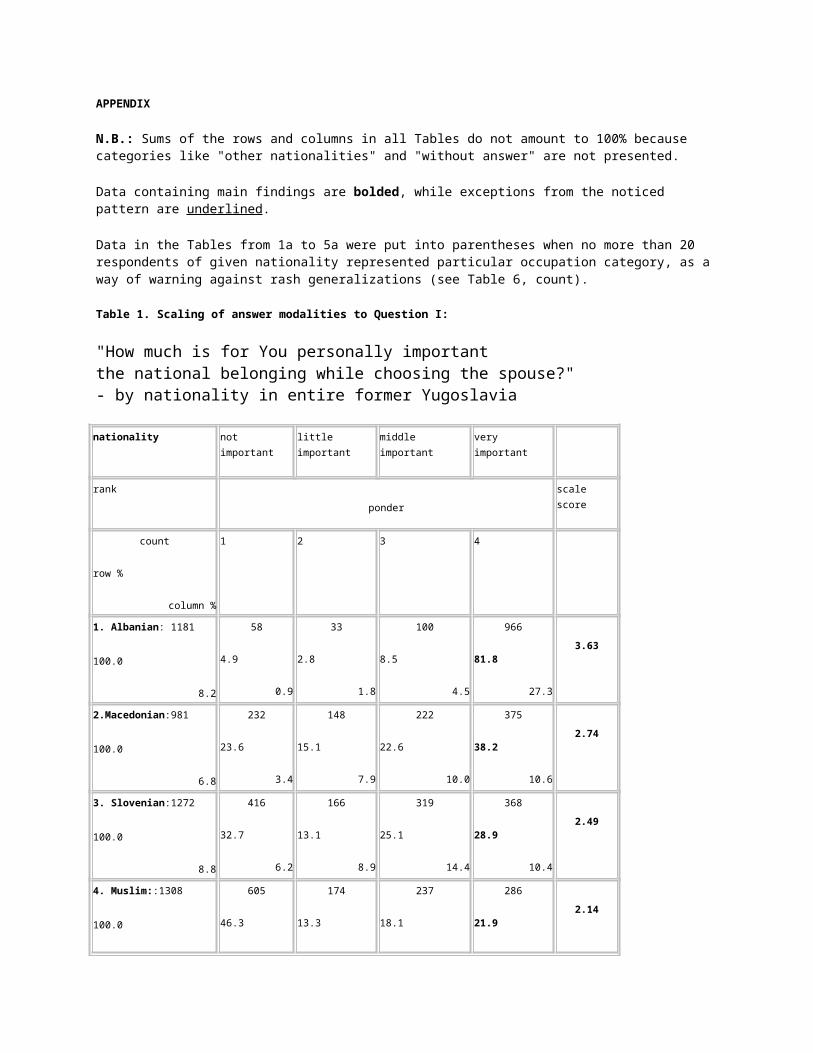
APPENDIX
N.B.: Sums of the rows and columns in all Tables do not amount to 100% because categories like "other nationalities" and "without answer" are not presented.
Data containing main findings are bolded, while exceptions from the noticed pattern are underlined.
Data in the Tables from 1a to 5a were put into parentheses when no more than 20 respondents of given nationality represented particular occupation category, as a way of warning against rash generalizations (see Table 6, count).
Table 1. Scaling of answer modalities to Question I:
"How much is for You personally important the national belonging while choosing the spouse?"- by nationality in entire former Yugoslavia
nationality not important
little important
middle important
very important
rankponder
scale score
count
row %
column %
1 2 3 4
1. Albanian: 1181
100.0
8.2
58
4.9
0.9
33
2.8
1.8
100
8.5
4.5
966
81.8
27.3
3.63
2.Macedonian:981
100.0
6.8
232
23.6
3.4
148
15.1
7.9
222
22.6
10.0
375
38.2
10.6
2.74
3. Slovenian:1272
100.0
8.8
416
32.7
6.2
166
13.1
8.9
319
25.1
14.4
368
28.9
10.4
2.49
4. Muslim::1308
100.0
605
46.3
174
13.3
237
18.1
286
21.92.14

9.1 9.0 9.3 10.7 8.1
5. Montenegrin: 895
100.0
6.2
383
42.8
5.7
199
22.2
10.6
166
18.5
7.5
137
15.3
3.9
2.04
6. Croat:2578
100.0
17.9
1387
53.8
20.6
312
12.1
16.7
392
15.2
17.7
480
18.6
13.5
1.98
7. Serb:4804
100.0
33.3
2550
53.1
37.9
724
15.1
38.7
690
14.4
31.2
819
17.0
23.1
1.94
8. Hungarian:158
100.0
1.1
114
72.2
1.7
21
13.3
1.1
8
5.1
0.4
12
7.6
0.3
1.44
9.Yugoslave 1003
100.0
6.9
841
83.3
12.5
79
7.9
4.2
40
4.0
1.8
39
3.9
1.1
1.27
Total:14438
100.0
100.0
6725
46.6
100.0
1873
13.0
100.0
2213
15.3
100.0
3544
24.5
100.0
2.16
Lambdasymmetric: .069; nationality dependent:: .015; nat. indep: .136
Cramer’s V.249
Contingency Coefficient ..445
Table 2. Scaling of answer modalities to Question II:
"With members of which nation would you like to work with the most?"- by nationality in entire former Yugoslavia
nationalityNot importan
Hungarian Mus Yugoslav Serb Croat Monteneg Macedon Albanian Slovenian

t limrin ian
rankponder
scales
count
raw %
column %
1 2 or 3 2 or 3
2 or 3 2 or 3
2 or 3
2 or 3 2 or 3 2 or 3 2 or 3
1. Slovenian: 1272
100.0
8.8
172
13.5
2.8
0
0.0
0.0
1
0.1
0.5
44
3.5
2.7
1
0.1
0.1
34
2.7
3.4
0
0.0
0.0
4
0.3
1.0
1
0.1
0.1
902
70.9
75.8
2.40
2. Albanian.: 1181
100.0
8.2
250
21.2
4.1
1
0.1
1.4
5
0.4
2.4
8
0.7
0.5
1
0.1
0.1
13
1.1
1.3
4
0.3
0.6
9
0.8
2.2
685
58.0
96.1
39
3.3
3.3
2.09
3. Macedonian:981
100.0
6.8
265
27.0
4.4
1
0.1
1.4
2
0.2
0.91
238
24.3
14.7
43
4.4
3.0
8
0.8
0.8
20
2.0
2,9
336
34.3
82.8
1
0.1
0.1
12
1.2
1.0
1.96
4. Montenegrin895
100.0
6.2
308
34.4
5.1
1
0.1
1.4
9
1.0
4.3
103
11.5
6.4
78
8.7
5.5
4
0.4
0.4
324
36.2
47.4
1
0.1
0.2
1
0.1
0.1
4
0.4
0.3
1.88
5. Croat 2578
100.0
17.9
1208
46.9
19.9
6
0.2
8.5
31
1.2
14.7
198
7.7
12.3
24
0.9
1.7
786
30.5
78.1
13
0.5
1.9
9
0.3
2.2
5
0.2
0.7
129
5.0
10.8
1.71
6. Serb:4804
100.0
33.3
2309
48.1
38.0
33
0.7
46.5
29
0.6
13.7
546
11.4
33.8
1181
24.6
82.8
68
1.4
6.8
267
5.6
39.1
29
0.6
7.1
6
0.1
0.8
42
0.9
3.5
1.64
7. Yugoslave 1003
100.0
631
62.9
10.4
6
0.6
8.5
7
0.7
3.3
209
20.8
12.9
25
2.5
1.8
24
2.4
2.4
20
2.0
2.9
6
0.6
1.5
1
0.1
0.1
19
1.9
1.6
1.47

6.9
8. Muslim:1308
100.0
9.1
665
50.8
11.0
3
0.2
4.2
122
9.3
57.8
246
18.8
15.2
56
4.3
3.9
64
4.9
6.4
31
2.4
4.5
4
0.3
1.0
7
0.5
1.0
29
2.2
2.4
1.46
9. Hungarian 158
100.0
1.1
108
68.4
1.8
20
12.7
28.2
1
0.6
0.6
6
3.8
0.4
8
5.1
0.6
2
1.3
0.2
2
1.3
0.3
1
0.6
0.2
0
0.0
0.0
2
1.3
0.2
1.34
Total:14438
100.0
100.0
6072
42.1
100.0
1615
11.2
100.0
71
0.5
100.0
211
1.5
100.0
1427
9.9
100.0
683
4.7
100.0
1007
7.0
100.0
406
2.8
100.0
1190
8.2
100.0
713
4.9
100.0
1.75*
Lambdasymmetric: .222; nationality dependent:: .284; nat. indep: .150
Cramer’s V.401
Contingency Coefficient .811
*Ponder 1 is given for the answer "not important", 2 is given for the choice of other nationalities’ members and ponder 3 for the choice of one’s co-national.
Below is the example of the scale result calculation for the entire sample:
1x6072+2x[(1615-209)+(1427-1181)+(683-324)+(406-336)+(1007-786)+(1190-902)+(211-122)+(713-685)+(71-20)] +3x(209+1181+324+336+786+902+122+685+20)]= 1.75
Table 3. Scaling of answer modalities to Question III:
"Do You agree and to what extent with the statement: A person can feel completely safe only when he/she lives in the milieu where exists the majority of its nation’s members’?"- by nationality in entire former Yugoslavia
nationality completely
and
partially
disagrees
not
certain
partially
and completelly
agrees

rankponder
scale score
count
raw %
column %
1 2 3
1. Albanian.: 118
100.0
8.2
152
12.9
2.0
181
15.3
14.4
848
71.8
15.6
2.59
2. Slovenian: 1272
100.0
8.8
351
27.6
4.5
114
9.0
9.1
803
63.1
14.7
2.35
3. Macedonian:981
100.0
6.8
407
41.5
5.3
82
8.4
6.5
492
50.2
9.0
2.09
4. Serb:4804
100.0
33.3
2508
52.2
32.5
405
8.4
32.3
1891
39.4
34.7
1.87
5. Montenegrin:895
100.0
6.2
513
57.3
6.6
78
8.7
6.2
304
34.0
5.6
1.77
6. Croat 2578
100.0)
17.9
1691
65.6
21,9
187
7.3
14.9
700
27.2
12.8
1.62
7. Hungarian 158
100.0
1.1
112
70.9
1.4
14
8.9
1.1
32
20.3
0.6
1.49
8. Muslim:1308
100.0
9.1
1023
78.2
13.2
114
8.7
9.1
171
13.1
3.1
1.35

9. Yugoslave 1003
100.0
6.9
814
81.2
10.5
57
5.7
4.5
132
13.2
2.4
1.32
Total:14438
100.0
100.0
7728
53.5
100.0
1255
8.7
100.0
5451
37.8
100.0
1.84
Lambdasym.:.076; nationality dependent:.000; nat.
indep: .185
Cramer’s V.225
Contingency Coefficient .363
1 • 2 • 3 • 4 • 5 • 6 • 7 • 8 • 9
LGI / Resources / Ethnic relations
OCT DEC JAN
12007 2008 2009
24captures
28Feb01- 1Dec08
CloseHelp
LGI / Resources / Ethnic relations
NATIONAL AND SOCIAL INCLUSION/EXCLUSION IN FORMER YUGOSLAVIA BEFORE THE WAR OF 1991
1 • 2 • 3 • 4 • 5 • 6 • 7 • 8 • 9
APPENDIX
N.B.: Sums of the rows and columns in all Tables do not amount to 100% because categories like "other nationalities" and "without answer" are not presented.

Data containing main findings are bolded, while exceptions from the noticed pattern are underlined.
Data in the Tables from 1a to 5a were put into parentheses when no more than 20 respondents of given nationality represented particular occupation category, as a way of warning against rash generalizations (see Table 6, count).
Table 1. Scaling of answer modalities to Question I:
"How much is for You personally important the national belonging while choosing the spouse?"- by nationality in entire former Yugoslavia
nationality not important
little important
middle important
very important
rankponder
scale score
count
row %
column %
1 2 3 4
1. Albanian: 1181
100.0
8.2
58
4.9
0.9
33
2.8
1.8
100
8.5
4.5
966
81.8
27.3
3.63
2.Macedonian:981
100.0
6.8
232
23.6
3.4
148
15.1
7.9
222
22.6
10.0
375
38.2
10.6
2.74
3. Slovenian:1272
100.0
8.8
416
32.7
6.2
166
13.1
8.9
319
25.1
14.4
368
28.9
10.4
2.49
4. Muslim::1308
100.0
9.1
605
46.3
9.0
174
13.3
9.3
237
18.1
10.7
286
21.9
8.1
2.14
5. Montenegrin: 895
100.0
383
42.8
199
22.2
166
18.5
137
15.32.04

6.2 5.7 10.6 7.5 3.9
6. Croat:2578
100.0
17.9
1387
53.8
20.6
312
12.1
16.7
392
15.2
17.7
480
18.6
13.5
1.98
7. Serb:4804
100.0
33.3
2550
53.1
37.9
724
15.1
38.7
690
14.4
31.2
819
17.0
23.1
1.94
8. Hungarian:158
100.0
1.1
114
72.2
1.7
21
13.3
1.1
8
5.1
0.4
12
7.6
0.3
1.44
9.Yugoslave 1003
100.0
6.9
841
83.3
12.5
79
7.9
4.2
40
4.0
1.8
39
3.9
1.1
1.27
Total:14438
100.0
100.0
6725
46.6
100.0
1873
13.0
100.0
2213
15.3
100.0
3544
24.5
100.0
2.16
Lambdasymmetric: .069; nationality dependent:: .015; nat. indep: .136
Cramer’s V.249
Contingency Coefficient ..445
Table 2. Scaling of answer modalities to Question II:
"With members of which nation would you like to work with the most?"- by nationality in entire former Yugoslavia
nationalityNot important
Hungarian Mus lim
Yugoslav Serb Croat Monteneg
rin
Macedon
ian
Albanian Slovenian
rankponder
scales
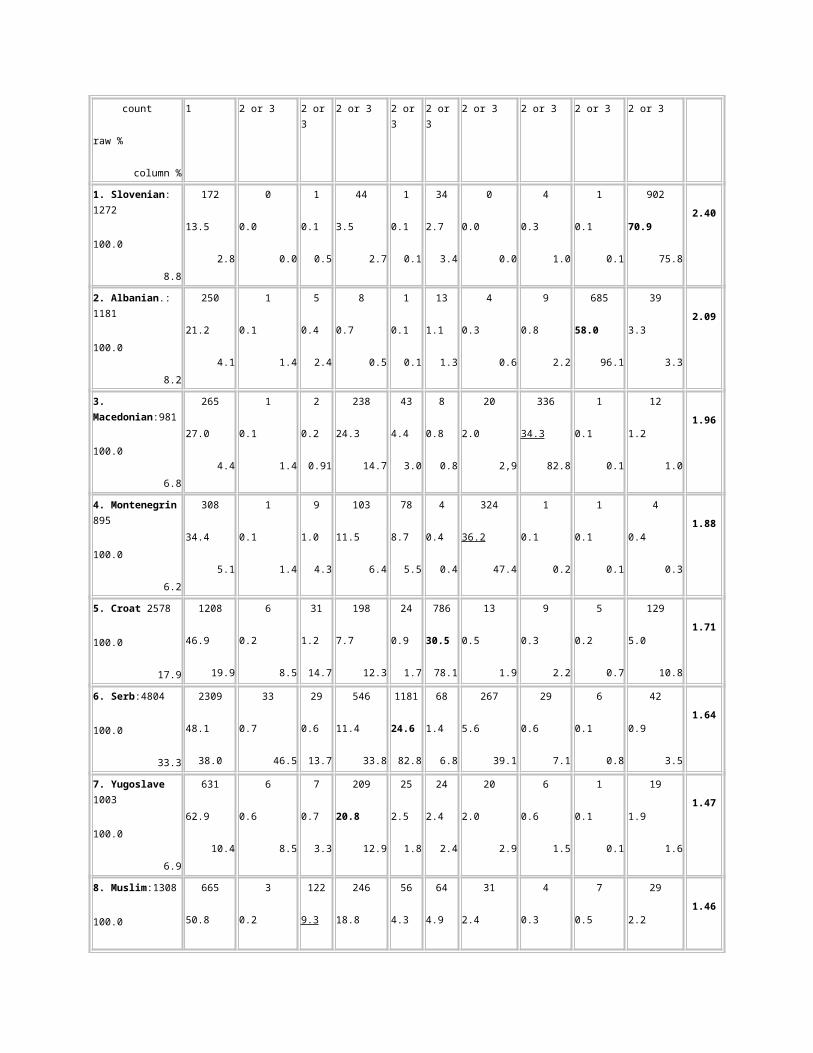
count
raw %
column %
1 2 or 3 2 or 3
2 or 3 2 or 3
2 or 3
2 or 3 2 or 3 2 or 3 2 or 3
1. Slovenian: 1272
100.0
8.8
172
13.5
2.8
0
0.0
0.0
1
0.1
0.5
44
3.5
2.7
1
0.1
0.1
34
2.7
3.4
0
0.0
0.0
4
0.3
1.0
1
0.1
0.1
902
70.9
75.8
2.40
2. Albanian.: 1181
100.0
8.2
250
21.2
4.1
1
0.1
1.4
5
0.4
2.4
8
0.7
0.5
1
0.1
0.1
13
1.1
1.3
4
0.3
0.6
9
0.8
2.2
685
58.0
96.1
39
3.3
3.3
2.09
3. Macedonian:981
100.0
6.8
265
27.0
4.4
1
0.1
1.4
2
0.2
0.91
238
24.3
14.7
43
4.4
3.0
8
0.8
0.8
20
2.0
2,9
336
34.3
82.8
1
0.1
0.1
12
1.2
1.0
1.96
4. Montenegrin895
100.0
6.2
308
34.4
5.1
1
0.1
1.4
9
1.0
4.3
103
11.5
6.4
78
8.7
5.5
4
0.4
0.4
324
36.2
47.4
1
0.1
0.2
1
0.1
0.1
4
0.4
0.3
1.88
5. Croat 2578
100.0
17.9
1208
46.9
19.9
6
0.2
8.5
31
1.2
14.7
198
7.7
12.3
24
0.9
1.7
786
30.5
78.1
13
0.5
1.9
9
0.3
2.2
5
0.2
0.7
129
5.0
10.8
1.71
6. Serb:4804
100.0
33.3
2309
48.1
38.0
33
0.7
46.5
29
0.6
13.7
546
11.4
33.8
1181
24.6
82.8
68
1.4
6.8
267
5.6
39.1
29
0.6
7.1
6
0.1
0.8
42
0.9
3.5
1.64
7. Yugoslave 1003
100.0
6.9
631
62.9
10.4
6
0.6
8.5
7
0.7
3.3
209
20.8
12.9
25
2.5
1.8
24
2.4
2.4
20
2.0
2.9
6
0.6
1.5
1
0.1
0.1
19
1.9
1.6
1.47
8. Muslim:1308
100.0
665
50.8
3
0.2
122
9.3
246
18.8
56
4.3
64
4.9
31
2.4
4
0.3
7
0.5
29
2.21.46

9.1 11.0 4.2 57.8 15.2 3.9 6.4 4.5 1.0 1.0 2.4
9. Hungarian 158
100.0
1.1
108
68.4
1.8
20
12.7
28.2
1
0.6
0.6
6
3.8
0.4
8
5.1
0.6
2
1.3
0.2
2
1.3
0.3
1
0.6
0.2
0
0.0
0.0
2
1.3
0.2
1.34
Total:14438
100.0
100.0
6072
42.1
100.0
1615
11.2
100.0
71
0.5
100.0
211
1.5
100.0
1427
9.9
100.0
683
4.7
100.0
1007
7.0
100.0
406
2.8
100.0
1190
8.2
100.0
713
4.9
100.0
1.75*
Lambdasymmetric: .222; nationality dependent:: .284; nat. indep: .150
Cramer’s V.401
Contingency Coefficient .811
*Ponder 1 is given for the answer "not important", 2 is given for the choice of other nationalities’ members and ponder 3 for the choice of one’s co-national.
Below is the example of the scale result calculation for the entire sample:
1x6072+2x[(1615-209)+(1427-1181)+(683-324)+(406-336)+(1007-786)+(1190-902)+(211-122)+(713-685)+(71-20)] +3x(209+1181+324+336+786+902+122+685+20)]= 1.75
Table 3. Scaling of answer modalities to Question III:
"Do You agree and to what extent with the statement: A person can feel completely safe only when he/she lives in the milieu where exists the majority of its nation’s members’?"- by nationality in entire former Yugoslavia
nationality completely
and
partially
disagrees
not
certain
partially
and completelly
agrees
rankponder
scale score
count 1 2 3

raw %
column %
1. Albanian.: 118
100.0
8.2
152
12.9
2.0
181
15.3
14.4
848
71.8
15.6
2.59
2. Slovenian: 1272
100.0
8.8
351
27.6
4.5
114
9.0
9.1
803
63.1
14.7
2.35
3. Macedonian:981
100.0
6.8
407
41.5
5.3
82
8.4
6.5
492
50.2
9.0
2.09
4. Serb:4804
100.0
33.3
2508
52.2
32.5
405
8.4
32.3
1891
39.4
34.7
1.87
5. Montenegrin:895
100.0
6.2
513
57.3
6.6
78
8.7
6.2
304
34.0
5.6
1.77
6. Croat 2578
100.0)
17.9
1691
65.6
21,9
187
7.3
14.9
700
27.2
12.8
1.62
7. Hungarian 158
100.0
1.1
112
70.9
1.4
14
8.9
1.1
32
20.3
0.6
1.49
8. Muslim:1308
100.0
9.1
1023
78.2
13.2
114
8.7
9.1
171
13.1
3.1
1.35
9. Yugoslave 1003
100.0
814
81.2
57
5.7
132
13.21.32

6.9 10.5 4.5 2.4
Total:14438
100.0
100.0
7728
53.5
100.0
1255
8.7
100.0
5451
37.8
100.0
1.84
Lambdasym.:.076; nationality dependent:.000; nat.
indep: .185
Cramer’s V.225
Contingency Coefficient .363
1 • 2 • 3 • 4 • 5 • 6 • 7 • 8 • 9
LGI / Resources / Ethnic relations
OCT DEC JAN
12007 2008 2009
22captures
28Feb01-1Dec08
CloseHelp
LGI / Resources / Ethnic relations
NATIONAL AND SOCIAL INCLUSION/EXCLUSION IN FORMER YUGOSLAVIA BEFORE THE WAR OF 1991
1 • 2 • 3 • 4 • 5 • 6 • 7 • 8 • 9
Table 4. Scaling of answer modalities to Question IV:

"Do You agree and to what extent with the statement: ‘Among nations good cooperation can be materialized but never also the complete trust’?"- by nationality in entire former Yugoslavia
nationality completely
and
partially
disagrees
not
certain
partially
and completelly
agrees
rankponder
scale score
count
raw %
column %
1 2 3
1. Albanian.: 1181
100.0
8.2
163
13.8
3.3
188
15.9
11.3
830
70.3
10.5
2.56
2. Slovenian: 1272
100.0
8.8
179
14.1
3.7
177
13.9
10.7
903
71.0
11.5
2.55
3. Macedonian:981
100.0
6.8
263
26.8
5.4
127
12.9
7.7
591
60.2
7.5
2.33
4. Serb:4804
100.0
33.3
1557
32.4
31.8
517
10.8
31.2
2730
56.8
34.7
2.24
5. Croat: 2578
100.0
17.9
935
36.3
19.1
301
11.7
18.2
1342
52.1
17.0
2.16
6. Hungarian 158 70 17 712.0

100.0
1.1
44.3
1.4
10.8
1.0
44.9
0.9
7. Muslim:1308
100.0
9.1
627
47.9
12.8
158
12.1
9.5
523
40.0
6.6
1.92
8. Montenegrin:895
100.0
6.2
447
49.9
9.1
81
9.1
4.9
367
41.0
4.7
1.91
9. Yugoslave 1003
100.0
6.9
566
56.4
11.6
69
6.9
4.2
368
36.7
4.7
1.75
Total:14438
100.0
100.0
4893
33.9
100.0
1658
11.5
100.0
7874
54.5
100.0
2.20
Lambdasym.: .025; nationality dependent:.001; nat.
indep .060
Cramer’s V.161
Contingency Coefficient .269
Table 5: Scaling of answer modalities to Question V:
"Do You agree and to what extent with the statement: ‘Every nation must have its state’?"- by nationality in entire former Yugoslavia
nationality completely
and
partially
disagrees
not
certain
partially
and completelly
agrees

rankponder
scale score
count
raw %
column %
1 2 3
1. Albanian: 1181
100.0
8.2
61
5.2
0.6
117
9.9
8.2
1003
84.9
28.1
2.80
2. Slovenian: 1272
100.0
8.8
376
29.6
4.0
268
21.1
18.7
624
49.1
17.5
2.19
3. Macedonian:981
100.0
6.8
584
59.5
6.2
100
10.2
7.0
297
30.3
8.3
1.71
4. Croat: 2578(100.0)
17.9
1703
66.1
18.0
280
10.9
19.6
595
23.1
16.7
1.57
5. Hungarian: 158
100.0
1.1
115
72.8
1.2
14
8.9
1.0
29
18.4
0.8
1.46
6. Montenegrin:895
100.0
6.2
653
73.0
6.9
92
10.3
6.4
150
16.8
4.2
1.44
7. Serb:4804
100.0
33.3
3815
79.4
40.4
374
7.8
26.2
615
12.8
17.3
1.33
8. Muslim:1308
100.0
9.1
1113
85.1
11.8
97
7.4
6.8
98
7.5
2.7
1.22

9. Yugoslave 1003
100.0
6.9
871
86.8
9.2
57
5.7
4.0
75
7.5
2.1
1.21
Total:14438
100.0
100.0
9439
65.4
100.0
1430
9.9
100.0
3564
24.7
100.0
1.59
Lambdasym.: .110; nationality dependent:.041;
nat.indep: .245
Cramer’s V.318
Contingency Coefficient .482
Table 6. "Work places"* according to Survay 1989/90
- by nationality of all respondents
natio
nality: Nwork place*
count
row %
column %
index**
1 2 3 4 5 6 7 8 9 10 11 12 13 14
ALB:1181 100.0
8.2
272
23.0
21.7
265
129
10.9
6.1
74
104
8.8
8.7
106
159
13.5
5.2
63
66
5.6
6.5
79
43
3.6
10.5
128
24
2.0
13.1
160
37
3.1
14.5
174
65
5.5
10.6
129
42
3.6
10.7
130
(14
1.2
6.8
83)
91
7.7
9.2
112
72
6.1
9.5
113
63
5.37
3.5
43
HUN:158 100.0
1.1
(11
7.0
26
16.5
28
17.1
23
14.6
(14
8.9
(3
1.9
(3
1.9
(2
1.3
(8
5.1
(2
1.3
(1
0.6
(3
1.9
(7
4.4
27
17.1

0.9
82)
1.2
109
4.1
365
0.8
73
1.4
127)
0.7
64)
1.6
145)
0.8
73)
1.3
118)
0.5
45)
0.5
45)
0.3
27)
0.9
82)
1.5
136
MUS:1308 100.0
9.1
118
9.0
9.4
103
200
15.3
19.5
214
137
10.5
11.5
126
397
30.4
13.0
143
69
5.3
6.8
75
32
2.4
7.8
86
(16
1.2
8.7
96)
(15
1.1
5.9
65)
41
3.1
6.7
74
21
1.6
5.4
59
(19
1.5
9.2
101)
61
4.7
6.2
68
55
4.2
7.3
80
126
9.6
7.0
77
SRB:4804
100.0
33.3
322
6.7
25.7
77
1098
22.9
52.1
156
381
7.9
31.9
96
974
20.3
31.8
95
323
6.7
31.7
95
123
2.6
29.9
90
46
1.0
25.1
75
74
1.5
29.0
87
171
3.6
27.9
84
136
2.8
34.8
105
71
1.5
34.5
104
317
6.6
32.1
96
234
4.9
30.9
93
530
11.0
29.5
89
MAC:981 100.0
6.8
117
11.9
9.3
137
120
12.2
5.7
84
55
5.6
4.6
68
197
20.1
6.4
94
51
5.2
5.0
74
(11
1.1
2.7
40)
(9
0.9
4.9
72)
21
2.1
8.2
121
31
3.2
5.0
74
(19
1.9
4.9
72)
(17
1.7
8.3
122)
137
14.0
13.9
167
123
12.5
16.2
238
73
7.4
4.1
60
CRO:2578 100.0
17.9
94
3.6
7.5
42
399
15.5
18.9
106
217
8.4
18.2
102
671
26.0
21.9
122
188
7.3
18.4
103
57
2.2
13.9
78
23
0.9
12.6
70
44
1.7
17.3
97
146
5.7
23.8
133
53
2.1
13.6
76
23
0.9
11.2
63
156
6.1
15.8
88
132
5.1
17.4
97
372
14.4
20.7
116
SLO:1272 100.0
8.8
45
3.5
3.6
41
29
2.3
1.4
16
135
10.6
11.3
128
193
15.2
6.3
72
92
7.2
9.0
102
88
6.9
21.4
243
33
2.6
18.0
205
28
2.2
11.0
125
49
3.9
8.0
91
(17
1.3
4.3
49)
(16
1.3
7.8
89)
29
2.3
2.9
33
(2
0.2
0.3
3)
327
25.7
18.2
207
YOU:1003100.0
6.9
128 (18 63 231 124 23 (17 21 55 37 27 78 59 117

12.8
10.2
148
1.8
0.9
13)
6.3
5.3
77
23.0
7.6
110
12.4
12.2
177
2.3
5.6
81
1.7
9.3
135)
2.1
8.2
119
5.5
9.0
130
3.7
9.5
138
2.7
13.1
190
7.8
7.9
114
5.9
7.8
113
11.7
6.5
94
MON:895 100.0
6.2
110
12.3
8.8
142
68
7.6
3.2
52
42
4.7
3.5
56
158
17.7
5.2
84
79
8.8
7.7
124
24
2.7
5.8
94
(8
0.9
4.4
71)
(8
0.9
3.1
50)
37
4.1
6.0
97
57
6.4
14.6
235
(15
1.7
7.3
118)
99
11.1
10.0
161
59
6.6
7.8
126
131
14.6
7.3
118
TOT14438
100.0
100.0
1255
8.7
100.
2106
14.6
100.
1195
8.3
100.
3059
21.2
100.
1020
7.1
100.
411
2.8
100.
183
1.3
100.
255
1.8
100.
614
4.3
100.
391
2.7
100.
206
1.4
100.
987
6.8
100.
757
5.2
100.
1796
12.4
100.
Lambdasym.: .027; nationality dependent:: .019; nat. indep: .034
Cramer’s V .152
Cont.. coef. .466
*1. unemployed; 2. peasant; 3. unqualified and semi-qualified worker; 4. qualifiedand highly qualified worker; 5. office worker with elementary school and office worker with secondary school;. 6. technician and foreman; 7. craftsman, private entrepreneur; 8. specialist employed in industry; 9. specialist employed in socialservices and free lance professional; 10. specialist employed in administration; 11. security personnel; 12. lower managers and directors; 13. political functionaries; 14. other
1 • 2 • 3 • 4 • 5 • 6 • 7 • 8 • 9
LGI / Resources / Ethnic relations
OCT DEC JAN
12007 2008 2009
19cap
CloseH

tures
28Feb01- 1Dec08
elp
LGI / Resources / Ethnic relations
NATIONAL AND SOCIAL INCLUSION/EXCLUSION IN FORMER YUGOSLAVIA BEFORE THE WAR OF 1991
1 • 2 • 3 • 4 • 5 • 6 • 7 • 8 • 9
Table 7: Index of participation of active population* in various occupations
- by nationality in entire former Yugoslavia
index of participation** N a t i o n a l i t y - in % of active population (9358 671)
O c c u p a t i o n
- in % of active pop.
ALB:
4,0
HUN:
2,0
MUS:
7,0
SRB:
41,4
MAC:
6,4
CRO:
19,5
SLO:
8,8
YUG:
5,5
MON:
2,4
active not exercisingoccup.:6,2
187 68 132 91 148 82 45 122 151
peasants and related:: 26,9 125 121 77 132 93 81 52 25 44
miners & ind. workers: 31,5 87 104 136 86 98 109 127 97 90
trade workers:5,1 68 86 90 91 109 112 111 143 127
services’ workers:5,7 61 97 96 85 79 129 114 131 133
administr. and related w.:9,5
56 70 72 89 98 109 139 173 147
experts and artists: 9,8 86 77 63 87 98 107 132 172 154
chemists, physicists 40 80 47 91 115 102 156 165 130
technicians, technologues 44 55 68 89 96 107 157 167 137

traffic experts 12 25 37 66 42 204 78 289 250
natural scientists 44 10 51 96 134 105 119 138 141
medicine 51 82 61 90 104 110 126 186 125
other experts 53 77 67 88 83 140 129 188 180
educational personnel 188 84 64 84 105 98 124 151 179
artists and a. assistants 53 138 43 84 91 97 103 240 91
defense personnel:1,7 129 86 105 102 110 85 65 141 175
managerial personnel: 1,6 48 72 79 89 113 102 142 152 194
high officials 102 68 98 85 117 79 141 159 289
directors 39 72 77 89 113 105 144 150 183
chambers’ associations’manag.
114 73 91 91 111 83 114 169 241
other occupations.: 0,1 123 101 132 61 60 176 132 79 61
physical culture workers 44 98 77 79 91 96 115 278 241
professional religious w. 148 103 148 56 50 201 137 18 5
without occup.:1,8 178 205 101 94 59 92 57 99 65
*Cenzus data for 1981, Savezni Zavod za Statistiku (Federal Statistical Bureau), 1984, p.1-14.
**Representation (participation) index is calculated as the ratio between the percentage participation of particular ethnic group’s members in a specific occupation group, and the percentage participation of the same ethnic group’s members in the sample or the active population.
Table 8. Correlation coefficients for selected variables
(IN) (MIS)

SPOUSE COWORKER SECURITY TRUST STATE
RELIGIOSITY -.3103** .0868** -.2361** -.1455** -.0365**
CONFESSION -.1520** .0827** -.1945** -.1614** -.0875**
NATIONALITY -.1390** .2702** .0072 .0432** -.2212**
WORKPLACE -.1352** .0749** -.1389** -.1089** -.0365**
AGE -.0246* -.1344** -.0019 .0257* .0450**
SEX .0001 -.0053 .0054 .0201* -.0237*
N: 14438 1-tailed significance: * - .01 ** - .001
1 • 2 • 3 • 4 • 5 • 6 • 7 • 8 • 9
LGI / Resources / Ethnic relations
OCT DEC JAN
12007 2008 2009
24captures
28Feb01-1Dec08
CloseHelp
LGI / Resources / Ethnic relations
NATIONAL AND SOCIAL INCLUSION/EXCLUSION IN FORMER YUGOSLAVIA BEFORE THE WAR OF 1991
1 • 2 • 3 • 4 • 5 • 6 • 7 • 8 • 9
Table 9. Distribution of the extreme exclusionist oriented answer modalities

to the questions No. I to No. V - by Republic/Province and by nationality
S a m p l e
rankQ u e s t i o n
Republic./Province
Nationality
raw %
index
No. I
spouse
No. II
coworker
No. III
(in)
security
No.IV
(mis)
trust
No.V
nation
state
scalescore*
1. K&M: N=1032 82.8 53.3 71.7 69.6 84.7
Albanian:907 (100.0) 85.0
103
54.5
112
72.1
101
69.8
100
88.1
1042.73
Serb:90 (100.0) 70.0
85
48.9
1075
70.0
98
71.1
102
60.0
71
Cramer’s V.160 .399 .080 .078 .237
2. SLOVENIA:N=139526.7 65.1 60.9 70.6 48.7
Slovenian:1244 (100.0) 29.4
110
72.2
106
64.4
106
71.5
101
50.0
1032.40
Croaten: 51 (100.0) 2.0
81
15.7
554
35.3
57
72.5
103
37.3
76
Serb: 40 (100.0)0.0
2.5
115
27.5
4.5
62.5
86
30.0
62
Cramer’s V.188 .259 .141 .073 .135
3.MACEDONIA:N=128847.4 41.0 55.1 64.9 40.4
Macedonia: 945(100.0) 39.6
83
35.2
128
51.2
93
60.4
93
31.2
772.17
Albanian: 226(100.0) 81.0
171
77.0
568
78.3
142
80.1
124
77.0
191
Serb: 25(100.0) 20.0 12.0 36.0 48.0 16.0

42 358 68 74 42
Cramer’s V.183 .362 .152 .134 .244
4.MONTENEGRO:N=958 16.1 36.3 31.3 36.7 18.0
Montenegrin:757(100.0) 15.2
95
39.0
114
33.8
108
38.6
105
17.0
951.82
Albanian: 36(100.0) 33.3
205
44.4
2476
41.7
132
36.1
97
69.4
382
Muslim:63(100.0) 12.7
79
34.9
1110
14.3
75
28.6
77
11.1
62
Serb: 35(100.0) 31.4
191
28.6
370
40.0
127
48.6
190
5.7
32
Yugoslave: N=60(100.0) 13.3
83
6.7
83
6.7
21
13.3
37
10.0
56
Cramer’s V.138 .426 .005 .182 .189
5.CROATIA: N=277113.6 28.4 24.4 49.7 20.6
Croat: 2030(100.0) 17.5
128
34.4
125
29.9
123
53.9
109
25.0
1211.81
Serb: 361(100.0) 3.3
25
4.7
45
9.7
40
39.3
79
8.9
43
Muslim: 42(100.0) 11.9
87
11.9
3033
16.7
67
52.4
107
11.9
60
Yugoslav: 250(100.0) 0.4
3
21.2
262
7.6
31
30.0
61
8.0
39
Cramer’s V.146 .189 .149 .219 .140
6.SERBIA**:N=332020.4 31.0 47.4 60.4 14.3
Serb: 28279(100.0) 20.0
98
32.6
112
50.6
107
62.6
104
14.9
701.80
Montenegrin:77(100.0) 19.5 27.3 40.3 63.6 15.6

96 378 87104
109
Muslim:179(100.0) 46.4
228
8.4
1111
24.6
52
42.5
70
12.3
85
Yugoslav: 160(100.0) 6.9
33
24.4
208
31.9
67
48.8
81
6.9
48
Cramer’s V.116 .148 .119 .098 .055
7.VOYVODINA:N=1282 9.0 16.1 26.9 51.1 8.6
Serb: 796(100.0) 11.2
125
17.3
139
31.3
116
56.7
111
7.3
85
Hungarian: 138(100.0) 8.7
96
13.0
37
21.7
81
44.9
88
18.1
204(1.55)
Croat: 78(100.0) 9.0
100
14.1
902
12.8
48
34.6
67
9.0
105
Yugoslaves: 170(100.0) 2.9
32
18.8
159
21.2
78
40.6
79
7.6
89
Cramer’s V.166 .169 .105 .115 .119
8. B&H: N=2392 16.0 11.7 10.7 39.6 6.7
Muslim: 995(100.0) 18.6
116
7.5
142
9.9
93
39.3
100
5.4
811.62
Serb: 630(100.0) 11.7
73
7.5
164
12.5
117
39.5
100
5.2
78
Croat:399(100.0) 28.8
180
16.3
261
15.3
143
43.9
111
14.5
216
Yugoslav: 337(100.0) 2.4
15
22.3
122
4.2
39
36.5
92
4.5
661.40
Cramer’s V.163 .118 .075 .070 .102

* Synthetic scale score for respondents of each nationality is calculated by summing up their scale scores obtained in the sample for entire former Yugoslavia (see Tables 1-5) and divided by 5.
In Table 9 it is written near the respondents affiliated to nationalities that arethe most concentrated in respective R/P and therefore influence the most (except Hungarians) the average results in particular R/P..
**Central Serbia; Provinces Kosovo and Metohiya and Voyvodina not included.
1 • 2 • 3 • 4 • 5 • 6 • 7 • 8 • 9
LGI / Resources / Ethnic relations
OCT DEC JAN
12007 2008 2009
21captures
18Dec01-1Dec08
CloseHelp
LGI / Resources / Ethnic relations
NATIONAL AND SOCIAL INCLUSION/EXCLUSION IN FORMER YUGOSLAVIA BEFORE THE WAR OF 1991
1 • 2 • 3 • 4 • 5 • 6 • 7 • 8 • 9
Table 1a: The nationality of the spouse is "very important"
- by nationality and occupation of respondents in entire former Yugoslavia
row %
index*work place ---
x C’sV
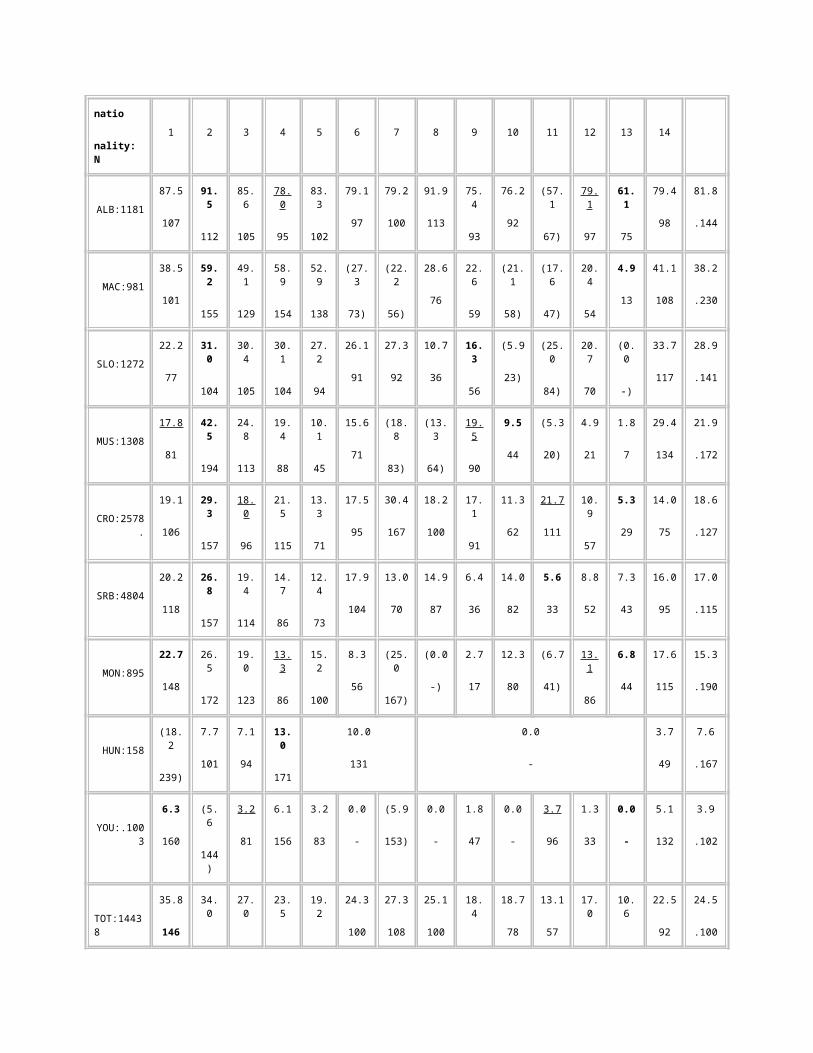
natio
nality: N
1 2 3 4 5 6 7 8 9 10 11 12 13 14
ALB:1181 87.5
107
91.5
112
85.6
105
78.0
95
83.3
102
79.1
97
79.2
100
91.9
113
75.4
93
76.2
92
(57.1
67)
79.1
97
61.1
75
79.4
98
81.8
.144
MAC:981 38.5
101
59.2
155
49.1
129
58.9
154
52.9
138
(27.3
73)
(22.2
56)
28.6
76
22.6
59
(21.1
58)
(17.6
47)
20.4
54
4.9
13
41.1
108
38.2
.230
SLO:127222.2
77
31.0
104
30.4
105
30.1
104
27.2
94
26.1
91
27.3
92
10.7
36
16.3
56
(5.9
23)
(25.0
84)
20.7
70
(0.0
-)
33.7
117
28.9
.141
MUS:1308 17.8
81
42.5
194
24.8
113
19.4
88
10.1
45
15.6
71
(18.8
83)
(13.3
64)
19.5
90
9.5
44
(5.3
20)
4.9
21
1.8
7
29.4
134
21.9
.172
CRO:2578.
19.1
106
29.3
157
18.0
96
21.5
115
13.3
71
17.5
95
30.4
167
18.2
100
17.1
91
11.3
62
21.7
111
10.9
57
5.3
29
14.0
75
18.6
.127
SRB:480420.2
118
26.8
157
19.4
114
14.7
86
12.4
73
17.9
104
13.0
70
14.9
87
6.4
36
14.0
82
5.6
33
8.8
52
7.3
43
16.0
95
17.0
.115
MON:895 22.7
148
26.5
172
19.0
123
13.3
86
15.2
100
8.3
56
(25.0
167)
(0.0
-)
2.7
17
12.3
80
(6.7
41)
13.1
86
6.8
44
17.6
115
15.3
.190
HUN:158(18.2
239)
7.7
101
7.1
94
13.0
171
10.0
131
0.0
-
3.7
49
7.6
.167
YOU:.1003
6.3
160
(5.6
144)
3.2
81
6.1
156
3.2
83
0.0
-
(5.9
153)
0.0
-
1.8
47
0.0
-
3.7
96
1.3
33
0.0
-
5.1
132
3.9
.102
TOT:14438
35.8
146
34.0
27.0
23.5
19.2
24.3
100
27.3
108
25.1
100
18.4
18.7
78
13.1
57
17.0
10.6
22.5
92
24.5
.100

138 110 96 77 74 69 44
Table 2a Preference of co-national for a coworker
- by nationality and occupation of respondents in entire former Yugoslavia
row %
Indexwork place ---
x C’sV
natio
nality: N
1 2 3 4 5 6 7 8 9 10 11 12 13 14
MUS:1308 7.6
82
13.0
139
15.3
164
9.1
97
4.3
47
9.4
104
(0.0
-)
(0.0
-)
7.3
81
0.0
-
(5.3
53)
6.6
70
0.0
-
12.7
136
9.3
.144
HUN.158(45.5
357)
15.4
121
3.6
28
13.0
103
15.0
118
8.7
68
7.4
58
12.7
..278
YOU:.1003
25.0
120
(11.1
56)
17.5
84
25.5
123
24.2
116
21.7
104
(11.8
59)
14.3
67
21.8
104
29.7
143
29.6
141
16.7
79
8.5
41
13.7
66
20.8
.127
SRB:480426.7
249
34.6
141
24.7
101
24.4
99
20.1
82
16.3
65
30.4
120
18.9
80
14.6
58
15.4
64
14.1
53
19.6
79
10.7
43
24.0
98
24.6
.090
CRO:2578.
37.2
125
33.3
109
38.2
126
35.3
116
33.0
108
21.1
68
30.4
100
25.0
82
28.1
91
(24.5
81)
(13.0
44)
27.6
90
(15.2
49)
22.6
74
30.5
.099
MAC:981 44.4
130
34.2
100
54.5
160
40.6
118
39.2
115
(27.3
82)
(11.1
33)
28.6
86
35.5
103
(15.8
47)
(35.3
106)
27.7
81
18.7
54
30.1
88
34.3
.157
MON:895 42.7
118
52,9
146
50.0
138
43.7
120
38.0
106
41.7
106
(25.0
67)
(12.5
33)
10.8
29
15.8
44
33.3
88
31.3
86
25.4
70
33.6
93
36.2
.159

ALB:1181 52.6
91
62.0
107
58.7
101
72.3
124
74.2
126
58.1
100
54.2
95
54.1
94
70.8
122
57.1
97
(42.9
75)
52.7
91
25.0
43
58.7
102
58.0
.170
SLO:127246.7
66
79.3
107
71.1
100
72.5
102
72.8
103
79.5
113
66.7
92
75.0
105
81.6
113
(64.7
92)
(62.5
85)
65.5
91
(100
0)
67.2
95
70.9
.147
*Representation index is calculated as the ratio between the percentage participation of particular ethnic group’s members occupuing certain work place ina specific answer modality (column percentage), and the percentage participation of the same ethnic group’s members in the sample (column percentage).
1 • 2 • 3 • 4 • 5 • 6 • 7 • 8 • 9
LGI / Resources / Ethnic relations
OCT DEC JAN
12007 2008 2009
23captures
28Feb01-1Dec08
CloseHelp
LGI / Resources / Ethnic relations
NATIONAL AND SOCIAL INCLUSION/EXCLUSION IN FORMER YUGOSLAVIA BEFORE THE WAR OF 1991
1 • 2 • 3 • 4 • 5 • 6 • 7 • 8 • 9
Table 3a
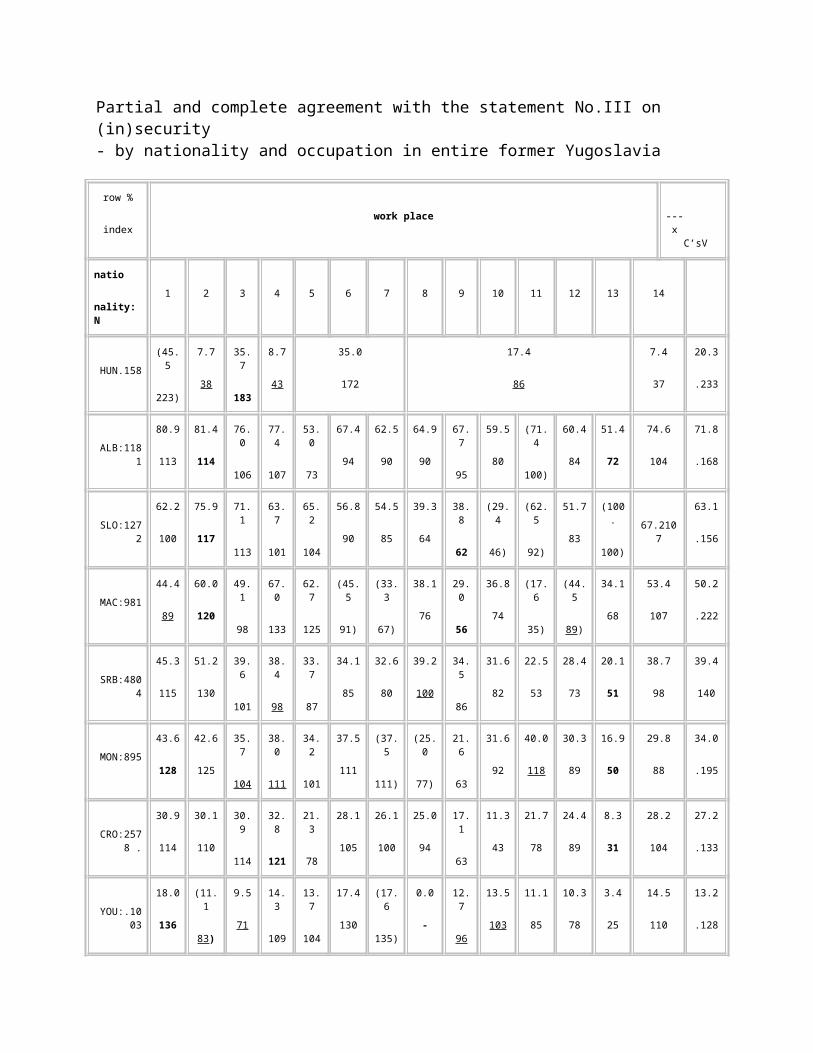
Partial and complete agreement with the statement No.III on (in)security- by nationality and occupation in entire former Yugoslavia
row %
indexwork place ---
x C’sV
natio
nality:N
1 2 3 4 5 6 7 8 9 10 11 12 13 14
HUN.158 (45.5
223)
7.7
38
35.7
183
8.7
43
35.0
172
17.4
86
7.4
37
20.3
.233
ALB:1181
80.9
113
81.4
114
76.0
106
77.4
107
53.0
73
67.4
94
62.5
90
64.9
90
67.7
95
59.5
80
(71.4
100)
60.4
84
51.4
72
74.6
104
71.8
.168
SLO:1272
62.2
100
75.9
117
71.1
113
63.7
101
65.2
104
56.8
90
54.5
85
39.3
64
38.8
62
(29.4
46)
(62.5
92)
51.7
83
(100.
100)
67.2107
63.1
.156
MAC:981 44.4
89
60.0
120
49.1
98
67.0
133
62.7
125
(45.5
91)
(33.3
67)
38.1
76
29.0
56
36.8
74
(17.6
35)
(44.5
89)
34.1
68
53.4
107
50.2
.222
SRB:4804
45.3
115
51.2
130
39.6
101
38.4
98
33.7
87
34.1
85
32.6
80
39.2
100
34.5
86
31.6
82
22.5
53
28.4
73
20.1
51
38.7
98
39.4
140
MON:895 43.6
128
42.6
125
35.7
104
38.0
111
34.2
101
37.5
111
(37.5
111)
(25.0
77)
21.6
63
31.6
92
40.0
118
30.3
89
16.9
50
29.8
88
34.0
.195
CRO:2578 .
30.9
114
30.1
110
30.9
114
32.8
121
21.3
78
28.1
105
26.1
100
25.0
94
17.1
63
11.3
43
21.7
78
24.4
89
8.3
31
28.2
104
27.2
.133
YOU:.1003
18.0
136
(11.1
83)
9.5
71
14.3
109
13.7
104
17.4
130
(17.6
135)
0.0
-
12.7
96
13.5
103
11.1
85
10.3
78
3.4
25
14.5
110
13.2
.128
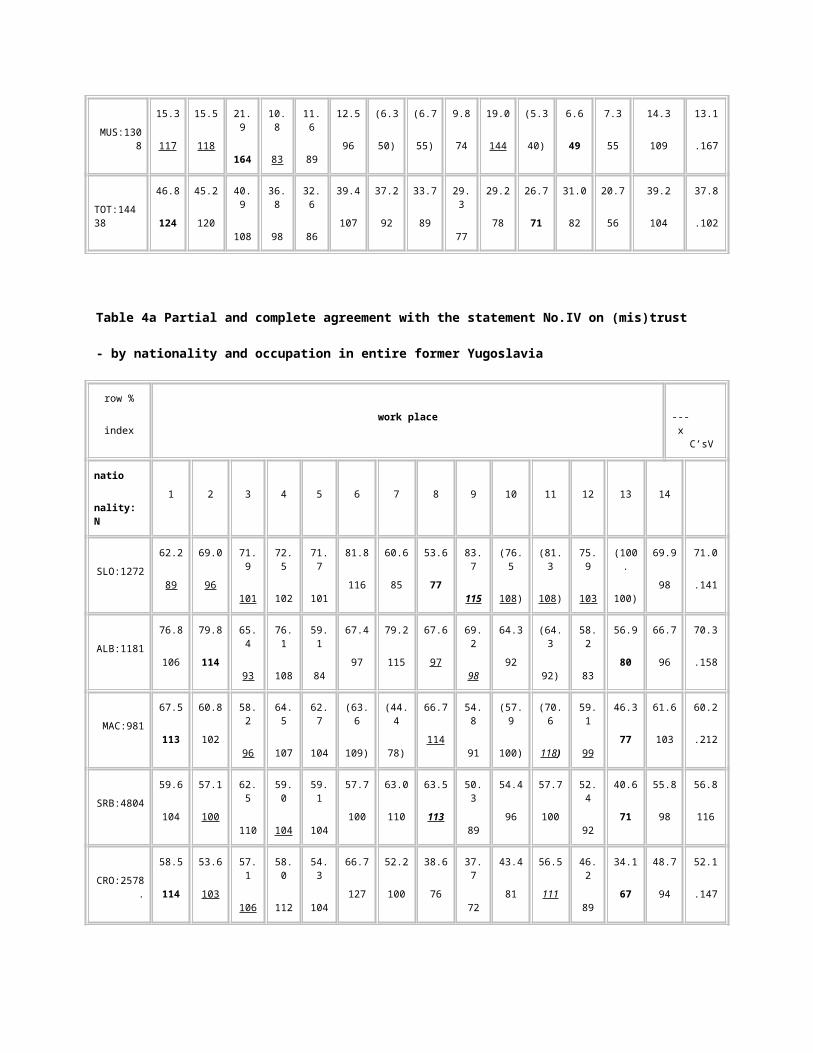
MUS:1308
15.3
117
15.5
118
21.9
164
10.8
83
11.6
89
12.5
96
(6.3
50)
(6.7
55)
9.8
74
19.0
144
(5.3
40)
6.6
49
7.3
55
14.3
109
13.1
.167
TOT:14438
46.8
124
45.2
120
40.9
108
36.8
98
32.6
86
39.4
107
37.2
92
33.7
89
29.3
77
29.2
78
26.7
71
31.0
82
20.7
56
39.2
104
37.8
.102
Table 4a Partial and complete agreement with the statement No.IV on (mis)trust
- by nationality and occupation in entire former Yugoslavia
row %
indexwork place ---
x C’sV
natio
nality: N
1 2 3 4 5 6 7 8 9 10 11 12 13 14
SLO:127262.2
89
69.0
96
71.9
101
72.5
102
71.7
101
81.8
116
60.6
85
53.6
77
83.7
115
(76.5
108)
(81.3
108)
75.9
103
(100.
100)
69.9
98
71.0
.141
ALB:1181 76.8
106
79.8
114
65.4
93
76.1
108
59.1
84
67.4
97
79.2
115
67.6
97
69.2
98
64.3
92
(64.3
92)
58.2
83
56.9
80
66.7
96
70.3
.158
MAC:981 67.5
113
60.8
102
58.2
96
64.5
107
62.7
104
(63.6
109)
(44.4
78)
66.7
114
54.8
91
(57.9
100)
(70.6
118)
59.1
99
46.3
77
61.6
103
60.2
.212
SRB:480459.6
104
57.1
100
62.5
110
59.0
104
59.1
104
57.7
100
63.0
110
63.5
113
50.3
89
54.4
96
57.7
100
52.4
92
40.6
71
55.8
98
56.8
116
CRO:2578.
58.5
114
53.6
103
57.1
106
58.0
112
54.3
104
66.7
127
52.2
100
38.6
76
37.7
72
43.4
81
56.5
111
46.2
89
34.1
67
48.7
94
52.1
.147

HUN.158 (72.7
161)
38.5
85
46.4
103
47.8
106
55.0
122
46.4
103
44.4
99
44.9
.188
MON:895 58.2
141
44.1
108
45.2
110
39.9
97
35.4
86
54.2
130
(25.0
56)
(62.5
156)
32.4
80
33.3
81
(66.7
159)
45.5
111
27.1
67
31.3
78
41.0
.187
MUS:1308 39.0
98
34.5
86
42.3
106
44.3
111
42.0
104
46.9
121
(25.0
67)
(46.7
118)
31.7
81
42.9
106
(47.4
113)
41.0
102
25.5
64
38.1
96
40.0
.144
YOU:.1003
43.0
116
(38.9
106)
36.5
100
40.7
111
39.5
107
21.7
61
(47.1
129)
19.0
52
27.3
75
29.7
81
22.2
94
32.1
87
25.4
69
41.0
111
36.7
.142
TOT:14438
61.0
111
55.0
101
58.1
106
56.7
104
54.2
99
61.8
114
54.6
100
53.3
94
47.1
86
49.1
89
56.3
107
50.5
92
38.3
71
53.5
98
54.5
.090
1 • 2 • 3 • 4 • 5 • 6 • 7 • 8 • 9
LGI / Resources / Ethnic relations
OCT DEC JAN
12007 2008 2009
21captures
28Feb01-1Dec08
CloseHelp
LGI / Resources / Ethnic relations
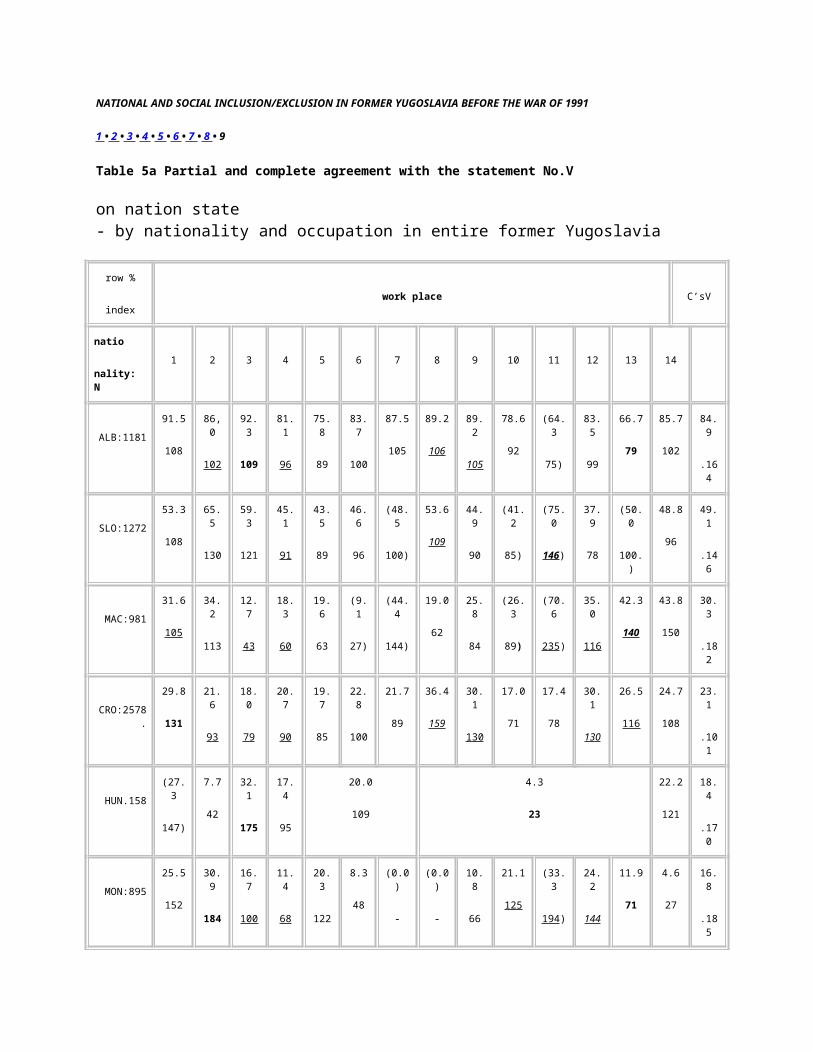
NATIONAL AND SOCIAL INCLUSION/EXCLUSION IN FORMER YUGOSLAVIA BEFORE THE WAR OF 1991
1 • 2 • 3 • 4 • 5 • 6 • 7 • 8 • 9
Table 5a Partial and complete agreement with the statement No.V
on nation state- by nationality and occupation in entire former Yugoslavia
row %
indexwork place C’sV
natio
nality: N
1 2 3 4 5 6 7 8 9 10 11 12 13 14
ALB:1181 91.5
108
86,0
102
92.3
109
81.1
96
75.8
89
83.7
100
87.5
105
89.2
106
89.2
105
78.6
92
(64.3
75)
83.5
99
66.7
79
85.7
102
84.9
.164
SLO:127253.3
108
65.5
130
59.3
121
45.1
91
43.5
89
46.6
96
(48.5
100)
53.6
109
44.9
90
(41.2
85)
(75.0
146)
37.9
78
(50.0
100.)
48.8
96
49.1
.146
MAC:981 31.6
105
34.2
113
12.7
43
18.3
60
19.6
63
(9.1
27)
(44.4
144)
19.0
62
25.8
84
(26.3
89)
(70.6
235)
35.0
116
42.3
140
43.8
150
30.3
.182
CRO:2578.
29.8
131
21.6
93
18.0
79
20.7
90
19.7
85
22.8
100
21.7
89
36.4
159
30.1
130
17.0
71
17.4
78
30.1
130
26.5
116
24.7
108
23.1
.101
HUN.158 (27.3
147)
7.7
42
32.1
175
17.4
95
20.0
109
4.3
23
22.2
121
18.4
.170
MON:895 25.5
152
30.9
184
16.7
100
11.4
68
20.3
122
8.3
48
(0.0)
-
(0.0)
-
10.8
66
21.1
125
(33.3
194)
24.2
144
11.9
71
4.6
27
16.8
.185

SRB:480418.0
140
13.5
105
12.1
95
11.7
91
11.8
93
9.8
77
8.7
70
13.5
107
12.9
100
15.4
121
16.9
133
9.1
71
13.7
106
12.6
99
12.8
.089
MUS:1308 8.5
113
6.5
87
13.1
175
6.3
84
4.3
58
0.0
-
(6.3
83)
(0.0
-)
19.2
265
4.8
63
(0.0
-)
4.9
66
1.8
24
11.1
149
7.5
.149
YOU:.1003
7.8
104
(5.6
72)
11.1
148
5.6
75
5.6
75
4.3
57
(5.9
76)
4.8
62
20.0
267
8.1
108
0.0
-
6.4
86
8.5
114
6.8
91
7.5
.147
TOT:14438
37.0
149
21.2
86
26.6
107
19.0
77
20.3
82
26.5
111
30.1
115
31.4
122
29.3
117
24.0
96
26.2
107
25.2
103
24.2
98
25.0
102
24.7
.096
1 • 2 • 3 • 4 • 5 • 6 • 7 • 8 • 9
LGI / Resources / Ethnic relations
Related Documents


