GPU Nuclear, Inc. (N p GThree Mile Island G U Nuclear Station NUCLEAR Route 441 South Post Office Box 480 Middletown, PA 17057-0480 Tel 717-948-8461 E910-02-054 December 16, 2002 U.S. Nuclear Regulatory Commission Attention: Document Control Desk Washington, DC 20555 Gentlemen, Subject: Saxton Nuclear Experimental Corporation (SNEC) Application for License Termination Operating License No. DPR-4 Docket No. 50-146 On February 2, 2000, the Saxton Nuclear Experimental Corporation (SNEC) submitted an application for termination of facility license: DPR-4, and included a License Termination Plan (LTP). On September 26, 2002 SNEC submitted Revision 1 to the LTP. The changes in Revision 1 incorporated information previously provided by SNEC to the NRC staff in response to requests for information. This letter submits responses to NRC Discussion Topics as a result of NRC letter dated October 28, 2002 (Attachment 1) and, Revision 2 to the LTP, consisting of a list of effective pages for the LTP and change pages to Revision I resulting from the discussion topic responses (Attachment 2). Additionally Calculation No. 6900-02-025 (Attachment 3) is provided to support the resolution of discussion topic 27. SNEC's February 2, 2000 application requested that the facility license be amended by adding a new section 2.E requiring SNEC to implement the LTP as approved by the NRC and containing criteria limiting SNEC's ability to make changes to the LTP without prior approval. The NRC staff requested that SNEC include several additional criteria further limiting the circumstances in which the LTP may be changed. NRC's letter of October 28, 2002 requested further modification to these criteria. This letter responds to the NRC's request and supplements the February 2, 2000 application to adopt the additional restrictive criteria. The No Significant Hazards Consideration Analysis determination in the February 2,2000 application is unaffected by this change. Accordingly, SNEC requests that section 2.E be worded as follows: 2.E. The licensee shall implement the approved SNEC Facility License Termination Plan as approved in the SER dated . The licensee may make changes to the SNEC Facility License Termination Plan without prior approval provided the proposed changes do not: (a) involve a change to the Technical Specifications or require NRC approval pursuant to 10 CFR 50.59;

Welcome message from author
This document is posted to help you gain knowledge. Please leave a comment to let me know what you think about it! Share it to your friends and learn new things together.
Transcript
GPU Nuclear, Inc.(N p GThree Mile IslandG U Nuclear StationNUCLEAR Route 441 South
Post Office Box 480Middletown, PA 17057-0480Tel 717-948-8461
E910-02-054December 16, 2002
U.S. Nuclear Regulatory CommissionAttention: Document Control DeskWashington, DC 20555
Gentlemen,
Subject: Saxton Nuclear Experimental Corporation (SNEC)Application for License TerminationOperating License No. DPR-4Docket No. 50-146
On February 2, 2000, the Saxton Nuclear Experimental Corporation (SNEC) submitted an application fortermination of facility license: DPR-4, and included a License Termination Plan (LTP). On September26, 2002 SNEC submitted Revision 1 to the LTP. The changes in Revision 1 incorporated informationpreviously provided by SNEC to the NRC staff in response to requests for information. This lettersubmits responses to NRC Discussion Topics as a result of NRC letter dated October 28, 2002(Attachment 1) and, Revision 2 to the LTP, consisting of a list of effective pages for the LTP and changepages to Revision I resulting from the discussion topic responses (Attachment 2). AdditionallyCalculation No. 6900-02-025 (Attachment 3) is provided to support the resolution of discussion topic 27.
SNEC's February 2, 2000 application requested that the facility license be amended by adding a newsection 2.E requiring SNEC to implement the LTP as approved by the NRC and containing criteria limitingSNEC's ability to make changes to the LTP without prior approval. The NRC staff requested that SNECinclude several additional criteria further limiting the circumstances in which the LTP may be changed.NRC's letter of October 28, 2002 requested further modification to these criteria. This letter responds to theNRC's request and supplements the February 2, 2000 application to adopt the additional restrictive criteria.The No Significant Hazards Consideration Analysis determination in the February 2,2000 application isunaffected by this change. Accordingly, SNEC requests that section 2.E be worded as follows:
2.E. The licensee shall implement the approved SNEC Facility License Termination Plan asapproved in the SER dated . The licensee may make changes to the
SNEC Facility License Termination Plan without prior approval provided the proposedchanges do not:
(a) involve a change to the Technical Specifications or require NRC approvalpursuant to 10 CFR 50.59;
U.S. Nuclear Regulatory CommissionE910-02-054December 16, 2002Page 2 of 2
(b) violate the criteria of 10 CFR 50.82(a)(6);
(c) reduce the coverage requirements for scan measurements;
(d) increase the derived concentration guideline level (DCGL), developed to meetthe requirements of 10 CFR 20.1402, and related minimum detectableconcentrations for both scan and fixed measurement methods;
(e) use a statistical test other than the Sign test or Wilcoxon Rank Sum test forevaluation of the final status survey;
(f) increase the radioactivity level, relative to the applicable derived concentrationguideline level, developed to meet the requirements of 10 CFR 20.1402, at whichinvestigation occurs;
(g) Increase the Type I decision error;
(h) Decrease an area classification (i.e., impacted to non-impacted; Class I to Class2; Class 2 to Class 3; Class I to Class 3)
If you have any questions or require additional information regarding this license amendment, pleasecontact Mr. James Byrne at (717) 948-8461.
I swear under penalty of perjury that the foregoing is true and correct.
Executed on /6 6/OX Sincerely,
G. A. Kuehn, Jr.Director, SNEC Facility
Attachments:1) Response to NRC Discussion Topics2) SNEC Facility License Termination Plan, Revision 2 change pages3) Calculation No. 6900-02-025
cc: Regional Administrator-NRC Region 1NRC Project Manager, NRRNRC Project Scientist, Region 1Chairman, Board of Supervisors, Liberty TownshipChairman, Board of County Commissioners, Bedford CountyDirector, Bureau of Radiation Protection, PA Department of Environmental Protection
Re Memo # E910-02-054
Attachment 1
Response to NRC Discussion Topics
DISCUSSION ISSUES FOR MEETING BETWEEN THE NRC AND SNEC STAFFSOCTOBER 31, 2002
HEALTH PHYSICS ISSUES
COVER LETTER:
1. Consider revision of license conditions under Section 2.E as follows:Revise condition (d) text as "...related minimum detectable concentrations (forboth scan and fixed measurement methods);"
Delete condition (e) result in significant environmental impacts not previouslyreviewed. This condition is already contained in condition (b) violate the criteriaof 10 CFR 50.82(a)(6)(iii) [i.e, Result in significant environmental impacts notpreviously reviewed.].
Response:Condition (d) has been revised and condition (e) has been deleted. Letter has been revised asfollows:
(a) involve a change to the Technical Specifications or require NRC approval pursuant to 10 CFR50.59;
(b) violate the criteria of 10 CFR 50.82(a)(6);
(c) reduce the coverage requirements for scan measurements;
(d) increase the derived concentration guideline level (DCGL), developed to meet therequirements of 10 CFR 20.1402, and related minimum detectable concentrations for bothscan and fixed measurement methods;
(e) use a statistical test other than the Sign test or Wilcoxon Rank Sum test for evaluation of thefinal status survey;
(f) increase the radioactivity level, relative to the applicable derived concentration guideline level,developed to meet the requirements of 10 CFR 20.1402, at which investigation occurs;
(g) increase the Type I decision error;
(h) decrease an area classification (i.e., impacted to non-impacted; Class 1 to Class 2; Class 2to Class 3; Class 1 to Class 3)
1
CHAPTER 1.0 GENERAL INFORMATION
2. Section 1.3, Plan Summary, page 1-2:
Revise the approval of proposed changes to be the same as those stated in the CoverLetter.
Response:LTP section 1.3 has been revised so that approval of proposed changes is the same as thosestated in the Cover Letter. This change also required editorial revisions to LTP Sections 5.2.4.4,5.6.4.3 and Appendix 5.2 to correct for License Condition References.
CHAPTER 2.0 SITE CHARACTERIZATION
3. Section 2.2.4.1.7.1. Intake Tunnel Characterization Results, page 1-1:
The first paragraph states "Approximately 1 square foot of surface area was surveyed."It is unclear whether the I square foot total was scanned or 1 square foot every 10 feetof tunnel length was scanned. This statement needs to be clarified.
Response:Section 2.2.4.1.7.1, page 2-16 revised as follows:
Surface Scans Using an E-140N with a HP-210/260 Probe: Locations of survey scanmeasurements were obtained for each 10 feet of tunnel length. Approximately I squarefoot of surface area was surveyed at each location. All Surface Scan survey results were <100NCPM.
4. Section 2.2.4.1.8.5, Conclusions, page 2-19:
Consider revising the following sentence in the third paragraph follows: "Robotics wasemployed for the majority of this work as the small diameter pipes, as the confinedspaces, and presence of water made manned entry difficult."
Response:".. as the" has been deleted. Sentence revised as follows:
Robotics was employed for the majority of this work as the small diameter pipes, confined spacesand presence of water made manned entry difficult.
5. Section 2.6. CONCLUSIONS, Pages 2-33 to 2-34:
Consider revision of "No positive results were detected >10' below the surface." to 'Nopositive results above background were detected >10' below the surface."
Response:Bottom of page 2-33 to top of 2-34 - Sentence has been revised as follows:
No positive results above background were detected >10' below the surface.
2
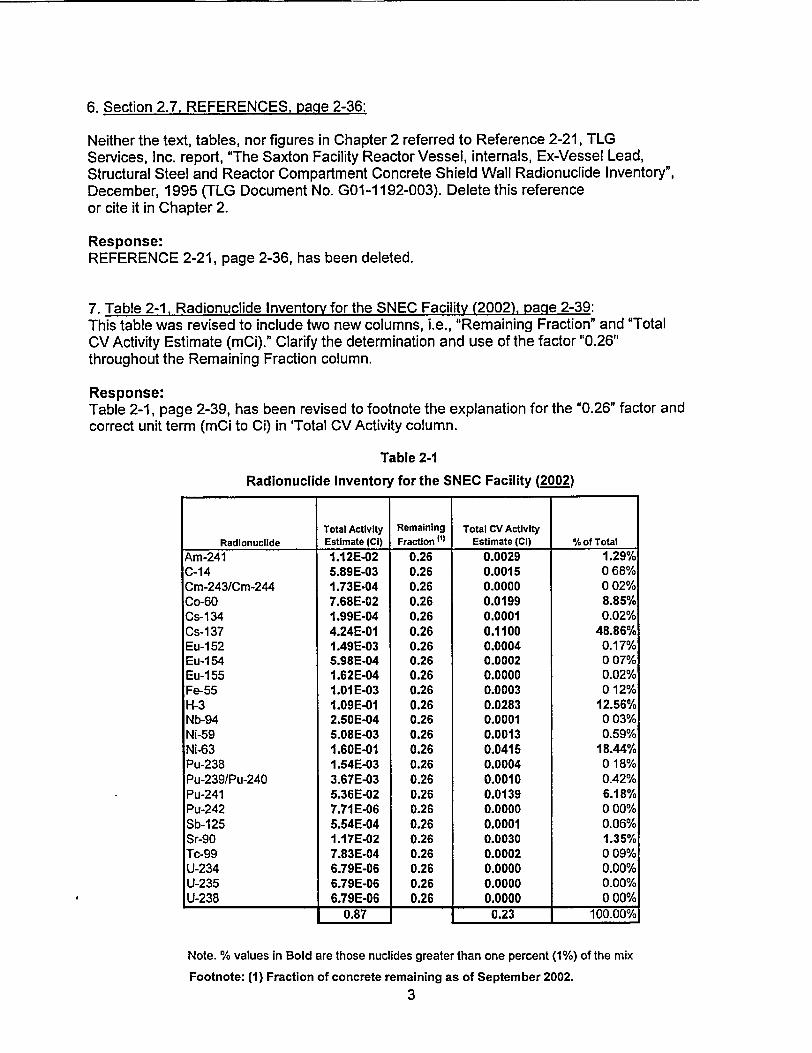
6. Section 2.7, REFERENCES, page 2-36:
Neither the text, tables, nor figures in Chapter 2 referred to Reference 2-21, TLGServices, Inc. report, 'The Saxton Facility Reactor Vessel, internals, Ex-Vessel Lead,Structural Steel and Reactor Compartment Concrete Shield Wall Radionuclide Inventory",December, 1995 (TLG Document No. G01-1192-003). Delete this referenceor cite it in Chapter 2.
Response:REFERENCE 2-21, page 2-36, has been deleted.
7. Table 2-1, Radionuclide InventorV for the SNEC Facility (2002), page 2-39:This table was revised to include two new columns, i.e., "Remaining Fraction" and "TotalCV Activity Estimate (mCi)." Clarify the determination and use of the factor "0.26"throughout the Remaining Fraction column.
Response:Table 2-1, page 2-39, has been revised to footnote the explanation for the "0.26" factor andcorrect unit term (mCi to Ci) in 'Total CV Activity column.
Table 2-1Radionuclide Inventory for the SNEC Facility (2002)
Total Activity Remaining Total CV ActivityRadionuclide Estimate (CI) Fraction (1) Estimate (Cl) % of Total
Am-241 1.12E-02 0.26 0.0029 1.29%C-14 5.89E-03 0.26 0.0015 0 68%Cm-243/Cm-244 1.73E-04 0.26 0.0000 0 02%Co-60 7.68E-02 0.26 0.0199 8.85%Cs-134 1.99E-04 0.26 0.0001 0.02%Cs-137 4.24E-01 0.26 0.1100 48.86%Eu-1 52 1.49E-03 0.26 0.0004 0.17%Eu-1 54 5.98E-04 0.26 0.0002 0 07%Eu-1 55 1.62E-04 0.26 0.0000 0.02%Fe-55 1.01E-03 0.26 0.0003 0 12%H-3 1.09E-01 0.26 0.0283 12.56%Nb-94 2.50E-04 0.26 0.0001 0 03%Ni-59 5.0BE-03 0.26 0.0013 0.59%Ni-63 1.60E-01 0.26 0.0415 18.44/Pu-238 1 .54E-03 0.26 0.0004 0 18%Pu-239/Pu-240 3.67E-03 0.26 0.0010 0.42%Pu-241 5.36E-02 0.26 0.0139 6.18%Pu-242 7.71E-06 0.26 0.0000 0 00%Sb-125 5.54E-04 0.26 0.0001 0.06%Sr-90 1.17E-02 0.26 0.0030 1.35%Tc-99 7.83E-04 0.26 0.0002 0 09%U-234 6.79E-06 0.26 0.0000 0.00%U-235 6.79E-06 0.26 0.0000 0.00%U-238 6.79E-06 0.26 0.0000 0 00%
0.87 0.23 1 U0.UU0I0
Note. % values in Bold are those nuclides greater than one percent (1 %) of the mix
Footnote: (1) Fraction of concrete remaining as of September 2002.
3
8. Tables 2-3a, 2-3b. 2-3c and 2.6a, pages 2-40, 2-42, 2-43, and 2-51:
During the public meeting on health physics issues (May 22, 2002), SNEC agreed torevise Tables 2.3a, 2.3b, and 2.6a to clarify sample type descriptions (e.g., scrapsamples - paint, concrete, etc.) and corresponding footnotes added as appropriate.Please revise Tables 2-3a and 2-3b to resolve this issue. Also, Table 2-3c needs to berevised to indicate scrap sample type. Regarding Table 2-6a, the sample data for theDSF Roof, Debris from Inside Air Conditioner Housing - SXOT951 needs to be revised(as agreed to at the public meeting) to indicate the radionuclide analyzed.
Response:Tables 2-3a, 2-3b and 2-3c have been revised to clarify scraping descriptions. In addition Cs-1 37has been added to Table 2-6a as the radionuclide of reference.
9. Table 2-28, Site Access Roads, page 2-86:
The number of standard deviations is not stated for the data in this table. Pleaseaddress.
Response:Uncertainty values reported in Table 2-28 are one standard deviation. A note has been added tobottom of table to clarify.
10. Table 2-29, Listing of all 'Hard to Detect Nuclides"/Transuranic Analysis, pages 2-87 to 2-95:
During the public meeting on health physics issues (May 22, 2002), SNEC agreed torevise Table 2-29 to include clarifying footnotes (i.e., state the analytical techniquesused, other radionuclides analyzed but not listed, and that blanks indicate no sampleanalysis done). Please revise Table 2-29 to include this information.
Response:Analytical techniques are specified in LTP Section 2.4, pg 2-32. The eleven radionuclides listed inthe table are deemed the most significant for the site. The selection process for theseradionuclides is documented in SNEC Calculation E900-01-030 and noted as Reference 6-13 inChapter 6 of the LTP. A note has been added to the beginning of Table 2-29 to denote 'blankspaces indicate no sample analyses performed.'
11. Table 2-30 (Cont'd), CV Backfill & Subsurface Sample Results (see Figures 2-31 and 2-32):
Entries numbered 123 and 124 refer to subsurface sample data located at Grout CurtainHole # 37. There is no such location identified on Figure 2-32, SNEC CV Grout andWell Installation Plan. Please revise the LTP to rectify this matter.
Response:The correct sample entries are 122 and 123 located on G.C. Hole # 37. Although grout hole # 37was not completed to depth and therefore never incorporated into Figure 2-32, these sampleswere taken out of the first 10 feet. Figure 2-32 has been revised to denote G.C. Hole # 37.
4
12. Figure 2-18. SNEC FACILITY - SSGS DISCHARGE TUNNEL, page 2-137
During the public meeting on health physics issues (May 22, 2002), SNEC agreed torevise Figure 2-18 to indicate sampling locations. Please revise Figure 2-18 to includethis information.
Response:Tables 2-3e and 2-3f provide a comprehensive list of samples and respective location distanceson Figure 2-18. It was agreed that placing all sample locations into Figure 2-18 would congest thedata making it hard to comprehend. Figure 2-18 has been expanded to make it more readable.
13. Figure 2-29. Soil Remediation Near SNEC CV, page 2-148:
Regarding the "area of current excavation," the figure provides no reference distancesfor the excavation boundaries. Thus, the extent of remediation is not clear. Pleaseprovide a frame of reference with distances or delete this figure.
Response:Figure 2-29, "SOIL REMEDIATION NEAR SNEC CV" is included simply for illustrative purposesto aid the readers understanding of the area involving soil remediation. Figure 2-32 has beenrevised and Figures 2-34 and 2-35 added to provide the reference distances in the impacted andnon-impacted areas. These drawings are to scale.
14. Figure 2-30, SNEC Facility CV, page 2-149:
This figure is a sketch that shows the approximate depth of remediation efforts to datearound the CV structure. Since this figure does not provide geophysical boundariesregarding the non-impacted region below the CV, it cannot be used to depict this region.During the public meeting on health physics issues (June 21, 2002), the NRC staffexplained that the LTP needs to include a figure(s) that clearly indicate the boundary ofthe non-impacted region under the CV. Figures/text specifying the non-impacted regionboundaries were not included in LTP Rev. 1. A separate figure with text that clearlydepicts the geophysical boundaries of the non-impacted region needs to be provided.
Response:Figure 2-30, 'SNEC FACILITY CV" is included simply for illustrative purposes to aid the reader'sunderstanding of the extent of remediation in the impacted and non-impacted regions. Figure 2-32 has been revised and Figures 2-34 and 2-35 added to more clearly indicate the boundary ofthe non-impacted region under the CV and the geophysical boundaries. These drawings are toscale. Section 2.2.4.2 has been updated to include these revised or new figures.
CHAPTER 5.0 SNEC FACILITY FINAL STATUS SURVEY PLAN
15. Section 5.1.1, Purpose, page 5-1:
Reference 5-5, NUREG-1575, "Multi-Agency Radiation Survey and Site InvestigationManual (MARSSIM)," should also be cited as a document cited and reviewed in theprocess of preparing the final status survey plan.
Response:Reference 5-5 has been cited in Section 5.1.1 as follows:
5
10 CFR 50.82(a)(9)(ii)(D) (Reference 5-1), Regulatory Guide 1.179 (Reference 5-2) and NUREG-1575 (Reference 5-5) have been used as guides in the preparation of this plan.
16. Section 5.2.4.2.2, Class 2 Area, page 5-10:
Consider revising the first sentence to read: "Class 2 areas are those that have or havehad prior to remediation, a potential for radioactive contamination or knowncontamination, but are not expected to contain material greater than the DCGLW.'
Response:First sentence in 5.2.4.2.2, page 5-10, has been revised as follows:
Class 2 areas are those that have or have had prior to remediation, a potential for radioactivecontamination or known contamination, but are not expected to contain radioactive materialgreater than the DCGLw.
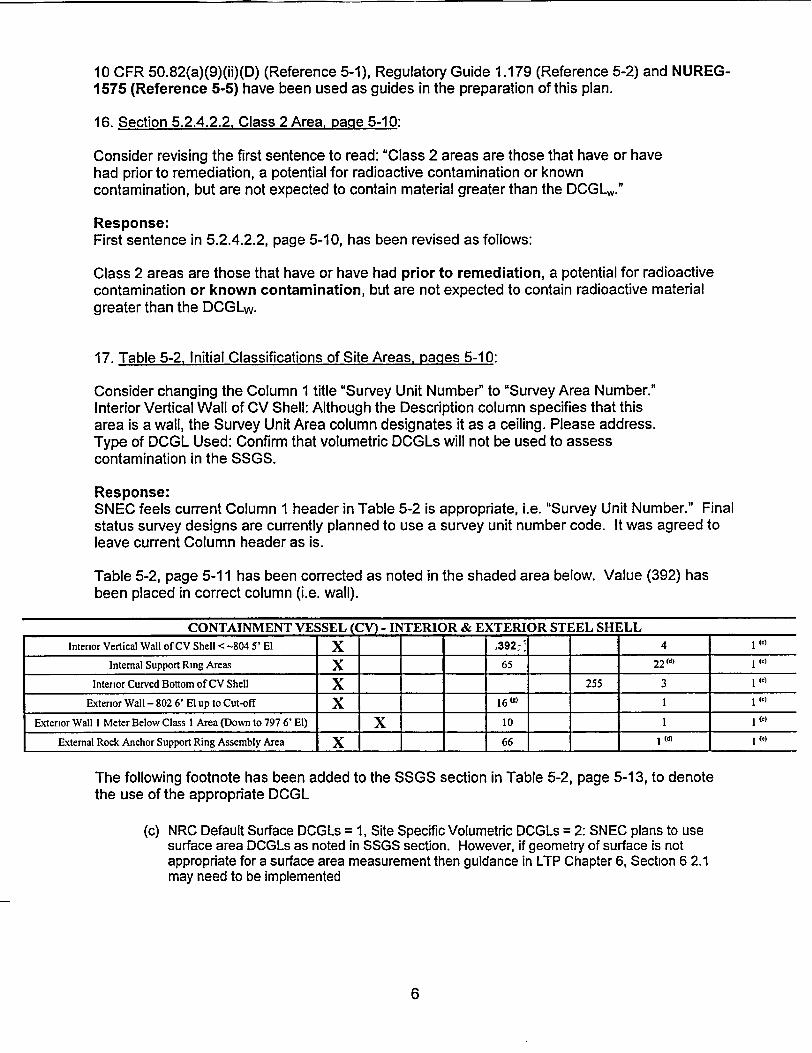
17. Table 5-2, Initial Classifications of Site Areas, pages 5-10:
Consider changing the Column 1 title "Survey Unit Number" to 'Survey Area Number."Interior Vertical Wall of CV Shell: Although the Description column specifies that thisarea is a wall, the Survey Unit Area column designates it as a ceiling. Please address.Type of DCGL Used: Confirm that volumetric DCGLs will not be used to assesscontamination in the SSGS.
Response:SNEC feels current Column 1 header in Table 5-2 is appropriate, i.e. "Survey Unit Number." Finalstatus survey designs are currently planned to use a survey unit number code. It was agreed toleave current Column header as is.
Table 5-2, page 5-11 has been corrected as noted in the shaded area below. Value (392) hasbeen placed in correct column (i.e. wall).
CONTAINMENT VESSEL (C-INTERIOR & EXTERIOR STEEL SHELLInterior Vertical Wall of CV Shell < -804 5' El X = = = .392 - = 4 lie)
Internal Support Ring Areas X 65 22 (d) I(C)
Interior Curved Bottom of CV Shell X 255 3 l
Exterior Wall - 802 6' El up to Cut-off X 16 ) I1
Exterior Wall I Meter Below Class 1 Area (Down to 797 6' El) X 10 I Ie)
External Rock Anchor Support Ring Assembly Area X 66 1 (d)
The following footnote has been added to the SSGS section in Table 5-2, page 5-13, to denotethe use of the appropriate DCGL
(c) NRC Default Surface DCGLs = 1, Site Specific Volumetric DCGLs = 2: SNEC plans to usesurface area DCGLs as noted in SSGS section. However, if geometry of surface is notappropriate for a surface area measurement then guidance in LTP Chapter 6, Section 6 2.1may need to be implemented
6
18. Section 5.2.5.1, Survey Design Overview. page 5-16:
The third paragraph of this section states, "When necessary, a two-stage samplingprocess may be used IAW Reference 5-20. This sampling approach allows a secondset of samples to be taken to meet the requirements of the statistical design of thesurvey. When used, this process will be incorporated as an option in the original surveydesign for the area." Per the Saxton Public Meeting Minutes, June 21, 2002, regardingthe use of 'Two Stage or Double Sampling" in final status surveys, the NRC staff statedthat the LTP needs to indicate those survey units where this method may be used toshow release criteria compliance. Section 5.2.5.1 does not indicate the criteria to beapplied when making the determination that Two Stage or Double Sampling will beapplied to a survey unit. In addition, use of Two Stage or Double Sampling increasesthe Type I decision error. Consequently, to use this process without identifying theapplicable survey units in the LTP would require additional license amendments afterthe LTP is approved.
Response:All sections of the LTP referring to 'Two Stage or Double Sampling have been deleted from theLTP. Reference 5-20 has been deleted.
19. Section 5.2.10, Schedule, page 5-24:
This section states "Final survey activities are planned and will be discussed with theNRC in advance to allow scheduling of the required public meeting on the LicenseTermination Plan." Per 10 CFR 50.82(a)(9)(iii), "The NRC shall also schedule a publicmeeting in the vicinity of the licensee's facility of upon receipt of the of the licensetermination plan." The required public meeting was held on May 25, 2000, after LTPRevision 0 (dated February 2000) was submitted by the licensee. There is no regulatoryrequirement to hold additional meetings. The sentence above needs to be explained ordeleted from the LTP.
Response:Last sentence in Section 5.2.10, page 5-23 has been deleted. Section now reads as follows:
Final status surveys are planned, scheduled, and tracked as a part of the overalldecommissioning planning process. The schedule is dependent upon the progress andcompletion of several decommissioning activities and review and approval of the LicenseTermination Plan. Presently, survey data collection is expected to begin in the fourth quarter of2002.
20. Section 5.4, SURVEY DESIGN, page 5-26:
Item 1 - Use of "Two Stage or Double Sampling" needs to be addressed in the designpackage. Consider revising the text to read "A brief overview describing the final statussurvey design, and a description of the use of "Two Stage or Double Sampling" whenapplicable."
Item 2 - Each survey design package needs to include a clear description of theboundaries for each survey area or unit. Consider revising the text to read "Adescription and map or drawing of impacted areas of the site, area, or building classifiedby residual radioactivity levels (Class 1, Class 2, or Class 3) and divided into survey
7
units, with an explanation of the basis for division into survey units and the boundariesfor each survey unit or area indicated. Maps should have compass headings indicated."
Response:Item 1. SNEC will not be using the Two Stage or Double Sampling approach and therefore this
technique will not be added under this item.
Item 2. Reworded as follows: A description and map or drawing of impacted areas of the site,area, or building classified by residual radioactivity levels (Class 1, Class 2, or Class 3)and divided into survey units, with an explanation of the basis for division into survey unitsand the boundaries for each survey unit or area indicated. Maps should havecompass headings indicated;
21. Section 5.4.4.5, Resurvey, page 5-38:
The second paragraph of this section states "in the case where a new survey unit isseparated out from an existing survey unit or an existing survey unit is subdivided, Class3 survey units need only additional randomly located measurements to complete thesurvey data set." When elevated contamination is identified in a Class 3 area and thearea is subsequently subdivided into different classifications, the survey for theremaining Class 3 area needs to be repeated. In other words, taking of additionalsamples from the revised Class 3 area to supplement those now contained in the newsubdivided area(s) classified as Class 1 or Class 2 is not permitted. Consider revisingthis paragraph to state "In the case where a new survey unit is separated out from anexisting survey unit or an existing survey unit is subdivided, Class 3 survey units need tohave the survey repeated to obtain a new survey data set."
Response:Paragraph 5.4.4.5, page 5-38, has been revised as follows:
In the case where a new survey unit is separated out from an existing survey unit, or an existingsurvey unit is subdivided, Class 3 survey units need to have the survey repeated to obtain anew survey data set. Class 1 and Class 2 survey units require a new survey design based onrandom-start systematic measurement locations.
22. Section 5.5.2.4.4, Static MDC for Structural Surfaces, page 5-46:
Item 5 states "Other correction factors may be applied to the above equation as deemedappropriate." This statement is vague; clarification of the term "other correction factors"needs to be provided.
Response:Page 5-46, Item 5 has been deleted.
23. Section 5.5.3.4.7, Subsurface Soil Contamination Survey, page 5-51:The text at the end of the first paragraph states "Additionally, in-situ measurements maybe considered when any layer exhibits results approaching 50% of the release criteria."The purpose of these measurements needs to be explained.
Response:Section 5.5.3.4.7, page 5-51 - Text has been revised to clarify meaning as follows:
8
Additionally, in-situ measurements may be considered when any layer exhibits resultsapproaching 50% of the release criteria to verify and determine extent of contamination.
24. Section 5.5.3.5, Investigation Measurements, page 5-54:In Section 2.2.4.2, "Soil," the third paragraph on page 2-20 states "Gamma bore loggingwill not be used as a stand alone technique for characterization or Final Status Surveybut rather as a compliment to sampling." In order that the term "compliment tosampling" is consistently used throughout the LTP, consider revising the final sentencein Section 5.5.3.5, 'Investigation Measurements," to state "Therefore, GPU Nuclear, Inc.will consider using gamma-logging as a compliment to sampling in areas where..."
Response:Last paragraph, final sentence in Section 5.5.3.5, page 5-54 has been revised as follows:
Therefore, GPU Nuclear, Inc. will consider using gamma-logging as a compliment to sampling inareas where volumetrically contaminated materials approach the release criteria or whencontamination is thought to be present in piping systems within a survey area.
25. Section 5.5.5.1, Other Scan Measurements. pages 5-54 to 5-55:Regarding 100 percent scanning of an area with high detection efficiencyinstrumentation, this section states "Therefore, the need to measure a finite number ofrandomly selected survey points are reduced or eliminated. Consequently, some scansurvey measurement efforts performed for initial phase and/or investigative purposes,may be accepted as final survey data provided the following conditions are met..." Incontrast to this statement on the use of such instrumentation, Section 5.4.3, "StaticMeasurements," states - "However, GPU Nuclear, Inc. has agreed that soil samples willstill be collected in open land areas additional to these semi-automated scan survey orin-situ gamma spectrometry special measurement techniques." In the latter case,SNEC has told the NRC staff (at public meetings) that the number of sampling points forthe final status survey will be determined by the MARSSIM process. Consequently,once determined, the number of sample points cannot be reduced or eliminated. Thisinconsistency between the two sections needs to be rectified. Furthermore, Section5.5.5.1 needs to specify the survey unit types or characteristics (e.g., embedded pipes)for which scan measurements may be accepted as final status survey data.
Response:First paragraph, second sentence in Section 5.5.5.1, page 5-54 has been deleted. Revisedparagraph currently reads:
When 100% of any area is scanned at a high detection efficiency, capable of discerning low levelsof residual activity (well below established DCGLW levels), collected results have a greaterassurance that survey areas meet the site release criteria. Consequently, some scan surveymeasurement efforts performed for initial phase and/or investigative purposes, may be acceptedas final survey data provided the following conditions are met:
9
26. Section 5.8, DEFINITIONS, page 5-66:
The definition for scoping survey states 'Surveys such as investigative surveys used toprovide a quick look at conditions before or during FSS work. These surveys are notnecessarily documented." This definition needs to be revised since scoping surveyactivities are performed for a preliminary risk assessment or to provide input foradditional characterization and are not conducted during the final status survey.Consider replacing this definition with that which is in NUREG-1 575, Rev. 1.. i.e., "A typeof survey that is conducted to identify: 1) radionuclide contaminants, 2) relative radionuclideratios, and 3) general levels and extent of contamination."
Response:Section 5.8, page 5-66 - Definition has been revised as follows:
Scoping Surveys - A type of survey that is conducted to identify: 1) radionuclidecontaminants, 2) relative radionuclide ratios, and 3) general levels and extent ofcontamination.
DOSE MODELING
27. Consider referencing in the LTP the specific MicroShield analysis used in support of Equation6-1. In referencing these calculations, consider stating that any future analysis using MicroShieldin support of Equation 6-1 will use the same conceptual model and input parameters (withpossibly the exception of the concentration) as those used in thereferenced analysis.
Response:Copies of SNEC Calculation 6900-02-025 have been provided to NRC as part of this answersubmittal. This document has been included in the reference section of LTP Chapter 6. Section6.2.1, page 6-3, has been revised to include NRC's comment that only the concentration oractivity will be updated in Equation 6-1 and the appropriate bounding constant(s) are notated foruse in Equation 6-1. In addition, application of Equation 6-1 will used over the entire respectivesurvey unit. Revisions to Section 6.2.1 have resulted in page changes to pages 6-4 through 6-9.The following is the revision to Section 6.2.1.
Exposure pathway (d) listed above applies to areas where there is penetrating radiation fromembedded sources of radioactivity, such as embedded piping or activated metal. To the extentpractical embedded pipe sources will be filled with grout or concrete. For modeling thesescenarios a bounding calculation has been performed (Reference 6-19) using the sum of thefractions method. This method combines applicable surface and volumetric DCGLs along withthe Microshield shielding code to calculate the respective dose from residual activity remaining onstructural surfaces, within residual piping, walls and floors or within activated metal (e.g. CV steelliner). Two scenarios have been evaluated in the calculation. They are:
* Bounding Limit 1 - Dose from an activated region of the SNEC CV steel shell is combinedwith the dose from surface contamination. The annual direct gamma dose calculated byMicroShield for the activated region is 7.2 mrem.
* Bounding Limit 2 - Dose from post remediation surface contamination and volumetriccontamination of concrete surfaces within the SSGS Discharge Tunnel are combined withseveral hypothetical direct exposures from pipe sections. The annual direct gamma dosecalculated by MicroShield for the SSGS pipe sections is 0.611 mrem.
10
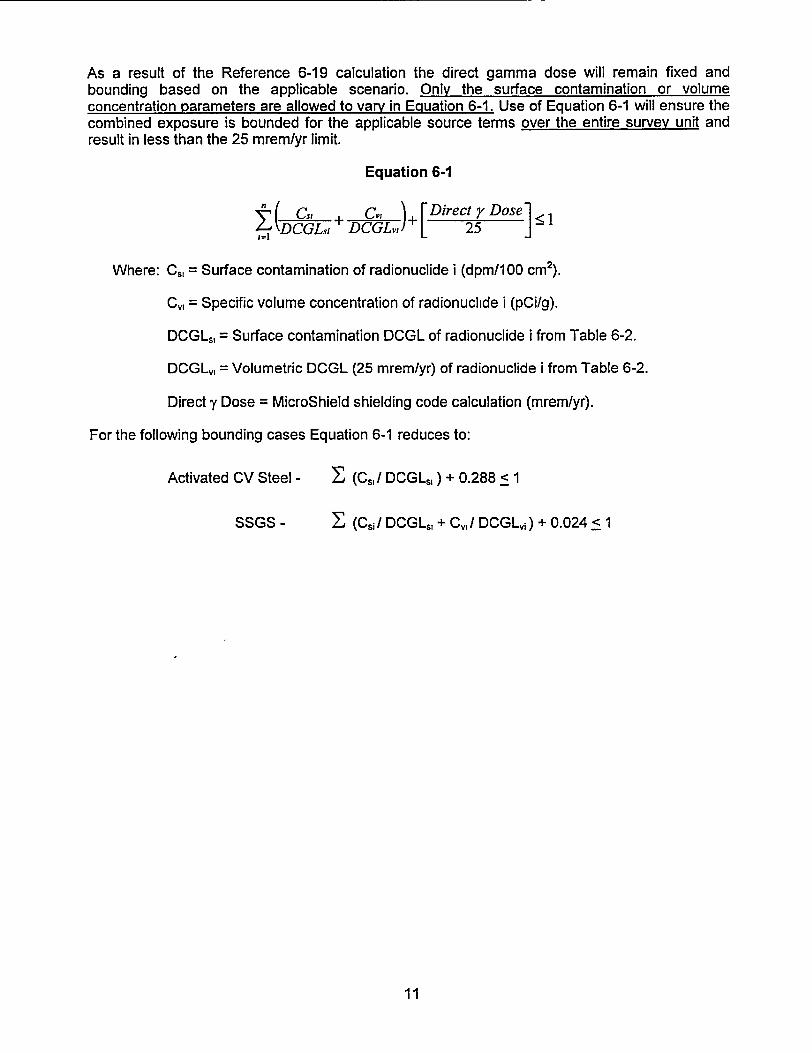
As a result of the Reference 6-19 calculation the direct gamma dose will remain fixed andbounding based on the applicable scenario. Only the surface contamination or volumeconcentration parameters are allowed to vary in Equation 6-1. Use of Equation 6-1 will ensure thecombined exposure is bounded for the applicable source terms over the entire survey unit andresult in less than the 25 mrem/yr limit.
Equation 6-1
n(G. C+ D [Direct r Dose]EDC sf+ DCGLv) + L 25 j -1
Where: Cs, = Surface contamination of radionuclide i (dpm/100 cm2).
C,, = Specific volume concentration of radionuclide i (pCi/g).
DCGLS, = Surface contamination DCGL of radionuclide i from Table 6-2.
DCGLV, = Volumetric DCGL (25 mrem/yr) of radionuclide i from Table 6-2.
Direct y Dose = MicroShield shielding code calculation (mrem/yr).
For the following bounding cases Equation 6-1 reduces to:
Activated CV Steel - z (CI/ DCGLS, ) + 0.288 < I
SSGS - z (Cj / DCGLs, + Cll DCGLV-) + 0.024 < 1
11
FINANCIAL
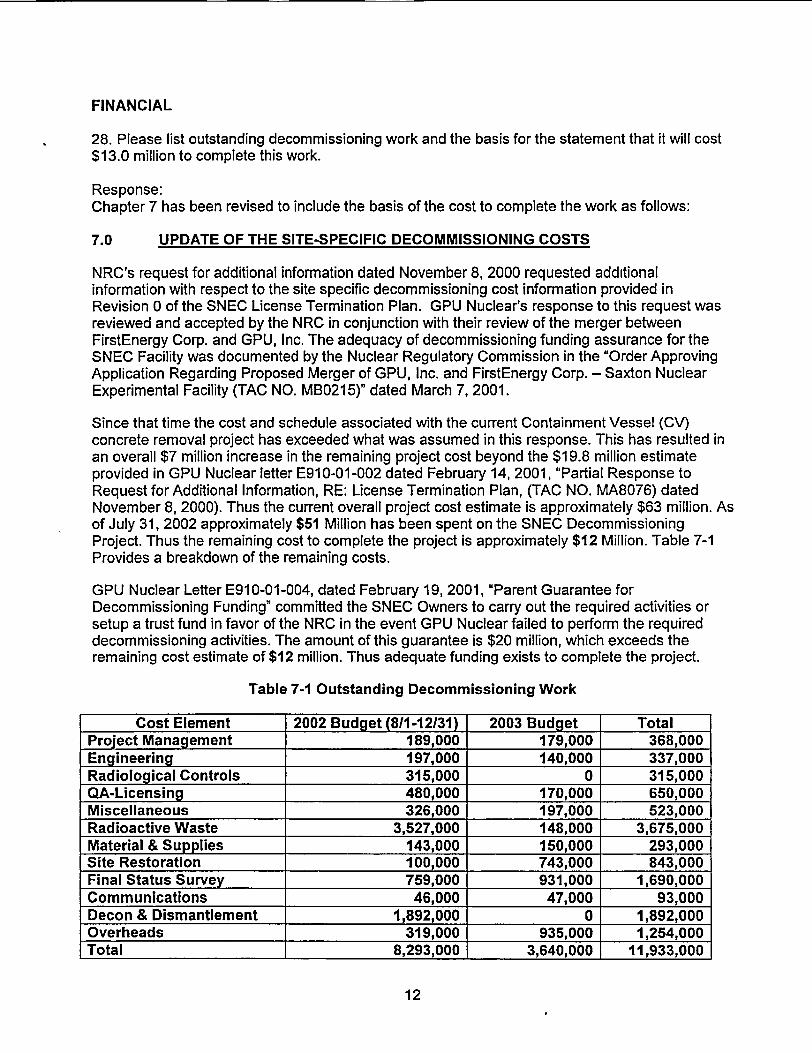
28. Please list outstanding decommissioning work and the basis for the statement that it will cost$13.0 million to complete this work.
Response:Chapter 7 has been revised to include the basis of the cost to complete the work as follows:
7.0 UPDATE OF THE SITE-SPECIFIC DECOMMISSIONING COSTS
NRC's request for additional information dated November 8, 2000 requested additionalinformation with respect to the site specific decommissioning cost information provided inRevision 0 of the SNEC License Termination Plan. GPU Nuclear's response to this request wasreviewed and accepted by the NRC in conjunction with their review of the merger betweenFirstEnergy Corp. and GPU, Inc. The adequacy of decommissioning funding assurance for theSNEC Facility was documented by the Nuclear Regulatory Commission in the 'Order ApprovingApplication Regarding Proposed Merger of GPU, Inc. and FirstEnergy Corp. - Saxton NuclearExperimental Facility (TAC NO. MB0215)" dated March 7, 2001.
Since that time the cost and schedule associated with the current Containment Vessel (CV)concrete removal project has exceeded what was assumed in this response. This has resulted inan overall $7 million increase in the remaining project cost beyond the $19.8 million estimateprovided in GPU Nuclear letter E910-01-002 dated February 14, 2001, "Partial Response toRequest for Additional Information, RE: License Termination Plan, (TAC NO. MA8076) datedNovember 8, 2000). Thus the current overall project cost estimate is approximately $63 million. Asof July 31, 2002 approximately $51 Million has been spent on the SNEC DecommissioningProject. Thus the remaining cost to complete the project is approximately $12 Million. Table 7-1Provides a breakdown of the remaining costs.
GPU Nuclear Letter E910-01-004, dated February 19, 2001, "Parent Guarantee forDecommissioning Funding" committed the SNEC Owners to carry out the required activities orsetup a trust fund in favor of the NRC in the event GPU Nuclear failed to perform the requireddecommissioning activities. The amount of this guarantee is $20 million, which exceeds theremaining cost estimate of $12 million. Thus adequate funding exists to complete the project.
Table 7-1 Outstanding Decommissioning Work
Cost Element 2002 Budget (811-12131) 2003 Budget TotalProject Management 189,000 179,000 368,000Engineering 197,000 140,000 337,000Radiological Controls 315,000 0 315,000QA-Licensing 480,000 170,000 650,000Miscellaneous 326,000 197,000 523,000Radioactive Waste 3,527,000 148,000 3,675,000Material & Supplies 143,000 150,000 293,000Site Restoration 100,000 743,000 843,000Final Status Survey 759,000 931,000 1,690,000Communications 46,000 47,000 93,000Decon & Dismantlement 1,892,000 0 1,892,000Overheads 319,000 935,000 1,254,000Total 8,293,000 3,640,000 11,933,000
12
GROUND WATER
29. Please incorporate your responses to the RAls, the radiological analytical results from thegroundwater sampling events, and other appropriate hydrogeological data into the revised LTP.This should include updating all text, tables, figures, and calculations inthe LTP for the aforementioned items where these items have been replaced by morecurrent analysis and data.
Please discuss as a minimum the following items in the LTP Groundwater Section:
a. Description of the overburden and bedrock water-bearing units at this site. (Note that therevised LTP has an adequate description of these units and this topic is included here only forpurposes of having a complete list.)
Response:No response required.
b. Discussion of the groundwater monitoring program at this site. This should include a discussionon the different phases in their monitoring program (i.e., what wells were installed, when, why). Amap delineating the location of the overburden and bedrock wells. (Revised LTP is adequateexcept several monitoring wells installed during the fall/winter of 2000 are not discussed. Some ofthese are very important wells, for example, the nested background wells OW-3 and OW-3R andothers - OW4, OW-4R, OW-5, OW-5R, and OW-6.)
Response:Last paragraph in Section 2.2.4.5, page 2-25 and Reference Section page 2-37, have beenrevised to add the references to the GPU Response letter to RAI3 dated March 19, 2001(Reference 2-35) and the Haley & Aldrich Report dated March 14, 2001 (Reference 2-36), wherethis information is contained.
Remediation activities have resulted in several monitoring wells being removed from service. InDecember 2000 additional wells were installed to characterize the upgradient anddowngradient regions onsite. References 2-35 and 2-36 provide information on theseinstallations. In addition, at the request of the NRC a deep angle well was installed in March2002 adjacent to and hydraulically downgradient of the CV. This well is intended to monitor forpotential ground water and subsurface contamination originating from the CV or from migration ofcontaminants down through the backfill adjacent to the CV. The location of all wells, both in-service and abandoned is shown on Figures 2-17 and 2-32.
c. Recent groundwater-level configuration maps representing the overburden and bedrock units.Also, discuss any changes in the groundwater-level configuration maps under drought andextremely wet conditions. The groundwater flow directions or patterns should be discussed andshown on the maps. The groundwater flow in the bedrock should also be discussed based uponobserved water levels and the fractures and structural features in the bedrock units. (Thisinformation was not included in the LTP, but it was included in the items listed above.) Thelicensee should also provide a table that lists the groundwater levels over time at this site for thedifferent monitoring wells. The licensee staff or consultants provided the NRC staff with a tablewith this information during the April 2002 groundwater sampling event. This table providesinformation on the variations in the groundwater levels during seasonal and wet and dry climaticperiods.
13
Response:Table 2-34 listing the most recent groundwater levels has been provided. In addition, Section2.2.4.5.1, page 2-26, has been revised as follows to describe groundwater flows through thevarious geological units.
Reference 2-32, submitted to the NRC on January 24, 2002 contains information on the SNECsite hydrogeology, monitoring well placement and sampling results.
Of particular note, as described in Reference 2-32, in 2000 and 2001, slug tests wereconducted on several observation wells. Slug tests (falling head tests) were conducted onseven wells to assess the ability of water to move through the subsurface. Tests wereconducted on three overburden (OW-3, OW-5, and OW-6) and four bedrock wells (OW-3R,OW-4R, OW-5R, OW-7R). The test was conducted by adding water to the well andfrequently measuring and recording decreasing water levels. The water levels wererecorded with a hand held water level probe. The Bouwer-Rice and the Hvorslov methodswere used to analyze the slug test data and estimate hydraulic conductivity.
The range of hydraulic conductivity for three wells at the overburden/bedrock interface is15.59 m/year to 35.62 m/year. The range of hydraulic conductivity for the four bedrockwells is 15.59 mlyearto 909.53 m/year. Travel time estimates based on these hydraulicconductivities indicate that if tritium was released from the facility it has likely reached theRaystown Branch of the Juniata River.
Additionally water levels have been collected monthly or bimonthly basis since January2001 to evaluate the potential for seasonal groundwater flow directions changes. Aspreadsheet with level data is attached as Table 2-34. As discussed in Reference 2-32Haley & Aldrich, Inc. evaluated the individual sets of water level information for Saxtonthrough November 2001. This evaluation included wells installed at theoverburden/bedrock interface and bedrock.
Groundwater elevations fluctuate throughout the year, however the groundwater flowpattern remains consistent. Groundwater elevations were reviewed and groundwaterelevation contours were generated for the 2001 monitoring events. This includes the highwater period in April 2001 and during the low water period in November 2001. Contouringindicates that the flow pattern is consistent and similar to past groundwater contours. Forexample, at the upgradient OW-3 series wells the water level elevations have fluctuated8.30 and 7.00 feet in OW-3 and OW-3R, respectively. Similarly, the groundwater elevationshave fluctuated 4.75 and 4.90 feet at the OW-5 series wells situated downgradient of thesite and near the river.
A comparison of groundwater and surface water level trends indicates they behavesimilarly. When higher and lower groundwater elevations occur at the site, they also occurin the surface water (the Raystown Branch of the Juniata River).
d. Groundwater flow rates in the two water-bearing units should be discussed. Account for rangesin the hydraulic conductivity of the different rock materials; impact, if any, of climatic conditions onhydraulic heads and flow rate; and the impact of bedrock structure (fractures and bedding planes)on the flow rate in the bedrock unit. (This information was not included in the revised LTP.)
Response:See response to item c above.
14
e. The groundwater flow rates should be used with potential plant-generated radionuclides tocalculate travel times from the industrial area to the surface water discharge in the RaytownBranch of the Juniata River. Where appropriate, the Kd's of the different radionuclides need to beused. Discuss the potential ranges in these travel times within both water-bearing units for thedifferent potential radionuclides. (This information was not included in the revised LTP.)
Response:Chemical form and Kds are discussed in LTP Section 6.2.2.7. For purposes of flow transportthrough soil or aqueous media tritium is normally the radionuclide of reference to predictmaximum transport through the various geological units found at Saxton. Note the answer to itemc in the hydraulic conductivity section and the reference to tritium transport.
f. Discuss the analytical results of the radionuclides present in the groundwater. This discussionshould include all potential plant-generated radionuclides, including the hard-to-detect. (Thelicensee's discussion is adequate. However, the licensee's conclusion on page 2-26 that resultsfrom Table 2-32 confirms that there are no radionuclides related to plant operations present in themonitored groundwater is not correct. Table 2-32 does not include all the monitoring wells thatwere sampled during the April 2002 sampling event. This table contains only results from thewells that NRC collected a split sample. Also, NRC analyzed their groundwater samples for H-3,Cs-1 37, Cs-I 34, Co-60, and the hard-to-detect radionuclides while the licensee apparentlyanalyzed their groundwater samples for H-3, Cs-1 37, Cs-1 34, and Co-60.)
Response:
LTP Revision 1 Table 2-17b (New Monitoring Well TRU/HTD Analysis Results) has beenrenumbered as 2-17c. A new table, which includes all the monitoring wells that were sampled inApril 2002, has been inserted and numbered as 2-17b. Section 2.2.4.5.1, paragraph 8, page 2-26, has been revised as follows:
The ORISE results are reported in Reference 2-34. SNEC analyzed the split samples for Cs-137,Cs-134, Co-60, and tritium. SNEC results are reported in Table 2-32 for wells where splitsamples were taken. Table 2-17b provides data for the remainder of the wells sampled thatday. Review of these sets of analysis confirms the conclusion that no radionuclides related toplant operations are present in the monitored groundwater.
15
Errata and Miscellaneous Corrections
1. Table of Contents, pages iv, v, and vii: Updated to reflect new and/or revised tables andfigures.
2. Page 2-18, Section 2.2.4.1.8.3, last sentence: Fixed grammar. Changed '..may have be.." to"..may have been.."
3. Page 2-19, Last sentence bottom of page: Added reference to CoPhysics report.
4. Page 2-20: Added a paragraph to section 2.2.4.2 to describe scan surveys performed byShonka Research Associates and corresponding reference.
5. Page 2-21, 1st paragraph: Clarified that the section of the CV Tunnel supporting the MHB willbe removed.
6. Page 2-23, Section 2.2.4.4.1, last paragraph, Typo error: "Cl-i" changed to "Cl-6"
7. Page 2-34, paragraph 8: Revised to denote only the Weir discharge point impacts the JuniataRiver. Paragraph 9 was deleted to avoid confusion with paragraph 8.
8. Page 2-36: Reference 2-14 updated.
9. Page 2-37: Added four (4) new references.
10. Pages 2-41 through 2-47: Changed font style in Tables 2-3a through 2-31 to AMal and addedcorrected rows to Tables 2-3b, 2-3e and 2-3f to denote correct units.
11. Page 2-49, Table 2-5b: Added Cs-1 37 to table headers.
12. Page 2-71: Table 2-17b renamed to Table 2-17c. Corrected Table 2-17c units from pCi/g topCi/l.
13. Page 2-147, Figure 2-28: Removed Note reference to microRem/hr readings.
14. Page 5-13, Table 5-2: Increased number of survey units from 2 to 3 for SSGS Intake Tunnelfloor and ceiling sections. This revision was required due to dimension complexitiesdetermined from recent inspections of the tunnels. Changed description of "Top of SealChambers" to "Floor Above Seal Chambers".
15. Page 5-24, Section 5.2.11, 2nd bullet item: Changed "Saxton" to "SNEC".
16. Page 5-63, Section 5.7.2, Item 5, 2nd bullet, Typo error: "Class 5" changed to "Class 3."
17. Page 5-68, Reference 5-5: Updated with latest revision.
18. Page 5-72, Table 5-15A, Sr-90 area factor for 9 M2 : Corrected value from 1.5 to 3.9. Thecorrect value (3.9) is documented in SNEC Calculation E900-01-005 (LTP Reference 6-10).Copy of this calculation was submitted to the NRC in their April 8, 2002 meeting with SNECstaff.
16
Re Memo # E910-02-054
Attachment 2
SNEC Facility License TerminationPlan, Revision 2 Change Pages
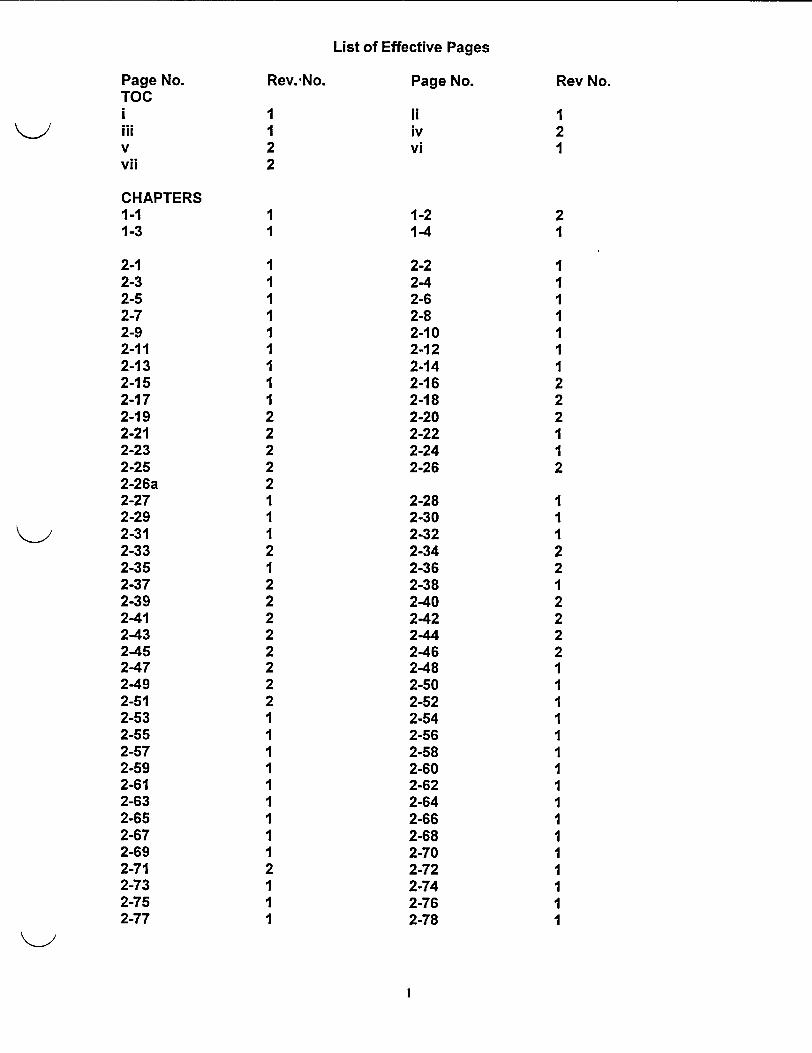
List of Effective Pages
Page No. Rev.-No. Page No. Rev No.TOCi 1 ii 1iii 1 iv 2v 2 vi 1vii 2
CHAPTERS1-1 1 1-2 21-3 1 1-4 1
2-1 1 2-2 12-3 1 2-4 12-5 1 2-6 12-7 1 2-8 12-9 1 2-10 12-11 1 2-12 12-13 1 2-14 12-15 1 2-16 22-17 1 2-18 22-19 2 2-20 22-21 2 2-22 12-23 2 2-24 12-25 2 2-26 22-26a 22-27 1 2-28 12-29 1 2-30 12-31 1 2-32 12-33 2 2-34 22-35 1 2-36 22-37 2 2-38 12-39 2 2-40 22-41 2 2-42 22-43 2 2-44 22-45 2 2-46 22-47 2 2-48 12-49 2 2-50 12-51 2 2-52 12-53 1 2-54 12-55 1 2-56 12-57 1 2-58 12-59 1 2-60 12-61 1 2-62 12-63 1 2-64 12-65 1 2-66 12-67 1 2-68 12-69 1 2-70 12-71 2 2-72 12-73 1 2-74 12-75 1 2-76 12-77 1 2-78 1
I
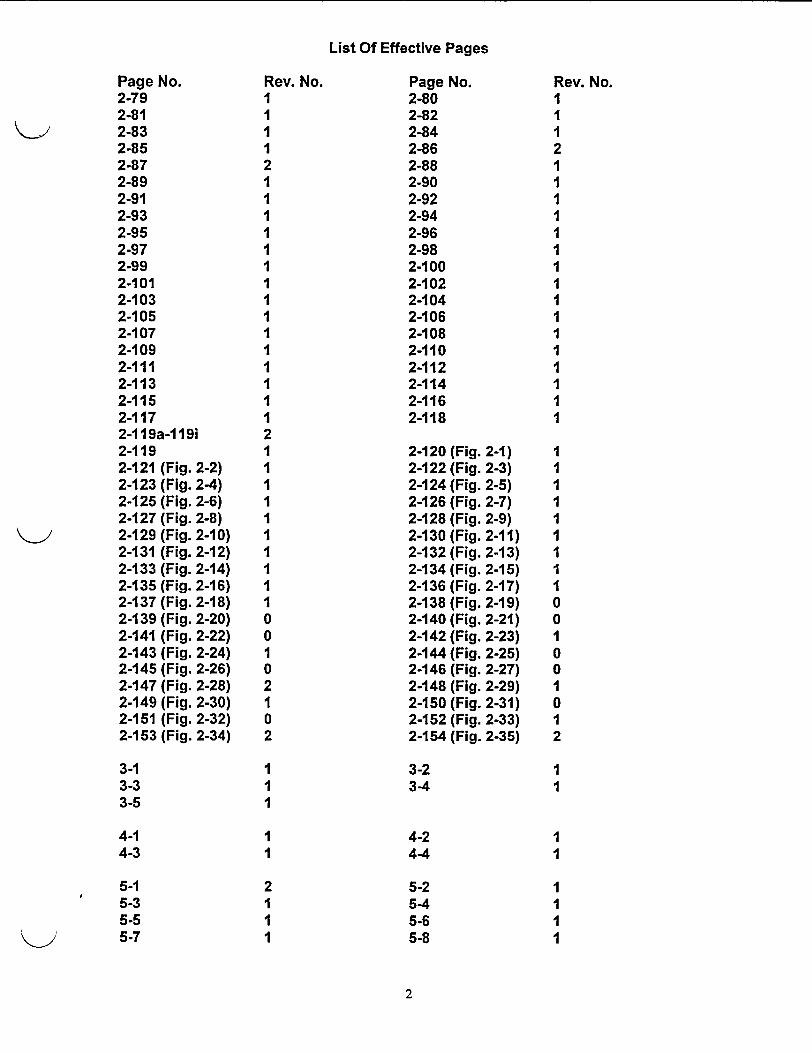
List Of Effective Pages
Page No.2-792-812-832-852-872-892-912-932-952-972-992-1012-1032-1052-1072-1092-1112-1132-1152-1172-119a-119i2-1192-121 (Fig. 2-2)2-123 (Fig. 2-4)2-125 (Fig. 2-6)2-127 (Fig. 2-8)2-129 (Fig. 2-10)2-131 (Fig. 2-12)2-133 (Fig. 2-14)2-135 (Fig. 2-16)2-137 (Fig. 2-18)2-139 (Fig. 2-20)2-141 (Fig. 2-22)2-143 (Fig. 2-24)2-145 (Fig. 2-26)2-147 (Fig. 2-28)2-149 (Fig. 2-30)2-151 (Fig. 2-32)2-153 (Fig. 2-34)
Rev. No.I12121111IIIIII1111121IIIIIIIII00I02I02
Page No.2-802-822-842-862-882-902-922-942-962-982-1002-1022-1042-1062-1082-1102-1122-1142-1162-118
2-120 (Fig. 2-1)2-122 (Fig. 2-3)2-124 (Fig. 2-5)2-126 (Fig. 2-7)2-128 (Fig. 2-9)2-130 (Fig. 2-11)2-132 (Fig. 2-13)2-134 (Fig. 2-15)2-136 (Fig. 2-17)2-138 (Fig. 2-19)2-140 (Fig. 2-21)2-142 (Fig. 2-23)2-144 (Fig. 2-25)2-146 (Fig. 2-27)2-148 (Fig. 2-29)2-150 (Fig. 2-31)2-152 (Fig. 2-33)2-154 (Fig. 2-35)
Rev. No.II121111111111111111
111111II10010010I2
II
3-13-33-5
1
1I
4-14-3
II
3-23-4
4-24-4
5-25-45-65-8
11
5-15-35-55-7
2III
IIII
2
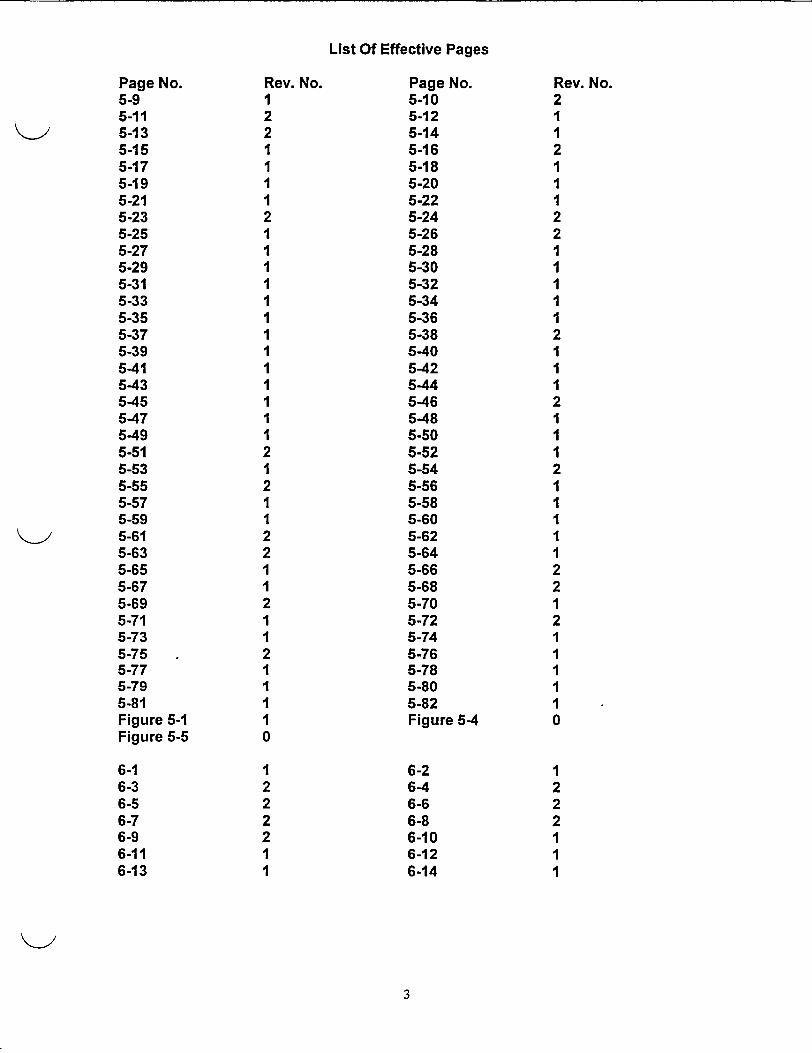
List Of Effective Pages
Page No.5-95-115-135-155-175-195-215-235-255-275-295-315-335-355-375-395-415-435-455-475-495-515-535-555-575-595-615-635-655-675-695-715-735-755-775-795-81Figure 5-1Figure 5-5
Rev. No.12211112111111111III
12121
2211211211110
Page No.5-105-125-145-165-185-205-225-245-265-285-305-325-345-365-385-405-425-445-465-485-505-525-545-565-585-605-625-645-665-685-705-725-745-765-785-805-82Figure 5-4
Rev. No.21I211I22111112111212121II122212IIIII0
I222III
6-16-36-56-76-96-116-13
12222II
6-26-46-66-86-106-126-14
3
List Of Effective Pages
Page No. Rev. No. Page No. Rev. No.
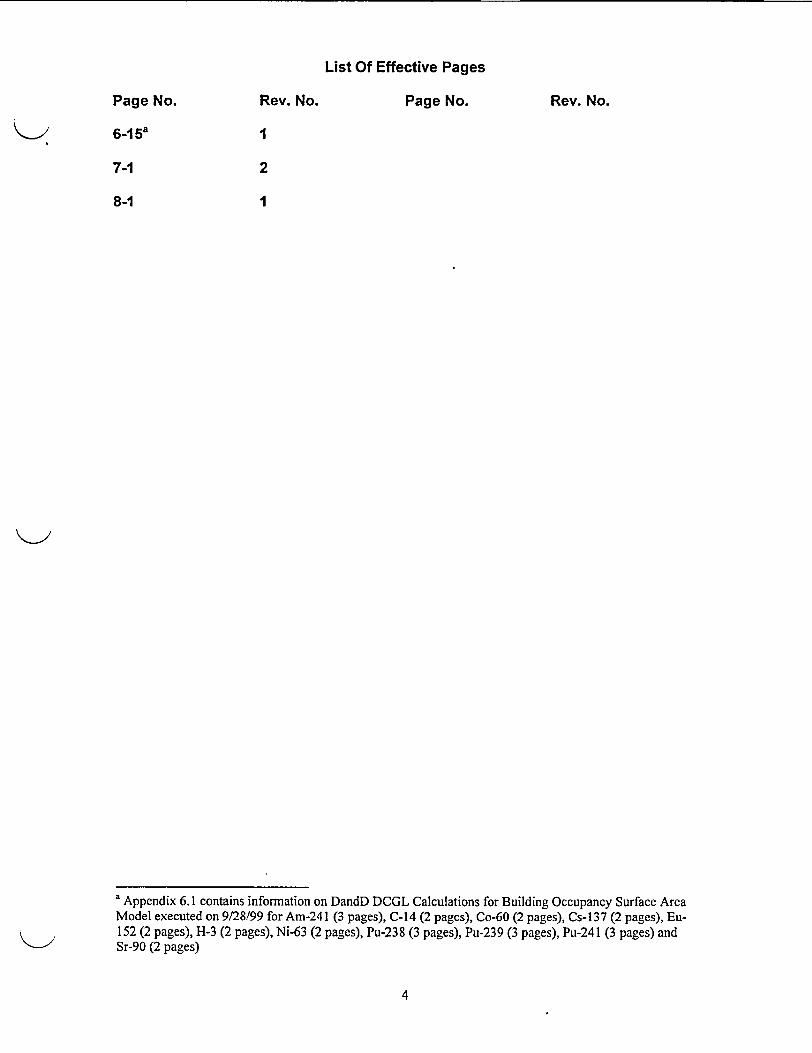
6-1 5a
7-1
1
2
18-1
a Appendix 6.1 contains information on DandD DCGL Calculations for Building Occupancy Surface AreaModel executed on 9/28/99 for Am-241 (3 pages), C-14 (2 pages), Co-60 (2 pages), Cs-137 (2 pages), Eu-152 (2 pages), H-3 (2 pages), Ni-63 (2 pages), Pu-238 (3 pages), Pu-239 (3 pages), Pu-241 (3 pages) andSr-90 (2 pages)
4
SNEC FACILITY LICENSE TERMINATION PLAN E AREVISION I
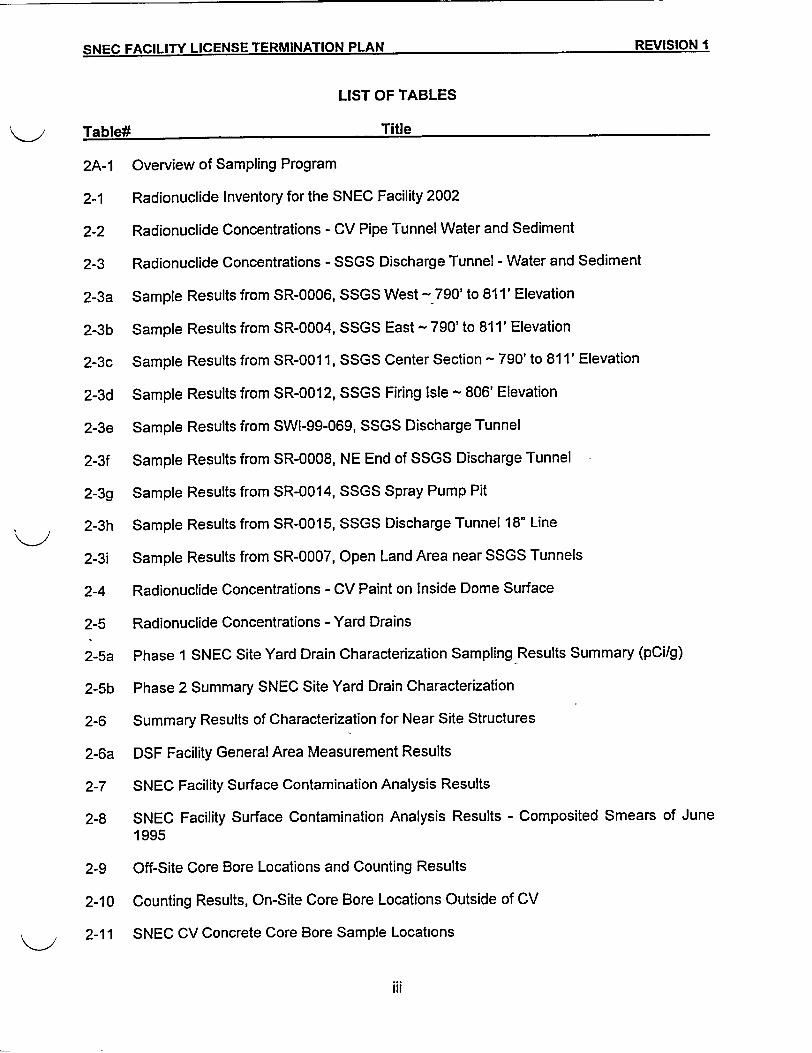
LIST OF TABLES
TitleTable*
2A-1
2-1
2-2
2-3
2-3a
2-3b
2-3c
2-3d
2-3e
2-3f
2-3g
2-3h
2-3i
2-4
2-5
2-5a
2-5b
2-6
2-6a
2-7
2-8
2-9
2-10
2-11
Overview of Sampling Program
Radionuclide Inventory for the SNEC Facility 2002
Radionuclide Concentrations - CV Pipe Tunnel Water and Sediment
Radionuclide Concentrations - SSGS Discharge Tunnel - Water and Sediment
Sample Results from SR-0006, SSGS West - 790' to 811' Elevation
Sample Results from SR-0004, SSGS East - 790' to 811' Elevation
Sample Results from SR-001 1, SSGS Center Section - 790' to 811' Elevation
Sample Results from SR-0012, SSGS Firing Isle - 806' Elevation
Sample Results from SWI-99-069, SSGS Discharge Tunnel
Sample Results from SR-0008, NE End of SSGS Discharge Tunnel
Sample Results from SR-0014, SSGS Spray Pump Pit
Sample Results from SR-0015, SSGS Discharge Tunnel 18" Line
Sample Results from SR-0007, Open Land Area near SSGS Tunnels
Radionuclide Concentrations - CV Paint on Inside Dome Surface
Radionuclide Concentrations - Yard Drains
Phase 1 SNEC Site Yard Drain Characterization Sampling Results Summary (pCi/g)
Phase 2 Summary SNEC Site Yard Drain Characterization
Summary Results of Characterization for Near Site Structures
DSF Facility General Area Measurement Results
SNEC Facility Surface Contamination Analysis Results
SNEC Facility Surface Contamination Analysis Results - Composited Smears of June1995
Off-Site Core Bore Locations and Counting Results
Counting Results, On-Site Core Bore Locations Outside of CV
SNEC CV Concrete Core Bore Sample Locations
iii
I
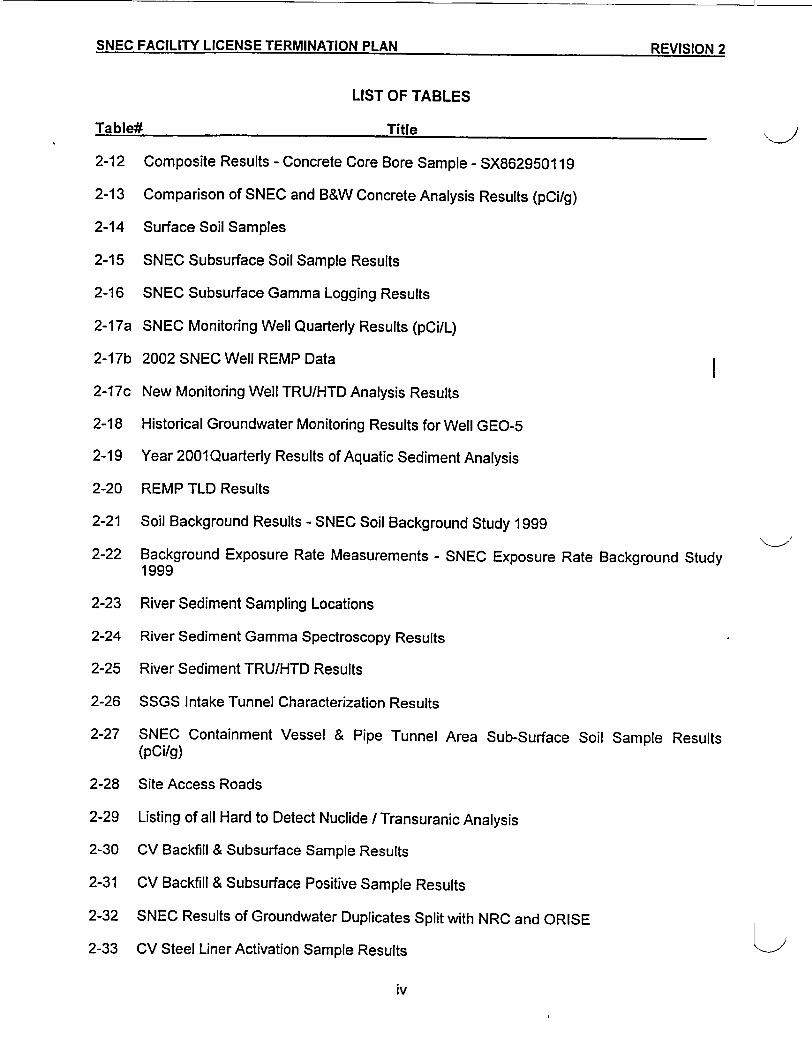
SNEC FACILITY LICENSE TERMINATION PLAN D=11Q~lK 13SN . , _FCIT _Y _L C S .T I ATO . _. AN.. D eiwirl I_ I l.VIA.1I&J c
LIST OF TABLES
Table# Title
2-12 Composite Results - Concrete Core Bore Sample - SX862950119
2-13 Comparison of SNEC and B&W Concrete Analysis Results (pCi/g)
2-14 Surface Soil Samples
2-15 SNEC Subsurface Soil Sample Results
2-16 SNEC Subsurface Gamma Logging Results
2-17a SNEC Monitoring Well Quarterly Results (pCi/L)
2-17b 2002 SNEC Well REMP Data
2-17c New Monitoring Well TRU/HTD Analysis Results
2-18 Historical Groundwater Monitoring Results for Well GEO-5
2-19 Year 2001 Quarterly Results of Aquatic Sediment Analysis
2-20 REMP TLD Results
2-21 Soil Background Results - SNEC Soil Background Study 1999
2-22 Background Exposure Rate Measurements - SNEC Exposure Rate Background Study1999
2-23 River Sediment Sampling Locations
2-24 River Sediment Gamma Spectroscopy Results
2-25 River Sediment TRU/HTD Results
2-26 SSGS Intake Tunnel Characterization Results
2-27 SNEC Containment Vessel & Pipe Tunnel Area Sub-Surface Soil Sample Results(pCi/g)
2-28 Site Access Roads
2-29 Listing of all Hard to Detect Nuclide / Transuranic Analysis
2-30 CV Backfill & Subsurface Sample Results
2-31 CV Backfill & Subsurface Positive Sample Results
2-32 SNEC Results of Groundwater Duplicates Split with NRC and ORISE
2-33 CV Steel Liner Activation Sample Results
iv
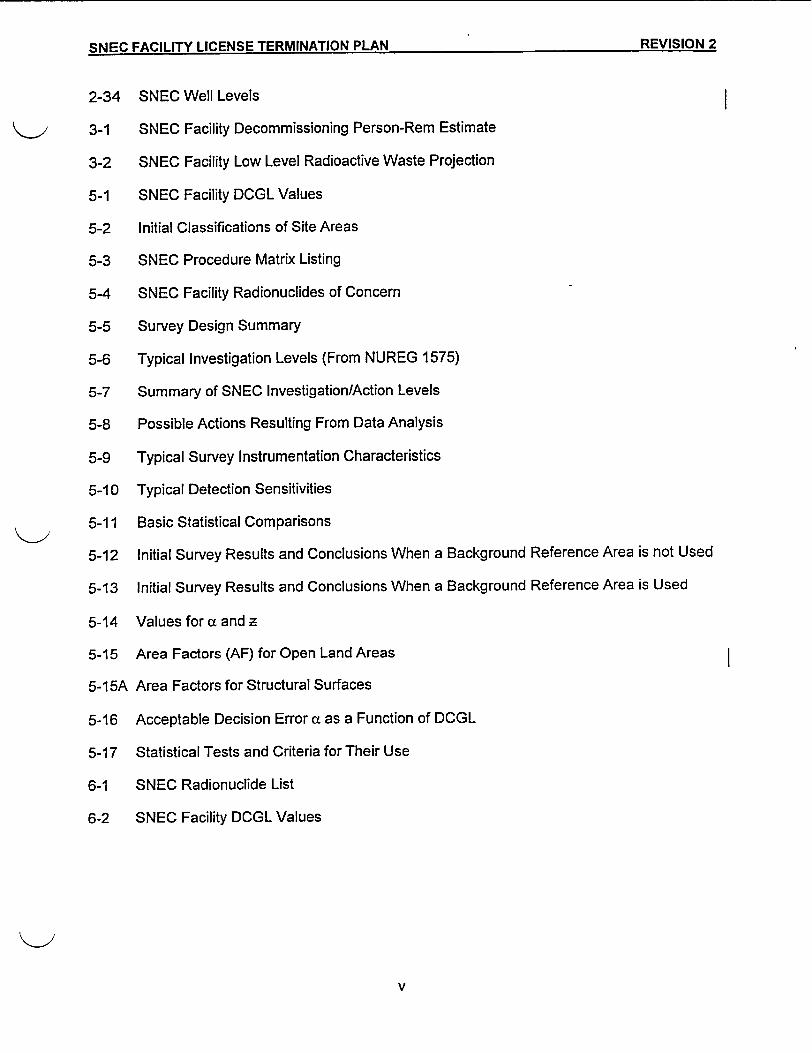
SNEC FAIIYLCNETRIAINPA I REVISION 2SNEC FACILITY LICENSE TERMINATION PLAN REVISION 2
2-34
3-1
3-2
5-1
5-2
5-3
5-4
5-5
5-6
5-7
5-8
5-9
5-10
5-11
5-12
5-13
5-14
5-15
5-15A
5-16
5-17
6-1
6-2
SNEC Well Levels
SNEC Facility Decommissioning Person-Rem Estimate
SNEC Facility Low Level Radioactive Waste Projection
SNEC Facility DCGL Values
Initial Classifications of Site Areas
SNEC Procedure Matrix Listing
SNEC Facility Radionuclides of Concern
Survey Design Summary
Typical Investigation Levels (From NUREG 1575)
Summary of SNEC Investigation/Action Levels
Possible Actions Resulting From Data Analysis
Typical Survey Instrumentation Characteristics
Typical Detection Sensitivities
Basic Statistical Comparisons
Initial Survey Results and Conclusions When a Background Reference Area is not Used
Initial Survey Results and Conclusions When a Background Reference Area is Used
Values for a and z
Area Factors (AF) for Open Land Areas
Area Factors for Structural Surfaces
Acceptable Decision Error a as a Function of DCGL
Statistical Tests and Criteria for Their Use
SNEC Radionuclide List
SNEC Facility DCGL Values
I
v
SNEC FACILITY LICENSE TERMINATION PLAN REVISION 2SNEC FACILITY LICENSE TERMINATION PLAN REVI�IOM 2
LIST OF FIGURES
Figure# Title
2-24 Map of the REMP Sampling Locations
2-25 Drawing of SNEC Facility SSGS Basement
2-26 Drawing of SNEC Facility SSGS Basement & Intake Tunnel
2-27 Drawing of SNEC Facility SSGS Boiler Pad
2-28 Drawing of SNEC Facility SSGS Intake Tunnel
2-29 Soil Remediation Near SNEC CV
2-30 SNEC Facility CV
2-31 SNEC CV Anchor Bolt Hole Installation Plan
2-32 SNEC CV Grout and Well Installation Plan
2-33 CV Steel Liner Activation Sample Results
2-34 SNEC Facility Cross Sectional View of SNEC Containment Vessel and SurroundingSubsurface Area
2-35 SNEC Facility Cross Sectional View of SNEC Containment Vessel and SurroundingSubsurface Area
3-1 Photograph of SNEC Facility CV & DSF Buildings
5-1 Site Area Grid Map
5-2 Example of a Data Interpretation Checklist
5-3 Gray Region Diagram
5-4 Containment Vessel Survey (Internal / External Grid)
5-5 Penelec Warehouse - Floor Plan and Exterior Wall Elevations
6-1 Dose Modeling Logic Chart
vii
SNEC FACILITY LICENSE TERMINATION PLAN I REVISION ISNEC FACILITY LICENSE TERMINATION PLAN REVISION I
1.0 GENERAL INFORMATION
1.1 PURPOSE
The Saxton Nuclear Experimental Corporation (SNEC) Facility License Termination Plan (LTP)has been prepared in accordance with the requirements of 10 CFR 50.82, 'Termination ofLicense' (Reference 1-1) and the guidance provided in Regulatory Guide 1.179, "StandardFormat and Content of License Termination Plans for Nuclear Power Reactors" (Reference 1-2).The SNEC Facility License Termination Plan is maintained as a supplement to the SNECFacility Updated Final Safety Analysis Report (USAR) (Reference 1-3) in accordance with 10CFR 50.82(a)(9)(i).
This plan demonstrates that the remainder of the decommissioning activities at the SNECFacility site will be performed in accordance with the regulations in 10 CFR 50.82. Theseactivities will not be inimical to the health and safety, common defense and security of the publicand will not have a significant effect on the quality of the environment.
1.2 HISTORICAL BACKGROUND
The Saxton Nuclear Experimental Corporation (SNEC) facility, is a deactivated pressurizedwater reactor (PWR), which was licensed to operate at 23.5-megawatt thermal (23.5 MWTh). Itis owned by the Saxton Nuclear Experimental Corporation (SNEC) and is supported by GPUNuclear Inc., The SNEC Facility is maintained under a Title 10 Part 50 License and associatedTechnical Specifications. In 1972, the license was amended to possess but not operate theSNEC reactor.
The facility was built from 1960 to 1962 and operated from 1962 to 1972 primarily as a researchand training reactor. After shutdown in 1972, the facility was placed in a condition equivalent toa status later defined by the NRC as SAFSTOR. Since then, it has been maintained in amonitored condition. The fuel was removed from the Containment Vessel (CV) in 1972 andshipped to the Atomic Energy Commission (AEC) (now Department of Energy) facility atSavannah River, SC., who remains as owner of the fuel. As a result, neither SNEC nor GPUNuclear Inc. has any responsibility relative to the spent fuel from the SNEC Facility. In addition,the control rod blades and the superheated steam test loop assemblies were shipped off-site.Following fuel removal, equipment, tanks, and piping located outside the CV were removed.The buildings and structures that supported reactor operations were partially decontaminatedfrom 1972 through 1974.
Additional information on the SNEC Facility history is provided in Chapter 2 of this plan.
1.3 PLAN SUMMARY
This SNEC Facility License Termination Plan describes the process by which decommissioningwill be completed and the SNEC Facility site released for unrestricted use. The plant activitiesdescribed in the SNEC Facility License Termination Plan are consistent with the activities thatalready may be conducted under the approved SNEC Facility Technical Specifications. Asspecified in the accompanying License Amendment application GPU Nuclear Inc. may makechanges or revisions to this plan without U.S. NRC approval provided the proposed changes orrevisions do not:
1-1
SNEC FACILITY LICENSE TERMINATION PLAN I REVISION 2- SNEC FACILITY LICENSE TERMINATION PLAN REVISION 2
a) Involve a change to the Technical Specifications or require NRC approval pursuant to10 CFR 50.59;
b) Violate the criteria of 10 CFR 50.82(a)(6);
c) Reduce the coverage requirements for scan measurements;
d) Increase the derived concentration guideline level (DCGL)' developed to meet therequirements of 10 CFR 20.1402, and related minimum detectable concentrations forboth scan and fixed measurement methods;
e) Use a statistical test other than the Sign test or Wilcoxon Rank Sum test forevaluation of the final status survey;
f Increase the radioactivity level, relative to the applicable derived concentrationguideline level, developed to meet the requirements of 10 CFR 20.1402, at whichinvestigation occurs;
g) Increase the Type I decision error;
h) Decrease an area classification (i.e., impacted to non-impacted; Class 1 to Class 2;Class 2 to Class 3; Class 1 to Class 3)
The following subsections provide a brief summary of the chapters presented in the LicenseTermination Plan.
1.3.1 Summary of Chapter 1 - General Information
This chapter provides the purpose of and regulatory basis for the SNEC Facility LicenseTermination Plan, as well as a brief overview of each chapter contained in the plan.
1.3.2 Summary of Chapter 2 - Site Characterization
In accordance with 10 CFR 50.82(a)(9)(ii)(A), this chapter provides a description of theradiological conditions at the SNEC Facility site. The SNEC Facility site characterizationincorporates the results of scoping and characterization surveys conducted to quantify the extentand nature of contamination at the SNEC Facility. The results of the scoping andcharacterization surveys have been and continue to be used to identify areas of the site that willrequire remediation, as well as to plan remediation methodologies and costs. Characterizationdata has been used to classify areas as to the magnitude of radiological impact for Final StatusSurvey and to guide remediation efforts. General findings are presented and explanation as tothe impact on remediation is given.
1-2
QKI=r' PAr'll 1TV I IrFKI.IqF TFRIVIINATMIS! Pi AN REVISION 1-- . l ITY- I ICFN. TFMN A -----RVISON-
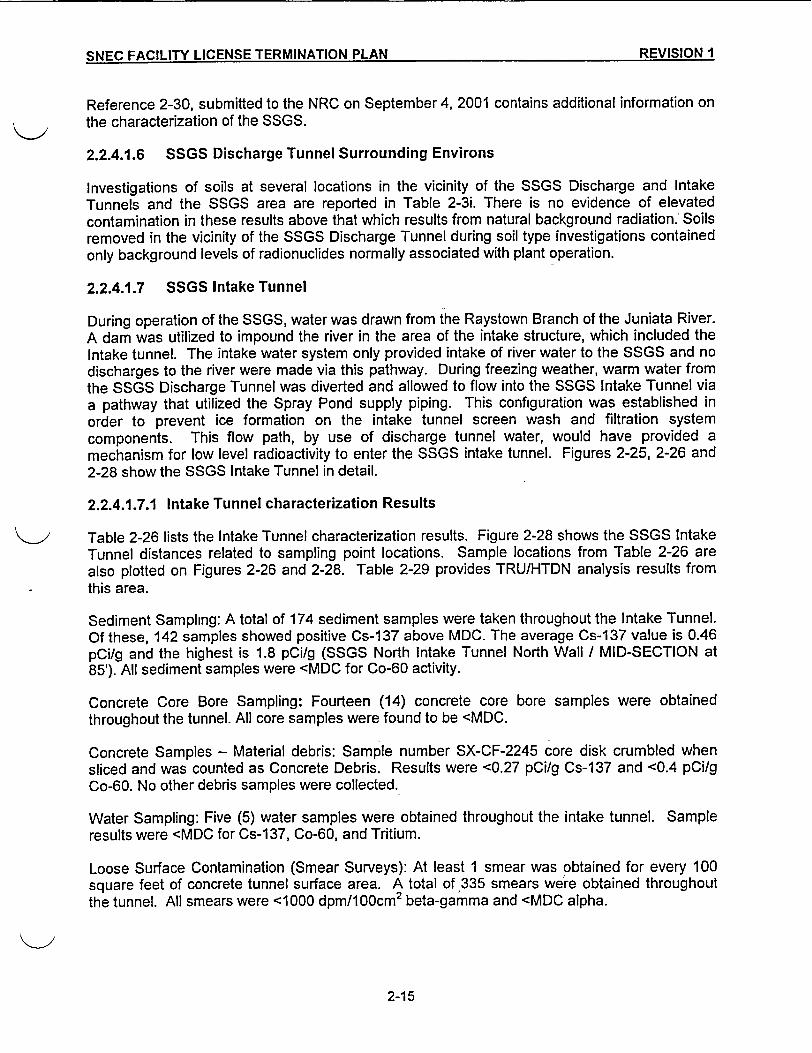
Reference 2-30, submitted to the NRC on September 4, 2001 contains additional information onthe characterization of the SSGS.
2.2.4.1.6 SSGS Discharge Tunnel Surrounding Environs
Investigations of soils at several locations in the vicinity of the SSGS Discharge and IntakeTunnels and the SSGS area are reported in Table 2-3i. There is no evidence of elevatedcontamination in these results above that which results from natural background radiation.' Soilsremoved in the vicinity of the SSGS Discharge Tunnel during soil type investigations containedonly background levels of radionuclides normally associated with plant operation.
2.2.4.1.7 SSGS Intake Tunnel
During operation of the SSGS, water was drawn from the Raystown Branch of the Juniata River.A dam was utilized to impound the river in the area of the intake structure, which included theIntake tunnel. The intake water system only provided intake of river water to the SSGS and nodischarges to the river were made via this pathway. During freezing weather, warm water fromthe SSGS Discharge Tunnel was diverted and allowed to flow into the SSGS Intake Tunnel viaa pathway that utilized the Spray Pond supply piping. This configuration was established inorder to prevent ice formation on the intake tunnel screen wash and filtration systemcomponents. This flow path, by use of discharge tunnel water, would have provided amechanism for low level radioactivity to enter the SSGS intake tunnel. Figures 2-25, 2-26 and2-28 show the SSGS Intake Tunnel in detail.
2.2.4.1.7.1 Intake Tunnel characterization Results
Table 2-26 lists the Intake Tunnel characterization results. Figure 2-28 shows the SSGS IntakeTunnel distances related to sampling point locations. Sample locations from Table 2-26 arealso plotted on Figures 2-26 and 2-28. Table 2-29 provides TRUIHTDN analysis results fromthis area.
Sediment Sampling: A total of 174 sediment samples were taken throughout the Intake Tunnel.Of these, 142 samples showed positive Cs-137 above MDC. The average Cs-137 value is 0.46pCi/g and the highest is 1.8 pCi/g (SSGS North Intake Tunnel North Wall / MID-SECTION at85'). All sediment samples were <MDC for Co-60 activity.
Concrete Core Bore Sampling: Fourteen (14) concrete core bore samples were obtainedthroughout the tunnel. All core samples were found to be <MDC.
Concrete Samples - Material debris: Sample number SX-CF-2245 core disk crumbled whensliced and was counted as Concrete Debris. Results were <0.27 pCi/g Cs-137 and <0.4 pCi/gCo-60. No other debris samples were collected.
Water Sampling: Five (5) water samples were obtained throughout the intake tunnel. Sampleresults were <MDC for Cs-1 37, Co-60, and Tritium.
Loose Surface Contamination (Smear Surveys): At least 1 smear was obtained for every 100square feet of concrete tunnel surface area. A total of 335 smears were obtained throughoutthe tunnel. All smears were <1000 dpm/1Ocm2 beta-gamma and <MDC alpha.
2-15
SNEC FACILITY LICENSE TERMINATION PLAN REVISION 2
Surface Scans Using an E-140N with a HP-210/260 Probe: Locations of survey scanmeasurements were obtained for each 10 feet of tunnel length. Approximately 1 square foot ofsurface area was surveyed at each location. All Surface Scan survey results were <100 NCPM.
Static Measurements Using a Bicron Micro-Rem: Dose rates were obtained throughout thetunnel approximately every 10 feet at 3 feet from the floor. Dose rates were 2-4 uR/hrthroughout the intake tunnel.
Reference 2-31, submitted to the NRC on January 11, 2002 contains additional information onthe characterization of the SSGS intake tunnel.
The intake tunnel from the river intake to the second clean-out (-440') is classified as non-impacted. The balance of the intake tunnel floors and walls are classified as a class 2 areawhile the ceiling is a class 3. The trash rack and intake screen areas are classified as non-impacted. Chapter 5.0 and Table 5-2 provide more information on the intake tunnelclassification.
2.2.4.1.8 Systems
Only those systems that will remain following remediation and fall under the Final Status Surveyprogram were characterized. This precluded characterization of such systems as the CVventilation system, piping that penetrates the CV into the service tunnel, and temporary systemsinstalled to support decommissioning such as compressed air, electrical power, rigging fixtures,etc. All of these systems will be removed prior to the Final Status Survey and are not includedin its scope.
One system that was characterized, as it will remain and be included in the Final Status Survey,is the complex site storm drain system. This system collects surface water and building drainsfrom structures in the Penelec property and directs it to the Raystown Branch of the JuniataRiver.
The Saxton Steam Generating Station (SSGS) was demolished along with segments of itssupporting yard drainage systems over twenty five (25) years ago. However, several sectionsof underground drainage piping still exist in the South and West sides of the SSGS in-groundstructure. These piping systems continue to channel rain water and site run-off away from thesite.
Drainage systems surrounding the SNEC CV area have largely been removed as a result of theexcavation of contaminated soils in the vicinity of the SNEC CV, including the Weir systempiping to the Juniata River in its entirety. In addition, a septic system drain field has beenexcavated on the South side of the Penelec Warehouse.
2.2.4.1.8.1 Yard Drains - Initial Inspection Results
An inspection and sampling of remaining segments of SSGS Yard System Drainage piping hasbeen performed in two (2) phases. The initial phase involved an effort to investigate andunderstand the various interconnections that exist between piping segments within the larger100 acre Penelec site area and the enclosed -10 acre inner area that surrounds the former coalfired SSGS footprint and existing SNEC Facility structures.
2-16
SqNFC FACILITY LICENSE TERMINATION PLAN REVISION 1SNEC FACILITY LICENSE TERMINATION PLAN REVISION I
Robotics and video camera equipment was used to probe and examine existing pipingsegments and establish their interconnections. The investigation phase also located accesspoints and established existing water flow patterns from these systems. Because water flowsaway from the site (toward the Juniata River), it was decided that a thorough investigation andsampling of remaining underground piping systems should be performed to rule out thepossibility elevated levels of radionuclide contamination having been introduced into theenvirons through these systems.
The Shoup Run Shunt Line is a 600 foot long 42 inch diameter line that was originally used tochannel water from Shoup Run to below the SSGS dam on the Juniata River thus bypassing theSSGS Intake Tunnel. All of the remaining SSGS area drainage lines on the south and westsides of the SSGS area connect at different points along the Shoup Run Shunt Line.
At the South edge of the SSGS Boiler Pad, a pipe section was discovered and unearthed thatappears to have been a storm drain line originating at the old SSGS Facility. This line continuesSouth toward the Penelec Warehouse where it connects with the grated yard drain opening bythis structure. This pipe section then continues further South past the Warehouse into the openfield beyond the -10 acre fenced in Penelec property. It continues South toward Shoup Run andpasses into and out of two (2) access openings. At this point the line is approximately 6 to 8 feetbelow the surface (grade level). At the second of the two access openings, the drain line turnstoward the Southwest and terminates into the Shunt Line.
The small four (4) bay Penelec Garage has four (4) sumps (1 per bay). Each of these sumpsconnect to a common header that passes below the garage floor toward the South and thenconnects to a -12" diameter line that ties directly into the Shunt Line. This 12" line runs parallelwith the South fence that surrounds the -10 acre Penelec property, and is assumed to connectat some point with the line running by the Penelec Warehouse.
About in the middle of the asphalt covered parking area between the Small Garage and theWarehouse, is a second grated drainage collection point that connects with the Shunt Linethrough a subsurface pipe traveling West toward and past the Penelec Garage. From roboticsinspection efforts it appears to travel very close to or beneath the Penelec Garage on its way tothe Shunt Line.
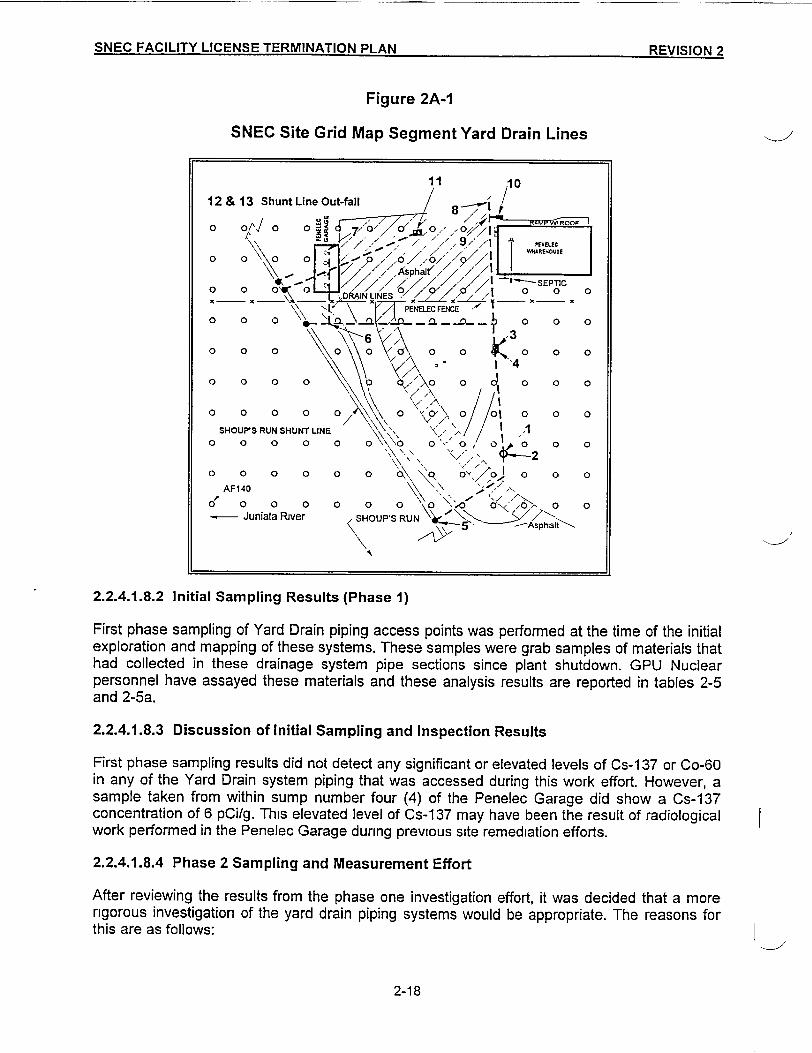
Another connection with the Shunt Line (about 10 feet further northwest and beyond theprevious connection) was discovered during a robotic inspection of the interior of the ShuntLine. This pipe serviced an unknown portion of the SSGS area but it is assumed to have beenanother yard drainage system tie-in that was destroyed during the initial SSGS demolition effort.All the Yard Drain piping sections are depicted in Figure 2A-1.
2-17
SNEC FACILITY LICENSE TERMINATION PLAN RE:VlrISIO 2SNEC FACILITY LICENSE TERMINATION PLAN PP�Jt�IAM �
Figure 2A-1
SNEC Site Grid Map Segment Yard Drain Lines
o O XSHOUPS RUN
2.2.4.1.8.2 Initial Sampling Results (Phase 1)
First phase sampling of Yard Drain piping access points was performed at the time of the initialexploration and mapping of these systems. These samples were grab samples of materials thathad collected in these drainage system pipe sections since plant shutdown. GPU Nuclearpersonnel have assayed these materials and these analysis results are reported in tables 2-5and 2-5a.
2.2.4.1.8.3 Discussion of Initial Sampling and Inspection Results
First phase sampling results did not detect any significant or elevated levels of Cs-137 or Co-60in any of the Yard Drain system piping that was accessed during this work effort. However, asample taken from within sump number four (4) of the Penelec Garage did show a Cs-137concentration of 6 pCi/g. This elevated level of Cs-137 may have been the result of radiologicalwork performed in the Penelec Garage during previous site remediation efforts.
I
2.2.4.1.8.4 Phase 2 Sampling and Measurement Effort
After reviewing the results from the phase one investigation effort, it was decided that a morerigorous investigation of the yard drain piping systems would be appropriate. The reasons forthis are as follows:
2-18

SNEC FACILITY LICENSE TERMINATION PLAN REVISION I
* Grab samples from within an operational drainage system continually collect sediment
and washout materials, i.e., materials that have washed into the systems since the time
of facility demolition. Potentially contaminated materials from the time of site operation
have most likely been lost by washing through the system and are no longer available for
sampling.
* Grab samples alone, without internal measurements can easily miss encrusted or fixed
contamination within a piping system.
* Some sections of drainage piping were not accessed during phase one activities.
* A more rigorous survey approach would be needed to meet Final Status Survey release
criteria.
To satisfy these concerns, a second phase sampling and measurement effort was conducted.
Measurements were made over accessible lengths of pipe and samples were taken from each
piping system. The results were compared with previous sampling results. No further actions
are planned for Final Status Survey since there were no significant findings in these systems.
Characterization results from this phase are summarized in table 2-5b.
2.2.4.1.8.5 Conclusions
During October 2001, in-situ gamma spectroscopy measurements and scale/sediment sampling
was performed as part of a study of radioactive contamination in embedded piping found at the
SNEC site. One hundred and twenty seven (127) spectra were collected in-approximately 10
pipes and drainage areas. Additionally, 39 QANQC spectra were collected, and 29
scale/sediment samples were collected and analyzed in the on-site GPU Nuclear laboratory.
The results show that radioactivity levels are well within site release limits (DCGLs), even using
conservative assumptions regarding calculations of in situ radionuclide concentrations.
Sampling data compare favorably with measurement results.
Phase 2 measurements confirm that the Yard Drain piping system is below the DCGL's for
releasing the site. In addition, measurements of significant sections of this system suggest that
no major source of contamination was released to this system during past site operations. As
such, this piping Will not need to be resurveyed as part of the Final Site Survey. This piping is
located under open land areas already classified as impacted Class 2 or 3 and these areas are
documented in Figure 5-1 of the SNEC LTP.
Because of the history of the site as evidenced by the HSA (Reference 2-14), and the soil
contamination on-site, this system was felt to be Impacted" and was surveyed and sampled.
Robotics was employed for the majority of this work as the small diameter pipes, the confined
spaces and presence of water made manned entry difficult. Figures 2A-1, 2-11 and 2-12 show
the location of these drains. Tables 2-5, 2-5a and 2-5b list the sample results. Chapter 5.0
provides the survey classifications that result from the characterization data.
References 2-31 and 2-38 contain information regarding characterization of embedded and yard
drain piping.
2-19
br=_c. r1MILI I T Ll.~I'4~C I CKMINA I HUN PLAN REVISION 22.2.4.2 Soil
In addition to the CV, contaminated soil in and around the SNEC Facility site will requireremediation. As described in Section 2.2.1, the SNEC Soil Remediation Project, completed in1994, removed contaminated soil front the site in an effort to reduce Cs-137 levels to <1pCi/gaverage. While this project achieved its goal, contaminated soil near the CV and thesurrounding support tunnel could not be removed until these structures were removed.Additionally, soil conditions and pervasive ground water near the surface prevented anassessment of soil contamination below about three feet deep in these areas.
Shonka Research Associates, Inc. performed a radiological scan survey in late November andearly December 2001 at the Saxton site (Reference 2-37). This survey constituted the firstphase of a two-phase effort to perform a Final Status Survey (FSS) for SNEC. The survey wasperformed using sodium iodide Nal(TI) scintillation spectrometers. Approximately 7 hectares(15 acres) of open land area was surveyed with 100% coverage The average concentrationsite-wide of '37Cs was 0.3 +/- 0.15 pCi/g (1 standard deviation).
In order to survey the areas not covered by the 1994 soil project and to investigate potentiallyimpacted areas identified by the HSA (Reference 2-14) a major surface and subsurface soilsampling program was completed in 1999. In addition to random points, biased samplelocations were selected based on the HSA and previous survey results. Cs-137 was the onlynuclide attributed to licensed operations, which was detected. The surface sample results arereported in Table 2-14, while the sample locations are shown on Figures 2-13 and 2-14. Theinformation has been used in concert with historical information to classify the survey units asdescribed in Chapter 5.0. The data has resulted in some areas off the SNEC Facility site butwithin the surrounding Penelec property being classified as impacted.
In addition to the 55 surface sample locations, 42 subsurface sample locations were sampled.These were generally biased samples located in areas where below grade tanks, piping, ducts,spills, and or structures were once present. The results of subsurface sampling are presentedin Table 2-15. Subsurface sample locations are shown on Figures 2-15 and 2-16. As acompliment to the subsurface sampling, gamma bore logging was performed at these samelocations. The use of two different techniques allows for the differentiation of possible soilcontamination at a location from the presence of buried radioactive components. The results ofthe gamma bore logging are presented in Table 2-16. Subsurface gamma bore logginglocations are shown on Figures 2-15 and 2-16. Results of the subsurface sampling and gammalogging indicate the need to remediate soil to a depth at least ten (10) feet deep on the northside of the CV. This has been completed. The gamma bore logging results show that someradioactive components were present at this depth in this location (holes #10, 11 & 13), thesehave been removed. Gamma bore logging will not be used as a stand alone technique forcharacterization or Final Status Survey but rather as a compliment to sampling.
The CV Pipe Tunnel concrete structure has largely been removed, allowing characterization ofthe soil beneath it. The top of the tunnel started at grade elevation (-81 1'-6") and endedapproximately ten (10) feet below grade. The walls, ceiling and floor of the CV Pipe Tunnel were8 to 14 inches thick in most areas.
The interior tunnel surface was contaminated from leaks in piping within the tunnel area duringfacility operation. Additionally, there are a number of contaminated pipe penetrations that extendthrough the CV steel shell wall and entered into the CV Pipe Tunnel. Many of thesepenetrations, which were initially cut and capped, leaked over the years since plant shutdown.These leaks resulted in contaminated water penetrating the seam between the CV Tunnel floorand wall sections, and at other structural defect areas within the CV Tunnel, which causedcontamination in soils at select locations below and adjacent to the CV Tunnel floor.
Based on the difficulty of surveying this contaminated and water filled structure, it wasdetermined that removal of the CV Tunnel would be necessary. As a result of this decision, themajority of the CV Tunnel has now been removed. Only a small section of the CV Tunnel
2-20
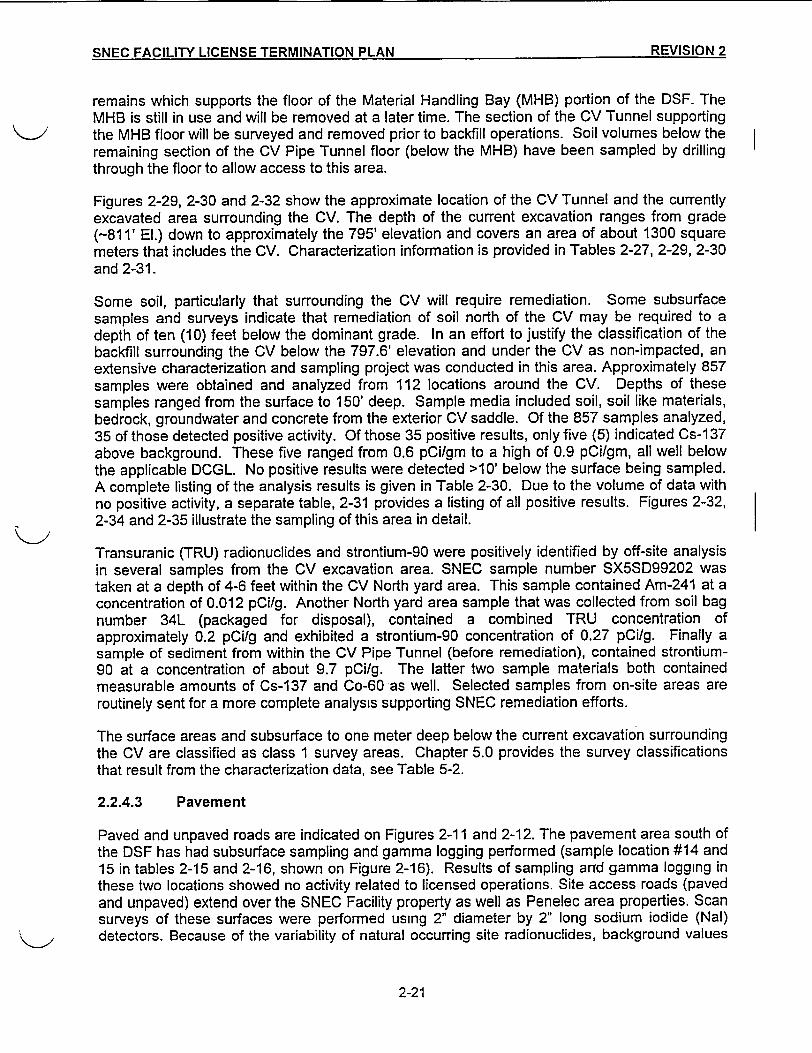
SNEC FACILITY LICENSE TERMINATION PLAN REVISION 2SNCFCLT IESETRIAINPA REVISION 2 -e--. -.-e ---.. -vww
remains which supports the floor of the Material Handling Bay (MHB) portion of the DSF. TheMHB is still in use and will be removed at a later time. The section of the CV Tunnel supportingthe MHB floor will be surveyed and removed prior to backfill operations. Soil volumes below theremaining section of the CV Pipe Tunnel floor (below the MHB) have been sampled by drillingthrough the floor to allow access to this area.
Figures 2-29, 2-30 and 2-32 show the approximate location of the CV Tunnel and the currentlyexcavated area surrounding the CV. The depth of the current excavation ranges from grade(-811' El.) down to approximately the 795' elevation and covers an area of about 1300 squaremeters that includes the CV. Characterization information is provided in Tables 2-27, 2-29, 2-30and 2-31.
Some soil, particularly that surrounding the CV will require remediation. Some subsurfacesamples and surveys indicate that remediation of soil north of the CV may be required to adepth of ten (10) feet below the dominant grade. In an effort to justify the classification of thebackfill surrounding the CV below the 797.6' elevation and under the CV as non-impacted, anextensive characterization and sampling project was conducted in this area. Approximately 857samples were obtained and analyzed from 112 locations around the CV. Depths of thesesamples ranged from the surface to 150' deep. Sample media included soil, soil like materials,bedrock, groundwater and concrete from the exterior CV saddle. Of the 857 samples analyzed,35 of those detected positive activity. Of those 35 positive results, only five (5) indicated Cs-1 37above background. These five ranged from 0.6 pCi/gm to a high of 0.9 pCi/gm, all well belowthe applicable DCGL. No positive results were detected >10' below the surface being sampled.A complete listing of the analysis results is given in Table 2-30. Due to the volume of data withno positive activity, a separate table, 2-31 provides a listing of all positive results. Figures 2-32,2-34 and 2-35 illustrate the sampling of this area in detail.
Transuranic (TRU) radionuclides and strontium-90 were positively identified by off-site analysisin several samples from the CV excavation area. SNEC sample number SX5SD99202 wastaken at a depth of 4-6 feet within the CV North yard area. This sample contained Am-241 at aconcentration of 0.012 pCi/g. Another North yard area sample that was collected from soil bagnumber 34L (packaged for disposal), contained a combined TRU concentration ofapproximately 0.2 pCi/g and exhibited a strontium-90 concentration of 0.27 pCi/g. Finally asample of sediment from within the CV Pipe Tunnel (before remediation), contained strontium-90 at a concentration of about 9.7 pCi/g. The latter two sample materials both containedmeasurable amounts of Cs-137 and Co-60-as well. Selected samples from on-site areas areroutinely sent for a more complete analysis supporting SNEC remediation efforts.
The surface areas and subsurface to one meter deep below the current excavation surroundingthe CV are classified as class 1 survey areas. Chapter 5.0 provides the survey classificationsthat result from the characterization data, see Table 5-2.
2.2.4.3 Pavement
Paved and unpaved roads are indicated on Figures 2-11 and 2-12. The pavement area south ofthe DSF has had subsurface sampling and gamma logging performed (sample location #14 and15 in tables 2-15 and 2-16, shown on Figure 2-16). Results of sampling and gamma logging inthese two locations showed no activity related to licensed operations. Site access roads (pavedand unpaved) extend over the SNEC Facility property as well as Penelec area properties. Scansurveys of these surfaces were performed using 2" diameter by 2" long sodium iodide (Nal)detectors. Because of the variability of natural occurring site radionuclides, background values
2-21
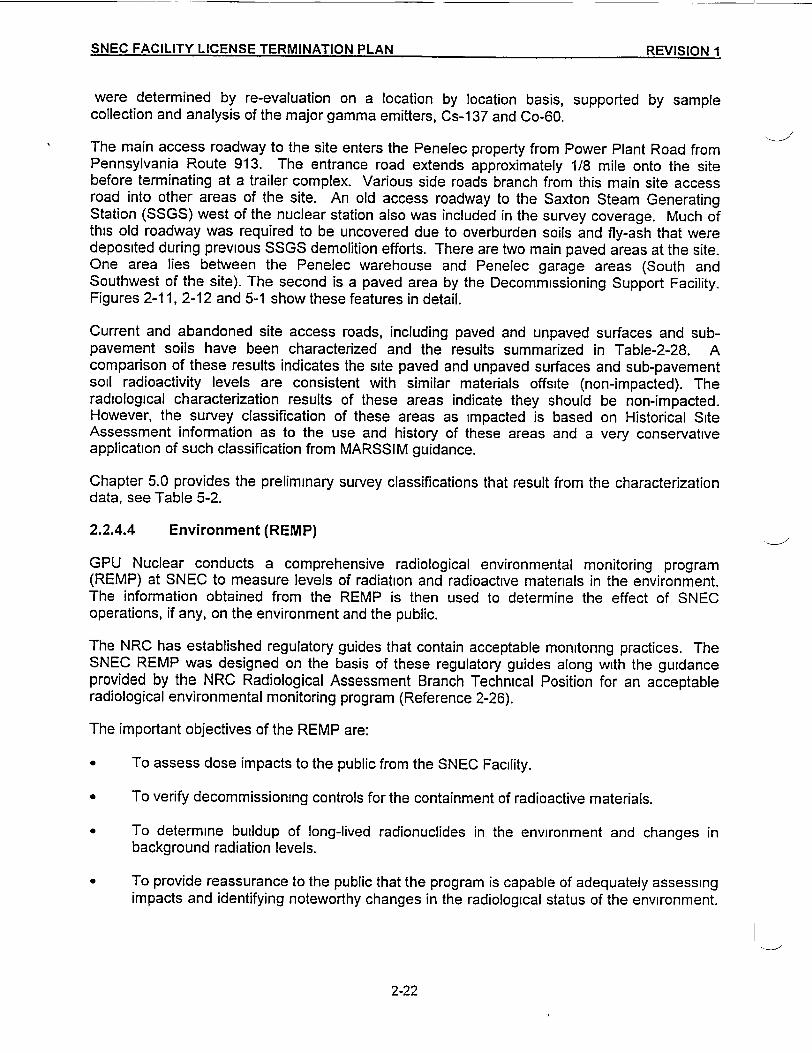
SNEC FACILITY LICENSE TERMINATION PiLAm PFVXIIlrK 1SE FACILITY LC._SE _.__INATIJ __ AN _. ..._ . Ia- v
were determined by re-evaluation on a location by location basis, supported by samplecollection and analysis of the major gamma emitters, Cs-1 37 and Co-60.
The main access roadway to the site enters the Penelec property from Power Plant Road fromPennsylvania Route 913. The entrance road extends approximately 1/8 mile onto the sitebefore terminating at a trailer complex. Various side roads branch from this main site accessroad into other areas of the site. An old access roadway to the Saxton Steam GeneratingStation (SSGS) west of the nuclear station also was included in the survey coverage. Much ofthis old roadway was required to be uncovered due to overburden soils and fly-ash that weredeposited during previous SSGS demolition efforts. There are two main paved areas at the site.One area lies between the Penelec warehouse and Penelec garage areas (South andSouthwest of the site). The second is a paved area by the Decommissioning Support Facility.Figures 2-11, 2-12 and 5-1 show these features in detail.
Current and abandoned site access roads, including paved and unpaved surfaces and sub-pavement soils have been characterized and the results summarized in Table-2-28. Acomparison of these results indicates the site paved and unpaved surfaces and sub-pavementsoil radioactivity levels are consistent with similar materials offsite (non-impacted). Theradiological characterization results of these areas indicate they should be non-impacted.However, the survey classification of these areas as impacted is based on Historical SiteAssessment information as to the use and history of these areas and a very conservativeapplication of such classification from MARSSIM guidance.
Chapter 5.0 provides the preliminary survey classifications that result from the characterizationdata, see Table 5-2.
2.2.4.4 Environment (REMP)
GPU Nuclear conducts a comprehensive radiological environmental monitoring program(REMP) at SNEC to measure levels of radiation and radioactive materials in the environment.The information obtained from the REMP is then used to determine the effect of SNECoperations, if any, on the environment and the public.
The NRC has established regulatory guides that contain acceptable monitoring practices. TheSNEC REMP was designed on the basis of these regulatory guides along with the guidanceprovided by the NRC Radiological Assessment Branch Technical Position for an acceptableradiological environmental monitoring program (Reference 2-26).
The important objectives of the REMP are:
* To assess dose impacts to the public from the SNEC Facility.
* To verify decommissioning controls for the containment of radioactive materials.
* To determine buildup of long-lived radionuclides in the environment and changes inbackground radiation levels.
* To provide reassurance to the public that the program is capable of adequately assessingimpacts and identifying noteworthy changes in the radiological status of the environment.
2-22
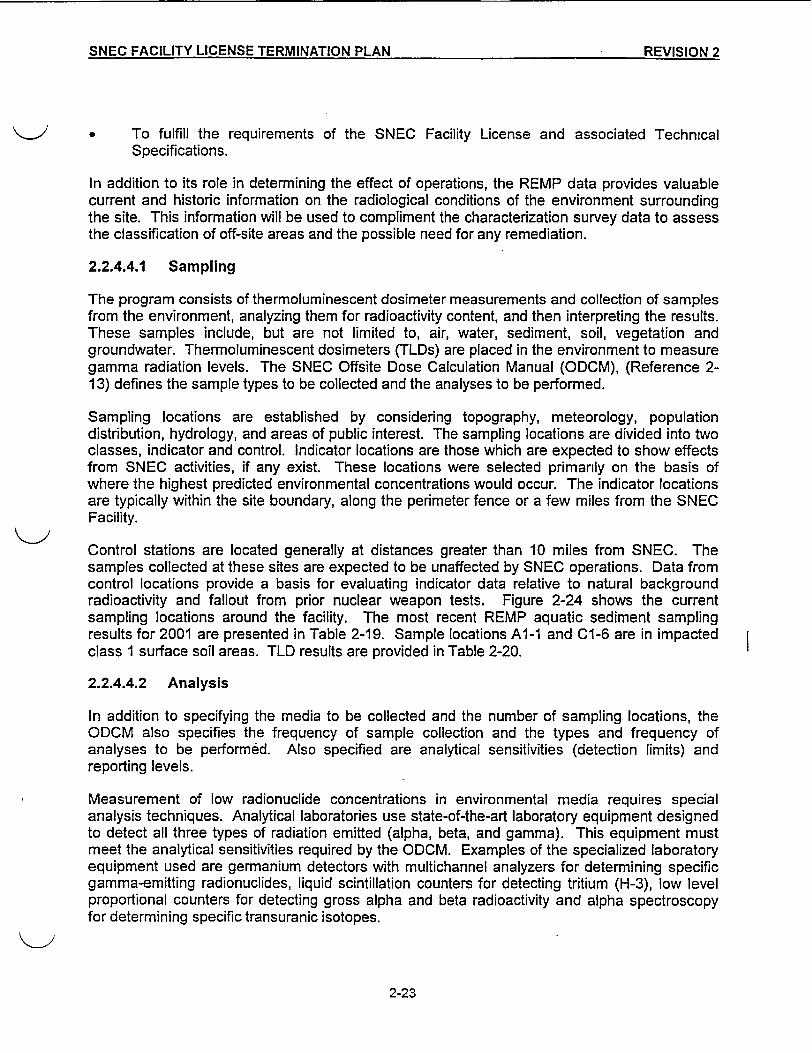
SNEC FACILITY LICENSE TERMINATION PLAN REVISIOnN 9-_SNEC FACILITY LICENSE TERMINATION PLAN RFVl�lflM 9
To fulfill the requirements of the SNEC Facility License and associated TechnicalSpecifications.
In addition to its role in determining the effect of operations, the REMP data provides valuablecurrent and historic information on the radiological conditions of the environment surroundingthe site. This information will be used to compliment the characterization survey data to assessthe classification of off-site areas and the possible need for any remediation.
2.2.4.4.1 Sampling
The program consists of thermoluminescent dosimeter measurements and collection of samplesfrom the environment, analyzing them for radioactivity content, and then interpreting the results.These samples include, but are not limited to, air, water, sediment, soil, vegetation andgroundwater. Thermoluminescent dosimeters (TLDs) are placed in the environment to measuregamma radiation levels. The SNEC Offsite Dose Calculation Manual (ODCM), (Reference 2-13) defines the sample types to be collected and the analyses to be performed.
Sampling locations are established by considering topography, meteorology, populationdistribution, hydrology, and areas of public interest. The sampling locations are divided into twoclasses, indicator and control. Indicator locations are those which are expected to show effectsfrom SNEC activities, if any exist. These locations were selected primarily on the basis ofwhere the highest predicted environmental concentrations would occur. The indicator locationsare typically within the site boundary, along the perimeter fence or a few miles from the SNECFacility.
Control stations are located generally at distances greater than 10 miles from SNEC. Thesamples collected at these sites are expected to be unaffected by SNEC operations. Data fromcontrol locations provide a basis for evaluating indicator data relative to natural backgroundradioactivity and fallout from prior nuclear weapon tests. Figure 2-24 shows the currentsampling locations around the facility. The most recent REMP aquatic sediment samplingresults for 2001 are presented in Table 2-19. Sample locations Al-1 and C1-6 are in impactedclass 1 surface soil areas. TLD results are provided in Table 2-20.
2.2.4.4.2 Analysis
In addition to specifying the media to be collected and the number of sampling locations, theODCM also specifies the frequency of sample collection and the types and frequency ofanalyses to be performed. Also specified are analytical sensitivities (detection limits) andreporting levels.
Measurement of low radionuclide concentrations in environmental media requires specialanalysis techniques. Analytical laboratories use state-of-the-art laboratory equipment designedto detect all three types of radiation emitted (alpha, beta, and gamma). This equipment mustmeet the analytical sensitivities required by the ODCM. Examples of the specialized laboratoryequipment used are germanium detectors with multichannel analyzers for determining specificgamma-emitting radionuclides, liquid scintillation counters for detecting tritium (H-3), low levelproportional counters for detecting gross alpha and beta radioactivity and alpha spectroscopyfor determining specific transuranic isotopes.
2-23
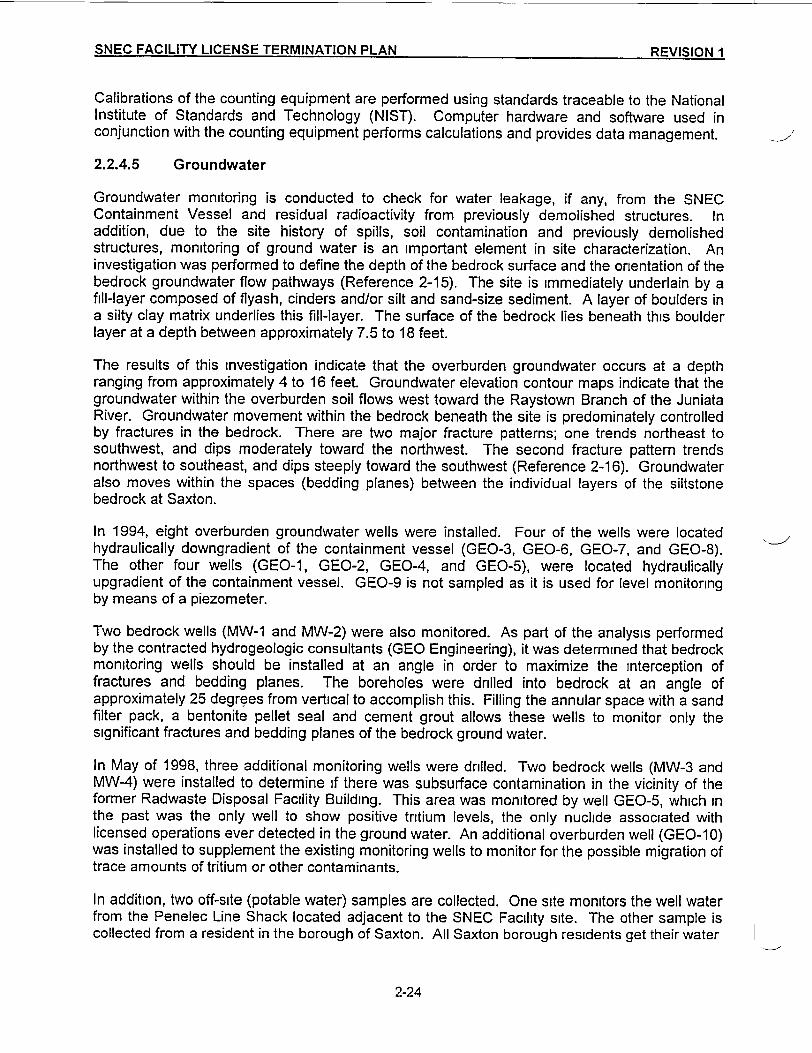
SNEC FACILITY LICENSE TERMINATION PLAN RE~VISION 1SNE FAILT LIES TEMNTO LN Fl§fN
Calibrations of the counting equipment are performed using standards traceable to the NationalInstitute of Standards and Technology (NIST). Computer hardware and software used inconjunction with the counting equipment performs calculations and provides data management.
2.2.4.5 Groundwater
Groundwater monitoring is conducted to check for water leakage, if any, from the SNECContainment Vessel and residual radioactivity from previously demolished structures. Inaddition, due to the site history of spills, soil contamination and previously demolishedstructures, monitoring of ground water is an important element in site characterization. Aninvestigation was performed to define the depth of the bedrock surface and the orientation of thebedrock groundwater flow pathways (Reference 2-15). The site is immediately underlain by afill-layer composed of flyash, cinders and/or silt and sand-size sediment. A layer of boulders ina silty clay matrix underlies this fill-layer. The surface of the bedrock lies beneath this boulderlayer at a depth between approximately 7.5 to 18 feet.
The results of this investigation indicate that the overburden groundwater occurs at a depthranging from approximately 4 to 16 feet. Groundwater elevation contour maps indicate that thegroundwater within the overburden soil flows west toward the Raystown Branch of the JuniataRiver. Groundwater movement within the bedrock beneath the site is predominately controlledby fractures in the bedrock. There are two major fracture patterns; one trends northeast tosouthwest, and dips moderately toward the northwest. The second fracture pattern trendsnorthwest to southeast, and dips steeply toward the southwest (Reference 2-16). Groundwateralso moves within the spaces (bedding planes) between the individual layers of the siltstonebedrock at Saxton.
In 1994, eight overburden groundwater wells were installed. Four of the wells were locatedhydraulically downgradient of the containment vessel (GEO-3, GEO-6, GEO-7, and GEO-8).The other four wells (GEO-1, GEO-2, GEO-4, and GEO-5), were located hydraulicallyupgradient of the containment vessel. GEO-9 is not sampled as it is used for level monitoringby means of a piezometer.
Two bedrock wells (MW-1 and MW-2) were also monitored. As part of the analysis performedby the contracted hydrogeologic consultants (GEO Engineering), it was determined that bedrockmonitoring wells should be installed at an angle in order to maximize the interception offractures and bedding planes. The boreholes were drilled into bedrock at an angle ofapproximately 25 degrees from vertical to accomplish this. Filling the annular space with a sandfilter pack, a bentonite pellet seal and cement grout allows these wells to monitor only thesignificant fractures and bedding planes of the bedrock ground water.
In May of 1998, three additional monitoring wells were drilled. Two bedrock wells (MW-3 andMW-4) were installed to determine if there was subsurface contamination in the vicinity of theformer Radwaste Disposal Facility Building. This area was monitored by well GEO-5, which inthe past was the only well to show positive tritium levels, the only nuclide associated withlicensed operations ever detected in the ground water. An additional overburden well (GEO-10)was installed to supplement the existing monitoring wells to monitor for the possible migration oftrace amounts of tritium or other contaminants.
In addition, two off-site (potable water) samples are collected. One site monitors the well waterfrom the Penelec Line Shack located adjacent to the SNEC Facility site. The other sample iscollected from a resident in the borough of Saxton. All Saxton borough residents get their water
2-24
Colon CAtII 1TV I ICNETERMIN1ATION PiLAM REVISION 2.. REVISION 2
from one of two sources. Putts Hollow reservoir is the primary source, but during low waterlevels, the township switches to the Seton Plant water supply, which draws from the JuniataRiver upstream of the SNEC Facility. Neither of these samples have ever detected anyradioactive contaminates.
Remediation activities have resulted in several monitoring wells being removed from service. InDecember 2000 additional wells were installed to characterize the upgradient and downgradientregions onsite. References 2-35 and 2-36 provide information on these new installations. Inaddition, at the request of the NRC a deep angle well was installed in March 2002 adjacent toand hydraulically downgradient of the CV. This well is intended to monitor for potential groundwater and subsurface contamination originating from the CV or from migration of contaminantsdown through the backfill adjacent to the CV. The location of all wells, both in-service andabandoned is shown on Figures 2-17 and 2-32.
2.2.4.5.1 Groundwater Results
Locations of the onsite groundwater stations sampled are shown in Figures 2-17 and 2-32.Historically the results from the analyses performed on these samples indicated no radioactivecontamination from plant-related radionuclides, other than tritium. Of the 57 groundwatersamples collected in 2001, none showed positive tritium. The results are well below theUSEPA's Primary Drinking Water Standard of 20,000 pCi/L (Reference 2-18). Tritium analysisrequires a minimum sensitivity of 2000 pCi/L. Required sensitivities for Co-60, Cs-1 34, and Cs-137 (gamma emitting radionuclides) are 15 pCi/L. Year 2001 groundwater monitoring results aregiven in Table 2-17a. Year 2002 data requested by the NRC is provided in Table 2-17b.
As stated earlier, GEO-5 originally was the only well to show positive tritium levels. The firstsample obtained from GEO-5 was collected and analyzed July of 1994. A 'Less Than" result fortritium was reported. Gamma analysis performed on this sample yielded "Less Than" activities.The October 1994 sample reported 560 pCi/L tritium. A special collection was performed twoweeks later to confirm the positive tritium and a result of 310 pCi/L was obtained. Gammaanalysis continued to show no reportable activity.
Quarterly and special collections from GEO-5 yielded some positive and some "Less Than"tritium activities. The highest activity of tritium (760 pCi/L) was observed October 1995. Sincethat time, no concentrations above 200 pCiUL were observed. Table 2-18 is a list of all tritiumresults that have been performed since the start of GEO-5 monitoring.
Upon review of these results, it appears that the activity in the GEO-5 area can be attributed topockets of tritiated water trapped in fractures leading to the overburden groundwater. In orderto assess the possibility of other contaminates in this area, GPU Nuclear contracted Haley &Aldrich, Inc. (formally GEO Engineering) to add supplemental monitoring wells in this location(Reference 2-17). These new wells showed infrequent tritium activity slightly above the MDA.The new monitoring wells, like the former wells, yielded "Less Than" activities for gammaanalysis. Table 2-17a lists the tritium results from all the monitoring wells sampled in the year2001. The results indicate that no other contaminants are present in the groundwater.
Based on the ground water monitoring program results, no contamination of ground water, withthe exception of tritium well below the USEPA's Primary Drinking Water Standard of 20,000pCi/L, has been observed over the monitoring period. The transit times for contaminantmovement would indicate that no such contamination will occur as it would have been observedwith or shortly following the positive tritium results.
2-25
SNEC FACILITY LICENSE TERMINATION Pi AN 0=1/lei~nI v�
Recent groundwater testing results (last 12 months) indicate tritium is not present above levelsof measurable detection. In May 2001, additional monitor wells (OW-7 and OW-7R) wereinstalled closer to the Site to increase confidence that tritium was not present in thegroundwater. In addition, monitor wells were installed in the backfill of the discharge tunnel(OP-3 and OP-4). Tables 2-17a, 2-17b and 2-17c provide sample results for the new monitoringwells. Figure 2-17 is updated to show all prior and current monitoring well locations.
In 2001, the NRC requested SNEC analyze groundwater samples for hard to detect nuclidesand transuranics (HTDN/TRU). Nine wells were sampled and analyzed by an off-site laboratoryfor HTDN/TRU. Except for naturally occurring uranium, all results were less than the minimumdetectable activity (<MDA). The results are reported in Table 2-17c.
Special monitoring of ground water was requested by the NRC in early 2002 in order to validatereported data and the conclusions related to potential ground water contamination. In April2002, ten (10) groundwater monitoring wells were sampled under NRC observation. Thesamples were split with the NRC who had the analyzed by Oak Ridge Institute for Science andEducation (ORISE). ORISE analyzed the samples for 1-129, Co-60, Cs-137, Am-241, Pu-238,Pu-239, Pu-241, U-234, U-235, U238, total uranium, Sr-90, C-14 and tritium. The ORISEresults are reported in Reference 2-34. SNEC analyzed the split samples for Cs-137, Cs-134,Co-60, and tritium. SNEC results are reported in Table 2-32 for wells where split samples weretaken. Table 2-17b provides data for the remainder of the wells sampled that day. Review ofthese sets of analysis confirms the conclusion that no radionuclides related to plant operationsare present in the monitored groundwater.
Reference 2-32, submitted to the NRC on January 24, 2002 contains information on the SNECsite hydrogeology, monitoring well placement and sampling results.
Of particular note, as described in Reference 2-32, in 2000 and 2001, slug tests were conductedon several observation wells. Slug tests (falling head tests) were conducted on seven wells toassess the ability of water to move through the subsurface. Tests were conducted on threeoverburden (OW-3, OW-5, and OW-6) and four bedrock wells (OW-3R, OW-4R; OW-5R, OW-7R). The test was conducted by adding water to the well and frequently measuring andrecording decreasing water levels. The water levels were recorded with a hand held water levelprobe. The Bouwer-Rice and the Hvorslov methods were used to analyze the slug test dataand estimate hydraulic conductivity.
The range of hydraulic conductivity for three wells at the overburden/bedrock interface is 15.59m/year to 35.62 m/year. The range of hydraulic conductivity for the four bedrock wells is 15.59m/year to 909.53 m/year. Travel time estimates based on these hydraulic conductivities indicatethat if tritium was released from the facility it has likely reached the Raystown Branch of theJuniata River.
Additionally water levels have been collected monthly or bimonthly basis since January 2001 toevaluate the potential for seasonal groundwater flow directions changes. A spreadsheet withlevel data is attached as Table 2-34. As discussed in Reference 2-32 Haley & Aldrich, Inc.evaluated the individual sets of water level information for Saxton through November 2001.This evaluation included wells installed at the overburden/bedrock interface and bedrock.
Groundwater elevations fluctuate throughout the year, however the groundwater flow patternremains consistent. Groundwater elevations were reviewed and groundwater elevationcontours were generated for the 2001 monitoring events. This includes the high water period in
2-26
SNEC FACILITY LICENSE TERMINATION PLAN REVISION 2SNE FAILT LIES EMNTO LNRVSO
April 2001 and during the low water period in November 2001. Contouring indicates that theflow pattern is consistent and similar to past groundwater contours. For example, at theupgradient OW-3 series wells the water level elevations have fluctuated 8.30 and 7.00 feet inOW-3 and OW-3R, respectively. Similarly, the groundwater elevations have fluctuated 4.75 and4.90 feet at the OW-5 series wells situated downgradient of the site and near the river.
A comparison of groundwater and surface water level trends indicates they behave similarly.When higher and lower groundwater elevations occur at the site, they also occur in the surfacewater (the Raystown Branch of the Juniata River).
2.2.4.6 Surface Water
The Juniata River surface water is monitored for radionuclides of potential SNEC Facility origin.Two grab samples, one control and one indicator, are collected on a quarterly basis andanalyzed for gamma emitting radionuclides and tritium. The indicator sample was collected atthe discharge bulkhead leading into the river, while the control sample was collected upstreamof the discharge. No tritium or other radionuclides attributed to SNEC operations were detectedabove the minimum detectable concentration (MDC).
2.2.4.7 River Sediment Characterization
The Raystown Branch of the Juniata River meanders from its headwaters near Deeters Gap inSomerset County through rural Bedford County. From Deeters Gap, the river runs an easterlycourse through the Town of Bedford, Pennsylvania. After Bedford, the river takes anortheasterly course to Saxton, Pennsylvania where the river begins to form Raystown Lake.The river upstream of Raystown Lake is characterized by slow pools and interrupted by fastshallow riffles.
The Saxton Steam Generating Station (SSGS) Dam, located adjacent to the SSGS, wasconstructed to impound water for the SSGS. Although this dam was breached after shutdownof the SSGS in 1974, it was in place during the operational period of the Saxton NuclearExperimental Corporation (SNEC) Facility. The SSGS Dam was a 780 feet long concretegravity dam on the Raystown Branch, about 700 feet downstream from the mouth of ShoupRun. Backwater from the SSGS Dam extended 1.5 miles upstream according to one historicalreport. However, based on a crest elevation of approximately of 794.00, it is possible that the
2-26a
QKIIC FACIL ITY ICENSE-q TERMINATION PLAN REVISION 2IA- . II IT I ICFN5- TFMNA -l PLA REVIION
Intentionally left blank.
2-26b
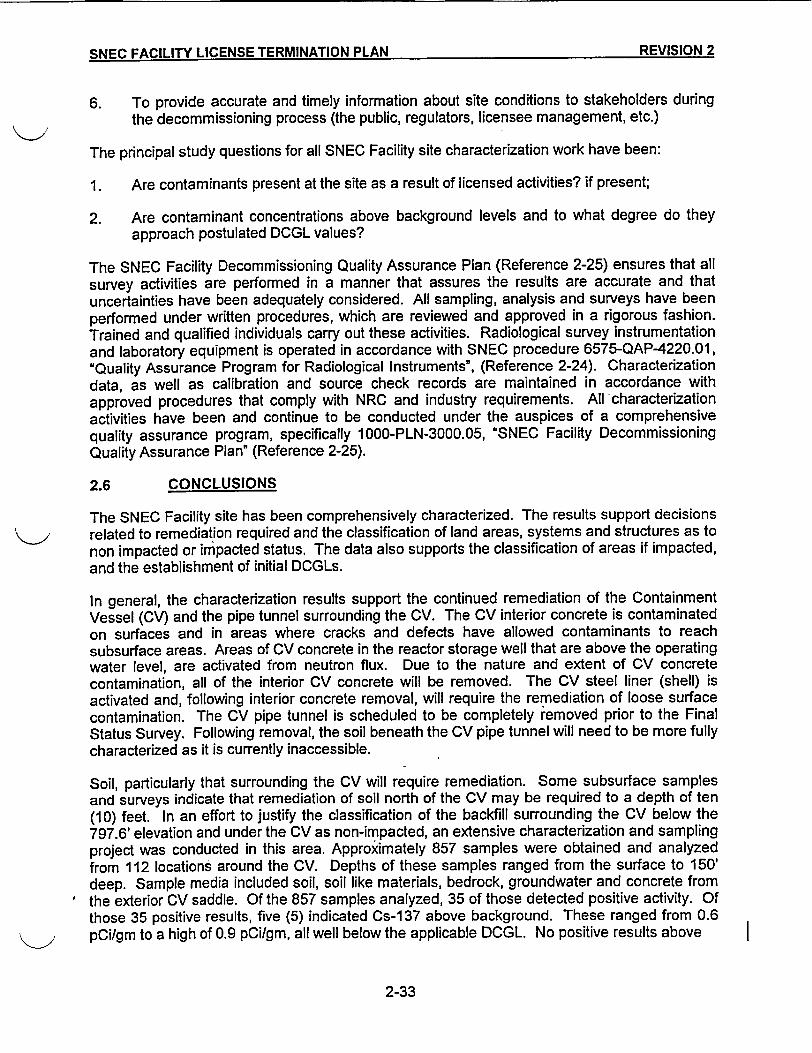
CK5* - Crt.. 1T I FMI-.m iA REVISION 2lagM&_E J-l_- rr I I( ._ .F-M ' .- -FMIAT-lJ1-WREISO 2 -
6. To provide accurate and timely information about site conditions to stakeholders duringthe decommissioning process (the public, regulators, licensee management, etc.)
The principal study questions for all SNEC Facility site characterization work have been:
1. Are contaminants present at the site as a result of licensed activities? if present;
2. Are contaminant concentrations above background levels and to what degree do theyapproach postulated DCGL values?
The SNEC Facility Decommissioning Quality Assurance Plan (Reference 2-25) ensures that allsurvey activities are performed in a manner that assures the results are accurate and thatuncertainties have been adequately considered. All sampling, analysis and surveys have beenperformed under written procedures, which are reviewed and approved in a rigorous fashion.Trained and qualified individuals carry out these activities. Radiological survey instrumentationand laboratory equipment is operated in accordance with SNEC procedure 6575-QAP-4220.01,"Quality Assurance Program for Radiological Instruments", (Reference 2-24). Characterizationdata, as well as calibration and source check records are maintained in accordance withapproved procedures that comply with NRC and industry requirements. All characterizationactivities have been and continue to be conducted under the auspices of a comprehensivequality assurance program, specifically 1000-PLN-3000.05, "SNEC Facility DecommissioningQuality Assurance Plan" (Reference 2-25).
2.6 CONCLUSIONS
The SNEC Facility site has been comprehensively characterized. The results support decisionsrelated to remediation required and the classification of land areas, systems and structures as tonon impacted or impacted status. The data also supports the classification of areas if impacted,and the establishment of initial DCGLs.
In general, the characterization results support the continued remediation of the ContainmentVessel (CV) and the pipe tunnel surrounding the CV. The CV interior concrete is contaminatedon surfaces and in areas where cracks and defects have allowed contaminants to reachsubsurface areas. Areas of CV concrete in the reactor storage well that are above the operatingwater level, are activated from neutron flux. Due to the nature and extent of CV concretecontamination, all of the interior CV concrete will be removed. The CV steel liner (shell) isactivated and, following interior concrete removal, will require the remediation of loose surfacecontamination. The CV pipe tunnel is scheduled to be completely removed prior to the FinalStatus Survey. Following removal, the soil beneath the CV pipe tunnel will need to be more fullycharacterized as it is currently inaccessible.
Soil, particularly that surrounding the CV will require remediation. Some subsurface samplesand surveys indicate that remediation of soil north of the CV may be required to a depth of ten(10) feet. In an effort to justify the classification of the backfill surrounding the CV below the797.6' elevation and under the CV as non-impacted, an extensive characterization and samplingproject was conducted in this area. Approximately 857 samples were obtained and analyzedfrom 112 locations around the CV. Depths of these samples ranged from the surface to 150'deep. Sample media included soil, soil like materials, bedrock, groundwater and concrete fromthe exterior CV saddle. Of the 857 samples analyzed, 35 of those detected positive activity. Ofthose 35 positive results, five (5) indicated Cs-137 above background. These ranged from 0.6pCi/gm to a high of 0.9 pCi/gm, all well below the applicable DCGL. No positive results above
2-33
';NFC FACILITY LICENSE TERMINATION PLAN REVISION 2SNEC F__._._.__xACILITY....... LN
background were detected >10' below the surface. A complete listing of the analysis results isgiven in Table 2-30. Due to the volume of data with no positive activity, a separate table, 2-31provides a listing of all positive results. These characterization results justify the classification ofthese areas as listed in Chapter 5.0. See Figures 2-32, 2-34 and 2-35.
Some soil sample results offsite but on surrounding Penelec property indicate the area hasbeen impacted by SNEC Facility operations. These areas will be classified as "impacted" andincluded in the Final Status Survey. Initial characterization data indicates that remediation ofthese areas may not be required.
The Saxton Steam Generating Station (SSGS) discharge tunnel is contaminated as a result ofroutine radioactive liquid effluent discharges from the SNEC Facility. Characterization of thisstructure indicates that extensive remediation will not be needed to meet final release criteria.However, several piping sections required removal as they were significantly above theapplicable DCGL.
The SSGS intake tunnel has been characterized and is minimally impacted by SNEC Facilityoperations. Remediation is not required to meet the proposed DCGLs however the SSGSintake tunnel will be included in the Final Status Survey.
The SSGS footprint including the turbine room, firing aisle and boiler pads has beencharacterized and these areas are impacted by SNEC Facility operations. These areas will beincluded in the Final Status Survey.
The Decommissioning Support Facility (DSF) is in use at this time to support decommissioningand contains radioactive material that precludes characterization sufficient to determine ifremediation will be required to meet final release criteria. In addition, the final disposition of thisbuilding has not been determined; i.e. will the building be removed prior to the Final StatusSurvey. If the structure remains it will be included in the Final Status Survey.
Other buildings, structures and systems offsite but on the surrounding Penelec property(excepting the SSGS discharge tunnel described above) will likely not require remediation tomeet final release criteria. However, they have been impacted by the operation of the SNECFacility and will be included in the Final Status Survey process. This includes the Penelecgarage (Figure 2-19), the Penelec warehouse (Figure 2-20) and the Penelec 'line shack"(Figure 2-21). The Penelec garage and warehouse are scheduled to be demolished prior toperformance of the Final Status Survey. If they remain they will be included in the survey.
The REMP data and characterization of offsite environmental areas indicate that remediation ofoffsite areas including effluent release pathways will not be required. The liquid effluentdischarge point (Weir) to the Raystown Branch of the Juniata River has been impacted bySNEC Facility operations and will be included in the Final Status Survey.
Due to the use of mixed oxide (MOX) fuel at the SNEC Facility and the history of failed fuel,special emphasis has been placed on the detection of so called hard to detect nuclides andtransuranic isotopes (HTDN/TRU) during characterization. Over 200 samples were analyzed for
2-34
SNEC FACILITY LICENSE TERMINATION PLAN E FREVISION I
HTDN and or TRU. These results are used to determine the appropriate nuclide ratios/mix forthe appropriate surrogate DCGL and to plan remediation activities. The extensive analysisperformed for HTDN/TRU has enabled SNEC to focus on those nuclides present as a result oflicensed operations as discussed in section 6.2.2.3. Table 2-29 provides the results ofHTDN/TRU analysis performed to date and is provided as requested by the NRC.
Supplemental characterization information has been submitted to the NRC under separatecover in References 2-30, 2-31 and 2-32.
2.7 REFERENCES
2-1 Code of Federal Regulations, Title 10 Part 50.82, "Application for Termination of License"
2-2 USNRC Regulatory Guide 1.179, "Standard Format and Content of License TerminationPlans for nuclear Power Reactors," January 1999
2-3 GPU Nuclear, "1994 Saxton Soil Remediation Project Report"
2-4 SNEC procedure No. 6575-PLN-5420.06, "SNEC Site Characterization Plan"
2-5 Station Work Instructions:
2-5.1 SWI-94-001, "Remove Core Bore Samples from Saxton Containment Vessel Bldg.Structures", Rev 2
2-5.2 SWI-94-002, "Bulk Sample Collection from SNEC Site Facilities in Preparation forOffsite Analysis"
2-5.3 SWI-94-003, "System Sampling at SNEC Facilities"
2-5.4 SWI-99-065, "Collecting Samples of Scabbled Concrete in the SNEC CV
2-5.5 SWI-99-068, "Characterization of the Remaining On-Site Structures"
2-5.6 SWI-99-069, "Saxton Coal Fired Steam Plant Discharge Tunnel Area"
2-5.7 SWI-99-070, "SNEC Site Sub-surface Soil Gamma Logging and Sampling"
2-5.8 SWI-99-071, "Saxton Out-falls and Other Remote Areas"
2-6 "SNEC Facility Site Characterization Report", May 1996
2-7 NUREG-1575, "Multi-Agency Radiation Survey, and Site investigation Manual(MARSSIM)," Revision 1 August 2001
2-8 SNEC Report, "Decommissioned Status of the SNEC Reactor Facility", February 20,1975
2-9 NUREG/CR-2082, "Monitoring for Compliance with Decommissioning Termination SurveyCriteria"
2-35
-
SNEC FACILITY LICENSE TERMINATION PLAN REVISION 2SNEC FACILITY LICENSE TERMINATION PLAN REVISION 2
2-10 "Saxton Nuclear Power Plant Final Release Survey of Reactor Support Buildings", GPUNuclear Corporation report, Revision 3, March 1992
2-11 "Confirmatory Radiological Survey for Portions of the Saxton Nuclear ExperimentalFacility, Saxton, Pa.", June 1991, Oak Ridge Associated Universities
2-12 USNRC Regulatory Guide 1.86, "Termination of Operating Licenses for Nuclearreactors," June 1974
2-13 "SNEC Facility Offsite Dose Calculation Manual", "E900-PLN-4542.08"
2-14 GPU Nuclear Report, 'SNEC Facility Historical Site Assessment", March 2000
2-15 GEO Engineering 'Phase I Report of Findings - Groundwater Investigation." November18, 1992
2-16 GEO Engineering 'Summary of Field Work." June 7, 1994
2-17 Haley and Aldrich 'Summary of Field Work." July 24, 1998
2-18 United States Environmental Protection Agency, Primary Drinking Water Standard,40CFR141.
2-19 CoPhysics Corp. report, "Review of the Final Release Survey of the Reactor SupportBuildings at the Saxton Nuclear Experimental Facility", 12/14/99
2-20 Minutes of the February 2, 1987 SNEC briefing to NRC Region 1
2-21 Deleted
2-22 RESRAD, Version 5.82, United States Department of Energy and Argonne NationalLaboratory, April 1998
2-23 NUREG/CR-5849, "Manual for Conducting Radiological Surveys in support of LicenseTermination', draft of June 1992
2-24 SNEC procedure E900-QAP-4220.01, "Quality Assurance Program for RadiologicalInstruments"
2-25 GPU Nuclear Plan, 1000-PLN-3000.05, "SNEC Facility Decommissioning QualityAssurance Plan"
2-26 United States Nuclear Regulatory Commission Branch Technical Position, "AnAcceptable Radiological Environmental Monitoring Program", Revision 1, November 1979
2-27 June 1988 "In-situ Survey General Public Utilities Facility and Surrounding Area",conducted by EG&G Energy Measurements for the DOE/NRC, report number DOEIONS-8806 dated September 1990
2-36
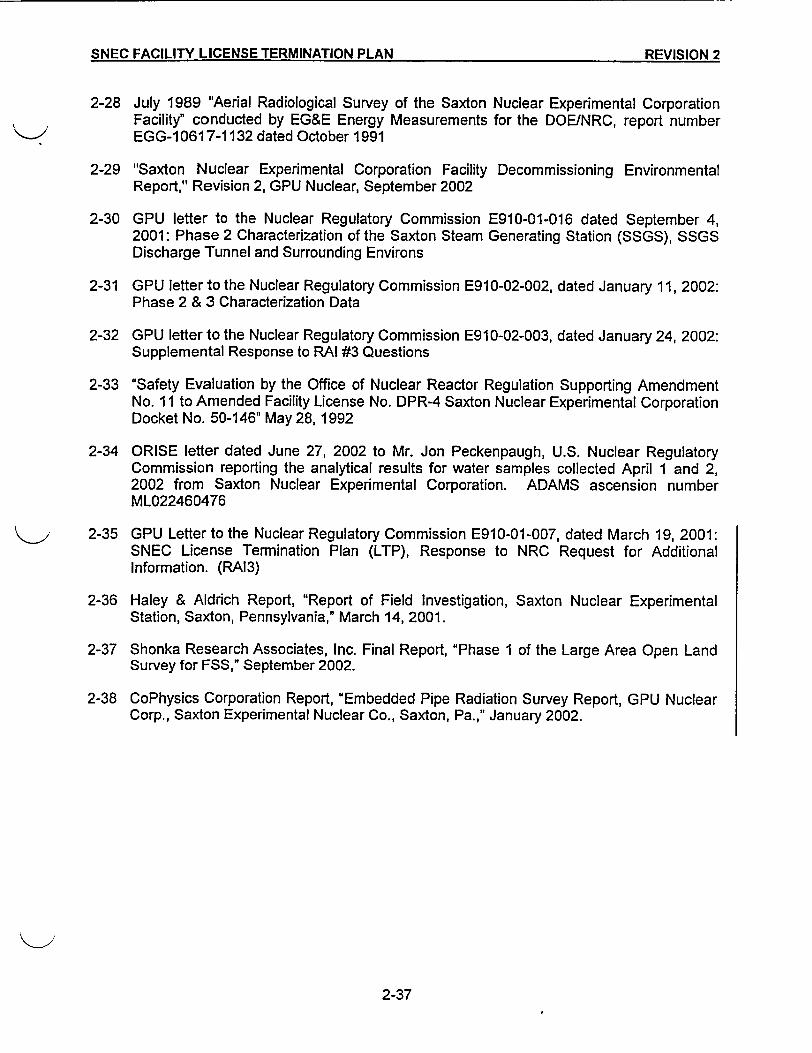
SNEC FACILITY LICENSE TERMINATION PLAN REVISIONh 2.M_, ... ^ .SNEC FACILITY LICENSE TERMINATION PLAN RFVI�IflM �
2-28 July 1989 "Aerial Radiological Survey of the Saxton Nuclear Experimental CorporationFacility" conducted by EG&E Energy Measurements for the DOE/NRC, report numberEGG-10617-1132 dated October 1991
2-29 "Saxton Nuclear Experimental Corporation Facility Decommissioning EnvironmentalReport," Revision 2, GPU Nuclear, September 2002
2-30 GPU letter to the Nuclear Regulatory Commission E910-01-016 dated September 4,2001: Phase 2 Characterization of the Saxton Steam Generating Station (SSGS), SSGSDischarge Tunnel and Surrounding Environs
2-31 GPU letter to the Nuclear Regulatory Commission E910-02-002, dated January 11, 2002:Phase 2 & 3 Characterization Data
2-32 GPU letter to the Nuclear Regulatory Commission E910-02-003, dated January 24, 2002:Supplemental Response to RAI #3 Questions
2-33 "Safety Evaluation by the Office of Nuclear Reactor Regulation Supporting AmendmentNo. 11 to Amended Facility License No. DPR-4 Saxton Nuclear Experimental CorporationDocket No. 50-146" May 28, 1992
2-34 ORISE letter dated June 27, 2002 to Mr. Jon Peckenpaugh, U.S. Nuclear RegulatoryCommission reporting the analytical results for water samples collected April 1 and 2,2002 from Saxton Nuclear Experimental Corporation. ADAMS ascension numberML022460476
2-35 GPU Letter to the Nuclear Regulatory Commission E910-01-007, dated March 19, 2001:SNEC License Termination Plan (LTP), Response to NRC Request for AdditionalInformation. (RAI3)
2-36 Haley & Aldrich Report, "Report of Field Investigation, Saxton Nuclear ExperimentalStation, Saxton, Pennsylvania," March 14, 2001.
2-37 Shonka Research Associates, Inc. Final Report, "Phase 1 of the Large Area Open LandSurvey for FSS," September 2002.
2-38 CoPhysics Corporation Report, "Embedded Pipe Radiation Survey Report, GPU NuclearCorp., Saxton Experimental Nuclear Co., Saxton, Pa.," January 2002.
2-37
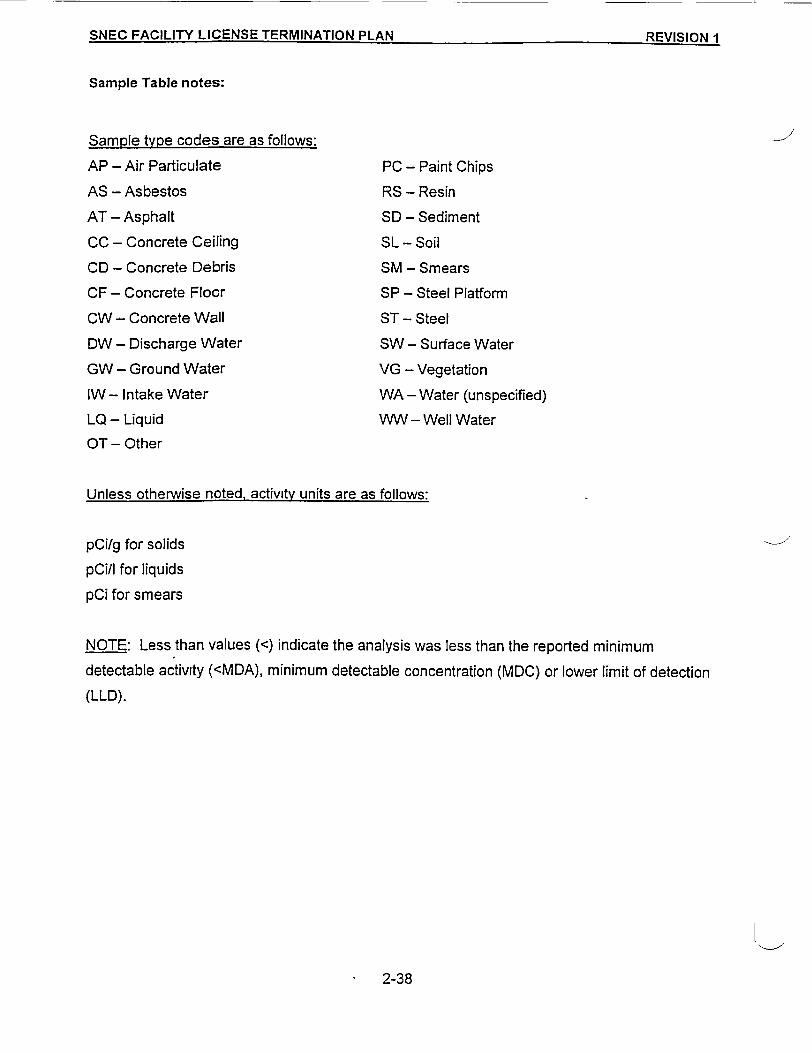
SNEC FACILITY LICENSE TERMINATION PLAN PEVI-ql'1N 1_NC FACILITY LICENSE TERMINATION PLAN _.._.__. - .
Sample Table notes:
Sample type codes are as follows:
AP - Air Particulate
AS - Asbestos
AT - Asphalt
CC - Concrete Ceiling
CD - Concrete Debris
CF - Concrete Floor
CW- Concrete Wall
DW - Discharge Water
GW - Ground Water
IW- Intake Water
LQ - Liquid
OT - Other
-- /
PC - Paint Chips
RS - Resin
SD - Sediment
SL - Soil
SM - Smears
SP - Steel Platform
ST - Steel
SW - Surface Water
VG - Vegetation
WA - Water (unspecified)
WW - Well Water
Unless otherwise noted, activity units are as follows:
pCi/g for solids
pCi/I for liquids
pCi for smears
NOTE: Less than values (<) indicate the analysis was less than the reported minimum
detectable activity (<MDA), minimum detectable concentration (MDC) or lower limit of detection
(LLD).
2-38
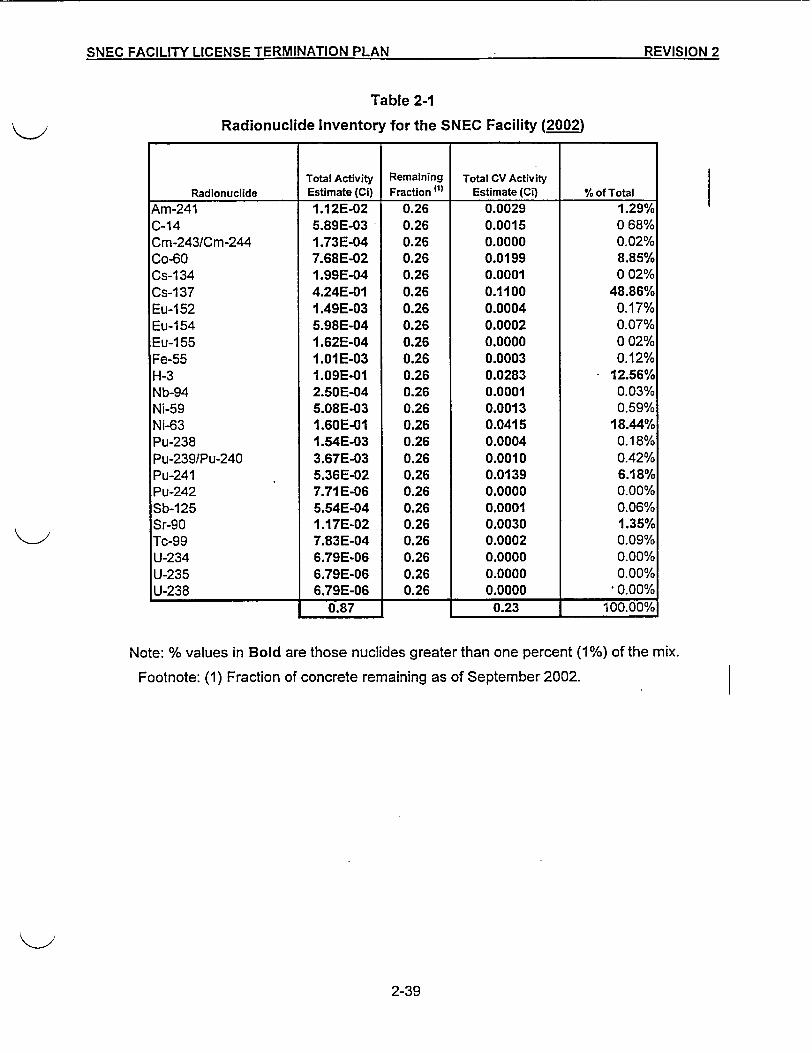
SNEC FACILITY LICENSE TERMINATION PLAN REVISIOnN 2---------- -SNE FAILT LIES TEMNTO PLA _EIl _
Table 2-1
Radionuclide Inventory for the SNEC Facility (2002)
Total Activity Remaining Total CV ActivityRadionuclide Estimate (Ci) Fraction { Estimate (Ci) % of Total
Am-241 1.12E-02 0.26 0.0029 1.29%C-14 5.89E-03 0.26 0.0015 0 68%Cm-243/Cm-244 1.73E-04 0.26 0.0000 0.02%Co-60 7.68E-02 0.26 0.0199 8.85%Cs-134 1.99E-04 0.26 0.0001 0 02%Cs-1 37 4.24E-01 0.26 0.1100 48.86%Eu-152 1.49E-03 0.26 0.0004 0.17%Eu-1 54 5.98E-04 0.26 0.0002 0.07%Eu-1 55 1.62E-04 0.26 0.0000 0 02%Fe-55 1.01E-03 0.26 0.0003 0.12%H-3 1.09E-01 0.26 0.0283 12.56%Nb-94 2.50E-04 0.26 0.0001 0.03%Ni-59 5.08E-03 0.26 0.0013 0.59%Ni-63 1.60E-01 0.26 0.0415 18.44%Pu-238 1.54E-03 0.26 0.0004 0.18%Pu-2391Pu-240 3.67E-03 0.26 0.0010 0.42%Pu-241 5.36E-02 0.26 0.0139 6.18%Pu-242 7.71 E-06 0.26 0.0000 0.00%Sb-125 5.54E-04 0.26 0.0001 0.06%Sr-90 1.17E-02 0.26 0.0030 1.35%Tc-99 7.83E-04 0.26 0.0002 0.09%U-234 6.79E-06 0.26 0.0000 0.00%U-235 6.79E-06 0.26 0.0000 0.00%U-238 6.79E-06 0.26 0.0000 0.00%
1 0.87 1 0.23 1 UU.UU00
Note: % values in Bold are those nuclides greater than one percent (1%) of the mix.
Footnote: (1) Fraction of concrete remaining as of September 2002.
2-39
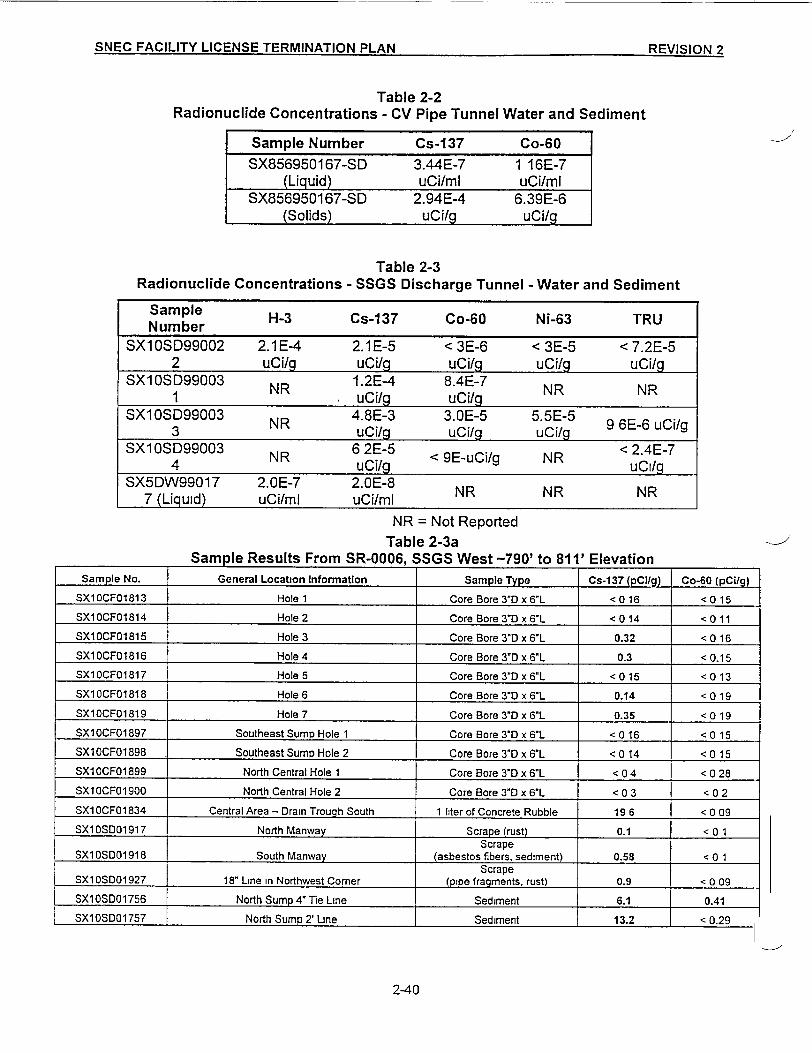
SNEC FACILITY LICENSE TERMINATION PLAN REVISIO0N 2SNEC FACILITY LICENSE TERMINATION PLAN REVISIflNJ9
Table 2-2Radionuclide Concentrations - CV Pipe Tunnel Water and Sediment
Sample Number Cs-137 Co-60SX856950167-SD 3.44E-7 1 16E-7
(Liquid) uCi/ml uCi/mlSX856950167-SD 2.94E-4 6.39E-6
(Solids) uCi/g uCi/g
I
Table 2-3Radionuclide Concentrations - SSGS Discharge Tunnel - Water and Sediment
Sample H-3 Cs-137 Co-60 Ni-63 TRUNumber
SX10SD99002 2.1E-4 2.1E-5 < 3E-6 < 3E-5 < 7.2E-52 uCi/g uCi/q uCi/g uCi/g uCi/g
SX1OSD99003 NR 1.2E-4 8.4E-7 NR NR1 ucilg Ucilg
SX10SD99003 NR 4.8E-3 3.OE-5 5.5E-5 9 6E-6 uCi/g3 uCilg uCi/g uCilg
SX10SD99003 NR 6 2E-5 < 9E uCi/g NR < 2.4E-74 Uci/g <9-~ RUcil/g
SX5DW99017 2.0E-7 2.0E-8 NR NR NR7 (Liquid) uCi/mI uCi/mI
NR = Not ReportedTable 2-3a
Sample Results From SR-0006, SSGS West -790' to 811' ElevationSample No. General Location Information Sample Type Cs-137 (pC!ig) Co-60 (pCilg)
SX1OCF01813 Hole 1 Core Bore 3"D x 6L < 0 16 < 0 15SX10CF01814 Hole 2 Core Bore 3"D x 6TL < 0 14 <0 11SX1OCF01815 Hole 3 Core Bore 3"D x 6L 0.32 <0 16SX10CF01816 Hole 4 Core Bore 3"D x 6L 0.3 < 0.15SX10CF01817 Hole 5 Core Bore 3"D x 6L < 0 15 < 0 13SX1OCF01818 Hole 6 Core Bore 3'D x 6L 0.14 < 0 19SX10CF01819 Hole 7 Core Bore 3'D x 6L 0.35 < 0 19SX1OCF01897 Southeast Sump Hole 1 Core Bore 3-D x 6L < 0 16 < 0 15SX10CF01898 Southeast Sump Hole 2 Core Bore 3"D x 6L < 0 14 < 0 15SX1 OCF01899 North Central Hole 1 Core Bore 3D x 6L < 0 4 < 0 28SX1OCF01900 North Central Hole 2 Core Bore 3"D x 6"L < 0 3 < 0 2SX1OCF01834 Central Area - Drain Trough South 1 liter of Concrete Rubble 19 6 < 0 09SX10SDO1917 North Manway Scrape (rust) 0.1 < 0 1
ScrapeSX10SDO1918 South Manway (asbestos fibers, sediment) 0.58 < 0 1
ScrapeSX10SDO1927 18" Line in Northwest Corner (pipe fragments, rust) 0.9 < 0 09SX1OSDO1756 North Sump 4'Tie Line Sediment 6.1 0.41SX10SD01757 North Sump 2' Line j Sediment 13.2 < 0.29
2-40
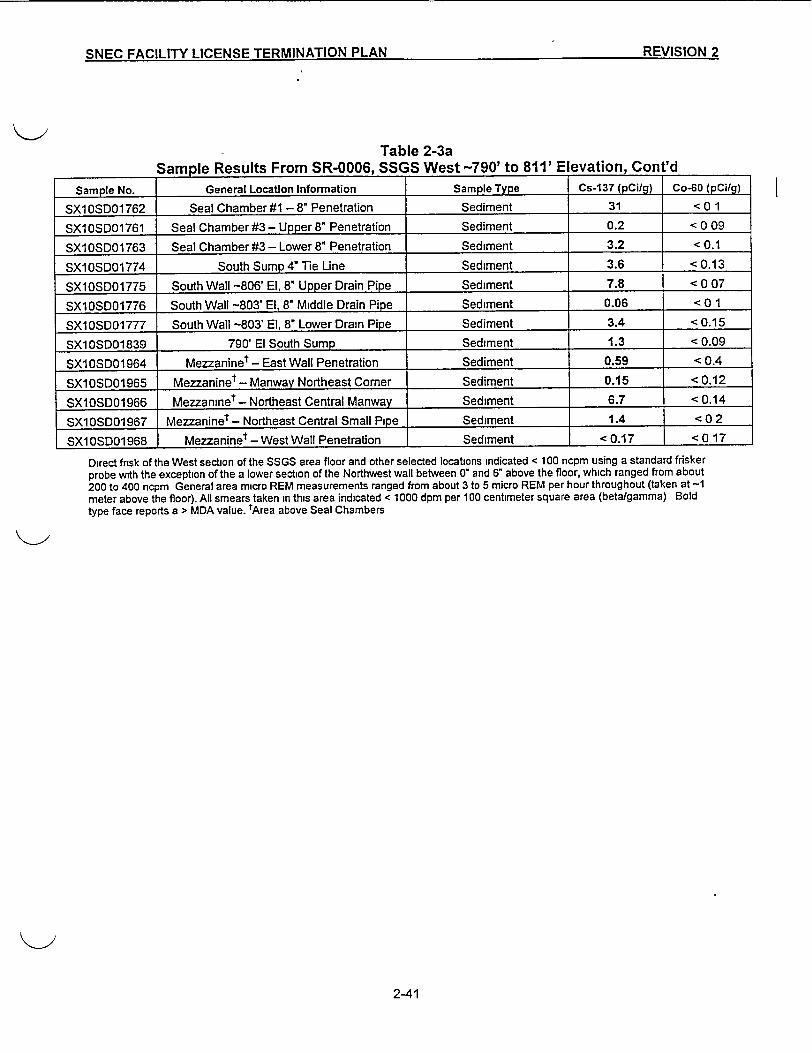
CKICI Cr:'1rVIT I InF-=-rF T=ORMIATrIfON PILAM REVIS;ION 9.J IN-- P I I I I .- , S-S. * _ _. .
Table 2-3aSample Results From SR-0006, SSGS West -790' to 811' Elevation, Cont'd
Sample No. General Location Information Sample Type Cs-137 (pCi/g) Co-60 (pCilg)
SX10SD01762 Seal Chamber #1 - 8" Penetration Sediment 31 < 0 1
SX10SDO1761 Seal Chamber #3 - Upper 8" Penetration Sediment 0.2 < 0 09
SX10SDO1763 Seal Chamber #3 - Lower 8" Penetration Sediment 3.2 < 0.1
SX10SD01774 South Sump 4" Tie Line Sediment 3.6 < 0.13
SX10SD01775 South Wall -806' El, 8" Upper Drain Pipe Sediment 7.8 < 0 07
SX10SD01776 South Wall -803' El, 8" Middle Drain Pipe Sediment 0.06 < 0 1
SX10SDO1777 South Wall -803' El, 8" Lower Drain Pipe Sediment 3.4 < 0.15
SX1 OSDO1 839 790' El South Sump Sediment 1.3 < 0.09
SX1 05D01964 Mezzaninet - East Wall Penetration Sediment 0.59 < 0.4
SX10SD01965 Mezzaninet - Manway Northeast Comer Sediment 0.15 < 0.12
SX10SD01966 Mezzaninet- Northeast Central Manwav Sediment 6.7 < 0.14
SX10SD01967 Mezzaninet -Northeast Central Small Pipe Sediment 1.4 < 0 2
SX10SD01968 Mezzaninet -West Wall Penetration Sediment < 0.17 <0 17
Direct frisk of the West section of the SSGS area floor and other selected locations indicated < 100 ncpm using a standard friskerprobe with the exception of the a lower section of the Northwest wall between 0" and 6" above the floor, which ranged from about200 to 400 ncpm General area micro REM measurements ranged from about 3 to 5 micro REM per hour throughout (taken at -1meter above the floor). All smears taken in this area indicated < 1000 dpm per 100 centimeter square area (beta/gamma) Boldtype face reports a > MDA value. tArea above Seal Chambers
2-41
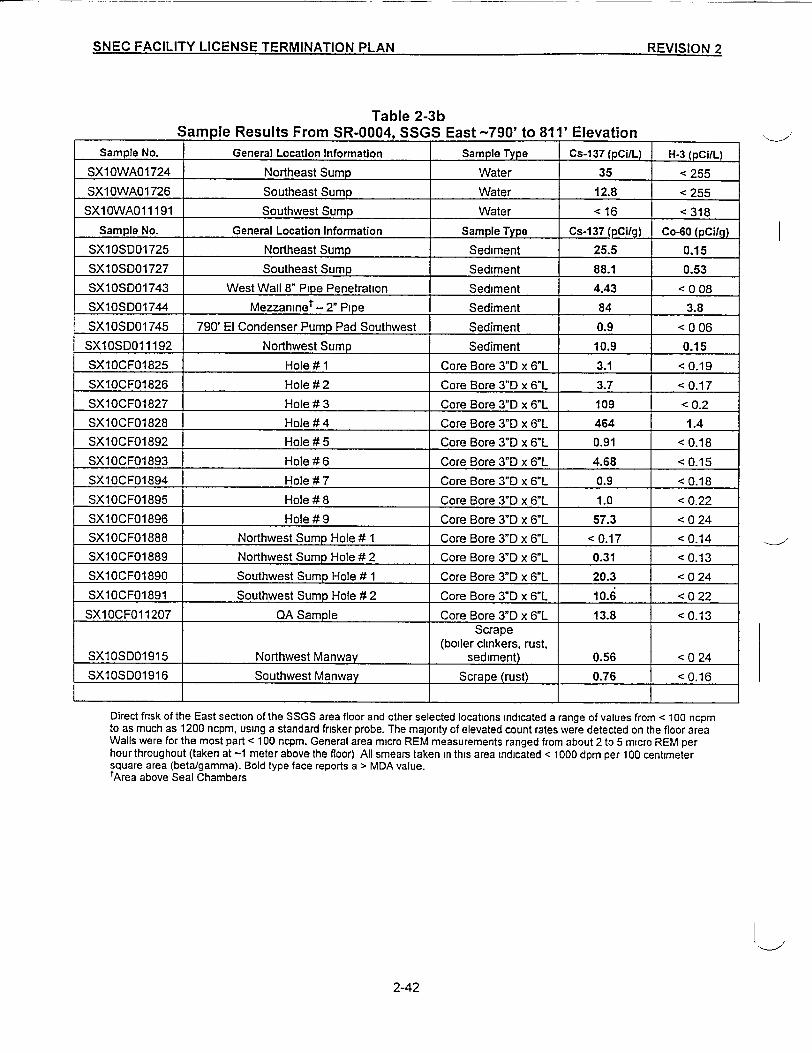
SNEC FACILITY LICENSE TERMINATION PLAN REVISION 2SNE FAILTY ICESETERINTIO PLN EVIIO 2 .
Table 2-3bSample Results From SR-0004, SSGS East -790' to 811' Elevation
Sample No. General Location Information Sample Type Cs-137 (pCi/L) H-3 (pCiIL)
SX10WA01724 Northeast Sump Water 35 < 255SX10WA01726 Southeast Sump Water 12.8 < 255SX1OWA011191 Southwest Sump Water < 16 < 318
Sample No. General Location Information Sample Type Cs-137 (pCi/g) Co-60 (pCilg)SX10SD01725 Northeast Sump Sediment 25.5 0.15SX10SD01727 Southeast Sump Sediment 88.1 0.53SX10SD01743 West Wall 8- Pipe Penetration Sediment 4.43 < 0 08SX10SD01744 Mezzaninet-2" Pipe Sediment 84 3.8SX10SD01745 790' El Condenser Pump Pad Southwest Sediment 0.9 < 0 06
SX10SD011192 Northwest Sump Sediment 10.9 0.1 5SX10CF01825 Hole # 1 Core Bore 3"D x 6"L 3.1 < 0.19SX10CF01826 Hole # 2 Core Bore 3"D x 6"L 3.7 < 0.17SX10CF01827 Hole # 3 Core Bore 3"D x 6"L 109 < 0.2SX10CF01828 Hole # 4 Core Bore 3"D x 6"L 464 1.4SX10CF01892 Hole # 5 Core Bore 3nD x 6"L 0.91 < 0.18SX10CF01893 Hole # 6 Core Bore 3"D x 6"L 4.68 < 0.15SX10CF01894 Hole # 7 Core Bore 3"D x 6"L 0.9 < 0.18SX10CF01895 Hole # 8 Core Bore 3"D x 6"L 1.0 < 0.22SXIOCF01896 Hole # 9 Core Bore 3"D x 6"L 57.3 < 0 24SX1OCF01888 Northwest Sump Hole # 1 Core Bore 3nD x 6"L < 0.17 < 0.14SX10CF01889 Northwest Sump Hole # 2 Core Bore 3nD x 6"L 0.31 < 0.13SX10CF01890 Southwest Sump Hole # 1 Core Bore 3WD x 6"L 20.3 < 0 24SX10CF01891 Southwest Sump Hole # 2 Core Bore 3nD x 6'L 10.6 < 0 22
SX1OCF011207 QA Sample Core Bore 3"D x 6"L 13.8 < 0.13Scrape
(boiler clinkers, rust,SX10SD01915 Northwest Manway sediment) 0.56 < 0 24SX10SDO1916 Southwest Manway Scrape (rust) 0.76 < 0.16
Direct frisk of the East section of the SSGS area floor and other selected locations indicated a range of values from < 100 ncpmto as much as 1200 ncpm, using a standard frisker probe. The majority of elevated count rates were detected on the floor areaWalls were for the most part < 100 ncpm. General area micro REM measurements ranged from about 2 to 5 micro REM perhour throughout (taken at -1 meter above the floor) All smears taken in this area indicated < 1000 dpm per 100 centimetersquare area (beta/gamma). Bold type face reports a > MDA value.tArea above Seal Chambers
2-42
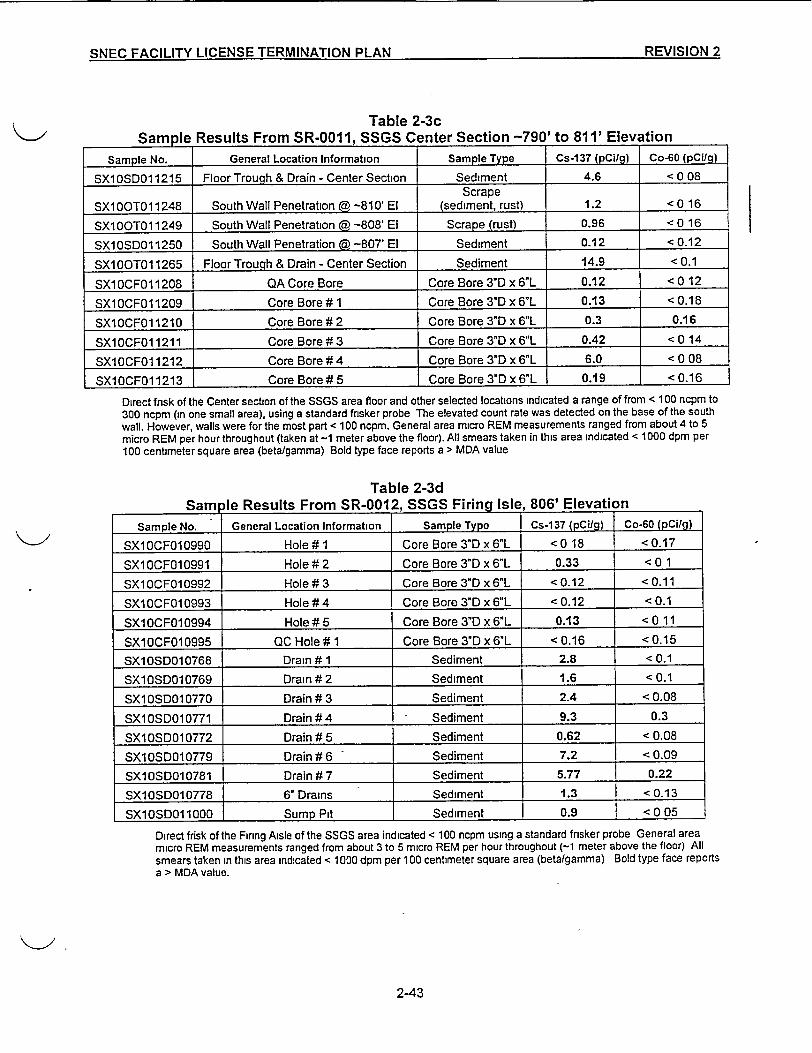
QKIrFr E:Ae'11 ITV ICES TFRRMINATlnM 1PLAN REVISIOiN 2
Table 2-3cSample Results From SR-0011, SSGS Center Section -790' to 811' Elevation
Sample No. General Location Information Sample Type Cs-137 (pCi/g) Co-60 (pCi/g
SX1 OSDO1 1215 Floor Trough & Drain - Center Section Sediment 4.6 < 0 08Scrape
SX100T011248 South Wall Penetration @ -810' El (sediment, rust) 1.2 <0 16
SX100T011249 South Wall Penetration @ -808' El Scrape (rust) 0.96 <0 16
SX10SD011250 South Wall Penetration @ -807' El Sediment 0.12 < 0.12
SX100TO11265 Floor Trough & Drain - Center Section Sediment 14.9 < 0.1
SX1OCF011208 QA Core Bore Core Bore 3'D x 6"L 0.12 < 0 12
SX10CF011209 Core Bore # 1 Core Bore 3'D x 6"L 0.13 < 0.18
SX10CF011210 Core Bore # 2 Core Bore 3"D x 6"L 0.3 0.16
SX1 OCF011211 Core Bore # 3 Core Bore 3"D x 6"L 0.42 < 0 14
SXIOCF011212 Core Bore # 4 Core Bore 3"D x 6'L 6.0 < 0 08
SX1OCF011213 Core Bore# 5 Core Bore 3D x 6"L 0.19 < 0.16
Direct fnsk of the Center section of the SSGS area floor and other selected locations indicated a range of from < 100 ncpm to300 ncpm (in one small area), using a standard frisker probe The elevated count rate was detected on the base of the southwall. However, walls were for the most part < 100 ncpm. General area micro REM measurements ranged from about 4 to 5micro REM per hour throughout (taken at -1 meter above the floor). All smears taken in this area indicated < 1000 dpm per100 centimeter square area (betalgamma) Bold type face reports a > MDA value
Table 2-3dSam le Results From SR-0012, SSGS Firing Isle, 806' Elevation
Sample No. General Location Information Sample Type Cs-137 (pCi/g) Co-60 (pci/g)
SX10CF010990 Hole # 1 Core Bore 3"D x 6"L <0 18 < 0.17
SX1OCF010991 Hole # 2 Core Bore 3"D x 6'L 0.33 < 0 1
SX1 OCF010992 Hole # 3 Core Bore 3"D x 6"L < 0.12 < 0.11
SX10CF010993 Hole # 4 Core Bore 3"D x 6"L < 0.12 < 0.1
SX10CF010994 Hole # 5 Core Bore 3"D x 6"L 0.13 < 0 11
SX10CF010995 QC Hole # 1 Core Bore 3"D x 6IL < 0.16 < 0.15
SX10SDO10768 Drain # 1 Sediment 2.8 < 0.1
SX10SD010769 Drain # 2 Sediment 1.6 < 0.1
SX1OSDO10770 Drain # 3 Sediment 2.4 < 0.08
SX1 0SDO10771 Drain # 4 - Sediment 9.3 0.3
SX10SDO10772 Drain # 5 Sediment 0.62 < 0.08
SX10SD010779 Drain # 6 Sediment 7.2 < 0.09
SX10SD010781 Drain # 7 Sediment 5.77 0.22
SX10SD010778 6" Drains Sediment 1.3 < 0.13
SX10SDO11000 Sump Pit Sediment 0.9 < 0 05
Direct frisk of the Firing Aisle of the SSGS area indicated < 100 ncpm using a standard frisker probe General areamicro REM measurements ranged from about 3 to 5 micro REM per hour throughout (-1 meter above the floor) Allsmears taken in this area indicated < 1000 dpm per 100 centimeter square area (beta/gamma) Bold type face reportsa > MDA value.
2-43
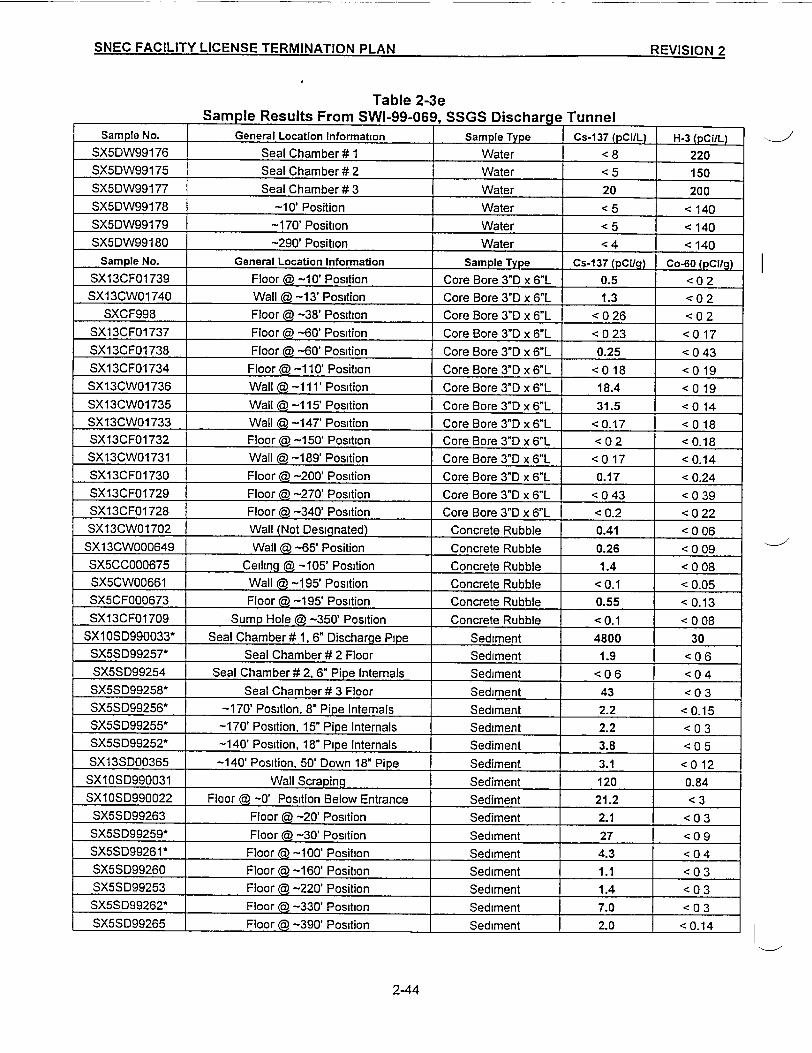
SNEC FACILITY LICENSE TERMINATION PLAN PREVISION 7. =::Z.��
Table 2-3eSample Results From SWI-99-069, SSGS Discharge Tunnel
Sample No. General Location Information Sample Type Cs-137 (pCi/L) H-3 (pC!/L)SX5DW99176 Seal Chamber # 1 Water < 8 220SX5DW99175 Seal Chamber# 2 Water < 5 150SX5DW99177 Seal Chamber # 3 Water 20 200SX5DW99178 -10' Position Water < 5 < 140SX5DW99179 -170' Position Water < 5 < 140SX5DW99180 -290' Position Water < 4 < 140
Sample No. General Location Information Sample Type Cs-137 (pC rg) Co-60 (pCilg)SX13CF01739 Floor @ -10' Position Core Bore 3"D x 6"L 0.5 < 0 2SX13CW01740 Wall @ -13' Position Core Bore 3"D x 6"L 1.3 < 0 2
SXCF998 Floor @ -38' Position Core Bore 3"D x 6"L < 0 26 < 0 2SX13CF01737 Floor @ -60' Position Core Bore 3"D x 6"L < 0 23 <0 17SX13CF01738 Floor @_ -60' Position Core Bore 3"D x 6"L 0.25 < 0 43SX13CF01734 Floor A -110' Position Core Bore 3"D x 6"L < 0 18 < 0 19SX13CW01736 Wall @ -111' Position Core Bore 3"D x 6"L 18.4 < 0 19SX13CW01735 Wall @ -115' Position Core Bore 3"D x 6"L 31.5 < 0 14SX13CW01733 Wall @ -147 Position Core Bore 3"D x 6"L < 0.17 < 0 18SX13CF01732 Floor @ -150' Position Core Bore 3"D x 6"L < 0 2 < 0.18SX13CW01731 Wall @ -189' Position Core Bore 3"D x 6"L <0 17 < 0.14SX13CF01730 Floor @ -200' Position Core Bore 3"D x 6"L 0.17 < 0.24SX13CF01729 Floor @ -270' Position Core Bore 3"D x 6"L < 0 43 < 0 39SX13CF01728 Floor @ -340' Position Core Bore 3"D x 6"L < 0.2 < 0 22SX13CW01702 Wall (Not Designated) Concrete Rubble 0.41 < 0 06SX13CW000649 Wall @ -65' Position Concrete Rubble 0.26 < 0 09SX5CC000675 Ceiling @ -105' Position Concrete Rubble 1.4 < 0 08SX5CW00661 Wall @ -195' Position Concrete Rubble < 0.1 < 0.05SX5CF000673 Floor @ -195' Position Concrete Rubble 0.55 < 0.13SX13CF01709 Sump Hole @ -350' Position Concrete Rubble < 0.1 < 0 08
SX10SD990033* Seal Chamber# 1, 6" Discharge Pipe Sediment 4800 30SX5SD99257* Seal Chamber # 2 Floor Sediment 1.9 < 0 6SX5SD99254 Seal Chamber# 2, 6" Pipe Internals Sediment <0 6 < 0 4SX5SD99258* Seal Chamber # 3 Floor Sediment 43 < 0 3SX5SD99256* -170' Position, 8' Pipe Intemals Sediment 2.2 < 0.15SX5SD99255* -170' Position, 15" Pipe Internals Sediment 2.2 < 0 3SX5SD99252* -140' Position, 18" Pipe Internals Sediment 3.8 < 0 5SX13SD00365 -140' Position, 50' Down 18" Pipe Sediment 3.1 <0 12SX10SD990031 Wall Scraping Sediment 120 0.84SX10SD990022 Floor @ -O' Position Below Entrance Sediment 21.2 <3
SX5SD99263 Floor @ -20' Position Sediment 2.1 < 0 3SX5SD99259* Floor @ -30' Position Sediment 27 < 0 9SX5SD99261* Floor @ -100' Position Sediment 4.3 < 0 4SX5SD99260 Floor @ -160' Position Sediment 1.1 < 0 3SX5SD99253 Floor @ -220' Position Sediment 1.4 < 0 3SX5SD99262* Floor @ -330' Position Sediment 7.0 < 0 3SX5SD99265 Floor @ -390' Position Sediment 2.0 < 0.14
2-44
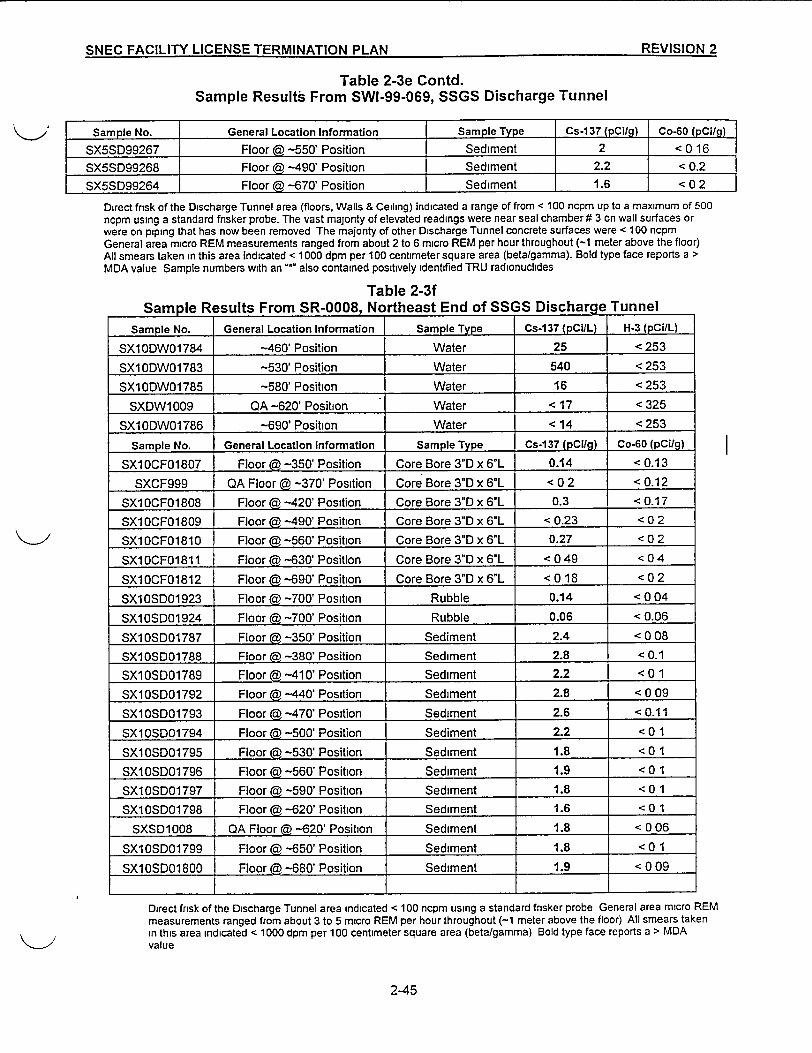
qSlEr FACILITY ICEr.NSE; TPPMINATIC)N PiLAN REVISION 2-�NJIC FACII ITY I IC�ENSF TFRMINATItV�J PH AN REVISION 2
Table 2-3e Contd.Sample Results From SWI-99-069, SSGS Discharge Tunnel
IK>j I Sample No. General Location Information Sample Type I Cs-137 (pCilg) I Co-60 (pCi/g) ISX5SD99267 Floor @ -550' Position Sediment 2 <0 16SX5SD99268 Floor @ -490' Position Sediment 2.2 < 0.2SX5SD99264 Floor @ -670' Position Sediment 1.6 < 0 2
Direct frisk of the Discharge Tunnel area (floors, Walls & Ceiling) indicated a range of from < 100 ncpm up to a maximum of 500ncpm using a standard frisker probe. The vast majonty of elevated readings were near seal chamber# 3 on wall surfaces orwere on piping that has now been removed The majority of other Discharge Tunnel concrete surfaces were < 100 ncpmGeneral area micro REM measurements ranged from about 2 to 6 micro REM per hour throughout (-1 meter above the floor)All smears taken in this area indicated < 1000 dpm per 100 centimeter square area (beta/gamma). Bold type face reports a >MDA value Sample numbers with an- also contained positively identified TRU radionuclides
Table 2-3fSample Results From SR-0008, Northeast End of SSGS Discharge Tunnel
Sample No. General Location Information Sample Type Cs-137 (pCilL) H-3 (pCi/L)
SX10DW01784 -460' Position Water 25 < 253
SX10DW01783 -530' Position Water 540 < 253
SX10DW01785 -580' Position Water 16 < 253
SXDW1 009 QA -620' Position Water < 17 < 325
SX10DWO1786 -690' Position Water < 14 < 253
Sample No. General Location Information Sample Type Cs-137 (pCilg) Co-60 (pCi/g)
SX10CF01807 Floor @ -350' Position Core Bore 3D x 6"L 0.14 < 0.13
SXCF999 QA Floor @ -370' Position Core Bore 3"D x 6L < 0 2 < 0.12
SX10CF01808 Floor @ -420' Position Core Bore 3"D x 6L 0.3 < 0.17SX10CF01809 Floor @ -490' Position Core Bore 3"D x 6-L < 0.23 <0 2
SX10CF01810 Floor @ -560' Position Core Bore 3"D x 6"L 0.27 < 0 2
SX10CF01811 Floor @ -630' Position Core Bore 3"D x 6'L < 0 49 <04
SX10CF01812 Floor @ -690' Position Core Bore 3"D x 61L < 0 18 < 0 2
SX10SD01923 Floor @ -700' Position Rubble 0.14 < 0 04
SX10SDO1924 Floor @ -700' Position Rubble 0.06 < 0.06
SX10SD01787 Floor i -350' Position Sediment 2.4 < 0 08
SX10SDO1788 Floor @ -380' Position Sediment 2.8 < 0.1SX10SD01789 Floor @ -410' Position Sediment 2.2 < 0 1
SX10SDO1792 Floor @ -440' Position Sediment 2.8 < 0 09
SX1OSDO1793 Floor @ -470' Position Sediment 2.6 < 0.11
SX10SD01794 Floor @ -500' Position Sediment 2.2 < 0 1
SX10SD01795 Floor @ -530' Position Sediment 1.8 < 0 1SX10SDO1796 Floor @ -560' Position Sediment 1.9 < 0 1SX10SDO1797 Floor @ -590' Position Sediment 1.8 < 0 1SX10SD01798 Floor @ -620' Position Sediment 1.6 < 0 1
SXSD1008 QA Floor @ -620' Position Sediment 1.8 < 0 06
SX10SD01799 Floor @ -650' Position Sediment 1.8 < 0 1
SXIOSDO1800 Floor @ -680' Position Sediment 1.9 < 0 09
Direct frisk of the Discharge Tunnel area indicated < 100 ncpm using a standard frisker probe General area micro REMmeasurements ranged from about 3 to 5 micro REM per hour throughout (-1 meter above the floor) All smears takenin this area Indicated <1000 dpm per 100 centimeter square area (beta/gamma) Bold type face reports a > MDAvalue
2-45
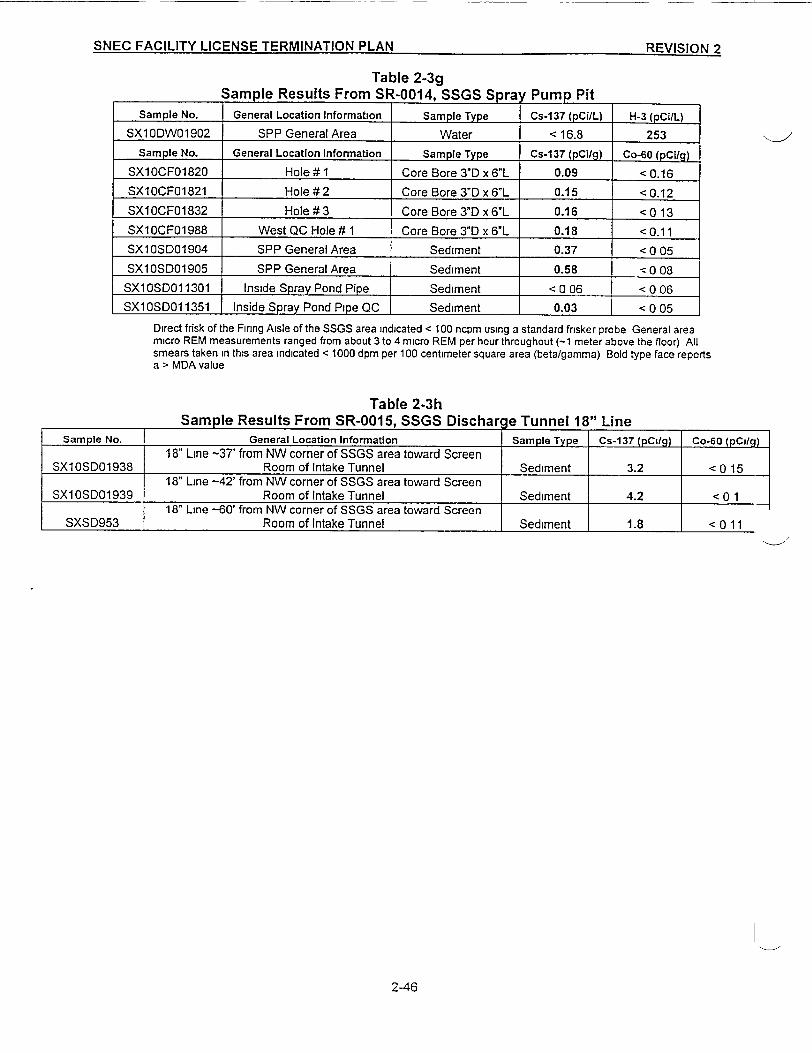
SNEC FACILITY LICENSE TERMINATION PLAN P1FVIz1r1,KN v�
Table 2-3gSample Results From S -0014, SSGS Spra Pump Pit
Sample No. General Location Information Sample Type Cs-137 (pCi/L) H-3 (pCi/L)
SX10DW01902 SPP General Area Water < 16.8 253Sample No. General Location Information Sample Type Cs-137 (pCilg) Co-60 (pCiug)
SX10CF01820 Hole # 1 Core Bore 3"D x 6"L 0.09 < 0.16SX10CF01821 Hole # 2 Core Bore 3"D x 6"L 0.15 < 0.12SX1OCF01832 Hole # 3 Core Bore 3ID x 6"L 0.16 < 0 13SX1 OCF01 988 West QC Hole # 1 Core Bore 3'D x 6"L 0.18 < 0.11SX10SDO1904 SPP General Area Sediment 0.37 < 0 05
SX10SD01905 SPP General Area Sediment 0.58 - 0 08
SX10SDO11301 Inside Spray Pond Pipe Sediment < 0 06 < 0 06
SX10SDO11351 Inside Spray Pond Pipe QC Sediment 0.03 <0 05
Direct frisk of the Firing Aisle of the SSGS area indicated < 100 ncpm using a standard frisker probe General areamicro REM measurements ranged from about 3 to 4 micro REM per hour throughout (-1 meter above the floor) Allsmears taken in this area indicated < 1000 dpm per 100 centimeter square area (beta/gamma) Bold type face reportsa > MDA value
Table 2-3hSample Results From SR-0015, SSGS Discharae Tunnel 18" Line
Sample No. General Location Information Sample Type cs-137 (pCi/g) _Co-60 (pcilg)18" Line -37' from NW corner of SSGS area toward Screen
SX10SD01938 Room of Intake Tunnel Sediment 1 3.2 <01518" Line -42' from NW corner of SSGS area toward Screen
SX10SD01939 Room of Intake Tunnel Sediment 4.2 <0 118" Line -60' from NW corner of SSGS area toward Screen
SXSD953 Room of Intake Tunnel Sediment 1.8 < 0 11
2-46
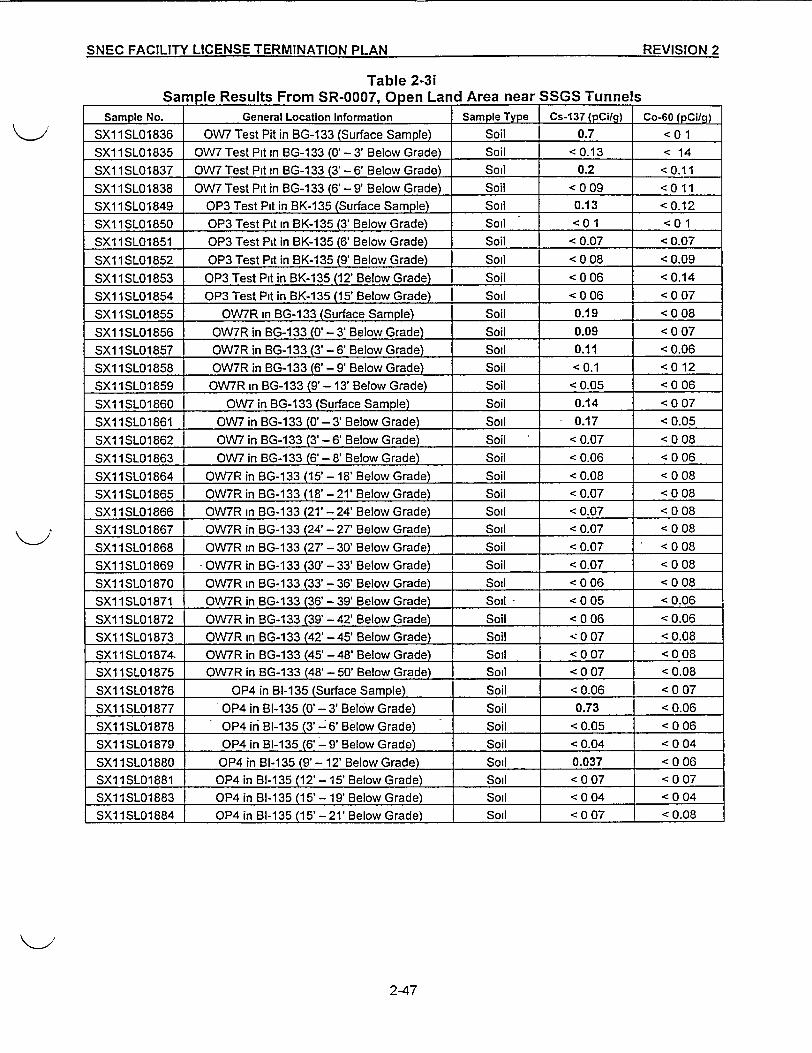
SNEC FACILITY LICENSE TERMINATION PLAN REVISION 2
Table 2-3iSample Results From SR-0007, Open Land Area near SSGS Tunnels
Sample No. General Location Information Sample Type Cs-137 (pCi/g) Co-60 (pCilg)SX11SL01836 OW7 Test Pit in BG-133 (Surface Sample) Soil 0.7 < 0 1SX11 SL01835 OW7 Test Pit in BG-1 33 (0'- 3' Below Grade) Soil < 0.13 < 14SX11SL01837 OW7 Test Pit in BG-133 (3' - 6' Below Grade) Soil 0.2 <0.11SX11SL01838 OW7 Test Pit in BG-133 (6'- 9' Below Grade) Soil < 0 09 < 0 11SX11SL01849 OP3 Test Pit in BK-135 (Surface Sample) Soil 0.13 < 0.12SX11SL01850 OP3 Test Pit in BK-135 (3' Below Grade) Soil < 0 1 < 0 1SX11SLO1851 OP3 Test Pit in BK-135 (6' Below Grade) Soil < 0.07 < 0.07SX11 SLO1852 OP3 Test Pit in BK-135 (9' Below Grade) Soil < 0 08 < 0.09SX11SLO1853 OP3 Test Pit in BK-135 (12' Below Grade) Soil < 0 06 < 0.14SX11SLO1854 OP3 Test Pit in BK-135 (15' Below Grade) Soil < 0 06 < 0 07SX11SLO1855 OW7R in BG-133 (Surface Sample) Soil 0.19 < 0 08SX1 1SLO1856 OW7R in BG-133 (0'- 3' Below Grade) Soil 0.09 < 0 07SX1 1SL01857 OW7R in BG-133 (3'- 6' Below Grade) Soil 0.11 < 0.06SX11SL01858 OW7R in BG-133 (6'- 9' Below Grade) Soil < 0.1 < 0 12SX11SL01859 OW7R in BG-133 (9'- 13' Below Grade) Soil < 0.05 < 0 06SX11SL01860 OW7 in BG-133 (Surface Sample) Soil 0.14 < 0 07SX11 SLO1861 OW7 in BG-1 33 (0'- 3' Below Grade) Soil 0.17 < 0.05SX11SL01862 OW7 in BG-133 (3'-6' Below Grade) Soil < 0.07 < 0 08SX11 SLO1863 OW7 in BG-1 33 (6' - 8' Below Grade) Soil < 0.06 < 0 06SX11SL01864 OW7R in BG-133 (15'- 18' Below Grade) Soil < 0.08 < 0 08SX11SL01865 OW7R in BG-133 (18' - 21' Below Grade) Soil < 0.07 < 0 08SX11SL01866 OW7R in BG-133 (21'- 24' Below Grade) Soil < 0.07 < 0 08SX11 SLO1867 OW7R in BG-133 (24' - 27' Below Grade) Soil < 0.07 < 0 08SX11 SLO1868 OW7R in BG-1 33 (27' - 30' Below Grade) Soil < 0.07 < 0 08SX11SL01869 OW7R in BG-133 (30'- 33' Below Grade) Soil < 0.07 < 0 08SX11SL01870 OW7R in BG-133 (33'- 36' Below Grade) Soil < 0 06 < 0 08SX11SLO1871 OW7R in BG-133 (36' - 39' Below Grade) Soil - < 0 05 < 0.06SX11SL01872 OW7R in BG-133 (39'-42' Below Grade) Soil < 006 <0.06SX11 SLO1873 OW7R in BG-1 33 (42' - 45' Below Grade) Soil < 0 07 < 0.08SX11SL01874. OW7R in BG-133 (45'- 48' Below Grade) Soil < 0 07 < 0 08SX11SL01875 OW7R in BG-133 (48'- 50' Below Grade) Soil < 0 07 < 0.08SX11SL01876 OP4 in Bl-135 (Surface Sample) Soil < 0.06 < 0 07SX11 SL01877 OP4 in BI-135 (0' - 3' Below Grade) Soil 0.73 < 0.06SX11SL01878 OP4 in BI-135 (3'-6' Below Grade) Soil < 0.05 < 0 06SX11SL01879 OP4 in BI-135 (6'- 9' Below Grade) Soil < 0.04 < 0 04
SX11SL01880 OP4 in BI-135 (9'- 12' Below Grade) Soil 0.037 < 0 06SX11SL01881 OP4 in BI-135 (12'- 15' Below Grade) Soil < 0 07 < 0 07SX11SL01883 OP4 in BI-135 (15'- 19' Below Grade) Soil < 0 04 < 0 04
SX11SL01884 OP4 in BI-135 (15'- 21' Below Grade) Soil < 0 07 < 0.08
2-47
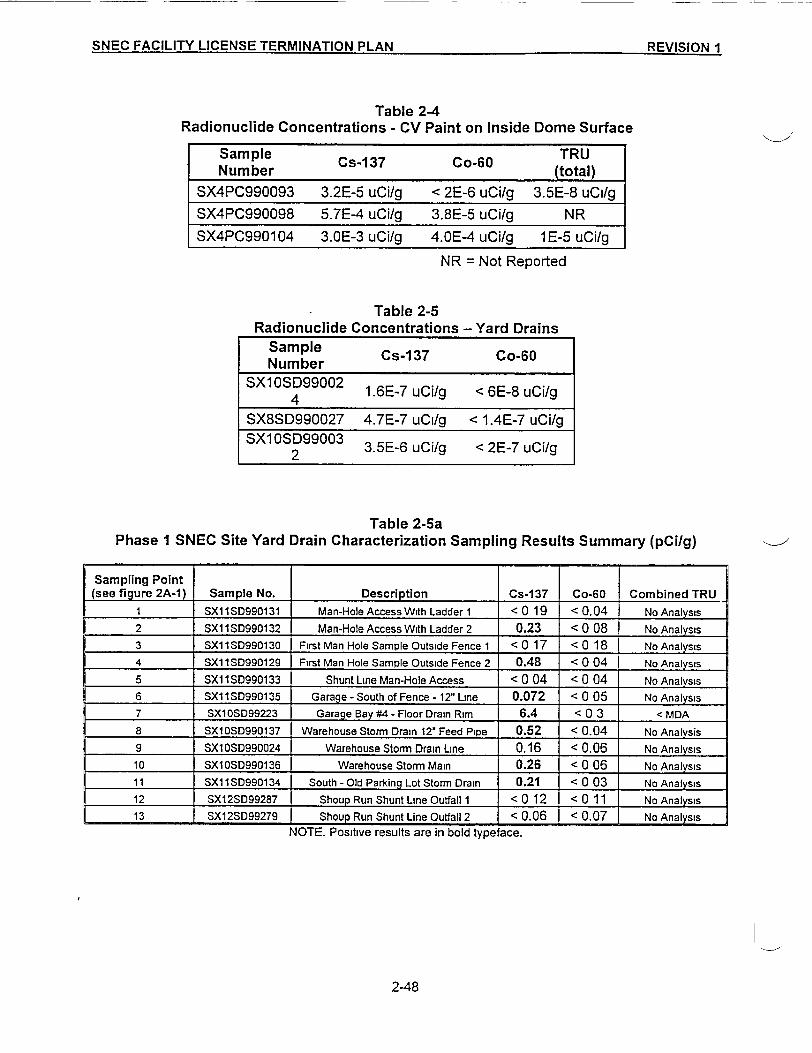
SNEC FACILITY LICENSE TERMINATION PLAN RE=VISION 1SNEC FACILITY LICENSE TERMINATION PLAN PF'JI5�lAM 4
Table 2-4Radionuclide Concentrations - CV Paint on Inside Dome Surface
Number Cs-137 Co-60 TRUSX4PC990093 3.2E-5 uCi/g <2E-6 uCi/g 3.5E-8 uCl/gSX4PC990098 5.7E-4 uCi/g 3.8E-5 uCi/g NRSX4PC990104 3.OE-3 uCi/g 4.OE-4 uCi/g 1E-5 uCi/g
NR = Not Reported
- Table 2-5Radionuclide Concentrations - Yard Drains
Number Cs-1 37 Co-60
SX1OSD99002 1.6E-7 uCi/g < 6E-8 uCi/g4
SX8SD990027 4.7E-7 uCi/g < 1.4E-7 uCi/g
SX12SD99003 3.5E-6 uCi/g < 2E-7 uCi/g2
Table 2-5aPhase I SNEC Site Yard Drain Characterization Sampling Results Summary (pCi/g)
Sampling Point(see figure 2A-1) Sample No. Description Cs-137 Co-60 Combined TRU
1 SX11SD990131 Man-Hole Access With Ladder 1 < 0 19 < 0.04 No Analysis
2 SX11SD990132 Man-Hole Access With Ladder 2 0.23 < 0 08 NoAnalysis3 SX1 1 SD990130 First Man Hole Sample Outside Fence 1 <0 17 < 0 18 No Analysis4 SX11SD990129 First Man Hole Sample Outside Fence 2 0.48 < 0 04 No Analysis5 SX11SD990133 Shunt Line Man-Hole Access < 0 04 < 0 04 No Analysis6 SX11SD990135 Garage - South of Fence - 12" Line 0.072 < 0 05 No Analysis7 SX10SD99223 Garage Bay #4 - Floor Drain Rim 6.4 < 0 3 < MDA8 SX10SD990137 Warehouse Storm Drain 12' Feed Pipe 0.52 < 0.04 No Analysis9 SX10SD990024 Warehouse Storm Drain Line 0.16 < 0.06 No Analysis10 SX10SD990136 Warehouse Storm Main 0.26 < 0 06 No Analysis11 SX11SD990134 South-Old Parking Lot Storm Drain 0.21 < 0 03 No Analysis12 SX12SD99287 Shoup Run Shunt Line Outfall 1 <0 12 < 0 11 No Analysis13 SX12SD99279 Shoup Run Shunt Line Outfall 2 < 0.06 < 0.07 No Analysis
NOTE. Positive results are in bold typeface.
2-48

SNEC~r FACILITY LICENSE TEIRMINATION PLAN REVISION 2
Table 2-5bPhase 2 Summary SNEC Site Yard Drain Characterization
Measurement Results (range) Sample Results (range)dpml100 cm' pClg pCilg
Location (Cs-137) (Cs-137) (Cs-137)
Small Garage Sumps < 664 to < 2134 < 2 1 to < 3.8 0 2 to 1 4
Central Grated Cover Yard Drain & Line to Shunt < 330 to 910 < 1 0 to < 2 <0 07 to 1.1
Grated Cover Yard Drain Near Warehouse < 309 to < 1633 < 11 to < 1 8 0 7 (one sample)
12" Line South of Small Garage Outside Fence < 336 to < 656 < 1.2 to < 2 3 < 0.1 (one sample)
Unknown 12" Drainage Line West of Small Garage < 360 to < 565 < 1 3 to < 2 < 0.1 (one sample)
Drain Line from Warehouse South to Shunt Line < 309 to < 522 < 1.1 to < 1.8 0.11 (one sample)
Shunt Line Access Points < 409 to < 694 < 1.4 to < 2 4 0.04 to 0 34
2-49
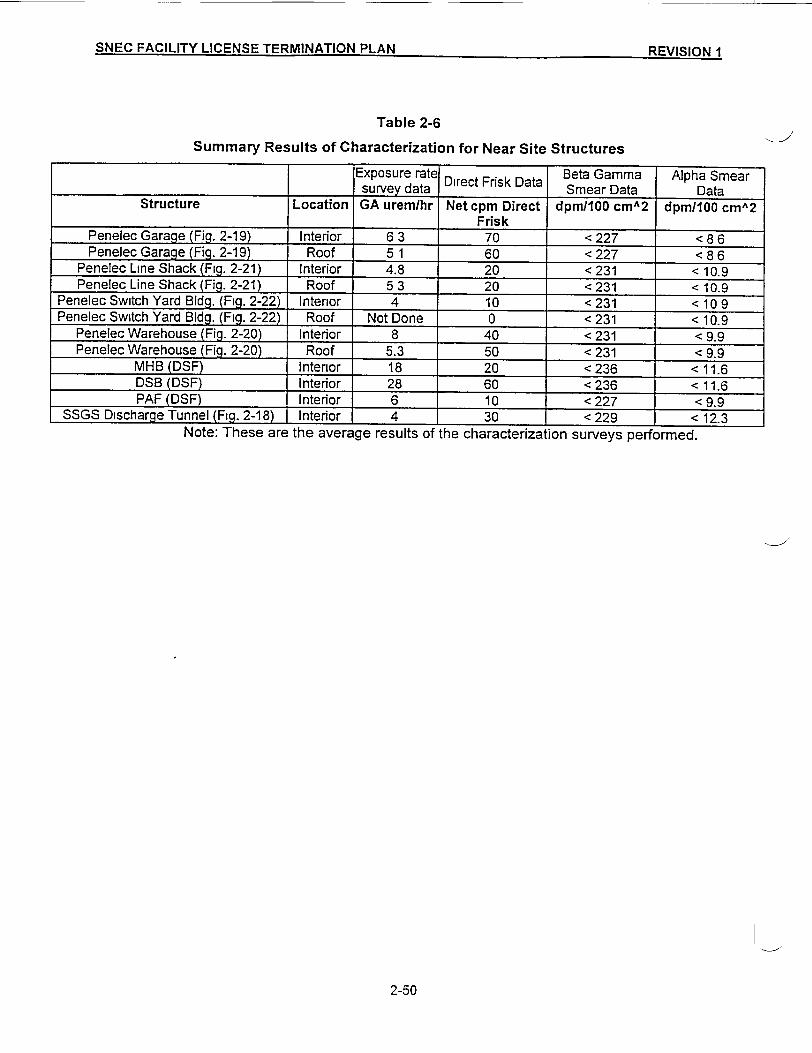
SNEC FACILITY LICENSE TEIRMINATION PLANI 0=1 10rKl 4SNEC FACILIT LICNS TMNTINPA 4, '- . I.IjII l
Table 2-6
Summary Results of Characterization for Near Site Structures
Exposure rate DrcFisDaa Beta Gamma Alpha Smearsurvey data Direct Frisk Data Smear Data Data
Structure Location GA urem/hr Net cpm Direct dpm/100 cmA2 dpm/100 cmA2Frisk
Penelec Garage (Fig. 2-19) Interior 6 3 70 < 227 < 8 6Penelec Garage (Fig. 2-19) Roof 5 1 60 < 227 < 8 6
Penelec Line Shack (Fig. 2-21) Interior 4.8 20 < 231 < 10.9Penelec Line Shack (Fig. 2-21) Roof 5 3 20 < 231 < 10.9
Penelec Switch Yard Bldg. (Fig. 2-22) Interior 4 10 < 231 < 10 9Penelec Switch Yard Bldg. (Fig. 2-22) Roof Not Done 0 < 231 < 10.9
Penelec Warehouse (Fig. 2-20) Interior 8 40 < 231 < 9.9Penelec Warehouse (Fig. 2-20) Roof 5.3 50 < 231 < 9.9
MHB (DSF) Intenor 18 20 < 236 < 11.6DSB (DSF) Interior 28 60 < 236 < 11.6PAF (DSF) Interior 6 10 < 227 < 9.9
SSGS Discharge Tunnel (Fig. 2-18) Interior 4 30 < 229 < 12.3Note: These are the average results of the characterization surveys performed.
2-50
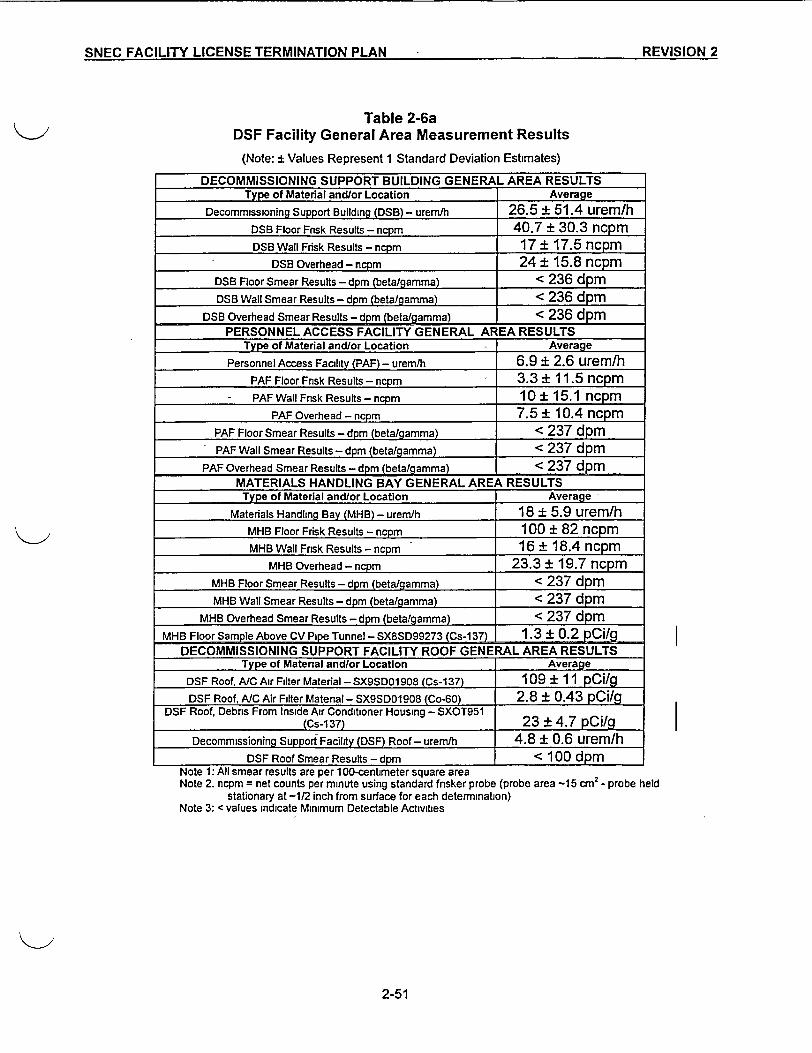
SNEC FACILITY LICENSE TERMINATION PLAN REVISION 2
Table 2-6aDSF Facility General Area Measurement Results
(Note: ± Values Represent 1 Standard Deviation Estimates)
DECOMMISSIONING SUPPORT BUILDING GENERAL AREA RESULTSType of Material and/or Location Average
Decommissioning Support Building (DSB) - urem/h 26.5 ± 51.4 urem/hDSB Floor Fnsk Results - ncpm 40.7 ± 30.3 ncpmDSBWallFriskResults-ncpm 17 ± 17.5 ncpm
DS8 Overhead - ncpm 24 ± 15.8 ncpmDSB Floor Smear Results - dpm (beta/gamma) < 236 dpmDSB Wall Smear Results - dpm (beta/gamma) < 236 dpm
DSB Overhead Smear Results - dpm (beta/gamma) < 236 dpmPERSONNEL ACCESS FACILITY GENERAL AREA RESULTS
Type of Material and/or Location AveragePersonnel Access Facility (PAF) - urem/h 6.9 ± 2.6 urem/h
PAF Floor Frisk Results - ncpm 3.3 ± 11.5 ncpm- PAF Wall Frisk Results - ncpm 10 ± 15.1 ncpm
PAF Overhead - ncpm 7.5 ± 10.4 ncpmPAF Floor Smear Results - dpm (beta/gamma) < 237 dpmPAF Wall Smear Results - dpm (beta/gamma) < 237 dpm
PAF Overhead Smear Results - dpm (beta/gamma) < 237 dpmMATERIALS HANDLING BAY GENERAL AREA RESULTSType of Material and/or Location Average -
Materials Handling Bay (MHB) - urem/h 18 ± 5.9 uremlhMHB Floor Frisk Results - ncpm 100 ± 82 ncpmMHB Wall Fnsk Results - ncpm 16 ± 18.4 ncpm
MHBOverhead-ncpm 23.3 ± 19.7 ncpmMHB Floor Smear Results - dpm (betalgamma) < 237 dpmMHB Wall Smear Results - dpm (beta/gamma) < 237 dpm
MHB Overhead Smear Results - dpm (beta/gamma) < 237 dpmMHB FloorSampleAbove CVPipeTunnel-SX8SD99273 (Cs-137) 1.3 ± 0.2 pCi/g
DECOMMISSIONING SUPPORT FACILITY ROOF GENERAL AREA RESULTSType of Material and/or Location Average
DSF Roof, A/C Air Filter Material - SX9SDO1908 (Cs-137) 109 ± 11 pCilgDSF Roof, A/C Air Filter Material - SX9SD01908 (Co-40) 2.8 ± 0.43 pCi/g
DSF Roof, Debris From Inside Air Conditioner Housing - SXOT951(Cs-1 37) 23 ± 4.7 pCi/g
Decommissioning Support Facility (DSF) Roof- urem/h 4.8 i 0.6 urem/hDSF Roof Smear Results - dpm < 100 dpm
I
Note 1: All smear results are per 1 00-centimeter square areaNote 2. ncpm = net counts per minute using standard frisker probe (probe area -15 cm2 - probe held
stationary at -1/2 inch from surface for each determination)Note 3: < values indicate Minimum Detectable Activities
2-51
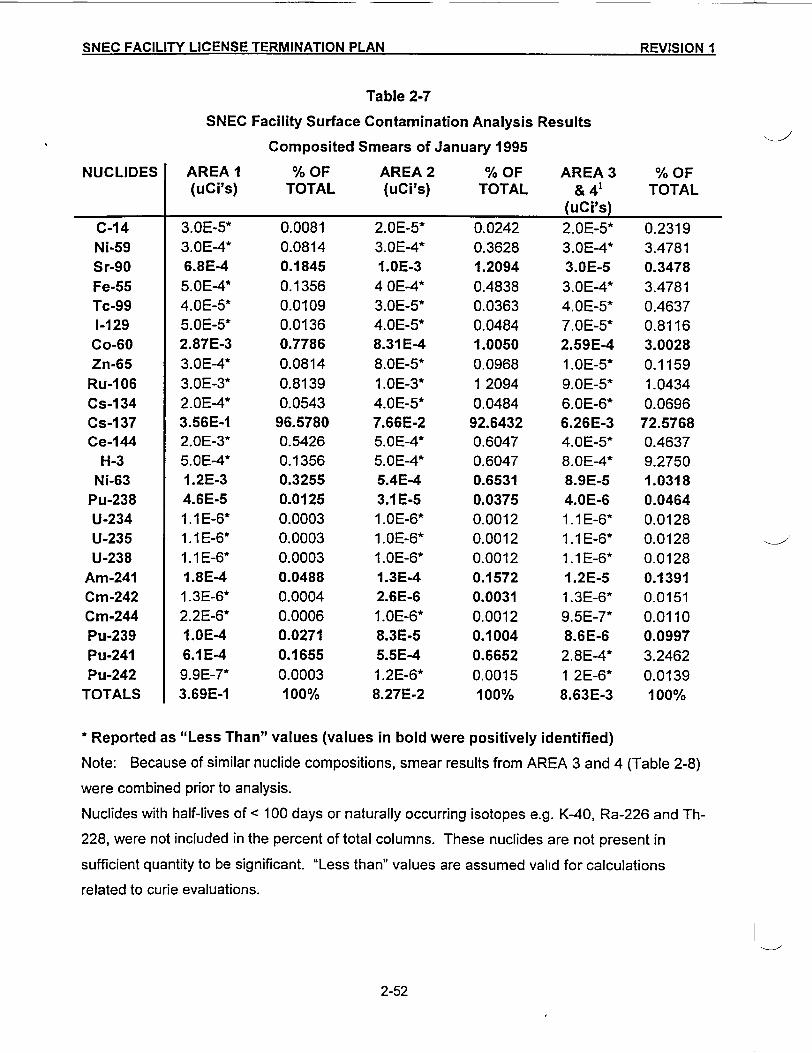
SNEC FACILITY LICENSE TERMINATION PLAN REVISION I
Table 2-7
SNEC Facility Surface Contamination Analysis Results
Composited Smears of January 1995
NUCLIDES AREA I % OF AREA 2 % OF AREA 3 %OF(uCi's) TOTAL (uCi's) TOTAL & 4' TOTAL
(uCi's)
C-14Ni-59Sr-90Fe-55Tc-991-129
Co-60Zn-65Ru-106Cs-1 34Cs-1 37Ce-144
H-3Ni-63
Pu-238U-234U-235U-238
Am-241Cm-242Cm-244Pu-239Pu-241Pu-242
TOTALS
3.OE-5*3.OE-4*6.8E-4
5.OE-4*4.OE-5*5.OE-5*2.87E-33.OE-4*3.OE-3*2.OE-4*3.56E-12.OE-3*5.OE-4*1.2E-34.6E-51. 1 E-6*1. 1E-6*1. 1E-6*1.8E-41 .3E-6*2.2E-6*1.OE-46.1IE-49.9E-7*3.69E-1
0.00810.08140.18450.13560.01090.01360.77860.08140.81390.054396.57800.54260.13560.32550.01250.00030.00030.00030.04880.00040.00060.02710.16550.0003100%
2.0E-5*3.0E-4*I.OE-3
4 OE-4*3.0E-5*4.0E-5*8.31 E-48.0E-5*1.OE-3*4.0E-5*7.66E-25.0E-4*5.0E-4*5.4E-43.1E-51.OE-6*1.OE-6*1.OE-6*1.3E-42.6E-61.OE-6*8.3E-55.5E-41.2E-6*8.27E-2
0.02420.36281.20940.48380.03630.04841.00500.09681 20940.048492.64320.60470.60470.65310.03750.00120.00120.00120.15720.00310.00120.10040.66520.0015100%
2.0E-5*3.0E-4*3.OE-53.0E-4*4.0E-5*7.0E-5*2.59E-41.OE-5*9.0E-5*6.0E-6*6.26E-34.0E-5*8.0E-4*8.9E-54.OE-61.1 E-6*1.1 E-6*1.1E-6*1.2E-51.3E-6*9.5E-7*8.6E-6
2.8E-4*1 2E-6*8.63E-3
0.23193.47810.34783.47810.46370.81163.00280.11591.04340.069672.57680.46379.27501.03180.04640.01280.01280.01280.13910.01510.01100.09973.24620.0139100%
* Reported as "Less Than" values (values in bold were positively identified)
Note: Because of similar nuclide compositions, smear results from AREA 3 and 4 (Table 2-8)
were combined prior to analysis.
Nuclides with half-lives of < 100 days or naturally occurring isotopes e.g. K-40, Ra-226 and Th-
228, were not included in the percent of total columns. These nuclides are not present in
sufficient quantity to be significant. "Less than" values are assumed valid for calculations
related to curie evaluations.
2-52
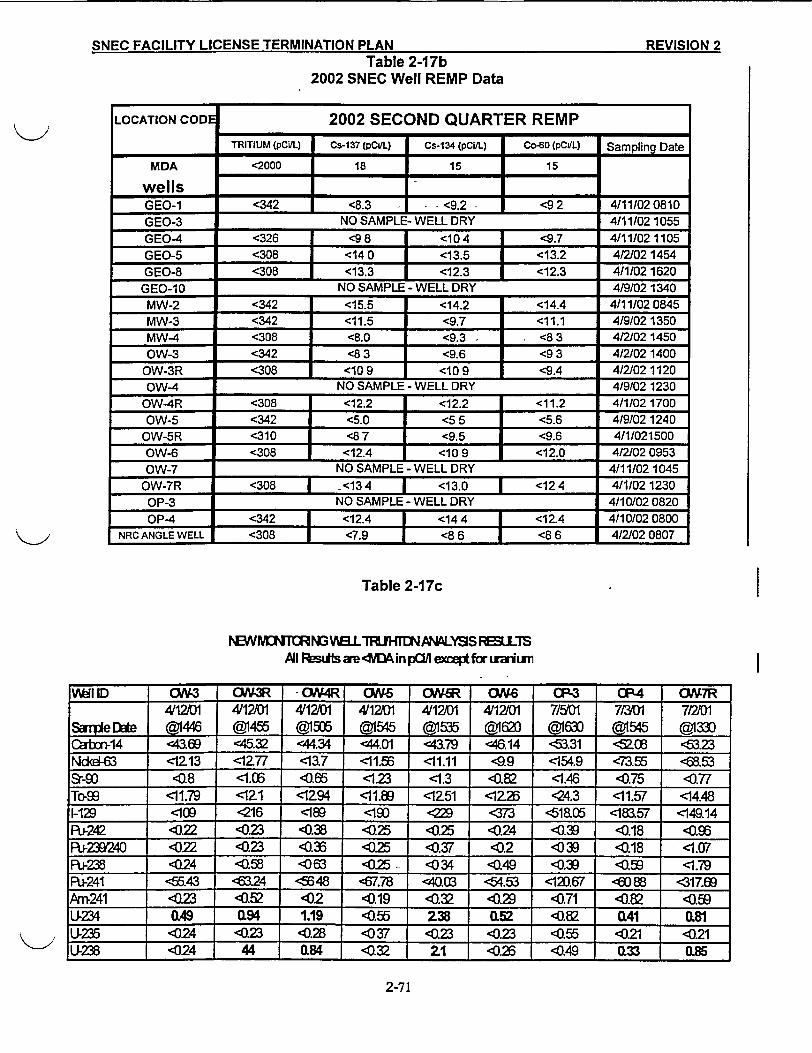
SNEC FACILITY LICENSE TERMINATION PLAN REVISION 2Table 2-17b
2002 SNEC Well REMP Data
LOCATION COD 2002 SECOND QUARTER REMPTRITIUM (pCiIL) Cs-137 (pCLtL) Cs-134 (pCI/L) Co-60 (pCVL) Sampling Date
MDA <2000 18 15 J 15
wells 11GEO-1 <342 | <8.3 - <9.2 - <92 4/11/02 0810GEO-3 NO SAMPLE- WELL DRY 4/11/02 1055
GEO-4 <326 <98 1 <104 J <9.7 4/11/02 1105
GEO-5 <308 <14 0 <13.5 <13.2 4/2/02 1454
GEO-8 <308 <13.3 <12.3 <12.3 4/1/02 1620GEO-10 NO SAMPLE - WELL DRY 4/9/02 1340
MW-2 <342 <15.5 <14.2 <14.4 4/11102 0845
MW-3 <342 <11.5 <9.7 <11.1 4/9/02 1350
MW-4 <308 <8.0 <9.3 . <8 3 4/2/02 1450
OW-3 <342 <8 3 <9.6 <9 3 4/2/02 1400
OW-3R <308 <109 <109 <9.4 4/2102 1120OW-4 NO SAMPLE - WELL DRY 4/9/02 1230
OW-4R <308 <12.2 <12.2 <11.2 4/1/02 1700
OW-5 <342 <5.0 <5 5 <5.6 4/9/02 1240
OW-5R <310 <87 <9.5 <9.6 4/1/021500
OW-6 <308 <12.4 <10 9 <12.0 4/2/02 0953
OW-7 NO SAMPLE - WELL DRY 4/11/02 1045
OW-7R <308 | <13 4 1 <13.0 1 <12 4 4/1/02 1230
OP-3 NO SAMPLE - WELL DRY 4/10/02 0820
OP-4 <342 I <12.4 I <14 4 1 <12.4 4/10/02 0800
NRC ANGLE WELL <308 <7.9 <8 6 | <8 6 4/2/02 0807
Table 2-17c
NrvNNTRNS V LTrIJIMNAI8Lys RMLTSAJI lesuts ae 4Min ecI ept fcr uaniu
I
IVUI ID .N3 CV3R -OA4R. O0 ONCV OAV6 CP-3 CP-4 aA7R
41201 4/12/01 41201 4/1201 4/1201 4/1201 7/5Y01 71Y01 7/&m~pe Dae @1446 @1455 @1505 @1545 @1535 @162 @060 @1545 @1:0C1rn14 <469 <4532 <44.34 <44.01 <4379 <46.14 <53.31 08 <5323Nmdo3 <1213 <1277 <3.7 <11.56 <11.11 ,*.9 <154.9 <73.55 <68.53sr-go <1 <1.06 <0.65 < .23 <1.3 <0.82 <1.46 <1).75 D0.77To-9 <11.79 <121 <1294 <11.89 <1251 <1226 <24.3 <11.57 <14.481129 <109 <216 <189 <190 <29 < <18.05 <183.57 <149.14Ri-242 <).22 <0.23 <0.38 <).25 <0.25 <0.24 <0.39 <0.18 <0.96Ri-23240 <02 <0.23 <0.36 <0.25 <0.37 <0.2 <039 <0.18 <1.07u-Z38 <0.24 <0.58 <063 <a25 <0 34 <0.49 <0.39 c .D59 <1.79
P,-241 <55.43 624 <8648 '67.78 <4.3 <4.53 <12D67 6)88 '317.69Aii241 <:23 <0. <0.2 <0.19 <12 <0.29 <0.71 <0.2 _ _.59
U234 Q49 Q.94 1.19 <0.55 238 Q52 0.82 0.41 Q.81U235 <024 <.23 <0.28 <037 <0.23 <0.23 <0.55 <0.21 <0.21U238 <024 44 0.84 *.32_ 21 e0.25 <0.49 0.33 0.85
2-71
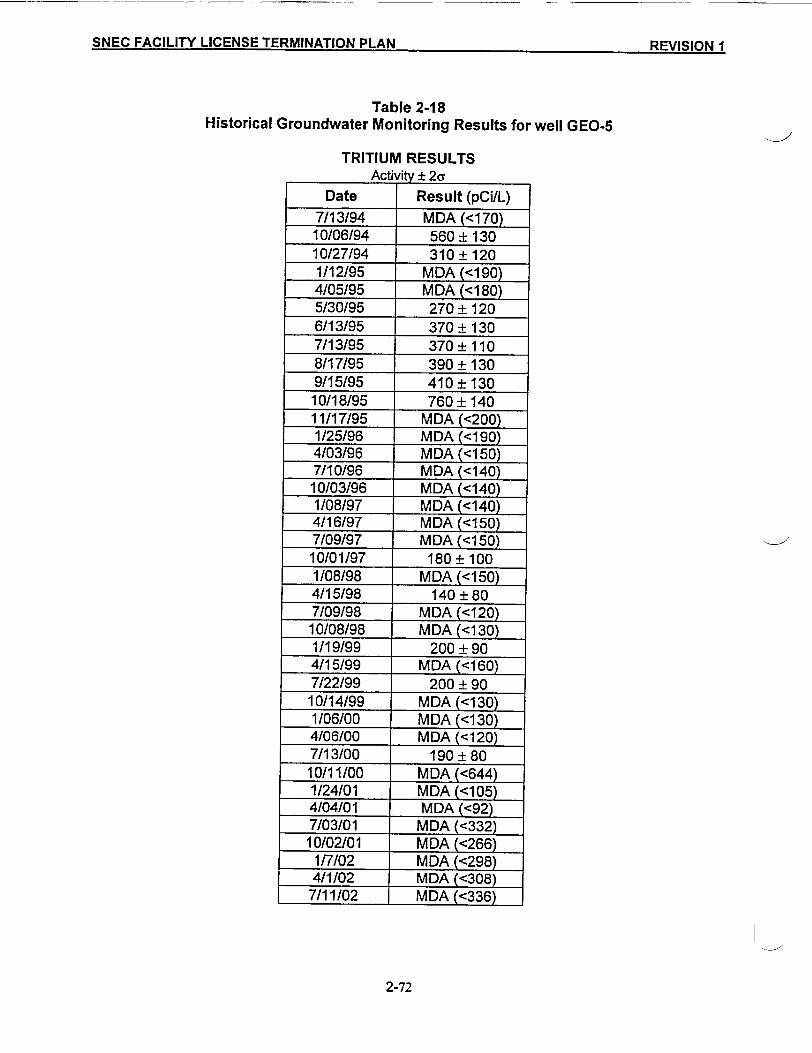
SNEC FACILITY LICENSE TERMINATION PLAN 0=X1llnKl -1SE A LES TI ON - IIV 1M 1
Table 2-18Historical Groundwater Monitoring Results for well GEO-5
TRITIUM RESULTSActivity ± 2a
Date Result (pCi/L)7/13/94 MDA (<170)10/06/94 560± 13010/27/94 310±1201/12/95 MDA (<190)4/05/95 MDA (<180)5/30/95 270± 1206/13/95 370± 1307/13/95 370±1108/17/95 390± 1309/15/95 410±130
10/18/95 760± 14011/17/95 MDA (<200)1/25/96 MDA (<190)4/03/96 MDA (<150)7/10/96 MDA (<140)10/03/96 MDA (<140)1/08/97 MDA (<140)4/16/97 MDA (<150)7/09/97 MDA (<150)10/01/97 180± 1001/08/98 MDA (<150)4/15/98 140 ±807/09/98 MDA (<120)10/08/98 MDA (<130)1/19/99 200 ±904/15/99 MDA (<160)7/22/99 200±9010/14/99 MDA (<130)1/06/00 MDA (<130)4/06/00 MDA (<120)7/13/00 190 ±80
10/11/00 MDA (<644)1/24/01 MDA (<105)4/04/01 MDA (<92)7/03/01 MDA (<332)10/02/01 MDA (<266)
1/7/02 MDA (<298)4/1/02 MDA (<308)7/11/02 MDA (<336)
2-72
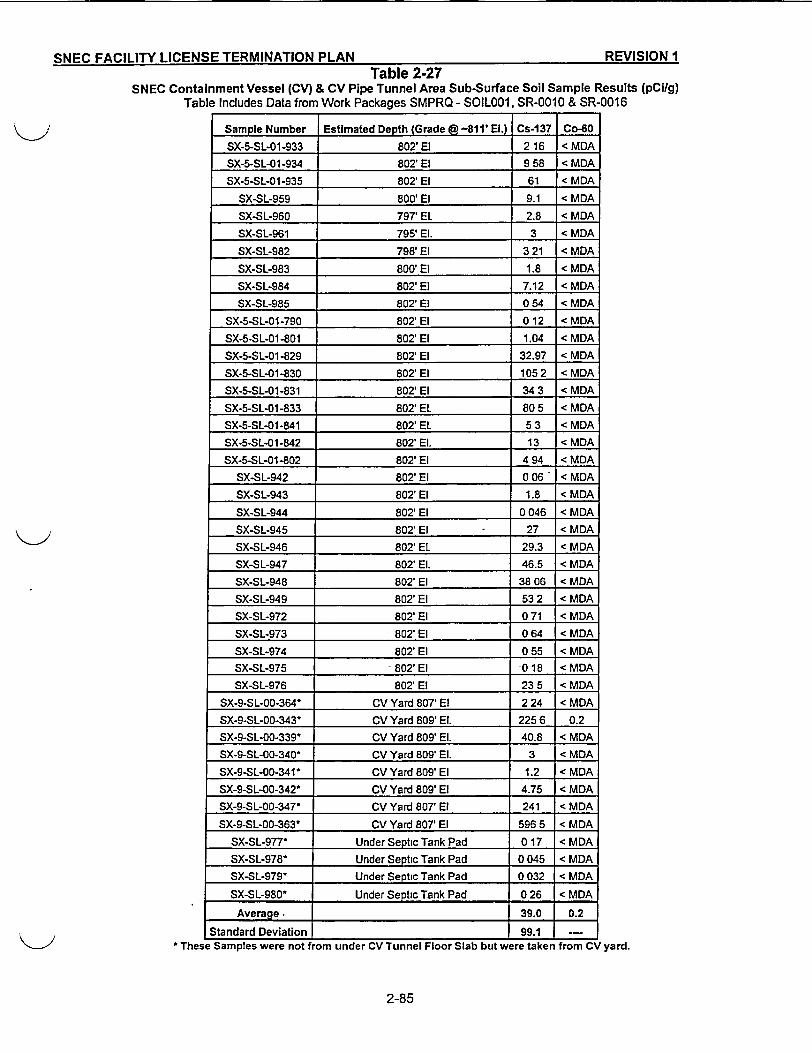
SNEC FACILITY LICENSE TERMINATION PLAN REVISION 1SNE FAILT LIES TEMNTO PLA REISO ITable 2-27
SNEC Containment Vessel (CV) & CV Pipe Tunnel Area Sub-Surface Soil Sample Results (pCi/g)Table Includes Data from Work Packages SMPRQ - SOIL001, SR-0010 & SR-0016
Sample Number Estimated Depth (Grade @-811' El.) Cs-137 Co-60
SX-5-SL-01-933 802' El 2 16 < MDASX-5-SL-01-934 802' El 9 58 < MDA
SX-5-SL-01-935 802' El 61 < MDA
SX-SL-959 800' El 9.1 < MDASX-SL-960 797'El. 2.8 < MDA
SX-SL-961 795'El. 3 < MDA
SX-SL-982 798'El 3 21 < MDA
SX-SL-983 800' El 1.8 < MDASX-SL-984 802' El 7.12 < MDASX-SL-985 802'El 0 54 < MDA
SX-5-SL-01-790 802'El 0 12 < MDA
SX-5-SL-01 -801 802'El 1.04 < MDA
SX-5-SL-01-829 802'El 32.97 < MDA
SX-5-SL-01-830 802'El 105 2 < MDASX-5-SL-01-831 802'El 34 3 < MDA
SX-5-SL-01-833 802'El. 80 5 < MDASX-5-SL-01-841 802'El. 5 3 < MDASX-5-SL-01-842 802'El. 13 < MDA
SX-5-SL-01-802 802'El 4 94 < MDASX-SL-942 802' El 0 06 < MDA
SX-SL-943 802' El 1.8 < MDA
SX-SL-944 802' El 0 046 < MDASX-SL-945 802' El 27 < MDA
SX-SL-946 802' El. 29.3 < MDASX-SL-947 802' El. 46.5 < MDA
SX-SL-948 802' El 38 06 < MDASX-SL-949 802' El 53 2 < MDA
SX-SL-972 802'El 0 71 < MDASX-SL-973 802' El 0 64 < MDA
SX-SL-974 802' El 0 55 < MDASX-SL-975 -802' El 0 18 < MDASX-SL-976 802'El 23 5 < MDA
SX-9-SL-00-364- CV Yard 807' El 2 24 < MDASX-9-SL-00-343* CV Yard 809' El. 225 6 0.2SX-9-SL-00-339* CV Yard 809'El. 40.8 < MDASX-9-SL-00-340* CV Yard 809'El. 3 < MDA
SX-9-SL-00-341- CV Yard 809'El 1.2 < MDASX-9-SL-00-342- CV Yard 809' El 4.75 < MDASX-9-SL-00-347^ CV Yard 807' El 241 < MDA
SX-9-SL-00-363- CV Yard 807'El 596 5 < MDA
SX-SL-977* Under Septic Tank Pad 0 17 < MDA
SX-SL-978* Under Septic Tank Pad 0 045 < MDASX-SL-979' Under Septic Tank Pad 0 032 < MDA
SX-SL-980 - Under Septic Tank Pad 0 26 < MDA
Average . 39.0 0.2
Standard Deviation 99.1These Samples were not from under CV Tunnel Floor Slab but were taken from CV yard.
2-85
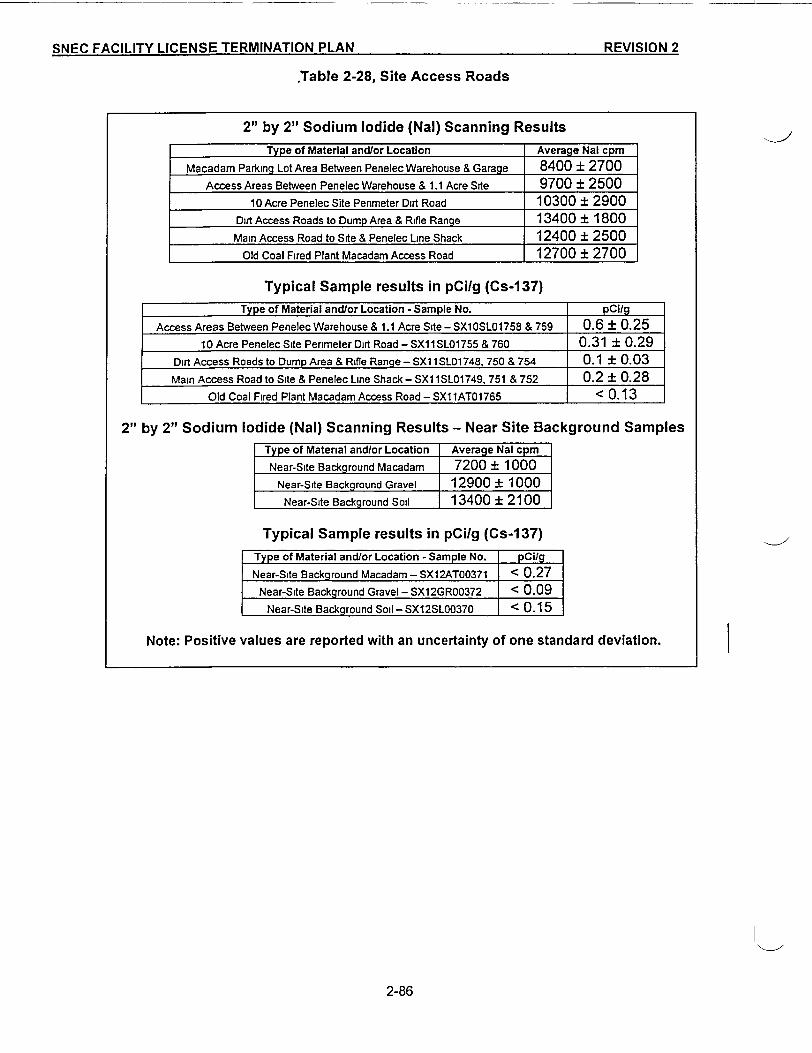
SNFC FACILITY LICENSE TERMINATION PLAN REVISION 2
.Table 2-28, Site Access Roads
2" by 2" Sodium Iodide (Nal) Scanning Results
Type of Material and/or Location Average Nal cpm
Macadam Parking Lot Area Between Penelec Warehouse & Garage 8400 ± 2700Access Areas Between Penelec Warehouse & 1.1 Acre Site 9700 ± 2500
10 Acre Penelec Site Perimeter Dirt Road 10300 ± 2900Dirt Access Roads to Dump Area & Rifle Range 13400 i 1800Main Access Road to Site & Penelec Line Shack 12400 ± 2500
Old Coal Fired Plant Macadam Access Road 12700 ± 2700
Typical Sample results in pCilg (Cs-137)Type of Material and/or Location - Sample No. pCi/g
Access Areas Between Penelec Warehouse & 1.1 Acre Site - SX10SL01758 & 759 0.6 ± 0.2510 Acre Penelec Site Perimeter Dirt Road - SX1 1 SLO1 755 & 760 0.31 ± 0.29
Dirt Access Roads to Dump Area & Rifle Range - SX1 ISLO1 748, 750 & 754 0.1 ± 0.03Main Access Road to Site & Penelec Line Shack - SX1 1 SL01749, 751 & 752 0.2 i 0.28
Old Coal Fired Plant Macadam Access Road - SX1 1AT01765 < 0.13
2" by 2" Sodium Iodide (Nal) Scanning Results - Near Site Background SamplesType of Material and/or Location Average Nal cpm
Near-Site Background Macadam 7200 ± 1000Near-Site Background Gravel 12900 ± 1000
Near-Site Background Soil 13400 ± 2100
Typical Sample results in pCilg (Cs-137)Type of Material andlor Location - Sample No. pCi/g
Near-Site Background Macadam - SX12AT00371 < 0.27Near-Site Background Gravel - SX12GR00372 < 0.09
Near-Site Background Soil - SX12SL00370 < 0.15
Note: Positive values are reported with an uncertainty of one standard deviation. I
2-86
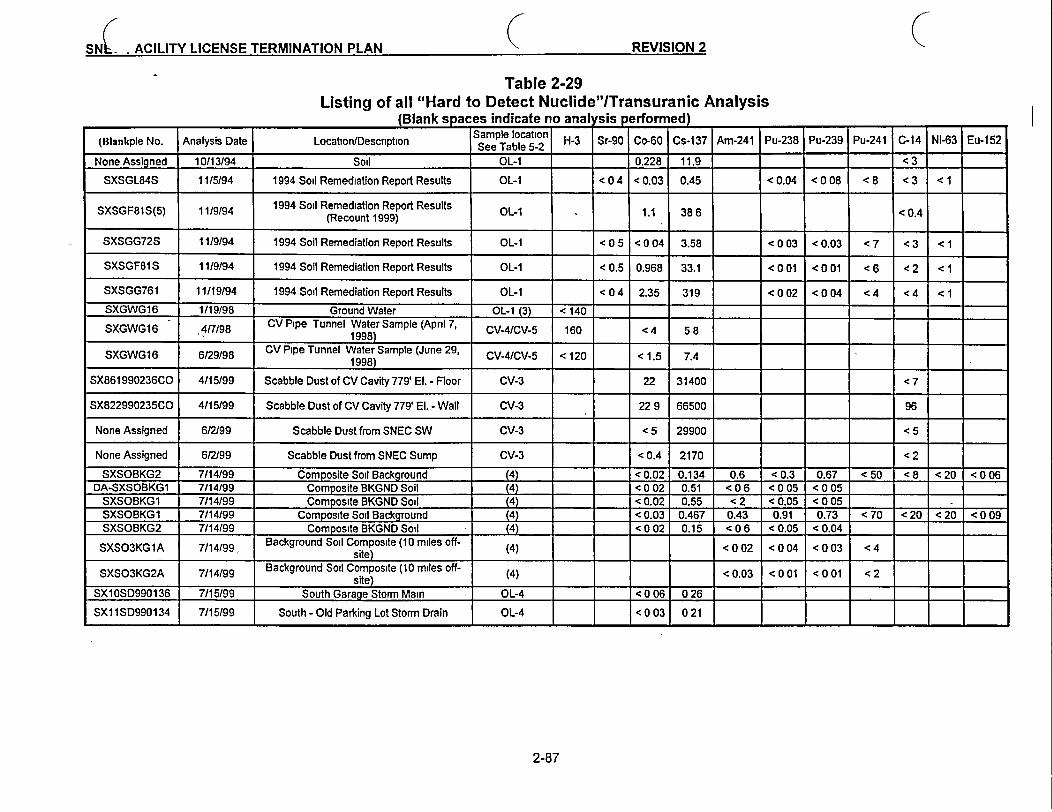
SNC- ACILITY LICENSE TERMINATION PLAN I < REVISION 2SNC ACILITY LICENSE TERMINATION PLAN REVISION 2
Table 2-29Listing of all "Hard to Detect Nuclide"/Transuranic Analysis
(Blank spaces indicate no anal sis perform ed)
(Blankple No. Analysis Date Locaion/Descrption See Table 5-2 H-3 Sr-90 Co-60 Cs-137 Am-241 Pu-238 Pu-239 Pu-241 C-14 Ni-63 Eu-152
None Assigned 10/13/94 Soil OL-1 0.228 11.9 < 3
SXSGL84S 11t5/94 1994 Soil Remediation Report Results OL-1 <04 < 0.03 0.45 < 0,04 < 0 08 < 8 < 3 < 1
SXSGF81S(5) 11/9/94 1994 Soil Remediation Report Results OL-1 _ 1.1 38 6 < 0.4(Recount 1999)
SXSGG72S 11/9194 1994 Soil Remediation Report Results OL-1 < 0 5 < 0 04 3.58 < 0 03 < 0.03 < 7 < 3 < 1
SXSGF81S 11/9/94 1994 Soil Remediation Report Results OL-1 < 0.5 0.968 33.1 <001 <001 < 6 < 2 < 1
SXSGG761 11/19/94 1994 Soil Remediation Report Results OL-1 < 0 4 2.35 319 <0 02 <0 04 <4 <4 <1
SXGWG16 1/19/98 Ground Water OL-1 (3) < 140 .
SXGWG16 4/7/98 CV Pipe Tunnel Water Sample (April 7, CV-4/CV-5 160 < 4 5 81998) _ __
SXGWG16 6/29/98 CV Pipe Tunnel Water Sample (June 29, CV-4/CV-5 < 120 < 1.5 7.4SX861990236CO__ 4u701998) ____
SX861990236CO 4/15/99 Scabble Dust of CV Cavity 779' El. - Floor CV-3 22 31400 <7
SX82299023500 4/15/99 Scabble Dust of CV Cavity 779' El. -Wail CV-3 22 9 66500 96
None Assigned 612/99 Scabble Dust from SNEC SW CV-3 < 5 29900 < 5
None Assigned 6/2/99 Scabble Dust from SNEC Sump CV-3 < 0.4 2170 < 2
SXSOBKG2 7/14/99 Composite Soil Background (4) - < 0.02 0.134 0.6 < 0.3 0.67 < 50 <8 <20 <0 06DA-SXSOBKG1 7/14/99 Composite BKGND Soil (4) c 0 02 0.51 <06 < 0 05 < 0 05
SXSOBKG1 7/14/99 Composite BKGND Soil (4) - 0.02 0.55 <2 < 0.05 < 0 05 _ __
SXSOBKG1 7/14/99 Composite Soil Background (4) - 0.03 0.467 0.43 0.91 0.73 < 70 < 20 <20 <0 09SXSOBKG2 7/14(99 Composite BKGND Soil (4) < 0 02 0.15 <06 < 0.05 < 0.04
SXSO3KG1A 7/14199 Background Soil Composite (10 miles off- (4) < 0 02 < 0 04 < 0 03 <4
SXSO3KG2A 7/14199 Background Soil Composite (10 miles off- (4) < 0.03 < 0 01 < 0 01 <2__________________ ______________ s ite )_ _ _ _ _ _ _ __ _ _ _ _ _ _ _ _ _ _ _
SX10SD990136 7/15/99 South Garage Storm Main OL-4 < 0 06 0 26
SX11SD990134 7/15/99 South - Old Parking Lot Storm Drain OL-4 < 0 03 0 21 _
2-87
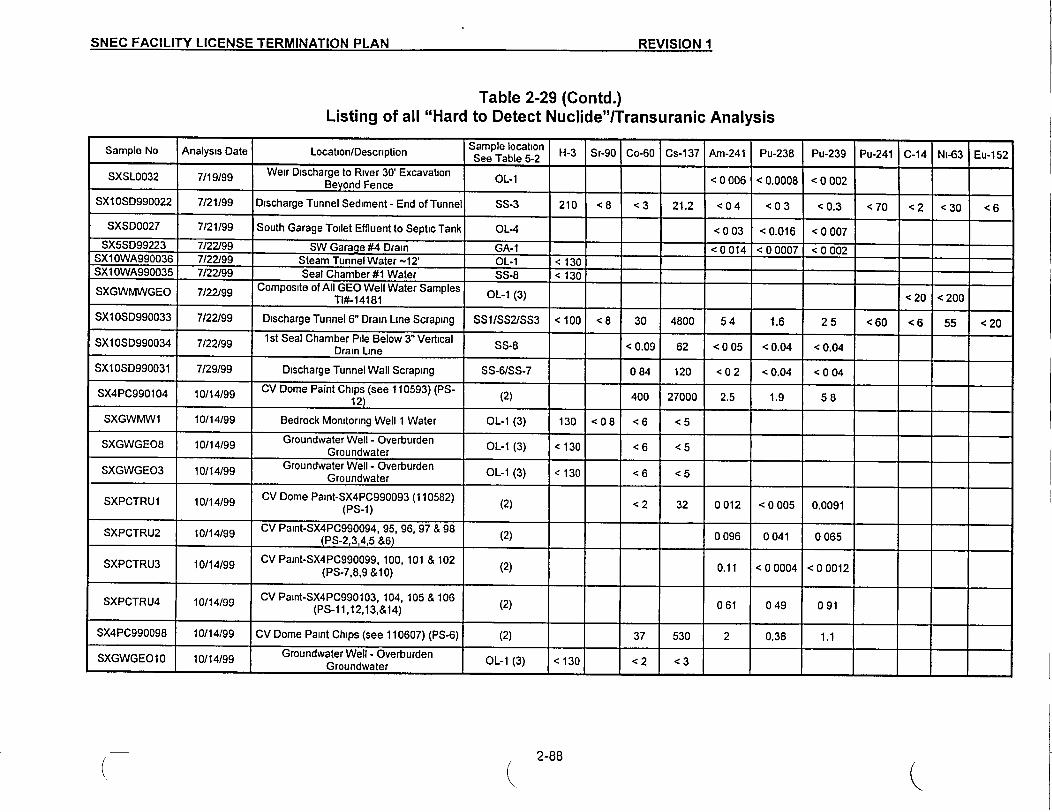
SNEC FACILITY L[CFN.I;F TFRMINATIf)M Pi AIIJ PREVISIONm 1SEFACLT LIFX TFMNTA *1 AN * * * * flN
Table 2-29 (Contd.)Listing of all "Hard to Detect Nuclide"lTransuranic Analysis
Sample No Analysis Date Locaton/Description Saee Table 5-2 H-3 Sr-90 Co-60 Cs-137 Am-241 Pu-238 Pu-239 Pu-241 C-14 Ni-63 Eu-152
SXSL0032 7/19199 Weir Discharge to River 30' Excavation OL-1 < 0 006 < 0.0008 < 0 002___________ -Beyond Fence_ _ __ _ _ _
SX10SD990022 7/21/99 Discharge Tunnel Sediment - End of Tunnel SS-3 210 < 8 < 3 21.2 <0 4 < 0 3 < 0.3 < 70 < 2 < 30 < 6
SXSD0027 7/21/99 South Garage Toilet Effluent to Septic Tank OL-4 < 0 03 < 0.016 < 0 007SX5SD99223 7/22/99 SW Garage #4 Drain GA-I <0014 <00007 < 0 002
SXIOWA990036 7/22/99 Steam Tunnel Water -12' OL-1 < 130 -
SX10WA990035 7/22/99 Seal Chamber #1 Water SS-8 < 130
SXGWMWGEO 7/22/99 Composite of All GEO Well Water Samples OL-1 (3) < 20 < 200TI#-14181
SX10SD990033 7/22/99 Discharge Tunnel 6" Drain Line Scraping SS1/SS2/SS3 < 100 < 8 30 4800 54 1.6 2 5 < 60 < 6 55 < 20
SX10SD990034 7/22/99 ist Seal Chamber Pile Below 3" Vertical SS-8 < 0.09 62 < 0 05 < 0.04 < 0.04Drain Line ___
SX10SD990031 7/29/99 Discharge Tunnel Wall Scraping SS-6/SS-7 0 84 120 < 0 2 < 0.04 < 0 04
SX4PC990104 10/14/99 CV Dome Paint Chips (see 110593) (PS- (2) 400 27000 2.5 1.9 5 812) _ _ __ _ _
SXGWMW1 10/14/99 Bedrock Monitoring Well 1 Water OL-I (3) 130 <08 <6 <5
SXGWGE08 10/14/99 Groundwater Well- Overburden OL-1 (3) < 130 < 6 < 5Groundwater___
SXGWGE03 10/14/99 Groundwater Well - Overburden OL-1 (3) < 130 < 6 < 5__________ ~Groundwater _ _ _ _ _ _
SXPCTRU1 10/14/99 CV Dome Paint-SX4PC990093 (110582) (2) <2 32 0 012 < 0 005 0.0091(PS-i)II I
SXPCTRU2 10/14/99 CV Paint-(X4PC990094, 95, 96, 97 & 98 (2) 0 096 0 041 0 065(PS-2,3 ,4,5_&6)__ _ _ _ _ ___ _ _ _ _ __ _ _ _
SXPCTRU3 10/14/99 CV Paint-(X4PC990099, 100, 101 & 102 (2) 0.11 <00004 <00012(PS-7,8,9 &IO)
SXPCTRU4 10/14/99 CV Paint-SX4PC990103, 104, 105 & 106 (2) 0 61 049 0 91SXPCTRU4 10/14/99(PS-11,12,13,&14)06 04 09
SX4PC990098 10/14/99 CV Dome Paint Chips (see 110607) (PS-6) (2) 37 530 2 0.38 1.1
SXGWGE010 10/14/99 Groundwater Well - Overburden OL-1 (3) < 130 <2 <3__ _ _ _ _ _ _ _ _ _ _ _G roundwater I__ __ _ __I__ _
2-88( Q
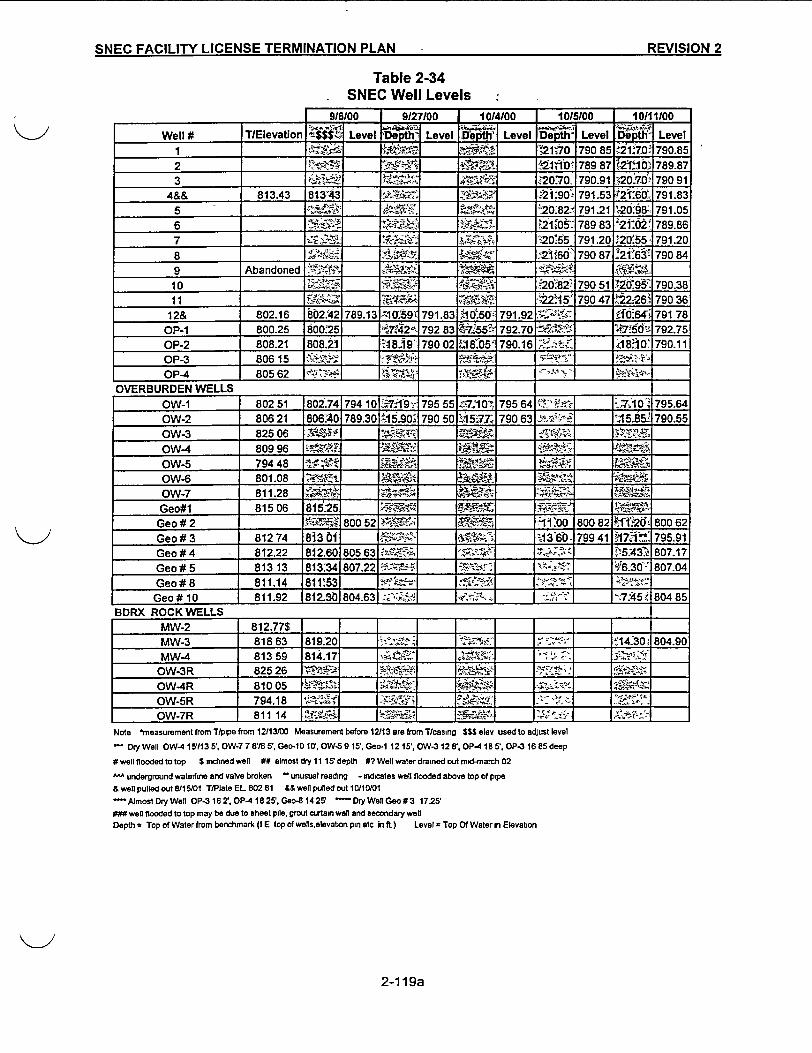
SNEC FACILITY LICENSE TERMINATION PLAN - REVISION 2SNEC FACILITY LICENSE TERMINATION PLAN REVISION 2
Table 2-34SNEC Well Levels
9/6100 9/27/00 _-.
10/4/00 10/5/00 10/111/00
Well # TlElevation ___ Level Depthr L Level1 -i V O21.70 790 85 -217J0 790.85
2 _____b_ _24'lbD 789 87 >2f'1bI 789.87
3 _____ _ 9 _ -20.7O 790.91 '20.7fl- 790 914&& 813.43 81343 _____ _ >2i:90, 791.53 '21 6O. 791.83
5 ________ -__ _ 20.82- 791.21 1,206f98- 791.056 _________ r$ 789 83 2-21 02 789.867 i______ > _2-0*55 791.20 2b.^5S 791.208 _____15d- 21S 790 87 21 03'790 84
9 Abandoned 'HiV . Z =____ _
10 -l _ 20.82! 790 51 72d95 90.38
11 ____ _ _ . 2215i 790 47 122.26' 790 3612& 802.16 802.'42 789.13 Y10'591 791.83 i1l50- 791.92 A,,;f, fdO 64 791 78OP-1 800.25 800.25 -7'42- 792 83 0A 55?' 792.70 g > ,7w : 'g 7156& 792.75OP-2 808.21 808.21 1-a8 19 790 02 1 8.D5 790.16 .- 18 10' 790.11OP-3 806 15 . _____ . .
OP-4 805 62 . _ , '.
OVERBURDEN WELLS = =
OW-1 802 51 802.74 794 10 ri 7i9' 795 55 T-.7103 795 64 S . -710 795.64
OW-2 806 21 806-.40 789.30 '15.90< 790 50 A.5-77, 790 63 , 015.B5 790.55OW-3 825 06 R
OW-4 809 96 __._
OW-5 794 48 . _-Q _____
OW-6 801.08 r
OW-7 811.28 4__ .1r-B
Geo#1 815 06 815.25 . i-RGeo#2 800_52__ w 9 . 1100 800 82 ei120 800 62
Geo # 3 812 74 83 01 t__ .T _ _ -13 60 799 41 7 795.91Geo#4 _812.22 812.60 805 63 . - = 15A43 807.17
Geo#5 813 13 813.34 807.22 . _ _ ___ b 630 80704Geo#8 811.14 81153 1____ __,' _ _
Geo#10 811.92 812.080463 ;..:A _ ___ _ _ f 745 80485BDRX ROCK WELLS
MW-2 812.77$
MW-3 81863 81920 _ 'i 1430 804.90MW-4 813 59 81i.17 ____ ___ _;- _
OW-3R 825 26 -s____ ___s <la S
OW-4R 810 05 | -'.
OW-5R 794.18 + _ - - _ | _|._
OW-7R 811 14 -zi s -'@'&i- _ _ _ _ __ _ __I __
Note 'measurement from T/pipe from 12t13tD0 Meatirement before 12t13 are from Ticasing $5S elev used to adjust level
- DryWell OW 415/135',OW-778' /,Geo-10t0',OW 9t15' Geo-1 1215', OW-32 e. OP41B5'.OP431685deep
# well flooded to top $ inclined well ## almost dry 11 15S depth #? Well water drained out mid-march 02
underground waterine and valve broken -Lunusual reading - indicates well flooded above top of pipe& well pulled out 8/15t01 TtPlate EL 80281 && well puled out 11C/1001
AImostDryWell OP-3 162: OP-4 1825.Geo-8 1425S DryWeD Geo#3 17.25### wel flooded to top may be due to sheet pile, grout curtamn wall and secondary wellDepth = Top of Water from benchmark (I E top of wellsalevation pin etc In fL) Level r Top Of Water in Elevation
2-119a
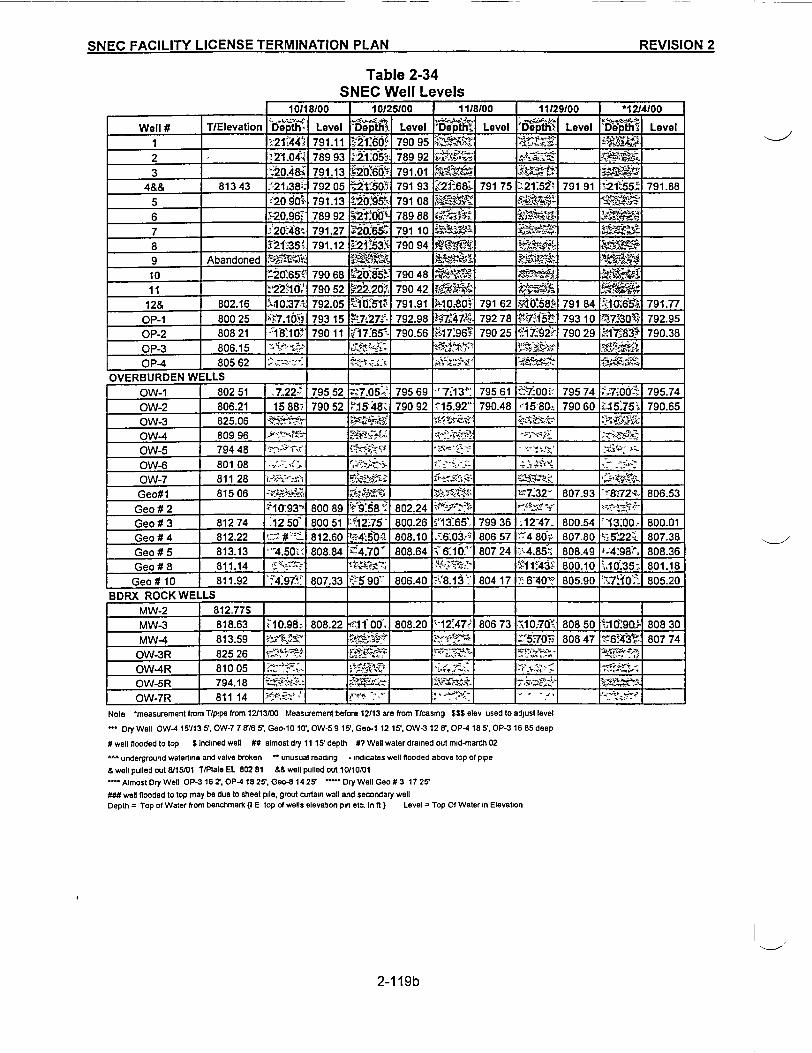
SNEC FACILITY LICENSE TERMINATION PLAN REVISION 2SNE FAIIYLCNETRINTO LNRVSO
Table 2-34SNEC Well Levels
. . .
10/18/00 10125100 1 11/8100 11/29100 *1 2/4/00
Well # T/Elevation De @pt Level DeptpU Level - Level Dthi Level "Depth. Level
1 21744i' 791.11 2- 79095 1 .790 _
2 . ,2-104\ 789 93 21 05 789 92 > l-r*u- -___
3 1.2048- 791.13 i02-o0i6 791.01 =
4&8 813 43 21.38. 792 05 2t.503> 791 93 2M.68. 791 75 > 21:52' 791 91 ^,21'655 791.88
5 2090i 791.13 095. 791 08 + ___
6 Y2-0.96: 789 92 7289 -78988 i _
7 120M48t 791.27 2065 791 10
8 :l2f3W5 791.12 r21-538 790 94 5 '_
9 Abandoned i ___
10 [20r65: 790 68 S208b 790 48 1
11 [ 22 10 790 52 522 20. 790 42 t>6 _____
12& 802.16 "A 0' 37<- 792.05 1'051t1 791.91 A10.80t 791 62 giw585 791 84 . 791.77
OP-1 800 25 27. 10i 793 15 -727-4' 792.98 N4is K 792 78 t -7 115f 793 10 U7A30 792.95
OP-2 808 21 18 10 790 11 TW7-65 790.56 il7z965 790 25 'i172 790 29 t17,8:§; 790.38
OP-3 806.15 > c _ _ z ____
OP-4 805 62 . - ,l. ____ J -
OVERBURDEN WELLSOW-1 802 51 722 795 52 ,7,057 795 69 ` 7M13J- 795 61 7--i00,, 795 74 f r7T0 0': 795.74
OW-2 806.21 15 88- 790 52 " 1S 48i 790 92 15.92T' 790.48 r15-80- 790 60 i 15:75 *| 790.65
OW-3 825.06 i Z _____
OW-4 809 96 , ____ -*.,_
OW-5 794 48 __;;r _:-__ ___ _r __r__
OW-6 801 08 ___ -_OW-7 811 28Geo#1 815 06 !--f; _ _ t,7,32 807.93 7T81724 806.53
Geo #2 _ _ 1093i 800 89 15St 802.24 L _ rf C
Geo # 3 812 74 1250 800 51 t12-175 800.26 t'13>65. 799 36 .12-47 800.54 -13-00, 800.01Geo # 4 812.22 c #VL 812.60 -450t 808.10 _6103 806 57 4 80 807 80 l 55.22v 807.38
Geo # 5 813.13 -4.50 808.84 Z 4.70" 808.64 t- 6-10- 807 24 3-4.85b 808.49 f498 808.36
Geo # 8 811.14 '_, .r-11.43.. 80010 1035 801.18Geo # 10 811.92 'N 4-97't 80733 5s 90 806.40 --8 13 804 17 6 A407 805.90 1 1'0 805.20
BDRX ROCK WELLSMW-2 812.77$ _
MW-3 818.63 i10.986 808.22 11f 00' 808.20 -12_47%l 806 73 ,10.70- 808 50 %10 90^. 808 30
MW-4 813.59 M ___ i¶-;$ ___ __ ' 570 I 808 47 5-t76 3* 807 74
OW-3R 825 26 '-_XE t. -- er <
OW-4R 810 05 ____ _ ____ _ ____
OW-5R 794.18 -__e_ .> ____ 1-4 _ ____ ____
OW-7R 811 14
Note 'measurement from Tlpipe from 12t13100 Measurement before 12/13 are from T/casing SS$ elev used to adjust level
- Dry Well OW-4 15113 5. OW-7 7 S/6 5 Geo-10 10', OW-S 915S, Geo-1 12 15', OW-3 12 8, OP-4 18 5, OP-3 16 85 deep
# well flooded to top $ Incined well ## almost dry 11 15 depth #7 Wall water drained out mid-march 02
underground waterline and valve broken - unusual reading - indicates well flooded above top of pipe
& well pulled out 8/15/01 TPlTate EL 802 81 && well pulled out 10/10/01
' Almost Dry WeDl OP-3 1682. OP-4 1825', Geo-8 14 25 Dry Well Geo # 3 17 25'
### well flooded to top may be due to sheet pile, grout curtain wall and secondary wellDepth = Top of Water from benchmark (I E top of wells elevation pin etc. In fn) Level = Top Of Water in Elevation
2-11 9b
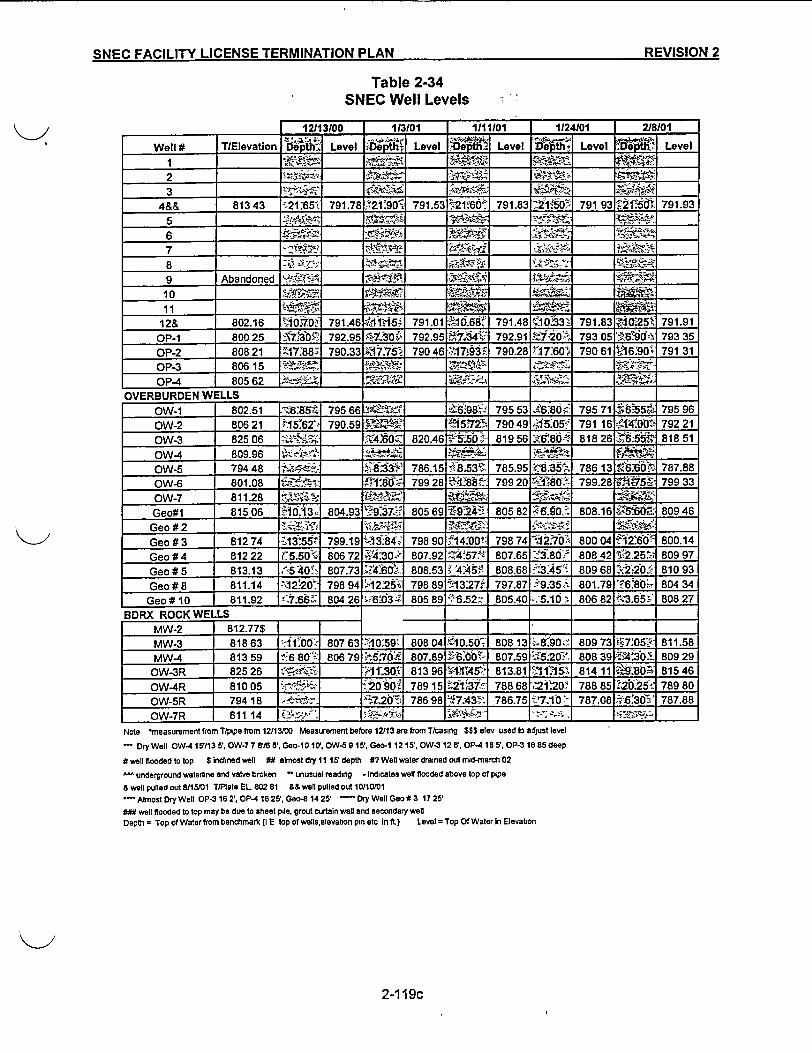
SNEC FACILITY LICENSE TERMINATION PLAN - REVISION 2SNEC FACILITY LICENSE TERMINATION PLAN REVISION 2
Table 2-34SNEC Well Levels
I 'I I
12113100 113101 1111101 1124101 218101
Well # TlElevation Dept Lee Level . .Level _ Level e th_ Level
2. __ija . ... .Jd.__ __ _ __.
3 c _ _ _ _ _ _ _
4&& 813 43 21:65 791.78 2i.90 791.53 t.2t.6O 791.83 21'50- 791 93 .1f0 79193
S __ _ _ _ .-.- re.-~t -'<-.
6 _ _ _ _ _ _ _ _ __ _ _ _ "
7-i:!¢e _______ -< -; __ _ >y.2.I' ; -a
8 _ _ _ _ _ _ _ _ _ _ _ %_ _
9 Abandoned 11v _ _ -
10 _ _ i . ' _ -,4 3
11 _____ ~- -
12& 802.16 -410 07Z 791.46 -1s5 791.01 1068 79148 l10.33os 791.83 NG.25 79191OP-1 800 25 5\7-3b 792.95 w.30 792.95 792.91 Mi720 ' 79305 ;9 793 35
OP-2 808 21 "417`881 790.33 7u;75 79046 .jmi3 790.28 -17.6O. 79061 M06'901 791 31OP-3 806 15 .-, ___ ___ _._ ___;
OP-4 80562 3 r _ -OVERBURDEN WELLS
OW-1 802.51 -a.85;. 795 66 3 _ _ 98' 795 53 4t.80 795 71 - t55, 795 96
OW-2 806 21 -15'62 790.59 393- _ 5.'7Z25 790 49 1305 791 16 f4SD00 792 21OW-3 825 06 --- 450 Z 820A6 850 819 56 .Z68d-J 818 26 65@ 818 51OW-4 809.96 , ____ ____
OW-5 794 48 - e 8 786.15 r-8,53t 785.95 8 35 786 13 fT6 60N 787.88OW-6 801.08 . -t I'8( 799328 4%8 799 20 t1.80 799.28 -75a 79933OW-7 811.28 t -; ____ ____ ____
Geo#1 815 06 10 13 804.93 -9.37,-:- 805 69 '9.2 805 82 S 90 808.16 . 809 46Geo#2 U4 _r___ ____z
Geo#3 812 74 :A3-55 799.19 384 798 90 14'00t 798 74 270 800 04 260 800.14Geo#4 81222 '560' 80672 4:30> 80792 -4.57' 807.65 -z80 808 42 1&25 809 97Geo#5 813.13 6540 807.73 -X60-z 808.53 4-A5t,! 808.68 f3.45' 809 68 220 810 93Geo#8 811.14 :'-12s20" 798 94 <'2.252 ' 79889 BA13:27, 797.87 -'9.35,t 801.79 ' .6806... 804 34
Geo # 10 811.92 7'68 804 26 ;.6'43 4- 805 89 :':6.52; 805.40 , 5.10 . 806 82 1t3.65>- 808 27BDRX ROCK WELLS
MW-2 812.77$ | _ _ . _
MW-3 81863 -.11b.00>| 80763 Th10.59- 80804 y-10.50. 80813 -t8.90; 80973 i't7'054 811.58MW-4 813 59 -.6 680' 806 79 5764d 807.89 6.-6 807.59 ,5:20 808 39 ;430 809 29
OW-3R 82526 ____ -f. iO 0 813 96 1145i 81381 t11".1S' 81 41 1 '-98D. 81546OW-4R 81005 ____ 2090' 78915 2137 78868 21'20l 78885 2025: 78980OW-5R 794 18 | _d_ - | 7.20d5 786 98 7A43: 786.75 710 b 787.08 . 3O- 787.88
OW-7R | 811 14 7-<., _| ., S4'--.Note 'measurementfrom Tlpipe from 12113100 Measurement before 12/13 are from Ticasing $55 elev used to adjust level
Dry Well OW.4 1513 5'. OW-7 7 8S6 5', Geo-10 10'. OW-5 915', Gao- 12 15', OW-3 12 8', OP-4 18 5'. OP-3 16 85 deep
# well flooded to top $ indined well ## almost dry 1115' depth #7 Well water drained out mid-march 02
^ underground waterline and valve broken -unusual reading - Indicates well flooded above top of pipe
& well pulled out 8/15/01 Tl/tate EL 80281 && welt pulled out 10110/01
AltmostDry Well OP-3162',OP-41825SGeo-8142S -DryWellGeo#3 1725'
*5* well ftooded to top may be due to sheet pile, grout curtain wall and secondary well
Depth = Top of Water from benchmark (I E top of wellselevabon pin etc In It.) Level = Top Of Water In Elevation
2-119c
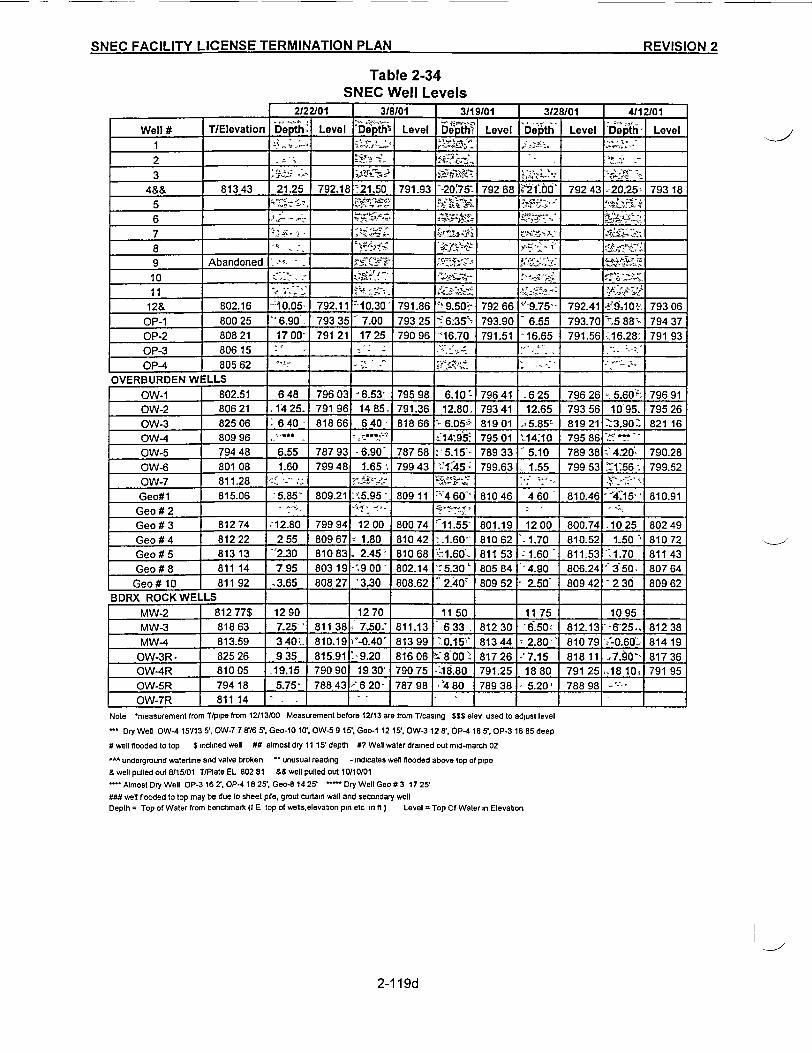
SNEC FACILITY LICENSE TERMINATION PLAN REVISIO1N 2-SNEC FACILITY LICENSE TERMINATION PLAN RFVl5�lON 2
Table 2-34SNEC Well Levels
| 2122/01 318101 3119101 3128101 4112/01
Well # T/Elevation Level Ddpth' Level _ Level . Level Level1 __ _ _ _ _ ; -_._- ,_ _____ <, -- . _____
2 _i -; -~ __ _ _ fS_ _ _
3 _ _ _ _ _ _ _ r.:2;-s X- _ _ _ _ _ia _ _ , , >'~ - '. _ _ _ _ _
48& 813 43 21.25 792.18 -21.50 791.93 --20'75: 792 68 .21'O 792 43 >20;25- 793 18
5 * ,., ___ >.i-. .e-f*.'--.'~
7 _____ __ __ ._ __ :8''<:t r .' -, J ,,r _
8 ''_
9 Abandoned 's -
10 -. , __ __ -.
1 1 ._ _ _ ,_ _ _ _ _ _._ _ _ _Sqe' >sf,< r
12& 802.16 --10.05- 792.11 10.30 791.86 9.502 792 66 '~9.75-- 792.41 -! 9;10!fi 793 06
OP-1 800 25 " 6.90- 793 35 7.00 793 25 /635' 793.90 6.55 793.70 5 88- 794 37
OP-2 808 21 17 00- 791 21 17 25 790 96 '16.70 791.51 -16.65 791.56 -_16.28' 791 93
OP-3 806 15 -; :---
OP4 805 62 _____ - _ -' -- - -
OVERBURDEN WELLS
OW-1 802.51 648 796 03 6.53' 795 98 6:10 796 41 -6 25 796 26 -5.60; 796 91
OW-2 806 21 ,14 25. 791 96 14 85. 791.36 12.80. 793 41 12.65 793 56 1095. 795 26
OW-3 825 06 6 40 - 818 66 6 40 - 818 66 6.05V 819 01 ... 85t 819 21 :3.90. 821 16
OW4 809 96 .- - __'_7_ ;[14:95. 795 01 ' 14.10 795 86 Z< .
OW-5 794 48 6.55 787 93 - 6.90- 787 58 5.15>- 789 33 5.10 789 38 -' 4.20, 790.28
OW-6 801 08 1.60 799 48 1-65 799 43 ;45 799.63 1.55 799 53 <!-1:56 799.52
OW-7 811.28 --_ .-,-t: - , ______ , - - - -.
Geo#1 815.06 5.85- 809.21 >.5.95 - 809 11 -`7460- 81046 460 810.46 -4'.15' 810.91
Geo#2 .- :-'
Geo#3 812 74 $.12.80 799 94 12 00 800 74 '11.55- 801.19 12 00 800.74 .10 25 802 49
Geo #4 812 22 2 55 809 67 1.80 81042 .160- 81062 -1.70 810.52 1-50 810 72
Geo#5 813 13 -'2.30 81083- 2.45- 81068 -. 1.60'. 81153 1.60 811.53 -:1.70 811 43
Geo # 8 811 14 7 95 803 19 -'9 00 802.14 '5.301 805 84 4.90 806.24 3 50. 807 64
Geo # 10 811 92 -3.65 808 27 '3.30 808.62 2.40' 809 52 2.50 809 42 2 30 809 62
BDRX ROCK WELLS I
MW-2 812 77$ 12 90 12 70 11 50 11 75 10 95
MW-3 81863 - 7.25-' 811 38 7.50-: 811.13 633 81230 6.50 ' 812.13 '-625. 81238
MW-4 813.59 3 401- 810.19 ;'-0.40' 813 99 -0.151 81344 2.80- 810 79 -,:0.60'- 814 19
OW-3R 825 26 9 35 815.91 '9.20 816 06 t-8 00 0 817 26 '7.15 81811 .7.90- 81736OW-4R 810 05 19.15 790 90 19 30' 790 75 -.18.80 791.25 18 80 791 25 .18 10. 791 95
OW-5R 794 18 -5.75- 788 43 6 20- 787 98 4 80 789 38 - 5.20' 788 98 _. _
OW-7R 81114 - _ -
Note 'measurement from Tipipe from 12113/00 Measurement before 12/13 are from T/casing SSS elev used to adjust level
- Dry Well OW-4 15113 5'. OW-7 7 g/6 5'% Geo-10 10'. OW-5 915. Geo-1 12 1S. OW-3 12 8'. OP-4 18 5', OP-3 16 85 deep
8 well flooded to top $ inclined well ## almost dry 11 15' depth #7 Well waler drained out mid-march 02
^^ underground waterline and valve broken - unusual reading - indicates well flooded above top of pipe
& well pulled out 8/15101 T/Plate EL 802 81 &&well pulled out 10/10101
- Almost Dry Well OP-3 16 2'. OP-4 18 25', Geo-8 14 25' * Dry Well Geo # 3 17 25'
ft well flooded to top may be due to sheet pile, grout curtain wall and secondary wellDepth = Top of Water from benchmark (I E top of wellselevabon pin etc in t ) Level = Top Of Water in Elevation
2-119d
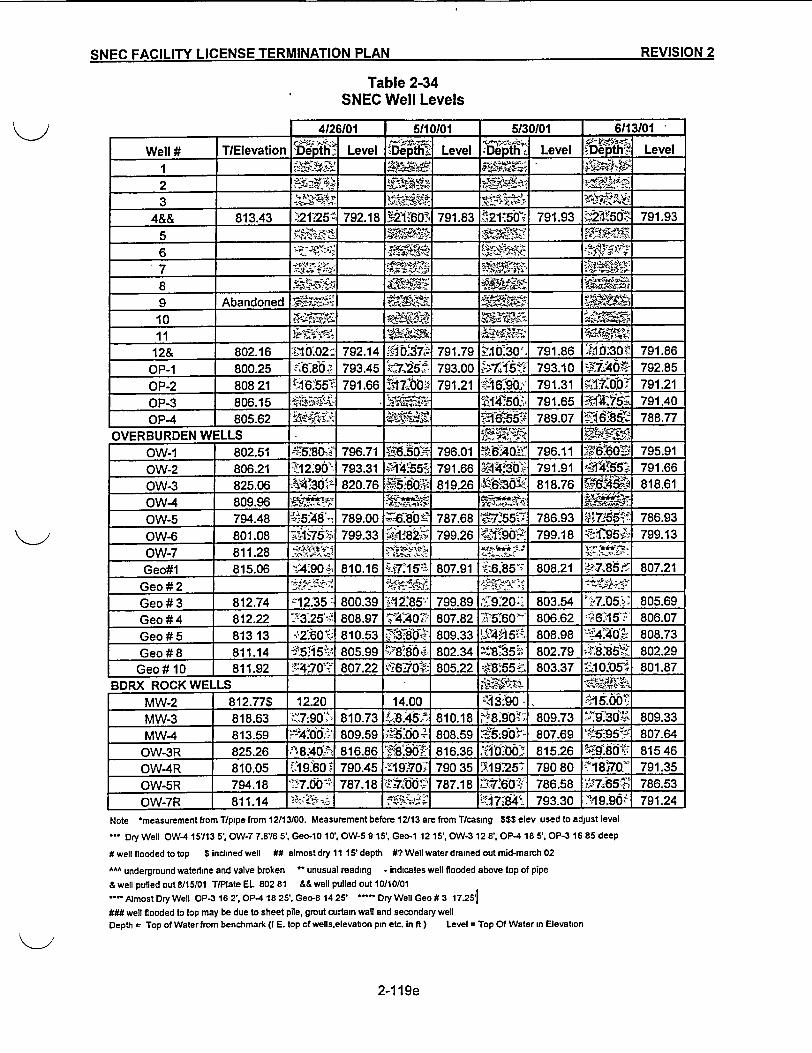
O:m~r. CA1,111 ITV I lr!F=M~z1 TFROUMANInklt PI ANI REVISION~t 2_J1tV-% UAt"0111L V I a .d .T.MMA IA Dl AMRFI5tfMCImLt ren.al-Ad I of,> .I ol~ *I- ||B roan,_,,,,
Table 2-34SNEC Well Levels
4/26101 5/10101 5130101 6113/01 |
Well# T/Elevation Dfph; Le Level CDept. Level1 R za__ __ ___ _ _ _ _
2_ _ _ _ _ _ , *-Xx4w ',?i -,7gr __ _
4&& 813.43 .21-54 792.18 N 2iC*6OW 791.83 ^z2lf5d S 791.93 *21 50 791.93
9 Abandoned VD,-- .10 _ _ _ _ _ _' _
1 1 _ _ _ _ _ _ _ _ _ _ _ _ _ _ _ __'
12& 802.16 ?1.02^ 792.14 0b-7 , 791.79 10.30'. 791.86 1iJ 03 0 i 791.86OP-1 800.25 -6.80. 793.45 .725- 793.00 715 793.10 ,74O* 792.85OP-2 808 21 §-16`55't 791.66 -BI7C0o2 791.21 -1690, - 791.31 q1 !,',0 R 791.21OP-3 806.15 :m _ _ _ . A4:50:7' 791.65 :i'54_.75z 791.40OP-4 805.62 , _____ _ 789.07 0!;Z' 788.77
OVERBURDEN WELLS __ __ __
OW-1 802.51 r95'80,-_ 796.71 YM.0V 796.01 .-N.401• 796.11 -W 1i.U~tq 795.91OW-2 806.21 '12.909% 793.31 OU 5 Z 791.66 # 791.91 •i;5 791.66OW-3 825.06 -4.30 820.76 RR5401'! 819.26 6 818.76 f6f4id % 818.61OW-4 809.96 . ____ ____ . _
OW-5 794.48 5 48W 789.00 -6.8O• 787.68 ! 255i 786.93 ? 786.93OW-6 801.08 5175w 799.33 Z.4182.'i 799.26 5i.9O? 799.18 -C95- 799.13OW-7 811.28 ^ _ _ _ ,. ______
Geo#1 815.06 -.4.90 , 810.16 t7154 807.91 - 808.21 '7.85.< 807.21G eo#2 __ __ __ ____t_ _ __
Geo# 3 812.74 -12.35 z 800.39 ^1285: 799.89 ,R 9:'20 ' 803.54 W97 05. 805.69Geo #4 812.22 '`:125't 808.97 ¢~,WA40.[ 807.82 75.60' 806.62 -- 6.A 5: 806.07Geo #5 813 13 t2O.60vN 810.53 0-.§ 809.33 4!;i5-AX 808.98 4A0o 808.73Geo #8 811.14 15!i5:. 805.99 ;'988'0<- 802.34 4'.-35£ 802.79 J':8.'8&'.t'J 802.29Geo # 10 811.92 14'70'^. 807.22 5;?6:702.- 805.22 .,8.55 803.37 iJ0.205't 801.87
BDRX ROCK WELLS
MW-2 812.77$ 12.20 14.00 ;,i3 '90 _____ _ _0
MW-3 818.63 Z,7 90 0 810.73 *8:45i 810.18 *8.90W' 809.73 -9.30- 809.33MW-4 813.59 -4O.; 809.59 5:6006 808.59 .-:902 807.69 5954 807.64
OW-3R 825.26 ^;8:40 -- 816.86 ' 89 816.36 YTi'o06-o: 815.26 80- 815 46OW-4R 810.05 .19.'60' 790.45 -d19;7o.-' 790 35 19-254 790 80 *18i70. 791.35OW-5R 794.18 7.0' 787.18 77.17.60; 786.58 :7.65 786.53OW-7R 811.14 ___ ____ _ _ 17-f84". 793.30 Z-19.96'& 791.24
Note 'measurement from T/pipe from 12113/00. Measurement before 12113 are from Ticasing SSS elev used to adjust level
- Dry Well OW-4 15/13 5. OW-7 7.876 5', Geo-10 10'. OW-5 915', Geo-1 12 15', OW-3 12 8', OP-4 18 5', OP-3 16 85 deep
# well flooded to top S inclined well ## almost dry 11 15'depth #? Well water drained out mid-march 02
AAA underground waterline and valve broken - unusual reading - indicates well flooded above top of pipe& well pulled out 8/15101 T/Plate EL 802 81 && well pulled out 10/10/01* Almost Dry Well OP-3 16 2:. OP4 18 25', Geo-8 14 25' *- Dry Well Geo # 3 17.251### well flooded to top may be due to sheet pile, grout curtain wall and secondary wellDepth = Top of Water from benchmark (I E. top of wellselevation pin etc. in ft) Level = Top Of Water in Elevation
2-119e
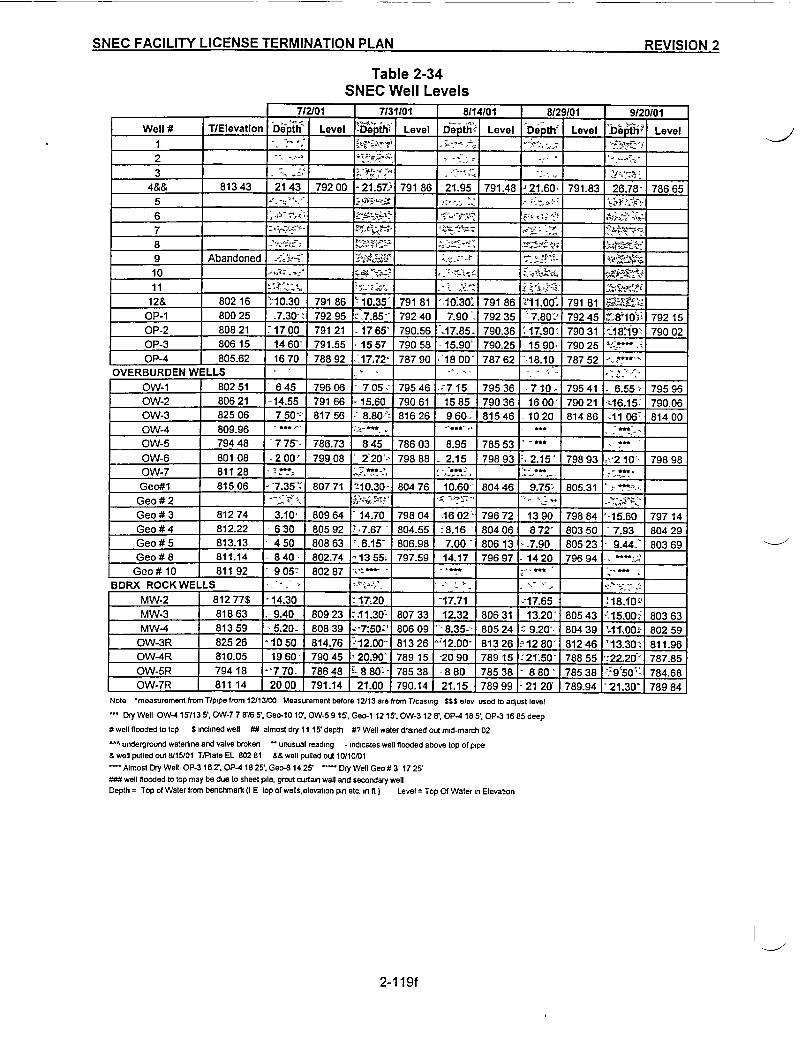
SNEC FACILITY LICENSE TERMINATION PLAN RF:VISOnm 2SNEC FACILITY LICENSE TERMINATION PLAN PF�Il�IAM -)
Table 2-34SNEC Well Levels
F 712101 7131101 8114/01 8129101 9120101Well # TlElevation Depth' Level -Depth: Level Depth Level Depth Level De t ' Level
2 -- -3 -_ __* _-,_s
4&& 813 43 21 43 792 00 21.57, 791 86 21.95 791.48 21.60 791.83 26.78- 786 655 .
6 r*; .,-r4.;.. ____ 4'->'f7 ~-^ r.,,.-1 ..'-: . ,.
8 - .-- ".t . , , ,, '<*~l.> ,
9 Abandoned - . '
10 _ :-Z -' * ' '-
12& 802 16 10.30 79186 10.35' 79181 '-1030@ 79186 'lt100. 79181 vOP-1 800 25 7.30- 792 95 --7.85-- 792 40 7.90' 792 35 7.80' 792 45 81 792 15OP-2 808 21 17 00 791 21 17 65' 790.56 _17.85. 790.36 17.90' 790 31 18194 790 02OP-3 806 15 14 60- 791.55 15 57 790 58 -15.90' 790.25 15 90 790 25 .OP-4 805.62 16 70 788 92 . 17.72 787 90 -18 00- 787 62 -18.10 787 52 .
OVERBURDEN W LLS - -. ._OW-1 802 51 6 45 796 06 -7 05 - 795 46 ^.i7 15 795 36 - 7 10 - 795 41 6.55 795 96OW-2 806 21 -14.55 791 66 -15.60 790 61 15 85 790 36 -16 00' 790 21 -;16.15 790.06OW-3 825 06 7 50'- 817 56 8.80- 816 26 9 60 815 46 -10 20 814 86 11 06- 814 00OW-4 809.96 . ,., " - *OW-5 794 48 7 77-- 786.73 8 45 786 03 8.95 785 53 - -,OW-6 801 08 -2 00' 799 08 2 20'- 798 88 2.15 798 93 I. 2.15' 798 93 .- '2 10' 798 98OW-7 811 28 ' : 2..-,. _____
Geo#1 815 06 -'7.35 '. 807 71 ':10.30- 804 76 10.60- 804 46 9.75; 805.31 ...Geo#2 -X _ Ž 2 ' .-,-,> t, -_ ,
Geo # 3 812 74 3.10 809 64 - 14.70 798 04 -16 02- 796 72 13 90 798 84 '-15.60 797 14Geo#4 812.22 630 805 92 . 7.67 804.55 .8.16 - 804 06 8 72' 803 50 7.93 804 29Geo #5 813.13 - 4 50 808 63 -. 6.15' 806.98 7.00 806 13 -.7.90 805 23 - 9.44.' 803 69Geo#8 811.14 - 8 40 - 802.74 -13 55 797.59 14.17 796 97 14 20 796 94 .Geo # 10 81192 9 05'- 802 87 . - -. ;
BDRX ROCK WELLS , - -f. - . '-= -.
MW-2 812 77$ '14.30 17.20 -17.71 217.65 '18.10 ' -MW-3 818 63 9.40 809 23 . 1.30- 807 33 12.32 806 31 13.20- 805 43 -'.15.00i 803 63MW4 813 59 6.20- 808 39 ;-7:50;' 806 09 '- 8.35-- 805 24 9.20'1 804 39 L 1f;00. 802 59
OW-3R 825 26 '10 50 814.76 12.00- 813 26 '12.00- 813 26 -12 80- 812 46 -'13.30' 811.96OW4R 810 05 19 60' 790 45 20.90- 789 15 -20 90 78915 '21'50- 788 55 -:22.20 787.85OW-SR 794 18 -770 78648 8 80- 785 38 - 8 80 785 38 8 80 ' 785 38 -9'50 " 784.68OW-7R 811 14 20 00 791.14 21.00 790.14 21.15 789 99 - 21 20- 789.94 ' 21.30' 789 84
Note 'measurement from Tlpipe trom 12/13100 Measurement before 12/13 are from T/casing S$S elev used to adjust level
-- Dry Well OW4 15 113 5', OW-7 7 8'/6 5. Geo-10 1a0 OW-5 9 15', Geo-1 1215'. OW-3 12 8', OP4 18 5. OP-3 16 85 deep
#well flooded to top $ inclined well W# almost dry 11 15'depth # Well water drained out mid-march 02
- underground waterline and valve broken - unusual reading - indicates well flooded above top of pipe& well pulled out 8/15101 TlPlate EL 802 81 && well pulled out 10/10/01
Almost Dry Well OP-3 16.2'. OP-A 18 25. Geo-8 14 25' - Dry Well Geo # 3 17 25'### well flooded to top may be due to sheet pile, grout curtain wall and secondary wellDepth = Top of Waler from benchmark (I E top of wells,elevation pin etc. in nf) Level = Top Of Water in Elevation
2-1 1 9f
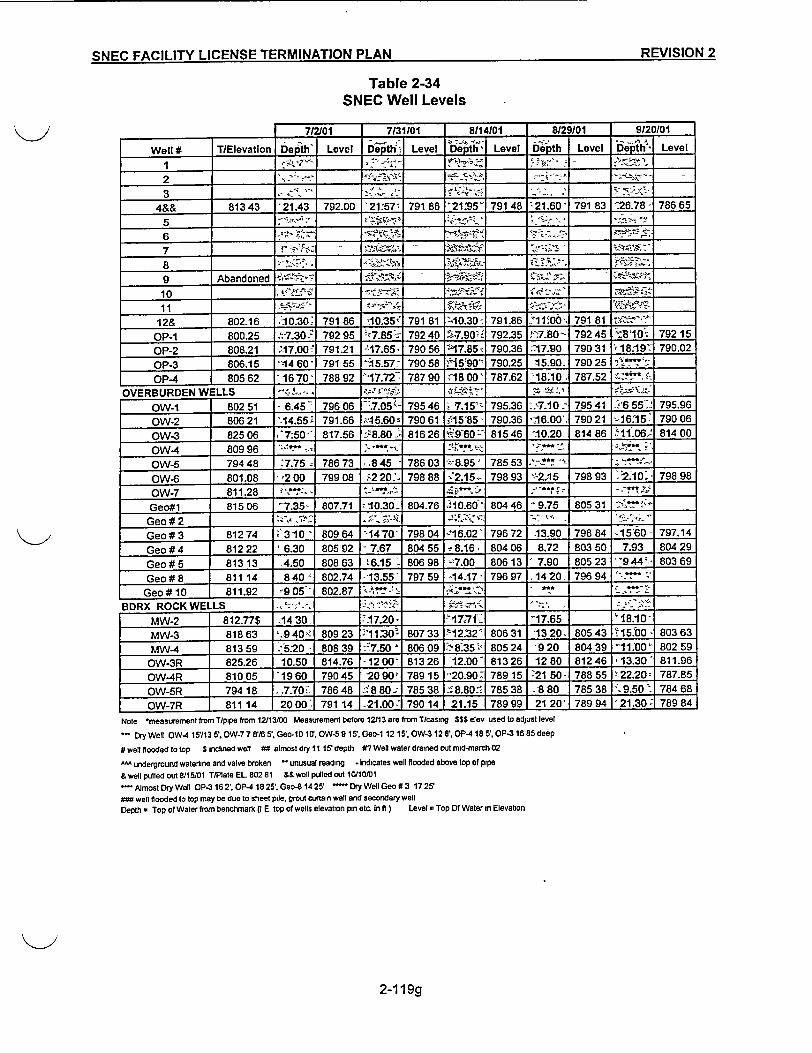
emFr- =Arll ITV I ICFMSE TFRMINATION PLAN REVISION 2
Table 2-34SNEC Well Levels
I f712101 I 7131101 8114101 8129101 9120101
DS.v epth -@th bijh-s Le v |-Well # T/Elevation Depth' Level DOWi Level Deth; Level Depth Level Depth Level
4&813 43 '21.43 792.00 21:57t 791 86 -21t95' 791 48 21.60 791 83 C-26.78 - 786 65
1 ~ ~ ~ ~ ~ ~ ~ *-,~ _____<a_,_.+ + ;,
9 Abandoned -ta _____ -~. , -t; . , , :.
10 , te¢s. _____ _ - -,- _ ,:'", '- _____ '* *t-,-
12& 802.16 .10.30. 79186 u10235" 791 81 --10.30 791.86 '11.O00 79181 ;.W'ROP-1 800.25 ~,7.30.S 792 95 7.5 - 792 40 ~.7 -790>> 792.35 f^>7.80-- 792 45 'z'10 4 792 15OP-2 808.21 .'17.00 ' 791.21 -17.65 790 56 - 17.854 790.36 --17.90 790 31 ' 18.19w 790.02
OP-4 805 62 1 670' 788 92 -17v72 - 787 90 18tB00' 787w62 -18w10 787.52 . _____
OVERBURDEN WELLS e. 4 __ ___ ..- P, t,-za5 _~atvu.
OW-1 802 51 6.45 e796 06 *7.05-; 795 46 't7.15'' 795.36 -,'7.10: 795 41 2'6 552 795.96
OW-2 806 21 '.14.55 -791.66 ,--15.60o 790 61 715'85' 790.36 ':216.00' 790 21 -16Z15 790 06
OW-3 82506 '7;50<' 817.56 38.80 816 26 69-60 ' 815 46 10.20. 814 86 t-11.06S- 814 00
OW-4 8 09 96 s ____ ;-¢~ - :.**~ - s :" tf. _.
OW-5 794 48 :'7.75 786 73 .8 45 -786 03 *2w-8 95 ' 785 53 au "*l ~ v>
OW46 801.08 '2 00 799 08 ; 220:' 798 88 -'2.15- 798 93 '-2.15 798 93 :2.10: 798 98
OW~7 811.w28 i'~ t ___ - * >4t>g - ** Ss
Geo#1 815 06 '-7.35- 807.71 1 0.30. 804.76 .w10.60 ' 804 46 9.75 805 31 w i
Geo #2 *> 9> ___ '-_:Q; f-:'-" * s.e, . -e -- ,- s
Geo #3 812 74 E 310 809 64 14 7Q' 798 04 -'1 6.02' 796 72 13.90 798 84 .15'60- 797.14
Geo # 4 812 22 ' 6.30 805 92 7.67 804 55 e' 8.16. 804 06 8.72 803 50 7.93 804 29
Geo # 5 813 13 -4.50 808 63 t6.15 .806 98 '>7b00 80613 ' 7.90 805 23 ' 9 44'< 803 69Geo #8 811 14 8 40~ 802.74 -13.55 ' 797 59 {14v17 796 97 -14 20. 796 94 -"**
Geo #10 811.92 '905 ' 802.87 - ;** ai t * . >_
MW-2 812.77S ~1430 ___ p17.20' _ -"17*71- 17.65 ~ 18.1D-
MW-3 818 63 '.9 40 7, 809 23 .'1130 807 33 9-12'32' 806 31 '1320. 805 43 5-15.^00- 803 63
MW-4 813 59 5S20 808 39 ' 7.50-o 806 09 -'t835 t 805 24 '9 20 804 39 '-11.U00 802 59
OW-3R 825.26 10.50 814.76 - 120W0' 813 26 12*00 '813 26 12 80 812 46 13.30' 811.v96
OW-4R 810 05 '1960 79045 -2090' 78915 2090. 78915 21 50- 788 55 '-22.20 787.85
OW-5R 794 18 ..7.702. 786 48 i'8 80:_ 785 38 ^;8o80 ''785 38 .880 785 38 x.9.50 ^ 784 68
OW-7R 811 14 20 00 791 14 .21tW0- 790 14 2115 789 99 21 20' 789 94 '21.30:- 789 84Note measurement from T/pipe from 12/13/00 Measurement before 12/13 are from T/casing $$$ elev used to adjust level
'a DryWel OW415'1135'.OW-778'/6o 5Geo-10 IOW-5915' Geo-1 1215' OW.3128' OP4 18 5. OP31685deep
# well flooded to top $ inclined well ## almost dry 11 15' depth O? Well water drained out mid-march 02
underground waterline and valve broken unusual reading - Indicates well flooded above top of pipe
& well pulled out 8/15/01 T/Plate EL 802 81 && well pulled out 10/10/01
Almost Dry Well OP.3 16 2'. OP.4 18 25'. Geo-8 14 25' Dry Wet Geo # 3 17 25'N# well flooded to top may be due to sheet pile, grout curtain wall and secondary wellDepth = Top of Waler from benchmark (1 E top of wells elevation pin etc. In It) Level = Top Of Water in Elevation
2-119g
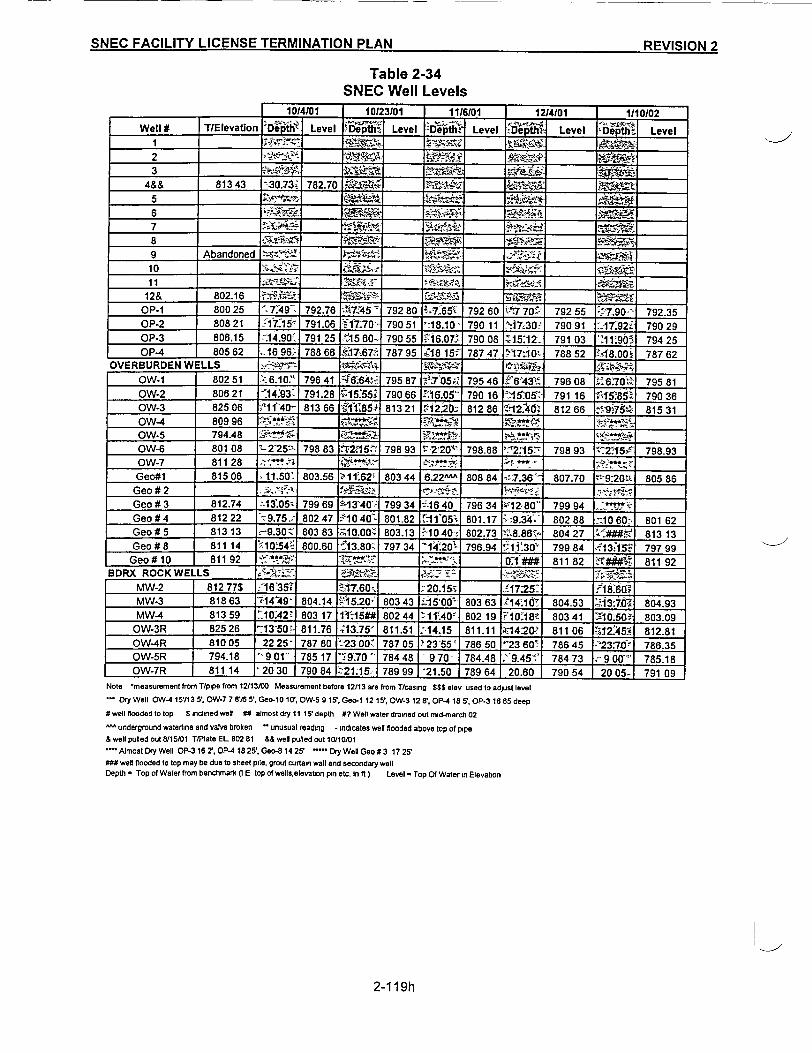
SNEC FACILITY LICENSE TERMINATION PLAN DpCl-AlnM ')
Table 2-34SNEC Well LevelsI *1'
'I U14101 10123101 I 1116101 1214101 1110102Well # TEleva_ onLe Dph Level eDethti Level D ep~th, Level fDep Level
2 r3 _ _ _ ', t"
4 8& 813 43 20.736. 782.70 fV IŽ"__
6 ; ~ '. ___ __9t~&i-
7 _ _ _ _ _ i ~ = 9 a;
8 _ _ _ _ _ _ _ _ _ t '
9 Abandoned L @F _b. ___ . __ __
1 0 ___ __ < ' ___ ___ ___ ______vtNsF ~E ;
1 1 _ _ _ _ - 2.- - _ _ _ 6 _ _ _ *R---.' _ _ _ _ _ _
12& 802.16 s-, "~- _____^ __ "- crv_____ e~ ______
OP-1 800 25 -l749' 792.76 7.J~t~5 792 80 3- 7 654 792 60 t-7 70Z- 792 55 '<.7 90-~ 792.35OP-2 808 21 17:154 791.08 -^17170 790 51 -18.10- 790 11 -17c30~ 790 91 ' 17.92i 790 29OP-3 806.15 ;-14.90 791 25 t~15 60 790 55 61607> .790 08 ZI5:12 791 03 *11'9Ot 794 25OP-4 805 62 16 96- 788 66 017.67.- 787 95 -,1815f 787 47 ,N17:10t 788 52 r-f8.00o 787 62
OVERBURDEN WELLS * f+ .ff --'.r}~
OW-1 802 51 6 610. 796 41 4f6.64t- 795 87 : k7'05g 795 46 i<6 43~ 796 08 ,6:70v 795 81OW-2 806 21 '14'93 791.28 w>A5 55; 790 66 i'16&05" 790 16 -15<054- 791 16 1'X5.85t 790 36OW-3 825 06 ,1140 813 66 1t,85i 813 21 ti-2.20s 812 86 Z-12?4Q; 812 66 X'9;75S 815 31OW- 809 96 , .,,;tit2@t'OW-5 794.48 ,~* __ _ Q." ,> _ * t = tQ <_
ow-6 801 08 2 25- 798 83 w2-.15¢ 798 93 r-2 20' 798.88 .2.15~ 798 93 V'2.ts. 798.93
Geo#1 815 06 > 1150'. 803.56 '11 62' 803 44 6.22" 808 84 -p7:36 807.70 r:9:20~ 805 86Geo #2 ___ ___ R =-tM' "-^"D- .r
Geo #3 812.74 ,13'05: 799 69 's13'40r 799 34 .'16 40 796 34 '-12-80 799 94 V_. ____
Geo #4 812 22 -9.75.; 802 47 -l040 801.82 .t1105'X 801.17 * 9 34 802 88 b10 60. 801 62Geo#5s 813 13 - 9.30- 803 83 >10.00 803.13 ,10 40 802.73 za8.86 804 27 '###.' 813 13Geo #8 811 14 "10'54' 800.60 '213.80~ 797 34 1420'i 796.94 ',11i 30) 799 84 ,*13'1S- 797 99Geo#10 811 92 t'-,£ _ * s" *' 0.f## 811 82 ~~T# 811 92
BDRX ROCK WELLS ____ ,,. ___ _____ ______~;-
MW-2 812 77$ -16735? t17.602 . 20.15> £17;25 ___________
MW-3 818 63 .14'49' 804.14 215.20' 803 43 ,415'00 803 63 < 14 10 804.53 1°3 70t 804.93MW-4 813 59 '10-A2' 803 17 11'.15##l 802 44 '¢11.40' 802 19 t0i18' 803 41 -10.502 803.09
OW-3R 825 26 r 13-50,- 811.76 ~13.75' 811.51 .-14.15 811.11 t14>20z 811 06 <i2.45i 812.81OW-4R 810 05 22 25' 787 80 r23 008 787 05 ~2355f 786 50 ' 23 60 786 45 --23.70 786.35OW-5R 794.18 ' 9 01 78517 2970 ̂ 784 48 9 70 784.48 9 45k' 784 73 900o 785.18OW-7R -811 14 '20 30 790 84 :21.15. 789 99 '21.50 789 64 20.60 790 54 20 05- 791 09
Note 'measurement from T/pipe hom 12113100 Measurement before 12113 are from Tlcasmg S$S elev used to adjust level
* Dry Well OW-t 15/13 5. OW-7 7 i8 5'. Geo-10 10. OW-5 9 15', Geo-1 12 15'. OW-3 12 8r. OP-4 18 5. OP-3 16 85 deep
6 well flooded to top $ inclined well U# almost dry 11 1 S depth #? Wen water drained out mid-march 02
underground watetline and valve broken - unusual reading * tndicates well flooded above top of pipe& well pulled out8/15/01 T/Plate EL 80281 &&welt pulled out10v10/01
AlmostDry Well OP-3 168Z. OP-4 1S2S' Geo-8 1425 '....DryWetGeo#3 1725'!## wet flooded to top may be due to sheet pile, grout curtain wall and secondary well
Depth 5 Top of Waler from benchmarik (I E top of wellselevabon pin etc in f) Level = Top Of Water in Elevation
l -
2-119h
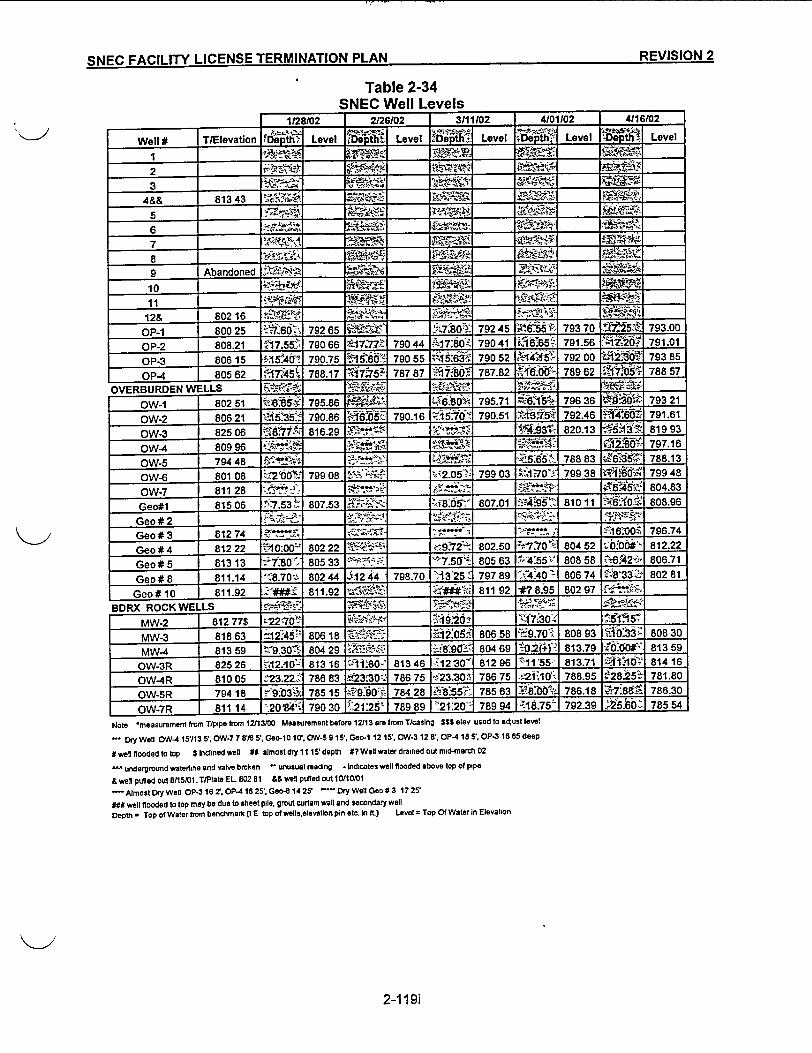
C-L111T.- lif A r-111 1rV I 1f1=MCr- TPORMIMATInM Pi AN REVISION 2OeMF-%'- 170%%fEI v I ir .- MQ..- T.~~sll Dl Ahi. REVIION
Table 2-34SNEC Well Levels
r . . - .. _ -. .,1128102 I 2126102 3111/02 4101J02 411 6/02
Well TlElevation _ Level L I _ Level Level p Level
12 7- 15-
3
4e& 813 43 .iSiLf':@-95 _ _
6 -__ _t_
7 14AI-
Abandoned i . i.
10 __ _ , 3.s -I.-'k
12& 802 16 i '
OP-1 800 25 '7'60; 79265 ;___ 71801-y 79245 .6 55- 793 70 7t.5Z 793.00
OP-2 808.21 Aj755 79066 1777.7 79044 7908802 79041 5T7.65 79156 17t0- 791.01
OP-3 806 15 JA5e40d 790.75 156O 79055 A15 63 79052 -4t5 - 79200 1i.2!d 6 79385
OP-4 80562 r¶T45 788.17 -tj7f75" 78787 7.8 787.82 1'&00 78962 788 57
OVERBURDEN WELLS _ _ c .
OW-1 80251 795.6 i_ 6 795.71 -61&t 79636 tl' i 79321
OW-2 80621 '1f5!35: 790.86 790.16 5.7V 790.51 X1~'75~ 792.46 -i460Z 791.61
OW-3 82506 N6117A 816.29 TQ!t 'Fi43+ 820.13 819 93
OW-4 809 96 ,- aa r i -i28 797.16
OW-5 794 48 .w 's _ _; - ' T5' 788 83 -6Xd5' 788.13
OW-4 801 08 '2-00, 799 08 I G- 2.05 799 03 Akt4d70: 799 38 -f#d' 79948
OW-7 811 28 r,, ___ ______ -'- --",_____ 5 ' 804.83Geo#1 815 06 1 7.53 807.53 Z __ .-48.05 807.01 495 81011 -:§.-X 808.96
Geo#2 1 :_ -
Geo#3 812 74 .7 "- f $.6W006 796.74
Geo#4 812 22 r10-00 802 22 -'*5 ___ .9.72 802.50 Ti770 804 52 bo0 00 812.22
Geo#5 813 13 780 805 33 ! _ "7.5Us 805 63 *';4 55VJ 808 58 ;746A2t. 806.71
Geo#8 811.14 `->8.70 802 44 w.01244 798.70 A1325 797 89 /,t4'40 806 74 8133-7 802 81
Geo#10 811.92 811.92 ; s . .g 811 92 *#?8.95 802 97 f4X~M
BDRX ROCK WELLS 1-.s _ ____
MW-2 812 77$ t22 -70T19 - ,1,9A 20. '2-17.30' 5 5
MW-3 818 63 42"45 80618 !c~ -12055 806 58 Gi9,70-S 808 93 -t0233- 808 30
MW-4 813 59 Z9.30': 804 29 r~'U c- -89d 80469 02(+)- 81379 -&000. 81359OW-3R 825 26 -A 2A-10 813 16 1180 813 46 12W30 812 96 t11'55- 813.71 fi1 '-I 814 16
OW-4R 810 05 *23.22^s 786 83 E-t23.301. 786 75 - 23.30 78675 ;2i 10 788.95 r28.25 781.80
OW-5R 794 18 rt9 03"k 78515 1 9.90:' 784 28 , 785 63 ,,8 b0-' 786.18 -7`8&2 786.30
OW-7R 811 14 '20784- 79030 2 2 78989 2120' 78994 187 792.39 15.60Z 785 54
Note 'measurementfrom Tlpipe from 12tt3100 Measurement before 12)13aretromT/casing S$S elev used to adjust level
-- DryWelt OW4 115713 5,OW778'/6 S',Geoo-10 10'.OW-5 15', Geo-1 12 15', OW312 8', OP.418 5. OP-3 1685deep
# well flooded to top S Indined well #8 almost dry 1115' depth #? Well water drained out mid-mardc 02
- underground waterline and valve bmken - unusual reading - Indicates well flooded above top of pipe
& well pulled out 8/15101. T/Plate EL 802 81 && well pulled out 10110/01
AlmostDryWell OP-316ZOP4 1B25'.Geo-8 1425' ODryWellGeo#3 1725'
### well flooded to top may be due to sheet pile, grout curtain wall and secondary well
Depth = Top of Water from bendimark (a E top of wellselevahn pin etc. in ft) Level = Top Of Water In Elevation
2-119i
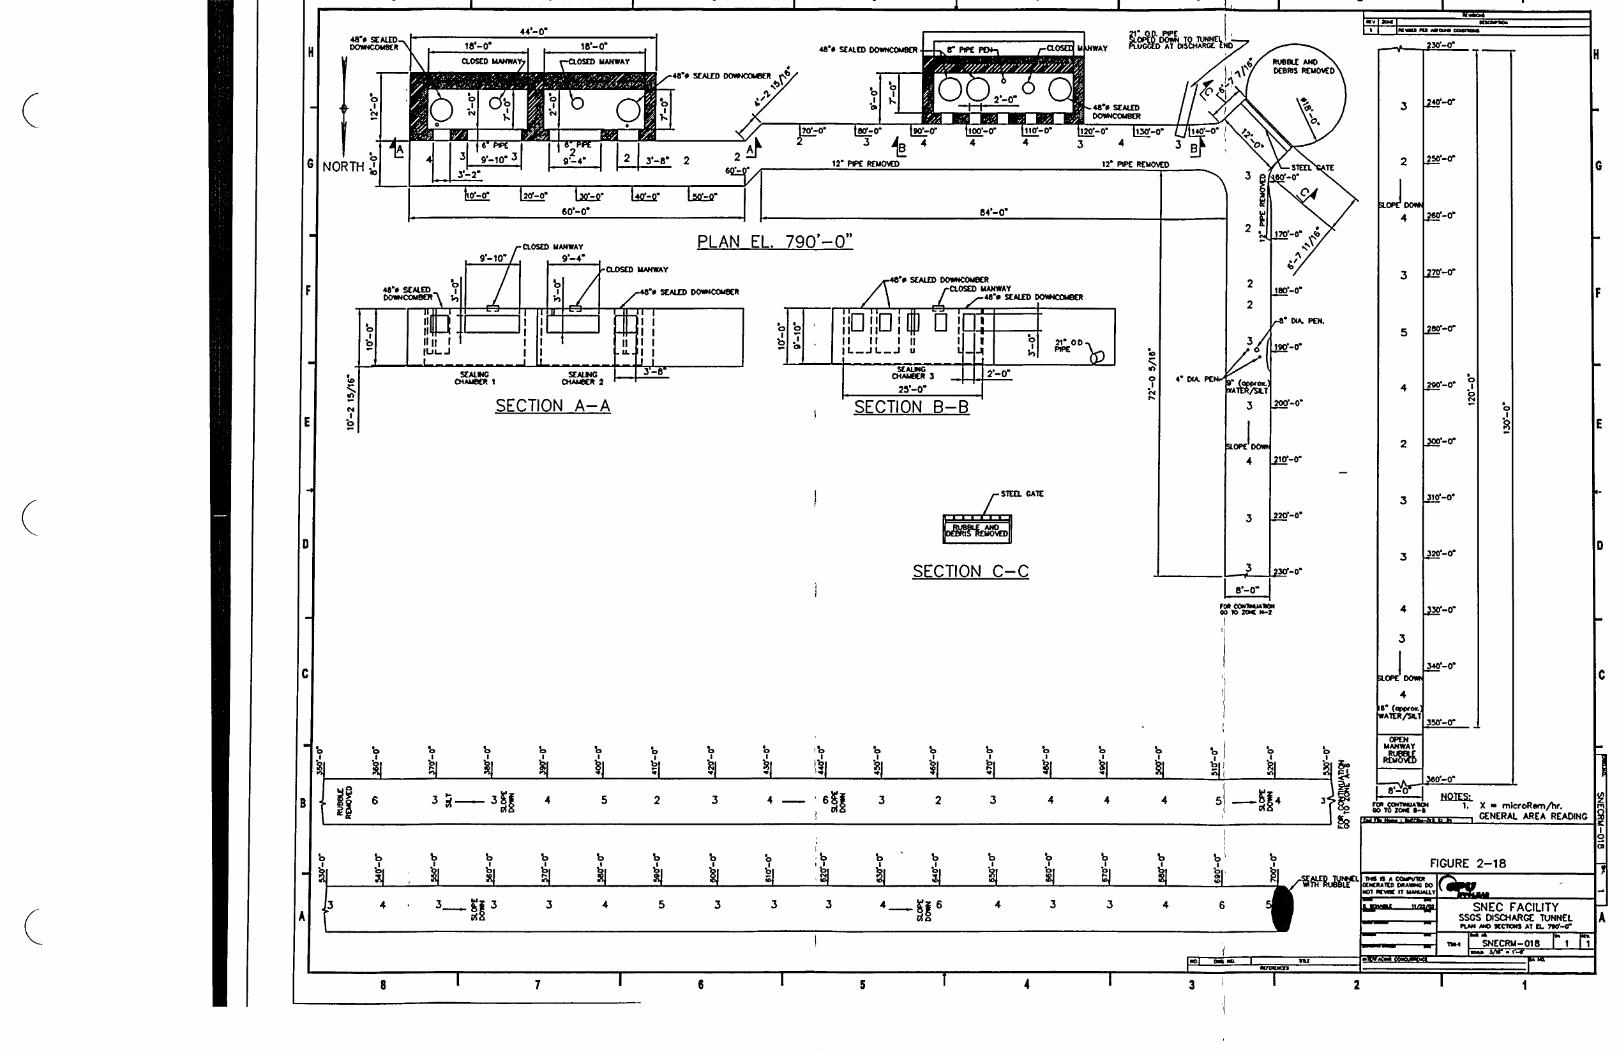
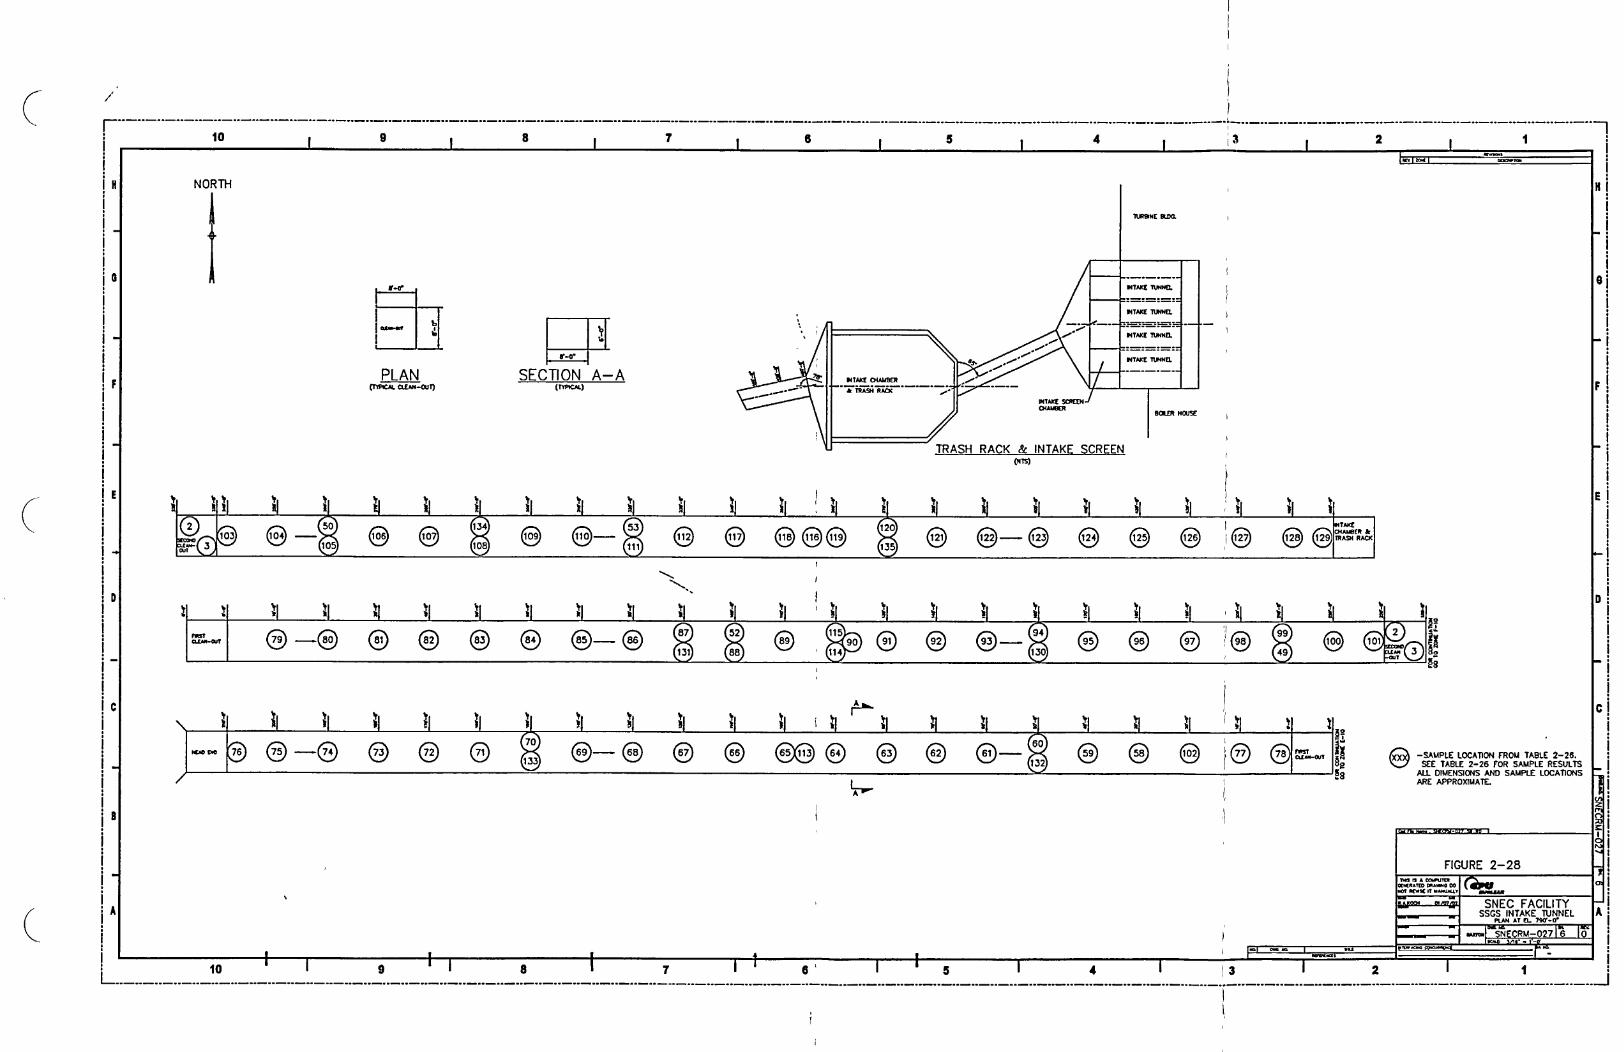
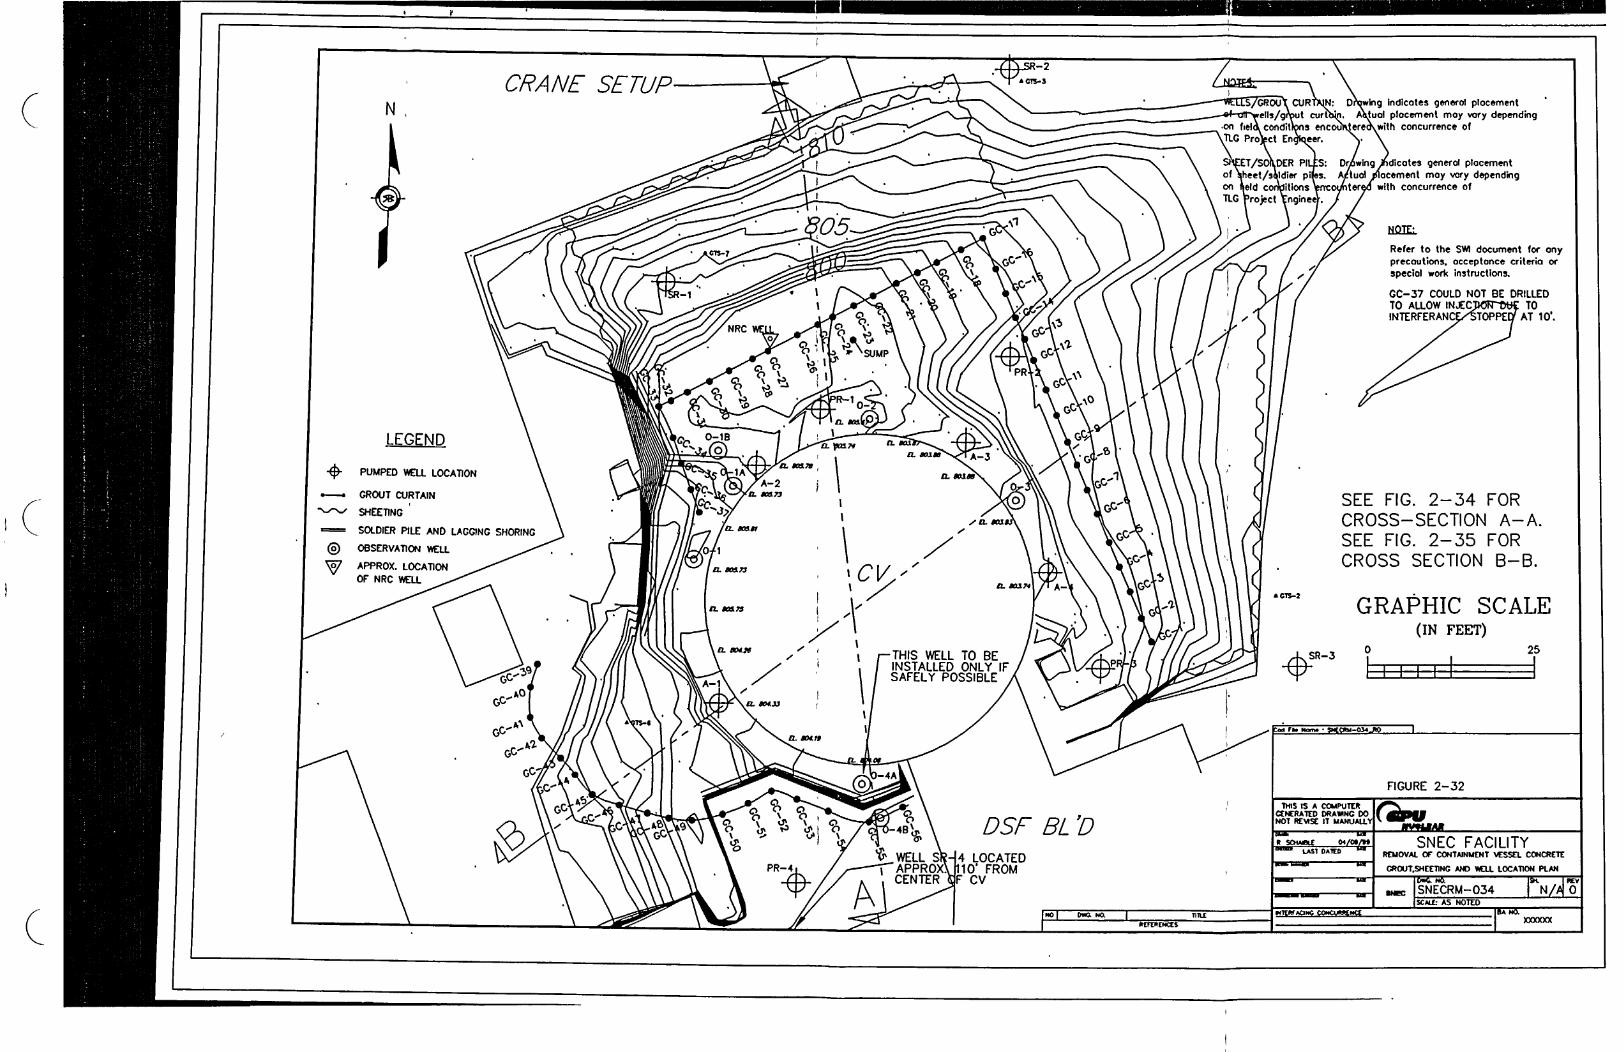
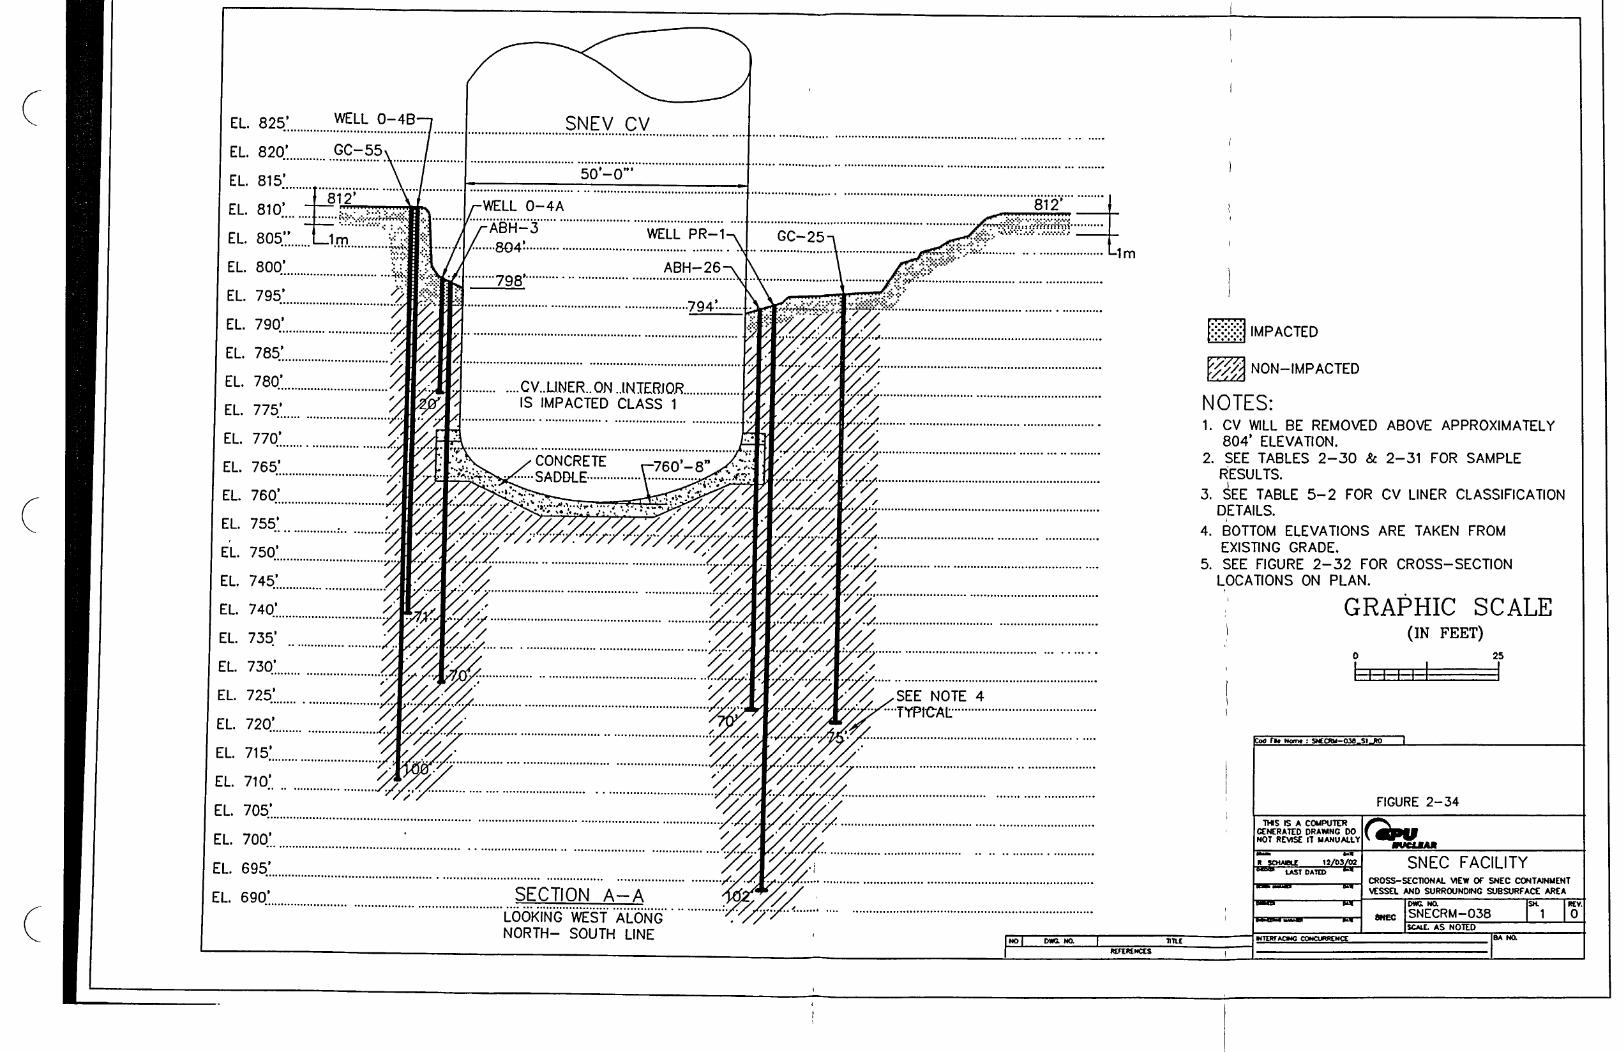
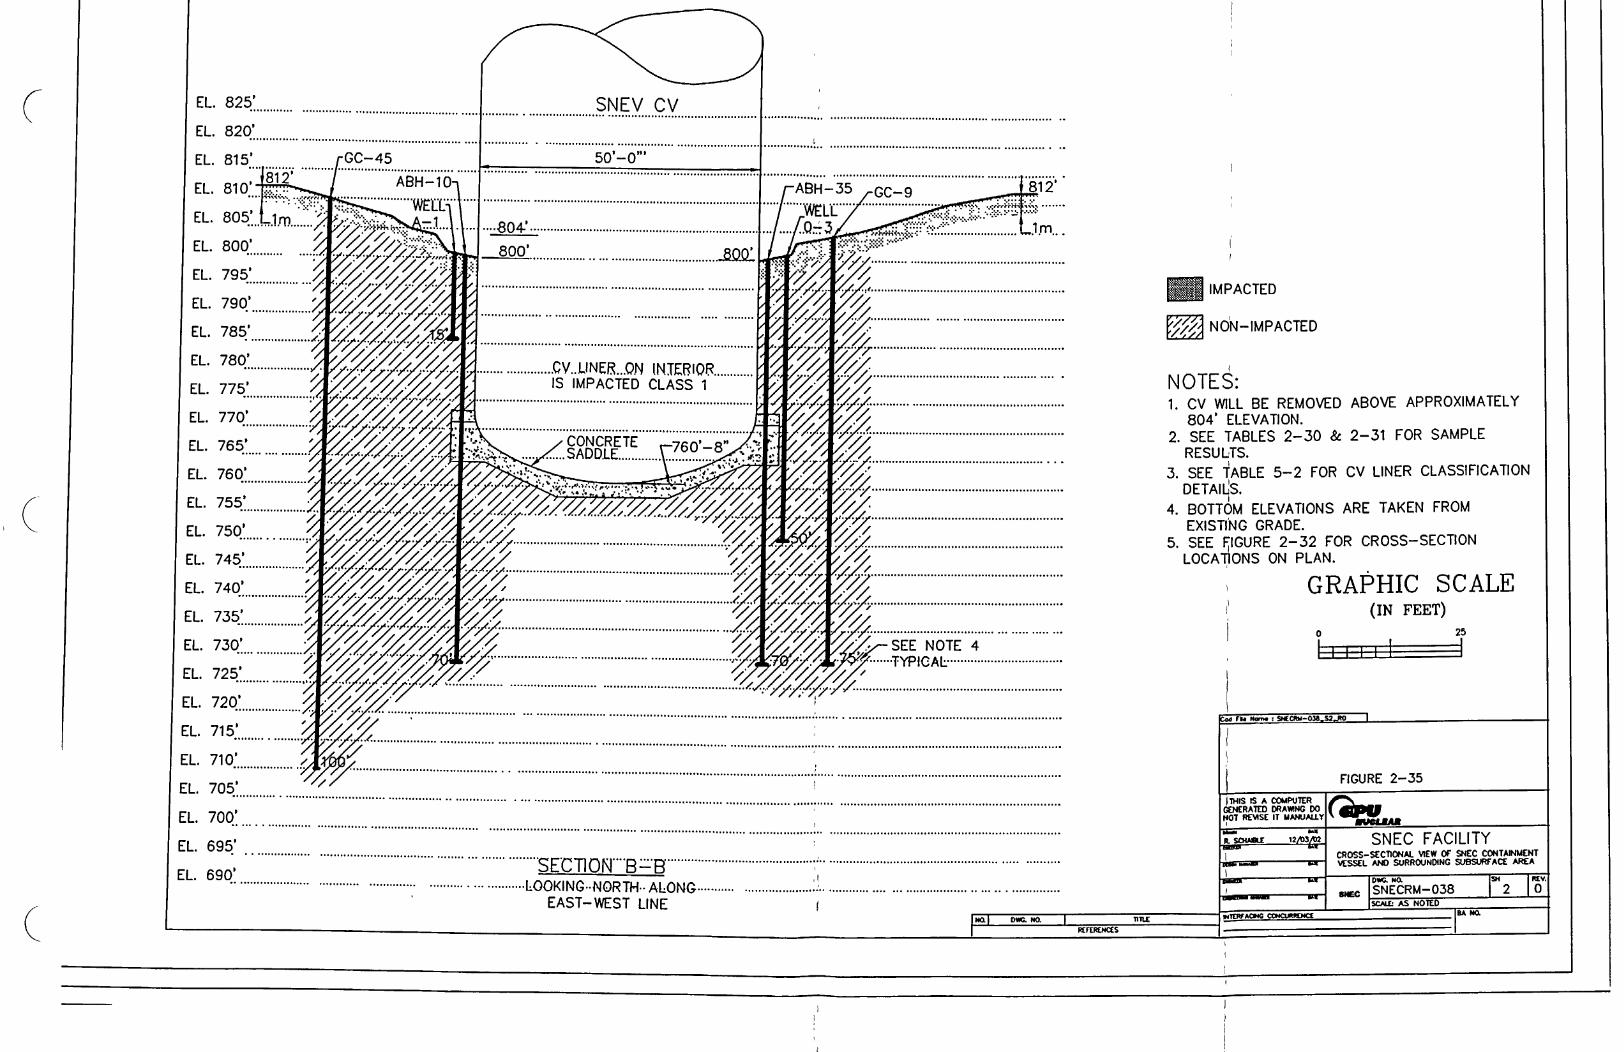
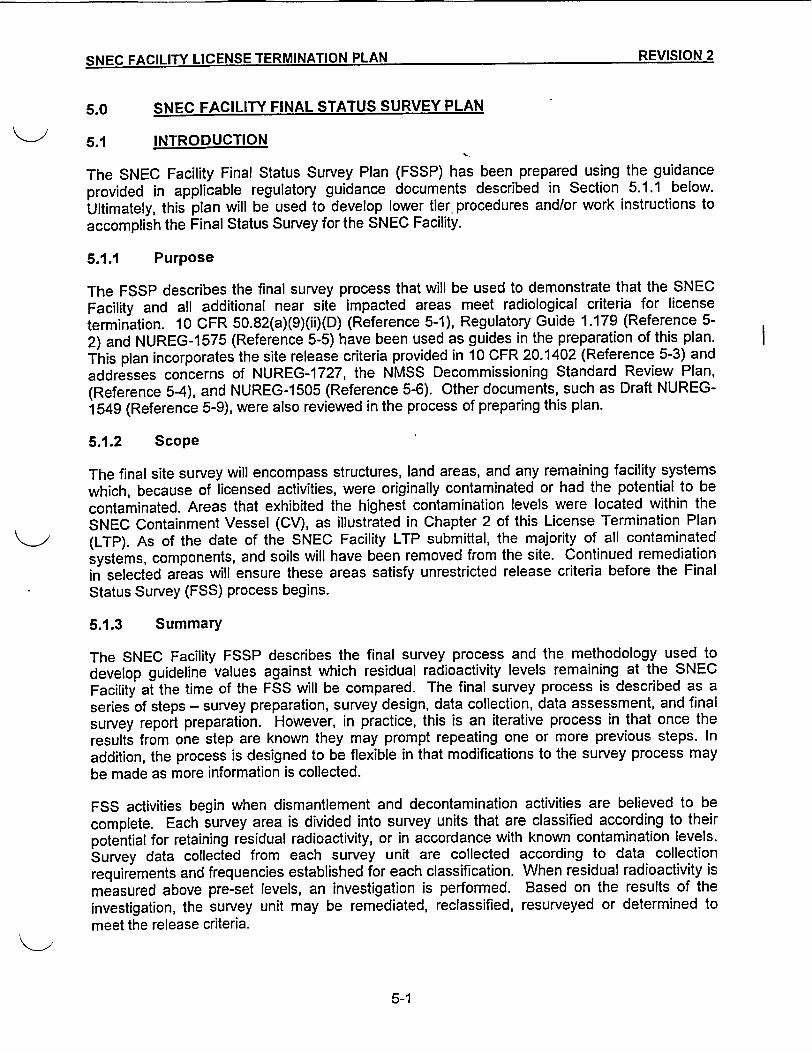
t1L1=f1 rA fll I1V I If=FNR TPORAMIATInM N PAN REVISION 2rPI . r '- .L | - .... * .. . l. .
6.0 SNEC FACILITY FINAL STATUS SURVEY PLAN
5.1 INTRODUCTION
The SNEC Facility Final Status Survey Plan (FSSP) has been prepared using the guidanceprovided in applicable regulatory guidance documents described in Section 5.1.1 below.Ultimately, this plan will be used to develop lower tier procedures and/or work instructions toaccomplish the Final Status Survey for the SNEC Facility.
5.1.1 Purpose
The FSSP describes the final survey process that will be used to demonstrate that the SNECFacility and all additional near site impacted areas meet radiological criteria for licensetermination. 10 CFR 50.82(a)(9)(ii)(D) (Reference 5-1), Regulatory Guide 1.179 (Reference 5-2) and NUREG-1575 (Reference 5-5) have been used as guides in the preparation of this plan.This plan incorporates the site release criteria provided in 10 CFR 20.1402 (Reference 5-3) andaddresses concerns of NUREG-1727, the NMSS Decommissioning Standard Review Plan,(Reference 5-4), and NUREG-1505 (Reference 5-6). Other documents, such as Draft NUREG-1549 (Reference 5-9), were also reviewed in the process of preparing this plan.
5.1.2 Scope
The final site survey will encompass structures, land areas, and any remaining facility systemswhich, because of licensed activities, were originally contaminated or had the potential to becontaminated. Areas that exhibited the highest contamination levels were located within theSNEC Containment Vessel (CV), as illustrated in Chapter 2 of this License Termination Plan(LTP). As of the date of the SNEC Facility LTP submittal, the majority of all contaminatedsystems, components, and soils will have been removed from the site. Continued remediationin selected areas will ensure these areas satisfy unrestricted release criteria before the FinalStatus Survey (FSS) process begins.
5.1.3 Summary
The SNEC Facility FSSP describes the final survey process and the methodology used todevelop guideline values against which residual radioactivity levels remaining at the SNECFacility at the time of the FSS will be compared. The final survey process is described as aseries of steps - survey preparation, survey design, data collection, data assessment, and finalsurvey report preparation. However, in practice, this is an iterative process in that once theresults from one step are known they may prompt repeating one-or more previous steps. Inaddition, the process is designed to be flexible in that modifications to the survey process maybe made as more information is collected.
FSS activities begin when dismantlement and decontamination activities are believed to becomplete. Each survey area is divided into survey units that are classified according to theirpotential for retaining residual radioactivity, or in accordance with known contamination levels.Survey data collected from each survey unit are collected according to data collectionrequirements and frequencies established for each classification. When residual radioactivity ismeasured above pre-set levels, an investigation is performed. Based on the results of theinvestigation, the survey unit may be remediated, reclassified, resurveyed or determined tomeet the release criteria.
5-1
SqNFQ FACILITY LICENSE TERMINATION PLAN RFVIMMKI 1�NFC FACILITY LICENSE TERMINATION PLAN �3�II�tflM 4
There are three principal types of survey results collected during the FSS effort. They are 1)scan measurement data, 2) fixed-point measurement data, and 3) sampling of volumetricmaterials for laboratory analysis. In-situ gamma-ray spectrometry may also be included in therelease survey process as well asthe results of any special measurements or analysis.Statistical testing criteria for special measurements will be applicable to the survey methodsused. All collected data are first verified to be of adequate quantity and quality, capable ofsupporting underlying assumptions necessary for statistical testing. Where necessary, previoussurvey steps are re-evaluated. Each survey unit will then be tested and compared to the releasecriteria. To meet the release criteria, the survey data must pass the statistical tests applied.When the data set fails statistical testing criteria, the survey unit is not suitable for unrestrictedrelease without further actions.
Upon completion of FSS activities, a final survey report will be prepared which summarizes thedata. The report will document the conclusion that the SNEC Facility and near site areas meetthe 10 CFR 20.1402 release criteria and may be released for unrestricted use.
5.2 SURVEY OVERVIEW
This section describes the scope and methodology of the final survey process. It includesquality assurance measures and access control procedures. It also describes howimplementation of this plan will demonstrate that the remaining structures and site areas meetthe 10 CFR 20.1402 criteria for unrestricted release. Also described herein, are the methodsused to develop guideline values against which residual radioactivity levels will be compared.
5.2.1 Identity of Radiological Contaminants
The radionuclide inventory at the SNEC Facility was estimated during the initial sitecharacterization process, which was conducted between 1995 and 1996. Those data arecompiled in the SNEC Facility Site Characterization Report (Reference 5-7). Station WorkInstructions, site procedures, and Survey Requests have since been used to collect additionalsite characterization data. This more recently collected information is summarized in Chapter 2of this plan. All of the data were reviewed and a final radionuclide listing was developed. Referto Chapter 6, Section 6.2.2.3.
5.2.2 Site Release Criteria
5.2.2.1 Radiological Criteria for Unrestricted Use
These site release criteria correspond to the radiological criteria for unrestricted use given in 10CFR 20.1402, which are:
* Dose Standard
Residual radioactivity, distinguishable from background radiation and resulting in aTotal Effective Dose Equivalent (TEDE) to an average member of the critical groupwill not exceed 25 mrem/y, including that from groundwater sources of drinking water.
* ALARA Standard
Residual radioactivity will be reduced to levels that are As Low As ReasonablyAchievable (ALARA), as addressed in Section 6.4.
5-2
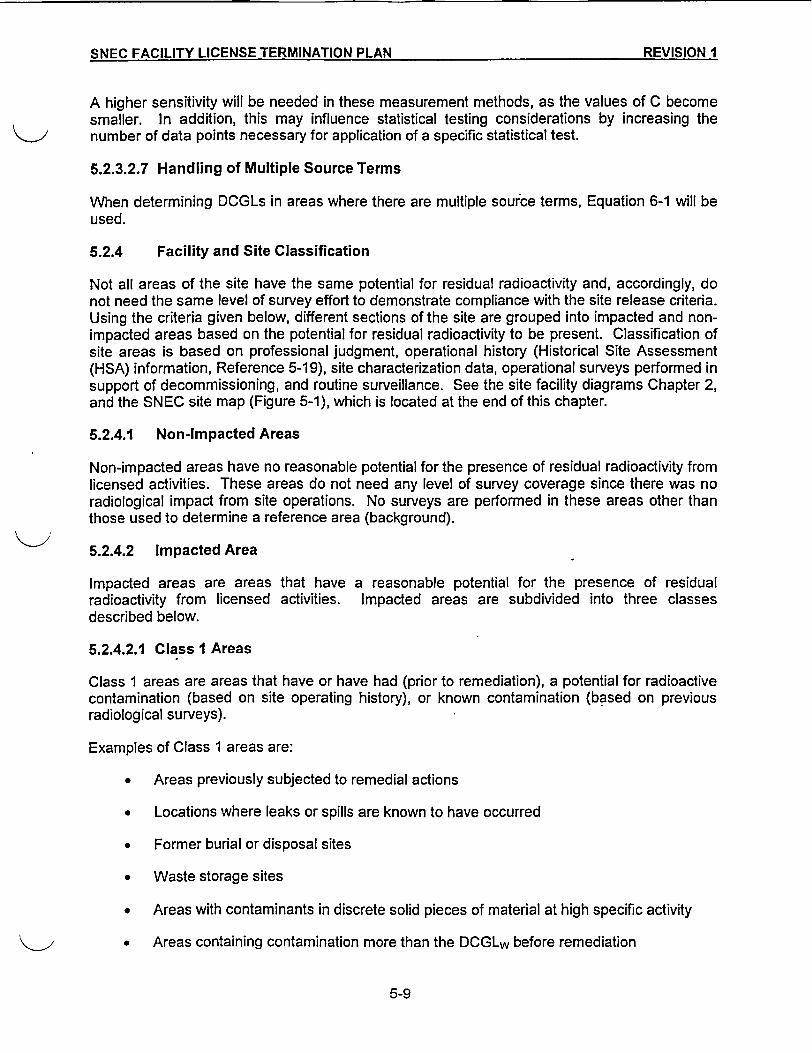
.qJC FACILITY LICENSE TERMINATION PLAN REVISION I�NEC FACILITY LICENSE TERMINATION PLAN REVISION I
A higher sensitivity will be needed in these measurement methods, as the values of C becomesmaller. In addition, this may influence statistical testing considerations by increasing thenumber of data points necessary for application of a specific statistical test.
5.2.3.2.7 Handling of Multiple Source Terms
When determining DCGLs in areas where there are multiple source terms, Equation 6-1 will beused.
5.2.4 Facility and Site Classification
Not all areas of the site have the same potential for residual radioactivity and, accordingly, donot need the same level of survey effort to demonstrate compliance with the site release criteria.Using the criteria given below, different sections of the site are grouped into impacted and non-impacted areas based on the potential for residual radioactivity to be present. Classification ofsite areas is based on professional judgment, operational history (Historical Site Assessment(HSA) information, Reference 5-19), site characterization data, operational surveys performed insupport of decommissioning, and routine surveillance. See the site facility diagrams Chapter 2,and the SNEC site map (Figure 5-1), which is located at the end of this chapter.
5.2.4.1 Non-impacted Areas
Non-impacted areas have no reasonable potential for the presence of residual radioactivity fromlicensed activities. These areas do not need any level of survey coverage since there was noradiological impact from site operations. No surveys are performed in these areas other thanthose used to determine a reference area (background).
5.2.4.2 Impacted Area
Impacted areas are areas that have a reasonable potential for the presence of residualradioactivity from licensed activities. Impacted areas are subdivided into three classesdescribed below.
5.2.4.2.1 Class 1 Areas
Class 1 areas are areas that have or have had (prior to remediation), a potential for radioactivecontamination (based on site operating history), or known contamination (based on previousradiological surveys).
Examples of Class I areas are:
* Areas previously subjected to remedial actions
* Locations where leaks or spills are known to have occurred
* Former burial or disposal sites
* Waste storage sites
* Areas with contaminants in discrete solid pieces of material at high specific activity
* Areas containing contamination more than the DCGLw before remediation
5-9
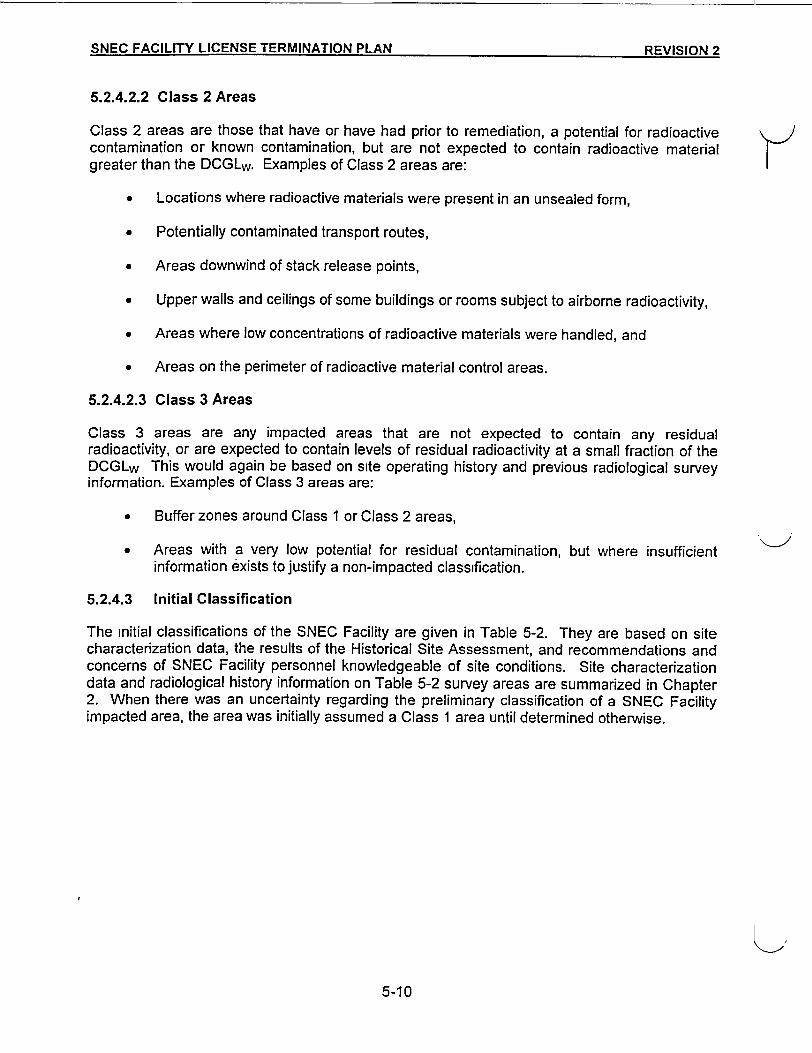
SNEQ FACILITY LICENSE TERMINATION PLAN PRZVIQRlf1 ISNEC FACILITY LICENSE TERMINATION PLAN PF�II�IAM)
5.2.4.2.2 Class 2 Areas
Class 2 areas are those that have or have had prior to remediation, a potential for radioactivecontamination or known contamination, but are not expected to contain radioactive materialgreater than the DCGLw. Examples of Class 2 areas are:
* Locations where radioactive materials were present in an unsealed form,
* Potentially contaminated transport routes,
* Areas downwind of stack release points,
* Upper walls and ceilings of some buildings or rooms subject to airborne radioactivity,
* Areas where low concentrations of radioactive materials were handled, and
* Areas on the perimeter of radioactive material control areas.
5.2.4.2.3 Class 3 Areas
Class 3 areas are any impacted areas that are not expected to contain any residualradioactivity, or are expected to contain levels of residual radioactivity at a small fraction of theDCGLW This would again be based on site operating history and previous radiological surveyinformation. Examples of Class 3 areas are:
* Buffer zones around Class 1 or Class 2 areas,
* Areas with a very low potential for residual contamination, but where insufficientinformation exists to justify a non-impacted classification.
5.2.4.3 Initial Classification
The initial classifications of the SNEC Facility are given in Table 5-2. They are based on sitecharacterization data, the results of the Historical Site Assessment, and recommendations andconcerns of SNEC Facility personnel knowledgeable of site conditions. Site characterizationdata and radiological history information on Table 5-2 survey areas are summarized in Chapter2. When there was an uncertainty regarding the preliminary classification of a SNEC Facilityimpacted area, the area was initially assumed a Class 1 area until determined otherwise.
5-10
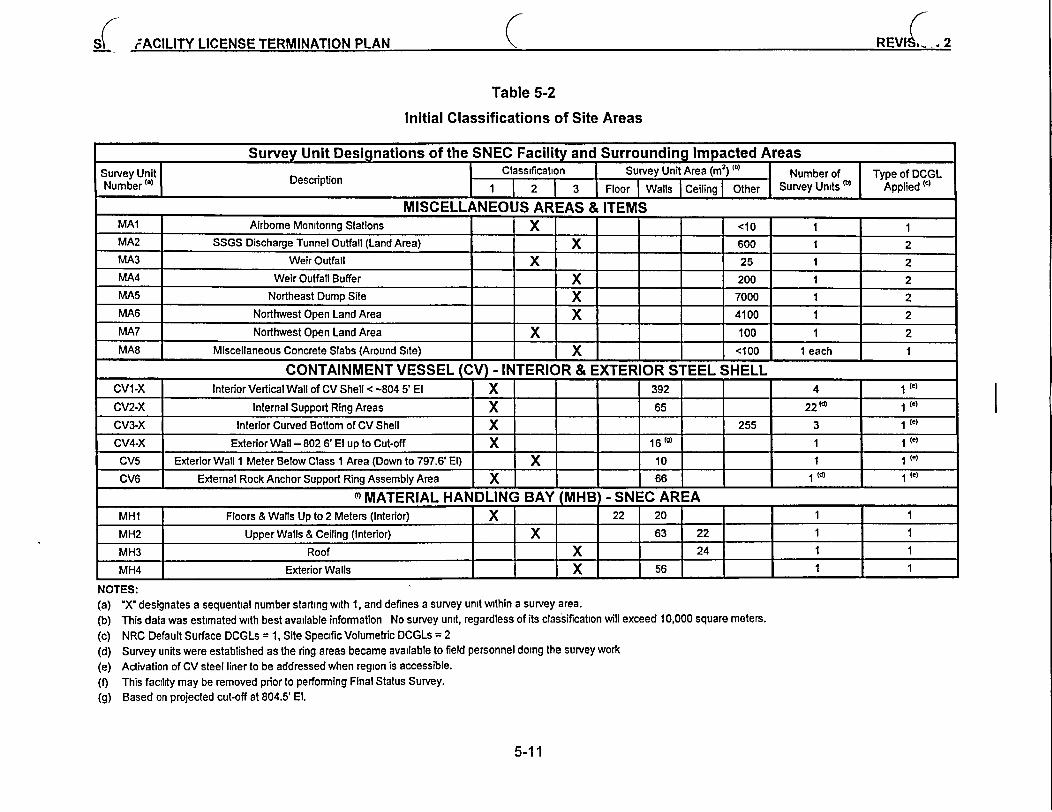
S REVIL .2ACIL ITY I ICE=NSE TEPMINATIONJ Pi ANj As w w| Do | TV | | |wb t MA| As§ § A ---.-- ' *----- --
Table 5-2
Initial Classifications of Site Areas
Survey Unit Designations of the SNEC Facility and Surrounding Impacted Areas |Survey Unit I D Classification | Survey Unit Area (m2) (b) Number of | Type of DCGL
umr Description 1 2 3 Floor Walls i Ceiling Other Survey Uns(b) Applied('
______MISCELLANEOUS AREAS & ITEMSMAI Airborne Monitoring Stations X <10 1 1MA2 SSGS Discharge Tunnel Outfall (Land Area) X 600 1 2
MA3 Weir Outfall X 25 1 2
MA4 Weir Outfall Buffer X 200 1 2
MA5 Northeast Dump Site X 7000 1 2MA6 Northwest Open Land Area X 4100 1 2
MA7 Northwest Open Land Area _ X 100 1 2MA8 Miscellaneous Concrete Slabs (Around Site) X <100 1 each I
CONTAINMENT VESSEL (CVj-INTERIOR & EXTERIOR STEEL SHELLCV1-X Interior Vertical Wall of CV Shell < -804 5' El X 392 4 1 (e)
CV2-X Internal Support Ring Areas X 65 22 Id) 1 (e)
CV3-X Interior Curved Bottom of CV Shell X 255 3 1 (e)
CV4-X Exterior Wall - 802 6' El up to Cut-off X 16 () 1 1 (e)
CV5 Exterior Wall 1 Meter Below Class I Area (Down to 797.6' El) X _ 10 1 1 ()CV6 External Rock Anchor Support Ring Assembly Area X 66 1 (d) 1 (e)
' MMATERIAL HANDLING BAY (MHB -SNEC AREAMH1 Floors & Walls Up to 2 Meters (Interior) X | 22 20 1 1MH2 Upper Walls & Ceiling (Interior) | X | | 63 22 1 1
MH3 Roof jX 24 1 1MH4 Exterior Walls - X 56 1 1
NOTES:(a) "X' designates a sequential number starting with 1, and defines a survey unit within a survey area.(b) This data was estimated with best available information No survey unit, regardless of its classification will exceed 10,000 square meters.(c) NRC Default Surface DCGLs = 1, Site Specific Volumetric DCGLs = 2(d) Survey units were established as the ring areas became available to field personnel doing the survey work(e) Activation of CV steel liner to be addressed when region is accessible.(f) This facility may be removed prior to performing Final Status Survey.(g) Based on projected cut-off at 804.5' El.
I
5-11
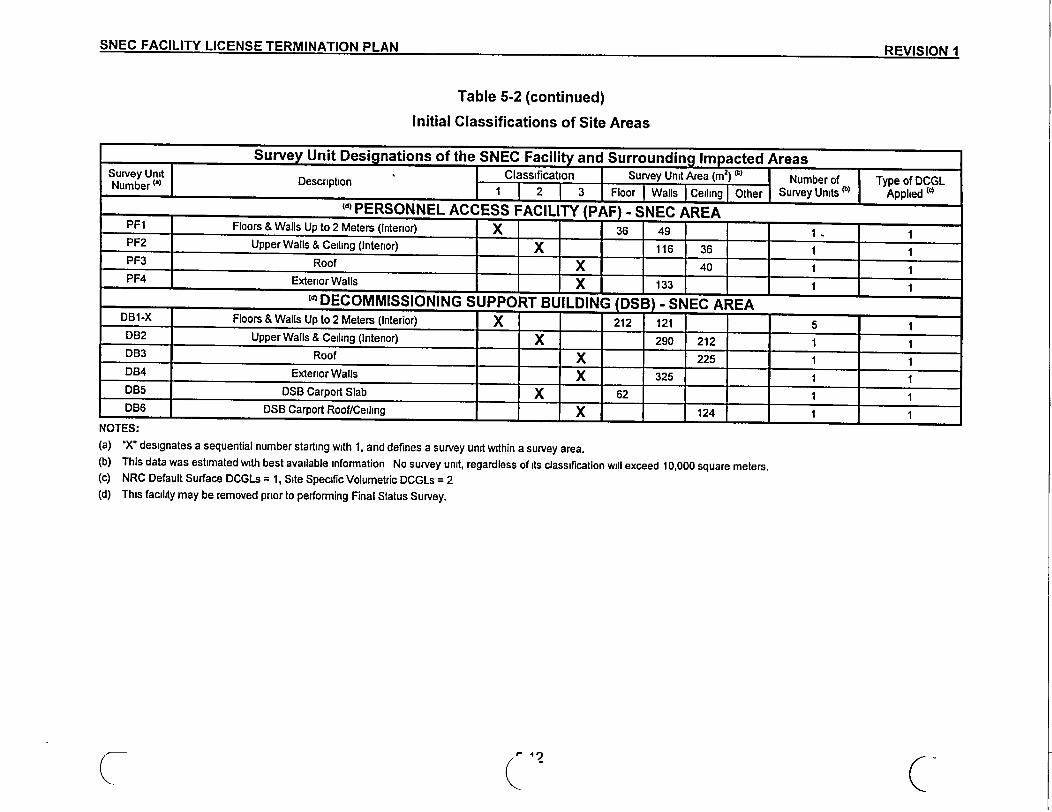
SNEC FACILITY LICENSER1 TERPMINATION Pi AM ne\,.>.Az. -SNC FACLITY I i T rI A ~KVlIOUN 1
Table 5-2 (continued)
Initial Classifications of Site Areas
Survey Unit Designations of the SNEC Facility and Surrounding Impacted AreasSurvey Unit I DesCption C lassification Survey Unit Area (i) (b) Number of I Type of DCGLNumber ) D 1 1 2 1 3 j Floor I Walls | Ceiling I Other Survey Units ( Applied (4
(d PERSONNEL ACCESS FACILITY (P F) - SNEC AREA _PF1 Floors & Walls Up to 2 Meters (Interior) X _ 36 49 1 1 1PF2 Upper Walls & Ceiling (Interior) X 116 36 1 1PF3 Roof X _ 40 1 1PF4 Exterior Walls X 133 _ 1 1
(d) DECOMMISSIONING SUPPORT BUILDIN ;(DS -SNEC AREADB1-X Floors & Walls Up to 2 Meters (Interior) X 212 121 5 1DB2 Upper Walls & Ceiling (Interior) X 290 212 1 1DB3 Roof X 225 1 1D04 Exterior Walls X 325 1 1DB5 DSB Carport Slab X 62 1 1DB6 DSB Carport Roof/Ceiling X 124 1 1
NU l :(a) 1X" designates a sequential number starting with 1, and defines a survey unit within a survey area.(b) This data was estimated with best available information No survey unit, regardless of its classification will exceed 10,000 square meters.(c) NRC Default Surface DCGLs = 1, Site Specific Volumetric DCGLs = 2(d) This facility may be removed prior to performing Final Status Survey.
( r- ^
c
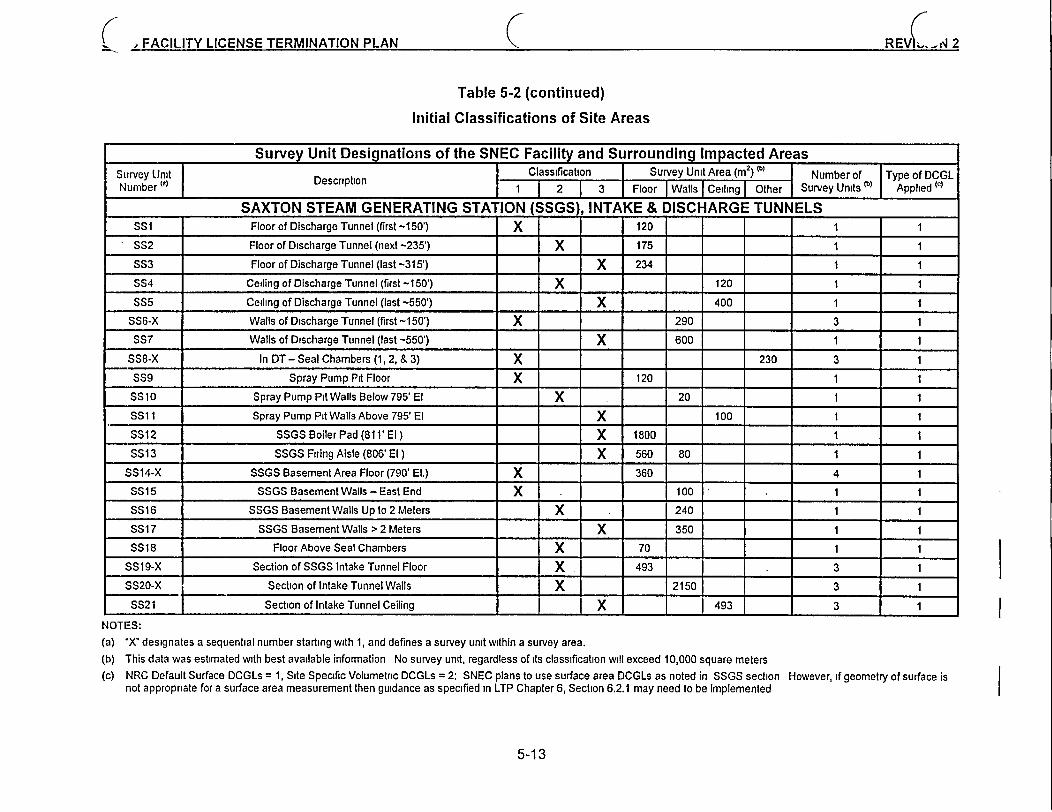
C , FACILITY LICENSE TERMINATION PLAN REV C-N 2
Table 5-2 (continued)
Initial Classifications of Site Areas
Survey Unit Designations of the SNEC Facility and Surrounding Impacted AreasSurvey Unit Descption | Classification Survey Unit Area (in
2) (b) Number of | Type of DCGL
Number | D 1 2 | 3 Floor I Walls I Ceiling I Other Survey Units | Applied ic)
SAXTON STEAM GENERATING STATION SSGS), INTAKE & DISCHARGE TUNNELSSS1 Floor of Discharge Tunnel (first -150') X 120 1 1
SS2 Floor of Discharge Tunnel (next -235') X 175 1 1
SS3 Floor of Discharge Tunnel (last -315') X 234 1 1
SS4 Ceiling of Discharge Tunnel (first -150') X 120 1 1
SS5 Ceiling of Discharge Tunnel (last -550') X 400 1 1
SS6-X Walls of Discharge Tunnel (first -150') X 290 3 1
SS7 Walls of Discharge Tunnel (last -550') X 600 1 1
SS8-X In DT - Seal Chambers (1, 2, & 3) X 230 3 1
SS9 Spray Pump Pit Floor X 120 1 1
SSIO Spray Pump Pit Walls Below 795' El X 20 1 1
SS11 Spray Pump Pit Walls Above 795' El X 100 1 1
SS12 SSGS Boiler Pad (811' El ) X 1800 1 1
SS13 SSGS Firing Aisle (806' El) X 560 80 1 1
SS14-X SSGS Basement Area Floor (790' El.) X 360 4 1
SS15 SSGS Basement Walls - East End X 100 1 1
SS16 SSGS Basement Walls Up to 2 Meters X 240 1
SS17 SSGS Basement Walls > 2 Meters X 350 1
SS18 FloorAbove Seal Chambers X 70 1 1
SS19-X Section of SSGS Intake Tunnel Floor X 493 3 1
SS20-X Section of Intake Tunnel Walls X 2150 31
SS21 Section of Intake Tunnel Ceiling X 493 3 1
NOTES:(a) "X" designates a sequential number starting with 1, and defines a survey unit within a survey area.(b) This data was estimated with best available information No survey unit, regardless of its classification will exceed 10,000 square meters(c) NRC Default Surface DCGLs = 1, Site Specific Volumetric DCGLs = 2: SNEC plans to use surface area DCGLs as noted in SSGS section However, if geometry of surface is
not appropriate for a surface area measurement then guidance as specified in LTP Chapter 6, Section 6.2.1 may need to be implemented
5-13
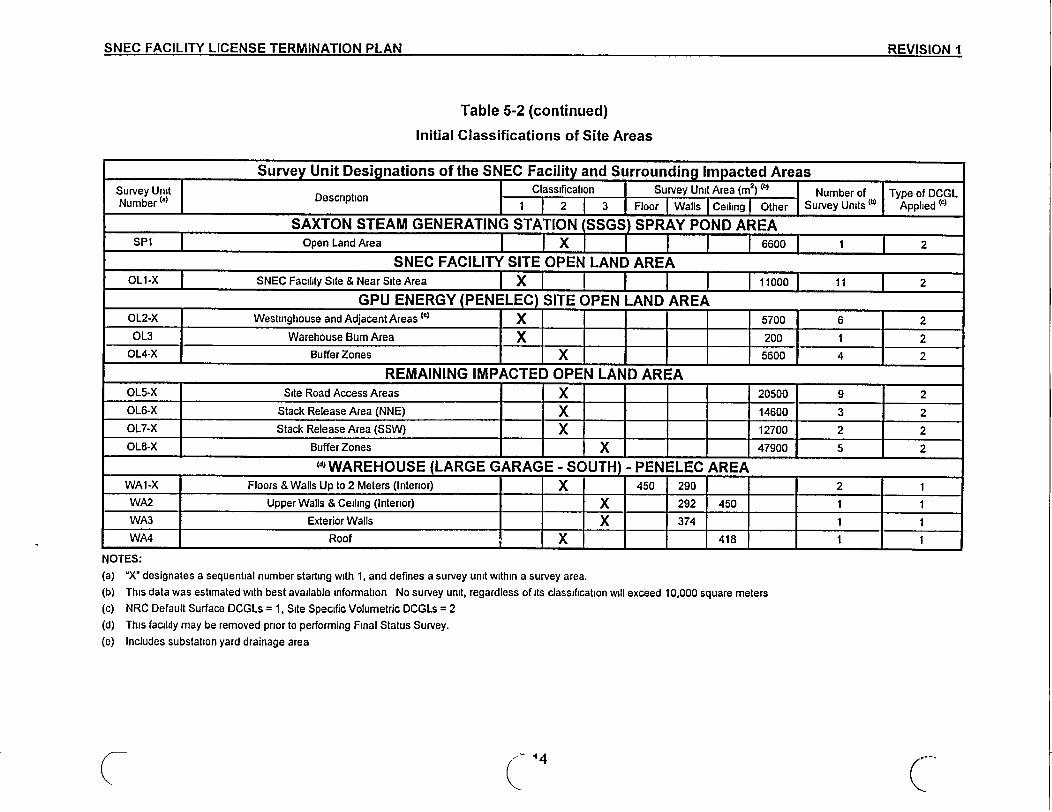
QKN9f' F:Arll 1TV I I=r'CKFr 79=0111AW lYltKl 01 ASI M=11JQc~lnK1 Ao r I I If 1- A Af. * tlJcLc * cnvw, sIt, ru "MOM fLVEOIDjI'N I
Table 5-2 (continued)
Initial Classifications of Site Areas
Survey Unit Designations of the SNEC Facility and Surroundina Imnacted AreasIumber (a t Classification Survey Unit Area (m2) (b) Number of | Type of DCGLN 1 1 2 1 3 | Floor I Walls I Ceiling Other Survey Units"b| Applied (c)
SAXTON STEAM GENERATING STATION (SSGS) SPRAY POND AREASPI Open LandXArea X 6600 1 2
SNEC FACILITY SITE OPEN LAND AREAOL1-X SNEC Facility Site & Near Site Area I X I I I I I I 11000 11 2
GPU ENERGY (PENELEC) SITE OPEN LAND AREA0L2-X Westinghouse and Adjacent Areas i') X _ . _ 5700 6 2
OL3 Warehouse Burn Area X 200 1 2OL4-X Buffer Zones X 5600 4 2
______ REMAINING IMPACTED OPEN LAND AREAOL5-X Site Road Access Areas X ___ 20500 9 2
OL6-X Stack Release Area (NNE) X = = 14600 3 2
OL7-X Stack Release Area (SSW) X 127 00 2 2OL8-X Buffer Zones = X 47900 5 2
'd' WAREHOUSE (LARGE GARAGE- SC UTH) - PENELEC AREAWA1-X Floors & Walls Up to 2 Meters (Interior) X 450 290 | 2 1WA2 Upper Walls & Ceiling (Interior) X 292 450 1 1WA3 Exterior Walls X 374 1 1WA4 Roof X [ 418 1 1
NOTES:(a) 'X designates a sequential number starting with 1, and defines a survey unit within a survey area.(b) This data was estimated with best available information No survey unit, regardless of its classification will exceed 10,000 square meters(c) NRC Default Surface DCGLs = 1, Site Specific Volumetric DCGLs = 2(d) This facility may be removed prior to performing Final Status Survey.(e) Includes substation yard drainage area
( C 14 C
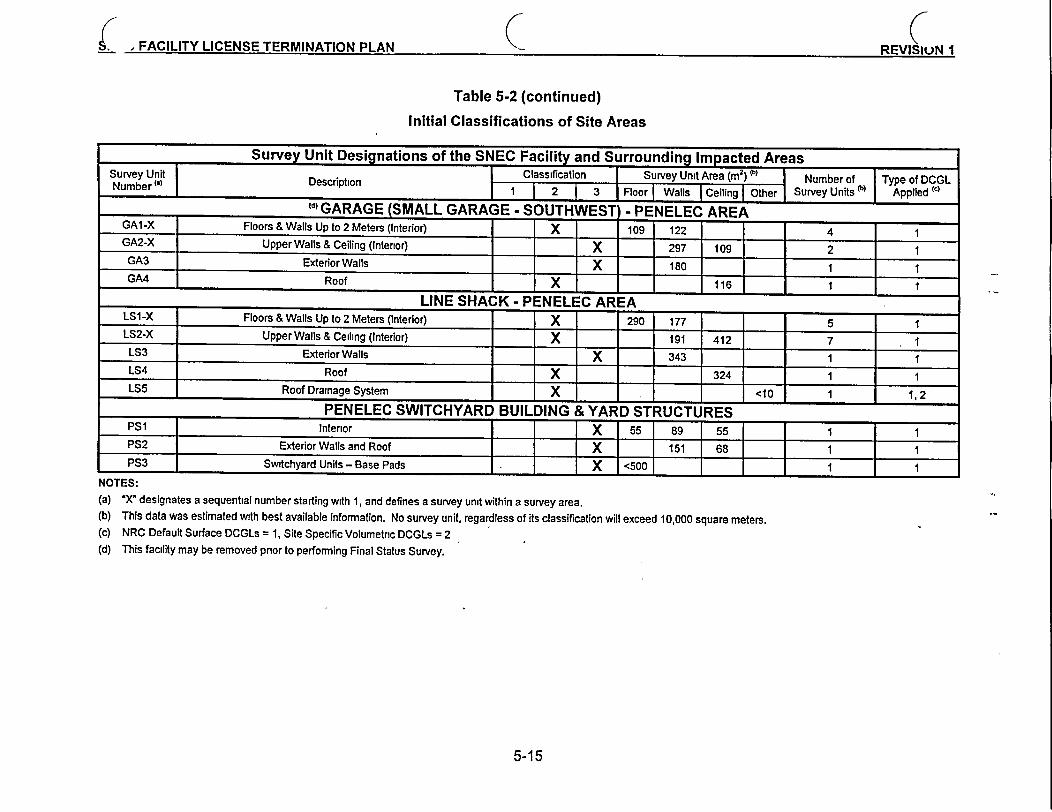
L , FACILITY LICENSE TERMINATION PLAN C F T REVISIuN I
Table 5-2 (continued)
Initial Classifications of Site Areas
Survey Unit Designations of the SNEC Facility and Surrounding Impacted AreasSurvey Unit Description Classification Survey Unit Area (mi2 ) (b) Number of I Type of DCGLNumber( ) I j i-I J2 |3 Floor I Walls I Ceiling I Other Survey Units b Applied (c)
(d) GARAGE (SMALL GARAGE - SOUTHWEST - PENELEC AREAGA1-X Floors & Walls Up to 2 Meters (Interior) - X 109 122 4 1GA2-X Upper Walls & Ceiling (Intenor) X 297 109 2 1GA3 Exterior Walls IiX 180- 1GA4 Roof X 116 = 1
LINE SHACK - PENELEC AREALS1-X Floors & Walls Up to 2 Meters (Interior) X 290 177 5 1LS2-X Upper Walls & Ceiling (Interior) X = = 191 412 7 1LS3 Exterior Walls X 343 1 1LS4 Roof X 324 1 1LS5 Roof Drainage System X <10 1 1,2
PENELEC SWITCHYARD BUILDING & YARD STRUCTURES LPSi Intenor X | 55 | 89 55 | 1 [ 1PS2 Exterior Walls and Roof l l X | 151 68 1 | 1P53 Switchyard Units - Base Pads X |<500 |I| | . 1 [ 1
NOTES:(a) 'X" designates a sequential number starting with 1, and defines a survey unit within a survey area.(b) This data was estimated with best available information. No survey unit, regardless of its classification will exceed 10,000 square meters.(c) NRC Default Surface DCGLs = 1 Site Specific Volumetric DCGLs = 2(d) This facility may be removed prior to performing Final Status Survey.
5-15
SNEC FACILITY LICENSE TERMINATION PLAN PFIZlQnN1 v
5.2.4.4 Changes in Classification
Changes in classification are based on survey data and other relevant information that indicatesa different area classification is more appropriate. Changes in area classifications whichdecrease an area classification will be in accordance with License Condition 2.E.(h).
5.2.5 Final Survey Process
In general, FSS activities do not commence in the area to be surveyed until decontaminationactivities are believed to be complete and radioactive waste materials are removed. The FSSprocess begins with survey area preparation activities such as gridding and review of finalremediation support survey information, as well as survey area walk-downs. Survey designcalculations and the issuance of Survey Requests to field survey teams follow this phase. Fieldsurvey teams then collect the data and assemble the survey results in an organized andunderstandable format in accordance with site procedures. Data assessment anddocumentation concludes this process.
5.2.5.1 Survey Design Overview
Survey design, as described in Section 5.4, identifies relevant components of the FSS processand establishes the assumptions, methods, and performance criteria to be used. Areas readyfor FSS are classified as Class 1, Class 2 or Class 3 and are divided into survey units.Systematic scan and static measurements are prescribed according to a pattern and frequencyestablished for each classification. Investigation levels are established which, if exceeded,initiate an investigation of the survey data. A measurement from the survey unit that exceedsan investigation level may indicate a localized area of elevated residual radioactivity. Suchlocations are marked and investigated to determine the area and the level of the residualradioactivity present. Depending on the results of the investigation, the survey unit may requireremediation, and/or re-survey or re-classification.
Quality Control (QC) measurements are prescribed to identify and control measurement errorand uncertainty attributable to measurement methods or analytical procedures used in the datacollection process. QC measurements provide qualitative and quantitative information todemonstrate that measurement results are sufficiently free of error and accurately represent theradiological condition of the SNEC Facility.
5.2.5.2 Survey Data Collection
As deemed appropriate, a final post-remediation survey is performed using similarinstrumentation, quality control and survey techniques to be used in the FSS process. Thereview of the final post-remediation survey data is then carried out to verify that residualradioactivity levels are acceptable and that no additional remediation will be needed in thesurvey unit. If an area of elevated residual radioactivity is identified, and remediation isdetermined to be ALARA, the area is remediated and re-surveyed to ensure meeting FSSrequirements. The data collected during the final post-remediation survey (when performed),
5-16
SNEC FACILITY LICENSE TERMINATION PLAN I REVISION 2SNEC FACILITY LICENSE TERMINATION PLAN REVISION 2
responsible management in writing, and actions to resolve identified deficiencies are tracked andappropriately documented. Qualified personnel will perform an independent review of the FinalStatus Survey Report. This review will ensure that FSS results are performed and documented inaccordance with appropriate methodology, and that all conclusions reported are accurate andcorrectly presented.
5.2.8 Survey Records and Documentation
Generation, handling, and storage of FSS design information and survey data are controlled byapproved procedures. Survey records and documentation are maintained as quality records anddecommissioning records in accordance with approved facility procedures. Where possible, theyare also maintained as electronic media.
At a minimum, each final status survey record will include:
1. Date and time survey was performed
2. Instrumentation used and calibration due date(s)
3. Survey location (grid location or other reference markings)
4. Type of measurement performed (scan survey, fixed-point measurements etc.)
5. Survey team member(s) involved
6. Name of field supervisor(s) responsible for reviewing survey data
7. Survey and Sample Request numbers
Generation, handling and storage of the original final status survey design and data packages shallbe in accordance with the SNEC Records Retention procedure (E900-ADM-4500.04, Reference 5-16) and Radiological Surveys: Requirements & Documentation procedure (E900-ADM-4500.12,Reference 5-17).
5.2.9 Calculations
Formal calculations that support License Termination activities are prepared in accordance withthe SNEC Facility Calculations Procedure (E900-ADM-4500.44, Reference 5-15). Thesecalculations provide sufficient details with respect to purpose, method, assumptions, design input,references and units such that a person technically qualified in the subject can review andunderstand the analysis as well as verify the adequacy of the results without frequently consultingthe originator. Calculations may be used for activities such as survey design, dose modeling, andcomputer code verification.
5.2.10 Schedule
Final status surveys are planned, scheduled, and tracked as a part of the overalldecommissioning planning process. The schedule is dependent upon the progress andcompletion of several decommissioning activities and review and approval of the LicenseTermination Plan. Presently, survey data collection is expected to begin in the fourth quarter of2002
5-23
SNEC FACILITY LICENSE TERMINATION PLAN REVISION 2SNEC FACILITY LICENSE TERMINATION PLAN REVISION 2
5.2.11 Stakeholders
The stakeholders for the SNEC decommissioning project include those organizations andconcerned individuals listed below:
* Citizens Task Force (CTF)
* Concerned Citizens for SNEC Safety (CCFSS)
* Liberty Township
* Huntington and Bedford Counties
* The Commonwealth of Pennsylvania
* FirstEnergy Companies
* Applicable Contractors
* US Army Corps of Engineers
5.3 FINAL POST REMEDIATION SURVEYS
The professional judgment of the SNEC Facility staff will be used to implement final postremediation surveys in areas where former contamination levels required extensive remediation orin other areas as deemed appropriate. Properly designed, post remediation surveys can facilitatethe transfer and control of areas, and minimize the impact of planned or ongoing dismantlementactivities in adjacent areas.
5.3.1 Walk-down
A walk-down of the survey unit is performed prior to isolation. The principle objective of the walk-down is to assess the physical state of the survey unit and the scope of work necessary to prepareit for final survey. During the walk-down, requirements are identified for accessing, isolating, andcontrolling the survey unit. Support activities necessary to conduct the final survey, such asscaffolding, interference removal, and electrical tag-outs, are identified. Safety concerns such asconfined space entry, high walls, and ceilings are identified. For systems, the walk-down includesa review of system flow diagrams and piping drawings. The walk-down is performed when the finalconfiguration is known, usually near or after the completion of dismantlement activities.
5.3.2 Isolation Criteria
The following criteria will be satisfied prior to acceptance of a survey unit by the FSS team. Thephysical aspects of these criteria are verified during the walk-down.
1. Planned dismantlement activities within the post remediation survey unit are completed.
5-24
SNEC FACILITY LICENSE TERMINATION PLAN I REVISION 1SNEC FACILITY LICENSE TERMINATION PLAN REVISION I
2. Planned dismantlement activities affecting or adjacent to the post remediation surveyunit are completed, or are evaluated and determined to not have a reasonable potentialto introduce radioactive material into the post remediation survey unit.
3. An operational radiation protection survey of the post remediation survey unit iscompleted and all outstanding items are addressed.
4. Planned physical work in, on, or around a post remediation survey unit, other thanroutine surveillance or maintenance, is complete.
5. Tools, non-permanent equipment, and material not needed for survey data collection areremoved.
6. Housekeeping, clean up, and remediation of the survey unit are completed.
7. Scaffolding, temporary electrical and ventilation equipment and components, and othermaterial or equipment needed for survey data collection is radiologically clean and left inplace.
8. Transit paths to/through the post remediation survey unit are eliminated or re-routed.
9. Appropriate measures are instituted to prevent the re-introduction of radioactive materialinto isolated area from ventilation systems, drain lines, system vents, and other potentialairborne and liquid contamination pathways.
10. Measures are instituted to control access and egress and otherwise restrict radioactivematerial from entering the survey unit.
5.3.3 Transfer of Control
Once a walk-down has been performed and the isolation criteria are met, control of activities withinthe post remediation survey unit is transferred from the dismantlement organization to the FSSteam. The need for localized remediation within the isolated area may be identified after transferof control. Localized remediation may be performed under the control of the FSS organization.However, if large areas require remediation, the isolated area may be transferred back to thedismantlement organization for further decontamination.
5.3.4 Isolation and Control Measures
Prior to performing the FSS, the post remediation survey unit is isolated and controlled. Routineaccess, equipment removal, material storage, and worker and material transit through the areawithout proper controls are no longer allowed. One or more of the following administrative andphysical controls will be established to minimize the possibility of introducing radioactive materialfrom ongoing decommissioning activities in adjacent or nearby areas.
1. Personnel training
2. Installation of barriers to control access to the area(s)
3. Installation of postings with access/egress requirements
4. Locking or otherwise securing entrances to the area
5-25
SNEC FACILITY LICENSE TERMINATION PLAN DMIC0r\M1 -9XLV11a1%J1V 14
5. Installation of tamper-evident seals or labels
Isolation and control measures are implemented through approved facility procedures and remainin place through the FSS data collection process until license termination.
5.4 SURVEY DESIGN
The survey design identifies relevant components of the FSS process, and establishes theassumptions, methods, and performance criteria to be used. The methodology for planning a FSS,including a FSS in the subsurface region is identified in the applicable site procedure. Surveydesign is summarized in Table 5-5.
The application of survey design criteria to structures and land areas will vary based on the type ofsurvey media and the relative potential for elevated residual radioactivity. For facility systems,many of the survey design criteria applicable to structures and land areas do not apply or aredictated by the physical system layout and the accessibility to the system piping and components.To accommodate these factors, the survey design integrates both non-systematic (random) andjudgmental (biased) methods to data collection to achieve the overall objective of the final surveyprocess. Survey design will be performed in accordance with SNEC procedures E900-ADM-4500.59, 'Final Site Survey Planning" and E900-ADM-4500.58, "Treatment of Embedded Pipingand Components". When necessary, a two-stage sampling process may also be used IAWReference 5-20.
Each survey design package will address the following areas of interest:
1. A brief overview describing the final status survey design;
2. A description and map or drawing of impacted areas of the site, area, or buildingclassified by residual radioactivity levels (Class 1, Class 2, or Class 3) and divided intosurvey units, with an explanation of the basis for division into survey units and theboundaries for each survey unit or area indicated. Maps should have compass headingsindicated;
3. A description of the background reference areas and materials, if they will be used, anda justification for their selection;
4. A summary of the statistical tests that will be used to evaluate the survey results,including the elevated measurement comparison, if Class 1 survey units are present, ajustification for any test methods not included in MARSSIM, and the values for thedecision errors ( and ) with a justification for values greater than 0.05;
5. A description of scanning instruments, methods, calibration, operational checks,coverage, and sensitivity for each media and radionuclide;
6. For in-situ sample measurements made by field instruments, a description of theinstruments, calibration, operational checks, sensitivity, and sampling methods, with ademonstration that the instruments, and methods, have adequate sensitivity;
7. A description of the analytical instruments for measuring samples in the laboratory,including the calibration, sensitivity, and methodology for evaluation, with ademonstration that the instruments and methods have adequate sensitivity;
5-26
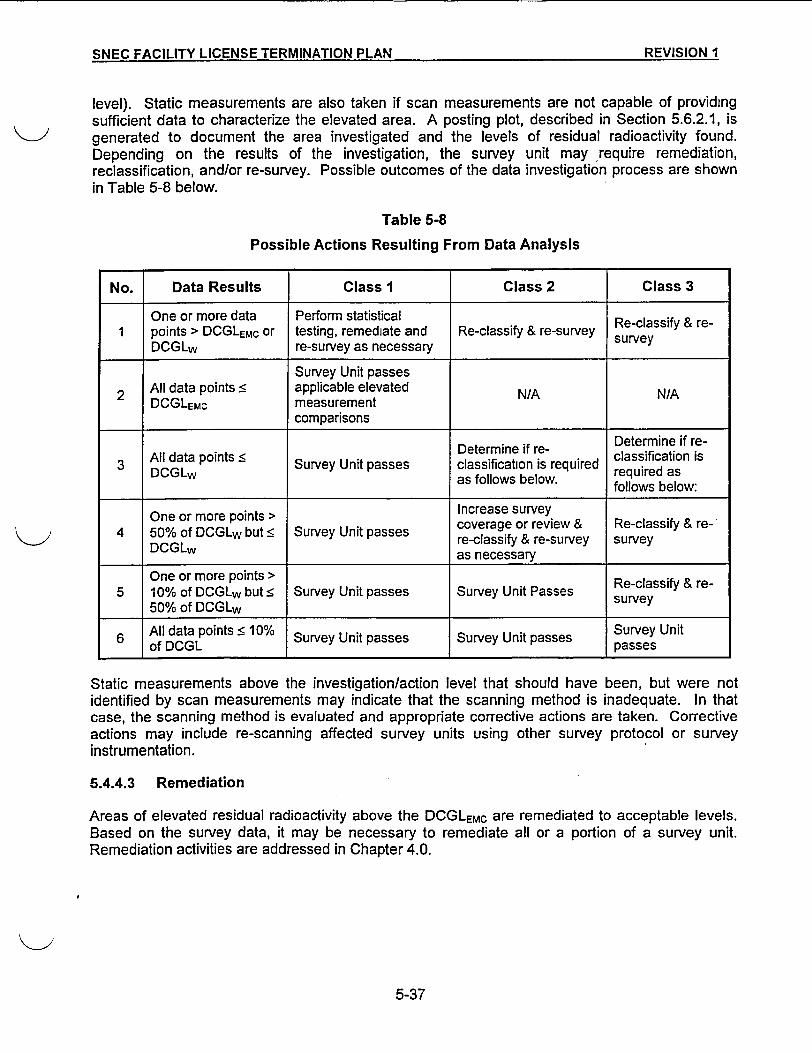
Ckl~Flt Festal 1rV I 19-:FNlr- TZRAMIATIMN Di ANI RE:VISION IIic aAtI- ... I art-In T M r MAT-M v run- . - ._._., .
level). Static measurements are also taken if scan measurements are not capable of providingsufficient data to characterize the elevated area. A posting plot, described in Section 5.6.2.1, isgenerated to document the area investigated and the levels of residual radioactivity found.Depending on the results of the investigation, the survey unit may require remediation,reclassification, and/or re-survey. Possible outcomes of the data investigation process are shownin Table 5-8 below.
Table 5-8
Possible Actions Resulting From Data Analysis
No. Data Results Class I Class 2 Class 3
One or more data Perform statistical1 points > DCGLEMC or testing, remediate and Re-classify & re-survey survey
DCGLw re-survey as necessary y
Survey Unit passes
2 All data points 5 applicable elevated N/A N/ADCGLEMC measurement
comparisons
Deterine i re-Determine if re-3 All Survey Unit passes classification is required requsired as
DCGLw as follows below.reuedafollows below:
One or more points > Increase survey4 50% of DCGLw but s Survey Unit passes coverage or review & Re-classify & re--
50DfCCG ut~SrvyUitpse re-classify & re-survey surveyDCGLw as necessary
One or more points >5 10% of DCGLw but < Survey Unit passes Survey Unit Passes survey
50% of DCGLW y
6 All data points C 10% Survey Unit passes Survey Unit passes passes
Static measurements above the investigation/action level that should have been, but were notidentified by scan measurements may indicate that the scanning method is inadequate. In thatcase, the scanning method is evaluated and appropriate corrective actions are taken. Correctiveactions may include re-scanning affected survey units using other survey protocol or surveyinstrumentation.
5.4.4.3 Remediation
Areas of elevated residual radioactivity above the DCGLEMC are remediated to acceptable levels.Based on the survey data, it may be necessary to remediate all or a portion of a survey unit.Remediation activities are addressed in Chapter 4.0.
5-37
SNEC FACILITY LICENSE TERMINATION PLAN RE-VISION 2-SNEC FACILITY LICENSE TERMINATION PLAN RFVI5�tflN 2
5.4.4.4 Subdividing Survey Units
Due to size restrictions and other considerations, a survey unit may need to be divided into two ormore smaller survey units. Survey unit sizes may be adjusted as necessary as long asassumptions used to develop area dose models remain valid. Suggested survey unit sizes areprovided in Table 5-5.
5.4.4.5 Resurvey
If a survey unit is reclassified or if remediation activities are performed, then a re-survey using themethods and frequency applicable to the new survey unit classification is performed. This includesthe case where only a small fraction of the area (< 10%) of a Class 1-survey unit is remediated.
In the case where a new survey unit is separated out from an existing survey unit, or an existingsurvey unit is subdivided, Class 3 survey units need to have the survey repeated to obtain a newsurvey data set. Class 1 and Class 2 survey units require a new survey design based on random-start systematic measurement locations.
When a new survey unit is separated out from an existing survey unit or is subdivided, the newsurvey unit will include a buffer zone that adequately bounds the area of identified contaminationwhen it borders a non-impacted area.
5.4.5 Quality Control (QC) Measurements
QC measurements are a component of the survey quality assurance process, and include qualitychecking and repeat measurements. Quality checking and repeat measurements are performed toidentify, assess, and monitor measurement error and uncertainty attributable to measurementmethods or analytical procedures used in the data collection process. Quality checking includesdirect observations of survey data and sample collections, and sample preparation and analyses.Repeat measurements are multiple measurements at the same location or from the same surveyunit. Repeat measurements provide quantitative information to demonstrate that measurementresults are sufficiently free of error to accurately represent the radiological condition of the SNECFacility. Results of QC measurements are documented in accordance with approved siteprocedures.
5.4.5.1 Type, Number, and Scheduling
QC checks will typically be performed by randomly re-sampling and/or re-surveying 5% of allsampling and/or survey points. For a low number of points (10 or less), the number of re-survey orre-sample locations will not be less than one (1). The type, number, and scheduling of QCmeasurements may also be determined by a performance-based method as described in Section4.9.2 of NUREG-1575. This method is based on the potential sources of error and uncertainty, thelikelihood of occurrence, and the consequences in the context of final survey data accuracy. Theprimary factors considered here are 1) the number of persons or organizations involved in the datacollection, 2) the number of measurement types or analytical methods used, and 3) the timeinterval over which the data are collected. Other factors include:
1. Number of survey measurements collected,
2. Experience of personnel involved,
5-38
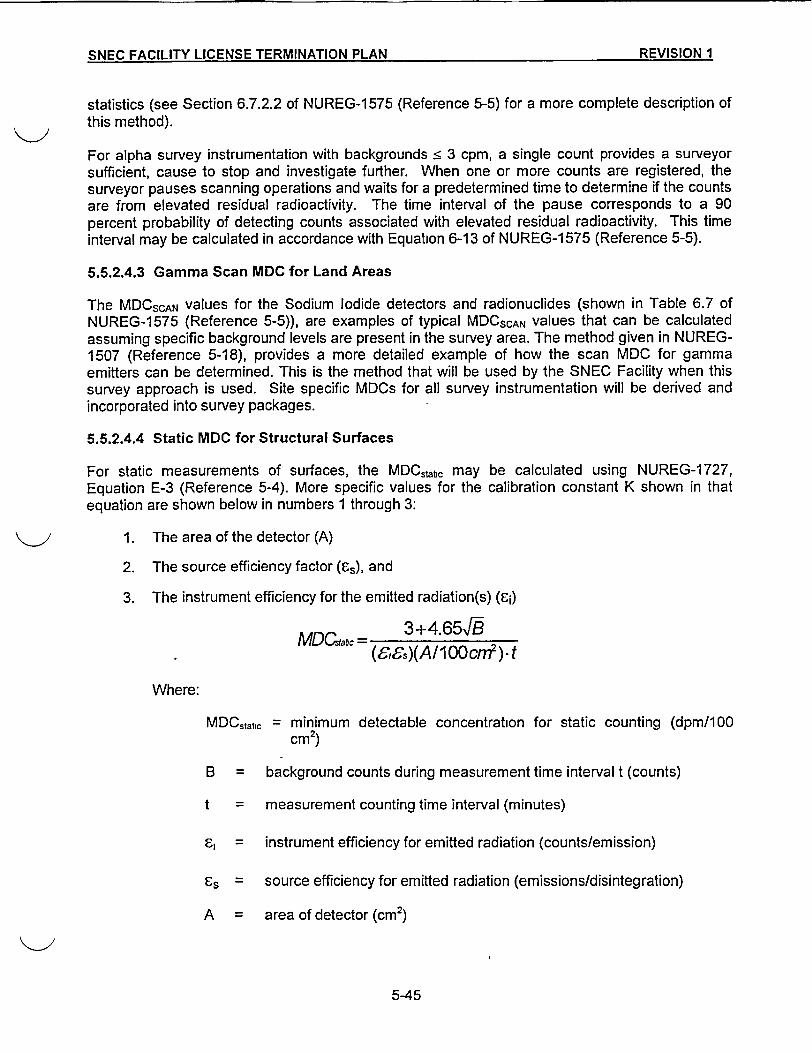
-QMr-r PArIl 1TV I Ir.FKI-RF TFIRMINATIM Pt AN REVSION 1amC F A|_l IT I IC__N5__ TFMN A P1 AN. REVSIO I_.._.. __,,_,
statistics (see Section 6.7.2.2 of NUREG-1575 (Reference 5-5) for a more complete description ofthis method).
For alpha survey instrumentation with backgrounds < 3 cpm, a single count provides a surveyorsufficient, cause to stop and investigate further. When one or more counts are registered, thesurveyor pauses scanning operations and waits for a predetermined time to determine if the countsare from elevated residual radioactivity. The time interval of the pause corresponds to a 90percent probability of detecting counts associated with elevated residual radioactivity. This timeinterval may be calculated in accordance with Equation 6-13 of NUREG-1 575 (Reference 5-5).
5.5.2.4.3 Gamma Scan MDC for Land Areas
The MDCSCAN values for the Sodium Iodide detectors and radionuclides (shown in Table 6.7 ofNUREG-1575 (Reference 5-5)), are examples of typical MDCSCAN values that can be calculatedassuming specific background levels are present in the survey area. The method given in NUREG-1507 (Reference 5-18), provides a more detailed example of how the scan MDC for gammaemitters can be determined. This is the method that will be used by the SNEC Facility when thissurvey approach is used. Site specific MDCs for all survey instrumentation will be derived andincorporated into survey packages.
5.5.2.4.4 Static MDC for Structural Surfaces
For static measurements of surfaces, the MDCstabc may be calculated using NUREG-1727,Equation E-3 (Reference 5-4). More specific values for the calibration constant K shown in thatequation are shown below in numbers 1 through 3:
1. The area of the detector (A)
2. The source efficiency factor (E.), and
3. The instrument efficiency for the emitted radiation(s) (E;)
MDCb5 = 3+4.65 H-J(&C,8)(A~lO00cm 2).t
Where:
MDCstac = minimum detectable concentration for static counting (dpm/100cm2 )
B = background counts during measurement time interval t (counts)
t = measurement counting time interval (minutes)
= instrument efficiency for emitted radiation (counts/emission)
Cs = source efficiency for emitted radiation (emissions/disintegration)
A = area of detector (cm2)
5-45
SNEC FACILITY LICENSE TERMINATION PLAN REVISION 2SNEC FACILITY LICENSE TERMINATION PLAN REVISION 2
4. The total efficiency (6,) is the product of the instrument (Ed) and source (es) efficiencies.These values will be determined during the calibration process for the specificradionuclide mix expected in each survey area/unit (as appropriate). Actual instrumentefficiencies are continuously monitored by site personnel. Any information or calculationsused to establish instrument efficiencies for final status survey work will be available atthe site for NRC on-site inspection purposes.
5.5.2.5 Detection Sensitivity
The detection sensitivity of typical detectors for surface contamination measurements is estimatedand the results summarized in Table 5-10. The results are shown for the principal instruments thatare expected to be used for alpha and beta-gamma direct surface contamination measurements.
Count times are selected to ensure that the measurements are sufficiently sensitive with respect tothe DCGLw. For example, the count times associated with measurements for surfacecontamination and gamma spectral analysis (soil and bulk materials) are normally set to ensure anMDCstatc is equal to or less than 50 percent of the DCGL. The scan rate associated with surfacescans is normally set to ensure an MDCSCAN of no more than 75 percent of the DCGL. If theMDCSCAN exceeds the DCGL, additional static measurements may be required, as discussed inAppendix 5.1.
5-46
SNEC FACILITY LICENSE TERMINATION PLAN REVISION 2
coefficient) values have been developed for relevant site radionuclides. These Kd values havethen been used to develop final site DCGLw values for all volumetric material types at the SNECsite. By selecting the most conservative DCGLw developed from these various material types, auniversally applicable DCGLw may then be used for all SNEC Facility volumetric materials. As aresult of this modeling and pathways analysis technique, SNEC site DCGLW values may be usedfor both surface and subsurface soil and construction debris (re-fill or otherwise). Any residualactivity allowed to remain in SNEC site structures or in soil materials will meet the site dose criteriafor unrestricted release based on these DCGLW values.
A sampling and measurement program will be implemented to monitor and control residualcontamination levels in re-fill materials. The sampling program will be statistically based and beapplied through the implementation of fully reviewed SNEC site procedures and/or workinstructions. Sampling and analysis will meet requirements stated in Section 5.2.7.6 of this plan.
5.5.3.4.5 Paved Parking Lots, Roads, Sidewalks, And Other Paved Areas
Paved parking lots, roadways, concrete slabs, and other paved areas are treated as structuresurfaces. Scan and static measurements are taken as prescribed by the survey design. Whereremediation has occurred or where residual radioactivity above background levels is suspected,direct surface contamination measurements are taken and a representative number of subsurfacesamples (below 15 cm) will be collected and analyzed. Depending on the size of the paved areaand the distribution of the residual radioactivity,-the paved area may be a separate survey unit orbe included as part of a larger survey unit. Sampling of these areas is also appropriate wherethere is reason to believe that contamination resides in, on, or below these structures.
5.5.3.4.6 Trailers And Temporary Facilities
Trailers or other temporary facilities used to support FSS or decommissioning work are notincluded in this study, but instead will be released in accordance with current SNEC FacilityRadiological Controls work practices and procedures. Any temporary facilities remaining at thetime of FSS activities shall be classified and surveyed in accordance with the applicable area oruse classification.
5.5.3.4.7 Subsurface Soil Contamination Survey
The subsurface sampling/measurement program will be controlled by site procedures and willfollow a systematic process for collecting subsurface information. In this methodology, each zone(surface, subsurface and buffer zone below the potentially contaminated region) will represent asample population. The buffer layer will extend below the depth of any formerly buried componentsand the suspected depth of the contamination zone. The buffer layer depth and starting point willalso be adjusted as indicated by sampling. The number of cores to be taken within each zone isthe number N required for the applicable statistical test applied. The core samples will behomogenized over each 1 meter of depth during the sample preparation process. The appropriatetest (WRS or Sign) will be applied to the results, as applicable. If the test indicates that the layerbeing assessed fails, the layer or the volume will be considered for remediation. Additionally, in-situ measurements may be considered when any layer exhibits results approaching 50% of therelease criteria to verify and determine extent of contamination.
Areas where subsurface contamination may be present at the SNEC site are identified andsampled through the following process:
5-51
SNECr FACILITY ICErNSE TEIRMINIATION PiLAN PRFVISIO 1I�MF(� FACII ITV I I(�FN�F TFPMINATIflN P1 AM PFlII�IAM 4
* Characterization and Historical Site Assessment (HSA) information were reviewed andused to determine the appropriate area classification. The area classification chosenconsiders both surface and subsurface volumes below structures as well as anyprevious remediation or survey efforts.
* A review of any existing measurement and/or sample results in the subsurface volume isthen performed to determine if sufficient sampling results are available for planning aFSS.
* These areas are then made accessible; i.e. obstacles to sampling and survey work areremoved (where possible), including any structural impediments.
* Where sampling below structures is prohibitively difficult or expensive; sampling throughfloor/slab structures or road coverings may be the appropriate choice rather thanremoving the entire structure to access the subsurface volume.
* The final state subsurface regions are identified including the depth and thickness of thebuffer zone.
* Each subsurface layer is sampled and surveyed IAW a survey and sampling plan.
When any sample or survey result suggests or necessitates remediation of a volume, theremediation is performed before a final round FSS design is planned.
Identified locations where subsurface sampling/measurements will be planned include:
1. The Spray Pond area (-5500 square meters)
2. The 1.148 acre SNEC Facility site. To date, a significant portion of this area has beenremediated.
3. Any suspect subsurface areas identified by site management that have showncontamination levels approaching the DCGLw.
5-52
C~r-F^I FCIel 1TV I IC ETERIMINATIONt PiLAN REVISION I1KIV 1_A rAI-I I| I - -.... .. MIN l P A REVISION. ,
5.5.3.4.8 CV Steel Shell Activation Area Survey
The activated section of the CV steel liner is currently assumed to be a region of the CV shell thatextends from about the 790' El (operational water line in the reactor cavity) up to the proposed cutoff region at about the 805' El (-15 feet). Additionally, the region is assumed to extend for a fullquadrant of the CV or about 39' of the circumference of this building (centered horizontally at theformer location of the reactor).
When the interior surface of the CV shell is thoroughly decontaminated, from residual surfacecontamination, samples of the steel shell will be collected within the activation zone previouslydescribed. The analysis of these samples will provide the best average concentration for the steelshell in the activation region. Additionally, a gamma measurement of the shell in this region may beused to augment the sampling efforts. These types of gamma measurements are specialmeasurements and are described in more detail in Section 5.5.3.4.9. The direct and indirect dosecontribution will be added to the dose contribution from residual surface contamination. The sumfrom these two sources will be maintained below 25 mrem/y TEDE.
5.5.3.4.9 CV Steel Support Ring Surveys
During 2002, SNEC was tasked with surveying and releasing several steel surface areas of theSNEC Containment Vessel (CV) steel shell in support of installation of steel I-beams, which weredesigned to stabilize the shell during removal of concrete. Survey areas were first aggressivelycleaned using methods such as surface grinding which removed surface oxides, paint and anyresidual concrete that had adhered to the SNEC CV steel surface, as well as a thickness of thesteel itself. This cleaning process removed contaminants to essentially the base metal, thusensuring that the vast majority of surface contamination had been removed before the surveysbegan. Pre and post cleaning surveys were performed to verify that the cleaning effort wassuccessful.
The survey was designed using NRC screening DCGLs for surface contamination as described inTable 5-1. A conservative scanning speed was set to locate elevated areas within the survey unitswhich when detected, were re-measured for a full one minute of count time. Elevatedmeasurement locations were re-cleaned and re-surveyed as necessary. Randomly located staticmeasurement points were also counted for one minute.
These areas have been surveyed 'at risk" in that they have been surveyed before NRC approval ofthe SNEC License Termination Plan (LTP). Conservative survey planning and remediation effortshave been used to ensure that all ring installation areas were decontaminated thoroughly belowpotential site release limits. In addition, radiological controls remained in place throughout thesurvey process to prevent survey area re-contamination.
This survey information will be included in the Final Status Survey Report.
5.5.3.5 Investigation Measurements
Removable activity, dose rate, and in-situ gamma spectrometry measurements may be used asdiagnostic tools to further characterize the radiological conditions in selected areas, and toevaluate potential response actions. Sodium iodide detectors can also be used, both for hard toreach areas e.g., embedments, piping and duct work, as well as for subsurface monitoringefforts such as gamma-logging. Sodium iodide detectors become especially useful whenemployed in conjunction with multi-channel analyzers that are capable of discerning between
5-53
I
SNEC FACILITY LICENSE TERMINATION PLAN REVISION 2
natural occurring and site-specific radionuclides.
Gamma-logging using a multi-channel analyzer is useful in both screening surveys (to determinedepth and average concentration of contamination) and in final status surveys (to provide an upperlimit of the average radionuclide concentration). If no significant counts are obtained in thedetection system's region of interest (ROI), within a bore hole or piping system, then a "less than"value, or minimum detectable concentration (MDC), can be quoted for the soil around the borehole or for a measured section of system piping at a given confidence level (95%). By ensuringthat the MDC is less than the release criteria, the surveyor can designate the soil in the vicinity ofthe detector (or section of pipe) to be below the release criteria. Additionally, this type ofmeasurement system is sensitive to elevated materials in adjacent buried piping or elevatedpockets of contamination outside of the immediate sampling zone. Therefore, GPU Nuclear, Inc.will consider using gamma-logging as a compliment to sampling in areas where volumetricallycontaminated materials approach the release criteria or when contamination is thought to bepresent in piping systems within a survey area.
5.5.3.6 Hard-To-Detect (HTD) Radionuclides
Many radionuclides are comparatively simple to detect in the field at environmental levels usingroutine gamma-ray spectroscopy analysis techniques. In contrast, the "Hard-To-Detect" (HTD)radionuclides are not easily identified using any routinely applied field measurement practices.SNEC has identified H-3, C-14 and Ni-63 as being the only HTD type nuclides of significance atthe SNEC Facility. A summary of the radionuclide selection process can be found in Section6.2.2.3.
5.5.4 Sample Handling and Analysis
When sample custody is transferred (e.g., when samples are sent off-site to another lab foranalysis), a chain-of-custody record accompanies the sample for tracking purposes. The samplechain of custody record documents the custody of samples from the point of measurement orcollection Until final results are obtained. These tracking records are controlled and maintained inaccordance with approved site procedures. On-site laboratory capabilities are used to performgamma spectroscopy of bulk sample materials, gross beta-gamma and alpha counting of smearsand Tritium analysis in liquid samples. Off-site laboratory services are procured as needed for Sr-90, TRU and other Hard-To-Detect (HTD) radionuclides. Laboratory analytical methods aregenerally capable of measuring levels at 10 to 50 percent (or less) of applicable DCGLW values.
5.5.5 Data Management
Final survey data may be collected from post remediation surveys, final surveys, investigationsurveys or special measurement evaluations such as those made to determine embedment or sub-surface activity levels.
5.5.5.1 Other Scan Measurements
When 100% of any area is scanned at a high detection efficiency, capable of discerning low levelsof residual activity (well below established DCGLW levels), collected results have a greaterassurance that survey areas meet the site release criteria. Consequently, some scan surveymeasurement efforts performed for initial phase and/or investigative purposes, may be acceptedas final survey data provided the following conditions are met:
5-54
SNEC FACILITY LICENSE TERMINATION PLAN I REVISION 2
1. The MDA for the scan is a small fraction of the required DCGLW for the survey area, andthere is sufficient sensitivity present in the survey design at an acceptable confidencelevel.
2. All applicable survey data collection requirements as prescribed in Section 5.5 and 5.6.1are followed.
3. The area was isolated after the survey activity.
5.5.5.2 Other Static Measurements
Other static measurements performed during post remediation and investigation surveys arebased on professional judgment. Since they are biased and not random, they may not be used inthe statistical tests. However, this does not necessarily preclude their acceptance as final surveydata. These measurements may be accepted as final survey data provided:
1. All applicable survey data collection requirements as prescribed in Section 5.5 and 5.6.1are followed.
2. Thirty or more data points are collected within the survey unit. For piping and otherembedments, accessibility to interior surfaces may not allow this number ofmeasurements. In these cases, similar survey methodology encompassing historicalassessment, characterization, remediation, and post remediation survey data will beused as a basis for biased measurements and sampling, to ensure that the releasecriteria are met.
3. None of the data points exceeds the DCGLW.
4. The area was isolated after the survey activity.
5.5.5.3 Data Recording
Survey measurements will be recorded in units appropriate for comparison to the DCGLW bycorrecting for material specific background, efficiency, geometry, detector area, and measurementsize as applicable. The recording units are dpm/100 cm2 for surface contamination and pCi/g forvolumetric radionuclide concentrations.
Records of survey data are maintained in accordance with approved site procedures. Survey datarecords include the identification of the surveyor, type of measurement, location, instrumentationused, results, time and date measurement was performed and the instrument calibrationinformation.
5-55
SNEC FACILITY LICENSE TERMINATION PLAN REVISIOnN 1SNEC FACILITY LICENSE TERMINATION PLAN RF�IIS�IflN I
5.6 SURVEY DATA ASSESSMENT
The data assessment process checklist is illustrated in Figure 5-2. Final survey data, described inSection 5.5, are reviewed to verify they are of adequate quantity and quality. Graphicalrepresentations and statistical comparisons of the data can be made which may provide bothquantitative and qualitative information about the data. An assessment is performed to verify thedata. If the quantity or quality of the data is called into question, previous survey steps are re-evaluated. The statistical tests are applied and conclusions are drawn from the data as to whetherthe survey unit meets the site release criteria.
5.6.1 Data Verification and Validation
The final survey data will be reviewed to verify they are authentic, appropriately documented, andtechnically defensible. The review criteria for data acceptability are:
1. The instruments used to collect the data are capable of detecting the radiation of interestat or below the investigation level. If not, acceptable compensatory measures havebeen taken.
2. The calibration of the instruments used to collect the data is current and radioactivesources used for calibration are traceable to recognized standards or calibrationorganizations.
3. Instrument response is checked before and, where required, after instrument use eachday data are collected.
4. Survey team personnel are properly trained in the applicable survey techniques, and thistraining is adequately documented.
5. The MDCs and the assumptions used to develop them are appropriate for theinstruments and the survey methods used to collect the data.
6. The survey methods used to collect the data are appropriate for the media and types ofradiation being measured.
7. Special measurement methods used to collect data are applied as warranted by surveyconditions, and are properly documented in accordance with an approved site procedureor Station Work Instruction.
8. The custody of samples that are to be sent for off-site laboratory analysis, are trackedfrom the point of collection until the final results have been obtained, and
9. The final survey data set consists of qualified measurement results representative ofcurrent facility status are collected as prescribed by the survey design package.
If a discrepancy exists where one or more criteria are not met, the discrepancy will be reviewedand corrective actions taken (as appropriate) in accordance with site procedures.
5-56
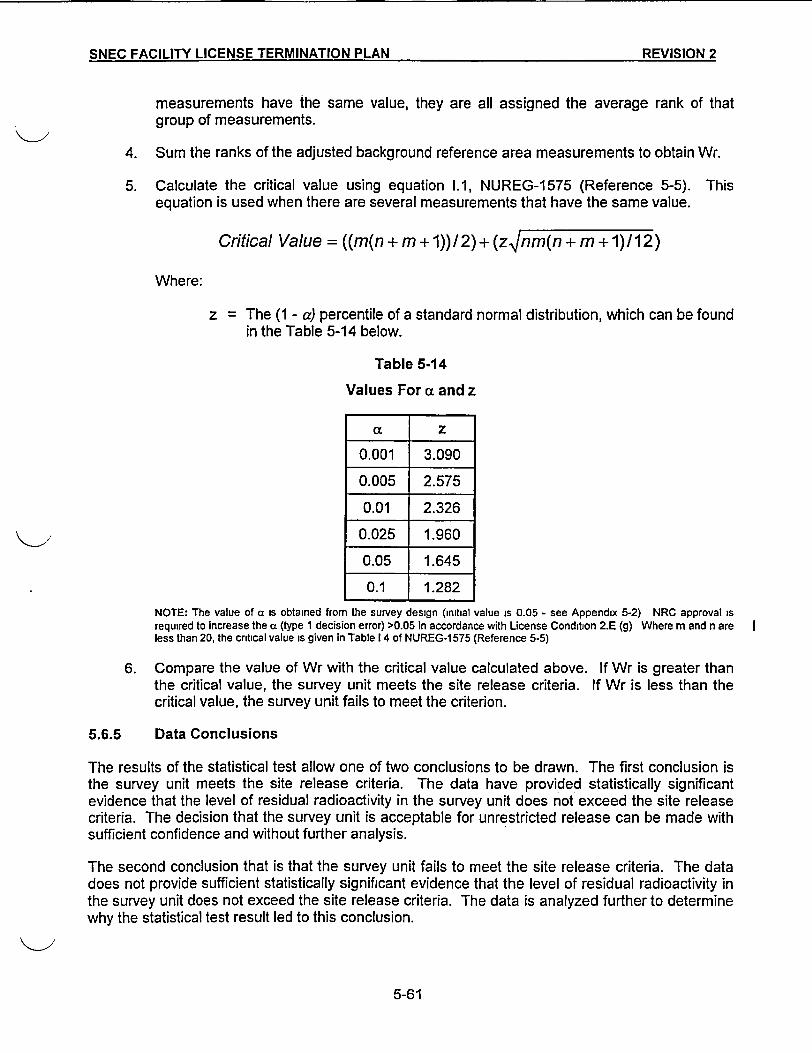
SNEC FACILITY LICENSE TERMINATION PLAN I REVISION 2SNEC FACILITY LICENSE TERMINATION PLAN REVISION 2
measurements have the same value, they are all assigned the average rank of thatgroup of measurements.
4. Sum the ranks of the adjusted background reference area measurements to obtain Wr.
5. Calculate the critical value using equation 1.1, NUREG-1575 (Reference 5-5). Thisequation is used when there are several measurements that have the same value.
Critical Value = ((m(n + m +1))/2)+ (zVnm(n + m + 1)/12)
Where:
z = The (1 - a) percentile of a standard normal distribution, which can be foundin the Table 5-14 below.
Table 5-14
Values For a and z
a Z
0.001 3.090
0.005 2.575
0.01 2.326
0.025 1.960
0.05 1.645
0.1 1.282
NOTE: The value of a is obtained from the survey design (initial value is 0.05 - see Appendix 5-2) NRC approval isrequired to increase the a (type 1 decision error) >0.05 in accordance with License Condition 2.E (g) Where m and n areless than 20, the critical value is given in Table 14 of NUREG-1575 (Reference 5-5)
6. Compare the value of Wr with the critical value calculated above. If Wr is greater thanthe critical value, the survey unit meets the site release criteria. If Wr is less than thecritical value, the survey unit fails to meet the criterion.
5.6.5 Data Conclusions
The results of the statistical test allow one of two conclusions to be drawn. The first conclusion isthe survey unit meets the site release criteria. The data have provided statistically significantevidence that the level of residual radioactivity in the survey unit does not exceed the site releasecriteria. The decision that the survey unit is acceptable for unrestricted release can be made withsufficient confidence and without further analysis.
The second conclusion that is that the survey unit fails to meet the site release criteria. The datadoes not provide sufficient statistically significant evidence that the level of residual radioactivity inthe survey unit does not exceed the site release criteria. The data is analyzed further to determinewhy the statistical test result led to this conclusion.
5-61
I
SNEC FACILITY LICENSE TERMINATION PLAN REVISION I
Possible reasons the survey unit fails to meet the site release criteria are:
1. It is in fact true,
2. It is a random statistical fluctuation, or
3. The test did not have sufficient power to detect that it is not true. The power of the testis primarily based on the actual number of measurements obtained and their standarddeviation. A retrospective power analysis for the test may be performed as described inAppendices 1.9 and 1.10 of NUREG-1575 (Reference 5-5) If the power of the test isinsufficient due to the number of measurements, additional data may be collected. If itappears that the failure may be due to statistical fluctuations, the survey unit may beresurveyed and another set of discrete measurements collected for statistical analysis.A larger number of measurements increases the probability of passing if the survey unitactually meets the site release criteria. If it appears that the failure was caused by thepresence of residual radioactivity in excess of the site release criteria, the survey unit isremediated and resurveyed.
5.7 SURVEY RESULTS
Survey results are documented in history files, survey unit release records, and are summarized inthe final survey report. Other detailed and summary data reports may be generated as requestedby the NRC or SNEC Management.
5.7.1 Survey Unit Release Record
The survey unit release record is the complete release record in a standardized format preparedfor each survey unit or group of survey units with similar histories. The survey unit release record "
is a collection of information necessary to demonstrate compliance with the site release criteria.This record includes:
1. A history file checklist:
The history file checklist references relevant operational and decommissioning data.The purpose of this checklist is to provide a basis for the survey unit classification. Thehistory file will reference relevant sections of the Historical Site Assessment (Reference5-19) and other compiled records including:
* History of remediation
* The survey unit operating history affecting radiological status
* Scoping, site characterization and post remediation survey data
* Other relevant information.
2. Description of the survey unit
3. Survey design information for the survey unit
4. Survey unit ALARA analysis, if performed
5-62
cqmcr A r:^fs1 ITV I InIrF1M4r TPORAMIATHIM PiLAM REVISION 2ONCf FAV"II a I i M; PT- MlMAT, -e .. . ,N RE -IO-
5. Survey measurement locations and corresponding survey data
6. Survey unit investigations performed with documented results, as applicable
7. Any survey unit data assessment results
8. Results of any special measurements performed for the survey unit
5.7.2 Final Survey Report
A final survey report will be prepared and submitted to the NRC. The report will provide asummary of any ALARA analysis, survey data results, and overall conclusions, which demonstratethat the SNEC Facility and site meet the radiological criteria for unrestricted use. Information suchas the number and type of measurements, basic statistical quantities, and statistical test results willbe included in the report.
The following outline illustrates a general format that may be used for the final status survey report.The outline below may be adjusted to provide a clearer presentation of the information. The levelof detail will be sufficient to clearly describe the final status survey program and certify the results.
Information to be submitted (Reference 5-4, Section 14.5):
1. A summary of the results of the final status survey.
2. A discussion of any changes that were made in the final status survey from what wasproposed in the LTP or other prior submittals.
3. A description of the method by which the number of samples were determined for eachsurvey unit (see Reference 5-5, Section 5.5.2). -
4. A summary of the values used to determine the numbers of samples and a justificationfor these values (see Reference 5-5, Section 5.5.2).
5. Survey results for each survey unit including:
* Number of samples taken for the survey unit.
* A map or drawing of the survey unit showing the reference system and random startsystematic sample locations for Class 1 and 2 survey units, and random locationsshown for Class 3 survey units and reference areas.
* Measured sample concentrations.
* Statistical evaluation of the measured concentrations (see Reference 5-5, Section8.3, 8.4 and 8.5).
* Judgmental and miscellaneous sample data sets reported separately from thosesamples collected for performing the statistical evaluation.
5-63
I
SNEC FACILITY LICENSE TERMINATION PLAN REVISION 1
* Discussion of anomalous data including any areas of elevated direct radiationdetected during scanning that exceeded the investigation level or measurementlocations in excess of the DCGLw.
* A statement that a given survey unit satisfied the DCGLw and the elevatedmeasurement comparison if any sample points exceeded the DCGLw.
6. A description of any changes in initial survey unit assumptions relative to the extent ofresidual radioactivity.
7. When a survey unit failed, a description of the investigation conducted to ascertain thereason for the failure and a discussion of the impact that the failure has on theconclusion that the facility was ready for final radiological surveys.
8. If a survey unit failed, a description of the impact that the reason for the failure has onother survey unit information.
5.7.3 Other Reports
If requested by the NRC, computer-generated and/or summary data reports will be provided inhard copy or electronic form. Survey data include date, instrument, location, type of measurement,and mode of instrument operation. Other data, such as conversion factors, background referenceareas, and the MDCs used, are available which will allow independent verification of the results.Measurement results will also be presented graphically. The FSS report will be independentlyreviewed.
Any independent verification survey performed will be performed by an organization outside theSNEC Facility staff and management organization. Reports generated as a result of anyindependent verification survey process initiated by the SNEC Facility, will be available uponrequest.
5-64
1;NFQ FACILITY LICENSE TERMINATION PLAN REVISION 1_NE FACLIT LIES TERMINATION PLAN_ __. ........................ REVISION............ _._
5.8 DEFINITIONS
1. Accessible Surface Area - An area available to a radiation detector for directscanning or fixed-point measurements.
2. Area Factor (AEMC) - A factor used to adjust the DCGLW to estimate DCGLEMC andthe minimum detectable concentration for scanning surveys in Class 1 surveyunits (DCGLEMC = DCGLW x AEMC. The area factor (AEMC) is the magnitude bywhich the residual radioactivity in a small area of elevated activity can exceed theDCGLW, while maintaining compliance with the release criterion. SNEC Facilityarea factors are listed in Table 5-15 of Appendix 5-1.
3. Background Radiation - Naturally occurring radiation which may include cosmic,terrestrial (radiation from the naturally radioactive elements) and man-maderadiation from global fallout.
4. Characterization Survey - A radiological survey and its supporting evaluationsperformed to establish the SNEC Facility radiological condition for planningdecommissioning activities.
5. Confidence Level - The probability associated with a confidence interval whichexpresses the probability that the confidence interval contains the populationparameter value being estimated.
6. Derived Concentration Guideline Level (DCGL) - Residual radioactivity levels thatequate to the site release criteria for that particular pathway or measurement. Thetwo (2) basic DCGLs defined in this plan are 1) the DCGLw and, 2) the DCGLEMC-The DCGLW is the average concentration limit for the standard size survey area.The DCGLEMC is the elevated measurement area DCGL, which is used for smallareas of elevated activity (above the DCGLw). When not defined, DCGL refers tothe DCGLw. Other DCGLs discussed in this plan (e.g., DCGLGA etc.) are derivedfrom these two basic definitions and are sometimes referred to as an 'effectiveDCGL".
7. Elevated Area - Areas of residual contamination exceeding the guideline value.
8. Final Status Survey (FSS) - Radiological measurements, evaluations andsupporting activities undertaken to demonstrate that the SNEC Facility satisfiesthe criteria for unrestricted use.
9. Hard-to-Detect Nuclide (HTD) - A radionuclide emitting radiation(s) that aredifficult to detect with field or laboratory based instrumentation.
10. History File - A compilation of information used to justify the classification andsurvey design for the survey unit. It should reference sections of the HistoricalSite Assessment, characterization survey data, remediation surveys and otherinformation used to establish the basis for the design of the final status survey.
11. Independent Verification Survey - An information only radiological survey,performed by an organization independent of the SNEC Facility staff and
5-65
I
SNEC FACILITY LICENSE TERMINATION PLAN REVISION 2
management, which will provide SNEC Facility management with an additionallevel of confidence concerning the validity of the Final Survey results.
12. Minimum Detectable Activity (MDA) - The minimum level of radiation orradioactivity that can be measured by a specific instrument and technique. TheMDA is usually established on the basis of assuring false positive and falsenegative rates of less than 5%.
13. Minimum Detectable Concentration (MDC) - The minimum activity concentrationon a surface or material volume that can be statistically detected abovebackground. This is usually set at the 95 % confidence level.
14. Multiple Source Terms - Generic term used when more then one source termelement is encountered (e.g., a remaining site structure with surfacecontamination and embedments).
15. Operational Survey - A radiological survey performed in accordance with SNECprocedures in support of routine site operations.
16. Quality Control Survey - A survey that consists of repeat measurements on aspecified fraction of the survey areas. The survey areas are usually selected atrandom to provide an additional check of final status survey measurements.
17. Release Criteria - A term used to identify the radiological requirements for releaseof the SNEC Facility for unrestricted use.
18. Remediation Survey - Any survey performed that is used to determine theeffectiveness of remediation activities. The final post remediation survey is aspecial remediation effectiveness survey performed with instrumentation similar tothe type used for the FSS. The survey methodology is also similar to actual FSSmethodology.
19. Scan Survey - A qualitative radiological monitoring technique that is performed bymoving a detector over a surface at a specified speed and distance to detectelevated activity areas or locations. Also called a 'Surface Scan".
20. Scoping Surveys - A type of survey that is conducted to identify. 1) radionuclidecontaminants, 2) relative radionuclide ratios, and 3) general levels and extent ofcontamination.
21. Structures - All SNEC Facility site buildings and their surfaces. In addition,platforms, restraints and supports, and external surfaces of piping systems,heating and ventilation systems, tanks, stacks, etc., are also treated as structuresin the final status survey if they exist beyond remediation efforts.
22. Surface Contamination - The total of both fixed and removable contamination. Forthe purposes of this plan, this would also include any remaining neutron-activatedmaterial near the surface. Also called total surface contamination.
23. Survey Area - The basic survey entity for the management of the Final StatusSurvey. It is comprised of one or more survey units, the bounds of which are
5-66
qcIrl cArii rrv II ItrMCCR TRMIMATIrIM PI AR REVISION 2jl= IN |l~ | I I 1 La I LB ll - .... - _Al - . - .
defined by existing facility physical features, such as a room, intersection of walls,column-and-row layout of a floor elevation, or structural I-beams.
24. Survey Location - In a structural or open land survey area, a survey location isusually represented by a single grid block. In a system survey area, a specifiedlength of piping or a component such as a valve or tank is referred to as a surveylocation. A survey location can contain one or more survey points. Also referredto as measurement locations.
25. Survey Unit Release Record - A collection of information in a standardized formatfor controlling and documenting field measurements taken for the Final StatusSurvey. A survey unit release record is prepared for each survey area. Thesurvey unit release record may include the survey instructions, a control form, gridmap(s), survey measurement data sheets and survey maps. It may also be calleda survey package.
26. Survey Point - A smaller subdivision within a survey location (grid block, system,component) where local measurements are taken. For structures and systems, asurvey point generally refers to an area covered by a detector, or an area of 100cm2 when a smear is taken. For open land areas, a survey point refers to thearea covered by a detector (for paved surfaces), the point at which a dose ratemeasurement is taken, or the point at which a soil or pavement sample iscollected.
27. Survey Unit - A geographical area consisting of structures or land areas ofspecified size and shape at a remediated site for which a separate decision will bemade whether the unit attains the site-specific reference-based cleanup standardfor the designated pollution parameter. Survey units are generally formed bygrouping contiguous site areas with a similar use history and the sameclassification of contamination potential. Survey units are established to facilitatethe survey process and the statistical analysis of survey data.
28. Total Effective Dose Equivalent (TEDE) - The sum of the deep dose equivalent(for external exposures) and the committed effective dose equivalent (for internalexposures).
29. Unity Rule - Where more than one radionuclide is present, the sum of the ratios ofeach radionuclide concentration to its respective DCGL should not exceed unity.When this method is used, the effective DCGL is equal to one (1).
5-67
SNEC FACILITY LICENSE TERMINATION PLAN REVISION 2SNEC FACILITY LICENSE TERMINATION PLAN REVISION 2
5.9 REFERENCES
5-1 Code of Federal Regulations, Title 10, Part 50.82, "Termination of License"
5-2 Regulatory Guide 1.179, "Standard Format and Content of License TerminationPlans for Nuclear Power Reactors," January 1999
5-3 Code of Federal Regulations, Title 10, Part 20.1402, "Radiological Criteria forUnrestricted Use"
5-4 NUREG-1727, "NMSS Decommissioning Standard Review Plan", September2000.
5-5 NUREG-1575, Revision 1, 'Multi-Agency Radiation Survey and Site InvestigationManual (MARSSIM)," August 2001
5-6 NUREG-1505, "A Nonparametric Statistical Methodology for the Design andAnalysis of Final Status Decommissioning Surveys"
5-7 SNEC Facility Site Characterization Report, May, 1996
5-8 NUREG/CR-5512, "Residual Radioactive Contamination From Decommissioning,Final Report," Volume 1, October 1992
5-9 Draft NUREG-1549, "Using Decision Methods for Dose Assessment to ComplyWith Radiological Criteria for License Termination," July 1998
5-10 Yu, C. F. et al., Manual for Implementing Residual Radioactivity Materials a-Guidelines Using RESRAD, Environmental Assessment Division, ArgonneNational Laboratory
5-11 Yu, C. F. et al., RESRAD-Build, A Computer Model for Analyzing the RadiologicalDoses Resulting from the Remediation and Occupancy of Buildings Contaminatedwith Radioactive Material. Environmental Assessment Division, Argonne NationalLaboratory
5-12 Regulatory Guide 4.15, 'Quality Assurance for Radiological Monitoring Programs(Normal Operations) - Effluent Streams and the Environment"
5-13 SNEC Procedure, 1000-PLN-3000.05, "SNEC Facility Decommissioning QualityAssurance Plan"
5-14 SNEC Procedure, E900-PLN-4542.01, "SNEC Radiation Protection Plan"
5-15 SNEC Procedure, E900-ADM-4500.44, "SNEC Facility Calculations"
5-16 SNEC Procedure, E900-ADM-4500.04, "SNEC Records Retention Procedure"
5-17 SNEC Procedure, E900-ADM-4500.12, "Radiological Surveys: Requirements &Documentation Procedure"
5-68
QmlFr FACILITY ILICENSE TERMINATION PLAN4 REVISION 2ie�cii rrv I ICFN�E TERMINATION PLAN REVISION 2
5-18 NUREG-1507, "Minimum Detectable Concentrations With Typical RadiationSurvey Instruments for Various Contaminants and Field Conditions," June 1998
5-19 SNEC Facility Historical Site Assessment Report, January 2000
5-20 Deleted - I
5-69
SNEC FACILITY LICENSE TERMINATION PLAN REVISION I_SNEC FACILIT._Y LICENSE__ TERMINATION........................ .... _.. PLAN . . . . . REVISION...........
APPENDIX 5-1
ELEVATED MEASUREMENT COMPARISON (EMC)
The EMC, sometimes called a "hot spot test," is a simple comparison of measured valuesagainst a limit. There are two applications of this comparison in the final survey process. It isused when the sensitivity of the scanning technique is not sufficient to detect levels of residualradioactivity below the DCGL (i.e., where the MDCsCan is greater than the DCGL). In thisapplication, the number of static measurements may need to be adjusted. Appendix 5-2describes how this is done. The second application in this appendix, is when one or more scanor static measurement data points exceed the DCGL. The use of the EMC for measurementsabove the DCGL provides assurance that unusually large measurements receive the properattention and that any area having the potential for significant dose contributions is identified.The EMC is intended to flag potential failures in the remediation process.
Locations, identified by scan or static measurements, with levels of residual radioactivity, whichexceed the DCGL, are investigated (see Section 5.4.4). The size of the area where theelevated residual radioactivity exceeds the DCGL and the level of the residual radioactivitywithin the area are determined. The average level of residual radioactivity is then compared tothe DCGLEMC. If a background reference area is to be applied to the survey unit, the mean ofthe background reference area measurements may be added to the DCGL or the DCGLEMC towhich the average level of residual radioactivity is compared.
The DCGLEMC is calculated using the following equation (NUREG-1 575, Equation 8-1):
DCGLEMC = Area Factorx DCGL
The area factor is the multiple of the DCGL that is permitted in the area of elevated residualradioactivity without requiring remediation. The area factor is related to the size of the area overwhich the elevated residual radioactivity is distributed. That area, denoted AEMC, is generallybordered by levels of residual radioactivity below the DCGL, and is determined by theinvestigation. The area factor is the ratio of dose per unit area or volume for the default surfacearea for the applicable dose modeling scenario to that generated using the area of elevatedresidual radioactivity, AEMC- It is calculated based on the methodology given in chapter 8 ofNUREG-1505 (Reference 5-6).
If the average level of the elevated residual radioactivity is less than the DCGLEMC, there isreasonable assurance the site release criteria is still satisfied and the area does not requireremediation. Radioactivity at the DCGLEMc distributed over the area AEMc delivers the samecalculated dose as does residual radioactivity at the DCGL distributed over the default surfacearea. If the DCGLEMC is exceeded, the area is remediated and resurveyed. Area factors foropen land areas at the SNEC Facility are provided in Table 5-15. Area factors for surface areaDCGLs supplied by the NRC are provided in Table 5-15A.
5-70
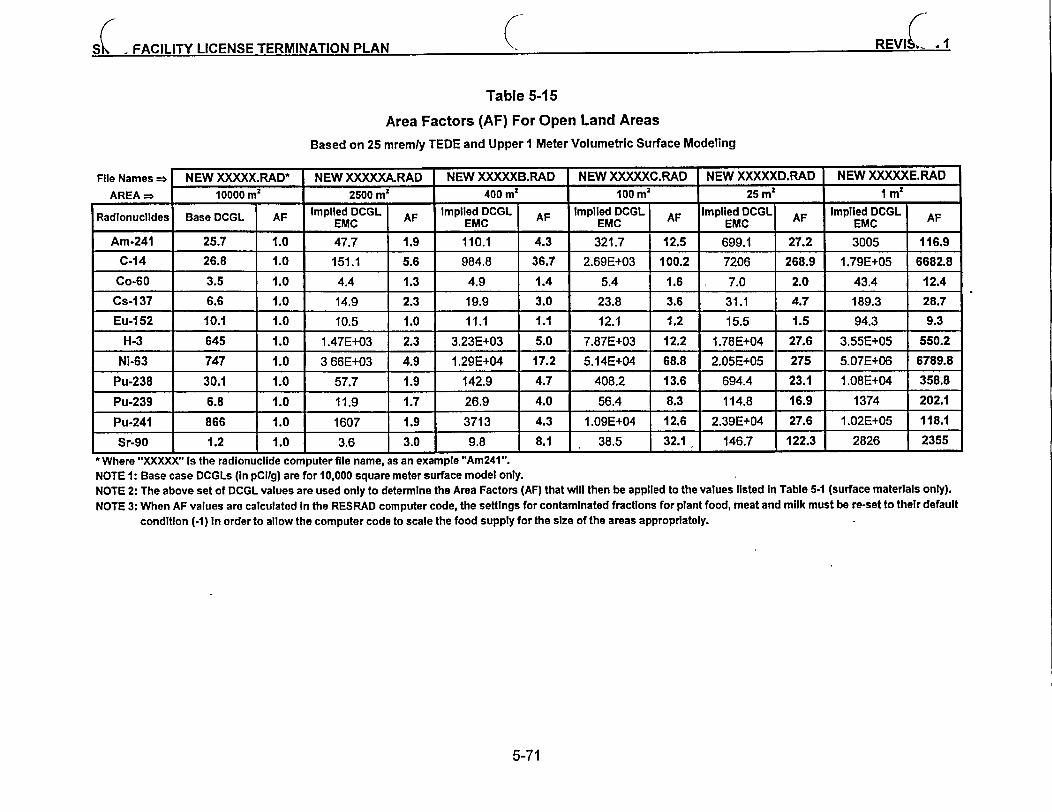
CC C^Ae'I ETV I It*CSK10 T'rCORMATAflM Oi AM REVIC I1I>1 ', IA~LI I I LI'.CIMICJ I I5XhWIIIMJ I IVI rul
Table 5-15
Area Factors (AF) For Open Land Areas
Based on 25 mremly TEDE and Upper 1 Meter Volumetric Surface Modeling
File Names = NEW XXXXX.RAD* NEW XXXXXA.RAD NEW XXXXXB.RAD NEW XXXXXC.RAD NEW XXXXXD.RAD NEW XXXXXE.RADAREA => 10000 m2 2500 m2 400 m2 100 ml 25 m2 I m2
2
Radionuclides Base DCGL AF Implied DCGI AF Implied DCGL AF Implied DCGL AF Implied DCGL AF Implied DCGL AF__ _ _ _ _ _ _ _ _EIVC EIVC EMC _ __ EMVC EMC _ _ _
Am-241 25.7 1.0 47.7 1.9 110.1 4.3 L 321.7 12.5 699.1 27.2 3005 116.9
C-14 26.8 1.0 151.1 5.6 984.8 36.7 2.69E+03 100.2 7206 268.9 1.79E+05 6682.8
Co-60 3.5 1.0 4.4 1.3 4.9 1.4 5.4 1.6 7.0 2.0 43.4 12.4
Cs-137 6.6 1.0 14.9 2.3 19.9 3.0 23.8 3.6 31.1 4.7 189.3 28.7
Eu-152 10.1 1.0 10.5 1.0 11.1 1.1 12.1 1.2 15.5 1.5 94.3 9.3
H-3 645 1.0 1.47E+03 2.3 3.23E+03 5.0 7.87E+03 12.2 1.78E+04 27.6 3.55E+05 550.2
Ni-63 747 1.0 3 66E+03 4.9 1.29E+04 17.2 5.14E+04 68.8 2.05E+05 275 5.07E+06 6789.8
Pu-238 30.1 1.0 57.7 1.9 142.9 4.7 408.2 13.6 694.4 23.1 1.08E+04 358.8
Pu-239 6.8 1.0 11.9 1.7 26.9 4.0 56.4 8.3 114.8 16.9 1374 202.1
Pu-241 866 1.0 1607 1.9 3713 4.3 1.09E+04 12.6 2.39E+04 27.6 1.02E+05 118.1
Sr-90 1.2 1.0 3.6 3.0 9.8 8.1 38.5 32.1 146.7 122.3 2826 2355* Where "XXXXX" Is the radionuclide computer file name, as an example "Am241 ".NOTE 1: Base case DCGLs (in pCi/g) are for 10,000 square meter surface model only.NOTE 2: The above set of DCGL values are used only to determine the Area Factors (AF) that will then be applied to the values listed in Table 5.1 (surface materials only).NOTE 3: When AF values are calculated In the RESRAD computer code, the settings for contaminated fractions for plant food, meat and milk must be re-set to their default
condition (-1) In order to allow the computer code to scale the food supply for the size of the areas appropriately.
5-71
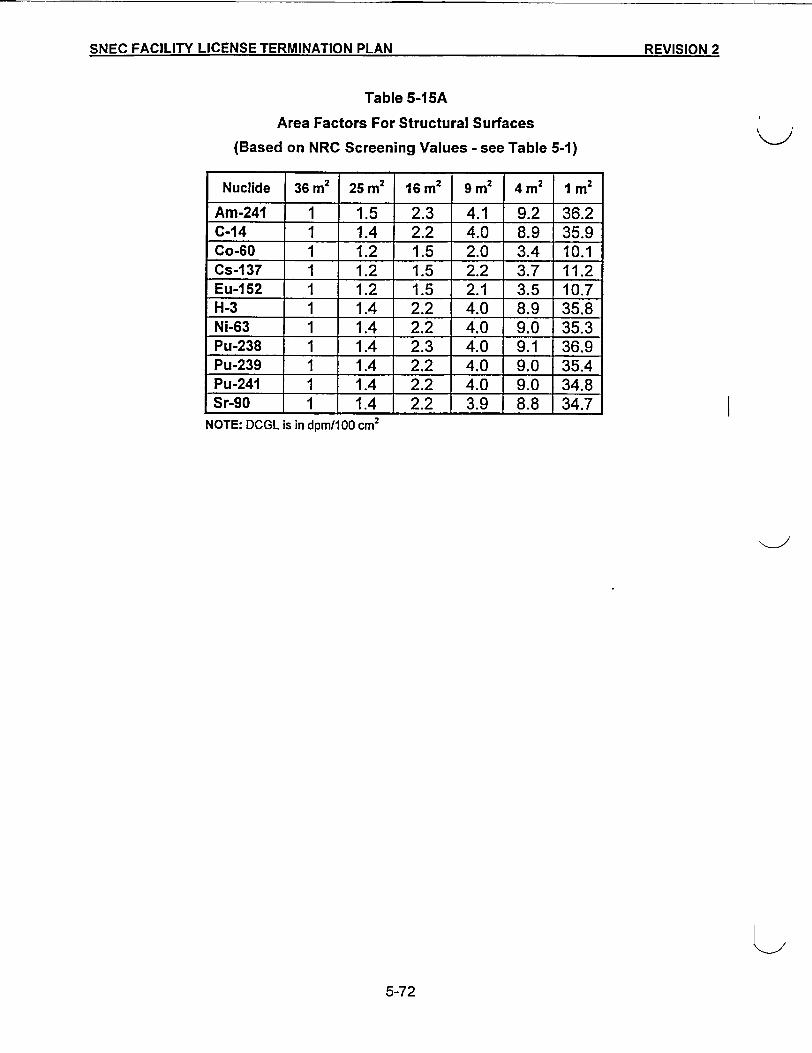
I
SNEC FACILITY LICENSE TERMINATION PLAN REVISIONm 2-SNEC FACILITY LICENSE TERMINATION PLAN RFVI�IflNI 2
Table 5-15A
Area Factors For Structural Surfaces
(Based on NRC Screening Values - see Table 5-1)
Nuclide 36 m2 25 m2 16 m2 9 m2 4 m2 I m2
Am-241 1 1.5 2.3 4.1 9.2 36.2C-14 1 1.4 2.2 4.0 8.9 35.9Co-60 1 1.2 1.5 2.0 3.4 10.1Cs-137 1 1.2 1.5 2.2 3.7 11.2Eu-162 1 1.2 1.5 2.1 3.5 10.7H-3 1 1.4 2.2 4.0 8.9 35.8Ni-63 1 1.4 2.2 4.0 9.0 35.3Pu-238 1 1.4 2.3 4.0 9.1 36.9Pu-239 1 1.4 2.2 4.0 9.0 35.4Pu-241 1 1.4 2.2 4.0 9.0 34.8Sr-90 1 1.4 2.2 3.9 8.8 34.7
NOTE: DCGL is in dpm/100 cm2
5-72
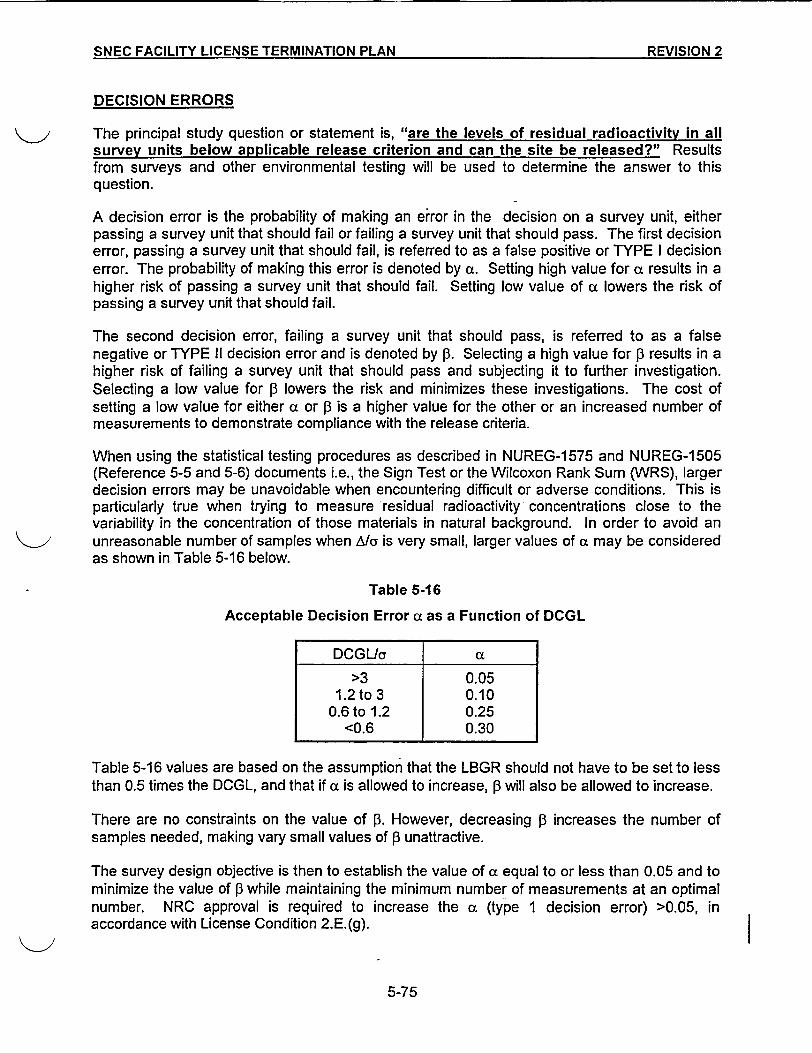
SNEC FACILITY LICENSE TERMINATION PLAN I REVISION2SNEC FACILITY LICENSE TERMINATION PLAN REVISION 2
DECISION ERRORS
The principal study question or statement is, "are the levels of residual radioactivity in allsurvey units below applicable release criterion and can the site be released?" Resultsfrom surveys and other environmental testing will be used to determine the answer to thisquestion.
A decision error is the probability of making an error in the decision on a survey unit, eitherpassing a survey unit that should fail or failing a survey unit that should pass. The first decisionerror, passing a survey unit that should fail, is referred to as a false positive or TYPE I decisionerror. The probability of making this error is denoted by a. Setting high value for a results in ahigher risk of passing a survey unit that should fail. Setting low value of a lowers the risk ofpassing a survey unit that should fail.
The second decision error, failing a survey unit that should pass, is referred to as a falsenegative or TYPE II decision error and is denoted by P3. Selecting a high value for P results in ahigher risk of failing a survey unit that should pass and subjecting it to further investigation.Selecting a low value for P lowers the risk and minimizes these investigations. The cost ofsetting a low value for either a or P is a higher value for the other or an increased number ofmeasurements to demonstrate compliance with the release criteria.
When using the statistical testing procedures as described in NUREG-1575 and NUREG-1505(Reference 5-5 and 5-6) documents i.e., the Sign Test or the Wilcoxon Rank Sum (WRS), largerdecision errors may be unavoidable when encountering difficult or adverse conditions. This isparticularly true when trying to measure residual radioactivity concentrations close to thevariability in the concentration of those materials in natural background. In order to avoid anunreasonable number of samples when A/l is very small, larger values of a may be consideredas shown in Table 5-16 below.
Table 5-16
Acceptable Decision Error a as a Function of DCGL
DCGLa a
>3 0.051.2 to 3 0.10
0.6 to 1.2 0.25<0.6 0.30
Table 5-16 values are based on the assumption that the LBGR should not have to be set to lessthan 0.5 times the DCGL, and that if a is allowed to increase, P will also be allowed to increase.
There are no constraints on the value of P. However, decreasing P increases the number ofsamples needed, making vary small values of P unattractive.
The survey design objective is then to establish the value of a equal to or less than 0.05 and tominimize the value of p while maintaining the minimum number of measurements at an optimalnumber. NRC approval is required to increase the a (type 1 decision error) >0.05, inaccordance with License Condition 2.E.(g). I
5-75
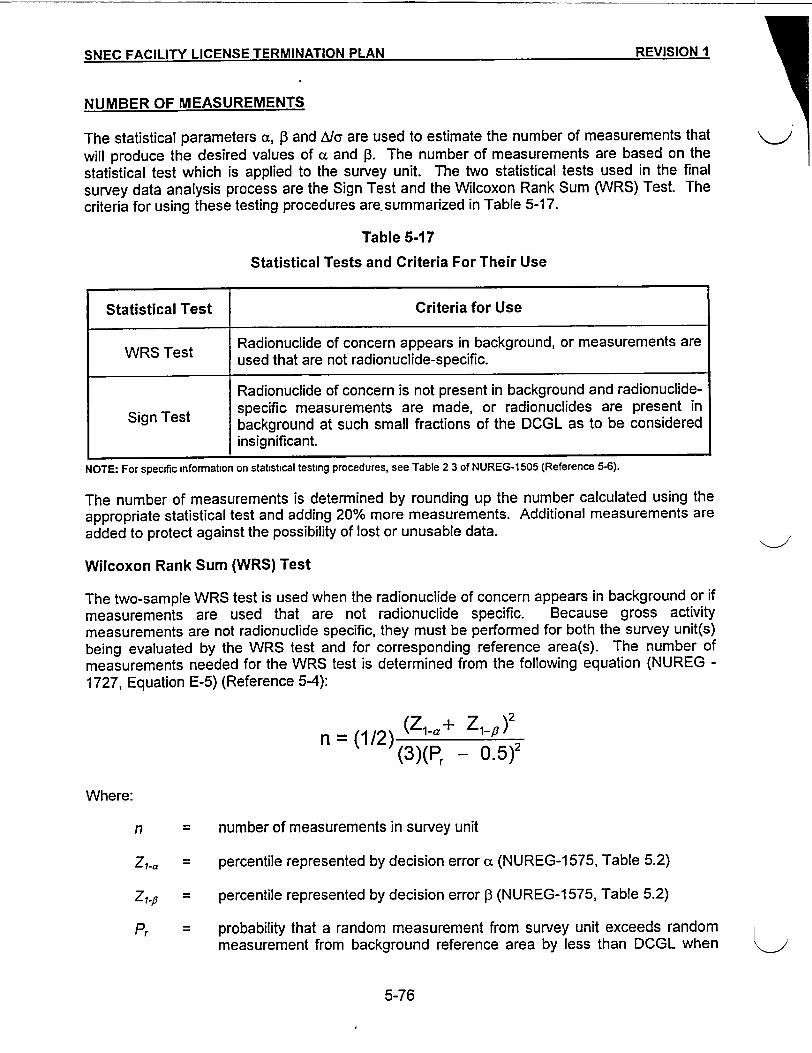
QkIce- cAw fIIT1V I Id-=MCF T=DRJINIMATlnM 01 AM REVISIOlfN I; NC* LAiI I l - ... A...M I- Avo rarI ,
NUMBER OF MEASUREMENTS
The statistical parameters a, f3 and A/c are used to estimate the number of measurements that \<Jwill produce the desired values of a and Pf. The number of measurements are based on thestatistical test which is applied to the survey unit. The two statistical tests used in the finalsurvey data analysis process are the Sign Test and the Wilcoxon Rank Sum (WRS) Test. Thecriteria for using these testing procedures are.summarized in Table 5-17.
Table 5-17
Statistical Tests and Criteria For Their Use
Statistical Test Criteria for Use
Tt Radionuclide of concern appears in background, or measurements areWRS Test used that are not radionuclide-specific.
Radionuclide of concern is not present in background and radionuclide-Test specific measurements are made, or radionuclides are present in
Sign ebackground at such small fractions of the DCGL as to be considered
insignificant.
NOTE: For specific information on statistical testing procedures, see Table 2 3 of NUREG-1505 (Reference 5-6).
The number of measurements is determined by rounding up the number calculated using theappropriate statistical test and adding 20% more measurements. Additional measurements areadded to protect against the possibility of lost or unusable data.
Wilcoxon Rank Sum (WRS) Test
The two-sample WRS test is used when the radionuclide of concern appears in background or ifmeasurements are used that are not radionuclide specific. Because gross activitymeasurements are not radionuclide specific, they must be performed for both the survey unit(s)being evaluated by the WRS test and for corresponding reference area(s). The number ofmeasurements needed for the WRS test is determined from the following equation (NUREG -1727, Equation E-5) (Reference 5-4):
(Zlia+ Z1-, )2rn = (1 /2) Z'+Z')
(3 )(Pr - 05)2
Where:
n = number of measurements in survey unit
Z.a = percentile represented by decision error a (NUREG-1 575, Table 5.2)
Z, = percentile represented by decision error P (NUREG-1575, Table 5.2)
P,. probability that a random measurement from survey unit exceeds randommeasurement from background reference area by less than DCGL when
5-76
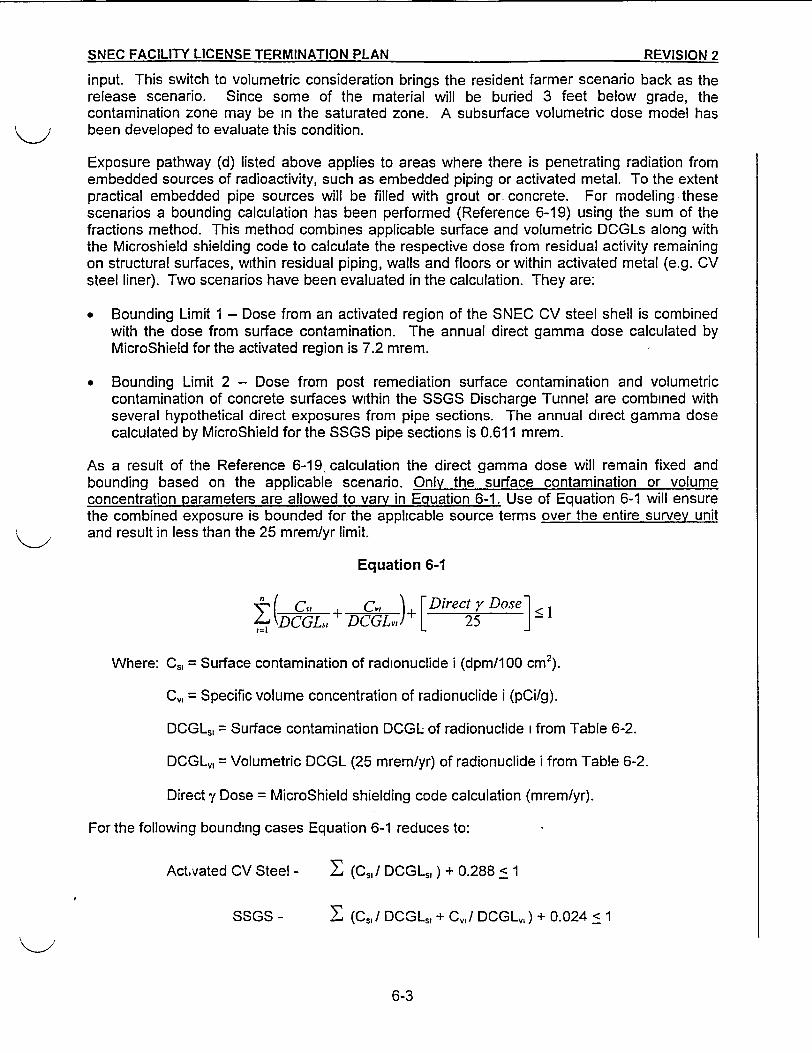
SNEC FACILITY LICENSE TERMINATION PLAN REVISION 2
input. This switch to volumetric consideration brings the resident farmer scenario back as therelease scenario. Since some of the material will be buried 3 feet below grade, thecontamination zone may be in the saturated zone. A subsurface volumetric dose model hasbeen developed to evaluate this condition.
Exposure pathway (d) listed above applies to areas where there is penetrating radiation fromembedded sources of radioactivity, such as embedded piping or activated metal. To the extentpractical embedded pipe sources will be filled with grout or concrete. For modeling -thesescenarios a bounding calculation has been performed (Reference 6-19) using the sum of thefractions method. This method combines applicable surface and volumetric DCGLs along withthe Microshield shielding code to calculate the respective dose from residual activity remainingon structural surfaces, within residual piping, walls and floors or within activated metal (e.g. CVsteel liner). Two scenarios have been evaluated in the calculation. They are:
* Bounding Limit 1 - Dose from an activated region of the SNEC CV steel shell is combinedwith the dose from surface contamination. The annual direct gamma dose calculated byMicroShield for the activated region is 7.2 mrem.
* Bounding Limit 2 - Dose from post remediation surface contamination and volumetriccontamination of concrete surfaces within the SSGS Discharge Tunnel are combined withseveral hypothetical direct exposures from pipe sections. The annual direct gamma dosecalculated by MicroShield for the SSGS pipe sections is 0.611 mrem.
As a result of the Reference 6-19. calculation the direct gamma dose will remain fixed andbounding based on the applicable scenario. Only the surface contamination or volumeconcentration parameters are allowed to vary in Equation 6-1. Use of Equation 6-1 will ensurethe combined exposure is bounded for the applicable source terms over the entire survey unitand result in less than the 25 mrem/yr limit.
Equation 6-1
_______+ Cv 1 )[DirectrDose]<,=, DCGL + DCGLvrl[ 25 -
Where: Cs, = Surface contamination of radionuclide i (dpm/100 cm2).
C,, = Specific volume concentration of radionuclide i (pCi/g).
DCGLs, = Surface contamination DCGL of radionuclide i from Table 6-2.
DCGLV, = Volumetric DCGL (25 mrem/yr) of radionuclide i from Table 6-2.
Direct y Dose = MicroShield shielding code calculation (mrem/yr).
For the following bounding cases Equation 6-1 reduces to:
Activated CV Steel - E (Cs,/ DCGLs, ) + 0.288 < 1
SSGS - E (Cs,/ DCGLS, + Ci,,! DCGLV,) + 0.024 < 1
6-3
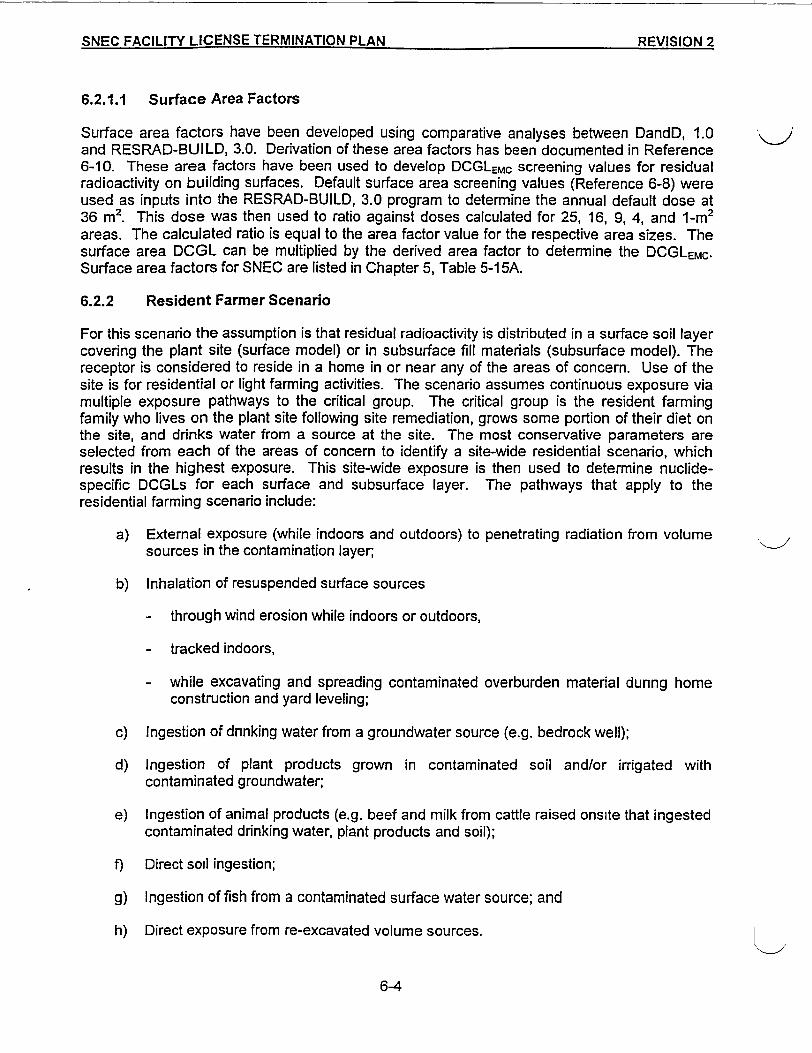
RNPQ FACILITY LICENSE TERMINATION PLAN RE=VISION 2-�NFC FACILITY LICENSE TERMINATION PLAN PFVIS�IflNi 9
6.2.1.1 Surface Area Factors
Surface area factors have been developed using comparative analyses between DandD, 1.0and RESRAD-BUILD, 3.0. Derivation of these area factors has been documented in Reference6-10. These area factors have been used to develop DCGLEMC screening values for residualradioactivity on building surfaces. Default surface area screening values (Reference 6-8) wereused as inputs into the RESRAD-BUILD, 3.0 program to determine the annual default dose at36 M2. This dose was then used to ratio against doses calculated for 25, 16, 9, 4, and 1-M2
areas. The calculated ratio is equal to the area factor value for the respective area sizes. Thesurface area DCGL can be multiplied by the derived area factor to determine the DCGLEMC.Surface area factors for SNEC are listed in Chapter 5, Table 5-1 5A.
6.2.2 Resident Farmer Scenario
For this scenario the assumption is that residual radioactivity is distributed in a surface soil layercovering the plant site (surface model) or in subsurface fill materials (subsurface model). Thereceptor is considered to reside in a home in or near any of the areas of concem. Use of thesite is for residential or light farming activities. The scenario assumes continuous exposure viamultiple exposure pathways to the critical group. The critical group is the resident farmingfamily who lives on the plant site following site remediation, grows some portion of their diet onthe site, and drinks water from a source at the site. The most conservative parameters areselected from each of the areas of concern to identify a site-wide residential scenario, whichresults in the highest exposure. This site-wide exposure is then used to determine nuclide-specific DCGLs for each surface and subsurface layer. The pathways that apply to theresidential farming scenario include:
a) External exposure (while indoors and outdoors) to penetrating radiation from volumesources in the contamination layer;
b) Inhalation of resuspended surface sources
- through wind erosion while indoors or outdoors,
- tracked indoors,
- while excavating and spreading contaminated overburden material dunng homeconstruction and yard leveling;
c) Ingestion of drinking water from a groundwater source (e.g. bedrock well);
d) Ingestion of plant products grown in contaminated soil and/or irrigated withcontaminated groundwater;
e) Ingestion of animal products (e.g. beef and milk from cattle raised onsite that ingestedcontaminated drinking water, plant products and soil);
f) Direct soil ingestion;
g) Ingestion of fish from a contaminated surface water source; and
h) Direct exposure from re-excavated volume sources.
6-4
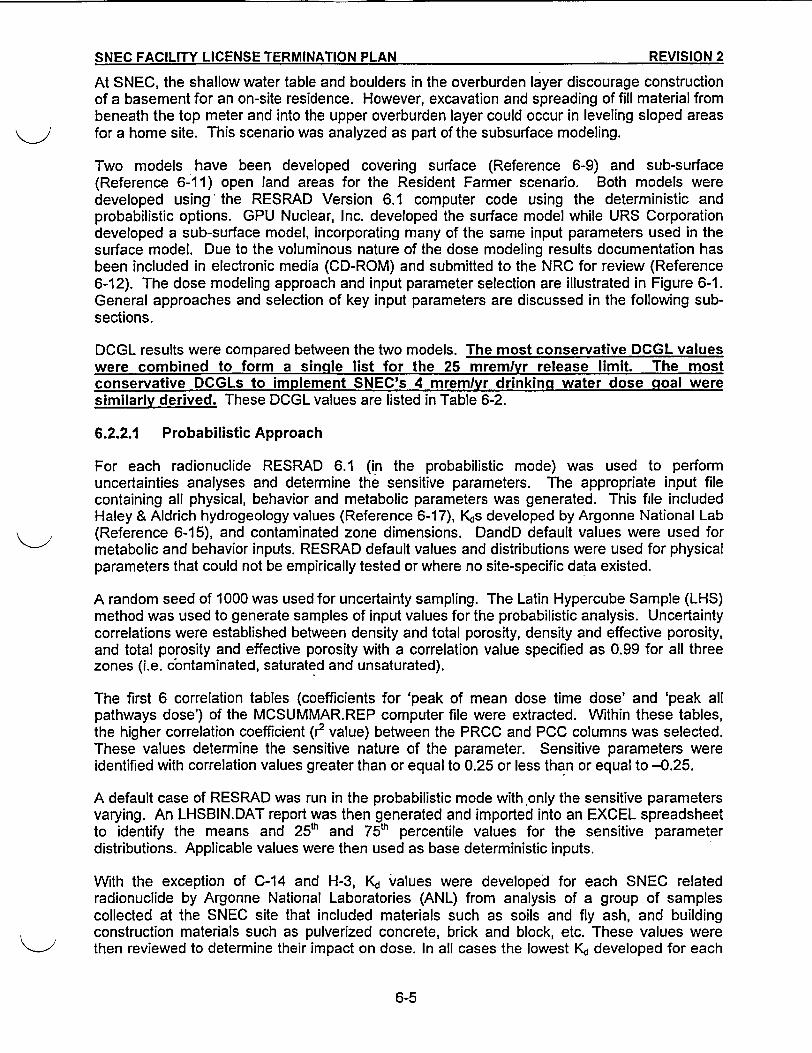
SNEC FACILITY LICENSE TERMINATION PLAN REVISION 2
At SNEC, the shallow water table and boulders in the overburden layer discourage constructionof a basement for an on-site residence. However, excavation and spreading of fill material frombeneath the top meter and into the upper overburden layer could occur in leveling sloped areasfor a home site. This scenario was analyzed as part of the subsurface modeling.
Two models have been developed covering surface (Reference 6-9) and sub-surface(Reference 6-11) open land areas for the Resident Farmer scenario. Both models weredeveloped using the RESRAD Version 6.1 computer code using the deterministic andprobabilistic options. GPU Nuclear, Inc. developed the surface model while URS Corporationdeveloped a sub-surface model, incorporating many of the same input parameters used in thesurface model. Due to the voluminous nature of the dose modeling results documentation hasbeen included in electronic media (CD-ROM) and submitted to the NRC for review (Reference6-12). The dose modeling approach and input parameter selection are illustrated in Figure 6-1.General approaches and selection of key input parameters are discussed in the following sub-sections.
DCGL results were compared between the two models. The most conservative DCGL valueswere combined to form a single list for the 25 mremlyr release limit. The mostconservative DCGLs to implement SNEC's 4 mrem/vr drinking water dose goal weresimilarly derived. These DCGL values are listed in Table 6-2.
6.2.2.1 Probabilistic Approach
For each radionuclide RESRAD 6.1 (in the probabilistic mode) was used to performuncertainties analyses and determine the sensitive parameters. The appropriate input filecontaining all physical, behavior and metabolic parameters was generated. This file includedHaley & Aldrich hydrogeology values (Reference 6-17), Kds developed by Argonne National Lab(Reference 6-15), and contaminated zone dimensions. DandD default values were used formetabolic and behavior inputs. RESRAD default values and distributions were used for physicalparameters that could not be empirically tested or where no site-specific data existed.
A random seed of 1000 was used for uncertainty sampling. The Latin Hypercube Sample (LHS)method was used to generate samples of input values for the probabilistic analysis. Uncertaintycorrelations were established between density and total porosity, density and effective porosity,and total porosity and effective porosity with a correlation value specified as 0.99 for all threezones (i.e. contaminated, saturated and unsaturated).
The first 6 correlation tables (coefficients for 'peak of mean dose time dose' and 'peak allpathways dose') of the MCSUMMAR.REP computer file were extracted. Within these tables,the higher correlation coefficient (r2 value) between the PRCC and PCC columns was selected.These values determine the sensitive nature of the parameter. Sensitive parameters wereidentified with correlation values greater than or equal to 0.25 or less than or equal to -0.25.
A default case of RESRAD was run in the probabilistic mode withonly the sensitive parametersvarying. An LHSBIN.DAT report was then generated and imported into an EXCEL spreadsheetto identify the means and 25th and 7 5 th percentile values for the sensitive parameterdistributions. Applicable values were then used as base deterministic inputs.
With the exception of C-14 and H-3, Kd values were developed for each SNEC relatedradionuclide by Argonne National Laboratories (ANL) from analysis of a group of samplescollected at the SNEC site that included materials such as soils and fly ash, and buildingconstruction materials such as pulverized concrete, brick and block, etc. These values werethen reviewed to determine their impact on dose. In all cases the lowest Kd developed for each
6-5
I
SNEC FACILITY LICENSE TERMINATION PLAN REVISION 2
radionuclide from each sample type produced the highest site dose. GPU Nuclear then selectedthe most conservative Kd value for each radionuclide to represent all material types at the site,thus site soils and re-fill materials may be placed in any location at the site without exceedingsite dose limits.
For C-14 and H-3, ANL recommended a value near 1 as the appropriate Kd to be used at thesite based on the type of volumetric materials present. Since these values were recommendedand not empirically derived, a review of the impact on dose at Kd values within a range ofpossible Kd values near 1 was conducted by GPU Nuclear, Inc. The results indicated that adefault value of 0.25 for H-3 and 1 for C-14 would provide the greater impact on dose andtherefore these values were selected for use when the probabilistic analysis indicated Kd was anon-sensitive parameter. When sensitive, the approach previously described using the 25th or7 5 th percentile of the RESRAD Kd default parameter set was selected.
6.2.2.2 Deterministic Approach
Prior to running RESRAD in the deterministic mode, a new input file containing information fromprobabilistic mode runs, was created as follows:
* Suppression of the uncertainty analysis.
* The 75th percentile value was used to replace the base-deterministic input value forthose sensitive parameters with sensitivity coefficients greater than or equal to 0.25.
* The 25th percentile value was used to replace the base-deterministic input value forthose sensitive parameters with sensitivity coefficients less than or equal to -0.25.
* The mean value was used to replace the base-deterministic input value for thosesensitive parameters not bounded by the 25th and 75h percentile values.
* Except when the coefficients of sensitivity for the distribution coefficients (Kd) aregreater than or equal to 0.25, the minimum Argonne developed Kd was used.
To determine the applicable DCGL values for each radionuclide, RESRAD was run in thedeterministic mode with the revised input file. The summary report provided the peak dose,year of occurrence and pathway breakdown for each peak dose. The 25 mrem/yr dose limitwas divided by the peak dose to determine a DCGL representing exposure from all pathways.This process was used for each radionuclide, soil region and SNEC area of concern. For 4mrem/yr drinking water dose goal, the above process was repeated with all pathways turned offexcept for the drinking water pathway. Files generated for drinking water dose analysis wereappended with DW.
6.2.2.3 Radionuclide Selection
To date, eleven (11) radionuclides have been identified as being significant dose contributors forthe SNEC site with Cs-137 being identified as the most predominant. Reference 6-13 providesthe analysis for determining site-related radionuclides. These radionuclides have been loadedinto both RESRAD and DandD software codes to determine applicable DCGLs for eachrespective model. Guidance from NUREG/CR-3474 and NUREG/CR-0130 was used to firstdevelop a comprehensive list of radionuclides that could potentially be found in media at theSNEC site, during its operation and post shutdown periods. From this list various criteria wasused to deselect radionuclides. Information on site-specific radionuclides was also determined
6-6
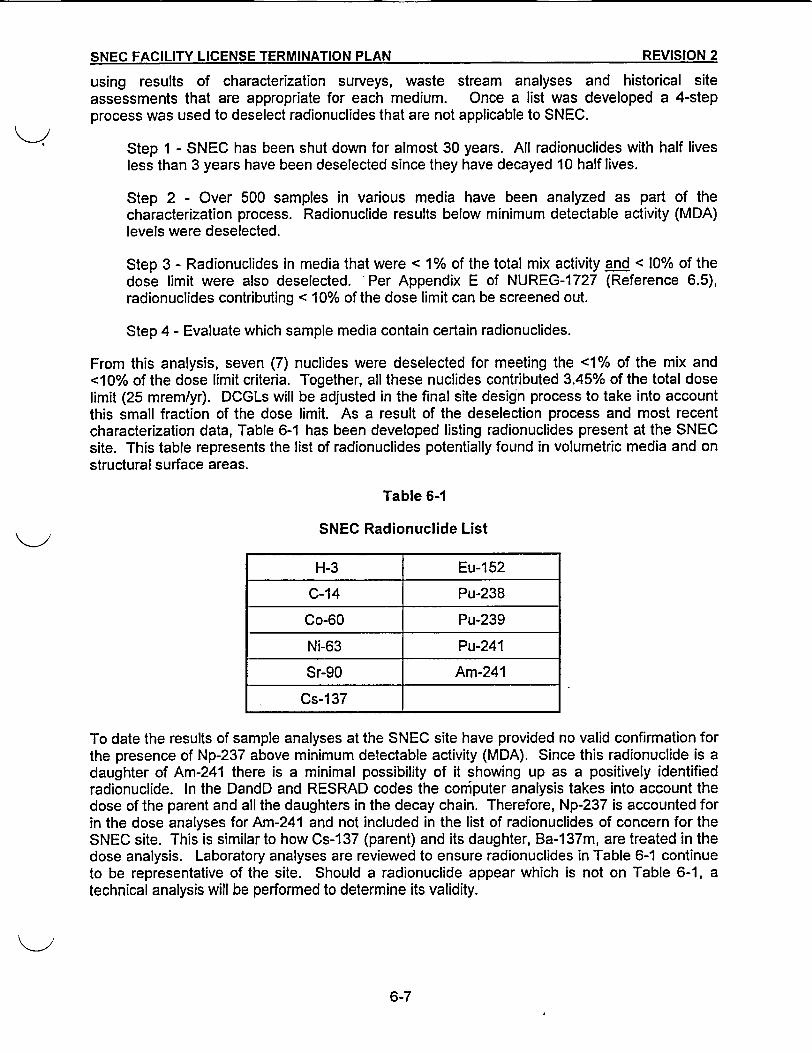
SNEC FACILITY LICENSE TERMINATION PLAN REVISION 2
using results of characterization surveys, waste stream analyses and historical siteassessments that are appropriate for each medium. Once a list was developed a 4-stepprocess was used to deselect radionuclides that are not applicable to SNEC.
Step 1 - SNEC has been shut down for almost 30 years. All radionuclides with half livesless than 3 years have been deselected since they have decayed 10 half lives.
Step 2 - Over 500 samples in various media have been analyzed as part of thecharacterization process. Radionuclide results below minimum detectable activity (MDA)levels were deselected.
Step 3 - Radionuclides in media that were < 1% of the total mix activity and < 10% of thedose limit were also deselected. -Per Appendix E of NUREG-1727 (Reference 6.5),radionuclides contributing c 10% of the dose limit can be screened out.
Step 4 - Evaluate which sample media contain certain radionuclides.
From this analysis, seven (7) nuclides were deselected for meeting the <1% of the mix and<10% of the dose limit criteria. Together, all these nuclides contributed 3.45% of the total doselimit (25 mrem/yr). DCGLs will be adjusted in the final site design process to take into accountthis small fraction of the dose limit. As a result of the deselection process and most recentcharacterization data, Table 6-1 has been developed listing radionuclides present at the SNECsite. This table represents the list of radionuclides potentially found in volumetric media and onstructural surface areas.
Table 6-1
SNEC Radionuclide List
H-3 Eu-1 52
C-14 Pu-238
Co-60 Pu-239
Ni-63 Pu-241
Sr-90 Am-241
Cs-1 37
To date the results of sample analyses at the SNEC site have provided no valid confirmation forthe presence of Np-237 above minimum detectable activity (MDA). Since this radionuclide is adaughter of Am-241 there is a minimal possibility of it showing up as a positively identifiedradionuclide. In the DandD and RESRAD codes the computer analysis takes into account thedose of the parent and all the daughters in the decay chain. Therefore, Np-237 is accounted forin the dose analyses for Am-241 and not included in the list of radionuclides of concern for theSNEC site. This is similar to how Cs-1 37 (parent) and its daughter, Ba-1 37m, are treated in thedose analysis. Laboratory analyses are reviewed to ensure radionuclides in Table 6-1 continueto be representative of the site. Should a radionuclide appear which is not on Table 6-1, atechnical analysis will be performed to determine its validity.
6-7
SRNFC FACILITY LICENSE TERMINATION PLAN REVISION~ 2-SNEC FACILITY LICENSE TERMINATION PLAN PFVI!�IflM 9
6.2.2.4 Contaminated Zone Description
The soil guideline (DCGL) is defined as the radiological concentration in soil that is acceptable ifthe site is to be used without radiological restrictions. The SNEC surface model is based on amaximum sized 10,000 m2-contaminated area, one meter thick with no cover material. Theconcentration of a radionuclide is considered to exceed background concentrations if it isgreater than the mean background plus twice the standard deviation of the backgroundmeasurements. Based on years of radiological surveys at the site the 10,000 m2 contaminatedarea dimension was selected as a dose model default parameter and is considered bounding.The one-meter thickness was selected based on remediation work conducted in 1994 at the site(Reference 6-14) and the average below grade groundwater level. For areas less than 10,000m , area factors have been developed and listed in Chapter 5, Table 5-15. Soil at the SNECsite is defined as unconsolidated earth materials, including concrete and other structural debristhat might be present.
The subsurface model calculates the dose from contaminants that may be in the saturated zoneas a result of reuse of fill and debris materials. Subsurface materials for the Spray Pond andgeneral site areas are very similar, consisting of approximately two meters of overburden and agreater thickness of underlying bedrock. The subsurface material in the SSGS consists ofcrushed, homogenized site construction debris that is covered with one meter of clean fill.Because of these differences, DCGLs were developed for only one material (homogenizeddebris) in the SSGS and for two materials (overburden and bedrock) in the Spray Pond andgeneral areas.
6.2.2.5 Dose Calculation Times (years)
Radiation doses, health risks, soil guidelines and media concentrations are calculated overuser-specified time intervals. The source is adjusted over time to account for radioactive decayand ingrowth, leaching, erosion and mixing. Although the regulatory recommendation is to usea 1000-year period, a 10,000-year period (more conservative assumption) was used to accountfor in-growth and decay of long-lived transuranic nuclides that have a potential impact on theground water pathway dose. RESRAD uses a one-dimensional groundwater model thataccounts for different transport of parent and daughter radionuclides with different distributioncoefficients (Kd)-
6.2.2.6 Site Geology and Hydrology
Subsurface investigations have been conducted at the SNEC Facility since 1981. The purposeof the investigations was to define the geologic and hydrogeologic characteristics at the site.Several of the early investigations focused on monitor well installations at key plant locations.Recent investigations examine groundwater trends beyond the immediate plant area at moredistant locations in order to characterize a broader aspect of the geologic conditions,groundwater flow and hydraulic conductivity.
There is reportedly approximately 7 to 18 feet of overburden material overlying bedrock (afractured siltstone). The overburden materials generally consist of a fill overlying a naturalboulder layer in a dense sandy, silty, clay matrix. Groundwater occurs in both theoverburden/bedrock interface and bedrock.
Groundwater flow is toward the northwest from the Facility in both the overburden/bedrockinterface and bedrock. The direction of flow is not effected by seasonal water level changes.
6-8
SNEC FACILITY LICENSE TERMINATION PLAN REVISION 2
The groundwater data indicates that the Raystown Branch of the Juniata River is a groundwaterdischarge feature. A subsurface discharge tunnel of a former coal fired generating stationaffects groundwater flow at the overburden/bedrock interface, acting as both a barrier and adrain. Groundwater flow in bedrock is controlled by northwest trending fractures.
Site-specific geometry (cross-section view) and hydrology data were used for input into theRESRAD code. This input data was based on studies conducted by a contracted geology firm(Reference 6-17) 6r default parameters determined by the RESRAD code, whichever was moreconservative.
6.2.2.7 Chemical Form and Kds
The chemical form of the SNEC residual radioactivity is bounded by the use of the default doseconversion factors (DCFs) in the RESRAD 6.1 code. These DCF values are based on chemicalform information in Federal Guidance Report # 11 that give the individual the highest dose perunit intake.
Distribution coefficient (KId) values are used in the RESRAD 6.1 code to predict the behavior ofradionuclides in -soil. Argonne National Laboratory has conducted tests and provided Kdmeasurements on SNEC soils and fill materials. Results of these tests are contained inReference 6-15.
6.2.2.8 Water Transport Parameters
The well from which water is withdrawn for domestic use or irrigation is conservatively assumedto be located either in the center of the contamination zone (in the mass balance, MB, model) orat the downgradient edge of the contaminated zone (in the nondispersion, ND, model). Foreither location, radionuclides are assumed to enter the well as soon as they reach the watertable. Usually, the MB model is used for smaller contaminated areas (e.g. 1000 m2 or less) andthe ND model is used for larger areas. For the SNEC surface model the ND input was used asthe RESRAD input. For the SNEC subsurface model the MB input was used.
6.2.2.9 Volumetric Area Factors
Volumetric area factors were developed using RESRAD 6.1 and SNEC inputs for the surfacemodeling parameters (Reference 6-9). In the base-case surface model the contaminatedfraction of plant, meat and milk products was assumed to equal one (1) using the residentfarmer scenario. Default values of -1 were substituted for these three input parameters forareas less than 10,000 M2. This was done so RESRAD could also scale smaller contaminatedareas (2500 M2, 400 M2, 100 M2, 25 M2, and 1 M2). The three default parameter values (-1)appropriately size the contaminated fractions of plants, meat and milk obtained from the sitewhen smaller and smaller area sizes are input into the RESRAD computer code. Volumetricarea factors for SNEC are listed in Table 5-15.
6-9
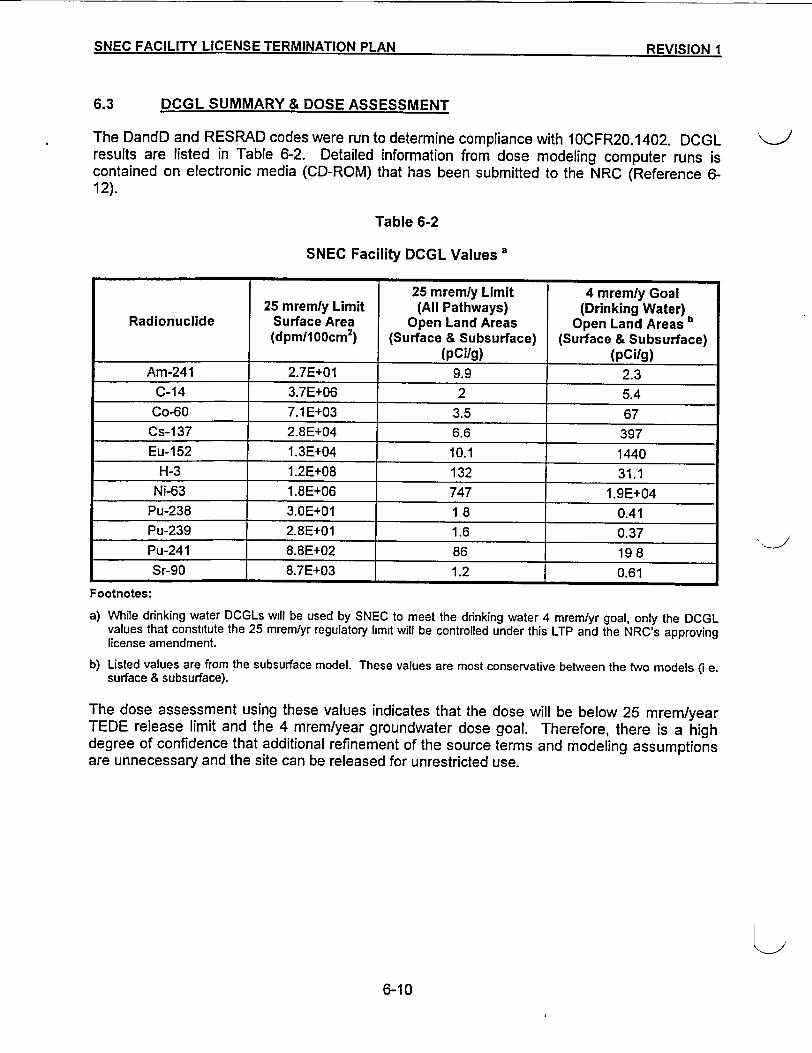
RNFQ FACILITY LICENSE TFRMINAT[t')N Pi AN 0Mx110r%1k1SNECFACLIT LIENSETERINIT~nI P1AM ~~I~EfkIa
6.3 DCGL SUMMARY & DOSE ASSESSMENT
The DandD and RESRAD codes were run to determine compliance with 10CFR20.1402. DCGLresults are listed in Table 6-2. Detailed information from dose modeling computer runs iscontained on electronic media (CD-ROM) that has been submitted to the NRC (Reference 6-12).
Table 6-2
SNEC Facility DCGL Values a
25 mremly Limit 4 mremly Goal25 mremly Limit (All Pathways) (Drinking Water)
Radionuclide Surface Area Open Land Areas Open Land Areas b(dpm/1OOcm 2) (Surface & Subsurface) (Surface & Subsurface)
(pCi/g) (pcifg)Am-241 2.7E+01 9.9 2.3
C-14 3.7E+06 2 5.4Co-60 7.1 E+03 3.5 67Cs-1 37 2.8E+04 6.6 397Eu-152 1.3E+04 10.1 1440
H-3 1.2E+08 132 31.1Ni-63 1.8E+06 747 1.9E+04
Pu-238 3.OE+01 1 8 0.41Pu-239 2.8E+01 1.6 0.37Pu-241 8.8E+02 86 19 8Sr-90 8.7E+03 1.2 0.61
Footnotes:
a) While drinking water DCGLs will be used by SNEC to meet the drinking water 4 mrem/yr goal, only the DCGLvalues that constitute the 25 mrem/yr regulatory limit will be controlled under this LTP and the NRC's approvinglicense amendment.
b) Listed values are from the subsurface model. These values are most conservative between the two models (i e.surface & subsurface).
The dose assessment using these values indicates that the dose will be below 25 mrem/yearTEDE release limit and the 4 mrem/year groundwater dose goal. Therefore, there is a highdegree of confidence that additional refinement of the source terms and modeling assumptionsare unnecessary and the site can be released for unrestricted use.
6-10
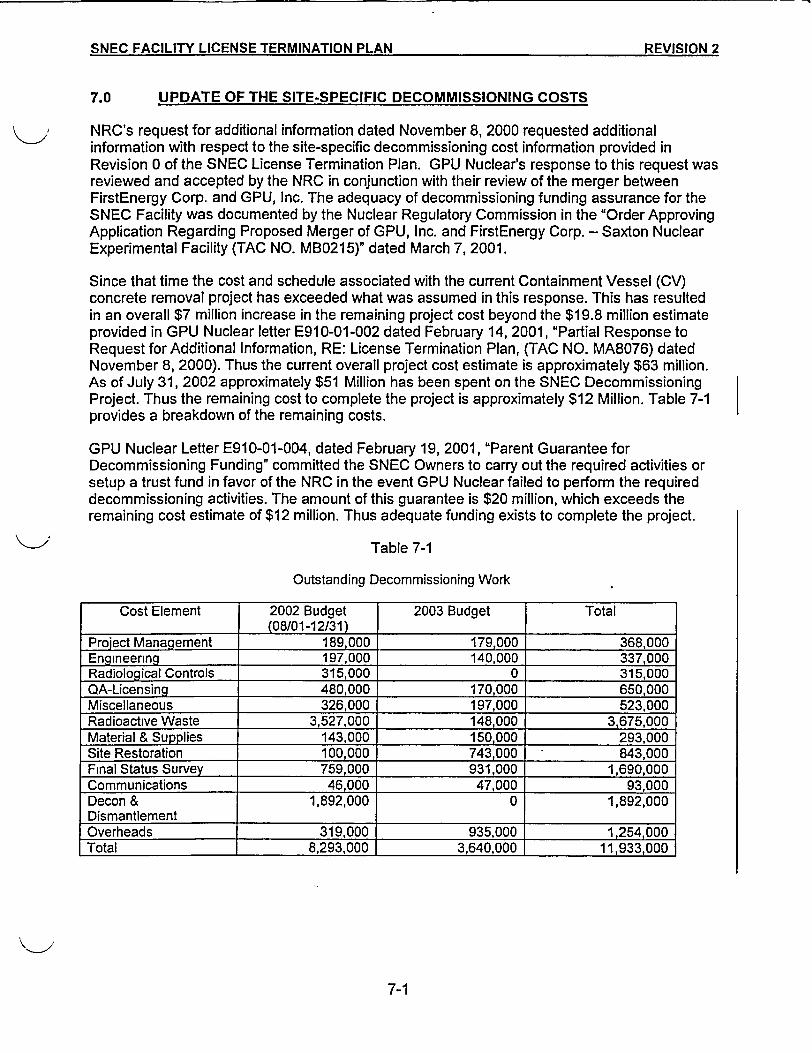
SqNFQ FACILITY LICENSE TERMINATION PLAN REVISION 2SNEC FACILITY LICENSE TERMINATION PLAN REVISION 2
7.0 UPDATE OF THE SITE-SPECIFIC DECOMMISSIONING COSTS
NRC's request for additional information dated November 8, 2000 requested additionalinformation with respect to the site-specific decommissioning cost information provided inRevision 0 of the SNEC License Termination Plan. GPU Nuclear's response to this request wasreviewed and accepted by the NRC in conjunction with their review of the merger betweenFirstEnergy Corp. and GPU, Inc. The adequacy of decommissioning funding assurance for theSNEC Facility was documented by the Nuclear Regulatory Commission in the 'Order ApprovingApplication Regarding Proposed Merger of GPU, Inc. and FirstEnergy Corp. - Saxton NuclearExperimental Facility (TAC NO. MB0215)" dated March 7, 2001.
Since that time the cost and schedule associated with the current Containment Vessel (CV)concrete removal project has exceeded what was assumed in this response. This has resultedin an overall $7 million increase in the remaining project cost beyond the $19.8 million estimateprovided in GPU Nuclear letter E910-01-002 dated February 14, 2001, "Partial Response toRequest for Additional Information, RE: License Termination Plan, (TAC NO. MA8076) datedNovember 8, 2000). Thus the current overall project cost estimate is approximately $63 million.As of July 31, 2002 approximately $51 Million has been spent on the SNEC DecommissioningProject. Thus the remaining cost to complete the project is approximately $12 Million. Table 7-1provides a breakdown of the remaining costs.
GPU Nuclear Letter E910-01-004, dated February 19, 2001, "Parent Guarantee forDecommissioning Funding" committed the SNEC Owners to carry out the required activities orsetup a trust fund in favor of the NRC in the event GPU Nuclear failed to perform the requireddecommissioning activities. The amount of this guarantee is $20 million, which exceeds theremaining cost estimate of $12 million. Thus adequate funding exists to complete the project.
Table 7-1
Outstanding Decommissioning Work
Cost Element 2002 Budget 2003 Budget Total(08/01-12/31)
Project Management 189,000 179,000 368,000Engineering 197,000 140,000 337,000Radiological Controls 315,000 0 315,000QA-Licensing 480,000 170,000 650,000Miscellaneous 326,000 197,000 523,000Radioactive Waste 3,527,000 148,000 3,675,000Material & Supplies 143,000 150,000 293,000Site Restoration 100,000 743,000 - 843,000Final Status Survey 759,000 931,000 1,690,000Communications 46,000 47,000 93,000Decon & 1,892,000 0 1,892,000DismantlementOverheads 319,000 935,000 1,254,000Total 8,293,000 3,640,000 11,933,000
7-1
Re Memo # E910-02-054
Attachment 3
Calculation No. 6900-02-025
-%- r
I
(PUNUCLEAR
CALCULATION COVER SHEET
I - . _ I .. . ... ! I-s-. hC. .lhdv,4. I caiculabdon No. I 1%Ve slalo Runlumre
j I
I 69O0-02-0 7 I 0ii..t,. WIrena Trmn Roundina Calculation
DESCRIPTION OF REVISION
Signature Date
Originator B. Brosey/ 3 .3 t 6 P G | o
Reviewer J.P. DonnachWie!- |
Additional Reviewer
Additional Reviewer
Additional Reviewer
rX I A ttUCA 'fl-, Management Approval NP k- I AV 'xVN\r\L -,aueAL
; .f .c 'N
Cover Page 1A
(GPU Calculation SheetNUCLEAR
ibject Calc.No. Rev. No. Sheet No.
_ Multiple Source Term Bounding Calculation 6900-02-0 z<0 1 of 4
Originator Date Reviewed by / Date
Bany H. Brosey 3 I d October 6, 2002 J. P. Donnachi
1.0 PROBLEM STATEMENT
1.1 The purpose of this calculation is to provide a bounding estimate of dose from multiple source
terms found on and/or in remediated structures and plant piping at the SNEC site.
1.2 Areas are assumed to have residual contamination residing on the surface and be volumetrically
contaminated. Doses are assumed to be additive, producing an upper bounding estimate of dose
within the SSGS area. Areas reviewed include the following:
* Dose from activation products found in the steel of the SNEC CV is augmented with dose
from residual surface contamination.
* Concrete surfaces in the SSGS area are described as a two component source term, with a
surface contamination component and a volumetric component.
* Volumetrically contaminated piping is treated as a separate dose contributor.
2.0 SUMMARY OF RESULTS
2.1 The results of this evaluation demonstrate that the dose from residual pipe sections will be
extremely small when compared with the 25 mrem/y limit imposed by 10 CFR 20. In addition,
the dose from activated steel within the SNEC CV when added to the dose resulting from surface
contamination in this structure will be controlled by the equation shown in Section 4.1.
3.0 REFERENCES
3.1 Microsoft Excel 97, Microsoft Corporation Inc., SR-2, 1985-1997.
3.2 GPU Nuclear Calculation No. 6900-02-011, "CV Stiffener Region Radionuclide Mix - Pre-
Survey", 3/12/02.
3.3 SNEC License Termination Plan Draft (LTP), Revision 1, 2002.
3.4 GPU Nuclear Calculation No. 6900-02-019, "Interior CV Weld Ring Areas @ 792.5 ft. El -
Survey Plan", 6/24/02.
3.5 "Embedded Pipe Radiation Survey Report", for GPU Nuclear, Saxton Nuclear Experimental
Corporation, Saxton, PA, by CoPhysics Corporation, 1242 Route 208, Monroe, NY, 10950,
October 2001 to January 2002.
4.0 ASSUMPTIONS AND BASIC DATA
4.1 This estimate considers applicable radionuclide concentrations found at the SNEC site, and
applies the sum of fractions methodology presented in Chapter 6, Revision 1 of the SNEC
License Termination Plan, when summing multiple source term dose. The equation for this type
of summation process is shown below.
Equation 6-1 from SNEC LTP (Reference 3.3)
+t DCGLvr Dose]D cL1+ 5-, I) [Dre5, •1
: G)PU Calculation SheetNUCLEAR
bject Caic. No. Rev. No. Sheet No.
lultiple Source Term Bounding Calculation 6900-024JC 0 2 of Ll
Originator Date Reviewed by Date
BaryH.Brosey 3 .? October 6, 2002 J. P. Donnachier\N 1/ /.o
Where: Ci =Surface contamination of radionuclide i (dpm/l00 cm2 ).
C~, = Specific volume concentration of radionuclide i (pCilg).
DCGL4 = Surface contamination DCGL of radionuclide i from Table 6-2
of Reference 33.
DCGL, = Volumetric DCGL (25 mrem/yr) of radionuclide i from
Table 6-2 of Reference 3.3.
Direct y Dose = MicroShield (or equivalent) shielding code calculation (mremlyr).
4.2 SNEC sample analysis results for a sample taken in the area of the 792' El support ring survey,
indicated that a gross survey unit limit of 3700 dpm/100 cm2 (for Cs-137) would be the
maximum limit for that support ring location (SNEC Sample No. SXSD3055). See Attachment
1-1 & 1-2. This surface source mix is a conservative estimate for the entire interior surface of the
CV steel shell.
4.3 Activation samples from the SNEC CV steel structure were examined by an off-site laboratory
and the results of these analysis are provided in Attachment 2-1 to 2-10.
4.4 The SSGS footprint area including the Discharge Tunnel is contaminated with radionuclide
concentrations similar to that found in the following samples. Sample identification numbers are
shown below. See Attachments 3-1 to 3-12. In general, these sample materials indicate that the
effective DCGL is near 6 pCi/g for Cs-137 (as the surrogate).
1) SXSD723 2) SXCF828 3) SXIOSD00366 4) SXSD1377
4.5 The SSGS Discharge Tunnel is assumed to be contaminated with the materials found in sample
SX1 OSD990033, which was taken from the nuclear plant effluent discharge line. This material is
similar to that found in the SSGS area. See Attachment 4-1 to 4-3.
4.6 For purposes of this bounding analysis, radioactive decay is not considered.
4.7 For purposes of this calculation, it is assumed that a person spends 50% of the time on-site and
50% of the time at point "A" on Attachment 5-1. This location is 0.5 meters from the CV shell
wall at the center of the activated region.
4.8 The thickness of the CV steel shell is assumed to be 11/16 inches (1.75 cm). Steel is assumed to
have a density of 7.86 g/cc. The Co-60 concentration input to the MicroShield computer
shielding code is (1.95 pCi/g x 7.86 g/cc)/lE+06 pCi/uCi = 1.5327E-05 uCi/cc.
- NUCLEAR
ibject, Multiple Source Term Bounding Calculation
Calculation Sheet
Cale. No.I 6900.02-0OK
Rev. No. Sbeet No.0 3 ofLIL
.
IiDw-e- hv /1 lDate .t-
Originator Date- _ L To .. )n.nAttfl1WI 2002 I P.T)onnachie 1 fl 1 lI/ a I ,A / . *I
bariy i.l1seYroey I -I o A- - ' I ___ r_ _ __
5.0 CALCULATION
5.1 Two scenarios have been evaluated within this calculation. They are:
I
5.1.1 Bounding Limit 1 - Dose from an activated region of the SNEC CV steel shell is coupled
with the dose from surface contamination.
5.1.2 Bounding Limit 2 - Dose from post remediation surface contamination and volumetric
contamination of concrete surfaces within the SSGS Discharge Tunnel are combined with
several hypothetical direct exposures from pipe sections.
5.2 Bounding Limit 1
5.2.1 Sampling of the SNEC CV steel shell in the region where activation has occurred, has
shown that the average concentration of Co-60 in the sampled region is -1.95 pCi/g ±
0.74 pCi/g (for purposes of this bounding estimate MDA values are included in the
average). See Attachment 2.
5.2.2 On Attachment 5-1, the activated region of the CV shell is assumed to be made up of
three individual plates X, Y and Z, with a Co-60 concentration as described in 5.2.1
above. Each plate is 30 degrees of circumference or -39.2 feet/3 = 13 feet wide. The
height of these plates is assumed to be 20 feet.
5.2.3 Three models were run in MicroShield. The first run (CVSHELL.MS5) was for plate Y
and yielded an exposure rate of 2.541E-03 mR/h (2.541 uR/h). The second run
(CVXPLUS.MS5) was for plate X and Z and yielded an exposure rate of 9.474E-04
mR/h (0.9474 uR/h). The third run (CVvINUS.MS5) yielded an exposure rate of
5.724E-04 mR/h (0.5724 uR/h) which must be subtracted from the previous run to adjust
for the off center characteristics of plates X and Z. Then the exposure rate at the center
of the activated region is estimated to be 2.541 + 2 x (0.9474 - 0.5724) = 3.291 uR/h. See
Attachments 5-2 to 5-7.
5.2.4 3.291 uR/h x 8766 hrs/year x 0.5 site occupancy x 0.5 occupancy at dose point A in
Attachment 5-1, yields 7.2 mR which is approximately 7.2 mrem. Residual surface
contamination on the CV shell can therefore not contribute more than 25 mrem - 7.2
mrem = 17.8 mrem.
5.2.5 Contamination on the CV surface is assumed to have a maximum effective DCGL (using
Cs-137 as a surrogate) of -3700 dpm/100 cm2 (see Section 4.2). This represents a 25
mrem dose from residual surface contamination and must be adjusted downward because
of the direct exposure rate from the activated metal. Therefore, the residual surface
contamination should not be more than (17.8/25) x 3700 = - 2600 dpm/100 cm2 in the
region of the activated steel. The equation used to combine dose is:
2600dpm /100CM2 7.2mrem < 13700dpm/100cm2 25mrem
CdPU Calculation SheetNUCLEAR
bject Calc.No. Rev. No. I Sheet No.
lultiple Source Term Bounding Calculation 6900-02-07 0 4 of
Orginator Date Rvviewed by te
Barry H. Brosey &93 . O tober 6, 2002 J. P. Donnachie ' ,0/7l/ 0
5.3 Bounding Limit 2
5.3.1 The SSGS area has similar radionuclide mix characteristics. See Attachments 3-1 to 3-
12. Using the source term and effective DCGLs provided on Attachment 4-1 and 4-2, it
can be seen that surface contamination in the Discharge Tunnel cannot be more than
-8150 dpm/100 cm2 for Cs-137 on concrete and steel surfaces, and volumetric
contamination would have to be below 6.38 pCi/g (Cs-137). As an example, if residual
surface contamination was remediated to -20% of the 8150 dpm/100 cm2 (or about 1630
dpm/100 cm2), then volumetric contamination within the Discharge Tunnel would be
maintained below 80% of the 6.38 pCi/g limit or about 5.1 pCi/g. Additionally, any dose
resulting from remaining contaminated pipe sections would be considered using the
equation presented in Section 4.1, and may result in an additional reduction in the above
values. However, most contaminated pipe runs have been removed from the SSGS area
including those in the Discharge Tunnel, leaving only short pipe stubs less than -2 foot in
length and one 18" tie line that connects the Intake Tunnel and Discharge Tunnels.
5.3.2 From Reference 3.5, the maximum contamination level found in remaining piping
located in the SSGS area, is approximately 5.6 pCi/g (Cs-137) (see Table 4.10,
Reference 3.5). This is very near the maximum permissible limit of 6.38 pCilg (for Cs-
137 as a surrogate) listed above for the SSGS area in general (assumes sample number
SXI OSD990033 has been chosen to represent the SSGS area).
Note that the cross-over sump piping in the SSGS footprint was more highly
contaminated but was completely remediated from the SSGS facility (see Table 4.3,
Reference 3.5).
5.3.3 To estimate an upper bounding dose contribution from one pipe end in the SSGS area or
Discharge Tunnel, it is assumed that the pipe end is completely filled with contaminatedmaterials. It is also assumed that the pipe is 2 feet long and jutting out perpendicularlyfrom one wall. An 8 inch diameter pipe size from Reference 3.5 was used as the model.
The mix is assumed to contain 6.38 pCi/g Cs-137 and 0.04 pCi/g Co-60 (the effective
DCGL). The impact of pipe wall shielding was ignored and the density of the fill
materials is assumed to be 1.4 g/cc. The dose point is assumed to be 0.5 meters from the
pipe stub end. MicroShield input concentrations are shown below.
Cs-137 concentration = (6.38 pCi/g x 1.4 g/cc)/lE+06 pCi/uCi = 8.932E-06 uCi/cc
Co-60 concentration = (0.04 pCi/g x 1.4 g/cc)/1E+06 pCi/uCi = 5.6E-08 uCi/cc.
5.3.4 The results from the MicroShield run indicates that a dose rate of 5.107E-05 mR/h (0.051
uR/h) would be generated from this model. See Attachments 6-1 and 6-2. Using the
same assumptions of Section 5.2.4, the yearly dose from this pipe model is 8766 hrs/yr x
0.5 x 0.5 x 0.051 uR/h = 112 uR = 0.112 mR = -0.112 mrem. This evaluation would be
performed for relevant pipe sections remaining in the SSGS area and any residual dose
would be considered within the equation listed in Section 4.1. This bounding estimate is
an exaggerated case since the pipe is assumed to be completely filled with contaminated
materials at the maximum concentration allowed.
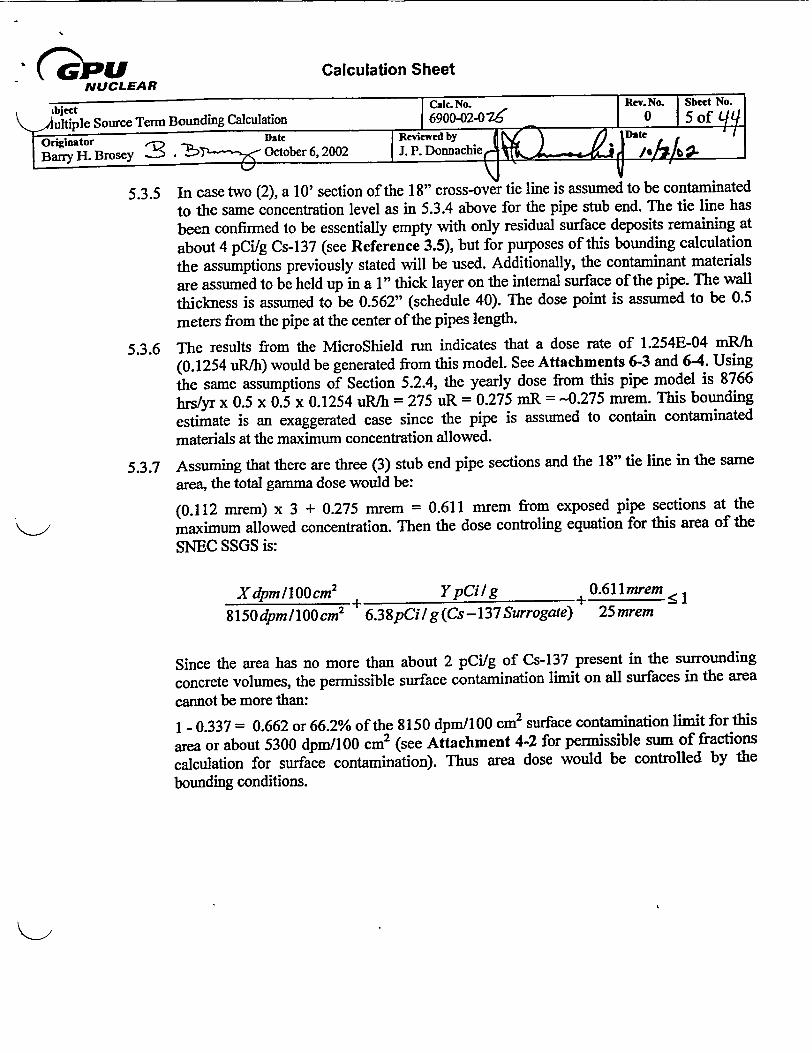
(C PU Calculation SheetNUCLEAR
ibject Caic. No. Rev. No. Sheet No.
clultipleSourceTermBounding Calculation 6900-02-0Z< | 0 |5 of qq.
Originator Date Reviewed by _Date
Bary H. Brosey 3 . October 6, 2002 J. P. Donnachier PI /4 Wb aL
5.3.5 In case two (2), a 10' section of the 18" cross-over tie line is assumed to be contaminated
to the same concentration level as in 5.3.4 above for the pipe stub end. The tie line has
been confirmed to be essentially empty with only residual surface deposits remaining at
about 4 pCilg Cs-137 (see Reference 3.5), but for purposes of this bounding calculation
the assumptions previously stated will be used. Additionally, the contaminant materials
are assumed to be held up in a 1" thick layer on the internal surface of the pipe. The wall
thickness is assumed to be 0.562" (schedule 40). The dose point is assumed to be 0.5
meters from the pipe at the center of the pipes length.
5.3.6 The results from the MicroShield run indicates that a dose rate of 1.254E-04 mR/h
(0.1254 uR/h) would be generated from this model. See Attachments 6-3 and 6-4. Using
the same assumptions of Section 5.2.4, the yearly dose from this pipe model is 8766
hrs/yr x 0.5 x 0.5 x 0.1254 uR/h = 275 uR = 0.275 mR = -0.275 mrem. This bounding
estimate is an exaggerated case since the pipe is assumed to contain contaminated
materials at the maximum concentration allowed.
5.3.7 Assuming that there are three (3) stub end pipe sections and the 18" tie line in the same
area, the total gamma dose would be:
(0.112 mrem) x 3 + 0.275 mrem = 0.611 mrem from exposed pipe sections at the
maximum allowed concentration. Then the dose controling equation for this area of the
SNEC SSGS is:
XdpmllOOcm2 + YpCi/g +0.611 mrem c
8150dpm /100cm2 6.38pCi /g(Cs -137 Surrogate) 25mrem
Since the area has no more than about 2 pCi/g of Cs-137 present in the surrounding
concrete volumes, the permissible surface contamination limit on all surfaces in the area
cannot be more than:
1 - 0.337 = 0.662 or 66.2% of the 8150 dpm/100 cm2 surface contamination limit for this
area or about 5300 dpm/100 cm2 (see Attachment 4-2 for permissible sum of fractions
calculation for surface contamination). Thus area dose would be controlled by the
bounding conditions.
' PuNUCLEAR
Calculation Sheet
1jen
i>iltiple Source Term Bounding Calculation
I Onggeator Date
| Ban~y H. Brosey 3 .? -. ober 6,2002
Cale. No.690002-07<
Reviewed byI J. P. Donnachie
Rev.No. Sheet No.
- 6 of Lf
te lo 410 I
6.0 LIST OF ATTACHMENTS
6.1 Attachments 1-1 to 1-2, "Sample Results for the Steel CV Shell", Sample No.SXSD3055.
6.2 Attachments 2-1 to 2-10, "CV Steel Shell Samples", Samples SXST3067 to 3087.
6.3 Attachment 3-1 to 3-12, Examples of Sample Materials from the SSGS Footprint Area.
6.4 Attachments 4-1 to 4-3, "Sample Results from the Discharge Tunnel", Sample SX1OSD990033.
6.5 Attachments 5-1 to 5-7, Diagram and Layout for the MicroShield runs of the CV Steel Shell.
6.6 Attachments 6-1 to 64, MicroShield Run for 8" and 18" Diameter Pipe Models.
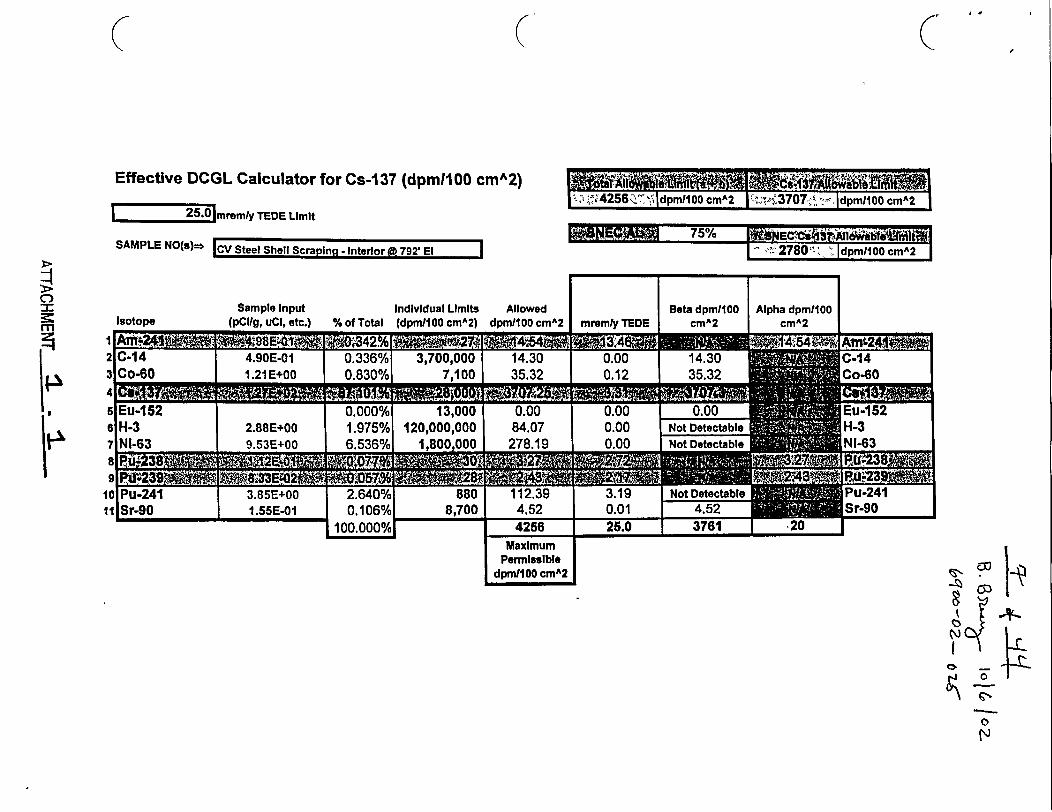
4 -
(C
Effective DCGL Calculator for Cs-I37 (dpmIIOO cmA2)
I- 25.mremty TEDE Limit
(r
I425 dpmI1OO cmA2 : '377 ,i dpmlIOO cmA2
75% - A' l7I' 'imi^I -- '2780' ',Idpm/100 CMA2
SAMPLE NO(s)= ICV SteelShellScraping- interiort 792'El -- I
C)
Im
..
Sample InputInClIn/ uCf. etc.
Beta dpm/100cmA2
Individual Limits Allowed/. nf Totna fvfnmt4f imniAJ donml14n nmA7Isotone
Alpha dpm/IO0cmA2mromly TEDE
MaximumPermissible
dpm/100 cmA2 6ZTa
k IIo _,
0
N
I -�
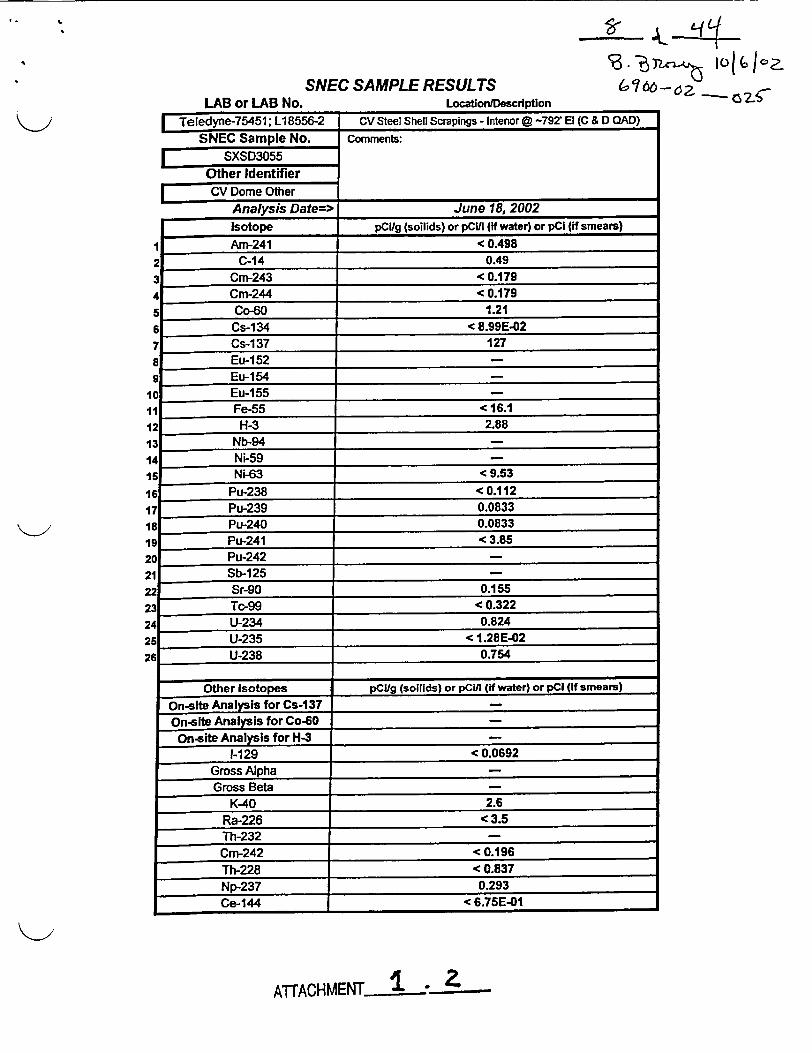
I ..
SI k- -B.3 110c6at
&76q-62 - ,SNEC SAMPLE RESULTSLocablon/Descript4onLAB or LAB No.
| Teledyne-75451; L1 85562 CV Steel Shell Scrapings - Intenor @ -792' El (C & D QAD)
SNEC Sample No. Comments:
SXSD3055Other IdentifierCV Dome Other
Analysis Date=> June 18, 2002Isotope pClg (soilids) or pCV1 (if water) or pci (if smears)
Ai241 _<0.4982Cb14 0.49
3 Cm-243 < 0.1794 Cm-244 < 0.1795 Co-60 1.21
6 Cs-134 < 8.99E-027 Cs-137 1278 Eu-152 _
9 Eu-154 _
0 Eu-155 _
I Fe-55 < 16.12 H-3 2.883 Nb-94 _
4 Ni-59 _
5 Ni-63 <9.53
6 Pu-238 < 0.1 127 Pu-239 0.08338 Pu-240 0.0833
Pu-241 < 3.85Pu-242 _
Sb-125 _
Sr-90 0.1553 Tc-99 < 0.322
U-234 0.824U-235 < 1.28E-02U-238 0.754
Other Isotopes pClig (soilids) or pCill (if water) or pCi (if smears)
On-site Analysis for Cs-137On-6lte Analysis for Co-60On-site Analysis for H-3 _
1-129 < 0.0692Gross AlphaGross Beta
K-40 2.6Ra-226 < 3.5lh-232_Cm-242 < 0.196Th-228 < 0.837Np-237 0.293Ce-144 < 6.75E-01
ATTACHMENT I *M 2
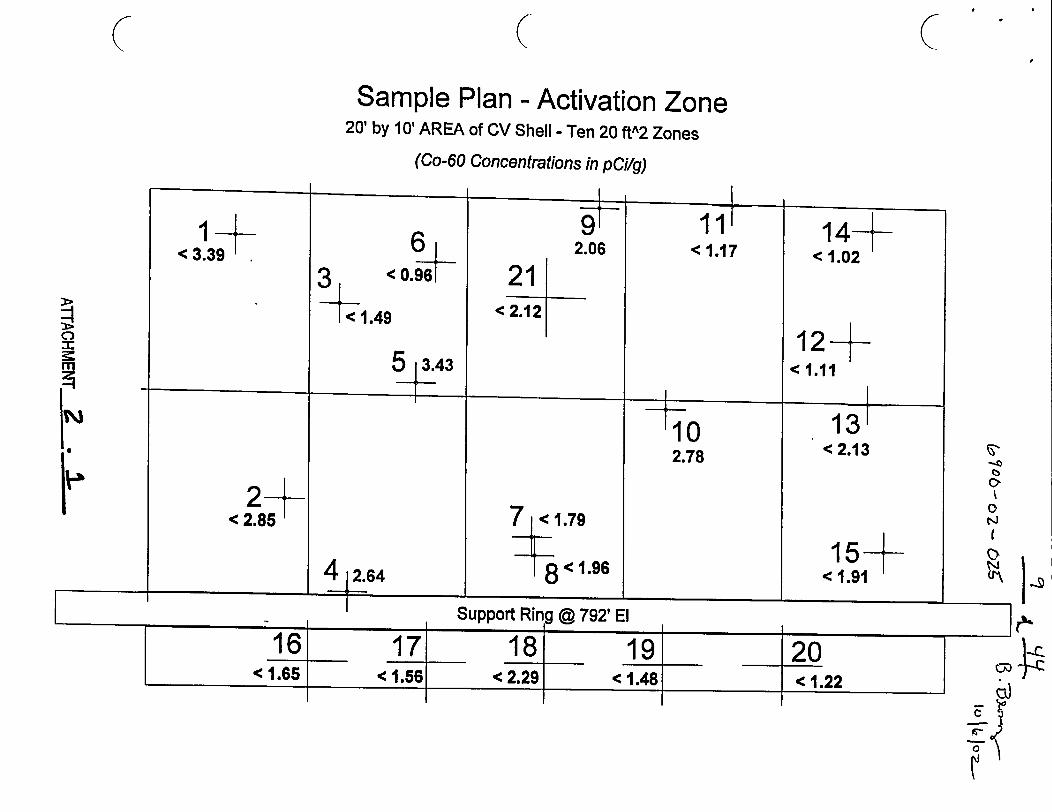
Sample Plan - Activation Zone20' by 10' AREA of CV Shell - Ten 20 ftA2 Zones
(Co-60 Concentrations in pCi/g)
I4
I1-
<3.39 I - 6<0.96
9--2.06
21< 2.12
11'< 1.17
-I I I
11I
v < 1.49
14+< 1.02
12+< 1.11
~~ I5 3.43
I I I IN
e1r02.78
2< 2.85
137< 2.13
15c 1.91
7 < 1.79
< 81.96
0ND
TA I-
41264I I II_ _ __ S R_ II
lSuppor Ring @ 792' El_ I
< 1.6517 18
< 2.2919
<1 I-R20Ie. 4 I
. - . . I -,. I.
I'6
UO1 fI/ UL ILrA. v.1 AMA VVV V VtVv S wa ̂ * s - ^5 w . vxv
1 Ioz.IL16102-
BWX Technologies, IncorporatedBWXT Services, Inc.
Nuclear & Environmental Operations2016 Mt. Athos Road
Lynchburg, VA 24504-5447
FAX Number: (434) 522-6860
6q5-oz- OLS
FAX TRANSMITTAL COVER PAGE
To: 1j, ?Zo5Lf Fax No.: 1 17 - q9?- &7 &
To: Fax No.: -
From: 5 Cla-l Phone: L-ISq- Sz- - <73
Message:•'j V3
P-F4L4SS AD5n .
Number of Pages: - 1.L. Including Cover Page
Date: g (27 / o-
ATTACHMEN Z . Z.
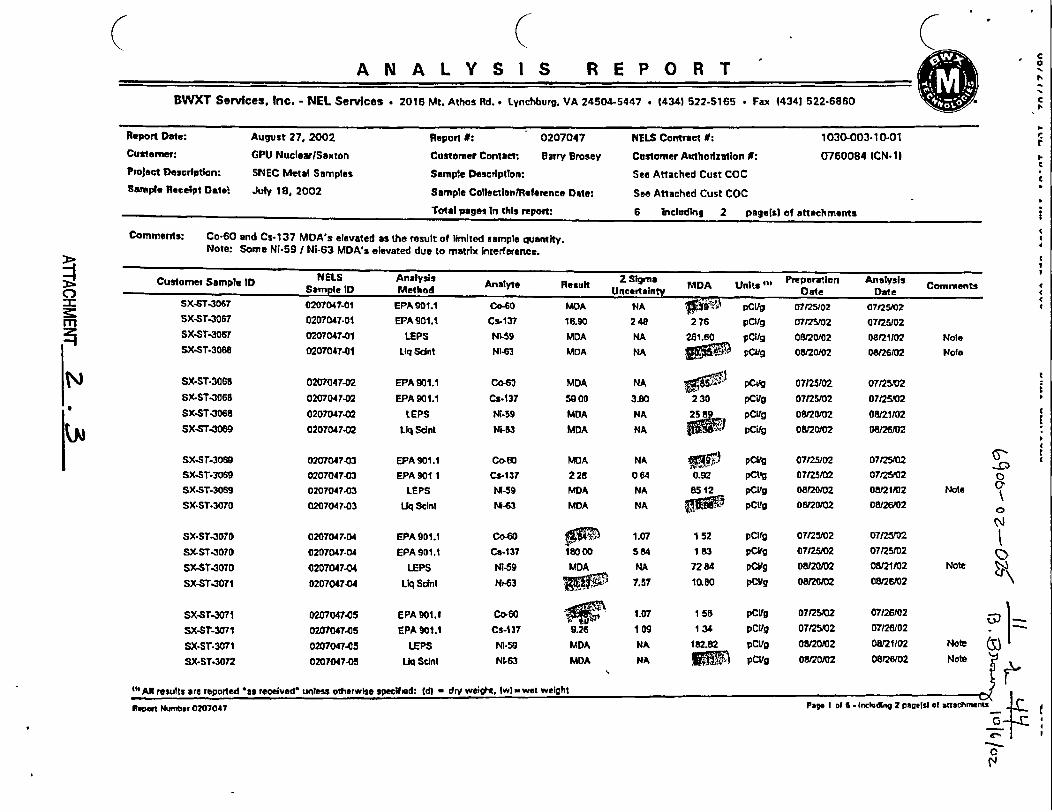
A N A L Y S I S R E P O R T
BWXT Services. Inc. - NEL Services . 2016 Mt. Athos Rd.. Lynchburg. VA 24504.5447 . 14341 522-5165 . Fax 4434t 522-6860
I c0h
1`
a.
Repor Date: August 27, 2002 Report #: 0207047 NELS Contract : 1030-003.10-01
Cuteamr: GPU NuclearlSaxton Cstaoruer Contatt: Barry Brosey Custarer Authorization 1: 0760084 (CN-11
Project Description: SiNEC Metal Samples Sample DescriptIon: See Attached Cust COC
Sarnple Receipt Date July 18, 2002 Sample CollectlonlReference Date: See Attached Cust COC
Total pages In this report: 6 Tncluding 2 page(sO of attachments
Comments: Co-60 and Cs-137 MDA's elevated as the result of limited sample quarrtity.Note: Some Ni.59 I Ni-63 MDA's elevated due to matrix interference.
Customer Sample ID NELS Analysis Analyte Result Z Sigmiia MDA Units'" Preparation Analysis CeerentsSampele ID Method Uncertainty Date DateC)
N
Sm
IId
C
II
ItCItSX-ST-3057
SX-ST-3067
SX-ST-30STSX-ST-3068
0207047-01
0207047-01
020704t.01
020704T.01
EPA 901.1EPA 901.1
LEPSLiq Scint
00-60Cs.137NbS9
NI-63
MDA
16.90
MDA
MDA
NA W " PCLg 071251022 48 2 76 pCl/g 07125102
NA 281.60 pCig s 0812002NA pCUg 0Y20t02
SX-ST-30G8
SX-STr-ooesSX-ST.3068
sx-STr-3069
SX-ST-3080sx-Sr-30619SX-ST.3069SX-ST.3070
0207047-02
0207047-02
0207047.20207047-02
02a7047-030207047-030207047.030207047-03
0207W47-04
0207D47-040207047-04
0207047.04
EPA 901.1EPA 901.1
tEPSLiq Sclot
EPA 901.1EPA 901 t
LEPSLUq Scint
EPA 901.1
EPA 901.1LEPS
Llq Scint
Co-S0
Cs.137
Cs-1137
M4-63
00-60Cs-137
Ni-59
MDA
5 000
MDAMOA
MDA
228MDA
MOA
18000MDA
NA
3.80
NA
NA
NA
064
NA
NA
1.07
584
NA
7.57
H I pC g 07)9 02102
2 30 pCirg 071251022589 pCi/g 0812002
pCi/g 08120/02
V pClg 07/25&02
0.92 pCVg 07/25/028512 PCltg o0820102
pClWg 0612010
1 52 pCI/O 0712502
1 83 pCfg 07125o272 84 pCuIg 012010210.00 pCY9 0a20102
0712512
07/25)0208121102
0816102
07/2502071251201121102
o0n26102
07W25M02
0712512
0821/02
08126102
071250
07125)02
0812102
M MQ602
Note
Note
Note
Ne0Note 0
SX-ST.3070SX-ST-307DSX-ST-3070
SX-ST-3071
SX-Sr-3071SX-Sr-3071
SX-ST.3071SX-ST.3072
0207047-050207047^05
0207047-05
0207047.05
EPA 901.1
EPA 901.1
LEP'S
Uq Sdnt
Co-60
Cs- 37
MN59NI-63
$ 1.07 1 55 pCVg 0
9.26 1 09 1 34 pCVg 0
"DA NA 182.82 PCVg 0
MDA NA i t pCig 0
7125W0 07/26102 1
7/25)02 07126102
8/20/02 0812102 Note8/0102 08126/02 Note fl1
FPag I DI 6 - Inclusnfg 2 Pagetri of arts ime i- f~
elC
"'All results are reported -as received' unless otherwise specified: tdl - dry weight., lwfwet weight
Papm Number 0207047
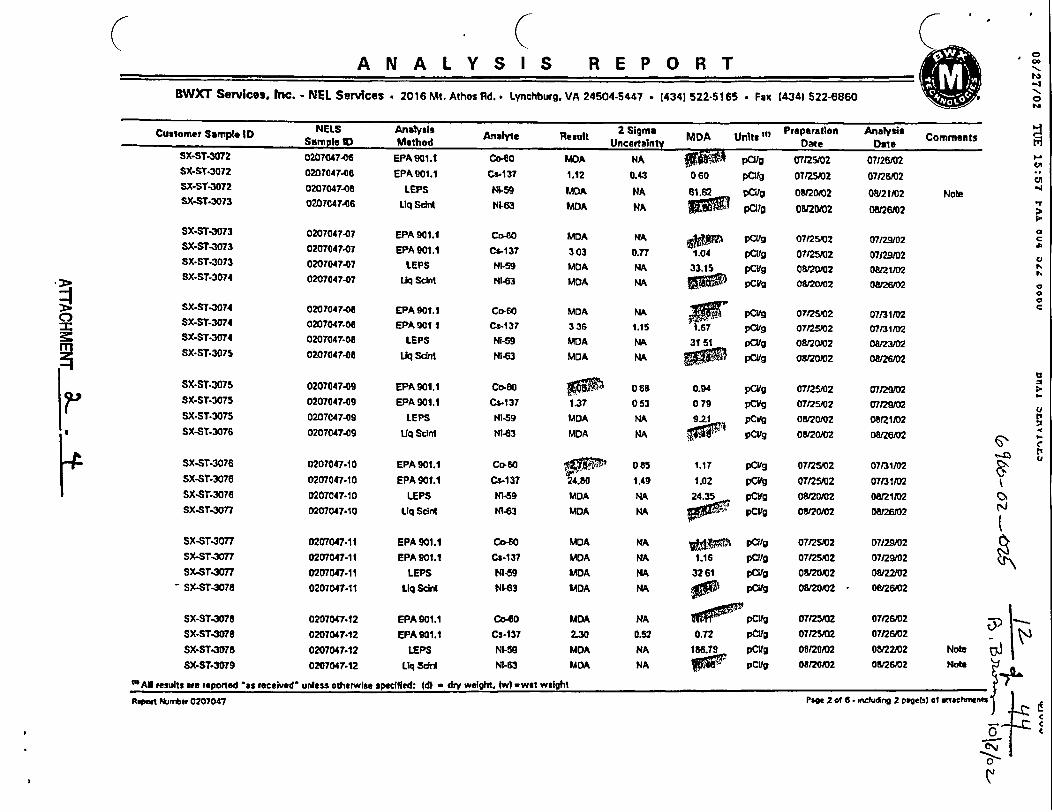
A N A L Y S I S R E P O R T
BWXT Services, Inc. - NEL Services . 2016 Mt. Athos Rd.. Lynchburg. VA 24504-5447 . (4341 522-5165 . Fax (4341 522-0860
C,
I
Customer Sampte ID SnELS Analysis Ana.fte Result 2 Sigma MDA Units D Pieparatlon Anatystis CommentsSamplIe ID Method Uncertainty Date DineSX-ST-3072 0201047-4e EPA 901.1 co-eO MDA NA plalg o 0O72502 07126002SX-ST-3072 020704746 EPA901.1 Cs-137 1.12 0.43 060 pCI0 0725102 07126/02SX-ST.302 020704746 LEPS lI-59 MDA NA 61.62 pCI1g 0812012 2 o0021)02 NobtSX-ST.3073 0207047.06 Liq Sdnt NHi-3 MDA NA Pt 08/ 2U0102 OU26JC2
SX-ST-3073 0207047-07 EPA 901.11 C1-0 MDA HA pCCVg 07125102 07/29102SX-ST-Wt3 0207047e7 EPA 901.1 Cs-I 37 303 0.77 1.04 pC0g 07125)0z 07)29102SX-ST-3073 0207047407 LEPS Nl-59 MDA NA 33,15 pCrg e01002 O8M2102SX-ST-3074 0207047-.7 L b Sdnt Nl-63 MDA NA pCvtg o a0102 oa8262
SX-ST.3074 0207047-0 EPA 901. 1 Co-ES MDA NA pCvg 0712502 07131/02SX-ST-3074 0207047.08 EPA 9011 Cs-137 336 1.15 f.67 pC9g 7/250z 07131102SX-ST.3074 0207047-wO LEPS NI-59 MDA NA 3151 pCVig 081002 W23/02SX-ST 3075 0207e47-03 Lq Scint NM.3 MOA NA , pCig 08&20)02 M2=
SX-ST.3075 0207047-09 EPA 901.1 co-80 058 Dug 0.94 pCifg 07/25102 07/291SX-ST-3075 0207047-09 EPA 901.1 Cs-137 1.37 053 079 pCVg 0725102 07WM=J02SX-ST.3075 0207C47-09 LEPS N-59 MDA NA 9.21 pCWg 08n20102 08Q11/2SX-STr3076 0207047.09 LIq Scint N163 MDA NA 6 pCg 08120102 0s/6/02
SX-ST.3076 0207047.10 EPA 901.1 Co-SO 08S 1.17 pcvg 07/252 O731)02SX-SrT3076 0207047-10 EPA 90t.1 CS-1 37 24.80 1.49 1.02 pCvg 07/25)02 07131t02SX-STr3076 0207047.10 LEPS N1-59 MDA NA 24.35 * pCVg OW0 2 0U211D2SX-ST.307 0207047-10 Liq Scint NI-63 MDA NA pCVg 0812002 02602
SX-STr3077 0207047-11 EPA 901.1 Co-so MOA NA 1t(0 pCilg 07/25/02 07/29)02SX-ST-3077 0207047-11 EPA 901.1 Cs-137 MDA NA 1.16 pCU0 07125102 0712902sx-sr3077 D207047-11 LEPS M S49 MDA NA 3261 palog 0120102 W122102SX-ST3078 0207047-11 Liq Schrt N4-63 MDA MA % pOtg O20102 - 08/26/02
SX-ST-3078 0207047-12 EPA 901.1 C-4O MDA NA ppltg OT1g 07125102 071262SX.ST.3078 0207047.12 EPA201.1 CS-137 230 0.52 0.72 pC09 0712502 07/2602SX-ST.3078 0207047.12 LEPS NI-59 MDA NA 186.79 p0ig 08120102 OU22102 NodeSX-ST.3079 0207047.12 Liq Scirt M-N3 M DA NA pCitg 0HM02 0826/02 NHe
"'All results see ieported 'as ,eceived' urdess otherwise specified: Wdt - dry weight. IwI -wet weightRApcfl Num*,r 0207047 Page 2 of S - includna 2 pege(s oft enachenns
0.N
tv
:s
(3 I
if> t
;3 * i
fCh
-
0
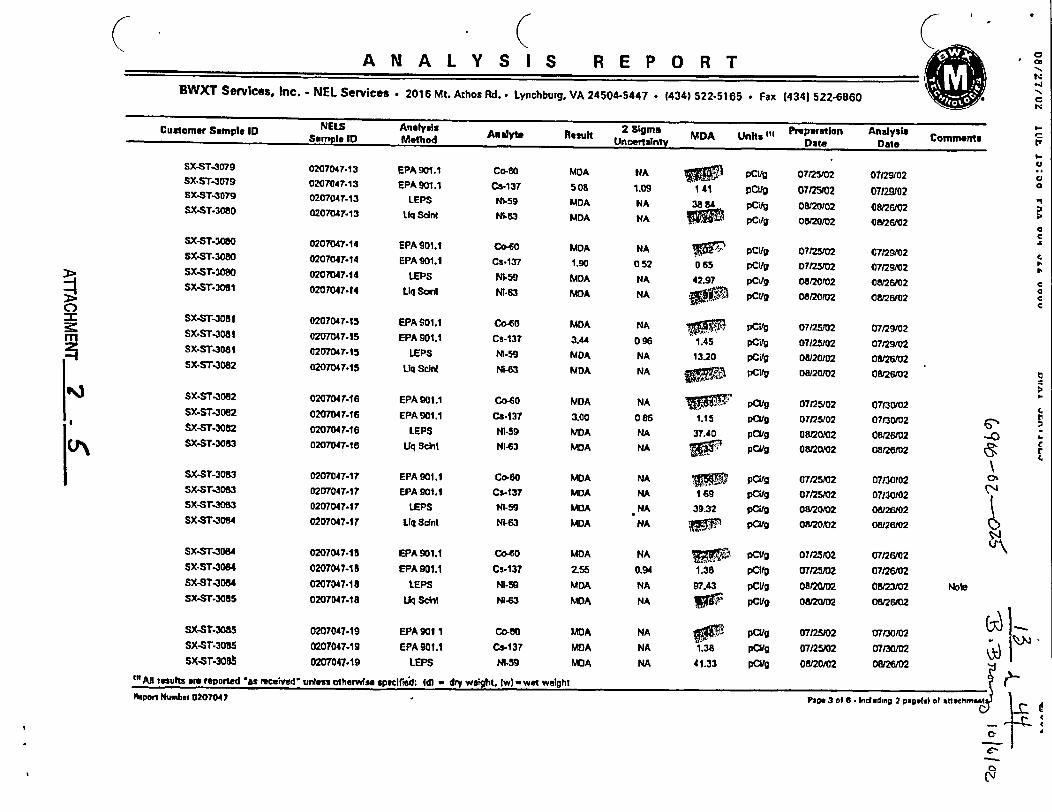
A N A L Y S I S R E P O R T I-4BWXT Services. Inc. - NEL Services . 2016 Mt. Athos Rd..- Lynichburg, VA 24504-5447 * 1434) 522-5165 * Fax 14341 522-6860 . *CN
CutomSer SempleID NELS Analysis Aw2dyt o Resul 2 Sigma MDA Units"M Preparatlon Analysts CoantCtnerSme D Sample ID Willed nt il Uncentainty Date Date Cmet
SX-ST.3079 0207047-13 EPA 901.1 Co-S0 MOA "A pCVg 07t2502 07129102sxsT-3D79 0207047.13 EPA 901.1 Cs-137 508 1.09 141 pCIrg 07/5/02 07129O21SX-ST.3079 0207047.13 LEPS N.59 MDA NA 38 4 pIXg 0812002 68126102SX-ST.3080 0207047.13 L q Sdnt NI.63 MDA NA . pC10 0)20102 0/2602
ASX-ST-3080 0207047.14 EPA 901.1 Co-60 MDA NA V r pCig 07t2srn2 0712912 eSX-ST.3080 0207047.14 EPA 901.1 Cs5137 1.90 0 52 065 pCLD 07M=2 07129102SX-ST.3080 0207047.14 LEPS NI.59 MDA NA 42.97 pci/9 08120102 o0u2612 CSX-ST-3051 0207047.14 LUq Scni N-6S3 MDA NA pC119 08J20t02 a n6re2 a
0101)CCC)
Sx-STr081 0207047.15 EPA 901.1 Cos6O MDA NA pCV/g 07125102 07/29/02SX.ST.3081 0207047.15 EPA 901.1 Cs-137 3.U 0 96 1.45 pCVg 07T25102 0729102mSX-ST03201 0207047.15 LEPS NI-ss MDA NA 13.20 pCVg D0820)02 0 V2&t12SX-ST-3082 0207047.15 Uq Scint N-3 MDA NA gpCg 08)20102 08126102
) SX.ST43082 020704T716 EPA 9O.1 Co40 NOA NA V pCV9 0712WO2 07130102SX-ST430t2 0207047.16 EPA 901.1 Cs-137 .00 086 1.15 pClt9 D7025102 07130/02 rSX-ST-3082 0207047.16 LEPS NI-59 MDA NA 37.40 p1309 0820)02 082612 ;SX-ST.3083 0207047T18 Uq Scint NI43 MOA NA W'> pCVg O8oM20 WM=126s2 r
SX-STr3083 0207047.17 EPA901.1 co.60 MDA NA ? pCilg 07/252 07130/02 0SXSTr30W3 0207047.17 EPA 901.1 Cs-137 MDA NA 169 pCig 07)25/02 07130C02sx-Sr-3053 0207047.17 LIEPS NI-S9 MDA NA 39.32 pCilg 0W20/02 08126/02SX-ST-3084 0207047-17 LIq Sdnt NI63 MDSA HA pCltp 08g o2o2 06/2/02 )2SX-ST.3Ds4 0207047-18 EPA 901.1 Co60 MhDA NA V pap Ci 07tZ5102 07n2612SX-ST-3084 0207047-13 EPA 901.1 Cs-137 2.55 0.94 1.38 pCItv U71202 07n26r02SX-ST-3064 0207047.18 *EPS M-59 MDA NA 97.43 pcu/ o082002 0=31302 NoteSX-ST-3055 0207047.18 LUq Scint M-63 MDA NA W pCI/89 DU202 o016102
SX-SI.30B5 0207047.19 EPA 901 1 co-eu MCA NA p./pC 07)25)2 07130/02sx-Sr-30S5 0207047-19 EPA 901.1 Cs.137 MOA NA 1.3F pCUg 07)2W2 07)30/02sx-sr-30o 0207047.19 LEPS Nl-59 MOA NA 41.33 pcv/ 08/20/02 O/6/02 P
'"ANtaesults are reported as rennvd untess otherwis. speclfie~: Id) - dry woit, 1w) -wet welghtAv0onl Number 0207047 Pan& 3 Al a * Indrn2n I .. *. .1M .
0'
0C'J
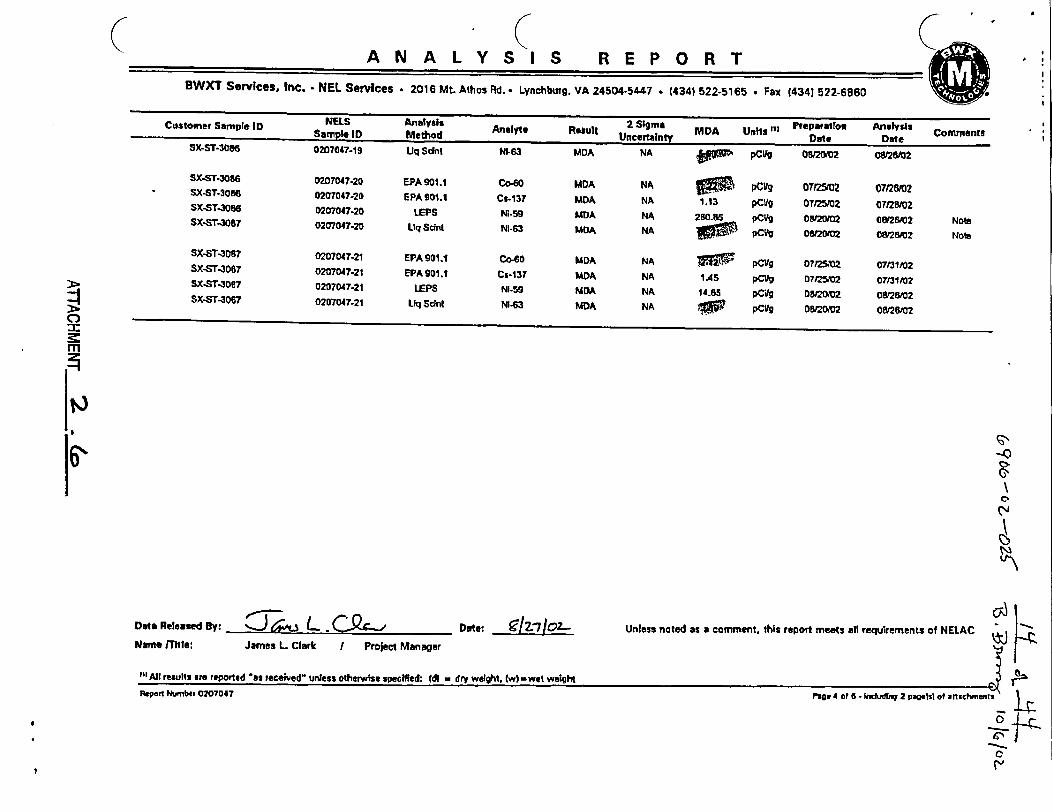
A N A L Y S I S R E P O R T p p
BWXT Services, Inc. . NEL Services . 2016 Mt. Attios Rd.. Lynchburg. VA 24504-5447 . (434\ 522-5165 . Fax (4341 522-6860
C)
I
,A
Cwutomer Sample ID INELS AnM thod Andlyte Reult 2 Sigma MDA Units l FreparaTo Analysis ComentsSapeI ehdUncertainty Dale DateSX-ST-306 0207047.19 Uq Sdnt Ni-63 U DA NA , pCLq 08Q0&02 48O2602
SX-ST-3086 0207047.20 EPA 901.1 Co-0S MDA NA F PCV9 125102 0712802SX-ST-3086 0207047.20 EPA901.1 Cs-I37 MDA NA 1.13 pCOg 07orn 2 07n28t02SX-ST40E6 0207047-20 IEPS Ni 59 DMDA NA 280.65 pCUg 01202 08126/02 NoteSX-ST-3087 0207047-20 Llq ScWiM M63 t A 1 NA pCVg 08129102 O8M2510 Note
SX-ST-3087 0207047-21 EPA 901.1 Co-60 1 MDA NA pCllg 07125/02 07/31/02SX-ST-3057 0207047-21 EPA 901t. Cs-1I3 IADA NA 1.45 pCuWg 07502 0731102SX-ST-3067 0207047-21 LEPS N-ss MDA NA 14.65 pCiJg 0820102 0&2802SX-STo3067 0207047-21 LUq Sdnl M-43 MDA NA pCVg 08202 02&02
Data Released By: 3 6; L.. CQ c Dote: 9'/2.71OZ- Unless noted as a comment, this report meets all requirements of NELACName MIte: James L. Clark I Project Manager
"'Allresuls arte reported ast eceivedr urbess otherwise specified: (dl dry weight. (W-wet weightRepon Numbew 0207047 fto. 4 of 6 1ehkdw 2 paosisl of anshes
I
NO
C.-.
-41_II
C
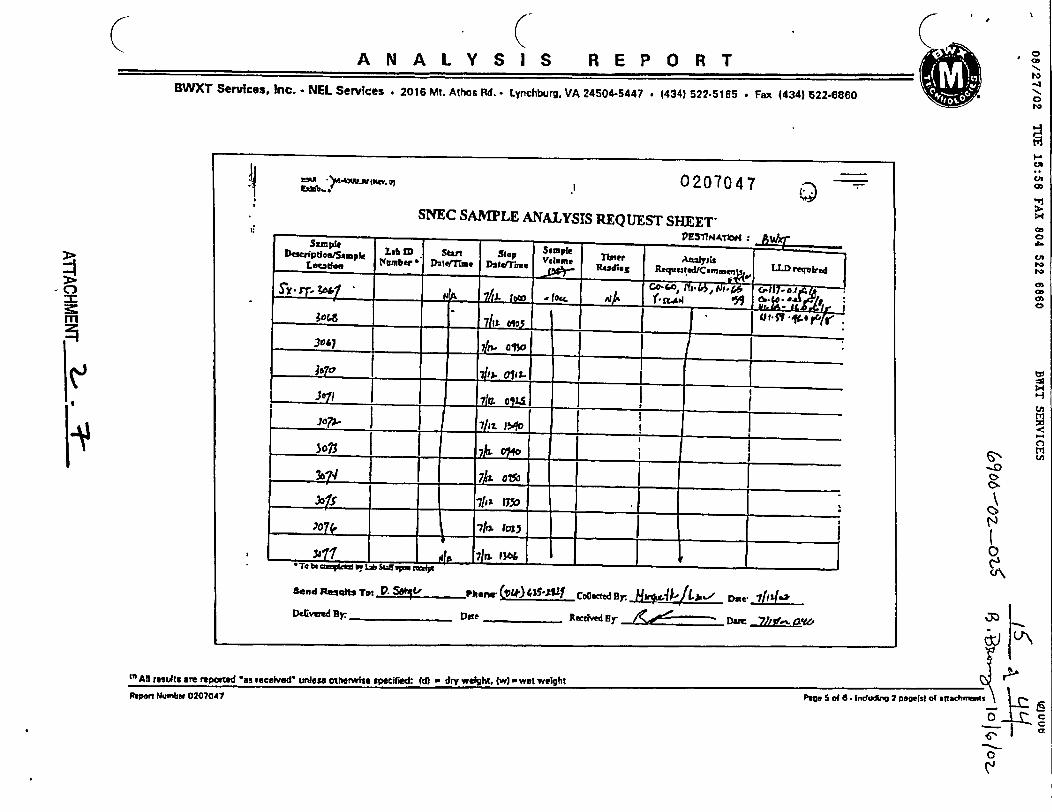
(A NA LY S IS R E P O R T
REPORT, 0
Go"I-I
0
BWXT Services, Inc. - NEL Services . 2016 Mi. Athos Rd. . Lynchburg. VA 24504-5447 . (4341 522-5165 . Fax (4341 52246860
t" -* ,XW><w_.I1 0207047
QISNEC SAMPLE ANALYSIS REQUEST SHEET
1?II
_epl VrZsnATx : WI/x
DnLdopte Lob 1 S5 Stop s R SpLe.n INnnmber Dterriin Dokrat fulme Zabner A2y~
Lotaendiog R Cqu 3~ed&cs Mni n5 L LD) re fro
-fo f.rrj 3.1| li iLt t. > '&°;IS 1- ~~~7/1-t low1 tU .§
go~~e + 11 010-5!f3v4; _ o-I-- ---
7Iti ! _ _ _ I___- -___.__
I1 J . _ _ _ _ _ _ e _ _ _ _ _- _ _i
7_ - 7L0227 11- __I
S lil 7h; 50Em Il'ToI b. Suff- i." _
-o
01A>
Send R a ft Ta: t. S_ L Phoe- (i.) C4 Coflc dBr._d : 4P )-, Dae 71
Delvd Dr. Dseo _ Rectiwd By- Damc _7k
toANt results ate reported 'as received' unless otherwise specified: id) - dry weight. wl -wet weight
W 0I; _-
Page So do 6 * fndui 2 pageisl of alt { fc \ c- _
CtC', -
Rsport Nunber 0207047
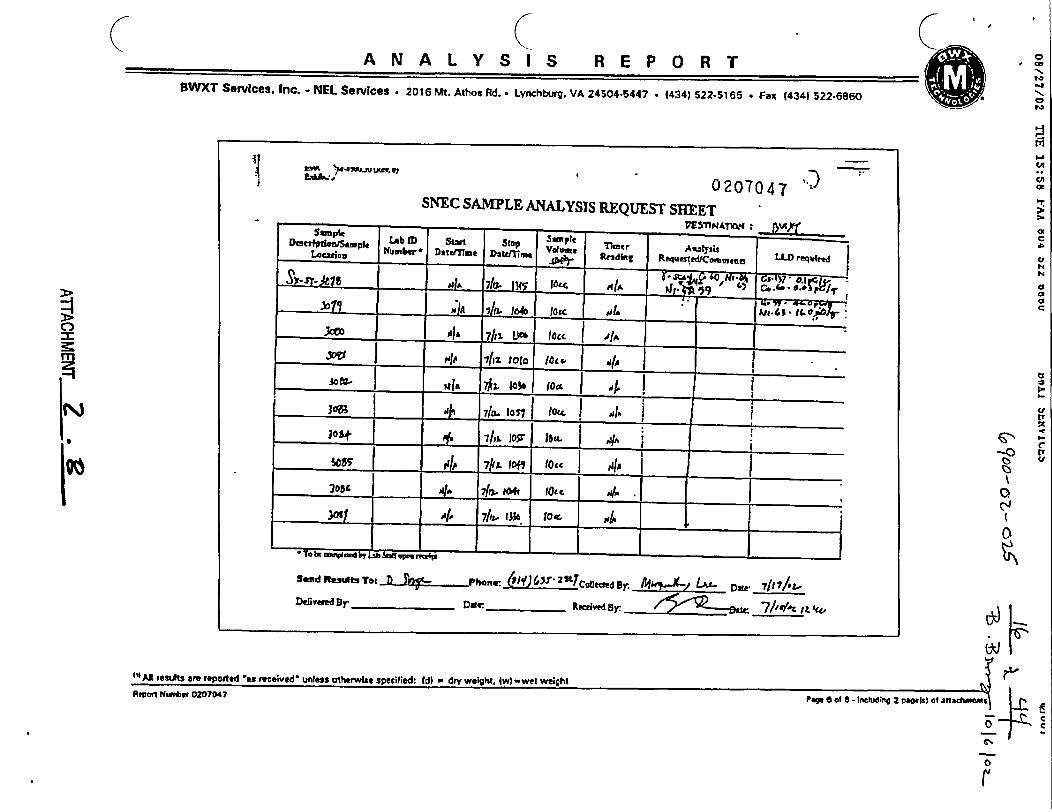
A N A L Y S I S R E P O R T__ REPORT
BWXT Services, Inc. - NEL Services . 2016 Mt. Athos Rd. . Lynchburg, VA 24504-5447 . 1434) 522-5165 . Fax (4341 522-6860
Io
N.02
DC>
IN1
M
0207047SNEC SAMPLE ANALYSIS REQUEST SHEET
_ _ V~E~fl~*A1,el4: wtSample tAb m 5 sa51ar m, r A
La _ D i "} Au Bb f~c jfysij'4F ro.z
C~o ubr'Dt~eDtdie Vlm Anldalu Requaeq o 00 ~required
. 08^ 71~~metsLD.°CI17 !#9I 7C* I 9 / - !
Jao W - ;Ie ~
3°l- 7-b-10 l -7 C 7
'I| 7/11 0scr lo 1c A ;_ _ _ _ _ _ _ AL ID MCI O ,A
Sf I rJiL 7A*x Ffo j 10ftc c wgo5s _ I . ,Isfn , roc 4 . _ ____309 14. I" btot 4A ______,1 A l - 7/11_ _I ___ ' __ |
To b ,ciew s by LabSufi'm -adFP
Send Rasulf ToT 1) ... Phone: u/Y)6 (,r. 2SL1COUtftd By. fdF , 6 Dain 71 7/AL
Deuv'd D r _ Der Recrived Byr . 7/'z IL -tv
C)
I 43 I
h"Al Gufte am 'epPtled 'aa received' unlesas ctherwle specified: (d) - dty weight. Iwi-wet weightAro1 N Mumbt 0207047
e-Pa of d - includi'm 2 tPa"l9) of anscniaml.
r
cC
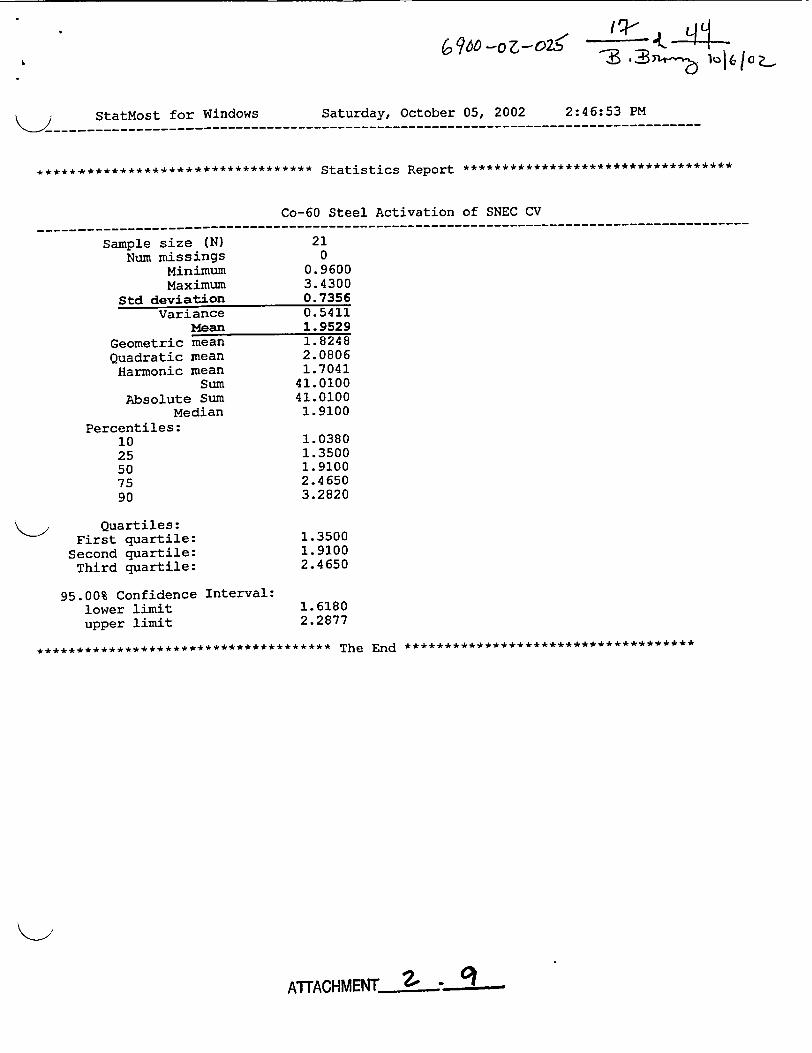
6 960o -o -OZ•-i .23 n4--Z IQ k6
StatMost for Windows Saturday, October 05, 2002 2:46:53 PM-________________ -- ______________________________________________
***** ***************************** Statistics Report **********************************
Co-60 Steel Activation of SNEC CV-_____---------------------------------------------------------------ee-----_____________
Sample size (N)Num missings
MinimumMaximum
Std deviationVariance
MeanGeometric meanQuadratic meanHarmonic mean
SumAbsolute Sum
Median
210
Percentiles:1025507590
Quartiles:First quartile:Second quartile:Third quartile:
95.00% Confidence Interval:lower limitupper limit
0. 96003. 43000.73560.54111.95291.82482.08061.7041
41. 010041. 01001.9100
1. 03801.35001.91002. 4 6503.2820
1.35001. 91002.4650
1. 61802. 2877
************************************* The End ************************************
ATTACHMENTC 2 E- N -
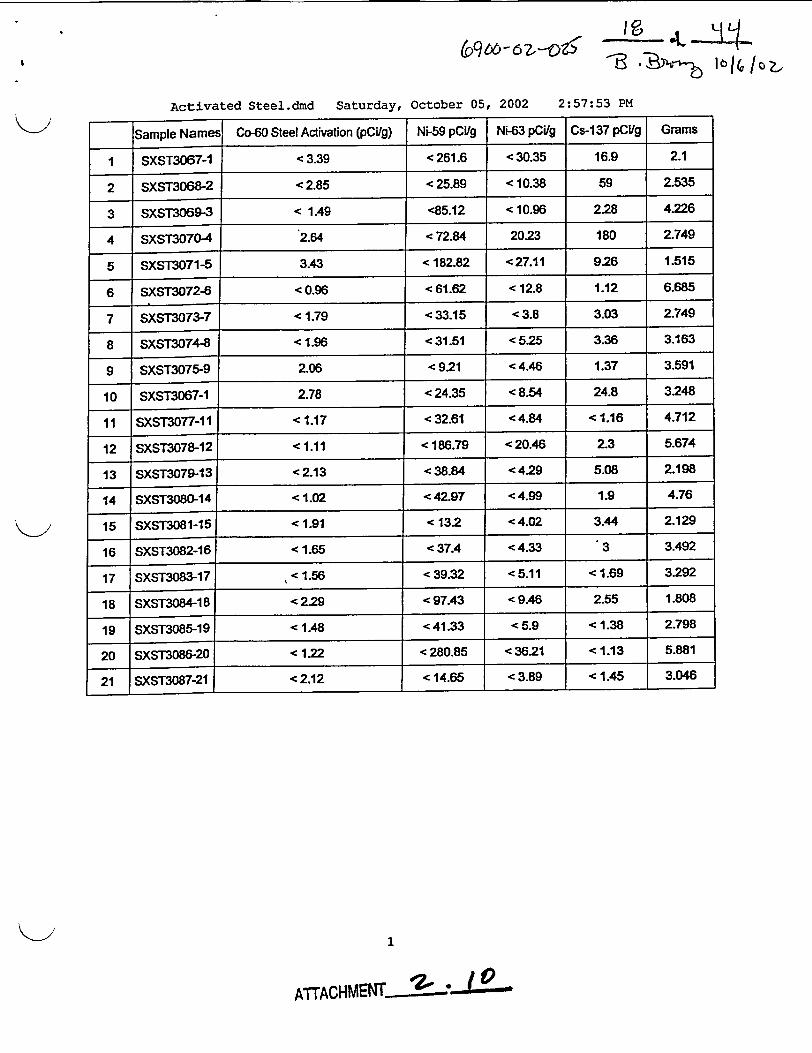
-B g IbI6 IoZ
Activated Steel.dmd Saturday, October 05, 2002 2:57:53 PM
Sample Names Co-60 Steel Activation (pCilg) Ni-59 pCig Ni-63 pCig Cs-1 37 pC/g Grams
I SXST3067-1 < 3.39 < 261.6 < 30.35 16.9 2.1
2 SXST3068-2 < 2.85 < 25.89 < 10.38 59 2.535
3 SXST3069-3 < 1.49 <85.12 < 10.96 2.28 4.226
4 SXST3070-4 2.64 < 72.84 2023 180 2.749
5 SXST3071-5 3.43 < 182.82 <27.11 9.26 1.515
6 SXST3072-6 < 0.96 < 61.62 < 12.8 1.12 6.685
7 SXST3073-7 < 1.79 < 33.15 < 3.8 3.03 2.749
8 SXST3074-8 < 1.96 < 31.51 < 5.25 3.36 3.163
9 SXST3075-9 2.06 < 921 < 4.46 1.37 3.591
10 5X5T3067-1 2.78 < 24.35 < 8.54 24.8 3248
11 SXST3077-11 < 1.17 < 32.61 < 4.84 < 1.16 4.712
12 SXST3078-12 < 1.11 < 186.79 < 20.46 2.3 5.674
13 SXST3079-13 < 2.13 < 38.84 < 4.29 5.08 2.198
14 SXST3080-14 < 1.02 < 42.97 < 4.99 1.9 4.76
15 SXST3081-15 < 1.91 < 132 <4.02 3.44 2.129
1 6 SXST3082-16 < 1.65 < 37.4 < 4.33 3 3.492
17 SXST3083-17 < 1.56 < 39.32 < 5.11 < 1.69 3.292
18 SXST3084-18 < 229 < 97.43 < 9.46 2.55 1.808
19 SXST3085-19 < 1.48 < 41.33 < 5.9 < 1.38 2.798
20 SXST3086-20 < 122 < 280.85 < 3621 < 1.13 5.881
21 SXST30 87-21 <2.12 < 14.65 < 3.89 < 1.45 3.046I .I I
1
ATAH~
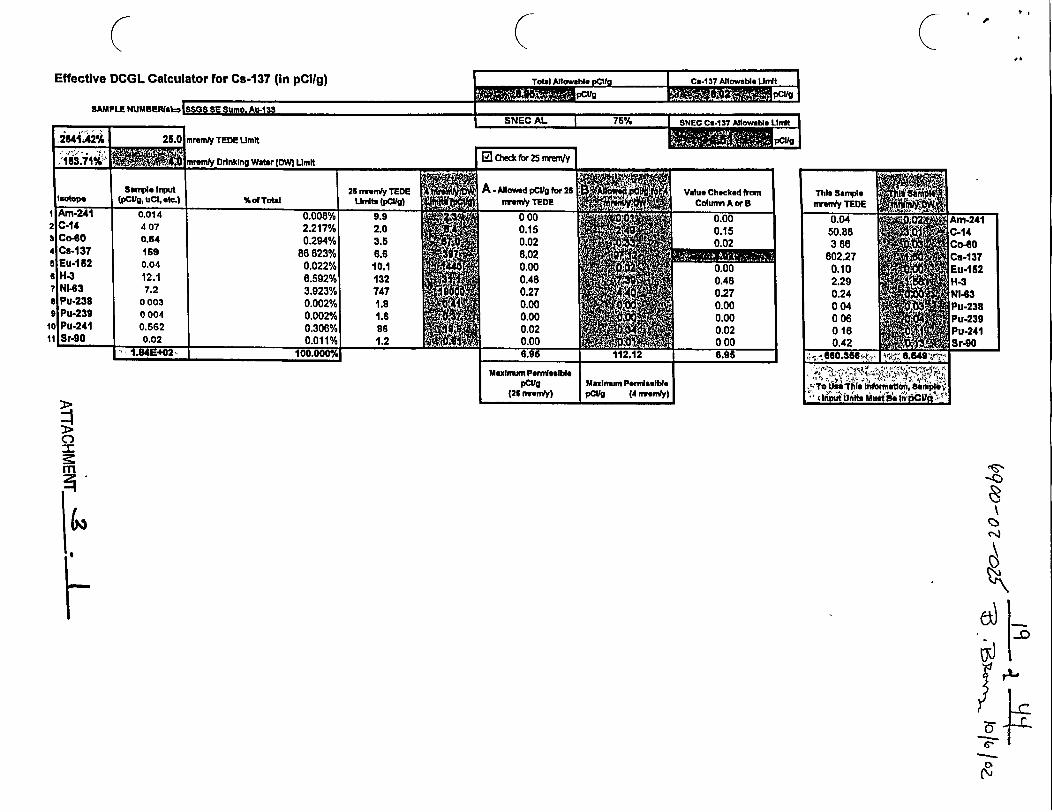
(Ct.6
Effective DCGL Calcu
SAMPLE NUMBERfaI=
lator for Cs-137 (In pCIIg) Tobal Allowble oCf I Cs-1 37 Alowable LInSto l l .PR= C-I , _,7 A.owab..
_ _ _ _ _ _ _ _ __ p g plQCnQ CC C.um A,.-4.%o-- I __ . .
5NEC Al. I 75% I SNEC C.137 AIlowable UIdt I
,2541.2%A 2I.t.... 1.
mremi TEDE Umlt
I I - I
I
2I
4
7
10II
r i63.71 ' reny Drinking Water (OM Umit l u mr zs
Sample Input 25 mrnmy TEDEs A Allowed pCUg for 21sotope (pCUg, ucI, etc.) % of Total ULmts (pCU) lm y TEDEAni241 0.014 0.008% 9.9 O 00C-14 407 2.217% 2.0 0.15Co4tO 0.64 0.294% 3.5 0.02Cs-137 169 86 823% 6.6 e.02Eu4152 0.04 0.022% 10.1 0.00H-3 12.1 6.592% 132 0.46Nl-63 7.2 3.923% 747 ba 0.27Pu-238 o 003 0.002% 1.8 0.00Pu-239 0 004 0.002% 1.6 0.00Pu-241 0.562 0.306% 86 0.02Sr-go 0.02 0.011% 1.2 0.00
Am-241C-14|
'a 137Eu-152H-3Nl-63
Pu-238Pu-239Pu.241
Sr-90I 1.U4 4 Z+0 100.O .% 6.95
Maximum Perlsslb[e
(25 nvmrny)Maxin im Peimissible
|pCIg (14 enr y) I
C)
m
. .
&19;
l
O F_
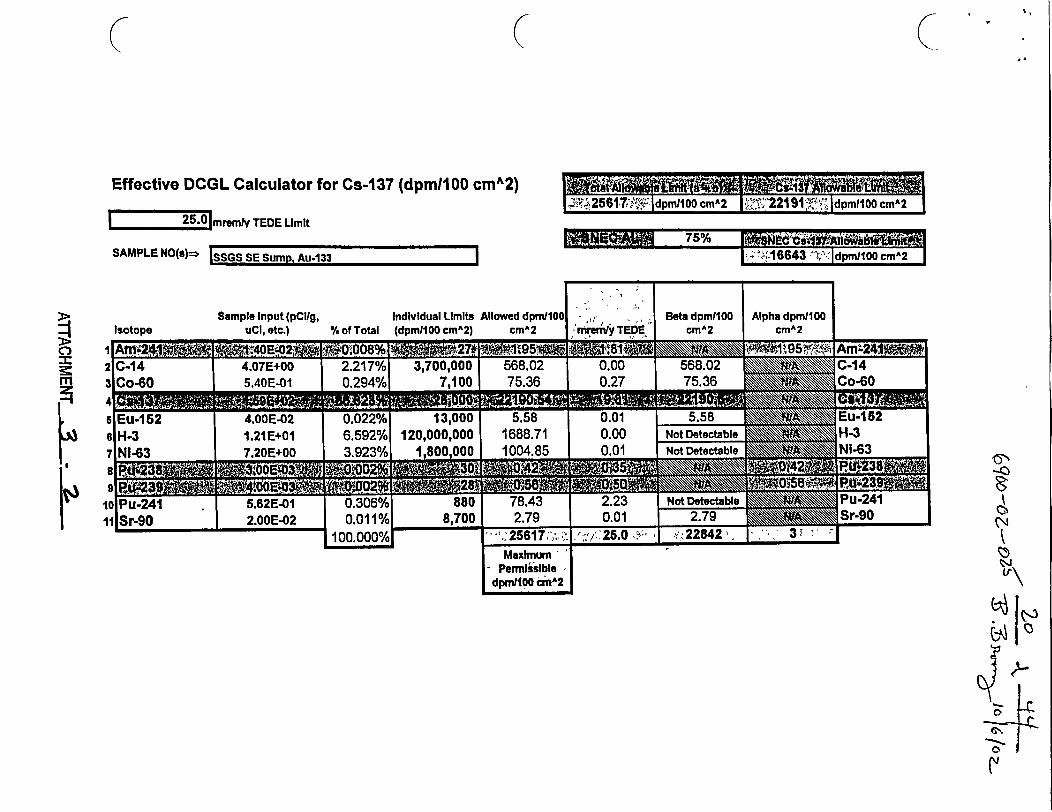
Effective DCGL Calculator for Cs-i 37 (dpmiO00 cmA2)
I m 25r0mrlmy TEDE Limit
,e 251'22iO m~ 912X"7,jdpm11OOcmA2.
1 OQ- __75% 14 a ;SAMPLE NO(s)=, Issas SE Stmn- Aiu..133 ---I I,.< ..2iv16643 IJssvdpml1OOcmA2 I
mreny TEDEC)
Sample Input (pCUg, Individual Limits Allowed dpml10OuCl. etc.) %ofTotal (dpmI100cmA2) cmA2
Beta dpm/1OOCmA2
Alpha dpm/100cmA2Isotope
I
Maxhnwn'- PermissibledpmJiOO 1cmA2

I -
6y(o -oZ-00I 2. 1 A 1j-53tc7%I" Col I 0
SNEC SAMPLE RESULTSLocatlonlDescriptionI AR or LAR No.
F BWXT, 01 11056-02 SSGS SE Sump, AU-133, SR-0003
SNEC Sample No. Comments:SXSD723
Other Identifier| SSGS/DT/IT Area Sample
Analysis Date=>' February 20, 2001Isotope pCilg (sollids) or pCUl (If water) or pCi (If smears)
I Am-241 < 0.014
2 C-14 < 4.07
3 Cm-2434 Cm-244 < 0.004
6 Co-60 0.546 Cs-134 < 0.05
7 Cs-137 159
8 Eu-152 < 0.04
9 Eu-1 54 < 0.03
o Eu-155 < 0.17
2 Fe-55 < 28.32 H- < 12.1
3 Nb-94 < 0.01
4 Ni-59 <16
Ni-63 < 7.2
Pu-238 < 0.003
Pu-239 < 0.004
Pu-240 < 0.004Pu-241 < 0.562
Pu-242 < 0.003
Sb-125 < 0.23
Sr-90 < 0.02
Tc-99 < 0.37
U-234 0.26
U-235 0.011
6 U-238 0.209
Other Isotopes pCVg (soilids) or pCI/I (if water) or pCi (if smears)
On-site AnalysIs for Cs-137On-site Analysis for Co-60On-site Analysis for H-3 3
1-129 < 1.68
Gross AJpha _
Gross BetaK-40
Ra-226Th-232Cm-242 < 0.019
Th-228 .Np-237 < 0.005
Ce-144 < 0.57
ATTACHMENI 3
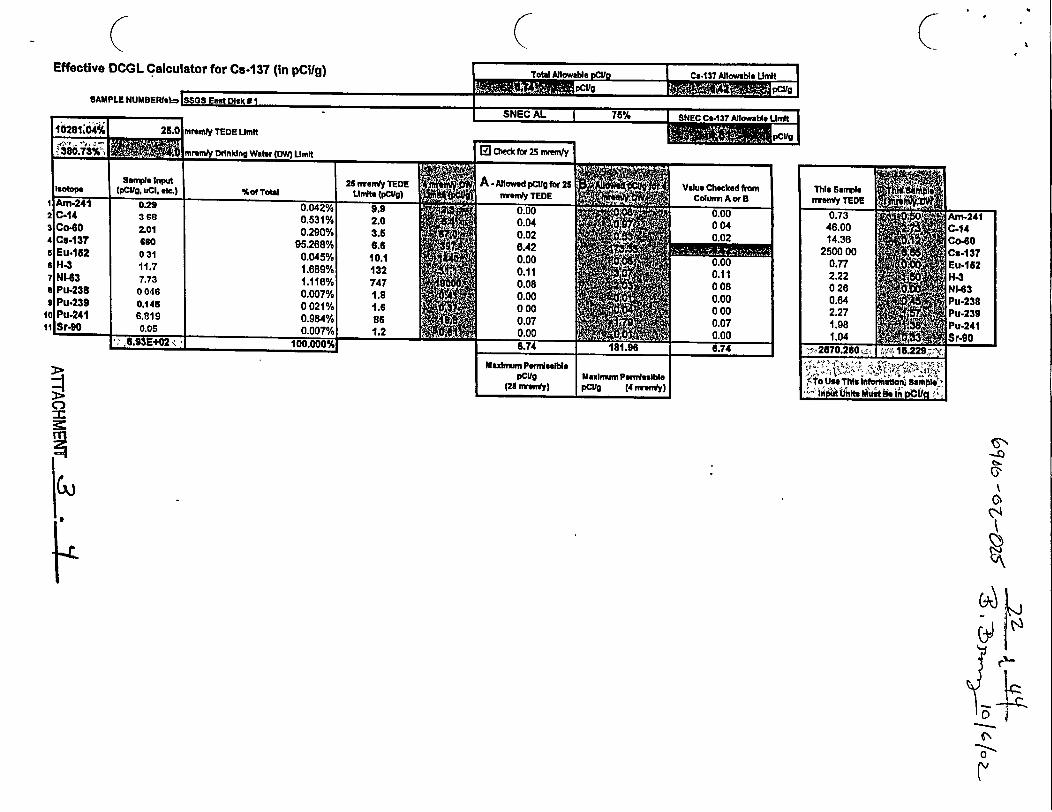
Effective DCGL Calculator for Cs-137 (In pClIg)
OA&MI U I-- -- ---
Tobal Allowob r.Min I I.-1J7 All-M. UI IAlToa M-"wHa odlo I f~A¶ AI,.,W. I ,,I#R _ r =_Ml nlElln
NF1- I ,IFb/ f w ~ ~- 'V'C.= flI- WI Ifl.JIn"IU~ni.S.ooaCam juni I -..>
:3IMtC AL I 76% 1 ur ... 7*ilS I_-
10281:4 A 25.0 mrommy TEDE UmItN . -I 1 Ir
_1 M m"'L ' 5.- I - M
memh nfl^l w mwz * ._"
2
4
eI
I
II
I CI1I
A I …5t~ ...... ,~n.um~ ~Uflin J L _ _liRl
Senlpl Input 25 mwmuy TeDE A A owed pCIg for 25Isotope (pCtg. uc. et.) %do Totl Uwnft (pCVg) mmnh TEDEAm-241 029 0.042% 9.9 0.00'C-14 3 Gs 0.531% 2.0 00Co-gO 2.01 0.290% 3.5 002i Cs.137 660 95.268% 6.6 6.42* Eu.162 0 31 0.045% 10.1 0.00
H.3 11.7 1.889% 132 0.11NI-3 7.73 1.116% 747 0.08
i Pu-238 0 046 0.007% 1.8 0.009 Pu.239 0.145 0 021% 1.6 0 00
fPu-241 6.819 .94% 8 6 0.07isr 90 0.00 0.00
' e .:, -_
wm-241.-14o -60.u-137Eu-1621H311-63Ou-238lu-239'u-241Sr-90
, ,.w0s-us i 1UU.UUU7.
U4laxjim~m PohussbI.
pCUg(25 enify)
lhaxlrm Pg sIbte
_ pCIg (4 mwwly)
_6.74
3
T,-oD
\oCVQ
a.
(~0
I(%
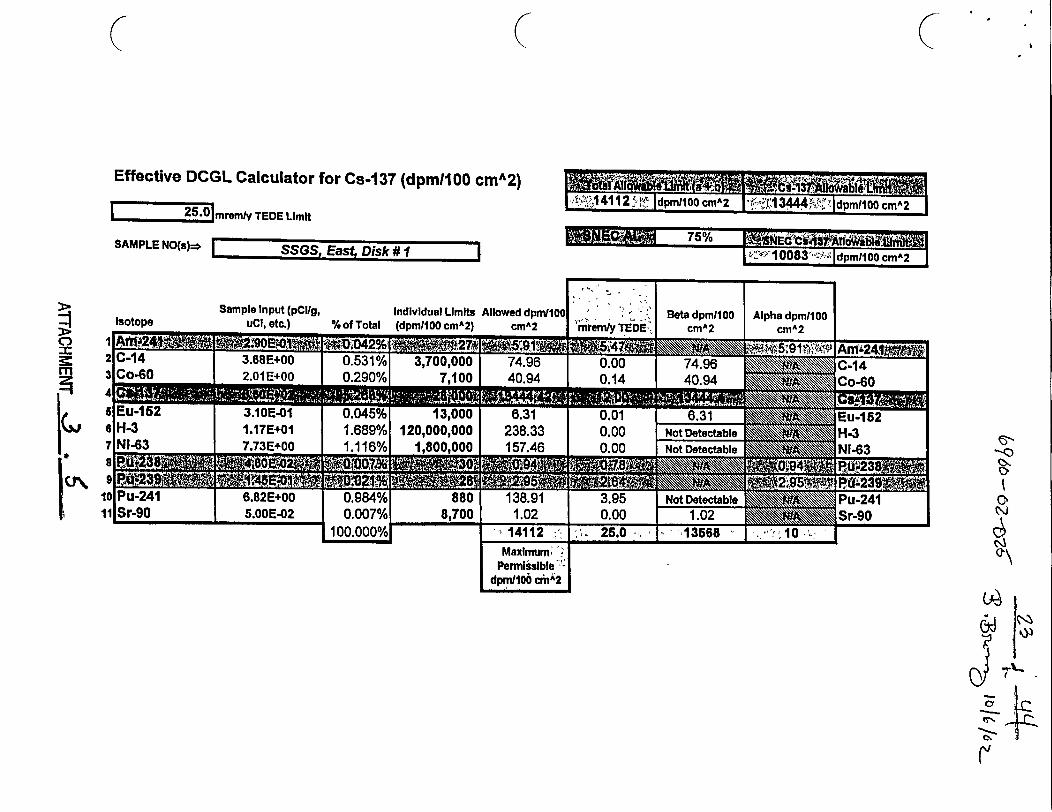
Effective DCGL Calculator for Cs-137 (dpml100 cmA2)
| 25e mremt TEDE Limit, ,1-2X A 00c C|112 dpm~lOcm2 - 13444`,'" 1dpmtiO00CMA2
I
A, ;975% jcIMt ("IiSAMPLE NO(s)=n. FT IS-SG-S --atDisk #1I---- I $KK> 10083' ,I'-Idpm/10OcmA2 I
C,
SI
V
Sample Input (pCUg, Individual Limits Allowed dpnVlOCuCI, etc.) % of Total (dom/100 cmA2) cmA2 fmriny TEDE
Beta dpml1 00cmA2
Alpha dpmll 00cmA2
1s
0NCIA
a\MaxImum;Permissible
dpm/l1OO6 d2
C';
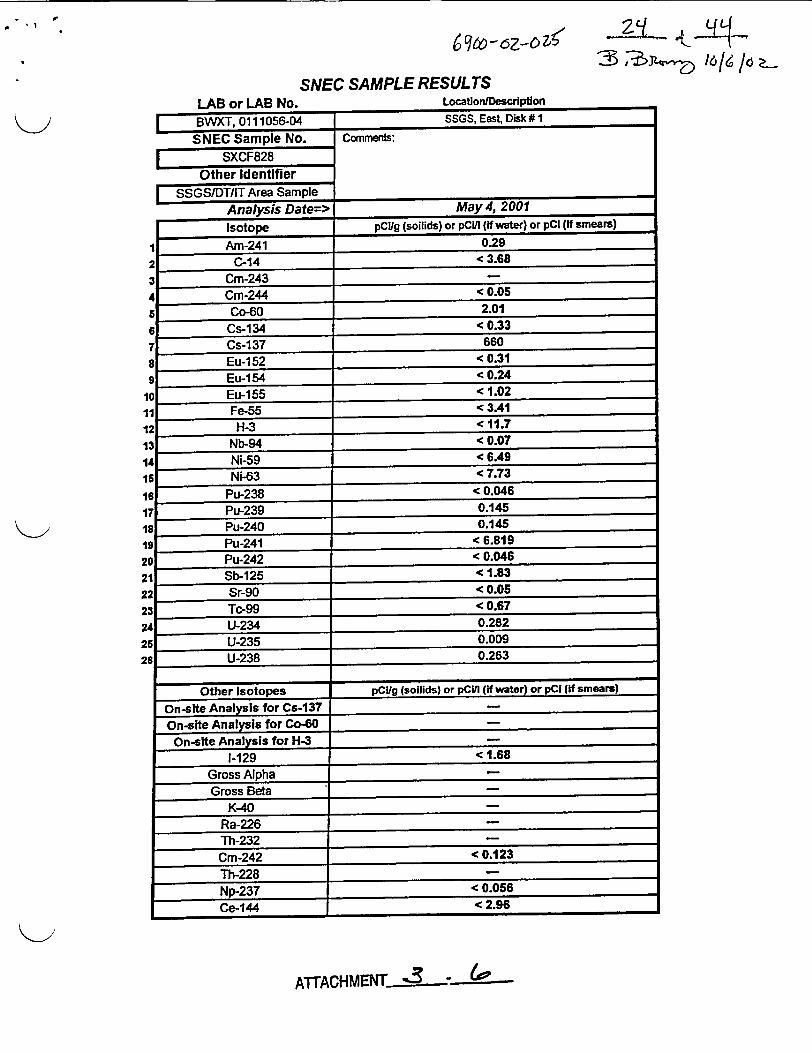
. I I
-i - &-t 41BJ%~1 6/
SNEC SAMPLE RESULTSLocationlDescriptionI AR nr I AR Nn
BWXT, 0111056-04 SSGS_ East Disk #I
SNEC Sample No. Comments:SXCF828
Other IdentifierSSGS/DT/IT Area Sample
Analysis Date=> May 4, 2001
Isotope pCilg (soilids) or pcl (Hf water) or pCl (if smears)
1Am-241 0.29C2-1437 66
3Cm-2434m24 < 0.05
6Co-60 2.01
6Cs-1 34 < 0.33
7Cs-137 660
B Eu-152 < 0.31
Eu-154 < 0.24
Eu-155 < 1.02
Fe-55 < 3.41
2 H-3 < 11.7
Nb-94 < 0.07
Ni-59 < 6.49
Ni-63 < 7.73
Pu-238 < 0.046Pu-239 0.1458Pu-240 0.145Pu-241 < 6.8190Pu-242 < 0.0461 Sb125 < 1.832Sr-90 < 0.053TC99 <0.67U-234 0.282U-235 0.009
U-238.263
Other Isotopes pCug (soilids) or pCIn (if water) or pci (if smears)
on-site Analysis for Cs-137On-srte Analysis for Go 60On-site Analysis for H-3 _
1-129 < 1.68
Gross AlphaGross Beta
K-40Ra-226Th-232 _
Cm-242 < 0.123
Th-228 __ _ _ _ _ _ _ _ _ _ _ _ _ __ _ _ _ _ _ _ _ _ _ _ _ _ _
Np-237 < 0.056Ce-144 < 2.96
ATTACHMENT 3 -tp,
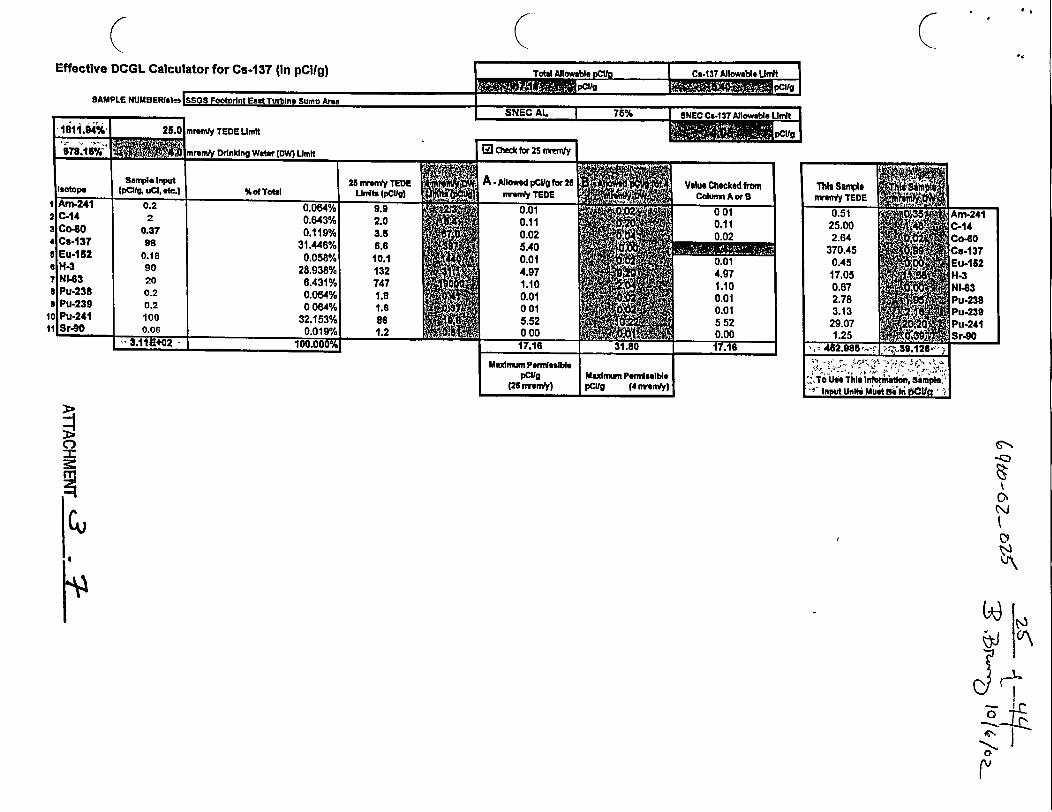
9,
Effective DCGL Calculator for Cs-137 (In pCi/g) I Totbl AlIowahle oJCn I C.427 U.N. Unit II Ca.17 Alowabl Un-it
---- - ------ ---- -A^AADI a AII IU R r Al^-I _CS C FAJ -A - � e. - T@sIA_ IU- M NU BEMS- -03 F Prnn Eam I MWine MUMTD AMReaI SNEG AL I 7F.-A. I I
1811.64%s 25.0I NE AL I 7Fi'A-I- I
mrnmly TEDE UmItWOMMMPCUOIgI 74 ... , ..- - r~n,~~irpMM~*~J- 'W*IIf lil
9
32
4
7
101`1
Sanple Input 25 nvnnly TEDesotope (p1l0g. u etc.) % Of Total U. Sh (puClg)Ami-241 0.2 0.064% 9.9C-14 2 0.643% 2.0Co-so 0.37 0.119% 3.5Cs-137 98 31.446% 6.6Eu.152 0.18 0.058% 10.1H-3 90 28.938% 132Nl43 20 8.431% 747Pu-238 0.2 0.064% 1.8Pu-239 0.2 0 084% 1.6Pu-241 100 32.153% 86Sr-90 0.O0 0.019% 1.2
. -4n n A.
A * Anowed pclg hr 2smnvny TEDE
0.010.110.025.400.014.971.100.010015.5200017.16
Thhs 5nnpl 3Mrn* T'DE.
05, 1 rAts l 'e i t(q -¢t.r*251.0 C >& >->
2..T 4 UnCbIdn~bn i^b170 5n~niuBPltf A-0 *| 4
km-241.4410 -60's .137W4624-341-632u-2383,u-239�Iu-241;r-90
1 UU.UUU7-_ _
I
Mexiiuim PenrmsslbepClIg
(25 fnvsny)IMaxlnvirn PermlasIbleIpCIVg (4 nVeny)
C4M GIN-JCD
F�DN
co�-l1AI
W 1
C6 1_ Ir
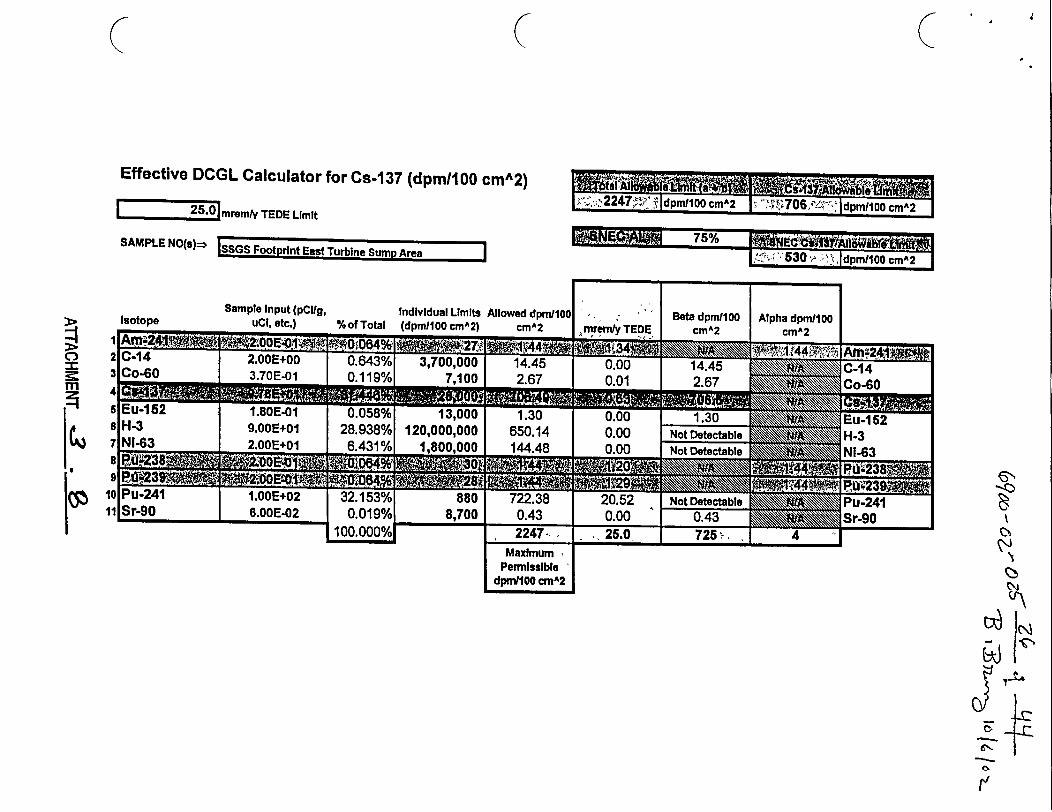
Effective DCGL Calculator for Cs-1 37 (dpmI100 cmA2)
I m 5r0emrerny TEDE Limit
SAMPLE NO(s)W= SSGS Foot rint East Turbine Sump Area 2
i; ;;, 22477 dpm0l0cmA2 | . ,jS7 ',Mdpm/100cm A2 J
', 530 I',dpm/100 cMA2 |
'I.
ITIC'3
IsotooeSample Input (pCIlg, Individual Limits Allowed dpm/100
uCi, etc.) %ofTotal (dom/100cmA21 cmABeta dpm/100
cmA2Alpha dpm/1OO
CmA2
Maximum ,Permissible
dpml100 CA2
CN
(\
ti 1C- el}

; . . j I~27~I44q- ~ -- +f
SNEC SAMPLE RESULTSLocationl/DescriptionL-AR or L-AB No.
| Teledyne-TI#-38253 SSGS Footprint East Turbine Sump Area AV-133 (Pumped)
SNEC Sample No. Cornments:SX1OSDO0366
Other IdentifierSSGS/DT/IT Area Sample
Analysis Date=> June 5, 2000Isotope pCu/g (soilids) or pCVlI (if water) or pCI (if smears)
1Am-241 < 0.2
2CS14 < 23 Cm-243 < 0.14Cm-244 < 0.1
6Co 60 O
6Cs-134 < 0.06367 Cs-137 97.8
Eu-152 < 0.18Eu-154 < 0.118Eu-155 < 0.211Fe-55 < 50
H-3 <90Nb-94 < 0.0479Ni-59 < 50
5 Ni-63 <20
Pu-238 < 0.2Pu-239 < 0.28Pu-240 < 0.2gPu-241 < 100oPu-242 < 0.21 Sb125 < 0.4012Sr-90 < 0.063 TC99 < 0.4U-234 1.15U-235 < 0.2U-238 0.57
Other Isotopes pCug (sollids) or pCul (H water) or pCl (if smears)On-site Analysis for Cs-137On-site Analysis for Co-60On-site Analysis for H-3 3
1-129 < 0.06Gross AlphaGross Beta
K-40 2.58
Ra-226 0.326Th-232 < 0.249Cm-242Th-228 _
Np-237 _
Ce-144 _
A1TACHMENT-0- 2 .3

(Effective DCGL Calculator for Cs- 37 (In pClIg)
SAMPLE NUMBERfadISSOS 79 El.. East-Debris from Puma Shnd Small Pins
Tobl1 Allbl MC1. I f._ S.7 All-W. ht t l II fV.4i7 Ati,...P.W. V-I V.' II
…-- I � -.SINtC% AL I 76%. I .. r e.4 IgS -
47,76.16e% 25.0 mramty TEDE Unimt* * rz~r-lauowa~unI
I "., �, ,
234
11
Sample Input 25 mrmlly TEDE A. AoA wed pCUg for 2lortpe (PCIug uCa. etc.) of Total Unith apO~g) wernly TEDEWWi.241 0.11 0.003% 9.9 00C-14 4.15013% 20.0
2 C2o- 1 3.98 0.126% 3.5 0.0tCu.137 3130 , 98.958% 6.6 8.55r Eu-152 0.24 0.008% 10.1 0.02H-3 '11 0.348% 132 0.02'N143 a Si 0.272% 747 0.02
iPu-238 0.07 0.002% 1.8 0'00F Pu-239 0.08 0.003% 1.6 * 0.00Pu-241 4.74 0.150% 86 0.01
ISr-go 0.04 0.001% 1.2 . 0.00. d3.16E+03.- 100.000% 6.62
l
Uaximum Pefstlble
(265Ilaxlim Pemoallble I
I pCVg (4 mramly)I
14
pCI/ (dOen
-o
N
0
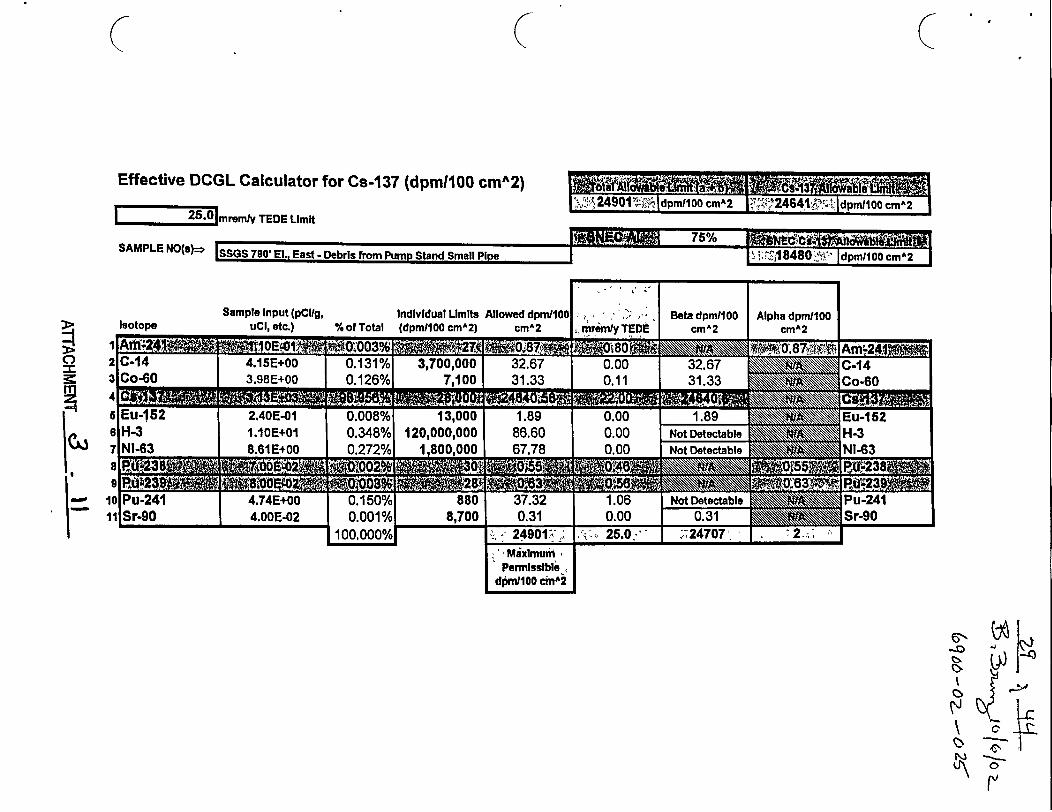
Effective DCGL Calculator for Cs-137 (dpmI100 cmA2)
! m5.00myemtv TEDE Limit
SAMPLE NO(9)=: IS 7 El. East -Debris from Pump Stand Small Pipe
| 249 1w%2dpmiO cmA2 |,I: 2464123 t'dpm1iOO cmA2
I-1* 75% Zei'c¾ c1'MT^18450&'t dpm/1OOcmA2
Sample Input (pCUg, Individual Limits Allowed dpm1lOOuCl. etc.) %fTotn l T rnmllfl cmA7i cmA , mrim/y TEDE
Alpha dpm/100CmA2
C)
"3
C1J
I-o
Beta dpm/100cmA2
I' MaximumPermissible ,
dpmO100 cO A2
C
0
r
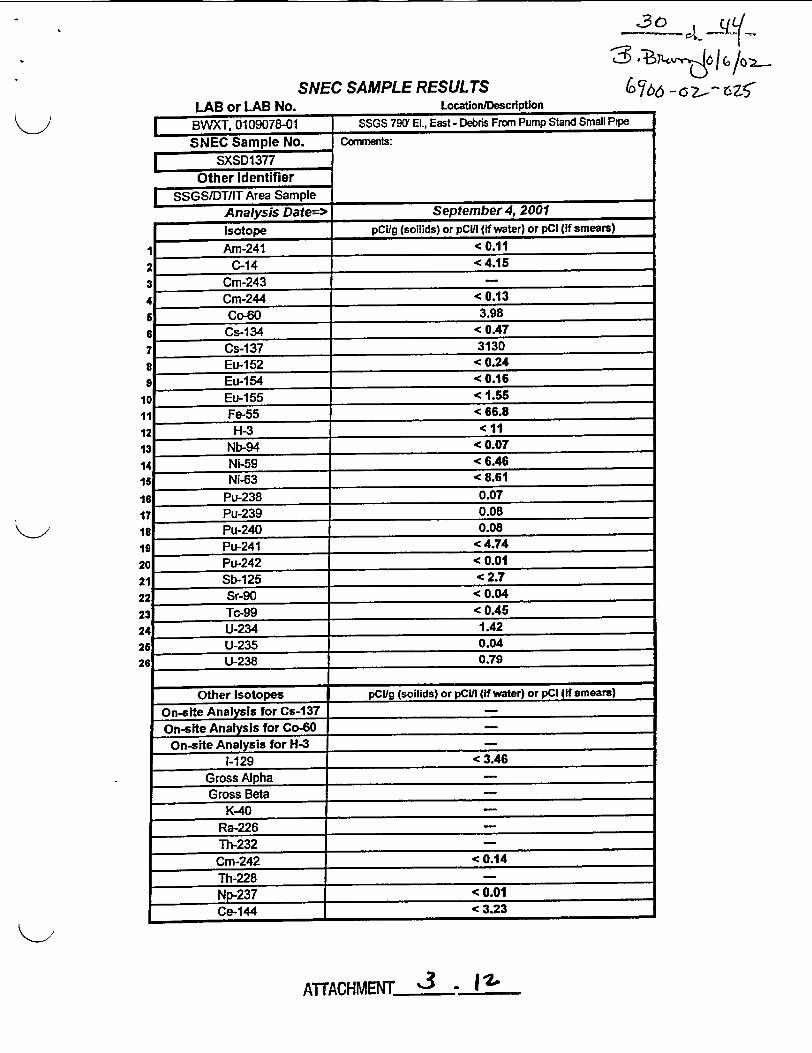
3 IC) 6'I-q6Zo
67b6 -, 6 i?- ;ZSZ5SNEC SAMPLE RESULTSLonaftion/DescriotionI AR1r a I AR Nn
BWXT, 0109078-01 SSGS 790' El., East - Debris From Pump Stand Small Pipe
SNEC Sample No. Comments:SXSD1377
Other IdentifierSSG SlDT/IT Area Sample
Analysis Date=> September 4, 2001Isotope pCUg (soilids) or pCUI (if water) or pCI (If smeas)
1 Am-241 < 0.112C-14 < 4.15
3Cm-2434Cm-244 < 0.13
5Co-60 3.986Cs-134 < 0.47
T Cs-137 3130
B Eu-152 < 0.24s Eu-154 < 0.16
Eu-1 55 < 1.55Fe-55 < 66.8
PH-34 <0.11
3N-94 < 0.07
Ni-59 <06.45
5Ni-63 c 8.61Pu-238 0.07Pu-239 0.08Pu-240 0.08
sPu-241 < 4.74Pu-242 < 0.01
1Sb-125 < 2.72Sr-90 < 0.043TC199 c 0OA5
TU-234 1.425U-235 0.046U-238 0.79
Other Isotopes pCl/g (soilids) or pCUI (if water) or pCI (if smears)
on-site Analysis for Cs-137On-site Analysis for Co-60
1I-129 < 3.46Gross AlphaGross Beta
K-40Ra-226Th-232Cm-242 < 0.14Th-228 _Np237 c 0.01Ce144 < 3.23
ATTACHMENT 3 - 1 I
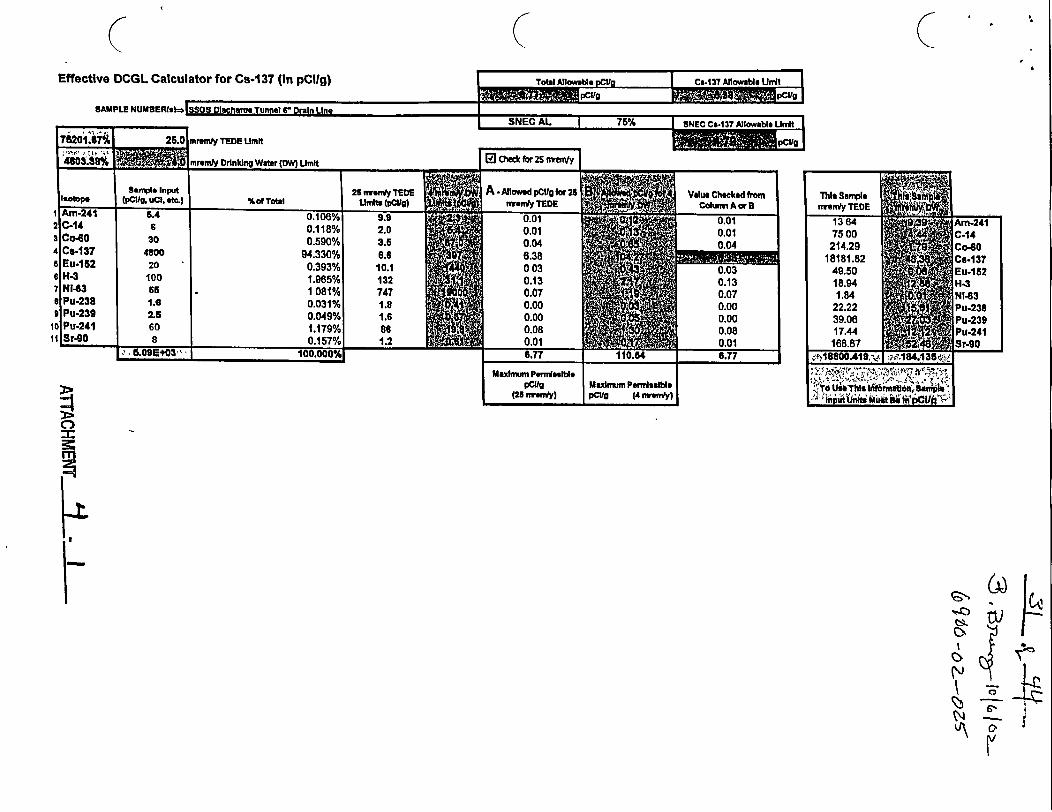
I
Effective DCGL Calculator for Cst 137 (in nClIIo I I t 4| 11 Ssa tf M I I-J IT - l *nS. _ IIA.. _.. .-. --- -" t'-"U .IAI I .DIn., -lW1 IJIAlW*IflLUI
,pmmCUs i 'm pcllgISAUDI a IiIUUROWDI.L- .In0 - ----. - . . I
SNEC AL r 75% I SEmCe rg.vr It7-tlw. t Llm I, .Ti2o11e74| 25.01mrnmty TEDE Umit
I UMPE' V�.4i7 AtIn,...hI.3 I..d I
_ |t"'l I ; I =
i
2A
IIIII
IfI ,
l rmyDfinking Wator (DM) LUfnt zWNAg Lncy
Sanmple Input 28 nremny TEDE A Allowed pCug fbr 2sotpe (plicu uCI. aft.) % Total Undta (pe/g) e w TEDE
AM-241 5.4 0.108% 9.9 00C-14 6 0.118% 2.0 0.01
ICoO-6 30 0.590% 3.5 00Cs-137 4300 94.330% 6.6 6.38Eu-152 20 0.393% 10.1 0 03
i H13 100 1.985% 132 0.137Nl 63 B6 1081% 747 0.07I Pu-238 1.6 0.031% 1.8 0.009Pu-239 2.5 0.049% 1.6 0.00
Pu-241 60 1.179% 186 0.08I sr- a 0.157% 1.20.01
5.09E403" 100.000%1 6.77
Am-241C-14
Co-60Cs 137Eu-1524H34Nl3Pu-238Pu-239hu-241
_
=1-DC,
II ".- I
Maximum Pwn lslbl I.", xpCIQg MLxlmum Pnwassil.e I 'i
(28 nrenvy) pCVs (4 ngVe y)
_ _
(A
N 4_w
cN I
U\ a
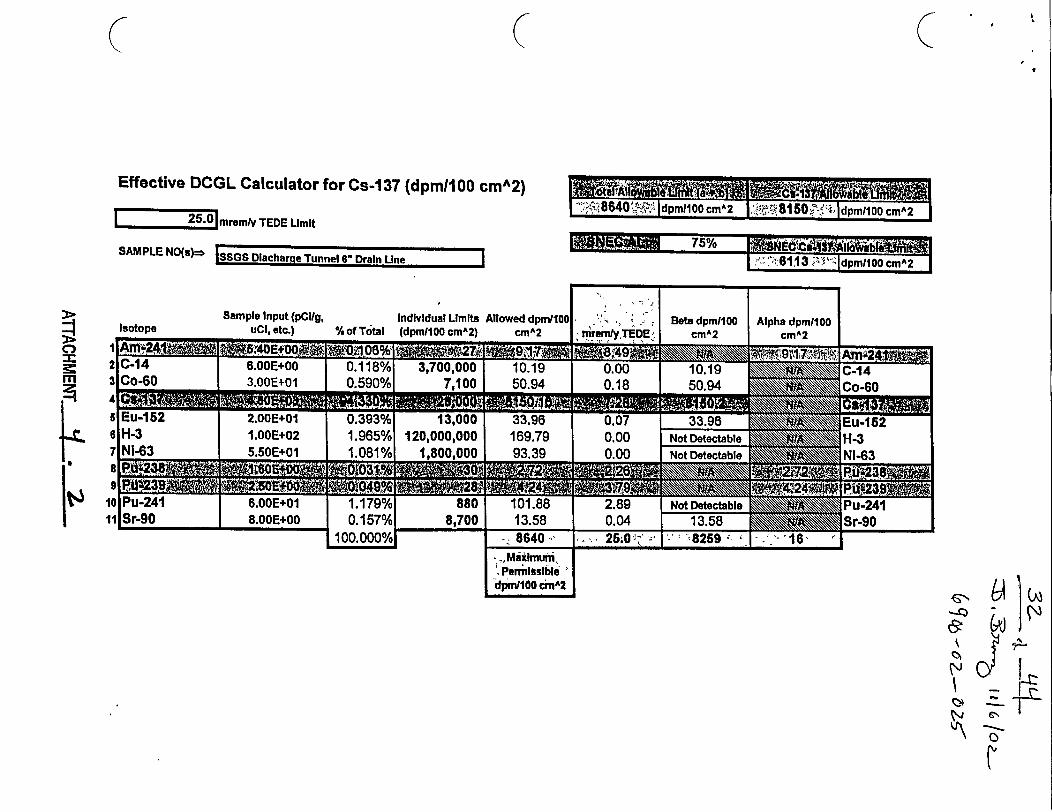
I
q
Effective DCGL Calculator for Cs-1 37 (dpmlO00 cmA2)
| mmremy TEDE Limit8 5 -,� t� 100ldpm/100 cm-2 i 0, Idpm/ 2_L
CMAL"WORMAN - 75% -SAMPLE NO(s)n SSGS Dacharqe Tunnel 6" Drain Line lV, " 61,13 '4';",jdPm"O0cm^2 l--- I I ~ .- .Bl~~~dpIoc
£DiSample Input (pCIlg, Individual Limits Allowed dpml100
uCI, etc.) % of Total (dnm/1O emMA2) tmA7
w,tm~,~~l
p -
- 2 MaxImum,.PermissibleId*nl100 cmA2
Cub
0
W
Z
;7
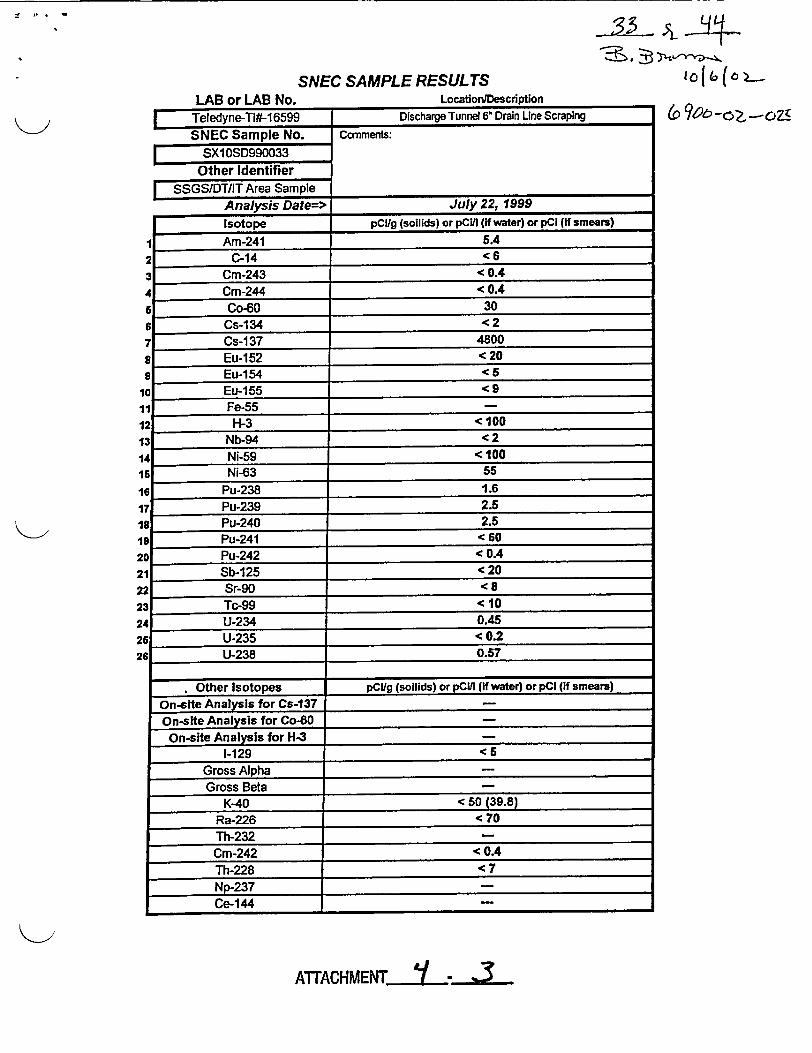
ioIl,(oaSNEC SAMPLE RESULTSLocationlDescrintionI AR nr LAB No.
Teledyne-Tl#-16599 Discharge Tunnel 6" Drain Line ScrapingSNEC Sample No. Commnmts:
IE SX10SD990033Other Identifier
I SSGSlDTllT Area SampleAnalysis Date=> July 22, 1999Isotope pCi/g (soilids) or pCul (if water) or pCi (if smears)
I Am-241 5.42 C-14 < 63 Cm-243 c 0.44 Cm-244 < 0.46 Co-60 306 Cs-134 < 27 Cs-1 37 4800a Eu-152 < 20g Eu-154 <511 Eu-155 <91I Fe-5512 H-3 < 10013 Nb-94 < 214 Ni-59 < 1005 Ni-63 556 Pu-238 1.67 Pu-239 2.59 Pu-240 2.59 Pu-241 < 600 Pu-242 < 0.4
Sb-125 < 202 Sr-90 < 83 Tc-99 <104 U-234 0.456 U-235 < 0.26 U-238 0.57
Other Isotopes pCi/g (soilids) or pCuI (if water) or pci (if smears)On-site Analysis for Cs-137On-site Analysis for Co-60
On-site Analysis for H-3I-129 < 5
Gross AlphaGross Beta
K-40 < 50 (39.8)Ra-226 c 70Th-232 _Cm-242 < 0.4Th-228 < 7Np-237 _
Ce-144
& 9t9g'-oŽZ-ola
A1TACHMENTY_ 3 -
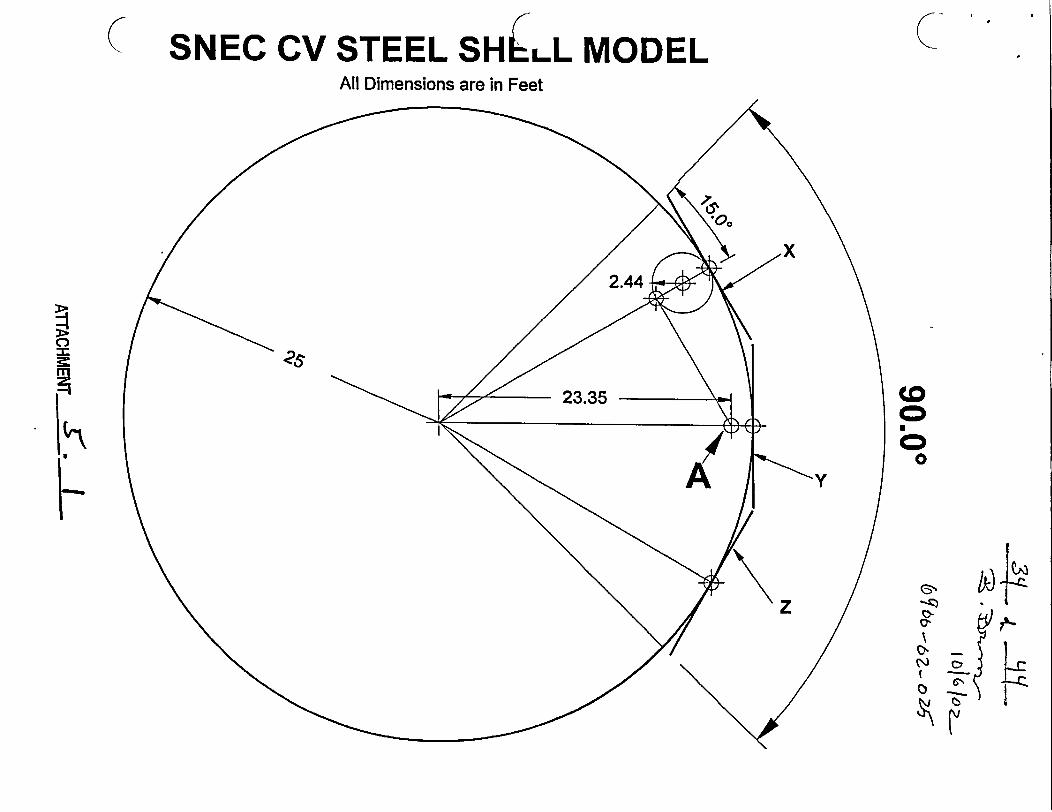
( SNEC CV STEEL SHELL MODELAll Dimensions are in Feet
:Ii'
=C
co40
0
0-C>
N . I
?r,
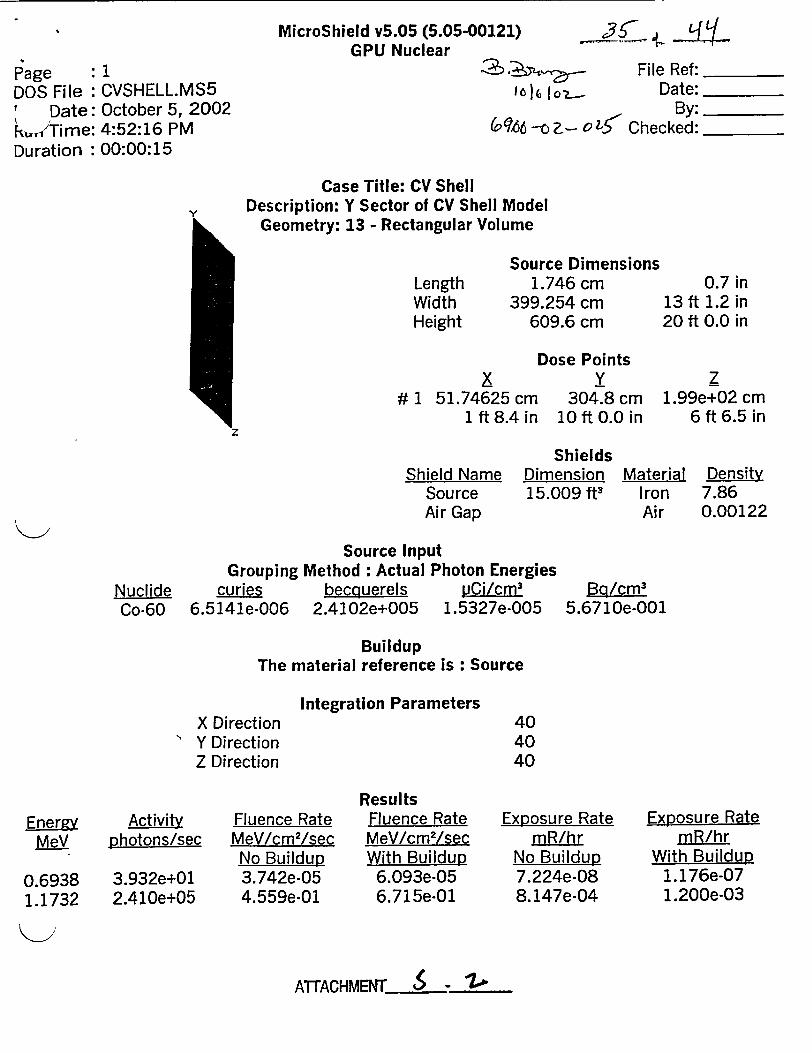
MicroShield v5.05 (5.05-00121)GPU Nuclear
,3rIPage : 1DOS File : CVSHELL.MS5
Date: October 5, 2002L",'time: 4:52:16 PMDuration : 00:00:15
3 . File Ref:1|lo IDate:
By:('9,66 --o Z- 0 2-•" Checked: -____
Case Title: CV ShellY Description: Y Sector of CV Shell Model
16 Geometry: 13 - Rectangular Volume
LengthWidthHeight
Source Dimensions1.746 cm 0.7 in
399.254 cm 13 ft 1.2 in609.6 cm 20 ft 0.0 in
Dose Points
z
x# 1 51.74625 cm
1 ft 8.4 in
Shield Name DiiSource 1!Air Gap
Y304.8 cm
10 ft 0.0 in
z1.99e+02 cm
6ft 6.5 in
Shieldsmension5.009 ft3
MaterialIronAir
Density7.860.00122
NuclideCo-60
Groupingcuries
6.5141e*006
Source InputMethod : Actual Photon Energies
becquerels pCi/cm3
2.4102e+005 1.5327e-005Bg/cm3
5.6710e-001
BuildupThe material reference is : Source
Integration ParametersX DirectionY DirectionZ Direction
404040
EnergaMeV
0.69381.1732
Activityphotons/sec
3.932e+012.410e+05
Fluence RateMeV/cm 2/sec
No Buildup3.742e-054.559e-01
ResultsFluence RateMeV/cm2 /secWith Buildup6.093e-056.715e-01
Exposure RatemR/hr
No Buildup7.224e-088.147e-04
Exposure RatemR/hr
With Buildup1.176e-071.200e-03
AITACHMENT &S - V
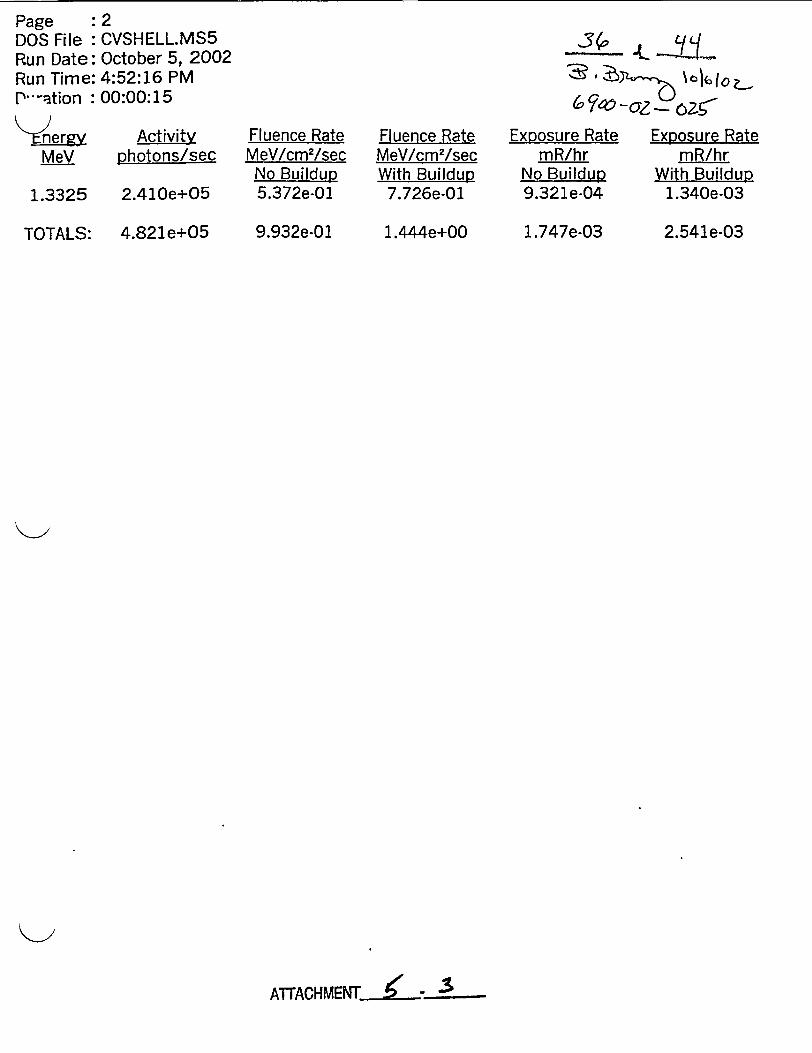
Page : 2DOS File: CVSHELL.MS5Run Date: October 5, 2002Run Time: 4:52:16 PMrP-ation : 00:00:15
Lf- -A3iS:R , Rs", 4.to Z_(0 F06 -CZ - Cag
_nergvMeV
Activityphotons/sec
Fluence RateMeV/cm 2/sec
No Buildup5.372e-01
Fluence RateMeV/cm2 /secWith Buildup
7.726e-01
Exposure RatemR/hr
No Buildup9.321e-04
Exposure RatemR/hr
With Buildup1.340e-031.3325 2.410e+05
TOTALS: 4.821e+05 9.932e-01 1.444e+00 1.747e-03 2.541e-03
ATTACHMENT s
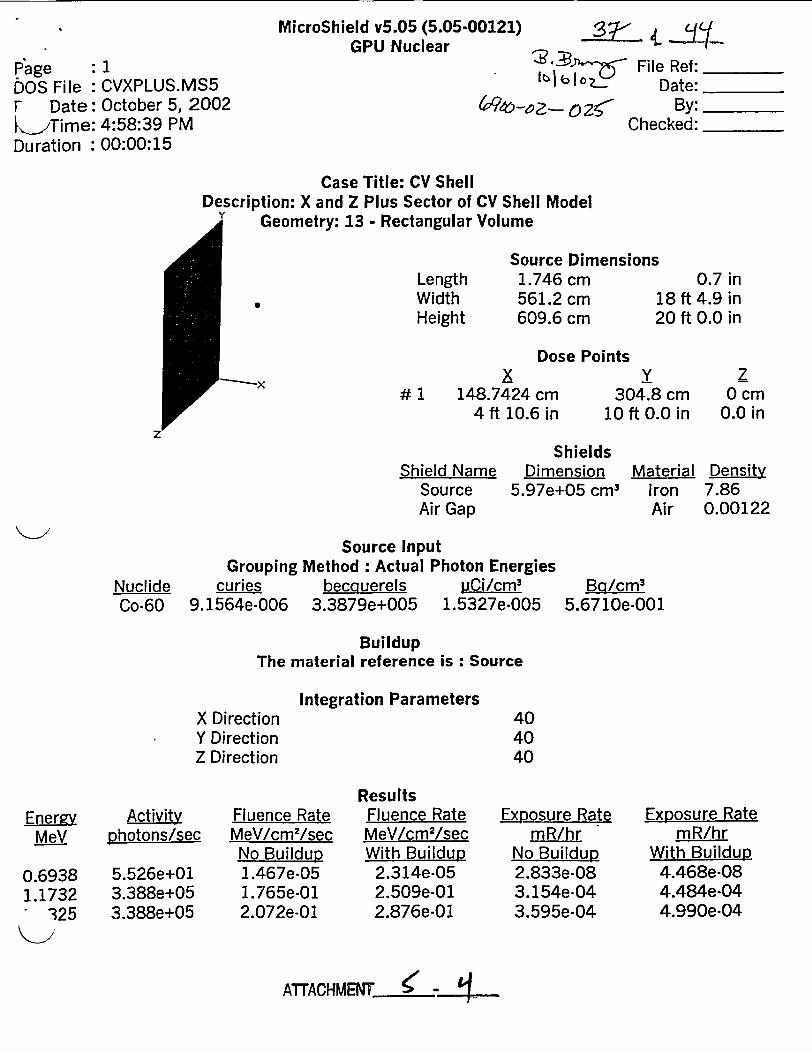
MicroShield v5.05 (5.05-00121)GPU Nuclear
Page : 1DOS File: CVXPLUS.MS5F Date: October 5, 2002i>Time: 4:58:39 PMDuration : 00:00:15
32j- 4 -
Ebb File Ref:luI b1bloz~ Date: ____
9?-A 2 ?-5By:Checked:
Case Title: CV ShellDescription: X and Z Plus Sector of CV Shell Model
Y A Geometry: 13 - Rectangular Volume
LengthWidthHeight
Source Dimension1.746 cm561.2 cm609.6 cm
a
Dose Pointsx
# 1 148.7424 cm4 ft 10.6 in
Y304.
loft(
0.7 in18ft 4.9 in20 ft 0.0 in
z8cm 0cm).0 in 0.0 in
iterial Densityron 7.86Air 0.00122
z
Shield NameSourceAir Gap
ShieldsDimension Me
5.97e+05 cm3
Source InputGrouping Method : Actual Photon Energies
curies becquerels pCi/cm3
9.1564e-006 3.3879e+005 1.5327e-005NuclideCo-60
Bq/CM3
5.6710e-001
BuildupThe material reference is : Source
Integration ParametersX DirectionY DirectionZ Direction
404040
EnergyMeV
0.69381.1732
325
Activityphotons/sec
5.526e+013.388e+053.388e+05
Fluence RateMeV/cm2 /secNo Buildup1.467e-051.765e-012.072e-01
ResultsFluence RateMeV/cm 2 /secWith Buildup2.314e-052.509e-012.876e-01
Exposure RatemR/hr
No Buildup2.833e-083.154e-043.595e-04
Exposure RatemR/hr
With Buildup4.468e 084.484e-044.990e-04
ATTACHMENr < -4-
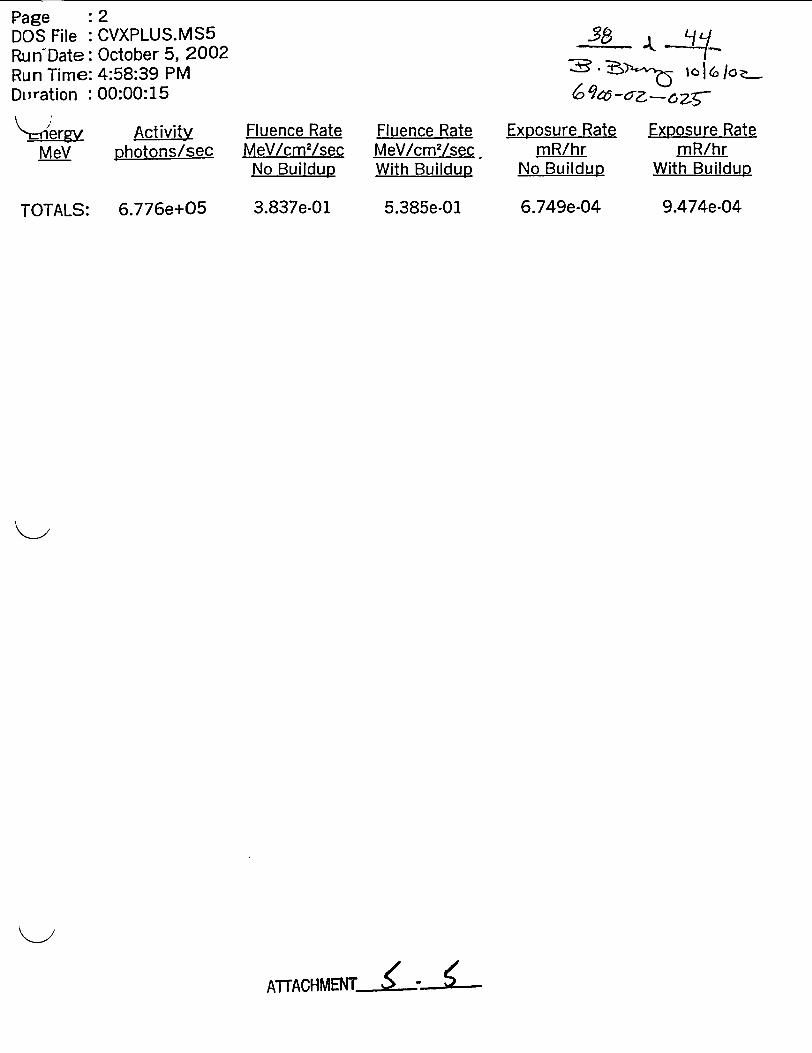
Page : 2DOS File: CVXPLUS.MS5Run'Date: October 5, 2002Run Time: 4:58:39 PMDuration : 00:00:15
---o -3 lo261at
:E . I 0 -oG /
MeV
TOTALS:
Activityphotons/sec
6.776e+05
Fluence RateMeV/cm2/secNo Buildup
3.837e-01
Fluence RateMeV/cm2/secWith Buildup
5.385e-01
Exposure RatemR/hr
No Buildup
6.749e-04
Exposure RatemR/hr
With Buildup
9.474e-04
ATTACHMENT •. -•-
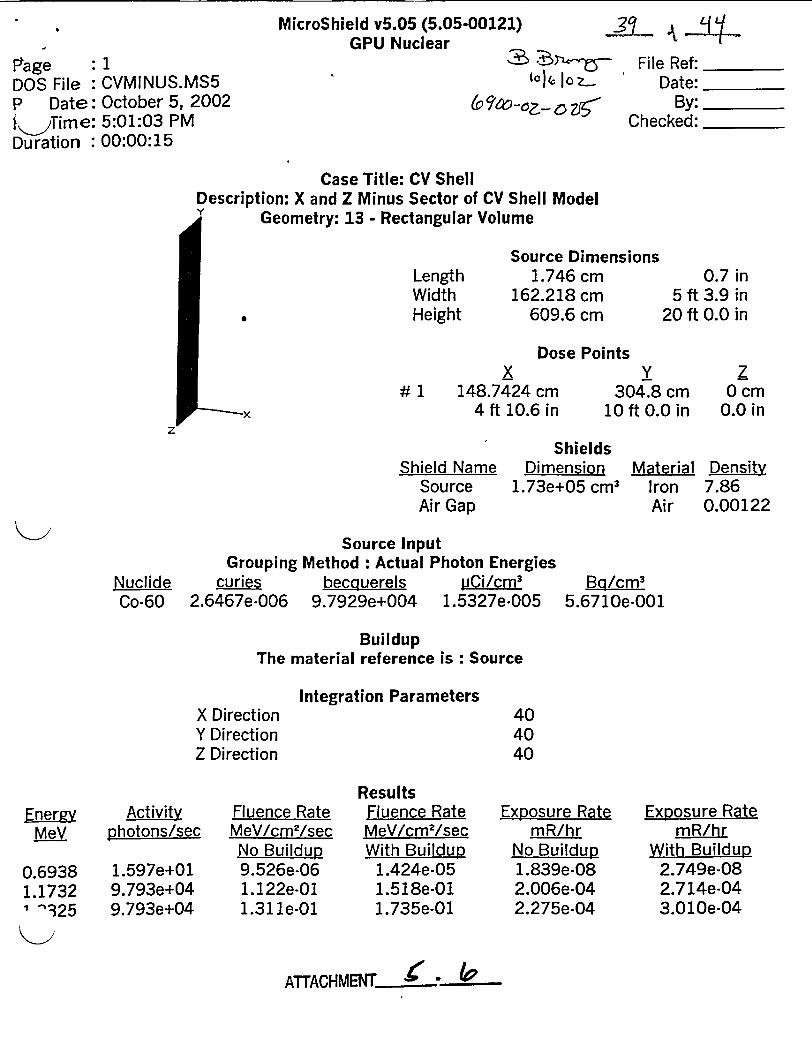
MicroShield v5.05 (5.05-00121)GPU Nuclear
Ftage : 1DOS File : CVMINUS.MS5P Date: October 5, 2002tKiTime: 5:01:03 PMDuration : 00:00:15
(olk lob-File Ref:
Date:By:
Checked:
Case Title: CV ShellDescription: X and Z Minus Sector of CV Shell ModelY
d Geometry: 13 - Rectangular Volume
LengthWidthHeight
Source Dimensions1.746 cm 0.7 in
162.218 cm 5 ft 3.9 in609.6 cm 20 ft 0.0 in.
Dose Pointsx
# 1 148.7424 cm4 ft 10.6 in
Y304.8 cm
10 ft 0.0 in
z0cm
0.0 in
Shield NameSourceAir Gap
ShieldsDimension
1.73e+05 cm3Material
IronAir
Density7.860.00122
Source InputGrouping Method : Actual Photon Energies
curies becquerels pCi/cm3
2.6467e-006 9.7929e+004 1.5327e-005NuclideCo-60
Bq/cm3
5.6710e-001
BuildupThe material reference is : Source
Integration ParametersX DirectionY DirectionZ Direction
404040
EnergyMeV
0.69381.1732' "325
Activityphotons/sec
1.597e+019.793e+049.793e+04
Fluence RateMeV/cm 2 /secNo Buildup9.526e-061.122e-011.31le-01
ResultsFluence RateMeV/cm 2/secWith Buildup
1.424e-051.518e-011.735e-01
Exposure RatemR/hr
No Buildup1.839e-082.006e-042.275e-04
Exposure RatemR/hr
With Buildup2.749e-082.714e-043.010e-04
ATTACHMENT v & -
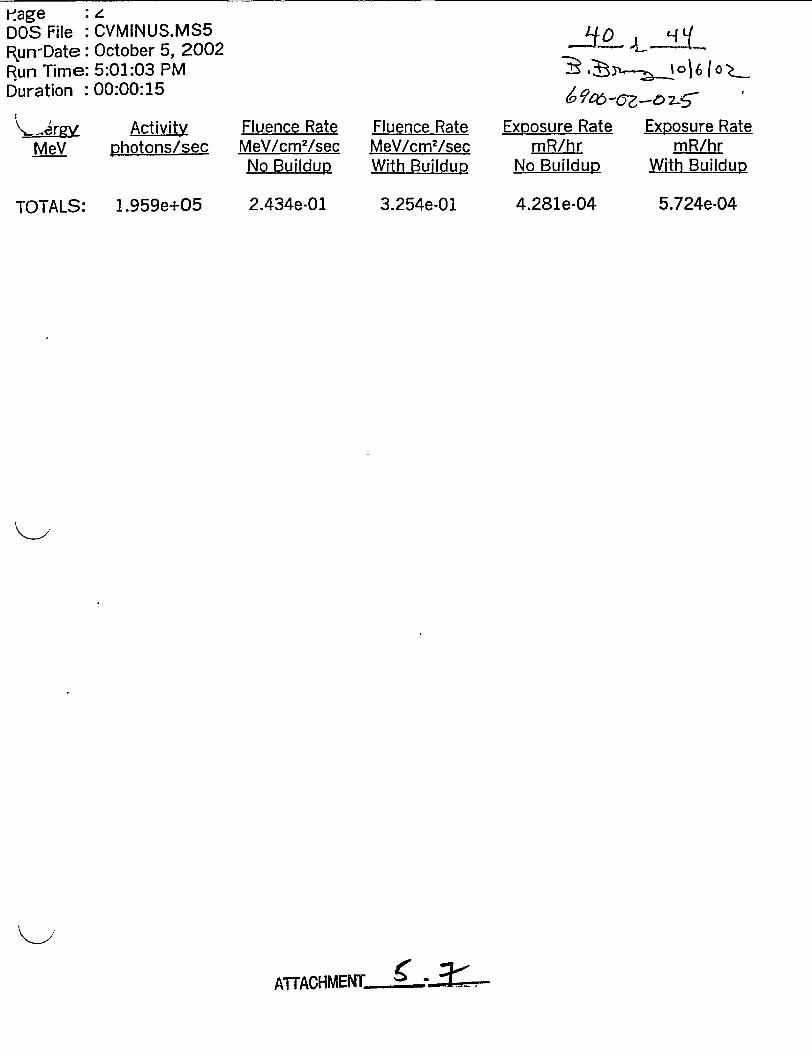
v.age : 4DOS File : CVMINUS.MS5Run-Date: October 5, 2002Run Time: 5:01:03 PMDuration : 00:00:15
-3 t,3nIoI6 fo
MeV
TOTALS:
Activityphotons/sec
1.959e+05
Fluence RateMeV/cm 2/sec
No Buildup
2.434e-01
Fluence RateMeV/cm 2/secWith Buildup
3.254e-01
Exposure RatemR/hr
No Buildup
4.281e-04
Exposure RatemR/hr
With Buildup
5.724e-04
A1TACHMENt .-
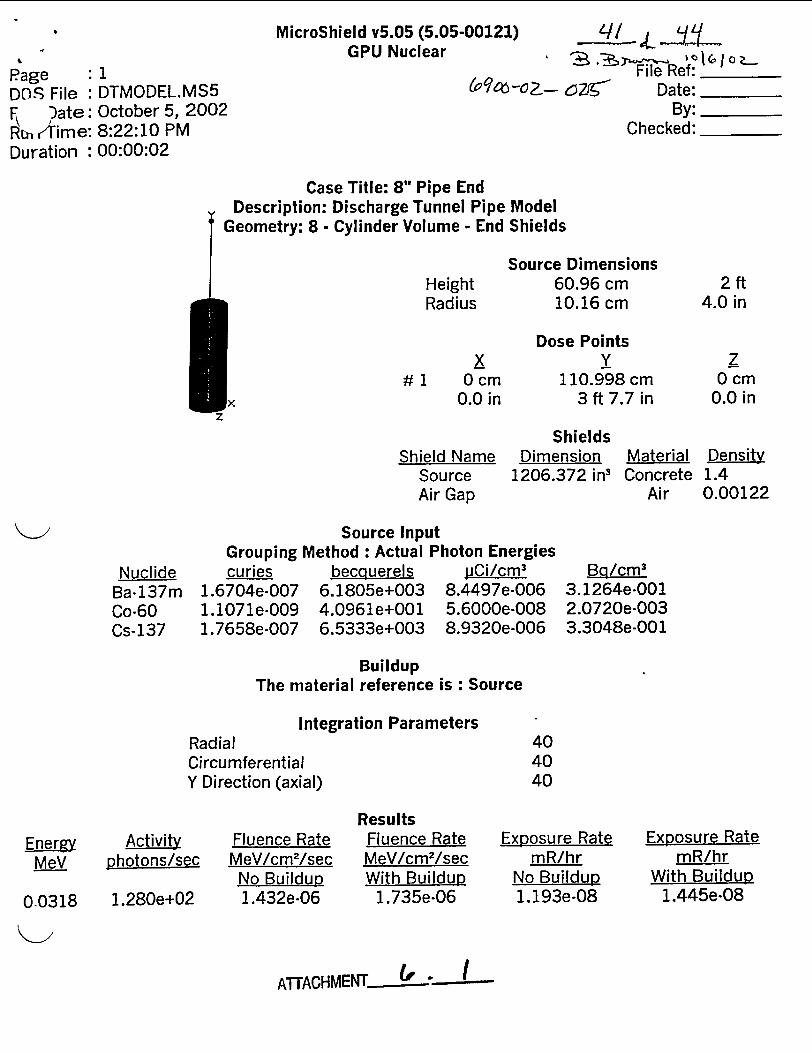
MicroShield v5.05 (5.05-00121)GPU Nuclear
PageDO-S File:F ?ate:Ru,+Time:Duration:
IDTMODEL.MS5October 5, 20028:22:10 PM00:00:02
(6o%-oa
,I 4. A3ft-
File Ref: _________
.sr Date:By:
Checked:
Case Title: 8" Pipe EndDescription: Discharge Tunnel Pipe Model
Geometry: 8 - Cylinder Volume - End Shields
HeightRadius
X# 1 0cm
0.0 in
Shield NameSourceAir Gap
Source Dimensions60.96 cm10.16 cm
Dose PointsY
110.998 cm3 ft 7.7 in
2ft4.0 in
z0 cm
0.0 in
Density1.40.00122
ShieldsDimension
1206.372 in3MaterialConcrete
Air
NuclideBa-137mCo-60Cs-137
Source InputGrouping Method : Actual Photon Energiescuries becquerels WCi/cm 3
1.6704e-007 6.1805e+003 8.4497e-0061.1071e-009 4.0961e+001 5.6000e-0081.7658e-007 6.5333e+003 8.9320e-006
Bq/cm3
3.1264e-0012.0720e-0033.3048e-001
BuildupThe material reference is : Source
Integration ParametersRadialCircumferentialY Direction (axial)
404040
EnergyMeV
Activityphotons/sec
Fluence RateMeV/cm 2 /secNo Buildup1.432e-06
ResultsFluence RateMeV/cm 2/secWith Buildup
1.735e-06
Exposure RatemR/hr
No Buildup1.193e-08
Exposure RatemR/hr
With Buildup1.445e-080.0318 1.280e+02
ATTACHMENT . I -
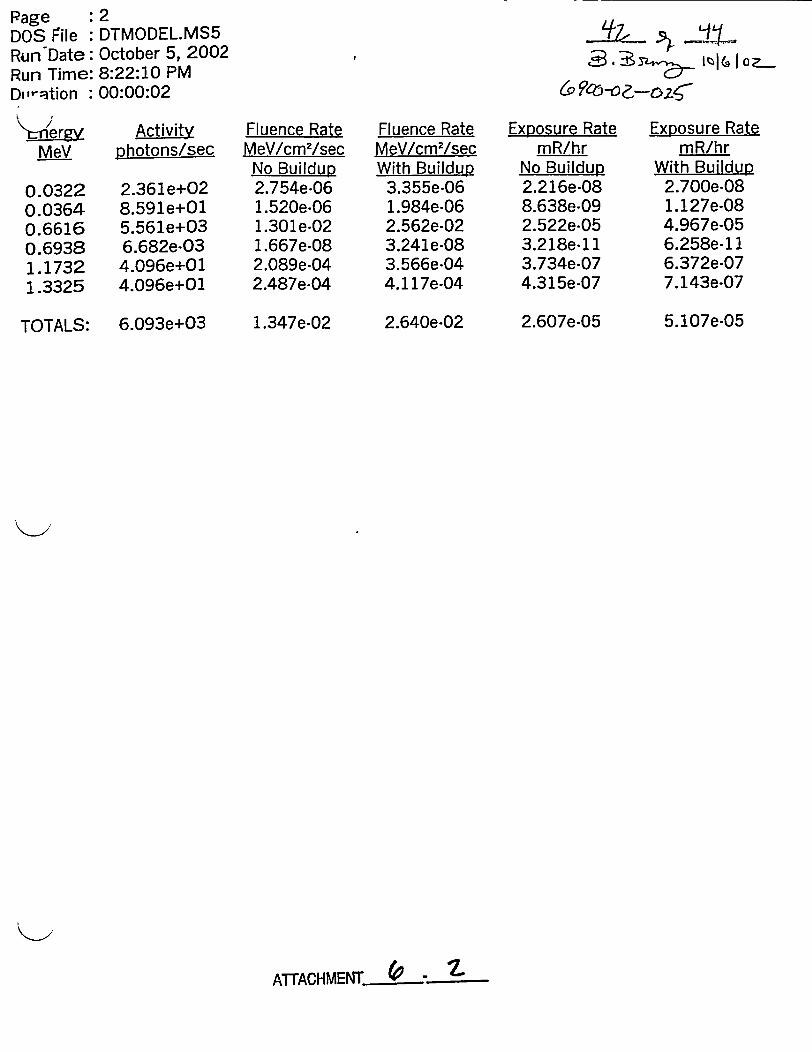
Page : 2DOS file : DTMODEL.MS5Run Date: October 5, 2002Run Time: 8:22:10 PMDo-avtion : 00:00:02
6 l 9- g'a3 * 31,r ,1 zt,( I a
6 & -s
'tniergyMeV
0.03220.03640.66160.69381.17321.3325
TOTALS:
Activityphotons/sec
2.361e+028.591e+015.561e+036.682e*034.096e+014.096e+01
6.093e+03
Fluence RateMeV/cm2 /secNo Buildup2.754e-061.520e-061.301e-021.667e*082.089e.042.487e.04
1.347e-02
Fluence RateMeV/cm 2/secWith Buildup
3.355e*061.984e*062.562e-023.241e-083.566e-044.117e-04
2.640e-02
Exposure RatemR/hr
No Buildup2.216e-088.638e 092.522e-053.218e-I 13.734e-074.315e-07
2.607e-05
Exposure RatemR/hr
With Buildup2.700e-081.127e-084.967e-056.258e*1 16.372e-077.143e-07
5.107e-05
AllTACHMENT & - E
Page : 1DOS File: 18LINE.MS5P D)ate: October 6, 2002R_ fime: 9:22:01 PMDuration : 00:00:44
MicroShield v5.05 (5.05-00121) JL. .GPU Nuclear S3 ~ 06\1OL.
& "6Oa 62-- File Ref: _____
6' ?d&-c~2 6Z ~ Date:____By:
Checked:
Case Title: Tie LineDescription: 18" Line Between Intake & DT
)metry: 12 - Annular Cylinder - External Dose Point
HeightRadius
Source Dimensions304.8 cm 10 ft 0.0 in20.32 cm 8.0 in
Dose Points0
X# 1 74.168 cm
2 ft 5.2 in
zIxShield Name
Cyl. CoreSourceShield 3TransitionAir Gap
ShielhDimensior20.32 ml
.025 m
.014 m
Y152.4 cm5 ft 0.0 in
Isl Material
AirConcrete
IronAirAir
z0cm
0.0 in
Density0.001221.47.860.001220.00122
NuclideBa-137mCo.60Cs-137
Groupingcuries
8.8740e-0075.8812e-0099.3806e-007
Source InputMethod : Actual Photon Energies
becquerels pCi/cm3
3.2834e+004 8.4497e-0062.1761e+002 5.6000e-0083.4708e+004 8.9320e-006
Bq/cm3
3.1264e-0012.0720e-0033.3048e-001
BuildupThe material reference is : Shield 3
Integration ParametersRadialCircumferentialY Direction (axial)
404040
Energy
IV
0.0318
Activityphotons/sec
6.798e+02
Fluence RateMeV/cm 2/secNo Buildup6.912e-40
ResultsFluence RateMeV/cm 2/secWith Buildup
1.700e-30
Exposure RatemR/hr
No Buildup5.758e-42
Exposure RatemR/hr
With Buildup1.416e-32
ATTACHMENT....J-- '3
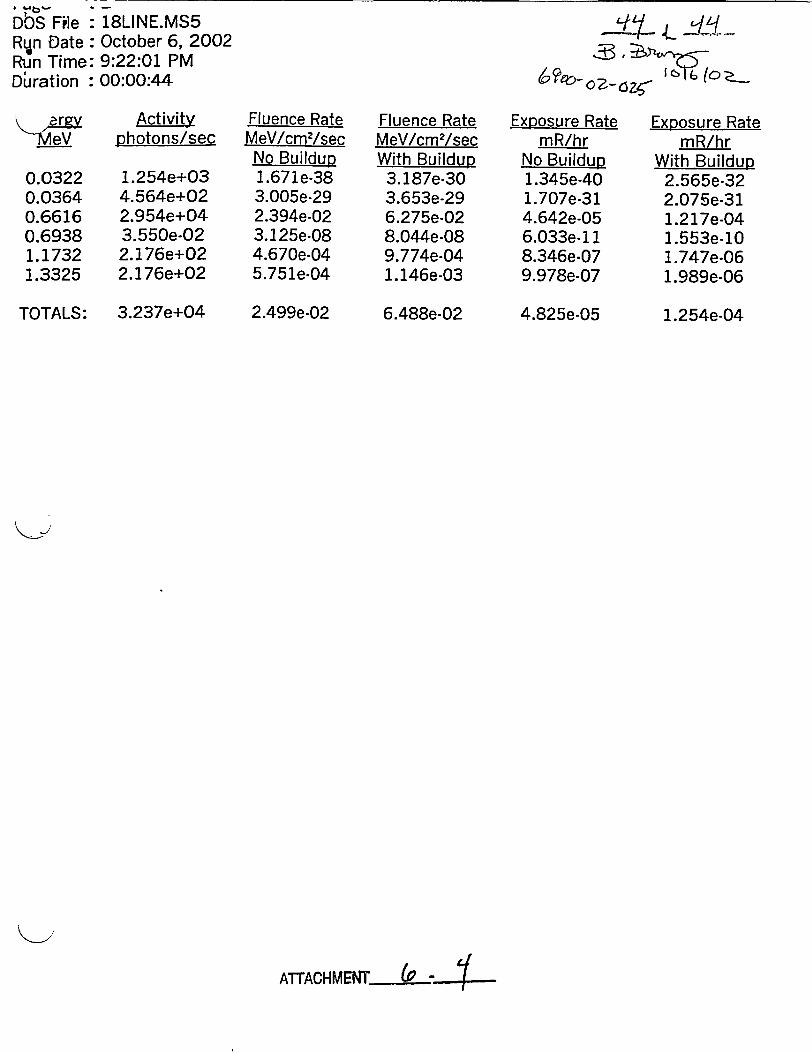
DbS File : 18LINE.MS5Run Date: October 6, 2002Run Time: 9:22:01 PMDuration : 00:00:44
O2 1- tz1~
t erg-MeV
0.03220.03640.66160.69381.17321.3325
TOTALS:
Activityphotons/sec
1.254e+034.564e+022.954e+043.550e-022.176e+022.176e+02
3.237e+04
Fluence RateMeV/cm 2/secNo Buildup1.671e-383.005e-292.394e-023.125e.084.670e-045.75le.04
2.499e-02
Fluence RateMeV/cm 2/secWith Buildup3.187e-303.653e-296.275e.028.044e-089.774e-041.146e-03
6.488e-02
Exposure RatemR/hr
No Buildup1.345e*401.707e-314.642e-056.033e-118.346e-079.978e-07
4.825e-05
Exposure RatemR/hr
With Buildup2.565e-322.075e-311.217e-041.553e-101.747e-061.989e-06
1.254e-04
ATTACHMMENT N
Related Documents