Graduate eses and Dissertations Iowa State University Capstones, eses and Dissertations 2013 Myers-Briggs® preferences and academic success in the first college semester Debra K. Sanborn Iowa State University Follow this and additional works at: hps://lib.dr.iastate.edu/etd Part of the Educational Assessment, Evaluation, and Research Commons , Higher Education Administration Commons , Higher Education and Teaching Commons , and the Personality and Social Contexts Commons is Dissertation is brought to you for free and open access by the Iowa State University Capstones, eses and Dissertations at Iowa State University Digital Repository. It has been accepted for inclusion in Graduate eses and Dissertations by an authorized administrator of Iowa State University Digital Repository. For more information, please contact [email protected]. Recommended Citation Sanborn, Debra K., "Myers-Briggs® preferences and academic success in the first college semester" (2013). Graduate eses and Dissertations. 13095. hps://lib.dr.iastate.edu/etd/13095

Welcome message from author
This document is posted to help you gain knowledge. Please leave a comment to let me know what you think about it! Share it to your friends and learn new things together.
Transcript
Graduate Theses and Dissertations Iowa State University Capstones, Theses andDissertations
2013
Myers-Briggs® preferences and academic success inthe first college semesterDebra K. SanbornIowa State University
Follow this and additional works at: https://lib.dr.iastate.edu/etd
Part of the Educational Assessment, Evaluation, and Research Commons, Higher EducationAdministration Commons, Higher Education and Teaching Commons, and the Personality andSocial Contexts Commons
This Dissertation is brought to you for free and open access by the Iowa State University Capstones, Theses and Dissertations at Iowa State UniversityDigital Repository. It has been accepted for inclusion in Graduate Theses and Dissertations by an authorized administrator of Iowa State UniversityDigital Repository. For more information, please contact [email protected].
Recommended CitationSanborn, Debra K., "Myers-Briggs® preferences and academic success in the first college semester" (2013). Graduate Theses andDissertations. 13095.https://lib.dr.iastate.edu/etd/13095
Myers-Briggs® preferences and academic success
in the first college semester
by
Debra K. Sanborn
A dissertation submitted to the graduate faculty
in partial fulfillment of the requirements for the degree of
DOCTOR OF PHILOSOPHY
Major: Education (Educational Leadership)
Program of Study Committee: Daniel C. Robinson, Major Professor
Larry H. Ebbers Sharon K. Drake
Mack C. Shelley, II Loren W. Zachary
Iowa State University
Ames, Iowa
2013
Copyright © Debra K. Sanborn, 2013. All rights reserved.

ii
DEDICATION
This
dissertation
is dedicated to
Chad,
Delaney, and Deckard.

iii
TABLE OF CONTENTS
LIST OF TABLES .................................................................................................................. vii
LIST OF FIGURES ................................................................................................................. xi
ABSTRACT ............................................................................................................................ xii
CHAPTER 1. INTRODUCTION ............................................................................................. 1 Statement of the Problem .............................................................................................. 2 Purpose of the Study ..................................................................................................... 2 Research Questions ....................................................................................................... 4 Theoretical and Conceptual Framework ....................................................................... 5 Methodology ................................................................................................................. 8 Delimitations and Limitations ....................................................................................... 9 Significance of the Study ............................................................................................ 10 Definition of Terms ..................................................................................................... 11 Summary ..................................................................................................................... 11
CHAPTER 2. LITERATURE REVIEW ................................................................................ 12 Introduction ................................................................................................................. 12 Typological Models .................................................................................................... 12 Myers-Briggs Type Indicator ...................................................................................... 13 Elements of Psychological Type ................................................................................. 15 Extraversion and Introversion ......................................................................... 16 Sensing and Intuition ...................................................................................... 17 Thinking and Feeling ...................................................................................... 17 Judging and Perceiving ................................................................................... 18 Feeling and Perceiving .................................................................................... 19 Problem in Review ...................................................................................................... 20 Myers-Briggs Research Perspective ........................................................................... 22 Learning style .................................................................................................. 23 Type and learning style ................................................................................... 24 Type, academic success, and persistence ........................................................ 28 Summary ..................................................................................................................... 33
CHAPTER 3. METHODOLOGY .......................................................................................... 35 Overview ..................................................................................................................... 35 Research Questions and Hypotheses .......................................................................... 38 Research Design .......................................................................................................... 41 Setting ......................................................................................................................... 43 Population and Sample ............................................................................................... 43 Reliability and Validity ............................................................................................... 44 Creation of the Research Dataset ................................................................................ 45

iv
Study Variables ........................................................................................................... 46 Dependent ....................................................................................................... 46 Independent ..................................................................................................... 46 Data Analysis .............................................................................................................. 47 Ethical Considerations ................................................................................................ 48 Limitations .................................................................................................................. 50 Delimitations ............................................................................................................... 50 Summary ..................................................................................................................... 51 CHAPTER 4. RESULTS ........................................................................................................ 52 Overview ..................................................................................................................... 52 Design Classification .................................................................................................. 53 Analysis of Research Questions and Hypotheses ....................................................... 54 Student background characteristics ................................................................. 54 Gender ................................................................................................. 55 STEM major ........................................................................................ 57 High-school percentile rank, composite ACT score means, and standard deviations .................................................................. 57 Summary ............................................................................................. 58 Differences in Myers-Briggs preference by cohort year and for the total Population ........................................................................................... 59 Differences in Myers-Briggs preference by male or female by cohort year and for total population ....................................................................... 78 Research sample type preference comparison with base sample ........ 79 Male type preference compared with base sample ............................. 79 Female type preference compared with base sample .......................... 82 Male and female 2004 distribution compared with base sample ........ 84 Male and female 2005 distribution compared with base sample ........ 86 Male and female 2006 distribution compared with base sample ........ 89 Male and female 2007 distribution compared with base sample ........ 91 Male and female 2008 distribution compared with base sample ........ 93 Male and female 2009 distribution compared with base sample ........ 96 Male and female 2010 distribution compared with base sample ........ 98 Male and female 2011 distribution compared with base sample ........ 99 Differences in Myers-Briggs preference for students with STEM majors by cohort year and for total population ............................................. 102 Research sample STEM and non-STEM major type preference comparison ............................................................................ 103 STEM major type preference comparison with base sample ............ 105 Non-STEM major type preference comparison with base sample ... 106 STEM and non-STEM 2004 distribution compared with base Sample ................................................................................... 108 STEM and non-STEM 2005 distribution compared with base Sample ................................................................................... 110
v
STEM and non-STEM 2006 distribution compared with base sample ................................................................................... 112 STEM and non-STEM 2007 distribution compared with base sample ................................................................................... 114 STEM and non-STEM 2008 distribution compared with base sample ................................................................................... 117 STEM and non-STEM 2009 distribution compared with base sample ................................................................................... 119 STEM and non-STEM 2010 distribution compared with base sample ................................................................................... 121 STEM and non-STEM 2011 distribution compared with base sample ................................................................................... 123 Differences in academic aptitude of ACT and high school percentile rank and Myers-Briggs preference by cohort year and for research sample ............................................................................................... 126
Differences in first-semester grade point and Myers-Briggs preference by cohort year and for research sample ............................................ 134 Relationship of ACT, high school percentile rank, and Myers-Briggs
preference to first-semester grade point by cohort year and for research sample ................................................................................. 143
Multicollinearity and singularity ....................................................... 143 Models examining MBTI, ACT and percentile rank as variables to GPA ............... 145 Summary ............................................................................................................................... 154 CHAPTER 5. DISCUSSION ................................................................................................ 157 Findings ..................................................................................................................... 159 Majority of students in the study have ENFP preferences ............................ 160 Differing frequency of type preferences for male and female students ........ 161 ENFP most frequent type for STEM and non-STEM majors ....................... 162 Variances exist between ACT and class rank and Myers-Briggs preference .......................................................................................... 163 Variances exist between first semester GPA and Myers-Briggs preference 163 ENFP preference has negative impact for some students ............................. 164 Conclusions ............................................................................................................... 164 Implications for Practice ........................................................................................... 166 Limitations and Recommendations for Future Research .......................................... 168 Validity challenges ........................................................................................ 173 Summary ................................................................................................................... 174 APPENDIX A. HUMAN SUBJECTS APPROVAL ............................................................ 176
APPENDIX B. MBTI SAMPLE ITEMS ............................................................................. 176

vi
REFERENCES ..................................................................................................................... 178
ACKNOWLEDGMENTS .................................................................................................... 182

vii
LIST OF TABLES
Table 3.1 Population sample for each cohort year ................................................................... 45 Table 3.2. Variables, coding scale, and source file of the data ................................................. 47 Table 3.3 Research questions, variables, and method of analysis ........................................... 49 Table 4.1. Gender distribution of students who enrolled fulltime, fall 2004–fall 2011 ............ 56 Table 4.2. Learning community distribution of students in STEM majors, who enrolled fulltime, fall 2004–fall 2011 .................................................................................... 56 Table 4.3. High school percentile rank, composite ACT score means, and standard deviations of students who enrolled fulltime, fall 2004–fall 2011 .......................... 57 Table 4.4. Type distribution of research sample (N=775) and SRTT comparison with population norms from the 1998 MBTI manual ...................................................... 61 Table 4.5. Type distribution of 2004 cohort (N = 97) and SRTT comparison with population norms from the 1998 MBTI manual ...................................................... 64 Table 4.6. Type distribution of 2005 cohort (N = 96) and SRTT comparison with population norms from the 1998 MBTI manual ...................................................... 65 Table 4.7. Type distribution of 2006 cohort (N = 95) and SRTT comparison with population norms from the 1998 MBTI manual ...................................................... 67 Table 4.8. Type distribution of 2007 cohort (N = 96) and SRTT comparison with population norms from the 1998 MBTI manual ...................................................... 70 Table 4.9. Type distribution of 2008 cohort (N = 99) and SRTT comparison with population norms from the 1998 MBTI manual ...................................................... 72 Table 4.10. Type distribution of 2009 cohort (N = 100) and SRTT comparison with population norms from the 1998 MBTI manual ...................................................... 73 Table 4.11. Type distribution of 2010 cohort (N = 97) and SRTT comparison with population norms from the 1998 MBTI manual ...................................................... 75 Table 4.12. Type distribution of 2011 cohort (N = 95) and SRTT comparison with population norms from the 1998 MBTI manual ...................................................... 76
viii
Table 4.13. Male/female distribution of research sample (N = 775) and SRTT comparison with population norms from the 1998 MBTI manual .............................................. 80 Table 4.14. Male/female distribution of 2004 cohort (N = 97) and SRTT comparison with population norms from the 1998 MBTI manual .............................................. 85 Table 4.15. Male/female distribution of 2005 cohort (N = 96) and SRTT comparison with population norms from the 1998 MBTI manual .............................................. 87 Table 4.16. Male/female distribution of 2006 cohort (N = 95) and SRTT comparison with population norms from the 1998 MBTI manual .............................................. 80 Table 4.17. Male/female distribution of 2007 cohort (N = 96) and SRTT comparison with population norms from the 1998 MBTI manual .............................................. 92 Table 4.18. Male/female distribution of 2008 cohort (N = 99) and SRTT comparison with population norms from the 1998 MBTI manual .............................................. 94 Table 4.19. Male/female distribution of 2009 cohort (N = 100) and SRTT comparison with population norms from the 1998 MBTI manual .............................................. 97 Table 4.20. Male/female distribution of 2010 cohort (N = 97) and SRTT comparison with population norms from the 1998 MBTI manual .............................................. 99 Table 4.21. Male/female distribution of 2011 cohort (N = 95) and SRTT comparison with population norms from the 1998 MBTI manual ............................................ 100 Table 4.22. STEM and non-STEM distribution of research sample (N = 775) and SRTT comparison with population norms from the 1998 MBTI manual ........................ 104 Table 4.23. STEM and non-STEM distribution of 2004 cohort (N = 97) and SRTT comparison with population norms from the 1998 MBTI manual ........................ 109 Table 4.24. STEM/non-STEM distribution of 2005 cohort (N = 96) and SRTT comparison with population norms from the 1998 MBTI manual ........................ 111 Table 4.25. STEM/non-STEM distribution of 2006 cohort (N = 95) and SRTT comparison with population norms from the 1998 MBTI manual ........................ 113 Table 4.26. STEM/non-STEM distribution of 2007 cohort (N = 96) and SRTT comparison with population norms from the 1998 MBTI manual ........................ 115 Table 4.27. STEM/non-STEM distribution of 2008 Cohort (N = 99) and SRTT comparison with population norms from the 1998 MBTI manual ........................ 118

ix
Table 4.28. STEM/non-STEM distribution of 2009 cohort (N = 100) and SRTT comparison with population norms from the 1998 MBTI manual ........................ 120 Table 4.29. STEM/non-STEM distribution of 2010 cohort (N = 97) and SRTT comparison with population norms from the 1998 MBTI manual ........................ 122 Table 4.30. STEM/non-STEM distribution of 2011 cohort (N = 95) and SRTT comparison with population norms from the 1998 MBTI manual ........................ 124 Table 4.31. Cross tabulation means and standard deviations comparing ACT composite by MBTI for population, 2004-2011 .......................................................................... 127 Table 4.32. One-way ANOVA summary comparing the ACT composite by MBTI for research population and cohort years 2004-2011 .................................................. 129 Table 4.33. Summary of post hoc Tukey-Kramer HSD comparing research population ACT composite to the MBTI ................................................................................. 130 Table 4.34. Cross tabulation of means and standard deviations comparing percentile rank by
MBTI for the population, 2004-2011 ..................................................................... 132 Table 4.35. One-way ANOVA summary for each year, 2004-2011, and research sample for percentile rank compared to the MBTI ............................................................ 133 Table 4.36. Cross tabulation of means and standard deviations comparing first-semester grade point by MBTI for the research population and cohort years, 2004-2011 ... 136 Table 4.37. One-way ANOVA summary of each year, 2004-2011, and research sample for ACT composite in comparison to the MBTI .................................................... 137 Table 4.38. Summary of post hoc Tukey-Kramer HSD comparing first semester grade point to MBTI .............................................................................................. 139 Table 4.39. Contingency table analysis comparing Myers-Briggs preference to 2.0 grade point ....................................................................................................................... 140 Table 4.40. Contingency table analysis comparing 2005 cohort Myers-Briggs preference to 2.0 grade point ................................................................................................... 141 Table 4.41. Multiple regression of MBTI, ACT composite, and percentile rank for first- semester grade point for research sample, ascending R2 ....................................... 146 Table 4.42. Summary of regression analysis model for variables with significance predicting students’ first semester grade point for the research population .......... 146

x
Table 4.43. Summary of regression analysis model for variables with significance predicting students’ first semester grade point, 2004 cohort (N = 97) ................... 148 Table 4.44. Summary of regression analysis model for variables with significance predicting students’ first semester grade point, 2005 cohort (N = 96) ................... 149 Table 4.45. Summary of regression analysis model for variables with significance predicting students’ first semester grade point, 2006 cohort (N = 95) ................... 149 Table 4.46. Summary of regression analysis model for variables with significance predicting students’ first semester grade point, 2007 cohort (N = 96) ................... 150 Table 4.47. Summary of regression analysis model for variables with significance predicting students’ first semester grade point, 2008 cohort (N = 99) ................... 151 Table 4.48. Summary of regression analysis model for variables with significance predicting students’ first semester grade point, 2009 cohort (N = 100) ................. 151 Table 4.49. Summary of regression analysis model for variables with significance predicting students’ first semester grade point, 2010 cohort (N = 97) ................... 152 Table 4.50. Summary of regression analysis model for variables with significance predicting students’ first semester grade point, 2011 cohort (N = 95) ................... 152

xi
LIST OF FIGURES
Figure 4.1. Euler diagram of student group classifications, illustrating variable relationship categories among students ............................................................. 55

xii
ABSTRACT
This research examined aspects of Myers-Briggs® preferences and academic success
in the first college semester. Academic aptitude as measured by precollege characteristics of
ACT and class rank, academic performance during the first semester of college, and Myers-
Briggs preference were analyzed for their significance within a learning community at a
Midwest research university. Academic performance and Myers-Briggs preference were
compared between students based upon grade point success in the first semester, fall 2004 to
fall 2011. Statistical analyses were completed to determine if there is a relationship between
type preference and academic success. ENFP, the preference for Extraverted Intuition with
Feeling and Perceiving, was the most frequent type preference for students in the sample.
ENFP was found to negatively relate to first-semester grade point for the research population
and two cohorts. Identifying a trend toward specific type preferences related to academic
achievement may provide support for the student population and enhance retention
interventions.

1
CHAPTER 1. INTRODUCTION
Student development theory helps one to understand differences among students who
are considering higher education. Understanding differences of psychological type and how
type pertains to learning style of students may also enhance student success. The assessment
of psychological type is based on the theory that human behavior is not random and that
patterns of mental functions exist in the population (Jung, 1971). Following this conceptual
foundation, the Myers-Briggs Type Indicator® (MBTI®) has become the most widely used
instrument for determining type preferences in business, personal coaching, and on college
campuses.
Psychological type assessment can been helpful to enable the detection of
interpersonal roadblocks and miscommunication related to type preferences, particularly for
students in the transition from high school to college. Hunter (2006) posited that “attention
to student characteristics, needs, behaviors, and experiences is central to creating and
sustaining successful transition initiatives” (p. 9). Through intentional examination of type
distribution and type theory related to learning preferences, opportunities emerge for
enabling students to understand more about themselves in the college transition.
During the past four decades, Myers-Briggs® type theory and the Myers-Briggs
assessment have became well known and widely utilized in a variety of education and
business settings. The accurate and ethical application of type theory has considerable value
for practitioners and research in many topic areas (Evans, Forney, Guido, Patton, & Renn,
2010; Hammer, 1996; VanSant, 2003; Stricker, Schiffman, & Ross, 1965).

2
Statement of the Problem
Specific, consistent differences in learning style personality temperament are
represented in typological theory (Robinson & Taylor, 2003). Although typological theories
of student development are helpful to understand characteristics unique to the individual
student, they are not able to explain individual changes or beliefs.
Myers-Briggs profile assessments collected from students during a first-year seminar
course were informally analyzed and sorted for a review of academic success and persistence
in the cohort. Through this process, it was discovered that the student population had
specific over-represented type preferences for two Myers-Briggs preferences in comparison
to national samples. An additional area of comparison was made of Myers-Briggs
preferences for students who had not achieved a 2.0 grade point average in the first semester
that also revealed over-represented type preferences. A disproportionate number of students
with the over-represented type preferences was also revealed to be withdrawing from the
institution prior to completing a degree. These circumstances suggest that psychological type
preferences could be a variable relating to student success for this student cohort within their
university. Additionally, if additional analysis of preference anomalies could be found as a
variable affecting academic success, then perhaps steps could be taken to positively enhance
the educational experience of students with these type preferences.
Purpose of the Study
Psychological type assessment can been helpful in detecting interpersonal roadblocks
and miscommunication related to type preferences, particularly for students in the transition
from high school to college. Through intentional examination of type distribution and type
3
research related to learning preferences, opportunities emerge to enable students to
understand more about themselves during the college transition.
Kalsbeek (1986, 2003) reported use of a tracking tool that aids universities in
reviewing Myers-Briggs data in comparison with available student data to provide a research
base for retention strategies. The study revealed that certain Myers-Briggs preferences were
significant in their influence on first semester grades. Type data were also found to correlate
with entering student profiles based on reasons for attending college, performance on college
admission standardized tests, and first-term academic achievement. The goal of the current
research was to reproduce portions of Kalsbeek’s study related to academic aptitude and
grade point correlation with Myers-Briggs preferences for a similar student sample. As
student retention and performance are important issues for all colleges and universities who
wish to recruit and graduate students, this study could aid in determining if students with
specific type preferences have more academic difficulty in their path to a college degree and,
if so, identify steps to ease this challenge.
This study examined whether student Myers-Briggs preferences correlate to academic
success in the first college semester. Descriptive and inferential statistics, and standard
multiple regression were used to analyze the relationship between first semester grade point
and variables of gender, STEM major, and academic aptitude. Ideally, this information will
provide introduction to further research for the use of type in early identification of students
requiring academic intervention.
4
Research Questions
If student type preferences and learning styles can be defined as incongruent to
institutional culture, lack of engagement may occur. As academic disengagement is a major
factor behind a decline in grades (Keup, 2006), identifying trends for academic success
related to psychological type that could be useful for student development.
The objective of this study was to investigate the collected type preferences for a
student group to analyze type preference distributions, learning style, and potential effects of
type on academic success in the first college semester. The following research questions
outlined the study:
1. What are the academic demographics of the students in the study, including academic
aptitude (ACT and high school class rank) and first-semester grade point average?
2. Are there statistically significant differences in Myers-Briggs preferences for students
in the study by each cohort year and for the research population in comparison to the
distribution of a national sample?
3. Are there statistically significant differences in Myers-Briggs preferences by gender
for students in the study by each cohort year and for the research sample in
comparison to the distribution of a national population?
4. Are there statistically significant differences in Myers-Briggs preferences for students
with STEM majors by each cohort year and the research population in the study in
comparison to the distribution of a national population?
5. Are there statistically significant differences in academic aptitude of ACT and high
school class rank and Myers-Briggs preference for students by each cohort year and
for the research population in the study?
5
6. Are there statistically significant differences in academic aptitude and Myers-Briggs
preference for students in the study by grade point and ability to achieve a 2.00 grade
point in the first college semester by each cohort year and for the research
population?
7. Is there a correlation of ACT, high school class rank, or Myers-Briggs preference to
first semester grade point by each cohort year and the research population?
These questions guided this quantitative study to assess perceived effects of type and
learning style. Combined with measures of academic aptitude, the results of this study could
aid student academic progress and persistence.
Theoretical and Conceptual Framework
Typological models of student development can be used to explain differences of
psychological type and how these differences affect student success. Three common
typological models of student development include: Holland’s Person-Environment Theory,
Kolb’s Theory of Experiential Learning, and the Myers-Briggs Type. Although typological
models cannot explain individual changes or beliefs, they are useful for understanding
differences and characteristics unique to each student and how these differences may
influence student development and academic success.
Holland’s (1997) Person-Environment Theory typological model seeks to explain
vocational behavior and suggests that our culture allows persons to be categorized by
personality type. Kolb’s (1984) Theory of Experiential Learning arranges individuals
according to a learning style model based upon how they learn and develop.

6
The basic premise of Myers-Briggs type is that individuals can have different
motivations and processes for getting through the day, but they will follow certain polar
configurations. The preference pairs include where a person gets his or her energy,
categorized as Extraversion and Introversion; how an individual takes in information or
Sensing and Intuiting; the decision-making process of Thinking and Feeling; and the
orientation to and organization in the outer world of Judging and Perceiving. Individuals use
each aspect of the personality pairs daily, but have a preference for one that is more
comfortable or useful to the self.
There is substantial literature related to the typology theoretical framework and
academic success variables related to student Myers-Briggs preferences. As student retention
and performance are important issues for all colleges and universities, this review may aid in
determining if students with specific type preferences have more academic difficulty in their
path to a college degree and, if so, identify steps to ease this challenge.
In a conceptual framework of this research, it is import to reflect the dichotomies of
psychological type in consideration to learning styles and influences of academic success.
Learning style is important to the composition of student success in college (Chesborough,
2005; 2009; DiTiberio & Hammer, 1993). Learning style can be described as the different
ways a student will approach critical thinking and the assimilation of new information or how
they process information. Although learning style is fairly consistent for most individuals, it
can be enhanced with usage, and developed by individual strengths that contribute to student
understanding (Evans et al., 2010).
Lawrence (2009) defined four learning styles and dispositions of learning related to
psychological type preferences. Cognitive style is the preferred function or pattern for
7
information processing. Attitude and interest patterns affecting the participation in learning
are the second aspect of learning style. A disposition to seek learning environments that
match interests is the third aspect, while a disposition to successfully use learning tools
completes the quadrant.
The Myers-Briggs indicator, although not an identifier of physical trait learning, is
beneficial in that it assesses learning preferences and processes rather than the learning
behaviors of most learning style inventories (Jensen, 2003). Jensen described the Myers-
Briggs as the most comprehensive assessment of learning style assessments attributing to
instrument norming, length of development time, and sixteen specific approaches to student
learning.
In an examination of 107,000 college students enrolled in 59 college majors,
Schaubhut and Thompson (2011) created a Myers-Briggs type table summary information
from a comparison to a database collection of all fulltime college students completing the
assessment. They posited that an understanding of psychological type preference may be
helpful for students as they plan their academic and institutional choices.
Allen (2007) addressed the debate of whether to measure learning or the learner by
suggesting that psychological type can be used to enhance learning strategies and incorporate
learning style into the demands of learning. Following two decades of research within a
community college study skills center, Allen hypothesized that students learn the same way
they think. As thinking is a concept of psychological type, then learning – like thinking – is,
therefore, innate.
The evolution of student learning and expectations has demonstrated opportunities for
learning style development and teaching growth. Erickson and Strommer (2005) posited that
8
research university models of creating and delivering knowledge do not successfully address
the learning styles of current students. They encouraged educators to incorporate small
group discussion, personal writing exercises, case studies, problem-based learning, and
experiential learning to meet student learners where they are in the classroom.
An understanding of psychological type as made available by the Myers-Briggs can
be a mechanism for assisting students and college administrators to understand learning and
student success in various post-secondary institutions. As university cultures are wide and
varying, establishing student fit within that culture through use of Myers-Briggs is one
method for enhancing student satisfaction and progress to graduation.
Methodology
A quantitative inquiry using secondary data was employed to investigate the
questions in this study. Descriptive and inferential statistics were used to examine Myers-
Briggs profile assessments in comparison with student and institutional data for academic
aptitude and first-semester grade point. The study was structured as quasi-experimental time
series design in that measures of the student cohort were collected before and after the
assessment (Creswell, 2009). The Myers-Briggs instrument (Form M) was collected from
794 first-semester freshmen at a Midwest research university. Students were sorted by age
for inclusion in the study and a population sample was reviewed for type preferences. The
assessment was given as a complement to a first-year seminar course lecture related to
learning style. Students were classified as in-state resident students in undergraduate majors
throughout six colleges. Although each achieved regular admission to the university, they
differed in range of high school rank and ACT scores. An additional comparison was made
9
of Myers-Briggs preferences for students with less than a 2.0 grade point in the first
semester.
A distribution of Myers-Briggs Learning Styles for the full student cohort and less
than 2.0 grade point cohort were developed for measure against the percentage distribution of
a U.S. sample. To compare the means for learning style and academic aptitude through
ACT, an analysis of variance (ANOVA) was utilized for the full cohort and less than 2.0
group. Finally, a multiple regression was implemented for the variables of class rank, ACT,
first-semester grade point, and preference for the research sample and each cohort group.
Regression models are valuable as they help to determine how variables are related to each
other to understand their relationship (De Veaux, Velleman, & Bock, 2012).
Delimitations and Limitations
This study was designed to capture data for an identified group of students at this
university; thus, it should be carefully interpreted before comparison to other student groups
or institutions. The student cohort was deemed of sufficient sample size to address the data,
but may not be representative of the student population based upon demographic and
socioeconomic status. Limitations of this study include the structure of the Myers-Briggs as
a self-reporting instrument. The assumption was made that the respondents were of normal
mental health and objectively reported their preferences when completing the assessment.
Additionally, as respondents were asked to complete the Myers-Briggs assessment as part of
a first-year seminar assignment on learning styles as opposed to self-selecting to complete
the instrument, an assumption was made that the respondents objectively reported their
preferences and were not influenced by the assignment directive.
10
Significance of the Study
Macdaid (2003) designated type practitioners and educators regularly using the
Myers-Briggs as able and obligated to contribute to the data and research of the instrument.
Each collection of descriptive data or hypothesis testing adds to the body of literature
supporting the reliability and validity of the Myers-Briggs. Macdaid suggested type
distribution, correlations, differences, and case studies as solid areas for initiating and
contributing to type research.
Comparisons of Myers-Briggs preferences for students who are not able to achieve a
2.0 grade point average and who may be withdrawing from an institution prior to completing
a degree may offer insight to improving student success. These circumstances define the
potential hypothesis that psychological type preferences are a variable to success for this
student cohort within the university.
There is evidence that statistical analysis of type distributions for a specific
population may help identify whether Myers-Briggs preferences correlate to student
academic difficulty in the first college year. The review of the literature supports that type
preferences, particularly preferences for perceiving, may have an effect on student academic
progress and that identification and understanding of these preferences may assist in
compensating for student learning differences. Type theory reveals that preferences are not
related to ability or motivation. As such, identifying a trend toward specific type preferences
in participants who are not successful in the first college year may provide analysis pertinent
to the participant population in the research.
Preferences of psychological type are equal in their validity and strength to the
individual and no type is of more advantage than another. This research sought to confirm
11
these questions with a goal to develop adaptive programming aimed at increasing student
success.
Definition of Terms
This section defines frequent terminology used in this study and the assessment of
measurement.
Academic aptitude: The term to explain the academic demographic first-year students bring
to the university based upon their ACT standardized test score and high school class rank.
MBTI®: The psychological assessment instrument administered to measure an individual’s
Myers-Briggs preferences. It is a registered product of Consulting Psychologists Press
(CPP), Inc.
Myers-Briggs®: Defines the preferences measured by the MBTI® instrument. Denotes the
authors of the assessment, Katharine Briggs and Isabel Briggs Myers. It is a registered
trademark of the MBTI® Trust, Inc.
Summary
This study builds on prior research to add to the knowledge of whether Myers-Briggs
preferences and academic aptitude correlate to academic success in the first college semester.
Chapter 2 summarizes the literature on the benefits and usage of Myers-Briggs for
understanding individual learning style. Chapter 3 presents the quantitative methodology and
methods used for designing and conducting this study. Chapter 4 provides the descriptive
and inferential results of the study. Finally, Chapter 5 summarizes the research results, and
provides conclusions and recommendations for future research, practice, and policy.
12
CHAPTER 2. LITERATURE REVIEW
Introduction
As student development theory helps one to understand differences in students served
in higher education, typological models of student development can be used to explain
differences of psychological type and how these differences affect student success.
Typological models do not explain individual changes or beliefs, but are useful for
understanding individual differences and characteristics unique to each student and how
these differences may influence student development and academic success. These models
are also helpful in describing interpersonal interactions and can be employed in designing
educational experiences, team building, training, conflict management and leadership
functions (Evans, Forney, Guido, Patton, & Renn, 2010). Four common typological models
complementing student development include: (a) the Strong-Cambell Interest Inventory; (b)
Holland’s Person-Environment Theory; (c) Kolb’s Theory of Experiential Learning; and (d)
the Myers-Briggs Type Indicator.
Typological Models
Campbell, Borgen, Eastes, Johansson, and Peterson (1968) expanded elements of the
Strong Interest Inventory to enable a clearer explanation and usage of typological interest
inventories in daily application. Their longitudinal study included test-retest measures of two
population samples over multiples years to demonstrate that vocational inventories can also
be descriptive of the individual. Campbell and Holland (1972) investigated a merging of
vocational inventories with personality types and found that rankings on the Strong
Vocational Interest Blank corresponded with the personality scales models set forth by
13
Holland. The Holland personality scale provides a general framework of the individual while
the vocational inventory measures strengths allowing a much more individualized view of the
subject (Cambell & Holland, 1972). Campbell later became a coauthor of the Strong-
Campbell Interest Inventory.
Holland’s (1997) Person-Environment Theory as a typological model seeks to explain
vocational behavior and suggests that our culture enables persons to be categorized by
personality type. The instrument based on Holland’s theory identifies characteristics and
behaviors to define six personality types based upon a 66-item survey. Holland posited that
if an individual then chooses a career or work environment that is similar to his or her
personality type and values, then he or she is more likely to be successful and satisfied in
their endeavor.
Kolb’s (1984) Theory of Experiential Learning arranges individuals according to a
learning style model based upon how they learn and develop. The Kolb assessment is a 12-
item self-scoring instrument that helps a participant to understand preferred learning style
and approaches to problems, conflict and communication. The Kolb model is best known for
its four learning styles: Accommodating, Assimilating, Converging, and Diverging, but is a
developmental theory in that it explains the stages and complexity through which individual
development occurs (Evans et al., 2010).
Myers-Briggs Type Indicator
The Myers-Briggs Type Indicator (MBTI) is the most widely used instrument for
determining psychological type preferences utilized in business and personal coaching and
has common usage on the college campus. The 93-item Form M instrument is the most

14
frequently used assessment of the MBTI battery. The assessment is based upon the theory
that human behavior is not random and that innate patterns of mental functions exist in the
population (Jung, 1971). The basic premise of type is that individuals can have different
motivations and processes for getting through the day, but that they will follow certain
configurations. The MBTI instrument was conceived by the mother-daughter team of
Katherine Briggs and Isabel Briggs Myers with the foundation of Jung’s orientation and
organization to the outer world, or judging and perceiving preferences (Myers, 1980). Briggs
and Myers designed the original assessment to guide individuals in understanding the “value
of differences” (Myers, p. 201). The MBTI asks a series of self-report forced-choice
questions (Appendix B) to define opposing preferences for personal energy, acquiring
information, making decisions, and organizing one’s world. Based upon responses to these
questions, an individual is assigned a type preference for each pair of opposites which when
combined will become one of sixteen distinct four-letter type codes. When assessing
psychological type, proper facilitation requires that an individual is encouraged to determine
their best-fit type, accepting that environment, academics, and self-knowledge may influence
this best fit.
Psychological type assessment can been helpful in allowing the detection of
interpersonal roadblocks and miscommunication related to type preferences, particularly for
students in the transition from high school to college. Hunter (2006) posited that “attention
to student characteristics, needs, behaviors, and experiences is central to creating and
sustaining successful transition initiatives” (p. 9). Through intentional examination of type
distribution and type theory related to learning preferences, opportunities emerge for
enabling students to understand more about themselves in the college transition. Although
15
the MBTI is not designed to be a predictor, examining type distributions and preference
anomalies to enhance student services and resources may lead to increased student success
and progress toward degree.
During the past four decades, Myers-Briggs type theory and the MBTI have became
well known and widely utilized in a variety of education and business settings. As MBTI
popularity has grown, misinterpretation and misuse of the assessment by untrained
individuals and in easily accessible unmeasured online formats has also increased.
Regardless of these challenges, the accurate and ethical application of type theory has
considerable value for practitioners and research in many topic areas (Evans, Forney, Guido,
Patton, & Renn, 2010; Hammer, 1996; VanSant, 2003). Substantial critiques of Myers-
Briggs theory including assessments of reliability, validity, and factor analysis support its
value (Capraro & Capraro, 2002; Pittenger, 2005; Reynierse & Harker, 2005; Stricker,
Schiffman, & Ross, 1965).
Elements of Psychological Type
There are four MBTI type dichotomies, or opposite preference pairs, and each has a
different influence on learning. The word preference is used to refer to the innate tendency
one has in each of the psychological dichotomies (Myers, 1980). The principle of preference
is frequently illustrated in type facilitations by asking participants to write their signature
with their non-dominant hand. Generally, participants will describe this exercise as
awkward, uncomfortable, or not a preferred activity, but one they are able to complete. Just
as an individual has a preferred hand for writing, each individual also has a preference for
daily functions, but is able to operate out of preference, as needed. The preference pairs
16
include where a person gets their energy, categorized as Extraversion and Introversion; how
an individual takes in information or Sensing and Intuiting; the decision-making process of
Thinking and Feeling; and the orientation to and organization in the outer world of Judging
and Perceiving. Individuals use each aspect of the personality pairs daily, but have a
preference for one that is more comfortable or useful to the self. As addressed previously, an
individual is assigned a type preference for each pair of opposites which, when combined,
create 16 individual four-letter type codes.
Extraversion and Introversion
Extraversion and Introversion are expressions of where an individual gathers personal
energy. Extraversion (E) is the energy that develops from engaging with people, objects and
events. Externally expressing interests and interacting with others is invigorating for
extraverts. Extraverts learn best in situations that include movement, action and
conversation, and prefer to connect theories and facts with personal experience. Introversion
(I) is a reflective, inward coordination with thoughts and ideas. Introverts look internally for
thoughts and energy. They think best in quiet or solitude and prefer advance notice before
sharing or acting in a learning situation.
Dunning (2008) encouraged Extraverts to practice active listening and reading
strategies to remain focused in lectures or while studying. Study and discussion groups are
particularly helpful for students with this preference, although Extraverts may wish to limit
questions or comments so that everyone in a group has an opportunity to participate.
Introverted preference students should find time to think and study in quiet, uninterrupted
locations so that they may process information. When possible, Introverts should seek

17
agendas and other information in advance in order to think things through before responding.
As Introverts can be viewed as quiet and unengaged, Dunning encouraged these students to
use “nonverbal cues to demonstrate participation” (p. 17) while engaging in group processes.
Sensing and Intuition
Sensing and Intuition are the functions for attaining information. The Sensing (S)
perception is the process of awareness and accumulating information through the physical
senses. Sensing is a pragmatic function relying on details, sequenced lists, and consistency.
Sensors learn best with sequential learning from concrete to abstract and tend to excel at
memorization. The Intuitive (N) perception is future oriented and uses hunches and sees
possibilities to provide explanations. Intuitive preference persons value patterns and abstract
ideas and learn through imaginative tasks and theoretical topics with ease.
Sensing preference students learn best by summarizing subject matter; finding
practical application for big picture ideas or themes; and “creating specific, short-term
learning goals” (Dunning, 2008, p. 18). Students who prefer Intuition can increase detail
oriented fact retention with flash cards or summarized outlines and should focus on
supporting facts with ideas and connections when writing or making presentations. Intuitive
types must “avoid being distracted by tangentially related information” (p. 19) and can
enhance their learning by focusing on the specifics required of academic assignments.
Thinking and Feeling
Thinking and Feeling are the decision-making or judgment processes of type.
Thinking (T) is the objective decision-making process that uses specific standards to analyze
information or situations and then improve the situations or performance. Thinking
18
preference individuals are motivated in learning by logic and respect for their competence.
The Feeling (F) decision-making preference is more subjective and based upon personal
values for accommodating harmony and the improvement of personal conditions for others.
Individuals with Feeling preference are motivated in learning by personal encouragement,
values and the human dimension of a topic or lesson.
The logical and analytical Thinking preference student seeks credible reasoning.
Dunning (2008) encouraged this student to take the time to create questions and comments
without debating over topics and issues. As the Thinking preference generally relies on
critique rather than appreciation, listening and understanding are helpful for the learning
processing of this student. Dunning noted that students with a preference for Feeling achieve
the most from learning when it validates their individual perspective. Feeling preference
students are most successful when they are encouraged and supporting in their learning.
Judging and Perceiving
Judging (J) is the process of engaging with the outer world preferring organization,
structure, and a planned life. Those preferring Judgment tend to experience time in specific
segments. They are driven to seek closure or finish tasks in those specific time periods.
Judging preference learning thrives on task completion, structured learning and specific
goals. The Perceiving (P) preference values autonomy, flexibility and spontaneity. They
experience time as an uninterrupted flow and are open to new information as they experience
and process. They prefer open learning environments that rely less on deadlines and
structure.
19
The student with a Judging preference is frequently eager to get things completed.
Dunning (2008) suggested that students with this preference should avoid open and over-
scheduling, making decisions too quickly, and should “plan for inevitable interruptions to
minimize academic stress” (p. 22). The openness of the learning schedule for the Perceiving
preference student be a challenge if essential time is not available for a student to do the
work required. Dunning advised the Perceiving student to recognize his or her flow
approach to learning, but to allow for structure and organization as required.
Feeling and Perceiving
The student population prompting this research and literature review had over-
represented type preferences for Feeling and Perceiving in comparison to national samples.
There are four MBTI types that encompass the Feeling and Perceiving preferences, ISFP,
ESFP, INFP and ENFP. Nardi (2001) described persons with Introversion, Sensing, Feeling
and Perceiving (ISFP) and Extraverted, Sensing, Feeling and Perceiving (ESFP) as
experiential and improvisational. Students with these preferences like to see the big picture
early in a learning concept so that they may decide relevancy. They appreciate respect in the
classroom and appreciate being able to ask questions to clarify learning. The ISFP and ESFP
appreciate immediate feedback and most enjoy learning in the context of how it will help
them accomplish a task or help others. They learn best when the content is challenging but
fun, allowing “the freedom and independence to explore” (p. 25).
The Introverted, Intuitive, Feeling, Perceiving (INFP) and Extraverted, Intuitive,
Feeling, Perceiving (ENFP) persons were recognized by Nardi (2001) as being perceptive
and inspirational. They respond easily to others’ behaviors or emotions and are able to

20
mediate communication and meanings in relationships. The INFP and ENFP learn most
efficiently when there is connection to their values and personal experiences. They seek
meaning and goals in learning and achievement and learn best through self-discovery and
personal development. The INFP and ENFP students appreciate authentic and encouraging
feedback and want to be “recognized for the unique perspective they bring to an assignment
or task” (p. 37).
Problem in Review
MBTI profile assessments taken during a first-year seminar course guide this interest
in whether knowledge of type can be asset to student success. The MBTI instrument (Form
M) was administered to approximately 800 entering first-year students at Iowa State
University. The assessment was a complement to a first-year seminar course lecture related
to learning style. The resulting profiles, collected by this researcher over an eight-year
period, were informally analyzed and sorted for a review of academic success and persistence
in the cohort. Through this process, it was discovered that the student population had
specific over-represented type preferences for Feeling and Perceiving in comparison to
national samples. An additional area of comparison was made of MBTI preferences for
students who had not achieved a 2.0 grade point average in the first semester. From the
collected profiles, 110 students with less than a 2.0 in the first semester were grouped
according to personality type. Consequently, there were a higher number of students from
this less than 2.0 group with the over-represented type preferences for Feeling and
Perceiving. A disproportionate number of students with the Feeling and Perceiving
preferences were also found to be withdrawing from the institution prior to completing a
degree. These circumstances suggested the possibility that psychological type preferences

21
could be a variable relating to student success for this student cohort within their university.
Additionally, it was suspected that if preference anomalies could be found to be a variable
affecting academic success, then perhaps steps could be taken to positively enhance the
education experience of students with these type preferences. Maxwell (2005) defined this
generation of theory from data as grounded theory methodology. Grounded theory, first
defined by Glaser and Strauss (1967), is a reverse of traditional research in that data
collection inductively drives the hypotheses questions.
Utilizing the collected type preferences for the cohort group, the following research
questions framed this study:
1. What are the academic demographics of the students in the study, including academic
aptitude (ACT and high school class rank) and first-semester grade point average?
2. Are there statistically significant differences in Myers-Briggs preferences for students
in the study by each cohort year and for the research population in comparison to the
distribution of a national sample?
3. Are there statistically significant differences in Myers-Briggs preferences by gender
for students in the study by each cohort year and for the research sample in
comparison to the distribution of a national population?
4. Are there statistically significant differences in Myers-Briggs preferences for students
with STEM majors by each cohort year and the research population in the study in
comparison to the distribution of a national population?
5. Are there statistically significant differences in academic aptitude of ACT and high
school class rank and Myers-Briggs preference for students by each cohort year and
for the research population in the study?

22
6. Are there statistically significant differences in academic aptitude and Myers-Briggs
preference for students in the study by grade point and ability to achieve a 2.00 grade
point in the first college semester by each cohort year and for the research
population?
7. Is there correlation of ACT, high school class rank, or Myers-Briggs preference to
first semester grade point by each cohort year and the research population?
Although ability and motivation are primary factors influencing student academic
success, an understanding of the impact of type preferences can assist services for all
students. If a student’s type preferences and learning styles as defined by type are
incongruent to institutional culture, lack of engagement may occur. As academic
disengagement can lead to distraction and lack of motivation, major factors behind a decline
in grades (Keup, 2006), identifying trends for academic success related to psychological type
could be useful for student development.
This literature review sought information related to the aforementioned theoretical
framework and whether academic success and academic progress variables may relate to
student MBTI preferences. As student retention and performance are important issues for all
colleges and universities who wish to recruit and graduate students, this review may aid in
determining if students with specific type preferences have more academic difficulty in their
path to a college degree and, if so, identify steps to ease this challenge.
Myers-Briggs Research Perspective
As mentioned previously, Macdaid (2003) designated type practitioners and educators
utilizing the Myers-Briggs assessment as responsible to contribute to the data and research of
23
the instrument. Each collection of descriptive data or hypothesis testing adds to the body of
literature supporting the reliability and validity of the MBTI. Macdaid suggested type
distribution, correlations, differences, and case studies as solid areas for initiating and
contributing to type research.
Myers, McCaulley, Quenk, and Hammer (1998) indicated that type distribution tables
are the basic method for reporting MBTI information on groups and that the descriptive
information of the type table provides evidence of construct validity. Type distributions are
most commonly analyzed through the self-selection ratio type table, or SRTT, (McCaulley,
1985). Self-selection ratio type tables are used to determine the frequency of a type in
comparison to a base population and provide a measurement of the overrepresentation or
underrepresentation of a type preference for a group.
Learning style
In a conceptual framework of this research, it is import to reflect the dichotomies of
psychological type in consideration to learning styles and influences of academic success.
Learning style is important to the composition of student success in college (Chesborough,
2005; 2009; DiTiberio & Hammer, 1993). Learning style can be described as the different
ways a student will approach critical thinking and the assimilation of new information or how
they process information. Although learning style is fairly consistent for most individuals, it
can be enhanced with usage, and developed by individual strengths that contribute to student
understanding (Evans et al., 2010). Differences in attentional processing such as absorbing
the big picture as opposed to small bites of information, encoding strategies, or the

24
organizing of information and self-regulation of learning, can be contributing factors in
diverse learning styles (Svinicki, 2004).
Lawrence (2009) defined four styles and dispositions of learning related to
psychological type preferences. Cognitive style is the preferred function or pattern for
information processing. Attitude and interest patterns affecting the participation in learning
are the second aspect of learning style. A disposition to seek learning environments that
match interests is the third aspect, while a disposition to successfully use learning tools
completes the quadrant. Lawrence advised that although a student’s learning strategies and
behaviors may be required to change from situation to situation, their type preferences do not
change and “aspects of learning style that are a reflection of one’s type can be expected to
persist across situations” (p. 39). Lawrence defined these learning preferences as aligned
with MBTI type preferences or the mental processes of type theory. He suggested that the
sixteen individual types are also sixteen methods of mental processing, each with individual
strengths, and all with value for the individual learner.
Type and learning style
Identifying a correlation of MBTI preferences as a gauge of academic success in
college requires a review of literature within the framework of MBTI usage and examination
among college students. Academic success in the first college semester is widely believed to
affect the eventual success or graduation of the new college student. Tinto (1975) suggested
that a necessary factor in this success for the college student is finding out whether an
institution fits their needs allowing them to become integrated into the campus culture.
College students will frequently adapt to the education culture of an institution to find
25
success (Pascarella & Terenzini, 2005). It is this integration function that can determine
whether a student continues toward a degree and is retained by a college or university.
The MBTI indicator, although not an identifier of visual, auditory, and kinesthetic
learning styles is beneficial in that it assesses learning preferences and processes rather than
the learning behaviors of most learning style inventories (Jensen, 2003). Jensen described
the MBTI as the most comprehensive assessment of learning style assessments attributing to
instrument norming, length of development time, and sixteen specific approaches to student
learning. He asserted that as the MBTI is a personality type assessment, and type is generally
static, it is more useful than learning style assessments for measuring student behavior or
performance which may fluctuate, dependent upon the learning experience. As institution
type and instructor type preferences can frequently differ from student type preferences, an
understanding of type theory can assist educators and learners in goals of student success.
Jenson encouraged instructors not to abandon their preferred teaching styles but instead to be
more flexible in how they teach, augmenting lecture with class discussion, adding theoretical
discussion to facts and figures, and “allowing for unstructured learning when applicable,” (p.
133).
In an examination of 107,000 college students enrolled in fifty-nine college majors,
Schaubhut and Thompson (2011) created MBTI type table summary information from a
comparison to a database collection of all fulltime college students completing the MBTI.
They noted that an understanding of psychological type preference may be helpful for
students as they plan their academic and institutional choices. Although students should not
choose a major or a university on the basis of type alone, assessing an academic environment
in relation to MBTI preferences is a useful tool for post-secondary education planning.
26
Schaubhut and Thompson suggested that instructors and educators may also find usefulness
in examining the type preferences of students in specific majors to become more
synchronized with the learning styles of students choosing those programs.
Alaoutinen, Heikkinen, and Porras (2012) studied computer science students at
Finnish and Egyptian universities enrolled in a five-day intensive computer-coding course.
Students were identified by learning style and assessed for satisfaction with learning
following the course and found that introverted, reflective (I) and intuitive, big picture (N)
learners did particularly well in the intensive education format. Alaoutinen et al. suggested
that, although intensive courses with group work are common, they are not widely used and
their focus on collaboration may be of advantage to some learners.
Differences were found among personality style for Swiss university students in the
visual arts, music, and psychology as examined by Haller and Courvoisier (2010). Mean
scores found psychology and music students as more extraverted while visual arts students
were identified as more introverted. Haller and Courvoisier suggested that creative students
have a different personality and thinking style and that some areas of study seem to require
different personality profiles. This is valuable information for students in that it
demonstrates a tendency to choose a field of study that fits individual strengths and
personality. The challenge then becomes when students with less self-knowledge self-select
into fields of study that do not match their strengths.
Allen (2007) addressed the debate of whether to measure learning or the learner by
suggesting that psychological type can be used to enhance learning strategies and incorporate
learning style into the demands of learning. Following two decades of research within a
community college study skills center, Allen hypothesized that students learn the same way
27
they think. As thinking is a concept of psychological type, learning, like thinking, is
therefore innate. By comparing the preference pairs to learning taxonomy, Allen
demonstrated elements of type preferences and different learning styles by linking them to
concrete and abstract thinking. By focusing on how to assist students in the full use of their
individual type preferences, Allen illustrated that educators can meet individual learning
needs and encourage learner growth.
In a study of MBTI influences connected to social work student learning style,
Chesborough (2009) found an overrepresentation of Extroverted Sensing students that was
contrary to an earlier collection of type data for social workers that demonstrated more
Introverted Intuiting preferences. Chesborough asserted that as many prior social workers
become social work educators, conflicts in instructional and learning styles may occur in the
classroom and that an understanding of type could assist in the educational success of social
work students. As instructors cannot consistently teach to individual type preferences,
Chesborough recommended matching students for study and discussion groups based on type
preferences to enhance learning.
Chesborough (2005) also conducted a university study of male football and basketball
scholarship athletes and found that Sensing, Thinking and Perceiving functions were strongly
preferred. Additionally, it was found that the ISTP, ESTP and ESTJ types were significantly
over-represented in the athlete sample. She emphasizes the implication of this study in that
student athletes, frequently recognized as at-risk, may actually be different learners requiring
a different learning environment. This assertion follows the generally recognized assumption
that most classroom instruction is primarily reliant on deductive delivery. As a potential
solution to these different learning preferences, Chesborough presented a redesigned learning

28
plan that enhances the ability of Sensing, Thinking and Perceiving individuals in achieving
academic success, but is sensible and applicable for many college classrooms. First,
educators can be encouraged to provide learning conditions that use more applied approaches
to learning and conditions that make use of inductive rather than deductive strategies. They
should utilize audiovisual materials and other media and rely less on straight lecture format
for presentation of information. Instructors should make stronger use of computer-assisted
learning and interactive materials to “provide immediate, specific feedback on learning
problems and individual learning” (p. 38). Additionally, the use of experiential learning such
as field trips and laboratory experiments along with alternatives to paper writing is desirable
and Chesborough encouraged institutions to coordinate the use of type-alike student learning
assistants or tutors within athletic academic programs.
The evolution of student learning and expectations has demonstrated opportunities for
learning style development and teaching growth. Erickson and Strommer (2005) posited that
research university models of creating and delivering knowledge do not successfully address
the learning styles of current students. They encouraged educators to incorporate small
group discussion, personal writing exercises, case studies, problem-based learning and
experiential learning to meet student learners where they are in the classroom. “Sufficient
variety of instructional strategies helps to maintain interest as well as appeal to the various
learning strengths of a diverse class” (p. 255).
Type, academic success, and persistence
As students move toward campus integration they seek congruence and comfort in a
campus culture. Type theory and the MBTI can be helpful in moving students toward this
29
goal. Kalsbeek (1986, 2003) reported on a tracking tool that aids university communities in
reviewing MBTI data in comparison with available student data to provide a research base
for retention strategies. Students at a medium-size private university were administered the
MBTI at the time of their housing application or during first-year orientation. They
consented to having their scores merged with ACT/SAT scores and other entry and
demographic data sources. Academic results, program of study and enrollment status of the
students were tracked in subsequent semesters. While it is not surprising that results from the
tracking research found ACT/SAT scores as the best predictor of academic performance in
the first semester, the research also revealed that preferences for Introversion, Perception and
Intuition were found to be statistically significant in their influence on first semester grades.
Type data were also found to correlate with entering student profiles as to reasons for
attending college, performance on college admission standardized tests and first-term
academic achievement. Each of these correlations is helpful to campus retention efforts by
explaining possible shifts in college entry data and academic success. As failure to find
academic success is a major factor in student persistence, Kalsbeek (2003) emphasized that
the MBTI instrument is useful for academic success programs. It can be used to identify
special challenges for students, as a method for responding to students in need of academic
support, and for “facilitating a good educational fit between the learner and the instructor” (p.
109).
In a second study examining the type preferences of students in social work majors,
Campbell and White (2009) discovered students of color studying social work were
significantly more likely to have Sensing, Sensing-Thinking, and Introverted-Sensing than
traditional-aged college students in a sample of senior undergraduates. Students in the study
30
were also less likely to prefer the Intuitive preference than the sample population. As
suggested by Chesborough (2009), many social work educators have more Introverted
Intuiting preferences and Campbell and White found this type conflict to be potentially
detrimental to the success of minority students in social work studies. They theorized that
Sensing preference students generally are successful in the social work field, but that the
propensity for Intuiting preference students to score higher on timed aptitude tests may
potentially eliminate many Sensing preference students from admission to social work
programs. As Sensing preference students tend to prefer linear and hands-on learning,
Campbell and White recommended social work programs offer more “engagement in
concrete tasks and early opportunities for students to engage in practical experiences” (p. 61).
In a nine-year study of MBTI type, choice of major and academic performance of
nearly 6,300 students at a private university, DiRienzo, Das, Synn, Kitts, and McGrath
(2010) researched whether certain MBTI types were specific to majors, if type correlated to
academic success and if certain MBTI type preferences outperform other types. Their results
indicated a significant relationship between Type, major, and academic success including a
finding that Judging types had higher average grade points overall and that all Introverted,
Feeling, and Judging types outperformed other students in the study with the exception of
Business students. Students with a preference for Perceiving were generally found to have
lower average grade points. Additionally, students with Intuitive, Feeling and Perceiving
preferences demonstrated a likelihood to choose study in the fine arts while those with
preferences for Extraversion, Sensing and Thinking more frequently chose business majors.
The size and scope of this study helps to provide practical information regarding MBTI type
for advising and support of academic success.
31
Following a ten-year study of entering freshman at a liberal arts college to determine
if there were MBTI type patterns among withdrawing students, Barrineau (2005) found
students with preferences for Perceiving, Intuition and Perceiving, and specifically, the ENFP
type preference (Extraverted, Intuiting, Feeling and Perceiving), were moderately, but
significantly, more likely to withdraw from college. DiTiberio and Hammer (1993) defined
the ENFP college student as disliking routine and as one who may avoid necessary details.
This student may fluctuate among many college majors before choosing and impulsively
become involved in many projects, sometimes not finishing them. Barrineau found that in
addition to identifying student type preferences related to attrition, students with the Judging
preference were significantly underrepresented among students leaving the university. As
the study reported that 69% of students who failed to persist to graduation had a preference
for Perceiving, it provides solid analysis for addressing academic support, mentoring
possibilities and transition issues with students of similar preferences. Barrineau suggested
that institutions should create type-alike mentoring programs between first-year students and
upper classification students, enforce stricter deadlines on majors and courses to push
students toward graduation, and develop “type and learning style training for faculty and
advisors to address type attrition concerns” (pp. 31-32).
Students labeled as low achieving based upon standardized testing were found as able
to compensate and achieve above-expected collegiate performance levels by using learning
preference tools to complement their psychological type preferences (Hill, 2006). Students
admitted to a six-week remedial academic program at a midsized four-year university and
who eventually achieved a 3.0 or better were included in the study. The Sensing preference
in successful students in the sample was found to outnumber the Intuitive type by three to
32
one. Hill argues this finding is noteworthy as colleges frequently measure academic ability
through standardized assessments of ability, favoring students with Intuitive preferences. He
encourages institutions to identify non-cognitive factors for predicting academic performance
and to consider the influence of these results in course design and instruction. The challenge
then, according to Erickson and Strommer (2005), is that faculty cannot be expected to meet
the different learning preferences of all students all of the time, but they can offer a variety of
educational activities and assignments to engage students with a variety of learning styles.
Students of all preferences can find academic success, a factor that should be a recognizable
foundation of any student retention initiative.
Beckham (2012) conducted a qualitative study of academically successful Perceiving
preference college students compared with a content analysis of college success and study
skills texts. She found that although Perceiving students valued learning and were
academically successful using their own learning styles and approaches, some were less
confident and less positive about their skills as a result of institutionalized methods and
expectations of student success. Beckham described Perceiving students as viewing time in a
continuous process where they work in a connected flow on a project. Frequently, this flow
will begin at what may be characterized as at the last minute or directly before a deadline or
project due date. This is in contrast to those with a Judging preference who view time in
increments and divide large tasks into smaller parts. Beckham stated that this finite Judging
time management process is supported in much of the academic skills and success literature
but is difficult to achieve for those with the Perceiving preference. She argued that we
cannot invalidate the learning of students who spend less time on study or writing simply
because they complete these tasks differently. If students with Perceiving preferences
33
ultimately persist to graduation and are satisfied with their education, institutions should not
be able to lessen the value of the experience. Beckham recommended that college success
courses, texts and educators be willing to utilize unconventional instruction strategies to meet
the needs of all students.
As outlined by Tinto (1975, 2012), a key factor for persistence is the integration to
campus academic and social cultures experienced by a student in the transition to college.
An understanding of psychological type as made available by the MBTI instrument can be a
mechanism for assisting students to understand learning and student success in the post-
secondary institution. As university cultures are wide and varying, establishing student fit
within that culture through use of the MBTI is one method for enhancing student satisfaction
and progress to graduation.
Summary
What began as an assignment in a first-year seminar course lecture related to learning
style has revealed that a student cohort with MBTI preferences for Feeling and Perceiving
could provide analysis for contribution to the field of typological student development
research. Delving further into a comparison of MBTI preferences for students who are not
able to achieve a 2.0 grade point average and who may be withdrawing from an institution
prior to completing a degree may offer insight to improving student success. These
circumstances defined the hypothesis that psychological type preferences are a variable to
success for this student cohort within the university.
There is evidence that statistical analysis of type distributions for a specific
population may help identify whether MBTI preferences correlate to student academic
34
difficulty in the first college year. This review of the literature supports that type
preferences, particularly preferences for Perceiving, may have an effect on student academic
progress and that identification and understanding of these preferences may assist in
compensating for student learning differences. Type theory reveals that preferences are not
related to ability or motivation. As such, identifying a trend toward specific type preferences
in participants who are not successful in the first college year may provide analysis distinct to
the participant population in the research.
Preferences of psychological type are valid in their strength to enhance individual
perception of style and learning. This research ascertained the value of the Myers-Briggs
assessment in helping students to better understand their fit within their institution with a
goal of enhancing persistence.

35
CHAPTER 3. METHODOLOGY
Overview
The purpose of this study was to examine the relationship of Myers-Briggs Type
preferences to first-semester grade point average for new direct from high school Iowa
students enrolling at Iowa State University as recipients of the Hixson Award from fall 2007
through fall 2011. Myers-Briggs preferences represent a typological model of student
development theory. Although typology does not explain individual changes or beliefs, the
models are useful for understanding individual differences and characteristics and how these
differences may influence student development and academic success.
Myers-Briggs profile assessments collected from eight first-year student cohorts
enrolled in a first-year seminar course were informally analyzed and sorted for a review of
academic success and persistence in a student cohort. Through this process, it was
discovered that the student population had over-represented type preferences for two Myers-
Briggs preferences in comparison to national samples. An additional comparison found
evidence of over-represented type preferences for students who had not achieved a 2.0 grade
point average in the first semester and among those students withdrawing from the institution
prior to completing a degree. These circumstances suggest that psychological type
preferences could be a variable relating to student success for this student cohort within their
university, and invite additional statistical analysis.
Kalsbeek (1986, 2003) reported on a tracking tool that aids universities in reviewing
Myers-Briggs data in comparison with available student data to provide a research base for
retention strategies. The study revealed certain Myers-Briggs preferences to be significant in
36
their influence on first-semester grades. Type data were also found to correlate with entering
student profiles regarding reasons for attending college, performance on college admission
standardized tests, and first-term academic achievement.
The goal of this study was to reproduce portions of Kalsbeek’s research with data
collected on Myers-Briggs preferences for a first-year student cohort sample. As student
retention and performance are important issues for all colleges and universities that wish to
recruit and retain students through graduation with the bachelor’s degree, this study might aid
in determining if students with specific type preferences have more academic difficulty in
their path to a college degree, and, if so, identify steps to ease this challenge.
Measures of the student cohort were studied with data measuring student personality
types before and after the Myers-Briggs assessment in what Creswell (2009) referred to as a
quasi-experimental time series design. The Myers-Briggs instrument (Form M) collected
from approximately 800 first-year students were reviewed for type preferences. The
assessment was given as a complement to a first-year seminar course lecture related to
learning style. The student participants were classified as in-state resident students in a
variety of majors throughout six undergraduate colleges. They each achieved regular
admission to the university, but varied in range of high school rank and ACT scores. Data
from that form were correlated with pre-enrollment measures of academic aptitude, ACT,
and high school class rank, and then with first-semester grade point. An additional analysis
was made of Myers-Briggs preferences for students with less than a 2.0 grade point average
in the first semester.
A quantitative inquiry using secondary data was utilized to investigate the questions
for this study. The survey questions and analysis of the results were informed by the review
37
of current literature in the field. Descriptive and inferential statistics were employed to
examine Myers-Briggs profile assessments in comparison with student and institutional data
for academic aptitude and first-semester grade point. Analyses of consistencies or anomalies
in cohort type preferences were also conducted.
The JMP Pro 10 statistical software package from SAS was used to investigate the
quantitative variables and relationships between independent and dependent variables.
Logistic regression models were used to determine the variables that affect first-semester
academic success.
The student population in this study was comprised of new, direct from high school,
first-time fulltime Iowa resident students who enrolled at Iowa State University beginning
fall 2004 through fall 2011. The secondary database was comprised of eight years of student
data, with approximately 100 students in each year.
Descriptive statistics were calculated for specific independent variables. Analysis of
variance (ANOVA) was utilized for the full sample and separately for students with less than
a 2.00 cumulative grade point average to compare the means for type preference and
measures of academic aptitude. Multiple Regression was implemented for the variables of
class rank, ACT, and preference pairs for the full cohort and less than 2.0 group. As stated
in Chapter 1 egression models are valuable as they help us to see variables and their
relationships to enhance understanding (De Veaux, Velleman, & Bock, 2012).
The primary method for analyzing type preferences is the self-selection ratio type
table (SRTT; McCaulley, 1985). The SRTT is used to measure the frequency of type in a
collected sample against the frequency of that type in a base population.
38
The analyses assessed categorical and continuous variables. The independent
variables included continuous variables, such as ACT, high school rank, or first-semester
grade point, and discrete variables, such as Myers-Briggs Type preference. A complete list
of variables are located in a codebook table (see Table 3.2).
Self-selection ratio type tables were used to aid in reporting the results. Contingency
tables were created to assess the association between categorical variables (e.g., gender).
Histograms were created to show frequencies of variables collected for each year.
Additional research is needed to explore student learning preferences and predictors
affecting first-semester student success and retention. This study might help to further
illuminate these learning preferences and potential barriers to degree attainment.
Additionally, this research may provide educators and advisors of similar student programs
and of learning communities with typological development information to support students in
the transition to college. [you are the humble researcher]
This chapter describes the methodological approach employed for this study. The
research questions, hypotheses, research design, setting, population, comparison sample, data
collection, variables, data management, and method of data analyses are outlined. The
ethical issues, limitations, and delimitations of the study also are reported.
Research Questions and Hypotheses
If student type preferences and learning styles are found to be incongruent with
institutional culture, lack of engagement may occur. As academic disengagement is a major
variable behind a decline in grades and increased attrition (Keup, 2006), identifying trends
for academic success related to psychological type can be useful for student development.
39
The purpose of this study was to investigate the collected type preferences for a
student cohort to analyze type preference distributions, learning style, and potential effects of
type on academic success in the first college semester. The following research questions
guided this study. If a research question is not descriptive and seeks inference, a
corresponding hypothesis is included. Each hypothesis is written in the traditional null
hypothesis form postulating no difference between variables (Creswell, 2009).
1. What are the academic demographics of the students in the study, including academic
aptitude (ACT and high school class rank) and first-semester grade point average?
2. Are there statistically significant differences in Myers-Briggs preferences for students
in the study by each cohort year in comparison to the distribution of a national
population?
Hypothesis 1: There is no difference between the Myers-Briggs preferences
for students in the study and the national population.
3. Are there statistically significant differences in Myers-Briggs preferences by gender
for students in the study by each cohort year and across groups in comparison to the
distribution of a national population?
Hypothesis 2: There is no difference between the Myers-Briggs preferences
by gender for students in the study by cohort year or across groups and the
national population.
4. Are there statistically significant differences in Myers-Briggs preferences for students
with STEM majors by each cohort year in the study in comparison to the distribution
of a national population?

40
Hypothesis 3: There is no difference between the Myers-Briggs preferences
for students with STEM majors in the study and the national population.
5. Are there statistically significant differences in academic aptitude of ACT and high
school class rank and Myers-Briggs preference for students by each cohort year and
across groups in the study?
Hypothesis 4: There is no difference in ACT and high school class rank and
Myers-Briggs preference for students by each cohort year and across groups
in the study.
6. Are there statistically significant differences in Myers-Briggs preference for student
grade point in the first college semester in comparison by each cohort year and across
groups? Are there statistically significant differences in Myers-Briggs preference for
students who are able to achieve a 2.00 grade point in in the first college semester by
each cohort year and across groups?
Hypothesis 5: There is no difference in Myers-Briggs preference for students
in the study by grade point in the first college semester in comparison by each
cohort year and for the research population.
Hypothesis 6: There is no difference in Myers-Briggs preference for students
who are able to achieve a 2.00 grade point in the first college semester in
comparison by cohort year and for the research population.
7. Is there correlation of ACT, high school class rank, or Myers-Briggs preference to
first semester grade point by each cohort year and across groups.?
41
Hypothesis 7: There is no correlation of ACT, high school class rank, or
Myers-Briggs preference, to first semester grade point by each cohort year and
across groups.
These research questions and hypotheses framed this quantitative study to provide
information on the effect of Myers-Briggs learning preferences and academic success in the
first semester. The findings of this study should add to the body of knowledge regarding
typological connections in student development and academic achievement for students
enrolling at Iowa State University.
Research Design
The framework for this study provides the plans and procedures for completing this
research. According to Creswell (2009), there are three components involved with the
design: (1) researcher paradigm; (2) strategy of inquiry; and (3) research method. The
problem addressed in this study reflects the need to identify and assess the various causes
(variables) that influence outcomes (type preferences related academic success in the first
college semester).
Creswell (2009) defined this approach as postpositivist in that it begins with a
research theory, followed by data collection, and then a statistical analysis of the data.
Postpositivists seek to identify and assess causes that are influencing outcomes. This
researcher began by noticing trends in Myers-Briggs assessments, developed theories, and
then requested to collect data to test the theories.
The strategy of inquiry for this study was structured as a quasi-experimental time
series design in that measures of the student cohort were studied from before and after the

42
Myers-Briggs assessment (Creswell, 2009). The Myers-Briggs instrument (Form M) was
collected from first-year students from the fall 2004 through fall 2011 semesters and
reviewed for type preferences. Descriptive and inferential statistics were employed to
examine a secondary database of Myers-Briggs profile assessments in comparison with
student and institutional data for academic aptitude and first-semester grade point. Analyses
of consistencies or anomalies in cohort type preferences were conducted.
The JMP Pro 10.0 statistical software package was used to investigate the quantitative
variables and relationships between independent and dependent variables. Logistic
regression models were used to determine which variables affect first-semester academic
success.
Descriptive statistics were calculated for specific independent variables. To compare
the means for type preference and academic aptitude through ACT, an analysis of variance
(ANOVA) was utilized to compare means across groups for the full cohort and across groups
for students with less than 2.00 grade point. Finally, multiple regression was implemented
for the variables of class rank, ACT, and preference pairs for the full cohort and less than 2.0
group.
The student population in this study was comprised of new, direct from high school,
first-time fulltime Iowa resident students who enrolled at Iowa State University beginning
fall 2004 through fall 2011. The database was comprised of eight years of student data, with
approximately 100 students each year. The analyses assessed categorical and continuous
variables. The independent variables included continuous variables, such as ACT, high
school rank, or first-semester grade point and discrete variables, such as Myers-Briggs Type
preference.
43
Astin’s (1984) Input-Environment-Outcome model provided a conceptual framework
to research variables that impact student success in the first semester of college. This
framework recognizes students’ precollege characteristics as inputs, students’ academic
learning experiences during their first semester of college as environmental, and cumulative
GPA earned after the first semester as an outcome.
This research design sought to determine causes that define outcomes. It examined a
secondary database of student data and Myers-Briggs preferences of a first-year student
learning community, and descriptive and inferential statistical analyses were utilized to
identify variables influencing student success in the first college semester.
Setting
The setting for this study was Iowa State University, an AAU and Carnegie RU/VH
comprehensive public research university located in a small Midwest city. Iowa State was
established in 1858 and currently enrolls approximately 31,000 students, 82% of whom are
undergraduate students in six colleges. The University is the nation’s first land-grant
institution, is accredited by the North Central Association of the Higher Learning
Commission, and is one of three major public universities in Iowa. Sixty-eight percent of
undergraduates are Iowa residents.
Population and Sample
The student population in this study was comprised of new, direct from high school,
first-time, fulltime Iowa resident students who enrolled at Iowa State beginning fall 2004
through fall 2011. They were selected for enrollment in the Hixson Awards Program and
participated in a required first-year seminar learning community course. They were

44
primarily first-generation students, defined for federal educational program purposes as
having parents without an earned bachelor’s degree. The students also had primarily low
Expected Family Contribution (EFC) as determined by the Free Application for Federal
Student Aid (FAFSA) and were typically full Pell Grant eligible.
The Hixson Opportunity Awards (Hixson Awards) were created in 1995 for Iowa
high school students whose challenging environments typically preclude higher education,
and are the largest privately funded scholarship at Iowa State. One hundred high school
seniors are selected from across the state (ideally, one from each county) to receive this
yearly award (one-half tuition and fees for four years) representing each county of the state,
rural and urban communities. The Hixson Program serves 400 students annually (first-year
through senior classification) and supports the university mission by strengthening
undergraduate programs, sustaining a supportive university community, and enhancing
student life through programming for intellectual growth and persistence. The Hixson
Program has among the highest retention and graduation rates for learning communities at
the institution.
The secondary database compilation was comprised of eight years of first-year
student data, with approximately 100 students each year. Students under the age of 18 years
at the time of enrollment were excluded from the study. Table 3.1 provides the population
for each cohort year.
Reliability and Validity
During the past four decades, Myers-Briggs type theory and the MBTI® assessment have
became well known and widely utilized in a variety of education and business settings.
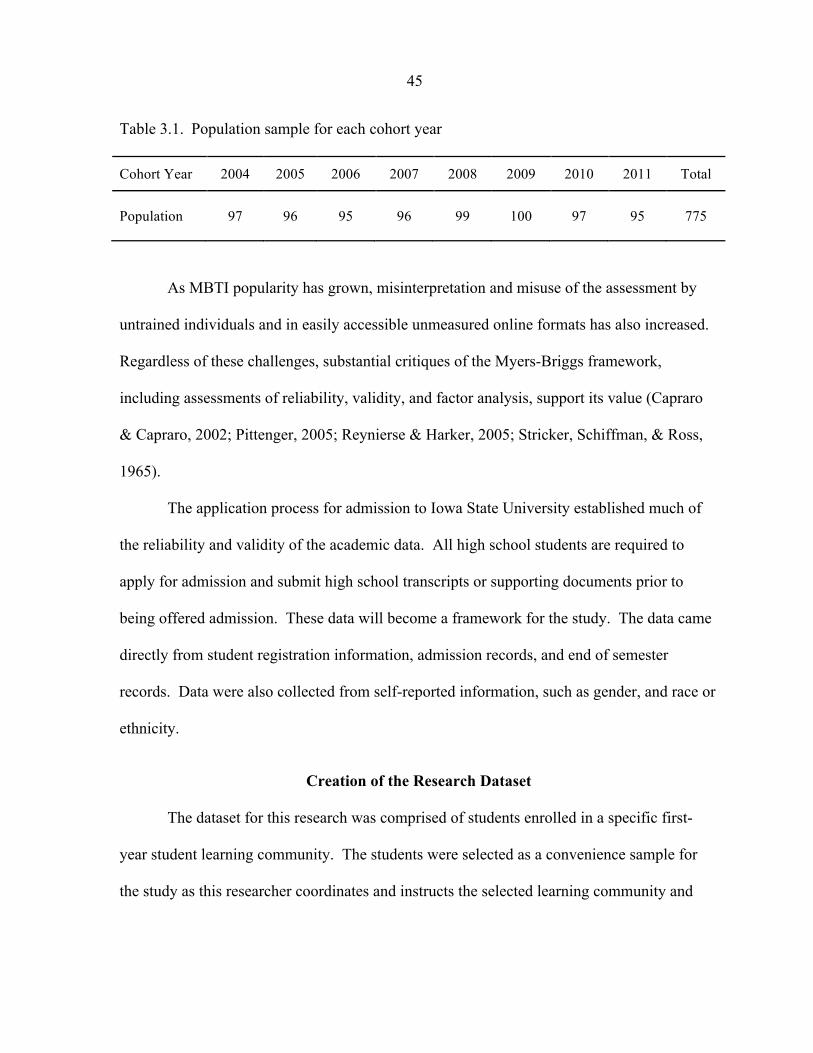
45
Table 3.1. Population sample for each cohort year
Cohort Year 2004 2005 2006 2007 2008 2009 2010 2011 Total
Population 97 96 95 96 99 100 97 95 775
As MBTI popularity has grown, misinterpretation and misuse of the assessment by
untrained individuals and in easily accessible unmeasured online formats has also increased.
Regardless of these challenges, substantial critiques of the Myers-Briggs framework,
including assessments of reliability, validity, and factor analysis, support its value (Capraro
& Capraro, 2002; Pittenger, 2005; Reynierse & Harker, 2005; Stricker, Schiffman, & Ross,
1965).
The application process for admission to Iowa State University established much of
the reliability and validity of the academic data. All high school students are required to
apply for admission and submit high school transcripts or supporting documents prior to
being offered admission. These data will become a framework for the study. The data came
directly from student registration information, admission records, and end of semester
records. Data were also collected from self-reported information, such as gender, and race or
ethnicity.
Creation of the Research Dataset
The dataset for this research was comprised of students enrolled in a specific first-
year student learning community. The students were selected as a convenience sample for
the study as this researcher coordinates and instructs the selected learning community and
46
first-year seminar course where the Myers-Briggs instrument was facilitated. The students
were enrolled fulltime their first fall semester to seek their first bachelor’s degree.
Extracting required information from each student’s admission and academic record
and comparing it with the reported Myers-Briggs preference of the student became the basis
for the secondary dataset of this study. The Myers-Briggs information were supplied to the
Office of the Registrar so that student identifiers could be removed to protect student privacy
following data extraction. When the data were extracted, a codebook was created that
identifies details for each variable. Text values were replaced with numeric data when
possible, all labels and values were assigned, and data were verified against the original
extracted file.
Study Variables
Dependent
This study has one dependent variable—the first-semester grade point average of
the students. This grade point variable is continuous, and is reported as actual GPA received.
Independent
The independent variables used in this study are organized into three areas: (a)
student attributes, or background demographic characteristics; (b) academic aptitude, or high
school academic background characteristics; and (c) survey and academic environmental
characteristics that occurred while enrolled for their semester at Iowa State. Table 3.2
provides a listing of the variables.
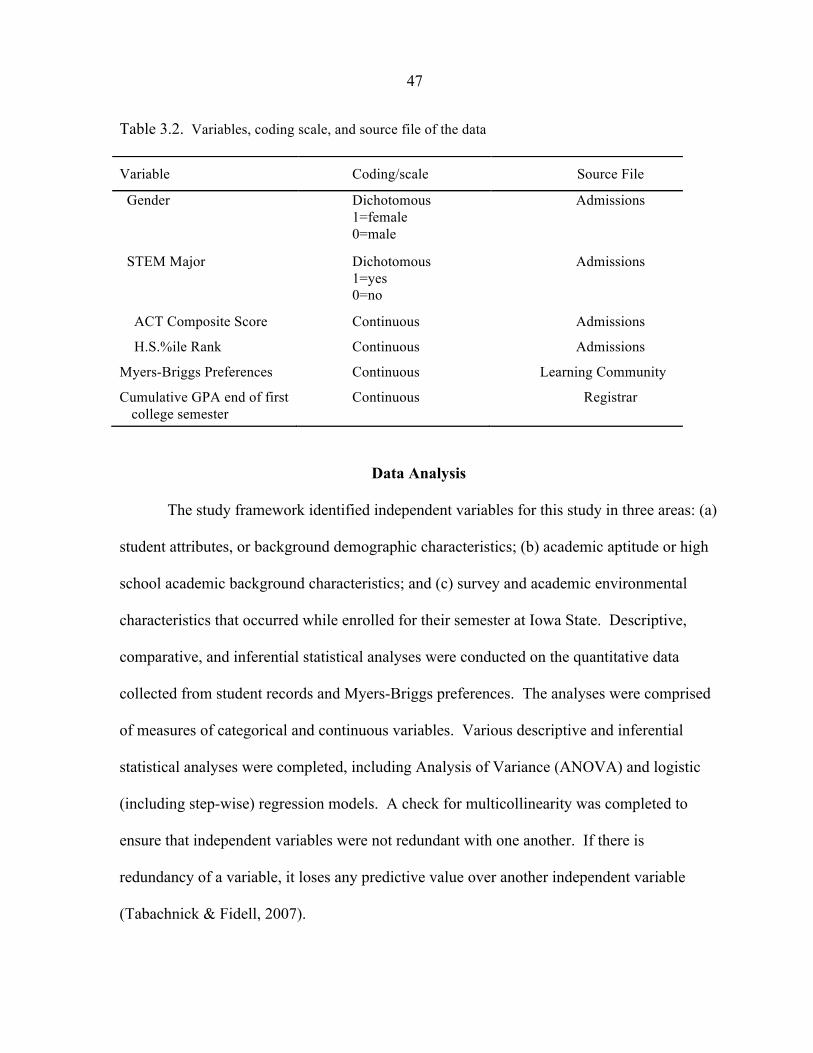
47
Table 3.2. Variables, coding scale, and source file of the data
Data Analysis
The study framework identified independent variables for this study in three areas: (a)
student attributes, or background demographic characteristics; (b) academic aptitude or high
school academic background characteristics; and (c) survey and academic environmental
characteristics that occurred while enrolled for their semester at Iowa State. Descriptive,
comparative, and inferential statistical analyses were conducted on the quantitative data
collected from student records and Myers-Briggs preferences. The analyses were comprised
of measures of categorical and continuous variables. Various descriptive and inferential
statistical analyses were completed, including Analysis of Variance (ANOVA) and logistic
(including step-wise) regression models. A check for multicollinearity was completed to
ensure that independent variables were not redundant with one another. If there is
redundancy of a variable, it loses any predictive value over another independent variable
(Tabachnick & Fidell, 2007).
Variable Coding/scale Source File
Gender
Dichotomous 1=female 0=male
Admissions
STEM Major
Dichotomous 1=yes 0=no
Admissions
ACT Composite Score
Continuous Admissions
H.S.%ile Rank
Continuous Admissions
Myers-Briggs Preferences
Continuous Learning Community
Cumulative GPA end of first college semester
Continuous Registrar
48
Table 3.3 provides a breakdown of the research questions, variables, and method of
analysis. For research questions 2 through 4, type distributions were completed with self-
selection ratio type table (SRTT) analysis, the primary method for measurement of type
distribution (McCaulley, 1985). SRTT determines the over- or underrepresentation of a
research sample in comparison to a national base type preference sample. The ratio
numerator represents the percentage of that type in the research sample while the
denominator is the type percentage in the base population. This was followed by a chi-
square test and simulated distribution of the test statistic to determine probability for the
frequency of a given type preference occurring by chance.
Ethical Considerations
The University Registrar approved the Release of Student Information for Research
for the project on July 9, 2012. The study received approval for meeting requirements of
federal regulations and ISU policies governing human subjects research from the Iowa State
Institutional Review Board (IRB) on July 12, 2012. A copy of the IRB approval is provided
in Appendix A.
This researcher protected participant rights and confidentiality. Due to the secondary
database’s sensitive nature of containing student information, the data were reported in
aggregate terms to maintain the anonymity of individual student records.
Myers-Briggs survey participant data were de-identified by the Registrar to assure
data integrity. At no time are individuals named or otherwise identified in reports or
presentations. Additionally, this researcher has accumulated more then 20 fulltime years

49
Table 3.3. Research questions, variables, and method of analysis
Variables
Research Questions Independent Dependent Method of Analysis 1. What are the demographics of the students in the study including academic aptitude (ACT and high school class rank) fall 2004 to 2009?
Background characteristics gender ACT class rank class size
Descriptive
2. Are there statistically significant differences in Myers-Briggs preferences for students in the study by each cohort year and the whole study in comparison to the distribution of a national population?
Gender type preference STEM entry year
SRTT Chi-Square Simulation of Test Statistic
3. Are there statistically significant differences in Myers-Briggs preferences by gender for students in the study by each cohort year and across groups in comparison to the distribution of a national population?
Gender type preference STEM entry year
SRTT Chi-Square Simulation of Test Statistic
4. Are there statistically significant differences in Myers-Briggs preference for students with STEM majors in the study in comparison to the distribution of a national population?
2004, 2005, 2006, 2007 2008, 2009, 2010, 2011
SRTT Chi-Square Simulation of Test Statistic
5. Are there statistically significant differences in academic aptitude of ACT and high school class rank and Myers-Briggs preference for students by each cohort year and across groups in the study?
2004, 2005, 2006, 2007 2008, 2009, 2010, 2011
Inferential ANOVA Tukey-Kramer HSD Cross-Tabulation
6. Are there statistically significant differences in Myers-Briggs preference for students in the study and GPA in comparison by cohort year and across groups?
2004, 2005, 2006, 2007 2008, 2009, 2010, 2011
Mean GPA conclusion of first college semester
Inferential ANOVA Tukey-Kramer HSD Cross-Tabulation
7. Is there correlation of ACT, class rank, or Myers-Briggs preference to first semester GPA by each cohort year and across groups?
2004, 2005, 2006, 2007 2008, 2009, 2010, 2011
Mean GPA conclusion of first college semester
Pearson correlation Multiple logistic regression
50
working in a higher education environment and is well practiced in FERPA regulations and
the importance of confidentiality.
Limitations
This study was designed to capture data for an identified group of students at this
university and should be carefully interpreted before comparison to other student groups or
institutions. As all students under the age of 18 years at the time of enrollment were
excluded from the sample, the results are not fully representative. Additional limitations of
this study include the structure of Myers-Briggs as a self-reporting instrument. The
assumption must be made that the respondents are of normal mental health and objectively
report their preferences when completing the assessment. Additionally, as respondents were
asked to complete the Myers-Briggs assessment as part of a first-year seminar assignment on
learning styles as opposed to self-selecting to complete the instrument, the assumption was
made that the respondents were objectively reporting their preferences and were not
influenced by the assignment directive.
Delimitations
A delimitation of this research is that the scope of the study was confined to students
in a specific first-year student learning-community who enrolled fulltime each fall semester
from 2004 through 2011 at Iowa State University. The study sample was deemed of
sufficient sample size to address the data, but may not be representative of the student
population based upon demographic and socioeconomic status. Other learning communities,
colleges, or universities would also have similar student populations from which to draw
information. Creation of this database also required that certain students be delimited or
51
excluded from the study if they were not 18 years of age at the semester of enrollment or
academic aptitude information was missing from the dataset.
Summary
The methodological approach suggested for this study was highlighted in this chapter.
Outlines were provided for research questions, hypotheses, research design, and study
setting. Additionally, the population, sample, data collection, variables, data management,
and proposed data analysis were reviewed. Ethical considerations, and limitations and
delimitations of the study were also addressed.
52
CHAPTER 4. RESULTS
Overview
This chapter provides an overview of the quantitative findings of this study
comparing student academic aptitude and Myers-Briggs preference with ability to achieve a
2.00 grade point in the first semester. Understanding differences of psychological type and
how type pertains to learning style in students may enhance student success. The chapter is
organized into seven sections. Each section is based upon a research question and is
supplemented by six corresponding hypotheses statements. Section RQ 1 examines the
background characteristics and academic demographics of students who enrolled fulltime at
Iowa State beginning each fall semester from fall 2004 through 2011 (also referred to as the
research population). The descriptive reporting includes male or female, high school
percentile class rank, composite ACT scores, size of high school graduating class and
whether students selected a STEM major. Percentages are reported for all of these
characteristics.
Section RQ 2 reports whether statistically significant differences are present in the
distribution of type and among each cohort year and for the full sample in comparison to the
national sample distribution. Section RQ 3 reports the possibility of a statistically significant
difference between male and female students in comparison to the national sample
distribution. Section RQ 4 examines whether STEM majors in the sample are found with
demonstrated difference in comparison to the national sample distribution. Tables and
figures highlight any change over the eight years of the study.
53
Section RQ 5 evaluates whether a statistically significant difference is present in the
mean ACT and high school class percentile rank in comparison to Myers-Briggs preferences
for cohort year and for the research population. Section RQ 6 analyzes if there are
significant differences in academic aptitude and Myers-Briggs preferences based on ability to
achieve a 2.00 grade point for each cohort and the research population. Section RQ 7 reports
the Stepwise regression results between students’ composite ACT score, percentile class
rank, Myers-Briggs preferences and achievement of a 2.00 grade point at the conclusion of
the first college semester.
Psychological type assessment can been helpful in detecting interpersonal roadblocks
for students in the transition from high school to college. This examination of type
distribution and type research related to learning preferences may help students understand
more about themselves in the college transition.
Design Classification
The study was structured as quasi-experimental time series design in that measures of
the student cohort were collected before and after the assessment (Creswell, 2009). The
Myers-Briggs instrument (Form M) was collected from 775 first-semester freshmen at a
Midwest research university and reviewed for type preferences. The assessment was given
as a complement to a first-year seminar course lecture related to learning style. Student high
school rank and ACT scores were collected from prior to enrollment. An additional
comparison examined variables based upon greater or less than a 2.0 GPA in the first
semester. The framework used to organize this study is retrospective cohort analysis, with
the outcomes of the research population being reviewed without following specific cases. It

54
is also between-group design in that the descriptive and inferential statistical analyses are
compared for the research sample, between the cohorts of the research sample, and with a
national base population. The research questions focus on statistically significant differences
between the sample and base populations (Figure 1). This design is necessary for
determining the correct statistical analyses for the research questions.
There are several different groupings of students based on achievement of a 2.0 grade
point in the first semester, Type preference, and STEM major:
1. ! 2.00 first semester grade point 2. " 2.00 first semester grade point 3. Composite ACT 4. High School percentile rank 5. STEM major 6. Non-STEM major 7. Myers-Briggs Type Preferences (16 options)
Analysis of Research Questions and Hypotheses
Student background characteristics
Research Question 1: What are the academic demographics of students in the research population, including academic aptitude (ACT and high school class rank) and first-semester grade point average?
This first research question examined the background characteristics of cohort
population size and male/female delineation in Table 4.1. The number and percentages of
students in this population who enrolled in STEM or non-STEM majors is provided in Table
4.2. For each of the eight years, precollege academic aptitude as measured by the mean and
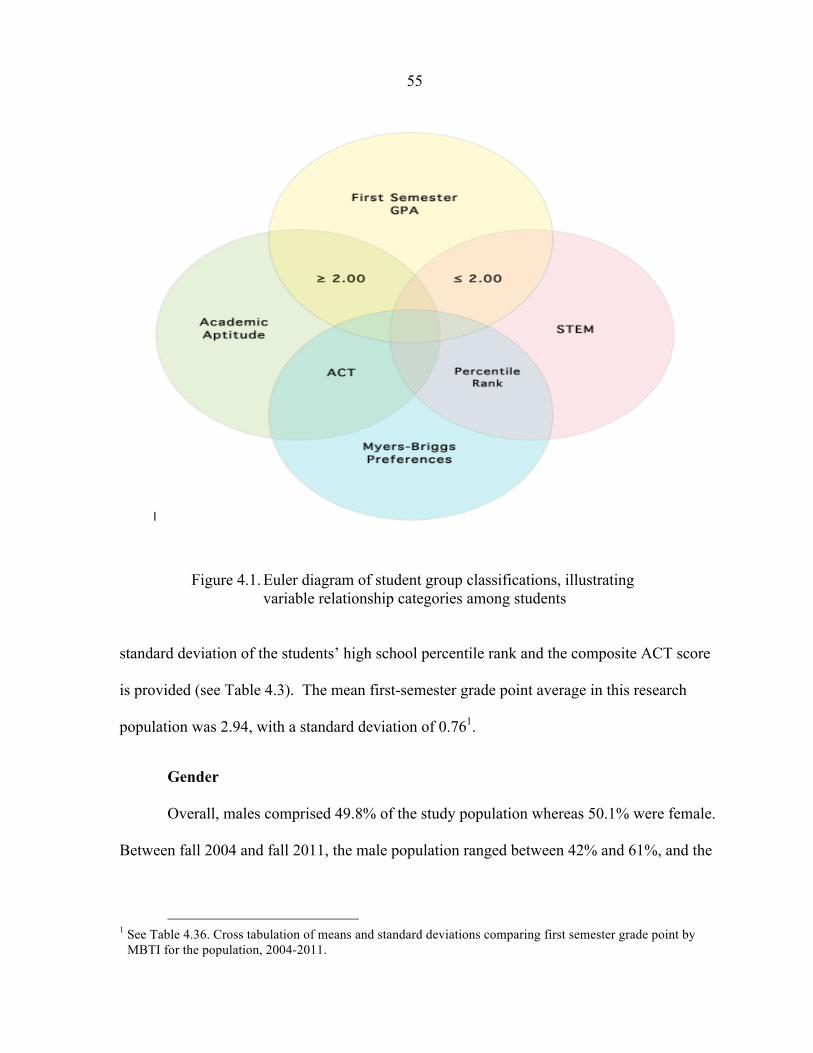
55
Figure 4.1. Euler diagram of student group classifications, illustrating
variable relationship categories among students
standard deviation of the students’ high school percentile rank and the composite ACT score
is provided (see Table 4.3). The mean first-semester grade point average in this research
population was 2.94, with a standard deviation of 0.761.
Gender
Overall, males comprised 49.8% of the study population whereas 50.1% were female.
Between fall 2004 and fall 2011, the male population ranged between 42% and 61%, and the
1 See Table 4.36. Cross tabulation of means and standard deviations comparing first semester grade point by
MBTI for the population, 2004-2011.

56
Table 4.1. Gender distribution of students who enrolled fulltime, fall 2004–fall 2011 Female Male Year entered n % n % Total
2004 50 52 47 48 97 2005 43 45 53 55 96 2006 55 58 40 42 95 2007 51 53 45 47 96 2008 39 39 60 61 99 2009 51 51 49 49 100 2010 52 54 45 46 97 2011 48 51 47 49 95
Total 389 50.1 386 49.8 775
N = 775 Table 4.2. Learning community distribution of students in STEM majors, who enrolled fulltime, fall 2004–fall 2011 Female Male Year entered n % n % Total
2004 53 55 44 45 97 2005 33 34 63 66 96 2006 49 52 46 48 95 2007 45 47 51 53 96 2008 46 46 53 54 99 2009 46 46 53 53 100 2010 35 36 62 64 97 2011 39 41 56 59 95
Total 346 45 529 55 775
N = 775 female population between 39% and 58%. The average yearly number of students in each
cohort during these eight years was 96.88 students. The race of the students in this
population was predominately White; because only a very small number of students in this
study were from other racial groups, race was not utilized as a variable for this study.
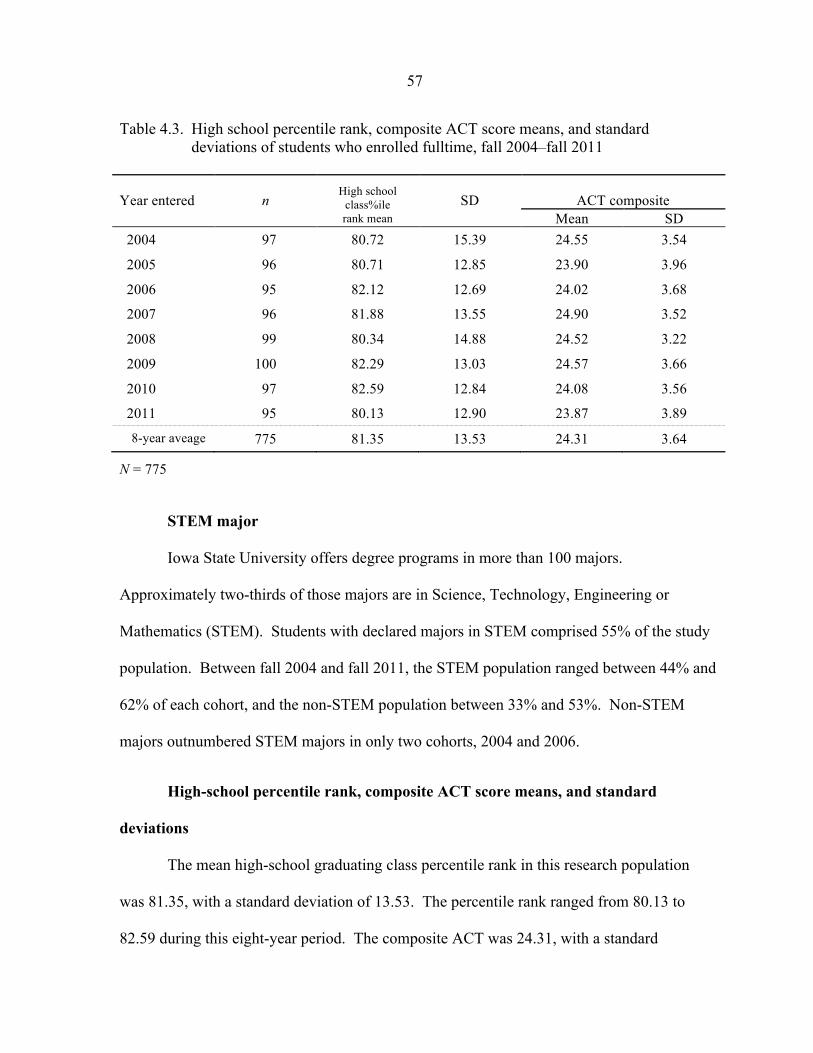
57
Table 4.3. High school percentile rank, composite ACT score means, and standard deviations of students who enrolled fulltime, fall 2004–fall 2011
Year entered n High school
class%ile rank mean
SD ACT composite Mean SD
2004 97 80.72 15.39 24.55 3.54
2005 96 80.71 12.85 23.90 3.96
2006 95 82.12 12.69 24.02 3.68
2007 96 81.88 13.55 24.90 3.52
2008 99 80.34 14.88 24.52 3.22
2009 100 82.29 13.03 24.57 3.66
2010 97 82.59 12.84 24.08 3.56
2011 95 80.13 12.90 23.87 3.89
8-year aveage 775 81.35 13.53 24.31 3.64
N = 775
STEM major
Iowa State University offers degree programs in more than 100 majors.
Approximately two-thirds of those majors are in Science, Technology, Engineering or
Mathematics (STEM). Students with declared majors in STEM comprised 55% of the study
population. Between fall 2004 and fall 2011, the STEM population ranged between 44% and
62% of each cohort, and the non-STEM population between 33% and 53%. Non-STEM
majors outnumbered STEM majors in only two cohorts, 2004 and 2006.
High-school percentile rank, composite ACT score means, and standard
deviations
The mean high-school graduating class percentile rank in this research population
was 81.35, with a standard deviation of 13.53. The percentile rank ranged from 80.13 to
82.59 during this eight-year period. The composite ACT was 24.31, with a standard
58
deviation of 3.64, whereas the composite ACT scores ranged from 23.87 to 24.90 during this
eight-year period.
The mean high school GPA of the students who enrolled fulltime from fall 2004
through fall 2011 was 3.63. As high school GPA was assessed as a component of university
admission policies in only three of the eight years of the research sample, this variable was
not utilized in the demographic collection.
Summary
The population in this study was comprised of 775 students. The students were new
direct from high school Iowa students who enrolled fulltime at Iowa State beginning each fall
semester from 2004 through 2011, and were selected to participate in the learning community
by way of receiving the program scholarship. The following list summarizes the key
background characteristics of this population that answer Research question 1: What are the
academic demographics of students in the research population, including academic aptitude
(ACT and high school class rank) and first-semester grade point average?
1. A slight majority of the students in the full research sample were female (50.1%);
(49.8%) were male.
2. A majority of the students were enrolled in STEM majors (55%); (45%) were non-
STEM.
3. The mean composite high school graduating class percentile rank was 81.35, with a
standard deviation of 13.53.
4. The mean composite ACT score was 24.31, with a standard deviation of 3.64.
59
Differences in Myers-Briggs preference by cohort year and for the total population
Research Question 2: Are there statistically significant differences in Myers-Briggs preferences for students in the study and by each cohort year in comparison to the distribution of a national population?
H0 1: There is no difference between the Myers-Briggs preferences for
students in the study and by cohort year and the national population.
To measure Research Question 2, type distributions were completed with self-
selection ratio type table (SRTT) analysis, the primary method for measurement of type
distribution (McCaulley, 1985). SRTT determines the over- or under-representation of a
research sample in comparison to a national base type preference sample. The ratio
numerator represents the percentage of that type in the research sample while the
denominator is the type percentage in the base population. This was followed by a chi-
square test and simulated distribution of the test statistic to determine a probability for
frequency of a given type preference occurring by chance.
Following the SRTT and chi-square analysis of type preference for each cohort year
and the full research sample, a simulation calculation of the distribution of the test statistic
from the multinomial or null distribution was calculated for each type table. The simulation
can be explained as rolling multisided dice; for example, a die with 775 sides being rolled, or
sampled, 100,000 times. The test statistic distribution was computed using the entire
research sample of 775 students, and for the eight cohort years. Of the nine samples of
students, 2004-2011, and the full research sample, only the 2010 cohort group was found not
significantly different from the base sample type population.
60
Each block in the 16 block type table examined in research question 2 contains the
name of the type, the percentage of the sample with preferences for this type and the
percentage of the base population or expected frequency for this type. The final figure in the
block is the index, or observed to expected frequency for this type. A probability figure is
included with the index if statistical significance of the ratio is found through 2 ! 2 chi-
square analysis with one degree of freedom and is highlighted in the following analysis. .
The simulated distribution of the test statistic from the null population is included for each
table as some cell frequencies are five or less.
Table 4.4 illustrates the SRTT for the full research sample of 775 students in
comparison to the national base sample. The simulated distribution of the test statistic for the
full type table is significant at 0.000 indicating that it is unlikely to occur by chance in the
sample. Of the 16 types, 7 types were underrepresented in comparison to the base population
sample, 8 were over-represented, and 1 type preference was equal to the base population.
Eleven types were found to be statistically significant for the research sample—ISTJ, ISFJ,
INFJ, ISFP, INFP, ESTP, ENFP, ENTP, ESTJ, ESFJ, and ENFJ.
ISTJ, or Introverted Sensing with Thinking and Judging was found to occur in 5.5%
of the research population. The index or ratio at 0.47 was less than the expected occurrence
of 8.1% in the base population, and was found to be significant at 0.001 in chi-square
calculation (X! = 24.467, df = 1, N = 43, p < .001). ISFJ, or Introverted Sensing with Feeling
and Judging, was found to occur in 7.3% of the research population. The index or ratio at
0.53 was also less than the expected occurrence of 13.8% in the base population and is
significant at 0.001 in chi-square calculation (X! = 24.272, df = 1, N = 56, p < .001). INFJ, or
Introverted Intuition with Feeling and Judging, was found to occur in 3.3% of the research
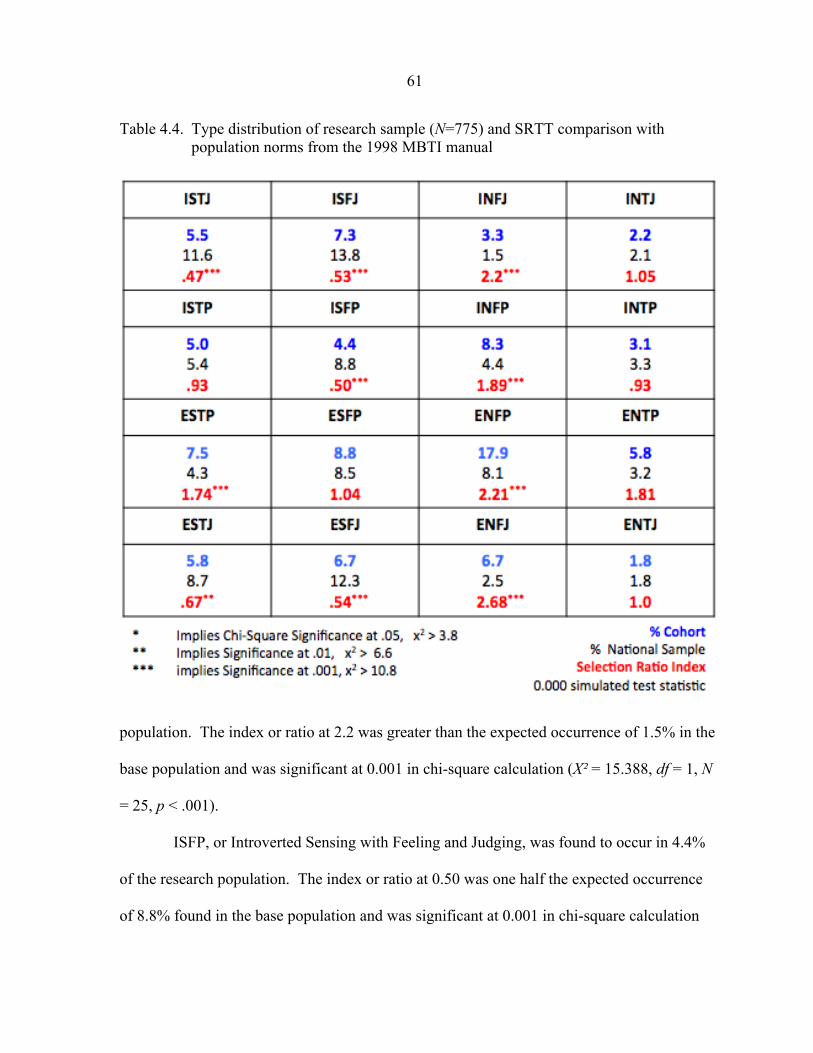
61
Table 4.4. Type distribution of research sample (N=775) and SRTT comparison with population norms from the 1998 MBTI manual
population. The index or ratio at 2.2 was greater than the expected occurrence of 1.5% in the
base population and was significant at 0.001 in chi-square calculation (X! = 15.388, df = 1, N
= 25, p < .001).
ISFP, or Introverted Sensing with Feeling and Judging, was found to occur in 4.4%
of the research population. The index or ratio at 0.50 was one half the expected occurrence
of 8.8% found in the base population and was significant at 0.001 in chi-square calculation
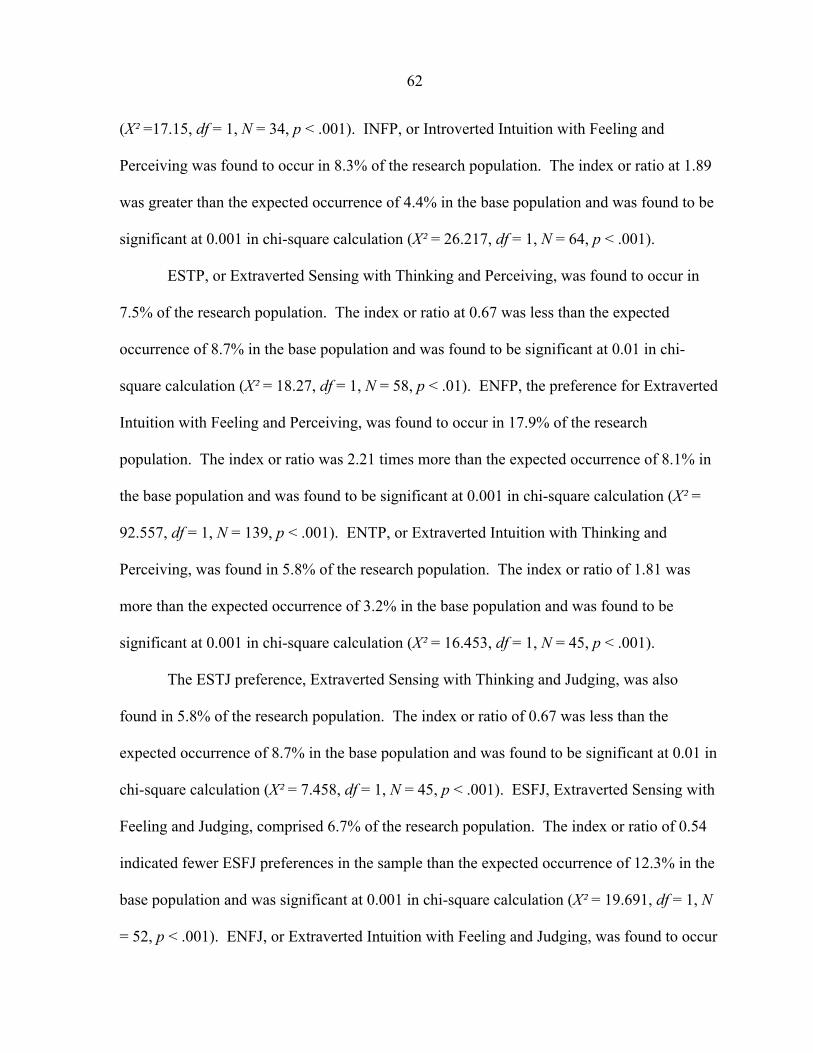
62
(X! =17.15, df = 1, N = 34, p < .001). INFP, or Introverted Intuition with Feeling and
Perceiving was found to occur in 8.3% of the research population. The index or ratio at 1.89
was greater than the expected occurrence of 4.4% in the base population and was found to be
significant at 0.001 in chi-square calculation (X! = 26.217, df = 1, N = 64, p < .001).
ESTP, or Extraverted Sensing with Thinking and Perceiving, was found to occur in
7.5% of the research population. The index or ratio at 0.67 was less than the expected
occurrence of 8.7% in the base population and was found to be significant at 0.01 in chi-
square calculation (X! = 18.27, df = 1, N = 58, p < .01). ENFP, the preference for Extraverted
Intuition with Feeling and Perceiving, was found to occur in 17.9% of the research
population. The index or ratio was 2.21 times more than the expected occurrence of 8.1% in
the base population and was found to be significant at 0.001 in chi-square calculation (X! =
92.557, df = 1, N = 139, p < .001). ENTP, or Extraverted Intuition with Thinking and
Perceiving, was found in 5.8% of the research population. The index or ratio of 1.81 was
more than the expected occurrence of 3.2% in the base population and was found to be
significant at 0.001 in chi-square calculation (X! = 16.453, df = 1, N = 45, p < .001).
The ESTJ preference, Extraverted Sensing with Thinking and Judging, was also
found in 5.8% of the research population. The index or ratio of 0.67 was less than the
expected occurrence of 8.7% in the base population and was found to be significant at 0.01 in
chi-square calculation (X! = 7.458, df = 1, N = 45, p < .001). ESFJ, Extraverted Sensing with
Feeling and Judging, comprised 6.7% of the research population. The index or ratio of 0.54
indicated fewer ESFJ preferences in the sample than the expected occurrence of 12.3% in the
base population and was significant at 0.001 in chi-square calculation (X! = 19.691, df = 1, N
= 52, p < .001). ENFJ, or Extraverted Intuition with Feeling and Judging, was found to occur
63
in 6.7% of the population (X! = 54.936, df = 1, N = 52, p < .001). The index or ratio was 2.68
times more than the expected occurrence of 2.5% in the base population and was found to be
significant at 0.001 in chi-square calculation.
Table 4.5 shows the SRTT for the 2004 cohort of 97 students in comparison to the
national base sample. The simulated distribution of the test statistic for the full type table
was significant at 0.000 indicating little occurrence chance in the sample. Of the 16 types, 10
types were underrepresented in comparison to the base population sample and 8 types were
over-represented. Four types were found to be statistically significant for the research
sample—ISFJ, INFP, ENFP and ENFJ.
ISFJ, or Introverted Sensing with Feeling and Judging, was found to occur in 6.2% of
the 2004 population. The index or ratio wass 0.38, or less than the expected occurrence of
13.8% in the base population and significant at 0.05 in chi-square calculation (X! = 5.253, df
= 1, N = 5, p < .05). INFP, or Introverted Intuition with Feeling and Perceiving, was found in
19.6% of the population. The index or ratio was 4.45 times more than the expected
occurrence of 4.4% in the base population and was found to be significant at 0.001 in chi-
square calculation (X! = 50.851, df = 1, N = 5, p < .001). ENFP, the preference for
Extraverted Intuition with Feeling and Perceiving, was found to occur in 16.5% of the
research population. The index or ratio was 2.04 times more than the expected occurrence of
8.1% in the base population, and was found to be significant at 0.01 in chi-square calculation
(X! = 8.439, df = 1, N = 16, p < .01). ENFJ, the preference for Extraverted Intuition with
Feeling and Judging, was found to occur in 10.3% of the research population. The index or
ratio was 4.12 times higher than the expected occurrence of 2.5% in the base population and
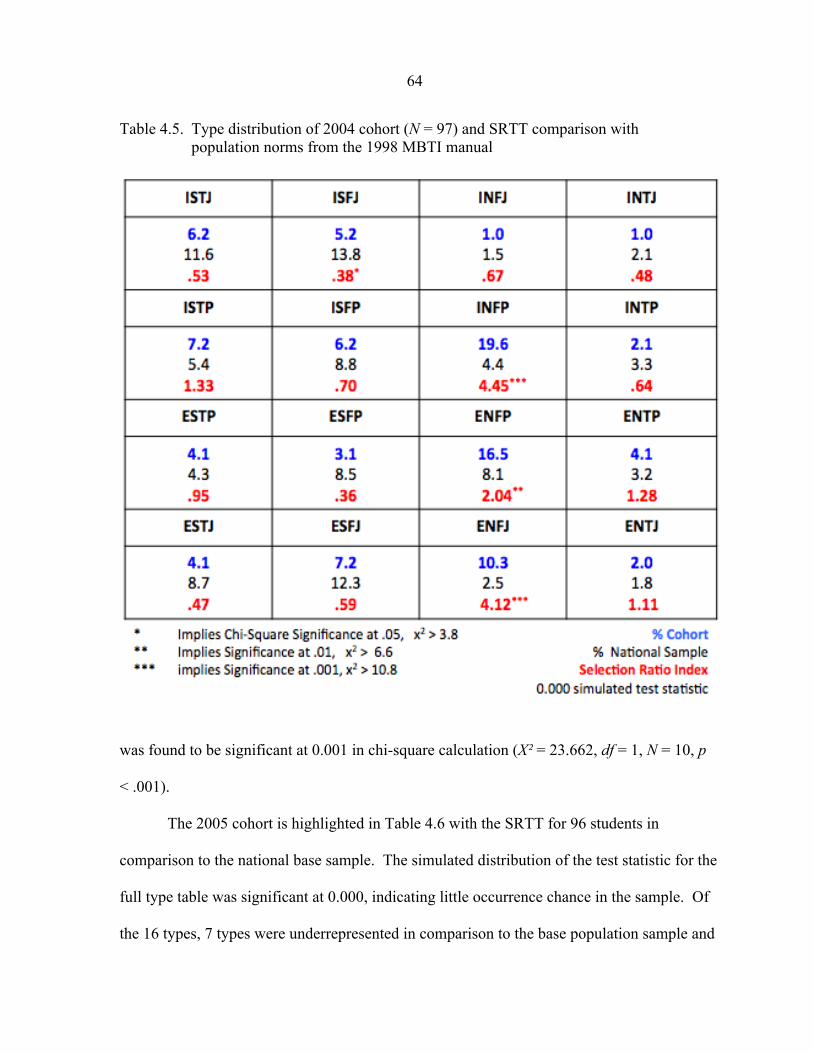
64
Table 4.5. Type distribution of 2004 cohort (N = 97) and SRTT comparison with population norms from the 1998 MBTI manual
was found to be significant at 0.001 in chi-square calculation (X! = 23.662, df = 1, N = 10, p
< .001).
The 2005 cohort is highlighted in Table 4.6 with the SRTT for 96 students in
comparison to the national base sample. The simulated distribution of the test statistic for the
full type table was significant at 0.000, indicating little occurrence chance in the sample. Of
the 16 types, 7 types were underrepresented in comparison to the base population sample and
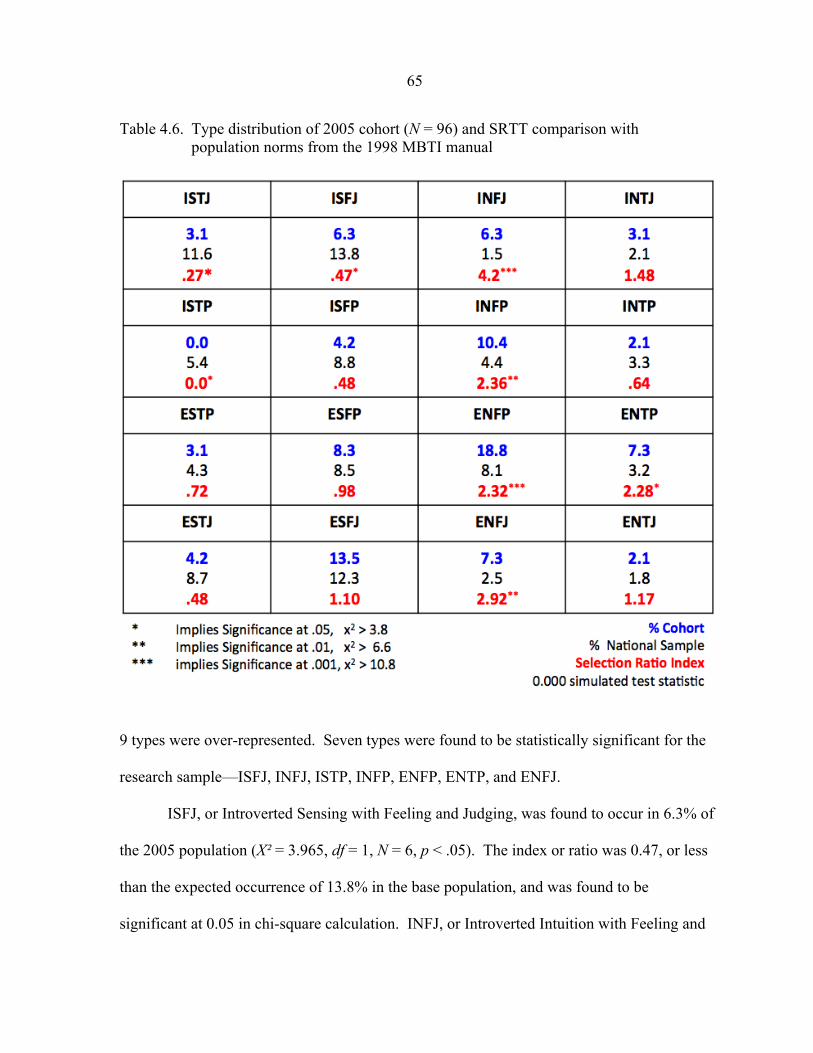
65
Table 4.6. Type distribution of 2005 cohort (N = 96) and SRTT comparison with population norms from the 1998 MBTI manual
9 types were over-represented. Seven types were found to be statistically significant for the
research sample—ISFJ, INFJ, ISTP, INFP, ENFP, ENTP, and ENFJ.
ISFJ, or Introverted Sensing with Feeling and Judging, was found to occur in 6.3% of
the 2005 population (X! = 3.965, df = 1, N = 6, p < .05). The index or ratio was 0.47, or less
than the expected occurrence of 13.8% in the base population, and was found to be
significant at 0.05 in chi-square calculation. INFJ, or Introverted Intuition with Feeling and
66
Judging, was found in 6.3% of the population (X! = 14.44, df = 1, N = 6, p < .001). The
index or ratio was 4.2 times more than the expected occurrence of 1.5% in the base
population and was found to be significant at 0.001 in chi-square calculation. ISTP, or
Introverted Sensing with Thinking and Perceiving, was not found in the 2005 population (X!
= 5.184, df = 1, N = 0, p < .05). The index or ratio of zero was less than the expected
occurrence of 5.4% in the base population, and was found to be significant at 0.05 in chi-
square calculation. INFP, or Introverted Intuition with Feeling and Perceiving, was found in
10.4% of the population. The index or ratio was 2.36 times more than the expected
occurrence of 4.4% in the base population, and was found to be significant at 0.01 in chi-
square calculation (X! = 7.898, df = 1, N = 10, p < .01).
ENFP, the preference for Extraverted Intuition with Feeling and Perceiving, was
found to occur in 18.8% of the 2005 population. The index or ratio was 2.32 times more than
the expected occurrence of 8.1% in the base population and was found to be significant at
0.001 in chi-square calculation (X! = 13.442, df = 1, N = 18, p < .001). ENTP, the preference
for Extraverted Intuition with Thinking and Perceiving, was found to occur in 7.3% of the
population. The index, at 2.28, was greater than the expected occurrence of 3.2% in the base
population and was found to be significant at 0.05 in chi-square calculation (X! = 5.023, df =
1, N = 7, p < .05). ENFJ, or Extraverted Intuition with Feeling and Judging was found to
occur in 7.3% of the research population (N = 7). The index or ratio was 2.92 times more
than the expected occurrence of 2.5% in the base population, and was found to be significant
at 0.01 in chi-square calculation. (X! = 8.817, df = 1, N = 7, p < .01).
The 2006 student cohort is depicted in Table 4.7 with the SRTT for 95 students in
comparison to the national base sample. The simulated distribution of the test statistic for the
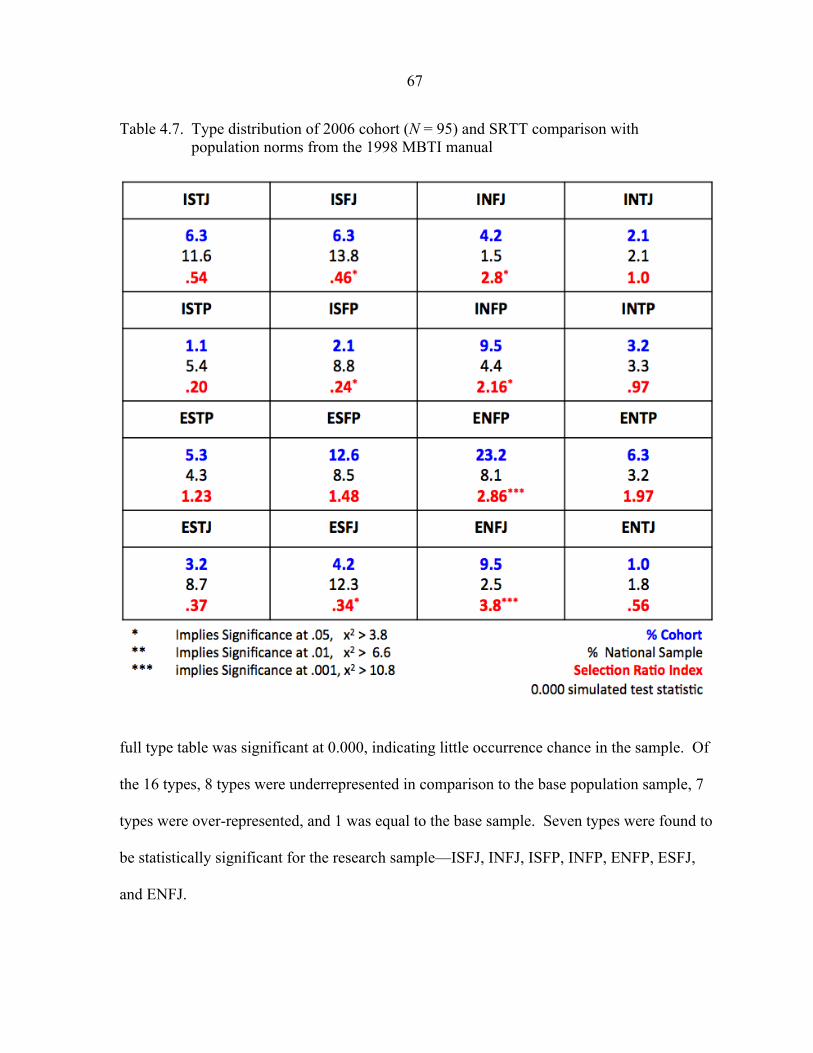
67
Table 4.7. Type distribution of 2006 cohort (N = 95) and SRTT comparison with population norms from the 1998 MBTI manual
full type table was significant at 0.000, indicating little occurrence chance in the sample. Of
the 16 types, 8 types were underrepresented in comparison to the base population sample, 7
types were over-represented, and 1 was equal to the base sample. Seven types were found to
be statistically significant for the research sample—ISFJ, INFJ, ISFP, INFP, ENFP, ESFJ,
and ENFJ.
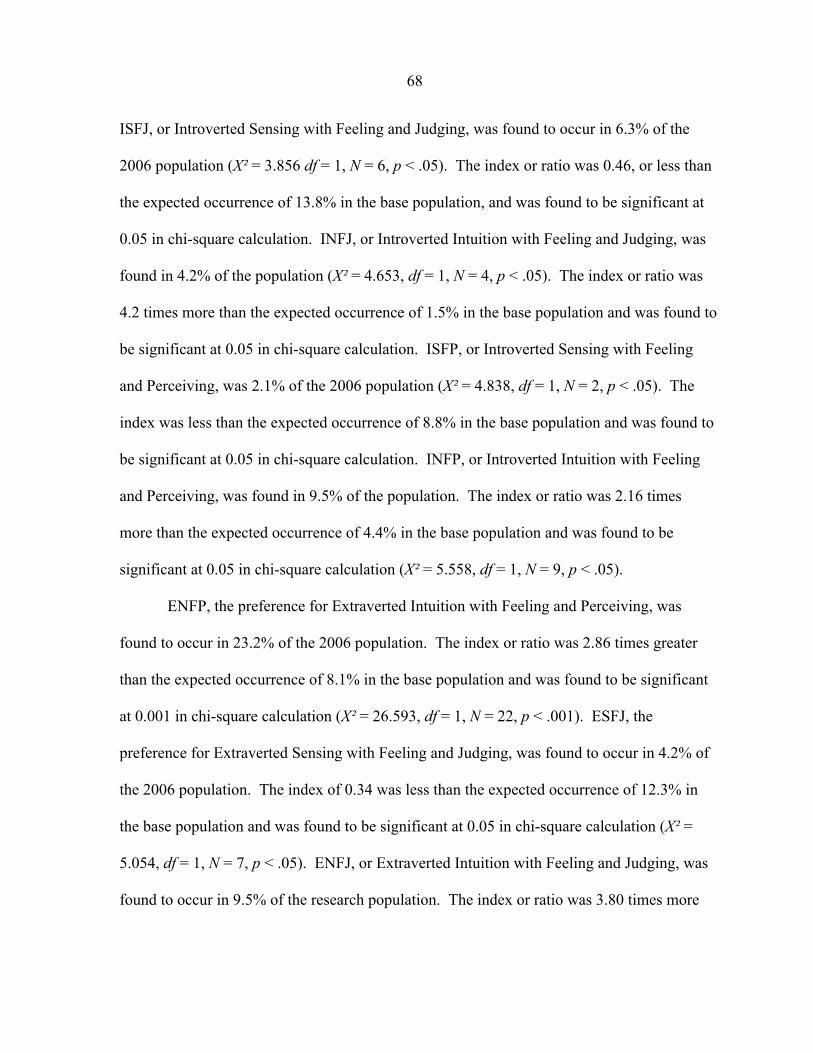
68
ISFJ, or Introverted Sensing with Feeling and Judging, was found to occur in 6.3% of the
2006 population (X! = 3.856 df = 1, N = 6, p < .05). The index or ratio was 0.46, or less than
the expected occurrence of 13.8% in the base population, and was found to be significant at
0.05 in chi-square calculation. INFJ, or Introverted Intuition with Feeling and Judging, was
found in 4.2% of the population (X! = 4.653, df = 1, N = 4, p < .05). The index or ratio was
4.2 times more than the expected occurrence of 1.5% in the base population and was found to
be significant at 0.05 in chi-square calculation. ISFP, or Introverted Sensing with Feeling
and Perceiving, was 2.1% of the 2006 population (X! = 4.838, df = 1, N = 2, p < .05). The
index was less than the expected occurrence of 8.8% in the base population and was found to
be significant at 0.05 in chi-square calculation. INFP, or Introverted Intuition with Feeling
and Perceiving, was found in 9.5% of the population. The index or ratio was 2.16 times
more than the expected occurrence of 4.4% in the base population and was found to be
significant at 0.05 in chi-square calculation (X! = 5.558, df = 1, N = 9, p < .05).
ENFP, the preference for Extraverted Intuition with Feeling and Perceiving, was
found to occur in 23.2% of the 2006 population. The index or ratio was 2.86 times greater
than the expected occurrence of 8.1% in the base population and was found to be significant
at 0.001 in chi-square calculation (X! = 26.593, df = 1, N = 22, p < .001). ESFJ, the
preference for Extraverted Sensing with Feeling and Judging, was found to occur in 4.2% of
the 2006 population. The index of 0.34 was less than the expected occurrence of 12.3% in
the base population and was found to be significant at 0.05 in chi-square calculation (X! =
5.054, df = 1, N = 7, p < .05). ENFJ, or Extraverted Intuition with Feeling and Judging, was
found to occur in 9.5% of the research population. The index or ratio was 3.80 times more

69
than the expected occurrence of 2.5% in the base population and was found to be significant
at 0.001 in chi-square calculation (X! = 18.480, df = 1, N = 9, p < .001).
The 2007 student cohort is depicted in Table 4.8 with the SRTT for 96 students in
comparison to the national base sample. The simulated distribution of the test statistic for the
full type table was significant at 0.000, indicating little occurrence chance in the sample. Of
the 16 types, 7 were underrepresented in comparison to the base population sample, 8 types
were over-represented, and 1 was equal to the base sample. Seven types were found to be
statistically significant for the research sample—ISTJ, INFJ, INFP, ENFP, ENTP, ESFJ, and
ENFJ.
ISTJ, Introverted Sensing with Thinking and Judging, was found to occur in 5.5% of
the 2007 population (X! = 5.944 df = 1, N = 3, p < .05). The index was 0.47, or less than the
expected occurrence of 11.6% in the base population and was found to be significant at 0.05
in chi-square calculation. INFJ, or Introverted Intuition with Feeling and Judging, was found
in 3.3% of the population (X! = 8.801, df = 1, N = 5, p < .01). The index or ratio was 2.2
times more than the expected occurrence of 1.5% in the base population and was found to be
significant at 0.01 in chi-square calculation. INFP, which is Introverted Intuition with
Feeling and Perceiving, was found in 8.3% of the population. The index or ratio was 1.89
times more than the expected occurrence of 4.4% in the base population and was found to be
significant at 0.05 in chi-square calculation (X! = 5.400, df = 1, N = 9, p < .05).
ENFP, the preference for Extraverted Intuition with Feeling and Perceiving, was
found to occur in 24.2% of the 2007 population. With an index 2.21 times greater than the
expected occurrence of 8.1% in the base population, ENFP was found to be significant at
0.001 in chi-square calculation (X! = 29.806, df = 1, N = 23, p < .001). ENTP, or Extraverted

70
Table 4.8. Type distribution of 2007 cohort (N = 96) and SRTT comparison with population norms from the 1998 MBTI manual
Intuition with Thinking and Perceiving, was found to occur in 5.8% of the 2007 population.
The index or ratio was 1.81 times greater than the expected occurrence of 3.2% in the base
population and was found to be significant at 0.05 in chi-square calculation (X! = 5.023, df =
1, N = 7, p < .05). ESFJ, or Extraverted Sensing with Feeling and Judging, was found to
occur in 6.7% of the 2007 population. With an index of 0.54, it was less than the expected
occurrence of 12.3% in the base population and was found to be significant at 0.05 in chi-
71
square calculation (X! = 3.925, df = 1, N = 5, p < .05). ENFJ, or Extraverted Intuition with
Feeling and Judging, was found to occur in 7.2% of the 2007 cohort. The index or ratio was
2.68 times more than the expected occurrence of 2.5% in the base population and was found
to be significant at 0.01 in chi-square calculation. (X! = 8.817, df = 1, N = 7, p < .01).
The 2008 student cohort is depicted in Table 4.9 with the SRTT for 99 students with
comparison to the national base sample. The simulated distribution of the test statistic for the
full type table was significant at 0.000, indicating little occurrence chance in the sample. Of
the 16 types in the table, 10 were underrepresented in comparison to the base population
sample while 6 types were over-represented. Four types were found to be statistically
significant for the research sample—ISFJ, ESTP, ENFP, and ENFJ.
ISFJ, Introverted Sensing with Feeling and Judging, was found to occur in 2.0% of the 2008
population (X! = 9.955, df = 1, N = 2, p < .01). The index was 0.15, or less than the expected
occurrence of 13.8% in the base population and was found to be significant at 0.01 in chi-
square calculation. ESTP was the preference for Extraverted Sensing with Thinking and
Perceiving and was found in 12.1% of the population (X! = 14.084, df = 1, N = 12, p < .001).
The SRTT ration was 2.81 times more than the expected occurrence of 4.3% in the base
population and was found to be significant at 0.001 in chi-square calculation.
ENFP, the preference for Extraverted Intuition with Feeling and Perceiving, was
found to be 21.2% of the 2008 population. The index or ratio was 2.62 times greater than the
expected occurrence of 8.1% in the base population and was found to be significant at 0.001
in chi-square calculation (X! = 21.013, df = 1, N = 21, p < .001). ENFJ, or Extraverted
Intuition with Feeling and Judging, was found to occur in 7.0% of the 2008 research
population. The index or ratio was 2.80 times more than the expected occurrence of 2.5% in
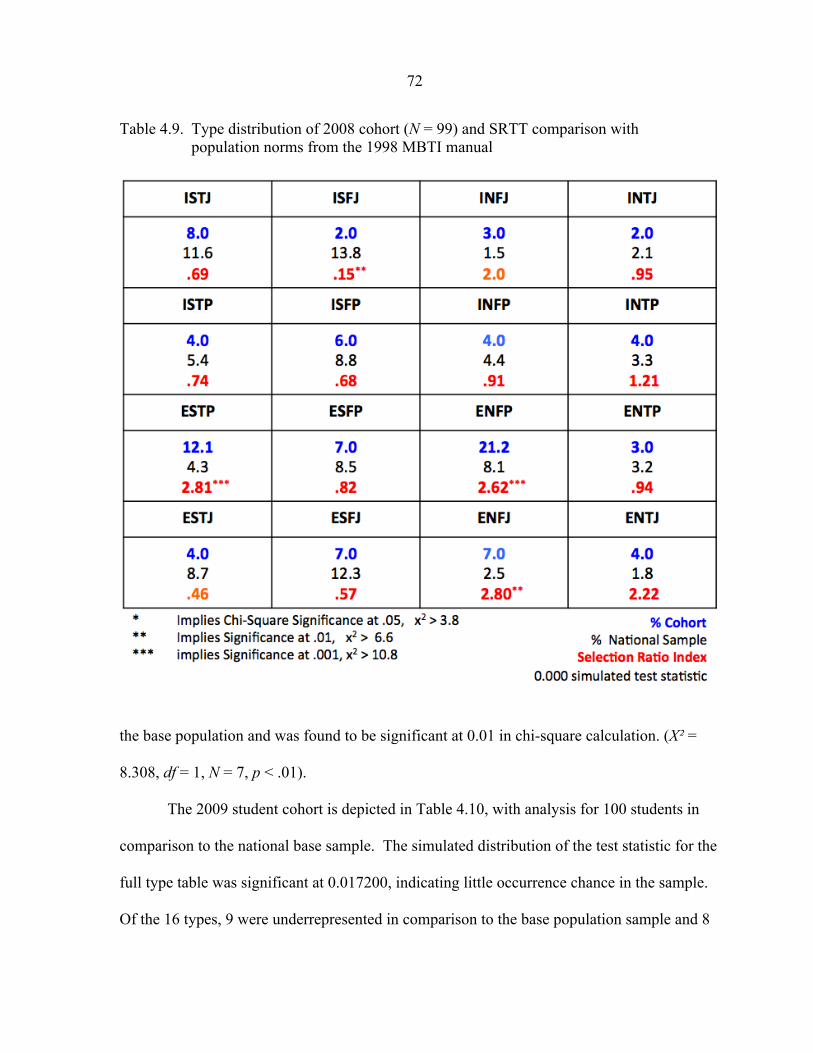
72
Table 4.9. Type distribution of 2008 cohort (N = 99) and SRTT comparison with population norms from the 1998 MBTI manual
the base population and was found to be significant at 0.01 in chi-square calculation. (X! =
8.308, df = 1, N = 7, p < .01).
The 2009 student cohort is depicted in Table 4.10, with analysis for 100 students in
comparison to the national base sample. The simulated distribution of the test statistic for the
full type table was significant at 0.017200, indicating little occurrence chance in the sample.
Of the 16 types, 9 were underrepresented in comparison to the base population sample and 8
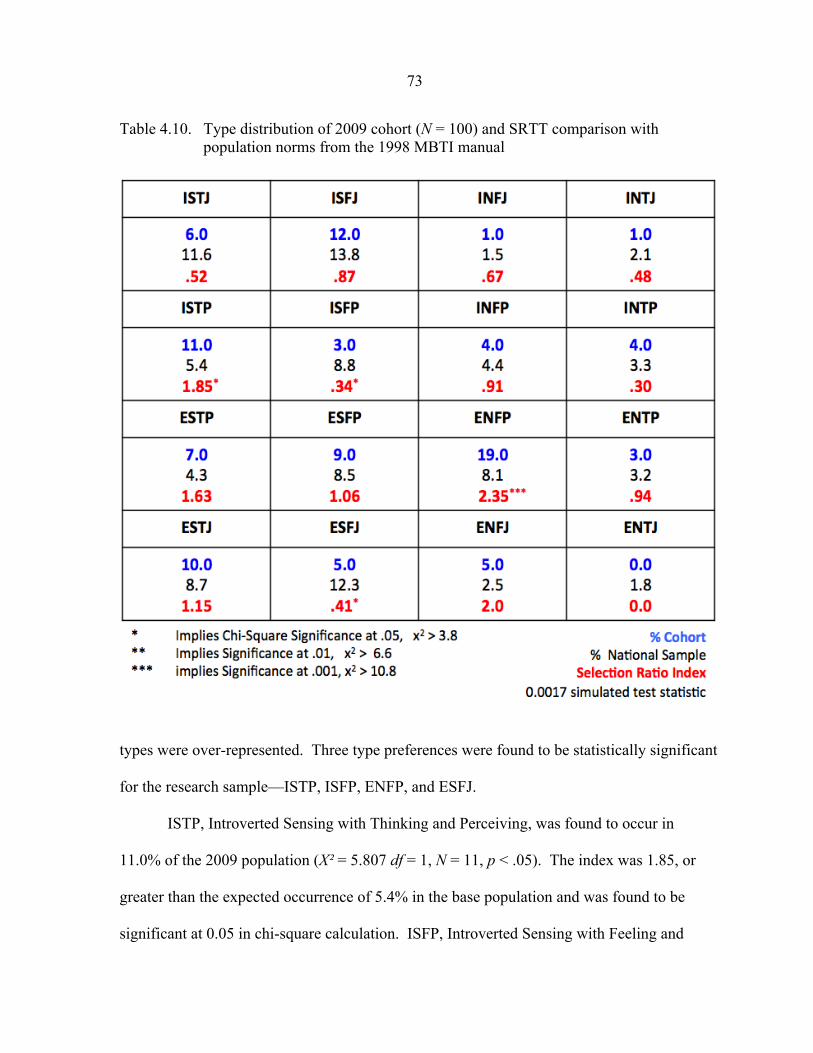
73
Table 4.10. Type distribution of 2009 cohort (N = 100) and SRTT comparison with population norms from the 1998 MBTI manual
types were over-represented. Three type preferences were found to be statistically significant
for the research sample—ISTP, ISFP, ENFP, and ESFJ.
ISTP, Introverted Sensing with Thinking and Perceiving, was found to occur in
11.0% of the 2009 population (X! = 5.807 df = 1, N = 11, p < .05). The index was 1.85, or
greater than the expected occurrence of 5.4% in the base population and was found to be
significant at 0.05 in chi-square calculation. ISFP, Introverted Sensing with Feeling and
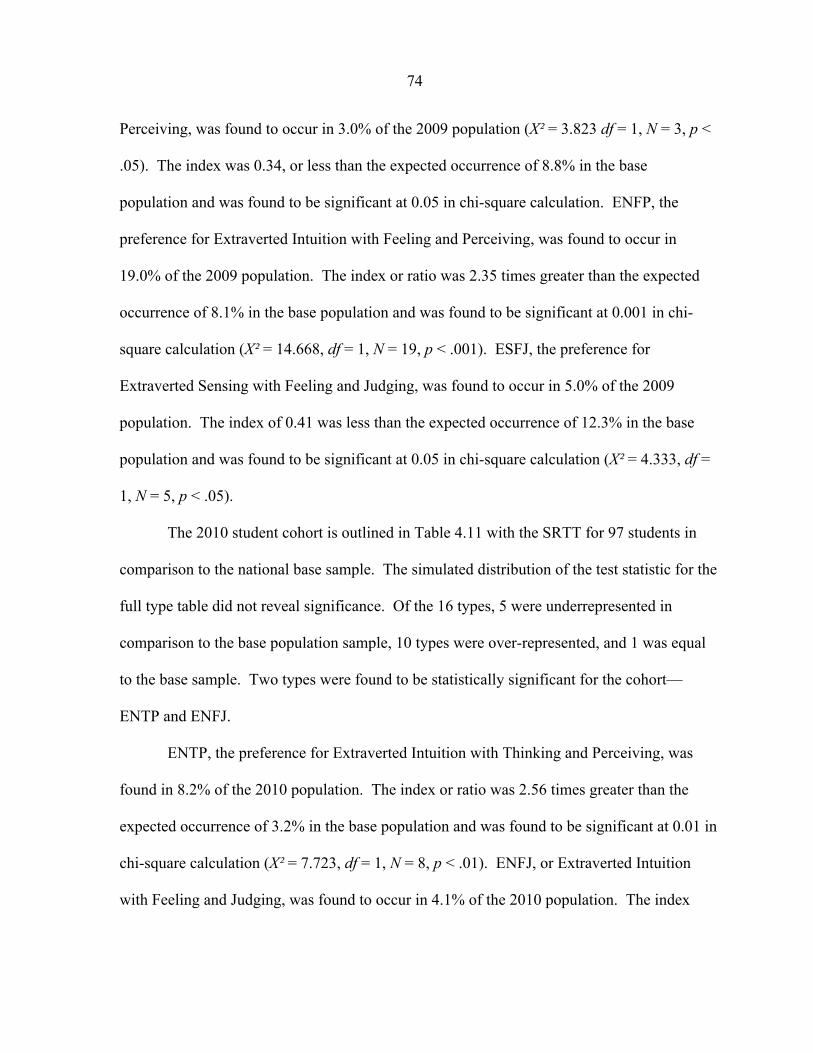
74
Perceiving, was found to occur in 3.0% of the 2009 population (X! = 3.823 df = 1, N = 3, p <
.05). The index was 0.34, or less than the expected occurrence of 8.8% in the base
population and was found to be significant at 0.05 in chi-square calculation. ENFP, the
preference for Extraverted Intuition with Feeling and Perceiving, was found to occur in
19.0% of the 2009 population. The index or ratio was 2.35 times greater than the expected
occurrence of 8.1% in the base population and was found to be significant at 0.001 in chi-
square calculation (X! = 14.668, df = 1, N = 19, p < .001). ESFJ, the preference for
Extraverted Sensing with Feeling and Judging, was found to occur in 5.0% of the 2009
population. The index of 0.41 was less than the expected occurrence of 12.3% in the base
population and was found to be significant at 0.05 in chi-square calculation (X! = 4.333, df =
1, N = 5, p < .05).
The 2010 student cohort is outlined in Table 4.11 with the SRTT for 97 students in
comparison to the national base sample. The simulated distribution of the test statistic for the
full type table did not reveal significance. Of the 16 types, 5 were underrepresented in
comparison to the base population sample, 10 types were over-represented, and 1 was equal
to the base sample. Two types were found to be statistically significant for the cohort—
ENTP and ENFJ.
ENTP, the preference for Extraverted Intuition with Thinking and Perceiving, was
found in 8.2% of the 2010 population. The index or ratio was 2.56 times greater than the
expected occurrence of 3.2% in the base population and was found to be significant at 0.01 in
chi-square calculation (X! = 7.723, df = 1, N = 8, p < .01). ENFJ, or Extraverted Intuition
with Feeling and Judging, was found to occur in 4.1% of the 2010 population. The index
75
Table 4.11. Type distribution of 2010 cohort (N = 97) and SRTT comparison with population norms from the 1998 MBTI manual
was 1.64 times more than the expected occurrence of 2.5% in the base population and was
found to be significant at 0.05 in chi-square calculation (X! = 4.452, df = 1, N = 4, p < .05).
The 2011 student cohort in Table 4.12 has the SRTT for 95 students in comparison to
the national base sample. The simulated distribution of the test statistic for the full type table
was significant at 0.000003, indicating little occurrence chance in the sample. Of the 16
types, 7 were underrepresented in comparison to the base population sample, 8 types were

76
Table 4.12. Type distribution of 2011 cohort (N = 95) and SRTT comparison with population norms from the 1998 MBTI manual
over-represented, and 1 was equal to the base sample. Nine types were found to be
statistically significant for the research sample—ISFP, ESTP, ENTP, and ESFJ.
ISFP, Introverted Sensing with Feeling and Perceiving, was found to occur in 2.1% of
the 2011 population (X! = 4.838 df = 1, N = 2, p < .05). The index was 0.24, or less than the
expected occurrence of 8.8% in the base population and was found to be significant at 0.05 in
chi-square calculation. ESTP, the preference for Extraverted Sensing with Thinking and
77
Perceiving, was found to occur in 14.7% of the 2011 population. The index or ratio was 3.42
times greater than the expected occurrence of 4.3% in the base population and was found to
be significant at 0.001 in chi-square calculation (X! = 26.065, df = 1, N = 14, p < .001).
ENTP, the preference for Extraverted Intuition with Thinking and Perceiving, was
found to occur in 7.4% of the 2011 population. The index or ratio was 2.31 times greater
than the expected occurrence of 3.2% in the base population and was found to be significant
at 0.05 in chi-square calculation (X! = 5.158, df = 1, N = 7, p < .05). ESFJ, the preference for
Extraverted Sensing with Feeling and Judging, was found to occur in 4.2% of the population.
The index of 0.34 was less than the expected occurrence of 12.3% in the basepopulation and
was found to be significant at 0.05 in chi-square calculation (X! = 5.054, df = 1, N = 4, p <
.05).
Null hypothesis 1 was rejected because there were statistically significant differences
in the distribution of type preferences in each cohort group of students and for the full
research sample. Although the test statistic distribution simulation conducted by cohort year
found the 2010 cohort group type preference not significantly different from the base sample
type population, it did contain two type preferences, ENFJ and ENTP, found to be
significantly different from the base sample.
In the full research sample of 775 students, 7 type preferences were found to be a
lower percentage than the national base sample, 8 preferences were found to be greater than
the base sample, and 1, ENTJ, was found to have an equal percentage in the research sample
as in the national base sample. For the eight cohort years in the study, only 3 type preference
comparisons of 128 (eight cohort years, 16 type preferences) were found to be equal to the
base national sample for the preference, 2 INTJ and 1 ENTJ.
78
Differences in Myers-Briggs preference by male or female by cohort year and for total
population
Research Question 3: Are there statistically significant differences in Myers-Briggs preferences for male and female students in the study by each cohort year and for the research population in comparison to the distribution of a national population?
H0 2: There is no difference between the Myers-Briggs preferences for male
and female students in the study and by each cohort year and the national
population.
To measure Research Question 3, type distributions were completed with self-
selection ratio type table (SRTT) analysis followed by a chi-square test and simulated
distribution of the test statistic to determine a probability for frequency of a given type
preference table occurring by chance. Of the eight cohorts, 2004-2011, and the full research
sample of students, only the self-selection type ratio table for females in the 2009 and 2010
cohort groups were not statistically different from the base sample national population.
Each category block in the 16 type tables illustrated in Research Question 3 contains
the type preference and three rows of type percentage and frequency information for the
research sample and base population. Row one includes the number of male students with
the type preference in the sample, the percentage of males with this preference, and the index
or ratio of that percentage to the base population sample of males with the same type
preference. Row two is comprised of the percentage population of the base sample with the
type preference, the percentage of males in the base sample with the preference, and the
percentage of females in the base sample with the type preference. Row three includes the
number of female students with the type preference in the sample, the percentage of females
in the cohort with this preference, and the index or ratio of that percentage to the base
79
population sample of females with the same type preference. A probability figure is included
for the male and female indexes if statistical significance of the ratio is found through chi-
square analysis with one degree of freedom. The simulated distribution of the test statistic
from the null population is mentioned for each table as some cell frequencies have five or
fewer students. The following are descriptions of the SRTT and type preferences with
significance for each cohort.
Research sample type preference comparison with base sample
Table 4.13 shows the SRTT for the full research sample of 775 students in
comparison to the national base sample. The simulated distribution of the test statistic for the
full type table was significant at 0.000, indicating that it was unlikely to occur by chance in
the sample. Of the 16 types, 9 types were underrepresented for males in comparison to the
base population sample and 7 were over-represented. Seven types were underrepresented for
females in comparison to the base population sample and 9 were over-represented. Eleven of
16 type preferences were found to be statistically significant for males in the research
sample, and 9 of 16 type preferences were statistically significant for females in the research
sample. Only preferences for ISTP, Introverted Sensing with Thinking and Perceiving,
INTP, Introverted Intuition with Thinking and Perceiving, and ESFP, Extraverted Sensing
with Feeling and Perceiving, were not found statistically different from the base population
sample for either male or female students.
Male type preference compared with base sample
ISTJ, Introverted Sensing with Thinking and Judging, was presented in 6.0% of males
in the full research population. The index, or ratio, at 0.37, was the smallest SRTT for males,
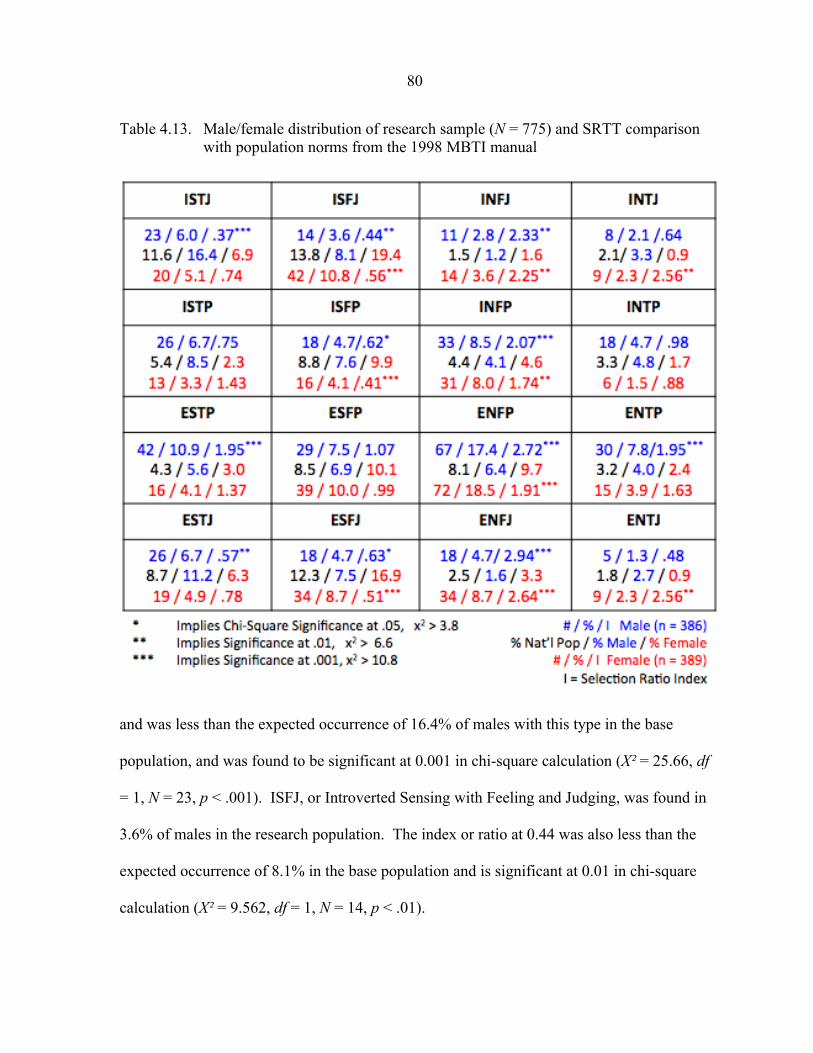
80
Table 4.13. Male/female distribution of research sample (N = 775) and SRTT comparison with population norms from the 1998 MBTI manual
and was less than the expected occurrence of 16.4% of males with this type in the base
population, and was found to be significant at 0.001 in chi-square calculation (X! = 25.66, df
= 1, N = 23, p < .001). ISFJ, or Introverted Sensing with Feeling and Judging, was found in
3.6% of males in the research population. The index or ratio at 0.44 was also less than the
expected occurrence of 8.1% in the base population and is significant at 0.01 in chi-square
calculation (X! = 9.562, df = 1, N = 14, p < .01).
81
INFJ, or Introverted Intuition with Feeling and Judging, was preferred for 2.8% of
males in the research population. The index or ratio at 2.33 was more than double the
expected occurrence of 1.2% for males in the base population and was significant at 0.01 in
chi-square calculation (X! = 8.904, df = 1, N = 11, p < .01). ISFP, or Introverted Sensing
with Feeling and Judging, was found for 4.7% of males in the research population. The
index or ratio at 0.62 demonstrated it was less than the expected occurrence of 7.6% found
for males in the base population and was significant at 0.05 in chi-square calculation (X!
=4.358, df = 1, N = 18, p < .05). INFP, which is Introverted Intuition with Feeling and
Perceiving, was found to occur in 8.5% of the research population. The index or ratio at 2.07
indicated a greater than the expected occurrence of 4.1% in the base population for males and
was found to be significant at 0.001 in chi-square calculation (X! = 18.724, df = 1, N = 33, p
< .001).
ESTP, or Extraverted Sensing with Thinking and Perceiving was found to occur for
10.9% of males in the research population. The index or ratio at 1.95 was higher than the
expected occurrence of 5.6% in the base population and was found significant at 0.001 in
chi-square calculation (X! = 19.267, df = 1, N = 42, p < .001). ENFP, or Extraverted Intuition
with Feeling and Perceiving, was found in 17.4% of males or 67 students, and was the most
frequent type preference for male students in the study. The index or ratio of 2.72 was more
than the expected occurrence of 6.4% of males in the base population and was found to be
significant at 0.001 in chi-square calculation (X! = 72.441 df = 1, N = 67, p < .001). ENTP,
or Extraverted Intuition with Thinking and Perceiving, was found in 7.8% of males. The
index or ratio of 1.95 was more than the expected occurrence of 4.0% of males in the base
82
population and was found to be significant at 0.001 in chi-square calculation (X! = 13.842 df
= 1, N = 30, p < .001).
For the ESTJ preference, Extraverted Sensing with Thinking and Judging, males
totaled 6.7% of the research population. The index or ratio of 0.57 was less than the
expected occurrence of 11.2% in the base male population and was found to be significant at
0.01 in chi-square calculation (X! = 6.848, df = 1, N = 26, p < .01). ESFJ, the preference for
Extraverted Sensing with Feeling and Judging, comprised 4.7% of males in the research
population. The index or ratio of 0.63 indicated fewer ESFJ preferences in the sample than
the expected occurrence of 7.5% in the base population and was significant at 0.05 in chi-
square calculation (X! = 4.172, df = 1, N = 18, p < .05). ENFJ, or Extraverted Intuition with
Feeling and Judging, was found to occur in 4.7% of the male population (X! = 22.458, df = 1,
N = 18, p < .001). The index or ratio was 2.94 times more than the expected occurrence of
1.6% in the base population and was found to be significant at 0.001 in chi-square
calculation.
Female type preference compared with base sample
ISFJ, or Introverted Sensing with Feeling and Judging, was found in 10.8% of
females in the research population. The index or ratio at 0.56 was fewer than the expected
occurrence of 19.4% for females in the base population and is significant at 0.001 in chi-
square calculation (X! = 14.864, df = 1, N = 42, p < .001). INFJ, or Introverted Intuition with
Feeling and Judging, was preferred for 3.6% of females in the research population. The
index or ratio at 2.25 indicated this preference occurred with more frequency than the 1.6%
83
found for females in the base population and was significant at 0.01 in chi-square calculation
(X! = 9.813, df = 1, N = 14, p < .01).
INTJ, or Introverted Intuition with Thinking and Judging, was found for 2.3% of
females in the research population. The index or ratio at 2.56 demonstrated a greater than
expected occurrence of 0.9% was found for females in the base population and was
significant at 0.01 in chi-square calculation (X! =8.643, df = 1, N = 9, p < .01). ISFP, or
Introverted Sensing with Feeling and Perceiving, was found for 4.1% of females in the
research population. The index or ratio at 0.41 demonstrated less than the expected
occurrence of 9.9% found for females in the base population and was significant at 0.001 in
chi-square calculation (X! =13.149, df = 1, N = 16, p < .001). INFP, or Introverted Intuition
with Feeling and Perceiving, was found in 8.0% of females in the research population. The
index or ratio at 1.74 was greater than the expected occurrence of 4.6% in the base
population for females and was found significant at 0.01 in chi-square calculation (X! =
9.587, df = 1, N = 31, p < .01).
ENFP, the preference for Extraverted Intuition with Feeling and Perceiving, was
found for 18.5% of females in the research population, which at 72 students was the most
frequent preference for female students in the study. This index or ratio was 1.91 times more
than the expected occurrence of 9.7% of females in the base population and was found to be
significant at 0.001 in chi-square calculation (X! = 31.207, df = 1, N = 72, p < .001). ESFJ,
the preference for Extraverted Sensing with Feeling and Judging, comprised 5.1% of females
in the research population. The index or ratio of 0.51 indicated fewer females with ESFJ
preferences in the sample than the expected occurrence of 16.9% in the base population and
was significant at 0.001 in chi-square calculation (X! = 15.295, df = 1, N = 34, p < .001).
84
ENFJ, or Extraverted Intuition with Feeling and Judging, was found to occur in 8.7% of the
female population (X! = 35.113, df = 1, N = 34, p < .001). The index or ratio was 2.64 times
more than the expected occurrence of 3.3% in the base population and was found to be
significant at 0.001 in chi-square calculation. ENTJ, or Extraverted Intuition with Feeling
and Judging, was found in 2.3% of the female population (X! = 8.643, df = 1, N = 9, p < .01).
The index or ratio was 2.56 times more than the expected occurrence of 0.9% in the base
population and was found to be significant at 0.01 in chi-square calculation.
Male and female 2004 distribution compared with base sample
Table 4.14 shows the SRTT for the 2004 cohort of 97 students in comparison to the national
base sample. The simulated distribution of the test statistic for the full type table was
significant at 0.000 (male) and 0.000001 (female), indicating little occurrence of chance in
the sample. Of the 16 types, 9 types were underrepresented for males in comparison to the
base population sample and 7 were over-represented. Eight types were underrepresented and
8 were over-represented for females in comparison to the base population sample. Three of
16 type preferences were found to be statistically significant for males and for females in the
research sample.
ISTJ, Introverted Sensing with Thinking and Judging, was presented in 4.3% of males
in the full research population. The index or ratio at 0.26 was less than the expected
occurrence of 16.4% of males with this type in the base population and was found to be
significant at 0.05 in chi-square calculation (X! = 4.229, df = 1, N = 2, p < .05). INFP, or
Introverted Intuition with Feeling and Perceiving, was found in 23.4% of males in the 2004
population. The index or ratio was 5.70 times more than the expected occurrence of 4.1% of
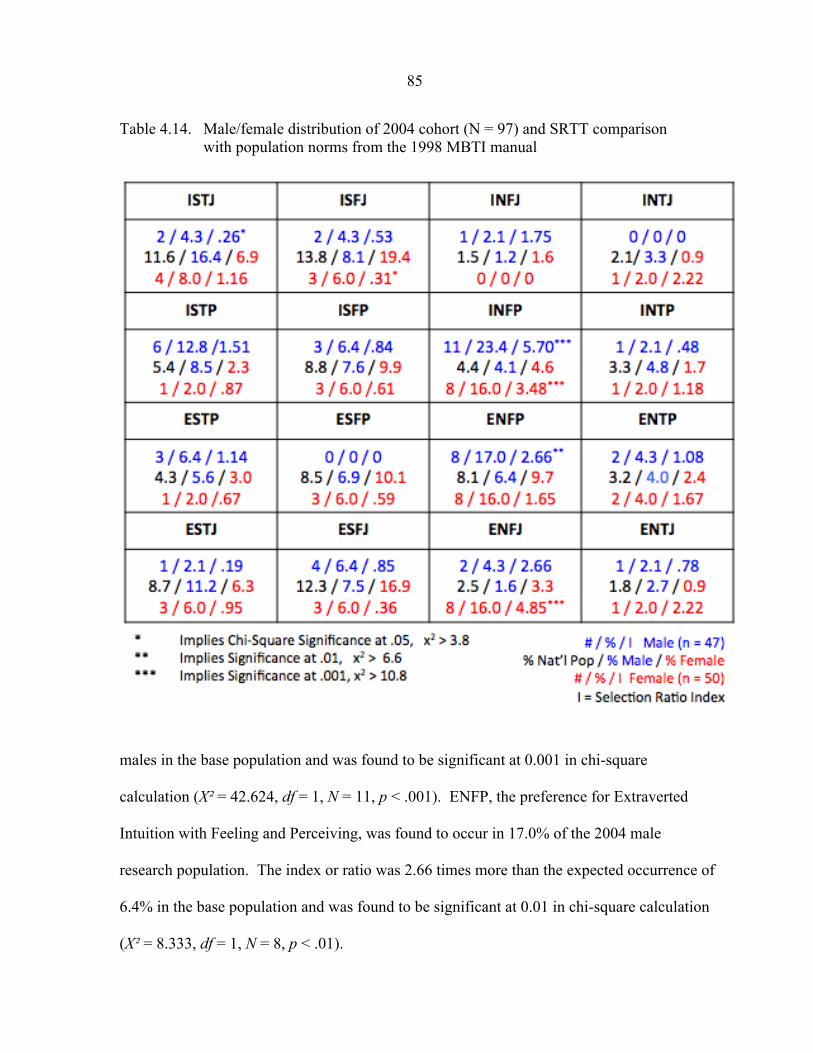
85
Table 4.14. Male/female distribution of 2004 cohort (N = 97) and SRTT comparison with population norms from the 1998 MBTI manual
males in the base population and was found to be significant at 0.001 in chi-square
calculation (X! = 42.624, df = 1, N = 11, p < .001). ENFP, the preference for Extraverted
Intuition with Feeling and Perceiving, was found to occur in 17.0% of the 2004 male
research population. The index or ratio was 2.66 times more than the expected occurrence of
6.4% in the base population and was found to be significant at 0.01 in chi-square calculation
(X! = 8.333, df = 1, N = 8, p < .01).
86
ISFJ, or Introverted Sensing with Feeling and Judging, was found in 6.0% of females
in the 2004 population. The index or ratio at 0.31 was fewer than the expected occurrence of
19.4% for females in the base population and was significant at 0.05 in chi-square calculation
(X! = 4.628, df = 1, N = 3, p < .05). INFP, or Introverted Intuition with Feeling and
Perceiving, was found to occur in 16.0% of females in the 2004 population. The index or
ratio at 3.48 was greater than the expected occurrence of 4.6% in the base population for
females and was found to be significant at 0.001 in chi-square calculation (X! = 14.126, df =
1, N = 8, p < .001). ENFJ, or Extraverted Intuition with Feeling and Judging, was found to
occur 16.0% of the 2004 female population (X! = 24.438, df = 1, N = 8, p < .001). The index
or ratio was 4.85 times more than the expected occurrence of 3.3% in the base female
population and was found to be significant at 0.001 in chi-square calculation.
Male and female 2005 distribution compared with base sample
The 2005 cohort is shown in Table 4.15 with the SRTT for 96 students in comparison
to the national base sample. The simulated distribution of the test statistic for the full type
table was significant at 0.00065 (male) and 0.000077 (female), indicating little occurrence of
chance in the sample. Of the 17 types, 8 were underrepresented and 8 were over-represented
for males in the cohort. Seven types were underrepresented for females in comparison to the
base population sample and 9 were over-represented. Five of 16 type preferences were found
to be statistically significant for males in the 2005 sample, and 4 of 16 type preferences were
found to be statistically significant for females.
ISTJ, Introverted Sensing with Thinking and Judging, was not found among males in
the 2005 population. The index or ratio at 0.0 was less than the expected occurrence of

87
Table 4.15. Male/female distribution of 2005 cohort (N = 96) and SRTT comparison with population norms from the 1998 MBTI manual
16.4% of males with this type in the base population and was found to be significant at 0.01
in chi-square calculation (X! = 8.700, df = 1, N = 0, p < .01). INFJ, or Introverted Intuition
with Feeling and Judging, was found in 5.7% of the population (X! = 8.703, df = 1, N = 3, p <
.005). The index or ratio was 4.75 times more than the expected occurrence of 1.2% in the
base population and was found to be significant at 0.005 in chi-square calculation. ISTP, or
Introverted Sensing with Thinking and Perceiving, was also not found in the 2005 population

88
(X! = 4.51, df = 1, N = 0, p < .05). The index or ratio of zero was less than the expected
occurrence of 5.4% in the base population and was found significant at 0.05 in chi-square
calculation.
ENFP, the preference for Extraverted Intuition with Feeling and Perceiving, was
found to occur in 20.1% of males in the 2005 population. The index or ratio was 3.14 times
more than the expected occurrence of 6.4% in the base population and was found to be
significant at 0.001 in chi-square calculation (X! = 17.083, df = 1, N = 11, p < .001). ENTP,
the preference for Extraverted Intuition with Thinking and Perceiving, was found to occur in
11.3% of males in the 2005 population. The index or ratio was 2.83 times more than the
expected occurrence of 4.0% in the base population and was found to be significant at 0.001
in chi-square calculation (X! = 7.101, df = 1, N = 6, p < .01).
ISFJ, or Introverted Sensing with Feeling and Judging, was found in 4.7% of females
in the 2005 population. The index or ratio at 0.24 was lower than the expected occurrence of
19.4% for females in the base population and was significant at 0.05 in chi-square calculation
(X! = 4.820, df = 1, N = 2, p < .05). INFJ, or Introverted Intuition with Feeling and Judging,
was found in 7.0% of females in the 2005 population. The index or ratio at 4.38 was greater
than the expected occurrence of 1.6% for females in the base population and was significant
at 0.01 in chi-square calculation (X! = 7.733, df = 1, N = 3, p < .01). INFP, or Introverted
Intuition with Feeling and Perceiving, was found to occur in 11.6% of females in the 2005
population. The index or ratio at 2.52 was greater than the expected occurrence of 4.6% in
the base population for females and was found to be significant at 0.05 in chi-square
calculation (X! = 4.606, df = 1, N = 5, p < .05). Extraverted Intuition with Feeling and
Judging, or ENFJ, was found to occur 11.6% of the 2005 female population (X! = 9.026, df =
89
1, N = 5, p < .01). The index or ratio was 3.52 times more than the expected occurrence of
3.3% in the base female population and was found to be significant at at 0.01 in chi-square
calculation.
Male and female 2006 distribution compared with base sample
The 2006 student cohort is depicted in Table 4.16 with the SRTT for 95 students in
comparison to the national base sample. The simulated distribution of the test statistic for the
full type table was significant at 0.00007 (male) and 0.000003 (female), indicating little
occurrence of chance in the sample. Of the 16 types, 8 were underrepresented and 8 were
over-represented for males and females in the cohort. Four of 16 type preferences were
found to be statistically significant for males in the 2006 sample, and 2 of 16 type
preferences were found to be statistically significant for females.
INFJ, or Introverted Intuition with Feeling and Judging, was found in 5.0% of males
in the 2006 population. The index or ratio at 4.17 was greater than the occurrence of 1.2% in
the base male population and was significant at 0.05 in chi-square calculation (X! = 4.813, df
= 1, N = 2, p < .05). INFP, or Introverted Intuition with Feeling and Perceiving, was found in
12.5% of males in the 2006 population (X! = 6.883, df = 1, N = 5, p < .01). The 3.05 index
was greater than the expected occurrence of 4.1% in the base population and was found to be
significant at 0.01 in chi-square calculation. ESFP, or Extraverted Sensing with Feeling and
Perceiving, was found to occur for 17.5% of males in the 2006 population. The index or
ratio at 2.54 indicated a higher than expected occurrence of 6.9% in the base population and
was found significant at 0.05 in chi-square calculation (X! = 6.514, df = 1, N = 7, p < .05).
ENFP, Extraverted Intuition with Feeling and Perceiving, was found in 20.0% of males in the
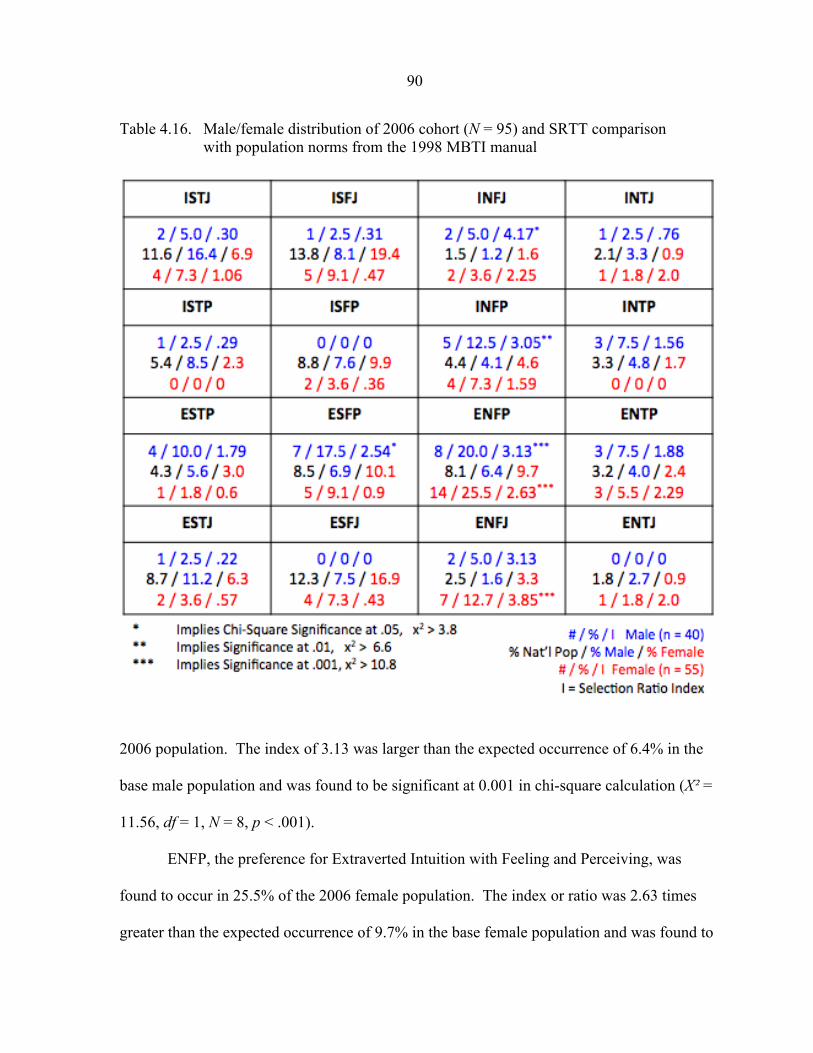
90
Table 4.16. Male/female distribution of 2006 cohort (N = 95) and SRTT comparison with population norms from the 1998 MBTI manual
2006 population. The index of 3.13 was larger than the expected occurrence of 6.4% in the
base male population and was found to be significant at 0.001 in chi-square calculation (X! =
11.56, df = 1, N = 8, p < .001).
ENFP, the preference for Extraverted Intuition with Feeling and Perceiving, was
found to occur in 25.5% of the 2006 female population. The index or ratio was 2.63 times
greater than the expected occurrence of 9.7% in the base female population and was found to
91
be significant at 0.001 in chi-square calculation (X! = 14.044, df = 1, N = 14, p < .001).
ENFJ, or Extraverted Intuition with Feeling and Judging, was found to occur in 12.7% of the
2006 female population. The index or ratio was 3.85 times more than the expected
occurrence of 3.3% in the base population and was found to be significant at 0.001 in chi-
square calculation (X! = 14.743, df = 1, N = 7, p < .001).
Male and female 2007 distribution compared with base sample
The 2007 student cohort is illustrated with male and female type preference in Table 4.17
with the SRTT for 96 students in comparison to the national base sample. The simulated
distribution of the test statistic for the full type table was significant at 0.000005 (male) and
0.005760 (female), indicating the small occurrence of chance in the sample. Of the 16 types,
we are underrepresented and 8 were over-represented for males in the cohort. Of the 16
types, 7 were underrepresented and 9 were over-represented for females in the cohort. Four
of 16 type preferences were found to be statistically significant for males in the 2007 sample,
whereas 3 of 16 type preferences were found to be statistically significant for females.
ISTJ, Introverted Sensing with Thinking and Judging, was found to occur in 2.2% of
the 2007 male population (X! = 5.516, df = 1, N = 1, p < .05). The index was 0.13, or less
than the expected occurrence of 16.4% in the base male population and was found to be
significant at 0.05 in chi-square calculation. INFJ, or Introverted Intuition with Feeling and
Judging, was found in 6.6% of males (X! = 11.207, df = 1, N = 3, p < .001). The index or
ratio was 5.5 times more than the expected occurrence of 1.2% in the base male population
and was found to be significant at 0.001 in chi-square calculation. ENFP, the preference for
Extraverted Intuition with Feeling and Perceiving, was found to occur in 26.7% of the 2007
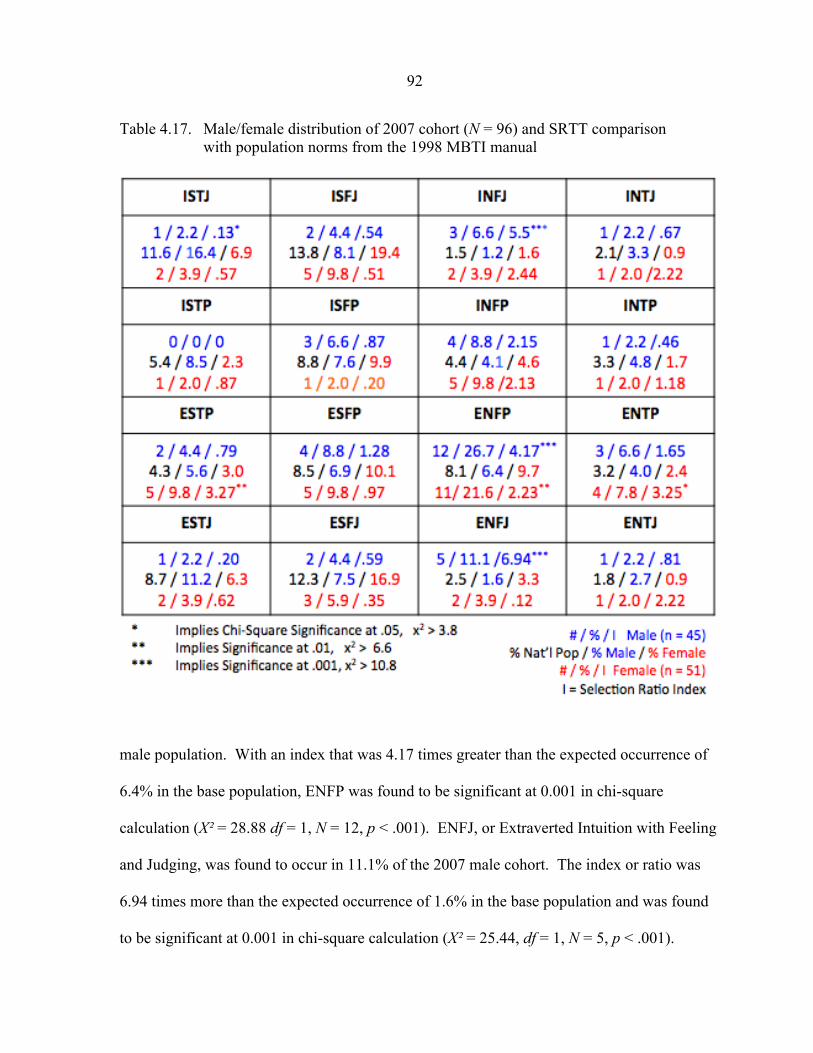
92
Table 4.17. Male/female distribution of 2007 cohort (N = 96) and SRTT comparison with population norms from the 1998 MBTI manual
male population. With an index that was 4.17 times greater than the expected occurrence of
6.4% in the base population, ENFP was found to be significant at 0.001 in chi-square
calculation (X! = 28.88 df = 1, N = 12, p < .001). ENFJ, or Extraverted Intuition with Feeling
and Judging, was found to occur in 11.1% of the 2007 male cohort. The index or ratio was
6.94 times more than the expected occurrence of 1.6% in the base population and was found
to be significant at 0.001 in chi-square calculation (X! = 25.44, df = 1, N = 5, p < .001).
93
ESTP, which is Extraverted Sensing with Thinking and Perceiving, was found to
occur in 9.8% of females in the 2007 population. The index or ratio was 3.27 times greater
than the expected occurrence of 3.0% in the base female population and was found to be
significant at 0.01 in chi-square calculation (X! = 7.870, df = 1, N = 5, p < .01). ENFP, the
preference for Extraverted Intuition with Feeling and Perceiving, was found to occur in
21.6% of the 2007 female population. With an index of 2.23 times greater than the expected
occurrence of 9.7% in the base population, ENFP was found to be significant at 0.01 in chi-
square calculation (X! = 7.394, df = 1, N = 11, p < .01). ENTP, or Extraverted Intuition with
Thinking and Perceiving, was found in 7.8% of 2007 females. The index or ratio was 3.25
times greater than the expected occurrence of 2.4% in the base population and was found to
be significant at 0.05 in chi-square calculation (X! = 6.334, df = 1, N = 4, p < .05).
Male and female 2008 distribution compared with base sample
The 2008 student cohort is provided for male and female type preference in Table
4.18 with the SRTT for 99 students in comparison to the national base sample. The
simulated distribution of the test statistic for the full type table was significant at 0.000
(male) and 0.000029 (female), indicating the small occurrence of chance in either sample.
Of the 16 types, 10 were underrepresented and 6 were over-represented for males in the
cohort. For females in the cohort, 9 types are underrepresented and 7 are over-represented.
Three of 16 type preferences were found to be statistically significant for males in the 2008
sample, whereas 4 of 16 type preferences were found to be statistically significant for
females.
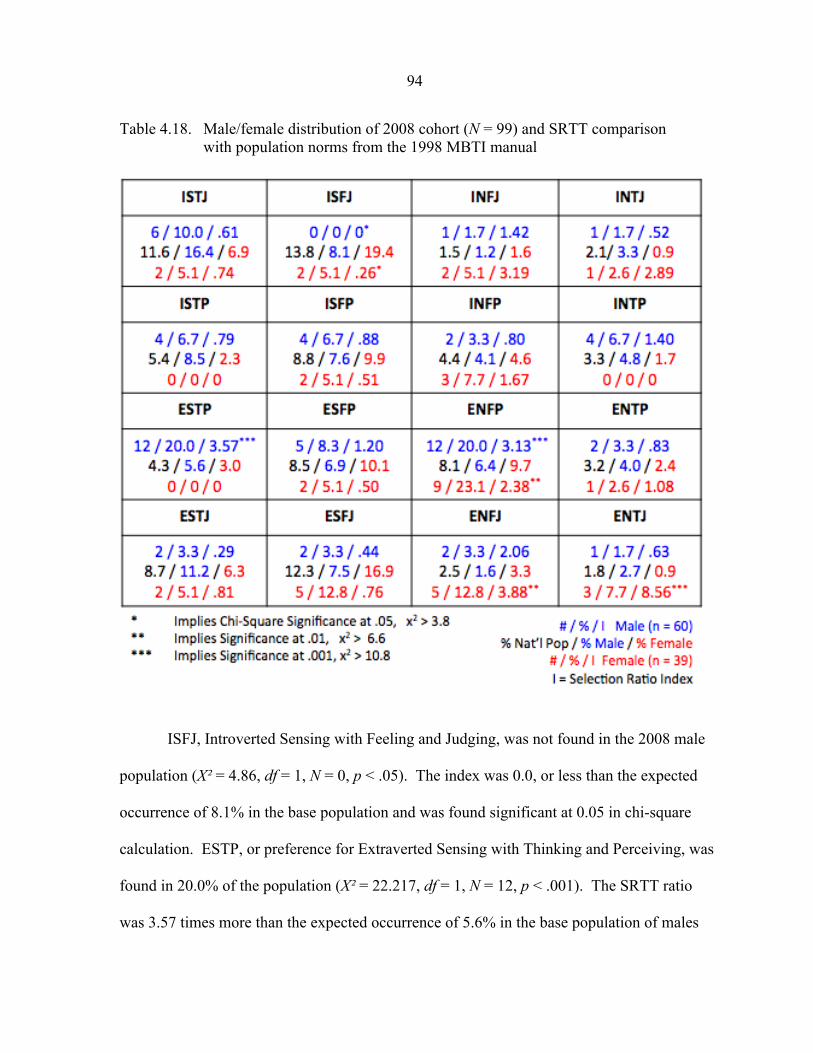
94
Table 4.18. Male/female distribution of 2008 cohort (N = 99) and SRTT comparison with population norms from the 1998 MBTI manual
ISFJ, Introverted Sensing with Feeling and Judging, was not found in the 2008 male
population (X! = 4.86, df = 1, N = 0, p < .05). The index was 0.0, or less than the expected
occurrence of 8.1% in the base population and was found significant at 0.05 in chi-square
calculation. ESTP, or preference for Extraverted Sensing with Thinking and Perceiving, was
found in 20.0% of the population (X! = 22.217, df = 1, N = 12, p < .001). The SRTT ratio
was 3.57 times more than the expected occurrence of 5.6% in the base population of males
95
and was found to be significant at 0.001 in chi-square calculation. ENFP, the preference for
Extraverted Intuition with Feeling and Perceiving, was found to be 20.0% of the 2008 male
population. The index or ratio was 3.13 times greater than the expected occurrence of 6.4%
in the base population and was found significant at 0.001 in chi-square calculation (X! =
17.34, df = 1, N = 12, p < .001).
ISFJ, or Introverted Sensing with Feeling and Judging, was found in 5.1% of females
in the 2008 population. The index or ratio at 0.26 was lower than the expected occurrence of
19.4% for females as in the base population and was significant at 0.05 in chi-square
calculation (X! = 4.098, df = 1, N = 2, p < .05). ENFP, or Extroverted Intuition with Feeling
and Perceiving, was found to occur in 23.1% of females in the 2008 population. The index
or ratio at 2.38 was greater than the expected occurrence of 9.7% in the base population for
females and is found to be significant at 0.01 in chi-square calculation (X! = 7.209, df = 1, N
= 9, p < .01). Extraverted Intuition with Feeling and Judging, or ENFJ, was found to occur
12.8% of the 2008 female population (X! = 10.670, df = 1, N = 5, p < .01). The index or ratio
was 3.88 times more than the expected occurrence of 3.3% in the base female population and
was found to be significant at 0.01 in chi-square calculation. Extraverted Intuition with
Thinking and Judging, or ENTJ, was found for 7.7% of the 2008 female population (X! =
20.064, df = 1, N = 3, p < .001). The index or ratio was 3.52 times more than the expected
occurrence of 0.9% in the base female population and was found to be significant at 0.001 in
chi-square calculation.
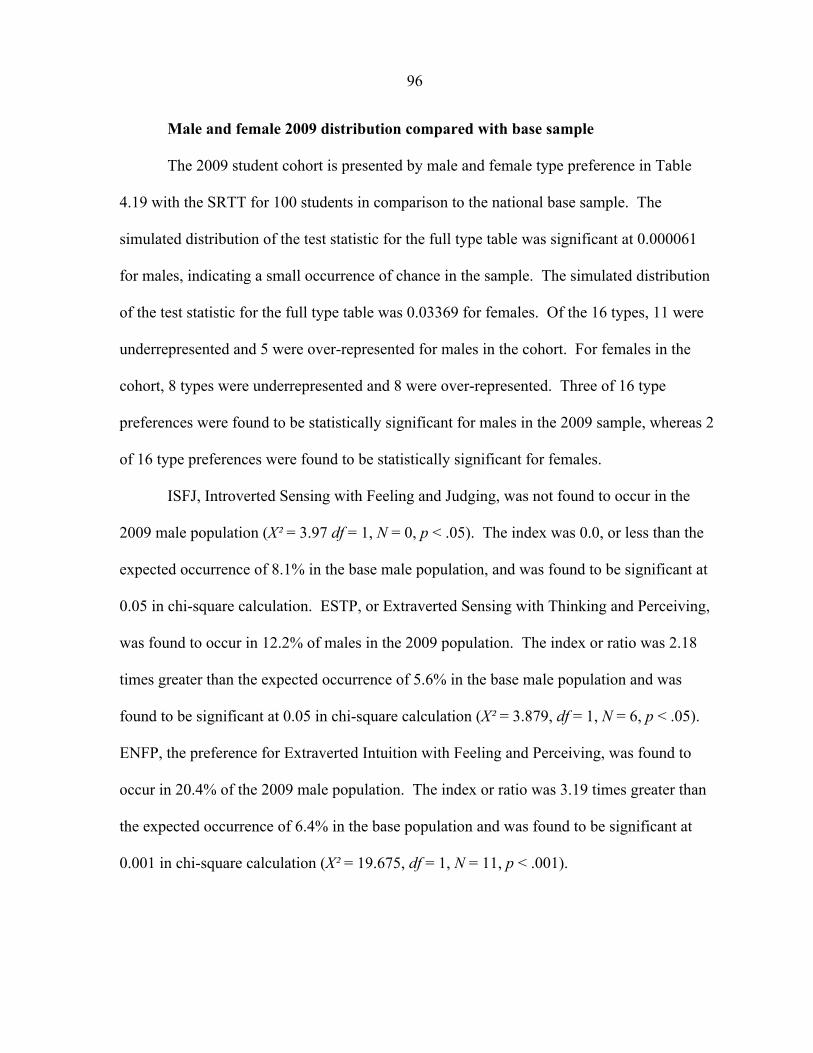
96
Male and female 2009 distribution compared with base sample
The 2009 student cohort is presented by male and female type preference in Table
4.19 with the SRTT for 100 students in comparison to the national base sample. The
simulated distribution of the test statistic for the full type table was significant at 0.000061
for males, indicating a small occurrence of chance in the sample. The simulated distribution
of the test statistic for the full type table was 0.03369 for females. Of the 16 types, 11 were
underrepresented and 5 were over-represented for males in the cohort. For females in the
cohort, 8 types were underrepresented and 8 were over-represented. Three of 16 type
preferences were found to be statistically significant for males in the 2009 sample, whereas 2
of 16 type preferences were found to be statistically significant for females.
ISFJ, Introverted Sensing with Feeling and Judging, was not found to occur in the
2009 male population (X! = 3.97 df = 1, N = 0, p < .05). The index was 0.0, or less than the
expected occurrence of 8.1% in the base male population, and was found to be significant at
0.05 in chi-square calculation. ESTP, or Extraverted Sensing with Thinking and Perceiving,
was found to occur in 12.2% of males in the 2009 population. The index or ratio was 2.18
times greater than the expected occurrence of 5.6% in the base male population and was
found to be significant at 0.05 in chi-square calculation (X! = 3.879, df = 1, N = 6, p < .05).
ENFP, the preference for Extraverted Intuition with Feeling and Perceiving, was found to
occur in 20.4% of the 2009 male population. The index or ratio was 3.19 times greater than
the expected occurrence of 6.4% in the base population and was found to be significant at
0.001 in chi-square calculation (X! = 19.675, df = 1, N = 11, p < .001).
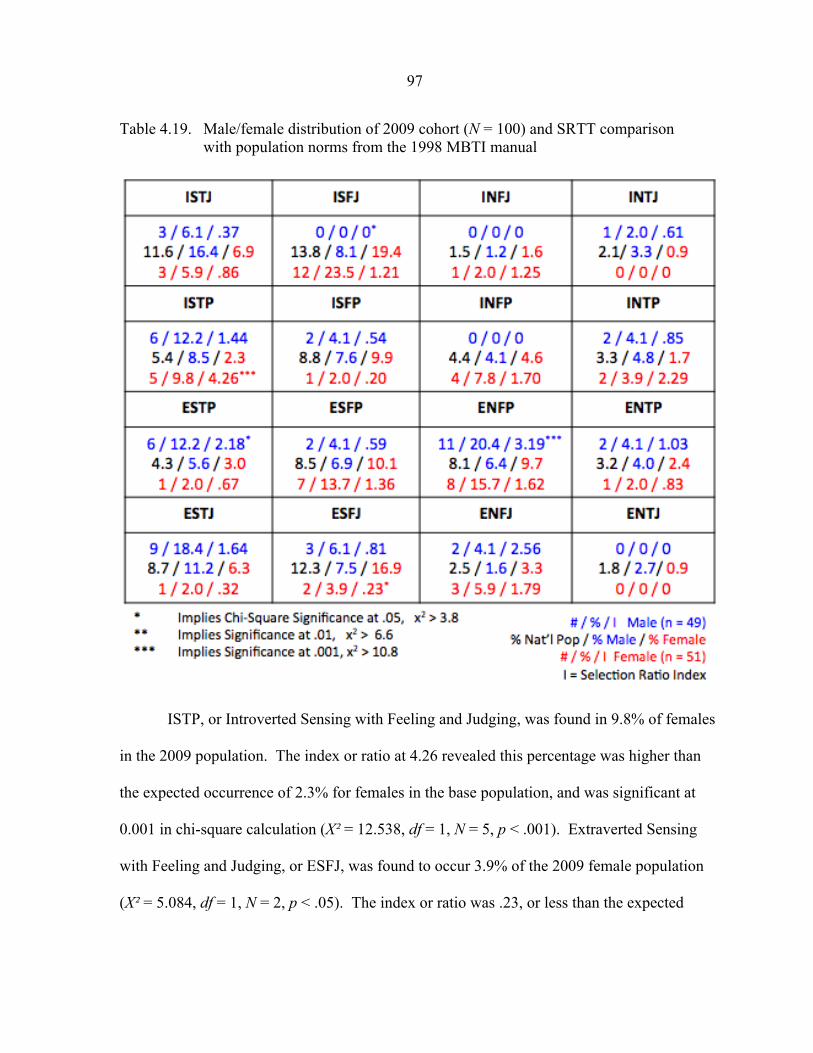
97
Table 4.19. Male/female distribution of 2009 cohort (N = 100) and SRTT comparison with population norms from the 1998 MBTI manual
ISTP, or Introverted Sensing with Feeling and Judging, was found in 9.8% of females
in the 2009 population. The index or ratio at 4.26 revealed this percentage was higher than
the expected occurrence of 2.3% for females in the base population, and was significant at
0.001 in chi-square calculation (X! = 12.538, df = 1, N = 5, p < .001). Extraverted Sensing
with Feeling and Judging, or ESFJ, was found to occur 3.9% of the 2009 female population
(X! = 5.084, df = 1, N = 2, p < .05). The index or ratio was .23, or less than the expected

98
occurrence of 16.9% in the base female population and was found to be significant at 0.05 in
chi-square calculation.
Male and female 2010 distribution compared with base sample
The 2010 student cohort by male and female type preference in Table 4.20 provides
the SRTT for 97 students in comparison to the national base sample. The simulated
distribution of the test statistic for the full type table was significant at 0.000033 for males,
indicating a very small occurrence of chance in either sample. The simulated distribution of
the test statistic for the full type table was 0.6317 for females. Of the 16 types, 8 were
underrepresented and 8 were over-represented for males in the cohort. For females in the
cohort, 10 types were underrepresented and 6 were over-represented. One of 16 type
preferences was found to be statistically significant for males in the 2010 sample, whereas 2
of 16 type preferences were found to be statistically significant for females.
ENTP, the preference for Extraverted Intuition with Thinking and Perceiving, was
found in 17.8% of the 2010 male population. The index or ratio was 4.45 times greater than
the expected occurrence of 4.0% in the base male population and was found to be significant
at 0.001 in chi-square calculation (X! = 21.356, df = 1, N = 8, p < .001). ISTP, or Introverted
Sensing with Feeling and Judging, was found in 7.6% of females in the 2010 population.
The index or ratio at 3.30 was higher than the expected occurrence of 2.3% for females in the
base population and was significant at 0.05 in chi-square calculation (X! = 6.533, df = 1, N =
4, p < .05). Extraverted Intuition with Thinking and Judging, or ENTJ, was found to occur in
3.8% of the 2010 female population (X! = 4.980, df = 1, N = 2, p < .05). The index or ratio

99
Table 4.20. Male/female distribution of 2010 cohort (N = 97) and SRTT comparison with population norms from the 1998 MBTI manual
was 4.22, or greater than the expected occurrence of 0.9% in the base female population, and
found to be significant at 0.05 in chi-square calculation.
Male and female 2011 distribution compared with base sample
The 2011 student cohort in Table 4.21 has the SRTT for 95 students in comparison to
the national base sample. The simulated distribution of the test statistic for the full type table
was significant at 0.000024 for males and 0.003890 for females, indicating a small
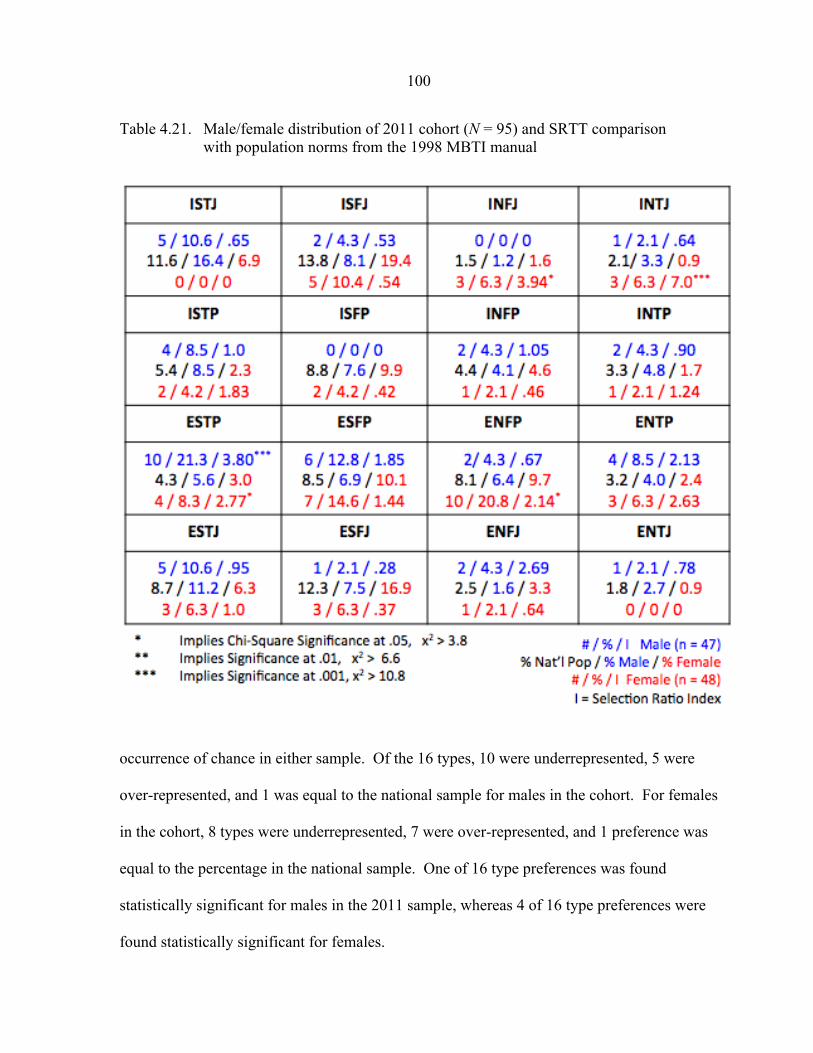
100
Table 4.21. Male/female distribution of 2011 cohort (N = 95) and SRTT comparison with population norms from the 1998 MBTI manual
occurrence of chance in either sample. Of the 16 types, 10 were underrepresented, 5 were
over-represented, and 1 was equal to the national sample for males in the cohort. For females
in the cohort, 8 types were underrepresented, 7 were over-represented, and 1 preference was
equal to the percentage in the national sample. One of 16 type preferences was found
statistically significant for males in the 2011 sample, whereas 4 of 16 type preferences were
found statistically significant for females.

101
ESTP, which is Extroverted Sensing with Thinking and Perceiving, was found to
occur in 21.3% of males in the 2011 population. The index or ratio at 3.80 was greater than
the expected occurrence of 5.6% in the base population for males and was found to be
significant at 0.001 in chi-square calculation (X! = 20.652, df = 1, N = 10, p < .001).
Introverted Intuition with Feeling and Judging, or INFJ, was found to occur in 6.3%
of the 2011 female population (X! = 6.458, df = 1, N = 3, p < .05). The index or ratio was
3.94 times more than the expected occurrence of 1.6% in the base female population and was
found to be significant at 0.05 in chi-square calculation. Introverted Intuition with Thinking
and Judging, or INTJ, was found to occur 6.3% of the 2011 female population (X! = 15.360,
df = 1, N = 3, p < .001). The index or ratio was 7.0 times more than the expected occurrence
of 0.9% in the base female population and was found to be significant at 0.001 in chi-square
calculation. ESTP, the preference for Extraverted Sensing with Thinking and Perceiving,
was found to occur in 8.3% of the 2011 female population. The index or ratio was 2.77 times
greater than the expected occurrence of 3.0% in the base population and was found to be
significant at 0.05 in chi-square calculation (X! = 4.551, df = 1, N = 4, p < .05). ENFP, the
preference for Extraverted Intuition with Feeling and Perceiving, was found to occur in
20.8% of the population. The index of 2.14 demonstrated a greater than the expected
occurrence of 9.7% in the base female population and was found to be significant at 0.05 in
chi-square calculation (X! = 6.119, df = 1, N = 10, p < .05).
Null hypothesis 2 was rejected because there were statistically significant differences
in the distribution of type preferences among males and females in each cohort group of
students and for the full research sample. Although the test statistic distribution simulation
conducted by cohort year found the 2009 and 2010 female cohort group type preferences not
102
significantly different from the base sample type population, each cohort demonstrated two
type preferences found to be significantly different from the base sample.
ENFP, or Extraverted Intuition with Feeling and Perceiving, was the most frequent
type preference for the research population, with males at 17.4% (N = 67) and females at
18.5% (N = 71). The least frequent preference for male students was ENTJ, or Extraverted
Intuition with Thinking and Judging, at 1.3% of the population (N = 5). The least frequent
preference for female students was INTP, or Introverted Intuition with Thinking and
Perceiving, at 1.5% (N = 6). In the full research sample and eight cohort years, only one type
preference for males or females was found to be equal to the base national sample for the
preference, ISTP for male students and ESTJ for female students, both in the 2010 cohort
year. Research Question 3 revealed significant differences in Myers-Briggs preferences for
male and female for students in the study by each cohort year and for the research population
in comparison to the distribution of a national population.
Differences in Myers-Briggs preference for students with STEM majors by cohort year
and for total population
Research Question 4: Are there statistically significant differences in Myers-Briggs preferences students with STEM majors in the study by each cohort year and for the research population in comparison to the distribution of a national population?
H0 2: There is no difference between the Myers-Briggs preferences for
students with STEM majors in the study and by each cohort year and the
national population.
To measure Research Question 4, type distributions with self-selection ratio type
table (SRTT) analysis were completed for students with STEM majors (N = 429) and non-

103
STEM majors (N = 346) followed by a chi-square test and simulated distribution of the test
statistic to determine a probability for frequency of a given type preference table occurring
by chance. Each category block in the sixteen type tables illustrated in Research Question 4
contains the type preference and three rows of type percentage and frequency information for
the research sample and base population. Row one includes the number of STEM students
with the type preference in the sample, the percentage of STEM students with this
preference, and the index or ratio of that percentage to the base population sample with the
same type preference. Row two is the percentage of the base sample population with the
type preference. Row three includes the number of non-STEM students with the type
preference in the sample, the percentage of non-STEM students in the cohort with this
preference, and the index or ratio of that percentage to the base population sample with the
same type preference. A probability figure is included for the STEM and non-STEM indexes
if statistical significance of the ratio is found through chi-square analysis with one degree of
freedom. The simulated distribution of the test statistic from the null population is
mentioned for each table as some cell frequencies have five or fewer students. The following
are descriptions of the SRTT and type preferences with significance for each cohort.
Research sample STEM and non-STEM major type preference comparison
Table 4.22 shows the SRTT for the full research sample of 775 students in
comparison to the national base sample. The simulated distribution of the test statistic for
STEM and non-STEM tables was significant at 0.000, indicating that the results are unlikely
to occur by chance in the sample. Of the 16 types, 6 were underrepresented for STEM
majors in comparison to the base population sample and 10 were over-represented. Nine
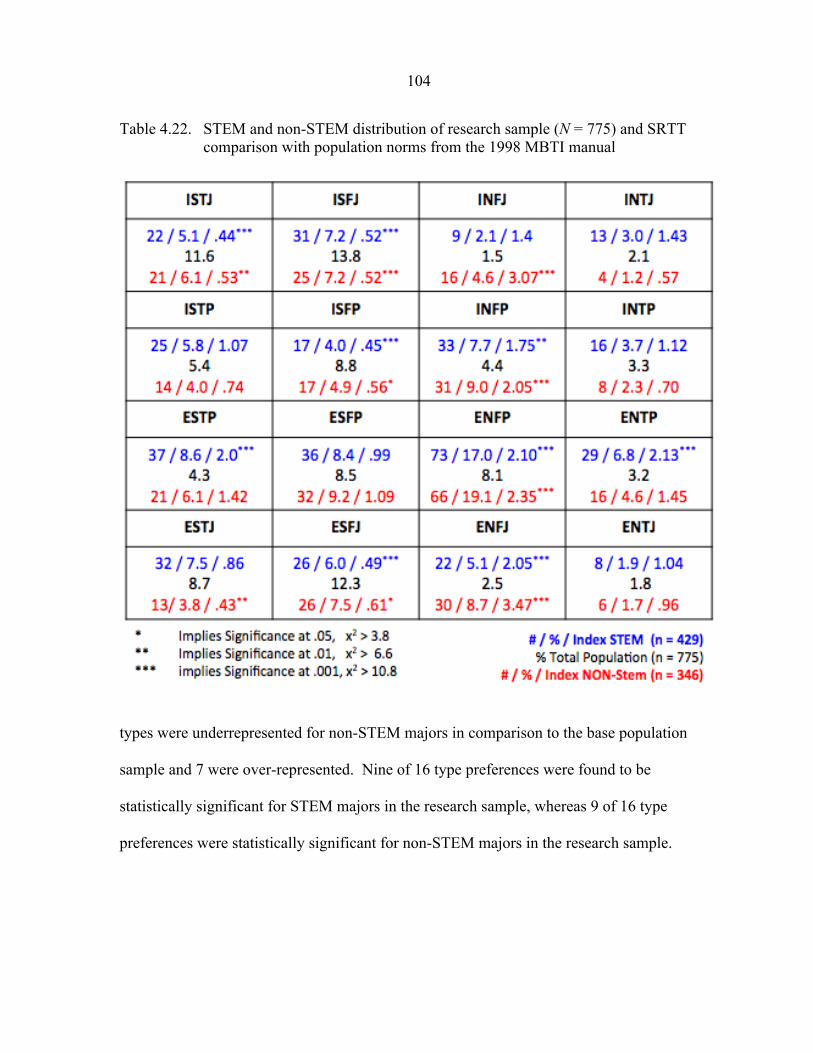
104
Table 4.22. STEM and non-STEM distribution of research sample (N = 775) and SRTT comparison with population norms from the 1998 MBTI manual
types were underrepresented for non-STEM majors in comparison to the base population
sample and 7 were over-represented. Nine of 16 type preferences were found to be
statistically significant for STEM majors in the research sample, whereas 9 of 16 type
preferences were statistically significant for non-STEM majors in the research sample.
105
STEM major type preference comparison with base sample
ISTJ, Introverted Sensing with Thinking and Judging, was the preferred type in 5.1%
of students with STEM majors in the full research population. The index or ratio at 0.44 was
the smallest SRTT for non-STEM majors, and was less than the expected occurrence of
11.6% of individuals with this type in the base population. The index or ratio was found to
be significant at 0.001 in chi-square calculation (X! = 15.519, df = 1, N = 22, p < .001). ISFJ,
or Introverted Sensing with Feeling and Judging, was found in 7.2% of students in STEM
majors in the research population. The index or ratio at 0.52 was also less than the expected
occurrence of 13.8% in the base population and was significant at 0.001 in chi-square
calculation (X! = 13.433, df = 1, N = 31, p < .001).
ISFP, or Introverted Sensing with Feeling and Judging, was found for 4.0% of
students in STEM in the research population. The index or ratio at 0.45 was less than the
expected occurrence of 8.8% found in the base population and was significant at 0.001 in
chi-square calculation (X! =11.446, df = 1, N = 17, p < .001). INFP, or Introverted Intuition
with Feeling and Perceiving, was found to occur in 7.7% of students in STEM in the research
population. The index or ratio at 1.75 indicated a greater than the expected occurrence of
4.4% in the base population and was found to be significant at 0.01 in chi-square calculation
(X! = 10.519, df = 1, N = 33, p < .01).
ESTP, or Extraverted Sensing with Thinking and Perceiving, was found to occur for
5.8% of students in STEM in the research population. The index or ratio at 2.0 was higher
than the expected occurrence of 4.3% in the base population and was found significant at
0.001 in chi-square calculation (X! = 18.802, df = 1, N = 37, p < .001). ENFP, or Extraverted
Intuition with Feeling and Perceiving, was found for 17.0% of students in STEM and was the
106
most frequent type preference for STEM majors in the study. The index or ratio of 2.10
revealed a more than expected occurrence of 8.1% in the base population, and was found to
be significant at 0.001 in chi-square calculation (X! = 42.273 df = 1, N = 73, p < .001).
ENTP, or Extraverted Intuition with Thinking and Perceiving, was found in 6.8% of STEM
majors. The index or ratio of 2.13 revealed more than the expected occurrence of 3.2% in the
base population. and was found to be significant at 0.001 in chi-square calculation (X! =
17.088, df = 1, N = 29, p < .001). ESFJ, the preference for Extraverted Sensing with Feeling
and Judging, comprised 6.0% of STEM students in the research population. The index or
ratio of 0.49 indicated fewer ESFJ preferences for STEM majors in the study than the
expected occurrence of 12.3% in the base population and was significant at 0.001 in chi-
square calculation (X! = 13.603, df = 1, N = 26, p < .001).
Non-STEM major type preference comparison with base sample
ISTJ, or Introverted Sensing with Thinking and Judging, was found in 6.1% of
students with non-STEM majors in the research population. The index or ratio at 0.53 was
fewer than the expected occurrence of 11.6% in the base population and was significant at
0.01 in chi-square calculation (X! = 9.098, df = 1, N = 21, p < .01). ISFJ, or Introverted
Sensing with Feeling and Judging, was found in 7.2% of non-STEM students in the research
population. The index or ratio at 0.52 was fewer than the expected occurrence of 13.8% in
the base population and was significant at 0.001 in chi-square calculation (X! = 10.802, df =
1, N = 25, p < .001). INFJ, or Introverted Intuition with Feeling and Judging, was preferred
by 3.6% of non-STEM students in the research population. The index or ratio at 3.07
indicated this preference occurred with more frequency than the 1.5% found in the base
107
population and was significant at 0.001 in chi-square calculation (X! = 22.431, df = 1, N = 16,
p < .001).
ISFP, or Introverted Sensing with Feeling and Perceiving, was found for 4.9% of
non-STEM majors in the research population. The index or ratio at 0.56 demonstrated a less
than expected occurrence of 8.8% in the base population and was significant at 0.05 in chi-
square calculation (X! =5.907, df = 1, N = 17, p < .05). INFP, or Introverted Intuition with
Feeling and Perceiving, was found in 9.0% of non-STEM students in the research population.
The index or ratio at 2.05 indicated a greater than expected occurrence of 4.4% in the base
population and was found significant at 0.001 in chi-square calculation (X! = 16.424, df = 1,
N = 31, p < .001).
ENFP, the preference for Extraverted Intuition with Feeling and Perceiving, was
found for 19.1% of non-STEM students in the research population, which at 66 students was
the most frequent preference for non-STEM students in the study. This index or ratio was
2.35 times more than the expected occurrence of 8.1% in the base population and was found
to be significant at 0.001 in chi-square calculation (X! = 51.571, df = 1, N = 66, p < .001).
ESTJ, the preference for Extraverted Sensing with Thinking and Judging, comprised 3.8% of
non-STEM students in the research population. The index or ratio of 0.43 indicated fewer
non-STEM majors with ESTJ preferences in the sample than the expected occurrence of
8.7% in the base population and was significant at 0.01 in chi-square calculation (X! =9.715,
df = 1, N = 13, p < .01). ESFJ, the preference for Extraverted Sensing with Feeling and
Judging, comprised 7.5% of non-STEM students in the research population. The index or
ratio of 0.61 indicated fewer non-STEM students with these preferences in the sample than
the expected occurrence of 12.3% in the base population and was significant at 0.05 in chi-

108
square calculation (X! = 6.469, df = 1, N = 26, p < .05). ENFJ, or Extraverted Intuition with
Feeling and Judging, was found to occur in 8.7% of non-STEM population (X! = 52.148, df =
1, N = 30, p < .001). The index or ratio was 3.47 times more than the expected occurrence of
2.5% in the base population and was found to be significant at 0.001 in chi-square
calculation.
STEM and non-STEM 2004 distribution compared with base sample
Table 4.23 provides the SRTT for the 2004 cohort of 97 students by STEM or non-
STEM major in comparison to the national base sample. The simulated distribution of the
test statistic for the full type tables was significant at 0.005770 (STEM) and 0.000 (non-
STEM), indicating little occurrence of chance in the sample. Of the 16 types, 7 types were
underrepresented for STEM majors in comparison to the base population sample and 9 were
over-represented. Eight types were underrepresented and 8 were over-represented for non-
STEM majors in comparison to the base population sample. One of 16 type preferences was
found to be statistically significant for STEM majors, whereas 3 preferences for the non-
STEM majors were found significant in the 2004 cohort.
INFP, or Introverted Intuition with Feeling and Perceiving, was found in 15.9% of
STEM majors in the 2004 population. The index or ratio was 3.61 times more than the
expected occurrence of 4.4% in the base population and was found to be significant at 0.001
in chi-square calculation (X! = 13.689, df = 1, N = 7, p < .001).
INFP was found to occur in 22.6% of non-STEM majors in the 2004 population. The
index or ratio at 5.14 indicated a greater than the expected occurrence of 4.4% in the base
population and was found to be significant at 0.001 in chi-square calculation (X! = 40.133, df
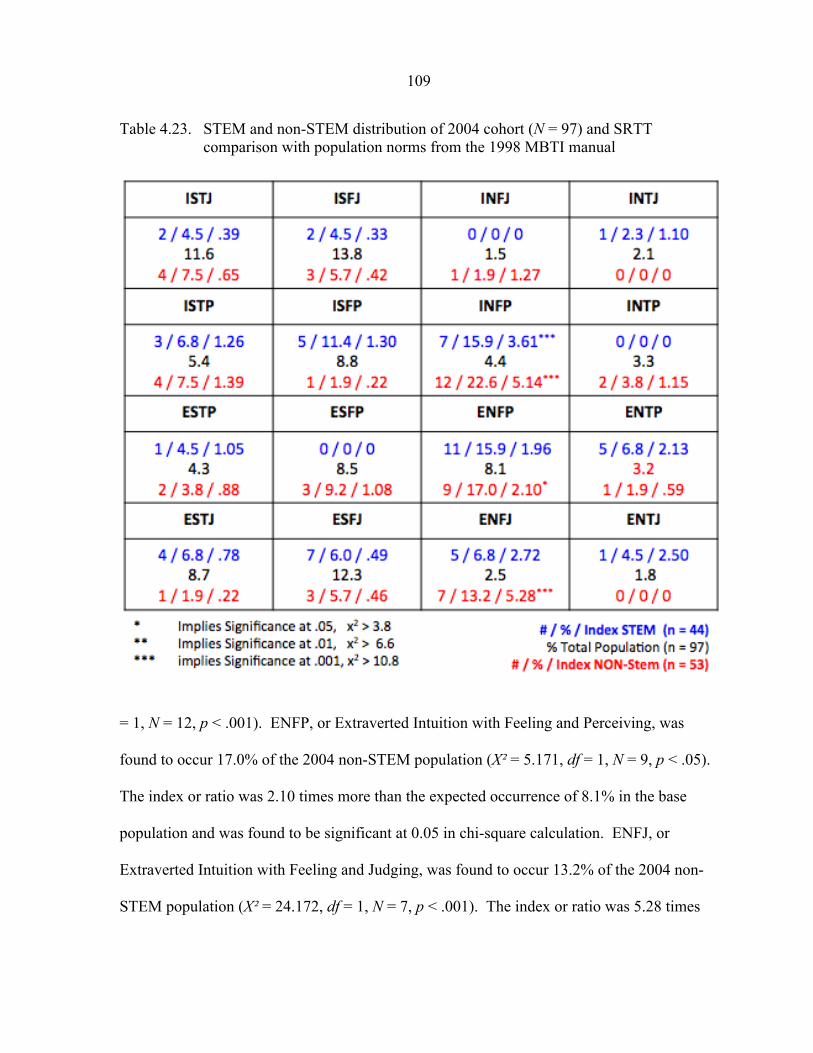
109
Table 4.23. STEM and non-STEM distribution of 2004 cohort (N = 97) and SRTT comparison with population norms from the 1998 MBTI manual
= 1, N = 12, p < .001). ENFP, or Extraverted Intuition with Feeling and Perceiving, was
found to occur 17.0% of the 2004 non-STEM population (X! = 5.171, df = 1, N = 9, p < .05).
The index or ratio was 2.10 times more than the expected occurrence of 8.1% in the base
population and was found to be significant at 0.05 in chi-square calculation. ENFJ, or
Extraverted Intuition with Feeling and Judging, was found to occur 13.2% of the 2004 non-
STEM population (X! = 24.172, df = 1, N = 7, p < .001). The index or ratio was 5.28 times

110
more than the expected occurrence of 2.5% in the base population and was found to be
significant at 0.001 in chi-square calculation.
STEM and non-STEM 2005 distribution compared with base sample The 2005 cohort is shown in Table 4.24 with the SRTT for 96 students in comparison
to the national base sample. The simulated distribution of the test statistic for the full type
tables was significant at 0.000058 (STEM) and 0.00221 (non-STEM), indicating little
occurrence of chance in the sample. Of the 16 types, 9 were underrepresented and 7 were
over-represented for STEM majors in the cohort. Eight types were underrepresented for non-
STEM majors in comparison to the base population sample and 8 were over-represented.
Five of 16 type preferences were found to be statistically significant for STEM majors in the
2005 sample, whereas 3 of 16 type preferences were found to be statistically significant for
non-STEM majors.
ISTJ, Introverted Sensing with Thinking and Judging, was found among 3.2% of
STEM majors in the 2005 population. The index or ratio at 0.28 was less than the expected
occurrence of 11.6% with this type in the base population and was found to be significant at
0.05 in chi-square calculation (X! = 3.848, df = 1, N = 2, p < .05). INFJ, or Introverted
Intuition with Feeling and Judging, was found in 4.8% of the population (X! = 4.423, df = 1,
N = 3, p < .05). The index or ratio was 3.22 times more than the expected occurrence of
1.5% in the base population and was found to be significant at 0.05 in chi-square calculation.
ENFP, the preference for Extraverted Intuition with Feeling and Perceiving, was
found to occur in 17.5% of STEM majors in the 2005 population. The index or ratio was
2.16 times more than the expected occurrence of 8.1% in the base population and was found
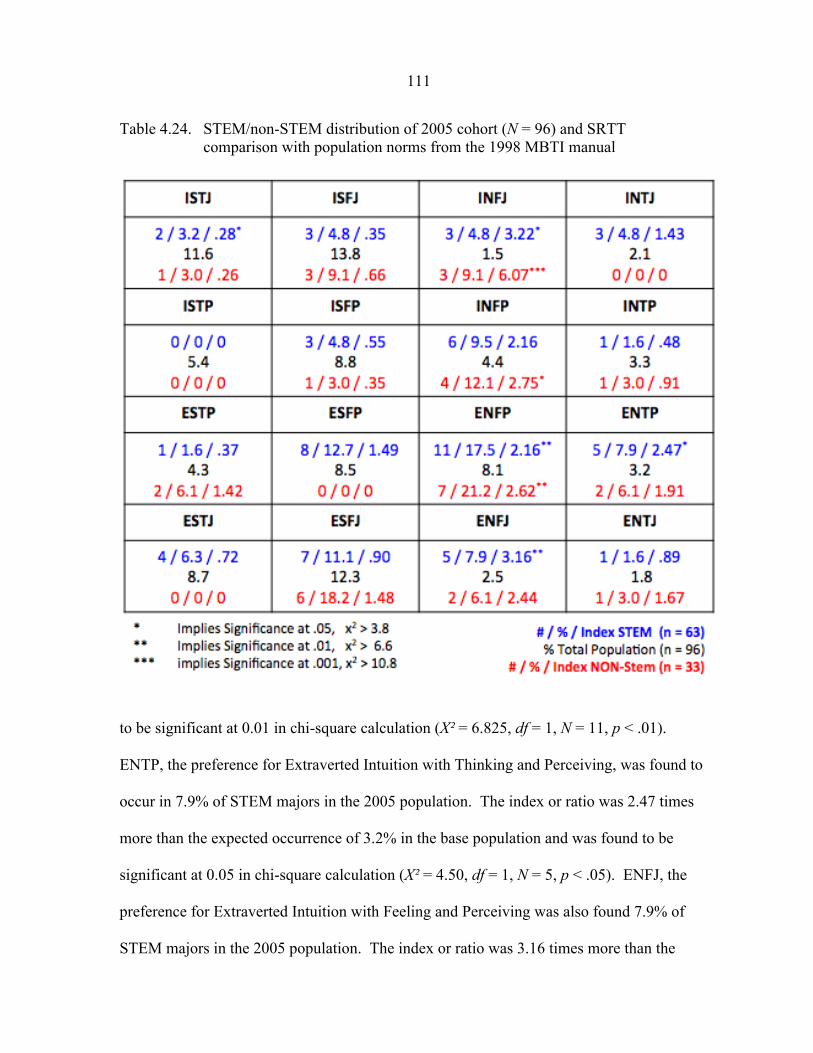
111
Table 4.24. STEM/non-STEM distribution of 2005 cohort (N = 96) and SRTT comparison with population norms from the 1998 MBTI manual
to be significant at 0.01 in chi-square calculation (X! = 6.825, df = 1, N = 11, p < .01).
ENTP, the preference for Extraverted Intuition with Thinking and Perceiving, was found to
occur in 7.9% of STEM majors in the 2005 population. The index or ratio was 2.47 times
more than the expected occurrence of 3.2% in the base population and was found to be
significant at 0.05 in chi-square calculation (X! = 4.50, df = 1, N = 5, p < .05). ENFJ, the
preference for Extraverted Intuition with Feeling and Perceiving was also found 7.9% of
STEM majors in the 2005 population. The index or ratio was 3.16 times more than the
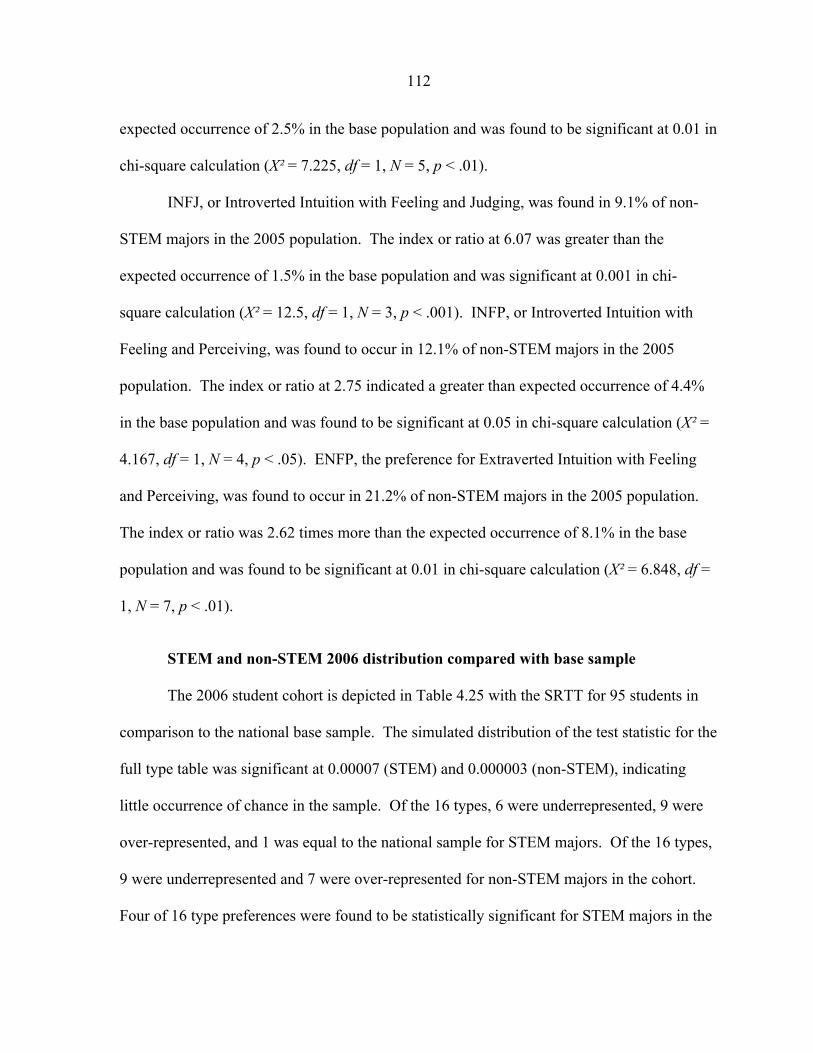
112
expected occurrence of 2.5% in the base population and was found to be significant at 0.01 in
chi-square calculation (X! = 7.225, df = 1, N = 5, p < .01).
INFJ, or Introverted Intuition with Feeling and Judging, was found in 9.1% of non-
STEM majors in the 2005 population. The index or ratio at 6.07 was greater than the
expected occurrence of 1.5% in the base population and was significant at 0.001 in chi-
square calculation (X! = 12.5, df = 1, N = 3, p < .001). INFP, or Introverted Intuition with
Feeling and Perceiving, was found to occur in 12.1% of non-STEM majors in the 2005
population. The index or ratio at 2.75 indicated a greater than expected occurrence of 4.4%
in the base population and was found to be significant at 0.05 in chi-square calculation (X! =
4.167, df = 1, N = 4, p < .05). ENFP, the preference for Extraverted Intuition with Feeling
and Perceiving, was found to occur in 21.2% of non-STEM majors in the 2005 population.
The index or ratio was 2.62 times more than the expected occurrence of 8.1% in the base
population and was found to be significant at 0.01 in chi-square calculation (X! = 6.848, df =
1, N = 7, p < .01).
STEM and non-STEM 2006 distribution compared with base sample
The 2006 student cohort is depicted in Table 4.25 with the SRTT for 95 students in
comparison to the national base sample. The simulated distribution of the test statistic for the
full type table was significant at 0.00007 (STEM) and 0.000003 (non-STEM), indicating
little occurrence of chance in the sample. Of the 16 types, 6 were underrepresented, 9 were
over-represented, and 1 was equal to the national sample for STEM majors. Of the 16 types,
9 were underrepresented and 7 were over-represented for non-STEM majors in the cohort.
Four of 16 type preferences were found to be statistically significant for STEM majors in the

113
Table 4.25. STEM/non-STEM distribution of 2006 cohort (N = 95) and SRTT comparison with population norms from the 1998 MBTI manual
2006 sample, whereas 2 of 16 type preferences were found to be statistically significant for
non-STEM majors.
INFJ, or Introverted Intuition with Feeling and Judging, was found in 6.5% of STEM
majors in the 2006 population. The index or ratio at 4.3 was greater than the occurrence of
1.5% in the base population and was significant at 0.01 in chi-square calculation (X! = 7.733,
df = 1, N = 3, p < .01). ENFP, Extraverted Intuition with Feeling and Perceiving, was found
in 23.9% of STEM majors in the 2006 population. The index of 2.95 was larger than the
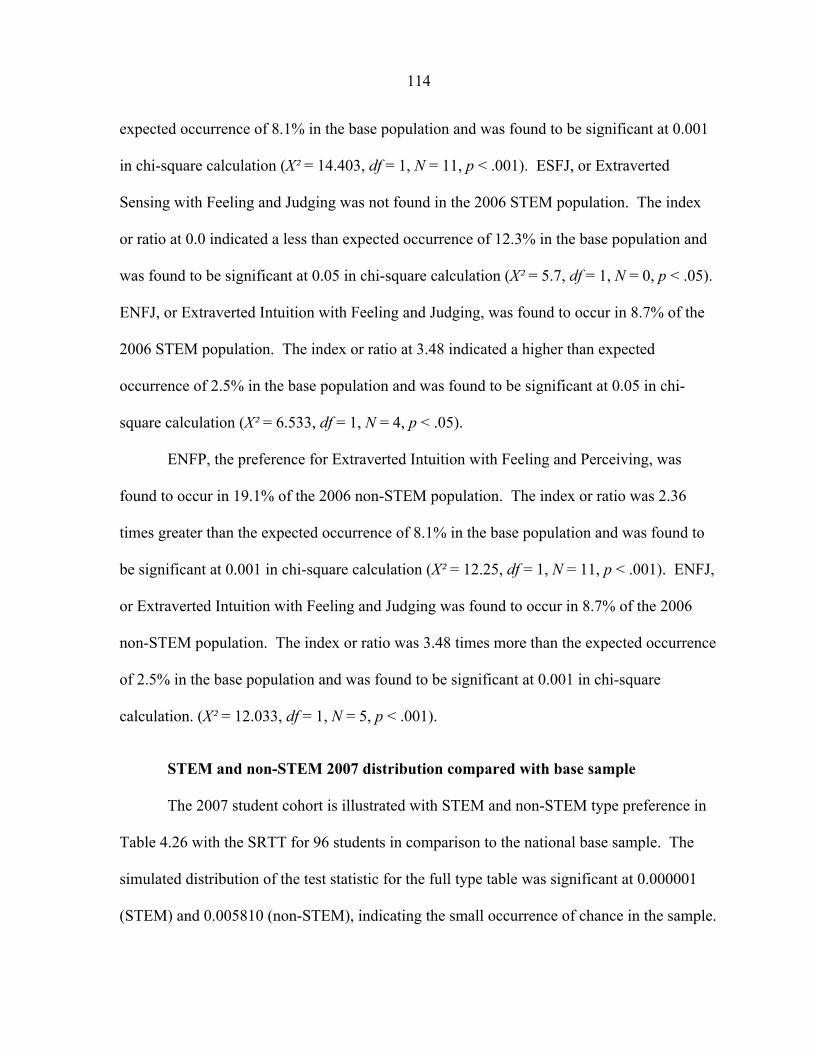
114
expected occurrence of 8.1% in the base population and was found to be significant at 0.001
in chi-square calculation (X! = 14.403, df = 1, N = 11, p < .001). ESFJ, or Extraverted
Sensing with Feeling and Judging was not found in the 2006 STEM population. The index
or ratio at 0.0 indicated a less than expected occurrence of 12.3% in the base population and
was found to be significant at 0.05 in chi-square calculation (X! = 5.7, df = 1, N = 0, p < .05).
ENFJ, or Extraverted Intuition with Feeling and Judging, was found to occur in 8.7% of the
2006 STEM population. The index or ratio at 3.48 indicated a higher than expected
occurrence of 2.5% in the base population and was found to be significant at 0.05 in chi-
square calculation (X! = 6.533, df = 1, N = 4, p < .05).
ENFP, the preference for Extraverted Intuition with Feeling and Perceiving, was
found to occur in 19.1% of the 2006 non-STEM population. The index or ratio was 2.36
times greater than the expected occurrence of 8.1% in the base population and was found to
be significant at 0.001 in chi-square calculation (X! = 12.25, df = 1, N = 11, p < .001). ENFJ,
or Extraverted Intuition with Feeling and Judging was found to occur in 8.7% of the 2006
non-STEM population. The index or ratio was 3.48 times more than the expected occurrence
of 2.5% in the base population and was found to be significant at 0.001 in chi-square
calculation. (X! = 12.033, df = 1, N = 5, p < .001).
STEM and non-STEM 2007 distribution compared with base sample
The 2007 student cohort is illustrated with STEM and non-STEM type preference in
Table 4.26 with the SRTT for 96 students in comparison to the national base sample. The
simulated distribution of the test statistic for the full type table was significant at 0.000001
(STEM) and 0.005810 (non-STEM), indicating the small occurrence of chance in the sample.
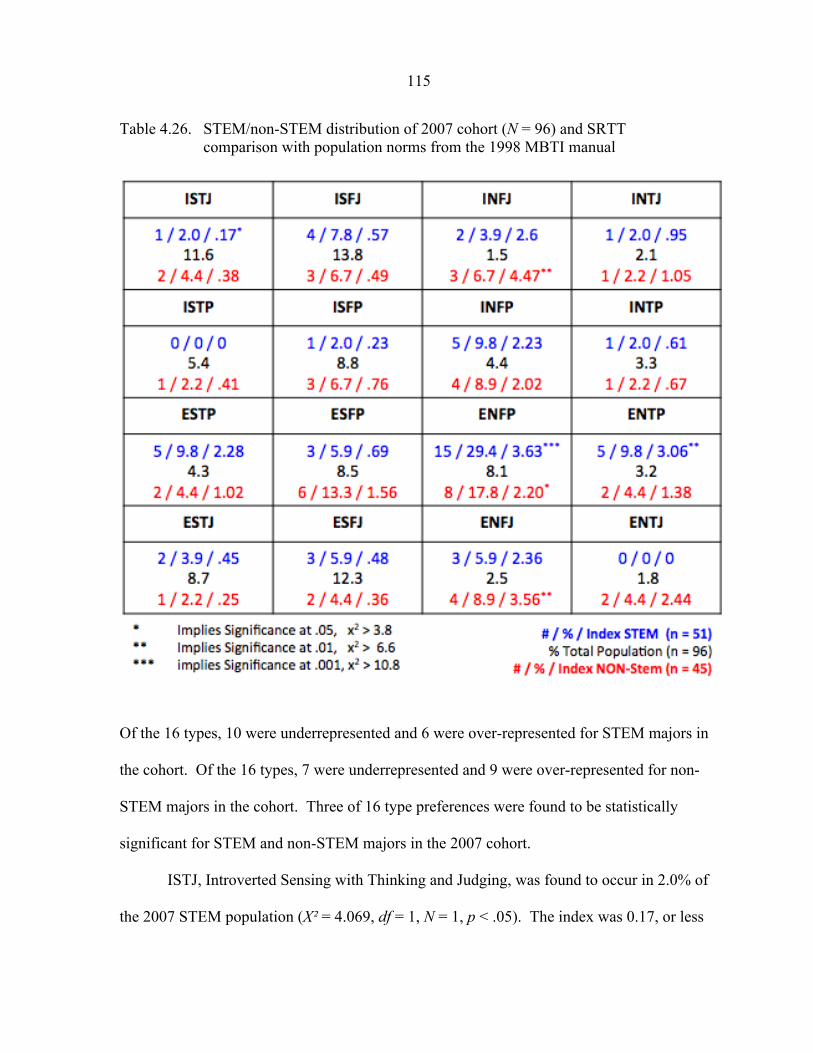
115
Table 4.26. STEM/non-STEM distribution of 2007 cohort (N = 96) and SRTT comparison with population norms from the 1998 MBTI manual
Of the 16 types, 10 were underrepresented and 6 were over-represented for STEM majors in
the cohort. Of the 16 types, 7 were underrepresented and 9 were over-represented for non-
STEM majors in the cohort. Three of 16 type preferences were found to be statistically
significant for STEM and non-STEM majors in the 2007 cohort.
ISTJ, Introverted Sensing with Thinking and Judging, was found to occur in 2.0% of
the 2007 STEM population (X! = 4.069, df = 1, N = 1, p < .05). The index was 0.17, or less
116
than the expected occurrence of 11.6% in the base population and was found to be significant
at 0.05 in chi-square calculation. ENFP, the preference for Extraverted Intuition with Feeling
and Perceiving, was found to occur in 29.4% of the 2007 STEM population. With an index
that was 3.63 times greater than the expected occurrence of 8.1% in the base population,
ENFP was found to be significant at 0.001 in chi-square calculation (X! = 28.978 df = 1, N =
15, p < .001). ENTP, or Extraverted Intuition with Thinking and Perceiving, was found to
occur in 9.8% of the 2007 STEM cohort. The index or ratio was 3.06 times more than the
expected occurrence of 3.2% in the base population and was found to be significant at 0.01 in
chi-square calculation (X! = 7.225, df = 1, N = 5, p < .01).
INFJ, or preference for Introverted Intuition with Feeling and Judging, was found to
occur in 6.7% of non-STEM majors in the 2007 population. The index or ratio was 4.47
times greater than the expected occurrence of 1.5% in the base population and was found to
be significant at 0.01 in chi-square calculation (X! = 7.915, df = 1, N = 3, p < .01). ENFP, the
preference for Extraverted Intuition with Feeling and Perceiving, was found to occur in
17.8% of the 2007 non-STEM population. With an index that was 2.20 times greater than
the expected occurrence of 8.1% in the base population, ENFP was found to be significant at
0.05 in chi-square calculation (X! = 5.378, df = 1, N = 8, p < .05). ENFJ, or Extraverted
Intuition with Feeling and Judging, was found in 8.9% of 2007 non-STEM majors. The
index or ratio was 3.56 times greater than the expected occurrence of 2.5% in the base
population and was found to be significant at 0.01 in chi-square calculation (X! = 7.645, df =
1, N = 4, p < .01).
117
STEM and non-STEM 2008 distribution compared with base sample
The 2008 student cohort is shown with STEM and non-STEM type preference in
Table 4.27 with the SRTT for 99 students in comparison to the national base sample. The
simulated distribution of the test statistic for the full type table was significant at 0.000013
(STEM) and 0.005810 (non-STEM), indicating the small occurrence of chance in either
sample. Of the 16 types, 7 were underrepresented and 9 were over-represented for STEM
majors in the cohort. For non-STEM majors in the cohort, 10 types were underrepresented
and 6 were over-represented. Five of 16 type preferences were found to be statistically
significant for STEM majors in the 2008 sample, whereas 4 of 16 type preferences were
found to be statistically significant for non-STEM majors.
ISFJ, or Introverted Sensing with Feeling and Judging, was found in the 2008 STEM
population (X! = 5.437, df = 1, N = 1, p < .05). The index was 0.14, or less than the expected
occurrence of 13.8% in the base population, and was found significant at 0.05 in chi-square
calculation. ISFP, or Introverted Sensing with Feeling and Perceiving, was not found among
the STEM majors in the 2008 population. The index or ratio at 0.0 was lower than the
expected occurrence of 8.8% in the base population and was significant at 0.05 in chi-square
calculation (X! = 4.7, df = 1, N = 0, p < .05). ESTP, or preference for Extraverted Sensing
with Thinking and Perceiving, was found in 17.0% of the population (X! = 19.517, df = 1, N
= 9, p < .001). The SRTT ratio was 3.95 times more than the expected occurrence of 4.3% in
the base population, and was found to be significant at 0.001 in chi-square calculation.
ENFP, the preference for Extraverted Intuition with Feeling and Perceiving, was found to be
18.9% of the 2008 STEM population. The index or ratio was 2.33 times greater than the
expected occurrence of 8.1% in the base population, and was found significant at 0.01 in chi-
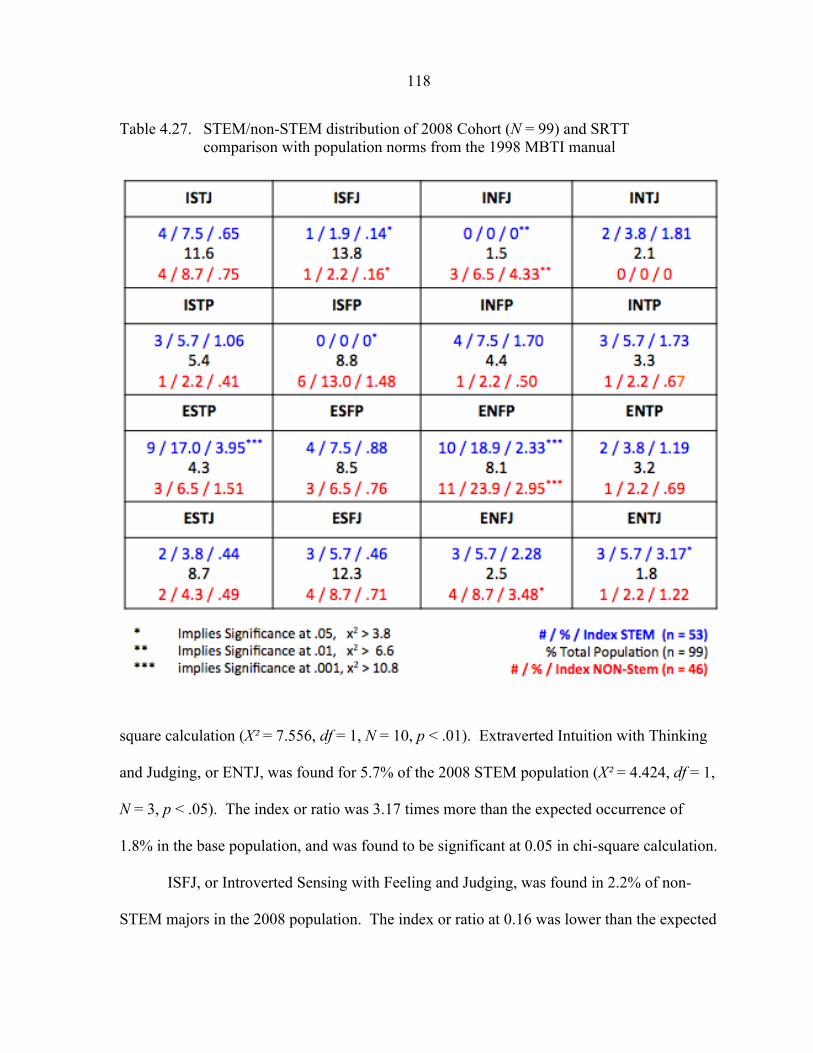
118
Table 4.27. STEM/non-STEM distribution of 2008 Cohort (N = 99) and SRTT comparison with population norms from the 1998 MBTI manual
square calculation (X! = 7.556, df = 1, N = 10, p < .01). Extraverted Intuition with Thinking
and Judging, or ENTJ, was found for 5.7% of the 2008 STEM population (X! = 4.424, df = 1,
N = 3, p < .05). The index or ratio was 3.17 times more than the expected occurrence of
1.8% in the base population, and was found to be significant at 0.05 in chi-square calculation.
ISFJ, or Introverted Sensing with Feeling and Judging, was found in 2.2% of non-
STEM majors in the 2008 population. The index or ratio at 0.16 was lower than the expected
119
occurrence of 13.8% in the base population and was significant at 0.05 in chi-square
calculation (X! = 6.3, df = 1, N = 1, p < .05). INFJ, or Introverted Intuition with Feeling and
Judging, was found in 6.5% of non-STEM majors in the 2008 population. The index or ratio
at 4.33 was greater than the expected occurrence of 1.5% in the base population and was
significant at 0.01 in chi-square calculation (X! = 7.733, df = 1, N = 3, p < .01). ENFP, or
Extroverted Intuition with Feeling and Perceiving, was found to occur in 23.9% of non-
STEM majors in the 2008 population. The index or ratio at 2.95 indicated a greater than the
expected occurrence of 8.1% in the base population and was found to be significant at 0.001
in chi-square calculation (X! = 14.403, df = 1, N = 11, p < .001). Extraverted Intuition with
Feeling and Judging, or ENFJ, was found to occur 8.7% of the 2008 non-STEM population
(X! = 6.533, df = 1, N = 4, p < .05). The index or ratio was 3.48 times more than the expected
occurrence of 2.5% in the base non-STEM population, and was found to be significant at
0.05 in chi-square calculation.
STEM and non-STEM 2009 distribution compared with base sample
The 2009 student cohort is exhibited by STEM and non-STEM type preference in
Table 4.28 with the SRTT for 100 students in comparison to the national base sample. The
simulated distribution of the test statistic for the full type table was significant at 0.1707 for
STEM majors and 0.012630 for non-STEM majors. Of the 16 types, 9 were
underrepresented and 9 were over-represented for STEM majors in the cohort. For non-
STEM majors in the cohort, 8 types were underrepresented and 8 were over-represented.
One of 16 type preferences was found to be statistically significant for STEM majors in the
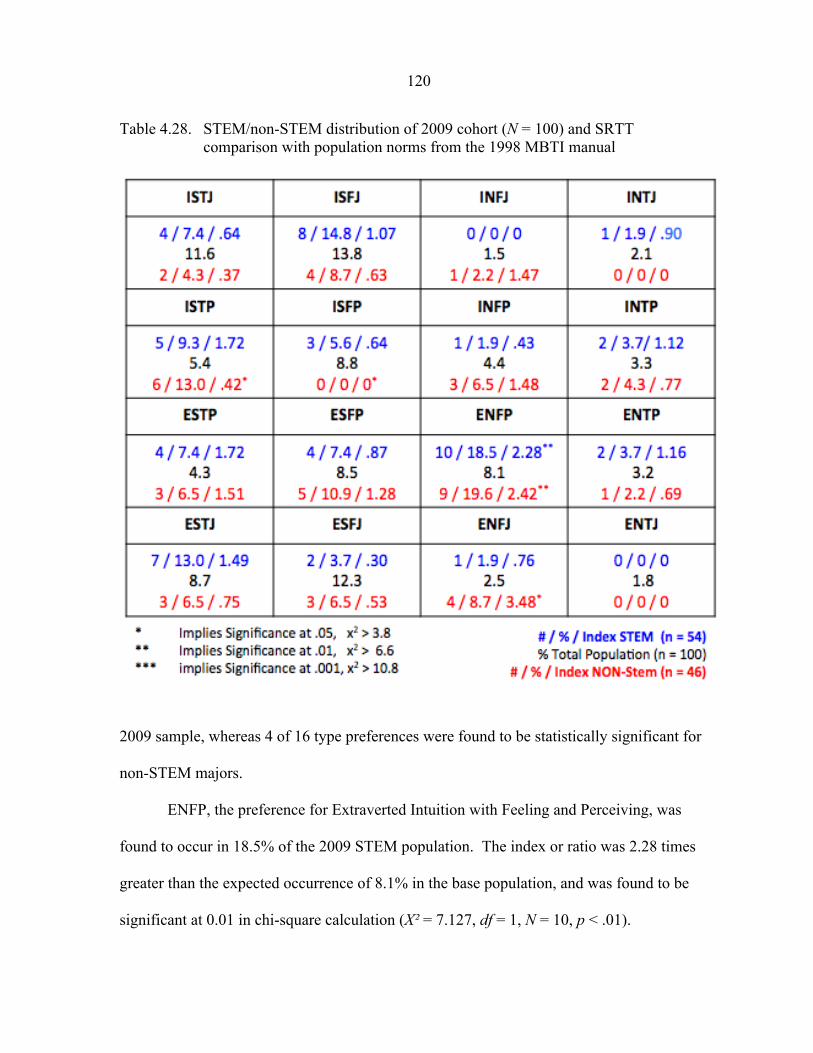
120
Table 4.28. STEM/non-STEM distribution of 2009 cohort (N = 100) and SRTT comparison with population norms from the 1998 MBTI manual
2009 sample, whereas 4 of 16 type preferences were found to be statistically significant for
non-STEM majors.
ENFP, the preference for Extraverted Intuition with Feeling and Perceiving, was
found to occur in 18.5% of the 2009 STEM population. The index or ratio was 2.28 times
greater than the expected occurrence of 8.1% in the base population, and was found to be
significant at 0.01 in chi-square calculation (X! = 7.127, df = 1, N = 10, p < .01).
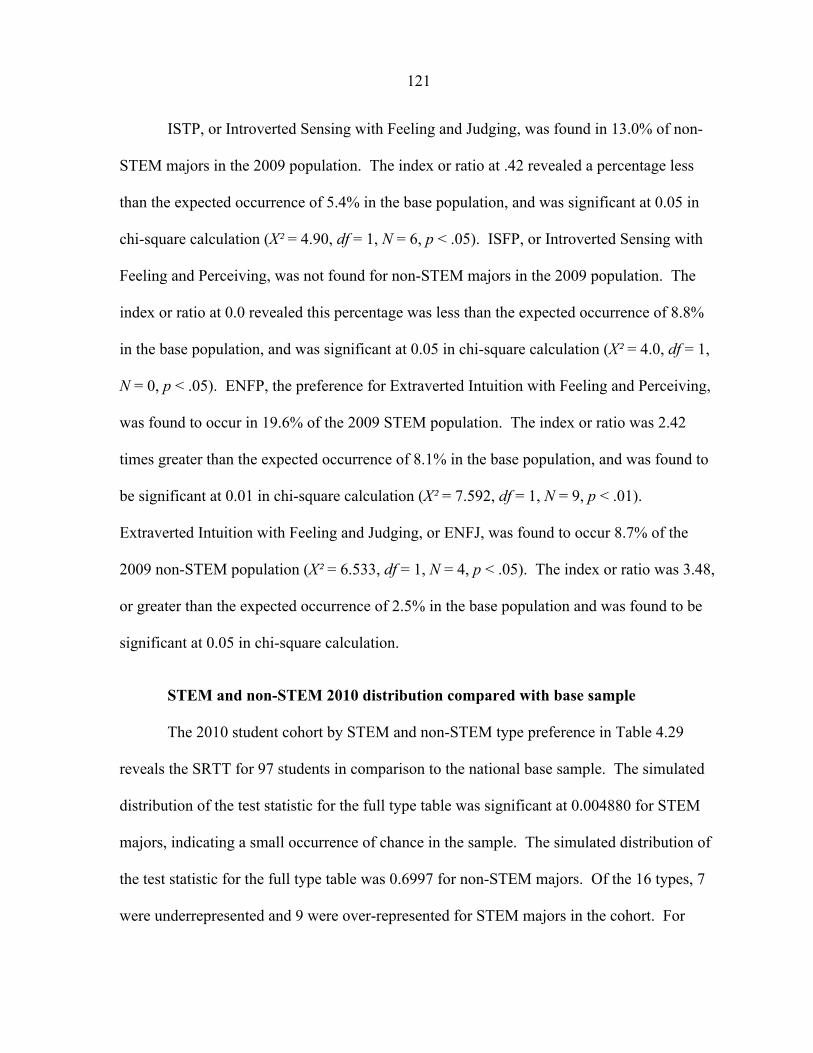
121
ISTP, or Introverted Sensing with Feeling and Judging, was found in 13.0% of non-
STEM majors in the 2009 population. The index or ratio at .42 revealed a percentage less
than the expected occurrence of 5.4% in the base population, and was significant at 0.05 in
chi-square calculation (X! = 4.90, df = 1, N = 6, p < .05). ISFP, or Introverted Sensing with
Feeling and Perceiving, was not found for non-STEM majors in the 2009 population. The
index or ratio at 0.0 revealed this percentage was less than the expected occurrence of 8.8%
in the base population, and was significant at 0.05 in chi-square calculation (X! = 4.0, df = 1,
N = 0, p < .05). ENFP, the preference for Extraverted Intuition with Feeling and Perceiving,
was found to occur in 19.6% of the 2009 STEM population. The index or ratio was 2.42
times greater than the expected occurrence of 8.1% in the base population, and was found to
be significant at 0.01 in chi-square calculation (X! = 7.592, df = 1, N = 9, p < .01).
Extraverted Intuition with Feeling and Judging, or ENFJ, was found to occur 8.7% of the
2009 non-STEM population (X! = 6.533, df = 1, N = 4, p < .05). The index or ratio was 3.48,
or greater than the expected occurrence of 2.5% in the base population and was found to be
significant at 0.05 in chi-square calculation.
STEM and non-STEM 2010 distribution compared with base sample
The 2010 student cohort by STEM and non-STEM type preference in Table 4.29
reveals the SRTT for 97 students in comparison to the national base sample. The simulated
distribution of the test statistic for the full type table was significant at 0.004880 for STEM
majors, indicating a small occurrence of chance in the sample. The simulated distribution of
the test statistic for the full type table was 0.6997 for non-STEM majors. Of the 16 types, 7
were underrepresented and 9 were over-represented for STEM majors in the cohort. For
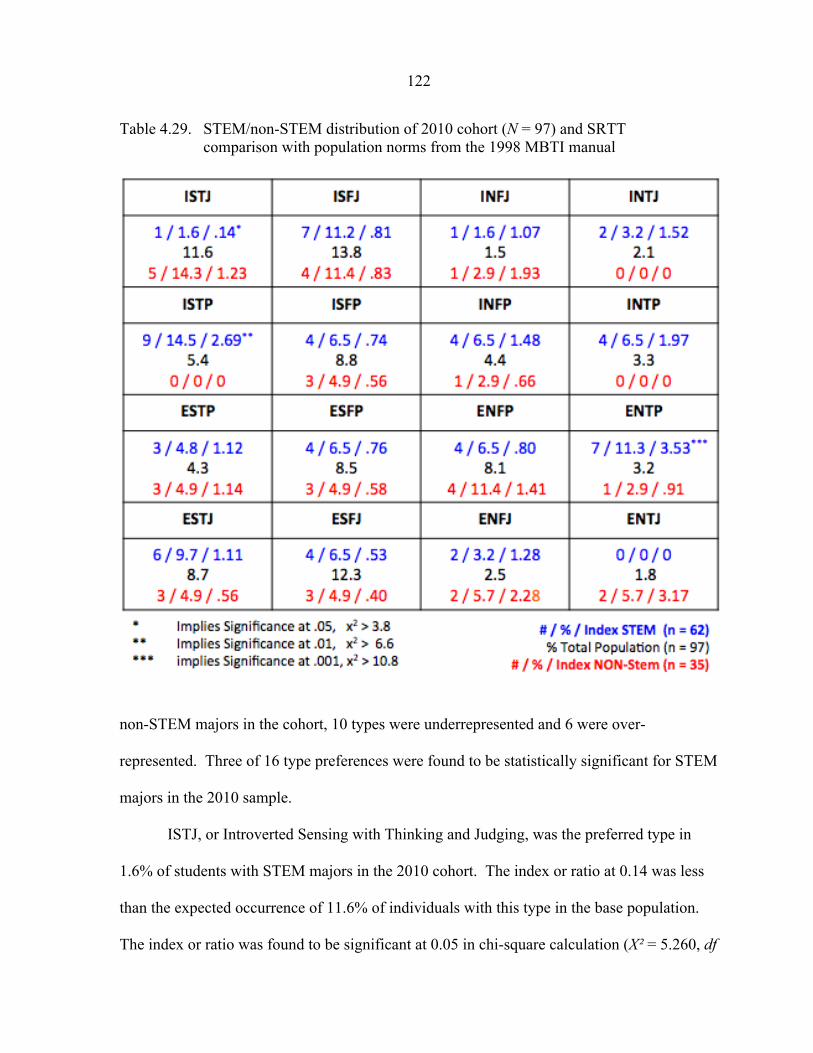
122
Table 4.29. STEM/non-STEM distribution of 2010 cohort (N = 97) and SRTT comparison with population norms from the 1998 MBTI manual
non-STEM majors in the cohort, 10 types were underrepresented and 6 were over-
represented. Three of 16 type preferences were found to be statistically significant for STEM
majors in the 2010 sample.
ISTJ, or Introverted Sensing with Thinking and Judging, was the preferred type in
1.6% of students with STEM majors in the 2010 cohort. The index or ratio at 0.14 was less
than the expected occurrence of 11.6% of individuals with this type in the base population.
The index or ratio was found to be significant at 0.05 in chi-square calculation (X! = 5.260, df

123
= 1, N = 1, p < .05). ISTP, or Introverted Sensing with Thinking and Perceiving, was found
in 14.5% of students in STEM majors in the 2005 group. The index or ratio at 2.69 was
greater than the expected occurrence of 5.4% in the base population and is significant at 0.01
in chi-square calculation (X! = 9.529, df = 1, N = 9, p < .01). ENTP, the preference for
Extraverted Intuition with Thinking and Perceiving, was found in 11.3% of the 2010 STEM
population. The index or ratio was 3.53 times greater than the expected occurrence of 3.2%
in the base population, and was found to be significant at 0.001 in chi-square calculation (X!
= 12.727, df = 1, N = 7, p < .001).
STEM and non-STEM 2011 distribution compared with base sample
The 2011 student cohort shown in Table 4.30 provides the SRTT for 95 students in
comparison to the national base sample. The simulated distribution of the test statistic for the
full type table was significant at 0.000052 for STEM majors and 0.001840 for non-STEM
majors, indicating a small occurrence of chance in either sample. Of the 16 types, 8 were
underrepresented, 7 were over-represented, and 1 was equal to the national sample for STEM
majors in the cohort. For non-STEM majors in the cohort, 9 types were underrepresented
and 7 were over-represented in comparison to the national sample. Two of 16 type
preferences were found statistically significant for STEM majors in the 2011 sample,
whereas 5 of 16 type preferences were found statistically significant for non-STEM majors.
ISFP, or Introverted Sensing with Feeling and Perceiving, was not found in STEM
majors in the 2011 cohort. This was less than the expected occurrence of 8.8% in the base
population and was significant at 0.05 in chi-square calculation (X! = 4.9, df = 1, N = 0, p <
.05). ESTP, the preference for Extraverted Sensing with Thinking and Perceiving, was found
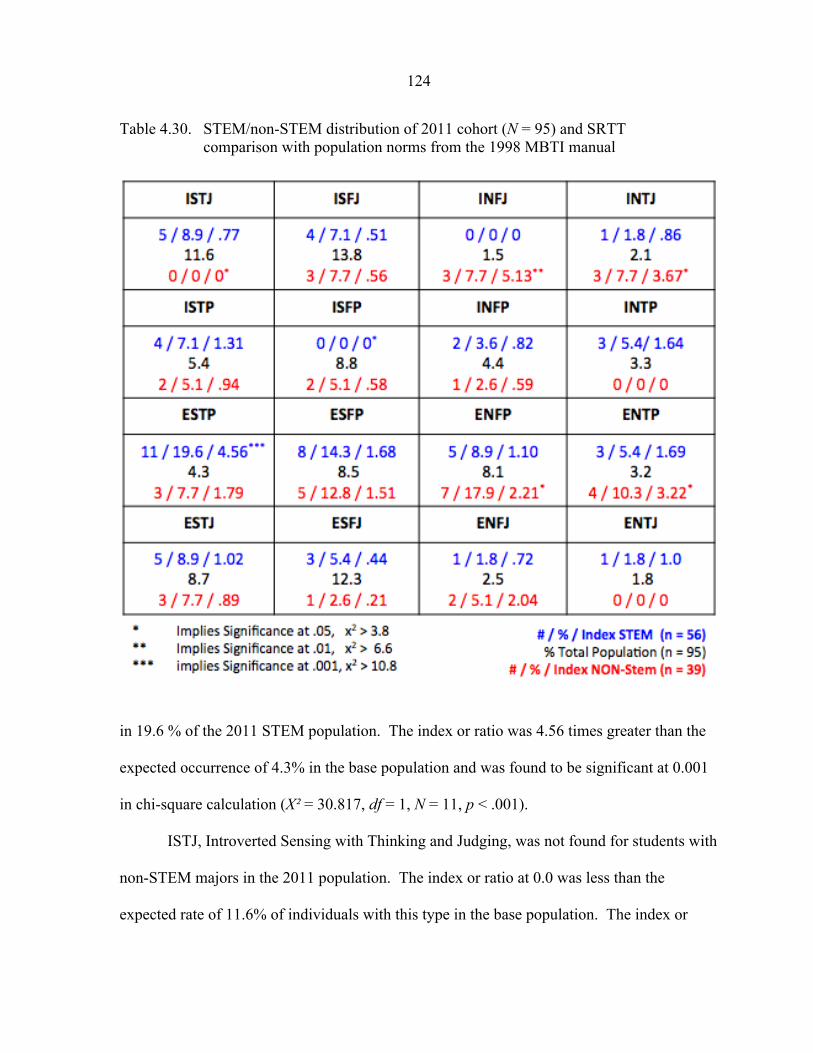
124
Table 4.30. STEM/non-STEM distribution of 2011 cohort (N = 95) and SRTT comparison with population norms from the 1998 MBTI manual
in 19.6 % of the 2011 STEM population. The index or ratio was 4.56 times greater than the
expected occurrence of 4.3% in the base population and was found to be significant at 0.001
in chi-square calculation (X! = 30.817, df = 1, N = 11, p < .001).
ISTJ, Introverted Sensing with Thinking and Judging, was not found for students with
non-STEM majors in the 2011 population. The index or ratio at 0.0 was less than the
expected rate of 11.6% of individuals with this type in the base population. The index or
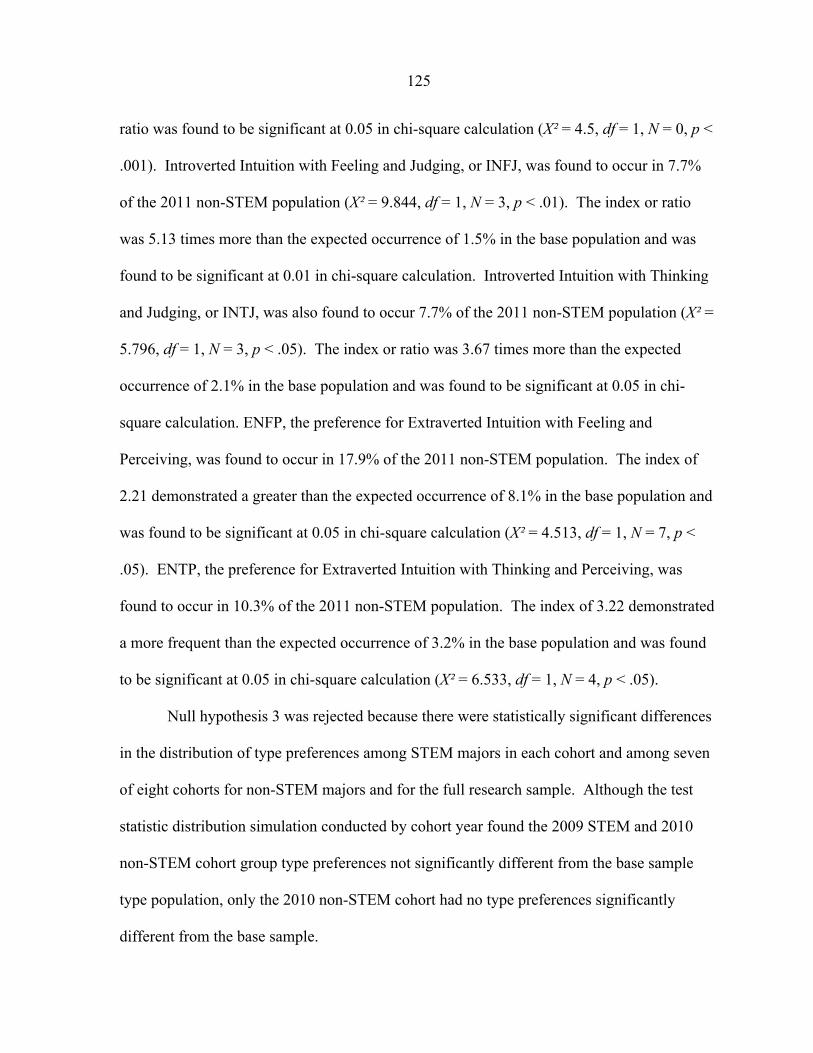
125
ratio was found to be significant at 0.05 in chi-square calculation (X! = 4.5, df = 1, N = 0, p <
.001). Introverted Intuition with Feeling and Judging, or INFJ, was found to occur in 7.7%
of the 2011 non-STEM population (X! = 9.844, df = 1, N = 3, p < .01). The index or ratio
was 5.13 times more than the expected occurrence of 1.5% in the base population and was
found to be significant at 0.01 in chi-square calculation. Introverted Intuition with Thinking
and Judging, or INTJ, was also found to occur 7.7% of the 2011 non-STEM population (X! =
5.796, df = 1, N = 3, p < .05). The index or ratio was 3.67 times more than the expected
occurrence of 2.1% in the base population and was found to be significant at 0.05 in chi-
square calculation. ENFP, the preference for Extraverted Intuition with Feeling and
Perceiving, was found to occur in 17.9% of the 2011 non-STEM population. The index of
2.21 demonstrated a greater than the expected occurrence of 8.1% in the base population and
was found to be significant at 0.05 in chi-square calculation (X! = 4.513, df = 1, N = 7, p <
.05). ENTP, the preference for Extraverted Intuition with Thinking and Perceiving, was
found to occur in 10.3% of the 2011 non-STEM population. The index of 3.22 demonstrated
a more frequent than the expected occurrence of 3.2% in the base population and was found
to be significant at 0.05 in chi-square calculation (X! = 6.533, df = 1, N = 4, p < .05).
Null hypothesis 3 was rejected because there were statistically significant differences
in the distribution of type preferences among STEM majors in each cohort and among seven
of eight cohorts for non-STEM majors and for the full research sample. Although the test
statistic distribution simulation conducted by cohort year found the 2009 STEM and 2010
non-STEM cohort group type preferences not significantly different from the base sample
type population, only the 2010 non-STEM cohort had no type preferences significantly
different from the base sample.
126
ENFP, or Extraverted Intuition with Feeling and Perceiving, was the most frequent
type preference for the research population, with STEM majors at 17.0% (N = 73) and non-
STEM majors at 19.1% (N = 66). The least frequent preference for STEM students was
ENTJ, or Extraverted Intuition with Thinking and Judging, at 1.86% of the population (N =
8). The least frequent preference for non-STEM students was INTJ, or Introverted Intuition
with Thinking and Judging, at 1.16% (N = 4). Considering the full research sample and eight
cohort years, only two type preference for STEM majors were found to be equal to the base
national sample for the preference, ESTP in the 2006 cohort year, and ENTJ in the 2011
cohort. Research Question 4 revealed significant differences in Myers-Briggs preferences for
STEM and non-STEM students in the study by cohort year and for the research population in
comparison to the distribution of a national population.
Differences in academic aptitude of ACT and high school percentile rank and Myers-
Briggs preference by cohort year and for research sample
Research Question 5: Are there statistically significant differences in the Academic Aptitude as measured by ACT and high school percentile rank in graduating class and Myers-Briggs preference by each cohort year or for the research population?
H04: There is no significant difference in ACT and high school percentile
rank and Myers-Briggs preference by cohort year or for the research
population.
To answer Research Question 5, cross-tabulations, one-way analysis of variance
(ANOVA), and Tukey-Kramer HSD post hoc tests were computed using the research sample
of 775 students and eight cohort years to determine the distribution of Myers-Briggs type to
the ACT composite and high school graduating class percentile rank of students. Table 4.31
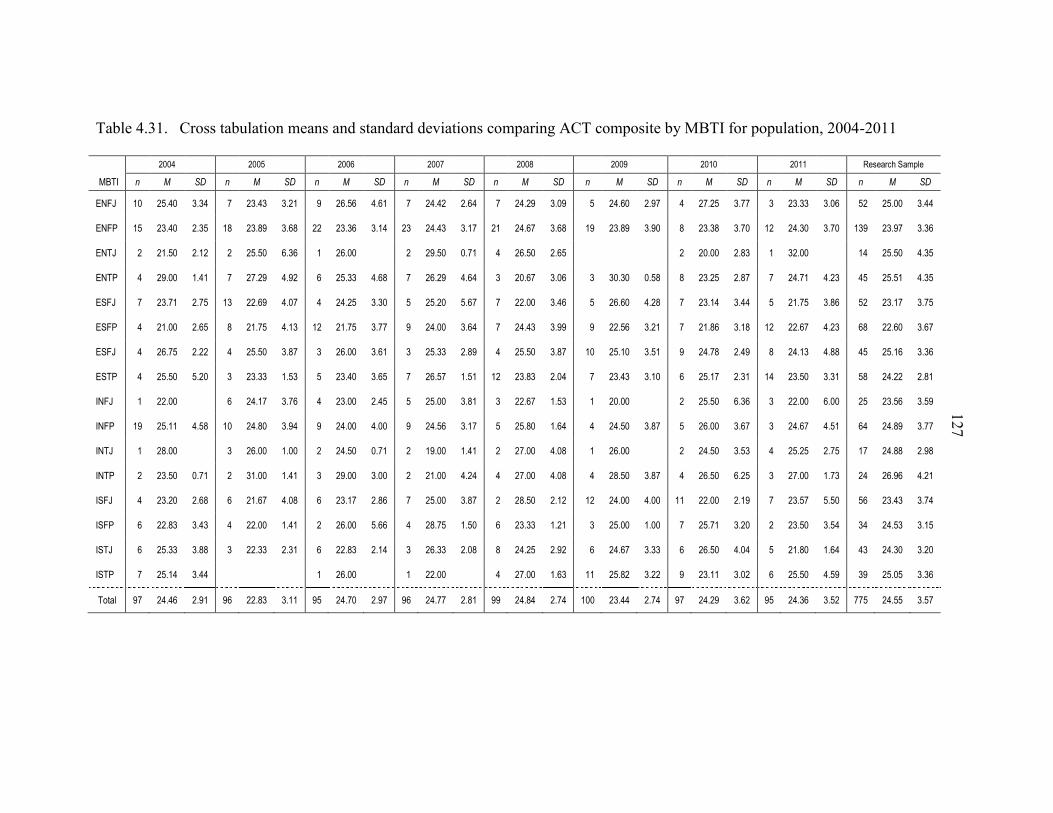
1
Table 4.31. Cross tabulation means and standard deviations comparing ACT composite by MBTI for population, 2004-2011 ! ! "##$! ! ! "##%! ! ! "##&! ! ! "##'! ! ! "##(! ! ! "##)! ! ! "#*#! ! ! "#**! ! +,-,./01!2.345,!
6789! !" #" $%" !" #" $%" !" #" $%" !" #" $%" !" #" $%" !" #" $%" !" #" $%" !" #" $%" !" #" $%"
:;<=! *#! "%>$#! ?>?$! !!'! "?>$?! ?>"*! !!)! "&>%&! $>&*! !!'! "$>$"! ">&$! !!'! "$>")! ?>#)! !!!!%! "$>&#! ">)'! !!$! "'>"%! ?>''! !!?! "?>??! ?>#&! !!%"! "%>##! ?>$$!
:;<@! *%! "?>$#! ">?%! *(! "?>()! ?>&(! ""! "?>?&! ?>*$! "?! "$>$?! ?>*'! "*! "$>&'! ?>&(! !!*)! "?>()! ?>)#! !!(! "?>?(! ?>'#! *"! "$>?#! ?>'#! *?)! "?>)'! ?>?&!
:;8=! !!"! "*>%#! ">*"! !!"! "%>%#! &>?&! !!*! "&>##! ! !!"! ")>%#! #>'*! !!$! "&>%#! ">&%! ! ! ! !!"! "#>##! ">(?! !!*! ?">##! ! !!*$! "%>%#! $>?%!
:;8@! !!$! ")>##! *>$*! !!'! "'>")! $>)"! !!&! "%>??! $>&(! !!'! "&>")! $>&$! !!?! "#>&'! ?>#&! !!!!?! ?#>?#! #>%(! !!(! "?>"%! ">('! !!'! "$>'*! $>"?! !!$%! "%>%*! $>?%!
:2<=! !!'! "?>'*! ">'%! *?! "">&)! $>#'! !!$! "$>"%! ?>?#! !!%! "%>"#! %>&'! !!'! "">##! ?>$&! !!!!%! "&>&#! $>"(! !!'! "?>*$! ?>$$! !!%! "*>'%! ?>(&! !!%"! "?>*'! ?>'%!
:2<@! !!$! "*>##! ">&%! !!(! "*>'%! $>*?! *"! "*>'%! ?>''! !!)! "$>##! ?>&$! !!'! "$>$?! ?>))! !!!!)! "">%&! ?>"*! !!'! "*>(&! ?>*(! *"! "">&'! $>"?! !!&(! "">&#! ?>&'!
:2<=! !!$! "&>'%! ">""! !!$! "%>%#! ?>('! !!?! "&>##! ?>&*! !!?! "%>??! ">()! !!$! "%>%#! ?>('! !!*#! "%>*#! ?>%*! !!)! "$>'(! ">$)! !!(! "$>*?! $>((! !!$%! "%>*&! ?>?&!
:28@! !!$! "%>%#! %>"#! !!?! "?>??! *>%?! !!%! "?>$#! ?>&%! !!'! "&>%'! *>%*! *"! "?>(?! ">#$! !!!!'! "?>$?! ?>*#! !!&! "%>*'! ">?*! *$! "?>%#! ?>?*! !!%(! "$>""! ">(*!
9;<=! !!*! "">##! ! !!&! "$>*'! ?>'&! !!$! "?>##! ">$%! !!%! "%>##! ?>(*! !!?! "">&'! *>%?! !!!!*! "#>##! ! !!"! "%>%#! &>?&! !!?! "">##! &>##! !!"%! "?>%&! ?>%)!
9;<@! *)! "%>**! $>%(! *#! "$>(#! ?>)$! !!)! "$>##! $>##! !!)! "$>%&! ?>*'! !!%! "%>(#! *>&$! !!!!$! "$>%#! ?>('! !!%! "&>##! ?>&'! !!?! "$>&'! $>%*! !!&$! "$>()! ?>''!
9;8=! !!*! "(>##! ! !!?! "&>##! *>##! !!"! "$>%#! #>'*! !!"! *)>##! *>$*! !!"! "'>##! $>#(! !!!!*! "&>##! ! !!"! "$>%#! ?>%?! !!$! "%>"%! ">'%! !!*'! "$>((! ">)(!
9;8@! !!"! "?>%#! #>'*! !!"! ?*>##! *>$*! !!?! ")>##! ?>##! !!"! "*>##! $>"$! !!$! "'>##! $>#(! !!!!$! "(>%#! ?>('! !!$! "&>%#! &>"%! !!?! "'>##! *>'?! !!"$! "&>)&! $>"*!
92<=! !!$! "?>"#! ">&(! !!&! "*>&'! $>#(! !!&! "?>*'! ">(&! !!'! "%>##! ?>('! !!"! "(>%#! ">*"! !!*"! "$>##! $>##! **! "">##! ">*)! !!'! "?>%'! %>%#! !!%&! "?>$?! ?>'$!
92<@! !!&! "">(?! ?>$?! !!$! "">##! *>$*! !!"! "&>##! %>&&! !!$! "(>'%! *>%#! !!&! "?>??! *>"*! !!!!?! "%>##! *>##! !!'! "%>'*! ?>"#! !!"! "?>%#! ?>%$! !!?$! "$>%?! ?>*%!
928=! !!&! "%>??! ?>((! !!?! "">??! ">?*! !!&! "">(?! ">*$! !!?! "&>??! ">#(! !!(! "$>"%! ">)"! !!!!&! "$>&'! ?>??! !!&! "&>%#! $>#$! !!%! "*>(#! *>&$! !!$?! "$>?#! ?>"#!
928@! !!'! "%>*$! ?>$$! ! ! ! !!*! "&>##! ! !!*! "">##! ! !!$! "'>##! *>&?! !!**! "%>("! ?>""! !!)! "?>**! ?>#"! !!&! "%>%#! $>%)! !!?)! "%>#%! ?>?&!
!8AB.5! )'! "$>$&! ">)*! )&! "">(?! ?>**! )%! "$>'#! ">)'! )&! "$>''! ">(*! ))! "$>($! ">'$! *##! "?>$$! ">'$! )'! "$>")! ?>&"! )%! "$>?&! ?>%"! ''%! "$>%%! ?>%'!
127

128
exhibits the cross-tabulation Myers-Briggs preference and number of students with those
preferences, the mean composite ACT for students with the preference, and the standard
deviation for each of the cohort groups of students for the years 2004 to 2011. The mean
ACT for the research sample was 24.55 with a standard deviation of 3.57 and interquartile
range of 0.64. Of the eight cohort groups of students, the ACT composite was highest for the
2008 cohort at 24.84.
Table 4.32 provides a summary of the one-way Analysis of Variance (ANOVA)
results which reveals that the full research population ACT composite comparison to Myers-
Briggs type had a significant difference score when measured for each of the eight cohort
years and research sample, F (15, 759) = 3.722, p < .001) at the p = .05 level. The one-way
ANOVA results indicated that there was not a significant difference or change for the ACT
composite score earned by students in each of the eight individual cohort years in comparison
to MBTI, possibly due to sample size.
Tukey-Kramer HSD post hoc tests were computed to determine if a significant
difference existed for the ACT Composite for students in comparison to Myers-Briggs
preference by cohort year or for the research population. The results shown in Table 4.33
indicate nine instances in which significance did appear between the means of ACT and
Myers-Briggs preference for students in the full research population. No significance for
ACT and type were found by individual cohort year with Tukey. Table 4.33 reveals that the
mean difference between INTP and ESFP within the research population was 4.36, a
significant value, as indicated with a p value < .001, at the p = .05 level. Recall that Table
4.31 revealed the mean ACT composite for the research population was 24.55; for INTP,
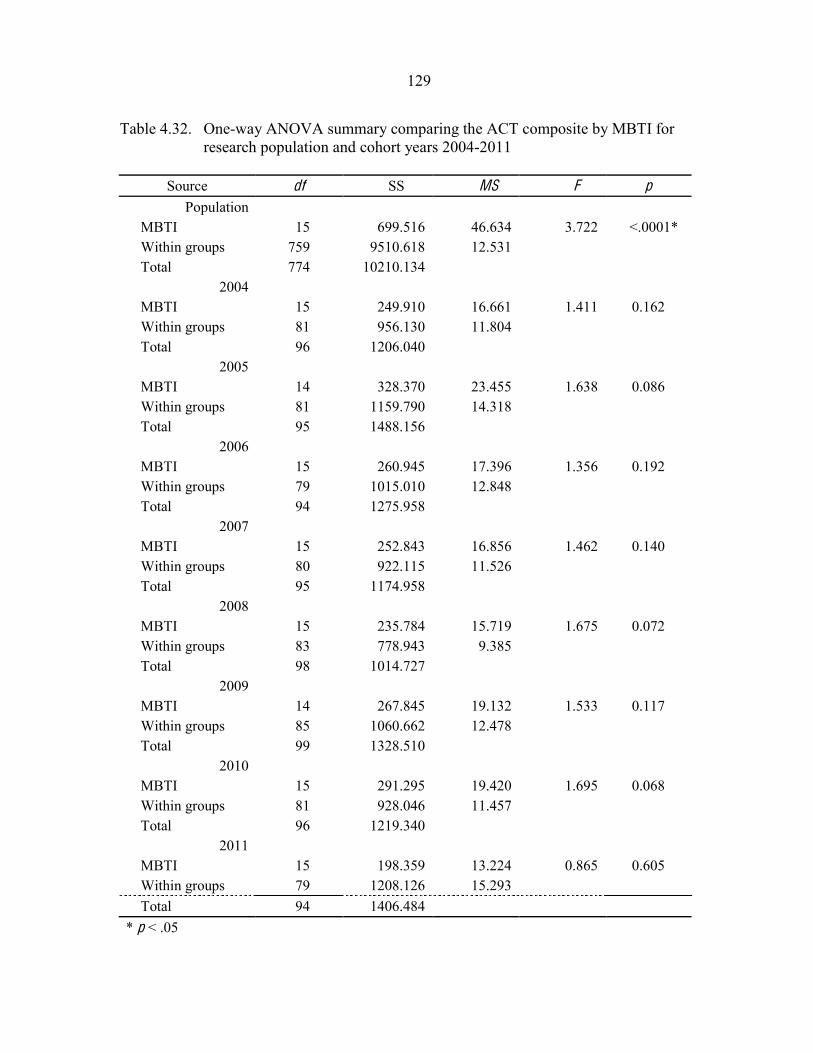
129
Table 4.32. One-way ANOVA summary comparing the ACT composite by MBTI for research population and cohort years 2004-2011
Source df SS MS F p
Population MBTI 15 699.516 46.634 3.722 <.0001* Within groups 759 9510.618 12.531 Total 774 10210.134
2004 MBTI 15 249.910 16.661 1.411 0.162 Within groups 81 956.130 11.804 Total 96 1206.040
2005 MBTI 14 328.370 23.455 1.638 0.086 Within groups 81 1159.790 14.318 Total 95 1488.156
2006 MBTI 15 260.945 17.396 1.356 0.192 Within groups 79 1015.010 12.848 Total 94 1275.958
2007 MBTI 15 252.843 16.856 1.462 0.140 Within groups 80 922.115 11.526 Total 95 1174.958
2008 MBTI 15 235.784 15.719 1.675 0.072 Within groups 83 778.943 9.385 Total 98 1014.727
2009 MBTI 14 267.845 19.132 1.533 0.117 Within groups 85 1060.662 12.478 Total 99 1328.510
2010 MBTI 15 291.295 19.420 1.695 0.068 Within groups 81 928.046 11.457 Total 96 1219.340
2011 MBTI 15 198.359 13.224 0.865 0.605 Within groups 79 1208.126 15.293 Total 94 1406.484
* p < .05
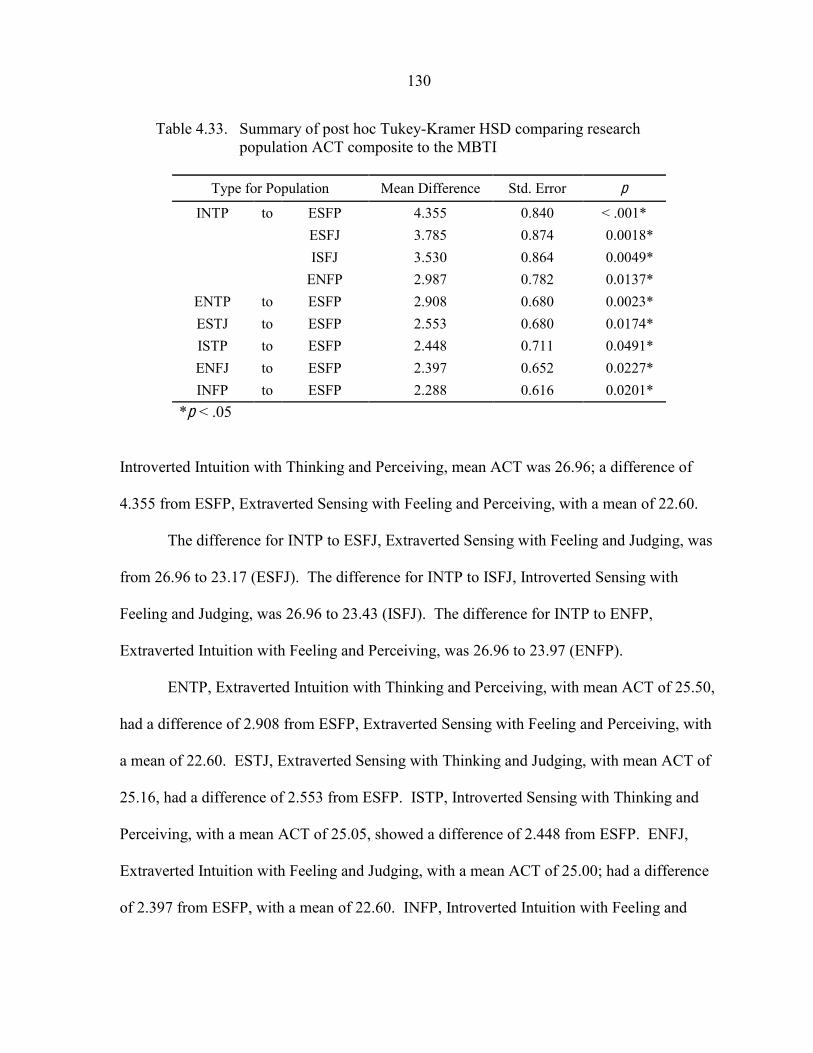
130
Table 4.33. Summary of post hoc Tukey-Kramer HSD comparing research population ACT composite to the MBTI
Type for Population Mean Difference Std. Error p
INTP to ESFP 4.355 0.840 < .001*
ESFJ 3.785 0.874 0.0018*
ISFJ 3.530 0.864 0.0049*
ENFP 2.987 0.782 0.0137*
ENTP to ESFP 2.908 0.680 0.0023* ESTJ to ESFP 2.553 0.680 0.0174* ISTP to ESFP 2.448 0.711 0.0491* ENFJ to ESFP 2.397 0.652 0.0227* INFP to ESFP 2.288 0.616 0.0201*
*p < .05
Introverted Intuition with Thinking and Perceiving, mean ACT was 26.96; a difference of
4.355 from ESFP, Extraverted Sensing with Feeling and Perceiving, with a mean of 22.60.
The difference for INTP to ESFJ, Extraverted Sensing with Feeling and Judging, was
from 26.96 to 23.17 (ESFJ). The difference for INTP to ISFJ, Introverted Sensing with
Feeling and Judging, was 26.96 to 23.43 (ISFJ). The difference for INTP to ENFP,
Extraverted Intuition with Feeling and Perceiving, was 26.96 to 23.97 (ENFP).
ENTP, Extraverted Intuition with Thinking and Perceiving, with mean ACT of 25.50,
had a difference of 2.908 from ESFP, Extraverted Sensing with Feeling and Perceiving, with
a mean of 22.60. ESTJ, Extraverted Sensing with Thinking and Judging, with mean ACT of
25.16, had a difference of 2.553 from ESFP. ISTP, Introverted Sensing with Thinking and
Perceiving, with a mean ACT of 25.05, showed a difference of 2.448 from ESFP. ENFJ,
Extraverted Intuition with Feeling and Judging, with a mean ACT of 25.00; had a difference
of 2.397 from ESFP, with a mean of 22.60. INFP, Introverted Intuition with Feeling and
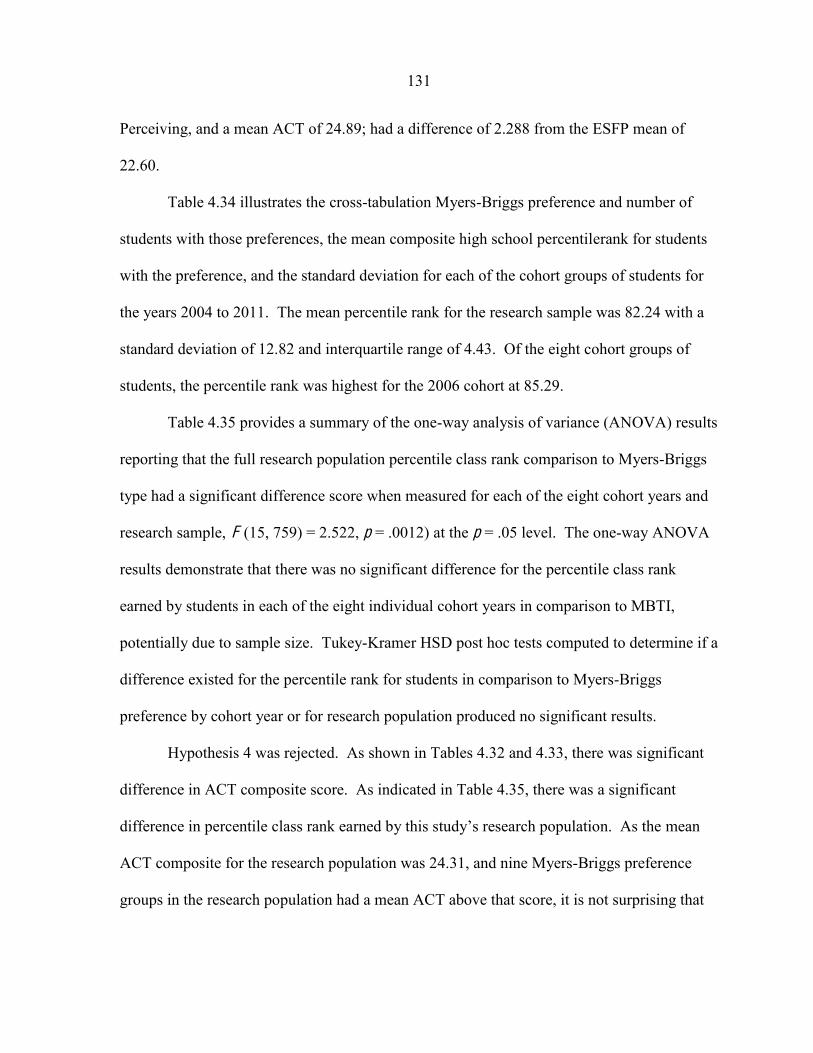
131
Perceiving, and a mean ACT of 24.89; had a difference of 2.288 from the ESFP mean of
22.60.
Table 4.34 illustrates the cross-tabulation Myers-Briggs preference and number of
students with those preferences, the mean composite high school percentilerank for students
with the preference, and the standard deviation for each of the cohort groups of students for
the years 2004 to 2011. The mean percentile rank for the research sample was 82.24 with a
standard deviation of 12.82 and interquartile range of 4.43. Of the eight cohort groups of
students, the percentile rank was highest for the 2006 cohort at 85.29.
Table 4.35 provides a summary of the one-way analysis of variance (ANOVA) results
reporting that the full research population percentile class rank comparison to Myers-Briggs
type had a significant difference score when measured for each of the eight cohort years and
research sample, F (15, 759) = 2.522, p = .0012) at the p = .05 level. The one-way ANOVA
results demonstrate that there was no significant difference for the percentile class rank
earned by students in each of the eight individual cohort years in comparison to MBTI,
potentially due to sample size. Tukey-Kramer HSD post hoc tests computed to determine if a
difference existed for the percentile rank for students in comparison to Myers-Briggs
preference by cohort year or for research population produced no significant results.
Hypothesis 4 was rejected. As shown in Tables 4.32 and 4.33, there was significant
difference in ACT composite score. As indicated in Table 4.35, there was a significant
mean
ACT composite for the research population was 24.31, and nine Myers-Briggs preference
groups in the research population had a mean ACT above that score, it is not surprising that
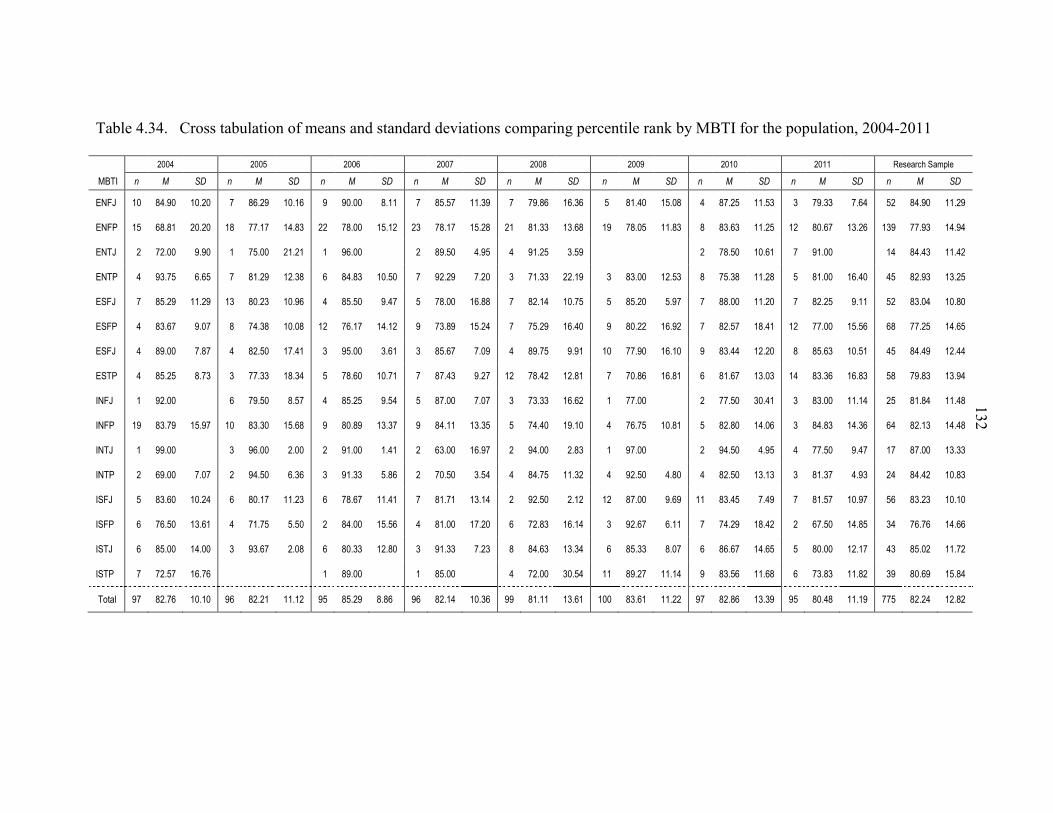
128
Table 4.34. Cross tabulation of means and standard deviations comparing percentile rank by MBTI for the population, 2004-2011 ! ! "##$! ! ! "##%! ! ! "##&! ! ! "##'! ! ! "##(! ! ! "##)! ! ! "#*#! ! ! "#**! ! +,-,./01!2.345,!
6789! !" #" $%" !" #" $%" !" #" $%" !" #" $%" !" #" $%" !" #" $%" !" #" $%" !" #" $%" !" #" $%"
:;<=! *#! ($>)#! *#>"#! !!'! (&>")! *#>*&! !!)! )#>##! !!(>**! !!'! (%>%'! **>?)! !!'! ')>(&! *&>?&! !!%! (*>$#! *%>#(! !!$! ('>"%! **>%?! !!?! ')>??! !!'>&$! !!%"! ($>)#! **>")!
:;<@! *%! &(>(*! "#>"#! *(! ''>*'! *$>(?! ""! '(>##! *%>*"! "?! '(>*'! *%>"(! "*! (*>??! *?>&(! !!*)! '(>#%! **>(?! !!(! (?>&?! **>"%! *"! (#>&'! *?>"&! *?)! ''>)?! *$>)$!
:;8=! !!"! '">##! !!)>)#! !!*! '%>##! "*>"*! !!*! )&>##! ! !!"! ()>%#! !!$>)%! !!$! )*>"%! !!?>%)! ! ! ! !!"! '(>%#! *#>&*! !!'! )*>##! ! !!*$! ($>$?! **>$"!
:;8@! !!$! )?>'%! !!&>&%! !!'! (*>")! *">?(! !!&! ($>(?! *#>%#! !!'! )">")! !!'>"#! !!?! '*>??! "">*)! !!!!?! (?>##! *">%?! !!(! '%>?(! **>"(! !!%! (*>##! *&>$#! !!$%! (">)?! *?>"%!
:2<=! !!'! (%>")! **>")! *?! (#>"?! *#>)&! !!$! (%>%#! !!)>$'! !!%! '(>##! *&>((! !!'! (">*$! *#>'%! !!!!%! (%>"#! !!%>)'! !!'! ((>##! **>"#! !!'! (">"%! !!)>**! !!%"! (?>#$! *#>(#!
:2<@! !!$! (?>&'! !!)>#'! !!(! '$>?(! *#>#(! *"! '&>*'! *$>*"! !!)! '?>()! *%>"$! !!'! '%>")! *&>$#! !!!!)! (#>""! *&>)"! !!'! (">%'! *(>$*! *"! ''>##! *%>%&! !!&(! ''>"%! *$>&%!
:2<=! !!$! ()>##! !!'>('! !!$! (">%#! *'>$*! !!?! )%>##! !!?>&*! !!?! (%>&'! !!'>#)! !!$! ()>'%! !!)>)*! !!*#! ''>)#! *&>*#! !!)! (?>$$! *">"#! !!(! (%>&?! *#>%*! !!$%! ($>$)! *">$$!
:28@! !!$! (%>"%! !!(>'?! !!?! ''>??! *(>?$! !!%! '(>&#! *#>'*! !!'! ('>$?! !!)>"'! *"! '(>$"! *">(*! !!!!'! '#>(&! *&>(*! !!&! (*>&'! *?>#?! *$! (?>?&! *&>(?! !!%(! ')>(?! *?>)$!
9;<=! !!*! )">##! ! !!&! ')>%#! !!(>%'! !!$! (%>"%! !!)>%$! !!%! ('>##! !!'>#'! !!?! '?>??! *&>&"! !!!!*! ''>##! ! !!"! ''>%#! ?#>$*! !!?! (?>##! **>*$! !!"%! (*>($! **>$(!
9;<@! *)! (?>')! *%>)'! *#! (?>?#! *%>&(! !!)! (#>()! *?>?'! !!)! ($>**! *?>?%! !!%! '$>$#! *)>*#! !!!!$! '&>'%! *#>(*! !!%! (">(#! *$>#&! !!?! ($>(?! *$>?&! !!&$! (">*?! *$>$(!
9;8=! !!*! ))>##! ! !!?! )&>##! !!">##! !!"! )*>##! !!*>$*! !!"! &?>##! *&>)'! !!"! )$>##! !!">(?! !!!!*! )'>##! ! !!"! )$>%#! !!$>)%! !!$! ''>%#! !!)>$'! !!*'! ('>##! *?>??!
9;8@! !!"! &)>##! !!'>#'! !!"! )$>%#! !!&>?&! !!?! )*>??! !!%>(&! !!"! '#>%#! !!?>%$! !!$! ($>'%! **>?"! !!!!$! )">%#! !!$>(#! !!$! (">%#! *?>*?! !!?! (*>?'! !!$>)?! !!"$! ($>$"! *#>(?!
92<=! !!%! (?>&#! *#>"$! !!&! (#>*'! **>"?! !!&! '(>&'! **>$*! !!'! (*>'*! *?>*$! !!"! )">%#! !!">*"! !!*"! ('>##! !!)>&)! **! (?>$%! !!'>$)! !!'! (*>%'! *#>)'! !!%&! (?>"?! *#>*#!
92<@! !!&! '&>%#! *?>&*! !!$! '*>'%! !!%>%#! !!"! ($>##! *%>%&! !!$! (*>##! *'>"#! !!&! '">(?! *&>*$! !!!!?! )">&'! !!&>**! !!'! '$>")! *(>$"! !!"! &'>%#! *$>(%! !!?$! '&>'&! *$>&&!
928=! !!&! (%>##! *$>##! !!?! )?>&'! !!">#(! !!&! (#>??! *">(#! !!?! )*>??! !!'>"?! !!(! ($>&?! *?>?$! !!!!&! (%>??! !!(>#'! !!&! (&>&'! *$>&%! !!%! (#>##! *">*'! !!$?! (%>#"! **>'"!
928@! !!'! '">%'! *&>'&! ! ! ! !!*! ()>##! ! !!*! (%>##! ! !!$! '">##! ?#>%$! !!**! ()>"'! **>*$! !!)! (?>%&! **>&(! !!&! '?>(?! **>("! !!?)! (#>&)! *%>($!
!8AB.5! )'! (">'&! *#>*#! )&! (">"*! **>*"! )%! (%>")! (>(&! )&! (">*$! *#>?&! ))! (*>**! *?>&*! *##! (?>&*! **>""! )'! (">(&! *?>?)! )%! (#>$(! **>*)! ''%! (">"$! *">("!
132
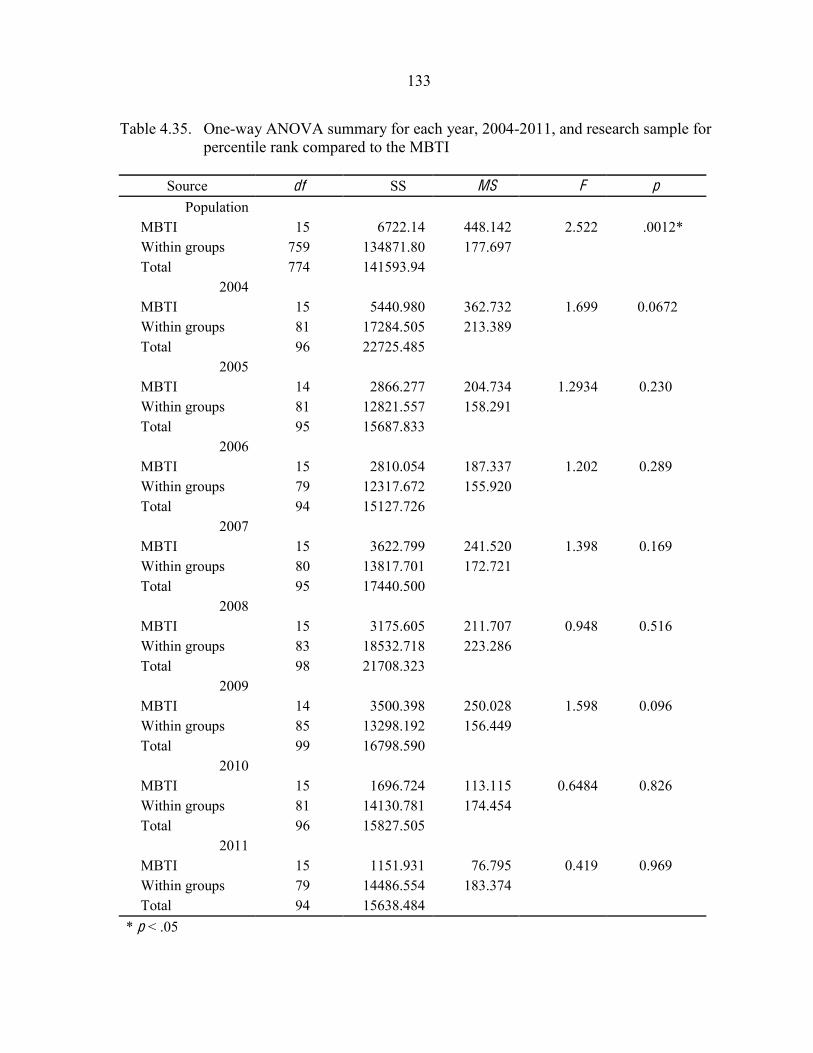
133
Table 4.35. One-way ANOVA summary for each year, 2004-2011, and research sample for percentile rank compared to the MBTI
Source df SS MS F p
Population MBTI 15 6722.14 448.142 2.522 .0012* Within groups 759 134871.80 177.697 Total 774 141593.94
2004 MBTI 15 5440.980 362.732 1.699 0.0672 Within groups 81 17284.505 213.389 Total 96 22725.485
2005 MBTI 14 2866.277 204.734 1.2934 0.230 Within groups 81 12821.557 158.291 Total 95 15687.833
2006 MBTI 15 2810.054 187.337 1.202 0.289 Within groups 79 12317.672 155.920 Total 94 15127.726
2007 MBTI 15 3622.799 241.520 1.398 0.169 Within groups 80 13817.701 172.721 Total 95 17440.500
2008 MBTI 15 3175.605 211.707 0.948 0.516 Within groups 83 18532.718 223.286 Total 98 21708.323
2009 MBTI 14 3500.398 250.028 1.598 0.096 Within groups 85 13298.192 156.449 Total 99 16798.590
2010 MBTI 15 1696.724 113.115 0.6484 0.826 Within groups 81 14130.781 174.454 Total 96 15827.505
2011 MBTI 15 1151.931 76.795 0.419 0.969 Within groups 79 14486.554 183.374 Total 94 15638.484
* p < .05
134
significance in scores were found within the study. Study results revealed in Table 4.33
indicate nine instances in which significance did appear between the means of ACT and
Myers-Briggs preference for students in the full research population. Additionally, as the
mean percentile rank for the research sample was 82.24 with a standard deviation of 12.82, a
difference in percentile class rank measurements for the population was not unexpected.
Significance was found for each pre-college academic aptitude variable with
comparison within the full research population. Although no significance for ACT and
percentile rank and type preference were found by individual cohort year, the results prompt
consideration of these results for first-year college students. There may be need for an
additional understanding and reflection upon learning style related to type and where
opportunities for improving academic strengths may be focused. These data are important
for college administrators, specifically in terms of orientation and preparation for the first
college year.
Differences in first-semester grade point and Myers-Briggs preference by cohort year
and for research sample
Research Question 6: Are there statistically significant differences in Myers-Briggs preference for student grade point in the first college semester by each cohort year and across groups? Are there statistically significant differences in Myers-Briggs preference for students who are able to achieve a 2.00 grade point in in the first college semester by each cohort year and across groups?
H05: There is no difference in Myers-Briggs preference for students in the
study by grade point in the first college semester in comparison by
each cohort year and for the research population.
135
H06: There is no difference in Myers-Briggs preference for students who are
able to achieve a 2.00 grade point in the first college semester in
comparison by cohort year and for the research population.
For a comparison of Myers-Briggs preference with first semester grade point, cross-
tabulations, one-way analysis of variance (ANOVA), and Tukey-Kramer HSD post hoc tests
were computed using the full research sample of 775 students and eight cohort years to
determine the distribution of Myers-Briggs type to the first-semester grade point of students
in the study. Table 4.36 provides a cross-tabulation of Myers-Briggs preference and number
of students, with the preference, mean first-semester grade point for students with the
preference, and the standard deviation for each of the cohort groups of students for the years
2004 to 2011 and the full research sample. The mean first-semester grade point for the
research sample was 2.94 with a standard deviation of 0.76 and interquartile range of 0.32.
Of the eight cohort groups of students, the first-semester grade point was highest for the 2004
cohort at 3.09 and lowest for the 2007 cohort at 2.80.
Table 4.37 provides a summary of one-way ANOVA results which reveal that the full
research population grade point comparison to the Myers-Briggs preference had significant
difference when measured, F (15, 759) = 3.230, p < .0001) at the p = .05 level. Significance
was also found for the 2004 cohort, F (15, 81) = 2.184, p = 0.0134. There was no significant
difference found for first semester grade point earned by students in the 2005-2011
individual cohort years in comparison to Myers-Briggs.
Tukey-Kramer HSD post hoc tests were computed to determine if significant
difference existed for the first semester grade point for students in comparison to Myers-
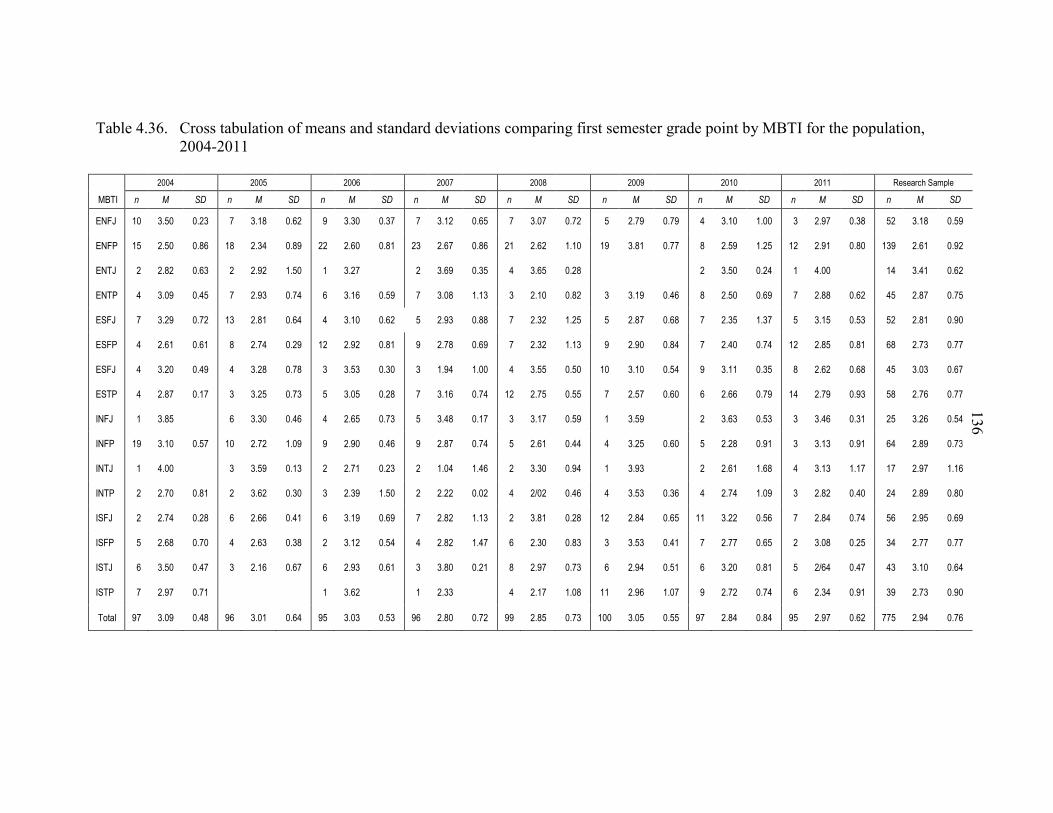
128
Table 4.36. Cross tabulation of means and standard deviations comparing first semester grade point by MBTI for the population, 2004-2011
! ! "##$! ! ! "##%! ! ! "##&! ! ! "##'! ! ! "##(! ! ! "##)! ! ! "#*#! ! ! "#**! ! +,-,./01!2.345,!
6789! !" #" $%" !" #" $%" !" #" $%" !" #" $%" !" #" $%" !" #" $%" !" #" $%" !" #" $%" !" #" $%"
:;<=! *#! >?%#! #?">! !!'! >?*(! #?&"! !!)! >?>#! #?>'! !!'! >?*"! #?&%! !!'! >?#'! #?'"! !!%! "?')! #?')! !!$! >?*#! *?##! !!>! "?)'! #?>(! !!%"! >?*(! #?%)!
:;<@! *%! "?%#! #?(&! *(! "?>$! #?()! ""! "?&#! #?(*! ">! "?&'! #?(&! "*! "?&"! *?*#! *)! >?(*! #?''! !!(! "?%)! *?"%! *"! "?)*! #?(#! *>)! "?&*! #?)"!
:;8=! !!"! "?("! #?&>! !!"! "?)"! *?%#! !!*! >?"'! ! !!"!! >?&)! #?>%! !!$! >?&%! #?"(! ! ! ! !!"! >?%#! #?"$! !!*! $?##! ! !!*$! >?$*! #?&"!
:;8@! !!$! >?#)! #?$%! !!'! "?)>! #?'$! !!&! >?*&! #?%)! !!'! >?#(! *?*>! !!>! "?*#! #?("! !!>! >?*)! #?$&! !!(! "?%#! #?&)! !!'! "?((! #?&"! !!$%! "?('! #?'%!
:2<=! !!'! >?")! #?'"! *>! "?(*! #?&$! !!$! >?*#! #?&"! !!%! "?)>! #?((! !!'! "?>"! *?"%! !!%! "?('! #?&(! !!'! "?>%! *?>'! !!%! >?*%! #?%>! !!%"! "?(*! #?)#!
:2<@! !!$! "?&*! #?&*! !!(! "?'$! #?")! *"! "?)"! #?(*! !!)! "?'(! #?&)! !!'! "?>"! *?*>! !!)! "?)#! #?($! !!'! "?$#! #?'$! *"! "?(%! #?(*! !!&(! "?'>! #?''!
:2<=! !!$! >?"#! #?$)! !!$! >?"(! #?'(! !!>! >?%>! #?>#! !!>! *?)$! *?##! !!$! >?%%! #?%#! *#! >?*#! #?%$! !!)! >?**! #?>%! !!(! "?&"! #?&(! !!$%! >?#>! #?&'!
:28@! !!$! "?('! #?*'! !!>! >?"%! #?'>! !!%! >?#%! #?"(! !!'! >?*&! #?'$! *"! "?'%! #?%%! !!'! "?%'! #?&#! !!&! "?&&! #?')! *$! "?')! #?)>! !!%(! "?'&! #?''!
9;<=! !!*! >?(%! ! !!&! >?>#! #?$&! !!$! "?&%! #?'>! !!%! >?$(! #?*'! !!>! >?*'! #?%)! !!*! >?%)! ! !!"! >?&>! #?%>! !!>! >?$&! #?>*! !!"%! >?"&! #?%$!
9;<@! *)! >?*#! #?%'! *#! "?'"! *?#)! !!)! "?)#! #?$&! !!)! "?('! #?'$! !!%! "?&*! #?$$! !!$! >?"%! #?&#! !!%! "?"(! #?)*! !!>! >?*>! #?)*! !!&$! "?()! #?'>!
9;8=! !!*! $?##! ! !!>! >?%)! #?*>! !!"! "?'*! #?">! !!"! *?#$! *?$&! !!"! >?>#! #?)$! !!*! >?)>! ! !!"! "?&*! *?&(! !!$! >?*>! *?*'! !!*'! "?)'! *?*&!
9;8@! !!"! "?'#! #?(*! !!"! >?&"! #?>#! !!>! "?>)! *?%#! !!"! "?""! #?#"! !!$! "A#"! #?$&! !!$! >?%>! #?>&! !!$! "?'$! *?#)! !!>! "?("! #?$#! !!"$! "?()! #?(#!
92<=! !!"! "?'$! #?"(! !!&! "?&&! #?$*! !!&! >?*)! #?&)! !!'! "?("! *?*>! !!"! >?(*! #?"(! *"! "?($! #?&%! **! >?""! #?%&! !!'! "?($! #?'$! !!%&! "?)%! #?&)!
92<@! !!%! "?&(! #?'#! !!$! "?&>! #?>(! !!"! >?*"! #?%$! !!$! "?("! *?$'! !!&! "?>#! #?(>! !!>! >?%>! #?$*! !!'! "?''! #?&%! !!"! >?#(! #?"%! !!>$! "?''! #?''!
928=! !!&! >?%#! #?$'! !!>! "?*&! #?&'! !!&! "?)>! #?&*! !!>! >?(#! #?"*! !!(! "?)'! #?'>! !!&! "?)$! #?%*! !!&! >?"#! #?(*! !!%! "A&$! #?$'! !!$>! >?*#! #?&$!
928@! !!'! "?)'! #?'*! ! ! ! !!*! >?&"! ! !!*! "?>>! ! !!$! "?*'! *?#(! **! "?)&! *?#'! !!)! "?'"! #?'$! !!&! "?>$! #?)*! !!>)! "?'>! #?)#!
!8BC.5! )'! >?#)! #?$(! )&! >?#*! #?&$! )%! >?#>! #?%>! )&! "?(#! #?'"! ))! "?(%! #?'>! *##! >?#%! #?%%! )'! "?($! #?($! )%! "?)'! #?&"! ''%! "?)$! #?'&!
136
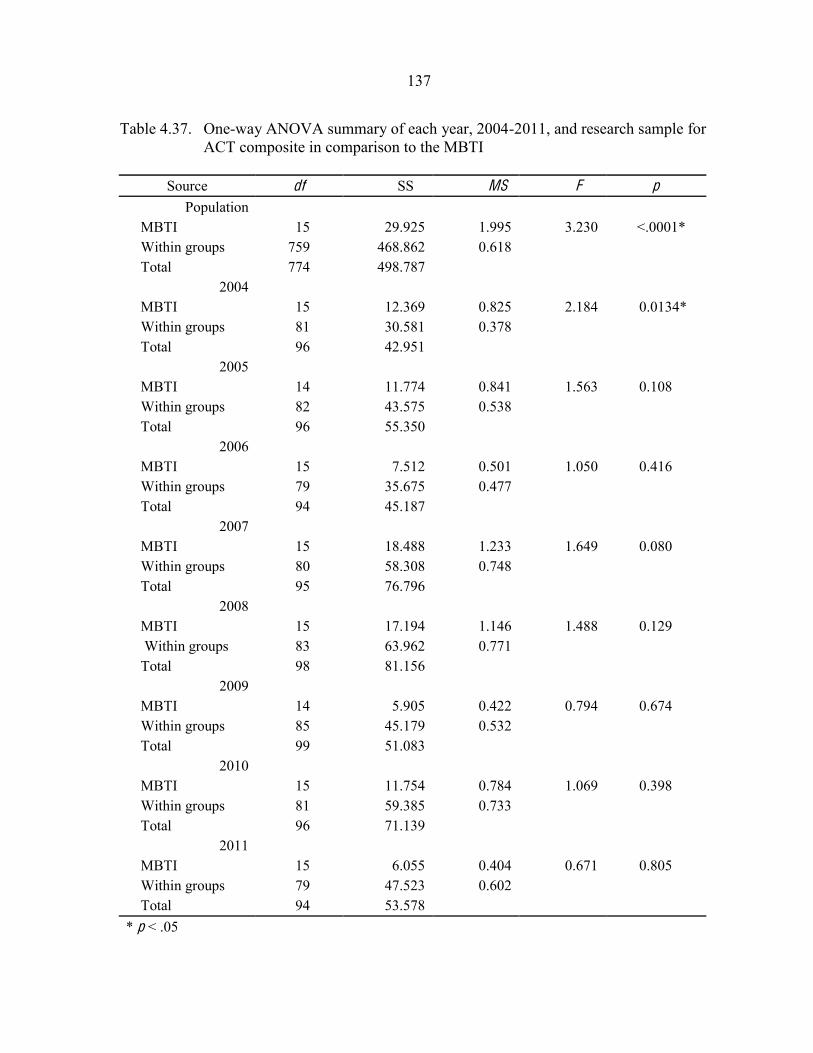
137
Table 4.37. One-way ANOVA summary of each year, 2004-2011, and research sample for ACT composite in comparison to the MBTI
Source df SS MS F p
Population MBTI 15 29.925 1.995 3.230 <.0001* Within groups 759 468.862 0.618 Total 774 498.787
2004 MBTI 15 12.369 0.825 2.184 0.0134* Within groups 81 30.581 0.378 Total 96 42.951
2005 MBTI 14 11.774 0.841 1.563 0.108 Within groups 82 43.575 0.538 Total 96 55.350
2006 MBTI 15 7.512 0.501 1.050 0.416 Within groups 79 35.675 0.477 Total 94 45.187
2007 MBTI 15 18.488 1.233 1.649 0.080 Within groups 80 58.308 0.748 Total 95 76.796
2008 MBTI 15 17.194 1.146 1.488 0.129 Within groups 83 63.962 0.771 Total 98 81.156
2009 MBTI 14 5.905 0.422 0.794 0.674 Within groups 85 45.179 0.532 Total 99 51.083
2010 MBTI 15 11.754 0.784 1.069 0.398 Within groups 81 59.385 0.733 Total 96 71.139
2011 MBTI 15 6.055 0.404 0.671 0.805 Within groups 79 47.523 0.602 Total 94 53.578
* p < .05

138
Briggs preference by cohort year or for the research population. The results shown in Table
4.38 indicate four instances in which significance appeared between the means of grade point
and Myers-Briggs preference for students in the full research population and one instance of
significance for the 2004 cohort. No significance for grade point and type were found in
2005 to 2011 cohort years with Tukey post-hoc test.
As illustrated in Table 4.36, the mean grade point for the research population was
2.86. This can be compared with Table 4.38, which illustrates the significant differences for
grade point found in Tukey post-hoc test. In the full research population, ENTJ, Extraverted
Intuition with Thinking and Judging, the mean GPA was 3.41; a difference of 0.804 from
ENFP, Extraverted Intuition with Feeling and Perceiving, with a mean GPA of 2.61. The
difference for INFJ, Introverted Intuition with Feeling and Judging, with a mean GPA of
3.26, from ENFP, was 0.650. For ENFJ, Extraverted Intuition with Feeling and Judging, and
a mean of 3.18, to ENFP, the difference was 0.579. The difference for ISTJ, Introverted
Sensing with Thinking and Judging, with a mean GPA of 3.10, to ENFP, was 0.494. Table
4.38 also provides the mean grade point for the 2004 cohort was 3.01. In the Tukey post-hoc
test, illustrated in Table 4.38, ENFJ, Extraverted Intuition with Feeling and Judging, with a
mean GPA of 3.50, has a difference of 1.001 from ENFP, Extraverted Intuition with Feeling
and Perceiving, with a mean GPA of 2.50.
To review Myers-Briggs preference with student achievement of a 2.0 grade point in
the first semester, contingency analysis was performed to explore the distribution of the two
nominal categories along with a cell chi-square and is displayed in Table 4.39. or the full
research population of 775 students enrolling from 2004 to 2011, 105 students were unable to
achieve a 2.0 grade point in the first semester. Of the students unable to achieve a 2.0 grade

139
Table 4.38. Summary of post hoc Tukey-Kramer HSD comparing first semester grade point to MBTI
Type for Population Mean Difference Std. Error p
ENTJ to ENFP 0.804 0.220 0.0251* INFJ to ENFP 0.650 0.171 0.0142* ENFJ to ENFP 0.579 0.128 0.0008* ISTJ to ENFP 0.494 0.137 0.0296*
Type for 2004 Cohort Mean Difference Std. Error p
ENFJ to ENFP 1.001 0.248 0.0108* *p < .05
point in the first semester, 32 students, or 30.48%, share the Myers-Briggs preference for
ENFP, Extraverted Intuition with Feeling and Perceiving, in comparison to the National
Sample type distribution, where 8.1% of the population has the ENFP preference.
Measurement of Pearson chi-square test of the contingency analysis produced significance at
0.0076 indicating a small likelihood that the relationship between type and achievement of a
2.0 grade point in the first semester occurred by chance for the research population. The cell
chi-square for the 32 students below a 2.0 grade point with ENFP preference was found to be
9.2070, which is significant at 0.005.
Cohort years 2004 to 2009 were each found with ENFP as the most frequent type
preference for students not achieving a 2.0 grade point in the first semester. For the 2005
cohort of 96 students, shown in Table 4.40, 12 students were unable to achieve a 2.0 grade
point in the first semester. Of the students unable to achieve a 2.0 grade point in the first
semester, six students, or 50.00%, shared the Myers-Briggs preference for ENFP, Extraverted
Sensing with Feeling and Perceiving. Measurement of Pearson chi-square test of the
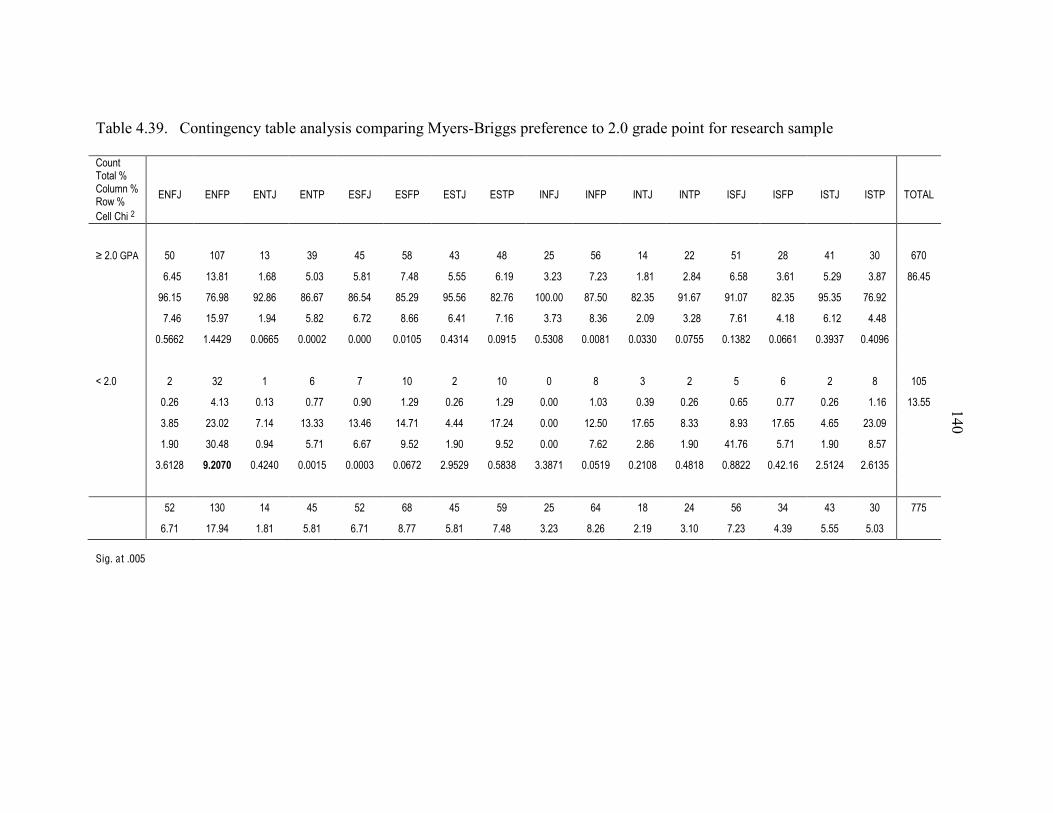
132
Table 4.39. Contingency table analysis comparing Myers-Briggs preference to 2.0 grade point for research sample !"#$%&'"%()&*&!")#+$&*&,"-&*&!.))&!/0&1&
2345& 2346& 23'5& 23'6& 2745& 2746& 27'5& 27'6& 8345& 8346& 83'5& 83'6& 8745& 8746& 87'5& 87'6& '9':;&
& & & & & & & & & & & & & & & & & &
<6:& =>& ?>@& ?A& AB& C=& =D& CA& CD& 1=& =E& ?C& 11& =?& 1D& C?& A>& E@>&
& &&EFC=& ?AFD?& &&?FED& &&=F>A& &&=FD?& &&@FCD& &&=F==& &&EF?B& &&&AF1A& &&@F1A& &&?FD?& &&1FDC& &&EF=D& &&AFE?& &&=F1B& &&AFD@& DEFC=&
& BEF?=& @EFBD& B1FDE& DEFE@& DEF=C& D=F1B& B=F=E& D1F@E& ?>>F>>& D@F=>& D1FA=& B?FE@& B?F>@& D1FA=& B=FA=& @EFB1& &
& &&@FCE& ?=FB@& &&?FBC& &&=FD1& &&EF@1& &&DFEE& &&EFC?& &&@F?E& &&&AF@A& &&DFAE& &&1F>B& &&AF1D& &&@FE?& &&CF?D& &&EF?1& &&CFCD& &
& >F=EE1& ?FCC1B& >F>EE=& >F>>>1& >F>>>& >F>?>=& >FCA?C& >F>B?=& >F=A>D& >F>>D?& >F>AA>& >F>@==& >F?AD1& >F>EE?& >FABA@& >FC>BE& &
& & & & & & & & & & & & & & & & & &
G&1F>& 1& A1& ?& E& @& ?>& 1& ?>& >& D& A& 1& =& E& 1& D& ?>=&
& >F1E& &&CF?A& >F?A& &&>F@@& &&>FB>& &&?F1B& >F1E& &&?F1B& >F>>& &&?F>A& &&>FAB& >F1E& &&>FE=& &&>F@@& >F1E& &&?F?E& ?AF==&
& AFD=& 1AF>1& @F?C& ?AFAA& ?AFCE& ?CF@?& CFCC& ?@F1C& >F>>& ?1F=>& ?@FE=& DFAA& &&DFBA& ?@FE=& CFE=& 1AF>B& &
& ?FB>& A>FCD& >FBC& &&=F@?& &&EFE@& &&BF=1& ?FB>& &&BF=1& >F>>& &&@FE1& &&1FDE& ?FB>& C?F@E& &&=F@?& ?FB>& &&DF=@& &
& AFE?1D& !"#$%$& >FC1C>& >F>>?=& >F>>>A& >F>E@1& 1FB=1B& >F=DAD& AFAD@?& >F>=?B& >F1?>D& >FCD?D& >FDD11& >FC1F?E& 1F=?1C& 1FE?A=& &
& & & & & & & & & & & & & & & & & &
& =1& ?A>& ?C& C=& =1& ED& C=& =B& 1=& EC& ?D& 1C& =E& AC& CA& A>& @@=&
& EF@?& ?@FBC& ?FD?& =FD?& EF@?& DF@@& =FD?& @FCD& AF1A& DF1E& 1F?B& AF?>& @F1A& CFAB& =F==& =F>A& &&Sig. at .005
140
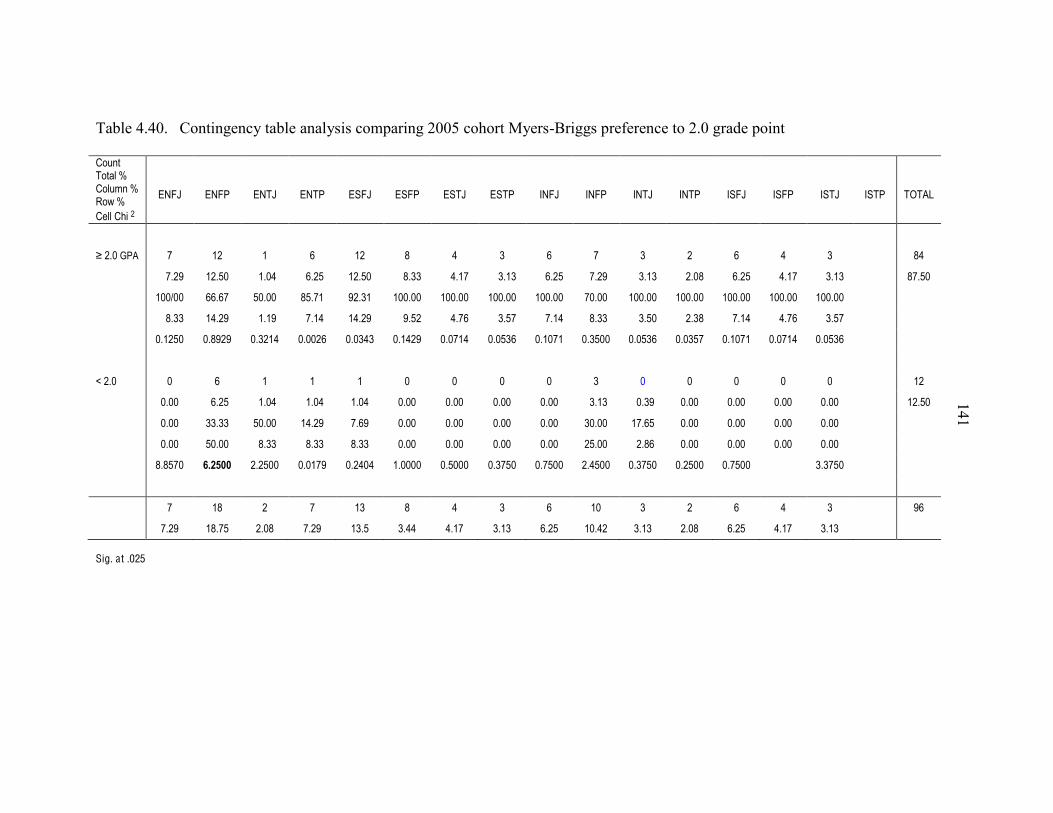
137
Table 4.40. Contingency table analysis comparing 2005 cohort Myers-Briggs preference to 2.0 grade point !"#$%&'"%()&*&!")#+$&*&,"-&*&!.))&!/0&1&
2345& 2346& 23'5& 23'6& 2745& 2746& 27'5& 27'6& 8345& 8346& 83'5& 83'6& 8745& 8746& 87'5& 87'6& '9':;&
& & & & & & & & & & & & & & & & & &
<6:& =& >1& >& ?& >1& @& A& B& ?& =& B& 1& ?& A& B& & @A&
& &&&&=C1D& >1CEF& &&>CFA& &&?C1E& >1CEF& &&&&@CBB& &&&&AC>=& &&&&BC>B& &&&&?C1E& &&=C1D& &&&&BC>B& &&&&1CF@& &&&&?C1E& &&&&AC>=& &&&&BC>B& & @=CEF&
& >FFGFF& ??C?=& EFCFF& @EC=>& D1CB>& >FFCFF& >FFCFF& >FFCFF& >FFCFF& =FCFF& >FFCFF& >FFCFF& >FFCFF& >FFCFF& >FFCFF& & &
& &&&&@CBB& >AC1D& &&>C>D& &&=C>A& >AC1D& &&&&DCE1& &&&&AC=?& &&&&BCE=& &&&&=C>A& &&@CBB& &&&&BCEF& &&&&1CB@& &&&&=C>A& &&&&AC=?& &&&&BCE=& & &
& FC>1EF& FC@D1D& FCB1>A& FCFF1?& FCFBAB& FC>A1D& FCF=>A& FCFEB?& FC>F=>& FCBEFF& FCFEB?& FCFBE=& FC>F=>& FCF=>A& FCFEB?& & &
& & & & & & & & & & & & & & & & & &
H&1CF& F& ?& >& >& >& F& F& F& F& B& F& F& F& F& F& & >1&
& FCFF& &&?C1E& &&>CFA& &&>CFA& >CFA& FCFF& FCFF& FCFF& FCFF& &&BC>B& &&FCBD& FCFF& FCFF& FCFF& FCFF& & >1CEF&
& FCFF& BBCBB& EFCFF& >AC1D& =C?D& FCFF& FCFF& FCFF& FCFF& BFCFF& >=C?E& FCFF& FCFF& FCFF& FCFF& & &
& FCFF& EFCFF& &&@CBB& &&@CBB& @CBB& FCFF& FCFF& FCFF& FCFF& 1ECFF& &&1C@?& FCFF& FCFF& FCFF& FCFF& & &
& @C@E=F& !"#$%%& 1C1EFF& FCF>=D& FC1AFA& >CFFFF& FCEFFF& FCB=EF& FC=EFF& 1CAEFF& FCB=EF& FC1EFF& FC=EFF& & BCB=EF& & &
& & & & & & & & & & & & & & & & & &
& =& >@& 1& =& >B& @& A& B& ?& >F& B& 1& ?& A& B& & D?&
& =C1D& >@C=E& 1CF@& =C1D& >BCE& BCAA& AC>=& BC>B& ?C1E& >FCA1& BC>B& 1CF@& ?C1E& AC>=& BC>B& & &
&Sig. at .025
141
142
contingency analysis for the 2005 cohort did not display significance. Cell chi-square for the
six students with ENFP preference unable to achieve a 2.0 grade point was found to be 6.25,
significant at 0.025.
Null hypothesis 5 was rejected because there was significant difference in Myers-
Briggs preference for students in the study by grade point in the first college semester in
comparison for the 2004 cohort year and for the full research population. In the full research
population, Tukey post-hoc test found ENTJ, INFJ, ENFJ, and ISTJ to have a significant
mean difference for grade point among students with ENFP preference. Tukey analysis for
the 2004 cohort found ENFJ with a significant mean difference from ENFP.
Hypothesis 6 was rejected as there was a significant difference in Myers-Briggs
preference for students who were able to achieve a 2.00 grade point in the first college
semester was identified for the 2005 cohort year and for the research population. Of students
unable to achieve a 2.0 grade point in the 2005 cohort, 50% shared ENFP preferences, as did
30.48% of students not achieving a 2.0 grade point in the full research population. These
results were found significant with cell chi-square.
The findings indicate that, although many students identified with the ENFP
preference, Extraverted Intuition with Feeling and Perceiving, and were capable of adapting
within personal type preferences and learning style to find academic success; others with the
ENFP preference faced difficulty in the transition to the first college semester. As students
who are unable to achieve a 2.0 grade point at the university are placed on academic warning
or probation and in jeopardy of continuing their enrollment, there is need for understanding
of type and learning style to improve college transition and development of academic

143
strengths. These data are important for college administrators, specifically those working
with students during orientation and courses in the first college year.
Relationship of ACT, high school percentile rank, and Myers-Briggs preference to first-
semester grade point by cohort year and for research sample
Research Question 7: Are there statistical relationships for ACT, high school percentilerank and Myers-Briggs preference for student grade point in the first college semester by each cohort year and across groups?
H07: There is no correlation of ACT, class rank, or Myers-Briggs preference
by grade point in the first college semester in comparison by each
cohort year and for the research population.
The model in this analysis was constructed with three types of variables following
Astin’s (1984) conceptual I-E-O framework (input-environment-outcome). The background
characteristics of the student through the Myers-Briggs preference (input); the two high
school academic aptitude characteristics: high school percentile and ACT score
(environment); and the cumulative GPA at the end of the first college semester (outcome).
Multiple logistic regression was implemented for the variables of class rank, ACT
composite, and Myers-Briggs preference for the full research sample and 2004 to 2011
cohorts. Regression analysis uses the relationship between variables to make a prediction
based on observation. As ACT and percentile class rank are considered similar variables of
academic aptitude, a test for multicollinearity and singularity was utilized.
Multicollinearity and singularity
Multicollinearity is a condition in which the independent variables are highly
correlated (.90 or greater) and singularity is when the independent variables are perfectly
144
correlated and one independent variable is a combination of one or more of the other
independent variables. If multicollinearity or singularity exists, then the independent
variables are redundant and do not hold predictive value over another independent variable
(Tabachnick & Fidell, 2007). Prior to applying statistical modeling, the fit between the
academic aptitude variables (ACT and percentile class rank), was checked for
multicollinearity and singularity through Pearson correlation. Tabachnick and Fidell
suggested that independent variables that correlate with one another at .70 or greater should
not be included. As the correlation for ACT and percentile rank was 0.4475, it was
determined the ACT and percentile rank variables could be used in Research Question seven
logistic regression modeling.
To test for normality of the regression model, residuals were collected and a
distribution was calculated finding a normal distribution. To check for autocorrelation of the
residuals, the Durbin-Watson statistic was calculated at 1.782 with a p value of 0.0004. As
the Durbin-Watson is near 2.0, there is no autocorrelation among the residuals. A review of
the Residual by Predicted Plot also found no nonlinear effects.
A validation of the research population models was tested with the Predicted Error
Sum of Squares (PRESS) statistic. The PRESS calculates the residual for each observation
from a new regression that excludes the observation from the estimation. For a model to be
valid the PRESS should be close to but not less than the Sum of Squared Errors (SSE) found
in the ANOVA. As the PRESS for the regression model was found to be 379.11566 as
compared to the SSE of 362.12401, the model was found valid. Subsequent PRESS statistics
for the individual cohort models also demonstrated validity.
145
Models examining MBTI, ACT and percentile rank as variables to GPA
To understand the relationship of academic success in the first college semester to
Myers-Briggs preference and academic aptitude, this analysis examined whether any
relationships existed between first semester grade point and Myers-Briggs preference, ACT
composite, and%ile class rank. A logistic regression analysis was utilized to answer this
question for the students in the sample to describe the average effect, if any, of predictor
variables on the criterion variable of first semester grade point. There were sixteen exclusive
type categories examined for the full research sample and each cohort year.
The model was computed with the sixteen Myers-Briggs type categories, ACT
Composite, and high school class percentile rank seeking relationship to first semester grade
point. As the MBTI variable sorts to the 16 type categories upon regression analysis,
coefficients were not illustrated for MBTI in Table 4.41. The primary variables are listed in
R-Square (R2) ascending order showing increasing proportion of the variation for fit of the
model. The highest possible R2 is 1.0 while the lowest us 0.0. The R2 as a model comparison
can indicate that variables are poorly measured, that variables have been excluded, or that the
model has been incorrectly specified. However, the R2 is only the indicator of completeness
of the regression model, as the p-value of the model is a better factor to determine the
goodness of a regression. The p-value for each of the variables and combination of variables
was significant at <.0001.
To determine the accuracy of model, it was necessary to understand the model fit in
comparison to test results with the variables (Table 4.42). The model coefficient had an R2
of 0.2740, indicating that 27% of factor influence on first-semester grade point could be
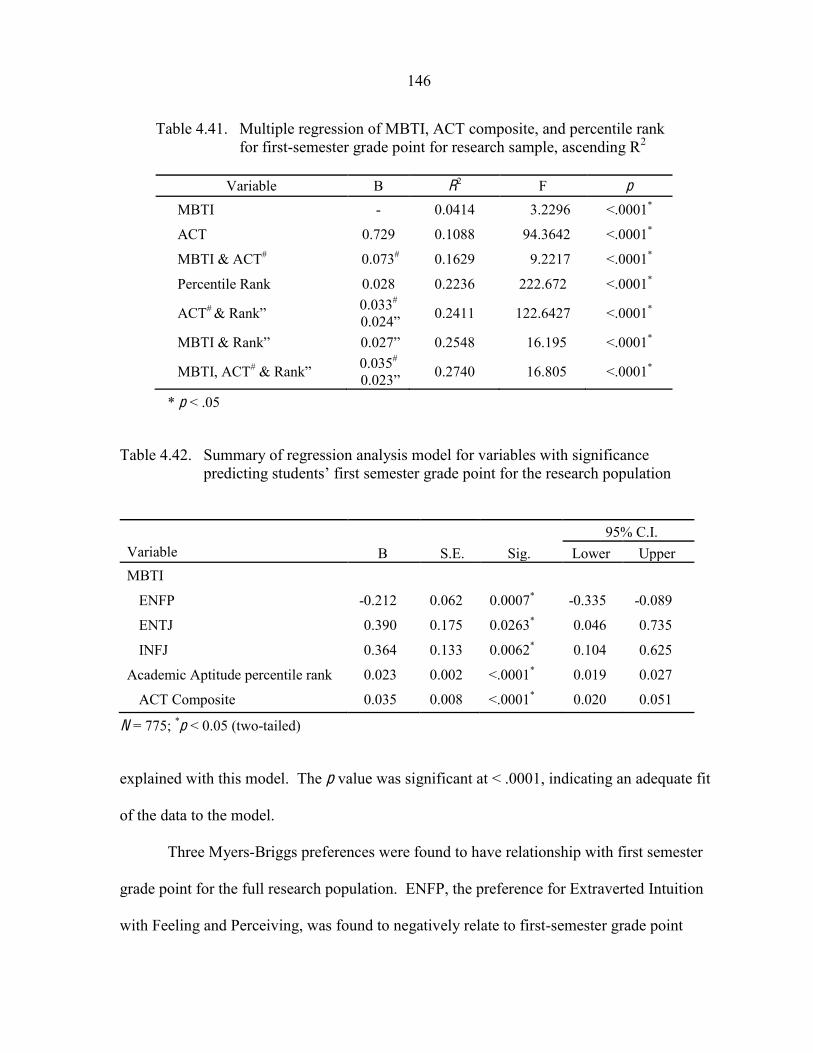
146
Table 4.41. Multiple regression of MBTI, ACT composite, and percentile rank for first-semester grade point for research sample, ascending R2
Variable B R2 F p
MBTI - 0.0414 3.2296 <.0001*
ACT 0.729 0.1088 94.3642 <.0001*
MBTI & ACT# 0.073# 0.1629 9.2217 <.0001*
Percentile Rank 0.028 0.2236 222.672 <.0001*
ACT# 0.033#
0.2411 122.6427 <.0001*
0.2548 16.195 <.0001*
MBTI, ACT# 0.035#
0.2740 16.805 <.0001*
* p < .05
Table 4.42. Summary of regression analysis model for variables with significance
95% C.I. Variable B S.E. Sig. Lower Upper MBTI
ENFP -0.212 0.062 0.0007* -0.335 -0.089
ENTJ 0.390 0.175 0.0263* 0.046 0.735
INFJ 0.364 0.133 0.0062* 0.104 0.625
Academic Aptitude percentile rank 0.023 0.002 <.0001* 0.019 0.027
ACT Composite 0.035 0.008 <.0001* 0.020 0.051
N = 775; *p < 0.05 (two-tailed)
explained with this model. The p value was significant at < .0001, indicating an adequate fit
of the data to the model.
Three Myers-Briggs preferences were found to have relationship with first semester
grade point for the full research population. ENFP, the preference for Extraverted Intuition
with Feeling and Perceiving, was found to negatively relate to first-semester grade point
147
upon regression analysis for the full research population and was significant at 0.0007 where
the p value is <0.05. ENFP was the preference for 17.9% of the research population, which
is 2.21 times more than the expected occurrence of 8.1% in the base national sample. ENTJ,
the preference for Extraverted Intuition with Thinking and Judging, demonstrated a positive
relationship for first semester grade point and was significant at 0.0263. The ENTJ
preference, at 1.8% of the research population, was equal to the national sample percentage.
INFJ, the preference for Introverted Intuition with Feeling and Judging, demonstrated a
positive relationship for first semester grade point and was significant at 0.0062. The INFJ
preference, at 3.3% of the research population, was 2.2 times greater than the national sample
percentage of 1.5%.
Both measures of academic aptitude, ACT composite and high school percentile rank,
were found to positively affect first semester grade point for the full research population.
Percentile rank and ACT were each significant at <.0001, where the p value is < 0.05 for the
model.
The 2004 Cohort model coefficient (Table 4.43) demonstrated R-square of 0.3989,
indicating that nearly 40% of factor influence on first-semester grade point could be
explained with this model. The p value was significant at 0.0004, indicating an adequate fit
of the data to the model.
Two Myers-Briggs preferences were found to have relationship with first semester
grade point for the 2004 Cohort. ENFJ, the preference for Extraverted Intuition with Feeling
and Judging, demonstrated a positive relationship for first semester grade point and was
significant at 0.0437. The ENFJ preference, at 10.3% of the 2004 cohort, was 2.5 times
greater than the national sample percentage of 2.5%. ENFP, the preference for Extraverted
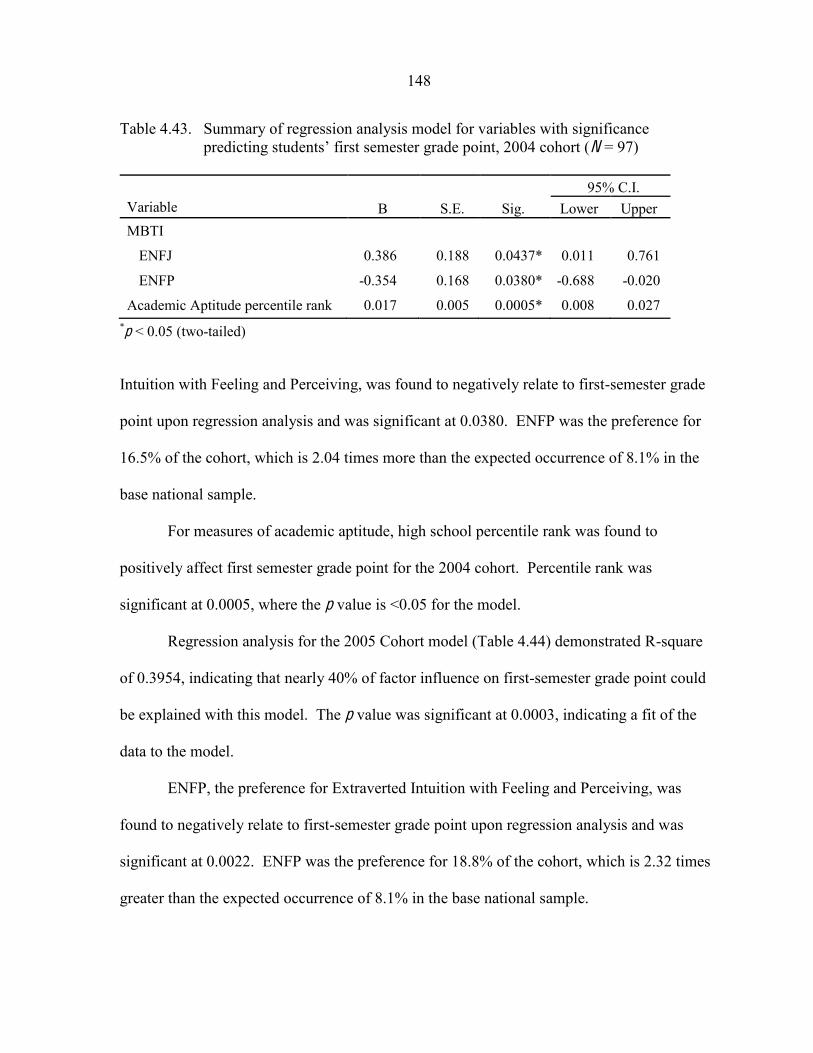
148
Table 4.43. Summary of regression analysis model for variables with significance pre N = 97)
95% C.I. Variable B S.E. Sig. Lower Upper MBTI
ENFJ 0.386 0.188 0.0437* 0.011 0.761
ENFP -0.354 0.168 0.0380* -0.688 -0.020
Academic Aptitude percentile rank 0.017 0.005 0.0005* 0.008 0.027 *p < 0.05 (two-tailed)
Intuition with Feeling and Perceiving, was found to negatively relate to first-semester grade
point upon regression analysis and was significant at 0.0380. ENFP was the preference for
16.5% of the cohort, which is 2.04 times more than the expected occurrence of 8.1% in the
base national sample.
For measures of academic aptitude, high school percentile rank was found to
positively affect first semester grade point for the 2004 cohort. Percentile rank was
significant at 0.0005, where the p value is <0.05 for the model.
Regression analysis for the 2005 Cohort model (Table 4.44) demonstrated R-square
of 0.3954, indicating that nearly 40% of factor influence on first-semester grade point could
be explained with this model. The p value was significant at 0.0003, indicating a fit of the
data to the model.
ENFP, the preference for Extraverted Intuition with Feeling and Perceiving, was
found to negatively relate to first-semester grade point upon regression analysis and was
significant at 0.0022. ENFP was the preference for 18.8% of the cohort, which is 2.32 times
greater than the expected occurrence of 8.1% in the base national sample.
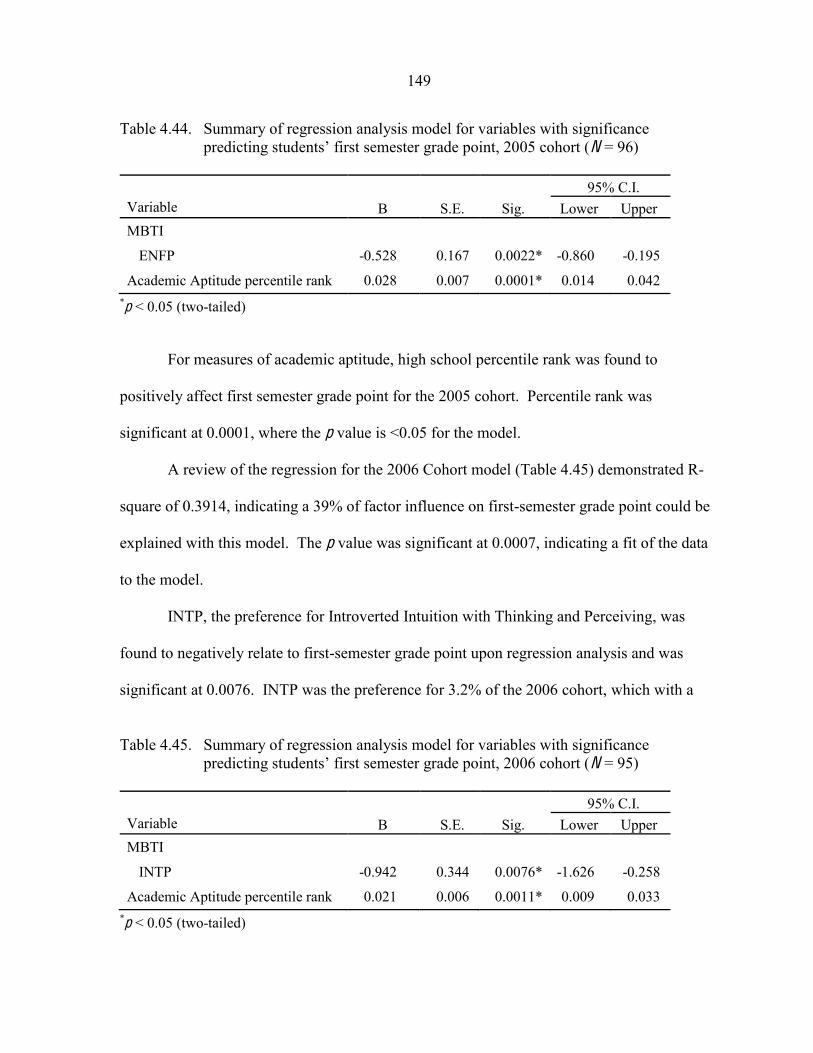
149
Table 4.44. Summary of regression analysis model for variables with significance p N = 96)
95% C.I. Variable B S.E. Sig. Lower Upper MBTI
ENFP -0.528 0.167 0.0022* -0.860 -0.195
Academic Aptitude percentile rank 0.028 0.007 0.0001* 0.014 0.042 *p < 0.05 (two-tailed)
For measures of academic aptitude, high school percentile rank was found to
positively affect first semester grade point for the 2005 cohort. Percentile rank was
significant at 0.0001, where the p value is <0.05 for the model.
A review of the regression for the 2006 Cohort model (Table 4.45) demonstrated R-
square of 0.3914, indicating a 39% of factor influence on first-semester grade point could be
explained with this model. The p value was significant at 0.0007, indicating a fit of the data
to the model.
INTP, the preference for Introverted Intuition with Thinking and Perceiving, was
found to negatively relate to first-semester grade point upon regression analysis and was
significant at 0.0076. INTP was the preference for 3.2% of the 2006 cohort, which with a
Table 4.45. Summary of regression analysis model for variables with significance N = 95)
95% C.I. Variable B S.E. Sig. Lower Upper MBTI
INTP -0.942 0.344 0.0076* -1.626 -0.258
Academic Aptitude percentile rank 0.021 0.006 0.0011* 0.009 0.033 *p < 0.05 (two-tailed)

150
self-selection of 0.97, is slightly less than the expected occurrence of 3.3% in the base
national sample.
As a measure of academic aptitude, high school percentile rank was found to
positively affect first semester grade point for the 2006 cohort. Percentile rank was
significant at 0.0011, where the p value is <0.05 for the model.
A review of the regression for the 2007 Cohort model (Table 4.46) demonstrated R-
square of 0.3655, indicating nearly 37% of factor influence on first-semester grade point
could be explained with this model. The p value was significant at 0.0020, indicating a fit of
the data to the model.
No Myers-Briggs preferences were found to have relationship to first semester grade
point for the cohort. For measures of academic aptitude, high school percentile rank was
found to positively affect first semester grade point with significance at 0.0120. ACT also
held a positive relationship with first semester GPA and demonstrated a 0.0236 significance.
Table 4.46. Summary of regression analysis model for variables with significance N = 96)
95% C.I. Variable B S.E. Sig. Lower Upper Academic Aptitude percentile rank 0.021 0.008 0.0120* 0.005 0.037
ACT Composite 0.072 0.031 0.0236* 0.010 0.134 *p < 0.05 (two-tailed)
Regression analysis for the 2008 Cohort model (Table 4.47) demonstrated R-square
of 0.5162, indicating that 51% of factor influence on first-semester grade point could be
explained with this model. The p value was significant at <.0001, indicating a satisfactory fit
of the data to the model.

151
Table 4.47. Summary of regression analysis model for variables with significance N = 99)
95% C.I. Variable B S.E. Sig. Lower Upper
Academic Aptitude percentile rank 0.034 0.005 <.0001* 0.023 0.045 *p < 0.05 (two-tailed)
Only a measure of academic aptitude, high school percentile rank, was found with a
relationship to first semester grade point. Percentile rank was a positive influence to first
semester grade point for the 2008 cohort and was significant at <.0001, where the p value is
<0.05 for the model.
The regression for the 2009 Cohort model (Table 4.48) posted an R-square of 0.3214,
indicating that 32% of factor influence on first-semester grade point could be explained with
this model. The p value was significant at .0043, indicating a fit of the data to the model.
The measures of academic aptitude, ACT composite and percentile rank, were found
to have a relationship to first semester grade point. ACT was positively related to first
semester grade point for the 2008 cohort and was significant at .0095, where the p value is
<0.05 for the model. Percentile rank was also positively related with significance at 0.0030.
Table 4.48. Summary of regression analysis model for variables with significance ade point, 2009 cohort (N = 100)
95% C.I. Variable B S.E. Sig. Lower Upper Academic Aptitude percentile rank 0.018 0.021 0.0095* 0.006 0.030
ACT Composite 0.056 0.006 0.0030* 0.014 0.098 *p < 0.05 (two-tailed)

152
Regression analysis for the 2010 Cohort model (Table 4.49) demonstrated R-square
of 0.3005, indicating that 30% of factor influence on first-semester grade point could be
explained with this model. The p value was significant at .0212, indicating fit of the data to
the model.
Only a measure of academic aptitude, high school percentile rank, was found with a
relationship to first semester grade point for this cohort. Percentile rank had a positive
relationship to first semester grade point for the 2010 cohort and was significant at .0192,
where the p value is <0.05 for the model.
A regression analysis for the 2011 Cohort model (Table 4.50) resulted in an R-square
of 0.3805, indicating that a 38% factor influence on first-semester grade point could be
explained with this model. The p value was significant at 0.0012, indicating a fit of the data
to the model.
Table 4.49. Summary of regression analysis model for variables with significance N = 97)
95% C.I. Variable B S.E. Sig. Lower Upper
Academic Aptitude percentile rank 0.018 0.008 0.0192* 0.003 0.033 *p < 0.05 (two-tailed)
Table 4.50. Summary of regression analysis model for variables with significance t (N = 95)
95% C.I. Variable B S.E. Sig. Lower Upper MBTI
ESTJ -0.483 0.236 0.0444* -0.954 -1.013
Academic Aptitude percentile rank 0.268 0.007 0.0001* 0.013 0.040 *p < 0.05 (two-tailed)
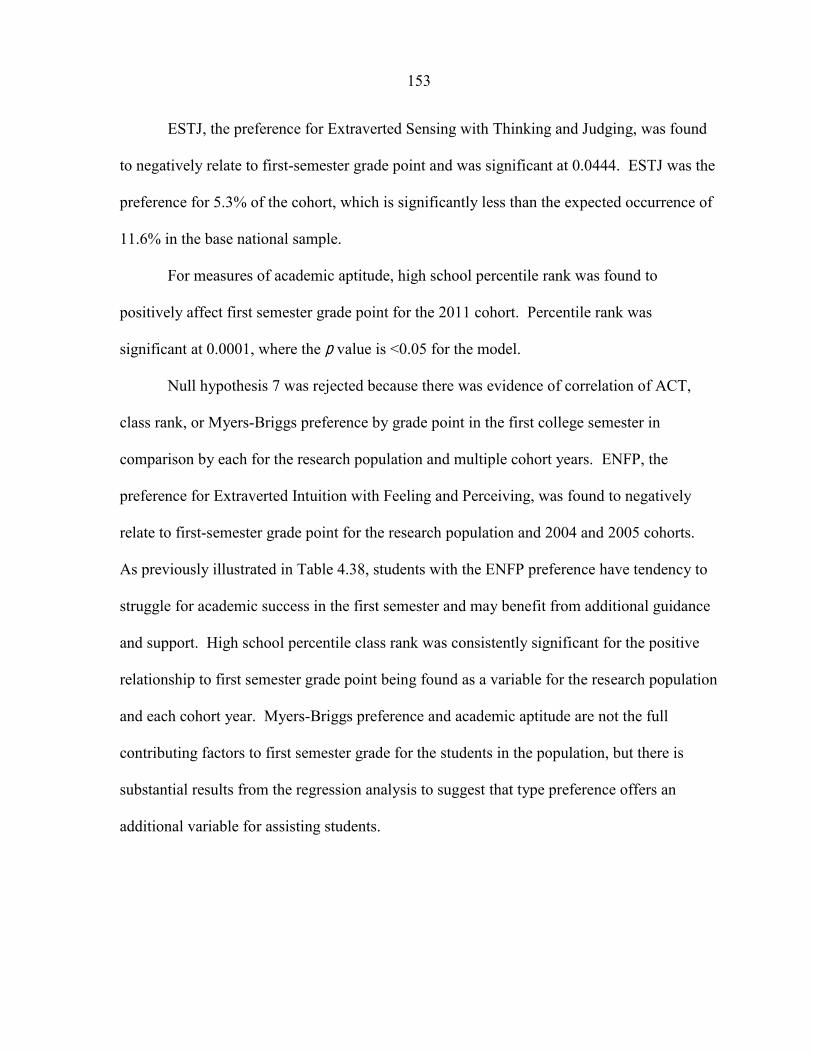
153
ESTJ, the preference for Extraverted Sensing with Thinking and Judging, was found
to negatively relate to first-semester grade point and was significant at 0.0444. ESTJ was the
preference for 5.3% of the cohort, which is significantly less than the expected occurrence of
11.6% in the base national sample.
For measures of academic aptitude, high school percentile rank was found to
positively affect first semester grade point for the 2011 cohort. Percentile rank was
significant at 0.0001, where the p value is <0.05 for the model.
Null hypothesis 7 was rejected because there was evidence of correlation of ACT,
class rank, or Myers-Briggs preference by grade point in the first college semester in
comparison by each for the research population and multiple cohort years. ENFP, the
preference for Extraverted Intuition with Feeling and Perceiving, was found to negatively
relate to first-semester grade point for the research population and 2004 and 2005 cohorts.
As previously illustrated in Table 4.38, students with the ENFP preference have tendency to
struggle for academic success in the first semester and may benefit from additional guidance
and support. High school percentile class rank was consistently significant for the positive
relationship to first semester grade point being found as a variable for the research population
and each cohort year. Myers-Briggs preference and academic aptitude are not the full
contributing factors to first semester grade for the students in the population, but there is
substantial results from the regression analysis to suggest that type preference offers an
additional variable for assisting students.
154
Summary
This chapter presented the quantitative results of the study through various
descriptive and inferential statistical analyses. The descriptive statistics provided the
background characteristics of the population in this study by gender, STEM major, and
academic aptitude measurements of ACT Composite and high school graduating class
percentile rank. Findings for the research population included the nearly even distribution of
female students (50.1%) and male students (49.8%). The mean composite ACT score was
24.31, and the mean percentile rank was 81.35. STEM majors were selected for 55% of
students in the study.
Sections RQ 2–7 provided the inferential statistical results for the research questions
and hypotheses stated in each section. Statistically significant differences in the distribution
of Myers-Briggs type preferences in comparison to the national base population sample were
reported in Section RQ 2. In the full research sample of 775 students, seven type preferences
were found to be a lower percentage than the national base sample, eight preferences were
found to be greater than the base sample, and one, ENTJ was found to have an equal
percentage in the research sample as in the national base sample. For the eight cohort years
in the study (8 cohorts, 16 type preferences), only three type preference comparisons were
found to be equal to the base national sample for the preference, two for INTJ and one ENTJ.
Section RQ 3 found statistically significant differences in the distribution of type
preferences among males and females in each cohort group of students and for the full
research sample. ENFP or Extraverted Intuition with Feeling and Perceiving is the most
frequent type preference of males for the research population at 17.4% (N = 67) and females
at 18.5% (N = 71). The least frequent preference for male students is ENTJ, or Extraverted

155
Intuition with Thinking and Judging at 1.3% of the population (N = 5). The least frequent
preference for female students is INTP, or Introverted Intuition with Thinking and Perceiving
at 1.5% (N = 6).
Section RQ 4 examined the presence of a statistically significant difference in the
type preference of students by whether they had selected a STEM or non-STEM major.
Analysis found statistically significant differences in the distribution of type preferences
among STEM majors in each cohort and among seven of eight cohorts for non-STEM majors
and for the full research sample. Only the 2010 non-STEM cohort had no type preferences
found to be significantly different from the base sample. ENFP or Extraverted Intuition with
Feeling and Perceiving was found as the most frequent type preference for the research
population with STEM majors at 17.0% (N = 73) and non-STEM majors at 19.1% (N = 66).
The least frequent preference for STEM students is ENTJ, or Extraverted Intuition with
Thinking and Judging at 1.86% of the population (N = 8). The least frequent preference for
non-STEM students is INTJ, or Introverted Intuition with Thinking and Judging at 1.16% (N
= 4).
To answer Research Question 5, cross-tabulations, one-way analysis of variance
(ANOVA), and Tukey-Kramer HSD post hoc tests were utilized to determine any difference
in ACT and high school percentile rank and Myers-Briggs preference by cohort year and for
the research population. Significant difference in ACT Composite score and percentile class
rank were identified in this study’s research population but not by individual cohort year.
Mean ACT composite for the research population was 24.31 while nine Myers-Briggs
preference groups in the population had a mean ACT above that score. Additionally, mean
percentile rank for the research sample was 81.35 with a standard deviation of 12.82.
156
Section RQ 6 compared differences in Myers-Briggs preference for student grade
point in the first college semester by each cohort year and across groups. A significant
difference in Myers-Briggs preference for students who are able to achieve a 2.00 grade point
in the first college semester was identified for the 2005 cohort year and for the research
population. Of students unable to achieve a 2.0 grade point in the 2005 cohort, 50% shared
ENFP preferences, as did 30.48% of students not achieving a 2.0 grade point in the full
research population.
Section RQ 7 detailed logistic regression results finding evidence of correlation of
ACT, class rank, and Myers-Briggs preference by grade point in the first college semester in
for the research population and multiple cohort years. ENFP, the preference for Extraverted
Intuition with Feeling and Perceiving, was found to negatively relate to first-semester grade
point for the research population and 2004 and 2005 cohorts. High school percentile class
rank was consistently significant for positive relationship to first semester grade point as a
variable for the research population and each cohort year.
This study produced indicators to suggest that Myers-Briggs preference, particularly
preferences for ENFP, Extraverted Intuition with Feeling and Perceiving, may impact student
academic progress for this population. Identification and understanding of these preferences
may assist in compensating for student learning differences and academic direction. As type
theory tells us that preferences are not related to ability or motivation, identifying a trend
toward specific type preferences related to academic achievement may provide support for
the student population in this research. These data are important for college administrators,
specifically those working with students during orientation, advisement, and courses in the
first college year.

157
CHAPTER 5. DISCUSSION
Institutions are increasingly scrutinized for their ability to retain and graduate
students. Higher education administrators are aware of these expectations and consistently
measure predictors, productivity, programs, and funding to enhance retention. The evolving
student demographic provides ever-changing opportunities for examining student behaviors,
academic, and personal goals.
Usage of a learning style assignment in a first-year seminar course has revealed that a
student cohort with anomalous Myers-Briggs preferences for Extraverted Intuition with
Feeling and Perceiving could provide analysis for the field of typological student
development and student retention research. Delving further into a comparison of type
preferences for students who are not able to achieve a 2.0 grade point average and who may
be withdrawing from an institution prior to completing a degree may offer insight to
improving student success. These circumstances define the hypothesis that psychological
type preferences may be a variable for success for this student cohort within the university.
As human learning has been described as individual as human fingerprints (Dryden &
Vos, 2005), an understanding of psychological type as made available by the MBTI
instrument can be a mechanism for assisting students and college administrators in
understanding learning and student success in the post-secondary institutions. Seidman
(2012) described early identification, or the assessment of student skill levels, as an essential
component to retention. Establishing student learning style through the Myers-Briggs
assessment or other measures contributes to this formula. As university cultures are wide
158
and varying, establishing student fit and learning style within the culture is one method for
enhancing student satisfaction and progress to graduation.
There is evidence that statistical analysis of type distributions for a specific
population may help identify whether MBTI preferences correlate to student academic
difficulty in the first college year. The review of the literature supports that type preferences,
particularly preferences for Perceiving, may have an effect on student academic progress and
that identification may assist in compensating for student learning differences. Type
dichotomies are similar to arguments for lateralization of brain functions, science shows that
individuals use both sides of their brain for all activities, but one hemisphere may have
dominance, as it is with type and learning. Type theory tells us that preferences are not
related to ability or motivation and that all preferences are equal in their validity and strength
to the individual and no type is of more advantage than another. This research has sought to
confirm these questions to plan for future assessment and so that adaptive programming may
be aimed at increasing student success.
The purpose of this study was to examine the perceived relationship between a
personality and learning style assessment and student success in the first college semester.
This study had three goals: (a) understand the results of the Myers-Briggs assessment for the
research population in comparison to a national base sample; (b) explore the relationship of
the Myers-Briggs assessment to gender and STEM major for the research population; and (c)
investigate the correlation of academic aptitude and Myers-Briggs assessment results to
grade point in the first college semester. This chapter discusses the quantitative results and
overall findings of this study. First, a summary of the study is provided followed by the
findings of the quantitative research. Next, this chapter will discuss implications for practice,

159
application of the study, recommendations for future research and final thoughts regarding
the significance of the study.
The literature review in Chapter 2 presented an overview of type theory, and the
benefit of measuring type and academic success. It outlined the framework, importance, and
critical need for this research. The review also provided a basis for addressing the research
questions and hypotheses, and for determining which variables (such as ACT and Class rank)
to consider for use in the logistic regression models. The chapter also provided a synopsis of
the positive aspects of type and learning style identification as an asset to college academic
success.
Chapter 3 presented the quantitative methodology for using a secondary database to
examine the research questions in this study. Myers-Briggs preferences gathered from
students in a first semester learning community seminar course, supplemented by academic
aptitude, major, and grade point information were sorted by the university registrar and
investigated for relationship to academic success. Descriptive and inferential statistics were
used to analyze the demographic pre-college academic aptitude characteristics and,
specifically, the Myers-Briggs assessment results collected for students entering the
university 2004 to 2011. The research questions, hypotheses, research design, setting,
population, data collection, variables, data management, and analyses were stated. The
chapter also discussed ethical considerations, limitations, and delimitations of the study.
Findings
Through descriptive and inferential statistical analyses, the results of seven research
questions were presented in Chapter 4. Research Question 1 identified descriptive statistics

160
found for the research population of 775 students. Each cohort year enrollment averaged 97
students with the smallest class being 95 students and the largest class enrolling 100 students.
Representation of male and female percentage for the research sample of students was
roughly equal (female: 50.1%). The percentage of female students by cohort year ranged
from 39% to 58%. A majority of students in the research sample had STEM majors (55%)
with the smallest percentage of STEM being the 2004 cohort year with 45% and the largest
proportion being the 2005 cohort year with 66%. For measures of academic aptitude, the
research population had a mean composite ACT score of 24.31 and mean high school class
percentile rank of 81.35. The mean first semester cumulative GPA was 2.87 for the research
samples with the 2004 cohort posting the highest mean grade point at 3.01 and the 2008
cohort registering the lowest first semester grade point at 2.75.
Majority of students in the study have ENFP preferences
Research Question 2 utilized SRTT analysis for comparison of the research sample
Myers-Briggs type preferences to a national base sample. Significant differences were
identified in the distribution of type preferences in each cohort group of students and for the
full research sample compared to the national sample. The preference of Extraverted
Intuition with Feeling and Perceiving, ENFP, was the most frequent type and was found in
17.9% of the population, a self-selection index of 2.21. Described by Myers (1980) the
ENFP individual is strong in initiative and creativity, but is not always successful at
completing projects. They will frequently demonstrate impulsive energy but not always the
willpower to get things done. The ENFP hates routine, thrives on variety, may lack planned
purpose, but is full of ideas.
161
Findings for the research sample illustrated seven type preferences were found to be
of a lower percentage than the national base sample, eight preferences were found to be
greater than the base sample, and one, ENTJ, Extraverted Intuition with Thinking and
Judging, was found to have an equal percentage in the research sample as in the national base
sample. For the eight cohort years in the study (eight cohort years, 16 type preferences), only
three type preference comparisons were found to be equal to the base national sample for the
preference, two INTJ, Introverted Intuition with Thinking and Judging, and one ENTJ,
Extraverted Intuition with Thinking and Judging.
Differing frequency of type preferences for male and female students
Significant differences were identified in the distribution of type preferences among
males and females in each cohort group of students and for the full research sample in
research Question 3. Cohort years 2009 and 2010 demonstrated two significantly different
female type preferences in comparison to the base sample although the overall sample for
female students in those cohorts did not appear significant. ENFP or Extraverted Intuition
with Feeling and Perceiving was found to be the most frequent type preference for the
research population, males and females. The least frequent preference for male students was
ENTJ, or Extraverted Intuition with Thinking and Judging, while the least frequent
preference for female students is INTP, or Introverted Intuition with Thinking and
Perceiving. In the full research sample and eight cohort years, only one type preference for
male and for female students was found to be equal to the base national sample for the
preference. ISTP, Introverted Sensing with Thinking and Perceiving, for male students and
162
ESTJ, Extraverted Sensing with Thinking and Judging, for female students, were found equal
to the national sample in the 2010 cohort year measurement.
ENFP most frequent type for STEM and non-STEM majors
Research Question 4 found significant differences in Myers-Briggs preferences for
STEM and non-STEM students in the study by cohort year and for the research population in
comparison to the distribution of a national population. Statistically significant differences in
the distribution of type preferences were found among STEM majors in each cohort, for
seven of eight cohorts for non-STEM majors, and for the full research sample. Only the
2010 non-STEM cohort had no type preferences found to be significantly different from the
base sample.
ENFP or Extraverted Intuition with Feeling and Perceiving was the most frequent
type preference for the research population with STEM and non-STEM majors, mirroring the
finding for the research population. The least frequent preference for STEM students is
ENTJ, or Extraverted Intuition with Thinking and Judging, while the least frequent
preference for non-STEM students is INTJ, or Introverted Intuition with Thinking and
Judging. Analyzing the full research sample and eight cohort years, only two type
preferences for STEM majors were found to be equal to the base national sample for the
preference, ESTP, Extraverted Sensing with Thinking and Perceiving, in the 2006 cohort
year, and ENTJ, Extraverted Intuition with Thinking and Judging, in the 2011 cohort.
163
Variances exist between ACT and class rank and Myers-Briggs preference
Upon analysis of the pre-college academic aptitude variables, ACT composite and
percentile class rank, significance was found for each variable in comparison to the full
research population in Research Question 5. There was also significant difference in ACT
Composite score and percentile class rank earned by this study’s research population in
comparison between type preferences. No significance for ACT or percentile rank and type
preference was found by individual cohort year. Nine instances of significant difference
were found between the means of ACT and Myers-Briggs preference for students in the full
research population. INTP, or Introverted Intuition with Thinking and Perceiving, had
significantly different ACT Composite from ESFP, ESFJ, ISFJ, and ENFP. Type preferences
for ENTP, ESTJ, ISTP, ENFJ, and INFP were found to have significant difference for ACT
Composite from ESFP, or Extraverted Sensing with Feeling and Perceiving.
Variances exist between first semester GPA and Myers-Briggs preference
In a review of first-semester grade point comparisons in Research Question 6,
significant difference was found in Myers-Briggs preference for students in the study for the
2004 cohort year and for the full research population. Students with ENTJ, INFJ, ENFJ, and
ISTJ preferences were found to have a significantly higher grade point than students with
ENFP, Extraverted Intuition with Feeling and Perceiving, preference in the full research
population. Students in the 2004 cohort with ENFJ, Extraverted Intuition with Feeling and
Judging, preference were found with significantly higher grade point than those with ENFP,
Extraverted Intuition with Feeling and Perceiving, preference in the cohort. A significant
difference in Myers-Briggs preference for students able to achieve a 2.00 grade point in the
164
first college semester was identified for 2005 cohort year and for the research population. Of
students unable to achieve a 2.0 grade point in the 2005 cohort, 50% shared ENFP,
Extraverted Intuition with Feeling and Perceiving, preferences, as did 30.48% of students not
achieving a 2.0 grade point in the full research population.
ENFP preference has negative impact for some students
Finally, evidence of correlation for ACT, class rank, and Myers-Briggs preference by
grade point in the first college semester was found among each variable measured for the
research population and multiple cohort years. ENFP, the preference for Extraverted
Intuition with Feeling and Perceiving, was found to negatively relate to first-semester grade
point for the research population, 2004, and 2005 cohorts. High school percentile class rank
was consistently significant for the positive relationship to first semester grade point as a
variable for the research population and each cohort year. Myers-Briggs preference and
academic aptitude did not demonstrate as full contributing factors to first semester grade for
the students in the population, but there were substantial results from the regression analysis
to suggest that type preference offers an additional variable for assisting and evaluating
student strengths and learning styles.
Conclusions
Questions central to this study inquire whether the overrepresentation of certain
Myers-Briggs type preferences are distinct to this participant population and whether it leads
to an overrepresentation of specific type preferences among participants who are not
successful in the first college year. The collection of quantitative archival data related to
participant academic persistence is key to the type preference analysis. If one compares
165
these results with Astin’s (1993) Input-Environment-Outcome model it can be noted that
precollege academic aptitude characteristics, student first semester learning experiences and
grade point each intertwine to influence first semester grade point outcomes.
The findings indicate that although many students identify with the ENFP preference,
Extraverted Intuition with Feeling and Perceiving, and are capable of adapting within
personal type preferences and learning style to find academic success; many other students
with the ENFP preference face difficulty in the transition to the first college semester. As
illustrated in the grade point comparison in Chapter 4, students with the ENFP preference
have a tendency to struggle for academic success in the first semester and may benefit from
additional guidance and support. As students who are unable to achieve a 2.0 grade point at
the university are placed on academic warning or probation and in jeopardy of continuing
their enrollment, there is need for understanding of type and learning style to improve college
transition and development of academic strengths.
This study produced indicators that suggest Myers-Briggs preference, particularly
preferences for ENFP, Extraverted Intuition with Feeling and Perceiving, may impact student
academic progress for this population. Identification and understanding of these preferences
may assist in compensating for student learning differences and academic direction. As type
theory tells us that preferences are not related to ability or motivation, identifying a trend
toward specific type preferences related to academic achievement may lead to better support
for the student population in this research. These data are important for college
administrators, specifically those working with students during orientation, advisement, and
transition courses in the first college year.
166
Implications for Practice
When examining a conceptual framework of this research, the dichotomies of
psychological type, learning styles, and influences of academic aptitude and academic
success in the first semester are important to the analysis. There are four MBTI type
dichotomies or opposite preferences: (a) personal energy, or Extraversion and Introversion;
(b) how an individual takes in information or Sensing and Intuiting; (c) the logical or
harmonious decision-making process of Thinking or Feeling; and (d) the organization and
orientation to the outer world or Judging and Perceiving. When assessing psychological
type, an individual is always allowed to determine their best-fit type, while environment,
academics, and self-knowledge may influence this best fit. Additional factors of college-
going success including preparation, goals, beliefs, obstacles and motivation solidify
structure. Although these findings emphasize that psychological type, specifically, is not the
only indicator of student difficulty in the first college year, it may complement other early-
identification factors to enhance intrusive first-year advising and retention efforts.
Multiple Regression implemented for the variables of percentile class rank, ACT, first
semester grade point and type preference for the full cohort and each cohort group found
high school percentile class rank with the strongest relationship to grade point. This is in
contrast to Kalsbeek’s (1986) Myers-Briggs assessment research finding the SAT as the best
predictor of first semester grade point. The study also highlighted that Myers-Briggs
preference, particularly preferences for ENFP, Extraverted Intuition with Feeling and
Perceiving, may impact student academic progress when the individual student has a difficult
transition in learning style.
167
Identification and understanding of these preferences may assist in compensating for
student learning differences. Identifying a trend toward specific type preferences related to
academic achievement may provide support for the student population. Future research will
seek to confirm these questions with a goal to develop adaptive programming aimed at
increasing student success.
The results of this study are similar to those found by DiRienzo, Das, Synn, Kitts, and
McGrath (2010), who identified Judging types with generally higher average GPAs and
Barrineau (2005) who discovered that found students preferring P (Perceiving), NP (Intuition
Perceiving), and ENFP, Extraverted Intuition with Feeling and Perceiving, were moderately
but significantly more likely to be at risk of retention. As failure to find academic success is
a major factor in student persistence, Kalsbeek (2003) emphasized that the MBTI instrument
is useful for academic success programs and can help identify special challenges for students,
as a method for responding to students in need of academic support. Likewise, Tinto (2012)
encouraged the incorporation of new student assessments that attend less to knowledge and
skills and pay more attention to what defines student success in college and can also consider
the interaction of student personality and environment.
Beckham’s (2012) analysis of academically successful Perceiving preference college
students presents a variety of methods for engaging students with preferences incongruent to
the university academic culture. Understanding how some students, particularly those with
ENFP preferences, view time in a continuous, more fluid process and how they find strength
in last minute or deadline pressure is a step toward enhancing the academic success of
different learners. Beckham recommends that institutions provide students with the freedom
to construct their own learning experiences. Findings by Reason, Terenzini, and Domingo

168
(2006) support the individual student experience as a strong predictor for success and also
that perceived level of student support has great influence on the development of academic
competence. They additionally recommend that faculty use a variety of teaching methods to
appeal to student learning. As discussed by Erickson and Strommer (2005), institutions and
instructors offering a variety of educational activities and assignments to engage learning can
assist students of all preferences to find academic success.
An understanding of psychological type as made available by the MBTI instrument
can be a mechanism for assisting students and college administrators to understand learning
and student success in various post-secondary institutions. As university cultures are wide
and varying, establishing student fit within that culture through use of type assessments is an
efficient method for enhancing student satisfaction and progress to graduation.
Limitations and Recommendations for Future Research
This study was designed to capture data for an identified research population at this
university and should be carefully interpreted before comparison to other student groups or
institutions. The population sample was deemed of sufficient sample size to address the data,
but may not be representative of the student population based upon demographic and
socioeconomic status. Specifically, as this research population was comprised predominantly
of students with high financial need and as students with higher budgeted financial need are
significantly less likely to persist or graduate (Whalen, Saunders and Shelley, 2010), the
population may be predisposed to academic difficulty.
As the Myers-Briggs is a self-reporting instrument, the assumption must be made that
the respondents are of normal mental health and objectively report their preferences when

169
completing the assessment. Additionally, as respondents were asked to complete the Myers-
Briggs assessment as part of a first-year seminar assignment on learning styles as opposed to
self-selecting to complete the instrument, an assumption is made that the respondents were
objectively reporting their preferences and were not influenced by the assignment directive.
Questions central to this study sought to define if the overrepresentation of certain
type preferences is distinct to this participant population and whether it leads to an
overrepresentation of specific type preferences among participants who are not successful in
the first college year. Without this information, the study would not have sufficient
foundation to build adequate research questions. Additionally, participant verification of
type understanding is needed to determine if type preferences were viewed as a contributing
factor in academic success and successfully linked to the study.
Effective application of type knowledge allows recognition that individuals do not
interact, process information and produce decisions in similar manners. This same
acceptance and appreciation of type principles may not transpire with an introduction to type
for the first year college student, dependent upon where they are in their own personal
identity development. This breach in understanding could be a disadvantage for future
research in distinguishing participants who find value in the instrument.
Incongruence for this research includes relating existing theory for MBTI preferences
and academic success with a trend toward specific type preferences in participants who are
not successful in the first college year. As the Myers-Briggs assessment is not intended as a
predictor of academic success, but rather as a knowledge base for measuring personality style
differences, future research must be cautious in definition of results. Additionally, the
findings here may be distinct to the research population and in need of a more expansive
170
population to enhance validity of the research. Completing a longitudinal study following
the academic success, persistence, and graduation completion of students will aid in
determining if students with specific type preferences face more difficulty in their path to a
degree. Ideally, this information would provide early identification of students who may
benefit from enhanced programming to meet academic needs.
To extend upon this research, a combination of data collection and student interviews
is recommended to gather information as a case study seeking additional validation of the
correlation of MBTI preferences to academic success in college. With the questions involved
in this research, further analysis through a case study methodology would provide a valuable
a mixed methods review of quantitative and qualitative data collected and interpreted for the
research study. As in this study, MBTI assessment information for the student cohort in the
study will be gathered to establish a framework of modal type and type culture for the
research population. This information will be merged with college entry data including class
rank, ACT and grade point averages of the students in the study to examine academic
preparation of student participants and those not achieving a 2.0 in the first semester. A
comparison of type preferences and grade point will occur to assess type preferences of
students with academic difficulty and trend data of type preferences for the student cohort.
Case study would enable analysis of the potential links of psychological type and
academic success in a general context that allows new questions to unfold for future research.
Assessing the student satisfaction and understanding of type comprehension would enrich the
opportunities for creating adaptive learning style programming. Formal and informal
interviews could follow the seminar course type assessment to establish student
understanding of type preferences and if this understanding connects to potential for
171
academic success. The students may be selected for interview based upon their assessed
MBTI preferences to provide a cross-section of type. Those students with over-represented
type preferences in comparison to the type population may provide researcher understanding
of MBTI type in addition to questions regarding their student satisfaction and motivation.
Student opinion, personal data, and information related to the context of the study may allow
type understanding to emerge.
In a conceptual framework of this evaluation, the dichotomies of psychological type,
learning styles, and influences of college-going and academic success must be considered.
Collecting archival data for clarity strength score of type preference and type pair samples
measured against a national sample would provide valuable measurement of the type outliers,
a source for this research. Additional areas for expansion of the research include dissection
of type preferences by STEM major, including a breakout by male and female students;
examination of type and ethnic diversity of the research population or additional student
populations; and further type comparision to socioeconomic and financial need status of
participants.
Assessments for future research comparison with these research results include the
Cooperative Institutional Research Program Freshman Survey (CIRP) collection of pre-
college information; College Student Inventory (CSI), a pre-college early alert survey; and
the Making Achievement Possible Works (MAP-Works) early alert mechanism. The
students in the research population each participated in one or more of these surveys and
additional opportunities for measurement may offer validity to the results of this study. An
MBTI comparison to the Kolb Learning Style Inventory (LSI) as described by Salter, Evans,
and Forney (2004) may also be a direction for additional research.
172
The measurement of the learning style and retention study completed by Kalsbeek
(2003) assessed several variables not included in this study; learning style related to program
of study or college major, strength score of MBTI preference dichotomies, and grade point at
upper level classification. Each of these components could add additional validity to the
inferences of the study and become areas for further research. Additionally, increased
sample size, particularly for students with low academic achievement in the first semester,
will aid in understanding the influence of the MBTI instrument on this group.
The St. Louis University TRAILS Project (Tracking Retention and Academic
Integration by Learning Style), (Kalsbeek, 2003) was an impetus for this research effort to
collect Myers-Briggs assessment data for intuitional persistence studies. The study is
important as it highlights the value of incorporating type knowledge for the larger population
of students entering the university. Although Kalsbeek did not describe a type facilitation
module in the TRAILS Project, implementation of the Myers-Briggs assessment across the
campus should include an interpretation function for all student participants. As personal
understanding of preferences and adaptation within type incongruence is the responsibility of
the individual, it is essential that this instruction be included in the retention equation.
Finally, the development of type learning modules that include type-alike peer mentoring to
address the needs of ENFP learners and others facing academic difficulty could be a
financially productive and efficient retention bridge for gaps in student persistence on our
university campuses.

173
Validity challenges
Several challenges were faced in this study to find a correlation of MBTI preferences
as a gauge of academic success in college. Collection of the data and involvement with the
participants may not have been available for a significant period of time to justify the study.
As the type preferences of each student cohort are collected once annually in the fall
semester, only eight cohort populations have completed the MBTI assessment for review.
While that allowed analysis for 775 students, only 13.5% (n = 105) in those eight years have
achieved less than a 2.00 grade point in the first semester.
Student satisfaction measurements of how the type assessment meets learning
outcomes of the first-year seminar course are collected each fall semester. However, these
surveys do not adequately measure if learning and understanding of psychological type has
occurred. Questions remain as to whether the study participants have sufficient
understanding of psychological type preferences or validation of the topic to determine a link
to academic success. Not all students will have the same acceptance and appreciation of type
principles based upon their first type assessment. Much of this will be dependent upon where
the students are in their personal identity development. Additionally, there are considerably
more factors beyond psychological type that may be indicators of student difficulty in the
first college year. Astin and Oseguera (2012) assert that degree completion is complex and
affected by a multitude of pre-college, environmental and institutional characteristics.
However, determining if type is a factor for early-identification of academic difficulty may
be a method to enhance intrusive first-year advising and retention. Determining if the data
collected on type preferences are true anomalies is key to the validity of this research.
Additional review of the type preference relationships will be required along with the
174
identification of additional variables leading to academic difficulty in the participants. These
associations can be helpful to campus retention efforts by explaining college entry data and
academic success related to MBTI type and learning style.
As preferences of psychological type are equal in their validity and strength to the
individual student, this understanding can be a key for easing the transition to university
learning. Future research will seek to confirm these questions with a goal to develop
adaptive programming aimed at increasing student success and persistence to graduation.
Summary
This study was conducted to examine if student Myers-Briggs preferences correlate to
academic success in the first college semester. Descriptive and inferential statistics, and
standard multiple regression were used to analyze the relationship between first semester
grade point and variables of gender, STEM major, and academic aptitude. Results indicated
that there are significant differences of type preferences for the research population in
relationship to the national base sample. Additionally, while ACT and percentile class rank
were found to positively predict grade point, Myers-Briggs preferences were found to be
positive and negative influences on first semester grade point. Ideally, this information
validates that type correlation merits further research for the early identification of students
requiring academic intervention.
Tinto (2012) postulated that, while institutions have focused funding on retention,
little has been done to change the college classroom and the student experience in the
classroom. He asserted that any gains in retention and graduation rates must begin with
student success. Identification and understanding of type preferences may be one approach

175
to support student learning differences and academic success. This study produced indicators
suggesting that Myers-Briggs preferences, particularly preferences for ENFP, Extraverted
Intuition with Feeling and Perceiving, may impact student academic progress for this
population. Identifying a trend toward specific type preferences related to academic
achievement may provide support for the student population in this research. These data
have important implications for college administrators who wish to make an impact on
student persistence to graduation.

176
APPENDIX A. HUMAN SUBJECTS APPROVAL
IOWA STATE UNIVERSITY OF SCIENCE AND TECHNOLOGY
Date: 7/13/2012 To: Debra Sanborn CC: Dr. Daniel Robinson 1080 Hixson-Lied Student Success Center N247 Lagomarcino Perry, GA 31069 Dr. Larry Ebbers
N256 Lagomarcino From: Office for Responsible Research
Title: MBTI Preferences and Academic Success in the First College Semester
IRB ID: 12-339
Approval Date: 7/12/2012 Date for Continuing Review: 7/11/2014
Submission Type: New Review Type: Expedited
The project referenced above has received approval from the Institutional Review Board (IRB} at Iowa State University according to the dates shown above. Please refer to the IRB ID number shown above in all correspondence regarding this study.
To ensure compliance with federal regulations (45 CFR 46 & 21 CFR 56), please be sure to:
• Use only the approved study materials in your research, including the recruitment materials and informed consent documents that have the IRB approval stamp.
• Retain signed informed consent documents for 3 years after the close of the study, when documented consent is required.
• Obtain IRB approval prior to implementing any changes to the study by submitting a Modification Form for Non-Exempt Research or Amendment for Personnel Changes form, as necessary.
• Immediately inform the IRB of (1) all serious and/or unexpected adverse experiences involving risks to subjects or others; and (2) any other unanticipated problems involving risks to subjects or others.
• Stop all research activity if IRB approval lapses, unless continuation is necessary to prevent harm to research participants. Research activity can resume once IRB approval is reestablished.
• Complete a new continuing review form at least three to four weeks prior to the date for continuing review as noted above to provide sufficient time for the IRB to review and approve continuation of the study. We will send a courtesy reminder as this date approaches.
Please be aware that IRB approval means that you have met the requirements of federal regulations and ISU policies
governing human subjects research. Approval from other entities may also be needed. For example, access to data from private records (e.g. student, medical, or employment records, etc.) that are protected by FERPA, HIPAA, or other confidentiality policies requires permission from the holders of those records. Similarly, for research conducted in institutions other than ISU (e.g., schools, other colleges or universities, medical facilities, companies, etc.), investigators must obtain permission from the institution(s) as required by their policies. IRB approval in no way implies or guarantees that permission from these other entities will be granted.
Upon completion of the project, please submit a Project Closure Form to the Office for Responsible Research, 1138 Pearson
Hall, to officially close the project. Please don’t hesitate to contact us if you have questions or concerns at 515-294-4566 or [email protected].
Institutional Review Board Office of Responsible Research Vice President for Research 1138 Pearson Hall Ames, Iowa 50011-2207
515 294-4566 FAX 515 294-4267

177
APPENDIX B. MBTI SAMPLE ITEMS
Your answers will help show you how you like to look at things and how you like to go about deciding things. There are no “right” and “wrong” answers to these questions. Knowing your own preferences and learning about other people’s can help you understand what your strengths are, what kinds of work you might enjoy, and how people with different preferences can relate to one another and contribute to society.
Part I: Which answer comes closest to telling how you usually feel or act? 16. Are you inclined to
A. value sentiment more than logic, or B. value logic more than sentiment?
20. Do you prefer to A. arrange dates, parties, etc., well in advance, or B. be free to do whatever looks like fun when the time comes?
Part II: Which word in each pair appeals to you more? Think about what the words mean, not about how they look or sound.
36. A. systematic B. casual
58. A. sensible B. fascinating
Part III: Which answer comes closest to describing how you usually feel or act? 59. When you start a big project that is due in a week, do you !
A. take time to list the separate things to be done and the order of doing them, or ! B. plunge right in?
67. At parties do you A. do much of the talking, or B. let others do most of the talking?
Part IV: Which word in each pair appeals to you more? Think about what words mean, not about how they look or how they sound.
79. A. imaginative B. realistic
91. A. devoted ! B. determined The sample items listed above were taken from the Myers-Briggs Type Indicator® Form M
Item Booklet, by Katharine C. Briggs and Isabel Briggs Myers, copyright 1998 by Peter B Myers and Katharine D. Myers. All rights are reserved. Further reproduction is prohibited without written consent of the publisher, CPP, Inc.
MBTI, Myers-Briggs, and Myers-Briggs Type Indicator are trademarks or registered
trademarks of the Myers-Briggs Type Indicator Trust in the United States and other countries.

178
REFERENCES
Allen, E. (2007). Integrating learning types and cognitive taxonomies: Wedding two classic models. Journal of Psychological Type, 67(7), 59-70.
Alaoutinen, S., Heikkinen, K., & Porras, J. (2012). Experiences of learning styles in an intensive collaborative course. International Journal of Technology and Design Education, 22(1), 25-49.
Astin, A. (1984). Student involvement: A developmental theory for higher education. Journal of College Student Personnel, 25(3), 297–308.
Astin, A.W., & Oseguera, L. (2012). Pre-college and institutional influences on degree attainment. In A. Seidman (Ed.), College student retention (2nd ed), pp. 119-145. Lanham, MD: Bowman and Littlefield.
Barrineau, P. (2005). Personality types among undergraduates who withdraw from liberal arts colleges. Journal of Psychological Type, 65(4), 27-32.
Beckham, M. H. (2012). Building momentum: The unconventional strengths of perceiving college students. Journal of Psychological Type, 72(2), 27-40.
Campbell, D.P, Borgen, F. H, Eastes, S. H., Johansson, C. B., & Peterson, R.A. (1968). A set of basic interest scales for the Strong Vocational Interest Blank for Men. Journal of Applied Psychology Monograph, 52(6), 1-54.
Campbell, D. P, & Holland, J. L. (1972). A merger in vocational interest research: Applying Holland’s theory to Strong’s data. Journal of Vocational Behavior, 2, 353-376.
Campbell, F. B., & White, J. Z. (2005). Psychological type and minority student success in undergraduate social work programs. Journal of Psychological Type, 69(4), 50-62.
Capraro, R. M., & Capraro, M. M. (2002). Myers-Briggs type Indicator score reliability across studies: A meta-analytic reliability generalization study. Educational and Psychological Measurement, 62(4), 590-602.
Chesborough, S. (2005). Do athletes learn differently? Implications for improving the learning environment for athletes. Journal of Psychological Type, 64(4), 31-40.
Chesborough, S. (2009). Do social work students learn differently? MBTI implications for teaching strategies that address social work students’ current learning styles. Journal of Psychological Type, 69(2), 23-41.
Creswell, J. W. (2009). Research design: Qualitative, quantitative, and mixed methods approaches (3rd ed). Thousand Oaks, CA: Sage.
179
De Veaux, R. D., Velleman, P. F., & Bock, D. E. (2012). Stats: Data and models with statistical methods for the social sciences (3rd ed.). Boston, MA: Pearson.
DiRienzo, C., Das, J., Synn, W., Kitts, J., & McGrath, K. (2010). The relationship between MBTI and academic performance: A study across academic disciplines. Journal of Psychological Type, 70(5), 53-67.
DiTiberio, J. K., & Jammer, A. L. (1993). Introduction to type in college. Palo Alto, CA: Consulting Psychologists Press.
Dryden, G., & Vos, J. (2005). The new learning revolution: How Britain can lead the world in learning, education, and schooling. Stafford, U.K.: Network Education Press.
Dunning, D. (2008). Introduction to type and learning. Palo Alto, CA: Consulting Psychologists Press.
Erickson, B. L., & Strommer, D. W. (2005). Inside the first-year classroom. In Upcraft, M. L. Gardner, J. N. & Barefoot, B. O. (Eds.), Challenging and supporting the first-year student. San Francisco, CA: Jossey-Bass.
Evans, N. J., Forney, D. S., Guido, F. M., Patton, L. D., & Renn, K. A. (2010). Student development in college: Theory, research and practice. San Francisco, CA: Jossey-Bass.
Glaser, B., & Strauss, A. (1967). The discovery of grounded theory. Chicago, IL: Aldine.
Haller, C. S., & Courvoisier, D. S. (2010). Personality and thinking style in different creative domains. Psychology of Aesthetics, Creativity, and the Arts, 4(3), 149-160.
Hammer, A. L. (Ed.). (1996). MBTI Applications: A decade of research on the Myers-Briggs Type Indicator. Palo Alto, CA: Consulting Psychologists Press.
Hill, A. B. (2006). Developmental student achievement: The personality factor. Journal of Psychological Type, 66(9), 79-87.
Holland, J. L. (1997). Making vocational choices: A theory of vocational personalities and work environments (3rd ed.). Odessa, FL: Psychological Assessment Research.
Hunter, M. S. (2006). Lessons learned: Achieving institutional change in support of students in transition. New Directions for Student Services, 2006(114), 7-15.
Jensen, G. H. (2003). Learning styles. In J. A. Provost & S. Anchors (Eds.), Using the MBTI instrument in colleges and universities. Gainesville, FL: Center for Applications of Psychological Type.
Jung, C. G. (1971). Psychological Types. Princeton, NJ: Princeton University Press.
180
Kalsbeek, D. H. (1986, June). Linking learning style theory with retention research: The TRAILS project. Paper presented at the Association for Institutional Research forum, Orlando FL.
Kalsbeek, D. H. (2003). Campus retention: The MBTI instrument in institutional self-studies. In J. A. Provost & S. Anchors (Eds.), Using the MBTI instrument in colleges and universities (pp. 87-122). Gainesville, FL: Center for Applications of Psychological Type.
Keup, J. R. (2006). Promoting new-student success: Assessing academic development and achievement among first-year students. New Directions for Student Services, 2006(114), 27-46.
Kolb, D. A. (1984). Experiential learning: Experience as the source of learning and development. Upper Saddle River, NJ: Prentice Hall.
Lawrence, G. D. (2009). Type, motivation and learning style. In People types and tiger stripes (4th ed), pp. 33-46. Gainesville, FL: Center for Applications of Psychological Type.
Macdaid, G. P. (2003). Research approaches using the MBTI instrument. In J. A. Provost & S. Anchors (Eds.), Using the MBTI instrument in colleges and universities (pp. 405-438). Gainesville, FL: Center for Applications of Psychological Type.
Maxwell, J. A. (2005). Qualitative research design: An interpretive approach. Thousand Oaks, CA: Sage.
McCaulley, M. H. (1985). The selection ratio type table: A research strategy for comparing type distributions. Journal of Psychological Type, 10, 46-56.
Myers, I. B. (1980). Gifts differing. Palo Alto, CA: Consulting Psychologists Press.
Myers, I. B., McCaulley, M. H. Quenk, N. L., & Hammer, A. L. (1998). MBTI manual: A guide to the development and use of the Myers-Briggs Type Indicator. Palo Alto, CA: Consulting Psychologists Press.
Nardi, D. (2001). Multiple intelligences and personality type: Tools and strategies for developing human potential. Huntington Beach, CA: Telos.
Pascarella, E. T., & Terenzini, P. T. (2005). How college affects students: A third decade of research (2nd ed.). San Francisco, CA: Jossey-Bass.
Pittenger, D. J. (2005). Cautionary comments regarding the Myers-Briggs Type Indicator. Consulting Psychology Journal: Practice and Research, 57(3), 210-221.

181
Reason, R. D., Terenzini, P. T., & Domingo, R.J. (2006). First things first: Developing academic competence in the first year of college. Research in Higher Education, 47(2), 149-175.
Reynierse, J. H., & Harker, J. B. (2005). Type interactions: MBTI relationships and self-report questionnaire scale scores. Journal of Psychological Type, 64(6a), 57-75.
Robinson, D. C., & Taylor, K. A. (2003). Diverse learners in the 21st century . In J. A. Provost & S. Anchors (Eds.), Using the MBTI instrument in colleges and universities (pp. 157-202). Gainesville, FL: Center for Applications of Psychological Type.
Salter, D. W., Evans, N. J., & Forney, D. S. (2004). A longitudinal study of learning style preferences on the Myers-Briggs Type Indicator and Learning Style Inventory. Journal of College Student Development, 47(2), 173-184.
Schaubhut, N. A., & Thompson, R. C. (2011). MBTI type tables for college majors. Mountain View, CA: Consulting Psychologists Press.
Seidman, A. (2012). Taking action: A retention formula and model for student success. In A. Seidman (Ed.), College student retention (2nd ed), pp. 267-284. Lanham, MD: Bowman and Littlefield.
Stricker, L. J., Schiffman, H., & Ross, J. (1965). Prediction of college perfromance with the Myers-Briggs Type Indicator. Educational and Psychological Measurement, 25(4), 1081-1095.
Svinicki, M. D. (2004). Learning and motivation in the postsecondary classroom. Bolton, MA: Anker.
Tabachnick, B. G., Fidell, L. S. (2007). Using multivariate statistics (5th ed.). Boston, MA: Pearson.
Tinto, V. (2012). Completing college: Rethinking institutional action. Chicago, IL: University of Chicago Press.
Tinto, V. (1975). Dropout from higher education: A theoretical synthesis of recent research. Review of Educational Research, 43, 89-125.
VanSant, S. S. (2003). Wired for conflict: The role of personality in resolving differences. Gainesville, FL: Center for Applications of Psychological Type.
Whalen, D., & Saunders, K., & Shelley, M. (2010). Leveraging what we know to enhance short-term and long-term retention of university students. Journal of College Student Retention ,11(3), 407-430.
182
ACKNOWLEDGMENTS
Throughout my doctoral program, I have enjoyed encouragement, assistance, and
support from numerous individuals making this a memorable journey. Each person kept me
focused, inspired, and confident that I could pursue and complete my Ph.D.
Most notable is Professor Daniel Robinson, who pointed me forward and kept me
challenged. Dan instilled in me a love for type and inspired this research. Professors Larry
Ebbers, Mack Shelley, Sharon Drake, and Loren Zachary provided encouragement and
motivation, and never waivered in their belief that I could complete this process.
To my parents, Cheryl and Jack Kimberley—Thank you for your love, support, and
for teaching me the value of education. You always encouraged me to pursue my dreams,
and celebrated my successes.
To my sister, Kricket, and her family—Thank you for your love and support, for
thinking differently, and keeping me grounded. We are unique in our talents, but share the
same goals for life and family.
Special thanks to Allison Severson-Haban—Grateful for your ISTJ; Dr. Penny
Rosenthal—You made it look easy; Japannah Kellogg—For talking me out of the trees; and
Dr. Mary Jo Gonzales—For reminding me to breathe. To my colleagues in the Dean of
Students Office—Thank you for your many words of reinforcement and helpful insight.
Special appreciation is offered to my multiple cohorts of fellow graduate students—
Your support, good humor, and knowledge have been immeasurable. I look forward to
tracking your future successes. Thank you to the Iowa State Office of the Registrar for their
help in database constuction. Thank you to my editor, Pat Hahn. Many thanks to the

183
students of the Hixson Program for always reaching for the stars. And for the many
opportunitunities they have provided, Liz Beck, David Bousquet, Marc Harding, and Kent
McElvania, I offer my gratitude.
Most importantly, thank you to my family. This effort would not have been possible
without the love, support, and patience of my husband and partner, Chad, and our children,
Delaney and Deckard. I am inspired by each of you and fortunate to have you as my family.
This dissertation and degree are as much yours as they are mine, and I hope they serve as a
reminder to always treasure your education adventures. To the Batcave!
Related Documents