Submitted 25 September 2014 Accepted 15 May 2015 Published 11 June 2015 Corresponding author John R. Hutchinson, [email protected] Academic editor Amir A. Zadpoor Additional Information and Declarations can be found on page 43 DOI 10.7717/peerj.1001 Copyright 2015 Hutchinson et al. Distributed under Creative Commons CC-BY 4.0 OPEN ACCESS Musculoskeletal modelling of an ostrich (Struthio camelus) pelvic limb: influence of limb orientation on muscular capacity during locomotion John R. Hutchinson 1,2 , Jeffery W. Rankin 1 , Jonas Rubenson 3,4 , Kate H. Rosenbluth 2 , Robert A. Siston 2,5 and Scott L. Delp 2 1 Structure and Motion Laboratory, Department of Comparative Biomedical Sciences, The Royal Veterinary College, University of London, Hatfield, Hertfordshire, United Kingdom 2 Bioengineering Department, Stanford University, Stanford, CA, USA 3 School of Sport Science, Exercise and Health, The University of Western Australia, Perth, WA, Australia 4 Department of Kinesiology, The Pennsylvania State University, University Park, PA, USA 5 Department of Mechanical and Aerospace Engineering, The Ohio State University, Columbus, OH, USA ABSTRACT We developed a three-dimensional, biomechanical computer model of the 36 major pelvic limb muscle groups in an ostrich (Struthio camelus) to investigate muscle function in this, the largest of extant birds and model organism for many studies of locomotor mechanics, body size, anatomy and evolution. Combined with experimental data, we use this model to test two main hypotheses. We first query whether ostriches use limb orientations (joint angles) that optimize the moment-generating capacities of their muscles during walking or running. Next, we test whether ostriches use limb orientations at mid-stance that keep their extensor muscles near maximal, and flexor muscles near minimal, moment arms. Our two hypotheses relate to the control priorities that a large bipedal animal might evolve under biomechanical constraints to achieve more effective static weight support. We find that ostriches do not use limb orientations to optimize the moment-generating capacities or moment arms of their muscles. We infer that dynamic properties of muscles or tendons might be better candidates for locomotor optimization. Regardless, general principles explaining why species choose particular joint orientations during locomotion are lacking, raising the question of whether such general principles exist or if clades evolve different patterns (e.g., weighting of muscle force–length or force–velocity properties in selecting postures). This leaves theoretical studies of muscle moment arms estimated for extinct animals at an impasse until studies of extant taxa answer these questions. Finally, we compare our model’s results against those of two prior studies of ostrich limb muscle moment arms, finding general agreement for many muscles. Some flexor and extensor muscles exhibit self-stabilization patterns (posture-dependent switches between flexor/extensor action) that ostriches may use to coordinate their locomotion. However, some conspicuous areas of disagreement in our results illustrate some cautionary principles. Importantly, tendon-travel empirical measurements of muscle moment arms must be carefully designed to preserve 3D muscle geometry lest How to cite this article Hutchinson et al. (2015), Musculoskeletal modelling of an ostrich (Struthio camelus) pelvic limb: influence of limb orientation on muscular capacity during locomotion. PeerJ 3:e1001; DOI 10.7717/peerj.1001

Welcome message from author
This document is posted to help you gain knowledge. Please leave a comment to let me know what you think about it! Share it to your friends and learn new things together.
Transcript
Submitted 25 September 2014Accepted 15 May 2015Published 11 June 2015
Corresponding authorJohn R. Hutchinson,[email protected]
Academic editorAmir A. Zadpoor
Additional Information andDeclarations can be found onpage 43
DOI 10.7717/peerj.1001
Copyright2015 Hutchinson et al.
Distributed underCreative Commons CC-BY 4.0
OPEN ACCESS
Musculoskeletal modelling of an ostrich(Struthio camelus) pelvic limb: influenceof limb orientation on muscular capacityduring locomotionJohn R. Hutchinson1,2, Jeffery W. Rankin1, Jonas Rubenson3,4,Kate H. Rosenbluth2, Robert A. Siston2,5 and Scott L. Delp2
1 Structure and Motion Laboratory, Department of Comparative Biomedical Sciences, The RoyalVeterinary College, University of London, Hatfield, Hertfordshire, United Kingdom
2 Bioengineering Department, Stanford University, Stanford, CA, USA3 School of Sport Science, Exercise and Health, The University of Western Australia, Perth, WA,
Australia4 Department of Kinesiology, The Pennsylvania State University, University Park, PA, USA5 Department of Mechanical and Aerospace Engineering, The Ohio State University, Columbus,
OH, USA
ABSTRACTWe developed a three-dimensional, biomechanical computer model of the 36major pelvic limb muscle groups in an ostrich (Struthio camelus) to investigatemuscle function in this, the largest of extant birds and model organism for manystudies of locomotor mechanics, body size, anatomy and evolution. Combinedwith experimental data, we use this model to test two main hypotheses. We firstquery whether ostriches use limb orientations (joint angles) that optimize themoment-generating capacities of their muscles during walking or running. Next,we test whether ostriches use limb orientations at mid-stance that keep theirextensor muscles near maximal, and flexor muscles near minimal, moment arms.Our two hypotheses relate to the control priorities that a large bipedal animalmight evolve under biomechanical constraints to achieve more effective staticweight support. We find that ostriches do not use limb orientations to optimizethe moment-generating capacities or moment arms of their muscles. We infer thatdynamic properties of muscles or tendons might be better candidates for locomotoroptimization. Regardless, general principles explaining why species choose particularjoint orientations during locomotion are lacking, raising the question of whethersuch general principles exist or if clades evolve different patterns (e.g., weighting ofmuscle force–length or force–velocity properties in selecting postures). This leavestheoretical studies of muscle moment arms estimated for extinct animals at animpasse until studies of extant taxa answer these questions. Finally, we compare ourmodel’s results against those of two prior studies of ostrich limb muscle momentarms, finding general agreement for many muscles. Some flexor and extensormuscles exhibit self-stabilization patterns (posture-dependent switches betweenflexor/extensor action) that ostriches may use to coordinate their locomotion.However, some conspicuous areas of disagreement in our results illustrate somecautionary principles. Importantly, tendon-travel empirical measurements of musclemoment arms must be carefully designed to preserve 3D muscle geometry lest
How to cite this article Hutchinson et al. (2015), Musculoskeletal modelling of an ostrich (Struthio camelus) pelvic limb: influence oflimb orientation on muscular capacity during locomotion. PeerJ 3:e1001; DOI 10.7717/peerj.1001
their accuracy suffer relative to that of anatomically realistic models. The dearth ofaccurate experimental measurements of 3D moment arms of muscles in birds leavesuncertainty regarding the relative accuracy of different modelling or experimentaldatasets such as in ostriches. Our model, however, provides a comprehensive set of3D estimates of muscle actions in ostriches for the first time, emphasizing that avianlimb mechanics are highly three-dimensional and complex, and how no muscles actpurely in the sagittal plane. A comparative synthesis of experiments and models suchas ours could provide powerful synthesis into how anatomy, mechanics and controlinteract during locomotion and how these interactions evolve. Such a frameworkcould remove obstacles impeding the analysis of muscle function in extinct taxa.
Subjects Bioengineering, Computational Biology, Zoology, Anatomy and Physiology,KinesiologyKeywords Paleognathae, Ratite, Moment arm, Gait, Biomechanics, Posture, Muscle, Bird
INTRODUCTIONAs the largest living avian bipeds, ostriches (Struthio camelus Linnaeus 1758) are important
for understanding how body mass influences locomotor mechanics in birds. In addition,
ostriches are among the fastest of living terrestrial animals, and are the fastest living (per-
haps even the fastest ever) bipedal runners. These birds can reach maximum speeds >15
ms−1 (Alexander et al., 1979); similar to another biped that is coincidentally of similar size:
red kangaroos (Macropus rufus) (Bennett & Taylor, 1995). Examination of their locomotor
dynamics may reveal some of the complex factors that determine maximum running speed
in land animals and guide the development of fast running machines. Ostriches are also of
similar body size to humans, which other than birds are the only obligate striding bipeds
today, making comparisons of bipedal locomotor function in these two species possible
(e.g., Gatesy & Biewener, 1991; Rubenson et al., 2011). Additionally, as the largest extant
birds, ostriches are important “endpoints” for studies of body size effects on locomotion
(e.g., Maloiy et al., 1979; Gatesy, Baker & Hutchinson, 2009; Brassey et al., 2013a; Brassey et
al., 2013b; Kilbourne, 2013). Furthermore, ostriches are members of the ratite bird clade,
whose evolution from basal flying birds into large cursorial flightless animals has been
of longstanding scientific interest. However, the evolutionary patterns and processes that
produced the diversity of living ratites and their unusual locomotor mechanisms remain
uncertain (Baker et al., in press and references therein). In turn, ratite birds including
ostriches occupy relatively basal positions in extant avian phylogeny (e.g., Cracraft &
Clarke, 2001; Baker et al., in press). Despite their remarkable cursorial specializations and
evolutionarily increased body size, ostriches can offer clues to the structure and function of
earliest crown clade birds, and thereby about the evolution of avian locomotion from their
theropod dinosaur forebears (e.g., Gatesy, 1990). Ostriches have also often been employed
as analogues for dinosaur locomotion (e.g., Russell, 1972; Paul, 1998) despite some major
anatomical differences (Gatesy, 1990; Gatesy, 1995; Hutchinson & Gatesy, 2000; Hutchinson,
Hutchinson et al. (2015), PeerJ, DOI 10.7717/peerj.1001 2/52
2002; Gatesy, Baker & Hutchinson, 2009; Hutchinson & Allen, 2009), so ostriches and extinct
dinosaurs may be reciprocally informative.
A general problem facing those interested in examining the above questions in detail is
that ostrich locomotion, including pelvic limb structure-function relationships during
movement, remains incompletely understood. Numerous studies have empirically
investigated the locomotor kinematics and kinetics of ostriches (e.g., Alexander et al.,
1979; Gatesy & Biewener, 1991; Abourachid, 2001; Abourachid & Renous, 2000; Rubenson et
al., 2004; Rubenson et al., 2007; Rubenson et al., 2011; Smith et al., 2006; Smith et al., 2007;
Smith, Jespers & Wilson, 2010; Smith & Wilson, 2013; Jindrich et al., 2007; Schaller et al.,
2009; Schaller et al., 2011) and much focus has been given to the whole-body mechanics
and energetics of ostriches (e.g., Fedak & Seeherman, 1979; Fedak, Heglund & Taylor,
1982; Rubenson et al., 2004; Watson et al., 2011). However, detailed understanding of
the interactions between the various components of the musculoskeletal system and the
environment during these movements remain poorly understood. Due to the complex,
non-linear dynamics of the musculoskeletal system, correlating whole-body level measures
of locomotion to specific muscle function-structure relationships cannot yet be adequately
performed.
Furthermore, ostrich myology was not carefully described until recently (Weissengruber,
Forstenpointner & Gangl, 2003; Gangletal, 2004; Zinoviev, 2006; also knee joint functional
morphology by Fuss, 1996; foot/ankle function by Schaller et al., 2009, Schaller et al., 2011).
Previous myological studies were marred by errors in interpreting ostrich anatomy and by
confusing application of mammalian anatomy to ostriches (e.g., Haughton, 1864; Macalis-
ter, 1864) or provided only a superficial treatment of proximal pelvic limb anatomy (e.g.,
Mellett, 1994). Even Gadow (1880), a classic comparative reference, contains antiquated
concepts of homology (Rowe, 1986). These prior studies of ostrich myology augment
comparative work on the pelvic limb myology of other ratites (e.g., Haughton, 1867a;
Haughton, 1867b; Gadow, 1880; McGowan, 1979; Vanden Berge, 1982; Patak & Baldwin,
1998; Picasso, 2010; Picasso, 2012; Chadwick et al., 2014; Lamas, Main & Hutchinson,
2014; Regnault, Pitsillides & Hutchinson, 2014). Additionally, data are available on muscle
physiology in ostriches (Velotto & Crasto, 2004) and other ratites (e.g., McGowan, 1979;
Patak & Baldwin, 1993), although biomechanical data characterizing muscle force–velocity
and force–length relationships for avian pelvic limb muscles are scant (e.g., Nelson,
Gabaldon & Roberts, 2004).
This body of prior research provides the strong foundation necessary for detailed
examination of ostrich limb muscle function using anatomically-realistic biomechanical
modelling in order to advance understanding of how the largest living bird supports its
body weight and moves itself with its pelvic limb muscles. Here, to provide new insight into
ostrich locomotor structure-function relationships, we investigate how pelvic limb muscle
functions relate to limb orientation (i.e., posture/pose or joint angles; Gatesy, 1995; Gatesy,
Baker & Hutchinson, 2009) in ostriches. To do this, we integrate data from experimentally
measured joint kinematics and ground reaction forces with a biomechanical computer
model that was constructed by digitizing the bones, muscles, and tendons of an adult
Hutchinson et al. (2015), PeerJ, DOI 10.7717/peerj.1001 3/52
ostrich. By replicating ostrich structure and behaviour, the musculoskeletal model pro-
vides estimates of individual muscle moment arms (Pandy, 1999) and maximum capacity
for moment generation during those behaviours: quantities that are otherwise difficult
or impossible to accurately measure non-invasively, especially for all thirty-six major
pelvic limb muscles simultaneously. Here we use this model to address some fundamental
mysteries about locomotion in ostriches as well as birds, non-avian dinosaurs and bipeds.
Larger mammalian species tend to have straighter limbs than smaller species to
improve their effective mechanical advantage during movement (Biewener, 1989; Biewener,
1990). Yet it remains unclear how much of this improvement is achieved by reducing
the moment arms of ground reaction forces about the limb joints using less flexed
limb joint orientations or by increasing muscle moment arms via increased anatomical
leverage (e.g., relatively larger trochanters) or straightened limb orientation (i.e., which
shifts muscles further away from joint centres; Hutchinson et al., 2005). Our ostrich
musculoskeletal model will facilitate discerning this relationship in birds, for whom
it seems a similar pattern to mammals of having improved mechanical advantage in
larger species holds (Gatesy & Biewener, 1991; Hutchinson, 2004; Gunther et al., 2004;
Brassey et al., 2013a; Kilbourne, 2013).
Previous studies (e.g., Hutchinson et al., 2005; and references therein) suggested that
limb antigravity muscle moment arms (or moment-generating capacity; Full & Ahn, 1995)
may peak in very upright limb orientations, which intimates that smaller animals with
more crouched poses (e.g., birds) employ sub-optimal joint angles for supporting their
body weight (Biewener, 1989; Gunther et al., 2004), presumably as a tradeoff to provide
other benefits such as increased manoeuvrability (e.g., Daley & Usherwood, 2010). As the
largest living birds, ostriches stand and move with straighter limbs than smaller birds
(Gatesy & Biewener, 1991). However, ostriches are bipeds that still habitually support
themselves with markedly flexed hip and knee joints, which make them a useful case
study of this mechanical relationship between posture and antigravity muscle capacity.
Understanding this relationship impacts the broader question of why animals choose
certain postures—do they select postures that favour larger moment arms for economical
force production (e.g., Fujiwara, 2009; Fujiwara, Endo & Hutchinson, 2011; Fujiwara &
Hutchinson, 2012) or other factors such as muscle force–length properties (e.g., McClearn,
1985; Lieber & Boakes, 1988a; Lieber & Boakes, 1988b; Lieber & Brown, 1992; Lieber &
Shoemaker, 1992; Lieber, 1997)?
The moment arms of ostrich pelvic limb muscles have been studied before with
two different methodologies: two-dimensional (2D) experimental (“tendon travel”)
measurements of de-fleshed limbs (Smith et al., 2007) and 3D musculoskeletal computer
models constructed from literature data, dissections and scanned skeletons (Bates &
Schachner, 2012). The question remains open: how accurate are these experimental
measurements and models, and how consistently can different researchers construct such
models given the inherent subjectivity involved? This methodological question impacts
many of the questions above; a weak model impairs the ability to test hypotheses. Here,
we use our 3D musculoskeletal model and previously collected experimental data to
Hutchinson et al. (2015), PeerJ, DOI 10.7717/peerj.1001 4/52
address three main questions related to the issues described above: (1) Do ostriches adopt
limb orientations during walking or running that optimize their capacity to generate
maximal moments about the pelvic limb joints? (2) Are the moment arms of limb muscles
maximized (for antigravity/extensor muscles; or minimized in the case of antagonistic
flexor muscles) at mid-stance of locomotion (optimizing weight support), or at highly
extended limb orientations, as prior studies of dinosaurs inferred (e.g., Hutchinson et al.,
2005)? Finally, (3) how accurate or repeatable are estimates of limb muscle moment arms
in ostriches using different methods?
We also integrate our results with previous studies of ostriches and other large birds
(cited above) to infer how the pelvic limb muscles function in locomotion. This provides
a three-dimensional perspective on avian musculoskeletal function, a necessary shift
away from past planar (2D) simplifications of this system (e.g., Alexander et al., 1979;
Abourachid, 2001; Hutchinson, 2004; Gatesy, Baker & Hutchinson, 2009) because recent
studies have shown complex 3D limb dynamics during avian movement (Gatesy, 1994;
Hutchinson & Gatesy, 2000; Rubenson et al., 2007; Rubenson et al., 2011; Goetz et al., 2008;
Abourachid et al., 2011; Andrada et al., 2013; Kambic, Roberts & Gatesy, 2014). Finally,
we synthesize our results with similar data from other bipeds, including humans and
Tyrannosaurus rex, to infer how limb muscle moment-generating capacity more generally
relates to limb orientation and body size.
MATERIALS AND METHODSAnimalsExperimental biomechanics data were collected from three female adult ostriches (70.0,
78.7, 75.9 kg body mass), from which a single representative animal’s data was used as
model input (78.7 kg). Birds were housed in a large outdoor paddock (5,000 m2) and
provided with unlimited access to food and water. All experiments were performed in
accordance with the Animal Ethics Committee of the University of Western Australia.
Architectural and geometric data for the muscle–tendon units, and skeletal dimensions
used in the computer model, were measured in a third female ostrich (65.3 kg), which
had no musculoskeletal pathologies and was culled from a commercial ostrich herd (The
Ostrich Meat Company, Merced, California). We subsequently verified these anatomical
data by qualitative comparisons with three other adult specimens of qualitatively similar
size, as well as literature descriptions (Gangletal, 2004; Zinoviev, 2006).
Kinematic measurementsThe experiments and 3D kinematic analyses are described in detail elsewhere (Rubenson
et al., 2004; Rubenson et al., 2007; Rubenson et al., 2011). Briefly, the birds were trained to
walk and run across a 50 m long fenced runway surfaced with high-density rubber matting
(10 mm thickness). An eleven-parameter direct linear transformation (DLT) was used
to construct a 3D image volume from two high-speed cameras (200 Hz) positioned at
45◦ angles to the runway (Peak Motus; Peak Performance, Centennial, Colorado, USA).
The DLT was calculated using a custom-built 48-point moveable calibration frame. The
Hutchinson et al. (2015), PeerJ, DOI 10.7717/peerj.1001 5/52
video footage from the two cameras was gen-locked and synchronized manually using a
hand held switch that caused a barcode in each video field to turn white. All data collection
was performed after sunset under artificial lighting. A wide range of speeds was recorded
in prior studies (Rubenson et al., 2004; Rubenson et al., 2007; Rubenson et al., 2011), but
we only used representative (i.e., 1 trial/gait) kinematic data for a single walking trial
at 1.22 ms−1 and slow running (at 3.46 ms−1). These two trials were within 1 S.D. of
the mean kinematic data for running trials from Rubenson et al. (2007) and previously
unpublished walking data from the same experimental analysis (see ‘Results’).
The 3D position and orientation of the ostrich limb segments were determined by
videotaping clusters of non-linear, retro-reflective markers placed on the pelvis, femur,
tibiotarsus, and tarsometatarsus and a single marker placed on the end of the third
phalanx. These markers were used to define segment rigid-body Technical Coordinate
Systems (TCS; Cappozzo et al., 1995). Prior to walking and running trials, static calibration
trials were performed in order to identify several key anatomical landmarks necessary to
construct segment Anatomical Coordinate Systems (ACS; see Rubenson et al. (2007) and
Rubenson et al. (2011) for details). Anatomical landmarks were identified using a 6-marker
pointer device and expressed in the segment TCSs. The static calibration trials thus allowed
for the reconstruction of each segment ACS across walking/running strides using the
motion data of the segment marker clusters alone.
Three-dimensional marker trajectory data were filtered using a fourth order zero-lag
Butterworth low-pass filter (4–12 Hz) and compiled in c3d format (Motion Lab Systems,
Baton Rouge, Louisiana, USA). Kinematics were computed using BodyBuilder modelling
software (Oxford Metrics, Oxford, UK). Joint angles were calculated by determining the
Euler angles associated with the transformation between the ACSs of the proximal and
distal segments of a joint (Grood & Suntay, 1983). Segment ACSs in both the model
(below) and in the experimental animals were constructed using the same landmarks
(anatomical landmarks and numerically derived axes) and same ordered set of rotations
between proximal and distal ACSs. Thus, 3D joint motion was defined equivalently in
the musculoskeletal model and in the experimental animals and we were able to use
experimentally derived joint angles as input into our musculoskeletal model to estimate
muscular mechanics in vivo during walking and running.
3D coordinate systems for anatomical dissectionWe used a Polaris optical tracking system (Northern Digital Inc., Waterloo, Ontario)
to record the positions of anatomic landmarks and relevant joint kinematics during
dissection sessions. This tracking system is accurate to within 1.5 mm with the 1.5 m3
measurement volume used in this study (Traxtal Inc., Toronto, Ontario), and in order to
ensure this accuracy we performed appropriate calibrations before collecting our data.
We first skinned the right pelvic limb of the ostrich specimen. Before dissection of
the muscles, we attached LED-emitting reference frames (AdapTrax trackers; Traxtal
Inc., Toronto, Ontario) to each bone segment using orthopaedic bone screws. Each
reference frame contained a cluster of LEDs that allowed the tracking system to record
Hutchinson et al. (2015), PeerJ, DOI 10.7717/peerj.1001 6/52
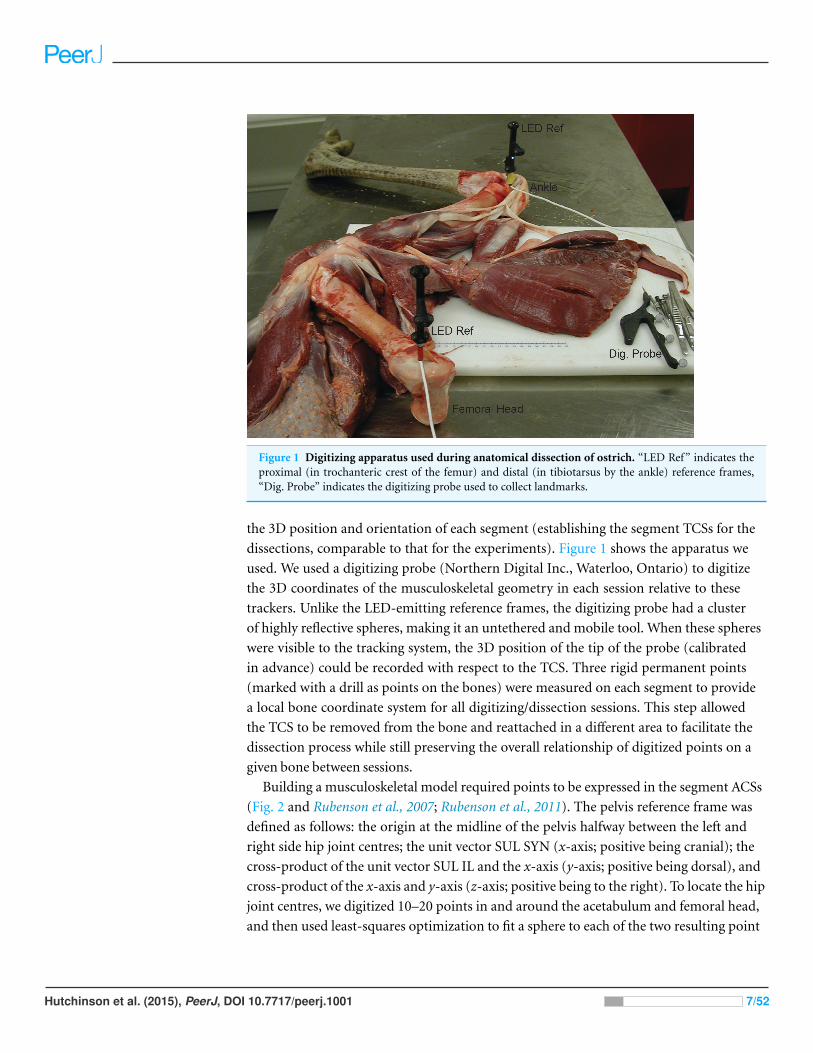
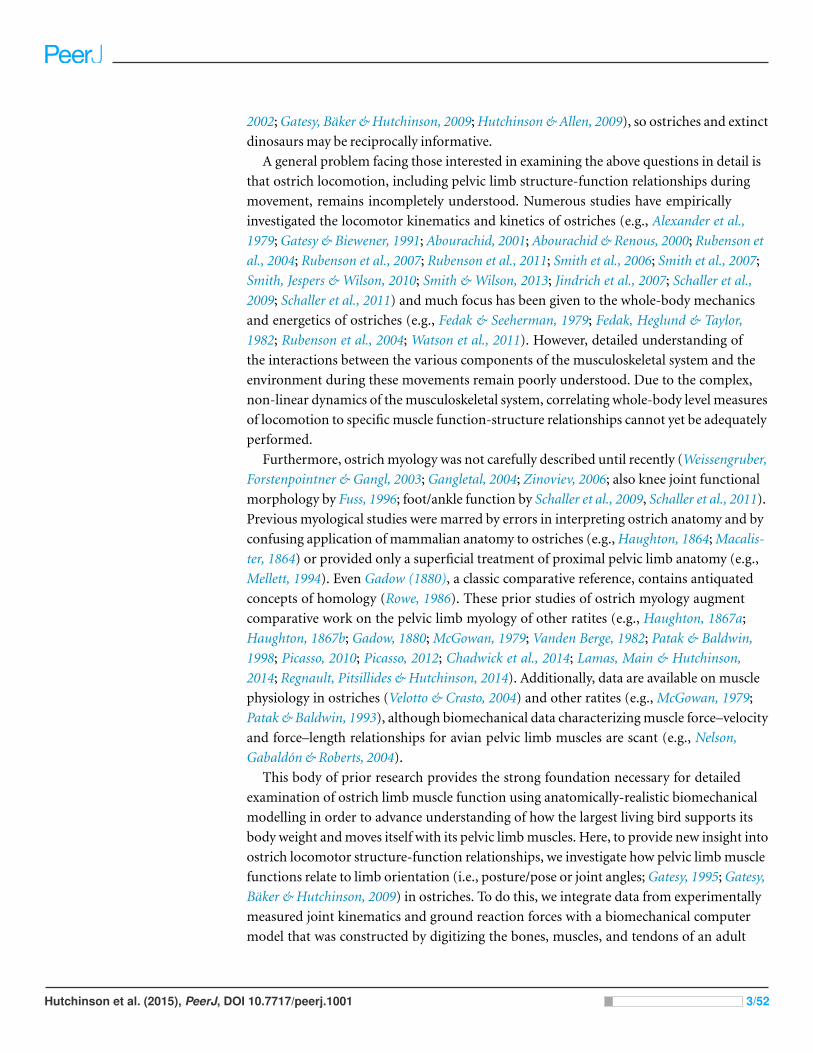
Figure 1 Digitizing apparatus used during anatomical dissection of ostrich. “LED Ref” indicates theproximal (in trochanteric crest of the femur) and distal (in tibiotarsus by the ankle) reference frames,“Dig. Probe” indicates the digitizing probe used to collect landmarks.
the 3D position and orientation of each segment (establishing the segment TCSs for the
dissections, comparable to that for the experiments). Figure 1 shows the apparatus we
used. We used a digitizing probe (Northern Digital Inc., Waterloo, Ontario) to digitize
the 3D coordinates of the musculoskeletal geometry in each session relative to these
trackers. Unlike the LED-emitting reference frames, the digitizing probe had a cluster
of highly reflective spheres, making it an untethered and mobile tool. When these spheres
were visible to the tracking system, the 3D position of the tip of the probe (calibrated
in advance) could be recorded with respect to the TCS. Three rigid permanent points
(marked with a drill as points on the bones) were measured on each segment to provide
a local bone coordinate system for all digitizing/dissection sessions. This step allowed
the TCS to be removed from the bone and reattached in a different area to facilitate the
dissection process while still preserving the overall relationship of digitized points on a
given bone between sessions.
Building a musculoskeletal model required points to be expressed in the segment ACSs
(Fig. 2 and Rubenson et al., 2007; Rubenson et al., 2011). The pelvis reference frame was
defined as follows: the origin at the midline of the pelvis halfway between the left and
right side hip joint centres; the unit vector SUL SYN (x-axis; positive being cranial); the
cross-product of the unit vector SUL IL and the x-axis (y-axis; positive being dorsal), and
cross-product of the x-axis and y-axis (z-axis; positive being to the right). To locate the hip
joint centres, we digitized 10–20 points in and around the acetabulum and femoral head,
and then used least-squares optimization to fit a sphere to each of the two resulting point
Hutchinson et al. (2015), PeerJ, DOI 10.7717/peerj.1001 7/52
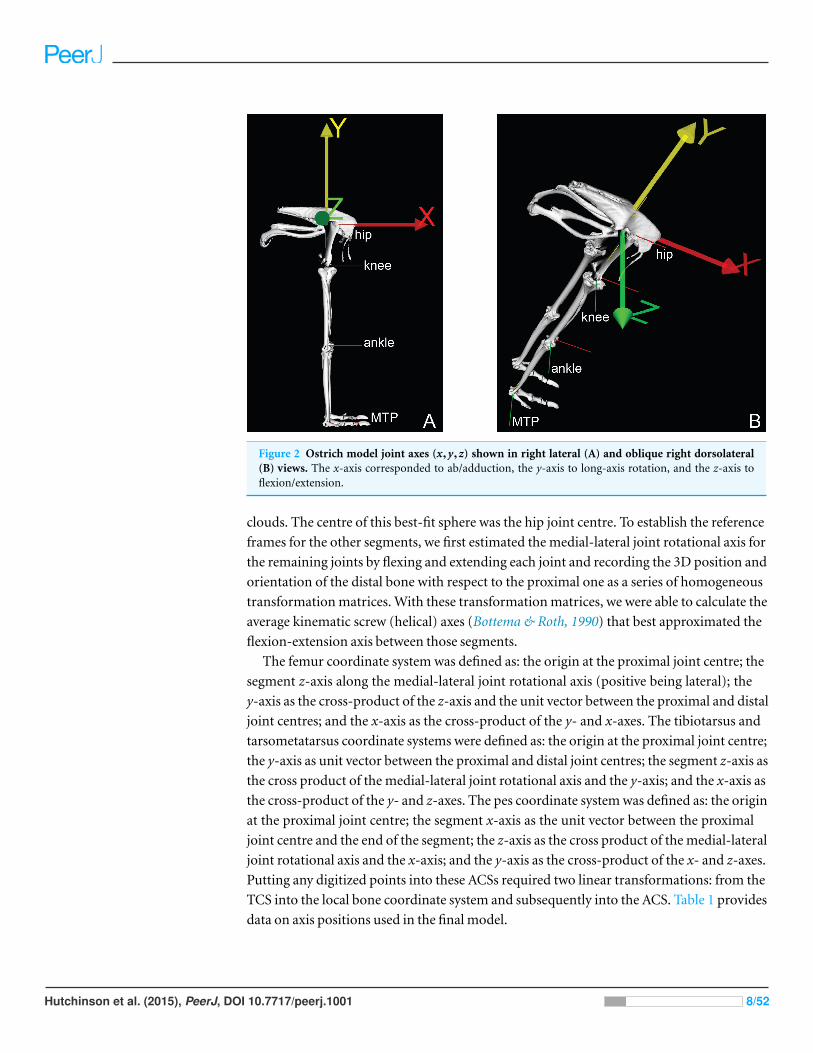
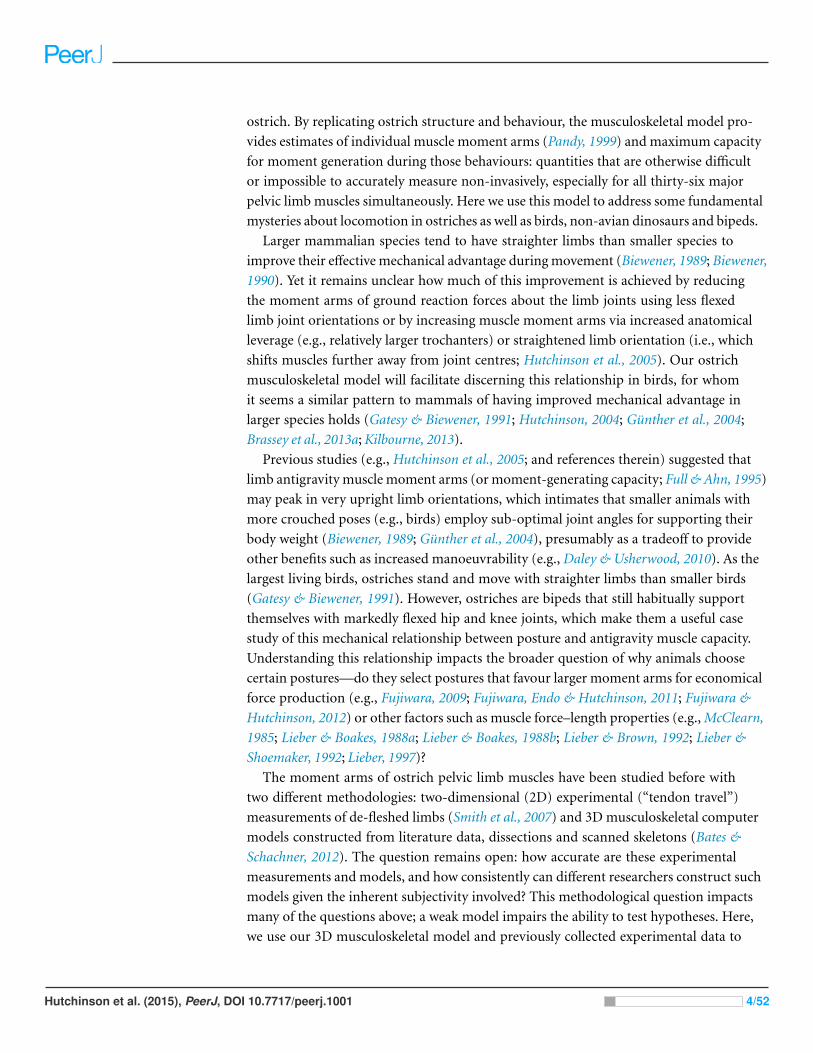
Figure 2 Ostrich model joint axes (x,y,z) shown in right lateral (A) and oblique right dorsolateral(B) views. The x-axis corresponded to ab/adduction, the y-axis to long-axis rotation, and the z-axis toflexion/extension.
clouds. The centre of this best-fit sphere was the hip joint centre. To establish the reference
frames for the other segments, we first estimated the medial-lateral joint rotational axis for
the remaining joints by flexing and extending each joint and recording the 3D position and
orientation of the distal bone with respect to the proximal one as a series of homogeneous
transformation matrices. With these transformation matrices, we were able to calculate the
average kinematic screw (helical) axes (Bottema & Roth, 1990) that best approximated the
flexion-extension axis between those segments.
The femur coordinate system was defined as: the origin at the proximal joint centre; the
segment z-axis along the medial-lateral joint rotational axis (positive being lateral); the
y-axis as the cross-product of the z-axis and the unit vector between the proximal and distal
joint centres; and the x-axis as the cross-product of the y- and x-axes. The tibiotarsus and
tarsometatarsus coordinate systems were defined as: the origin at the proximal joint centre;
the y-axis as unit vector between the proximal and distal joint centres; the segment z-axis as
the cross product of the medial-lateral joint rotational axis and the y-axis; and the x-axis as
the cross-product of the y- and z-axes. The pes coordinate system was defined as: the origin
at the proximal joint centre; the segment x-axis as the unit vector between the proximal
joint centre and the end of the segment; the z-axis as the cross product of the medial-lateral
joint rotational axis and the x-axis; and the y-axis as the cross-product of the x- and z-axes.
Putting any digitized points into these ACSs required two linear transformations: from the
TCS into the local bone coordinate system and subsequently into the ACS. Table 1 provides
data on axis positions used in the final model.
Hutchinson et al. (2015), PeerJ, DOI 10.7717/peerj.1001 8/52
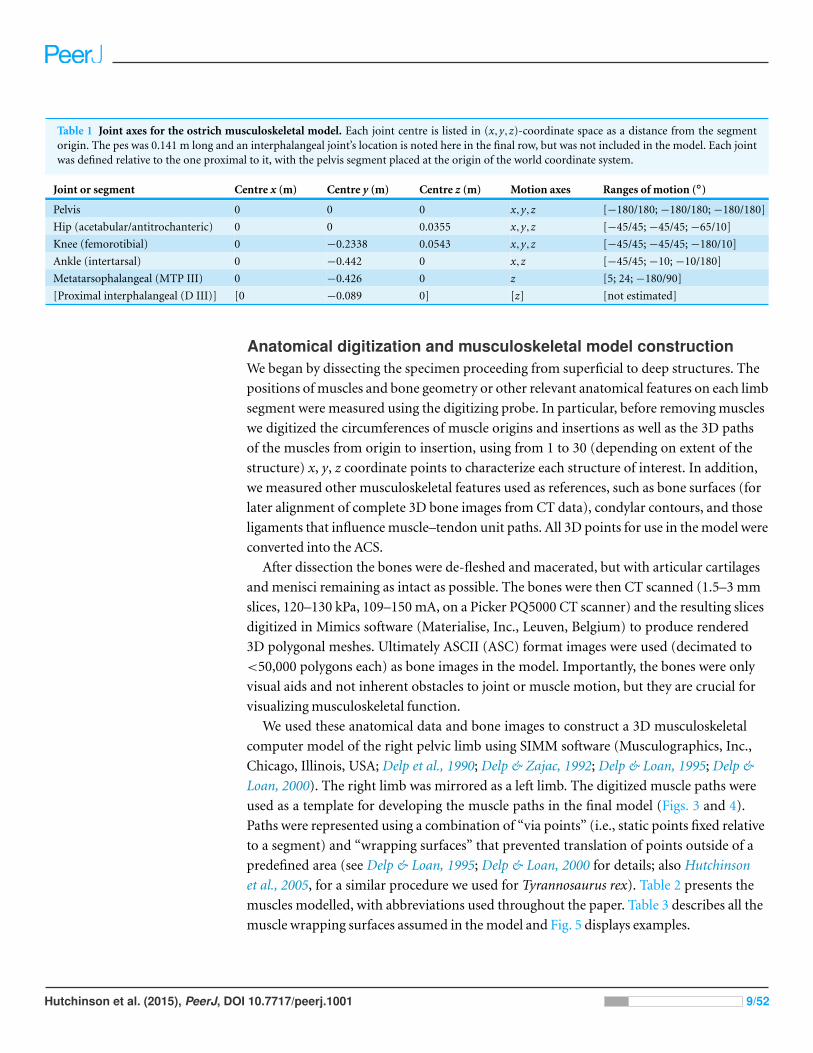
Table 1 Joint axes for the ostrich musculoskeletal model. Each joint centre is listed in (x,y,z)-coordinate space as a distance from the segmentorigin. The pes was 0.141 m long and an interphalangeal joint’s location is noted here in the final row, but was not included in the model. Each jointwas defined relative to the one proximal to it, with the pelvis segment placed at the origin of the world coordinate system.
Joint or segment Centre x (m) Centre y (m) Centre z (m) Motion axes Ranges of motion (◦)
Pelvis 0 0 0 x,y,z [−180/180; −180/180; −180/180]
Hip (acetabular/antitrochanteric) 0 0 0.0355 x,y,z [−45/45; −45/45; −65/10]
Knee (femorotibial) 0 −0.2338 0.0543 x,y,z [−45/45; −45/45; −180/10]
Ankle (intertarsal) 0 −0.442 0 x,z [−45/45; −10; −10/180]
Metatarsophalangeal (MTP III) 0 −0.426 0 z [5; 24; −180/90]
[Proximal interphalangeal (D III)] [0 −0.089 0] [z] [not estimated]
Anatomical digitization and musculoskeletal model constructionWe began by dissecting the specimen proceeding from superficial to deep structures. The
positions of muscles and bone geometry or other relevant anatomical features on each limb
segment were measured using the digitizing probe. In particular, before removing muscles
we digitized the circumferences of muscle origins and insertions as well as the 3D paths
of the muscles from origin to insertion, using from 1 to 30 (depending on extent of the
structure) x, y, z coordinate points to characterize each structure of interest. In addition,
we measured other musculoskeletal features used as references, such as bone surfaces (for
later alignment of complete 3D bone images from CT data), condylar contours, and those
ligaments that influence muscle–tendon unit paths. All 3D points for use in the model were
converted into the ACS.
After dissection the bones were de-fleshed and macerated, but with articular cartilages
and menisci remaining as intact as possible. The bones were then CT scanned (1.5–3 mm
slices, 120–130 kPa, 109–150 mA, on a Picker PQ5000 CT scanner) and the resulting slices
digitized in Mimics software (Materialise, Inc., Leuven, Belgium) to produce rendered
3D polygonal meshes. Ultimately ASCII (ASC) format images were used (decimated to
<50,000 polygons each) as bone images in the model. Importantly, the bones were only
visual aids and not inherent obstacles to joint or muscle motion, but they are crucial for
visualizing musculoskeletal function.
We used these anatomical data and bone images to construct a 3D musculoskeletal
computer model of the right pelvic limb using SIMM software (Musculographics, Inc.,
Chicago, Illinois, USA; Delp et al., 1990; Delp & Zajac, 1992; Delp & Loan, 1995; Delp &
Loan, 2000). The right limb was mirrored as a left limb. The digitized muscle paths were
used as a template for developing the muscle paths in the final model (Figs. 3 and 4).
Paths were represented using a combination of “via points” (i.e., static points fixed relative
to a segment) and “wrapping surfaces” that prevented translation of points outside of a
predefined area (see Delp & Loan, 1995; Delp & Loan, 2000 for details; also Hutchinson
et al., 2005, for a similar procedure we used for Tyrannosaurus rex). Table 2 presents the
muscles modelled, with abbreviations used throughout the paper. Table 3 describes all the
muscle wrapping surfaces assumed in the model and Fig. 5 displays examples.
Hutchinson et al. (2015), PeerJ, DOI 10.7717/peerj.1001 9/52
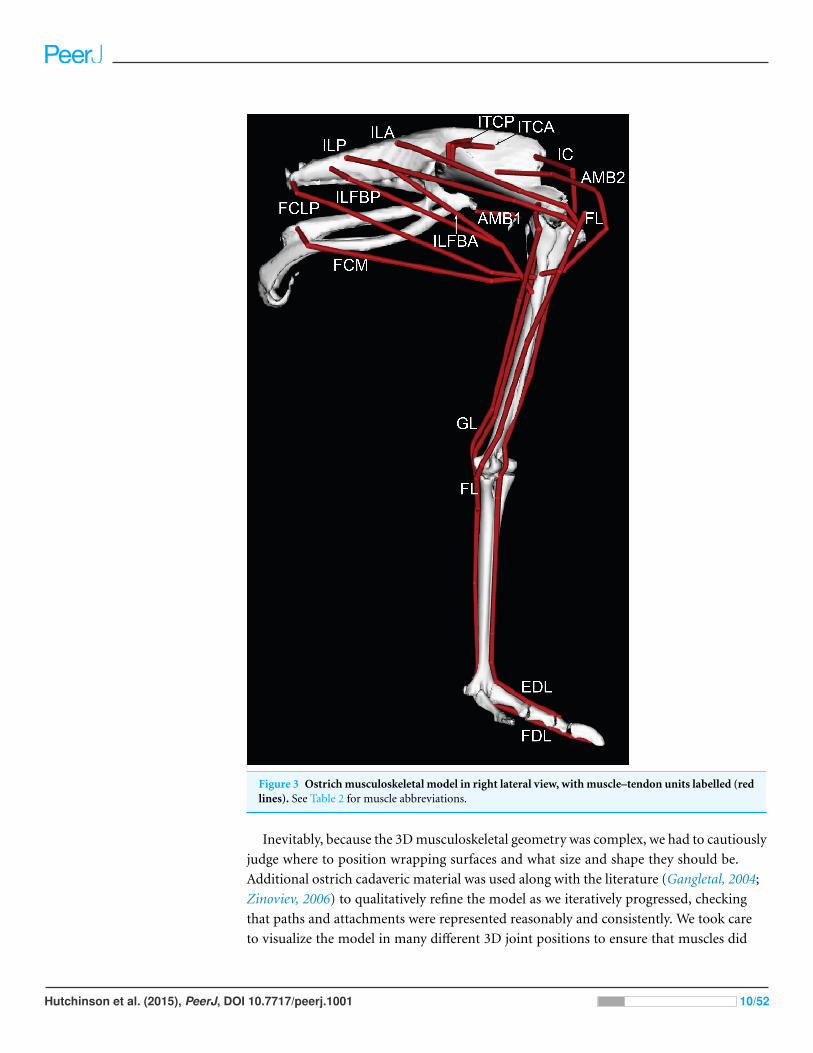
Figure 3 Ostrich musculoskeletal model in right lateral view, with muscle–tendon units labelled (redlines). See Table 2 for muscle abbreviations.
Inevitably, because the 3D musculoskeletal geometry was complex, we had to cautiously
judge where to position wrapping surfaces and what size and shape they should be.
Additional ostrich cadaveric material was used along with the literature (Gangletal, 2004;
Zinoviev, 2006) to qualitatively refine the model as we iteratively progressed, checking
that paths and attachments were represented reasonably and consistently. We took care
to visualize the model in many different 3D joint positions to ensure that muscles did
Hutchinson et al. (2015), PeerJ, DOI 10.7717/peerj.1001 10/52
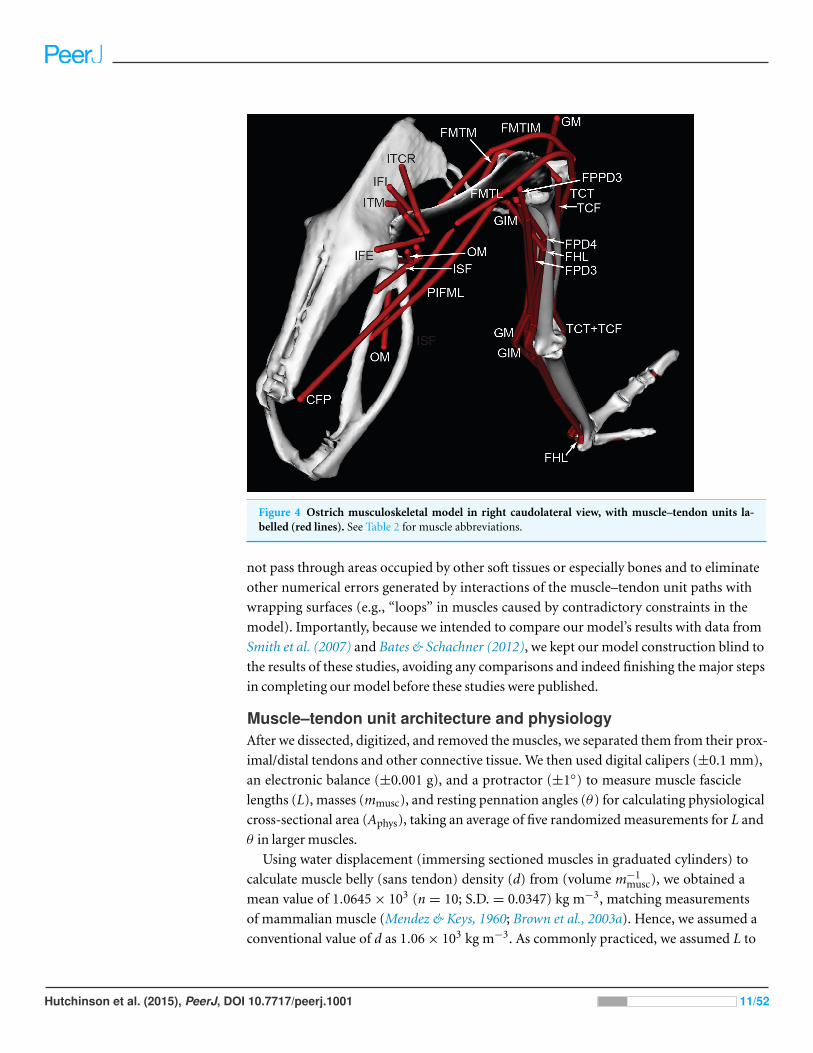
Figure 4 Ostrich musculoskeletal model in right caudolateral view, with muscle–tendon units la-belled (red lines). See Table 2 for muscle abbreviations.
not pass through areas occupied by other soft tissues or especially bones and to eliminate
other numerical errors generated by interactions of the muscle–tendon unit paths with
wrapping surfaces (e.g., “loops” in muscles caused by contradictory constraints in the
model). Importantly, because we intended to compare our model’s results with data from
Smith et al. (2007) and Bates & Schachner (2012), we kept our model construction blind to
the results of these studies, avoiding any comparisons and indeed finishing the major steps
in completing our model before these studies were published.
Muscle–tendon unit architecture and physiologyAfter we dissected, digitized, and removed the muscles, we separated them from their prox-
imal/distal tendons and other connective tissue. We then used digital calipers (±0.1 mm),
an electronic balance (±0.001 g), and a protractor (±1◦) to measure muscle fascicle
lengths (L), masses (mmusc), and resting pennation angles (θ) for calculating physiological
cross-sectional area (Aphys), taking an average of five randomized measurements for L and
θ in larger muscles.
Using water displacement (immersing sectioned muscles in graduated cylinders) to
calculate muscle belly (sans tendon) density (d) from (volume m−1musc), we obtained a
mean value of 1.0645 × 10³ (n = 10; S.D. = 0.0347) kg m−3, matching measurements
of mammalian muscle (Mendez & Keys, 1960; Brown et al., 2003a). Hence, we assumed a
conventional value of d as 1.06 × 10³ kg m−3. As commonly practiced, we assumed L to
Hutchinson et al. (2015), PeerJ, DOI 10.7717/peerj.1001 11/52
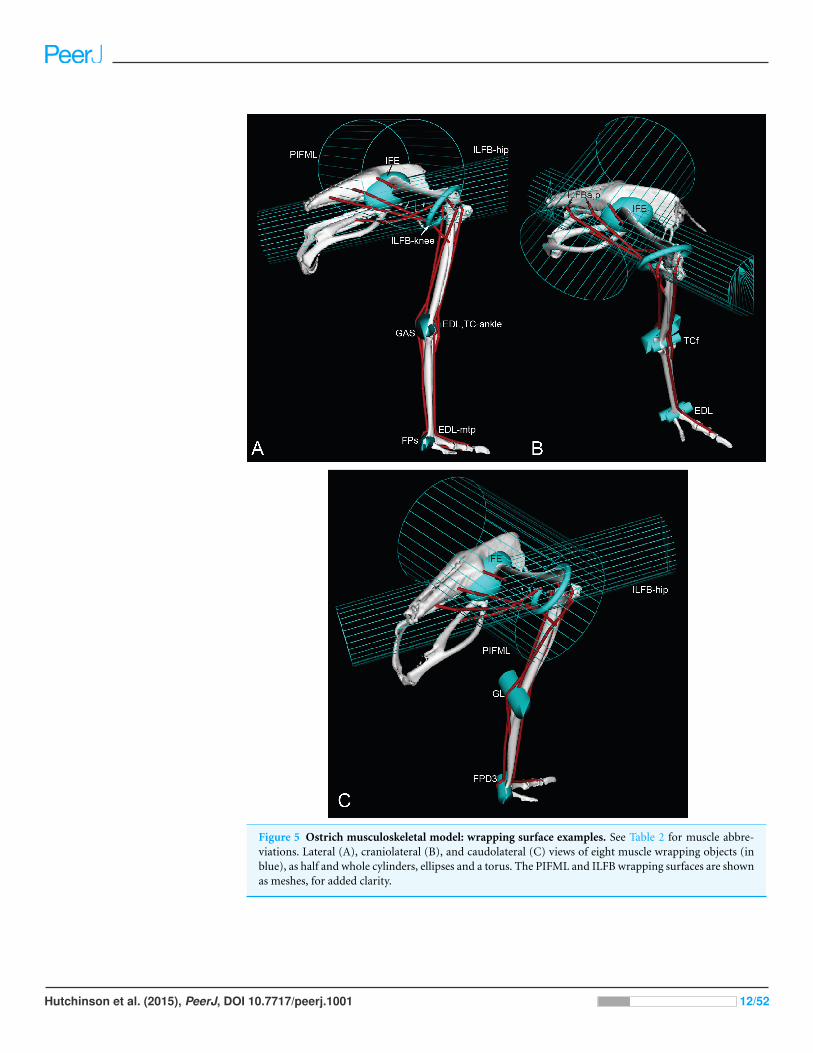
Figure 5 Ostrich musculoskeletal model: wrapping surface examples. See Table 2 for muscle abbre-viations. Lateral (A), craniolateral (B), and caudolateral (C) views of eight muscle wrapping objects (inblue), as half and whole cylinders, ellipses and a torus. The PIFML and ILFB wrapping surfaces are shownas meshes, for added clarity.
Hutchinson et al. (2015), PeerJ, DOI 10.7717/peerj.1001 12/52
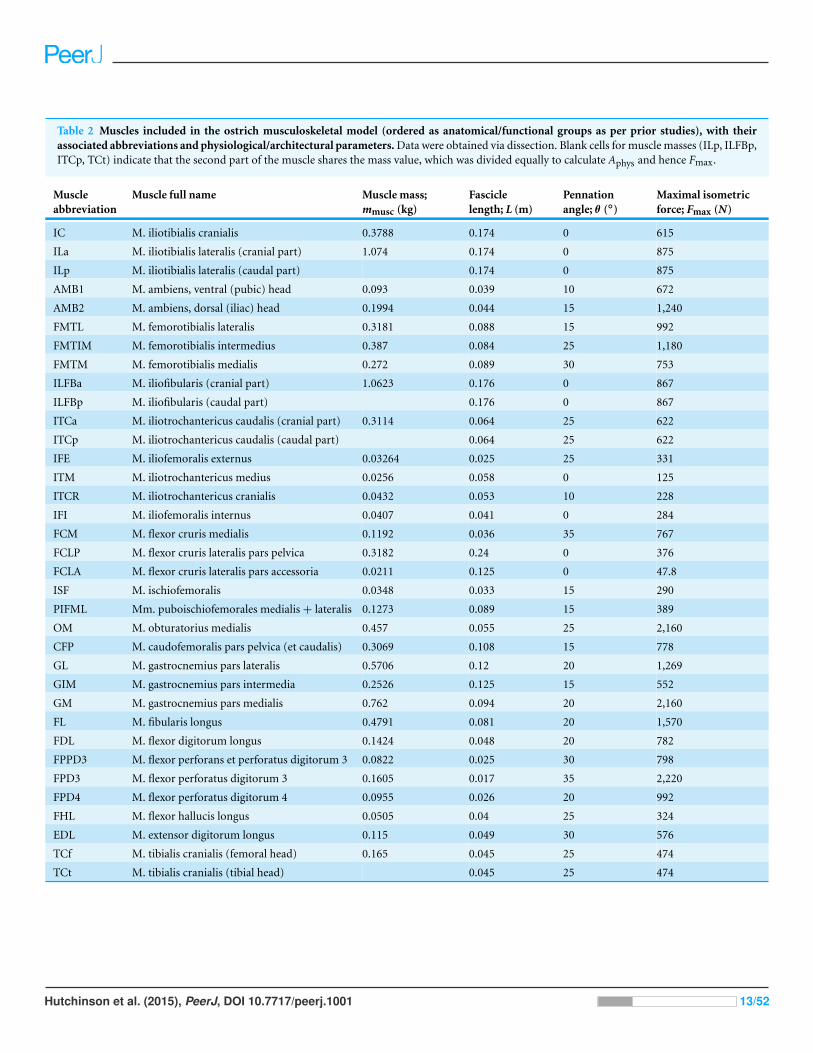
Table 2 Muscles included in the ostrich musculoskeletal model (ordered as anatomical/functional groups as per prior studies), with theirassociated abbreviations and physiological/architectural parameters. Data were obtained via dissection. Blank cells for muscle masses (ILp, ILFBp,ITCp, TCt) indicate that the second part of the muscle shares the mass value, which was divided equally to calculate Aphys and hence Fmax.
Muscleabbreviation
Muscle full name Muscle mass;mmusc (kg)
Fasciclelength; L (m)
Pennationangle; θ (◦)
Maximal isometricforce; Fmax (N)
IC M. iliotibialis cranialis 0.3788 0.174 0 615
ILa M. iliotibialis lateralis (cranial part) 1.074 0.174 0 875
ILp M. iliotibialis lateralis (caudal part) 0.174 0 875
AMB1 M. ambiens, ventral (pubic) head 0.093 0.039 10 672
AMB2 M. ambiens, dorsal (iliac) head 0.1994 0.044 15 1,240
FMTL M. femorotibialis lateralis 0.3181 0.088 15 992
FMTIM M. femorotibialis intermedius 0.387 0.084 25 1,180
FMTM M. femorotibialis medialis 0.272 0.089 30 753
ILFBa M. iliofibularis (cranial part) 1.0623 0.176 0 867
ILFBp M. iliofibularis (caudal part) 0.176 0 867
ITCa M. iliotrochantericus caudalis (cranial part) 0.3114 0.064 25 622
ITCp M. iliotrochantericus caudalis (caudal part) 0.064 25 622
IFE M. iliofemoralis externus 0.03264 0.025 25 331
ITM M. iliotrochantericus medius 0.0256 0.058 0 125
ITCR M. iliotrochantericus cranialis 0.0432 0.053 10 228
IFI M. iliofemoralis internus 0.0407 0.041 0 284
FCM M. flexor cruris medialis 0.1192 0.036 35 767
FCLP M. flexor cruris lateralis pars pelvica 0.3182 0.24 0 376
FCLA M. flexor cruris lateralis pars accessoria 0.0211 0.125 0 47.8
ISF M. ischiofemoralis 0.0348 0.033 15 290
PIFML Mm. puboischiofemorales medialis + lateralis 0.1273 0.089 15 389
OM M. obturatorius medialis 0.457 0.055 25 2,160
CFP M. caudofemoralis pars pelvica (et caudalis) 0.3069 0.108 15 778
GL M. gastrocnemius pars lateralis 0.5706 0.12 20 1,269
GIM M. gastrocnemius pars intermedia 0.2526 0.125 15 552
GM M. gastrocnemius pars medialis 0.762 0.094 20 2,160
FL M. fibularis longus 0.4791 0.081 20 1,570
FDL M. flexor digitorum longus 0.1424 0.048 20 782
FPPD3 M. flexor perforans et perforatus digitorum 3 0.0822 0.025 30 798
FPD3 M. flexor perforatus digitorum 3 0.1605 0.017 35 2,220
FPD4 M. flexor perforatus digitorum 4 0.0955 0.026 20 992
FHL M. flexor hallucis longus 0.0505 0.04 25 324
EDL M. extensor digitorum longus 0.115 0.049 30 576
TCf M. tibialis cranialis (femoral head) 0.165 0.045 25 474
TCt M. tibialis cranialis (tibial head) 0.045 25 474
Hutchinson et al. (2015), PeerJ, DOI 10.7717/peerj.1001 13/52
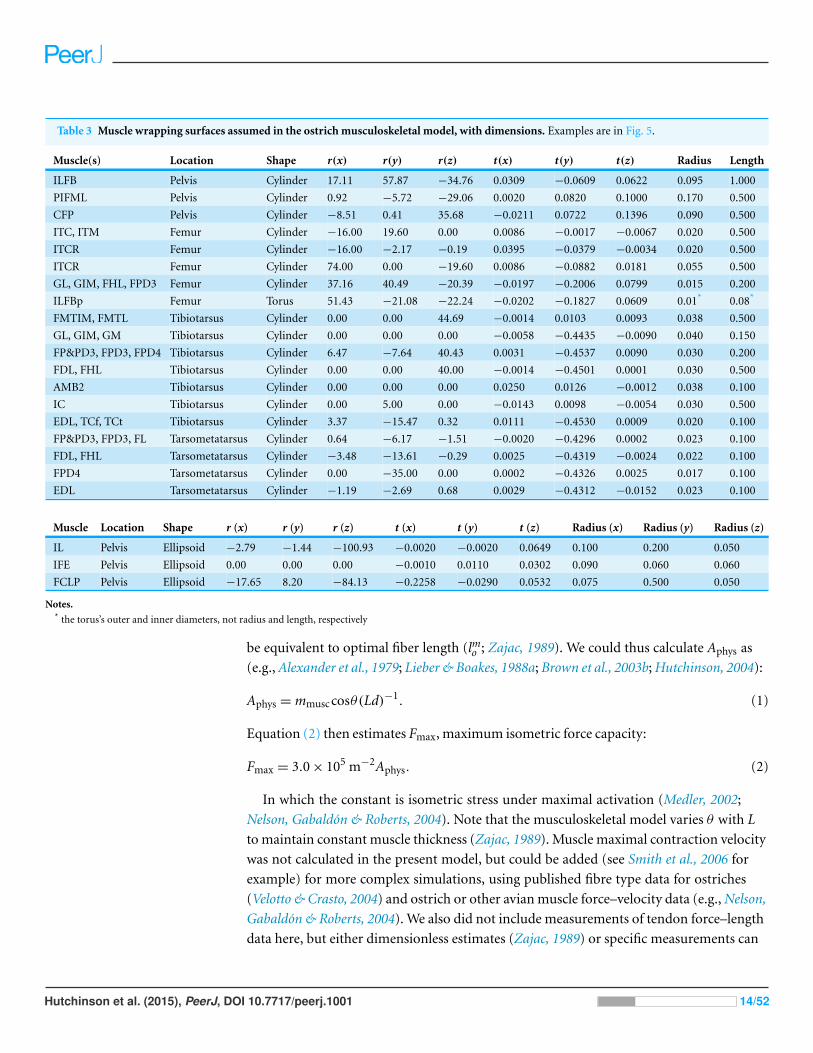
Table 3 Muscle wrapping surfaces assumed in the ostrich musculoskeletal model, with dimensions. Examples are in Fig. 5.
Muscle(s) Location Shape r(x) r(y) r(z) t(x) t(y) t(z) Radius Length
ILFB Pelvis Cylinder 17.11 57.87 −34.76 0.0309 −0.0609 0.0622 0.095 1.000
PIFML Pelvis Cylinder 0.92 −5.72 −29.06 0.0020 0.0820 0.1000 0.170 0.500
CFP Pelvis Cylinder −8.51 0.41 35.68 −0.0211 0.0722 0.1396 0.090 0.500
ITC, ITM Femur Cylinder −16.00 19.60 0.00 0.0086 −0.0017 −0.0067 0.020 0.500
ITCR Femur Cylinder −16.00 −2.17 −0.19 0.0395 −0.0379 −0.0034 0.020 0.500
ITCR Femur Cylinder 74.00 0.00 −19.60 0.0086 −0.0882 0.0181 0.055 0.500
GL, GIM, FHL, FPD3 Femur Cylinder 37.16 40.49 −20.39 −0.0197 −0.2006 0.0799 0.015 0.200
ILFBp Femur Torus 51.43 −21.08 −22.24 −0.0202 −0.1827 0.0609 0.01* 0.08*
FMTIM, FMTL Tibiotarsus Cylinder 0.00 0.00 44.69 −0.0014 0.0103 0.0093 0.038 0.500
GL, GIM, GM Tibiotarsus Cylinder 0.00 0.00 0.00 −0.0058 −0.4435 −0.0090 0.040 0.150
FP&PD3, FPD3, FPD4 Tibiotarsus Cylinder 6.47 −7.64 40.43 0.0031 −0.4537 0.0090 0.030 0.200
FDL, FHL Tibiotarsus Cylinder 0.00 0.00 40.00 −0.0014 −0.4501 0.0001 0.030 0.500
AMB2 Tibiotarsus Cylinder 0.00 0.00 0.00 0.0250 0.0126 −0.0012 0.038 0.100
IC Tibiotarsus Cylinder 0.00 5.00 0.00 −0.0143 0.0098 −0.0054 0.030 0.500
EDL, TCf, TCt Tibiotarsus Cylinder 3.37 −15.47 0.32 0.0111 −0.4530 0.0009 0.020 0.100
FP&PD3, FPD3, FL Tarsometatarsus Cylinder 0.64 −6.17 −1.51 −0.0020 −0.4296 0.0002 0.023 0.100
FDL, FHL Tarsometatarsus Cylinder −3.48 −13.61 −0.29 0.0025 −0.4319 −0.0024 0.022 0.100
FPD4 Tarsometatarsus Cylinder 0.00 −35.00 0.00 0.0002 −0.4326 0.0025 0.017 0.100
EDL Tarsometatarsus Cylinder −1.19 −2.69 0.68 0.0029 −0.4312 −0.0152 0.023 0.100
Muscle Location Shape r (x) r (y) r (z) t (x) t (y) t (z) Radius (x) Radius (y) Radius (z)
IL Pelvis Ellipsoid −2.79 −1.44 −100.93 −0.0020 −0.0020 0.0649 0.100 0.200 0.050
IFE Pelvis Ellipsoid 0.00 0.00 0.00 −0.0010 0.0110 0.0302 0.090 0.060 0.060
FCLP Pelvis Ellipsoid −17.65 8.20 −84.13 −0.2258 −0.0290 0.0532 0.075 0.500 0.050
Notes.* the torus’s outer and inner diameters, not radius and length, respectively
be equivalent to optimal fiber length (lmo ; Zajac, 1989). We could thus calculate Aphys as
(e.g., Alexander et al., 1979; Lieber & Boakes, 1988a; Brown et al., 2003b; Hutchinson, 2004):
Aphys = mmusccosθ(Ld)−1. (1)
Equation (2) then estimates Fmax, maximum isometric force capacity:
Fmax = 3.0 × 10⁵ m−2Aphys. (2)
In which the constant is isometric stress under maximal activation (Medler, 2002;
Nelson, Gabaldon & Roberts, 2004). Note that the musculoskeletal model varies θ with L
to maintain constant muscle thickness (Zajac, 1989). Muscle maximal contraction velocity
was not calculated in the present model, but could be added (see Smith et al., 2006 for
example) for more complex simulations, using published fibre type data for ostriches
(Velotto & Crasto, 2004) and ostrich or other avian muscle force–velocity data (e.g., Nelson,
Gabaldon & Roberts, 2004). We also did not include measurements of tendon force–length
data here, but either dimensionless estimates (Zajac, 1989) or specific measurements can
Hutchinson et al. (2015), PeerJ, DOI 10.7717/peerj.1001 14/52
be added to future simulations. For simplicity, we chose to focus in this initial study on
near-isometric muscle action and progress to more complex, dynamic parameters in later
work.
Muscles were identified as in Table 2 following Gangletal (2004) and Zinoviev (2006)
(see Appendix for additional details). For simplicity, we combined some muscle heads
into single functional muscles in the model (cf. Gangletal, 2004: Table 1) and omitted
some tendinous/minute muscles which were grouped with other similar muscles nearby
or omitted in the case of M. popliteus (rotates fibula around tibia; Fuss, 1996); these
simplifications are outlined in Text S1. However, some muscles (e.g., M. iliofibularis,
M. iliotrochantericus caudalis) were large enough that separation into two heads was
deemed important, as some heads might have very different flexor/extensor moment arms
than more cranial/caudally-positioned ones.
Limb muscle biomechanics: calculations and hypothesis testingThe musculoskeletal model was then imported into OpenSim (opensim.stanford.edu)
software in order to take advantage of the programme’s established analysis capabilities.
OpenSim uses the ‘virtual work’ method (change of muscle–tendon unit length per unit
joint rotation) explained by Delp & Loan (1995), Delp & Loan (2000) and Pandy (1999)
to compute muscular moment arms over a range of motion. Maximal muscular moments
then can be estimated using muscle Fmax and potentially lmo (see above and Zajac, 1989).
To test whether ostrich muscle moment-generating capacity is optimized to match
peak loads during walking and running (our Question 1), we compared the results
from estimated maximal muscle moments to experimentally-calculated internal and
external moments (Rubenson et al., 2011), addressed in the Discussion. First, each
muscle’s maximal isometric muscle force (Fmax) was multiplied by the flexor/extensor
moment arm calculated by OpenSim (i.e., from the individual trials’ limb joint angle
input data and the model’s resulting moment arm output data), for each pose adopted
throughout the representative walking and running gait cycle trials (every 1% of gait cycle)
to obtain the relationship between locomotor kinematics and isometric muscle moments.
Second, OpenSim was used to calculate individual muscle moments directly, taking into
account muscle force–length relationships (set as dimensionless in a Hill model as per
Zajac, 1989), in order to provide a more realistic estimate of the variation of maximal
moment-generating capacity throughout the same gait cycles. Both approaches were static,
ignoring time/history-dependent influences on muscles. The second approach allowed
non-isometric muscle action to be represented, but did not incorporate force–velocity
effects, which would require a more dynamic simulation to resolve. Total extensor and
flexor maximal moments were calculated in OpenSim as well as the net (extensor + flexor)
maximal moment.
To determine if ostrich limb muscle moment arms peak at extended limb orientations
or at mid-stance of locomotion (our Question 2), we used the model to calculate the mean
moment arm of all extensor or flexor muscles across the full range of motion of each
joint (estimated from osteological joint congruency as in Bates & Schachner (2012)) in
Hutchinson et al. (2015), PeerJ, DOI 10.7717/peerj.1001 15/52
flexion/extension (set at constant values for mid-stance of running in other degrees of free-
dom), summed these mean moment arms, and divided that sum by the summed maximal
moment arms for each muscle across the same range of motion (as in Hutchinson et al.,
2005). We then inspected whether our representative mid-stance poses in walking or run-
ning matched maximal or minimal averaged moment arms corresponding to those poses.
To compare the degree of matching between muscle moment arms in our model and the
experimental data of Smith et al. (2007) and Bates & Schachner (2012) (our Question 3), we
obtained the published experimental and modelling data (KT Bates, provided by request),
transformed their joint angle definitions to be consistent with our model definitions,
and plotted the muscle moment arms vs. each joint angle with our moment arm data
(also see Figs. S1–S4), restricting the other studies’ ranges of motion to those presented
in the original studies. For the knee and joints distal to it, in this study we focus only on
flexor/extensor moment arms for simplicity and because the importance of long-axis and
ab/adduction muscle (vs. passive tissue) moments at these distal joints is unclear, although
our model could be adjusted to calculate those non-sagittal moment arms and moments.
RESULTSHere we present our data for addressing our main questions, proceeding in order
with maximal muscular moments, maximal/minimal moment arms, and then general
moment arm patterns compared with other studies.’ The model is downloadable from
the repositories at https://simtk.org/home/opensim and Figshare (Hutchinson et al.,
2015) and can be manipulated in open source software OpenSim. Movie S1 shows the
model animated through the representative running stride (from Rubenson et al. (2007)).
Figure S5 shows the kinematic data for the walking trial vs. a larger dataset (not shown
in Rubenson et al. (2007), but obtained from the same methods and experiment). In that
representative trial, the pelvic pitch angle is ∼10◦ more tilted (pitched upward) than the
mean—reasons for this isolated deviation are unclear but also very unlikely to influence
our findings here. Both individual walking and running trials’ data are supplied in the
repository (Hutchinson et al., 2015).
Maximal muscular momentsOur 3D ostrich limb model predicted how the maximal capacity to generate muscle
moments should vary with limb orientation during walking and running (Figs. 6 and 7).
Maximal flexor moments increase if force–length properties are ignored (treating all mus-
cles as isometric). This indicates that most muscles in the model are at disadvantageously
short fibre lengths during locomotion, with walking having a generally greater capacity for
flexor moment generation (especially about the hip) than running. These curves do not
change much across the gait cycle. The pattern for extensor moments is more complex.
Peak capacity tends to be in late swing phase (reasonably consistent across all joints).
Force-length properties here provide an advantage, presumably because the muscles are
lengthened. Data during the stance phase do not support the hypothesis, regardless of
assumptions about muscle-force length states, that postures used around mid-stance of
walking or running optimize the moment-generating capacity of pelvic limb muscles in
Hutchinson et al. (2015), PeerJ, DOI 10.7717/peerj.1001 16/52
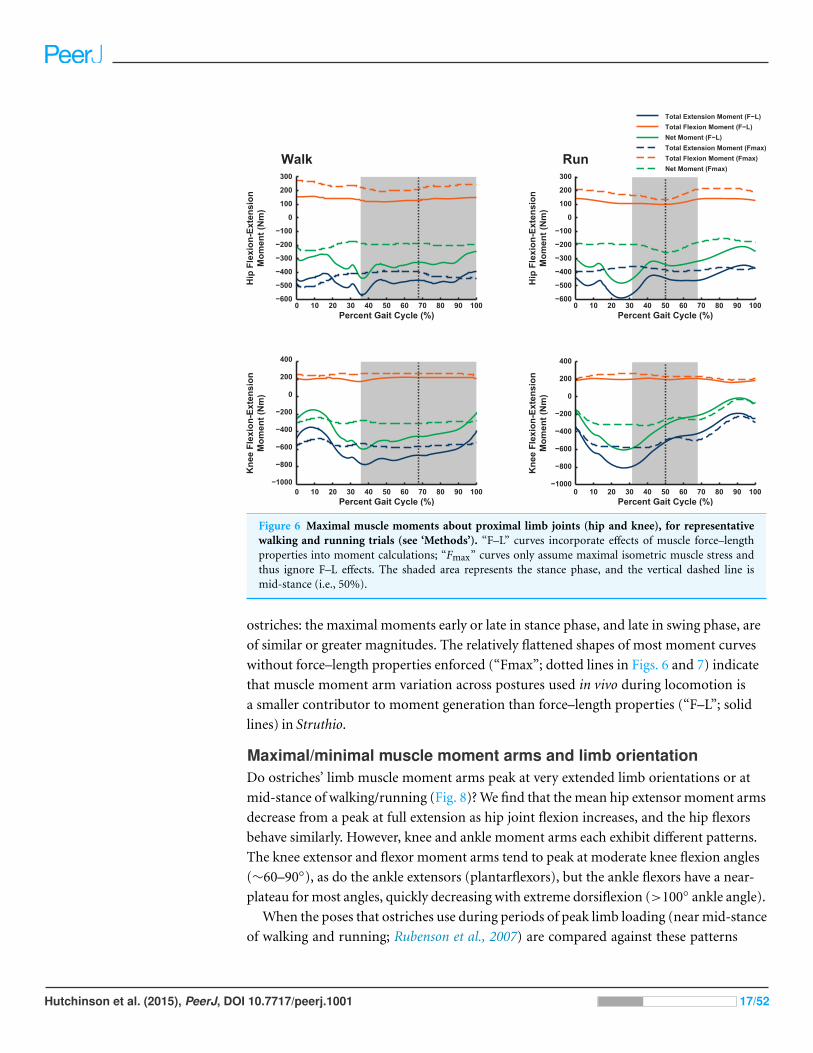
Figure 6 Maximal muscle moments about proximal limb joints (hip and knee), for representativewalking and running trials (see ‘Methods’). “F–L” curves incorporate effects of muscle force–lengthproperties into moment calculations; “Fmax” curves only assume maximal isometric muscle stress andthus ignore F–L effects. The shaded area represents the stance phase, and the vertical dashed line ismid-stance (i.e., 50%).
ostriches: the maximal moments early or late in stance phase, and late in swing phase, are
of similar or greater magnitudes. The relatively flattened shapes of most moment curves
without force–length properties enforced (“Fmax”; dotted lines in Figs. 6 and 7) indicate
that muscle moment arm variation across postures used in vivo during locomotion is
a smaller contributor to moment generation than force–length properties (“F–L”; solid
lines) in Struthio.
Maximal/minimal muscle moment arms and limb orientationDo ostriches’ limb muscle moment arms peak at very extended limb orientations or at
mid-stance of walking/running (Fig. 8)? We find that the mean hip extensor moment arms
decrease from a peak at full extension as hip joint flexion increases, and the hip flexors
behave similarly. However, knee and ankle moment arms each exhibit different patterns.
The knee extensor and flexor moment arms tend to peak at moderate knee flexion angles
(∼60–90◦), as do the ankle extensors (plantarflexors), but the ankle flexors have a near-
plateau for most angles, quickly decreasing with extreme dorsiflexion (>100◦ ankle angle).
When the poses that ostriches use during periods of peak limb loading (near mid-stance
of walking and running; Rubenson et al., 2007) are compared against these patterns
Hutchinson et al. (2015), PeerJ, DOI 10.7717/peerj.1001 17/52
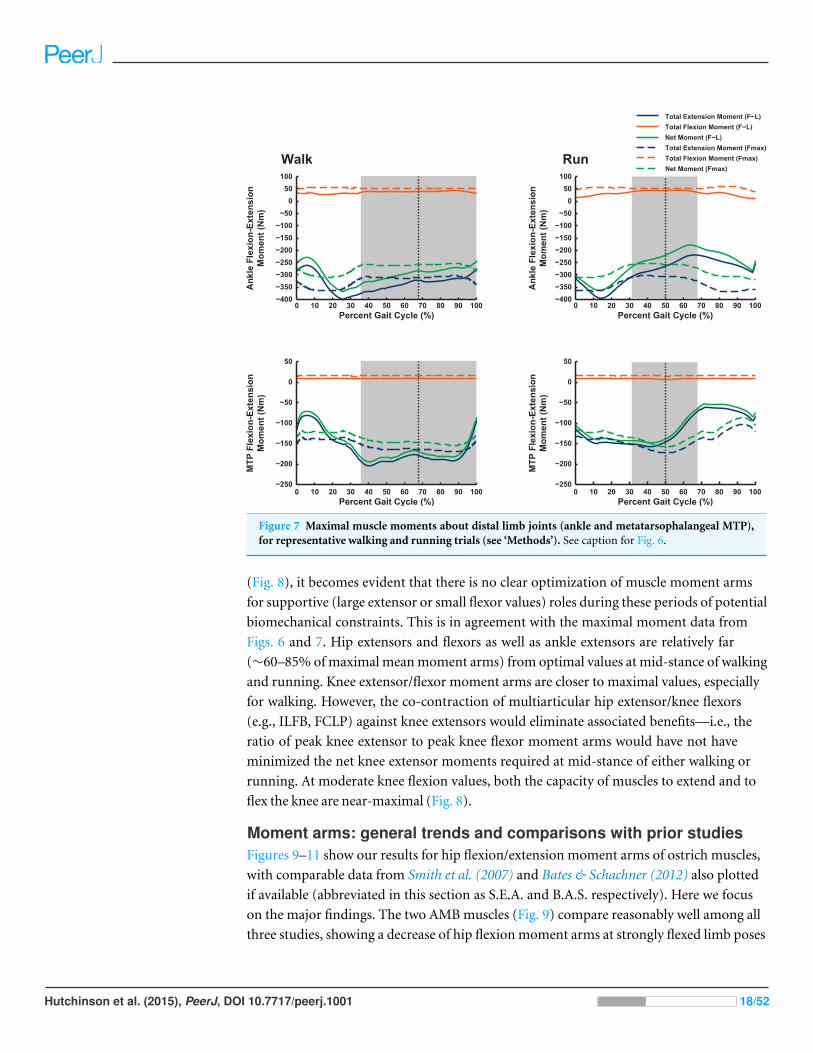
Figure 7 Maximal muscle moments about distal limb joints (ankle and metatarsophalangeal MTP),for representative walking and running trials (see ‘Methods’). See caption for Fig. 6.
(Fig. 8), it becomes evident that there is no clear optimization of muscle moment arms
for supportive (large extensor or small flexor values) roles during these periods of potential
biomechanical constraints. This is in agreement with the maximal moment data from
Figs. 6 and 7. Hip extensors and flexors as well as ankle extensors are relatively far
(∼60–85% of maximal mean moment arms) from optimal values at mid-stance of walking
and running. Knee extensor/flexor moment arms are closer to maximal values, especially
for walking. However, the co-contraction of multiarticular hip extensor/knee flexors
(e.g., ILFB, FCLP) against knee extensors would eliminate associated benefits—i.e., the
ratio of peak knee extensor to peak knee flexor moment arms would have not have
minimized the net knee extensor moments required at mid-stance of either walking or
running. At moderate knee flexion values, both the capacity of muscles to extend and to
flex the knee are near-maximal (Fig. 8).
Moment arms: general trends and comparisons with prior studiesFigures 9–11 show our results for hip flexion/extension moment arms of ostrich muscles,
with comparable data from Smith et al. (2007) and Bates & Schachner (2012) also plotted
if available (abbreviated in this section as S.E.A. and B.A.S. respectively). Here we focus
on the major findings. The two AMB muscles (Fig. 9) compare reasonably well among all
three studies, showing a decrease of hip flexion moment arms at strongly flexed limb poses
Hutchinson et al. (2015), PeerJ, DOI 10.7717/peerj.1001 18/52
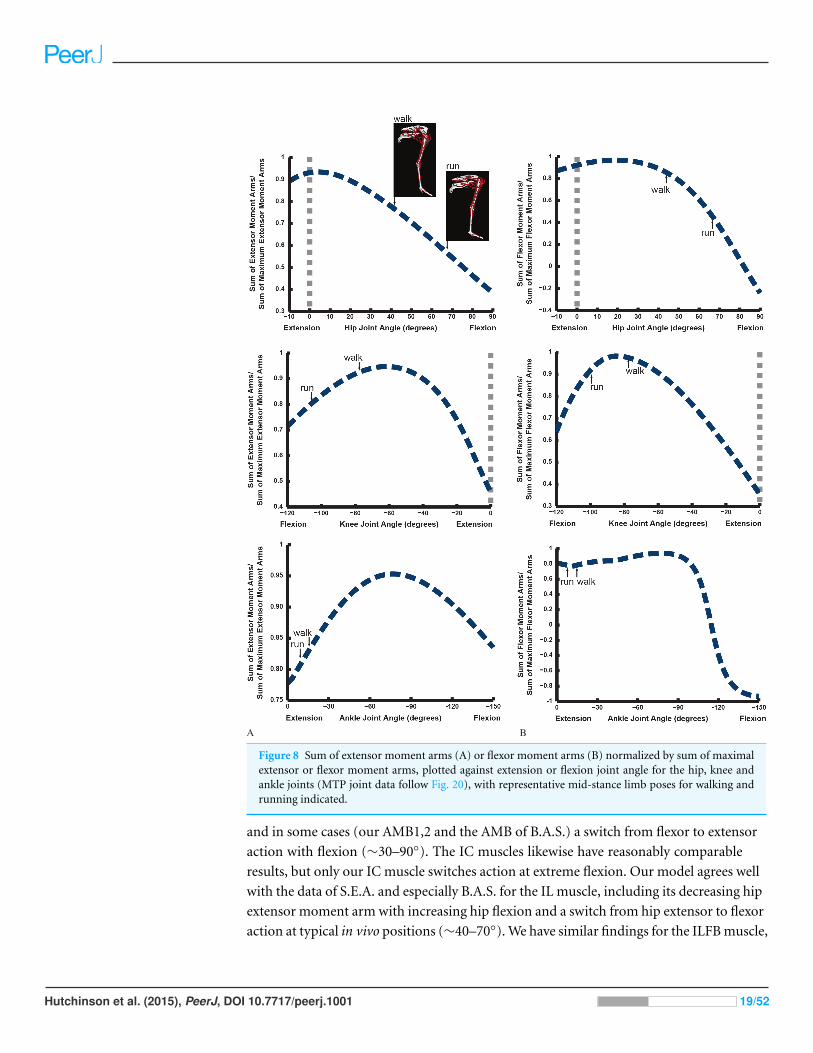
Figure 8 Sum of extensor moment arms (A) or flexor moment arms (B) normalized by sum of maximalextensor or flexor moment arms, plotted against extension or flexion joint angle for the hip, knee andankle joints (MTP joint data follow Fig. 20), with representative mid-stance limb poses for walking andrunning indicated.
and in some cases (our AMB1,2 and the AMB of B.A.S.) a switch from flexor to extensor
action with flexion (∼30–90◦). The IC muscles likewise have reasonably comparable
results, but only our IC muscle switches action at extreme flexion. Our model agrees well
with the data of S.E.A. and especially B.A.S. for the IL muscle, including its decreasing hip
extensor moment arm with increasing hip flexion and a switch from hip extensor to flexor
action at typical in vivo positions (∼40–70◦). We have similar findings for the ILFB muscle,
Hutchinson et al. (2015), PeerJ, DOI 10.7717/peerj.1001 19/52
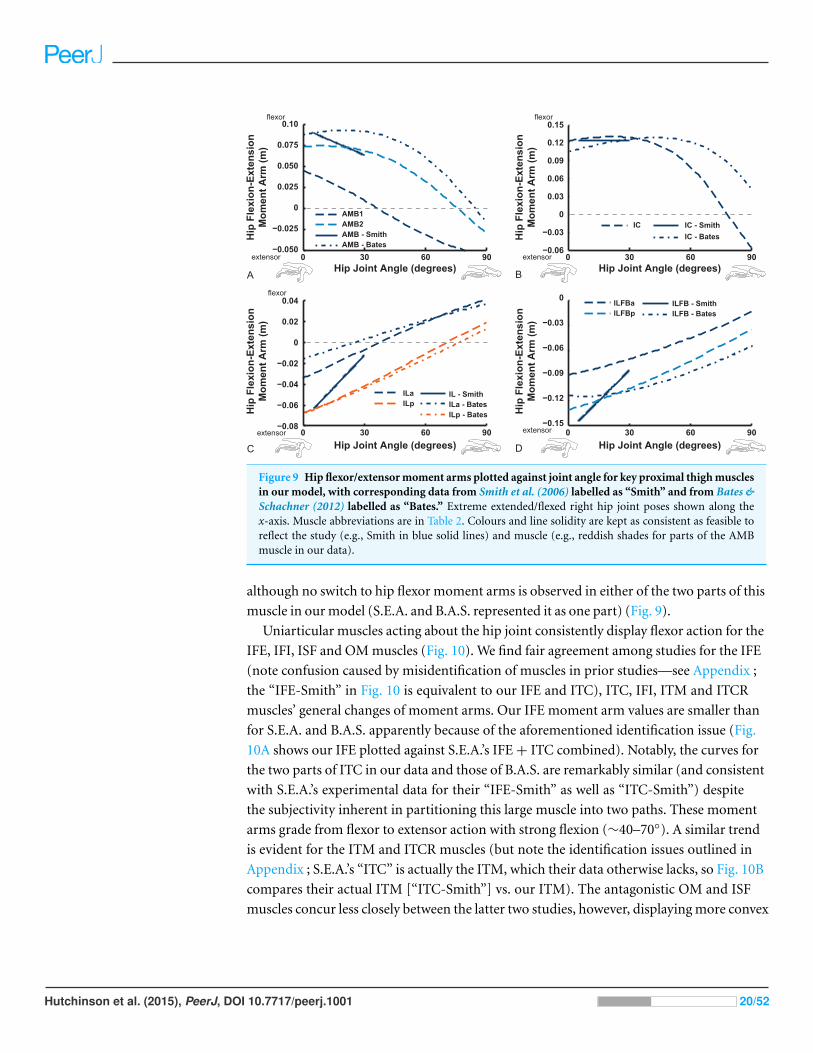
Figure 9 Hip flexor/extensor moment arms plotted against joint angle for key proximal thigh musclesin our model, with corresponding data from Smith et al. (2006) labelled as “Smith” and from Bates &Schachner (2012) labelled as “Bates.” Extreme extended/flexed right hip joint poses shown along thex-axis. Muscle abbreviations are in Table 2. Colours and line solidity are kept as consistent as feasible toreflect the study (e.g., Smith in blue solid lines) and muscle (e.g., reddish shades for parts of the AMBmuscle in our data).
although no switch to hip flexor moment arms is observed in either of the two parts of this
muscle in our model (S.E.A. and B.A.S. represented it as one part) (Fig. 9).
Uniarticular muscles acting about the hip joint consistently display flexor action for the
IFE, IFI, ISF and OM muscles (Fig. 10). We find fair agreement among studies for the IFE
(note confusion caused by misidentification of muscles in prior studies—see Appendix ;
the “IFE-Smith” in Fig. 10 is equivalent to our IFE and ITC), ITC, IFI, ITM and ITCR
muscles’ general changes of moment arms. Our IFE moment arm values are smaller than
for S.E.A. and B.A.S. apparently because of the aforementioned identification issue (Fig.
10A shows our IFE plotted against S.E.A.’s IFE + ITC combined). Notably, the curves for
the two parts of ITC in our data and those of B.A.S. are remarkably similar (and consistent
with S.E.A.’s experimental data for their “IFE-Smith” as well as “ITC-Smith”) despite
the subjectivity inherent in partitioning this large muscle into two paths. These moment
arms grade from flexor to extensor action with strong flexion (∼40–70◦). A similar trend
is evident for the ITM and ITCR muscles (but note the identification issues outlined in
Appendix ; S.E.A.’s “ITC” is actually the ITM, which their data otherwise lacks, so Fig. 10B
compares their actual ITM [“ITC-Smith”] vs. our ITM). The antagonistic OM and ISF
muscles concur less closely between the latter two studies, however, displaying more convex
Hutchinson et al. (2015), PeerJ, DOI 10.7717/peerj.1001 20/52
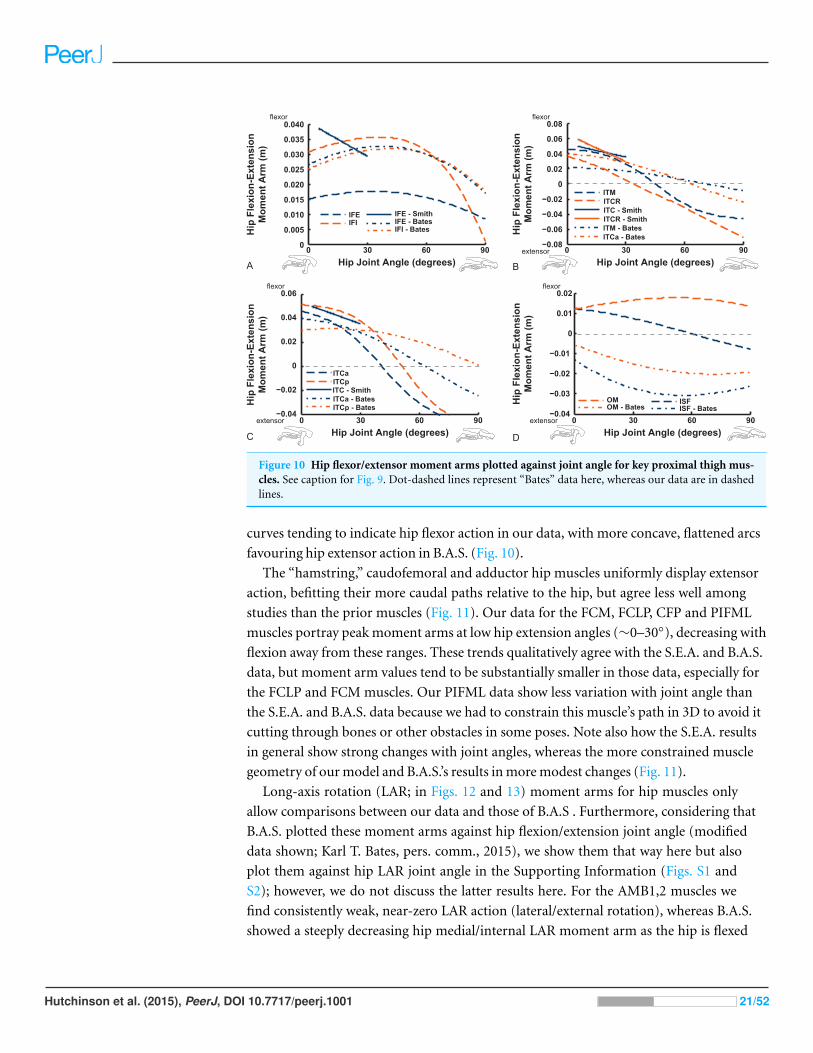
Figure 10 Hip flexor/extensor moment arms plotted against joint angle for key proximal thigh mus-cles. See caption for Fig. 9. Dot-dashed lines represent “Bates” data here, whereas our data are in dashedlines.
curves tending to indicate hip flexor action in our data, with more concave, flattened arcs
favouring hip extensor action in B.A.S. (Fig. 10).
The “hamstring,” caudofemoral and adductor hip muscles uniformly display extensor
action, befitting their more caudal paths relative to the hip, but agree less well among
studies than the prior muscles (Fig. 11). Our data for the FCM, FCLP, CFP and PIFML
muscles portray peak moment arms at low hip extension angles (∼0–30◦), decreasing with
flexion away from these ranges. These trends qualitatively agree with the S.E.A. and B.A.S.
data, but moment arm values tend to be substantially smaller in those data, especially for
the FCLP and FCM muscles. Our PIFML data show less variation with joint angle than
the S.E.A. and B.A.S. data because we had to constrain this muscle’s path in 3D to avoid it
cutting through bones or other obstacles in some poses. Note also how the S.E.A. results
in general show strong changes with joint angles, whereas the more constrained muscle
geometry of our model and B.A.S.’s results in more modest changes (Fig. 11).
Long-axis rotation (LAR; in Figs. 12 and 13) moment arms for hip muscles only
allow comparisons between our data and those of B.A.S . Furthermore, considering that
B.A.S. plotted these moment arms against hip flexion/extension joint angle (modified
data shown; Karl T. Bates, pers. comm., 2015), we show them that way here but also
plot them against hip LAR joint angle in the Supporting Information (Figs. S1 and
S2); however, we do not discuss the latter results here. For the AMB1,2 muscles we
find consistently weak, near-zero LAR action (lateral/external rotation), whereas B.A.S.
showed a steeply decreasing hip medial/internal LAR moment arm as the hip is flexed
Hutchinson et al. (2015), PeerJ, DOI 10.7717/peerj.1001 21/52
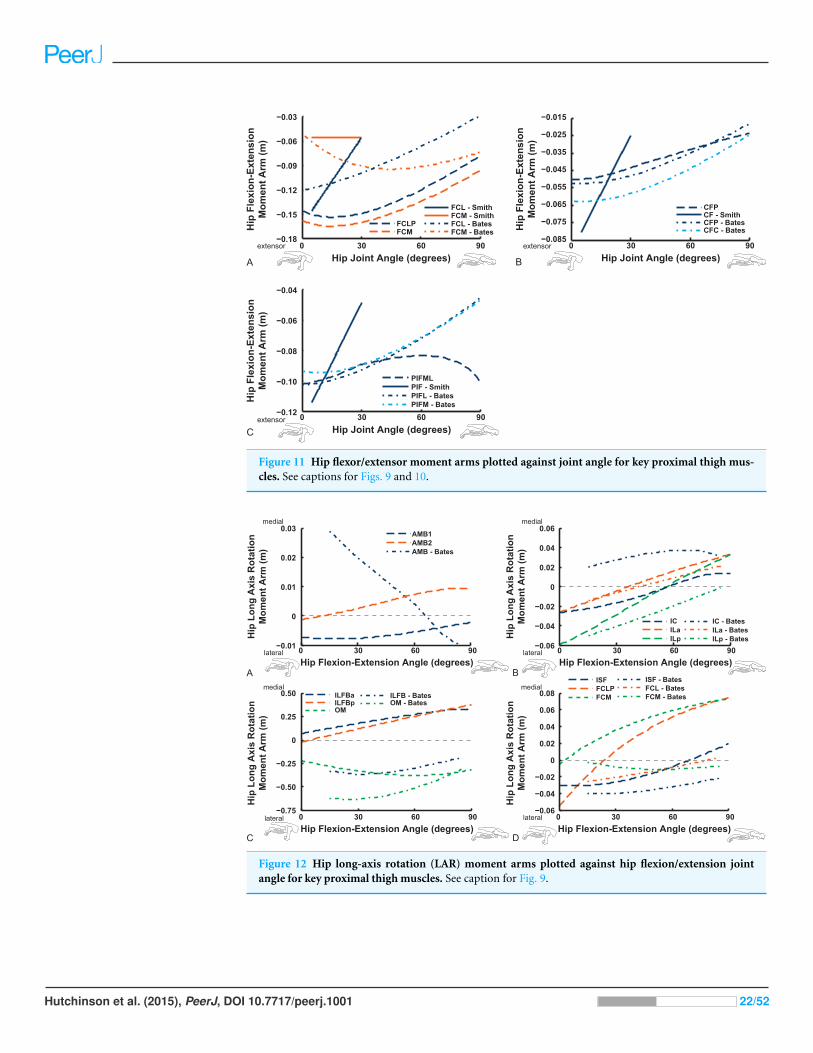
Figure 11 Hip flexor/extensor moment arms plotted against joint angle for key proximal thigh mus-cles. See captions for Figs. 9 and 10.
Figure 12 Hip long-axis rotation (LAR) moment arms plotted against hip flexion/extension jointangle for key proximal thigh muscles. See caption for Fig. 9.
Hutchinson et al. (2015), PeerJ, DOI 10.7717/peerj.1001 22/52
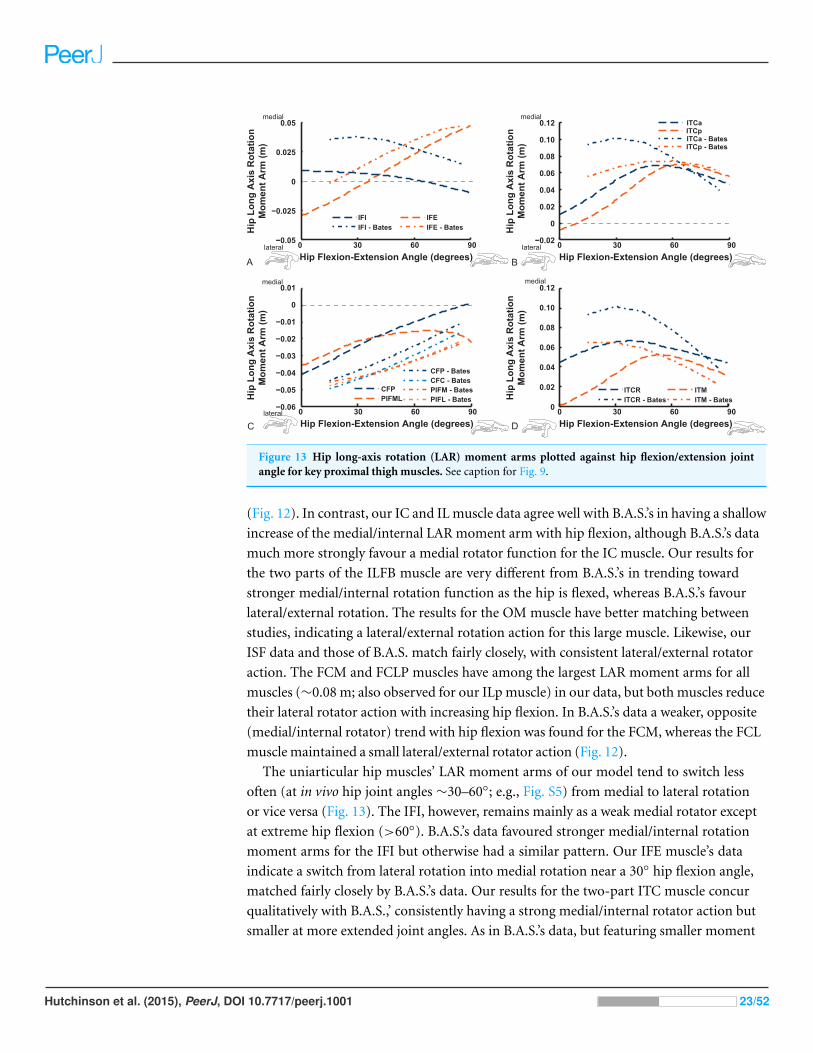
Figure 13 Hip long-axis rotation (LAR) moment arms plotted against hip flexion/extension jointangle for key proximal thigh muscles. See caption for Fig. 9.
(Fig. 12). In contrast, our IC and IL muscle data agree well with B.A.S.’s in having a shallow
increase of the medial/internal LAR moment arm with hip flexion, although B.A.S.’s data
much more strongly favour a medial rotator function for the IC muscle. Our results for
the two parts of the ILFB muscle are very different from B.A.S.’s in trending toward
stronger medial/internal rotation function as the hip is flexed, whereas B.A.S.’s favour
lateral/external rotation. The results for the OM muscle have better matching between
studies, indicating a lateral/external rotation action for this large muscle. Likewise, our
ISF data and those of B.A.S. match fairly closely, with consistent lateral/external rotator
action. The FCM and FCLP muscles have among the largest LAR moment arms for all
muscles (∼0.08 m; also observed for our ILp muscle) in our data, but both muscles reduce
their lateral rotator action with increasing hip flexion. In B.A.S.’s data a weaker, opposite
(medial/internal rotator) trend with hip flexion was found for the FCM, whereas the FCL
muscle maintained a small lateral/external rotator action (Fig. 12).
The uniarticular hip muscles’ LAR moment arms of our model tend to switch less
often (at in vivo hip joint angles ∼30–60◦; e.g., Fig. S5) from medial to lateral rotation
or vice versa (Fig. 13). The IFI, however, remains mainly as a weak medial rotator except
at extreme hip flexion (>60◦). B.A.S.’s data favoured stronger medial/internal rotation
moment arms for the IFI but otherwise had a similar pattern. Our IFE muscle’s data
indicate a switch from lateral rotation into medial rotation near a 30◦ hip flexion angle,
matched fairly closely by B.A.S.’s data. Our results for the two-part ITC muscle concur
qualitatively with B.A.S.,’ consistently having a strong medial/internal rotator action but
smaller at more extended joint angles. As in B.A.S.’s data, but featuring smaller moment
Hutchinson et al. (2015), PeerJ, DOI 10.7717/peerj.1001 23/52
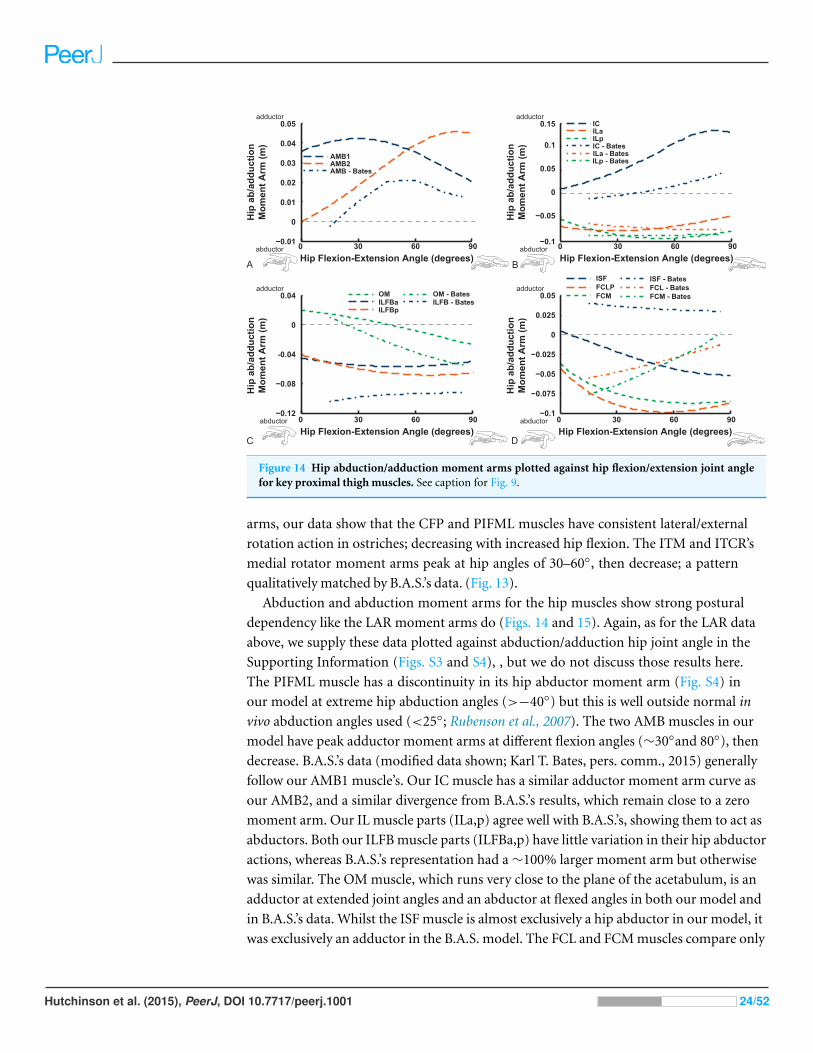
Figure 14 Hip abduction/adduction moment arms plotted against hip flexion/extension joint anglefor key proximal thigh muscles. See caption for Fig. 9.
arms, our data show that the CFP and PIFML muscles have consistent lateral/external
rotation action in ostriches; decreasing with increased hip flexion. The ITM and ITCR’s
medial rotator moment arms peak at hip angles of 30–60◦, then decrease; a pattern
qualitatively matched by B.A.S.’s data. (Fig. 13).
Abduction and abduction moment arms for the hip muscles show strong postural
dependency like the LAR moment arms do (Figs. 14 and 15). Again, as for the LAR data
above, we supply these data plotted against abduction/adduction hip joint angle in the
Supporting Information (Figs. S3 and S4), , but we do not discuss those results here.
The PIFML muscle has a discontinuity in its hip abductor moment arm (Fig. S4) in
our model at extreme hip abduction angles (>−40◦) but this is well outside normal in
vivo abduction angles used (<25◦; Rubenson et al., 2007). The two AMB muscles in our
model have peak adductor moment arms at different flexion angles (∼30◦and 80◦), then
decrease. B.A.S.’s data (modified data shown; Karl T. Bates, pers. comm., 2015) generally
follow our AMB1 muscle’s. Our IC muscle has a similar adductor moment arm curve as
our AMB2, and a similar divergence from B.A.S.’s results, which remain close to a zero
moment arm. Our IL muscle parts (ILa,p) agree well with B.A.S.’s, showing them to act as
abductors. Both our ILFB muscle parts (ILFBa,p) have little variation in their hip abductor
actions, whereas B.A.S.’s representation had a ∼100% larger moment arm but otherwise
was similar. The OM muscle, which runs very close to the plane of the acetabulum, is an
adductor at extended joint angles and an abductor at flexed angles in both our model and
in B.A.S.’s data. Whilst the ISF muscle is almost exclusively a hip abductor in our model, it
was exclusively an adductor in the B.A.S. model. The FCL and FCM muscles compare only
Hutchinson et al. (2015), PeerJ, DOI 10.7717/peerj.1001 24/52
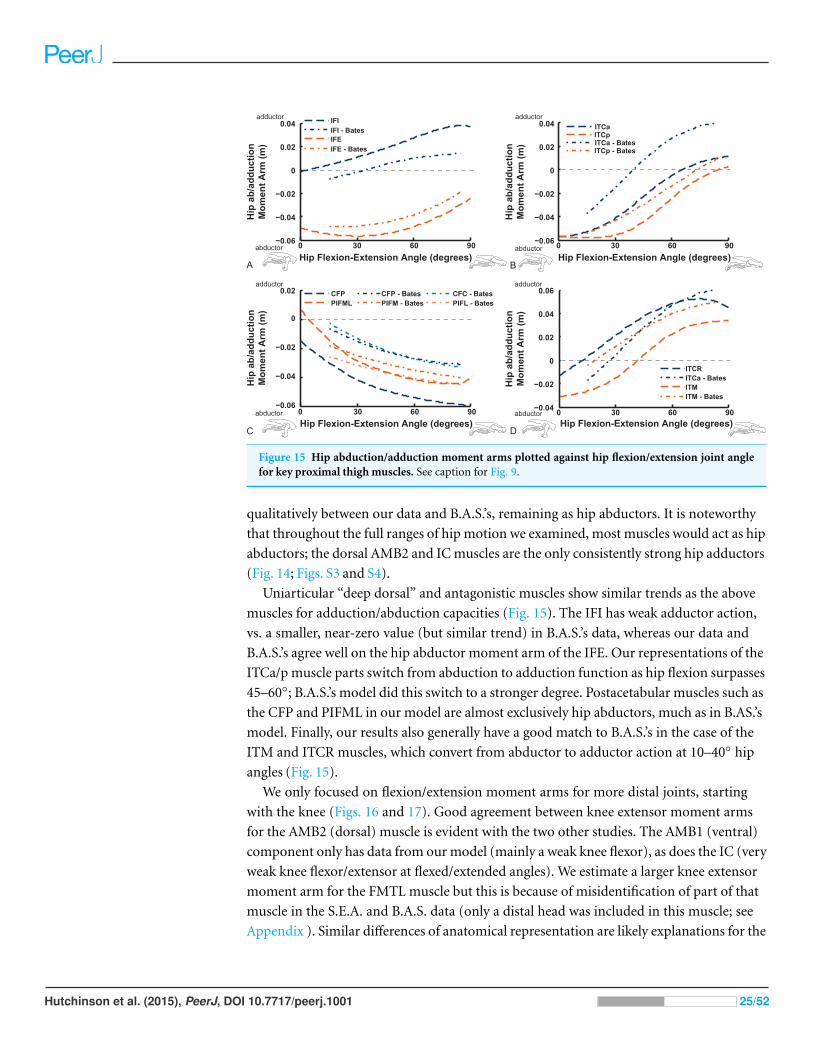
Figure 15 Hip abduction/adduction moment arms plotted against hip flexion/extension joint anglefor key proximal thigh muscles. See caption for Fig. 9.
qualitatively between our data and B.A.S.’s, remaining as hip abductors. It is noteworthy
that throughout the full ranges of hip motion we examined, most muscles would act as hip
abductors; the dorsal AMB2 and IC muscles are the only consistently strong hip adductors
(Fig. 14; Figs. S3 and S4).
Uniarticular “deep dorsal” and antagonistic muscles show similar trends as the above
muscles for adduction/abduction capacities (Fig. 15). The IFI has weak adductor action,
vs. a smaller, near-zero value (but similar trend) in B.A.S.’s data, whereas our data and
B.A.S.’s agree well on the hip abductor moment arm of the IFE. Our representations of the
ITCa/p muscle parts switch from abduction to adduction function as hip flexion surpasses
45–60◦; B.A.S.’s model did this switch to a stronger degree. Postacetabular muscles such as
the CFP and PIFML in our model are almost exclusively hip abductors, much as in B.AS.’s
model. Finally, our results also generally have a good match to B.A.S.’s in the case of the
ITM and ITCR muscles, which convert from abductor to adductor action at 10–40◦ hip
angles (Fig. 15).
We only focused on flexion/extension moment arms for more distal joints, starting
with the knee (Figs. 16 and 17). Good agreement between knee extensor moment arms
for the AMB2 (dorsal) muscle is evident with the two other studies. The AMB1 (ventral)
component only has data from our model (mainly a weak knee flexor), as does the IC (very
weak knee flexor/extensor at flexed/extended angles). We estimate a larger knee extensor
moment arm for the FMTL muscle but this is because of misidentification of part of that
muscle in the S.E.A. and B.A.S. data (only a distal head was included in this muscle; see
Appendix ). Similar differences of anatomical representation are likely explanations for the
Hutchinson et al. (2015), PeerJ, DOI 10.7717/peerj.1001 25/52
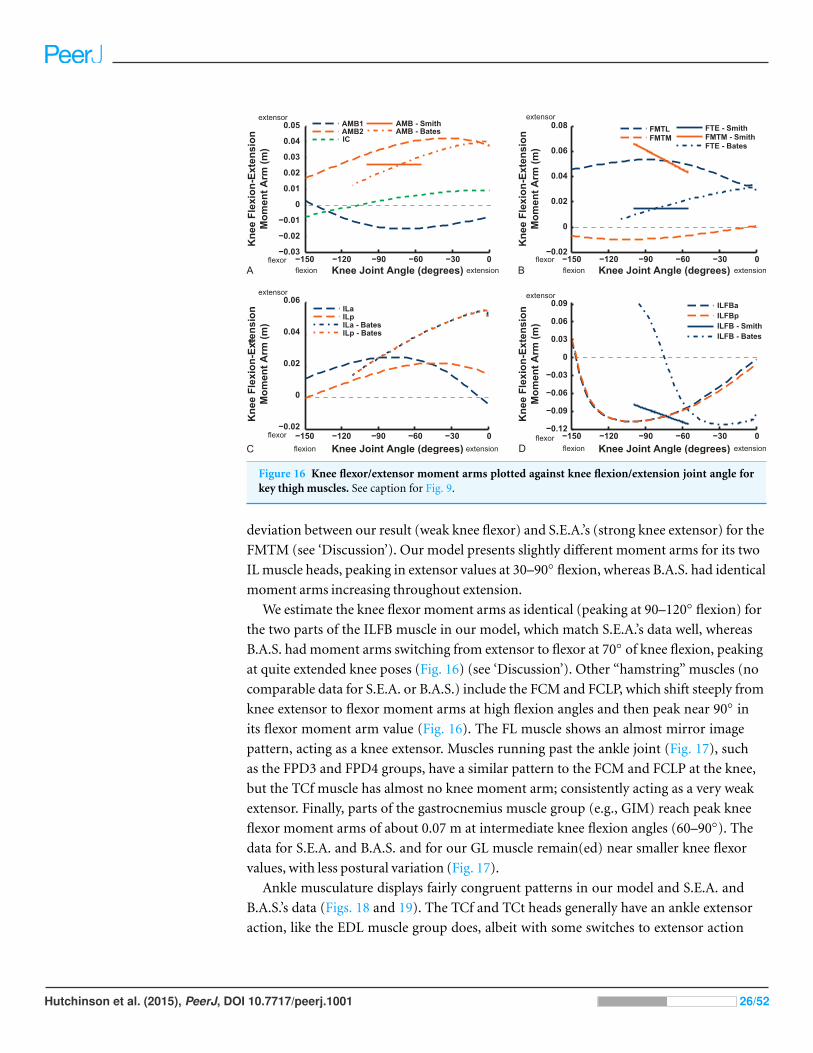
Figure 16 Knee flexor/extensor moment arms plotted against knee flexion/extension joint angle forkey thigh muscles. See caption for Fig. 9.
deviation between our result (weak knee flexor) and S.E.A.’s (strong knee extensor) for the
FMTM (see ‘Discussion’). Our model presents slightly different moment arms for its two
IL muscle heads, peaking in extensor values at 30–90◦ flexion, whereas B.A.S. had identical
moment arms increasing throughout extension.
We estimate the knee flexor moment arms as identical (peaking at 90–120◦ flexion) for
the two parts of the ILFB muscle in our model, which match S.E.A.’s data well, whereas
B.A.S. had moment arms switching from extensor to flexor at 70◦ of knee flexion, peaking
at quite extended knee poses (Fig. 16) (see ‘Discussion’). Other “hamstring” muscles (no
comparable data for S.E.A. or B.A.S.) include the FCM and FCLP, which shift steeply from
knee extensor to flexor moment arms at high flexion angles and then peak near 90◦ in
its flexor moment arm value (Fig. 16). The FL muscle shows an almost mirror image
pattern, acting as a knee extensor. Muscles running past the ankle joint (Fig. 17), such
as the FPD3 and FPD4 groups, have a similar pattern to the FCM and FCLP at the knee,
but the TCf muscle has almost no knee moment arm; consistently acting as a very weak
extensor. Finally, parts of the gastrocnemius muscle group (e.g., GIM) reach peak knee
flexor moment arms of about 0.07 m at intermediate knee flexion angles (60–90◦). The
data for S.E.A. and B.A.S. and for our GL muscle remain(ed) near smaller knee flexor
values, with less postural variation (Fig. 17).
Ankle musculature displays fairly congruent patterns in our model and S.E.A. and
B.A.S.’s data (Figs. 18 and 19). The TCf and TCt heads generally have an ankle extensor
action, like the EDL muscle group does, albeit with some switches to extensor action
Hutchinson et al. (2015), PeerJ, DOI 10.7717/peerj.1001 26/52
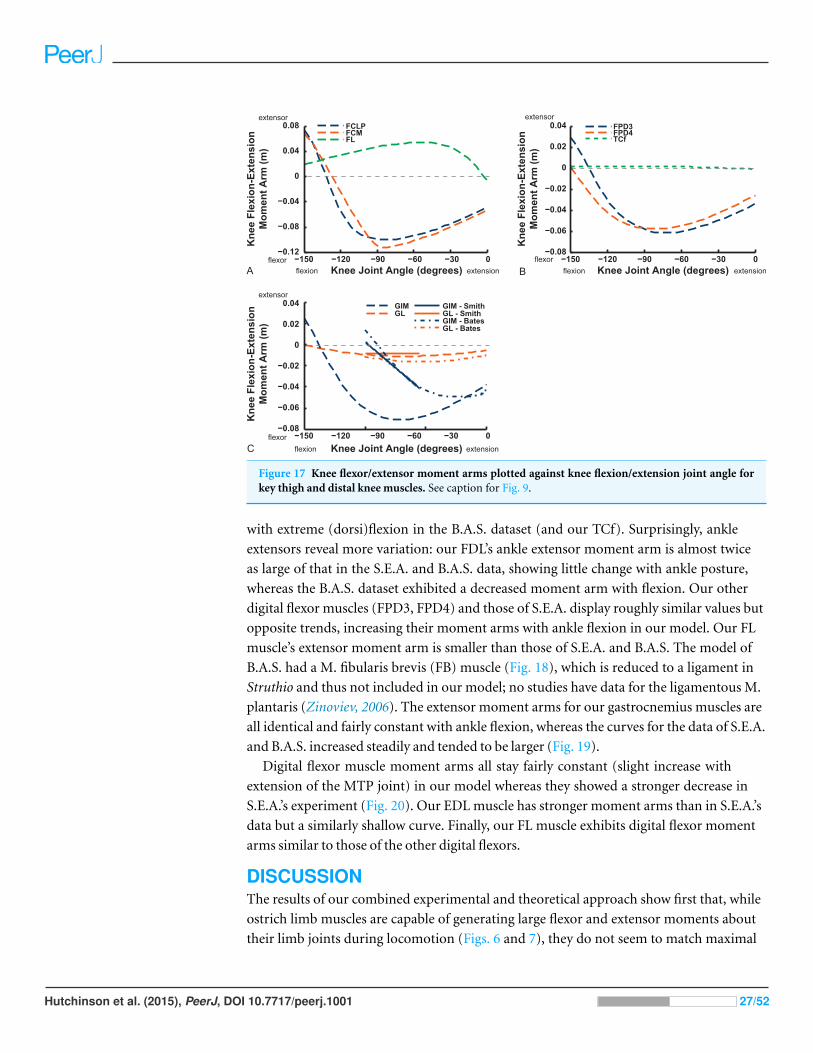
Figure 17 Knee flexor/extensor moment arms plotted against knee flexion/extension joint angle forkey thigh and distal knee muscles. See caption for Fig. 9.
with extreme (dorsi)flexion in the B.A.S. dataset (and our TCf). Surprisingly, ankle
extensors reveal more variation: our FDL’s ankle extensor moment arm is almost twice
as large of that in the S.E.A. and B.A.S. data, showing little change with ankle posture,
whereas the B.A.S. dataset exhibited a decreased moment arm with flexion. Our other
digital flexor muscles (FPD3, FPD4) and those of S.E.A. display roughly similar values but
opposite trends, increasing their moment arms with ankle flexion in our model. Our FL
muscle’s extensor moment arm is smaller than those of S.E.A. and B.A.S. The model of
B.A.S. had a M. fibularis brevis (FB) muscle (Fig. 18), which is reduced to a ligament in
Struthio and thus not included in our model; no studies have data for the ligamentous M.
plantaris (Zinoviev, 2006). The extensor moment arms for our gastrocnemius muscles are
all identical and fairly constant with ankle flexion, whereas the curves for the data of S.E.A.
and B.A.S. increased steadily and tended to be larger (Fig. 19).
Digital flexor muscle moment arms all stay fairly constant (slight increase with
extension of the MTP joint) in our model whereas they showed a stronger decrease in
S.E.A.’s experiment (Fig. 20). Our EDL muscle has stronger moment arms than in S.E.A.’s
data but a similarly shallow curve. Finally, our FL muscle exhibits digital flexor moment
arms similar to those of the other digital flexors.
DISCUSSIONThe results of our combined experimental and theoretical approach show first that, while
ostrich limb muscles are capable of generating large flexor and extensor moments about
their limb joints during locomotion (Figs. 6 and 7), they do not seem to match maximal
Hutchinson et al. (2015), PeerJ, DOI 10.7717/peerj.1001 27/52
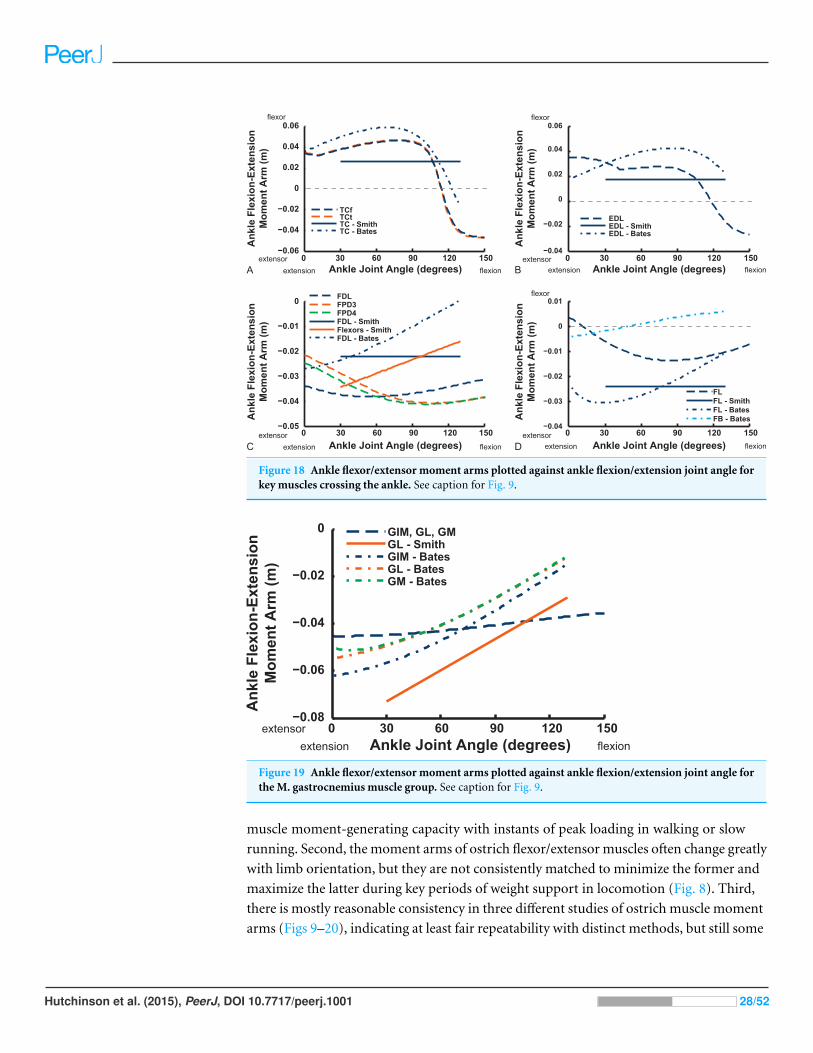
Figure 18 Ankle flexor/extensor moment arms plotted against ankle flexion/extension joint angle forkey muscles crossing the ankle. See caption for Fig. 9.
Figure 19 Ankle flexor/extensor moment arms plotted against ankle flexion/extension joint angle forthe M. gastrocnemius muscle group. See caption for Fig. 9.
muscle moment-generating capacity with instants of peak loading in walking or slow
running. Second, the moment arms of ostrich flexor/extensor muscles often change greatly
with limb orientation, but they are not consistently matched to minimize the former and
maximize the latter during key periods of weight support in locomotion (Fig. 8). Third,
there is mostly reasonable consistency in three different studies of ostrich muscle moment
arms (Figs 9–20), indicating at least fair repeatability with distinct methods, but still some
Hutchinson et al. (2015), PeerJ, DOI 10.7717/peerj.1001 28/52
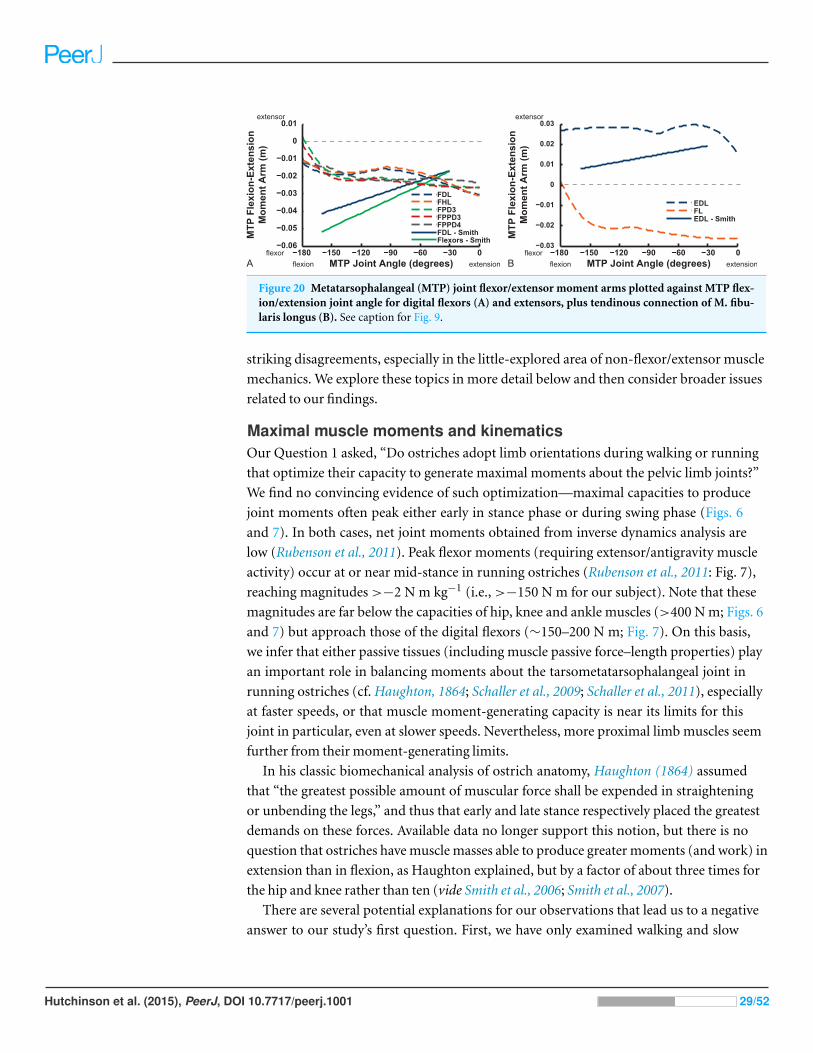
Figure 20 Metatarsophalangeal (MTP) joint flexor/extensor moment arms plotted against MTP flex-ion/extension joint angle for digital flexors (A) and extensors, plus tendinous connection of M. fibu-laris longus (B). See caption for Fig. 9.
striking disagreements, especially in the little-explored area of non-flexor/extensor muscle
mechanics. We explore these topics in more detail below and then consider broader issues
related to our findings.
Maximal muscle moments and kinematicsOur Question 1 asked, “Do ostriches adopt limb orientations during walking or running
that optimize their capacity to generate maximal moments about the pelvic limb joints?”
We find no convincing evidence of such optimization—maximal capacities to produce
joint moments often peak either early in stance phase or during swing phase (Figs. 6
and 7). In both cases, net joint moments obtained from inverse dynamics analysis are
low (Rubenson et al., 2011). Peak flexor moments (requiring extensor/antigravity muscle
activity) occur at or near mid-stance in running ostriches (Rubenson et al., 2011: Fig. 7),
reaching magnitudes >−2 N m kg−1 (i.e., >−150 N m for our subject). Note that these
magnitudes are far below the capacities of hip, knee and ankle muscles (>400 N m; Figs. 6
and 7) but approach those of the digital flexors (∼150–200 N m; Fig. 7). On this basis,
we infer that either passive tissues (including muscle passive force–length properties) play
an important role in balancing moments about the tarsometatarsophalangeal joint in
running ostriches (cf. Haughton, 1864; Schaller et al., 2009; Schaller et al., 2011), especially
at faster speeds, or that muscle moment-generating capacity is near its limits for this
joint in particular, even at slower speeds. Nevertheless, more proximal limb muscles seem
further from their moment-generating limits.
In his classic biomechanical analysis of ostrich anatomy, Haughton (1864) assumed
that “the greatest possible amount of muscular force shall be expended in straightening
or unbending the legs,” and thus that early and late stance respectively placed the greatest
demands on these forces. Available data no longer support this notion, but there is no
question that ostriches have muscle masses able to produce greater moments (and work) in
extension than in flexion, as Haughton explained, but by a factor of about three times for
the hip and knee rather than ten (vide Smith et al., 2006; Smith et al., 2007).
There are several potential explanations for our observations that lead us to a negative
answer to our study’s first question. First, we have only examined walking and slow
Hutchinson et al. (2015), PeerJ, DOI 10.7717/peerj.1001 29/52
running. Near maximal speed, moment capacity and requirements around mid-stance
might be more closely matched (e.g., Hutchinson, 2004), as forces surely increase. At a
duty factor of 0.42, Rubenson et al. (2011) obtained peak vertical ground reaction forces
of 1500–2000 N or about 2.17–2.89 times body weight (BW), whereas Alexander et al.
(1979) estimated 2.7 BW peak forces for an ostrich at near top speed (duty factor 0.29).
The latter study used an equation that probably underestimates peak forces for ostriches,
as Rubenson et al.’s (2011) data show (peak forces are 16–55% greater than predicted from
duty factor). Second, our present model is still static, not considering force–velocity or
other dynamic interactions that would alter moment-generating capacities. It is possible
that these parameters, or highly complex interactions (e.g., muscle moment arms and
“power amplification”), could be more influential than the isometric and force–length
properties that our model considers. Third, entirely different factors could determine
locomotor and postural optimization, such as energetic costs or stability/manoeuvrability
(e.g., Daley & Usherwood, 2010).
Comparison of our results with other studies of the relationship between limb
orientation and muscle mechanics reveal a fourth potential explanation, that the
optimization of anatomy, posture, physiology and other factors in locomotor dynamics
could be highly species-, task-, limb-, joint- or muscle-specific. Lieber and colleagues
(Lieber & Boakes, 1988a; Lieber & Boakes, 1988b; Mai & Lieber, 1990; Lieber & Brown,
1992; Lieber & Shoemaker, 1992) conducted an elegant series of studies that constitute a
model system for addressing this issue. They elucidated that maximal moment production
by the semitendinosus muscle in frog hindlimbs showed a strong dependence on muscle
isometric force capacity and moment arms. Some of these studies found less dependence of
moment production on joint angle-dependent moment arm values (e.g., Lieber & Boakes,
1988a; Lieber & Boakes, 1988b), but this dependency varied for the hip and knee joints
(Mai & Lieber, 1990; Lieber & Shoemaker, 1992)—and might be expected to vary for other
muscles, too. Indeed, the moment arm did not vary much with knee joint angle for the
semitendinosus (e.g., 0.37–0.44 cm about knee, across 10–160◦ range of flexion/extension;
Lieber & Boakes, 1988a: Fig. 6A) so this muscle could not contribute much variation to
muscle moment production. One might predict more dependency of maximal muscle
moment production on moment arms for muscles that have more variable moment arms,
but this has not been conclusively determined. Lieber & Brown (1992) found that there
was no simple relationship between muscle fibre length and moment arm in seven frog
hindlimb muscles, with differences evident between muscles acting about the hip and knee,
suggesting diverse adaptations to moment production demands.
The aforementioned studies’ reviews of numerous others in humans, cats and other
species likewise note some variability and uncertainty in what factors determine maximal
moment capacity in limbs, so consensus has been elusive. Furthermore, Brown et al.’s
(2003b) modelling/experimental study of horse forelimbs found that while the moment-
producing capacities of flexor muscles were determined mostly by muscle properties
(e.g., Fmax or muscle force–length), muscle moment arms could have greater effects on
moments than those properties for some extensor muscles. Young, Scott & Loeb (1993) also
Hutchinson et al. (2015), PeerJ, DOI 10.7717/peerj.1001 30/52
found variability from 50–100% of resting fascicle length in the amount of length change
that cat ankle muscles used throughout their range of motion. Thus strict “sarcomere
equivalency” (constant usage of maximal muscle range of motion; e.g., discussions in
McClearn, 1985; Lieber, 1997; Bates & Schachner, 2012) is not expected, but an approximate
“tuning” of moment arms to muscle fibre lengths (and joint ranges of motion) is expected
at least in some cases (see Sellers et al. (2013) for an example of how such information
could be useful). Lieber & Shoemaker (1992) explained how a greater muscle fibre
length to moment arm ratio would cause muscle force–length properties to become less
influential on muscle moment production. Therefore, in the long-fibred proximal muscles
of ostriches and other birds that run closer to the hip and knee joints and thus have smaller
moment arms (e.g., Smith et al., 2006; Smith et al., 2007), individual muscles’ moment
arms might be quite influential. This speculation has yet to be conclusively tested, let alone
integrated into studies of whole limbs and locomotor dynamics.
Regardless, recent studies of the hindlimbs of mice (Lieber, 1997), rats (Johnson et al.,
2008), and chimpanzees (O’Neill et al., 2013), as well as horse forelimbs (Brown et al.,
2003a; Brown et al., 2003b) favour some optimization of locomotor tasks and muscle
moment arms, as do broad comparative studies of elbow muscles by Fujiwara and
colleagues (Fujiwara, 2009; Fujiwara, Endo & Hutchinson, 2011; Fujiwara & Hutchinson,
2012) and a comparative study of mammalian carnivores (McClearn, 1985). So far,
however, general principles that extend across lineages, behaviours or anatomies remain
elusive. We consider this ambiguity’s effect on inferences about extinct taxa further below.
Muscle moment arm-joint angle dependenciesNext, we posed Question 2: are the moment arms of limb muscles maximized (for
antigravity/extensor muscles; or minimized in the case of antagonistic flexor muscles)
at mid-stance of locomotion (optimizing weight support), or at highly extended limb
orientations, as prior studies of dinosaurs inferred (e.g., Hutchinson et al., 2005)?
The peak extensor muscle moment arms that ostrich pelvic limb antigravity muscles
have about the hip joint lie close to a completely columnar (i.e., vertical or 0◦) hip angle,
approximately 5◦(Fig. 8), similar to prior results for Tyrannosaurus rex (Hutchinson
et al., 2005). Ostriches, however, do not stand or normally move with such extended
hip joints (Rubenson et al., 2007). We suspect this difference is because of their two
orders of magnitude smaller body size (65+ kg vs. ∼6,000+ kg) and hence the lack of
necessity for extreme postural changes to maintain lower muscle stresses in order to
maintain locomotor performance (Biewener, 1989; Biewener, 1990). However, ostriches
may also have a greater importance for non-isometric muscle force–length properties
in determining the limb orientation used (Figs. 6 and 7), as per the section above. Such
speculations can be tested better once such physiological data exist for ostrich muscles.
Our data also do not strongly support Smith et al.’s (2007) suggestion that hip extensor (or
other muscle) moment arms are at peak values toward the end of stance phase (Figs. 6–8).
Overall, unfortunately the factors that determine limb orientation in locomoting
ostriches, as the largest extant striding biped (and theropod dinosaur) available for study,
Hutchinson et al. (2015), PeerJ, DOI 10.7717/peerj.1001 31/52
remain inconclusive, leaving the application of such principles to reconstructing limb
orientations and locomotion in extinct theropods (e.g., Hutchinson et al., 2005; Gatesy,
Baker & Hutchinson, 2009) on shakier empirical and theoretical ground. However, this
uncertainty is not cause for cynicism. It is an opportunity for future improvement,
especially given the dearth of comparative studies that focus on how musculoskeletal
mechanics relate to limb orientation, and the technical difficulties inherent to measuring
or modelling muscle moment arms and other properties. Furthermore, quantitative
biomechanical studies of extant or fossil organisms should still be considered a major
step forward from past qualitative, intuitive or subjective functional studies.
How accurate and repeatable are estimates of ostrich limb musclemoment arms?Our study’s Question 3 dealt with a methodological comparison among the three main
studies of ostrich pelvic limb muscle moment arms. Agreement seems fair overall,
especially for flexion/extension actions. However, several main messages emerge from
our comparisons, some of which were also voiced by the other two studies of ostrich pelvic
limb moment arms (Smith et al., 2007; Bates & Schachner, 2012; here “S.E.A”. and “B.A.S”.).
Circumstantial support for all three methods’ accuracy additionally comes from tendon
travel measurements of cranial and caudal parts of the IL muscle in guineafowl by Carr et
al. (2011). General patterns (their Fig. 7) for the IL moment arms about the knee (concave
arc, peaking ∼100◦ knee angle in flexion) and the hip (increasing with extension) agree
reasonably well with these three ostrich studies (Figs. 12 and 16). However, all moment
arms for the ostrich IL muscle infer a switch to hip flexor action in strongly flexed poses,
and little or no levelling off of the moment arm curve at strong hip flexion angles.
Key areas of disagreement between our results and those of B.A.S. and/or S.E.A. include
occasionally major differences in if, or how, muscles switch between flexion and extension
(e.g., the AMB1 and AMB2, IC, ILFB about the hip; Fig. 9–11), whether certain muscles
are flexors or extensors (e.g., the OM; see “Implications for ostrich limb muscle function”
below), or the absolute magnitudes or relative trends in the data (e.g., our near-constant
moment arms about the ankle for the FDL and gastrocnemius muscles; Figs. 18 and 19; and
for the digital muscles, Fig. 20). We also found some differences in LAR and ab/adduction
moment arms about the hip for B.A.S.’s data, but these are likely explained by differing
muscle paths (e.g., via points and wrapping); see Figs. 12–15. Bates & Schachner (2012)
acknowledge that their model could not use both via points and wrapping surfaces for
the same muscle. This limitation explains the switch of their ILFB knee moment arm
from flexor to extensor with knee flexion (unlike Smith et al.’s (2007) data); our model
only exhibits this switch at extreme knee flexion (∼150◦ vs. 90◦; Fig. 16). Similarly, our
FDL’s ankle extensor moment arm was nearly constant (Fig. 18), as in Smith’s data, but the
modelling limitation might explain why Bates & Schachner’s (2012) moment arm curve
showed a stronger decrease with ankle flexion.
Contrastingly, the “M. femorotibialis medialis” (see Appendix ; equivalent to part of
our FMTL; Fig. 16, “FTE-Bates”) muscle’s moment arm increased with knee extension
in B.A.S.’s model, following a pattern similar to other knee extensors,’ but S.E.A. found a
Hutchinson et al. (2015), PeerJ, DOI 10.7717/peerj.1001 32/52
progressive decline of that muscle part’s (“FMTM-Smith”, Fig. 16) knee extensor moment
arm with knee extension. By comparing homologous muscles, it is evident that S.E.A.’s
experimental data (“FMTM-Smith”, Fig. 16) match our model somewhat (FMTL; i.e., solid
red and dashed blue lines in Fig. 16B). Furthermore, the two distal parts of FMTL (“FTE”
in Fig. 16; B.A.S. and S.E.A. data) match each other somewhat. However, only our model
represents the anatomy and function (weak knee flexion) of the actual medial head of
M. femorotibialis (FMTM; Fig. 16), which was not distinct in the data of B.A.S or S.E.A.
Thus, a combination of incorrect classification of muscles (Appendix ) and methodological
differences explains divergence between some of the three studies’ results. We noted similar
problems with misidentifications (IFE, ITC, ITM muscles; Appendix ) above in describing
the results shown in Fig. 10.
We raise the point here of the mistaken notion that tendon travel estimates of moment
arms are free of errors in joint centre estimation, which is often repeated (e.g., Smith et
al., 2007; Channon et al., 2010). This is only partly correct—by using the virtual work
principle that moment arms are equal to the change in musculotendinous length (“tendon
travel”) per unit of joint rotation, tendon travel experiments do minimize some errors in
measuring moment arms, but still require joint centre estimates to calculate joint rotations,
forming the traditional x-axis of moment arm vs. joint angle plots. Admittedly, all studies
may carry this burden of error; our model is different in using empirically measured
3D joint axes. Yet typical tendon travel experiments still introduce another error, by
introducing inevitable kinematic cross-talk between flexion/extension movements and
motions about other planes (i.e., limb joints that are manually flexed/extended through a
range of motion will also involve some motion in LAR and ab/adduction—see Rubenson
et al., 2007). Only the most rigorously constrained studies, which measure joint axes and
constrain motions to strictly flexion-extension planes, avoid this problem. Models like ours
and B.A.S.’s can explicitly avoid it. Our model’s data show that, because moment arms of
muscles co-vary with all joint angles (flex/extension, ab/adduction, long-axis rotation)
(Figs 12–15, S1–S4), changes in multiple joint angles at once (i.e., kinematic cross-talk) will
tend to produce different moment arms than changes in one angle at a time.
Bates & Schachner (2012: p.1342) inferred that, because their model’s outputs matched
experimental data, “predicted abduction/adduction and long-axis rotation moments are
good estimates.” We find some important differences between our results and those of
either or both studies that somewhat weaken this inference (Figs. 12–15). However, we
reiterate and celebrate that all three studies discussed here obtain broadly similar results
for most muscles, in particular emphasizing that moment arms are not constant for most
muscles. Furthermore, Smith et al. (2007) and Bates & Schachner (2012) noted limitations
similar to those mentioned above.
Some comparative data exist from studies of other ratites or more restricted datasets for
ostriches. Hutchinson (2004) provided estimates weighted by physiological cross-sectional
area (Aphys) of “antigravity” (extensor) muscle moment arms for a 2D model of an ostrich,
using the same specimen and hence congruent with our results. Alexander et al. (1979)
created a simple 2D geometric model of an ostrich whose limb dimensions were similar
Hutchinson et al. (2015), PeerJ, DOI 10.7717/peerj.1001 33/52
to ours (cf. their Table I and our Table 1), obtaining comparable muscle moment arm
measurements: femorotibialis 5.1 cm about the knee (ours ∼5 cm), gastrocnemius 3.8 cm
about the ankle (ours ∼4 cm), and digital flexors 3.2 cm about the MTP joint (ours
∼2 cm). This ostrich was 64% of the body mass of ours but had muscle masses about
85% of ours, helping to explain its ∼30% greater Aphys and Fmax values (in addition, surely,
to shorter muscle fascicles; Eqs. (1) and (2)), which are differences most likely attributable
to its wild-caught status as opposed to our specimen’s farm provenance.
Goetz et al. (2008) created a musculoskeletal model of an emu using a procedure grossly
similar to ours, and obtained similar results—e.g., ILFB muscle having the largest hip
extensor moment arm (but see Appendix ). Troy, Brown & Conzemius (2009) assumed
that only the IFE, ITM, ITCR and PIFML muscles (homologous to ours) would resist hip
adduction in their simplified emu model, but our analysis reveals that several more hip
abductors exist, namely the IL, ILFB, FCM/L and CFP muscle groups (Table 4; Figs. 14
and 15). See Lamas, Main & Hutchinson (2014) for more consideration of emu pelvic limb
muscle functions.
There are anatomical and methodological reasons to suggest that musculoskeletal
modelling approaches (this study and Bates & Schachner (2012)) can sometimes be
more reliable than tendon-travel-based empirical data (e.g., Smith et al., 2007; also
possibly Carr et al., 2011). First, the typical experimental method, as applied to date
with birds, removes surrounding muscles and replaces whole 3D muscle bellies with
quasi-2D strings (often lacking key “via points” or wrapping surfaces) that must alter
the lines of action and thus moment arms of the in situ muscles. The potential for such
alteration is experimentally testable, but existing studies of moment arms in various
species (especially humans) already give strong precedent for this inference: analogous
comparisons of “straight-line” 2D measurements (e.g., Jensen & Davy, 1975) vs. 3D
medical imaging or in situ measurements (e.g., Young, Scott & Loeb, 1993; Arnold & Delp,
2001) vs. anatomically-realistic 3D musculoskeletal models (Delp et al., 1999; Arnold et
al., 2000; Kargo & Rome, 2002; Brown et al., 2003b; Burkholder & Nichols, 2004; Blemker
& Delp, 2006; O’Neill et al., 2013) show better agreement between the latter two methods,
and areas where simple 2D measurements are imprecise or misleading. To be fair, poorly
designed musculoskeletal models can have the same problems—faithful representations of
anatomical geometry are vital for both methods.
Bates & Schachner (2012, their electronic supplementary material) note that their
model obtained an “extremely close match to the experimental data, particularly given
the level of intra-specific variation present in muscle moment arms for ostriches.” Smith
et al. (2007) did attribute some of their experimental variation to individual differences
in morphology that might alter moment arms, but as they noted some of the variation
may have instead been due to experimental error. Young, Scott & Loeb (1993), using a
rigorous, validated in situ experimental apparatus for muscles crossing cat ankle joints, still
found some individual variability that they attributed to muscles tethered by soft tissues as
opposed to those restricted by bony wrapping surfaces or travelling in simple straight lines
without any obstacles. We caution that these different sources of error need to be weighed
Hutchinson et al. (2015), PeerJ, DOI 10.7717/peerj.1001 34/52
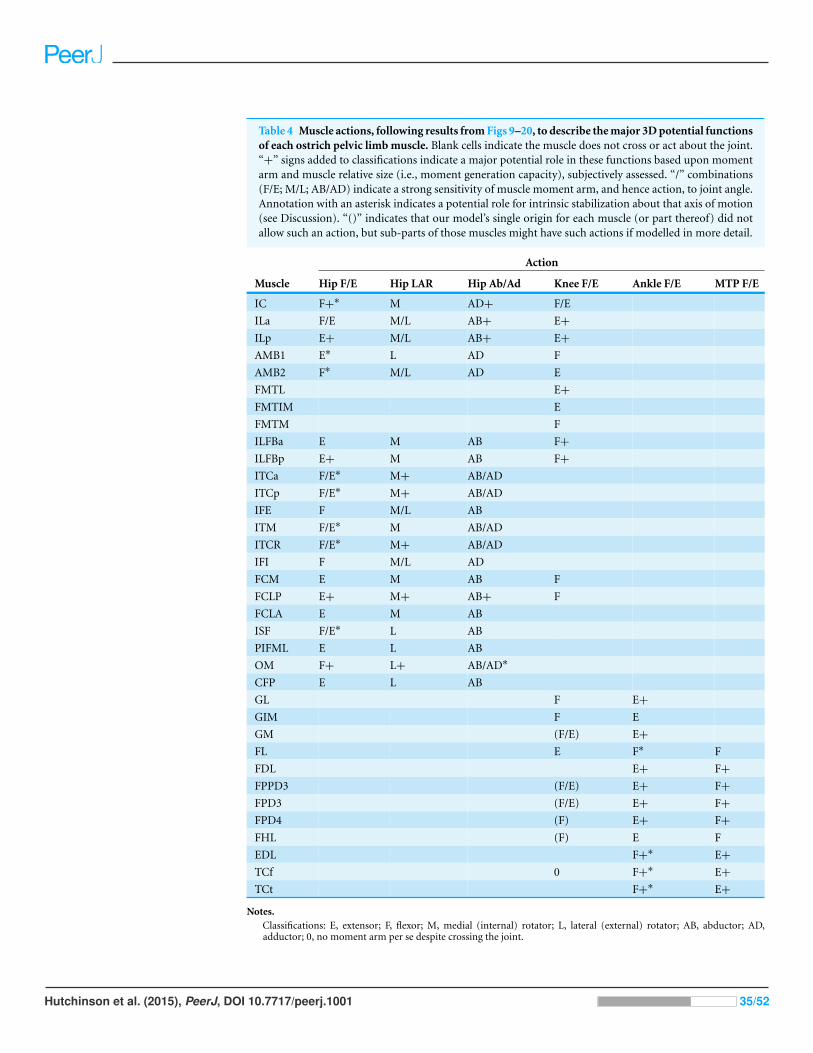
Table 4 Muscle actions, following results from Figs 9–20, to describe the major 3D potential functionsof each ostrich pelvic limb muscle. Blank cells indicate the muscle does not cross or act about the joint.“+” signs added to classifications indicate a major potential role in these functions based upon momentarm and muscle relative size (i.e., moment generation capacity), subjectively assessed. “/” combinations(F/E; M/L; AB/AD) indicate a strong sensitivity of muscle moment arm, and hence action, to joint angle.Annotation with an asterisk indicates a potential role for intrinsic stabilization about that axis of motion(see Discussion). “()” indicates that our model’s single origin for each muscle (or part thereof) did notallow such an action, but sub-parts of those muscles might have such actions if modelled in more detail.
Action
Muscle Hip F/E Hip LAR Hip Ab/Ad Knee F/E Ankle F/E MTP F/E
IC F+∗ M AD+ F/E
ILa F/E M/L AB+ E+
ILp E+ M/L AB+ E+
AMB1 E∗ L AD F
AMB2 F∗ M/L AD E
FMTL E+
FMTIM E
FMTM F
ILFBa E M AB F+
ILFBp E+ M AB F+
ITCa F/E∗ M+ AB/AD
ITCp F/E∗ M+ AB/AD
IFE F M/L AB
ITM F/E∗ M AB/AD
ITCR F/E∗ M+ AB/AD
IFI F M/L AD
FCM E M AB F
FCLP E+ M+ AB+ F
FCLA E M AB
ISF F/E∗ L AB
PIFML E L AB
OM F+ L+ AB/AD∗
CFP E L AB
GL F E+
GIM F E
GM (F/E) E+
FL E F∗ F
FDL E+ F+
FPPD3 (F/E) E+ F+
FPD3 (F/E) E+ F+
FPD4 (F) E+ F+
FHL (F) E F
EDL F+∗ E+
TCf 0 F+∗ E+
TCt F+∗ E+
Notes.Classifications: E, extensor; F, flexor; M, medial (internal) rotator; L, lateral (external) rotator; AB, abductor; AD,adductor; 0, no moment arm per se despite crossing the joint.
Hutchinson et al. (2015), PeerJ, DOI 10.7717/peerj.1001 35/52
separately; individual variability is an interesting biological reality, but experimental error
needs minimizing. We suspect that some of the issues raised above about unrealistic
representation of musculoskeletal anatomy in tendon travel experiments might be due
to experimental error. Bates & Schachner (2012) also raised the latter issue, finding that
trends evident in Smith et al.’s (2007) moment arm data would leave the hip extensors
too weak to balance the hip joint moments during stance phase, with a premature shift
to hip flexor action. Our results (Figs. 9–20) indicate that tendon travel measurements of
moment arms often exhibit steeper changes with joint angle in some cases, or constant
moment arms where models show good reason to suspect variable moment arms with
joint angle.
O’Neill et al.’s (2013; also Holowka & O’Neill, 2013) musculoskeletal modelling
and experimental analysis of chimpanzee pelvic limb moment arms came to similar
conclusions as we have here, concerning model vs. tendon travel estimates of moment
arms (see also Brown et al., 2003a; Brown et al., 2003b for horses). Importantly, they noted
that non-linear trends in moment arm vs. joint angle data are to be expected, so tendon
travel studies that enforce the fitting of largely linear (or simple polynomial) curves to
their data may introduce errors. O’Neill et al. (2013) also cautioned that (p. 3721) “the
3D orientation of the pelvis and thigh segments during tendon-excursion experiments
can have a significant effect on moment arm metrics.” Channon et al. (2010) used cubic
spline functions to characterize gibbon hindlimb muscle moment arms, presenting an
improvement over the method used for ostriches by Smith et al. (2007) and considering
some of the potential errors in tendon travel methods. Tightly controlled experiments with
cats (Young, Scott & Loeb, 1993) have shown good agreement with model-based moment
arm data (Burkholder & Nichols, 2004).
Nonetheless, there is room for improvement in all methodologies. In particular, human
experiments have shown that moment arms may depend on muscle activation levels
(Maganaris, 2004; Tsaopoulos et al., 2007), a phenomenon that few moment arm studies
have assimilated. Numerous studies have also shown that sarcomere or fibre length changes
in real 3D muscles, as opposed to line segments, may be highly heterogeneous and complex
(e.g., Blemker, Pinsky & Delp, 2005; Carr et al., 2011).
The accuracy of avian musculoskeletal models remains unresolved. Studies of moment
arms for ostriches and other avian species badly need stronger validation tests—ideally
3D, in vivo and across a range of behaviours—to test where different methods succeed
or fail. O’Neill et al. (2013) noted that model-based estimates of moment arms should
be less sensitive to the origins of muscles than to the insertions, and given that those
insertions tend to be more easily circumscribed in ostriches (as in chimpanzees), a focus
on improving the placement of muscle insertions could be powerful. At present, there
is no published gold standard measurement that the aforementioned studies can be
compared against, and thus it is unclear which estimates of moment arms are truly more
accurate and reliable than others. Our judgements above might prove to be incorrect.
We assume here, except where noted, that our moment arm estimates are generally an
improvement over previous studies’ because they are 3D, based on precise, subject-specific
Hutchinson et al. (2015), PeerJ, DOI 10.7717/peerj.1001 36/52
anatomical measurements of a single cadaver in situ, and incorporate modern data on the
3D complexity of avian limb joint axes. However, our assumption of improved accuracy
demands a test against a gold standard, with clear criteria for what a “good” agreement
between moment arm curves is; a question that no studies (including ours) have answered.
Model assumptions and potential refinementsSome simplifications of joint systems were necessary in our model but could be improved
with later iterations. The tibio-fibular articulation is slightly mobile in ostriches (Fuss,
1996) and other birds, but we maintained it as an immobile joint. Likewise, the (proximal;
see Chadwick et al., 2014; Regnault, Pitsillides & Hutchinson, 2014) patella surely translates
(and perhaps rotates) during knee flexion/extension in birds as in humans (e.g., Walker,
Rovick & Robertson, 1988; Suzuki et al., 2012) but we maintained it in the same resting
position (with respect to the femur), represented simply by a wrapping surface. Adding
such translation would influence the moment arm curves for knee extensor muscles. The
intertarsal (ankle) joint’s motions during swing phase (extreme dorsiflexion) seemed
unrealistic, laterally rotating the tarsometatarsus to a seemingly disarticulated position
(see Movie S1), but we kept this as-is in the model rather than invent a subjective solution,
as it would have minimal influence on our results here and maintained strict fidelity to
our anatomical and kinematic data. Future implementations of the model emphasizing
ankle joint mechanics (especially in the swing phase when dorsiflexion is prominent) may
need to adjust these kinematics. The proximal interphalangeal joint of digit III was kept
immobile in the model because our kinematic data lacked its angular motions, but the
model has the capacity to allow the joint to flex and extend if desired (Table 1; Hutchinson
et al., 2015), and could involve internal mechanisms such as those described by Schaller et
al. (2011) if necessary for research questions addressed with it.
Our model’s muscles were simplified, as the Methods and Text S1 Text explain. Our
digitizing procedure, performed in 2002, was simplistic (similar to that of Burkholder
& Nichols, 2004), whereas more recent techniques have fused CT and MRI imaging
modalities to produce quite accurate and complex 3D musculoskeletal models (e.g.,
Zarucco et al., 2006; Harrison et al., 2014). Real muscles have complex 3D structure but
we have simplified them into basic Hill model muscles of 2D structure. Internal tendons
were observed in some muscles (e.g., M. iliotrochantericus caudalis, Mm. gastrocnemii,
many digital flexors; Gangletal, 2004). The Hill model does not discretely represent these
features, which can affect muscle forces and gearing. Ligaments and other passive tissues
were not represented in our model, and these would be particularly important features
to consider in a complete dynamic model, as Haughton (1864) suggested and Schaller
et al. (2009) demonstrated experimentally. Finally, a test of the validity of our moment
arm estimates against a “gold standard” empirical measurement (see above) with explicit
criteria for an acceptable level of precision would be valuable.
Yet like any model, simple or complex, our model is a useful starting point for a
continually iterative process of improvement (enhanced by the open format of our model;
Hutchinson et al., 2015) that progressively approximates reality. It has the advantage of
Hutchinson et al. (2015), PeerJ, DOI 10.7717/peerj.1001 37/52
being able to estimate muscle forces, moments, and length changes that are unlikely or
impossible to be measurable in vivo, especially simultaneously across a full stride.
Implications for ostrich limb muscle functionTable 4 shows our classification of the major actions of ostrich pelvic limb muscles (also
see Lamas, Main & Hutchinson (2014) for emu muscles). This approach, as opposed
to the classical perspective in comparative anatomy and biomechanics, emphasizes the
three-dimensional nature of avian limbs and the capacity of muscles to generate moments
about many joints and degrees of freedom (see also the categorization for cat ankle muscles
provided by Young, Scott & Loeb (1993); also model-based assessments using isometric
force-fields by Kargo & Rome (2002) and endpoint forces by Burkholder & Nichols (2004)).
Standard functional anatomy papers tend to emphasize flexion/extension and only present
other actions (or any actions about other joints than those deemed to be the main joints
of action) in a seemingly arbitrary fashion (e.g., Smith et al., 2007: Table 2; cf. our Table 4),
with at least the implicit assumption that non-parasagittal actions are less important. Our
approach also reveals how the functions of some muscles have been misclassified before (or
remain uncertain), for ostriches and perhaps for other avian species—to the degree that
ostriches are representative of ancestral muscle functions, which remains to be determined.
The degree of uncertainty about avian pelvic limb muscle function particularly applies to
3D actions about the hip joint; many muscles have actions (e.g., flexion/extension) that
switch depending on the joint angles adopted.
Examples of somewhat surprising 3D actions of hip muscles include the M. obturatorius
medialis (OM), which we find to mainly fulfill a lateral rotator and flexor action at the hip,
whereas Smith et al. (2006), Smith et al. (2007)), Bates & Schachner (2012), Bates, Benson &
Falkingham (2012), Bates et al. (2012) favour an extensor action of this muscle (in addition
to lateral rotation) in ostriches and other archosaurs. In the model of B.A.S., this seems
to be at least partly due to a distal insertion of the OM muscle on the femur, rather than
very proximally onto the trochanteric crest Gangletal, 2004; Zinoviev, 2006. Furthermore,
some “antigravity muscles” act in one direction synergistically with other muscles, resisting
gravity, but in other direction(s) they act antagonistically, requiring greater moments from
other “antigravity” muscles. Clear examples include the PIFML and CFP muscles, which
are presumably active in hip extension but incur lateral rotator and abductor moments
about the hip (Table 4). These muscles probably oppose other antigravity muscles such
as the ITC in medial rotation, whereas they would oppose potential hip extensors and
adductors such as AMB1 (cf. moment data in Rubenson et al., 2011: Fig. 7), indicating the
complex dynamics of hip musculature.
The analysis of Rubenson et al. (2011; Fig. 7) indicates that hip adduction, not abduc-
tion, must be resisted during stance phase in locomoting ostriches, and thus abductor
muscle activity is predicted, a moment that many hip extensors create anyway. However,
hip adduction capacity is far more limited—only the IC, AMB1, 2 and IFI muscles have
clear actions in hip adduction. (Smith et al. (2006): Table 2) assigned adductor actions
to other muscles such as the flexor cruris (FC) heads, PIFML and OM whereas we find
Hutchinson et al. (2015), PeerJ, DOI 10.7717/peerj.1001 38/52
these to be abductors. Indeed, the actions of the two heads of AMB may oppose each
other (Table 4), so it would be interesting to know how they are coordinated. The ITC
muscle’s parts have clear roles in medial rotation, but their actions in flexion/extension
vary with limb posture (see also Gatesy, 1994), rendering it less clear whether (or when)
they play a predominant hip extensor (e.g., Rubenson et al., 2006) or hip flexor (e.g., Smith
et al., 2006; Smith et al., 2007) role in ostriches or other birds. How any birds balance
this complex interaction of long-axis and ab/adductor moments at the hip or other
joints remains almost unexplored (but see Gatesy, 1994), yet modelling (and simulation)
approaches such as ours offer one way to tease apart the complexity. Bates & Schachner
(2012) found that Alligator and Struthio had similar hip extensor moment arms but there
were large abduction and small adduction moment arms in their ostrich, along with large
long-axis rotation moment arms. The functional and evolutionary implications of these
differences remain unclear, and dependent on understanding force balance about the hip
joint in extant archosaurs such as Struthio.
Complex function is not restricted to proximal muscles, however. Complex anatomy of
distal limb muscles is a pernicious problem in avian locomotor biomechanics, and difficult
to render realistically in biomechanical models such as ours. As the Text S1 describes, we
could not model all origins (or subdivided tendons; e.g., digital flexors) of all muscle parts.
Indeed, in some cases the origins are diffuse—e.g., M. gastrocnemius medialis originates
mainly from the medial side of the proximal tibiotarsus, but the surrounding fascia it is
attached to continue proximally past the knee joint, via the proximal patella and other
structures. It is not clear if some of these distal muscles exert important moments about the
knee joint (some forces may be going directly to their distal origins from the tibiotarsus),
and the dynamics of the patella (not represented in our model except as a static wrapping
surface) further complicates matters. Thus, it is unclear how forces are balanced across
ostrich (or other avian) knees, complicating comparisons with other species (e.g., Higham,
Biewener & Wakeling, 2008; Andrada et al., 2013).
Young, Scott & Loeb (1993) and Johnson et al. (2008) noted that some muscles in cat and
rat hindlimbs seemed to have intrinsically stabilizing properties, shifting from flexor to
extensor moment arms in a linear fashion with increasing joint flexion. Eight modelled
ostrich limb muscles also show this pattern: the AMB1, AMB2, IC, ITCa, ITCp, ITM,
ITCR and ISF exhibit stabilization function in flexion-extension (Figs. 9 and 10). Weaker
evidence for self-stabilization is present for the OM muscle in hip ab/adduction (Fig. 14)
and the four ankle flexors in flexion/extension (TCf, TCt, EDL, and FL; Fig. 18), so any
self-stabilization properties must be interpreted as being largely restricted to the hip’s
flexion-extension function (see also Table 4). Judging from these hip muscles’ paths,
their long lines of action (due to the elongate pelvis and limb) running close to the
hip seem to predispose them to these intrinsic stabilization properties. These patterns
deserve more examination in a comparative context with other species in the future—for
example, similar hip muscles show similar moment arm patterns that hint at intrinsic
stabilization in various extinct dinosaurs and other archosaurian reptiles (Hutchinson et al.,
Hutchinson et al. (2015), PeerJ, DOI 10.7717/peerj.1001 39/52
2005; Hutchinson et al., 2008; Bates & Schachner, 2012; Bates, Benson & Falkingham, 2012;
Bates et al., 2012; Maidment et al., 2013).
Musculoskeletal models of limb function: past, present and futureA wide variety of studies have used musculoskeletal models to reconstruct limb function
in extant and extinct animals, but there remains little agreement for standards of model
design, analysis and validation. The same software (SIMM) or other packages (GaitSym,
Anybody, varieties of Adams, etc.) has been used to estimate limb muscle moment arms
in other extant species including chimpanzees and other hominins (O’Neill et al., 2013;
Holowka & O’Neill, 2013; and references therein), horses (Brown et al., 2003a; Brown
et al., 2003b; Zarucco et al., 2006; Harrison et al., 2010), domestic cats (Burkholder &
Nichols, 2004), rats (Johnson et al., 2008), emus (Goetz et al., 2008), Alligator and ostriches
(Bates & Schachner, 2012), frogs (Kargo & Rome, 2002; Kargo, Nelson & Rome, 2002),
cockroaches (Full & Ahn, 1995) and others, in addition to simpler past approaches (e.g., for
small mammals, McClearn, 1985). It is not clear which software packages most accurately
estimate muscle moment arms, but our comparisons with the data from Bates & Schachner
(2012) suggest some advantages of our approach. Regardless, comparative biologists
seeking to harness the power of musculoskeletal modelling techniques have much to learn
from the considerable progress made in analyzing and validating similar models of human
limb muscles (e.g., Delp et al., 1990; Delp & Zajac, 1992; Delp et al., 1999; Arnold et al., 2000;
Arnold & Delp, 2001; Holzbaur, Murray & Delp, 2005; Nikooyan et al., 2011).
There has been a recent flourishing of musculoskeletal models of extinct taxa, especially
hominins (e.g., Australopithecus in Nagano et al., 2005) and dinosaurs or other archosaurs.
Theropod dinosaurs have featured prominently, including Allosaurus, Struthiomimus
(Bates & Schachner, 2012; Bates, Benson & Falkingham, 2012), Tyrannosaurus (Hutchinson
et al., 2005), and Velociraptor (Hutchinson et al., 2008), among other taxa (Allen,
2010). More recently, sauropodomorph (Mallison, 2010a; Mallison, 2010b) as well as
ornithischian dinosaurs have enjoyed a new focus (Mallison, 2010c; Bates et al., 2012;
Fujiwara & Hutchinson, 2012; Maidment et al., 2013). Other extinct taxa studied, for
example, includethe stem-crocodile Poposaurus (Bates & Schachner, 2012) and related
taxa (Molnar, 2014), a pterosaur (Costa, Rocha-Barbosa & Kellner, 2013) and the early
tetrapod Ichthyostega (Pierce, Clack & Hutchinson, 2012). The detail and apparent effort
put into these models varies widely, often depending on the research questions being
asked. It remains debatable how detailed such models of extinct taxa need to be in order
to be sufficiently accurate—are cruder models good enough for strictly comparative
work? There are clear analogies with the usage of finite element models (e.g., Rayfield,
2007)—often, it is argued that simpler models are sufficient for simple comparative
questions, whereas more complex questions such as bone failure (or, for musculoskeletal
models, locomotor dynamics or performance ?) require more realistic models.
Whether the focus is on limb joint ranges of motion, muscle moment arms, or dynamic
simulation, there is a need for more scrutiny of models of extant taxa to establish how
accurate and reliable these modelling approaches truly are, and ultimately a renewed
Hutchinson et al. (2015), PeerJ, DOI 10.7717/peerj.1001 40/52
examination and synthesis of those findings with past studies of extinct taxa. Studies using
models to estimate muscle moment arms need to consider not only this, but also how or
whether those parameters actually matter for particular muscles, joints, behaviours or
species (see also Bates & Schachner, 2012; Bates et al., 2012; Maidment et al., 2013).
To the degree that general principles of moment arm usage exist, they should clarify
under what circumstances a moment arm is optimized to perform a certain function. An
understanding of this link between muscle mechanics, kinematics and moment arms could
link the disparate palaeobiological/comparative studies on limb joint ranges of motion
and orientations (e.g., Mallison, 2010a; Mallison, 2010b; Mallison, 2010c; Pierce, Clack &
Hutchinson, 2012; Molnar, 2014) with those of limb muscle moment arms (Hutchinson et
al., 2005; Hutchinson et al., 2008; Allen, 2010; Bates & Schachner, 2012; Bates et al., 2012;
Fujiwara & Hutchinson, 2012; Maidment et al., 2013). Such a synthesis could lead to a
robust, sustainable future for comparative musculoskeletal modelling and simulation, and
new insights into the evolution of musculoskeletal function and locomotor dynamics.
ACKNOWLEDGEMENTSWe thank Peter Loan for kind and patient technical support. Thanks to Aaron Daub for his
proficient assistance in the ostrich digitization and dissection. This paper benefited from
discussions with F Clay Anderson, Allison Arnold, Silvia Blemker, Steve Gatesy, and Karl
Bates, as well as with members of the Stanford Neuromuscular Biomechanics Laboratory
and the Structure & Motion Laboratory at The Royal Veterinary College. We graciously
appreciate constructive reviews by Robert Kambic and Karl Bates, and comments from
Diego Sustaita, that improved the manuscript.
APPENDIXA few observations from our dissections revealed differences in muscle identifications from
previous studies, which themselves have had much disagreement (reviewed in Gangletal,
2004; Zinoviev, 2006). However, generally our findings agree well with the excellent study
by Gangletal (2004). Zinoviev (2006) made some amendments to the latter study that our
dissections independently have confirmed.
First, rather than treat “M. pectineus” as a novel muscle unrelated to M. ambiens (e.g.,
Mellett, 1994; Gangletal, 2004) or as a part of M. femorotibialis medialis (= FMTM or
“internus”; Zinoviev, 2006), we refer to the muscle here as M. ambiens 1 (AMB1; for its
pubic origin as in most other Reptilia; Hutchinson, 2002) and refer to the muscle with the
derived iliac origin as M. ambiens 2 (AMB2; i.e., the dorsal head) (Table 2). We do not
intend for this to be a formal nomenclatural change but it is used for convenience within
this paper and to suggest that the homologies (and thus formal nomenclature) of these
two muscle heads deserve reconsideration. Our nomenclature avoids confusion with the
mammalian M. pectineus which has no homology with these muscles, and maintains
the same nomenclature for the homologous M. ambiens (whether one or two parts)
in extant Sauropsida. We deem these homologies and nomenclature marginally more
parsimonious than other interpretations (reviewed by Zinoviev, 2006), the latest of which
(favoured by Zinoviev (2006)) requires loss of the origin of M. ambiens from the pectineal
Hutchinson et al. (2015), PeerJ, DOI 10.7717/peerj.1001 41/52
(preacetabular) process that is plesiomorphically present in birds (Hutchinson, 2002) and
gain of a new head of the FMTM muscle (the “pars pectineus”). In our scenario, mainly a
new head of M. ambiens (AMB2) is required; a phenomenon that is not unknown in other
birds and is pervasive in Crocodylia (Hutchinson, 2002).
Second, we agree with Zinoviev (2006) that Gangletal (2004) confused the two crura
of “M. iliofemoralis externus” with M. iliotrochantericus caudalis, which engendered
further errors in identifying other muscles. We have confirmed this from dissections of
three additional ostrich cadavers, and hence the position of our M. iliotrochantericus
caudalis (ITCa, ITCp in Table 2) differs from theirs (also data in Smith et al., 2006; Smith
et al., 2007). We consider M. iliofemoralis externus (IFE) to be weakly differentiated from
the latter muscle, also intimated by Gangletal (2004: p. 113; and Gadow, 1880), but we
represent it in our model as a separate head (IFE), again agreeing with Zinoviev (2006).
This is corroborated by the main muscle in question (ITC) having a large internal tendon,
preacetabular position (between the heads of Mm. iliotibiales; IC and IL), and overlaying
Mm. iliotrochanterici medius et cranialis (ITM, ITCR), which are traits diagnostic of
M. iliotrochantericus caudalis, not “M. iliofemoralis externus” as in Gangletal (2004).
This then explains why the latter study did not find M. iliotrochantericus medius—it
identified it as M. iliotrochantericus caudalis, noting some fusion and distolateral
insertion with M. iliotrochantericus cranialis, which are diagnostic of M. iliotrochantericus
medius instead. Hence our M. iliotrochantericus medius (ITM) corresponds to their “M.
iliotrochantericus caudalis”; but our M. iliotrochantericus cranialis (ITCR) corresponds to
theirs. Smith et al. (2006) perpetuated the errors caused by Gangl et al.’s misidentifications,
which complicates comparisons with our data (see our ‘Results’ section, Fig. 10). Bates &
Schachner (2012) appear to have avoided these errors.
A third point of discordance between this study and Gangletal’s (2004) is that we
consider the latter study’s “Mm. femorotibiales externus et medius” to be two parts
(superficial and deep) of M. femorotibialis lateralis (FMTL; vide Zinoviev, 2006),
because this avian muscle typically originates on the lateral surface of the femur, deep
to M. iliotibialis lateralis (IL), as the former two parts do. Gangletal’s (2004) “Mm.
femorotibiales internus et accessorius” then correspond to our Mm. femorotibiales
medialis et intermedius (FMTM, FMTIM), because their topological connections more
closely match these muscles in birds. Zinoviev (2006) again gave a detailed correction
that we concur with, whereas Smith et al. (2006), Smith et al. (2007) and possibly Bates &
Schachner (2012) used Gangletal’s (2004) misidentifications.
Accepting these identifications renders ostrich anatomy more similar to other birds:
M. iliotrochantericus caudalis remains large and originating dorsal to M. iliotrochanteri-
cus medius, which originates cranial to M. iliotrochantericus cranialis, and the insertions
of these muscles retain similar proximodistal positions (the first on the lateral surface of
the proximal femur, the second two sequentially distal on the craniolateral edge of the
trochanteric crest; Rowe, 1986; Hutchinson, 2002). Furthermore, Mm. femorotibiales in our
view then match avian anatomical positions more reasonably.
Hutchinson et al. (2015), PeerJ, DOI 10.7717/peerj.1001 42/52
However, ostrich pelvic muscle anatomy is still derived in the large relative size of M.
iliofemoralis internus (IFI; “cuppedicus” of Rowe, 1986; Table 2) and the two distinct heads
of M. ambiens (i.e., the novel dorsal head, AMB2). Additionally, M. iliotrochantericus
medius (ITM) is slightly derived in having a markedly more dorsal position (required
by the dorsally shifted M. ambiens and M. iliofemoralis internus (IFI)) than in typical
neornithines, and Mm. femorotibiales have strong division of the lateral head (FMTL)
into two parts, but not a novel “accessorius” head. Furthermore, M. obturatorius medialis
(OM) in ostriches is extraordinary in its mostly lateral origin, whereas normally in birds it
is confined to the inside of the pelvis.
Similar problems with muscle identifications vex other studies of ratite limb form and
function. Patak & Baldwin’s (1998) anatomical description of emu pelvic limb muscles was
used to formulate Goetz et al.’s (2008) musculoskeletal model of an emu, incorporating
analogous errors that deserve correction in future studies (see Lamas, Main & Hutchinson,
2014). The issues outlined in this appendix drive home the point that a firm grasp of
avian myology, ideally based upon understanding of fundamental groups of muscles
likely present in the ancestral neornithine bird and hence homologous among its living
descendants, is critical for any biomechanical and comparative analyses of muscle form,
function and evolution (see also Zinoviev, 2006).
ADDITIONAL INFORMATION AND DECLARATIONS
FundingThis work was completed as part of a postdoctoral fellowship from the National Science
Foundation awarded to John R. Hutchinson in 2001, and subsequent funding from the
BBSRC, grant number BB/I02204X/1, as well as the Leverhulme Trust (grant number
RPG-2013-108). Additional support was provided by the Biomechanical Engineering
Division at Stanford University, and from The Royal Veterinary College, Department of
Comparative Biomedical Sciences. The funders had no role in study design, data collection
and analysis, decision to publish, or preparation of the manuscript.
Grant DisclosuresThe following grant information was disclosed by the authors:
National Science Foundation.
BBSRC: BB/I02204X/1.
Leverhulme Trust: RPG-2013-108.
Competing InterestsJohn R. Hutchinson is an Academic Editor for PeerJ.
Author Contributions• John R. Hutchinson and Jeffery W. Rankin conceived and designed the experiments,
performed the experiments, analyzed the data, wrote the paper, prepared figures and/or
tables, reviewed drafts of the paper.
Hutchinson et al. (2015), PeerJ, DOI 10.7717/peerj.1001 43/52
• Jonas Rubenson conceived and designed the experiments, performed the experiments,
contributed reagents/materials/analysis tools, wrote the paper, reviewed drafts of the
paper.
• Kate H. Rosenbluth conceived and designed the experiments, performed the experi-
ments, analyzed the data, reviewed drafts of the paper.
• Robert A. Siston conceived and designed the experiments, performed the experiments,
contributed reagents/materials/analysis tools, reviewed drafts of the paper.
• Scott L. Delp conceived and designed the experiments, contributed
reagents/materials/analysis tools, reviewed drafts of the paper.
Data DepositionThe following information was supplied regarding the deposition of related data:
Figshare: http://dx.doi.org/10.6084/m9.figshare.1409443.
Supplemental InformationSupplemental information for this article can be found online at http://dx.doi.org/
10.7717/peerj.1001#supplemental-information.
REFERENCESAbourachid A. 2001. Kinematic parameters of terrestrial locomotion in cursorial (ratites),
swimming (ducks), and striding birds (quail and guinea fowl). Comparative Biochemistry andPhysiology A 131:113–119 DOI 10.1016/S1095-6433(01)00471-8.
Abourachid A, Renous S. 2000. Bipedal locomotion in ratites (Paleognatiform) [sic]: examples ofcursorial birds. Ibis 142:538–549 DOI 10.1111/j.1474-919X.2000.tb04455.x.
Abourachid A, Hackert R, Herbin M, Libourel PA, Lambert F, Gioanni H, Provini P, Blazevic P,Hugel V. 2011. Bird terrestrial locomotion as revealed by 3D kinematics. Zoology 114:360–368DOI 10.1016/j.zool.2011.07.002.
Alexander R, McN, Maloiy GMO, Njau R, Jayes AS. 1979. Mechanics of running of the ostrich(Struthio camelus). Journal of Zoology 187:169–178 DOI 10.1111/j.1469-7998.1979.tb03941.x.
Allen V. 2010. The evolution of avian hindlimb conformation and locomotor function. PhDdissertation, The Royal Veterinary College, University of London.
Andrada E, Nyakatura JA, Bergmann F, Blickhan R. 2013. Adjustments of global and localhindlimb properties during terrestrial locomotion of the common quail (Coturnix coturnix).Journal of Experimental Biology 216:3906–3916 DOI 10.1242/jeb.085399.
Arnold AS, Delp SL. 2001. Rotational moment arms of the medial hamstrings and adductors varywith femoral geometry and limb position: implications for the treatment of internally rotatedgait. Journal of Biomechanics 34:437–447 DOI 10.1016/S0021-9290(00)00232-3.
Arnold AS, Salinas S, Asakawa DJ, Delp SL. 2000. Accuracy of muscle moment arms estimatedfrom MRI-based musculoskeletal models of the lower extremity. Computer Aided Surgery5:108–119 DOI 10.3109/10929080009148877.
Baker AJ, Haddrath O, McPherson JR, Cloutier A. 2014. Genomic support for a moa-tinamouclade and adaptive morphological convergence in flightless ratites. Molecular Biology andEvolution In Press.
Hutchinson et al. (2015), PeerJ, DOI 10.7717/peerj.1001 44/52
Bates KT, Benson RB, Falkingham PL. 2012. A computational analysis of locomotor anatomyand body mass evolution in Allosauroidea (Dinosauria: Theropoda). Paleobiology 38:486–507DOI 10.1666/10004.1.
Bates KT, Maidment SC, Allen V, Barrett PM. 2012. Computational modelling of locomotormuscle moment arms in the basal dinosaur Lesothosaurus diagnosticus: assessingconvergence between birds and basal ornithischians. Journal of Anatomy 220:212–232DOI 10.1111/j.1469-7580.2011.01469.x.
Bates KT, Schachner ER. 2012. Disparity and convergence in bipedal archosaur locomotion.Journal of the Royal Society Interface 9:1339–1353 DOI 10.1098/rsif.2011.0687.
Bennett MB, Taylor GC. 1995. Scaling of elastic strain energy in kangaroos and the benefits ofbeing big. Nature 378:56–59 DOI 10.1038/378056a0.
Biewener AA. 1989. Scaling body support in mammals: limb posture and muscle mechanics.Science 245:45–48 DOI 10.1126/science.2740914.
Biewener AA. 1990. Biomechanics of mammalian terrestrial locomotion. Science 250:1097–1103DOI 10.1126/science.2251499.
Blemker SS, Delp SL. 2006. Rectus femoris and vastus intermedius fiber excursionspredicted by three-dimensional muscle models. Journal of Biomechanics 39:1383–1391DOI 10.1016/j.jbiomech.2005.04.012.
Blemker SS, Pinsky PM, Delp SL. 2005. A 3D model of muscle reveals the causesof nonuniform strains in the biceps brachii. Journal of Biomechanics 38:657–665DOI 10.1016/j.jbiomech.2004.04.009.
Bottema O, Roth B. 1990. Theoretical kinematics. vol. 1. Mineola: Dover Publications.
Brassey CA, Holdaway RN, Packham AG, Anne J, Manning PL, Sellers WI. 2013b. More thanone way of being a moa: differences in leg bone robustness map divergent evolutionarytrajectories in Dinornithidae and Emeidae (Dinornithiformes). PLoS ONE 8(12):e82668DOI 10.1371/journal.pone.0082668.
Brassey CA, Kitchener AC, Withers PJ, Manning PL, Sellers WI. 2013a. The role ofcross-sectional geometry, curvature, and limb posture in maintaining equal safety factors: acomputed tomography study. Anatomical Record 296:395–413 DOI 10.1002/ar.22658.
Brown NAT, Pandy MG, Buford WL, Kawcak CE, McIlwraith CW. 2003a. Moment arms aboutthe carpal and metacarpophalangeal joints for flexor and extensor muscles in equine forelimbs.American Journal of Veterinary Research 64:351–357 DOI 10.2460/ajvr.2003.64.351.
Brown NAT, Pandy MG, Kawcak CE, McIlwraith CW. 2003b. Force- and moment-generatingcapacities of muscles in the distal forelimb of the horse. Journal of Anatomy 203:101–113DOI 10.1046/j.1469-7580.2003.00206.x.
Burkholder TJ, Nichols TR. 2004. Three-dimensional model of the feline hindlimb. Journal ofMorphology 261:118–129 DOI 10.1002/jmor.10233.
Cappozzo A, Catani F, Della Croce F, Leardini A. 1995. Position and orientation in space of bonesduring movement: anatomical frame definition and determination. Clinical Biomechanics10:171–178 DOI 10.1016/0268-0033(95)91394-T.
Carr JA, Ellerby DJ, Rubenson J, Marsh RL. 2011. Mechanisms producing coordinated functionacross the breadth of a large biarticular thigh muscle. Journal of Experimental Biology214:3396–3404 DOI 10.1242/jeb.060319.
Chadwick KP, Regnault S, Allen V, Hutchinson JR. 2014. Three-dimensional anatomy of theostrich (Struthio camelus) knee joint. PeerJ 2:e706 DOI 10.7717/peerj.706.
Hutchinson et al. (2015), PeerJ, DOI 10.7717/peerj.1001 45/52
Channon AJ, Crompton RH, Gunther MM, Vereecke EE. 2010. Muscle moment arms of thegibbon hind limb: implications for hylobatid locomotion. Journal of Anatomy 216:446–462DOI 10.1111/j.1469-7580.2009.01209.x.
Costa FR, Rocha-Barbosa O, Kellner AWA. 2013. A biomechanical approach on the optimalstance of Anhanguera piscator (Pterodactyloidea) and its implications for pterosaur gait onland. Historical Biology 26:582–590 DOI 10.1080/08912963.2013.807253.
Cracraft J, Clarke J. 2001. The basal clades of modern birds. In: Gauthier JA, Gall LF, eds. Newperspectives on the origin and early evolution of birds: proceedings of the international symposiumin honor of John H. Ostrom. New Haven: Peabody Mus Nat Hist, 143–156.
Daley MA, Usherwood JR. 2010. Two explanations for the compliant running paradox: reducedwork of bouncing viscera and increased stability in uneven terrain. Biology Letters 6:418–421DOI 10.1098/rsbl.2010.0175.
Delp SL, Hess WE, Hungerford DS, Jones LC. 1999. Variation of rotation moment arms with hipflexion. Journal of Biomechanics 32:493–501 DOI 10.1016/S0021-9290(99)00032-9.
Delp SL, Loan JP. 1995. A graphics-based software system to develop and analyzemodels of musculoskeletal structures. Computers in Biology and Medicine 25:21–34DOI 10.1016/0010-4825(95)98882-E.
Delp SL, Loan JP. 2000. A computational framework for simulating and analyzinghuman and animal movement. IEEE Computing in Science and Engineering 2:46–55DOI 10.1109/5992.877394.
Delp SL, Loan JP, Hoy MG, Zajac FE, Topp EL, Rosen JM. 1990. An interactive graphics-basedmodel of the lower extremity to study orthopaedic surgical procedures. IEEE Transactions inBiomedical Engineering 37:757–767 DOI 10.1109/10.102791.
Delp SL, Zajac FE. 1992. Force- and moment-generating capacity of lower-extremity musclesbefore and after tendon lengthening. Clinical Orthopaedics 284:247–259.
Fedak MA, Heglund NC, Taylor CR. 1982. Energetics and mechanics of terrestrial locomotion. II.Kinetic energy changes of the limbs and body as a function of speed and body size in birds andmammals. Journal of Experimental Biology 79:23–40.
Fedak MA, Seeherman HJ. 1979. Reappraisal of energetics of locomotion shows identicalcost in bipeds and quadrupeds including ostrich and horse. Nature 282:713–716DOI 10.1038/282713a0.
Fujiwara SI. 2009. Olecranon orientation as an indicator of elbow joint angle in the stance phase,and estimation of forelimb posture in extinct quadruped animals. Journal of Morphology270:1107–1121 DOI 10.1002/jmor.10748.
Fujiwara SI, Endo H, Hutchinson JR. 2011. Topsy-turvy locomotion: biomechanicalspecializations of the elbow in suspended quadrupeds reflect inverted gravitational constraints.Journal of Anatomy 219:176–191 DOI 10.1111/j.1469-7580.2011.01379.x.
Fujiwara SI, Hutchinson JR. 2012. Elbow joint adductor moment arm as an indicator of forelimbposture in extinct quadrupedal tetrapods. Proceedings of the Royal Society B: Biological Sciences279:2561–2570 DOI 10.1098/rspb.2012.0190.
Full R, Ahn A. 1995. Static forces and moments generated in the insect leg: comparison of athree-dimensional musculo-skeletal computer model with experimental measurements. Journalof Experimental Biology 198:1285–1298.
Fuss FK. 1996. Tibiofibular junction of the South African ostrich (Struthio camelus australis).Journal of Morphology 227:213–226DOI 10.1002/(SICI)1097-4687(199602)227:2<213::AID-JMOR7>3.0.CO;2-9.
Hutchinson et al. (2015), PeerJ, DOI 10.7717/peerj.1001 46/52
Gadow H. 1880. Zur vergleichenden Anatomie der Muskulatur des Beckens und der hinterenGliedmasse der Ratiten. Jena: Gustav Fischer.
Gangl D, Weissengruber GE, Egerbacher M, Forstenpointer G. 2004. Anatomical descriptionof the muscles of the pelvic limb in the ostrich (Struthio camelus). Anatomia HistologiaEmbryologia 33:100–114 DOI 10.1111/j.1439-0264.2003.00522.x.
Gatesy SM. 1990. Caudofemoral musculature and the evolution of theropod locomotion.Paleobiology 16:170–186.
Gatesy SM. 1994. Neuromuscular diversity in archosaur deep dorsal thigh muscles. Brain Behaviorand Evolution 43:1–14 DOI 10.1159/000113619.
Gatesy SM. 1995. Functional evolution of the hindlimb and tail from basal theropods to birds.In: Thomason JJ, ed. Functional morphology in vertebrate paleontology. Cambridge: CambridgeUniversity Press, 219–234.
Gatesy SM, Baker M, Hutchinson JR. 2009. Constraint-based exclusion of limb poses forreconstructing theropod dinosaur locomotion. Journal of Vertebrate Paleontology 29:535–544DOI 10.1671/039.029.0213.
Gatesy SM, Biewener AA. 1991. Bipedal locomotion—effects of speed, size and limb posture inbirds and humans. Journal of Zoology 224:127–147 DOI 10.1111/j.1469-7998.1991.tb04794.x.
Goetz JE, Derrick TR, Pedersen DR, Robinson DA, Conzemius MG, Baer TE, Brown TD. 2008.Hip joint contact force in the emu (Dromaius novaehollandiae) during normal level walking.Journal of Biomechanics 41:770–778 DOI 10.1016/j.jbiomech.2007.11.022.
Grood ES, Suntay WJ. 1983. A joint coordinate system for the clinical description ofthree-dimensional motions: application to the knee. Journal of Biomechanical Engineering105:136–144 DOI 10.1115/1.3138397.
Gunther M, Keppler V, Seyfarth A, Blickhan R. 2004. Human leg design: optimalaxial alignment under constraints. Journal of Mathematical Biology 48:623–646DOI 10.1007/s00285-004-0269-3.
Harrison SM, Whitton RC, Kawcak CE, Stover SM, Pandy MG. 2010. Relationship betweenmuscle forces, joint loading and utilization of elastic strain energy in equine locomotion. TheJournal of Experimental Biology 213(23):3998–4009 DOI 10.1242/jeb.044545.
Harrison SM, Whitton RC, Kawcak CE, Stover SM, Pandy MG. 2014. Evaluation of asubject-specific finite-element model of the equine metacarpophalangeal joint underphysiological load. Journal of Biomechanics 47:65–73 DOI 10.1016/j.jbiomech.2013.10.001.
Haughton R. 1864. On the muscular mechanism of the leg of the ostrich. Annals & Magazine ofNatural History 3rd Series 15:262–272.
Haughton R. 1867a. Notes on animal mechanics. No. X. Muscular anatomy of the emu (Dromaeusnovae hollandiae). Proceedings of the Irish Academy of Science 9:487–497.
Haughton R. 1867b. Notes on animal mechanics. No. XI. Muscular anatomy of the rhea (Struthiorhea). Proceedings of the Irish Academy of Science 9:497–504.
Higham TE, Biewener AA, Wakeling JM. 2008. Functional diversification within and betweenmuscle synergists during locomotion. Biology Letters 4:41–44 DOI 10.1098/rsbl.2007.0472.
Holowka NB, O’Neill MC. 2013. Three-dimensional moment arms and architectureof chimpanzee (Pan troglodytes) leg musculature. Journal of Anatomy 223:610–628DOI 10.1111/joa.12121.
Holzbaur KR, Murray WM, Delp SL. 2005. A model of the upper extremity for simulatingmusculoskeletal surgery and analyzing neuromuscular control. Annals of Biomedical Engineering33:829–840 DOI 10.1007/s10439-005-3320-7.
Hutchinson et al. (2015), PeerJ, DOI 10.7717/peerj.1001 47/52
Hutchinson JR. 2002. The evolution of hindlimb tendons and muscles on the lineto crown-group birds. Comparative Biochemistry and Physiology A 133:1051–1086DOI 10.1016/S1095-6433(02)00158-7.
Hutchinson JR. 2004. Biomechanical modeling and sensitivity analysis of bipedal running ability.I. Extant taxa. Journal of Morphology 262:421–440 DOI 10.1002/jmor.10241.
Hutchinson JR, Allen V. 2009. The evolutionary continuum of limb function from early theropodsto birds. Naturwissenschaften 96:423–448 DOI 10.1007/s00114-008-0488-3.
Hutchinson JR, Anderson FC, Blemker SS, Delp SL. 2005. Analysis of hindlimb muscle momentarms in Tyrannosaurus rex using a three-dimensional musculoskeletal computer model.Paleobiology 31:676–701 DOI 10.1666/04044.1.
Hutchinson JR, Gatesy SM. 2000. Adductors, abductors, and the evolution of archosaur locomo-tion. Paleobiology 26:734–751 DOI 10.1666/0094-8373(2000)026<0734:AAATEO>2.0.CO;2.
Hutchinson JR, Miller C, Fritsch G, Hildebrandt T. 2008. The anatomical foundation formultidisciplinary studies of animal limb function: examples from dinosaur and elephant limbimaging studies. In: Fritsch G, Frey R, eds. Anatomical imaging: towards a new morphology.Berlin: Springer, 23–38.
Hutchinson JR, Rankin JW, Rubenson J, Rosenbluth KH, Siston RA, Delp SL. 2015. Ostrichbiomechanical computer model files and code. Figshare. Available at http://dx.doi.org/10.6084/m9.figshare.1409443.
Jensen RH, Davy DT. 1975. An investigation of muscle lines of action about the hip: acentroid line approach vs the straight line approach. Journal of Biomechanics 8:103–110DOI 10.1016/0021-9290(75)90090-1.
Jindrich DL, Smith NC, Jespers K, Wilson AM. 2007. Mechanics of cutting maneuversby ostriches (Struthio camelus). Journal of Experimental Biology 210:1378–1390DOI 10.1242/jeb.001545.
Johnson WL, Jindrich DL, Roy RR, Edgerton VR. 2008. A three-dimensional model of the rathindlimb: musculoskeletal geometry and muscle moment arms. Journal of Biomechanics41:610–619 DOI 10.1016/j.jbiomech.2007.10.004.
Kambic RE, Roberts TJ, Gatesy SM. 2014. Long-axis rotation: a missing degree of freedom inavian bipedal locomotion. Journal of Experimental Biology jeb-101428 published online.
Kargo WJ, Rome LC. 2002. Functional morphology of proximal hindlimb muscles in the frogRana pipiens. Journal of Experimental Biology 205:1987–2004.
Kargo WJ, Nelson F, Rome LC. 2002. Jumping in frogs: assessing the design of the skeletal systemby anatomically realistic modeling and forward dynamic simulation. Journal of ExperimentalBiology 205:1683–1702.
Kilbourne BM. 2013. On birds: scale effects in the neognath hindlimb and differences in thegross morphology of wings and hindlimbs. Biological Journal of the Linnean Society 110:14–31DOI 10.1111/bij.12110.
Lamas L, Main RP, Hutchinson JR. 2014. Ontogenetic scaling patterns and functionalanatomy of the pelvic limb musculature in emus (Dromaius novaehollandiae). PeerJ2:e716 DOI 10.7717/peerj.716.
Lieber RL. 1997. Muscle fiber length and moment arm coordination during dorsi- andplantarflexion in the mouse hindlimb. Acta Anatomica 159:84–89 DOI 10.1159/000147970.
Lieber RL, Boakes JL. 1988a. Sarcomere length and joint kinematics during torque production infrog hindlimb. American Journal of Physiology 254:C759–C768.
Hutchinson et al. (2015), PeerJ, DOI 10.7717/peerj.1001 48/52
Lieber RL, Boakes JL. 1988b. Muscle force and moment arm contributions to torque productionin frog hindlimb. American Journal of Physiology 254:c769–C772.
Lieber RL, Brown CG. 1992. Sarcomere length-joint angle relationships of seven frog hindlimbmuscles. Cells Tissues Organs 145:289–295 DOI 10.1159/000147380.
Lieber RL, Shoemaker SD. 1992. Muscle, joint, and tendon contributions to the torque profile offrog hip joint. American Journal of Physiology 263:R586–R586.
Macalister A. 1864. On the anatomy of the ostrich (Struthio camelus). Proceedings of the Royal IrishAcademy 9:1–24.
Maganaris CN. 2004. Imaging-based estimates of moment arm length in intact humanmuscle–tendons. European Journal of Applied Physiology 91:130–139DOI 10.1007/s00421-003-1033-x.
Mai MT, Lieber RL. 1990. A model of semitendinosus muscle sarcomere length, kneeand hip joint interaction in the frog hindlimb. Journal of Biomechanics 23:271–279DOI 10.1016/0021-9290(90)90017-W.
Maidment SC, Bates KT, Falkingham PL, VanBuren C, Arbour V, Barrett PM. 2013.Locomotion in ornithischian dinosaurs: an assessment using three-dimensional computationalmodelling. Biological Reviews published online. DOI 10.1111/brv.12071.
Mallison H. 2010a. The digital Plateosaurus I: body mass, mass distribution, and posture assessedusing CAD and CAE on a digitally mounted complete skeleton. Palaeontologia Electronica13:Article 13.2.8A. Available at http://palaeo-electronica.org/2010 2/198/index.html.
Mallison H. 2010b. The digital Plateosaurus II: an assessment of the range of motion of the limbsand vertebral column and of previous reconstructions using a digital skeletal mount. ActaPalaeontologica Polonica 55:433–458 DOI 10.4202/app.2009.0075.
Mallison H. 2010c. CAD assessment of the posture and range of motion of Kentrosaurus aethiopi-cus Hennig 1915. Swiss Journal of Geosciences 103:211–233 DOI 10.1007/s00015-010-0024-2.
Maloiy GMO, Mc N Alexander R, Njau R, Jayes AS. 1979. Allometry of the legs of running birds.Journal of Zoology 187:161–167 DOI 10.1111/j.1469-7998.1979.tb03940.x.
McClearn D. 1985. Anatomy of raccoon (Procyon lotor) and coati (Nasua narica and N. nasua)forearm and leg muscles: relations between fiber length, moment-arm length, and joint-angleexcursion. Journal of Morphology 183:87–115 DOI 10.1002/jmor.1051830106.
McGowan C. 1979. The hind limb musculature of the Brown Kiwi, Apteryx australis mantelli.Journal of Morphology 160:33–74 DOI 10.1002/jmor.1051600105.
Medler S. 2002. Comparative trends in shortening velocity and force production in skeletalmuscle. American Journal of Physiology - Regulatory, Integrative and Comparative Physiology283:R368–R378 DOI 10.1152/ajpregu.00689.2001.
Mellett FD. 1994. A note on the musculature of the proximal part of the pelvic limb of the ostrich(Struthio camelus). Journal of the South African Veterinary Association 65:5–9.
Mendez J, Keys A. 1960. Density and composition of mammalian muscle. Metabolism—Clinicaland Experimental 9:184–188.
Molnar J. 2014. The biomechanics of vertebrae across evolutionary transitions between waterand land: examples from early Tetrapod and Crocodylomorpha. PhD dissertation, The RoyalVeterinary College, University of London.
Nagano A, Umberger BR, Marzke MW, Gerritsen KGM. 2005. Neuromusculoskeletal computermodeling and simulation of upright, straight-legged, bipedal locomotion of Australopithecusafarensis. American Journal of Physical Anthropology 126:2–13 DOI 10.1002/ajpa.10408.
Hutchinson et al. (2015), PeerJ, DOI 10.7717/peerj.1001 49/52
Nelson FE, Gabaldon AM, Roberts TJ. 2004. Force-velocity properties of two avian hindlimb mus-cles. Comparative Biochemistry and Physiology A 137:711–721 DOI 10.1016/j.cbpb.2004.02.004.
Nikooyan AA, Veeger HEJ, Chadwick EKJ, Praagman M, Van der Helm FCT. 2011. Developmentof a comprehensive musculoskeletal model of the shoulder and elbow. Medical & BiologicalEngineering & Computing 49:1425–1435 DOI 10.1007/s11517-011-0839-7.
O’Neill MC, Lee LF, Larson SG, Demes B, Stern JT, Umberger BR. 2013. A three-dimensionalmusculoskeletal model of the chimpanzee (Pan troglodytes) pelvis and hind limb. Journal ofExperimental Biology 216:3709–3723 DOI 10.1242/jeb.079665.
Pandy MG. 1999. Moment arm of a muscle force. Exercise and Sport Science Reviews 27:79–118DOI 10.1249/00003677-199900270-00006.
Patak A, Baldwin J. 1993. Structural and metabolic characterization of the muscles used to powerrunning in the emu (Dromaius novaehollandiae), a giant flightless bird. Journal of ExperimentalBiology 175:233–249.
Patak A, Baldwin J. 1998. Pelvic limb musculature in the emu Dromaius novaehollandiae (Aves:Struthioniformes: Dromaiidae): adaptations to high-speed running. Journal of Morphology238:23–37 DOI 10.1002/(SICI)1097-4687(199810)238:1<23::AID-JMOR2>3.0.CO;2-O.
Paul GS. 1998. Limb design, function and running performance in ostrich-mimics andtyrannosaurs. Gaia 15:257–270.
Picasso MBJ. 2010. The hindlimb muscles of Rhea americana (Aves, Palaeognathae, Rheidae).Anatomia Histologia Embryologia 39:462–472 DOI 10.1111/j.1439-0264.2010.01017.x.
Picasso MBJ. 2012. Postnatal ontogeny of the locomotor skeleton of a cursorial bird: greater rhea.Journal of Zoology 286:303–311 DOI 10.1111/j.1469-7998.2011.00880.x.
Pierce SE, Clack JA, Hutchinson JR. 2012. Three-dimensional limb joint mobility in the earlytetrapod Ichthyostega. Nature 486:523–526 DOI 10.1038/nature11124.
Rayfield EJ. 2007. Finite element analysis and understanding the biomechanics and evolutionof living and fossil organisms. Annual Review of Earth and Planetary Sciences 35:541–576DOI 10.1146/annurev.earth.35.031306.140104.
Regnault S, Pitsillides AA, Hutchinson JR. 2014. Structure, ontogeny and evolution of thepatellar tendon in emus (Dromaius novaehollandiae) and other palaeognath birds. PeerJ 2:e711DOI 10.7717/peerj.711.
Rowe T. 1986. Homology and evolution of the deep dorsal thigh musculature in birds and otherReptilia. Journal of Morphology 189:327–346 DOI 10.1002/jmor.1051890310.
Rubenson J, Heliams DB, Lloyd DG, Fournier PA. 2004. Gait selection in the ostrich:mechanical and metabolic characteristics of walking and running with and withoutan aerial phase. Proceedings of the Royal Society B: Biological Sciences 271:1091–1099DOI 10.1098/rspb.2004.2702.
Rubenson J, Henry HT, Dimoulas PM, Marsh RL. 2006. The cost of running uphill: linkingorganismal and muscle energy use in guinea fowl (Numida meleagris). Journal of ExperimentalBiology 209:2395–2408 DOI 10.1242/jeb.02310.
Rubenson J, Lloyd DG, Besier TF, Heliams DB, Fournier PA. 2007. Running in ostriches (Struthiocamelus): three-dimensional joint axes alignment and joint kinematics. Journal of ExperimentalBiology 210:2548–2562 DOI 10.1242/jeb.02792.
Rubenson J, Lloyd DG, Heliams DB, Besier TF, Fournier PA. 2011. Adaptations for economicalbipedal running: the effect of limb structure on three-dimensional joint mechanics. Journal ofthe Royal Society Interface 8:740–755 DOI 10.1098/rsif.2010.0466.
Hutchinson et al. (2015), PeerJ, DOI 10.7717/peerj.1001 50/52
Russell DA. 1972. Ostrich dinosaurs from the Late Cretaceous of Western Canada. CanadianJournal of Earth Sciences 9:375–402 DOI 10.1139/e72-031.
Schaller NU, D’Aout K, Villa R, Herkner B, Aerts P. 2011. Toe function and dynamic pressuredistribution in ostrich locomotion. Journal of Experimental Biology 214:1123–1130DOI 10.1242/jeb.043596.
Schaller NU, Herkner B, Villa R, Aerts P. 2009. The intertarsal joint of the ostrich (Struthiocamelus): anatomical examination and function of passive structures in locomotion. Journalof Anatomy 214:830–847 DOI 10.1111/j.1469-7580.2009.01083.x.
Sellers WI, Margetts L, Coria RA, Manning PL. 2013. March of the titans: the locomotor capabil-ities of sauropod dinosaurs. PLoS ONE 8(10):e78733 DOI 10.1371/journal.pone.0078733.
Smith NC, Jespers KJ, Wilson AM. 2010. Ontogenetic scaling of locomotor kinetics andkinematics of the ostrich (Struthio camelus). Journal of Experimental Biology 213:1347–1355DOI 10.1242/jeb.020271.
Smith NC, Payne RC, Jespers KJ, Wilson AM. 2007. Muscle moment arms of pelviclimb muscles of the ostrich (Struthio camelus). Journal of Anatomy 211:313–324DOI 10.1111/j.1469-7580.2007.00762.x.
Smith NC, Wilson AM. 2013. Mechanical and energetic scaling relationships of runninggait through ontogeny in the ostrich (Struthio camelus). Journal of Experimental Biology216:841–849 DOI 10.1242/jeb.064691.
Smith NC, Wilson AM, Jespers KJ, Payne RC. 2006. Muscle architecture and functional anatomyof the pelvic limb of the ostrich (Struthio camelus). Journal of Anatomy 209:765–779DOI 10.1111/j.1469-7580.2006.00658.x.
Suzuki T, Hosseini A, Li JS, Gill IV TJ, Li G. 2012. In vivo patellar tracking and patellofemoralcartilage contacts during dynamic stair ascending. Journal of Biomechanics 45:2432–2437DOI 10.1016/j.jbiomech.2012.06.034.
Troy KL, Brown TD, Conzemius MG. 2009. Contact stress distributions on the femoralhead of the emu (Dromaius novaehollandiae). Journal of Biomechanics 42:2495–2500DOI 10.1016/j.jbiomech.2009.07.017.
Tsaopoulos DE, Baltzopoulos V, Richards PJ, Maganaris CN. 2007. In vivo changes in the humanpatellar tendon moment arm length with different modes and intensities of muscle contraction.Journal of Biomechanics 40:3325–3332 DOI 10.1016/j.jbiomech.2007.05.005.
Vanden Berge JC. 1982. Notes on the myology of the pelvic limb in kiwi (Apteryx) and in otherbirds. The Auk 99:309–315.
Velotto S, Crasto A. 2004. Histochemical and morphometrical characterization and distributionof fibre types in four muscles of ostrich (Struthio camelus). Anatomia Histologia Embryologia33:251–256 DOI 10.1111/j.1439-0264.2004.00535.x.
Walker PS, Rovick JS, Robertson DD. 1988. The effects of knee brace hinge design and placementon joint mechanics. Journal of Biomechanics 21:965–974 DOI 10.1016/0021-9290(88)90135-2.
Watson RR, Rubenson J, Coder L, Hoyt DF, Propert MW, Marsh RL. 2011. Gait-specificenergetics contributes to economical walking and running in emus and ostriches. Proceedings ofthe Royal Society B: Biological Sciences 278:2040–2046 DOI 10.1098/rspb.2010.2022.
Weissengruber GE, Forstenpointner G, Gangl D. 2003. Gut zu Fuß – funktionell-anatomischeAspekte des bipeden Laufens deim Afrikanischen Strauß (Struthio camelus Linne, 1758).Veterinary Medicine Austria Wiener Tierarztliche Monatsschrift 90:67–78.
Hutchinson et al. (2015), PeerJ, DOI 10.7717/peerj.1001 51/52
Young RP, Scott SH, Loeb GE. 1993. The distal hindlimb musculature of the cat:multiaxis moment arms at the ankle joint. Experimental Brain Research 96:141–151DOI 10.1007/BF00230447.
Zajac FE. 1989. Muscle and tendon: properties, models, scaling, and application to biomechanicsand motor control. Critical Reviews in Biomedical Engineering 17:359–411.
Zarucco L, Wisner ER, Swanstrom MD, Stover SM. 2006. Image fusion of computedtomographic and magnetic resonance images for the development of a three-dimensionalmusculoskeletal model of the equine forelimb. Veterinary Radiology & Ultrasound 47:553–562DOI 10.1111/j.1740-8261.2006.00185.x.
Zinoviev AV. 2006. Notes on the hind limb myology of the Ostrich (Struthio camelus). Ornithologia33:53–62.
Hutchinson et al. (2015), PeerJ, DOI 10.7717/peerj.1001 52/52
Related Documents