International Journal of Marketing & Financial Management, Volume 2, issue 7, Aug-2014, pp 01-10 1 | Page International Journal of Marketing & Financial Management (IJMFM) ISSN: 2348 –3954 (Online) ISSN: 2349 –2546 (Print) Available online at : http://www.arseam.com/content/volume- 2issue-6-july-2014 Email us: [email protected] Instructions for authors and subscription information: http://www.arseam.com/ MULTIVARIATE GARCH MODEL OF TRANSMISSION OF VOLATILITY: A STUDY OF BRIC STOCK MARKETS Joshi Prashant Uka Tarsadia University, Bardoli, India Abstract The study examines the volatility spillover among BRIC markets using a four-variable symmetric GARCH-BEKK model during January 2009 to June 2014. We find evidence of bi-directional shock spill over among Brazil and Russia, Brazil and China, Russia and India and bidirectional volatility spill over among stock markets of Brazil and Russia, between Brazil and India and among Brazil and China. The magnitude of volatility linkages is low indicating weak integration of BRIC stock markets. The study finds that own volatility spillover is higher than cross market spillover. The overall persistence of stock market volatility is highest for China (0.987) and lowest for Russia (0.889). The implication of weak integration is that investors will benefit from reduction of diversifiable risk. Keywords: Return and Volatility spillovers, Unit Root Test, Multivariate GARCH model, JEL Classification: C32, G15 1. Introduction The extent of the global linkage of emerging markets improves access to the international capital markets. Strong global linkage reduces the insulation of the emerging stock markets from external shocks, hence limiting the scope for independent monetary policy (Li and Majerowska, 2007). From the perspective of the global investors, weak stock market linkage in the form of less than perfect correlation between their returns offers potential gains from international portfolio diversification, while strong market linkage or co-movement in returns eliminates the potential benefits of diversification.

Welcome message from author
This document is posted to help you gain knowledge. Please leave a comment to let me know what you think about it! Share it to your friends and learn new things together.
Transcript
International Journal of Marketing & Financial Management, Volume 2, issue 7, Aug-2014, pp 01-10
1 | P a g e
International Journal of
Marketing & Financial
Management (IJMFM) ISSN: 2348 –3954 (Online)
ISSN: 2349 –2546 (Print)
Available online at :
http://www.arseam.com/content/volume-
2issue-6-july-2014
Email us: [email protected]
Instructions for authors and subscription
information:
http://www.arseam.com/
MULTIVARIATE GARCH MODEL OF TRANSMISSION OF
VOLATILITY: A STUDY OF BRIC STOCK MARKETS
Joshi Prashant Uka Tarsadia University, Bardoli, India
Abstract
The study examines the volatility spillover among BRIC markets using a four-variable symmetric GARCH-BEKK
model during January 2009 to June 2014. We find evidence of bi-directional shock spill over among Brazil and Russia,
Brazil and China, Russia and India and bidirectional volatility spill over among stock markets of Brazil and Russia,
between Brazil and India and among Brazil and China. The magnitude of volatility linkages is low indicating weak
integration of BRIC stock markets. The study finds that own volatility spillover is higher than cross market spillover. The
overall persistence of stock market volatility is highest for China (0.987) and lowest for Russia (0.889). The implication of
weak integration is that investors will benefit from reduction of diversifiable risk.
Keywords: Return and Volatility spillovers, Unit Root Test, Multivariate GARCH model, JEL Classification: C32, G15
1. Introduction
The extent of the global linkage of emerging markets improves access to the international capital
markets. Strong global linkage reduces the insulation of the emerging stock markets from external
shocks, hence limiting the scope for independent monetary policy (Li and Majerowska, 2007). From the
perspective of the global investors, weak stock market linkage in the form of less than perfect correlation
between their returns offers potential gains from international portfolio diversification, while strong
market linkage or co-movement in returns eliminates the potential benefits of diversification.
International Journal of Marketing & Financial Management, Volume 2, issue 7, Aug-2014, pp 01-10
2 | P a g e
Although there is no dearth of literature on financial integration, there are only a few studies
related to emerging stock markets of Asia. Moreover, the limited literature on the emerging stock markets
in Asia has studied the co-movements between the stock markets using cointegration and Vector
Autoregression framework (Eun and Shin, 1989,Chung and Ng, 1992, Bhattacharya and Samantha,
2001, Wong, Agrawal and Du, 2005, Voronkova, 2004, Ahmad, Ashraf and Ahmed, 2005, Cheeley and
Steeley, 2005, Yang, Hsiao, Li and Wang, 2006, Hoque, 2007). The studies do not take into account the
interactions in terms of volatility among the markets.
It is believed that if markets are integrated, an unanticipated event in one market will influence
not only returns but also variance in the other markets. The analysis of volatility is particularly important
because it can proxy for the risk of assets.
Joshi(2011) examined the return and volatility spillover among Asian stock markets in India,
Hong Kong, Japan, China, Jakarta and Korea using a six-variable asymmetric GARCH-BEKK model
during 2nd February 2007 to 20th February, 2010. The study found the evidence of bi-directional return;
shock and volatility spill over among most of the stock markets. The magnitude of volatility linkages was
low indicating weak integration of Asian stock markets. It found that own market volatility spillover was
higher than cross market spillover.
Li (2007) examined the linkages between the two emerging stock exchanges namely Shanghai and
Shenzen of China and the established stock markets Heng Seng of Hong Kong and S & P of the US by a
multivariate GARCH-BEKK framework using the daily share price indices of the stock markets, January
4, 2000 to August 17, 2005. The results indicated that there was no evidence of spillover effect in terms of
return and volatility between the stock exchanges in China and US market. There was an evidence of
unidirectional volatility spillover from stock exchange in Hong Kong to those in Shanghai and Shenzhen.
The study found that Chinese stock exchanges were integrated with the regional developed stock
exchange in Hong Kong but the extent of the linkages between the stock exchange in Hong Kong and
China was weak. The results further showed that there was a bidirectional shock spillover between the
two Chinese stock exchanges. The study also found that there was an asymmetric response of volatility in
all four stock exchanges under study.
Harris and Pisedtasalasai (2006) applied constant conditional correlation MGARCH framework to
investigate return and volatility spillover effects between the Financial Times Stock Exchange (FTSE)100,
FTSE 200 and FTSE small cap equity indices of UK stock market using daily return during January 1,
1986 to December 2002 using GJR specifications of MGARCH model to capture asymmetric effect. The
study found that return and volatility transmission mechanism between large and small stocks in the UK
were asymmetric. There were significant positive spillover effects from portfolio of larger stocks to the
portfolio of smaller stocks.
Worthington and Higgs (2004) examined the transmission of equity returns and volatility among
three developed Asian markets (Hong Kong, Japan and Singapore) and six emerging markets of Asia
(Indonesia, Korea, Malaysia, the Philippines, Taiwan and Thailand) using weekly returns from January
15, 1988 to October 6, 2000. They employed BEKK (Baba, Engle, Kraft and Kroner) parameterization of
multivariate GARCH model to identify the source and magnitude of volatility spillover. The study found
the presence of positive mean and volatility spillovers. The mean return spillovers from the developed
markets to the emerging markets were not homogenous across the emerging markets. Application of
MGARCH suggested that own stock market volatility spillovers were generally higher than cross-volatility
spillovers for all markets, especially for emerging stock markets.
Scheicher(2001) studied the regional and global integration of stock markets in terms of return
and volatility shocks in Hungary, Poland and Czech Republic and Financial Times/S&P‟s world actuaries
index by using MGARCH(Multivariate Generalized Auto regressive conditional heteroscedasticity) with a
constant conditional correlation. Using daily closing price values of the stock markets from January 1,
1995 to October 7, 1997, results revealed that the emerging stock exchanges were integrated with the
International Journal of Marketing & Financial Management, Volume 2, issue 7, Aug-2014, pp 01-10
3 | P a g e
global market, proxied by Financial Times/S&P‟s actuaries‟ world index only in terms of return. MGARCH
results showed that the regional influences were the major cause of volatility of the markets. International
volatility had no impact on the markets.
Chou, Lin and Wu (1999) examined the price and volatility linkages of Taiwan stock market with
United States using close-to-open, open-to-close and close-to-close returns of indices of Taiwan known as
Taikex and United states‟ Standard and Poor‟s 500 (S&P 500) composite index during January 1, 1991 to
December 31, 1994. The results found that the volatility and return spilt over from US to Taiwan. The
results of MGARCH indicated some important linkage from the US stock market to the Taiwan stock
market. The spillover effects occurred for both the mean and the variance of Taiwan Stock returns. It
further pointed out that the volatility in US stock markets affected total daily volatilities of the Taiwan
stock market.
Although there is a voluminous literature on equity market integration internationally, little
research has been undertaken to study the interdependence structure of the BRIC stock markets. BRIC
stands for Brazil, Russia, India and China. These countries were originally grouped in to BRICs by
Goldman Sachs‟s James O‟Neal. BRIC countries are formed because of their crucial role in the today‟s
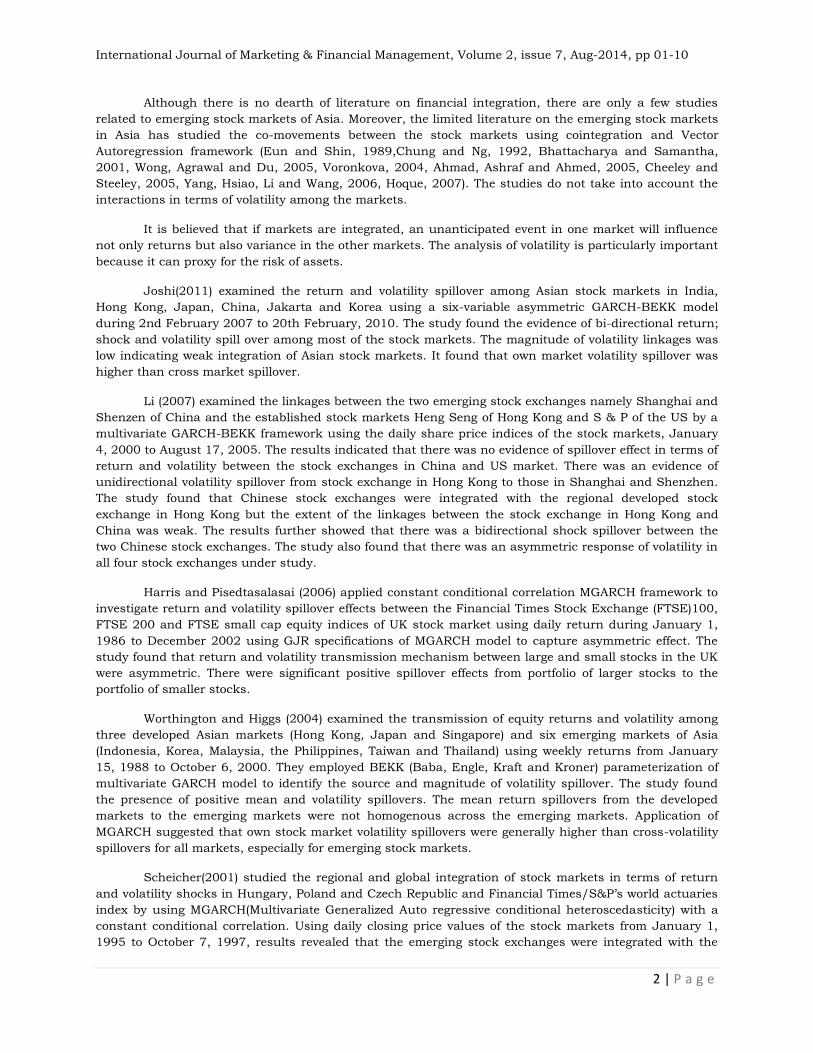
world economy. The Figure 1 highlights the importance of the BRICs in the world‟s future economy as
they may become the largest economies in the world by 2050 (Glodman Sachs1). The economic growth
rates for these countries are well above the most of the industrialized countries like USA, Japan,
Figure 1: Ten Largest Economy of the World in 2050, measuerd in GDP( billions of 2006
USD)
Source: http://en.wikipedia.org/wiki/File:Top_five_largest_economies_in_2050.jpg
United Kingdom and Canada. During 2002 – 2008, the Chinese economy grew at an average of 10
percent per year while India grew at an average of 8 percent per year (Balakrishnan et el 2009). China
also gradually became the world‟s largest exporter with $1,897 trillion worth of exports (CIA‟s The Worlds
Fact book 2011). Meanwhile, the BRICs are also increasing their trade with one another: especially the
Chinese and Indian trade has increased by $60 billion in 2010 while setting a $100 billion bilateral trade
target by 2015. The BRICs‟ large share of foreign exchange reserves in the world economy provides them
a strong competitive advantage. All four countries are among the ten largest accumulators of foreign
exchange reserves in dollars, accounting for over 40 percent of the world‟s total (“The trillion Dollar Baby”,
The Economist Magazine February 2012).
1 Goldman Sachs : http://www.goldmansachs.com/
International Journal of Marketing & Financial Management, Volume 2, issue 7, Aug-2014, pp 01-10
4 | P a g e
Moreover, the monetary policy actions of BRICs can influence the rest of the world as they hold a
large portion of treasury bonds of many of the foreign countries including the US, UK and Canada. All
these above factors make the BRICs highly important in the world economy. So having a better idea about
the monetary policy behavior of the BRICs would help other economies to be efficient in their participation
in the world economic activities (Tamazian & Chousa, 2009). With the growing importance of BRIC
countries in the world economy, it will be interesting to examine how those market interact with each
other especially in terms of volatility. The knowledge about volatility interactions will help investors to
take investment and portfolio diversification decision. Weak stock market linkages benefits investors from
international portfolio diversification, while strong market linkage in returns and volatility eliminates the
potential benefits of diversification.
In the light of the review of the existing literature on the linkages between the various stock
markets, the present study tries to analyze volatility spill over among BRIC stock markets using
MGARCH-BEKK framework. The rest of the paper is organized as follows. Data and Preliminary Analysis
are presented in Section 2. Section 3 provides research design used in the study. Empirical results are
discussed in Section 4. Section 5 summarizes.
2. Data and Preliminary Analysis
We collected data on BOVASPA, RTSI, Sensex and SSE of Brazil, Russia, India and China‟s
closing price indices respectively from January 1, 2009 to June, 2014. It consists of 1359 observations.
The period is the most recent one. These stock markets have become increasingly integrated. The trades
between countries have increased. They are playing an important role in the world economy. These might
have influenced the behavior and the pattern of volatility and therefore it will be instructive to study
volatility in this period.
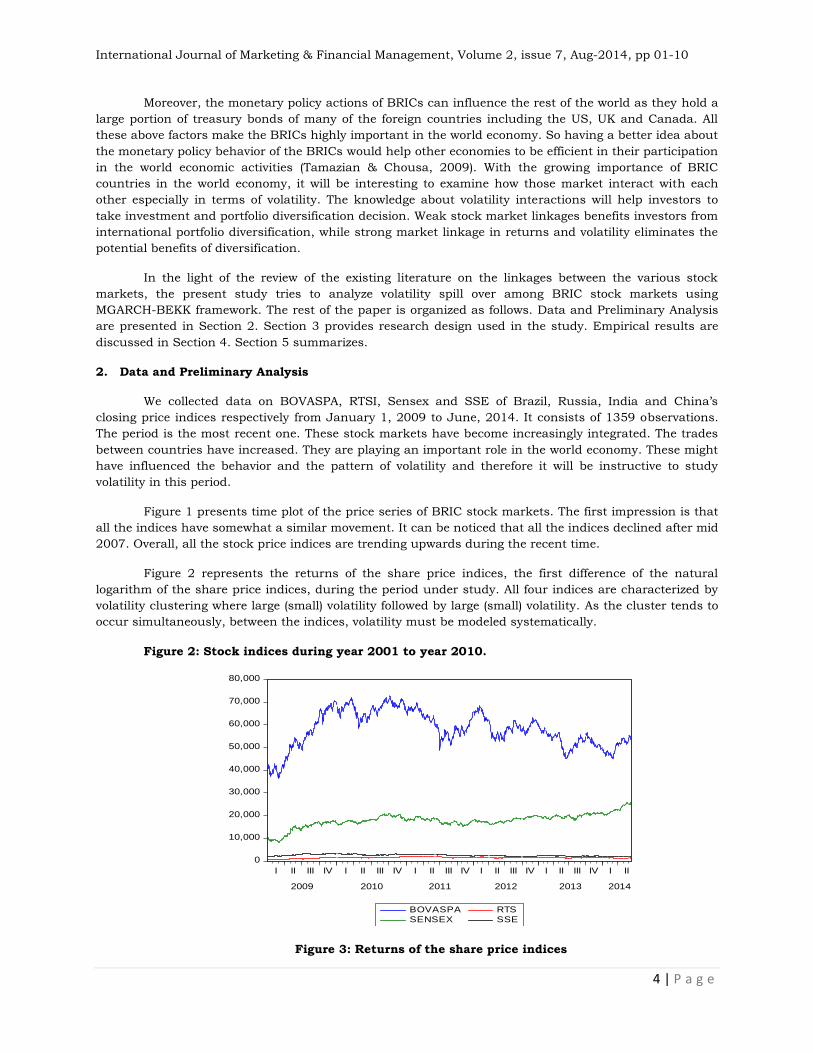
Figure 1 presents time plot of the price series of BRIC stock markets. The first impression is that
all the indices have somewhat a similar movement. It can be noticed that all the indices declined after mid
2007. Overall, all the stock price indices are trending upwards during the recent time.
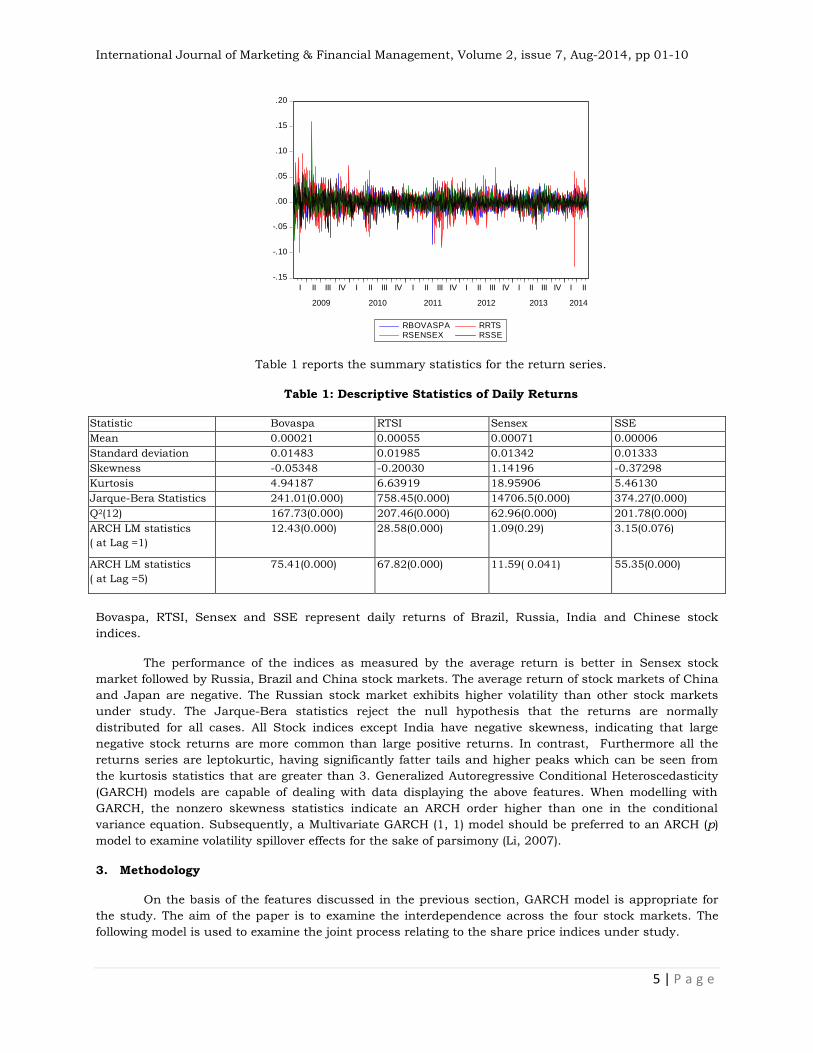
Figure 2 represents the returns of the share price indices, the first difference of the natural
logarithm of the share price indices, during the period under study. All four indices are characterized by
volatility clustering where large (small) volatility followed by large (small) volatility. As the cluster tends to
occur simultaneously, between the indices, volatility must be modeled systematically.
Figure 2: Stock indices during year 2001 to year 2010.
0
10,000
20,000
30,000
40,000
50,000
60,000
70,000
80,000
I II III IV I II III IV I II III IV I II III IV I II III IV I II
2009 2010 2011 2012 2013 2014
BOVASPA RTSSENSEX SSE
Figure 3: Returns of the share price indices
International Journal of Marketing & Financial Management, Volume 2, issue 7, Aug-2014, pp 01-10
5 | P a g e
-.15
-.10
-.05
.00
.05
.10
.15
.20
I II III IV I II III IV I II III IV I II III IV I II III IV I II
2009 2010 2011 2012 2013 2014
RBOVASPA RRTSRSENSEX RSSE
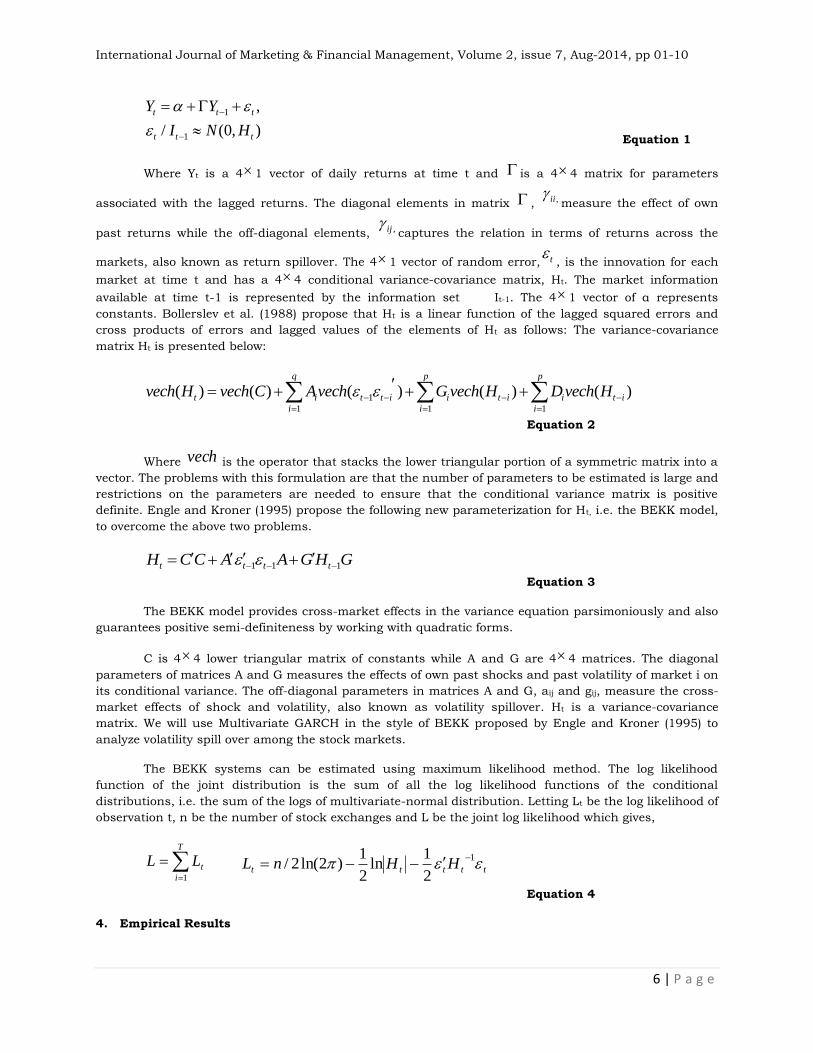
Table 1 reports the summary statistics for the return series.
Table 1: Descriptive Statistics of Daily Returns
Statistic Bovaspa RTSI Sensex SSE
Mean 0.00021 0.00055 0.00071 0.00006
Standard deviation 0.01483 0.01985 0.01342 0.01333
Skewness -0.05348 -0.20030 1.14196 -0.37298
Kurtosis 4.94187 6.63919 18.95906 5.46130
Jarque-Bera Statistics 241.01(0.000) 758.45(0.000) 14706.5(0.000) 374.27(0.000)
Q2(12) 167.73(0.000) 207.46(0.000) 62.96(0.000) 201.78(0.000)
ARCH LM statistics
( at Lag =1)
12.43(0.000) 28.58(0.000) 1.09(0.29)
3.15(0.076)
ARCH LM statistics
( at Lag =5)
75.41(0.000) 67.82(0.000) 11.59( 0.041)
55.35(0.000)
Bovaspa, RTSI, Sensex and SSE represent daily returns of Brazil, Russia, India and Chinese stock
indices.
The performance of the indices as measured by the average return is better in Sensex stock
market followed by Russia, Brazil and China stock markets. The average return of stock markets of China
and Japan are negative. The Russian stock market exhibits higher volatility than other stock markets
under study. The Jarque-Bera statistics reject the null hypothesis that the returns are normally
distributed for all cases. All Stock indices except India have negative skewness, indicating that large
negative stock returns are more common than large positive returns. In contrast, Furthermore all the
returns series are leptokurtic, having significantly fatter tails and higher peaks which can be seen from
the kurtosis statistics that are greater than 3. Generalized Autoregressive Conditional Heteroscedasticity
(GARCH) models are capable of dealing with data displaying the above features. When modelling with
GARCH, the nonzero skewness statistics indicate an ARCH order higher than one in the conditional
variance equation. Subsequently, a Multivariate GARCH (1, 1) model should be preferred to an ARCH (p)
model to examine volatility spillover effects for the sake of parsimony (Li, 2007).
3. Methodology
On the basis of the features discussed in the previous section, GARCH model is appropriate for
the study. The aim of the paper is to examine the interdependence across the four stock markets. The
following model is used to examine the joint process relating to the share price indices under study.
International Journal of Marketing & Financial Management, Volume 2, issue 7, Aug-2014, pp 01-10
6 | P a g e
1
1
,
/ (0, )
t t t
t t t
Y Y
I N H
Equation 1
Where Yt is a 41 vector of daily returns at time t and is a 4 4 matrix for parameters
associated with the lagged returns. The diagonal elements in matrix , ,ii measure the effect of own
past returns while the off-diagonal elements, ,ij captures the relation in terms of returns across the
markets, also known as return spillover. The 41 vector of random error, t , is the innovation for each
market at time t and has a 44 conditional variance-covariance matrix, Ht. The market information
available at time t-1 is represented by the information set It-1. The 41 vector of α represents
constants. Bollerslev et al. (1988) propose that Ht is a linear function of the lagged squared errors and
cross products of errors and lagged values of the elements of Ht as follows: The variance-covariance
matrix Ht is presented below:
1
1 1 1
( ) ( ) ( ) ( ) ( )q p p
t i t t i i t i i t i
i i i
vech H vech C Avech G vech H Dvech H
Equation 2
Where vech is the operator that stacks the lower triangular portion of a symmetric matrix into a
vector. The problems with this formulation are that the number of parameters to be estimated is large and
restrictions on the parameters are needed to ensure that the conditional variance matrix is positive
definite. Engle and Kroner (1995) propose the following new parameterization for Ht, i.e. the BEKK model,
to overcome the above two problems.
GHGAACCH tttt 111
Equation 3
The BEKK model provides cross-market effects in the variance equation parsimoniously and also
guarantees positive semi-definiteness by working with quadratic forms.
C is 44 lower triangular matrix of constants while A and G are 4 4 matrices. The diagonal
parameters of matrices A and G measures the effects of own past shocks and past volatility of market i on
its conditional variance. The off-diagonal parameters in matrices A and G, aij and gij, measure the cross-
market effects of shock and volatility, also known as volatility spillover. Ht is a variance-covariance
matrix. We will use Multivariate GARCH in the style of BEKK proposed by Engle and Kroner (1995) to
analyze volatility spill over among the stock markets.
The BEKK systems can be estimated using maximum likelihood method. The log likelihood
function of the joint distribution is the sum of all the log likelihood functions of the conditional
distributions, i.e. the sum of the logs of multivariate-normal distribution. Letting Lt be the log likelihood of
observation t, n be the number of stock exchanges and L be the joint log likelihood which gives,
T
i
tLL1
ttttt HHnL 1
2
1ln
2
1)2ln(2/
Equation 4
4. Empirical Results
International Journal of Marketing & Financial Management, Volume 2, issue 7, Aug-2014, pp 01-10
7 | P a g e
In this section, we perform unit root test to check for nonstationarity of the stock markets series.
We report the estimated results about market linkages. We will look for any statistically significant cross-
market effects as evidence of linkages and measures the extent of the linkages by the estimated time-
varying covariances using MGARCH asymmetric model. We organize the section as follows. In section 4.1,
we discuss Augmented Dickey Fuller Test (ADF) results. In section 4.2, we report the evidence of market
linkages in the estimated six-variable asymmetric GARCH-BEKK model.
4.1 Unit root test results
Stationarity conditions of the stock market indices are tested by Augmented Dickey-Fuller Test
(ADF). A unit root test is a statistical test for the proposition that in an autoregressive statistical model of
a time series, the autoregressive parameter is one. It is a test for detecting the presence of stationarity in
the series. The early and pioneering work on testing for a unit root in time series was done by Dickey and
Fuller (Dickey and Fuller 1979, Fuller 1976). If the variables in the regression model are not stationary,
then it can be shown that the standard assumptions for asymptotic analysis will not be valid. In other
words, the usual “t-ratios” will not follow a t-distribution; hence they are inappropriate to undertake
hypothesis tests about the regression parameters.
Stationarity time series is one whose mean, variance and covariance are unchanged by time shift.
Nonstationary time series have time varying mean or variance or both. If a time series is nonstationary,
we can study its behaviour only for a time period under consideration. It is not possible to generalize it to
other time periods. It is, therefore, not useful for forecasting purpose.
The presence of unit root in a time series is tested with the help of Augmented Dickey-Fuller Test.
It tests for a unit root in the univariate representation of time series. For a return series Rt, the ADF test
consists of a regression of the first difference of the series against the series lagged k times as follows:
Equation 5
)ln(;1 ttttt Rrrrr
The null hypothesis is H0: 0 and H1: 1 . The
acceptance of null hypothesis implies nonstationarity.
We can transform the non stationary time series to stationary time series either by differencing or
by detrending. The transformation depends upon whether the series are difference stationary or trend
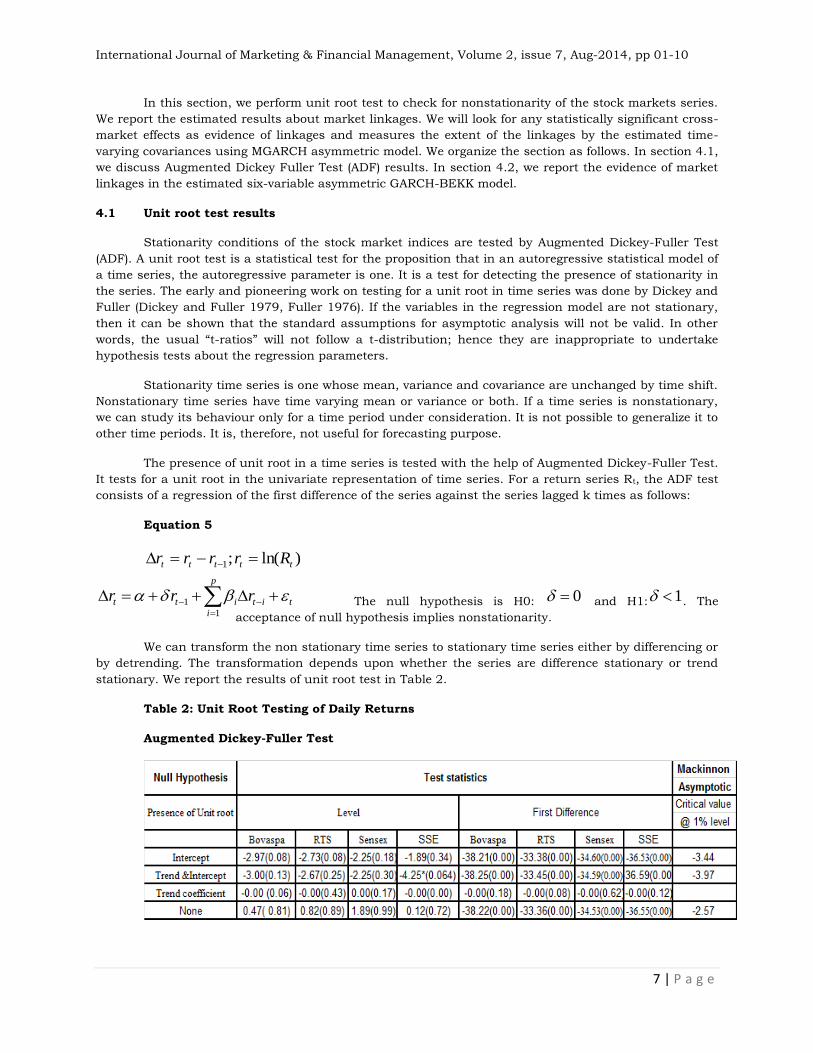
stationary. We report the results of unit root test in Table 2.
Table 2: Unit Root Testing of Daily Returns
Augmented Dickey-Fuller Test
1
1
p
t t i t i t
i
r r r
International Journal of Marketing & Financial Management, Volume 2, issue 7, Aug-2014, pp 01-10
8 | P a g e
.ADF statistics reported in the Table 2 show that the null hypothesis of a unit root in case of all
four indices is rejected. The absolute computed values for all the indices are higher than the MacKinnon
critical value at 1% level. Thus, the results show that the return series are stationary. As the results
suggest that the underlying return series are stationary, our next step is to examine the stock markets‟
linkages.
4.2 The Evidence of stock market linkages
The time-varying variance-covariance Equation 3 are estimated simultaneously by the maximum
likelihood method. Note that the stock exchanges Brazil, Russia, India and China are indexed 1, 2, 3 and
4 respectively. We examine the estimated results of the time varying variance-covariance Equation 3 in
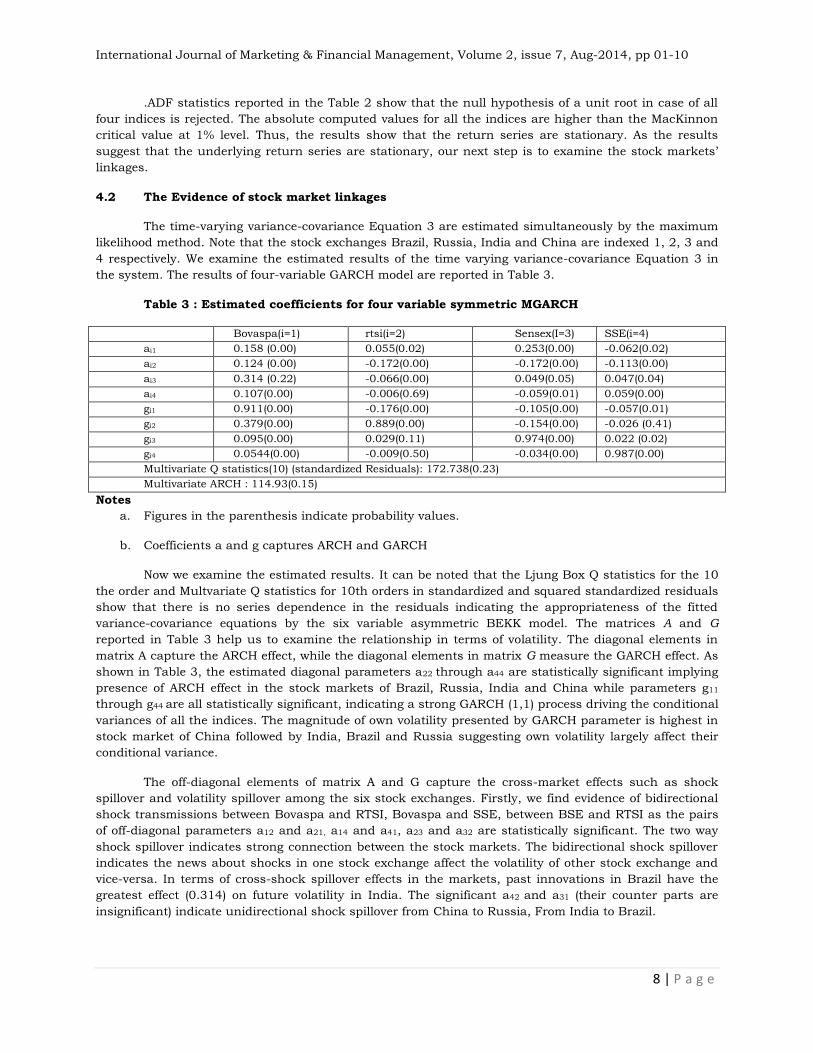
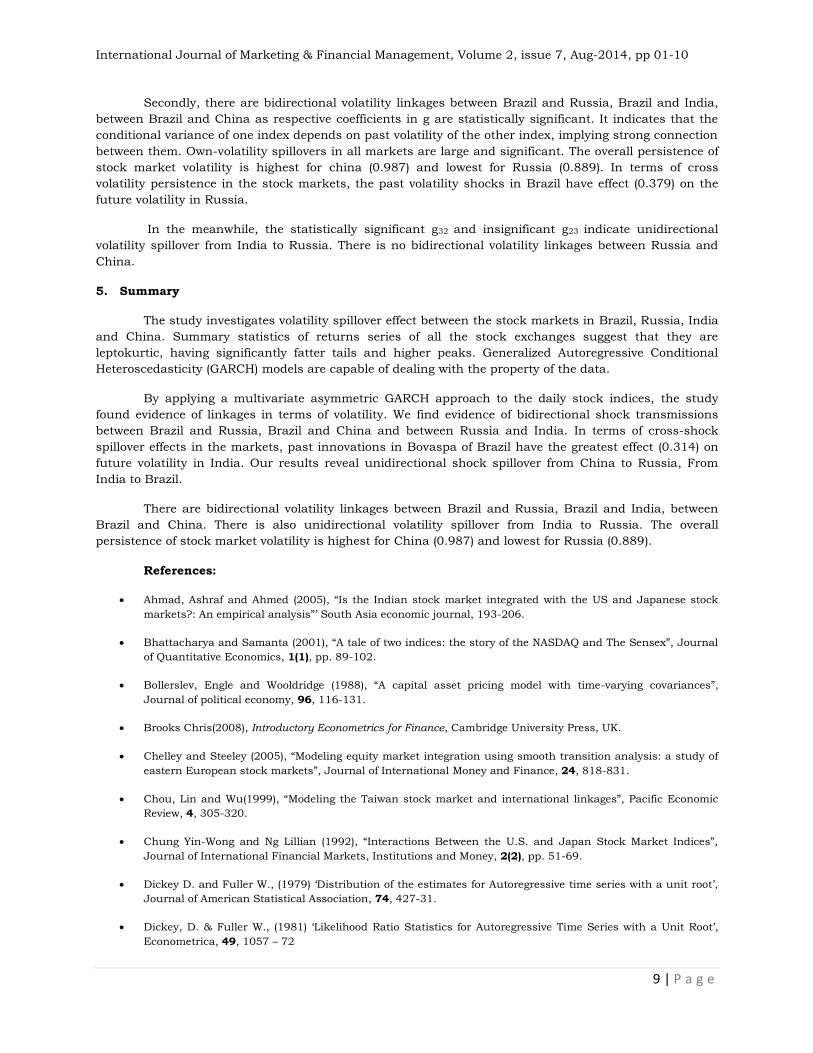
the system. The results of four-variable GARCH model are reported in Table 3.
Table 3 : Estimated coefficients for four variable symmetric MGARCH
Bovaspa(i=1) rtsi(i=2) Sensex(I=3) SSE(i=4)
ai1 0.158 (0.00) 0.055(0.02) 0.253(0.00) -0.062(0.02)
ai2 0.124 (0.00) -0.172(0.00) -0.172(0.00) -0.113(0.00)
ai3 0.314 (0.22) -0.066(0.00) 0.049(0.05) 0.047(0.04)
ai4 0.107(0.00) -0.006(0.69) -0.059(0.01) 0.059(0.00)
gi1 0.911(0.00) -0.176(0.00) -0.105(0.00) -0.057(0.01)
gi2 0.379(0.00) 0.889(0.00) -0.154(0.00) -0.026 (0.41)
gi3 0.095(0.00) 0.029(0.11) 0.974(0.00) 0.022 (0.02)
gi4 0.0544(0.00) -0.009(0.50) -0.034(0.00) 0.987(0.00)
Multivariate Q statistics(10) (standardized Residuals): 172.738(0.23)
Multivariate ARCH : 114.93(0.15)
Notes
a. Figures in the parenthesis indicate probability values.
b. Coefficients a and g captures ARCH and GARCH
Now we examine the estimated results. It can be noted that the Ljung Box Q statistics for the 10
the order and Multvariate Q statistics for 10th orders in standardized and squared standardized residuals
show that there is no series dependence in the residuals indicating the appropriateness of the fitted
variance-covariance equations by the six variable asymmetric BEKK model. The matrices A and G
reported in Table 3 help us to examine the relationship in terms of volatility. The diagonal elements in
matrix A capture the ARCH effect, while the diagonal elements in matrix G measure the GARCH effect. As
shown in Table 3, the estimated diagonal parameters a22 through a44 are statistically significant implying
presence of ARCH effect in the stock markets of Brazil, Russia, India and China while parameters g11
through g44 are all statistically significant, indicating a strong GARCH (1,1) process driving the conditional
variances of all the indices. The magnitude of own volatility presented by GARCH parameter is highest in
stock market of China followed by India, Brazil and Russia suggesting own volatility largely affect their
conditional variance.
The off-diagonal elements of matrix A and G capture the cross-market effects such as shock
spillover and volatility spillover among the six stock exchanges. Firstly, we find evidence of bidirectional
shock transmissions between Bovaspa and RTSI, Bovaspa and SSE, between BSE and RTSI as the pairs
of off-diagonal parameters a12 and a21, a14 and a41, a23 and a32 are statistically significant. The two way
shock spillover indicates strong connection between the stock markets. The bidirectional shock spillover
indicates the news about shocks in one stock exchange affect the volatility of other stock exchange and
vice-versa. In terms of cross-shock spillover effects in the markets, past innovations in Brazil have the
greatest effect (0.314) on future volatility in India. The significant a42 and a31 (their counter parts are
insignificant) indicate unidirectional shock spillover from China to Russia, From India to Brazil.
International Journal of Marketing & Financial Management, Volume 2, issue 7, Aug-2014, pp 01-10
9 | P a g e
Secondly, there are bidirectional volatility linkages between Brazil and Russia, Brazil and India,
between Brazil and China as respective coefficients in g are statistically significant. It indicates that the
conditional variance of one index depends on past volatility of the other index, implying strong connection
between them. Own-volatility spillovers in all markets are large and significant. The overall persistence of
stock market volatility is highest for china (0.987) and lowest for Russia (0.889). In terms of cross
volatility persistence in the stock markets, the past volatility shocks in Brazil have effect (0.379) on the
future volatility in Russia.
In the meanwhile, the statistically significant g32 and insignificant g23 indicate unidirectional
volatility spillover from India to Russia. There is no bidirectional volatility linkages between Russia and
China.
5. Summary
The study investigates volatility spillover effect between the stock markets in Brazil, Russia, India
and China. Summary statistics of returns series of all the stock exchanges suggest that they are
leptokurtic, having significantly fatter tails and higher peaks. Generalized Autoregressive Conditional
Heteroscedasticity (GARCH) models are capable of dealing with the property of the data.
By applying a multivariate asymmetric GARCH approach to the daily stock indices, the study
found evidence of linkages in terms of volatility. We find evidence of bidirectional shock transmissions
between Brazil and Russia, Brazil and China and between Russia and India. In terms of cross-shock
spillover effects in the markets, past innovations in Bovaspa of Brazil have the greatest effect (0.314) on
future volatility in India. Our results reveal unidirectional shock spillover from China to Russia, From
India to Brazil.
There are bidirectional volatility linkages between Brazil and Russia, Brazil and India, between
Brazil and China. There is also unidirectional volatility spillover from India to Russia. The overall
persistence of stock market volatility is highest for China (0.987) and lowest for Russia (0.889).
References:
Ahmad, Ashraf and Ahmed (2005), “Is the Indian stock market integrated with the US and Japanese stock
markets?: An empirical analysis”‟ South Asia economic journal, 193-206.
Bhattacharya and Samanta (2001), “A tale of two indices: the story of the NASDAQ and The Sensex”, Journal
of Quantitative Economics, 1(1), pp. 89-102.
Bollerslev, Engle and Wooldridge (1988), “A capital asset pricing model with time-varying covariances”,
Journal of political economy, 96, 116-131.
Brooks Chris(2008), Introductory Econometrics for Finance, Cambridge University Press, UK.
Chelley and Steeley (2005), “Modeling equity market integration using smooth transition analysis: a study of
eastern European stock markets”, Journal of International Money and Finance, 24, 818-831.
Chou, Lin and Wu(1999), “Modeling the Taiwan stock market and international linkages”, Pacific Economic
Review, 4, 305-320.
Chung Yin-Wong and Ng Lillian (1992), “Interactions Between the U.S. and Japan Stock Market Indices”,
Journal of International Financial Markets, Institutions and Money, 2(2), pp. 51-69.
Dickey D. and Fuller W., (1979) „Distribution of the estimates for Autoregressive time series with a unit root‟,
Journal of American Statistical Association, 74, 427-31.
Dickey, D. & Fuller W., (1981) „Likelihood Ratio Statistics for Autoregressive Time Series with a Unit Root‟,
Econometrica, 49, 1057 – 72
International Journal of Marketing & Financial Management, Volume 2, issue 7, Aug-2014, pp 01-10
10 | P a g e
Engle and Kroner(1995), “Multivariate simultaneous generalized ARCH”, Econometric Theory, 11, 122-150.
Eun C., and Shim S, (1989), “International Transmission of Stock Market Movements”, Journal of Financial
and Quantitative Analysis, 24(2), 241-255.
Harris and Pisedtasalasai (2006), “Return and volatility spillovers between large and small stocks in the UK”,
Journal of Business Finance and Accounting, 1-16.
Hogue (2007), “Co-movement of Bangladesh stock market with other markets: cointegration and error
correction approach”, Managerial Finance, 33(10),810-820.
Joshi (2011), “Return and Volatility Spillovers Among Asian Stock Markets”, Sage Open, pp.1-8. The article is
available at; http://sgo.sagepub.com/content/early/2011/06/10/2158244011413474
Karolyi (1995), “A Multivariate GARCH model of international transmissions of stock returns and volatility:
The case of the United States and Canada”, Journal of Business and Economic Studies, 13(1), 11-24.
Kroner, K. and Ng, V.(1998), “Modeling asymmetric comovements of asset returns”, The review of Financial
Studies, 11, 817-44.
Li (2007), “International Linkages of the Chinese stock exchanges: a multivariate GARCH analysis”, Applied
Financial Economics, 17, 285-295.
Ng Thiam (2002), “Stock Price Movements in South-East Asia”, Asian Economic Journal, 16(4), pp.353-77.
Scheicher(2001), “The comovements of stock markets in Hungary, Poland and the Czech republic”,
International Journal of Finance and Economics, 6, 27-39.
Voronkova (2004), “Equity market integration in Central European stock markets: A cointegration analysis
with shifting regimes”, International Review of Financial Analyst, 13, 633-647.
Wing-Keung Wong & Agarwal Aman & Jun Du, (2005), "Financial Integration for India Stock Market, a
Fractional Cointegration Approach," Departmental Working Papers wp501, National University of Singapore,
Department of Economics.
Worthington and Higgs (2004), “Transmission of Equity returns and volatility in Asian developed and
emerging markets: A multivariate GARCH analysis”, International Journal of Finance and Economics, 9, 71-
80.
Yang, Hsiao, Li and Wang (2006), “The emerging market crisis and stock market linkages: further evidence”,
Journal of Applied Econometrics, 21, 727-744.
Related Documents