Louisiana Tech University Louisiana Tech Digital Commons Doctoral Dissertations Graduate School Spring 2013 Multiscale modeling of enzyme-catalyzed methanol production by particulate methane monooxygenase Katherine K . Bearden Follow this and additional works at: hps://digitalcommons.latech.edu/dissertations Part of the Biochemistry Commons , Inorganic Chemistry Commons , and the Other Chemical Engineering Commons

Welcome message from author
This document is posted to help you gain knowledge. Please leave a comment to let me know what you think about it! Share it to your friends and learn new things together.
Transcript

Louisiana Tech UniversityLouisiana Tech Digital Commons
Doctoral Dissertations Graduate School
Spring 2013
Multiscale modeling of enzyme-catalyzedmethanol production by particulate methanemonooxygenaseKatherine K. Bearden
Follow this and additional works at: https://digitalcommons.latech.edu/dissertations
Part of the Biochemistry Commons, Inorganic Chemistry Commons, and the Other ChemicalEngineering Commons
MULTISCALE MODELING OF ENZYME-CATALYZED
METHANOL PRODUCTION BY PARTICULATE
METHANE MONOOXYGENASE
by
Katherine K. Bearden, B.S, M.S.
A Dissertation Presented in Partial Fulfillment o f the Requirements o f the Degree
Doctor o f Philosophy
COLLEGE OF ENGINGEERING AND SCIENCE LOUISIANA TECH UNIVERSITY
May 2013

UMI Number: 3573581
All rights reserved
INFORMATION TO ALL USERS The quality of this reproduction is dependent upon the quality of the copy submitted.
In the unlikely event that the author did not send a complete manuscript and there are missing pages, these will be noted. Also, if material had to be removed,
a note will indicate the deletion.
Di!ss0?t&iori Publishing
UMI 3573581Published by ProQuest LLC 2013. Copyright in the Dissertation held by the Author.
Microform Edition © ProQuest LLC.All rights reserved. This work is protected against
unauthorized copying under Title 17, United States Code.
ProQuest LLC 789 East Eisenhower Parkway
P.O. Box 1346 Ann Arbor, Ml 48106-1346

LOUISIANA TECH UNIVERSITY
THE G R ADUATE SCH O O L
________________March 21,2013Date
We hereby recommend that the dissertation prepared under our supervision by
Katherine K. Bearden, M.S.__________________________________________________
entitled Multiseale Modeling o f Enzyme-Catalyzed______________________________
Methanol Production by Particulate Methane Monooxygenase____________________
be accepted in partial fulfillment of the requirements for the Degree of
Doctor of Philosophy in Engineering______________________
■Supervisor of Dissertation Research
Head of Department
Department
Recomi Son concurred in:
>_ s
Approved:
Advisory Committee
Approved:
Directdrof Graduate Studies
Dean of the College
Dean of theGraduate School
GS Form 13(8/10)

ABSTRACT
In this work, the conversion of methane to methanol by the particulate Methane
Monooxygenase (pMMO) enzyme is investigated using a multi-scale modeling approach.
This enzyme participates in carbon cycling and aids in the removal of harmful
atmospheric methane, converting it to methanol. The interaction between pMMO and a
neighboring enzyme that is present in the same organism is studied, and the unknown
pMMO active site is elucidated and tested for methane oxidation towards the production
of methanol.
Fundamental knowledge o f pMMO’s mechanism is not fully understood.
Understanding how this enzyme works in nature will provide information towards
designing efficient synthetic catalysts through biomimetics, which can mitigate the
harmful effects of methane in the atmosphere. These studies could also lead to the
development o f new synthetic catalysts that could impact the use o f methanol as a
cleaner, and greener, energy source. The practical application o f this study would become
fruitful once the mechanism is determined, mimicked, and then applied to create biofuels,
synthetically.
This work focuses on the fundamental research o f the kinetics o f an important
catalyzed chemical reaction that relates to environmental biocatalysis, and involves
atmospheric methane consumption (oxidation) for the production of fuel (methanol).

Mimicking these same reactions in industrial settings has the potential to also reduce the
harmful effects o f methane while producing methanol as a desirable alternative fuel.
Although experimental techniques have indicated a region o f interest where the
reaction is thought to take place, the novelty o f this research begins with uniquely
studying the interactions between MDH and pMMO by examining the docking regions of
the enzymes to deduce an active region. Secondly, reaction mechanisms are proposed,
and information about the kinetics of the methane oxidation process reaction is obtained.
Transition state structures are determined and energy barriers estimated. Lastly,
macroscopic reaction rates are determined through Kinetic Monte Carlo calculations to
support the favored reaction pathways and demonstrate real-time oxidation reactions
while observing the behavior o f the pMMO system. Details from each of these
techniques provide information to further the understanding o f how pMMO oxidizes
methane.

APPROVAL FOR SCHOLARLY DISSEMINATION
The author grants to the Prescott Memorial Library of Louisiana Tech University
the right to reproduce, by appropriate methods, upon request, any or all portions o f this
Dissertation. It is understood that “proper request” consists o f the agreement, on the part
of the requesting party, that said reproduction is for his personal use and that subsequent
reproduction will not occur without written approval o f the author o f this Dissertation.
Further, any portions o f the Dissertation used in books, papers, and other works must be
appropriately referenced to this Dissertation.
Finally, the author of this Dissertation reserves the right to publish freely, in the
literature, at any time, any or all portions o f this Dissertation.
Authpr-
GS Form 14(8/10)

DEDICATION
To my parents who taught me the power o f prayer and persistence.

*
TABLE OF CONTENTS
ABSTRACT.................................................................................................................................. iii
DEDICATION..............................................................................................................................vi
LIST OF TABLES...................................................................................................................... xii
LIST OF FIGURES...................................................................................................................xiii
ACKNOWLEDGMENTS........................................................................................................ xix
CHAPTER 1 ...................................................................................................................................1
INTRODUCTION.........................................................................................................................1
1.1 M ethane.........................................................................................................................1
1.1.1 Methane as a Pollutant............................................................................................1
1.1.2 Methane Derivative as Fuel................................................................................... 1
1.1.3 Bioremediation of Methane Performed by Paddy Plants.................................. 3
1.2 Enzymatic Reactions....................................................................................................4
1.2.1 Description and Advantages o f Enzymatic Reactions...................................... 4
1.2.2 Metalloenzymes for Small Molecule Catalysis..................................................6
1.3 Dissertation Overview.................................................................................................7
CHAPTER 2 LITERATURE REVIEW .....................................................................................9
2.1 Methanol Dehydrogenase..........................................................................................10
2.1.1 MDH Structure........................................................................................................11
2.1.2 Oxidation of Methanol by MDH......................................................................... 11
2.1.3 MDH/pMMO Interaction..................................................................................... 12
2.2 Particulate Methane Monooxygenase......................................................................13
vii

viii
2.2.1 Two Forms of Methane Monooxygenase..........................................................13
2.3 Structure o f pM M O .................................................................................................... 14
2.3.1 Evolution of Structure Composition...................................................................16
2.3.1.1 PDB Energy 1 YEW - Methylococcus capsulatus (B ath)...................... 16
2.3.1.2 PDB Entry 3CHX - Methylococcus trichosporium O B 3b..................... 17
2.3.2 Metal Centers.......................................................................................................... 19
2.3.2.1 Monocopper Center......................................................................................20
2.3.2.2 Dicopper Center............................................................................................ 21
2.3.2.3 Tricopper Center........................................................................................... 22
2.4 Overview of Methane Oxidation Mechanism by MMO........................................22
2.4.1 Proposed Mechanisms......................................................................................... 22
2.4.2 Dioxygen Scission and C - H Bond Activation................................................23
2.4.2.1 Dioxygen Scission........................................................................................ 23
2.4.2.2 C-H Bond Activation....................................................................................24
2.5 pMMO Mechanism.....................................................................................................25
2.5.1 H-Abstraction and Methyl Shift M echanisms..................................................26
2.6 Research Objectives.................................................................................................... 30
2.7 Summary.......................................................................................................................31
CHAPTER 3 METHODOLOGY..............................................................................................33
3.1 Potential Energy Surface........................................................................................... 33
3.2 Molecular M odeling................................................................................................... 34
3.3 Quantum Mechanics................................................................................................... 36
3.3.1 Density Functional Theory..................................................................................38
3.3.2 Basis Sets................................................................................................................ 40
3.3.3 Transition State Theory and Reaction Rates..................................................... 41
3.4 Forcefields................................................................................................................... 42
3.5 Molecular Mechanics..................................................................................................44
3.6 Molecular Dynamics...................................................................................................45
3.7 Classical Monte Carlo and Kinetic Monte Carlo....................................................46
3.7.1 Classical Monte Carlo........................................................................................... 47
3.7.2 Kinetic Monte C arlo............................................................................................. 47
3.7.3 CARLOS Background.......................................................................................... 49
3.8 Summary.......................................................................................................................50
CHAPTER 4 PMMO/MDH INTERACTION WITH SUBSTRATES...............................52
4.1 Introduction.................................................................................................................. 52
4.2 Models o f MDH and pMMO Enzym es................................................................... 53
4.3 Computational Details and Procedure......................................................................57
4.3.1 Approach of Substrates......................................................................................... 62
4.4 Results and Discussion...............................................................................................63
4.4.1 Interaction o f pMMO and MDH in the Presence o f M ethane........................ 63
4.4.2 Diffusion Coefficients........................................................................................... 67
4.4.3 Atomic Distance Measurements within the pMMO Active S ite ....................72
4.5 Summary.......................................................................................................................79
CHAPTER 5 H-ABSTRACTION AND METHYL-SHIFT METHANE OXIDATION MECHANISMS...........................................................................................................................80
5.1 Introduction.................................................................................................................. 80
5.2 Model Construction and Computational D etails....................................................81
5.2.1 Mechanism Proposal Details for M odel.............................................................82
5.2.1.1 Metal Centers................................................................................................82
5.2.1.2 Nitrogen.........................................................................................................83
5.2.1.3 Charges..........................................................................................................83

X
5.2.1.4 Oxygen............................................................................................................ 85
5.2.2 Computational D etails...........................................................................................85
5.3 Results and Discussion.............................................................................................. 8 6
5.3.1 Description...............................................................................................................8 6
5.3.2 pMMO Active Site: C ^C u 1 Scenario..................................................................87
5.3.2.1 Results o f the Cu'Cu1 Scenario....................................................................87
5.3.2.2 Discussion o f the C u tu 1 Scenario............................................................. 91
5.3.3 pMMO Active Site: CunCun Scenario.................................................................91
5.3.3.1 Results o f the CunCuH Scenario..................................................................92
5.3.3.2 Discussion of the CunCun scenario............................................................ 92
5.3.4 Modified H-Abstraction and Methyl Shift M echanisms..................................93
5.3.4.1 C u tu 1 Scenario in the pMMO Active Site................................................96
5.3.4.2 Discussion o f the Cu'Cu1 Scenario............................................................. 97
5.3.4.3 CunCuH Scenario in the pMMO Active Site........................................... 100
5.3.4.4 Discussion o f the CunCun Scenario in the pMMO Active Site 103
5.3.5 Overall Conclusions..............................................................................................106
5.4 Summary.....................................................................................................................106
CHAPTER 6 KINETIC MONTE CARLO STUDIES.........................................................107
6.1 Introduction................................................................................................................ 107
6.2 Input Parameters for CARLOS 4.1.........................................................................108
6.2.1 Density Functional Theory..................................................................................108
6.2.2 Transition State Theory.........................................................................................109
6.2.3 Molecular Dynamics.............................................................................................109
6.3 Computational Specifications & Assumptions..................................................... 110
6.4 Procedure................................................................................................................... 113
xi
6.5 Results and Discussion............................................................................................. 115
6 . 6 Summary..................................................................................................................... 123
CHAPTER 7 CONCLUSIONS AND FUTURE W ORK.................................................... 124
7.1 Conclusions................................................................................................................. 124
7.2 Future Work................................................................................................................ 127
7.2.1 Computational Studies.........................................................................................127
7.2.2 Experimental Work.............................................................................................. 129
APPENDIX A KMC IMAGES FROM CARLOS PROGRAM.................................. 132
A. 1 kMC Outputs from CARLOS...................................................................................133
APPENDIX B ENGINEERING EDUCATION AND OUTREACH..........................143
B.l Experiences.................................................................................................................144
B.2 Abstract....................................................................................................................... 145
BIBLIOGRAPHY......................................................................................................................146

LIST OF TABLES
Table 4-1: Diffusion Coefficients for specified atoms and molecules within the pMMO and pMMO/MDH systems with the addition o f substrates..................................... 6 8
Table 4-2: Distance between atoms in the coordinating environment afterdynamic simulation of 200 ps on the pMMO system. Figure 4-9 can be referencedfor a diagram of the coordinating environment........................................................................73
Table 4-3: Distance between atoms in the coordinating environment after dynamic simulation o f 200 ps on the pMMO/MDH system. Figure 4-9 can be referenced for a diagram o f the coordinating environment....................................................73
Table 5-1: Distance between atoms in the coordinating environment o f theCu’Cu1 scenario for the mH-A Mechanism.............................................................................. 97
Table 5-2: Distance between atoms in the coordinating environment o f theCu'Cu1 scenario for mM-S Mechanism.....................................................................................97
Table 5-3: Distance between atoms in the coordinating environment o f theCunCun scenario for mH-A Mechanism. Figure 4-9 can be referenced for theactive site configuration............................................................................................................ 1 0 2
Table 5-4: Distance between atoms in the coordinating environment o f theCunCun scenario for mM-S Mechanism. Figure 4-9 can be referenced for theactive site configuration............................................................................................................ 1 0 2
•yTable 6-1: Slope and R value for the rate o f diffusion versus time plots for singleactive site configurations for the initial substrate additions o f fifty, one hundred,and two hundred......................................................................................................................... 1 2 1

LIST OF FIGURES
Figure 1-1: Particulate methane monooxygenase (pMMO) and Methanol Dehydrogenase (MDH) co-localized in the rhizosphre o f a paddy plant. Methane is oxidized by pMMO which is subsequently used as fuel for MDH.....................................4
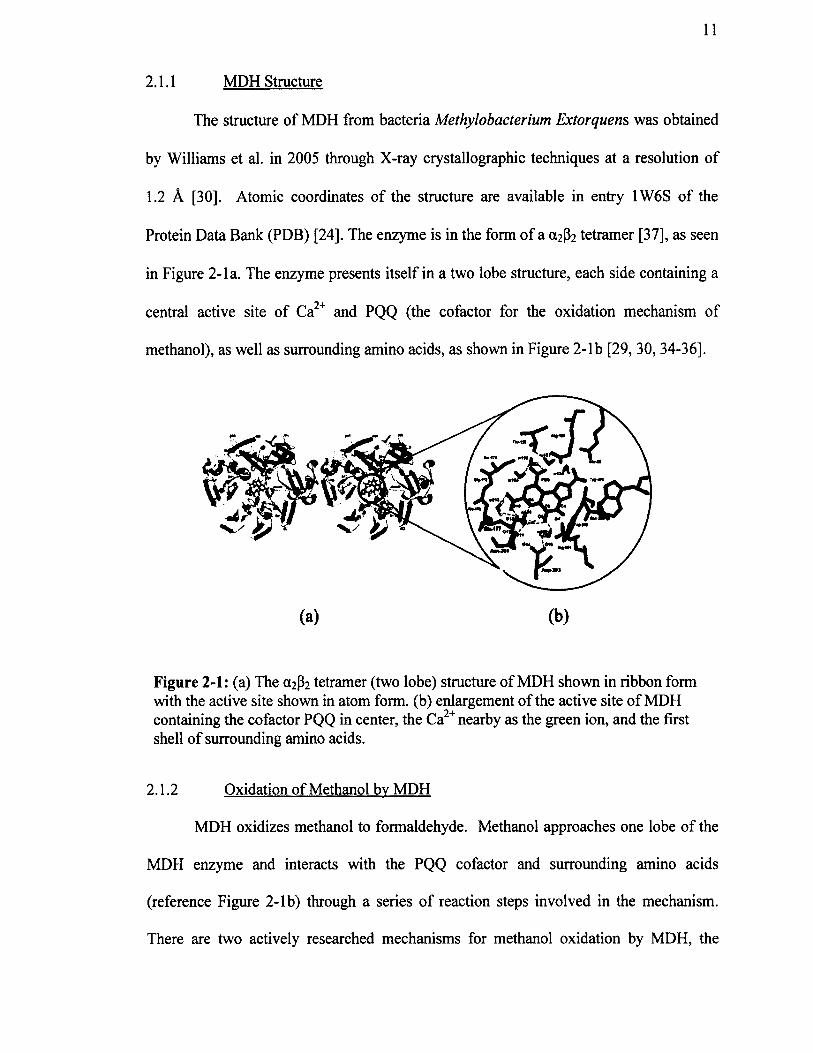
Figure 2-1: (a) The 012P2 tetramer (two lobe) structure of MDH shown in ribbon form with the active site shown in atom form, (b) enlargement o f the active site o f MDH containing the cofactor PQQ in center, the Ca2+nearby as the green ion, and the first shell o f surrounding amino acids................................................................................. 1 1
Figure 2-2: The structure of Methylosinus trichosporium OB3b particulatemethane monooxygenase (pMMO) [55] entry CH3X of the Protein Data Bank[24] showing three polypeptide chains arranged in a 013P3Y3 configuration......................... 15
Figure 2-3: The structure of Methylosinus trichosporium OB3b particulatemethane monooxygenase (pMMO) entry CH3X [55] of the Protein Data Bank[24] with the dicopper ions magnified in size and the region of the pmoB subunitshighlighted with yellow boxes. The monocopper ions are also magnified in sizeand are highlighted in red boxes.................................................................................................18
Figure 2-4: The structure of Methylosinus trichosporium OB3b particulate methane monooxygenase (pMMO) entry CH3X [55] o f the Protein Data Bank [24] shown in stick form with the copper ions magnified in size showing a distance of approximately 20 A between the monocopper and dicopper sites. The surrounding amino acids remain in stick form.........................................................................20
Figure 2-5: Proposed H-Abstraction mechanism................................................................... 28
Figure 2-6: Proposed Methyl —Shift mechanism....................................................................29
Figure 2-7: Depiction of intermediate structures for the proposed H-A and M-S mechanisms. Hydrogen atoms are white, oxygen atoms are red, carbon atoms are grey, and copper atoms are orange. The surrounding histidine molecules are shown in stick form..................................................................................................................... 30
Figure 3-1: (a) Three dimensional representation o f the Potential Energy Surface(left), (b) The configurations A and B will give the same (local) minimum, but Cwill lead to another (global) minimum (right) [81].................................................................34

xiv
Figure 4-1: The structure o f Methylosinus trichosporium OB3b particulatemethane monooxygenase (pMMO) entry CH3X [55] o f the Protein Data Bank[24] with the dicopper ions shown in orange o f the center. The three closestsurrounding histidine molecules are colored yellow and the remainingsurrounding amino acids are colored by composition (oxygen is red, nitrogen isblue, carbon is grey, hydrogen is white)................................................................................... 54
Figure 4-2: Three dimensional enzyme structure o f pMMO from entry CH3X [55] from the PDB [24] visualized in Materials Studio® (left). Reduced model of active region with three histidine molecules (highlighted green) and two copper ions (orange) (right).....................................................................................................................55
Figure 4-3: Three dimensional MDH enzyme model created from entry 1W 6 S [30] o f the Protein Data Bank [24]. The active site elements o f PQQ and Ca2+ are shown in ball and stick form to emphasize location............................................................... 56
Figure 4-4: Minimum energy configuration of the pMMO/MDH complex. The active site elements o f pMMO are three histidine molecules and a dicopper center.The active site elements o f MDH are the PQQ molecule and the calcium ion...................56
Figure 4-5: Minimized energy of pMMO and MDH/pMMO models withincreasing quantities of substrates............................................................................................. 59
Figure 4-6: Minimized energy of configuration o f pMMO with two methane molecules (pink) and two oxygen atoms (red) surrounding the dicopper center (orange). The surrounding amino acids are shown in green with the three closest histidine enlarged in size to show surrounding........................................................................60
Figure 4-7: (a) Minimized energy o f configuration of pMMO/MDH system (pMMO green, MDH blue) submerged in a water box. The pink shell is a visualization aid to show the enzyme surrounded in the water box. (b) The pMMO/MDH interface with the addition o f substrate molecules. The left side is pMMO with the enlarged orange copper ions, enlarged red oxygen atoms, and smaller green amino acids. The right side is MDH with the calcium ion enlarged and all amino acids shown in blue. The pink amino acids seen in the magnifiedview are from the visualization shell.........................................................................................61
Figure 4-8: Accessible hydrophobic pocket highlighted to show access to copper ions. The original pMMO structure is shown (top left) and then Van der Waals pMMO surface (solid blue) is used to show a dicopper site accessible to substrate molecules...................................................................................................................................... 63
Figure 4-9: Diagram of labeled atoms for coordinating environment. N1 is for singly bonded nitrogen, N2 for double bonded nitrogen........................................................64

XV
Figure 4-10: Distances between atoms and ions o f the dicopper site for the pMMO model. N1 is for singly bonded nitrogen, N2 for double bonded nitrogen.The ring of the histidine is shown in ball and stick form while the side chain isshown in line form....................................................................................................................... 65
Figure 4-11: Distances between atoms and ions o f the dicopper site for the pMMO/MDH model. N 1 is for singly bonded nitrogen, N2 for double bonded nitrogen. The ring of the histidine is shown in ball and stick form while the side chain is shown in line form........................................................................................................ 6 6
Figure 5-1: Proposed active site of pMMO with dicopper center (orange) andthree coordinating amino acids His 40, His 144, His 146...................................................... 82
Figure 5-2: Energy Diagram for the C u tu 1 scenario o f the H-Abstraction (H-A)and Methyl Shift (M-S) mechanisms.........................................................................................8 8
Figure 5-3: Screen shots o f the optimized configurations o f for H-Abstraction (H-A) mechanism steps. The dicopper site, oxygen, and methane are shown in balland stick form for easy examination o f the active species. The His 40, His 144,and His 146 are shown in line form...........................................................................................89
Figure 5-4: Screen shots o f the optimized configurations o f for Methyl Shift (M-S). The dicopper site, oxygen, and methane are shown in ball and stick form foreasy examination o f the active species. The His 40, His 144, and His 146 areshown in line form....................................................................................................................... 90
Figure 5-5: Energy Diagram for the CunCun scenario o f the H-Abstraction (H-A) and Methyl Shift (M-S) mechanisms........................................................................................ 92
Figure 5-6: Screen shots of the optimized configurations o f the Modified H-Abstraction (mH-A) mechanism steps. The dicopper site, oxygen, and methaneare shown in ball and stick form for easy examination of the active species. TheHis 40, His 144, and His 146 are shown in line form............................................................. 94
Figure 5-7: Screen shots o f the optimized configurations o f the Modified Methyl Shift (mM-S) mechanism steps. The dicopper site, oxygen, and methane are shown in ball and stick form for easy examination of the active species. The His 40, His 144, and His 146 are shown in line form.................................................................... 95
Figure 5-8: Energy Diagram for the Modified C u t u 1 scenario o f the H-Abstraction (mH-A) and Methyl Shift (mM-S) mechanisms................................................96
Figure 5-9: Energy Diagram for the Modified CunCun scenario o f the H- Abstraction (mH-A) and Methyl Shift (mM-S) mechanisms.............................................. 101

xvi
Figure 6-1: Three dimensional enzyme structure from the CH3X entry [55] o f the PDB [24] visualized in Materials Studio® (left). Two-dimensional enzyme structure o f pMMO portrayed on lattice in CARLOS program [87, 101] as input structure(right)............................................................................................................................ 1 1 0
Figure 6-2: A dicopper active site o f the pMMO enzyme with amino acids (left).The CARLOS output (post kMC nm) is shown (right) with the active site (green dots), surrounding amino acids (black dots), substrate molecules (red dots), and product molecules (blue dots)...................................................................................................113
Figure 6-3: CARLOS visuals o f (a) input file with all three active sites (green dots) and an initial setup of fifty substrate molecules(red dots) And (b)the final configuration with the methanol product formation (blue dots)........................................ 114
Figure 6-4: Concentration versus time for kMC simulation of methane substrates interacting with pMMO active sites. The amount o f substrate, shown in blue, decreases over time. The amount o f product, shown in red, is initially zero and increases throughout the allowed time limit...........................................................................116
Figure 6-5: Rate of formation of product for a single active site (two copper ions)with initial substrate additions of fifty, one hundred, and two hundred over aperiod of five thousand seconds............................................................................................... 117
Figure 6-6: Rate o f formation of product for a single active site (two copper ions)with initial substrate additions of fifty, one hundred, and two hundred over aperiod of five thousand seconds with the incorporation the diffusion coefficient............118
Figure 6-7: Rate o f formation of product for three active sites (six copper ions)with initial substrate additions o f fifty, one hundred, and two hundred over aperiod of five thousand seconds............................................................................................... 119
Figure 6-8: Rate of formation of product for three active sites (six copper ions)with initial substrate additions of fifty, one hundred, and two hundred over aperiod of five thousand seconds with the incorporation the diffusion coefficient............1 2 0
Figure A-l: pMMO 2-D Lattice Model for six copper ions (green dots). In the initial structure (left) there are fifty methane substrates (red dots). Methanol product formation (blue dots) is seen in the final structure (right). Obstacles, or surrounding amino acids, are also shown (black dots)......................................................... 133
Figure A-2: pMMO 2-D Lattice Model for six copper ions (green dots). In the initial structure (left) there are 100 methane substrates (red dots). Methanol product formation (blue dots) is seen in the final structure (right). Obstacles, or surrounding amino acids, are also shown (black dots)......................................................... 134
Figure A-3: pMMO 2-D Lattice Model for six copper ions (green dots). In the initial structure (left) there are 200 methane substrates (red dots). Methanol product formation (blue dots) is seen in the final structure (right). Obstacles, orsurrounding amino acids, are also shown (black dots)..........................................................135
Figure A-4: pMMO 2-D Lattice Model for two copper ions (green dots). In the initial structure (left) there are fifty methane substrates (red dots). Methanol product formation (blue dots) is seen in the final structure (right). Obstacles, or surrounding amino acids, are also shown (black dots)..........................................................135
Figure A-5: pMMO 2-D Lattice Model for two copper ions (green dots). In the initial structure (left) there are one hundred methane substrates (red dots).Methanol product formation (blue dots) is seen in the final structure (right).Obstacles, or surrounding amino acids, are also shown (black dots)................................. 136
Figure A-6: pMMO 2-D Lattice Model for two copper ions (green dots). In the initial structure (left) there are two hundred methane substrates (red dots).Methanol product formation (blue dots) is seen in the final structure (right).Obstacles, or surrounding amino acids, are also shown (black dots)................................. 137
Figure A-7: pMMO 2-D Lattice Model for six copper ions (green dots). In the initial structure (left) there are fifty methane substrates (red dots). Methanol product formation (blue dots) is seen in the final structure (right). Obstacles, or surrounding amino acids, are also shown (black dots). In this trial the diffusion coefficient has been incorporated.............................................................................................138
Figure A-8: pMMO 2-D Lattice Model for six copper ions (green dots). In the initial structure (left) there are 100 methane substrates (red dots). Methanol product formation (blue dots) is seen in the final structure (right). Obstacles, or surrounding amino acids, are also shown (black dots). In this trial the diffusion coefficient has been incorporated.............................................................................................139
Figure A-9: pMMO 2-D Lattice Model for six copper ions (green dots). In the initial structure (left) there are two hundred methane substrates (red dots).Methanol product formation (blue dots) is seen in the final structure (right).Obstacles, or surrounding amino acids, are also shown (black dots). In this trialthe diffusion coefficient has been incorporated..................................................................... 140
Figure A-10: pMMO 2-D Lattice Model for two copper ions (green dots). In the initial structure (left) there are fifty methane substrates (red dots). Methanol product formation (blue dots) is seen in the final structure (right). Obstacles, or surrounding amino acids, are also shown (black dots). In this trial the diffusion coefficient has been incorporated.............................................................................................141

Figure A -ll: pMMO 2-D Lattice Model for two copper ions (green dots). In the initial structure (left) there are one hundred methane substrates (red dots). Methanol product formation (blue dots) is seen in the final structure (right). Obstacles, or surrounding amino acids, are also shown (black dots). In this trial the diffusion coefficient has been incorporated............................................................

ACKNOWLEDGMENTS
I would like to acknowledge my committee members, Dr. Derosa, Dr.
Ramachadran, Dr. DeCoster, and Dr. Bishop, and thank them for their advisory role in
my studies. I would like to thank my advisor, Dr. Daniela Mainardi, for her faith,
patience, and determination in completing this research project. I would like to express
my appreciation of my past and current group members, especially Pumima Kharidehal,
Ancy Kunjumon, Fernando Soto, Dr. Phani Dathar, and in memoriam of Dr. Nagesh
Idupulapati.
One of the most influential experiences at Louisiana Tech University was my
participation in the NSF sponsored GK-12 program. I am indebted to Dr. David Mills for
his leadership in this endeavor and his persistence towards the Fellows’ professional
development. I would also like to thank Dr. Scott Gold, Dr. Tabbetha Dobbins, and Ms.
Amanda May for their guidance during my studies and my internship endeavors.
Most of all, I would like to thank my husband, Steven, as well as the rest o f my
family and friends, for their unyielding support while I have been working toward my
degree. I’d like to especially thank Jesse and Marisa Davis for their hospitality while I
completed my studies. I’d like to thank our daughters, Charlotte and Juliette, for daily
reminding me of the joy o f learning and for reinvigorating my sense o f hope. I thank God
for carrying me through the tough times and keeping me moving forward towards
accomplishing this goal.
CHAPTER 1
INTRODUCTION
1.1 Methane
1.1.1 Methane as a Pollutant
One of the most potent greenhouse gases is methane. Current methane
atmospheric emissions are approximately 500 teragrams (Tg) per year (increasing ~1%
annually) [1]. The majority (90-95%) o f methane on earth is o f biogenic origin, while
other sources include natural oil seepage and oil spills, as from the Deepwater Horizons
oil platform in the Gulf of Mexico in 2010. The toxic effects o f methane and other
hydrocarbons from the spill on the marine environment are still being researched [2 ].
There is a need to remove these harmful pollutants from the atmosphere [2].
Reducing or removing the amount o f methane currently in the environment is a daunting
feat. One possible solution is to convert it to useful fuel, such as methanol which can also
aid in mitigating the harmful effects o f methane in the environment.
1.1.2 Methane Derivative as Fuel
The liquid derivative o f methane is methanol. Methanol is a desirable alternative
fuel but is currently not cost efficient enough to mass produce. The conversion process of
methane to methanol is a complicated process that occurs under parameters consisting of
high/low temperatures and at varying pressures [3]. The industrial methods to synthesize
methanol are not time or cost efficient, and as such, have been reduced in the commercial
1

2
market of alternative fuels. One major hindrance is the capturing and housing of methane
due to its combustibility. In the industry setting, known catalysts require a high operating
temperature of 700-800 °C. Another drawback to this process is that there are side
oxidation reactions of carbon monoxide and carbon dioxide (contained in the feed gas)
during the process that produces a low yield of methane. The use of a catalyst that can
perform the conversion process of methane to liquid hydrocarbons at ambient
temperatures and pressures is desired [4].
Alternative energy sources are of particular interest with the current concerns
surrounding the depletion of fossil fuels. Proposed solutions include using renewable
resources, such as wind, solar, and biomass energy. The use of biological materials
(specifically plant) and a natural process to create energy opened the door to using nature
as a guide to creating more available natural resources.
Biofuels, such as methanol and ethanol, are suggested replacements (and current
additives) to regulated gasoline solutions [5, 6 ]. Methanol is a desirable commercial
product in and of itself, due to its stability in liquid form at ambient temperatures and
pressure and its potential for use as fuel.
George A. Olah, a 2005 Nobel Prize winner in Chemistry, wrote and co-authored
literature suggesting a new approach, a “methanol economy” which in part describes a
need for methanol to be used instead of fossil fuels [5]. Still, the hindrance to this
“methanol economy” lies in the difficulty presented in obtaining methanol. Although the
materials used to create the solutions are available in nature, the separation processes to
create/synthesize methanol and ethanol are difficult.

3
1.1.3 Bioremediation of Methane Performed by Paddy Plants
Bioremediation is the metabolization of pollutants by microorganisms. Active
research surrounding bioremediation is prevalent in the area of reducing greenhouse
gases (including methane). Many researchers are currently examining bioremediation
pathways in an effort to apply any information gathered into methods that mimic natural
processes.
Methylotrophs are microorganisms that have the ability to oxidize methane and
other one-carbon compounds, including methanol, formaldehyde, and formate [7, 8 ].
Methylotrophic microorganisms are found within the rhizosphere, or root system, of
paddy plants [9]. Methanotrophic bacteria, a subgroup of the methylotrophs, are
considered an important sink for methane [10,11]. The catalytic ability of Methanotrophs
has a potential commercial use for the biotransformation of numerous organic chemicals
into valuable products. Their capacity for the bioremediation of toxic pollutants has been
well recognized [12-14].
Particulate methane monooxygenase (pMMO) is an example of
Methanotrophic bacteria that uses methane as its sole carbon source [14]. The methanol
product is then further oxidized by the Methanol Dehydrogenase Enzyme (MDH) that is
found to neighbor pMMO in vivo, as shown in Figure 1-1. It has been shown that MDH
and pMMO have direct interaction, and it can be inferred that the MDH/pMMO complex
allows for efficient catalytic function in vitro [15]. Myronova et al. conclude that MDH
docking with pMMO contributes to the stability of the biosystem, and, thus, it aids in
electron transport between the two enzymes, which increases the efficiency of methane
oxidation [15].

4
To biomass
Figure 1-1: Particulate methane monooxygenase (pMMO) and Methanol Dehydrogenase (MDH) co-localized in the rhizosphre of a paddy plant. Methane is oxidized by pMMO which is subsequently used as fuel for MDH.
An example of a bioremediation process performed by pMMO was performed by
Lee et al. where pMMO was used to mineralize the pollutant trichloroethylene (TCE)
from ground water. The enzyme was able to break down TCE into CO2 , water, and
chloride, which allowed for further removal of chloride out of the water [16,17].
1.2 Enzymatic Reactions
1.2.1 Description and Advantages of Enzymatic Reactions
In a normal reaction, the substrate undergoes chemical and structural changes to
become a product. A catalyst is a substance that increases the reaction rate o f a chemical
reaction and remains unchanged after the reaction [18]. A catalyst reduces the activation
energy, which means that the substrate molecules have enough energy to reach a lower
energy transition state. Enzymes are a form of a catalyst, one that is biological in origin,
referred to as a biocatalyst. Enzymes accelerate the rate of the overall reaction by

5
providing catalytic power [18]. The overall enzyme is used as a catalyst to provide an
energetically favorable setting; the active site of an enzyme is the region in the enzyme
where the reaction takes place. Further discussion of active sites in the pMMO enzyme is
included in Chapter 2.
Enzymes are found in most biological settings, including bacteria, plants, and the
human body. One advantage of using enzymes as catalysts is that the enzyme specificity
can be exploited. The properties of the active site of the enzyme dictate the mechanism
that the enzyme will perform. In an enzymatic reaction, the enzyme stabilizes the
transition state (and thus structure) more than the transition state of an un-catalyzed
reaction.
The reduction of activation energy is due to the rearrangement of covalent bonds
during enzyme-catalyzed reactions. Other determinants in lowering the activation energy
can be non-covalent interactions (such as hydrogen bonds, hydrophobic interactions, and
ionic interactions) between the enzyme and the substrate (species that bind to the
enzyme). In some cases, the enzyme can bind to a substrate in a conformation that
resembles an intermediate if it is energetically favorable, indicating a conformational
change. Thus, the enzyme provides an environment in which the transition state is
stabilized [18]. Other conformational changes can occur due to pH or temperature effects
in the enzymatic environment.
In the industrial setting, enzymes are useful for their ability to catalyze specific
reactions and can be used to block side reactions. Such specificity can also be a
drawback due to an inability to interact with other substrates (or substrate molecules) for
which the enzyme is not specific. These parameters are the motivation behind the

increase in enzyme design and engineering [19-21]. In order to expand that research,
fundamental knowledge of the enzyme (and its active site) is essential thus motivating
this dissertation work. There is also a lesser possibility for the poisoning of active sites,
rendering them inoperable. An example of catalyst poisoning is carbon monoxide
poisoning on platinum catalysts where chemical bonding occurs and the site is no longer
usable for catalytic activity.
There are many advantages to using enzymes as catalysts over the traditional
metal catalyst. Advantages include reduced possibility of poisoning of sites, specificity of
substrates, and desirable temperature and pressure parameters. The disadvantages are that
the reaction must be of a biological setting, and the change in reaction rate is lower than
that obtained when most pure metal catalysts are used [19-21].
1.2.2 Metalloenzvmes for Small Molecule Catalysis
Metalloenzymes (or metalloproteins) are being heavily researched for their
potential to serve as small molecular catalysts [22]. The ability to catalyze alkanes and
other small hydrocarbons (including methane) has potential industrial application. In
metalloenzymes, the metal ion is bound to the protein in a specific spot, and it is
coordinated by specific amino acids. The nature of the metal ion(s) and the coordinating
environment dictate the substrates the enzyme is selective to and the mechanism for the
enzyme. Metalloenzymes perform as catalysts by allowing substrates to bind to (or
coordinate with) the available metal center(s) and their surrounding amino acid groups.
Studies of metalloenzymes have been of particular interest because of the
biomimetic (bio-inspired) approach to creating synthetic catalysts. Waldron et al.

7
estimated that one-quarter to one-third of all proteins require metals as part of their
structure and function [23]. An advantage to enzymes containing metals is that they can
offer selectivity between substrates by their metal composition and the size of the
hydrophobic pocket (cavity) that allows for substrates to approach.
Biologists and bio-inorganic chemists have studied the roles of metals and how
they are affiliated with cells, especially how metals compete for placement in enzymes.
Iron is involved with electron transfer and oxygen metabolism in haem form or iron-
sulfur clusters. Nickel is not used by humans but is heavily used by microorganisms.
Zinc only has a single oxidation state in solution, which limits the ability of zinc to
transfer electrons, and is suggested to be used to organize a protein’s structure. Cobalt is
seen to be involved in vitamin B 12 enzymes [23]. Manganese is seen to have a role in
oxygen-evolving photosynthetic bacteria for the enzyme. Copper is involved in many
reactions; but information about its charge, position, and bonding all remain unclear [2 ,
24,25].
The location and function of metal centers differ between organisms, and they can
structure themselves to obtain metal specific binding preferences [23]. The pMMO
enzyme used in this work is a cuprous metalloenzyme. Cuprous enzymes are studied in
the field of bio-organic chemistry, but there is a large void in the literature surrounding
how copper carries out methane oxidation [25].
1.3 Dissertation Overview
The chapters in this dissertation are organized to explain the (1) computational
exploration of locating the active site of pMMO and (2) investigation of the oxidation
mechanism performed by the enzyme. Chapter 2 includes a review of the structural and

8
biochemical information of MDH and pMMO. The objectives of this dissertation are
discussed at the end of that chapter. Chapter 3 provides the explanation of the
computational techniques utilized in this research. Chapter 4 details MDH/pMMO
interactions, including those after the addition of substrate molecules. The investigation
of the oxidation mechanism performed by pMMO will be presented in Chapter 5.
Reaction rates of methane to methanol conversion rates will be detailed in Chapter 6 .
Conclusions and a proposal for future work are contained in Chapter 7. Lastly, Chapter 8
details collaborations and experiences of this research in the K- 1 2 community,
specifically the collaboration with high school biology teacher Tanya Culligan.

CHAPTER 2
LITERATURE REVIEW
The field of enzymatic catalysis, including experimental, computational, and the
collaborations of the two, increases the understanding of the function of a full biological
system. Experimentalists use many spectroscopic techniques to study enzymes,
specifically X-ray crystallography to determine structures and spectroscopic probes to
explore dynamics of a protein’s conformational changes [26]. There are limitations,
however, to experimental procedures, including the equipment and the ability to purify
enzymes in solution for accurate experimentation.
Computations can be performed to examine specific geometries, interactions and
charge effects among other properties. Many computational techniques can be performed
quickly (and in a cost effective manner) to examine transition structures that have only
been theorized through experimental techniques. The other advantage to using
computational methods is that reactions can be studied on timescales (which includes
those necessary for capturing transition state formation), which are not visible through
spectroscopic techniques. Also, the techniques can be used to explore numerous theories
that are prevalent in the field. Computational studies have limitations with regards to
accuracy, efficiency, system size, and time scale.
While this research is strictly computational, the initial structures and location
information for the enzymes in this work were found using experimental techniques.
9

10
2.1 Methanol Dehydrogenase
More than thirty years ago it was suggested that Methanol Dehydrogenase (MDH)
was present in the intracytoplasimc membrane of methanotrophs [27] and has been
experimentally confirmed in multiple bacteria through the work of Branter et al. and
Murrell et al. [16, 28]. The knowledge of its location increased experimentation of the
catalytic function of the enzyme both experimentally and computationally.
The knowledge of pMMO co-localized with MDH suggests that the fuel being fed
to MDH is created by pMMO, which first oxidizes methane to methanol [16, 28], Work
involving the connection of these two enzymes is of interest because if it can be
understood how these enzymes work together in nature, clues to designing efficient
synthetic catalysts (through biomimetics) could be elucidated, with an ultimate goal of
mitigating the harmful effects of methane in the atmosphere, leading to a reduction in
global warming.
The catalytic activity that occurs in enzymes involves the active region of the
enzyme molecule, called the active site. The atomic interactions and molecular
formations that occur in this region compose the mechanism in the case of these
enzymes, an oxidation mechanism. The active site of MDH had been fully characterized
[29, 30], but mechanistic studies are ongoing [31-33].
The study of the crystal structure of MDH from bacteria Methylobacterium
Extorquens has determined that the enzyme has an (X2 P2 tetrameric structure and that its
active site contains a Ca2+ ion, a pyrrolo-quinoline quinine (PQQ), its redox cofactor,
various amino acids and water molecules [29, 30, 34-36].
11
2.1.1 MDH Structure
The structure of MDH from bacteria Methylobacterium Extorquens was obtained
by Williams et al. in 2005 through X-ray crystallographic techniques at a resolution of
1.2 A [30]. Atomic coordinates of the structure are available in entry 1W6S of the
Protein Data Bank (PDB) [24]. The enzyme is in the form of a 012P2 tetramer [37], as seen
in Figure 2-la. The enzyme presents itself in a two lobe structure, each side containing a
central active site of Ca2+ and PQQ (the cofactor for the oxidation mechanism of
methanol), as well as surrounding amino acids, as shown in Figure 2-lb [29, 30, 34-36].
(a) (b)
Figure 2-1: (a) The (X2 P2 tetramer (two lobe) structure of MDH shown in ribbon form with the active site shown in atom form, (b) enlargement of the active site of MDH containing the cofactor PQQ in center, the Ca2+ nearby as the green ion, and the first shell of surrounding amino acids.
2.1.2 Oxidation of Methanol bv MDH
MDH oxidizes methanol to formaldehyde. Methanol approaches one lobe of the
MDH enzyme and interacts with the PQQ cofactor and surrounding amino acids
(reference Figure 2-lb) through a series of reaction steps involved in the mechanism.
There are two actively researched mechanisms for methanol oxidation by MDH, the
12
Addition-Elimination and the Hydride Transfer [32, 35, 38, 39]. In the Addition-
Elimination mechanism, methanol forms a hemiketal structure with the PQQ cofactor. In
the Hydride Transfer reaction, hydrogen from methanol directly transfers to PQQ. The
proposed mechanisms for MDH are mentioned to show diversity in mechanisms used by
enzymes. More examples follow in Section 2-6.
2.1.3 MDH/pMMO Interaction
MDH is present when the Methylococcus capsulatus (Bath) organism is
expressing pMMO [15, 27, 28, 40]. The expression of pMMO is discussed in detail in
Section 2.2 but is stated here to explain the co-localization of the enzymes. Studies by
Myronova et al. indicate that the presence of MDH is important to the efficiency in the
catalytic function of pMMO. Unique studies performed using analytical
ultracentrifugation (and imaging) show that pMMO can undergo conformational
rearrangement upon binding with MDH [15]. Myronova suggests that MDH and pMMO
form a supracomplex, meaning the two enzymes come together to perform the methane
oxidation pathway. The formation of a supracomplex has also been studied with other
enzymes [41-43].
The methane oxidation performed by pMMO provides the fuel (methanol) that is
sequentially oxidized by MDH. One particular experimental study performed by Lee et
al. involved adding NaCl to the biological pMMO/MDH system to inhibit MDH. When
the system reached a concentration of 300 mM NaCl, MDH was completely inhibited and
pMMO lost half of its original activity. The conclusions drawn from those studies were
that MDH was needed to further convert the methanol to complete the carbon cycle
13
thereby showing the rate of methane oxidation was directly related to further methanol
oxidation [44].
It is suggested that the coupling of the MDH and pMMO enzymes improves
stability and facilitates direct coupling of electron transport between the two leading to a
more efficient conversion of methane to methanol [15]. Joint behavior between pMMO
and MDH has not been investigated using molecular modeling techniques. Further
investigation of the interaction between pMMO and MDH will provide insight into the
currently unknown active region of pMMO and the ability of substrates to approach the
two enzyme system.
2.2 Particulate Methane Monooxygenase
In the metabolic pathway, the conversion of methane to methanol is performed by
the enzyme Methane Monooxygenase (MMO). Methane Monooxygenase, whose
function is catalysis, is an oxidoreductase which has the ability to oxidize the C-H bond
in methane as well as other alkanes [45-47]. The role of monooxygenase reaction is to
catalyze the addition of a single oxygen atom from molecular oxygen into a substrate,
which yields methanol, and to catalyze the reduction of a second oxygen atom in the
substrate to water [48,49].
2.2.1 Two Forms of Methane Monooxveenase
Methane Monooxygenase (MMO) is found in all Methylotrophic bacteria [50],
and it can be grown to express two forms, soluble and particulate. The different forms
present depending on the amount of copper in the growth medium. The particulate form
(pMMO) is present when the copper concentration in the grown medium is above 4 pM.
The soluble form of MMO, termed sMMO, is expressed when the growth medium

14
contains concentrations of copper less than 0.8 pM [25, 46, 51]. Particulate methane
monooxygenase is located in the intracytoplasimc membrane of methanotrophs[16, 28].
Soluble methane monooxygenase has been isolated only from certain strains of
Methanotrophic bacteria, whereas pMMO is found in all methanotrophs but one. The
soluble form has been widely studied and is shown to have a distinct iron active site. The
oxidation mechanism of sMMO is not clearly understood although literature suggests a
high valence diiron core that reduces to Fe2 +Fe2+ during the oxidation reaction. The iron
active site of sMMO is buried in a hydrophobic cavity, but hydrocarbons are able to
approach the active site through an available space [16].
Experiments were run to contrast methane to methanol conversion (and further
processing into biomass) by the sMMO and pMMO forms of M. capsulatus (Bath). It
was shown the pMMO form had a 38% higher conversion over sMMO [52]. These two
forms of MMO have different metal centers and different mechanisms. Yet there remains
a need for information surrounding pMMO, the form of MMO that has a higher catalytic
ability, in order to make it commercially profitable.
As previously mentioned, pMMO is the most active enzyme involved in oxidizing
methane to methanol [12, 53]. Particulate methane monooxygenase is more restricted
than sMMO because it is shown to only oxidize methane and linear short chained
hydrocarbons but not aromatic compounds. It is believed that this is due to the sterically
restricted active site of pMMO [16].
2.3 Structure of pMMO
Rosenzweig’s group has determined the structure of pMMO through the study of
three different bacteria: Methylococcus capsulatus (Bath) (2005/2011) [50, 54],

15
Methylosinus trichosporium 0B3b (2008) [55], and Methylocystis species Strain M
(2011) [54]. All three structures show pMMO composed of three polypeptide chains
arranged in a 013P3Y3 (trimer) configuration, as seen in Figure 2-2 The structure displays
three groupings of three ‘tentacles’ with a hollow area down the middle of the enzyme.
This research focuses on the use of M. trichosporium OB3b because (1) the organism
contains the dicopper that is present in all other forms of pMMO and (2) experimental
studies highly favor using OB3b because it can be grown to express both sMMO and
pMMO. Literature is readily available to describe the growing protocols. Experimental
results provide a platform for comparison for the computational results presented in this
work.
Figure 2-2: The structure of Methylosinus trichosporium OB3b particulate methane monooxygenase (pMMO) [55] entry CH3X of the Protein Data Bank [24] showing three polypeptide chains arranged in a 0 3 ^ 3 7 3 configuration.

16
2.3.1 Evolution of Structure Composition
2.3.1.1 PDB Energy 1YEW - Methvlococcus capsulatus (Bath)
Since the late nineties, there have been numerous papers published aiming to
determine the structural makeup of pMMO and its ability to oxidize methane. In 2005,
evidence was provided by Lieberman et al. in an article published in Nature confirming
the presence of copper and zinc (not iron) in the composition of the enzyme [56]. This
paper was considered revolutionary because it provided the best known structure for the
enzyme which was needed to continue and advance experimental and computational
studies.
Many of the computational chemistry papers prior to the Lieberman et al. 2005
publication had focused on elucidating metal complexes (and mechanisms) formed with
iron in the presence of oxygen as it was utilized in MMO (later distinguished sMMO)
[57, 58]. Although their work provided insight to the metal composition of pMMO, new
information presented an area of interest of mechanisms involving zinc. Suggestions of
zinc and iron in the pMMO enzyme were dismissed and were thought to be products of
the purification process. Later it was proven that the zinc ion was indeed a byproduct of
purification and not part of the actual enzyme [55]. The theory that iron was a metal
center in the enzyme was exciting due to postulations that a mechanism could be
followed similar to one that continues to be heavily researched for the sMMO enzyme.
This critical X-ray crystal structure of pMMO provided by Lieberman et al. was
characterized from Methylococcus capsulatus (Bath) at a 2.8 A resolution [56]. The data
was recorded in the Protein Data Bank under the structure entry 1YEW [24], From the
crystal structure, the group reported that the enzyme consisted of a 300 kDa trimer,

17
composed of a-, P-, and y-subunits(~47kDa, ~24kDa, and ~22kDa, respectively) [59].
Previous structural analysis had not predicted the trimetric structure. X-ray absorption
spectroscopy (XAS) data suggested the active site to be located in the a or P-subunits [56,
59]. The areas of interest included a monocopper site, a dicopper site, and a zinc ion. The
oxidative state of the Cu cluster in pMMO was not determined in the investigation [56].
As previously mentioned, the composition of pMMO was later proven to be absent of
zinc.
2.3.1.2 PDB Entry 3CHX- Methvlococcus trichosporium OB3b
In 2008, a second crystal structure of pMMO from M. trichosporium OB3b was
obtained through X-ray diffraction with a resolution of 3.90 A [55] and is available as
entry CH3X in the PDB [24]. The same a-, p-, and y-subunits were observed the notable
difference between 1YEW and 3CHX being the composition and location of metal
centers.
The comparison of the M. capsulatus Bath and M. trichosporium OB3b structures
has led to reinvestigations of the enzyme and multiple suggestions of the metal
composition found in vivo. Through experiments, it was determined that the M.
capsulatus Bath has both copper and zinc ions present while only copper has been found
when examining the M. trichosporium OB3b enzyme. It has been suggested that certain
ions are not present in vivo, and it is accepted that the presence of zinc ions is due to the
experimental protocol followed during the purification process. The zinc site that is
present in M. capsulatus Bath contains copper in its place in the M. trichosporium OB3b
enzyme.

18
The comparison of the M. capsulatus Bath and M. trichosporium OB3b structures
has elucidated a common dicopper region [25, 45, 55]. More recently, a specific
dicopper region located in the pmoB subunit (shown in Figure 2-3) was found to be
present in all three pMMO structures and site-directed variants of pmoB have shown
activity and coordination by three surrounding histidine molecules. There are still
postulations that this may not be the specific methane oxidation site due to the resolution
used for creating the structure.
Figure 2-3: The structure of Methylosinus trichosporium OB3b particulate methane monooxygenase (pMMO) entry CH3X [55] of the Protein Data Bank [24] with the dicopper ions magnified in size and the region of the pmoB subunits highlighted with yellow boxes. The monocopper ions are also magnified in size and are highlighted in red boxes.

19
2.3.2 Metal Centers
When this research project began in 2006, there was a heavy debate about the ions
present in the enzyme. The first X-ray crystallographic studies found copper, iron, and
zinc [56]. With this information, the computational research area increased with studies
on the iron center, most of which mimicked the work being done to define the ferrous
based mechanism of sMMO [57, 58].
Purifying enzymes for experimental work is difficult [23] and can result in
undesirable metal ion implantation as is thought to be the case with the zinc ion of
pMMO. The determination that zinc does not occur in vivo once again led to increased
activity in the computational field to aid in defining the complex structures and the
oxidation mechanism that utilizes the copper ions as catalysts [25].
In the OB3b form of pMMO there are a total of nine copper ions, three from
monocopper sites and three from the dicopper centers throughout the enzyme (see Figure
2-3). Figure 2-4 shows the distance between the monocopper and dicopper site
(approximately 2 0 A) as it would be in one of the three pmoB subunits.

20
Figure 2-4: The structure of Methylosinus trichosporium OB3b particulate methane monooxygenase (pMMO) entry CH3X [55] of the Protein Data Bank [24] shown in stick form with the copper ions magnified in size showing a distance of approximately 20 A between the monocopper and dicopper sites. The surrounding amino acids remain in stick form.
The information that follows is a review of the experimental and computational
studies performed on the monocopper and dicopper centers of pMMO and their ability to
perform catalysis. The possibility of a tricopper center is also discussed. Computational
groups have studied various CuxOy complexes in an effort to determine if the species is
active in the oxidation mechanism.
2.3.2.1 Monocopper Center
There are three monocopper sites in pMMO, each one located also in the pmoB
subunit as seen previously in Figure 2-3. The monocopper center can combine with
oxygen to create a copper-oxo cupryl. A cupryl site been shown to have ability to
perform methane hydroxylation but possess limited oxidative activity [25].
Computational studies performed by Yoshizawa, Gherman, Decker, and Shiota et al.
suggest that a sole copper (and various moieties) is not capable of oxidizing methane [60-
21
63]. Instead, it is postulated that the monocopper site provides electrons to a nearby
dicopper to assist in the oxidation mechanism.
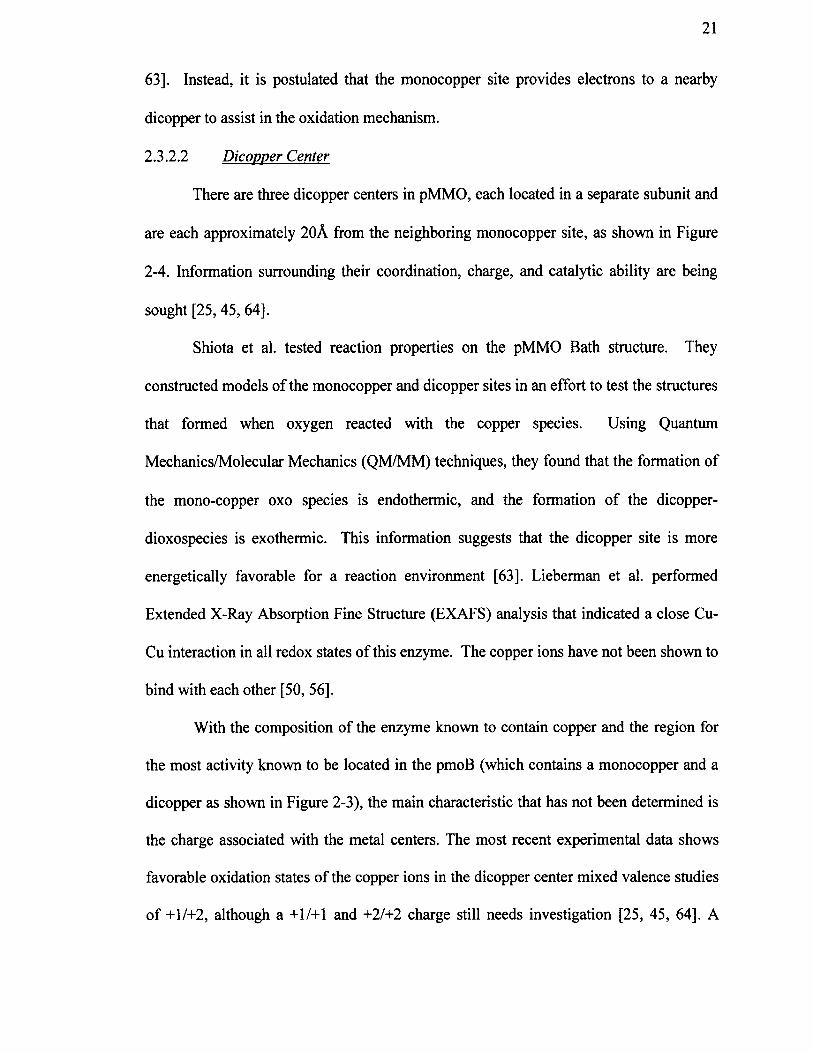
2.3.2.2 Dicopper Center
There are three dicopper centers in pMMO, each located in a separate subunit and
are each approximately 20A from the neighboring monocopper site, as shown in Figure
2-4. Information surrounding their coordination, charge, and catalytic ability are being
sought [25,45, 64].
Shiota et al. tested reaction properties on the pMMO Bath structure. They
constructed models of the monocopper and dicopper sites in an effort to test the structures
that formed when oxygen reacted with the copper species. Using Quantum
Mechanics/Molecular Mechanics (QM/MM) techniques, they found that the formation of
the mono-copper oxo species is endothermic, and the formation of the dicopper-
dioxospecies is exothermic. This information suggests that the dicopper site is more
energetically favorable for a reaction environment [63]. Lieberman et al. performed
Extended X-Ray Absorption Fine Structure (EXAFS) analysis that indicated a close Cu-
Cu interaction in all redox states of this enzyme. The copper ions have not been shown to
bind with each other [50, 56].
With the composition of the enzyme known to contain copper and the region for
the most activity known to be located in the pmoB (which contains a monocopper and a
dicopper as shown in Figure 2-3), the main characteristic that has not been determined is
the charge associated with the metal centers. The most recent experimental data shows
favorable oxidation states of the copper ions in the dicopper center mixed valence studies
of +1/+2, although a +1/+1 and +2/+2 charge still needs investigation [25, 45, 64], A
22
dicopper center is identified as the most probable active center and will be used in all
mechanism studies in this work.
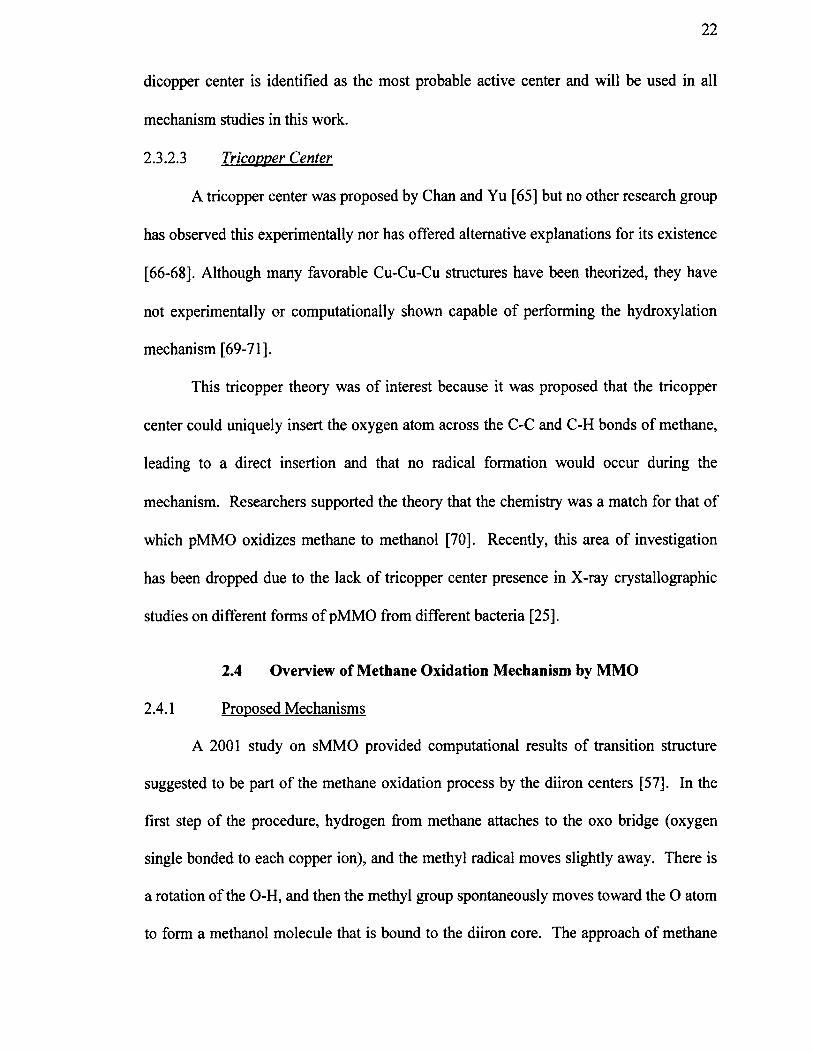
2.3.2.3 Tricopper Center
A tricopper center was proposed by Chan and Yu [65] but no other research group
has observed this experimentally nor has offered alternative explanations for its existence
[6 6 -6 8 ]. Although many favorable Cu-Cu-Cu structures have been theorized, they have
not experimentally or computationally shown capable of performing the hydroxylation
mechanism [69-71].
This tricopper theory was of interest because it was proposed that the tricopper
center could uniquely insert the oxygen atom across the C-C and C-H bonds of methane,
leading to a direct insertion and that no radical formation would occur during the
mechanism. Researchers supported the theory that the chemistry was a match for that of
which pMMO oxidizes methane to methanol [70]. Recently, this area of investigation
has been dropped due to the lack of tricopper center presence in X-ray crystallographic
studies on different forms of pMMO from different bacteria [25].
2.4 Overview of Methane Oxidation Mechanism by MMO
2.4.1 Proposed Mechanisms
A 2001 study on sMMO provided computational results of transition structure
suggested to be part of the methane oxidation process by the diiron centers [57]. In the
first step of the procedure, hydrogen from methane attaches to the oxo bridge (oxygen
single bonded to each copper ion), and the methyl radical moves slightly away. There is
a rotation of the O-H, and then the methyl group spontaneously moves toward the O atom
to form a methanol molecule that is bound to the diiron core. The approach of methane

23
to the oxo-bridge core was also supported by Gherman et al., and the same theory has
been heavily studied in pMMO [57]. The metal centers of pMMO and sMMO differ in
composition, location, and valence, but the use of determined intermediates was followed
[57].
Another insightful study was shown by Yoshizawa in which a Fem metal center
oxidized methane [72]. The uniqueness in this model is that an oxygen atom formed a
double bond with the solo iron center and did not form a bridge arrangement. The
mechanism proceeded with the double bond breaking and forming a FeOH complex, and
the methyl group shifted to bind directly to the iron center. The model proceeds with the
Fe-C bond cleavage and C-0 bond formation (forming methanol) and is the second
transition structure. The research provided evidence that the term “methyl migration”
(often referred to as methyl shift) is a possible pathway for methane hydroxylation
reactions in the sMMO enzyme and models thereof [72, 73]. There was no experimental
evidence of Fe-C bonding [74], The other positive of this work is that the substrate
directly interacts with the metal center [73]. The arguments negating this study were that
it (1) was performed in gas phase, and (2) the Fem center is not present in nature, which
suggests an overall need for further investigation.
2.4.2 Dioxveen Scission and C - H Bond Activation
2.4.2.1 Dioxveen Scission
Some mechanisms have both oxygen molecules (dioxygen) attached to the metal
centers. This suggests that a higher valence metal center is required, ones that are not
seen in nature. There are other biological systems that have binding of O2 , including

24
tyrosinase and catechol oxidase [64]. Most computational mechanism proposals involve
one oxygen atom.
All studies of pMMO reactions begin with the splitting of the dioxygen molecule
due to the nature of the monooxygenase requiring one oxygen. The mechanism proceeds
with a single oxygen atom. The second oxygen is believed to be reduced to water within
the MMO enzyme during the pMMO oxidation reaction [75]. The focus of this study
will begin with only one oxygen atom.
2.4.2.2 C-H Bond Activation
In pMMO, it is proposed that the methane could enter through the lipid bilayer
and accumulate (increase concentration) within the bilayer [45]. Catalytic function
occurs at the active site, but the surrounding area plays an important part of the overall
function in the C-H bond activation [76]. The hydroxylation of methane requires a bond
dissociation energy of 104 kcal mol' 1 to break the C-H bond [55, 77]. It is suggested that
the methyl radical is potentially more reactive than other hydrocarbon radicals due to ( 1 )
C-H bond energy (104 kcal/mol) or (2) accessibility to the active site [75]. The emphasis
of this study does not focus on where the energy for the initial C-H bond is provided; that
is a different field of study. The focus of this study is to propose a mechanism and use
computational techniques to describe the underlying chemical properties of the system.
To emphasize the diversity of mechanisms performed by metal centers, a brief
summary is provided. These mechanisms include C-H activation that can be performed
by a metal-induced carbon-hydrogen bond activation through five different methods. It is
important to recognize that there are many pathways by which metal centers can activate
C-H bonds. The use of metals is shown to assist. There are circumstances where the

25
metal is thought to ( 1 ) separately bond to hydrogen and the remaining radical
(reduction/elimination), (2 ) bind hydrogen to the metal and then bind the remaining
radical group to surrounding ligands (sigma-bond metathesis), (3) have the metal bind to
hydrogen and a ligand, therefore prompting the radical to bind to the ligand (insertion,
elimination), (4) bind hydrogen to the metal center and bind the radical to the
neighboring metal (homolytic by two metals), or (5) bind hydrogen to a ligand and have
the radical bind to the metal center (electrophilic activation) [78].
2.5 pMMO Mechanism
The relevance of the previous mechanism descriptions is to show the relation of
previous studies to the work performed in this research project, which attempts to mimic
pMMO’s mechanism. It is necessary to understand the C-H activation because it leads to
the determination of intermediates when interacting with O2 and metal centers (i.e.
pMMO) [79]. Literature suggests two possible scenarios for the use of copper in the
oxidation reaction. One possibility is the hydrogen atom (from methane) attaches to
copper bond oxygen (H-abstraction) or directly to copper (Methyl Shift). It is also agreed
that the histidine molecules coordinate but do not bond to the copper ions in the reaction
mechanism. It is also generally agreed that a single copper ion is used in the reaction, not
both at the same time except in the case of oxygen forming a bridge between the two
coppers. All of these generalities are still being investigated.
Current research efforts in describing the catalytic activity of pMMO have left
many undetermined properties of the system. It is unknown if both oxygen atoms are
simultaneously used. The exact charge on the individual copper ions is undecided.
Experimental and computational studies have been performed to suggest different oxygen

26
binding structures. It is agreed that the oxygen binds to copper (as opposed to
neighboring histidine) to perform the oxidation mechanism. The significance of the
dicopper center is also intriguing, and this work seeks to understand how the second
copper is involved. Two explanations are that the charges stabilize the environment or
that it is used to form an oxo bridge.
The study of metalloproteins is an evolving field that aims to understand and
mimic the catalytic function of metals in biology in an effort to create synthetic
compounds. It is also important to note that while the active center is where the
catalytic activity occurs, the entire enzyme plays a role in assembling amino acids and
developing a binding pocket for substrates [76]. It is in these pockets that non-covalent
interactions occur between the substrate and the surrounding amino acids. It is also the
area where the amino acid residues absorb the substrate. In an effort to duplicate the
hydrophobic binding site of the natural enzyme, both computational and experimental
studies have been performed. These combined efforts have assisted in studying the
enzymatic environment and performing analyses to gain a deeper understanding of how
the coordination environment of the active site in the metalloproteins is maintained
throughout its catalytic function.
2.5.1 H-Abstraction and Methvl Shift Mechanisms
Although many mechanisms have been examined for similar enzymes (e.g.
sMMO) and many different metal active sites (e.g. iron and zinc), there are two
mechanisms (Hydrogen Abstraction and Methyl Shift) that are applicable to pMMO that
have not been fully investigated. Both of them begin with a reactant containing CuO in
the presence of a methane molecule.

27
In the Hydrogen Abstraction (H-A) mechanism, the hydrogen closest to the CuO
is removed from the methane molecule and attaches to the oxygen atom. The copper ion
attaches to the methyl group, forming the first intermediate. In the next step, the copper
ion detaches and shifts to allow the oxygen to bond to the methyl group. In the last step,
the copper ion separates itself from the molecule to leave a methanol molecule and the
copper ion (Figure 2-5).
In the Methyl Shift mechanism (M-S), the hydrogen closest to the CuO complex
attaches to the copper ion. In the next step, the methyl shifts and binds with oxygen. The
complexes then detach themselves to form methanol, leaving the copper catalyst intact
(Figure 2-6). Figure 2-7 shows how the intermediates of each mechanism differ.

2 8
NH
NH
^ 0
NHHO,
CH
I
NHHO
Figure 2-5: Proposed H-Abstraction mechanism.

<Nz x
<N
<N

30
Reactants
Intermediate for H - A
Mechanism
r
Products ^
Intermediate for M - S
Mechanism
Figure 2-7: Depiction of intermediate structures for the proposed H-A and M-S mechanisms. Hydrogen atoms are white, oxygen atoms are red, carbon atoms are grey, and copper atoms are orange. The surrounding histidine molecules are shown in stick form.
2.6 Research Objectives
Because the MDH and pMMO enzymes are co-localized within the membrane of
the same organism, one of the hypotheses prompting this research is that the active sites
of MDH and pMMO are sufficiently close to each other to allow methanol oxidation by
31
MDH after methanol is produced by pMMO (from methane to methanol conversion).
The fundamental knowledge of methanol production (methane oxidation) by pMMO,
interaction between pMMO and MDH, and the corresponding electron transport through
the enzyme is insufficient in the research community.
The first direction of this dissertation is to characterize the active region of
pMMO by studying its interaction with MDH. The second direction is to suggest an
oxidation mechanism (methane to methanol) performed by the active site of pMMO. The
third direction is providing insight to the rates of methane conversion to methanol by the
pMMO enzyme. The computational tools that will be used to complete this work include
(a) Molecular Mechanics, (b) Classical Monte Carlo, (c) Density Functional Theory and
(d) Kinetic Monte Carlo, which will be used to investigate the following corresponding
objectives:
(1) Investigate the location of the active site by studying pMMO/MDH
interactions (a and b)
(2) Propose an oxidation mechanism that can be preformed by pMMO at the
dicopper active site (c)
(3) Study the activity of methane as it approaches the active site (including
conversions rates) (d)
2.7 Summary
This chapter gives an understanding of the pMMO enzyme, describes how similar
enzymes perform oxidation, and provides ideas surrounding the proposed mechanism
studied in this research.
32
• Between the two forms of MMO, pMMO has a higher catalytic efficiency than
sMMO and there is a demand to understand the methane oxidation mechanism by
pMMO.
• MDH is co-localized with pMMO and it takes the product of pMMO (methanol)
to fuel its subsequent reaction of methanol to formaldehyde.
• It is recognized that over the past decade the composition of the metal centers of
pMMO has been heavily debated but recent studies elucidated that pMMO
consists solely of copper. The enzyme contains some monocopper sites and some
dicopper sites with a total of nine copper ions in the enzyme.
• The structure of pMMO has been determined from three different bacteria. Each
of them differs slightly, but the dicopper region, located in the pmoB, is present in
all forms.
• The conversion of methane to methanol involves one oxygen atom and the
cleavage of a C-H bond from the methane.
• Although sMMO has different metal centers, proposed mechanisms were
described to show intermediate structures and suggest the possibility of
investigation to show similar structures in the pMMO enzyme.
• The H-abstraction and Methyl Shift forms of reactions will be investigated.

CHAPTER 3
METHODOLOGY
Computational tools can be used to predict the behavior of molecular systems.
They are used to investigate the structure of molecules and their reactivity. Techniques
used in this work include quantum mechanics, density functional theory, molecular
mechanics, molecular dynamics, classical Monte Carlo and kinetic Monte Carlo. This
chapter seeks to explain the theory behind these different techniques used to characterize
the studied molecular systems.
3.1 Potential Energy Surface
The Potential Energy Surface (PES) describes the energy variations with respect
to changes in atom arrangement [80]. The information that is concluded (and calculated)
from the PES gives chemical and structural information about the molecular system. In
order to consider all degrees of freedom, the dimensions of this surface vary depending
on the size of the molecular system. It is represented in a three-dimensional structure as
shown in Figure 3-l(a) [81]. A stationary point on the PES is where the first derivative
of the energy (with respect to internal or Cartesian coordinates) is zero. This indicates a
point where all forces on the atom are zero. This stationary point, where the second
derivative of the energy is positive, is where a stable molecular structure exists and
indicates that a minimum (local or global) has been found.
33
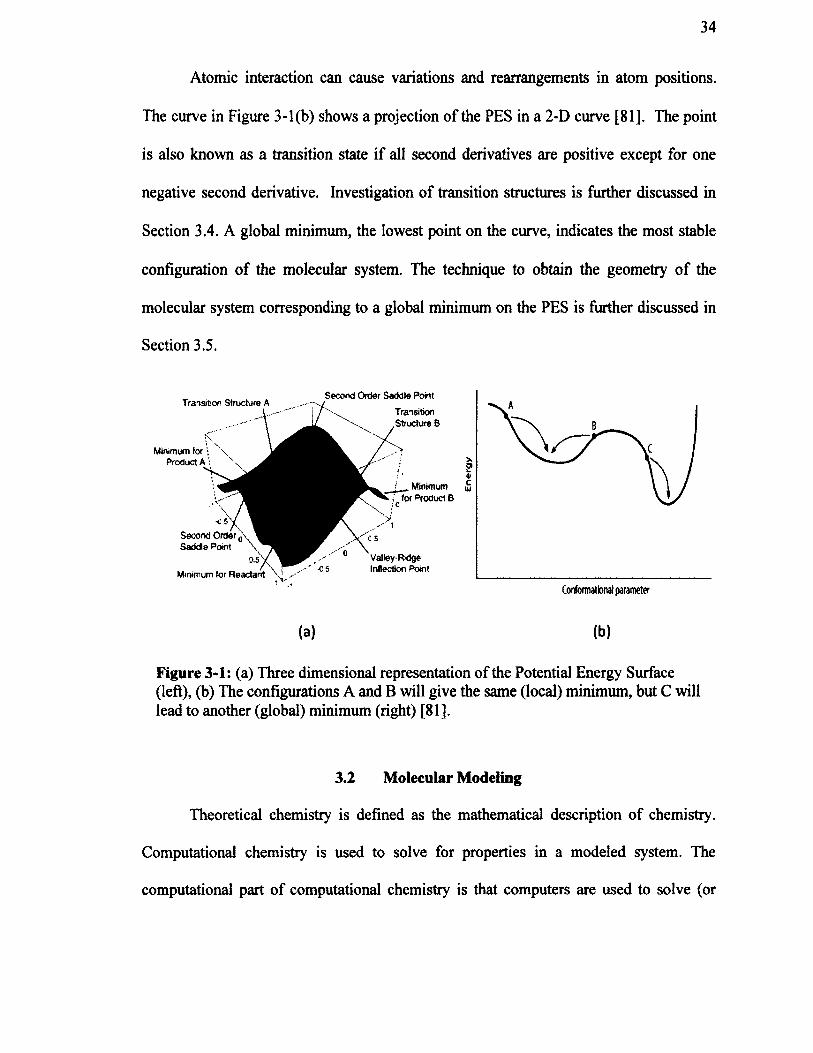
34
Atomic interaction can cause variations and rearrangements in atom positions.
The curve in Figure 3-l(b) shows a projection of the PES in a 2-D curve [81]. The point
is also known as a transition state if all second derivatives are positive except for one
negative second derivative. Investigation of transition structures is further discussed in
Section 3.4. A global minimum, the lowest point on the curve, indicates the most stable
configuration of the molecular system. The technique to obtain the geometry of the
molecular system corresponding to a global minimum on the PES is further discussed in
Section 3.5.
Transition Structure ASecond Order Saddle Point
Minimum tor •
TransitionStructure B
-C5Second Order Saddle Point
Minimum for Reactant
Minimumfor Product B
: C
Valiey-Ridge Inflection Point
gi
Conformational parameter
(a) (b)
Figure 3-1: (a) Three dimensional representation of the Potential Energy Surface (left), (b) The configurations A and B will give the same (local) minimum, but C will lead to another (global) minimum (right) [81].
3.2 Molecular Modeling
Theoretical chemistry is defined as the mathematical description of chemistry.
Computational chemistry is used to solve for properties in a modeled system. The
computational part o f computational chemistry is that computers are used to solve (or
35
more appropriately, approximate) solutions to the mathematical functions that are behind
the modeling techniques.
Molecular modeling can be used to visualize atoms and molecules in a real
system, including, but not limited to, the physical coordinates. Visualization programs
allow users to see a three-dimensional representation of the atomic arrangements while
retaining the structural and chemical information. Computational efficiency is crucial in
completing these calculations; therefore, the use of supercomputers and networks has
increased the ability and popularity of these forms of studies.
Molecular modeling is used to study natural and synthetic systems. Different
molecular modeling techniques use different sizes of models ranging from fewer than one
hundred to thousands of atoms. The size of the system is limited by the complexity of the
mathematical equations behind the technique. Each technique is used to investigate a
certain aspect of the system’s chemistry, but there is a tradeoff between accuracy and
computational speed. Choosing an appropriate model is critical in this area of research,
and included within the design of experiments is a way to verify that the model is
appropriate. The models created for each technique are further discussed in their
respective results chapter.
The desire to study biochemical reactions is increasing, and the methods to
examine these processes have expanded. Although experimentalists can provide the
structures of enzymes, it is not easy to see intermediates (and other complexes) that are
formed during enzyme reactions. Due to limitations involving speeds of reactions and
physical equipment to view these reactions, the use of modeling has become a common
tool. In studying reactions experimentally, visualizing the interaction between atoms in

36
time spans of picoseconds is a major limitation. Often experimentalists use a series of
reactions to infer and/or confirm the creation of a desired product; and intermediate
structures are theorized. One benefit to computational studies is that (1) mechanistic steps
can be seen with a visual output of atom arrangements, (2) dynamic studies can show
atomic movement in time intervals unable to be seen experimentally, and (3) multiple
studies can be carried out for slight variations on the system (i.e. substituting metal ions
in enzyme active sites). With the use of a combination of modeling tools and modeling
techniques, researchers can accurate represent a biological system and thus perform
informative and effective studies.
3.3 Quantum Mechanics
In this work, a PES is calculated using quantum mechanical methods, and
information is retrieved from the calculations. Quantum Mechanics involves solving the
Schrodinger equation to obtain the positions, forces, electronic structures, and energies
associated with atoms in a molecular system [82]. Although the analytical solution of
this equation can only be found for one electron systems (ex. hydrogen atom),
approximations of the solution can be made for larger systems. Quantum effects are
involved in every aspect o f chemistry. The time dependent Schrddinger equation is given
in Equation 3-1:
ft(r)*K r) = Eip(r) Eq. 3-1
where ft(r) is the Hamiltonian operator and is the wave function that represents
the molecular state of a system. The position vector, r, is defined by r = x i + y j + z£.
E is the energy of the system. The Hamiltonian operator has potential and kinetic energy
components, as shown in Equation 3-2:

37
electrons 2 nuclei _
f t = I Ip Ammd L U l A6 A
electrons nuclei , „-e2Z
elctrons - nuclei ~ „„ e2 . v eZ»z e
Y - + Y4->. n j L u rABi-* j 1 A-*B
where h is Plank’s constant, Wi is the mass of a particle i (/'= electron (e) or
nucleus (A)), Z is the atomic number, tab is the distance between the A and B nuclei, e is
the charge of the electron and r*A and ry are the electron-nucleus and electron-electron
distances, respectively. The first two terms of Equation 3-2 are the kinetic energy
contributions, and the last three terms are the Coulombic interactions. The equation
represents five main contributions to the total energy of a system. They take into account
the kinetic energies of the electron and nuclei, the attraction of the electrons to the nuclei,
and the inter-electronic and inter-nuclear repulsions.
Solving the Schrddinger equation exactly for any molecular system would
determine all of its properties. Unfortunately, the limitation is that it can only be solved
completely for a one electron system. There are no exact solutions for many electron
systems. In order to circumvent that problem, the Bom-Oppenheiner Approximation is
used to treat electrons separately from the nuclei in a multiple atom system. It is based
on the fact that the mass of an electron is significantly less than the mass of a nucleus.
This means that changes occurring in the position of the nuclei are added as fixed
contributions to the system. By separating out the motion of electrons from that of the

38
whole nucleus, the Schrodinger equation can be represented by the Electron Schrfidinger
equation for fixed nuclei, and Eeiec ~ Etotai, as shown in Equation 3-3:
^elec^Pelec ~ ^elec^Pelec
where the ipeiec is the electronic part of the total wave function, fietec is the
electronic Hamiltonian composed of potential energy of all particles but only the kinetic
energy of electrons. There are different types of methods that use the Bom -
Oppenheimer approximation, each falling under the category of an electronic structure
method. Popular electronic structure methods include Semi-empirical, Ab initio, and
Density Functional Theory.
Experimental data is used in semi-empirical methods to expedite the computation.
If a set of parameters exists that is applicable to the system, the number of calculations is
reduced because some integrals are replaced by empirical values. Ab initio methods do
not use experimental parameters, although this means more computation time is required.
Its benefit is that it can provide predictions for a broad range of systems. Density
Functional Theory (considered an Ab-initio method when hybrid methods are not used),
does not rely on empirical data to solve the Schrodinger equation, and it is the Quantum
Mechanical theory used in this work.
3.3.1 Density Functional Theory
Density Functional Theory (DFT) is considered an accurate method because it
includes both electron exchange and correlation for the instantaneous interactions of pairs
of electrons with opposite spin. It models this electron correlation through a general
functional of the electron density. DFT is based on the Hohenberg-Kohn theorem [83]

39
which uses functional of the electron density to determine the ground state energy. The
electron energy based on the theorem is shown in Equation 3-4:
E=Et +Ev + Ej + Exc Eq. 3-4
where ET is the kinetic energy from the motion of electrons, Ev describes the
potential energy of the nuclear-electron attraction and repulsion between pairs of nuclei,
EJ is the electron-electron repulsion term, and Exc, is the exchange correlation (remaining
electron-electron interactions) [84].
The first three terms correspond to the classical energy of the charge distribution
p. The extra term, the exchange correlation Exc is approximated as an integral involving
the spin densities and, sometimes, their gradients, as shown in Equation 3-5:
EJ =111 P (^ )(Ari2 )_1P(?2)d^dr^ Eq‘ ^
where p„ is the upward (a) spin density, pp is the downward (P) spin density and p
refers to the total electron density p„ + pp. The exchange and correlation parts
corresponding to the same-spin and mixed spin interactions are summed to create the Exc
term shown in Equation 3-6.
Exc = J f ( p a (r), pp (r), Vpa (r), Vpp ( f )d 3r Eq. 3-6
The exchange and correlation components can be listed as local functional and
gradient-corrected functional. The two main approximations of the exchange-energy
correlation are the Local Density Approximation (LDA) and the Generalized Gradient
Approximation (GGA). In LDA, uses the spin density values to calculate the electron
correlation terms. In GGA, the electron spin and its gradient are included in calculations.
The third type of approximations is the use of hybrid methods where the exchange

40
component is described as a linear combination of Hatree-Fock, local. Hybrid methods
are preferred because the density, not its wave function, corresponds to the real system.
3.3.2 Basis Sets
The molecular orbitals within a molecule can be mathematically represented as a
basis set [82]. A molecular orbital restricts an electron to a particular region of space.
When trying to approximate a specific molecular orbital, a larger basis set is desired
because it has fewer constraints to consider. This means that by considering more, a more
accurate approximation of the molecular orbitals can be made. The initial quantum-
mechanical calculation is to expand the wave functions for the molecular orbitals of the
system as a sum of atomic base functions; therefore, the accuracy of the results of a
calculation will depend on the accuracy of the basis set [18].
Linear combinations of Gaussian functions are used to form the atomic orbitals
(and thus, basis sets) for electronic structure calculations. DFT was originally only
applicable to periodic structures but is now useful for approximating the PES of
molecules. The accuracy of the DFT approach depends on the approximation exchange-
correlation energy functional.
As stated previously, larger basis sets consider more orbitals. There are minimal
basis sets (minimum number of basis functions required) like split valence basis sets (i.e.
3-31G) which have two sizes of basis function for each valence orbital. The triple split
valence basis set (i.e. 6-311G) uses three sizes of contracted functional for each orbital.
The limitation with split valence is that it allows for changes in size but not shape. The
use of polarized basis sets helps to overcome this limitation by addition orbitals with
angular momentum. One popular polarized basis sets are 6-31G (D, P) (commonly

41
referred to as 6-31G**) which adds p function to hydrogen atoms in addition to the d
functions on heavy atoms. The Double Numerical Polarization (DNP) basis set
corresponds to 6-31G**. The DNP considers the angular momentum that is one higher
than that of the highest occupied orbital in a free atom. DNP is the basis set used in this
research.
DFT calculations can provide the energy of a system corresponding to a minimum
(local and global) on the PES. It can also provide electronic distribution corresponding to
the minimum energy configuration. Vibrational and rotational frequencies corresponding
to each mode in the molecular system can be calculated. DFT studies can also be used to
determine transition state structures, which are presented in Chapter 5.
3.3.3 Transition State Theory and Reaction Rates
A transition state occurs through the rearrangement of atoms as a reaction
proceeds from substrate to product. As seen in Figure 3.1, the maximum energy point on
the reaction pathway curve is known as the transition state. It is the least stable state,
often containing bonds that are broken (radical formation) or a newly formed complex
structure due to the rearrangement of atoms.
As seen in Figure 3-1, the energy difference between the reactants and the
transition state is known as the activation energy. Transition State Theory is used to
calculate rate constants from activation energies. This technique is used to study the
kinetic and thermodynamic properties involved in a reaction. The conversion of
substrates to products involves overcoming an energy barrier. The rate of the reaction is
related to the Gibbs free energy in the system, and this relationship is shown in Equation
3-7:
where k is the rate constant (s'1), k% is the Boltzmann’s constant (3.29 X 10'24
cal/K), h is the Planck’s constant (6.626 X 10‘24 Js), T is the absolute temperature (298.15
K at room temperature), R is the universal gas constant (8.314 JK ^m ol1), and AG is the
Gibbs free energy of activation.
The transition state structures can be determined through the DMOL3 module of
Materials Studio®. It is verified through the synchronous transit method. In these
simulations, substrates, intermediates and products are known. The transition state (TS)
is determined by interpolating a reaction pathway to find the transition state. The Linear
Synchronous Transit (LST) method performs a single interpolation to the highest energy.
The Quadratic Synchronous Transit (QST) method looks for the energy maximum with
constrained minimums. Complete LST/QST begins with the LST optimization and
continues with the QST. The calculated TS is verified by a TS conformation algorithm
within Materials Studio®. The energy associated with the transition structure is used to
calculate activation energy and other energy barriers related to the reaction. Postulated
transition structures can be tested with DFT studies.
3.4 Forcefields
In larger systems, it is difficult to directly apply quantum mechanics. A forcefield
is a mathematical function that gives the potential energy of a molecular system as a
function of all atomic coordinates. A forcefield describes how atoms move, stretch,
vibrate, rotate and interact with each other, using a mathematical function that ignores the
presence of electrons. The advantage to using a forcefield is that it can provide accurate
descriptions with great computational speed.

43
There are many different forcefields, and each is used to describe the real
potential energy of a system. However, each one caters to a different system. For
example, MM2/MM3 forcefields are used for small molecule systems. OPLS is used for
liquid systems, while CHARM, AMBER, and GROMOS are used for proteins and
nucleic acids. COMPASS (Condensed-phase Optimized Molecular Potentials for Atomic
Simulation Studies) is used for organic and inorganic materials. It is the first Ab initio
forcefield that can predict gas phase and condensed phase properties such as structural,
conformation, vibration, and equation of state, cohesive energies, respectively. The
general forcefield equation is given in Equation 3-8.
It represents the bonded interactions of bond stretching, angle bending, and
torsion in the first three terms. The non-bonded interactions of Van der Waals and
Electrostatic (Coulombic) are represented in the fourth and fifth terms. More complex
forcefields consider out-of-plane tending and cross terms. Each of these terms is
necessary to describing an atomic system because the energy of the system increases
when bonds bend, rotate, or stretch. Likewise, the Van der Waals interactions capture the
attraction and repulsion of atoms (that are not bonded) in an effort to approximate the
preferred distance between these atoms. The electrostatics of the system describes the
interaction of charged atoms and long-range forces on the system. Coulomb’s Law is
bonds angles
£ 7 ( 1 + cos(nfi) - y))

44
used to calculate the energy between polar molecules that have partial electrostatic
causing attractive or repulsive movements. More complicated forcefield equations can
be extended by two terms to include solvation and polarization effects. Solvation effects
describe solvent-molecular interaction, and polarization describes the effect of a solvent
inducing a dipole on the system.
3.5 Molecular Mechanics
Figure 3.1 shows the goal is to find the minima, identifying both local and global.
The forcefield describes the atomic interactions to develop the PES, but further steps are
required to find the minima. The benefit to examining the electronic motion at fixed
nuclear positions is that a minimum on the PES can be sought for a molecular system.
The desired output of Molecular Mechanics is seeking the geometries of the system that
corresponds to the minima points on a PES. This can be accomplished through many
different minimization methods.
There are two broad categories of Energy Minimization Methods: Non-Derivative
and Derivative. The two non-derivative methods are (1) Simplex Method and (2)
Sequential Univariate Method. These methods are not utilized in results of this research
but are mentioned to show a variety of methods. The Derivate Methods are used in the
Material Studio Software package. There are two first-order derivative methods that are
used in these results. The Steepest Descents Method and The Conjugate Gradient
Methods provide accurate results for larger body systems. Of the second order
derivatives, the two that are pertinent to this research are the Newton-Raphson Method
and the Quasi-Newton Methods, but they are useful for smaller systems (200 atoms or

45
less). These methods (used solely or in combination) are used extensively in the
Molecular Mechanics studies in this research.
Molecular Mechanics (MM) is used to determine the energy of larger systems. It
considers the position of the nucleus in an atom as opposed to the electronic motion.
This is computationally quick, but the drawback is that properties that depend on
electronic configuration cannot be obtained. MM utilizes interactions of bonded and
non-bonded portions of a system. The COMPASS forcefield was used for all MM
calculations in this work.
3.6 Molecular Dynamics
Molecular Dynamics (MD) performs calculations using the Newton’s 2nd Law to
solve for atomic positions and velocities. MD follows the time evolution of a set of
interacting atoms. This technique is also implemented in the Discover module of
Materials Studio®. These simulations are computationally expensive but will be used on
larger models to see any conformational fluctuations by monitoring distances between
specified atoms during the simulation. Each trial is broken down in steps that are
separated by a fixed time (/). The vector sum (total force) of the interactions of one
particle to other particles is determined at a specific time t. The positions and velocities
at a time t + At are determined. When the atoms reposition, the forces lead to new
positions at a time t + At, and the iterations continue. A Taylor series is used to
approximate the positions and dynamic properties [80]. The series are solved by different
methods for integrating the equation of motion.
Molecular dynamics is a deterministic method. This means that the state of the
system at any future time can be predicted by its current state. The information from this

46
first step is still at the microscopic level. Statistical Mechanics is then used to study
macroscopic properties like transport and thermodynamics. The advantage to this is what
is seen at a microscope level through these simulations can be applied to a macroscopic
(larger scale) level to provide corresponding results as will be seen in Chapter 6.
There are a variety of ensembles that can be applied to different experimental
parameters. The NVE ensemble represents the number of atoms in the system (N), the
volume (V), and the potential energy (E) all remaining constant. The NVT ensemble
represents the number of atoms in the system (N), the volume (V), and temperature (T)
remaining constant in the system. One more ensemble is the NPT ensemble, which
represents the number of atoms in the system (N), the pressure (P), and the temperature
(T) all remaining constant. NVE is used in this work.
Molecular dynamics show the atomic interaction over time. Choosing an
appropriate time scale for the system being studied is extremely important. As mentioned
in other techniques, there is a tradeoff between accuracy and computational time. In the
case of molecular dynamics, it is desired that an appropriate time be chosen in order for a
desired interaction to be studied with low computation time.
3.7 Classical Monte Carlo and Kinetic Monte Carlo
Monte Carlo simulations can decrease the complexity of modeling biological
systems because they use random sampling techniques to help in modeling the complex
processes by focusing on configurations that are more probable. Monte Carlo is
considered a technique and there are various algorithms written for varying environments
(solution vs. surface) and for computational efficiency [85].

47
3.7.1 Classical Monte Carlo
A classical Monte Carlo technique (cMC) is performed by the Adsorption Locator
module of Materials Studio®. In this module, the configuration space of the enzyme is
searched while the temperature is decreased according to a simulated annealing schedule.
Simulating annealing is a metaheuristic algorithm, meaning it iteratively tries to improve
the quality of a solution to a problem. The algorithm is used for locating a good
approximation of the global minimum for a given function in a large configuration space
[86].
The concept was mimicked from the process of annealing in metallurgy. During
simulated annealing in metals, materials are heated and then slowly cooled in a way to
maximize crystal size and reduce the number of defects in the crystal lattice. The
algorithm considers variables corresponding to atomic configurations. In this case, the
solution that is being sought is the global minimum configuration as the temperature is
slowly lowered.
3.7.2 Kinetic Monte Carlo
The behavior of an active site (or even larger model) does not consider
microscopic local variations. These variations can be significant. Kinetic Monte Carlo
(kMC) is able to circumvent the approximations made in smaller models by specifying
the exact local environment. This technique allows for microscopic data to be
incorporated into a trial that will simulate the macroscopic behavior of the system.
Obtaining the macroscopic data allows for direct comparison with experimental data.
Statistical mechanics is a theory that can relate macroscopic properties to the
distribution and motion of the molecules in a large system. This means that given the

48
microscopic behavior (as determined in MM, cMC, or MD), thermodynamic and time
dependent behavior can be approximated for the larger system. One application of this to
the described research is to understand the rate of methane to methanol conversion. The
reaction rates are determined by DFT studies, used in Monte Carlo simulations, and then
Statistical Mechanics is applied to determine the diffusion of the methane molecule.
These results can then be compared to experimental results which consider a large body
system. The advantage of Kinetic Monte Carlo is that real-time behavior is described.
One of the fundamental challenges of modeling complex biological systems is the
variety of time and length scales. A combination of various computational tools can be
used to effectively model an entire biological system. Kinetic (or Dynamic) Monte Carlo
methods are adapted to using a large time and length scales. They require input
parameters obtained from experiments or smaller scale simulations. In typical kMC
simulations, a grid acts as a platform for a species to interact based on determined
guidelines. The interaction between the species is represented by movement on the grid
based on random probabilities.
The CARLOS program used to conduct kMC studies was developed by Johan
Lukkien [85, 87] and by A.P.J. Jansen [87, 88]. Although CARLOS is generally used to
model surface chemical reactions in two dimensions, there is flexibility to accommodate
for almost any kind of reaction. These variations are accounted for in the input file [85].
In this dissertation, CARLOS is used to study the methane oxidation of pMMO. A study
of the application to enzymatic reactions can be reviewed in the book chapter co-authored
by Dr. Mainardi and Dr. Jansen that considered the case study of methanol oxidation by
the Methanol Dehydrogenase Enzyme [89].

49
3.7.3 CARLOS Background
A fundamental or Master Equation is what is sought to use to derive analytical
results. Monte Carlo is a probabilistic approach and as such the rates are specified as
probabilities. The time evolution of the surface equation is (derived from first principles)
is the Master Equation, Equation 3-9 [89]:
where P(c,t) is the probability of finding the system in configuration c at time t
and kCC’ is the transition probability of the reaction to transfer from configurations c to c ’.
Numerical implementation of the master equation has been explored by several
methods. The first reaction method (FRM) [90] is used in this work since the method is
appropriate for cases where the reaction constants vary with time. For this method, when
the system is in a given configuration, c, the set of all possible reactions is determined
and a time of occurrence, tc-c, is generated for each reaction, /, compatible with
configuration c, as shown in Figure 3-10 [89].
selected uniformly in the interval (0,1) [89]. After the random number is selected, the
reaction with the smallest time is selected and the configuration is changed accordingly
and the time is incremented. Lastly, the set of possible reactions is generated according to
the new configuration, c ’. Equation 3-11 states the relationship between the microscopic
rate, k, to the macroscopic parameters:
Eq. 3-9
c'*c
Eq. 3-10
where is the time dependent rate o f reaction i and r is a random number

where v, is the prefactor and Eai is the active energy of a reaction, i [89].
3.8 Summary
The Schrodinger equation is the fundamental equation of Quantum Mechanics.
The Bom-Oppenheim Approximation is used to treat the electrons separately
from the nucleus so that the equation can be approximated for multi-atom
systems.
When the Schrodinger equation is solved/approximated, the minima of the
potential energy surface have been located.
Density Functional Theory and Transition state studies can be used to calculate
transition state structures, and their associated energies can be used to calculate a
reaction pathway.
Molecular Mechanics can approximate the potential energy surface using a
forcefield, which is a mathematical function that gives the potential energy of the
surface for all atomic coordinates.
o The entire atom is considered, not just the nuclei or electrons,
o The goal of molecular mechanics is to search for minima locations on the
forcefield using an energy minimizing method.
After a minimum has been found, Molecular Dynamics is used to solve Newton’s
2nd Law for each atom of the system.
o The values that can be obtained include time-dependent behavior of the
system.

51
o Molecular dynamics can also predict thermodynamic and transport
properties by studying the atomic interaction,
o Temperature and Pressure effects on transport properties of the system can
also be obtained.
• Classical and Kinetic Monte Carlo is used to understand the dynamics of a
reaction in real time at the macroscopic level.
CHAPTER 4
PMMO/MDH INTERACTION WITH SUBSTRATES
4.1 Introduction
MDH and pMMO are two enzymes present in the same organism. Researchers
have demonstrated that methane is oxidized by pMMO enzymes. Although there are
many enzymes that oxidize methane to methanol, pMMO is considered the most active.
The reaction of pMMO takes methane and oxygen and converts it to methanol at ambient
temperatures and pressures. By definition, the monooxygenase uses one oxygen atom in
its catalytic function, using the other oxygen in the formation of water. The product,
methanol, is then further processed to formaldehyde by neighboring MDH enzyme.
Although the pMMO active site of the catalytic activity is unknown, current
research suggests that it is in the pmoB site which contains a mono copper site that is ~
20 A away from a dicopper site. The two coppers in the dicopper site are separated by
2.54 A in the available structure from the X-crystallographic techniques, as seen in
Figure 2-4.
In this work, an exploration on pMMO’s catalytic ability is performed using a
multiscale approach by studying the pMMO/MDH interaction. In order for both enzymes
to work together in nature, their active sites should be closely positioned with respect to
each other, so methane can be oxidized to methanol by pMMO to serve as a fuel for
52

53
MDH to further oxidize. This constitutes, then, a hypothesis that will be tested in this
work. After a tentative pMMO active site is selected, its chemistry will be tested upon
methane oxidation. Results surrounding pMMO catalytic functionality will assist in
concluding the location of the pMMO active site and how this enzyme works in nature.
4.2 Models of MDH and pMMO Enzymes
The complete structures of pMMO and MDH were obtained from the Protein
Data Bank [24]. Entry 1W6S [30] was used for MDH, and entry CH3X [55] was used for
pMMO. The pMMO enzyme in its entirety is a very large system (37,676 atoms). In
order to obtain appropriate results with computational efficiency, a model was created to
consider the most active region while still maintaining a large amino acid surrounding
environment. Equally important when creating a model is to consider enough of the
surrounding protein environment to maintain coordination and stability of the biological
system. The closest surrounding amino acids are three histidine molecules, shown in
Figure 4-1, that play an important part in stabilizing the copper ions throughout the
reaction.

54
[RP163
Figure 4-1: The structure of Methylosinus trichosporium OB3b particulate methane monooxygenase (pMMO) entry CH3X [55] of the Protein Data Bank [24] with the dicopper ions shown in orange of the center. The three closest surrounding histidine molecules are colored yellow and the remaining surrounding amino acids are colored by composition (oxygen is red, nitrogen is blue, carbon is grey, hydrogen is white).
Likewise, the MDH enzyme (24,718 atoms) was reduced to scale with the
ireduced pMMO. One lobe of the MDH (with one Ca ) was used due to the knowledge
that the methanol oxidation occurs at either lobe of the two available in its structure
(shown in Figure 2-1). The results of trying to orient MDH and pMMO in search of the
configuration most likely used in nature is the complementary shapes of the enzymes.
These results suggest that they do interact and that their active sites are not too far apart
to make oxidation of methane to methanol in pMMO and methanol to formaldehyde in
MDH a concurrent and regulatory process [15].
The objectives outlined in Chapter 2 are designed to gain knowledge on how the
neighboring enzyme would assist or hinder the methane and oxygen approach, providing
evidence of a favorable reactive region in the pMMO enzyme. In order to determine
favorable alignment and bonding positions, two scenarios were created. The first

55
scenario is pMMO alone (Figure 4-2). The model of MDH is shown in Figure 4-3. The
second scenario will contain both pMMO and MDH (Figure 4-3). The two scenarios are
not atomically equal but allow for informative comparison. It is desired that trends in
energy variation will be considered, as methane and oxygen are added in each of the
scenarios.
Figure 4-2: Three dimensional enzyme structure of pMMO from entiy CH3X [55] from the PDB [24] visualized in Materials Studio® (left). Reduced model of active region with three histidine molecules (highlighted green) and two copper ions (orange) (right).

56
Figure 4-3: Three dimensional MDH enzyme model created from entiy 1W6S [30] of the Protein Data Bank [24]. The active site elements of PQQ and Ca2+ are shown in ball and stick form to emphasize location.
D ic o p p e r
3 H is t id in e
Figure 4-4: Minimum energy configuration of the pMMO/MDH complex. The active site elements of pMMO are three histidine molecules and a dicopper center. The active site elements of MDH are the PQQ molecule and the calcium ion.

57
4.3 Computational Details and Procedure
The first step in investigating the effect of methane in each of the previously
described scenarios is to first minimize the structures of the systems. The first two
computational techniques used in these results are Molecular Mechanics and Monte
Carlo. Molecular Mechanics simulations were performed using the Forcite module of
Materials Studio® software [86]. The Monte Carlo simulations were performed using the
Adsorption Locator module of Materials Studio®. The enzyme structures were
optimized (minimized) using the Smart Minimizer functionality of the Forcite Module
which first uses steepest descent algorithm, then Conjugate gradient method, and lastly
Quasi-Newton Methods if the number of atoms meets the requirement of the algorithm.
As mentioned in Section 3.3.3, Molecular mechanics uses forcefields for larger body
systems. COMPASS forcefield was used with the Forcite and Adsorption Locator
Modules.
The arrangement of pMMO/MDH was chosen based on its most stable
positioning out of a possible thirty original proposed docking positions obtained using
Molecular Mechanics and is shown in Figure 4-4. This is how the model of pMMO/MDH
was obtained before the original optimization.
The Adsorption Locator module utilizes the Monte Carlo technique to explore
possible docking regions of pMMO and MDH. It explores the configurations possible by
examining energetically favorable positions while the system undergoes a simulated
annealing schedule and the temperature is slowly decreased from 45 °C to 5°C, which is
the temperature range of exposure for Methanotrophic bacteria in nature.

58
The Adsorption Locator module was then utilized to see the approach of methane
and oxygen atoms upon the pMMO and pMMO/MDH systems. The energies of each
enzyme were used in combination with n number of methane molecules and oxygen
atoms respectively, ranging from one to five of each, paired together. The sole oxygen
atom was used in order for its negative charge to be attracted to the positive copper
centers of pMMO. Although in vivo a dioxygen molecule is used, it is unknown when
the oxygen activation occurs, and, for the purposes of these studies, the oxygen atom was
used as present when the pMMO performs catalysis. This is further discussed in Section
5.2.
The preliminary results of pMMO/MDH docking confirm the preference of
alignment near the surface of the pmoB subunit of pMMO, giving confidence to further
investigate the active site location of pMMO from the MDH point of view. Next, the
optimum configuration of pMMO/MDH (Figure 4-4) was considered as the second
scenario (the two enzymes together). Adsorption Locator was used to add a molecule of
methane and an atom of oxygen to the system. This was repeated for the addition of two,
three, four, and five substrate molecules. The notation of concentration is not used at this
point because this model is not in solution (no water has been added yet) so the addition
of substrates is referred to in quantities.
The positioning of substrates around the pMMO and pMMO/MDH models based
on these adsorption calculations provided insight on the stability of the system as the
amount of methane and oxygen increased (a single methane and single oxygen at a time).
The energies of the system through the addition of substrates showed a near equal trend,
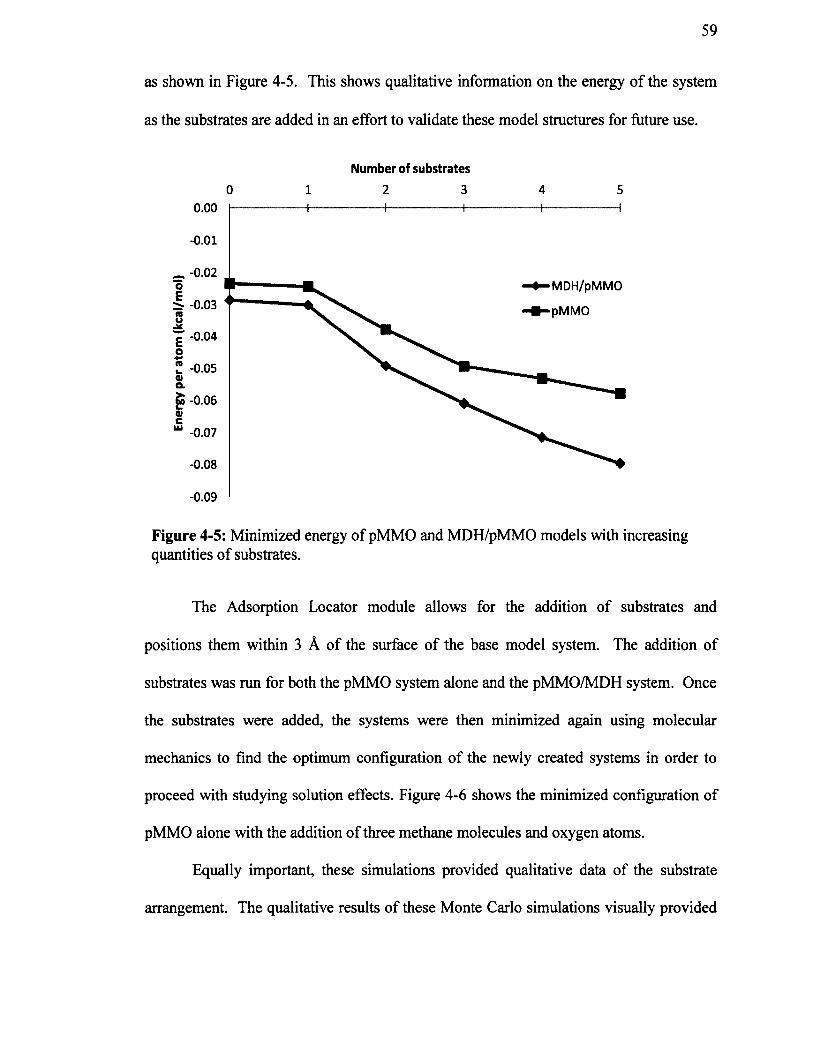
59
as shown in Figure 4-5. This shows qualitative information on the energy of the system
as the substrates are added in an effort to validate these model structures for future use.
Number of substrates0 1 2 3 4 5
0.00
-0.01
_ - 0.02MDH/pMMO
pMMO< -0.03
f" -0.04
“ -0.07
-0.08
-0.09
Figure 4-5: Minimized energy of pMMO and MDH/pMMO models with increasing quantities of substrates.
The Adsorption Locator module allows for the addition of substrates and
positions them within 3 A of the surface of the base model system. The addition of
substrates was run for both the pMMO system alone and the pMMO/MDH system. Once
the substrates were added, the systems were then minimized again using molecular
mechanics to find the optimum configuration of the newly created systems in order to
proceed with studying solution effects. Figure 4-6 shows the minimized configuration of
pMMO alone with the addition of three methane molecules and oxygen atoms.
Equally important, these simulations provided qualitative data of the substrate
arrangement. The qualitative results of these Monte Carlo simulations visually provided
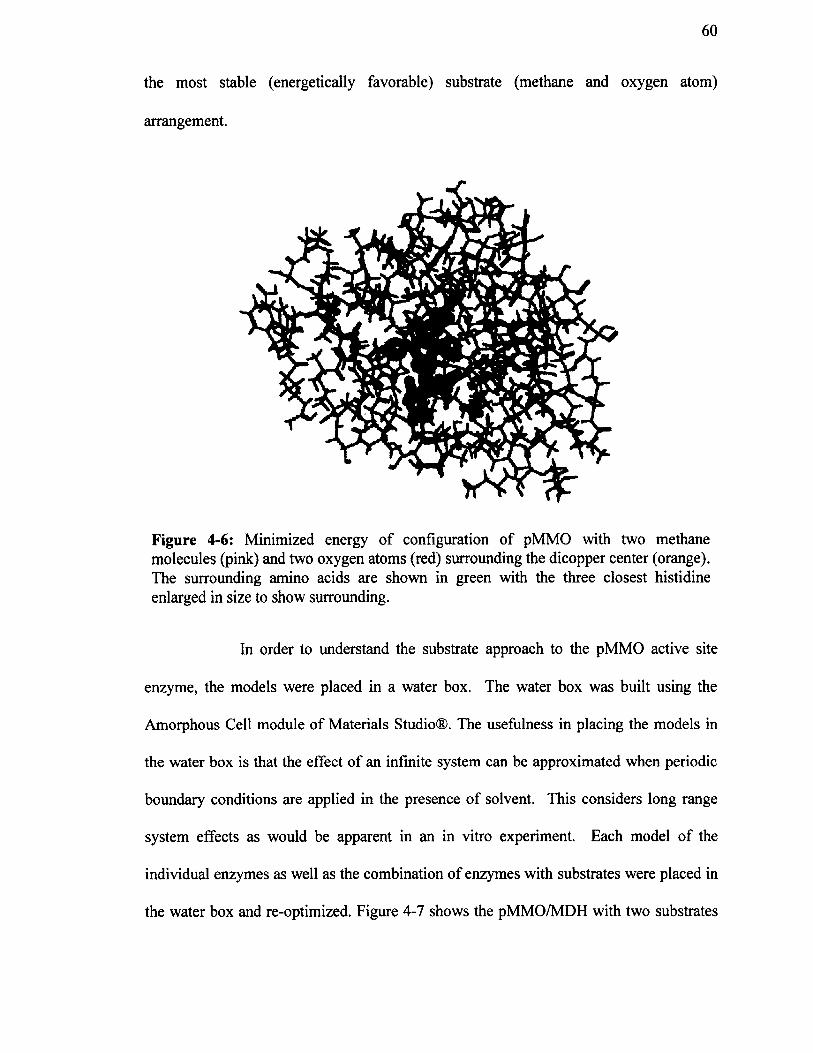
60
the most stable (energetically favorable) substrate (methane and oxygen atom)
arrangement.
Figure 4-6: Minimized energy of configuration of pMMO with two methane molecules (pink) and two oxygen atoms (red) surrounding the dicopper center (orange). The surrounding amino acids are shown in green with the three closest histidine enlarged in size to show surrounding.
In order to understand the substrate approach to the pMMO active site
enzyme, the models were placed in a water box. The water box was built using the
Amorphous Cell module of Materials Studio®. The usefulness in placing the models in
the water box is that the effect of an infinite system can be approximated when periodic
boundary conditions are applied in the presence of solvent. This considers long range
system effects as would be apparent in an in vitro experiment. Each model of the
individual enzymes as well as the combination of enzymes with substrates were placed in
the water box and re-optimized. Figure 4-7 shows the pMMO/MDH with two substrates

61
added. The energies of the system were then evaluated to ensure system stability before
proceeding with dynamic activity.
(a) (b)
Figure 4-7: (a) Minimized energy of configuration of pMMO/MDH system (pMMO green, MDH blue) submerged in a water box. The pink shell is a visualization aid to show the enzyme surrounded in the water box. (b) The pMMO/MDH interface with the addition of substrate molecules. The left side is pMMO with the enlarged orange copper ions, enlarged red oxygen atoms, and smaller green amino acids. The right side is MDH with the calcium ion enlarged and all amino acids shown in blue. The pink amino acids seen in the magnified view are from the visualization shell.
Once the stable configurations of enzymes and substrates within solution were
established, a third technique, Molecular dynamics, was applied in an effort to understand
the approach of the substrates. Diffusion coefficients were calculated for the substrates,
metal centers, and corresponding amino acids through statistical mechanics. Molecular
dynamic calculations were run with the Forcite Module of Materials Studio®. Once
again, the dynamics information is useful on its own but is also used to provide
microscopic data that can be applied at the macroscopic level, as mentioned in Sections
3.6 and 3.7. The micro-canonical ensemble NVT (constant number of particles, volume,

62
and temperature) was used for a simulation time of 200 picoseconds at a time step of 0.5
femtoseconds.
4.3.1 Approach of Substrates
In order for pMMO to catalyze methane, the substrate molecules must approach
the system. Molecular dynamics was applied to study how the substrates (methane
molecule(s) and oxygen atoms(s)) approach the dicopper active site. Experimental
studies have deduced that the activity occurs in the pmoB region, but the exact activity is
still undetermined. Again, pMMO and pMMO/MDH models were used to illustrate the
approach of the substrate to the active regions of the enzyme.
Literature suggests a hydrophobic pocket is available to substrates. This area was
found and maintained during the creation of the model. The importance of this area is
that it allows for substrates to have accessibility to the dicopper center. A hydrophobic
pocket can be visualized through the addition of a surface on the model, as shown in
Figure 4-8.
63
Figure 4-8: Accessible hydrophobic pocket highlighted to show access to copper ions. The original pMMO structure is shown (top left) and then Van der Waals pMMO surface (solid blue) is used to show a dicopper site accessible to substrate molecules.
4.4 Results and Discussion
4.4.1 Interaction of pMMO and MDH in the Presence of Methane
In order to determine that the pMMO and MDH models were appropriate before
application to the different computational techniques, distance measurements between the
identified active region and corresponding neighboring atoms were taken to show the
active region maintained structural integrity after minimization. Figure 4-9 is a diagram
of the neighboring atoms considered and will be referenced in the tables to follow in the
results chapters of this dissertation. It is acknowledged that the charge of copper can
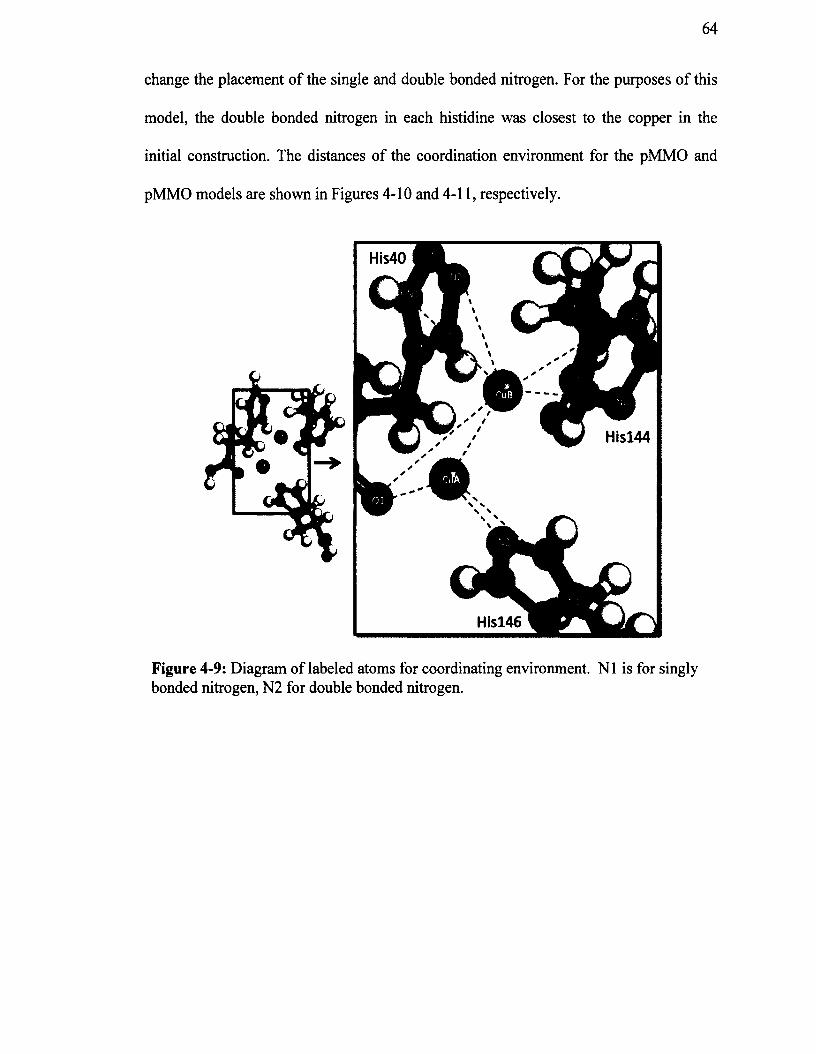
64
change the placement of the single and double bonded nitrogen. For the purposes of this
model, the double bonded nitrogen in each histidine was closest to the copper in the
initial construction. The distances of the coordination environment for the pMMO and
pMMO models are shown in Figures 4-10 and 4-11, respectively.
H is l4 4
H is l4 6
Figure 4-9: Diagram of labeled atoms for coordinating environment. N1 is for singly bonded nitrogen, N2 for double bonded nitrogen.

65
His 40
is 1444.310
4.377
5.500
6.132
2.351
7.369
4.4293.669
His 146
Figure 4-10: Distances between atoms and ions of the dicopper site for the pMMO model. N1 is for singly bonded nitrogen, N2 for double bonded nitrogen. The ring of the histidine is shown in ball and stick form while the side chain is shown in line form.
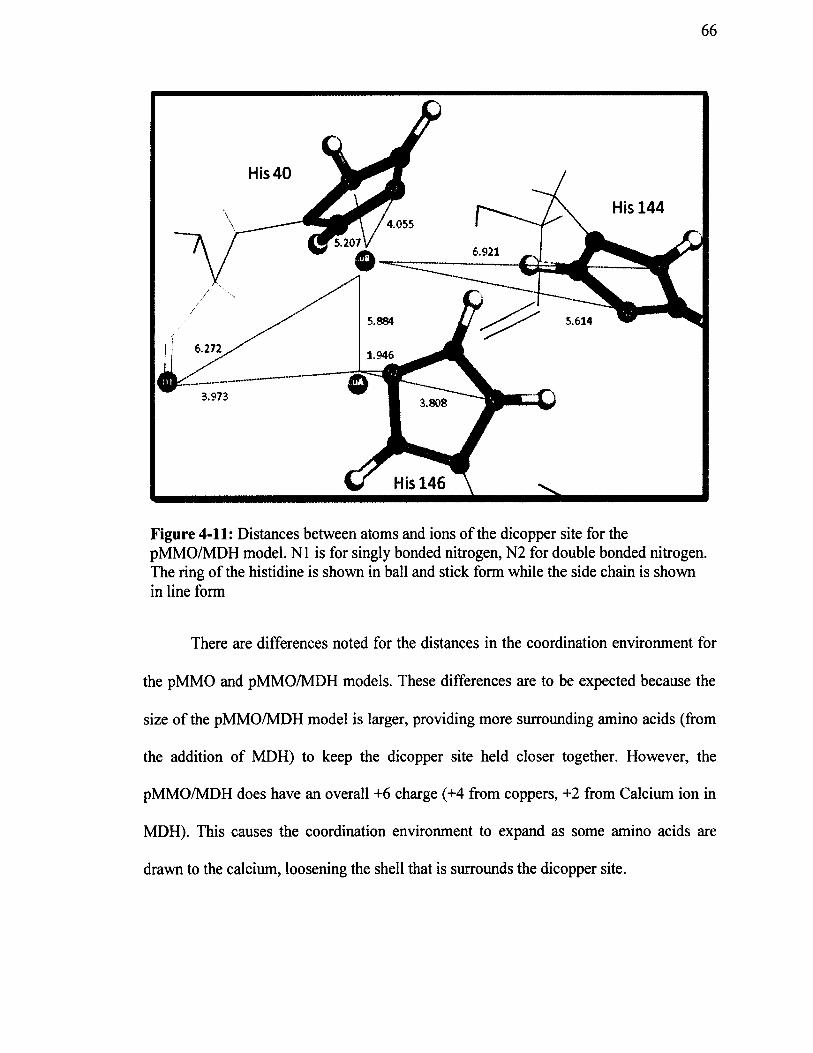
66
His 4 0
His 1444.055
5.207v 6.921
5.6145.884
6.272 1.946
3.973 3.808
His 146
Figure 4-11: Distances between atoms and ions of the dicopper site for the pMMO/MDH model. N1 is for singly bonded nitrogen, N2 for double bonded nitrogen. The ring of the histidine is shown in ball and stick form while the side chain is shown in line form
There are differences noted for the distances in the coordination environment for
the pMMO and pMMO/MDH models. These differences are to be expected because the
size of the pMMO/MDH model is larger, providing more surrounding amino acids (from
the addition of MDH) to keep the dicopper site held closer together. However, the
pMMO/MDH does have an overall +6 charge (+4 from coppers, +2 from Calcium ion in
MDH). This causes the coordination environment to expand as some amino acids are
drawn to the calcium, loosening the shell that is surrounds the dicopper site.

67
4.4.2 Diffusion Coefficients
The minimized pMMO and pMMO/MDH models containing up to five substrates
were placed in the water box, and a molecular dynamic simulation was performed
through the Forcite Module of Materials Studio®. The micro-canonical ensemble NVT
was used for a simulation time of 200 picoseconds at a time step of 0.5 femtoseconds.
The diffusion coefficients of the specified molecules (and ions) were calculated through
the use of statistical mechanics. The diffusion coefficients are calculated in an effort to
determine how the components of the active site behave as substrates approach (as they
would in nature before performing the oxidation mechanism). The diffusion coefficients
for both pMMO and pMMO/MDH systems are shown in Table 4-1. Through this
process, the diffusion of the atoms through the system (in the water box) can be
examined. This elucidates the ability of the substrates to diffuse in the system. A movie
has been added on the DVD addendum of this dissertation. It is “pMMO MDH
dynamics.”

68
Table 4-1: Diffusion Coefficients for specified atoms and molecules within the pMMO and pMMO/MDH systems with the addition of substrates.
Diffusion Coefficients in lO-8 cm2/s
Number ofoxygen
atoms and methane
molecules
H IS-4 0 HIS -144 HIS -146 CuA+2 CuB+J Calcium*2
- 0.33 1.10 0.34 0.30 0.20 -
1 35.46 54.09 15.46 19.89 39.55 -
. W U A2 107.34 64.66 82.17 1000.52 929.29 -
p f v i M t J
3 223.15 197.59 171.14 255.89 203.50 -
4 177.42 221.33 486.67 8.60 31.78 -
5 45.17 92.71 156.16 3.98 8.60 -
- 0.45 2.36 1.51 0.23 0.04 0.12
1 0.55 0.44 7.29 0.12 0.10 0.60
pMMO/ 2 7.28 2.31 3.42 0.98 0.68 0.80
MDH 3 0.46 0.38 1.80 0.24 0.13 0.14
4 7.93 1.04 1.79 1.12 1.35 0.44
5 0.97 0.58 1.05 0.12 0.15 0.17
Some of the general conclusions that can be drawn from the diffusion coefficient
listings are that pMMO (by itself) had significant movement throughout the duration of
the simulation time. This is seen through the large range of diffusion coefficients (0.20 x
10' 8 - 1000.52 x 10' 8 cm2/s) that is not seen with the larger pMMO/MDH model which
has a range of 0.10 x 10' - 7.29 x 10' cm /s. The model could be enhanced by adding
additional shells of amino acid to give more protein-like environment stability before
placement in solution (water box). The pMMO/MDH model suggests that the larger
model was able to maintain its structure throughout the dynamic time period. The
coefficients varied with the addition of substrates, but not in a noticeable trend. The only
noticeable changes were those that occurred between even and odd numbered additions
of substrates. One possibility for this is that with the addition of an odd number of
69
substrates there was a balance with the two positive copper ions ( + 2 charge each) and one
positive calcium ion (+2 charge). In the circumstances of the even numbered addition of
substrates, there is often a higher diffusion coefficient, suggesting movement due to an
unbalance in charge with the addition of the negatively charged oxygen atoms that are not
counterbalanced by the copper or calcium positive charge.
In the case of few (0, 1, and 2) substrate additions, there is an abundance of
positive charge. In the case of higher substrate addition (3,4, and 5), there is an equal or
additional negative charge from the oxygen atom. One specific case that can easily be
identified is for the His-40 amino acid in the pMMO/MDH system. The diffusion
coefficients for the odd additions are 0.55, 0.46, and 0.97 for 1, 3, and 5 substrates. The
diffusion coefficients are 7.28 and 7.93 for even additions of 2 and 4. Although this trend
is noticeable with a few other molecules, it does not hold for all of the molecules
examined. A significant conclusion is that longer simulation time may be needed to
clarify this trend at this theory level.
In the pMMO model, the diffusion coefficients for His 40, His 144, His 146, and
the two copper ions varied greatly with the addition of substrate molecules. They
fluctuated with the addition of substrate. The range of diffusion coefficients for the His
40 molecule is 0.33 x 10'8- 223.15 x 10‘8 cm/s2. The range of diffusion coefficients for
the His 144 molecule is 1.10 x 10"8 - 221.33 x 10' 8 cm/s2. The range of diffusion
coefficients was similar for His 40 and His 144, indicating that the molecules underwent
the similar dynamic movement. The range for the His 146 molecule is 0.34 x 10‘ 8 -
486.67 x 10' 8 cm/s2. This range is the largest of the three histidine molecules. One
possible reason for the large range is the location of His 146 near the surface increasing

70
its interaction with added substrates and water molecules that form the solution. The
range of diffusion coefficients for Cua is 0.30 x 10' 8 - 1000.52 x 10' 8 cm/s2. The large
diffusion coefficients indicate significant movement and suggests that the coordination
environment is not maintained. The large range of values suggests the histidine
molecules are influenced differently by the varying amount of substrate additions. A
possible explanation for the extremely high diffusion coefficients is the location of Cua at
the surface of the enzyme and accessible through the hydrophobic pocket, leading to
greater influences from other molecules. Another possible explanation is the large
influences from the +2 charge of each copper ion in the pMMO active site. The range of
diffusion coefficient on the Cub is 0.20 x 10‘ 8 - 929.29 x 10‘ 8 cm/s2. Once again location,
charge, and lack of a large protein environment to provide stability are possible reasons
for the unexpected large range of diffusion coefficients for this model.
Table 4-1 shows that the diffusion coefficients for the pMMO/MDH model
provided a small range of values due to the addition of substrates. The small ranges for
the His 40, His 144, His 146, and copper ions indicates that the larger model (pMMO and
MDH combined) provides an environment that is more stable, and the addition of
substrates has less influence on the stability of the active site. The range of diffusion
coefficients for His 40 is 0.45 x 10"8 - 7.93 x 10' 8 cm/s2. The highest diffusion coefficient
occurs when four substrates are added, with the value decreasing when a 5 substrate is
added. The range for His 144 is 0.44 x 10' 8 - 2.36 x 10' 8 cm/s2. The highest diffusion
coefficient occurred when there were no substrates added. This indicates that this
molecule had less movement during the dynamic simulation for each scenario that
substrates were added. This suggests a strong coordinating effect by His 144. The range

71
of diffusion coefficients for His 146 is 1.05 x 10' 8 - 7.29 x 10' 8 cm/s2. The highest
diffusion coefficient occurred with the addition of one substrate. After this, the values of
the diffusion coefficients consistently lowered with the addition of substrates. This
indicates the stabilization and coordinating of His 146 around the dicopper active site
which could also indicate a stabilizing influence by pMMO.
Minimum movement, indicated by the smallest diffusion coefficients, for the Cua
and Cub occurred at the addition of one, three, and five substrates. The diffusion
coefficients for C u a are 0.12 x 10'8, 0.24 x 10'8, and 0.12 x 10' 8 cm/s2 for the one, three,
and five substrate additions, respectively. As previously mentioned, the odd numbered
substrate additions have lower diffusion coefficients (compared to the even numbered
substrate additions) because of the charge influence on the system from the oxygen
atoms. The three negative oxygen atoms balance out the positive charges from the copper
ions and the calcium ion. The minimum diffusion coefficients did occur at these precise
times. A similar trend in diffusion coefficients is seen for Cub with 0.10 x 10'8, 0.13 x 10’
8, and 0.15 x 1 0 ' 8 cm/s2 for the addition of one, three, and five substrates, respectively.
The range of diffusion coefficients for CuAis 0.12 x 10' 8 -1.12 x 10' 8 cm/s2. The range of
diffusion coefficients for C ub is 0.04 x 10' 8 - 1.35 x 10' 8 cm/s2. These ranges are
extremely small. It is important to note the minimum movement of the copper ions in the
pMMO/MDH, especially when compared to the pMMO model.
Even through the addition of substrates, the coordinating environment of histidine
molecules maintained the position and structural integrity of the copper ions. Lastly, the
diffusion coefficient of the calcium ion (charge +2) in the MDH was measured to
investigate any influences on that portion of the system. The diffusion coefficient range
72
of Ca+ 2 is 0.12 x 10"8 - 0.80 x 10' 8 cm/s2. This range is smaller than the CuA and Cub
ranges and supports the idea that the mass and position of the ion increase the stability of
the overall pMMO/MDH model through all of the dynamic simulations. Lastly, the
minimum values for Ca were 0.14 x 10' 8 and 0.17 x 10"8 cm/s2 occurring at the addition
of three and five substrates, respectively.
4.4.3 Atomic Distance Measurements within the pMMO Active Site
Another way of evaluating the stability during diffusion was to examine the
distances between the coordinating atoms after the dynamic simulation was complete.
The important coordinating atoms are the nitrogen from the ring of the histidine
molecules and the oxygen at the base of His 40. The single bond and double bond
structures are systematically labeled N1 and N2. Figure 4-9 shows the labeling system.
Tables 4-2 and 4-3 show the distances between atoms within the pMMO and
pMMO/MDH systems, respectively. The distance to the nearest methane was not
recorded due to the distant (over 15 A away) arrangement of methane in each simulation.
It is considered not to directly affect the coordination environment as it is still
approaching the active site. The methane was not seen to penetrate the active site due to
the considerable short dynamic time (and neutral charge); they generally stayed in the
initial configurations found through adsorption locator and were found to have an average
diffusion coefficient of 2.98 x 10' 8 cm/s2 for the scenarios tested. The measurements
between the nearest oxygen (Ox) and the copper ions are listed to show the position of the
oxygen atom (most often in between the copper ions).

73
Table 4-2: Distance between atoms in the coordinating environment after dynamic simulation of 200 ps on the pMMO system. Figure 4-9 can be referenced for a diagram of the coordinating environment.
Number o f oxygen atoms and methane molecules
0 1 2 3 4 5
Cua-CUb4.97 2.92 2.17 2.86 2.80 3.13
0,-C uA - 1.45 1.66 1.48 1.47 1.58
0«-Cub - 1.47 1.43 1.47 1.48 1.58
N1-Cub6.78 8.73 8.74 3.29 7.08 6.38
Distance N2-Cub4.91 10.96 8.94 4.00 7.58 6.02
between His 40coordinating OI-Cua
5.02 7.38 11.29 6.45 8.37 5.55atoms(A) 0 1 - Cub
6.97 7.74 11.52 6.13 5.98 5.80
His 144N1-Cub
3.10 4.46 5.91 3.13 7.31 3.68
N2-Cub5.13 3.14 7.71 4.46 5.16 4.29
His 146N1-Cua
5.06 2.89 7.81 5.38 6.40 4.94
N2-Cua3.36 3.80 6.99 4.50 6.09 3.86
Table 4-3: Distance between atoms in the coordinating environment after dynamic simulation of 200 ps on the pMMO/MDH system. Figure 4-9 can be referenced for a diagram of the coordinating environment.
Number o f oxygen atoms and methane molecules
0 1 2 3 4 5
Cua-Cub4.33 3.13 3.12 3.12 3.13 3.13
Ox-CuA - 1.56 1.46 1.52 1.42 1.42
Ox-Cub - 1.57 4.57 1.69 4.38 4.38
N1-Cub 4.92 5.89 5.06 5.50 4.97 5.29
Distance 2.69 4.42 5.29 4.34 5.10 4.69between His 40
coordinating OI-Cua 5.49 5.76 4.69 5.43 5.79 5.80atoms
(A ) 0 1 -Cub6.35 6.10 5.08 5.30 5.90 6.18
His 144 N1-Cub 3.91 3.60 3.62 3.97 4.22 3.45
N2-Cub4.25 3.99 3.40 3.94 4.21 3.25
His 146 N1-Cua5.07 5.47 5.27 5.86 4.54 5.36
N2-Cua3.64 3.67 3.69 4.07 3.71 3.65

74
Once again, it is noted that the values for the distances of the atoms in the pMMO
system varying greatly after the dynamic simulations. This further supports the
suggestion that the pMMO model is too small and requires additional protein
environment to study the stability of the system. The pMMO/MDH system, on the other
hand, held steady throughout the dynamic simulation with the addition of up to five
substrates. In particular, the Cua-Cub distance maintained consistent values of 3.12 -
3.13 A after the addition of substrates. This is thought to be through the balance of
charge with the oxygen atom that is significantly close to the Cua on the outside of the
reaction but also due to the mass of the ions providing little movement.
The overall indication is that the model of pMMO alone is lacking a surrounding
protein environment that would provide significant stability throughout the dynamic
simulation. The pMMO/MDH model maintained its integrity but had fluctuations at
various additions of substrates. Below are direct comparisons between the models and
the distances between the coordinating environments. The data referenced below can be
found in Table 4-2 (pMMO alone) and Table 4-3 (pMMO/MDH).
• Distance between Cua and Cub: The distances are closest at the odd numbered
substrate additions (one, three, and five) for both models. The theory behind this
finding has been previously discussed. An exact separation distance at the
addition of five substrates was found to be 3.13 A for both models.
• Distance between oxygen atom (substrate) and Cua: Although there were no
noticeable trends when comparing the two models directly, it is important to note
the consistency in the pMMO model. The range of distances between these two
atoms ranged from 1.45-1.58 A. Although this suggests that the copper ion

75
located closest to the surface (having the most potential to be influenced by
substrate addition) did not deviate from position. This suggests that the oxygen
held the copper ion in position.
• Distance between the oxygen atom (substrate) and Cub: Although there were
no noticeable trends when comparing the two models directly, it is important to
note the consistency, once again, in the pMMO model. The range of distances
was 1.43-1.58 A. There was very little deviation, suggesting that the copper ion,
situated deepest in the hydrophobic pocket, did not become actively involved
during the dynamic simulation and was held in steady position through the
influence of the oxygen atom.
• Distance between the single bonded nitrogen (Nl) of His 40 and CuB: There
was a significant deviation in trend for the pMMO model at the addition of three
substrates. The distances between Nl and Cub are all above 6.30 A for all
additions of substrates except at three, which had a distance value of 3.29 A. This
occurrence suggests that there might be a balance of charge from the three
negative oxygen and the positive ions in the active sites which would keep the
molecules and ions in coordination environment closer together.
• Distance between the doubly bonded nitrogen (N2) of His 40 and CuB: There
are large separation distance differences between the pMMO and pMMO/MDH
models except at the addition of three substrates. The N2 - Cub distance is 4.00 A
for pMMO and 4.34A for pMMO/MDH. This small 0.34A difference between
the two models once again points to the odd number stability theory previously
discussed.

Distance between the oxygen atom (Ol) of His 40 and Cua: The distance
between these two atoms was 5.02 A and 5.49 A for the pMMO and
pMMO/MDH models, respectively, without the addition of substrates. The
values at the addition of five substrates were 5.55 A and 5.80 A for the pMMO
and pMMO/MDH models, respectively. Although there was great fluctuation at
all other substrate additions, the similar values suggests a possible involvement of
the oxygen atom of His 40 with large amounts of substrate addition.
Distance between the oxygen atom (01) of His 40 and Cub: The pMMO and
pMMO/MDH models have similar distances for Ol - Cub in the cases of zero,
four, and five substrate additions. The values for initial configuration (no
substrate addition) were 6.97 A and 6.35 A for pMMO and pMMO/MDH
respectively. At the addition of four substrates, the distance values are 5.98 A and
5.90 A for the pMMO and pMMO/MDH models, respectively. Lastly, at the five
substrate addition scenario, a distance of 5.80 A was found for the pMMO model
while a 6.18 A distance was found for the pMMO/MDH model. A possible
suggestion for this occurrence is that the oxygen atom of His 40 has a high
influence in coordination and stability as the number of substrates added
increases.
Conclusions about the coordinating effects of His 40: Similarities were found
between the initial distances and distances after five substrates were added. There
were also particular deviations in trend noted with the addition of three substrates.
It is suggested that His 40 has a stronger influence in coordination at high
concentrations of substrates. It is also noted that there is less variation of
77
distances between the additions of substrates in the pMMO/MDH than in the
pMMO model. Although this may indicate His 40 has a significant influence, the
reader is reminded of the significant difference in the size of the models, and,
thus, this statement cannot be verified without further studies.
• Distance between the single bonded nitrogen (Nl) of His 144 and Cub: After
the addition of five substrates, the distance between Nl and CuB was 3.68 A for
pMMO and 3.45 A for the pMMO/MDH model. These close values could
indicate a minimum threshold for coordination and stability by the His 144
molecule.
• Distance between the doubly bonded nitrogen (N2) of His 144 and Cub: The
distances between the models after the addition of 3, 4, and 5 substrates remain
consistent between the two models. The values are 4.46 A and 3.94 A for 3
substrates added, 5.16 A and 4.21 A at the addition of four substrates, and then
both are reduced in value to 4.29 and 3.25 for the pMMO and pMMO/MDH
models, respectively. This noticeable trend between the two models is unlike any
other scenario (see Table 4-2 and Table 4-3). The pMMO has higher values for
the distance between N2 and Cub through the addition of all of the substrates,
indicating that there is still greater movement and fluctuation occurring in the
smaller of the two models.
• Conclusions about the coordinating effects of His 144: The notable trends at
the higher and highest substrate additions indicate that the His 144 molecule does
influence the position and stability of the CuB in the dicopper active site.

Distance between the single bonded nitrogen (Nl) of His 146 and Cua: There
were similarities in the distances between the Nl and Cub at the initial
configuration and after the addition of three and five substrates. The initial
distances were 5.06 A for pMMO and 5.07 A for pMMO/MDH. After the
addition of three substrates, the distances became 5.38 A and 5.86 A for the
pMMO and pMMO/MDH models, respectively. Lastly, at the addition of five
substrates the distances became 4.94 A and 5.36 A. This was of interest due to
the similar numbers between the initial configuration and after the addition of
substrates, but also because the difference between the distances in the models
was less than 0.5 A in each case. This helps to support the significance of the
nitrogen in His 146 in the coordination of the dicopper active site. It should also
be noted that the range of distances through all of the additions of substrates for
the pMMO/MDH model was 4.54 - 5.86 A. If the scenario of four substrates
added is excluded, the range reduces to 5.07-5.86 A, one of the smallest rages of
values for all of the scenarios in Table 4-3, adding additional evidence for the
significance of His 146.
Distance between the doubly bonded nitrogen (N2) of His 146 and Cua: For
the pMMO model, the distance between N2 and Cua for the initial configuration
was 3.36 A and 3.86 A after the addition of five substrates. A similar and smaller
difference was noted between the initial configuration and the configuration and
after the addition of five substrates for the pMMO/MDH model, the values of
3.64 and 3.65 A. While the pMMO model distance values varied greatly, the
range of distances for the pMMO/MDH model was close, at 3.64-4.07 A.

79
• Conclusions about the coordinating effects of His 146: Of the three histidine
molecules evaluated in this experiment, the His 146 had the overall smallest and
most stable results, indicating a significant role in coordinating, and thus
maintaining, the integrity of the dicopper active site through the addition of
substrate molecules. This was present in both models but most notable in the
pMMO/MDH model.
4.5 Summary
• The models of pMMO and pMMO/MDH were structurally in agreement with the
original atomic arrangement of the enzyme, providing evidence that the models
maintain structural integrity and are appropriate for the use in these studies.
• The hydrophobic pocket of pMMO was identified through surface visualization
tools, and the addition of substrates was noted to align around this region.
• The diffusion coefficients of the pMMO and pMMO/MDH models were
recorded, discussed, and recognized to be data that will be used in the kinetic
Monte Carlo studies (Chapter 6 ).
• The distance measurements of the active region of pMMO and calcium ion of
MDH were recorded after the dynamic simulation and discussed to examine key
amino acids that increase the stability and coordination of pMMO with the
addition of substrates.

CHAPTER 5
H-ABSTRACTION AND METHYL-SHIFT METHANE OXIDATIONMECHANISMS
5.1 Introduction
In Chapter 4, the pMMO and MDH interaction with substrates was studied using
relatively large models. In this chapter, details of methane conversion through
mechanisms involving the small active site of pMMO are presented. Although pMMO is
experimentally shown to oxidize methane to methanol, the exact mechanism is unknown.
Many proposed mechanisms draw from various aspects of established mechanisms
surrounding other enzymes. Studies have been performed to focus on a mechanism
similar to those studied for sMMO, as previously discussed in Chapter 2. It is important
to understand the initial considerations and assumptions for the mechanism steps. These
details are provided for clarity.
The objective of this chapter is to investigate the H-Abstraction (H-A)
mechanism and the Methyl-Shift (M-S) mechanism as applied to pMMO. Similar
mechanisms have been proposed by Yoshizawa et al. [60], and elements of the proposed
mechanisms in this research have been researched by experimental and computational
groups [25, 75, 91-93]. Most enzymatic reactions involving methane occur by one of the
two aforementioned mechanisms (see Section 2.5.1). The H-A mechanism involves
striping a hydrogen atom off of the methane to attach to oxygen bond copper. This then
80

81
follows with the CH3 attaching to the OH in the subsequent step (see Figure 2-5). The
M-S mechanism involves the CH3 shifting and binding to the copper ion before releasing
a methanol molecule in the final step (see Figure 2-6). It is desired that through the
examination of this mechanism, information surrounding important structures can be
determined as those that would occur naturally. It is also important to determine which
steps are significant and which molecules are providing coordination and stability to the
active site of the enzyme. These details are needed to further the research surrounding
synthetic catalyst and could be used by both computational and experimental researchers.
5.2 Model Construction and Computational Details
As in any reaction mechanism, reactants proceed to a product formation. In the
case of enzymatic catalysis, the enzyme is used to increase the rate of the reaction. The
active site of the enzyme is where the reaction occurs. In Chapter 4, the active region of
pMMO was established to be the dicopper center located in pmoB (see Figure 2-3). The
histidines provide the coordinating environment. The proposed active site used in the
pMMO catalyzed methane oxidation is shown in Figure 5-1.
A small model consisting of two copper ions and the closest three amino acids
(histidine) was constructed from the Protein Data Bank, entry CH3X [24]. This small
model allows for studies to be conducted within the atomic limitation of DFT studies
while testing the importance of histidine molecules surrounding the dicopper site.
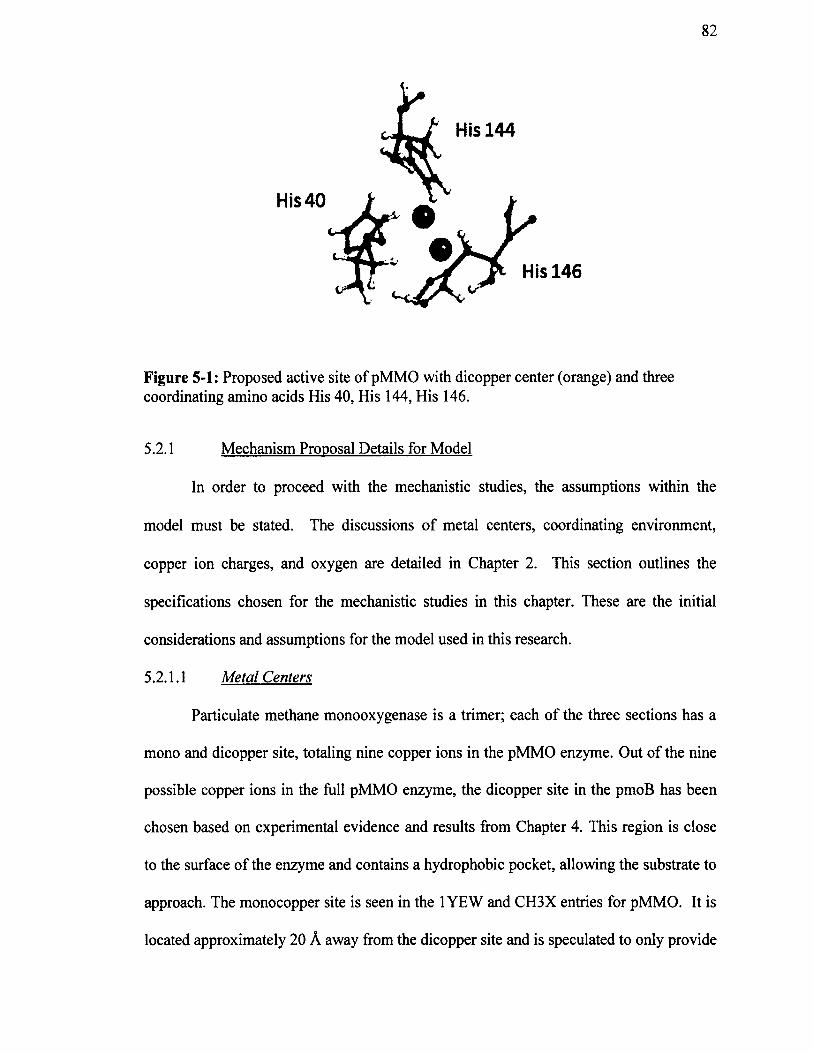
8 2
His 40
His 146
Figure 5-1: Proposed active site of pMMO with dicopper center (orange) and three coordinating amino acids His 40, His 144, His 146.
In order to proceed with the mechanistic studies, the assumptions within the
model must be stated. The discussions of metal centers, coordinating environment,
copper ion charges, and oxygen are detailed in Chapter 2. This section outlines the
specifications chosen for the mechanistic studies in this chapter. These are the initial
considerations and assumptions for the model used in this research.
5.2.1.1 Metal Centers
Particulate methane monooxygenase is a trimer; each of the three sections has a
mono and dicopper site, totaling nine copper ions in the pMMO enzyme. Out of the nine
possible copper ions in the full pMMO enzyme, the dicopper site in the pmoB has been
chosen based on experimental evidence and results from Chapter 4. This region is close
to the surface of the enzyme and contains a hydrophobic pocket, allowing the substrate to
approach. The monocopper site is seen in the 1 YEW and CH3X entries for pMMO. It is
located approximately 20 A away from the dicopper site and is speculated to only provide
5.2.1 Mechanism Proposal Details for Model

83
electrons for catalytic activity, not to participate in methane oxidation. The ability of
methane to approach the dicopper location is supported by evidence of a hydrophobic
pocket providing a way for the methane molecule to approach this region.
5.2.1.2 Nitrosen
The histidine amino acids contain single and double bonded nitrogen atoms in
their rings. Histidine (His) has an affinity towards copper. Although histidine can bind
with copper, it is also heavily cited as providing a ring for coordination chemistry [2, 94].
Defining the coordination chemistry of Cu / His systems can be challenging because
histidine has four potential sites for (de)protonation (i.e. binding). Currently, Mesu et al.
are working on the coordinating effects of Cu2+/ His complexes in aqueous solutions with
varying pH. Their efforts in studying these complexes are assisting the development of
synthetic enzymes that mimic the working mechanism of Cu enzymes [94]. Although this
dissertation research does not involve the binding, information surrounding the
coordination of the nitrogen atoms of histidine (the imidazole atoms) to copper ions is of
great significance.
5.2.1.3 Charges
The charges of the copper metal centers are one of the most important
investigations surrounding the oxidation of methane to methanol by the pMMO enzyme.
There is currently no agreement on the topic. There is the suggestion of high valence
coppers being able to initiate the reaction (as seen in sMMO), but their presence is not
seen in biological systems. Experimental studies have been performed to determine
possible models of equal or mixed valence dicopper sites. Suggested valences include
Cufcu1, Cu’Cu11, CunCuu, CunCuni, although Cu tends to have low charge. As stated

84
before high valence suggestions of Cum and CuIV have been investigated but are not
present in vivo [25,45,62,64].
XAS data performed by the two leading pMMO groups still leaves confirmation
of these structures as the actual charges associated in the biological setting undetermined
[54, 64]. The true charge of the copper in the pMMO structure has not been found.
Therefore, all chemical and structural information provided by the aforementioned
experiments will assist in the overall goal of providing information about pMMO in an
effort to create a synthetic catalyst.
One insightful study was performed in 2011 on a copper containing zeolite in an
effort to mimic methane oxidation of pMMO [95]. The enzyme was able to achieve
catalytic activity with a dicopper center CunCun. It is acknowledged that oxidation was
seen in the zeolite and has not been confirmed outside of that setting, but this structure
has not been fully investigated computationally and pointed to a unique opportunity to
supply mechanistic information using the CunCun model. The Rosenzweig group also
suggested a CunCun scenario and determined its feasibility but suggested further
mechanism testing [45, 64].
The lack of information surrounding the CuIICu11 structure prompted this study to
propose a mechanism that proceeds with this charge. The other advantage in studying a
structure with equal ion charge is that the charge of the ion does not allow for preferential
binding, thus allowing the stereochemistry of the system to be evaluated as well. Even if
it is not found in nature, the data provided will still be applicable in designing synthetic
catalyst. In this research, both C u tu 1 and CunCun charges on the Cu ions are considered
as different models to explore methane oxidation mechanisms.

85
5.2.1.4 Oxveen
Even though pMMO oxidizes atmospheric O2 , a monooxygenase, by definition,
uses a single (mono) oxygen atom to perform its catalytic function. Many studies have
been performed to determine the timing of the O2 scission (splitting of the molecule) in
the pMMO mechanism. In the mechanism performed in this work, it is assumed that the
scission occurs before binding.
An oxygen atom is able to form two bonds. The single bonding of oxygen to
copper would allow for the substrate (i.e. methane) to bond directly. If the oxygen
initially binds to both coppers, in the case of the bridge, then one of the bonds must
release in order to then bind to the substrate. The bridge formation is not examined in
this research because neither proposed mechanism is seen to proceed from an oxygen
structure with fully bonded oxygen. The oxygen needs a charge in both the H-A and M-S
mechanisms.
5.2.2 Computational Details
The computations reported here for mechanistic studies were performed with the
DFT generalized gradient approximation (GGA) as implemented in DMOL in Materials
Studio® software by Accelyrs Inc [8 6 ]. All geometry optimization calculations are
performed using the Perdew-Wang91 (PW91) exchange correlation functional and the
double numerical with polarization (DNP) basis set available in DMOL3. Calculations are
performed to ensure that stationary points on the potential energy surface of the systems
are in fact local minima (all real frequencies) or transition states (only one imaginary
frequency). In order to simulate a homogeneous polarizable medium, a continuum

86
solvation model known as COSMO is implemented. The dielectric constant (e) was
chosen to be four, which is the standard value used in modeling protein surroundings.
After each active site structure was geometry optimized using the DMol3 module
of Materials Studio®, the transition structures were determined using the Transition State
Search feature as previously described. A search for a transition state structure between
each of the complexes was conducted, but in some cases they did not exist at the theory
level used. In these cases, sometimes a bond was simply formed or broken. The
mechanism details are presented in diagram form in Figure 2-5 and Figure 2-6 for H-
Abstraction and Methyl Shift, respectively.
5.3 Results and Discussion
5.3.1 Description
The first model studied was the H-Abstraction and the Methyl Shift for the Cu'Cu1
scenarios. This was then repeated for CuHCun charges on the copper ion for both of the
proposed mechanisms.
The Hydrogen Abstraction (H-A) is proposed to be a four step mechanism, as
seen in Figure 2-5.
Step 1: The oxygen atom (available from the O2 scission) binds to Cua- This is
the copper nearest to the surface of the enzyme. It still retains a negative charge to attract
the neutral methane molecule.
Step 2: The closest hydrogen of the methane molecule to the oxygen breaks from
the methane and bonds to the oxygen atom. This leaves a positively charged
methyl group and a positively charged copper ion.
Step 3: The methyl group binds to the copper ion containing the OH group
87
Step 4: The methyl group and OH group break from the copper catalyst and rejoin
to form methanol product.
The Methyl Shift mechanism (M-S) is outlined in the following four steps:
Step 1: The oxygen atom binds to Cua. This is the copper nearest to the surface
of the enzyme. It still retains a negative charge to attract the neutral methane
molecule.
Step 2: The closest hydrogen of the methane molecule to the oxygen breaks from
the methane and bonds to the copper ion. This leaves a positively charged
methyl group, a neutral copper ion, and negatively charged oxygen that is singly
bonded to the copper ion.
Step 3: The methyl group binds to the oxygen atom.
Step 4: The two species break from the copper catalyst and join to form methanol
product.
5.3.2 pMMO Active Site: (VCu1 Scenario
5.3.2.1 Results o f the C i/C i/ Scenario
Initially, the Cu'Cu1 scenario was considered. The geometries of the atom
arrangement were optimized for each step of both mechanisms. The energy associated
was recorded, and the values recorded are taken to be relative to the reactant. The values
are recorded in Figure 5-2, and the atomic configurations of the model are shown for the
H-A step in Figure 5-3 and M-S in Figure 5-4.

Rea
ctan
t Re
lativ
e En
ergy
(K
cal/m
ol)
88
20.018.3
H-A-■-M -S
18.0
18.816.014.3
140 13 .0,
12.0
9.210.0 8.7
8.0
6.0
40
2.00.0
0.0React TS1 Inti TS2 P
Figure 5-2: Energy Diagram for the Ci^Cu1 scenario of the H-Abstraction (H-A) and Methyl Shift (M-S) mechanisms.

R T S 1
Figure 5-3: Screen shots of the optimized configurations of for H-Abstraction (H-A) mechanism steps. The dicopper site, oxygen, and methane are shown in ball and stick form for easy examination of the active species. The His 40, His 144, and His 146 are shown in line form.

90
R T S 1
I n t T S 2
P
Figure 5-4: Screen shots of the optimized configurations of for Methyl Shift (M-S). The dicopper site, oxygen, and methane are shown in ball and stick form for easy examination of the active species. The His 40, His 144, and His 146 are shown in line form.

91
5.3.2.2 Discussion o f the Ci/Ci/ Scenario
A search for a transition state structure between each of the complexes was
conducted, but in some cases they were found not to exist. In these cases, sometimes a
bond was simply formed or broken.
In the H-A mechanism, the TS1 was found not to exist. The TS2 structure was
found to be at an increased energy from the intermediate but because the final product is
a positive (and high) value, the overall mechanism is deemed unfavorable. This indicates
that this is not the mechanism seen in nature.
In the M-S mechanism the TS1 has a high value of 13.0 kcal/mol. This value is
lower than the intermediate value of 18.3 kcal/mol, suggesting that it is not a true
transition state. Overall the product is once again positive suggesting that this is not the
mechanism seen in nature.
A negative product formation would indicate a favorable reaction and suggest that
the mechanism is correct. Both mechanisms are deemed unfavorable. What is not truly
understood is how the system with an unbound oxygen atom is more stable that a product
formation where the oxygen atom is bound and has moved away from the dicopper site
5.3.3 pMMO Active Site: CunCun Scenario
Both the H-A mechanism and the M-S mechanism were repeated for the CuuCun
case. The formal charge on the ions was modified to +2 and the overall charge of the
system was increased to +4.

92
5.3.3.1 Results o f the Ci/!Cun Scenario
The geometries of the atom arrangement arrangements were optimized for each
step of the H-A and M-S mechanisms for the CunCun scenario. The energy associated
with each configuration was recorded and shown as energy relative to the reactant as
shown in Figure 5-5.
20.0H-A
-■-M -S17.8
18.0
*5 16.0
m 14.0 18.0
11.712.0
8.0
4.0
4.0 2.8
0.00.0
PTS1 Inti TS2React
Figure 5-5: Energy Diagram for the CunCun scenario of the H-Abstraction (H-A) and Methyl Shift (M-S) mechanisms.
5.3.3.2 Discussion o f the Cu'Cu11 scenario
In the case of the H-A mechanism, the TS1 energy barrier is 4.9 kcal/mol.
Although this is a small value, this is a confirmed transition state and suggests a correct
new mechanism step. The Inti value of 2.8 kcal/mol is smaller than the same structure in
the Cu'Cu1 scenario. The TS2 structure is seen to exist but is actually not a transition

93
structure due to the positive (and high) energy of the product, deeming this reaction
unfavorable.
In the case of the M-S mechanism, the TS1 is does not exist. The high energy
intermediate is followed by a high energy product formation, indicating once again that
the mechanism is unfavorable and does not exist in nature.
The final products in these scenarios are less stable than the reactants. These
findings led to the decision to explore more steps in the mechanism, leading to a seven
step modified H-A and M-S mechanisms. The Cu'Cu1 and CuI1Cu11 scenarios are again
explored.
5.3.4 Modified H-Abstraction and Methyl Shift Mechanisms
Data from the previously detailed scenarios suggested that additional steps in the
mechanism might lead to the formation of structures (and associated energies) that would
better describe the oxidation process preformed by pMMO. In order to extend these
mechanisms with addition steps, they modified them by adding reactant complexes (RC)
and product complexes (PC). This means that the addition step of the reactants bound
complex was added between the reactant and the intermediate and the product bound
complex was added between the intermediate and the product. This would allow for two
transition state searches to be performed in an effort to gather more data and insight to the
actual mechanism steps performed by pMMO. The modified H-Abstraction (mH-A) and
modified Methyl Shift (mM-S) mechanisms are explored for the Cu'Cu1 and CuIICu"
scenarios. The structures of the mH-A mechanism are shown in Figure 5-6 and the
structures of the mM-S mechanism are shown in Figure 5-7.

TS3H2 PH2
Figure 5-6: Screen shots of the optimized configurations of the Modified H- Abstraction (mH-A) mechanism steps. The dicopper site, oxygen, and methane are shown in ball and stick form for easy examination of the active species. The His 40, His 144, and His 146 are shown in line form.

95
Figure 5-7: Screen shots of the optimized configurations of the Modified Methyl Shift (mM-S) mechanism steps. The dicopper site, oxygen, and methane are shown in ball and stick form for easy examination of the active species. The His 40, His 144, and His 146 are shown in line form.

96
5.3.4.1 Cu1 Cu1 Scenario in the pMMO Active Site
In the case of the Cu’Cu1 scenario, the energies of each step of the two
mechanisms are once again recorded and are shown in Figure 5-8. Distances between
the dicopper site and surrounding atoms (as outlined in Chapter 2, reference Figure 4-9)
are once again recorded and shown in Table 5-1 and Table 5-2.
25.0H-A
-•-M -S 20.0O 20.0 18.3
18.6
15.0 16.4O) 14.814.6
8.7® 10J7.1
7.8
5.0
3.60.0
0.0TS3TS2 PC PTS1R RC
Figure 5-8: Energy Diagram for the Modified Cu'Cu1 scenario of the H-Abstraction (mH-A) and Methyl Shift (mM-S) mechanisms.
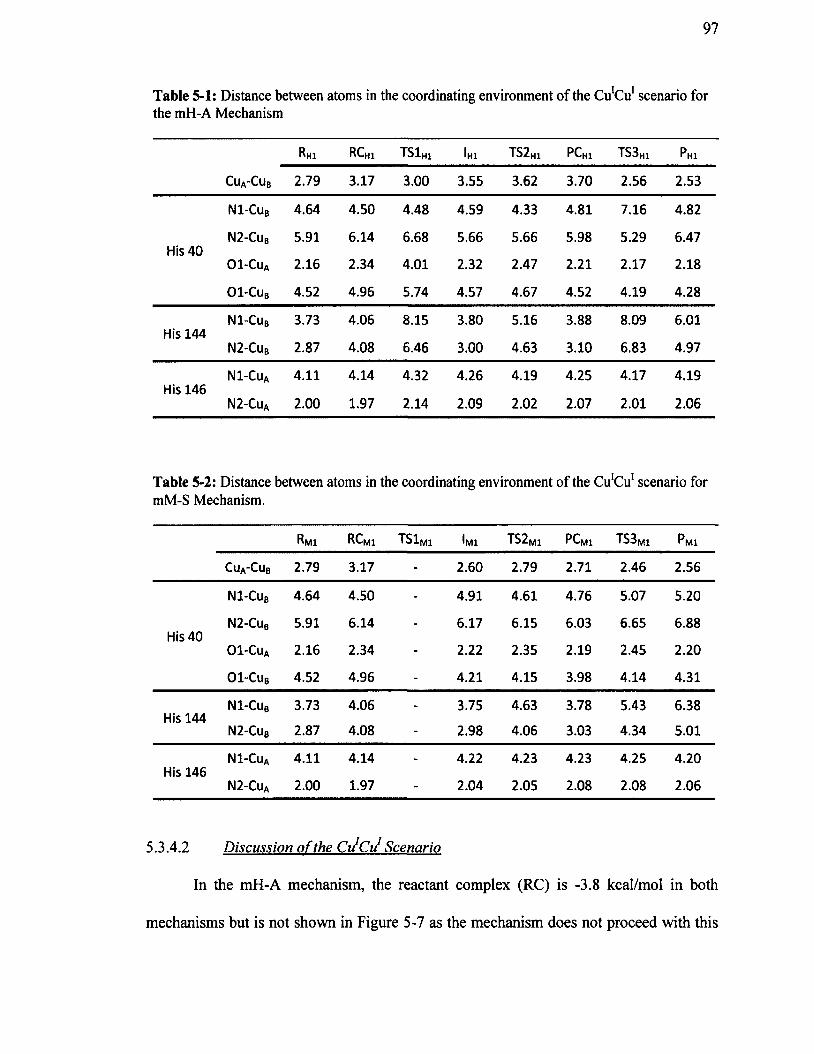
97
Table 5-1: Distance between atoms in the coordinating environment of the C u tu 1 scenario for the mH-A Mechanism
CUa-CUb
Rhi RChi TS1Hi Ihi TS2Hi PChi TS3Hi Phi
2.79 3.17 3.00 3.55 3.62 3.70 2.56 2.53
N 1-Cub 4.64 4.50 4.48 4.59 4.33 4.81 7.16 4.82
N2-Cub 5.91 6.14 6.68 5.66 5.66 5.98 5.29 6.47His 40
01-Cua 2.16 2.34 4.01 2.32 2.47 2.21 2.17 2.18
01-Cub 4.52 4.96 5.74 4.57 4.67 4.52 4.19 4.28
N 1-Cub 3.73 4.06 8.15 3.80 5.16 3.88 8.09 6.01His 144
N2-Cub 2.87 4.08 6.46 3.00 4.63 3.10 6.83 4.97
N1-CUa 4.11 4.14 4.32 4.26 4.19 4.25 4.17 4.19His 146
N2-Cua 2.00 1.97 2.14 2.09 2.02 2.07 2.01 2.06
Table 5-2: Distance between atoms in the coordinating environment of the C u tu 1 scenario for mM-S Mechanism.
Rmi RCmi TS1M1 Imi TS2M1 PCmi TS3mi Pmi
Cua-Cub 2.79 3.17 - 2.60 2.79 2.71 2.46 2.56
N1-Cub 4.64 4.50 - 4.91 4.61 4.76 5.07 5.20
N2-Cub 5.91 6.14 _ 6.17 6.15 6.03 6.65 6.88His 40
OI-Cua 2.16 2.34 - 2.22 2.35 2.19 2.45 2.20
01-Cub 4.52 4.96 - 4.21 4.15 3.98 4.14 4.31
N 1-Cub 3.73 4.06 3.75 4.63 3.78 5.43 6.38His 144
N2-Cub 2.87 4.08 - 2.98 4.06 3.03 4.34 5.01
IMI-Cua 4.11 4.14 4.22 4.23 4.23 4.25 4.20His 146
N2-Cua 2.00 1.97 - 2.04 2.05 2.08 2.08 2.06
5.3.4.2 Discussion o f the Ci/Cu1 Scenario
In the mH-A mechanism, the reactant complex (RC) is -3.8 kcal/mol in both
mechanisms but is not shown in Figure 5-7 as the mechanism does not proceed with this
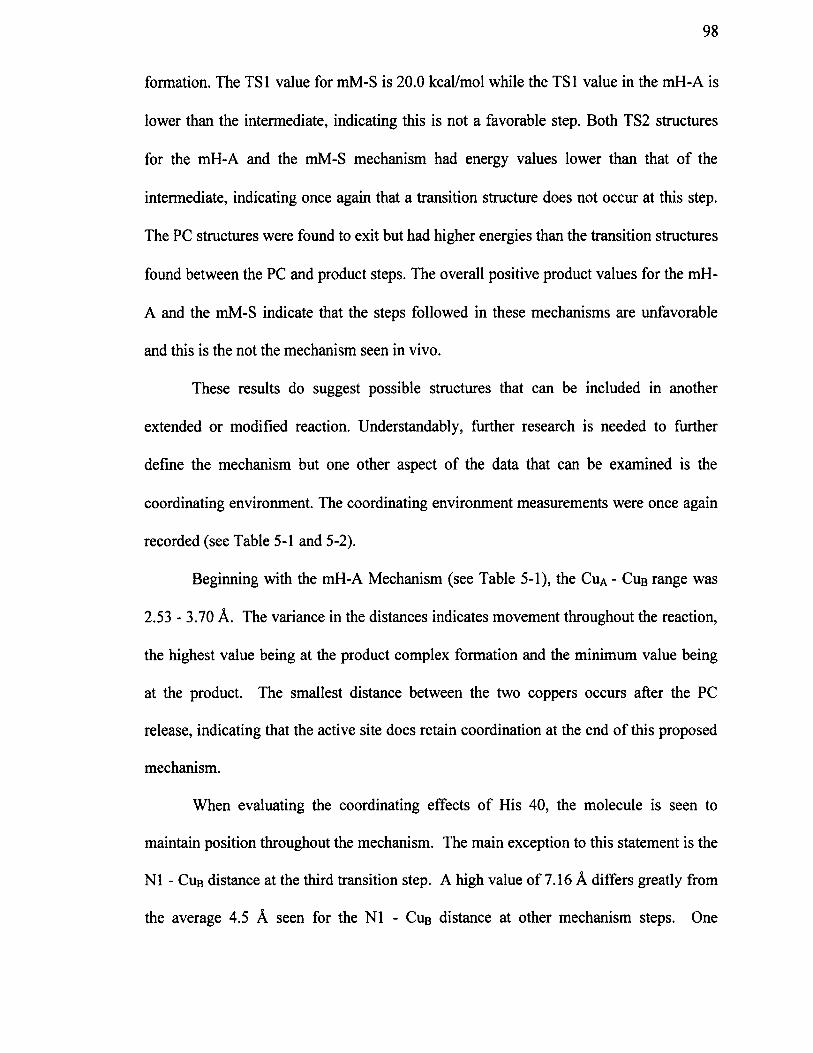
98
formation. The TS1 value for mM-S is 20.0 kcal/mol while the TS1 value in the mH-A is
lower than the intermediate, indicating this is not a favorable step. Both TS2 structures
for the mH-A and the mM-S mechanism had energy values lower than that of the
intermediate, indicating once again that a transition structure does not occur at this step.
The PC structures were found to exit but had higher energies than the transition structures
found between the PC and product steps. The overall positive product values for the mH-
A and the mM-S indicate that the steps followed in these mechanisms are unfavorable
and this is the not the mechanism seen in vivo.
These results do suggest possible structures that can be included in another
extended or modified reaction. Understandably, further research is needed to further
define the mechanism but one other aspect of the data that can be examined is the
coordinating environment. The coordinating environment measurements were once again
recorded (see Table 5-1 and 5-2).
Beginning with the mH-A Mechanism (see Table 5-1), the Cua - Cub range was
2.53 - 3.70 A. The variance in the distances indicates movement throughout the reaction,
the highest value being at the product complex formation and the minimum value being
at the product. The smallest distance between the two coppers occurs after the PC
release, indicating that the active site does retain coordination at the end of this proposed
mechanism.
When evaluating the coordinating effects of His 40, the molecule is seen to
maintain position throughout the mechanism. The main exception to this statement is the
N1 - Cub distance at the third transition step. A high value of 7.16 A differs greatly from
the average 4.5 A seen for the N1 - Cub distance at other mechanism steps. One

99
explanation could be the steric effects produced when the product complex is formed and
fully bound to the copper ion shifting the His 40 molecule farther away from the surface
of the enzyme, thus increasing the N 1 - Cub length.
The His 144 molecule is seen to shift slightly throughout the mechanism. The
greatest distances in bond lengths are seen at the TS3 and product formation. A value of
8.09 A is seen for the N1 - Cub distance, more than 2.0 A higher than any other N1 - Cub
measurement. This is once again thought to be attributed to the steric effects of the
methanol binding before the product formation. There are two significantly high values
for the N2 - Cub distance. A value of 6.46 A and 6.83 A are seen for the TS1 and TS3,
respectively. A possible explanation include steric effects of the methane and methanol
complexes causing the His 144 molecule to shift and increasing the distance between the
previous nitrogen ring of His 144 and the copper centers.
Lastly, the distances between the N1 and N2 of His 146 and Cua remain the most
consistent distance measurements throughout the entire mH-A mechanism. The range of
values for N1 - CuA is 4.11 - 4.26 A. The range of values for N2 - Cua is 1.97 - 2.14.
These small distances and small ranges indicate that the His 146 is significant in
coordinating and stabilizing the copper center throughout the mH-A mechanism.
Next, the mM-S Mechanism distances were analyzed (see Table 5-2). The Cua -
Cub distance ranges from 2.46 A to 3.17 A. It is interesting to note that the minimum
distance is not seen to be at the product formation (as with the mH-A) but at the TS2, the
last transition step. One possible explanation is that the ions are in close distance for
stabilization before the production formation. The distance is smaller than that of the

100
product complex formation value (2.71 A). This decreasing in distance at the transition
state indicates stability before the product formation.
The distance measurements for His 40 have a very small range. The N1 - Cub
distances range from 4.50 - 5.20 A. The range of N2 - Cub is 5.91 - 6.88 A. The range of
01 - Cua is 2.16 - 2.45 A. The range of 01 - Cub is 3.98 - 4.96 A. All of these ranges
have less than 1.0 A movement, and the smallest changes are seen for the 01 - Cua-
Evaluating all of these effects together, the His 40 is seen to remain stable and provide
coordination for the dicopper center for the M-S mechanism.
In examining the His 144 molecule, the range for the N1 - Cub distance is 3.73 -
6.38 A. The smallest distance is seen at the reactant, and the largest distance is seen at
the product. The range for the N2 - Cub is 2.87 - 5.01 A. Once again, the smallest
distance is seen at the reactant, and the largest distance is seen at the product. The
variance noted indicates that His 144 is not involved in coordination of the copper centers
and that the His 144 molecule is influenced heavily during the mM-S mechanism.
In the case of the His 146 molecule, the range for N1 - CuA is 4.11 - 4.25 A. The
range of N2 - Cua is 1.97 - 2.08 A. Both of these ranges are considerably smaller than
any of the other ranges for the mM-S mechanism and align well with the small ranges
seen for the mH-A mechanism. Once again this supports the coordinating and stability
effects of His 146.
5.3.4.3 Ct/1Cl/1 Scenario in the pMMO Active Site
Similarly, the energies associated with the mH-A and mM-S mechanisms were
recorded in Figure 5-9. The distances for the coordinating environment are recorded in
Table 5-3 and Table 5-4.

Rea
ctan
t R
elat
ive
Ener
gy
(Kca
l/mol
)
101
25.0
19 .919 .920.0
17 .9
19 .8
15.011 .7
10.0
8.28.25.0
2.9
0 .90.0
0.0TS2 PC TS3RC TS1 P
Figure 5-9: Energy Diagram for the Modified CunCu" scenario of the H-Abstraction (mH-A) and Methyl Shift (mM-S) mechanisms.

102
Table 5-3: Distance between atoms in the coordinating environment of the CunCun scenario for mH-A Mechanism. Figure 4-9 can be referenced for the active site configuration.
CuA-CuB
R|V12 RCm2 TS1m2 Im2 TS2m2 PCM2 TS3m2 Pm2
2.81 2.81 2.69 2.57 2.75 2.63 2.61 2.57
N 1-Cub 4.63 4.63 4.74 4.97 4.38 4.80 5.74 4.88
N2-Cub 5.81 5.81 5.77 6.11 5.44 5.87 6.97 6.33His 40
01-Cua 2.16 2.15 2.15 2.21 2.16 2.15 2.15 2.15
01-CUb 4.53 4.53 4.33 4.19 4.43 4.27 4.50 4.28
N 1-Cub 3.73 3.74 3.72 3.67 6.12 3.76 6.01 5.53His 144
N2-Cub 2.86 2.86 2.90 2.85 5.19 2.88 4.38 4.38
N1-CUa 4.12 4.12 4.21 4.19 4.19 4.22 4.14 4.20His 146
N2-Cua 1.98 1.98 2.06 2.04 2.05 2.07 1.99 2.05
Table 5-4: Distance between atoms in the coordinating environment of the CunCun scenario for mM-S Mechanism. Figure 4-9 can be referenced for the active site configuration.
Rh2 RCH2 TS1h2 lH2 PC H2 P H2
Cua-Cub 2.81 2.81 3.57 3.51 3.65 2.48
N1-Cub 4.63 4.63 4.66 4.93 4.55 5.44
N2-Cub 5.81 5.81 5.72 5.89 5.66 6.78His 40
OI-Cua 2.16 2.15 2.33 2.20 2.19 4.14
01-Cub 4.53 4.53 4.64 4.20 4.58 2.18
N1-CUb 3.73 3.74 3.74 3.75 3.77 6.57His 144
N2-Cub 2.86 2.86 2.86 2.91 2.87 5.00
N1-Cua 4.12 4.12 4.20 4.24 4.21 4.21His 146
N2-Cua 1.98 1.98 2.04 2.06 2.05 2.05
103
5.3A4 Discussion o f the CunCuH Scenario in the pMMO Active Site
The mH-A and mM-S mechanisms each have RC energies of 0.9 kcal/mol. The
search for transition structures between the RC and the I produced a high TS1 value of
18.9 kcal/mol for the mH-A mechanism, and a smaller TS1 values of 5.2 kcal/mol for the
mM-S mechanism. The transition state searches performed between the I and PC did not
produce acceptable transition structures. In the mM-S the structure did not exist. In the
mH-A mechanism, the energy associated with the TS2 was 18.8 kcal/mol, which is less
than the energy associated with the PC structure. This is interpreted as the transition state
non existing for that step. The transition search between the PC and P did result in a TS3
for the mH-A mechanism with a value of 22.4 kcal/mol. This is the highest energy
associated with the mechanism, indicating that the step that releases the product complex
is the energy barrier for the mechanism. The transition search between PC and P did not
return a favorable structure for the mM-S mechanism. The energy associated with each of
the products formed in for the mH-A and mM-S mechanisms was positive, deeming the
overall mechanism unfavorable. Overall, the energies associated with the mM-S
mechanism were considerably lower than most of the energies associated with the other
mechanisms and the different charge scenarios. This indicates that the higher charge
associated with the copper ions could provide a favorable environment for the proposed
mechanism steps to proceed.
The coordinating environment measurements were completed for the CunCun
scenario. The same format as above will be used where the mH-A mechanism will first
be discussed (see Table 5-3) then the mM-S mechanism will be discussed (see Table 5-
4).
104
In the mH-A mechanism, the Cua - Cub distance values range from 2.48 - 3.65 A.
The highest distance is seen at the product complex formation and the minimum distance
is seen at the following step, the product formation. The variance in the distance is over
1.0 A indicating a slight instability of the dicopper center throughout the steps of the
mechanism but becoming more stable in the final steps.
In the His 40 molecule, the range of distances for the N1 - Cub distance is 4.55 -
5.44 A. The range for N2 - Cub is 5.66 - 6.78 A. In reverse of the dicopper center CuA -
Cub measurement, the product formation is seen to be a minimum distance, and the
product is seen to have the highest distance. The range for the 01 - CuA distance is 2.15
- 4.14 A. Once again, a low distance measurement is seen for the product complex, and
the highest distance is measured at the product formation. Lastly, the 01 - Cub distance
ranges from 2.18 - 4.64 A. For this measurement, the lowest value of 2.18 A is seen for
the product formation. These values indicate a significant movement of the His 40
molecule throughout the mechanism, which is easily identified through the distance
measurements seen at the product formation. This would suggest that it does not play an
important role in coordinating or stabilizing as seen in the H-A mechanism for the Cu'Cu1
charge.
In the case of the His 144 molecule, the N1 - Cub measurement ranges from 3.73
- 6.57 A. The highest value is at the product formation. If this value is removed from
the range, the range would be reduced to 3.73 - 3.77 A, a significantly small range
indicating very little movement throughout the mechanism. The N2 - Cub range is 2.86 -
5.0 A. Once again, the highest value is at the product formation, and if this value is
removed from the range, the range would be reduced to 2.86 - 2.91 A. This small range

105
indicates stability throughout the mechanism with the largest movement of the His 144
molecule at the final step of the mechanism. It is unclear if the increased values are from
the release of the product and the movement of the molecules to allow for the product
detachment or if it is an effect of the high charge.
Lastly, the His 146 the N1 - C u a range is from 4.12 - 4.21 A. The N2 - C u a
range is from 1.98 - 2.05 A. Both of the small ranges indicate once again the His 146 has
little movement and provides stability and coordination to the dicopper center throughout
the entire H-A mechanism.
In the case of the mM-S mechanism (see Table 5-4), the distance between the two
coppers (C u a - C u b ) ranges from 2.57 - 2.81 A. This is the smallest range for the
dicopper center distance noted in the four different scenarios.
Within the His 40 molecule, the range of the N1 - Cub measurement is 4.38 - 4.97
A. The range of the N2 - CuB distance is 5.44 - 6.97 A. The range for the 01 - CuA is
2 .15-2 .21 A. The range of the 01 - Cub measurement is 4.19 - 4.53 A. When the
distances increase for the N1 - Cua and N1 - Cub measurements, this indicates that the
top of the amino acid, the nitrogen containing ring, has more movement through the steps
of the mechanism. The 01 - Cua and 01 - Cub measurements remain small and veiy
consistent, indicating little to no movement of the lower end of the amino acid throughout
the mechanism.
For the His 144 molecule, the range of values for the N1 - Cub is 3.72 - 6.12 A.
The highest values of 6.12 A, 6.01 A, and 5.53 A are seen at the TS2, TS3, and P
formations, respectively. The range for the N2 - Cub is from 2.85 - 5.19 A. Once again,
the highest values are 5.19 A, 4.38 A, and 4.38 A seen again at the T2, TS3, and P
106
formations, respectively. These particular values were noted due to their deviation from
the rest of the values within the range. These increases in distances could be a result of
the high +21+2 charge, but also because of the movement of molecules when the
transition state forms.
Lastly, the His 146 molecule starts with a range of values for the N1 - Cua
distance of 4.12 - 4.22 A. The distance range for the N2 - Cua measurement is 1.98 -
2.06 A. Once again, the small ranges for the measurements involved in this amino acid
indicate stability and helpful coordination of the dicopper center.
5.3.5 Overall Conclusions
What can be noted are the consistently low distance variations for the His 146
molecules in the mH-A and the mM-S Mechanisms. This trend indicates that even with
different charges and mechanism steps, the role of the amino acid remains significant.
Further testing of a mixed valence copper site might elucidate the oxygen atom behavior.
Although the mechanism has not been solved, the data from these simulations are very
useful in determining the important transition state configurations and amino acids
involved in the reactions.
5.4 Summary
• Proposed H-A and M-S mechanisms, as well as mH-A and mM-S mechanisms.
• Each mechanism was tested for the scenarios of Cu'Cu1 and CunCuu.
• Reaction pathway graphs were generated.
• The distances for the coordinating environment were recorded and analyzed to
show surrounding effects.

CHAPTER 6
KINETIC MONTE CARLO STUDIES
6.1 Introduction
The research included in this dissertation up to this point has produced results that
are quantitative but not directly comparable with experimental values due to the use of
models and assumptions. In other words, the work presented in Chapters 4 and 5 were on
the atomic and microscopic scale, which is not directly comparable to the macroscopic
scale. Enzymatic reactions are difficult to model due to the complexity involved with
biological systems, but the use of kinetic Monte Carlo techniques can aid in modeling
complex systems effectively through the use of random sampling techniques. This
chapter describes the integration of Molecular Dynamics (Chapter 4) and Density
Functional Theory (Chapter 5) values as input parameters into the macro-scale modeling
of methane oxidation by pMMO.
The traditional approach of modeling catalysis mechanisms involves the
methods such as mean-field modeling where the transport equations are described by
ordinary differential equations [96]. The methods consider average environments of
reactive sites and ignore microscopic local variations. This is a disadvantage as the
microscopic local variations are responsible for significant changes. Kinetic (or
Dynamic) Monte Carlo (kMC) methods are designed to overcome the approximation as
107

108
the local environments can be specified exactly [97]. In contrast to other techniques,
kMC is able to simulate many reaction types over various time scales up to the second
order and is used to study the time evolution of reactions. This technique is implored by
the coarse-grained program CARLOS 4.1 [87] and is available to the group through
previous collaborations with the program’s developers [89, 98, 99]. KMC is a model
with assumptions but it allows a comparison with experimental values through its
methods.
6.2 Input Parameters for CARLOS 4.1
The information that is required for the kMC studies are the microscopic energy
barriers and pre-exponential factors of the reaction rates involved in methane to methanol
oxidation. These values are obtained from Density Functional Theory (DFT) and
Transition State Theory (TST). For these kMC simulations, the values utilized come
from the Hydrogen Abstraction mechanism depicted in Section 4.5.
6.2.1 Density Functional Theory
DFT was used to energy optimize the substrate, product, and intermediate
structures of the active site of pMMO. These results were in the microscopic regime
(angstrom length scale) and provided accurate structural and energetic information for the
small model of the active site. The activation energies are required in order to calculate
the rate constants (see Equation 3-8). The activation energies calculated were facilitated
Intrinsic Reaction Coordinate (IRC) pathway calculations. The DFT calculations were
conducted using the PW91 exchange correlation function in combination with the double
numerical with polarization (DNP) basis set through the DMOL3 module of Materials
Studio® software [100]. The CunCuu scenario for the modified H-Abstraction

109
mechanism was used with the energy barrier for the C-H bond cleavage being used to
calculate the rate constant.
6.2.2 Transition State Theory.
The calculation of rate constants from the activation energies is conducted using
transition state theory (TST). Through this calculation, the pre-exponential factors can be
determined. TST is used to connect the kinetic and thermodynamic properties of a
system. By definition, the theory states that the substrates need to overcome an energy
barrier in order to form products. The theory also states that an equilibrium (Boltzmann)
energy distribution that relates the rate of reaction with the Gibbs free energy is shown in
Equation 3-8.
6.2.3 Molecular Dynamics
As specified in Chapter 5, the diffusion of methane was monitored in a
pMMO/water system. From those results, the simulation containing pMMO and one
methane and one oxygen was chosen to be evaluated. The diffusion coefficient of the
methane was obtained through statistical mechanics that are incorporated in the Forcite
module of Materials Studio® software [100].
Within the CARLOS program, there is an option to define rate constant due to
diffusion by Equation 6-1 below:
D Eq. 6-1
where a is the difference between grid points and D is the diffusion coefficient.
When a diffusion coefficient is unknown, the rate constant is taken directly from TST
calculations, as mentioned in Section 6.2.2. When diffusion coefficients are known, they
can be used to calculate a different rate, which is useful in providing a comparison for

110
modeling techniques. If the ro is utilized, the is assumed to be the distance between the
grid points that is used when the original 2-D structure of the input is created.
6.3 Computational Specifications & Assumptions
The CARLOS program requires that the 3-D enzyme structure be displayed as a
2-D reactive surface. This was done by taking the center of mass of each molecule and
having a three coordinate representation for the molecule rather than each atom.
Secondly, the x axis was negated so the y and z coordinates could be represented as a
single point on a 2-D lattice representation. Figure 6-1 shows the full 3-D enzyme (left)
from the CH3X entry [55] of the PDB [24] and the enzyme projected onto a 128 by 128
site 2-D grid (right).
Figure 6-1: Three dimensional enzyme structure from the CH3X entry [55] of the PDB [24] visualized in Materials Studio® (left). Two-dimensional enzyme structure of pMMO portrayed on lattice in CARLOS program [87,101] as input structure(right).

Ill
On the 2-D grid, the dimensional array of lattice points is called sites. Each site is
given a set of rules to indicate characteristic values or occupation. These characteristics
combine with the lattice information and are called the configuration. A simulation will
proceed and be seen as a change from one configuration to another. The behavior
allowed for each species is based on a set of probabilities and rules. Their behavior can
be diffuse, react, associate, or dissociate [85, 88, 89, 101].
Simply stated, substrates are placed randomly on the grid alongside active sites
and surrounding amino acids. During a specified time period, substrate molecules move
and take a random walk. Substrate molecules may react with a reactive region and, if they
interact with an active site, they are then converted to product. Each system or reaction
that is being modeled can be given governing rules to govern the behavior of substrates,
surrounding amino acids, or active sites. Assumptions are applied to the model to reduce
the complexity. These are the standard assumptions used within the Mainardi Group for
studying enzyme kinetics with this kMC approach, and are directly cited from Dandala et
al. [89]:
1. The motion of substrate molecules follows a random walk on the surface of the
lattice.
2. The motion of substrate molecules is restricted to the 2-D plane onto which the
positions of the obstacles (other amino acids that do not form part of the enzyme
active site) are projected.
3. There are no interactions between the individual substrates (methane and oxygen).
4. There are no interactions between the individual substrate species and the
obstacles.

112
5. Once the substrate species start a random walk.
6. The excluded volume condition is maintained, i.e., at any instant of time, one
lattice site cannot be occupied by more than one species of the same type.
The way the program approaches the reaction is by following the Michaelis-
Menten Kinetics equilibrium enzyme kinetics Equation 6-2 [102]:
J? + 5 —> ES —* E + P Eq. 6-2
where E denotes the enzyme, S denotes the substrate, ES is the intermediate
complex, and P is the product. The formation of an intermediate AS is not considered
due to the assumption that the system is diffusion limited. This means the substrate is
considered to be instantaneously converted to product at the active site (A). Therefore
Equation 6-2 reduces to a simpler reaction between the active site (A) and the substrate
molecule as shown in Equation 6-3:
A + S ^ A + P Eq*6-3
In summary, the initialization process is to first consider the pMMO enzyme
projected on a 2-D lattice. Figure 6-2 shows an area o f the pMMO enzyme with the
dicopper active site on the left. This same region is shown in a kMC output image on the
right. As depicted in Figure 6-2, the active site (green dots) can interact with substrates
(red dots) and result in the substrate turning into a product (blue dots). The surrounding
amino acids (black dots), also called obstacles, cannot interact. The diffusion path (or
random walk) that each substrate species takes is based on a probability of interacting.
Once a substrate has converted to a product, it will no longer interact with the active site.
The random walk of each substrate is complete after the allowable time has completed.

113
Figure 6-2: A dicopper active site of the pMMO enzyme with amino acids (left). The CARLOS output (post kMC run) is shown (right) with the active site (green dots), surrounding amino acids (black dots), substrate molecules (red dots), and product molecules (blue dots).
6.4 Procedure
As previously mentioned, each pMMO enzyme contains three subunits. In each
subunit lie three copper ions. There is a monocopper site that is approximately 20 A
away from the dicopper site (for a total of three ions). The dicopper site is shown to be
where methane oxidation occurs and is considered the active site in this research. For
this last form of experimentation, the full pMMO enzyme was considered. It is not
known if all three active sites are involved in the oxidation concurrently, though it is
often assumed to occur. In order to investigate if the three active sites could potentially be
involved in oxidation process at the same time without conflicting interaction, a trial was
run with all three active sites available for conversion.
In the following trials, one active site or three active sites are considered for fifty,
one-hundred, and two-hundred substrate additions. These six trials are then repeated with

114
the inclusion of a diffusion coefficient of 2.98 x 10‘8 cm s'2 for methane (Chapter 4
results). All twelve trials were run with the reaction barrier of 5 kcal mol'1 (CunCun
scenario of Chapter 5 results). The reaction barrier was chosen for comparison for this
baseline test, with the expectation that it will be refined. An example of the visual output
of a kMC simulation from CARLOS is shown in Figure 6-3. In this scenario, all three
dicopper active sites are displayed (green dots) with an initial setup of fifty substrate
molecules (red dots) shown on the left. The final configuration with product (blue dots)
formation (and substrate decreases) is shown on the right. The figures for all of the trials
have qualitative significance and are included in Appendix A for reference. A movie of
the simulations is included in a DVD addendum labeled “kMC simulations.”
(a) Initial configuration (b) Final configuration
Figure 6-3: CARLOS visuals of (a) input file with all three active sites (green dots) and an initial setup of fifty substrate molecules(red dots) And (b)the final configuration with the methanol product formation (blue dots).

115
The quantitative information that is generated through CARLOS is the fraction of
product formation over time. The output file provides information such as concentration
profiles o f substrates and products, obstacle (amino acid) density, and reaction rate
constants. In order to study the diffusion of methane to the active site of the enzyme on
the lattice, diffusion properties can be studied by calculating the root mean square
displacement (rms) of the diffusing substrate and the product molecule. These are related
by Equation 6-4 shown below.
(R2) = 4 Dta Eq. 6-4
where <R2> denotes the rms, D is the diffusion, and t is the time[89]. In order to
obtain the exponent a, the slope of the < R ^ versus time plotted on a log-log graph must
be obtained. The diffusive behavior, defined as o, depends on the size of the 2-D lattice
and obstacle concentrations. The diffusive behavior can thus be examined by calculating
the average diffusion length for time t, as shown in Equation 6-5 [89]
W Eq. 6-5
^ = F7 y ft* ” X| wi2 + “ y<(0l2}
where (xo,yo) is the position of the active site at the center of the lattice and (x,(f), yj(/)) is
the position of the substrate or product at time t. Np(/) is the number of products at time t.
6.5 Results and Discussion
In order to verify that the program was properly and systematically converting
substrate to product, a plot was constructed to show the concentration over time, as
shown in Figure 6-4.

116
0.010
0.009
0.008
S 0.0073uI 0.006E
0.005Substrate
— Productco"■5mk_4-*cVuc
0.004
o 0.003
0.002
0.001
0.0003000 4000 50000 1000 2000
Time (sec)
Figure 6-4: Concentration versus time for kMC simulation of methane substrates interacting with pMMO active sites. The amount of substrate, shown in blue, decreases over time. The amount of product, shown in red, is initially zero and increases throughout the allowed time limit.
The concentration of the substrate decreased proportionally to the product
formation. The results presented below in Figure 6-5 and Figure 6-6 display the
concentration of product over time for each of the previously described twelve trials.
Figure 6-6 incorporates the diffusion coefficient from the Chapter 4 results.

117
0.014
2000.012
100
3(Ja»0.010
oE§ 0.008
reE£ 0.006 t>3■o Ot -a o.oo4
0.002
0.0003,000 4,000 5,0001,000 2,0000
T im e (sec)
Figure 6-5: Rate of formation of product for a single active site (two copper ions) with initial substrate additions of fifty, one hundred, and two hundred over a period of five thousand seconds.

118
1.4E-04
200 with dc
100 with dc1.2E-04
^ — 50 with dc
1.0E-04
VIai| 8.0E-05 o E. c
| 6.0E-05 Ek.o
Ik
ts3TJOi -
4.0E-05
a
2.0E-05
0.0E+001,000 2,000 3,000 4,000 5,0000
Time (sec)
Figure 6-6: Rate of formation of product for a single active site (two copper ions) with initial substrate additions of fifty, one hundred, and two hundred over a period of five thousand seconds with the incorporation the diffusion coefficient.
In the case of a single active site (no diffusion coefficient incorporation) as seen
in Figure 6-5, the highest rate is seen with the two hundred substrate followed by the one
hundred and the fifty. The final rate of the two hundred substrate trial at the end of the
five thousand second time limit is almost triple that of the one hundred substrate trial.
With the inclusion of the diffusion coefficient, a drastic decrease in product rate
formation is noted. There is significantly less difference between the production rates of
the fifty, one hundred, and two hundred substrate trials. It is thought that this would

119
mimic the production limitation occurring in nature that there is an oxidation rate that
will not vary on the amount of substrate after a threshold is met. Further testing of this
idea is a continuation of this work.
Lastly, the inclusion of all three active sites (six copper ions) from the entire
pMMO enzyme was considered. Once again the simulation was run without the diffusion
coefficient (Figure 6-7) and then with the inclusion of the diffusion coefficient (Figure 6-
0.035
— 200
0.03— 100
vT 0.025fll3UaoJL 0.02cOreEfe 0.015u.t33•§v.a 0.01
0.005
1,000 2,000 3,000 4,000 5,0000Time (sec)
Figure 6-7: Rate of formation of product for three active sites (six copper ions) with initial substrate additions of fifty, one hundred, and two hundred over a period of five thousand seconds.

120
0.0004 ------------------------------------------------------------------------------------— 200 with dc
0.00035100 with dc
0.0003 — —50 with dc
_ 0.00025(AQ)3
® 0.00020 E,
1 0.00015 (0E° 0.0001 tJ3*3I 0.00005
0 ----------------------------------------------------------------------------0 1,000 2,000 3,000 4,000 5,000
Time (sec)
Figure 6-8: Rate of formation of product for three active sites (six copper ions) with initial substrate additions of fifty, one hundred, and two hundred over a period of five thousand seconds with the incorporation the diffusion coefficient.
When six copper ions were utilized, the overall production formation drastically
increases. In the case without the inclusion of the diffusion coefficient (Figure 6-7), the
highest rate of production for the two hundred substrate scenario was recorded at 0.03.
This is almost triple the rate that was seen for the two copper ion scenarios in Figure 6-5
as expected. This same trend is noted for the one hundred and fifty substrates as well.
When the diffusion coefficient was incorporated (Figure 6-8), the overall rate of
production was noted to be significantly less than the trials without the diffusion
*200 with dc
*100 with dc
•50 with dc

121
coefficient. Although the values for the six copper are significantly higher than the two
copper simulations, the incorporation of the diffusion coefficient decreases the rate of
product formation for the similar trials.
Lastly, the diffusive behavior, a, was calculated for each of the above four figures
and is summarized in Table 6-1. In order to understand how the rate of formation is
changing over time, a linear fit trend line was applied to the graph. The slope of the line
and the R2 value are provided in Table 6-2.
'STable 6-1: Slope and R value for the rate of diffusion versus time plots for single active site configurations for the initial substrate additions of fifty, one hundred, and two hundred.
Slope x IQ-6_______
Single Active Site (Figure 6-5)
200 initial substrates
100 initial substrates 50 initial substrates
2.395
0.8250.435
0.9925
0.97910.9398
Single Active Site with Incorporation of
Diffusion Coefficient
200 initial substrates 100 initial substrates
0.0130.014
0.42260.4730
(Figure 6-6) 50 initial substrates 0.004 0.1108200 initial substrates 4.387 0.9504
Three Active Sites 100 initial substrates 2.058 0.9219(Figure 6-7) 50 initial substrates 1.220 0.8855
Three Active Sites with Incorporation of
Diffusion Coefficient
200 initial substrates 100 initial substrates
0.0550.034
0.72950.6022
(Figure 6-8) 50 initial substrates 0.020 0.5623
The slope of each trend line was recorded to show relativity to each scenario. The
R2 value is shown to discuss the consistency of the data. For the single active site (Figure
6-5), the trend shows the doubling of values for the fifty, one hundred, and two hundred
substrates with fairly high R2 values, the highest being for the two hundred substrate trial.
The slope of the trend lines for the single active site with the incorporation of the

122
diffusion coefficient are much less consistent and the highest R value being 0.4730 for
the one hundred substrate trial, indicating the linear trend line association is not a valid
association with the data set. In the case of the three active sites without the diffusion
• • •coefficient (Figure 6-7), the slopes once again double and the R association remains
fairly consistent with the highest association being 0.9504 for the two hundred substrate
trial. Lastly, the incorporation of the diffusion coefficient for the three active sites
(Figure 6-8) indicates an increasing trend, but once again the R2 values are low, the
highest value being 0.7295 for the two hundred substrate trial. This indicates the linear
association is not a valid association.
In conclusion, the rate of production increases faster when the quantity of initial
substrates is greater. The difference between the use of three active sites and the single
active site is approximately three fold, and no hindrances are observed. Initially, it was
thought there would be a difference if product formation increased too drastically and the
substrates were converted to product too quickly.
Another qualitative observation is that the use of the diffusion coefficient did
decrease the rate of product formation as expected, but not with statistical consistency. It
was anticipated that the use of a diffusion coefficient would direct the substrate
molecules in an initial rate that would account for hindrances (etc.) as they diffuse during
the walk on the 2-D grid. There is a noticeable decrease in the rate as expected. The
computation of the exponent of the linear trend line had strong agreement with high R2
values until the incorporation of the diffusion coefficient with all three active sites. At
this point, the correlation is lost. The microscopic variances from the diffusion
coefficient calculations in Chapter 5 produced large variances in the macroscopic data
123
generated through these kMC simulations. More accurate diffusion coefficients will
increase the accuracy of the oxidation rates produced in these studies.
Although kMC has limitations, the goal of a kMC study is to obtain accurate and
predictive dynamics. And kMC is a robust tool that allows for dynamical predictions at
the macro scale without using a large number of assumptions[103]. Contained within this
chapter are the initial studies of methane oxidation by pMMO. This method of testing can
be used for multiple rapid scans under various conditions for a broader range of modeling
studies on the enzyme. With the refinement of experimental data as inputs, this model
will become stronger and can be used in further testing of pMMO or a pMMO/MDH
model. The results can also be used as input (or verifications) for higher level studies,
such as rate theory models or finite-element simulations[103].
6.6 Summary
• CARLOS program was used to perform kMC simulations to detail the methane
oxidation reaction performed by pMMO.
• The addition of diffusion coefficients as an input parameter assisted in increasing
the understanding of the movement of methane in the system.
CHAPTER 7
CONCLUSIONS AND FUTURE WORK
7.1 Conclusions
Presented in this dissertation are three different approaches of modeling the
enzymatic activity of pMMO. Through the use of multiscale modeling pMMO, was
characterized through the study of its interactions, mechanistic values, and macro-scale
oxidation rates.
Initially the active site of the pMMO was investigated through observing its
interaction with neighboring enzyme, MDH. Models of both enzymes were minimized
using Molecular Mechanics and then introduced to molecules of methane and oxygen
atoms (considered substrates) in an effort to understand the preferential docking regions
of the enzymes. The protein environment was simulated through the use of a dielectric
constant to imitate the effects of a large protein environment surrounding the active
region that was studied. The substrates showed preference towards the dicopper region of
pMMO. Molecular Dynamics and Statistical Mechanics were used to calculate the
diffusion coefficients and to further investigate the substrates approach of the dicopper
active site. Lastly, time dependent studies were performed using statistical probabilities
through kinetic Monte Carlo (kMC) technique to evaluate the rate of methane oxidation.
124

125
Initially, models were used to study how MDH and pMMO interacted in an effort
to determine the most active region within pMMO. Once the active site was deemed
preferable, two mechanisms were proposed. The proposals were based on a combination
of enzymatic catalysis theories. A detailed explanation of the system assumptions was
provided. The H-Abstraction mechanism proceeds with the oxygen atom binding to the
copper ion, followed by the hydrogen abstraction from methane to bind with the available
oxygen bond. The Methyl-Shift Mechanism proceeds with oxygen binding to the copper
ion, but the hydrogen that is abstracted from the methane binds directly to the copper.
Lastly, the results from the mechanistic studies were applied to a Kinetic Monte
Carlo study. Through this investigation, the rates of methane to methanol conversion
were determined and compared to experimental data. The results provide an
understanding of methane to methanol conversion surrounding the active site.
Specific conclusions:
• Appropriate models were created to represent the active regions of both
enzymes for the purposes of docking studies and substrate approach.
• The minimum energy configuration of MDH/pMMO supported the
hypothesis that the active regions were sufficiently close to one another to
allow for methanol fuel consumption by MDH after its production by
pMMO.
• The positioning of substrates at the dicopper region confirmed its
preference as an active region.

126
• The hydrophobic pocket of pMMO was visualized and maintained
throughout all Molecular Mechanic and Classical Monte Carlo
simulations.
• The Histidine 146 molecule had the smallest diffusion coefficients and the
minimum coordination distances through the dynamic simulations,
indicating a significant role in maintaining the coordinating environment
of the identified active site.
• From the proposed H-Abstraction and Methyl Shift mechanisms, the
Cu’Cu1 and CunCun scenarios were not favorable overall, but through
examination of the coordinating environment, structures were proposed
for modifications. Specifically, a coordinating role for Histidine 146 was
identified.
• Modified H-Abstraction and Methyl Shift mechanisms were proposed
based on the data from the initial proposed mechanisms. The Cu'Cu1 and
CuuCun scenarios were attempted once again, but both were deemed
overall unfavorable. The modified Methyl Shift had overall decreased
energy barriers, indicating regions for further refinement.
• Kinetic Monte Carlo trials were run to obtain macroscopic methanol
oxidation rates. The reaction components were verified. Validation of
following of the model parameters was completed.
• When three active sites were used, the rate was triple that of a single
active site use, indicating no hindrances.
127
• The incorporation of the diffusion coefficients for the Kinetic Monte Carlo
trials did decrease the rate of product formation, but not with consistency.
This indicated that the variances in the diffusion coefficient at the
microscopic scale led to larger deviations at the macroscopic scale.
7.2 Future Work
As frequently mentioned in this work, computational research is complemented
and advanced by experimental research (and vice versa). The next steps in studying
methane oxidation performed by pMMO would have both computational and
experimental elements.
7.2.1 Computational Studies
The continuation of this research could follow five approaches:
1. Consider mixed valence dicopper active sites
It has been suggested that the advantage of a mixed valence active site might
increase the stability of the enzymatic system by strengthening the coordinating
environment [25, 45]. Testing of C u tu 11 and CunCum could be considered in
future studies and exploration of H-Abstraction and Methyl Shift mechanisms.
2. Perform advanced DFT using hybrid methods (B3LYP. B3PW91. MPWPW91
etc.) using the new upgrades available in Materials Studio® 6.0
As with any computational technique, the accuracy of the data is important. The
use of PW91 method for the DFT studies in Chapter 5 is widely accepted but
contains the possibility of errors. The use of hybrid methods such as Modified
Perdew-Wang91Perdew-Wang91 (MPWPW91) or Becke 3-Parameter
(Exchange), Lee, Yang and Parr (B3LYP) could refine the structures and thus the

128
associated energies. Results found at these theory levels are considered more
refined and can be further used to obtained more realistic kinetic information [82].
3. Extended mechanistic studies with various radical formation (CFhO. etc.)
As stated, the mechanism is unknown. The natural occurrence of methane
oxidation at ambient pressure and temperature has made this process desirable to
mimic. Unfortunately, this has not been done in the industrial setting. Details of
this conversion are available for various methane oxidation processes, many of
which suggest different radical formation in the industrial settings of higher
pressures and temperatures [104]. Moving forward, considerations for various
radical formations and their selectivity in the mechanism could provide key
insights to determining pMMO’s mechanism at ambient temperatures and
pressures.
4. Study C-H bond cleavage and dioxygen cleavage
Lastly, a new theoretical study to continue this project is the elaboration on the
cleavage of the dioxygen bond and also the cleavage of the C-H bond, both of
which were assumed in the entirety of the research presented. At the time of this
dissertation, no application or considerations of these ideas has been taken toward
pMMO.
5. Perform model studies to determine the appropriate size of a model for
mechanistic studies
Model studies are critical in molecular modeling. The size of the model
determines the stability, but also assists in determining active molecules in a
reaction. For the initial studies in this dissertation, the key closest amino acids

129
(Histidine 40, Histidine 144, and Histidine 146) were included to stabilize the
copper ions throughout the oxidation process. One important consideration for
future modeling should be to consider an additional shell of two or three amino
acids. This kind of study is important to the scientific community in determining
an appropriate baseline model for future kinetic studies to be comparable. Simply
stated, it may be advantageous to be able to state that models containing a
researched minimum (i.e. five crucial amino acids or above one hundred atoms)
are appropriate when modeling a specific enzyme. These types of studies have
not been performed for the pMMO enzyme, but are commonly discussed
regarding other enzymes.
6. Perform pH studies
It is known that the pMMO enzyme prefers a basic environment to perform its
catalytic functions in vivo. Studies could be performed with the inclusion of OH
molecules in the water box simulation environment (Chapter 4) to create a desired
pH. By studying a range of pH values, a premium environment for catalytic
function could be determined through the examination of the effects of pH on
diffusion coefficients.
7.2.2 Experimental Work
In order to complement this research, a series of experiments should be developed
to support the mechanistic findings described in this dissertation. Fundamental
knowledge of how pMMO activates inert methane C-H bond is of interest in the chemical
community but is of larger scientific interest. The studying of enzyme catalysis with a
focus on chemical properties could provide an advance to basic chemical research.
130
Studying the interactions of pMMO/MDH could be completed with the collaboration of
biologists at Louisiana Tech University. One specific study that would parallel the
pMMO/MDH docking studies that were computationally performed would be to use Site
Directed Mutagenesis targeting amino acids critical to pMMO and MDH. Mutagenesis
studies are used to change the structure of molecules (in this case, the protein) and could
help to develop regioselectity for novel biological applications. One limitation observed
is that there is not a defined structure expressing system for pMMO that is required for
the mutagenesis studies [16].
Secondly, experimentally M. trichosporium can be grown in a Higgins nitrate
mineral salt medium containing 5pM Cu solely producing pMMO. Experimentalists
have found that NaCl can be used to inhibit MDH thus allowing them to quantify
methane to methanol conversion by pMMO experimentally [44], Duplicating these
methods with a designed protein could be a way to investigate ranges of catalytic
function.
Lastly, isolating the active region of pMMO could lead to optimizing the catalytic
function of pMMO or assist in creating a synthetic catalyst. Researchers at the University
of Illinois at Urbana-Champaign have successfully created a model of the active site of
the NiFe hydrogenase enzyme containing a nickel-iron active site. Rauchfuss et al.
created the complex to include a bridging hydride ligand which has been deemed crucial
for catalytic activity [105, 106]. Their efforts in modeling the active site and further
creating a structure have broken the ground for studying how natural catalyst can be
optimized. This logic could be applied to a broad range of enzymes that are examined for
catalytic function.

131
The need to continue to investigate methane oxidation by pMMO remains large.
Although insight has been provided in this dissertation, like most research, it prompted
many more questions. The use of multiscale modeling has assisted in providing data that
is useful to other computational chemists, as well as quantitative and qualitative
information for experimental researchers.

APPENDIX A
KMC IMAGES FROM CARLOS PROGRAM
132

133
Contained within this appendix are the twelve input and output files from
CARLOS 4.1 kMC simulations run in Chapter 6. These figures are qualitatively
important to see the conversion of methane (red dots) to methanol (blue dots), and assist
in understanding the progression of the simulations. Movie of each of these trials are
included in the disc addendum and are labeled ‘kMC simulations.’
A.l kMC Outputs from CARLOS
In the experiments from Chapter 6, methane oxidation by pMMO was modeled
using CARLOS 4.1 and was performed for time dependent simulations. In the following
trial outputs one active site and three active sites are considered for initial substrate
additions of fifty, one-hundred, and two-hundred for a total of twelve trials. The first trial
considered all three dicopper active sites (six Cu) with the initial concentration of fifty
methane, as shown in Figure A -l.
Figure A-l: pMMO 2-D Lattice Model for six copper ions (green dots). In the initial structure (left) there are fifty methane substrates (red dots). Methanol product formation (blue dots) is seen in the final structure (right). Obstacles, or surrounding amino acids, are also shown (black dots).

134
The second trial considered all three dicopper active sites (six Cu) with the initial
concentration of one-hundred methane, as shown in Figure A-2.
Figure A-2: pMMO 2-D Lattice Model for six copper ions (green dots). In the initial structure (left) there are 100 methane substrates (red dots). Methanol product formation (blue dots) is seen in the final structure (right). Obstacles, or surrounding amino acids, are also shown (black dots).
The third trial considered all three dicopper active sites (six Cu) with the initial
concentration of two-hundred methane, as shown in Figure A-3.

135
Figure A-3: pMMO 2-D Lattice Model for six copper ions (green dots). In the initial structure (left) there are 200 methane substrates (red dots). Methanol product formation (blue dots) is seen in the final structure (right). Obstacles, or surrounding amino acids, are also shown (black dots).
The fourth trial considered one dicopper active site (two Cu) with the initial
concentration of fifty methane molecule substrates, as shown in Figure A-4.
Figure A-4: pMMO 2-D Lattice Model for two copper ions (green dots). In the initial structure (left) there are fifty methane substrates (red dots). Methanol product formation (blue dots) is seen in the final structure (right). Obstacles, or surrounding amino acids, are also shown (black dots).

136
The fifth trial considered one dicopper active site (two Cu) with the initial
concentration of one hundred methane molecule substrates, as shown in Figure A-5.
Figure A-5: pMMO 2-D Lattice Model for two copper ions (green dots). In the initial structure (left) there are one hundred methane substrates (red dots). Methanol product formation (blue dots) is seen in the final structure (right). Obstacles, or surrounding amino acids, are also shown (black dots).
The sixth trial considered one dicopper active sites (three Cu) with the initial
concentration of two hundred methane with diffusion included as an input parameter, as
shown in Figure A-6.

137
Figure A-6: pMMO 2-D Lattice Model for two copper ions (green dots). In the initial structure (left) there are two hundred methane substrates (red dots). Methanol product formation (blue dots) is seen in the final structure (right). Obstacles, or surrounding amino acids, are also shown (black dots).
The seventh trial considered all three dicopper active sites (six Cu) with the initial
concentration of fifty methane with diffusion included as an input parameter, as shown in
Figure A-7.

138
Figure A-7: pMMO 2-D Lattice Model for six copper ions (green dots). In the initial structure (left) there are fifty methane substrates (red dots). Methanol product formation (blue dots) is seen in the final structure (right). Obstacles, or surrounding amino acids, are also shown (black dots). In this trial the diffusion coefficient has been incorporated.
The eighth trial considered all three dicopper active sites (six Cu) with the initial
concentration of one-hundred methane with diffusion included as an input parameter, as
shown in Figure A-8.

139
Figure A-8: pMMO 2-D Lattice Model for six copper ions (green dots). In the initial structure (left) there are 100 methane substrates (red dots). Methanol product formation (blue dots) is seen in the final structure (right). Obstacles, or surrounding amino acids, are also shown (black dots). In this trial the diffusion coefficient has been incorporated.
The ninth trial considered all three dicopper active sites (six Cu) with the initial
concentration of two-hundred methane with diffusion included as an input parameter, as
shown in Figure A-9.
140
Figure A-9: pMMO 2-D Lattice Model for six copper ions (green dots). In the initial structure (left) there are two hundred methane substrates (red dots). Methanol product formation (blue dots) is seen in the final structure (right). Obstacles, or surrounding amino acids, are also shown (black dots). In this trial the diffusion coefficient has been incorporated.
The tenth trial considered one dicopper active site (two Cu) with the initial
concentration of fifty methane with diffusion included as an input parameter, as shown in
Figure A-10.

141
Figure A-10: pMMO 2-D Lattice Model for two copper ions (green dots). In the initial structure (left) there are fifty methane substrates (red dots). Methanol product formation (blue dots) is seen in the final structure (right). Obstacles, or surrounding amino acids, are also shown (black dots). In this trial the diffusion coefficient has been incorporated.
The eleventh trial considered one dicopper active site (two Cu) with the initial
concentration of one-hundred methane with diffusion included as an input parameter, as
shown in Figure A-l 1.

142
Figure A -ll: pMMO 2-D Lattice Model for two copper ions (green dots). In the initial structure (left) there are one hundred methane substrates (red dots). Methanol product formation (blue dots) is seen in the final structure (right). Obstacles, or surrounding amino acids, are also shown (black dots). In this trial the diffusion coefficient has been incorporated.
APPENDIX B
ENGINEERING EDUCATION AND OUTREACH

144
B.l Experiences
Throughout graduate school days this researcher has been passionately involved
in inspiring and educating students in the K-12 population about the concepts and
applications of engineering. The first experience with this was with Dr. Tabbetha
Dobbins, the first quarter at Louisiana Tech. Two undergraduates and this researcher
fulfilled her request to create a Nanoscale Measurements and Analysis Workshop to be
delivered to neighboring schools in Grambling, Louisiana. The nanoscale concept was
introduced to students and they were engaged in activities using research equipment like
a UV-VIS spectrometer.
Shortly after Dr. Mainardi’s group was formed, the team became involved in the
National Science Foundation’s GK-12 Teaching Fellow program. Within this program
labs were created and lessons were delivered to high-risk students in middle schools in
Monroe, Louisiana.
The experience of being a former Research Experience for Undergraduates (REU)
student increased the understanding of the value of research experiences. Through
Louisiana Tech’s Research Experience for Teachers (RET) grant, Tanya Culligan, a
middle school biology and chemistry teacher was mentored as she conducted research
with Dr. Mainardi’s group through the summers of 2007 and 2008.
Included below is the paper “In Search of the Active Site of pMMO Enzyme:
Partnership between a K-12 Teacher, a Graduate K-12 Teaching Fellow, and a Research
Mentor” written by Bearden, Culligan, and Mainardi.

145
B.2 Abstract
The partnership between a K-12 teacher (Culligan), an NSF GK-12 Teaching
Fellow graduate student (Bearden), and a Louisiana Tech faculty member (Mainardi)
collaborating in a research and education project is described in this work. The unique
grouping of these three researchers allows for maximum dissemination of developed
modules. By the end of a 6-week RET program, the group developed modules to explain
the concept of the research conducted on the modeling of enzymes.
The full paper can be reviewed:
K. Bearden. Daniela S. Mainardi, and Tanya Culligan, "In Search of the Active of
pMMO Enzyme: Partnership between a K12 Teacher, a Graduate K12 Teaching Fellow, and a
Research Mentor" (2009) Chemical Engineering Education, Volume 43 (4) pp 273-278.
BIBLIOGRAPHY
[1] S. L. Caldwell, J. R. Laidler, E. A. Brewer, J. O. Eberly, S. C. Sandborgh, and F.S. Colwell, "Anaerobic Oxidation of Methane: Mechanisms, Bioenergetics, and the Ecology of Associated Microorganisms," Environmental Science & Technology, vol. 42, pp. 6791-6799,2008.
[2] R. N. Austin and J. T. Groves, "Alkane-oxidizing metalloenzymes in the carbon cycle," Metallomics, vol. 3, pp. 775-787, 2011.
[3] S. Lee and R. Iredall, Methanol Synthesis Technology: Taylor & Francis, Inc., 1989.
[4] B. E. Watkins, J. H. Satcher Jr., M. W. Droege, and R. T. Taylor, "Biomimetic Methane Oxidation," 1995.
[5] G. A. Olah, A. Goeppert, and G. K. S. Prakash, Beyond Oil and Gas: The Methanol Economy: Wiley-VCH, 2006.
[6] J. M. Ogden, M. M. Steinbugler, and T. G. Kreutz, "A comparison of hydrogen, methanol and gasoline as fuels for fuel cell vehicles: implications for vehicle design and infrastructure development," Journal o f Power Sources, vol. 79, pp. 143-168, 1999.
[7] S. K. Dubey, P. Padmanabhan, H. J. Purohit, and S. N. Upadhyay, "Tracking of methanotrophs and their diversity in paddy soil: A molecular approach," Current Science, vol. 85, pp. 92-95,2003.
[8] R. Whittenbury and H. Dalton, "The methylotrophic bacteria," in The prokaryotes, M. P. Starr, H. Stolp, H. G. Truper, A. Balows, and H. G. Schlegel, Eds. Heidelberg: Springer-Verlag, 1981, pp. 894-902.
[9] T. Henckel, M. Friedrich, and R. Conrad, "Molecular Analyses of the Methane- Oxidizing Microbial Community in Rice Field Soil by Targeting the Genes of the 16S rRNA, Particulate Methane Monooxygenase, and Methanol Dehydrogenase," Appl. Environ. Microbiol., vol. 65, pp. 1980-1990, May 1,1999 1999.
[10] S. K. Dubey, A. S. K. Sinha, and J. S. Singh, "Differential inhibition of CH4 oxidation in bare, bulk and rhizosphere soils of dryland rice field by nitrogen fertilizers," Basic and Applied Ecology, vol. 3, pp. 347-355,2002.
146
147
[11] B. Gilbert and P. Frenzel, "Rice roots and CH4 oxidation: the activity of bacteria, their distribution and the microenvironment," Soil Biology and Biochemistry, vol. 30, pp. 1903-1916, 1998.
[12] R. S. Hanson and T. E. Hanson, "Methanotrophic bacteria," Microbiol. Rev., vol. 60, pp. 439-471, June 1,1996 1996.
[13] T. J. Smith and H. Dalton, "Biocatalysis by methane monooxygenase and its application to the petroleum industry," in Petroleum Biotechnology, Developments and Perspectives, R. Vazquez-Duhalt and R. Quentero-Ramirez, Eds. Amsterdam, The Netherlands: Elsevier Science, BV, 2004, pp. 177-192.
[14] K. A. Smith, K. E. Dobbie, B. C. Ball, L. R. Bakken, B. K. Sitaula, S. Hansen, R. Brumme, W. Borken, S. Christensen, A. Prieme, D. Fowler, J. A. Macdonald, U. Skiba, L. Klemedtsson, A. Kasimir-Klemedtsson, A. Degorska, and P. Orlanski, "Oxidation of atmospheric methane in Northern European soils, comparison with other ecosystems, and uncertainties in the global terrestrial sink," Global Change Biology, vol. 6, pp. 791-803, 2000.
[15] N. Myronova, A. Kitmitto, R. F. Collins, A. Miyaji, and H. Dalton, "Three- Dimensional Structure Determination of a Protein Supercomplex That Oxidizes Methane to Formaldehyde in Methylococcus capsulatus (Bath)," Biochemistry, vol. 45, pp. 11905-11914, 2006.
[16] J. C. Murrell and T. J. Smith, "Biochemistry and Molecular Biology of Methane Monooxygenase Handbook of Hydrocarbon and Lipid Microbiology," K. N. Timmis, Ed.: Springer Berlin Heidelberg, 2010, pp. 1045-1055.
[17] S.-W. Lee, D. R. Keeney, D.-H. Lim, A. A. Dispirito, and J. D. Semrau, "Mixed Pollutant Degradation by Methylosinus trichosporium OB3b Expressing either Soluble or Particulate Methane Monooxygenase: Can the Tortoise Beat the Hare?," Applied and Environmental Microbiology, vol. 72, pp. 7503-7509, December 2006 2006.
[18] R. I. Masel, Chemical Kinetics and Catalysis: John Wiley & Sons, 2001.
[19] M. G. Serra, "Theoretical Studies of Systems of Biochemical Interest Containing Fe and Cu Transition Metals," in Chemistry. Universitat de Girona, 2009, p. 212.
[20] V. Renugopalakrishnan, R. Garduno-Juarez, G. Narasimhan, C. S. Verma, X. Wei, and P. Li, "Rational design of thermally stable proteins: relevance to bionanotechnology," JNanosci Nanotechnol, vol. 5, pp. 1759-67,2005.
[21] K. Hult and P. Berglund, "Engineered enzymes for improved organic synthesis," Curr Opin Biotechnol, vol. 14, pp. 395-400,2003.
[22] J. Zhang, H. Zheng, S. L. Groce, and J. D. Lipscomb, "Basis for specificity in methane monooxygenase and related non-heme iron-containing biological

148
oxidation catalysts," Journal o f Molecular Catalysis A: Chemical, vol. 251, pp. 54-65, 2006.
[23] K. J. Waldron and N. J. Robinson, "How do bacterial cells ensure that metalloproteins get the correct metal?," Nat Rev Micro, vol. 7, pp. 25-35, 2009.
[24] R. C. f. S. B. (RCSB), Rutgers, and UCSD, "RCSB Protein Data Bank."
[25] R. A. Himes and K. D. Karlin, "Copper-dioxygen complex mediated C-H bond oxygenation: relevance for particulate methane monooxygenase (pMMO)," Current Opinion in Chemical Biology, vol. 13, pp. 119-131,2009.
[26] V. L. Schramm, "Introduction: Principles of Enzymatic Catalysis," Chemical Reviews, vol. 106, pp. 3029-3030,2006.
[27] A. M. Wadzinski and D. W. Ribbons, "Oxidation of Cl compounds by particulate fractions from Methylococcus capsulatus: properties of methanol oxidase and methanol dehydrogenase," JBacteriol, vol. 122, pp. 1364-74,1975.
[28] C. Brantner, C. Remsen, H. Owen, L. Buchholz, and M. Collins, "Intracellular localization of the particulate methane monooxygenase and methanol dehydrogenase in Methylomicrobium album BG8," Archives o f Microbiology, vol. 178, pp. 59-64,2002.
[29] M. Ghosh, C. Anthony, K. Harlos, M. G. Goodwin, and C. Blake, "The refined structure of the quinoprotein methanol dehydrogenase from Methylobacterium extorquens at 1.94 a," Structure, vol. 3, pp. 177-187,1995.
[30] P. A. Williams, L. Coates, F. Mohammed, R. Gill, P. T. Erskine, A. Coker, S. P. Wood, C. Anthony, and J. B. Cooper, "The atomic resolution structure of methanol dehydrogenase from Methylobacterium extorquens," Acta Crystallographica: Section D, vol. 61, pp. 75-79,2005.
[31] A. Kunjumon, "Role of ammonia in the activation of methanol dehydrogease/cytochrome cL enzyme," in Biomedical Engineering: Louisiana Tech University, 2011, p. 127.
[32] N. B. Idupulapati and D. S. Mainardi, "A DMol3 study of the methanol addition- elimination oxidation mechanism by methanol dehydrogenase enzyme," Molecular Simulation, vol. 34, pp. 1057-1064,2008.
[33] N. B. Idupulapati and D. S. Mainardi, "Quantum Chemical Modeling of Methanol Oxidation Mechanism by Methanol Dehydrogenase Enzymes: Effect of Subsitution of Calcium by Barium in the Active Site," Journal o f Physical Chemistry A, vol. 144, pp. 1887-1896,2010.

149
[34] S. White, G. Boyd, F. S. Mathews, Z. Xia, W. Dai, Y. Zhang, and V. L. Davidson, "The active site structure of the calcium-containing quinoprotein methanol dehydrogenase," Biochemistry, vol. 32, pp. 12955-12958,1993.
[35] Z.-x. Xia, Y.-n. He, W.-w. Dai, S. A. White, G. D. Boyd, and F. S. Mathews, "Detailed Active Site Configuration of a New Crystal Form of Methanol Dehydrogenase from Methylophilus W3A1 at 1.9 A Resolution," Biochemistry, vol. 38, pp. 1214-1220,1998.
[36] Z.-x. Xia, W.-w. Dai, J.-p. Xiong, Z.-p. Hao, V. L. Davidson, S. White, and F. S. Mathews, "The three-dimensional structures of methanol dehydrogenase from two methylotrophic bacteria at 2.6-Angstrom resolution," Journal o f Biological Chemistry vol. 267, pp. 22289-22297,1992.
[37] P. R. Afolabi, F. Mohammed, K. Amaratunga, O. Majekodunmi, L. Dales, R.Gill, D. Thompson, B. Cooper, P. Wood, M. Goodwin, and C. Anthony, "Site- Directed Mutagenesis and X-ray Crystallography of the PQQ-Containing Quinoprotein Methanol Dehydrogenase and Its Electron Acceptor, Cytochrome cLa€ ,a€j," Biochemistry, vol. 40, pp. 9799-9809,2001.
[38] C. Anthony and P. Williams, "The structure and mechanism of methanol dehydrogenase," Biochimica et Biophysica Acta (BBA) - Proteins & Proteomics, vol. 1647, pp. 18-23,2003.
[39] M. Leopoldini, N. Russo, and M. Toscano, "The preferred reaction path for the oxidation of methanol by PQQ-containing methanol dehydrogenase: addition- elimination versus hydride-transfer mechanism," Chemistry, vol. 13, pp. 2109-17,2007.
[40] R. Ghosh and J. R. Quayle, "Purification and properties of the methanol dehydrogenase from Methylophilus methylotrophus," Biochemical Journal, vol. 199, pp. 245-250,1981.
[41] H. Boumans, L. A. Grivell, and J. A. Berden, "The respiratory chain in yeast behaves as a single functional unit," J Biol Chem, vol. 273, pp. 4872-7,1998.
[42] H. Schagger and K. Pfeiffer, "Supercomplexes in the respiratory chains of yeast and mammalian mitochondria," EmboJ, vol. 19, pp. 1777-83,2000.
[43] A. Stroh, O. Anderka, K. Pfeiffer, T. Yagi, M. Finel, B. Ludwig, and H. Schagger, "Assembly of respiratory complexes I, III, and IV into NADH oxidase supercomplex stabilizes complex I in Paracoccus denitrificans," J Biol Chem, vol. 279, pp. 5000-7,2004.
[44] S. G. Lee, J. H. Goo, H. G. Kim, J. I. Oh, Y. M. Kim, and S. W. Kim, "Optimization of methanol biosynthesis from methane using Methylosinus trichosporium OB3b," Biotechnology Letters, vol. 26, pp. 947-950,2004.

150
[45] R. Balasubramanian, S. M. Smith, S. Rawat, L. A. Yatsunyk, T. L. Stemmier, and A. C. Rosenzweig, "Oxidation of methane by a biological dicopper centre," Nature, vol. 465, pp. 115-119,2010.
[46] A. S. Hakemian and A. C. Rosenzweig, "The Biochemistry of Methane Oxidation," Annual Review o f Biochemistry, vol. 76, pp. 223-241, 2007.
[47] E. I. Solomon, U. M. Sundaram, and T. E. Machonkin, "Multicopper Oxidases and Oxygenases," Chemical Reviews, vol. 96, pp. 2563-2606,1996.
[48] J. D. Lipscomb, "Biochemistry of the Soluble Methane Monooxygenase," Annual Review o f Microbiology, vol. 48, pp. 371-399,1994.
[49] D. E. T. Pazmino, M. Winkler, A. Glieder, and M. W. Fraaije, "Monooxygenases as biocatalysts: Classification, mechanistic aspects and biotechnological applications," Journal o f Biotechnology, vol. 146, pp. 9-24.
[50] R. L. Lieberman, K. C. Kondapalli, D. B. Shrestha, A. S. Hakemian, S. M. Smith, J. Telser, J. Kuzelka, R. Gupta, A. S. Borovik, S. J. Lippard, B. M. Hoffman, A.C. Rosenzweig, and T. L. Stemmier, "Characterization of the Particulate Methane Monooxygenase Metal Centers in Multiple Redox States by X-ray Absorption Spectroscopy," Inorganic Chemistry, vol. 45, pp. 8372-8381, 2006.
[51] R. Balasubramanian and A. C. Rosenzweig, "Structural and Mechanistic Insights into Methane Oxidation by Particulate Methane Monooxygenase," Accounts o f Chemical Research, vol. 40, pp. 573-580,2007.
[52] D. Leak and H. Dalton, "Growth yields of methanotrophs," Applied Microbiology and Biotechnology, vol. 23, pp. 470-476, 1986.
[53] C. E. Fru, N. D. Gray, C. McCann, J. d. C. Baptista, B. Christgen, H. M. Talbot, A. El Ghazouani, C. Dennison, and D. W. Graham, "Effects of copper mineralogy and methanobactin on cell growth and sMMO activity in Methylosinus trichosporium OB3b," Biogeosciences Discuss, vol. 8, pp. 2851-2874,2011.
[54] S. M. Smith, S. Rawat, J. Telser, B. M. Hoffman, T. L. Stemmier, and A. C. Rosenzweig, "Crystal structure and characterization of particulate methane monooxygenase from Methylocystis species strain M," Biochemistry, vol. 50, pp. 10231-40,2011.
[55] A. S. Hakemian, K. C. Kondapalli, J. Telser, B. M. Hoffman, T. L. Stemmier, and A. C. Rosenzweig, "The Metal Centers of Particulate Methane Monooxygenase from Methylosinus trichosporium OB3b," Biochemistry, vol. 47, pp. 6793-6801, 2008.
[56] R. L. Lieberman and A. C. Rosenzweig, "Crystal structure of a membrane-bound metalloenzyme that catalyses the biological oxidation of methane," Nature, vol. 434, pp. 177-182,2005.
151
[57] B. F. Gherman, B. D. Dunietz, D. A. Whittington, S. J. Lippard, and R. A. Friesner, "Activation of the C-H Bond of Methane by Intermediate Q of Methane Monooxygenase: A Theoretical Study," Journal o f the American Chemical Society, vol. 123, pp. 3836-3837,2001.
[58] P. E. M. Siegbahn and R. H. Crabtree, "Mechanism of C-H Activation by Diiron Methane Monooxygenases: Quantum Chemical Studies," Journal o f the American Chemical Society, vol. 119, pp. 3103-3113,1997.
[59] A. C. Rosenzweig, "The metal centres of particulate methane mono-oxygenase," Biochemical Society Transactions, vol. 036, pp. 1134-1137,2008.
[60] K. Yoshizawa and Y. Shiota, "Conversion of Methane to Methanol at the Mononuclear and Dinuclear Copper Sites of Particulate Methane Monooxygenase (pMMO): A DFT and QM/MM Study," Journal o f the American Chemical Society, vol. 128, pp. 9873-9881,2006.
[61] B. F. Gherman, W. B. Tolman, and C. J. Cramer, "Characterization of the structure and reactivity of monocopper-oxygen complexes supported by beta- diketiminate and anilido-imine ligands," Journal o f Computational Chemistry, vol. 27, pp. 1950-1961,2006.
[62] A. Decker and E. I. Solomon, "Dioxygen activation by copper, heme and nonheme iron enzymes: comparison of electronic structures and reactivities," Current Opinion in Chemical Biology, vol. 9, pp. 152-163,2005.
[63] Y. Shiota and K. Yoshizawa, "Comparison of the Reactivity of Bis(p- oxo)CuIICuIII and CuIIICuIII Species to Methane," Inorganic Chemistry, vol. 48, pp. 838-845, 2008.
[64] M. A. Culpepper, G. E. Cutsail, B. M. Hoffman, and A. C. Rosenzweig,"Evidence for Oxygen Binding at the Active Site of Particulate Methane Monooxygenase," Journal o f the American Chemical Society, vol. 134, pp. 7640- 7643,2012/07/20 2012.
[65] S. I. Chan and S. S.-F. Yu, "Controlled Oxidation of Hydrocarbons by the Membrane-Bound Methane Monooxygenase: The Case for a Tricopper Cluster," Accounts o f Chemical Research, vol. 41, pp. 969-979,2008.
[66] R. L. Lieberman and A. C. Rosenzweig, "The quest for the particulate methane monooxygenase active site," Dalton Transactions, pp. 3390-3396, 2005.
[67] H. Yuan, M. L. Collins, and W. E. Antholine, "Concentration of Cu, EPR- detectable Cu, and formation of cupric-ferrocyanide in membranes with pMMO," J Inorg Biochem, vol. 72, pp. 179-85,1998.
[68] H. Yuan, M. L. Collins, and W. E. Antholine, "Type 2 Cu2+ in pMMO from Methylomicrobium album BG8," BiophysJ, vol. 76, pp. 2223-9,1999.

152
[69] P. P. Y. Chen and S. I. Chan, "Theoretical modeling of the hydroxylation of methane as mediated by the particulate methane monooxygenase," Journal o f Inorganic Biochemistry, vol. 100, pp. 801-809, 2006.
[70] P. P.-Y. Chen, R. B.-G. Yang, J. C.-M. Lee, and S. I. Chan, "Facile O-atom insertion into C C and C H bonds by a trinuclear copper complex designed to harness a singlet oxene," Proceedings o f the National Academy o f Sciences, vol. 104, pp. 14570-14575, September 11, 2007 2007.
[71] S. S. F. Yu, L.-Y. Wu, K. H. C. Chen, W.-I. Luo, D.-S. Huang, and S. I. Chan, "The Stereospecific Hydroxylation of [2,2-2H2]Butane and Chiral Dideuteriobutanes by the Particulate Methane Monooxygenase from Methylococcus capsulatus (Bath)," Journal o f Biological Chemistry, vol. 278, pp. 40658-40669, October 17,2003 2003.
[72] K. Yoshizawa, "Two-step concerted mechanism for methane hydroxylation on the diiron active site of soluble methane monooxygenase," Journal o f Inorganic Biochemistry, vol. 78, pp. 23-34,2000.
[73] M.-H. Baik, M. Newcomb, R. A. Friesner, and S. J. Lippard, "Mechanistic Studies on the Hydroxylation of Methane by Methane Monooxygenase,"Chemical Reviews, vol. 103, pp. 2385-2420,2003.
[74] A. M. Valentine, M.-H. LeTadic-Biadatti, P. H. Toy, M. Newcomb, and S. J. Lippard, "Oxidation of Ultrafast Radical Clock Substrate Probes by the Soluble Methane Monooxygenase from Methylococcus capsulatus(Bath)," Journal o f Biological Chemistry, vol. 274, pp. 10771-10776, April 16,1999 1999.
[75] J. C. Nesheim and J. D. Lipscomb, "Large Kinetic Isotope Effects in Methane Oxidation Catalyzed by Methane Monooxygenase: Evidence for C-H Bond Cleavage in a Reaction Cycle Intermediatea€ " Biochemistry, vol. 35, pp. 10240- 10247,1996.
[76] L. Franz, R. Prins, and G. D. Pimgraber, "Mimicking the Active Center of Methane-monooxygenase by Metal-Peptide Complexes Immobilized on Mesoporous Silica," Chemistry o f Materials, vol. 19, pp. 4357-4366,2007.
[77] H. Dalton, "The Leeuwenhoek Lecture 2000: The natural and unnatural history of methane-oxidizing bacteria," Philosophical Transactions: Biological Sciences, vol. 360, pp. 1207-1222,2005.
[78] M. M. Diaz-Requejo and P. J. Perez, "Coinage Metal Catalyzed C-H Bond Functionalization of Hydrocarbons," Chemical Reviews, vol. 108, pp. 3379-3394,2008.
[79] J. M. Bollinger Jr and J. B. Broderick, "Frontiers in enzymatic C-H-bond activation," Current Opinion in Chemical Biology, vol. 13, pp. 51-57,2009.

153
[80] A. R. Leach, Molecular Modelling Principles and Applications, 2nd ed.: Pearson Education Limited, 2001.
[81] A. D. Smith, Oxford dictionary o f biochemistry and molecular biology. Oxford ; New York: Oxford University Press, 1997.
[82] F. Jensen, Introduction to Computational Chemistry. New York: Wiley & Sons, 2002.
[83] V. Tozzini, "Multiscale Modeling of Proteins," Accounts o f Chemical Research, vol. 43, pp. 220-230, 2012/08/25 2010.
[84] V. Tozzini, "Coarse-grained models for proteins," Current Opinion Structural Biology vol. 15, pp. 144-50,2005.
[85] A. P. J. Jansen, "An introduction to Monte Carlo simulations of surface reactions " reprint arXiv cond-mat/0303028vl, 2003.
[86] Accelrys, "Materials Studio," 2008.
[87] J. J. Lukkien, J. P. L. Segers, P. A. J. Hilbers, R. J. Gelten, and A. P. J. Jansen, "Efficient Monte Carlo methods for the simulation of catalytic surface reactions," Physical Review E, vol. 58, pp. 2598-2610,1998.
[88] R. M. Nieminen and A. P. J. Jansen, "Monte Carlo simulations of surface reactions," Applied Catalysis A: General, vol. 160, pp. 99-123,1997.
[89] N. K. R. Dandala, A. P. J. Jansen, and D. S. Mainardi, "Multiscale Modeling Approach for Studying MDH-Catalyzed Methanol Oxidation," in Multiscale Modeling:From Atoms to Devices, P. Derosa and T. Cargin, Eds.: CRC Press, 2010, pp. 91-112.
[90] R. M. Nieminen and A. P. J. Jansen, "Monte Carlo simulations of surface reactions," Applied Catalysis A: General, vol. 160, pp. 99-123,1997.
[91] M. Costas, M. Mehn, P . , M. Jensen, P., and L. Que Jr., "Dioxygen Activation at Mononuclear Nonheme Iron Active Sites: Enzymes, Models, and Intermediates," Chemlnform, vol. 35, 2004.
[92] B. F. Gherman and C. J. Cramer, "Quantum chemical studies of molecules incorporating a Cu2022+ core," Coordination Chemistry Reviews, vol. 253, pp. 723-753,2009.
[93] E. I. Solomon, S. D. Wong, L. V. Liu, A. Decker, and M. S. Chow, "Peroxo and oxo intermediates in mononuclear nonheme iron enzymes and related active sites," Current Opinion in Chemical Biology, vol. 13, pp. 99-113, 2009.

154
[94] J. G. Mesu, T. Visser, F. Soulimani, E. E. van Faassen, P. de Peinder, A. M. Beale, and B. M. Weckhuysen, "New Insights into the Coordination Chemistry and Molecular Structure of Copper(II) Histidine Complexes in Aqueous Solutions," Inorganic Chemistry, vol. 45, pp. 1960-1971,2006.
[95] J. S. Woertink, P. J. Smeets, M. H. Groothaert, M. A. Vance, B. F. Sels, R. A. Schoonheydt, and E. I. Solomon, "A [Cu20]2+ core in Cu-ZSM-5, the active site in the oxidation of methane to methanol," Proceedings o f the National Academy o f Sciences, vol. 106, pp. 18908-18913, November 10, 2009 2009.
[96] K. J. Laidler, Chemical kinetics. New York: Harper & Row, 1987.
[97] R. J. Van Gelten, R. A. Van Santen, and A. P. J. Jansen, "Dynamic Monte Carlo Simulations of Oscillatory heterogeneous catalytic reactions," in Molecular dynamics: From classical to quantum methods, P. B. Balbuena and J. M. Seminario, Eds. Amsterdam: Elsevier Science, 1999.
[98] D. S. Mainardi, S. R. Calvo, A. P. J. Jansen, J. J. Lukkien, and P. B. Balbuena, "Dynamic Monte Carlo simulations o f 0 2 adsorption and reaction on Pt(l 11)," Chemical Physics Letters, vol. 382, pp. 553-560,2003.
[99] S. R. Calvo, D. S. Mainardi, A. P. J. Jansen, J. J. Lukkien, and P. B. Balbuena, "Test of a Mechanism for 0 2 Electroreduction on Pt(l 11) via Dynamic Monte Carlo Simulations," in Power Sources Modeling, R. G. Jungst, Ed. Pennington, NJ, 2005.
[100] Accelrys, "Materials Studio," San Diego: Accelyrs Inc., 2006.
[101] A. P. J. Jansen, "Monte Carlo simulations of chemical reactions on a surface with time-dependent reaction-rate constants," Computer Physics Communications, vol. 86, pp. 1-12,1995.
[102] A. Comish-Bowden, Fundamentals o f Enzyme Kinetics: Portland Press, 2004.
[103] A. F. Voter, "Introduction to the Kinetic Monte Carlo Method," in Radiation Effects in Solids, K. E. Sickafus and E. A. Kotomin, Eds. Dordrecht, The Netherlands: Springer, NATO Publishing Unit, 2005.
[104] C. L. Rasmussen and P. Glarborg, "Direct Partial Oxidation of Natural Gas to Liquid Chemicals: Chemical Kinetic Modeling and Global Optimization," Industrial & Engineering Chemistry Research, vol. 47, pp. 6579-6588, 2012/11/29 2008.
[105] B. E. Barton, C. M. Whaley, T. B. Rauchfuss, and D. L. Gray, "Nickel-Iron Dithiolato Hydrides Relevant to the [NiFe]-Hydrogenase Active Site," Journal o f the American Chemical Society, vol. 131, pp. 6942-6943,2012/11/29 2009.

155
[106] P. S. E. James E. Kloeppel, "Synthetic catalyst mimics nature's 'hydrogen econom y 'N ew s Bureau, Public Affairs University of Illinois at Urbana- Champaign, 2009.
[ 107] Montana State University Department of Physics.
[108] Nanotech at University of California at Santa Barbara.
[109] University of Wisconsin at Madison Materials Research Science and Engineering Center.
[110] E. Caton, C. Brewer, and F. Brown, "Building teacher-scientist partnerships: Teaching about energy through inquiry," School Science and Mathematics, vol. 100, 2000.
[111] A. K. B. K. D. Tanner, "Developing Scientist Educators: Analysis of Integrating K-12 Pedagogy and Partnership Experiences into Graduate Science Training," in 2006 NARSTAnnual Conference San Francisco, CA, 2006.
[112] F. Keppler, J. T. G. Hamilton, M. Bras, and T. Rockmann, "Methane emissions from terrestrial plants under aerobic conditions," Nature, vol. 439, pp. 187-191, 2006.
[113] S. H. Stanley, S. D. Prior, D. J. Leak, and H. Dalton, "Copper stress underlies the fundamental change in intracellular location of methane monooxygenase in methane-oxidising organisms: studies in batch and continuous cultures," Biotechnol. Lett., vol. 5, pp. 487-492,1983.
[114] J. A. Vorholt, "Cofactor-dependent pathways of formaldehyde oxidation in methylotrophic bacteria," Archives o f Microbiology, vol. 178,2002.
[115] D. Gabel and R. Sherwood, "The effect of student manipulation of molecular models on chemistry achievement according to Piagetian level," Journal o f Research in Science Teaching, vol. 17, pp. 75-81,1980.
[116] Y. J. Dori and N. Bamea, "In-service chemistry teachers training: the impact of introducing computer technology on teachers attitudes and classroom implementation," International Journal o f Science Education, vol. 19, pp. 577- 592, 1997.
[117] J. S. Krajcik, E. R. Simmons, and N. Lunetta, "A research strategy for the dynamic study of students' conception and problem solving strategies using science software," Journal o f Research in Science Teaching, vol. 25, pp. 147-155, 1988.
[118] V. M. Williamson and M. R. Abraham, "The effects of computer animation on the particulate mental models of college chemistry students," Journal o f Research in Science Teaching, vol. 32, pp. 521-534,1995.

156
[119] N. Bamea and Y. J. Dori, "Computerized Molecular Modeling as a Tool to Improve Chemistry Teaching," J. Chem. In f Comput. Sci, vol. 36, pp. 629-636, 1996.
[120] J. K. Gilbert and C. J. Boulter, "Learning science through models and modeling," in International Handbook o f Science Education, B. J. Fraser and K. G. Tobin, Eds. Dordrecht: Kluwer Academic Publisher, 1998, pp. 53-66.
[121] L. D. o. Education, "Comprehensive Curriculum," 2008.
[122] D. Kotys-Schwartz and M. S. Zarske, "Graduate Student Personal Experiences: Improving Collegiate Teaching through K-12 Outrearch," Procceedings o f the 2005 American Society for Engineering Education Annual Conference & Exposition, 2005.
Related Documents