Multimodal Solutions December 2020

Welcome message from author
This document is posted to help you gain knowledge. Please leave a comment to let me know what you think about it! Share it to your friends and learn new things together.
Transcript
Multimodal Solutions
December 2020
I-40/81 Multimodal Corridor Study
Technical Memorandum Multimodal Solutions
Table of Contents | Page i
Table of Contents 1. Introduction ............................................................................................................................................................................ 3
Purpose of This Memo .........................................................................................................................................3
Expanding the Universe of Solutions ...................................................................................................................4
2. Highway Capacity/Expansion Strategies ................................................................................................................. 6 New General-Purpose Lanes ................................................................................................................................6
Auxiliary Lanes .....................................................................................................................................................9
Interchange Type .................................................................................................................................................9
Ramp/Terminal Improvements ......................................................................................................................... 10
C-D Roadway ..................................................................................................................................................... 12
Truck Climbing Lanes ........................................................................................................................................ 13
Bypass Analysis ................................................................................................................................................. 14
Parallel Arterial Diversion ............................................................................................................................ 14
3. Transportation System Management and Operations Strategies ............................................................. 20 Managed Lanes ................................................................................................................................................. 21
High Occupancy Vehicle Lanes ..................................................................................................................... 21
High Occupancy Toll Lanes ........................................................................................................................... 22
Express Lanes ............................................................................................................................................... 23
Separate Truck Lanes ................................................................................................................................... 24
Separate Local Lanes and Through Lanes .................................................................................................... 24
Information Management ................................................................................................................................ 25
Traveler Information Systems (External to Vehicle) .................................................................................... 25
Traveler Information Systems (Internal to Vehicle) ..................................................................................... 26
Incident Management Systems ................................................................................................................... 28
HELP Routes ................................................................................................................................................. 29
SmartWay Expansion ................................................................................................................................... 30
Freeway Management/Active Traffic Demand Strategies ................................................................................ 31
Hard Shoulder Running – Buses ................................................................................................................... 32
Hard Shoulder Running - General Purpose (GP) Traffic ............................................................................... 33
Queue Warning ............................................................................................................................................ 34
Variable Speed Limits ................................................................................................................................... 34
Dynamic Lane Assignment/Control.............................................................................................................. 34
Integrated Corridor Management ............................................................................................................... 35
Ramp Metering ............................................................................................................................................ 36
Other Technology Solutions .............................................................................................................................. 40
Road Weather Information System (RWIS) ................................................................................................. 40
Electric Vehicle Charging Stations ................................................................................................................ 41
4. Freight-Related Strategies ............................................................................................................................................ 48 Truck Parking ..................................................................................................................................................... 48
Electric Truck Charging Stations ........................................................................................................................ 50
Alternative Truck Routing ................................................................................................................................. 50
Weigh-in-Motion ............................................................................................................................................... 51
Multimodal Freight Solutions ........................................................................................................................... 52
I-40/81 Multimodal Corridor Study
Technical Memorandum Multimodal Solutions
Table of Contents | Page ii
5. Safety ....................................................................................................................................................................................... 54 Potential Safety Improvements ........................................................................................................................ 55
Detour Routes ................................................................................................................................................... 57
Crossovers ......................................................................................................................................................... 58
Runaway Truck Ramps ...................................................................................................................................... 59
6. Transit ...................................................................................................................................................................................... 65 Infrastructure Improvements ........................................................................................................................... 65
Policy ................................................................................................................................................................. 67
Managed Lanes ............................................................................................................................................ 67
Bus on Shoulder ........................................................................................................................................... 67
Partnerships ...................................................................................................................................................... 67
Park & Ride Facilities for Regional Transit Service ....................................................................................... 68
Operation of Commuter Express/Regional Transit Service ......................................................................... 70
Improvements to Intercity Transit ............................................................................................................... 71
7. New Interchange Access ................................................................................................................................................ 74

I-40/81 Multimodal Corridor Study
Technical Memorandum Multimodal Solutions
Table of Contents | Page iii
Tables Table 1. Potential Additions to Physical Capacity ......................................................................................................6
Table 2. Potential Interchange Improvements ........................................................................................................ 10
Table 3. Potential Ramp/Terminal Improvements .................................................................................................. 11
Table 4. Potential C-D Roadway System .................................................................................................................. 12
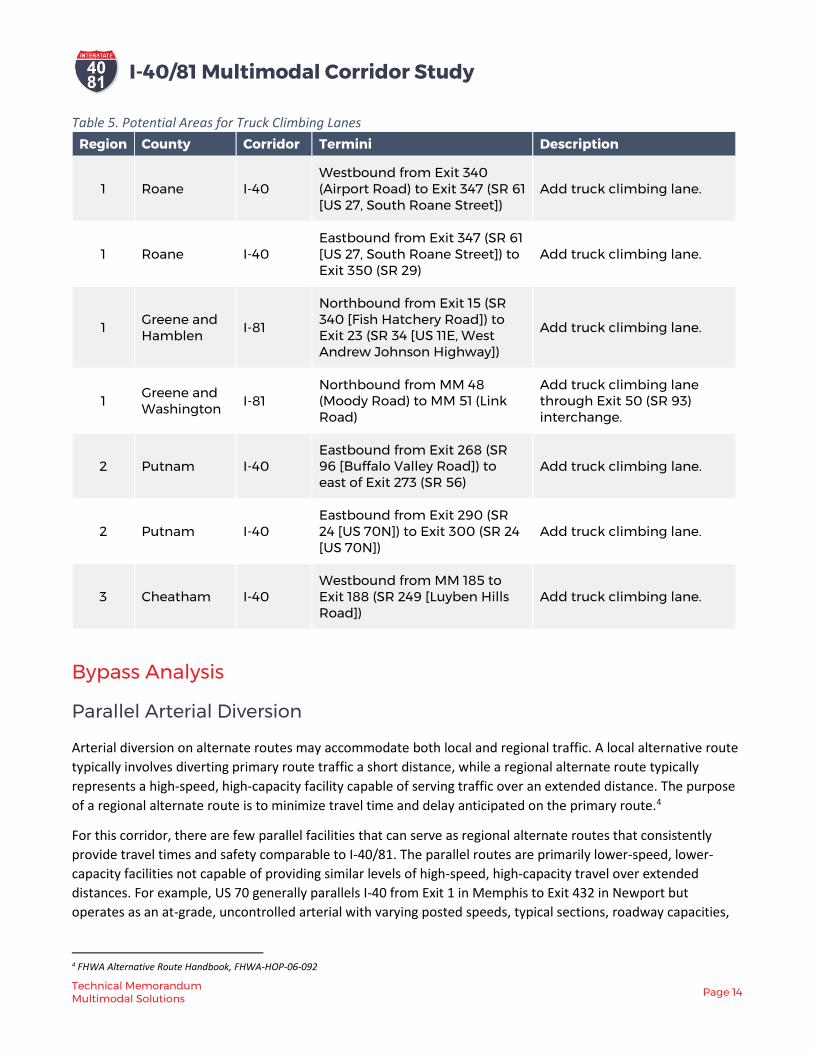
Table 5. Potential Areas for Truck Climbing Lanes .................................................................................................. 14
Table 6. TSMO Strategies ........................................................................................................................................ 20
Table 7. Potential HOV Conversion to HOT Lane .................................................................................................... 23
Table 8. Potential “HELP Lite” Service ..................................................................................................................... 30
Table 9. Potential Areas for ICM Deployment ......................................................................................................... 36
Table 10. Potential Ramp Metering Deployment .................................................................................................... 39
Table 11. Potential Improvements to RWIS ............................................................................................................ 41
Table 12. Future Improvements to Weigh-In-Motion Technology ......................................................................... 52
Table 13. Statewide Multimodal Freight Plan-Identified Projects in the Corridor .................................................. 53
Table 14. High Crash Segments ............................................................................................................................... 54
Table 15. IMPROVE ACT Projects Impacting High Crash Segments of the Corridor ................................................ 55
Table 16. Potential Corridor Safety Improvements ................................................................................................. 56
Table 17. Potential Safety Improvements for I-40/81 Detour Routes .................................................................... 58
Table 18. Potential Crossover Improvements ......................................................................................................... 59
Table 19. Potential Locations for Runaway Truck Ramps ....................................................................................... 60
Table 20. Potential Infrastructure Improvements to Benefit Transit Service on the Corridor ............................... 66
Table 21. Potential Locations for Permanent Park & Ride Facilities ....................................................................... 69

I-40/81 Multimodal Corridor Study
Technical Memorandum Multimodal Solutions
Table of Contents | Page iv
Figures Figure 1. Auxiliary lane example in Knox County westbound between Exits 374 and 376 ........................................9
Figure 2. Collector-Distributor System on the Katy Freeway (I-10) in Houston, TX. ............................................... 12
Figure 3. Left lane added for passing trucks on I-40 eastbound in Smith County ................................................... 13
Figure 4. Region 1 Potential Highway Capacity/Expansion Improvements ............................................................ 16
Figure 5. Region 2 Potential Highway Capacity/Expansion Improvements ............................................................ 17
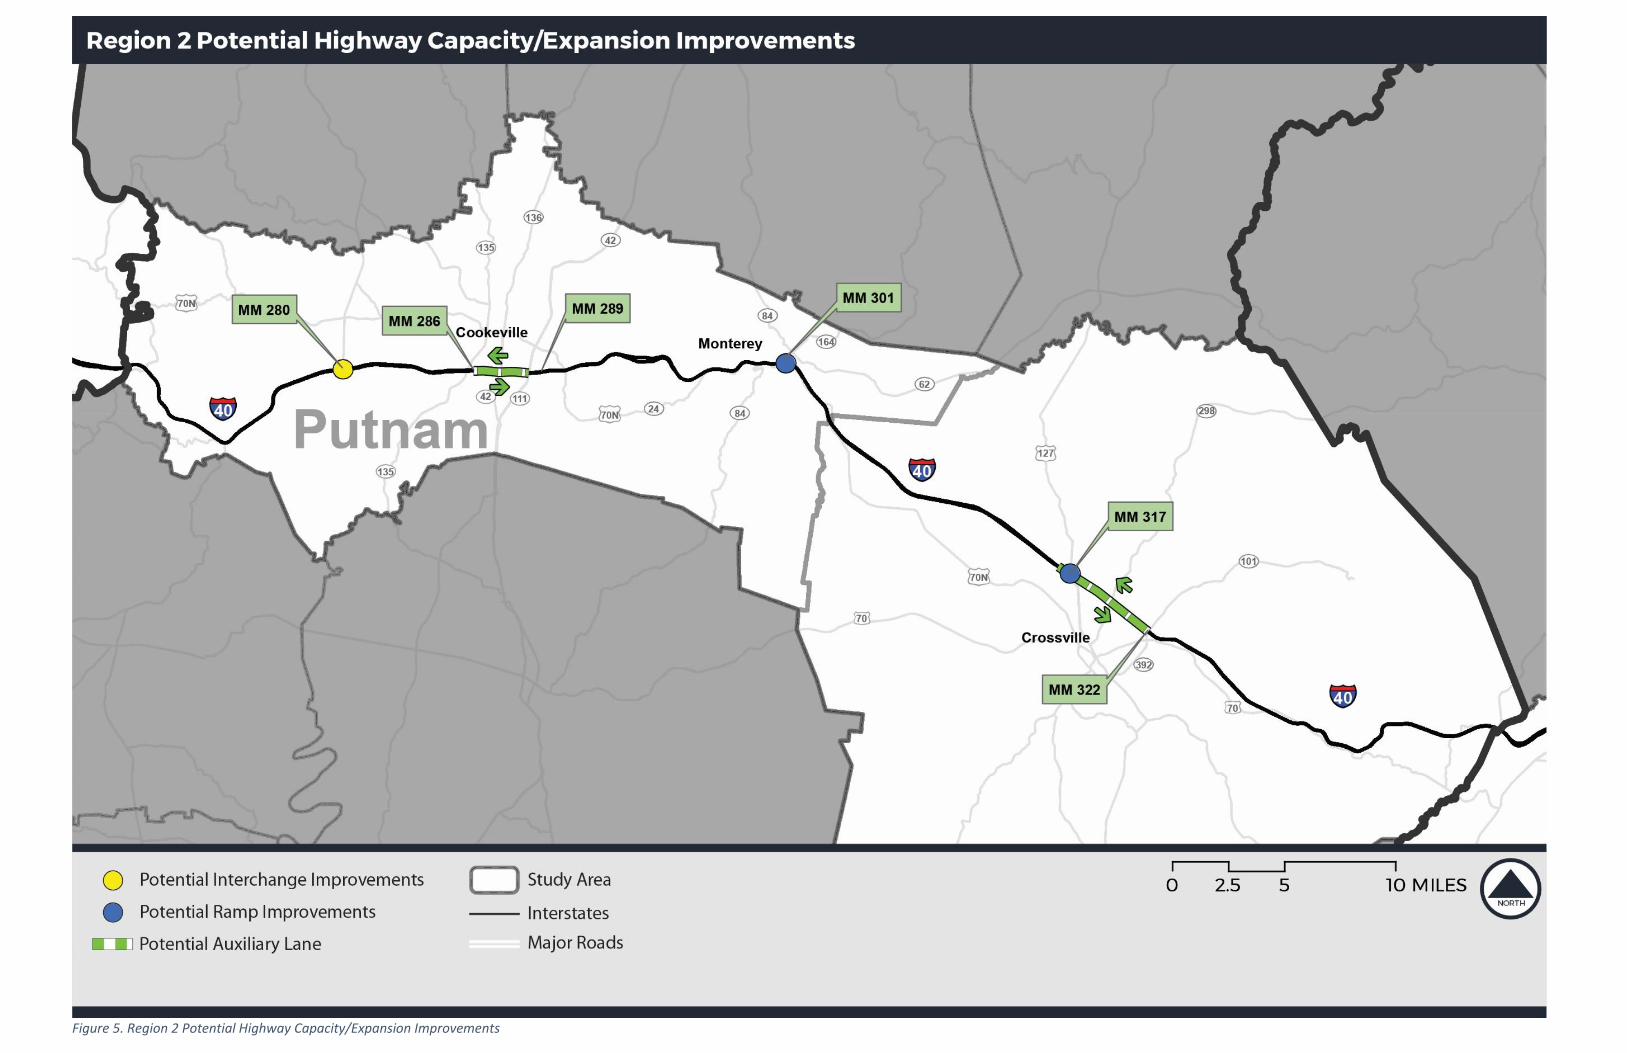
Figure 6. Region 3 Potential Highway Capacity/Expansion Improvements ............................................................ 18
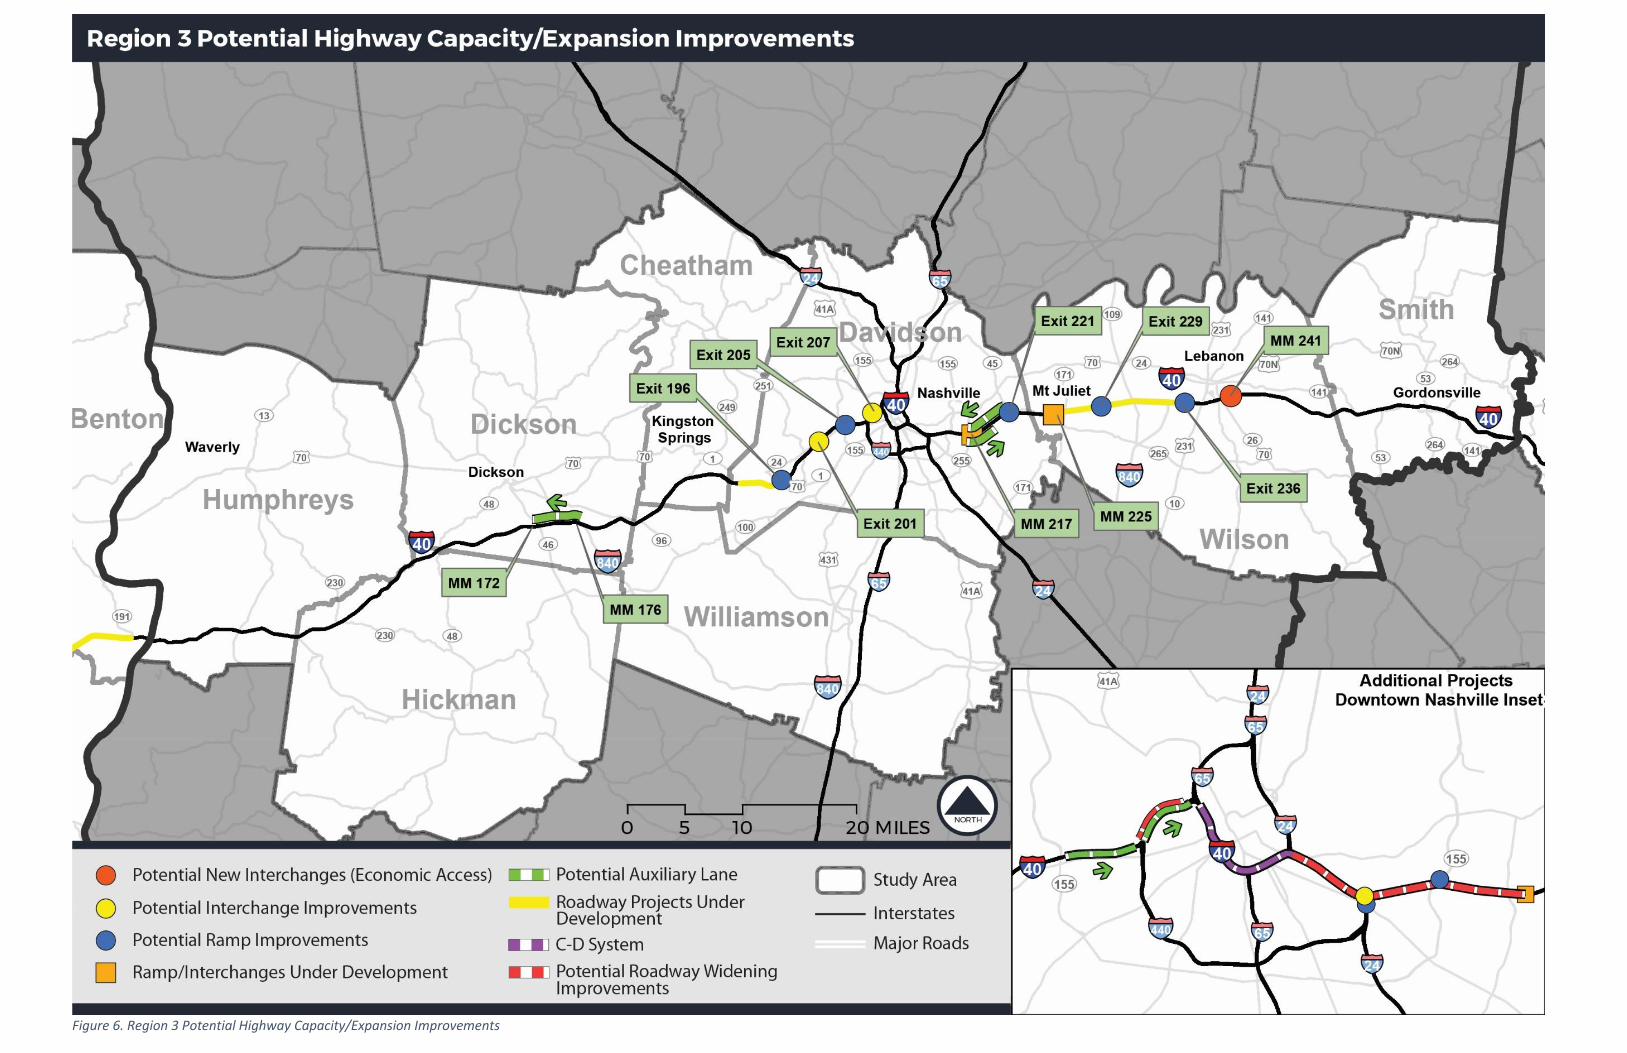
Figure 7. Region 4 Potential Highway Capacity/Expansion Improvements ............................................................ 19
Figure 8. I-85 HOT Lanes in Atlanta ......................................................................................................................... 20
Figure 9. Dynamic Shoulder Use .............................................................................................................................. 21
Figure 10. TDOT Dynamic Message Sign ................................................................................................................. 25
Figure 11. TDOT’s Region 1 Traffic Management Center ........................................................................................ 28
Figure 12. TDOT HELP Truck and Operator ............................................................................................................. 30
Figure 13. Statewide SmartWay .............................................................................................................................. 31
Figure 14. Bus Hard Shoulder Running in Minneapolis ........................................................................................... 32
Figure 15. Peak Use Shoulder Lane ......................................................................................................................... 33
Figure 16. Variable Speed Limits on I-5 in Seattle ................................................................................................... 34
Figure 17. Example of Minute by Minute Interstate Flow Variation ....................................................................... 37
Figure 18. Speed versus Throughput ....................................................................................................................... 37
Figure 19. Speed and Volume by Time of Day ......................................................................................................... 37
Figure 20. Speed versus Volume on I-40 in Downtown Nashville ........................................................................... 38
Figure 21. TDOT Weather Sensors .......................................................................................................................... 40
Figure 22. Improved RWIS equipment for monitoring winter weather events ...................................................... 40
Figure 23. Electric Vehicle Charging Station at Cracker Barrel in Lebanon, TN ....................................................... 41
Figure 24. Status of I-40/81 as an Alternative Fuel Corridor ................................................................................... 42
Figure 25. Region 1 Potential TSMO Improvements ............................................................................................... 44
Figure 26. Region 2 Potential TSMO Improvements ............................................................................................... 45
Figure 27. Region 3 Potential TSMO Improvements ............................................................................................... 46
Figure 28. Region 4 Potential TSMO Improvements ............................................................................................... 47
Figure 29. Trucks parked at the I-81 rest area in Greene County ........................................................................... 48
Figure 30. Truck Parking Facilities ........................................................................................................................... 49
Figure 31. Recommended Weigh-in-Motion Locations .......................................................................................... 51
Figure 32. FHWA Proven Safety Countermeasures ................................................................................................. 57
Figure 33. Runaway Truck Ramp (Colorado DOT) ................................................................................................... 59
Figure 34. Region 1 Potential Safety Improvements ............................................................................................... 61
Figure 35. Region 2 Potential Safety Improvements ............................................................................................... 62
Figure 36. Region 3 Potential Safety Improvements ............................................................................................... 63
Figure 37. Region 4 Potential Safety Improvements ............................................................................................... 64
Figure 38. Designated Park and Ride Lot for Regional Transit Authority Customers .............................................. 68
Figure 39. Potential Park and Ride Lot Locations .................................................................................................... 69
Figure 40. Gray Line Coach Used for RTA Regional Commuter Service .................................................................. 70
Figure 41. East Tennessee Human Resource Agency (ETHRA) Fleet ....................................................................... 72
Figure 42. Recently Constructed Interchange at I-40 and Tennessee Avenue in Cookeville .................................. 74
I-40/81 Multimodal Corridor Study
Technical Memorandum Multimodal Solutions
Table of Contents | Page 1
List of Acronyms
AASHTO American Association of State Highway and Transportation Officials
ATDM Active Traffic Demand Management
ATM Advanced Traffic Management
ATRI American Transportation Research Institute
BOS Bus on Shoulder
CARM Coordinated Adaptive Ramp Metering
CCS Combined Charging System
CCTV Closed-Circuit Television
C-D Collector-Distributor
CMAQ Congestion Mitigation and Air Quality Improvement Program
CN Canadian National Railway
DCFC Direct Current Fast Charging
DET Drive Electric Tennessee
DMS Dynamic Message Sign
FAST Act Fixing America’s Surface Transportation Act
FHWA Federal Highway Administration
GP General Purpose lanes
GPS Global Positional System
HOT High Occupancy Toll lanes
HOV High Occupancy Vehicle lanes
HRA Human Resources Agency
ICM Integrated Corridor Management
IMS Incident Management Systems
ITS Intelligent Transportation Systems
KAT Knoxville Area Transit
MATA Memphis Area Transit Authority
MM Mile Marker
MPO Metropolitan Planning Organization
I-40/81 Multimodal Corridor Study
Technical Memorandum Multimodal Solutions
Table of Contents | Page 2
List of Acronyms (cont.)
MUTCD Manual on Uniform Traffic Control Devices
NACFE North American Council for Freight Efficiency
NCTCOG North Central Texas Council of Governments
NHS National Highway System
NS Norfolk Southern Railway
PTC Positive Train Control
RDS Radar Detection System
RFID Radio-Frequency Identification Device
RTA Regional Transportation Authority of Middle Tennessee
RWIS Roadway Weather Information System
SOV Single Occupancy Vehicle
TDOT Tennessee Department of Transportation
THP Tennessee Highway Patrol
TIM Traffic Incident Management
TIS Traveler Information Systems
TMC Traffic Management Center
TPO Transportation Planning Organization
TSMO Transportation Systems Management and Operations
UDOT Utah Department of Transportation
VGI Vehicle-Grid Integration
VMT Vehicle Miles Traveled
VSL Variable Speed Limit
WIM Weigh-In-Motion

I-40/81 Multimodal Corridor Study
Technical Memorandum Multimodal Solutions
Page 3
1. Introduction
Purpose of This Memo
This technical memorandum presents potential multimodal solutions to address the deficiencies and projected
needs identified for the I-40/81 corridor in the Existing/Future Conditions Technical Memorandum. The potential
solutions are presented in six broad categories of improvements:
• Highway Capacity/Expansion
• Transportation Systems Management & Operations (TSMO)
• Freight
• Safety
• Transit
• Economic Access
Particular attention is given to the discussion of TSMO strategies, many of which are not currently being applied
in Tennessee. While not all of the TSMO strategies discussed have ultimately been identified as potential
solutions for the I-40/81 corridor, they are included in this memo as a resource to help the Tennessee
Department of Transportation (TDOT) promote a broader awareness and understanding of these additional
tools for maximizing mobility and safety.
Some of the potential solutions presented in this memo may prove less feasible based on cost, potential
environmental impacts, public support, or other factors. These considerations will be reviewed in a subsequent
technical memorandum, Project Priorities, in order to categorize solutions for near-term and long-term
implementation by TDOT.

I-40/81 Multimodal Corridor Study
Technical Memorandum Multimodal Solutions
Page 4
Expanding the Universe of Solutions
Demand on Tennessee’s Interstate highways continues to grow, an indication of the state’s continued economic
vitality and importance in interstate commerce. Functions served by the I-40/81 corridor include commuting in
and around the state’s urban areas, longer-distance freight movements, and intercity travel within the state.
Meeting these needs will likely continue to involve addition of new lanes in some areas of the corridor; however,
achieving optimal results will involve multiple strategies. Improving safety on I-40/81 has obvious benefits in
terms of achieving “Vision Zero,” the total elimination of traffic-related deaths, but even a crash that does not
result in injury can create lengthy delays for others using the corridor. Preventing crashes therefore has
demonstrable benefits to the state’s goal in maintaining efficient statewide mobility for both people and freight.
Certain strategies, such as the installation of truck climbing lanes in areas that have steep grades, directly
improve both traffic flow and safety by providing space to separate heavy, slower-moving vehicles from other
traffic. Providing an additional lane in selected areas, rather than widening the entire interstate corridor, is a
targeted strategy that helps maximize the effectiveness of the state’s funding resources. This strategic focus was
one of the goals of TDOT’s first I-40/81 corridor study, and several of the truck climbing lanes recommended in
the previous study have since been constructed.
Managing travel demand and encouraging the use of transit are other strategies that can help address the
future growth in travel along the I-40/81 corridor, which connects three of Tennessee’s four largest cities. The
Memphis, Nashville and Knoxville metropolitan areas each have travel demand management programs geared
to the promotion of ridesharing, transit, walking and biking, telecommuting, flexible work schedules, and other
ways to reduce the number of people driving in single-occupant vehicles. Although much of the operational
effectiveness of local transit service is impacted by development patterns, which are largely outside TDOT’s
sphere of influence, there are a number of ways in which TDOT can support commuter service and intercity
transit service through direct investments in the I-40/81 corridor and partnerships with transit agencies.
One of the most promising near-term opportunities to improve mobility in the I-40/81 corridor is through the
use of Transportation Systems Management & Operations (TSMO) strategies. Many of these are consistent with
the state’s goal of maximizing its existing investments in interstate capacity and should also be applied to
preserve mobility in areas where TDOT adds new highway capacity.
As further discussed in the section on TSMO Strategies, the level of traffic congestion on I-40/81 in the Nashville
and Knoxville areas has reached an advanced stage in which management of traffic density is needed in order to
continue serving the amount of traffic which the number of existing lanes should be able to carry. In these
situations, ramp metering can be used to maintain the freeway’s full ability to move traffic. Ramp metering is
therefore a significant improvement identified in the study. Other TSMO solutions discussed in this report can
play a significant role in smoothing traffic flow by providing advanced information to drivers, closing lanes when
crashes or other incidents have occurred, recommending alternative routes in real time, and facilitating transit
operations and other benefits which will continue to evolve as technology continues to advance.
However, in certain areas of the corridor, improved management cannot fully address operational issues caused
by the roadway’s physical characteristics including number of lanes, curvature (horizontal and vertical), and the
number and placement of entrances and exits. This report therefore outlines additional improvements to
address congestion and safety needs, including additional through lanes, auxiliary lanes, ramp and interchange
modifications, as well as the truck climbing lanes mentioned above.
I-40/81 Multimodal Corridor Study
Technical Memorandum Multimodal Solutions
Page 5
While fully functional autonomous vehicles are still in the future, connected vehicles as well as vehicles with
increasing automation sophistication are beginning to enter the fleet. Identified improvements in physical
infrastructure as well as TSMO solutions take this trend into account, and vehicle detection and communications
are recognized as an increasingly important component of any solutions implemented.
TDOT is entering an exciting phase of available improvements to its interstate system. With strategic physical
improvements, increased investments in systems management and operations, and continued focus on demand
management, effective and efficient system performance is attainable.
I-40/81 Multimodal Corridor Study
Technical Memorandum Multimodal Solutions
Page 6
2. Highway Capacity/Expansion Strategies
Highway Expansion Strategies are geometric changes to the existing transportation infrastructure which provide
additional physical capacity where needed. Such improvements address forecasted congestion levels and
include potential solutions such as the addition of new general-purpose lanes or auxiliary lanes along the
freeway corridor, upgrades to existing interchange forms, and others as detailed in the sections below.
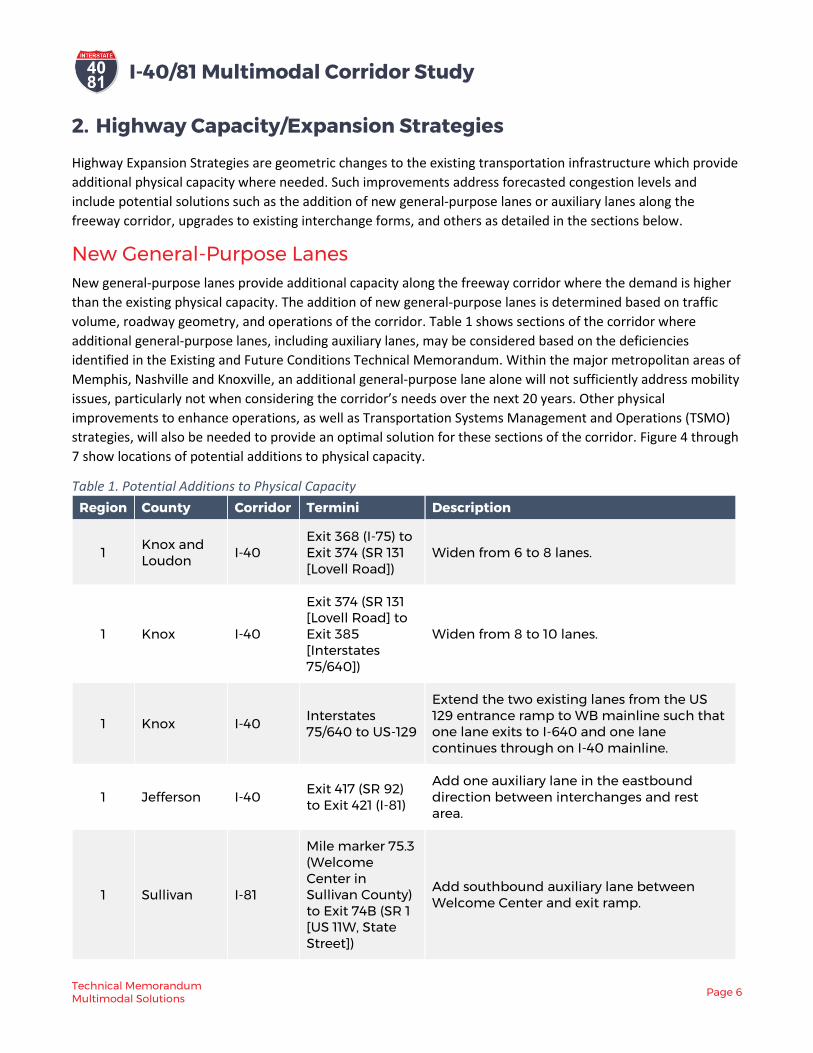
New General-Purpose Lanes New general-purpose lanes provide additional capacity along the freeway corridor where the demand is higher
than the existing physical capacity. The addition of new general-purpose lanes is determined based on traffic
volume, roadway geometry, and operations of the corridor. Table 1 shows sections of the corridor where
additional general-purpose lanes, including auxiliary lanes, may be considered based on the deficiencies
identified in the Existing and Future Conditions Technical Memorandum. Within the major metropolitan areas of
Memphis, Nashville and Knoxville, an additional general-purpose lane alone will not sufficiently address mobility
issues, particularly not when considering the corridor’s needs over the next 20 years. Other physical
improvements to enhance operations, as well as Transportation Systems Management and Operations (TSMO)
strategies, will also be needed to provide an optimal solution for these sections of the corridor. Figure 4 through
7 show locations of potential additions to physical capacity.
Table 1. Potential Additions to Physical Capacity
Region County Corridor Termini Description
1 Knox and Loudon
I-40 Exit 368 (I-75) to Exit 374 (SR 131 [Lovell Road])
Widen from 6 to 8 lanes.
1 Knox I-40
Exit 374 (SR 131 [Lovell Road] to Exit 385 [Interstates 75/640])
Widen from 8 to 10 lanes.
1 Knox I-40 Interstates 75/640 to US-129
Extend the two existing lanes from the US 129 entrance ramp to WB mainline such that one lane exits to I-640 and one lane continues through on I-40 mainline.
1 Jefferson I-40 Exit 417 (SR 92) to Exit 421 (I-81)
Add one auxiliary lane in the eastbound direction between interchanges and rest area.
1 Sullivan I-81
Mile marker 75.3 (Welcome Center in Sullivan County) to Exit 74B (SR 1 [US 11W, State Street])
Add southbound auxiliary lane between Welcome Center and exit ramp.

I-40/81 Multimodal Corridor Study
Technical Memorandum Multimodal Solutions
Page 7
Region County Corridor Termini Description
2 Putnam I-40
Exit 286 (SR 135 [South Willow Avenue]) to Exit 288 (SR 111)
Add auxiliary lanes between interchanges and ramp improvements.
2 Cumberland I-40
Exit 317 (SR 28 [US 127]) to Exit 322 (SR 101 [Peavine Road])
Add auxiliary lanes between interchanges. Add deceleration lanes to off-ramps.
3 Davidson I-40
Exit 204A-B (SR 155 [Briley Parkway], White Bridge Road) to Exit 208A-B (I-40/I-65 interchange)
In eastbound direction, extend SR 155 entrance ramp as an auxiliary lane to Exit 206 (I-40/440). (This includes adjustment of 46th Avenue entrance ramp.) Add auxiliary lane from Exit I-440 on-ramp to I-65 off-ramp.
In westbound direction, widen from 3 to 4 lanes from I-65 to I-440. Braid the Delaware Avenue ramp with the SR 155 exit off-ramp to eliminate weave.
3 Davidson I-40
From Exit 208A-B (I-40/65 interchange on west side of Inner Loop) to Exit 211A-B (I-40/24 interchange)
Develop a collector-distributor (C-D) system which separates downtown Nashville destination traffic from the interstate mainline through traffic. (See Table 4 for details.)
3 Davidson I-40
Exit 211A-B (I-40/24 interchange) to Exit 213A-B (I-40/24/440 interchange)
In eastbound direction:
• Merge proposed Inner Loop C-D system (see Table 4) into the I-40 mainline, as well as merge the I-24 lanes. (I-24 lanes may be barrier-separated in advance of Fesslers Lane exit to avoid interface with I-40 traffic.)
• Widen I-40/24 mainline from 4 to 6 lanes. • Shift I-40/24/440 junction westward for
proper distance needed for ramp terminal spacing and lane balance requirements.
In westbound direction:
• Widen from 4 to 6 lanes west of I-40/24/440 junction
• Remove left-hand I-24 merge, add flyover bridge to create right-hand merge

I-40/81 Multimodal Corridor Study
Technical Memorandum Multimodal Solutions
Page 8
Region County Corridor Termini Description
3 Davidson I-40
(cont.)
Exit 211A-B (I-40/24 interchange) to Exit 213A-B (I-40/24/440 interchange)
• Add barrier to separate I-24 lanes and restrict traffic entering from Fesslers and Hermitage Avenue to access I-24 only.
• At I-40/24 junction, transition proposed 6-lane section to accommodate ramp terminal spacing and lane balance requirements, both for I-24 and the proposed Inner Loop C-D system (see Table 4).
3 Davidson I-40
Exit 213A-B (I-40/24/440 interchange) to Exit 215A-B (SR 155 [Briley Parkway])
In eastbound direction:
• Widen I-40 from 5 to 6 lanes from Exit 213A-B to newly constructed SR 255 (Donelson Pike) interchange.
• Close slip ramp from SR 1 (Murfreesboro Pike) to eastbound I-40 entrance ramp. Create left-hand turn at SR 1 to loop ramp to provide access to NB I-24/I-440 to I-40 connection.
In westbound direction:
• Improve exit ramp to NB SR 155, evaluate ramp merge/weave on SR 155 between I-40 and Elm Hill Pike
3 Davidson I-40
Exit 216 (SR 255 [Donelson Pike]) to entrance ramp from Old Hickory Blvd (approximately Mile Marker 220)
Add one auxiliary lane in the westbound direction between relocated Donelson Pike interchange1 and interstate entrance ramp at westbound Old Hickory Blvd.
3 Davidson I-40
Exit 216 (SR 255 [Donelson Pike]) to Exit 219 (Stewarts Ferry Pike)
Add one auxiliary lane in the eastbound direction between relocated Donelson Pike interchange entrance ramp2 and interchange.
3 Dickson I-40 Exit 172 (SR 46) to Interstate 840
Add one auxiliary lane in the westbound direction between interchange and interstate junction.
4 Shelby I-40 Exit 1E (I-240) to Exit 2A (SR 300) Widen from 6 to 8 lanes.
1 Recommendations of this study have taken into consideration the improvements being made to the I-40/Donelson Pike interchange project, which was in
the right-of-way acquisition phase during this study’s completion. 2 See note 1.

I-40/81 Multimodal Corridor Study
Technical Memorandum Multimodal Solutions
Page 9
Auxiliary Lanes
An auxiliary lane is defined by the American
Association of State Highway Transportation
Officials (AASHTO) as the portion of the
roadway adjoining the traveled way used for
speed change, weaving, truck climbing,
maneuvering of entering and leaving traffic,
and other purposes supplementary to through-
traffic movement. Auxiliary lanes are used to
balance the traffic load along the freeway and
maintain a more uniform level of service. They
facilitate the positioning of drivers at exits and
the merging of drivers at entrances. Several
locations along the corridor have been
identified for potential addition of an auxiliary
lane, as shown in Table 1.
Interchange Type
Along the corridor, many interchanges have been identified for partial or full improvements due to capacity
issues related to changes in traffic volumes, patterns, and queuing. The scope of this study identifies the
interchange issues to be addressed; however, the specific interchange configuration to be used will be
determined at the time that TDOT is ready to proceed with engineering, except in cases where a recent study
has already recommended a specific design. Potential interchange improvements are shown in Table 2 and in
Figure 4 through 7.
Figure 1. Auxiliary lane example in Knox County westbound between Exits 374 and 376.

I-40/81 Multimodal Corridor Study
Technical Memorandum Multimodal Solutions
Page 10
Table 2. Potential Interchange Improvements
Region County Corridor Termini Description
1 Roane I-40 Exit 347 (SR 61 [US 27, South Roane Street])
Reconfigure interchange to provide operational and safety improvements.
1 Loudon I-40 Exit 368 (Junction with I-75)
Reconfigure interchange to provide operational and safety improvements.
1 Knox and Loudon
I-40 Exit 369 (Watt Road)
Reconfigure interchange to reduce weaving movements and capacity issues.
1 Knox I-40 Exit 373 (Campbell Station Road)
Reconfigure interchange to provide operational and capacity improvements.
1 Knox I-40 Exit 383 (SR 332 [Papermill Drive])
Separation of eastbound traffic to avoid weaving traffic between Exit 383 and Exit 385 (Interstates 75/640).
1 Jefferson I-40 Exit 421 (Junction with I-81)
Geometric and operational improvements to the interchange.
1 Sullivan I-81 Exit 57 (Junction with I-26 [US 23])
Reconfigure interchange to provide operational and safety improvements.
1 Sullivan I-81 Exit 74 (SR 1 [US 11W, State Street])
Ramp improvements to NB entrance ramp from SR 1 (US 11W, State Street) to provide operational and safety improvements.
2 Putnam I-40 Exit 280 (SR 56 [Baxter Road])
Widen SR 56 and ramps through interchange to provide operational and safety improvements.
3 Davidson I-40 Exit 201 (SR 24 [US 70, Charlotte Pike])
Reconfigure interchange to provide operational and safety improvements.
3 Davidson I-40 Exit 207 (Jefferson Street / 28th Avenue North)
Reconfigure interchange to eliminate weaving section in both directions.
4 Shelby I-40 Exit 1 (SR 1 [US 51, Danny Thomas Boulevard])
Add collector-distributor road to reduce weaving movements for westbound exiting traffic to SR 1 (US 51, Danny Thomas Boulevard) and Second Street.
Ramp/Terminal Improvements Potential ramp improvements include:
• Providing acceleration/deceleration lanes as well as adding lanes on the ramps to allow all ramps to be
in conformance with current state and federal standards and policies.
• Entrance and exiting spacing between ramps.
• Ramp terminal improvements that extend existing turn lanes or provide additional turn lanes,
signalization, etc. These improvements help avoid spillbacks on the interstate that interrupt operations.

I-40/81 Multimodal Corridor Study
Technical Memorandum Multimodal Solutions
Page 11
Potential ramp/terminal improvements are shown in Table 3 and Figure 4 through 9.
Table 3. Potential Ramp/Terminal Improvements
Region County Corridor Termini Description
1 Knox I-40 Exit 374 (SR 131 [Lovell Road]) Eastbound Off-Ramp
Realign ramp terminal and right-turn lane channelization to improve operations at signalized intersection.
1 Knox I-40 Exit 385 (Interstates 75/640) Eastbound Off-Ramp
Ramp improvements to increase capacity and improve vertical/horizontal alignment for trucks.
1 Knox I-40
Exit 387 (SR 62 [Western Avenue]) Westbound Off-Ramp
Braid the I-275 entrance to I-40 WB with the Western Ave and US 129 exit ramps.
2 Putnam I-40 Exit 301 (SR 24 [US 70N]) Westbound Off-Ramp
Add deceleration lane.
2 Cumberland I-40 Exit 317 (SR 28 [US 127])
Ramp improvements to remove islands at exit ramps (both eastbound and westbound).
3 Davidson I-40 Exit 221 (SR 45 [Old Hickory Boulevard])
Ramp improvements to enhance operations.
3 Davidson I-40
Exit 205 (SR 155 [Briley Parkway]) Westbound On-Ramp
Extend acceleration lanes approximately 0.5 miles to improve merge operations.
3 Wilson I-40 Exit 229 (Beckwith Road)
Eastbound and westbound ramp improvements to northbound Golden Bear Gateway.
3 Wilson I-40 Exit 236 (Hartmann Drive) Eastbound Off-Ramp
Widen to three lanes to provide operational improvements at signalized intersection.
4 Madison I-40 Exit 87 (SR 1 [US 70/US 412])
Ramp improvements to increase capacity3.
4 Shelby I-40 Exit 3 (North Watkins Street)
Reconfigure ramps with intersection of North Watkins Street and Overton Crossing Street to improve traffic operations.
3 CNU315 was let to construction in October 2020, which includes the widening of I-40 in both directions from US 45 (SR 5) to just east of US 70 (SR 1) in
Jackson. This project may make the need for a separate ramp improvement project unnecessary.
I-40/81 Multimodal Corridor Study
Technical Memorandum Multimodal Solutions
Page 12
C-D Roadway
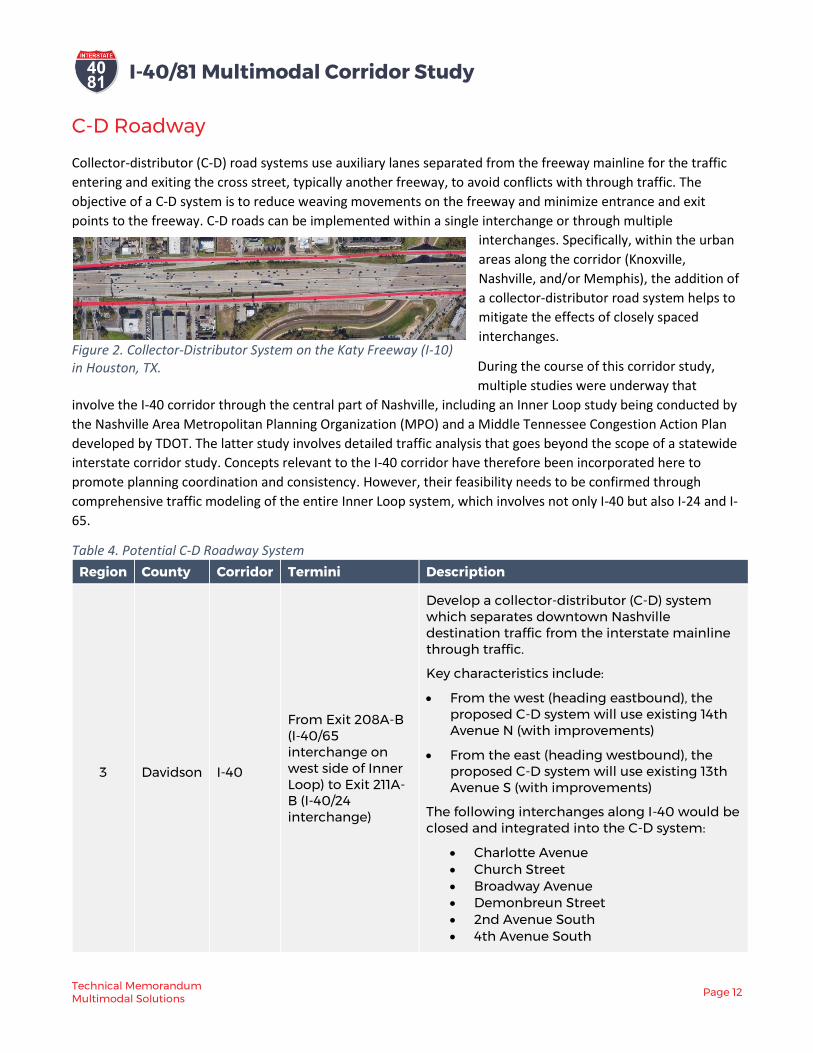
Collector-distributor (C-D) road systems use auxiliary lanes separated from the freeway mainline for the traffic
entering and exiting the cross street, typically another freeway, to avoid conflicts with through traffic. The
objective of a C-D system is to reduce weaving movements on the freeway and minimize entrance and exit
points to the freeway. C-D roads can be implemented within a single interchange or through multiple
interchanges. Specifically, within the urban
areas along the corridor (Knoxville,
Nashville, and/or Memphis), the addition of
a collector-distributor road system helps to
mitigate the effects of closely spaced
interchanges.
During the course of this corridor study,
multiple studies were underway that
involve the I-40 corridor through the central part of Nashville, including an Inner Loop study being conducted by
the Nashville Area Metropolitan Planning Organization (MPO) and a Middle Tennessee Congestion Action Plan
developed by TDOT. The latter study involves detailed traffic analysis that goes beyond the scope of a statewide
interstate corridor study. Concepts relevant to the I-40 corridor have therefore been incorporated here to
promote planning coordination and consistency. However, their feasibility needs to be confirmed through
comprehensive traffic modeling of the entire Inner Loop system, which involves not only I-40 but also I-24 and I-
65.
Table 4. Potential C-D Roadway System
Region County Corridor Termini Description
3 Davidson I-40
From Exit 208A-B (I-40/65 interchange on west side of Inner Loop) to Exit 211A-B (I-40/24 interchange)
Develop a collector-distributor (C-D) system which separates downtown Nashville destination traffic from the interstate mainline through traffic.
Key characteristics include:
• From the west (heading eastbound), the proposed C-D system will use existing 14th Avenue N (with improvements)
• From the east (heading westbound), the proposed C-D system will use existing 13th Avenue S (with improvements)
The following interchanges along I-40 would be closed and integrated into the C-D system:
• Charlotte Avenue • Church Street • Broadway Avenue • Demonbreun Street • 2nd Avenue South • 4th Avenue South
Figure 2. Collector-Distributor System on the Katy Freeway (I-10) in Houston, TX.

I-40/81 Multimodal Corridor Study
Technical Memorandum Multimodal Solutions
Page 13
Truck Climbing Lanes
Potential truck climbing lanes have been identified based on the warrant criteria outlined in the American
Association of State Highway and Transportation Officials’ 7th edition of A Policy on Geometric Design of
Highways and Streets for a climbing lane on a multilane highway:
1) The directional traffic volume exceeds 1,000 vehicles per
hour per lane (regardless of the percentage of trucks) and
2) The directional traffic volume for the upgrade is equal to or
greater than the service volume for Level of Service D and
3) One of the following conditions exists:
a) The critical length of grade is exceeded for the 10
miles per hour speed reduction curve, as identified
in Figure 3-21 of A Policy on Geometric Design of
Highways and Streets or
b) A Level of Service E or F exists on the grade or
c) A reduction of one or more levels of service is
experienced when moving from the approach
segment to the grade
High crash rates may also justify the addition of a climbing lane, regardless of traffic volumes and grade. The
AASHTO criteria outlined above, in addition to stakeholder input, were utilized to determine the appropriate
approximate locations for truck climbing lanes along the corridor.
A list of potential projects is listed in Table 5. Note that some of these improvements could be constructed as a
new left lane that allows faster vehicles to pass, instead of a traditional truck lane on the right. This approach
was used recently on a steep grade in Smith County (see Figure 3) and is preferred, when feasible, since it does
not require the truck to shift lanes.
Locations to evaluate truck climbing lanes are shown in Figure 34 through 37. Further evaluation of these
locations will determine the exact length of truck climbing lane needed in each segment.
Figure 3. Left lane added for passing trucks on I-40 eastbound in Smith County
I-40/81 Multimodal Corridor Study
Technical Memorandum Multimodal Solutions
Page 14
Table 5. Potential Areas for Truck Climbing Lanes
Region County Corridor Termini Description
1 Roane I-40 Westbound from Exit 340 (Airport Road) to Exit 347 (SR 61 [US 27, South Roane Street])
Add truck climbing lane.
1 Roane I-40 Eastbound from Exit 347 (SR 61 [US 27, South Roane Street]) to Exit 350 (SR 29)
Add truck climbing lane.
1 Greene and Hamblen
I-81
Northbound from Exit 15 (SR 340 [Fish Hatchery Road]) to Exit 23 (SR 34 [US 11E, West Andrew Johnson Highway])
Add truck climbing lane.
1 Greene and Washington I-81
Northbound from MM 48 (Moody Road) to MM 51 (Link Road)
Add truck climbing lane through Exit 50 (SR 93) interchange.
2 Putnam I-40 Eastbound from Exit 268 (SR 96 [Buffalo Valley Road]) to east of Exit 273 (SR 56)
Add truck climbing lane.
2 Putnam I-40 Eastbound from Exit 290 (SR 24 [US 70N]) to Exit 300 (SR 24 [US 70N])
Add truck climbing lane.
3 Cheatham I-40 Westbound from MM 185 to Exit 188 (SR 249 [Luyben Hills Road])
Add truck climbing lane.
Bypass Analysis
Parallel Arterial Diversion
Arterial diversion on alternate routes may accommodate both local and regional traffic. A local alternative route
typically involves diverting primary route traffic a short distance, while a regional alternate route typically
represents a high-speed, high-capacity facility capable of serving traffic over an extended distance. The purpose
of a regional alternate route is to minimize travel time and delay anticipated on the primary route.4
For this corridor, there are few parallel facilities that can serve as regional alternate routes that consistently
provide travel times and safety comparable to I-40/81. The parallel routes are primarily lower-speed, lower-
capacity facilities not capable of providing similar levels of high-speed, high-capacity travel over extended
distances. For example, US 70 generally parallels I-40 from Exit 1 in Memphis to Exit 432 in Newport but
operates as an at-grade, uncontrolled arterial with varying posted speeds, typical sections, roadway capacities,
4 FHWA Alternative Route Handbook, FHWA-HOP-06-092

I-40/81 Multimodal Corridor Study
Technical Memorandum Multimodal Solutions
Page 15
and operational characteristics. Overall, during normal operating conditions, the amount of traffic currently or
anticipated to be diverted to parallel arterials is minimal and has negligible impacts to I-40/81 operations.
However, during periods of major and/or lengthy interstate congestion, arterials that run generally parallel to
the corridor can and do serve as alternative routes. Numerous facilities along I-40/81 are identified for detour
route use during incidents. Currently, TDOT provides Incident Management Systems (IMS) on the corridor by
operating the HELP program and implementing Interstate Incident Management Plans within each region. The
Interstate Incident Management Plans identify parallel or alternate facilities, such as US 70, to be used to
reroute traffic from the mainline between any given exit on the interstate in both directions to help improve
incident management, reduce secondary crashes, and keep responders safe. Additional TSMO strategies related
to arterial diversion include Traveler Information Systems (TIS) to inform drivers of the alternate, and Integrated
Corridor Management (ICM), to better distribute traffic between different routes in a corridor.
As TDOT implements and expands its use of Transportation Systems Management and Operations (TSMO)
strategies such as IMS, TIS and ICM along the corridor, the level and frequency of traffic diversion may
potentially require additional improvements to parallel facilities to support safe and efficient operations during
events or over a sustained period. Potential improvements for consideration along parallel and connecting
facilities may include safety enhancements, traffic signal/ITS upgrades, and intersection and arterial corridor
infrastructure improvements. Further sections of this report identify examples where these types of
improvements should be considered.

I-40/81 Multimodal Corridor Study
Technical Memorandum Multimodal Solutions
Page 16
Figure 4. Region 1 Potential Highway Capacity/Expansion Improvements
I-40/81 Multimodal Corridor Study
Technical Memorandum Multimodal Solutions
Page 17
Figure 5. Region 2 Potential Highway Capacity/Expansion Improvements
I-40/81 Multimodal Corridor Study
Technical Memorandum Multimodal Solutions
Page 18
Figure 6. Region 3 Potential Highway Capacity/Expansion Improvements
I-40/81 Multimodal Corridor Study
Technical Memorandum Multimodal Solutions
Page 19
Figure 7. Region 4 Potential Highway Capacity/Expansion Improvements

I-40/81 Multimodal Corridor Study
Technical Memorandum Multimodal Solutions
Page 20
3. Transportation System Management and Operations Strategies
TSMO strategies are designed to improve the operation of expressway facilities by maximizing the efficiency of
the facility without the expense of constructing new lanes. Strategies accomplish this in various ways:
Table 6. TSMO Strategies
Goal Example Strategies
Provide better information to drivers on traffic conditions allowing them to divert to facilities with better real time operating conditions
Traveler Information Systems (TIS)
Move more people by increasing vehicle occupancy High Occupancy Vehicle (HOV) and High Occupancy Toll (HOT) lanes
Utilize unused capacity in HOV lanes by allowing Single Occupancy Vehicles (SOV) to pay a toll in order to use the lane
HOT lanes
Provide a potential funding source and mechanism for managed lane enforcement
HOT lanes
Maintain the optimal traffic density to maximize facility efficiency
Ramp metering
Better distribute traffic among different routes in a corridor Integrated Corridor Management (ICM)
Reduce crashes Queue Warning, Ramp Metering
TSMO strategies are not the proverbial silver
bullet to cure all issues but can manage and
significantly improve expressway operations.
Specifically, TSMO can maintain optimal flow
conditions to the extent that current geometric
conditions permit. Existing geometric issues will
continue to impact expressway operation even
after TSMO implementation. Additional
strategies must therefore be coupled with TSMO
in areas where demand is far outstripping the
transportation system’s capacity.
FHWA is supportive of TSMO strategies and
is also a valuable resource for planning and
implementation. As Tennessee begins to
consider changes in operations to its interstate
system, FHWA should be consulted early in the Figure 8. I-85 HOT Lanes in Atlanta (WSP)
I-40/81 Multimodal Corridor Study
Technical Memorandum Multimodal Solutions
Page 21
process to ensure that they would consider favorably the specific strategies being contemplated by
Tennessee. (It should also be noted that the current Surface Transportation Act, the FAST Act, was extended to
September 30, 2021. Changes in federal law at that point could impact potential solutions for TSMO
deployment.)
Managed Lanes
High Occupancy Vehicle Lanes
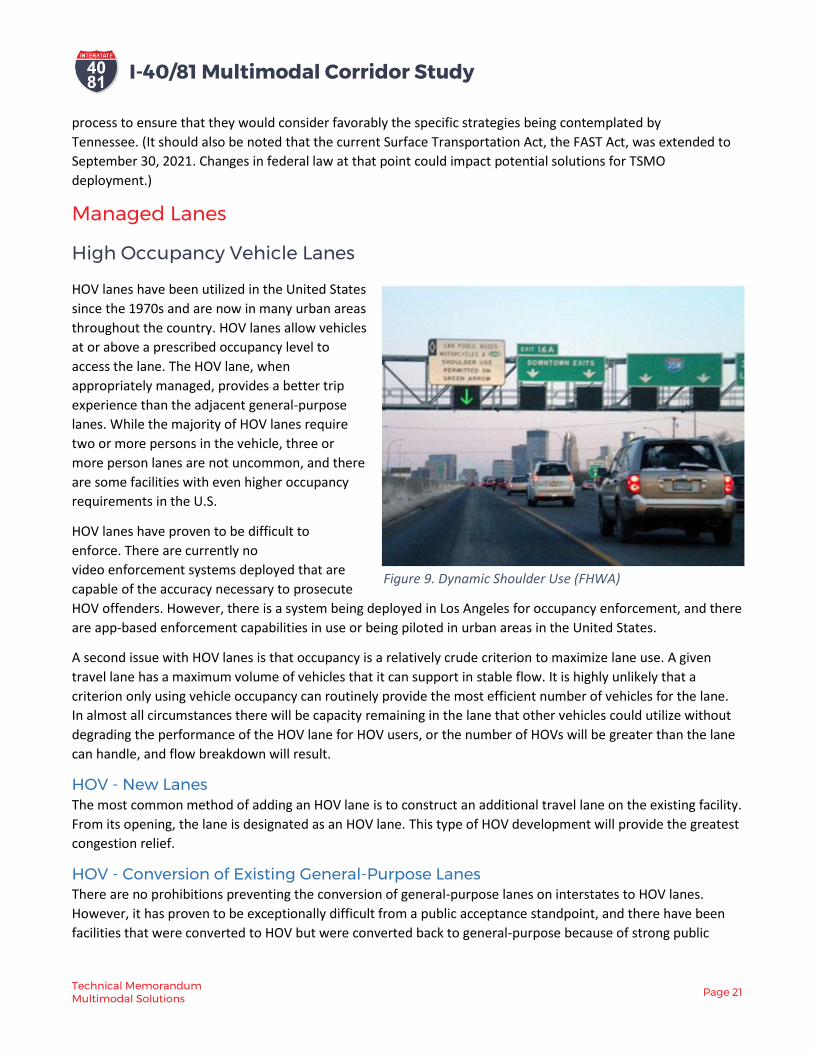
HOV lanes have been utilized in the United States
since the 1970s and are now in many urban areas
throughout the country. HOV lanes allow vehicles
at or above a prescribed occupancy level to
access the lane. The HOV lane, when
appropriately managed, provides a better trip
experience than the adjacent general-purpose
lanes. While the majority of HOV lanes require
two or more persons in the vehicle, three or
more person lanes are not uncommon, and there
are some facilities with even higher occupancy
requirements in the U.S.
HOV lanes have proven to be difficult to
enforce. There are currently no
video enforcement systems deployed that are
capable of the accuracy necessary to prosecute
HOV offenders. However, there is a system being deployed in Los Angeles for occupancy enforcement, and there
are app-based enforcement capabilities in use or being piloted in urban areas in the United States.
A second issue with HOV lanes is that occupancy is a relatively crude criterion to maximize lane use. A given
travel lane has a maximum volume of vehicles that it can support in stable flow. It is highly unlikely that a
criterion only using vehicle occupancy can routinely provide the most efficient number of vehicles for the lane.
In almost all circumstances there will be capacity remaining in the lane that other vehicles could utilize without
degrading the performance of the HOV lane for HOV users, or the number of HOVs will be greater than the lane
can handle, and flow breakdown will result.
HOV - New Lanes The most common method of adding an HOV lane is to construct an additional travel lane on the existing facility.
From its opening, the lane is designated as an HOV lane. This type of HOV development will provide the greatest
congestion relief.
HOV - Conversion of Existing General-Purpose Lanes There are no prohibitions preventing the conversion of general-purpose lanes on interstates to HOV lanes.
However, it has proven to be exceptionally difficult from a public acceptance standpoint, and there have been
facilities that were converted to HOV but were converted back to general-purpose because of strong public
Figure 9. Dynamic Shoulder Use (FHWA)
I-40/81 Multimodal Corridor Study
Technical Memorandum Multimodal Solutions
Page 22
sentiment. In a conversion, greater person throughput would depend on whether additional carpooling would
occur.
Considerations for Deployment of HOV Lanes • Congestion exists.
• Concentrations of origin and destination pairs exist.
• There is evidence to suggest that HOV lanes on a facility would increase carpooling.
• Policy decisions indicate a strong desire for HOV lanes versus other types of lane management.
High Occupancy Toll Lanes
HOV lanes often have excess capacity, including cases where the occupancy requirement has been increased in
order to manage growing HOV lane demand. HOT lanes allow this excess capacity in HOV lanes to be sold to
drivers willing to pay a toll to access a lane with better travel characteristics than the adjacent general-purpose
lanes. Variable pricing is used to manage the amount of access given to non-HOVs, preventing the degradation
of travel conditions in the lane.
Tolling is not currently broadly authorized in Tennessee. In 2007, the state legislature passed the Tennessee
Tollway Act, which authorized TDOT to identify up to two pilot toll projects for the General Assembly’s
consideration. Although traffic and revenue studies were conducted for several major road and bridge projects
around the state, including major new river crossings in Memphis and Chattanooga, TDOT has not brought any
pilot projects forward to the legislature.
Conversion of HOV lanes to HOT lanes is federally allowed under 23 U.S.C. § 129. In Tennessee, the state’s legal
interpretation is that HOT lanes are a form of tolling that would require separate authorization by the state
legislature. Conversion of the Nashville and Memphis HOV lanes would also require analysis of how
23 U.S.C. § 129 applies to conversion of a part-time HOV lane.
Once a lane is converted, TDOT would be required to monitor and confirm that service for HOVs using the lane
has not been compromised by allowing non-HOVs to use it. Specifically, operating conditions in the lane must
maintain a speed of 45 mph or greater 90 percent of the time during both the morning and evening peak
hours. Annual reporting to FHWA is required. If a facility should fail to meet this criterion, action must be taken
to correct the situation. Action could include raising the occupancy requirement, increasing tolls, or restricting
non-HOV vehicles (such as low emission vehicles) that have been allowed to use the lane.
Like HOV lanes, HOT lanes have proven to be difficult to enforce. They are more challenging to enforce than
HOV lanes since they allow both HOVs and single occupancy vehicles that pay the toll. Multiple systems such as
an occupancy declaration lane, or a visible light at the toll collection point indicating that a vehicle is declaring
itself an HOV, still require a traffic stop to verify occupancy before a traffic citation can be issued. However,
several agencies are testing new tools to meet the enforcement challenges.
In January 2020, the North Central Texas Council of Governments (NCTCOG) began using the app GoCARMA for
drivers to declare HOV status. Another app, RideFlag, is similar and has been deployed as a pilot in Utah.
NCTCOG changed its business rules to stop penalizing drivers who improperly declared themselves an HOV,
instead providing a discount to drivers who can show their HOV status through the app. In this
way, NCTCOG does not need to meet the high legal threshold to prosecute an offender. Since the app is used
to declare HOV status, and it has built-in mechanisms to prevent fraud, the app, along with the change in

I-40/81 Multimodal Corridor Study
Technical Memorandum Multimodal Solutions
Page 23
business rules, has allowed effective HOT lane enforcement without the need to perform traffic stops. It seems
probable that other agencies will adopt this mechanism. Toll payment itself has been routinely video
enforced for more than two decades, so complete HOT lane enforcement is possible without the need for traffic
stops.
HOT – New Lanes Under 23 U.S.C. § 129, if a lane is added to an interstate facility, it can be operated as a HOT lane regardless
of whether an HOV lane previously existed on the facility. The only caveat imposed is that the number of free
lanes, excluding auxiliary lanes, must be the same as it was before construction. Adding a HOT lane has all the
benefits of converting an HOV lane to HOT operation, plus it adds significant new capacity to the facility.
HOT – Conversion of General Purpose or HOV lanes Under existing federal law, an existing general-purpose lane on an interstate facility may not be converted to a
HOT lane. There is an exception under the Value Pricing Pilot Program; however, Tennessee does not currently
have one of the 15 slots available under the program. Further, conversion of a general-purpose lane to a HOT
lane would likely run into the same public resistance as conversion of a general-purpose lane to an HOV lane.
Conversion of an HOV lane to a HOT lane is permitted under existing federal law, and numerous HOV lanes
around the country have been converted to HOT operation. While there occasionally has been public resistance,
it is far less than conversion of a general-purpose lane.
Considerations for Deployment of HOV conversion • Existing HOV use is significantly less than the vehicle capacity of the HOV lane.
• HOV use is approaching the capacity limit of the HOV lane, and an increase to the occupancy
requirement to qualify as an HOV is required to prevent flow breakdown.
• HOV lane violations are high and enforcing HOV occupancy would likely result in significant diversion of
traffic to the general-purpose lanes that would result in significant flow degradation in the general-
purpose lanes.
Table 7. Potential HOV Conversion to HOT Lane
Region County Description
3 Davidson
and Wilson Existing HOV lanes on I-40 on the east side of Nashville, both directions, from Exit 216 (Briley Parkway) to Exit 232 (SR 109).
4 Shelby
Existing HOV lanes on I-40 eastbound from MM 15 (near the Sycamore View Road interchange) to MM 22 (near the US 64 interchange), and I-40 westbound from MM 22 to MM 16 (near the Sycamore View Road interchange).
Potential HOV conversions to HOT lanes are shown in Figure 25 through 28.
Express Lanes
There are numerous terms for managed lanes which require payment of a toll by all vehicles using the lane. For
this study, Express Lanes is the term used. While there may be toll exemptions for transit vehicles and over-the-
road buses, and possibly first responders, express lanes do not provide for special treatment based on auto
occupancy alone. Under 23 U.S.C. § 129, tolled express lanes can be added to an interstate facility as long as the
I-40/81 Multimodal Corridor Study
Technical Memorandum Multimodal Solutions
Page 24
number of free lanes is the same as it was before construction. The advantage of express lanes is that it is easier
to manage traffic flow when all the vehicles can be managed using price, rather than some fraction of the traffic
in the lane, as under HOT operation. Since auto occupancy does not need to be verified, enforcement is
simplified.
Considerations for Deployment of HOT or Express Lanes • Any new lane added on the I-40/81 corridor should be considered for HOT or Express operation. Doing
so maintains the capacity improvement and protects it from the degraded travel conditions caused by
congestion. HOT or Express lanes also maintain a travel option with a high level of trip time reliability.
Separate Truck Lanes
Truck-only lanes are intended to separate truck traffic from general traffic to improve the flow of goods
movement, facilitate flow in the general traffic lanes, and improve safety.
There are currently very few truck-only lanes in the United States. The New Jersey Turnpike has a barrier
separated set of lanes and interchanges that trucks are restricted to using. On an interstate facility, California
has two truck-only lanes: northbound and southbound I-5 in Los Angeles County at the SR 14 split, and
southbound I-5 in Kern County at the SR 99 junction near the “Grapevine” section of the corridor. 5 The truck
lanes in both locations are fairly short, just under 2.5 miles in Los Angeles County, and only 0.35 miles in Kern
County. Cars are permitted (but discouraged) in the truck lanes, but trucks are not allowed in the car lanes.
While trucks and cars are separated on these California facilities, Caltrans states “The purpose of these truck
lanes is to separate slower moving trucks from the faster general traffic on the grade,”6 suggesting it is more
likely that these should be classified as truck climbing lanes in the context of this study. The purpose of the Kern
County facility is to separate auto and truck merging at the I-5 and SR 99 interchange. Given the short length and
the purpose of the lanes, this facility is serving a function that would normally be considered an auxiliary lane.
Truck-only toll lanes have been studied but not implemented in Georgia, Oregon, California, and Missouri as a
way to improve goods movement and improve safety for general traffic. In addition to tolled truck lanes, the
Georgia Department of Transportation is moving forward with barrier separated truck only lanes (two lanes) on
I-75 south of Atlanta. These lanes will be northbound only and approximately 40 miles in length. Only
commercial vehicles will be allowed in the lane, and the project is scheduled to open in 2029. This portion of I-75
has significant truck traffic moving goods from the Port of Savannah north along I-75.
Considerations for Deployment of Separate Truck Lanes • The segment has a higher than average level of truck and automobile crashes.
• Truck percentages are significant enough to suggest that the lane(s) can be fully utilized.
Separate Local Lanes and Through Lanes
While the concept has been considered in many places for many years, there is currently no deployment of an
interstate with separately designated local lanes and lanes for through-traffic except in cases where the
through-lanes are tolled. For example, on SR 91 in Orange County, California, a tolled express lane that is 10
5 https://dot.ca.gov/programs/traffic-operations/legal-truck-access/truck-only-lanes. Accessed 06/08/2020. 6 Ibid, no additional research was performed to determine how slower traffic on the grade would occur in both directions in the same area.

I-40/81 Multimodal Corridor Study
Technical Memorandum Multimodal Solutions
Page 25
miles long only allows traffic to enter at its beginning and exit at its end. There are no interim access points. The
express lane is managed through pricing so that its level of service remains high even during peak traffic hours.
There are C-D roads on many interstates that provide for local travel between interchanges. While these C-D
roads provide a somewhat similar function as separate local lanes, they are usually not limited access, often
providing driveway access to businesses and other adjacent properties.
The major advantage of separating local and through traffic is to reduce overall weaving movements on the
facility. However, an untolled combination of local and through lanes, with both being limited access over a
significant distance, has drawbacks. Splitting traffic into local versus through trips is unlikely to balance lane
capacity with demand in most situations. This can result in unused capacity, and/or a facility where demand
exceeds capacity, with the associated breakdown in traffic flow. Through drivers are more likely than local
drivers to be unfamiliar with the area. Without a good understanding of where the through lanes permit access,
unfamiliar drivers may be reluctant to use the through lanes. There is also the possibility that drivers may find
themselves unintentionally in the through lanes and therefore delayed further in reaching their destination.
Considerations for Deployment of Separate Local and Through Lanes • Separate lanes for local traffic and through traffic are not recommended as a potential solution for
deployment in Tennessee except as a tolled express facility or a C-D system that might be developed in
the future.
Information Management
Traveler Information Systems (External to Vehicle)
Traveler Information Systems (TIS) that are external to the vehicle have been used on interstate facilities since
the interstates were developed in the mid-1950s. These initial systems were, and continue to be, fixed signage
providing information on routes, exits, speed limits, and other information necessary for the safe operation of
vehicles on the interstate. Later, traveler information was often provided during peak hours by radio stations
who shared incident information with listeners based on monitoring police scanners or using traffic reporters
who flew over the area in helicopters.
More recently, traveler information systems have become more
flexible. Dynamic message signs on the highway can provide driver
information, such as travel conditions, that can be updated in near
real time from a remote location. Larger dynamic message signs can
display relatively complex information, although the number of words
and lines that can be used are limited for readability based on
guidance from the Manual on Uniform Traffic Control Devices
(MUTCD). Even with the limited space, this allows the
latest conditions relating to congestion, crashes, and weather to be
displayed in near real time. These dynamic message signs are usually
controlled from a Traffic Management Center.
Smaller dynamic message signs can be used to convey less complex, but important, information also in near real
time. This can include dynamic speed limits, queue warnings, relatively simple text messages, and messages
Figure 10. TDOT Dynamic Message Sign

I-40/81 Multimodal Corridor Study
Technical Memorandum Multimodal Solutions
Page 26
related to lanes that are open or closed, which is particularly useful in crash situations or for hard shoulder
running.
Considerations for Deployment of Traveler Information Systems (External to Vehicle) • Fixed message signs should continue to be deployed as required by state regulation and the MUTCD.
• Larger dynamic message signs should be considered for areas where changing conditions require
motorists to receive relatively complex information in near real time.
• Smaller dynamic message signs should be considered where changing conditions require motorists to
receive relatively simple information in near real time.
Traveler Information Systems (Internal to Vehicle)
Traveler Information Systems internal to the vehicle are already in widespread use through smartphones. The
most common of these are trip planning apps such as Google Maps and Waze. However, in-vehicle devices are
quickly becoming more sophisticated allowing targeted information to be delivered efficiently. As the
information that needs to be delivered is usually dependent upon a vehicle’s location, a great deal of Traveler
Information Systems internal to the vehicle will require some type of location-based information. This is also
common in travel-related apps such as Waze and Google Maps.
Location-based traveler information uses technologies to determine the location of drivers along a facility. These
technologies can include in-vehicle devices such as smartphone global positioning systems (GPS), or
Dedicated Short-Range Communication devices (such as a transponder) coupled with roadside infrastructure.
Either device can create a geofence, i.e. a virtual perimeter for a real-world geographic area. While a geofence
can be created using roadside equipment, it is more typically derived from a smartphone app that uses GPS,
radio-frequency identification devices (RFID), Wi-Fi, or cellular data to trigger a pre-programmed action when
the device enters the pre-defined geographical boundary.7
Once a geofencing program is in place, defining the geofencing is a relatively simple process. Changing the
messages delivered inside a given geofence is also easy. To minimize distracted driving, information from
geofencing can be delivered in audible format over a driver’s smartphone. This allows geographically targeted
information to be delivered quickly and efficiently. The main drawback to geofencing is that it requires some
type of GPS/cellular device or transponder in the vehicle itself. As these types of devices are not ubiquitous,
geofencing cannot yet take the place of messaging outside of the vehicle.
Use of Traveler Information Systems for HOT/Toll Lane Management
Should Tennessee decide to implement HOT lanes or Express Lanes, geofencing can play a significant role in
reducing the cost of enforcing occupancy and potentially toll collection.
Geofencing provides similar benefits to other dynamic traffic management systems. By using a geofence,
managed lane facilities can reduce the need for traditional toll collection and enforcement methods (i.e. gantries
and cameras) by connecting directly with the users. Location-based traveler information can also provide more
accurate and precise traffic and travel time data.
7 Manchanda, Megha. “Soon, You May Have to Pay Highway Toll Based on Distance Actually Travelled.” Business Standard, 11 Apr. 2018, www.business-
standard.com/article/economy-policy/pilot-run-for-geo-fencing-on-delhi-mumbai-highway-route-expected-soon-118041100592_1.html.

I-40/81 Multimodal Corridor Study
Technical Memorandum Multimodal Solutions
Page 27
Location-based traveler information can be
found in several different forms, so the
technological maturity varies depending on
whether the technology is infrastructure or
vehicle based. In the case of
geofences, Bluedot has developed and begun to
sell geofencing technology for tolling
applications.
Other than cost, privacy can be a concern when
determining whether or not to implement
location-based traveler information. If GPS
tracking data is transmitted from vehicles to
facilities and toll operators, it could cause public
concerns over data privacy. Ensuring secure
data use and storage is therefore a key issue.
Considerations for Deployment of Traveler Information Systems (Internal to Vehicle)
• The devices necessary for deployment
of traveler information internal to the
vehicle are already widespread and
likely to continue to increase. Therefore,
serious consideration should be given to
deployment of these types of systems as the
opportunity presents itself.
• Internal to vehicle TIS is a much lower-cost
solution that promises the opportunity to
replace more expensive external deployments
such as overhead message signs. However, in-
vehicle traveler information cannot yet be
transmitted to all vehicles on the road today
and therefore cannot replace external to
vehicle TIS, especially when safety-related
messaging is needed.
Applications for Geofencing
In 2018, the Utah Department of Transportation
(UDOT) partnered with RideFlag (rideflag.com), an
app-based service that uses geofencing and facial
differentiation technology for HOV enforcement. At
the beginning of a trip, passengers in a vehicle
confirm their HOV compliance by using the RideFlag
application’s facial differentiation software. A
geofence placed around locations on the I-15 Express
Lanes reads a vehicle’s transponder, connected to the
RideFlag app, and confirms the vehicle’s HOV status.
The North Central Texas Council of Governments
operates several HOT lanes and has partnered with
GoCarma (gocarma.com) to identify vehicles meeting
HOV requirements. GoCarma uses a device in the
vehicle to automatically verify auto occupancy based
on sensing Bluetooth devices in the vehicle.
Mechanisms are in place in GoCarma that can verify
that multiple devices are not merely left in the
vehicle to cheat the system. This system has been in
actual operation since January 2020.
I-40/81 Multimodal Corridor Study
Technical Memorandum Multimodal Solutions
Page 28
Incident Management Systems
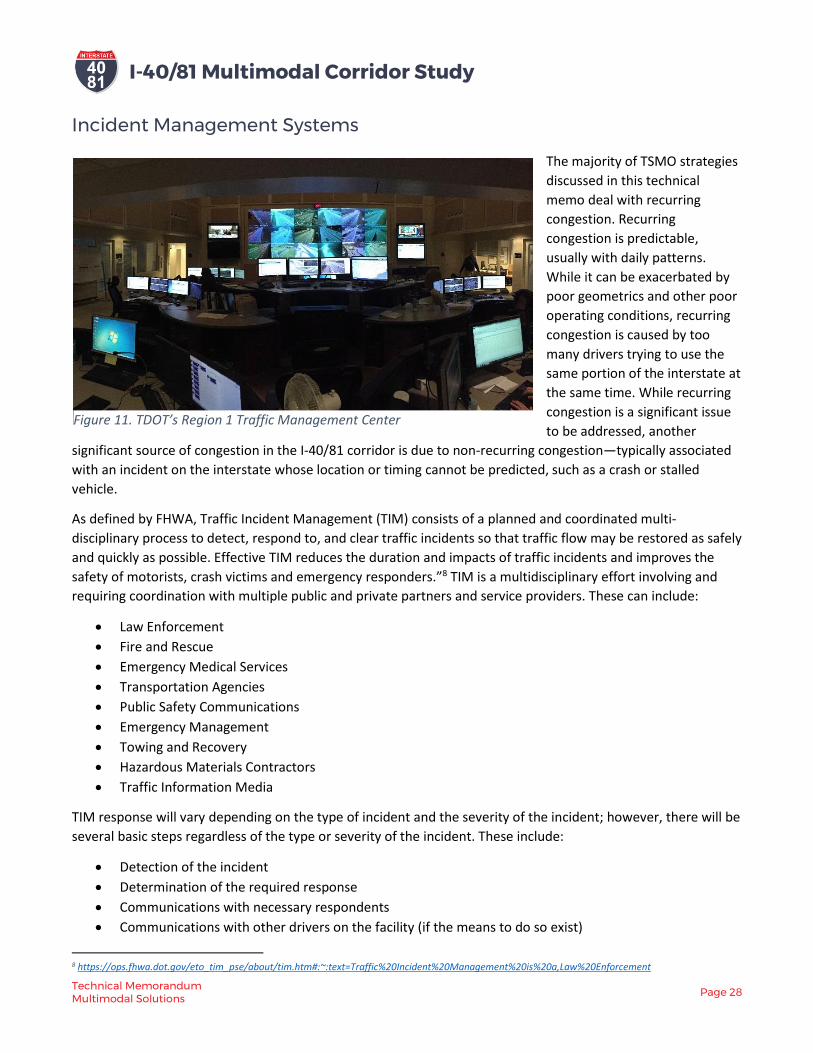
The majority of TSMO strategies
discussed in this technical
memo deal with recurring
congestion. Recurring
congestion is predictable,
usually with daily patterns.
While it can be exacerbated by
poor geometrics and other poor
operating conditions, recurring
congestion is caused by too
many drivers trying to use the
same portion of the interstate at
the same time. While recurring
congestion is a significant issue
to be addressed, another
significant source of congestion in the I-40/81 corridor is due to non-recurring congestion—typically associated
with an incident on the interstate whose location or timing cannot be predicted, such as a crash or stalled
vehicle.
As defined by FHWA, Traffic Incident Management (TIM) consists of a planned and coordinated multi-
disciplinary process to detect, respond to, and clear traffic incidents so that traffic flow may be restored as safely
and quickly as possible. Effective TIM reduces the duration and impacts of traffic incidents and improves the
safety of motorists, crash victims and emergency responders.”8 TIM is a multidisciplinary effort involving and
requiring coordination with multiple public and private partners and service providers. These can include:
• Law Enforcement
• Fire and Rescue
• Emergency Medical Services
• Transportation Agencies
• Public Safety Communications
• Emergency Management
• Towing and Recovery
• Hazardous Materials Contractors
• Traffic Information Media
TIM response will vary depending on the type of incident and the severity of the incident; however, there will be
several basic steps regardless of the type or severity of the incident. These include:
• Detection of the incident
• Determination of the required response
• Communications with necessary respondents
• Communications with other drivers on the facility (if the means to do so exist)
8 https://ops.fhwa.dot.gov/eto_tim_pse/about/tim.htm#:~:text=Traffic%20Incident%20Management%20is%20a,Law%20Enforcement
Figure 11. TDOT’s Region 1 Traffic Management Center
I-40/81 Multimodal Corridor Study
Technical Memorandum Multimodal Solutions
Page 29
• The response itself
• Determination of actions required prior to reopening travel lanes
• Performing needed actions such as vehicle removal and/or roadway repairs
• Re-establishment of traffic flow
While many of these actions will require planning more than they require roadway equipment, many of the
strategies discussed in this technical memo can provide effective support for incident response. For instance,
the incident can be detected through interstate video surveillance and traffic detection devices that show
unexplained slowdowns in the traffic flow. Communications with other drivers on the facility can be performed
with either devices such as dynamic message signs external to the vehicle or using in-vehicle devices, which is
already occurring in apps such as Google Maps and Waze.
Considerations for Deployment of Traffic Incident Management • Plans should be developed cooperatively with all agencies likely to be involved in the process.
• Traffic Incident Management plans should be periodically reviewed and updated.
• Experience gained from past incidents should be considered in plan review.
HELP Routes
Public and stakeholder input for this study has indicated a desire to expand the HELP program (described in the
Existing/Future Conditions technical memo) to areas currently without it. Outside major urban areas, continuous
patrolling and circulation of trucks may not be required. However, installation of CCTV cameras and other
Smartway equipment will help TDOT monitor and detect incidents, then dispatch HELP operators when and
where they are needed as a “HELP Lite” service. Additional trucks and operators would be needed to respond to
incidents in the expanded HELP service area without compromising TDOT’s ability to serve existing HELP routes.
Ultimately it would be desirable to provide “HELP Lite” service throughout the entire corridor, but initial efforts
could focus on more rural sections of the corridor where assistance is less likely to be readily available from
other public agencies. For instance, there is no Tennessee Highway Patrol station on the section of the corridor
between Jackson and Dickson, or between Knoxville and the Tri-Cities area.
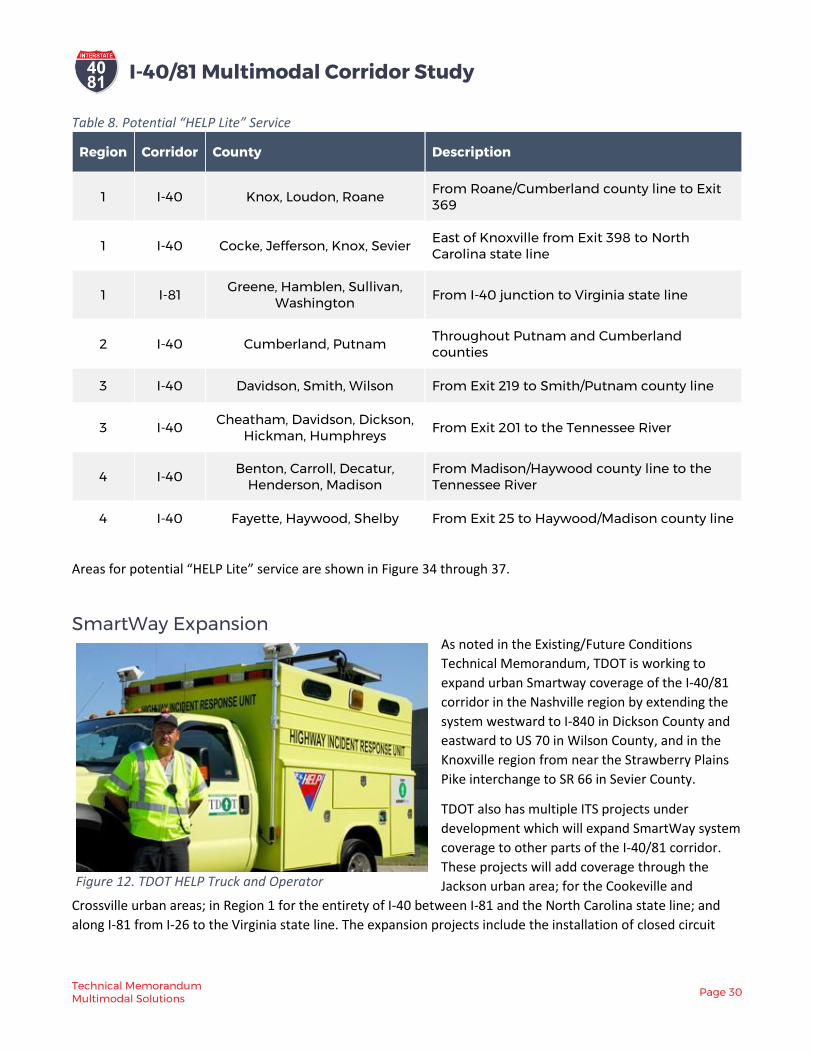
I-40/81 Multimodal Corridor Study
Technical Memorandum Multimodal Solutions
Page 30
Table 8. Potential “HELP Lite” Service
Region Corridor County Description
1 I-40 Knox, Loudon, Roane From Roane/Cumberland county line to Exit 369
1 I-40 Cocke, Jefferson, Knox, Sevier East of Knoxville from Exit 398 to North Carolina state line
1 I-81 Greene, Hamblen, Sullivan,
Washington From I-40 junction to Virginia state line
2 I-40 Cumberland, Putnam Throughout Putnam and Cumberland counties
3 I-40 Davidson, Smith, Wilson From Exit 219 to Smith/Putnam county line
3 I-40 Cheatham, Davidson, Dickson,
Hickman, Humphreys From Exit 201 to the Tennessee River
4 I-40 Benton, Carroll, Decatur,
Henderson, Madison From Madison/Haywood county line to the Tennessee River
4 I-40 Fayette, Haywood, Shelby From Exit 25 to Haywood/Madison county line
Areas for potential “HELP Lite” service are shown in Figure 34 through 37.
SmartWay Expansion
As noted in the Existing/Future Conditions
Technical Memorandum, TDOT is working to
expand urban Smartway coverage of the I-40/81
corridor in the Nashville region by extending the
system westward to I-840 in Dickson County and
eastward to US 70 in Wilson County, and in the
Knoxville region from near the Strawberry Plains
Pike interchange to SR 66 in Sevier County.
TDOT also has multiple ITS projects under
development which will expand SmartWay system
coverage to other parts of the I-40/81 corridor.
These projects will add coverage through the
Jackson urban area; for the Cookeville and
Crossville urban areas; in Region 1 for the entirety of I-40 between I-81 and the North Carolina state line; and
along I-81 from I-26 to the Virginia state line. The expansion projects include the installation of closed circuit
Figure 12. TDOT HELP Truck and Operator
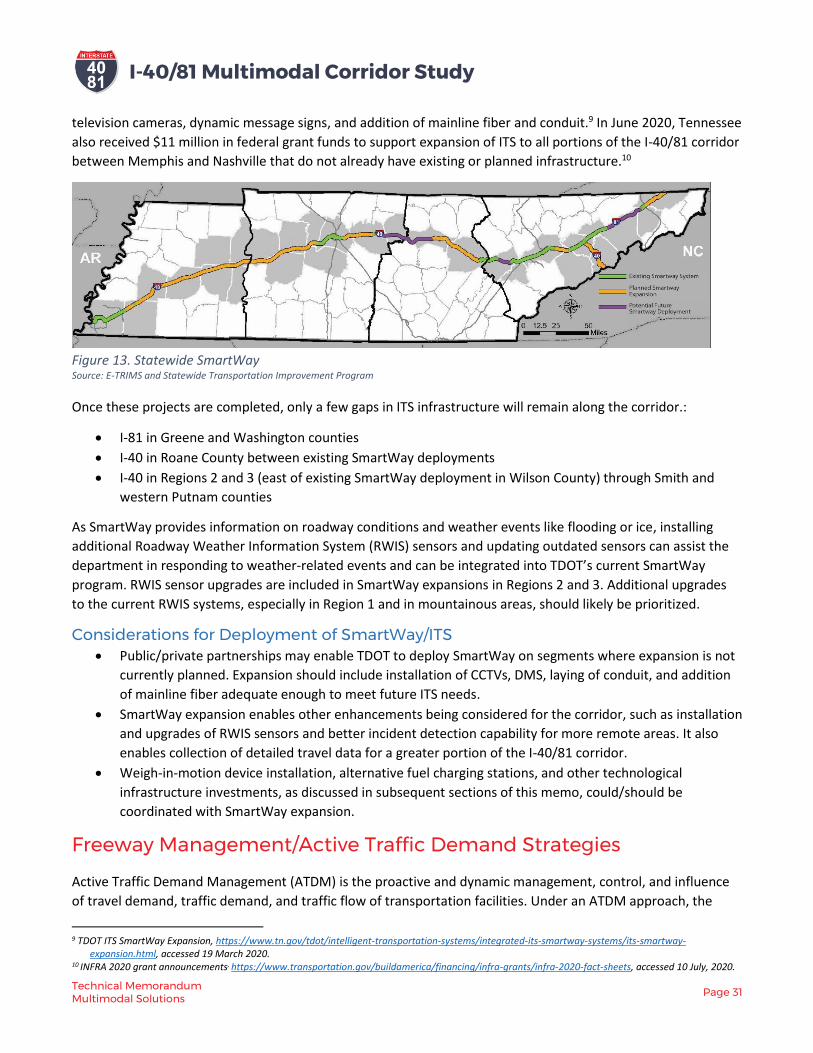
I-40/81 Multimodal Corridor Study
Technical Memorandum Multimodal Solutions
Page 31
television cameras, dynamic message signs, and addition of mainline fiber and conduit.9 In June 2020, Tennessee
also received $11 million in federal grant funds to support expansion of ITS to all portions of the I-40/81 corridor
between Memphis and Nashville that do not already have existing or planned infrastructure.10
Figure 13. Statewide SmartWay Source: E-TRIMS and Statewide Transportation Improvement Program
Once these projects are completed, only a few gaps in ITS infrastructure will remain along the corridor.:
• I-81 in Greene and Washington counties
• I-40 in Roane County between existing SmartWay deployments
• I-40 in Regions 2 and 3 (east of existing SmartWay deployment in Wilson County) through Smith and
western Putnam counties
As SmartWay provides information on roadway conditions and weather events like flooding or ice, installing
additional Roadway Weather Information System (RWIS) sensors and updating outdated sensors can assist the
department in responding to weather-related events and can be integrated into TDOT’s current SmartWay
program. RWIS sensor upgrades are included in SmartWay expansions in Regions 2 and 3. Additional upgrades
to the current RWIS systems, especially in Region 1 and in mountainous areas, should likely be prioritized.
Considerations for Deployment of SmartWay/ITS • Public/private partnerships may enable TDOT to deploy SmartWay on segments where expansion is not
currently planned. Expansion should include installation of CCTVs, DMS, laying of conduit, and addition
of mainline fiber adequate enough to meet future ITS needs.
• SmartWay expansion enables other enhancements being considered for the corridor, such as installation
and upgrades of RWIS sensors and better incident detection capability for more remote areas. It also
enables collection of detailed travel data for a greater portion of the I-40/81 corridor.
• Weigh-in-motion device installation, alternative fuel charging stations, and other technological
infrastructure investments, as discussed in subsequent sections of this memo, could/should be
coordinated with SmartWay expansion.
Freeway Management/Active Traffic Demand Strategies
Active Traffic Demand Management (ATDM) is the proactive and dynamic management, control, and influence
of travel demand, traffic demand, and traffic flow of transportation facilities. Under an ATDM approach, the
9 TDOT ITS SmartWay Expansion, https://www.tn.gov/tdot/intelligent-transportation-systems/integrated-its-smartway-systems/its-smartway-
expansion.html, accessed 19 March 2020. 10 INFRA 2020 grant announcements, https://www.transportation.gov/buildamerica/financing/infra-grants/infra-2020-fact-sheets, accessed 10 July, 2020.

I-40/81 Multimodal Corridor Study
Technical Memorandum Multimodal Solutions
Page 32
transportation system’s performance is continuously assessed. Dynamic actions using ATDM tools and assets are
constantly evaluated and implemented in real time to achieve performance objectives, such as preventing or
delaying breakdown conditions, improving safety, promoting sustainable travel modes, reducing emissions, or
maximizing system efficiency. Implemented actions are continuously monitored as they start to affect system
performance. This cyclical, real-time monitoring and adjustment approach can be carried out at various
operational time-scales, ranging from longer-term strategic approaches to short-term tactical decisions.
ATDM strategies can be deployed to improve a recurring congestion or safety issue at a specific location,
or deployed across a highway corridor as a broader transportation management strategy. They are often
deployed in combinations to maximize benefits and make efficient use of ATDM infrastructure.
Hard Shoulder Running – Buses Allowing buses to operate on the existing shoulder in
congested areas improves transit travel times and
transit trip reliability, which can lead to increased transit
ridership. To operate a hard shoulder for buses, key
provisions must be in place to minimize safety issues.
These criteria include limiting the maximum speed buses
can travel (typically 35 mph) and limiting the speed that
buses can travel relative to the adjacent traffic speeds
(typically no more than a 15 mph difference).
Professional drivers can operate buses on 10-foot
shoulders, although wider shoulders are preferred. The
potential safety concerns of this operation are reduced
by limiting the number of vehicles that use the shoulder
and by the fact that it is performed only by trained
professional drivers. Further, because of the relatively low number of vehicles on the shoulder and the use of
professional drivers, it is not considered a fatal flaw if there are a limited number of “pinch point” locations
(such as a narrow underpass) where buses would need to merge briefly back into the general traffic stream.
However, numerous pinch points along the route are not desirable.
In theory, either the inside or the outside shoulder can be used for Bus on Shoulder (BOS) operation. However,
placing bus on shoulder operation in the inside lane requires transit vehicles to weave across multiple lanes of
heavy traffic. The outside shoulder is therefore usually preferred.
Bus on shoulder operations exist in 13 states, including Ohio, Florida, Georgia, North Carolina, New Jersey,
Delaware, Maryland, Virginia, Minnesota, Illinois, Kansas, California, and Washington. Minnesota has the largest
system, with over 300 miles of shoulders used for bus operations.
Considerations for Deployment of Bus on Shoulder • Significant congestion in the general purpose lanes.
• Existing or planned transit routes that would benefit from bypassing congestion in the general purpose
lanes.
• Shoulders at least 10 feet wide exist over the significant majority of the route, or are planned.
Figure 14. Bus Hard Shoulder Running in Minneapolis
I-40/81 Multimodal Corridor Study
Technical Memorandum Multimodal Solutions
Page 33
In the Nashville metropolitan area, the regional nMotion transit plan proposes bus on shoulder operations on I-
40 from Nashville International Airport to the I-40/24/440 junction, and along the length of the commuter
express route which operates along I-40 west of Nashville from Dickson to downtown Nashville.
Hard Shoulder Running - General Purpose (GP) Traffic
Allowing passenger vehicles to utilize a shoulder requires different designs and operational strategies than bus-
only operations, to ensure safety. The assumption is that traffic will operate at speeds up to free flow, and that
there will be much higher volumes on the shoulder than there would be in a bus-only shoulder operation.
Shoulder design may warrant restrictions on the vehicles eligible for hard shoulder running, but such restrictions
are much more often the result of an overall managed lanes strategy. These restrictions may include limiting the
shoulder to use based on vehicle eligibility or other characteristics.
For traffic to operate safely in hard shoulder operations, the shoulder width should ideally be a minimum of 11
feet for the traffic, and an additional width of shoulder to the median or edge of pavement of three or more
feet. Also, for right side shoulder lanes, merges for entrances and exits must conform to safe standards.
Hard shoulder running can be accomplished in
conjunction with Dynamic Lane Assignment, which
usually takes the form of overhead dynamic message
signs that inform drivers when the shoulder is available
and actively managing access to the shoulder in
response to conditions. Alternatively, the shoulder can
be managed with time of day restrictions and static
signing. While a dynamic lane assignment system in
conjunction with mixed-traffic Hard Shoulder Running is
preferred, systems using static signing have been
successfully implemented.
Hard shoulder running effectively adds capacity during
peak periods but can increase safety risks by removing shoulders that are used for break downs, emergency
response, incidents, and for drivers to divert to avoid a rear end collision. However, hard shoulder running is
generally deployed in areas where congestion already exists, and by utilizing the shoulder the overall capacity of
the corridor is expanded. This reduces congestion and crashes due to congestion, compared to conditions
where the shoulder is not utilized.
Considerations for Deployment of GP Hard Shoulder Running • Significant congestion in the general purpose lanes.
• Shoulders 11 feet or greater in width exist over the significant majority of the route, or are planned.
• No “pinch points” exist, or they will be eliminated prior to hard shoulder use.
• Shoulder pavement is able to handle traffic load, or is planned for upgrade.
Potential Deployment of Hard Shoulder Running Hard shoulder use, whether for transit or all traffic, requires significant study to determine its feasibility. As a
starting point, any urban area is a potential candidate for hard shoulder running; however, specific issues that
will need to be addressed include:
Figure 15. Peak Use Shoulder Lane (Washington DOT)

I-40/81 Multimodal Corridor Study
Technical Memorandum Multimodal Solutions
Page 34
• Level of congestion
• Ability to provide continuous shoulder width, particularly for general purpose traffic
• Transit service within the corridor
• Ability to effectively open and close the lane when not in use
• Ability of the shoulder to handle traffic load
• Ability to provide emergency pull off sites along the shoulder, particularly for general purpose use
Keeping the above elements in mind, when changes are being made to urban sections of I-40 and I-81, the
potential for Bus on Shoulder and GP Hard Shoulder Running should be considered during planning and design.
The necessary elements for hard shoulder running can be incorporated if desired during reconstruction,
addition of lanes, and/or resurfacing projects.
Queue Warning
The purpose of a queue warning system is to alert drivers of slow or
stopped traffic ahead so they can safely decrease speeds. Effective
deployment reduces rear end collisions. Queue warning systems are
deployed upstream of bottleneck locations where a queue reoccurs
on a predictable basis and where there is a history of crashes. These
systems are typically deployed in locations where a freeway
segment is ending at a traffic signal, or in locations with limited sight
visibility, to allow drivers to react to slow or stopped traffic.
Variable Speed Limits
Variable Speed Limits (VSL) are designed to improve the flow of traffic under congested conditions, or for use
when weather conditions indicate a need for reduced speed. VSL can be enforceable using a white letter/black
background or a black letter/white background sign. VSL can also be advisory, using black letters on a yellow
sign. VSL limits can be useful in reducing the number of crashes, particularly rear-end crashes, under congested
conditions and can also delay the onset of stop and go traffic.
Considerations for Deployment of Queue Warning and Variable Speed Limits • Within, and upstream of, locations where congestion routinely occurs • In areas routinely impacted by inclement weather
Dynamic Lane Assignment/Control Dynamic Lane Assignment/Control systems use ITS infrastructure to change lane configurations as conditions
warrant. Dynamic lane control allows a system operator to better utilize available capacity. Examples of
deployment include converting a shoulder into a through-lane during peak periods, or as needed when one or
more travel lanes must be closed due to a crash or disabled vehicle. In a mainline application, dynamic lane
control could also involve warning drivers of lanes that are closed ahead, increasing the time and distance
available for required needed weaving. Dynamic lane assignment can also be used in recurring situations to
provide reversible lanes.
Figure 16. Variable Speed Limits on I-5 in Seattle

I-40/81 Multimodal Corridor Study
Technical Memorandum Multimodal Solutions
Page 35
Considerations for Deployment of Dynamic Lane Assignment/Control • In conditions where demand varies significantly through the day • Upstream of areas where crashes and other incidents are known to occur regularly
• In areas with Dynamic Shoulder use
Integrated Corridor Management ICM consists of the operational coordination of multiple transportation networks and cross-network
connections comprising a corridor, and the coordination of institutions responsible for corridor mobility.11 The
goal of ICM is to improve mobility, safety, and other transportation objectives for travelers and goods. ICM may
encompass numerous systems management activities, including:
• Cooperative and integrated policy among stakeholders
• Communications among network operators and stakeholders
• Improving the efficiency of cross-network junctions and interfaces
• Mobility opportunities, including shifts to alternate routes and modes
• Real-time traffic and transit monitoring
• Real-time information distribution (including alternative networks)
• Congestion management (recurring and non-recurring)
• Incident management
• Travel demand management
• Transportation pricing and payment
ICM may result in the deployment of an actual transportation management system connecting the individual
network-based transportation management systems, or may simply be a set of operational procedures agreed
to by the network owners with appropriate linkages between their respective systems. TDOT is testing ICM as
part of its I-24 Smart Corridor project linking Nashville and Murfreesboro. The pairing of I-24 and US 41 along a
major corridor make this segment an excellent candidate for ICM deployment.
Considerations for Deployment of ICM • ICM should be deployed to the extent practical in any significant urban area. • Reasonable parallel routes exist.
• Arterials with significant ITS capabilities should be given priority in the system.
If ICM is deployed along the I-40/81 corridor, it is suggested that its initial focus be on freeways and parallel
arterials, considering them as an overall corridor system. ICM would utilize ITS devices on all roadway facilities
within the corridor to manage their capacity and improve mobility and safety. As TDOT does not control all the
transportation facilities that would be included in integrated corridor management, cooperation between TDOT
and local agencies should continue to investigate ways to maximize the operational effectiveness of the overall
roadway network.
Potential areas for applying ICM are shown in Figure 25 through 28.
11Integrated Corridor Management (ICM) Program: Major Achievements, Key Findings, and Outlook, FHWA, July 2019
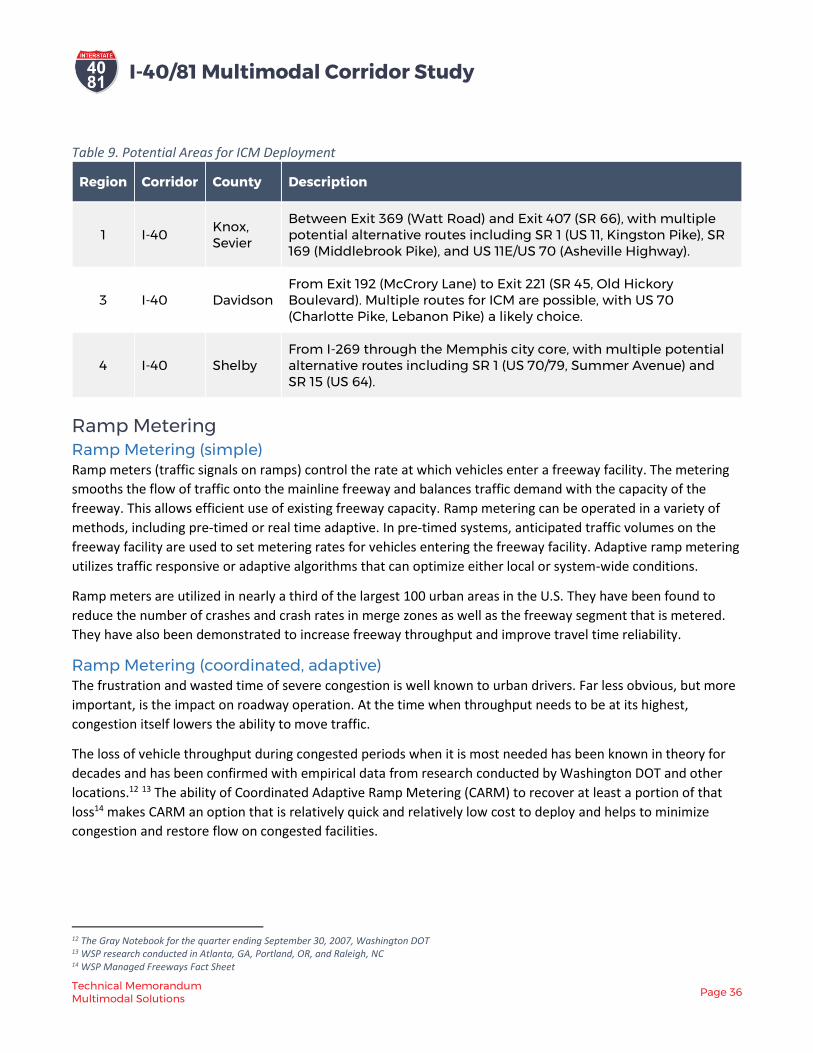
I-40/81 Multimodal Corridor Study
Technical Memorandum Multimodal Solutions
Page 36
Table 9. Potential Areas for ICM Deployment
Region Corridor County Description
1 I-40 Knox, Sevier
Between Exit 369 (Watt Road) and Exit 407 (SR 66), with multiple potential alternative routes including SR 1 (US 11, Kingston Pike), SR 169 (Middlebrook Pike), and US 11E/US 70 (Asheville Highway).
3 I-40 Davidson From Exit 192 (McCrory Lane) to Exit 221 (SR 45, Old Hickory Boulevard). Multiple routes for ICM are possible, with US 70 (Charlotte Pike, Lebanon Pike) a likely choice.
4 I-40 Shelby From I-269 through the Memphis city core, with multiple potential alternative routes including SR 1 (US 70/79, Summer Avenue) and SR 15 (US 64).
Ramp Metering Ramp Metering (simple) Ramp meters (traffic signals on ramps) control the rate at which vehicles enter a freeway facility. The metering
smooths the flow of traffic onto the mainline freeway and balances traffic demand with the capacity of the
freeway. This allows efficient use of existing freeway capacity. Ramp metering can be operated in a variety of
methods, including pre-timed or real time adaptive. In pre-timed systems, anticipated traffic volumes on the
freeway facility are used to set metering rates for vehicles entering the freeway facility. Adaptive ramp metering
utilizes traffic responsive or adaptive algorithms that can optimize either local or system-wide conditions.
Ramp meters are utilized in nearly a third of the largest 100 urban areas in the U.S. They have been found to
reduce the number of crashes and crash rates in merge zones as well as the freeway segment that is metered.
They have also been demonstrated to increase freeway throughput and improve travel time reliability.
Ramp Metering (coordinated, adaptive) The frustration and wasted time of severe congestion is well known to urban drivers. Far less obvious, but more
important, is the impact on roadway operation. At the time when throughput needs to be at its highest,
congestion itself lowers the ability to move traffic.
The loss of vehicle throughput during congested periods when it is most needed has been known in theory for
decades and has been confirmed with empirical data from research conducted by Washington DOT and other
locations.12 13 The ability of Coordinated Adaptive Ramp Metering (CARM) to recover at least a portion of that
loss14 makes CARM an option that is relatively quick and relatively low cost to deploy and helps to minimize
congestion and restore flow on congested facilities.
12 The Gray Notebook for the quarter ending September 30, 2007, Washington DOT 13 WSP research conducted in Atlanta, GA, Portland, OR, and Raleigh, NC 14 WSP Managed Freeways Fact Sheet

I-40/81 Multimodal Corridor Study
Technical Memorandum Multimodal Solutions
Page 37
What is Coordinated Adaptive Ramp Metering? CARM builds upon the ITS applications of ramp metering, ATM, and ICM to fully manage access to and demand
for a freeway facility. CARM on urban freeways utilizes integrated data collection sensors along the roadway and
advanced system management tools to monitor and control real time traffic conditions to provide a higher and
more consistent level of freeway performance.
Traffic flow is often thought of as uniform over a given time, for
example the peak hour. However, research shows that over short
periods of time as shown in Figure 17, minute by minute, flows
vary significantly both above and below the average flow for the
overall period examined.15 This variation is to be expected on any
urban limited access facility. By utilizing intelligent
information, communications and control systems, CARM
responds in real-time to slow the rate of vehicles entering a
freeway during brief periods of high flow and increase the rate
during brief periods of lower flow. Further, ramp meters within
the system coordinate and take into account conditions such as
queues at other ramps. This coordination between ramps and
freeway management in real-time separates CARM from other
forms of ramp metering and results in considerable improvements
in freeway performance and safety.
Figures 18 and 19 show characteristics of degraded flow at a
location on the I-75/85 connector in downtown Atlanta, presented
here because it illustrates patterns that are beginning to emerge
on I-40/81 in Nashville and Knoxville.
Figure 18 shows a simple scatterplot of speed versus throughput
(vehicles per lane per hour). The scatterplot
shows the classic back-bending curve associated with congestion
induced flow reduction. As shown in Figure 19, at this location
in Atlanta on I-75/85, the freeway flow reaches its maximum at the
hourly equivalent of 7,300 vehicles per hour before the system
breaks down, with flows dropping to the hourly equivalent of
4,500 vehicles per hour or just over 60 percent of the measured
maximum throughput. In other words, the facility loses 40 percent
of its ability to carry traffic at exactly the time it is most needed. By
implementing CARM and other ATMS elements, it is likely that a
significant portion of this “lost” capacity can be regained while
also maintaining stable speed. This significantly
increases the productivity of the existing infrastructure
investment.
15 Data from Colorado 470 West of I-25 between South Yosemite Street and South Quebec Street
0.0
10.0
20.0
30.0
40.0
50.0
60.0
70.0
80.0
0 200 400 600 800 1000 1200 1400 1600 1800 2000
Spee
d (
mp
h)
Volume (vehicles per lane per hour)
Speed versus VolumeI-75 Southbound at 10th Street (Atlanta, pre covid)
Figure 18. Speed versus Throughput
Figure 19. Speed and Volume by Time of Day
Figure 17. Example of Minute by Minute Interstate Flow Variation
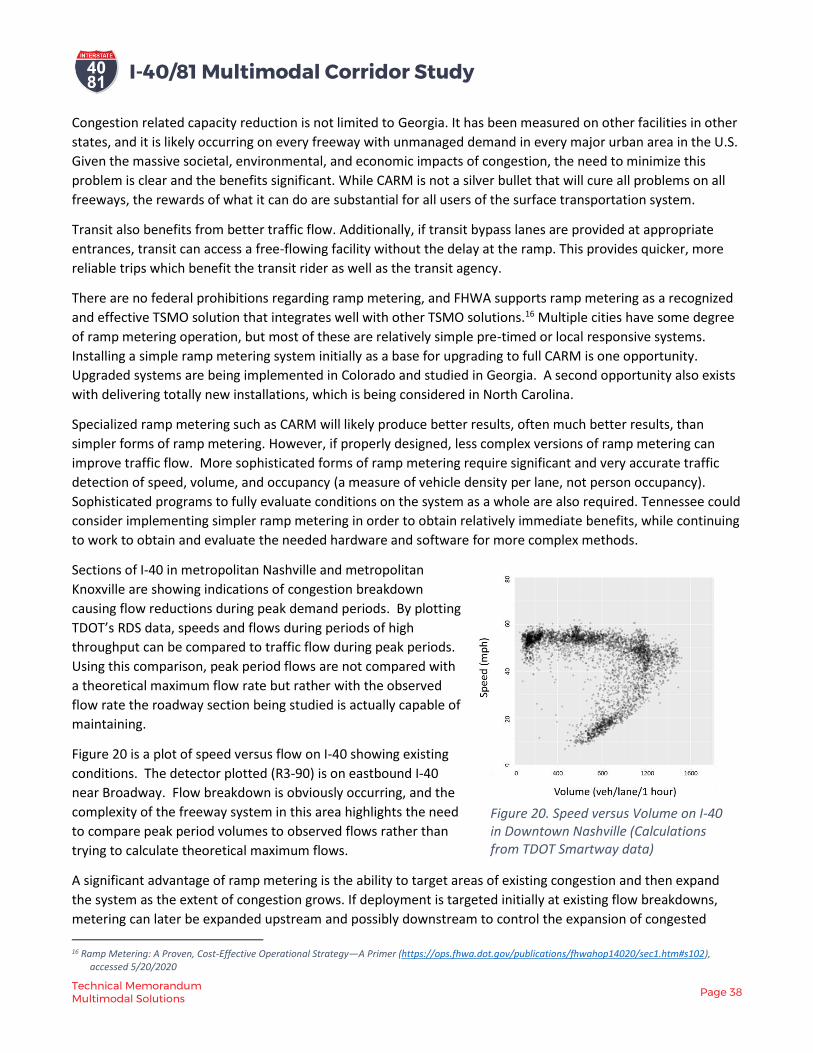
I-40/81 Multimodal Corridor Study
Technical Memorandum Multimodal Solutions
Page 38
Congestion related capacity reduction is not limited to Georgia. It has been measured on other facilities in other
states, and it is likely occurring on every freeway with unmanaged demand in every major urban area in the U.S.
Given the massive societal, environmental, and economic impacts of congestion, the need to minimize this
problem is clear and the benefits significant. While CARM is not a silver bullet that will cure all problems on all
freeways, the rewards of what it can do are substantial for all users of the surface transportation system.
Transit also benefits from better traffic flow. Additionally, if transit bypass lanes are provided at appropriate
entrances, transit can access a free-flowing facility without the delay at the ramp. This provides quicker, more
reliable trips which benefit the transit rider as well as the transit agency.
There are no federal prohibitions regarding ramp metering, and FHWA supports ramp metering as a recognized
and effective TSMO solution that integrates well with other TSMO solutions.16 Multiple cities have some degree
of ramp metering operation, but most of these are relatively simple pre-timed or local responsive systems.
Installing a simple ramp metering system initially as a base for upgrading to full CARM is one opportunity.
Upgraded systems are being implemented in Colorado and studied in Georgia. A second opportunity also exists
with delivering totally new installations, which is being considered in North Carolina.
Specialized ramp metering such as CARM will likely produce better results, often much better results, than
simpler forms of ramp metering. However, if properly designed, less complex versions of ramp metering can
improve traffic flow. More sophisticated forms of ramp metering require significant and very accurate traffic
detection of speed, volume, and occupancy (a measure of vehicle density per lane, not person occupancy).
Sophisticated programs to fully evaluate conditions on the system as a whole are also required. Tennessee could
consider implementing simpler ramp metering in order to obtain relatively immediate benefits, while continuing
to work to obtain and evaluate the needed hardware and software for more complex methods.
Sections of I-40 in metropolitan Nashville and metropolitan
Knoxville are showing indications of congestion breakdown
causing flow reductions during peak demand periods. By plotting
TDOT’s RDS data, speeds and flows during periods of high
throughput can be compared to traffic flow during peak periods.
Using this comparison, peak period flows are not compared with
a theoretical maximum flow rate but rather with the observed
flow rate the roadway section being studied is actually capable of
maintaining.
Figure 20 is a plot of speed versus flow on I-40 showing existing
conditions. The detector plotted (R3-90) is on eastbound I-40
near Broadway. Flow breakdown is obviously occurring, and the
complexity of the freeway system in this area highlights the need
to compare peak period volumes to observed flows rather than
trying to calculate theoretical maximum flows.
A significant advantage of ramp metering is the ability to target areas of existing congestion and then expand
the system as the extent of congestion grows. If deployment is targeted initially at existing flow breakdowns,
metering can later be expanded upstream and possibly downstream to control the expansion of congested
16 Ramp Metering: A Proven, Cost-Effective Operational Strategy—A Primer (https://ops.fhwa.dot.gov/publications/fhwahop14020/sec1.htm#s102),
accessed 5/20/2020
Figure 20. Speed versus Volume on I-40 in Downtown Nashville (Calculations from TDOT Smartway data)

I-40/81 Multimodal Corridor Study
Technical Memorandum Multimodal Solutions
Page 39
conditions. In addition to deployment in congested segments, metering will be needed on ramps upstream of
congested conditions to allow the system to establish control of the traffic stream prior to the congested area.
This approach will require monitoring of system conditions over time, and a contemporary study of conditions in
the corridor when system expansion is being contemplated.
It is not surprising that the most significant congestion on I-40 is occurring on segments with very complex
geometry. Ramp metering can assist in improving traffic flow in these areas; however, areas with complex
geometry are not likely to be the best sites for initial deployment of coordinated, adaptive ramp metering. For
this reason, if CARM moves forward as a recommended alternative, an initial test site on the corridor should be
identified to pilot CARM in Tennessee.
Considerations for Deployment of Ramp Metering • Significant congestion exists or is predicted in the future.
• All lane management is desired/required, not just management of specific lanes.
• Particularly desirable where construction of additional lanes is impractical.
Potential ramp metering deployment locations are shown in Figure 25 through 28.
Table 10. Potential Ramp Metering Deployment
Region County Description
1 Knox Knoxville area – Between Exit 374 (SR 131, Lovell Road) and downtown Knoxville near Broadway (US 441).
3 Davidson
Nashville area, west side - Ramp metering will need to expand from downtown Nashville to Exit 192 at Bellevue (US 70S). In the eastbound direction, metering will likely need to extend farther west to enable flow control.
3 Davidson
Nashville area, east side – While intermittent, significant congestion is likely as far east as Lebanon. Metering at all interchanges, both east and westbound, will be needed on I-40 from downtown Nashville to Exit 221 (SR 45, Old Hickory Boulevard). In the westbound direction, metering may need to extend farther east to enable flow control.
4 Shelby Memphis area, northwest side. Ramp metering should be considered on I-40 in both directions between Exit 1 and Exit 16 (SR 177, Germantown Parkway).

I-40/81 Multimodal Corridor Study
Technical Memorandum Multimodal Solutions
Page 40
Other Technology Solutions
Road Weather Information System (RWIS)
TDOT’s RWIS measures atmospheric, pavement, and/or water
level conditions. RWIS sensors provide data on real-time
conditions, including temperature, precipitation, humidity, wind,
and visibility, and can be especially helpful in portions of the I-
40/81 corridor where icing and poor visibility are frequent, i.e. at
higher elevations and near large waterbodies. TDOT’s Statewide
ITS Architecture, updated in 2019, identifies that the lack of a
robust and reliable RWIS means that maintenance crews must
be more proactive and very conservative in response to
potential weather-related events.17
Stakeholder input for this study also indicated the importance of
updating and enhancing RWIS infrastructure throughout the
corridor. Some of these improvements are taking place as part
of TDOT’s current Smartway expansion efforts. For example, the
planned expansion of the Smartway program in Region 2 across
the Cumberland Plateau from near MM 285 to SR 299 (Exit 338)
will include two RWIS sensors.
Considerations for RWIS Deployment • RWIS deployment throughout the interstate system is
desirable and should be incorporated in projects where
communications infrastructure already exists or is being
installed as part of roadway improvements.
• Priority should be given to areas where weather conditions
that significantly impact vehicle operation are most likely to
develop, including mountainous areas of Regions 1 and 2,
and near the Tennessee River at the Region 3/Region 4
boundary.
17 Final Tennessee Statewide Intelligent Transportation Systems Architecture, TDOT, August 2019, https://www.tn.gov/content/dam/tn/tdot/intelligent-
transportation-systems/rpt_tn_statewide_its_final_revised_20190806.pdf, accessed July 17, 2020.
Figure 21. TDOT weather sensor
Figure 22. Improved RWIS equipment can help TDOT better monitor winter weather events and improve traveler advisories about hazardous driving conditions. (THP)
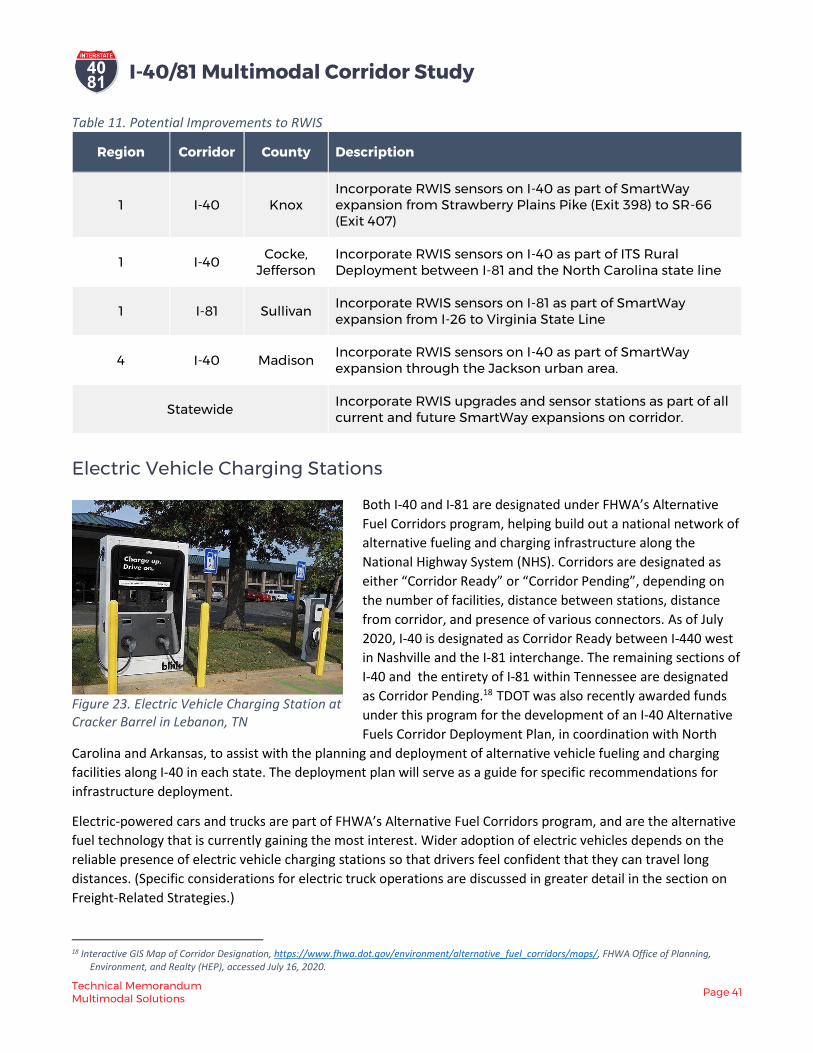
I-40/81 Multimodal Corridor Study
Technical Memorandum Multimodal Solutions
Page 41
Table 11. Potential Improvements to RWIS
Region Corridor County Description
1 I-40 Knox Incorporate RWIS sensors on I-40 as part of SmartWay expansion from Strawberry Plains Pike (Exit 398) to SR-66 (Exit 407)
1 I-40 Cocke,
Jefferson Incorporate RWIS sensors on I-40 as part of ITS Rural Deployment between I-81 and the North Carolina state line
1 I-81 Sullivan Incorporate RWIS sensors on I-81 as part of SmartWay expansion from I-26 to Virginia State Line
4 I-40 Madison Incorporate RWIS sensors on I-40 as part of SmartWay expansion through the Jackson urban area.
Statewide Incorporate RWIS upgrades and sensor stations as part of all current and future SmartWay expansions on corridor.
Electric Vehicle Charging Stations
Both I-40 and I-81 are designated under FHWA’s Alternative
Fuel Corridors program, helping build out a national network of
alternative fueling and charging infrastructure along the
National Highway System (NHS). Corridors are designated as
either “Corridor Ready” or “Corridor Pending”, depending on
the number of facilities, distance between stations, distance
from corridor, and presence of various connectors. As of July
2020, I-40 is designated as Corridor Ready between I-440 west
in Nashville and the I-81 interchange. The remaining sections of
I-40 and the entirety of I-81 within Tennessee are designated
as Corridor Pending.18 TDOT was also recently awarded funds
under this program for the development of an I-40 Alternative
Fuels Corridor Deployment Plan, in coordination with North
Carolina and Arkansas, to assist with the planning and deployment of alternative vehicle fueling and charging
facilities along I-40 in each state. The deployment plan will serve as a guide for specific recommendations for
infrastructure deployment.
Electric-powered cars and trucks are part of FHWA’s Alternative Fuel Corridors program, and are the alternative
fuel technology that is currently gaining the most interest. Wider adoption of electric vehicles depends on the
reliable presence of electric vehicle charging stations so that drivers feel confident that they can travel long
distances. (Specific considerations for electric truck operations are discussed in greater detail in the section on
Freight-Related Strategies.)
18 Interactive GIS Map of Corridor Designation, https://www.fhwa.dot.gov/environment/alternative_fuel_corridors/maps/, FHWA Office of Planning,
Environment, and Realty (HEP), accessed July 16, 2020.
Figure 23. Electric Vehicle Charging Station at Cracker Barrel in Lebanon, TN

I-40/81 Multimodal Corridor Study
Technical Memorandum Multimodal Solutions
Page 42
There are three primary speeds with which electric vehicle charging stations are developed: Level 1, which is
120-volt home wall outlets; Level 2, which is 240-volt chargers; and Level 3, which is DC Fast Chargers (DCFC).
Tennessee’s network of charging infrastructure includes more than 800 public charging locations, primarily
geared toward Level 2 charging. These are largely clustered in city centers, leaving large gaps in electric vehicle
charging infrastructure in rural areas.
Buildout of the entire corridor as Corridor Ready, based on FHWA guidelines, would require:
• Public DC Fast Charging Stations not greater than 50 miles apart.
• Stations no farther than five miles off the corridor.
• Each charging site should have both J1772 combo (CCS) and CHAdeMO connectors, since various vehicle
manufacturers equip their vehicles differently. Consideration should also be given to new connector
design standards being developed as part of innovations in electric vehicle design aimed at offering
faster charging for freight vehicles.19
Figure 24. Status of I-40/81 as an Alternative Fuel Corridor
A consortium of agencies and businesses, including TDOT and the Tennessee Department of Environment and
Conservation, have also partnered to create Drive Electric Tennessee (DET), a consortium whose mission is to
support adoption of 200,000 plug-in electric vehicles in the state by 2028.20 Since 2018, DET has embarked on
research regarding electric vehicles in Tennessee, including an Electric Vehicle Roadmap and a Statewide Electric
Vehicle Charging Needs Assessment. This work has determined that long stretches of highway corridors are the
best candidates for public investment, while urban areas with high amounts of traffic are more likely to attract
private investment. Public investment in charging infrastructure along the corridor may help reduce or eliminate
19 CharIN is publishing a solution for high power charging of trucks and busses beyond 1 MW, February 2019, https://www.charinev.org/news/news-
detail-2018/news/charin-is-publishing-a-solution-for-high-power-charging-of-tucks-and-busses-beyond-1-mw/, [sic] accessed September 9, 2020. 20 Drive Electric Tennessee (DET), https://www.tn.gov/environment/program-areas/energy/state-energy-office--seo-/programs-projects/programs-and-
projects/sustainable-transportation-and-alternative-fuels/sustainable-transportation-and-alternative-fuels/drive-electric-tennessee.html, accessed July 15, 2020.

I-40/81 Multimodal Corridor Study
Technical Memorandum Multimodal Solutions
Page 43
“range anxiety” and help ensure equity of access to electric vehicle infrastructure. Portions of I-40 and I-81 that
overlap with primary markets like Knoxville, Memphis, Nashville, and the Tri-Cities are likely the most
competitive candidates for private investment, with rural stretches of the corridor best suited for public
investment. DET research recommends that highway corridors be equipped with at least two chargers capable
of 50kW or more at least every 50 miles.
DET’s research also notes the importance of considering the capability of local power grids when installing
charging stations, particularly as the popularity of electric vehicles grows. DET’s roadmap includes tasks related
to smart charging and vehicle grid integration (VGI) applications that can help align electric vehicle charging with
the needs of the electric grid.
Considerations for Deployment of EV Infrastructure • Electric vehicles are becoming a larger portion of the overall traffic fleet and their proportion will likely
continue to increase. Bringing the I-40/81 corridor up to FHWA’s Corridor Ready standards is desirable.
Corridor Ready designation is achieved when public DC fast charging is no greater than 50 miles apart, no
greater than five miles from corridor, and each charging site is equipped with both CCS and CHAdeMO
connectors. • The capacity of local power grids to handle installation of charging stations may affect the timing and ability
to station installation. Aligning electric vehicle needs with those of local communities can ensure that the
electric grid is properly supplied.
• Research conducted to date has determined that long stretches of highway corridors are good candidates
for public investments, while urban areas with high amounts of traffic are more likely to attract private
investment.
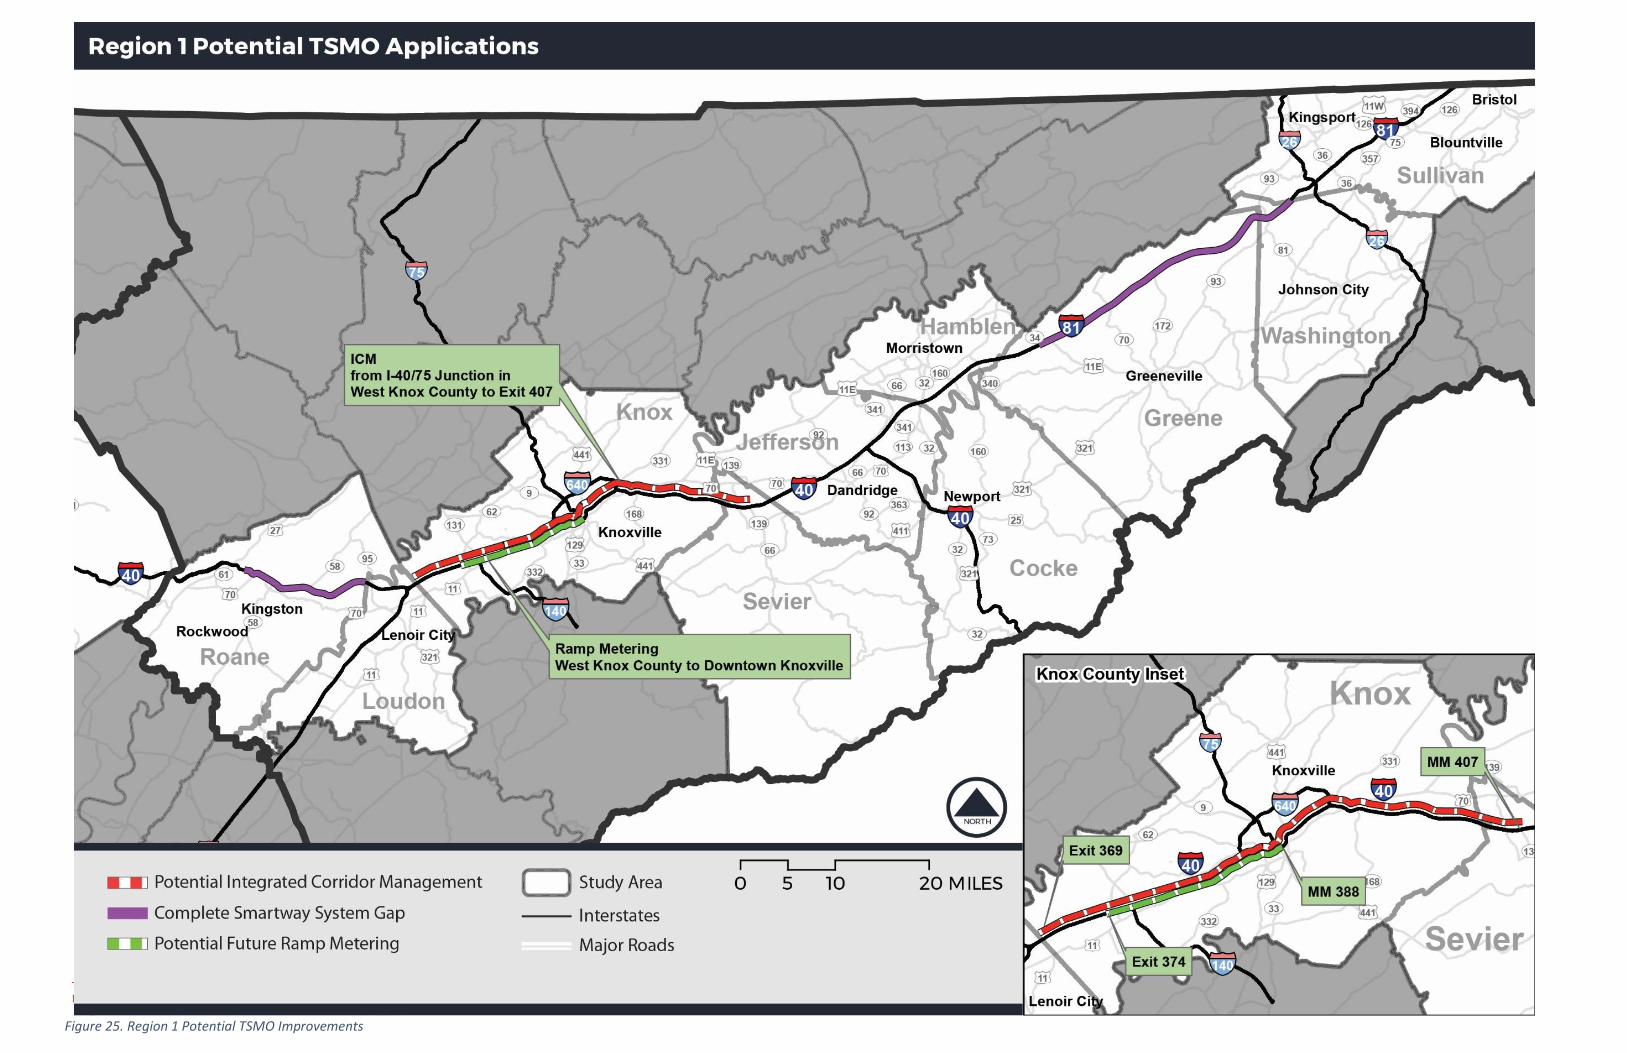
I-40/81 Multimodal Corridor Study
Technical Memorandum Multimodal Solutions
Page 44
Figure 25. Region 1 Potential TSMO Improvements

I-40/81 Multimodal Corridor Study
Technical Memorandum Multimodal Solutions
Page 45
Figure 26. Region 2 Potential TSMO Improvements
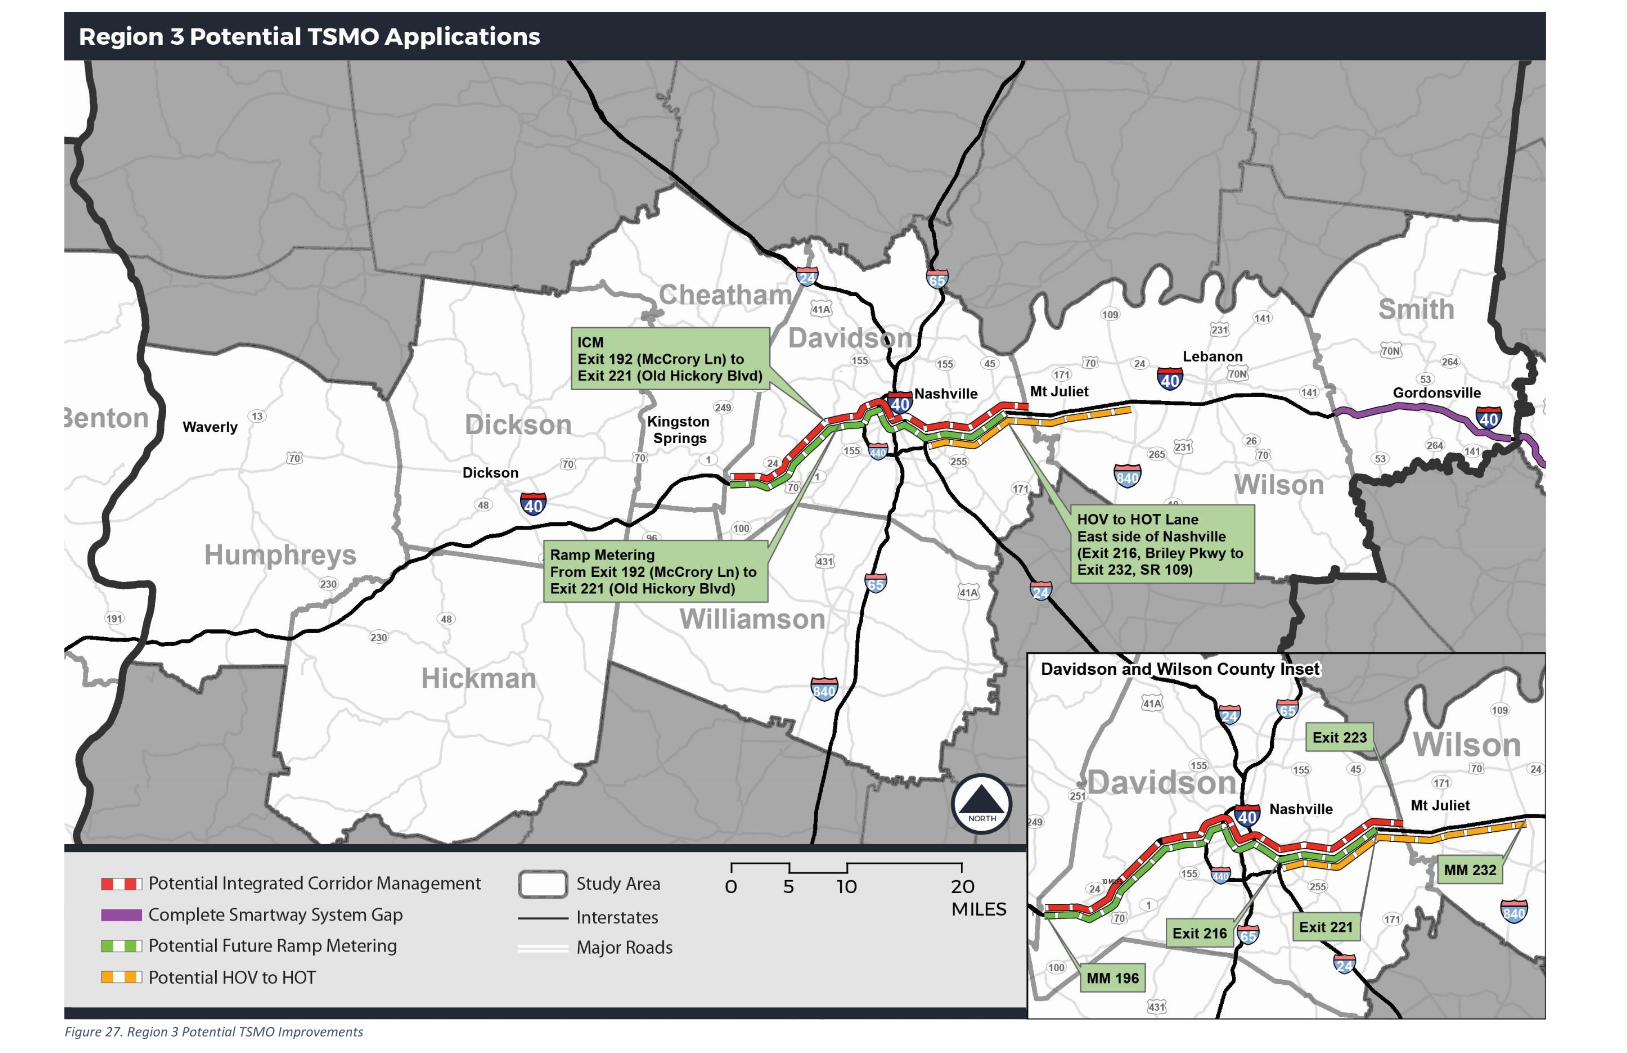
I-40/81 Multimodal Corridor Study
Technical Memorandum Multimodal Solutions
Page 46
Figure 27. Region 3 Potential TSMO Improvements
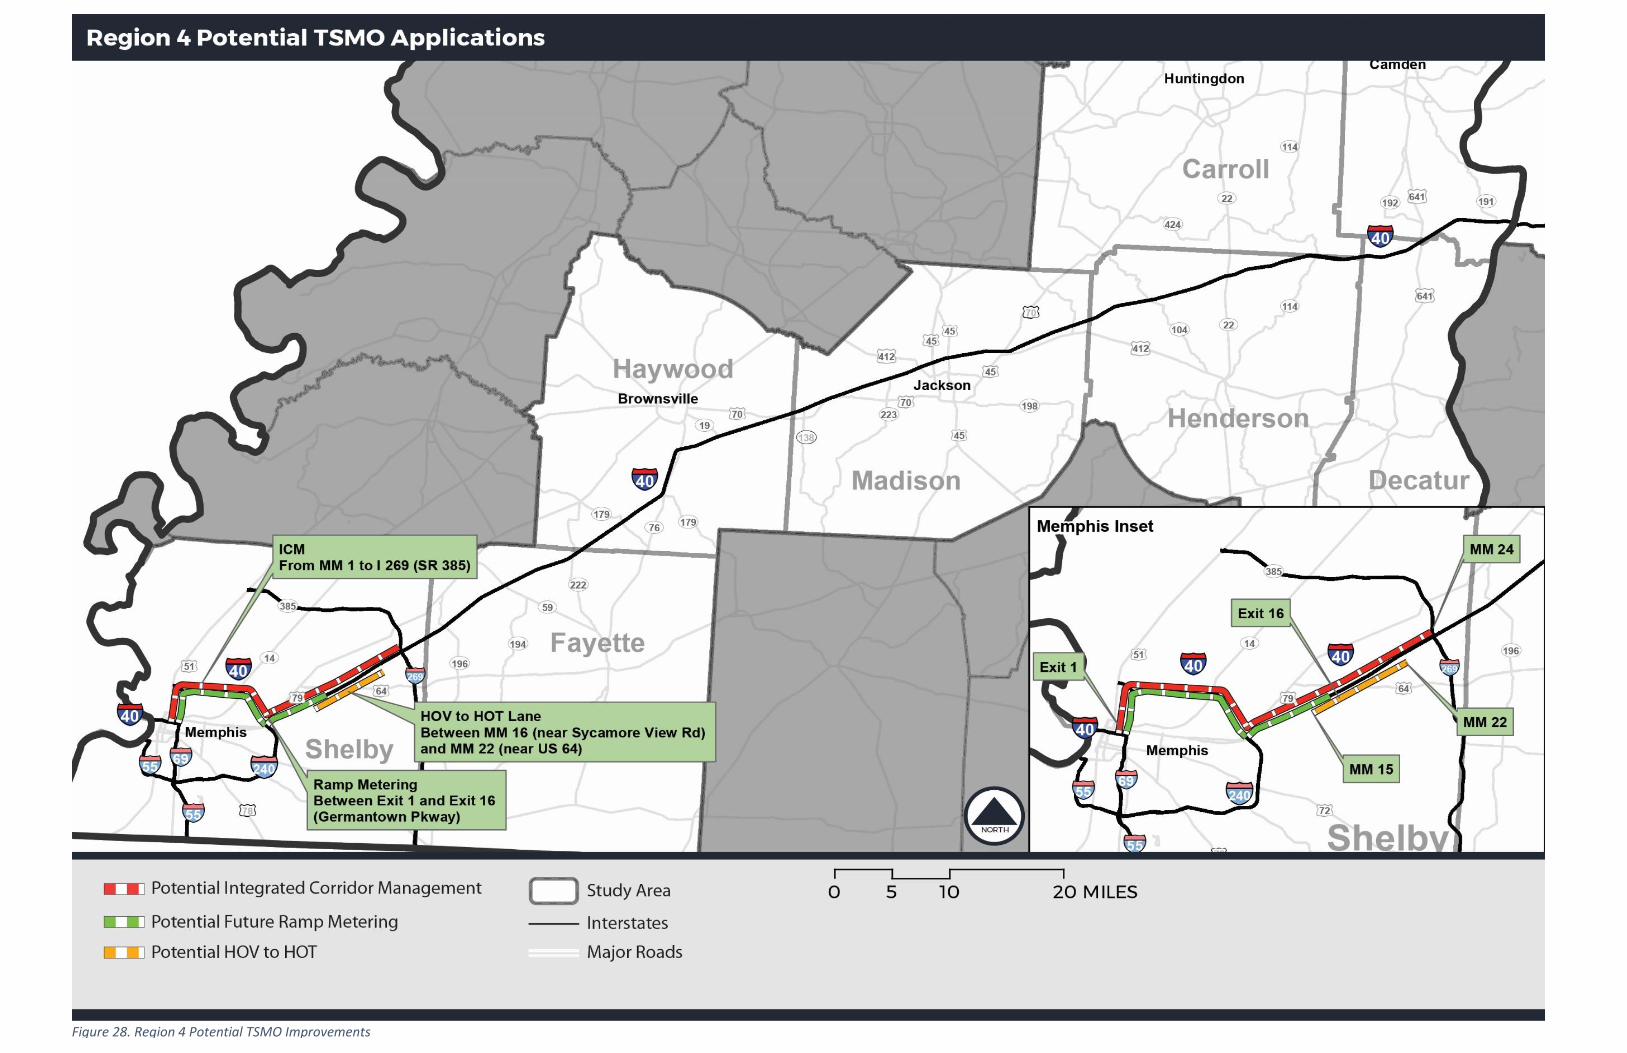
I-40/81 Multimodal Corridor Study
Technical Memorandum Multimodal Solutions
Page 47
Figure 28. Region 4 Potential TSMO Improvements

I-40/81 Multimodal Corridor Study
Technical Memorandum Multimodal Solutions
Page 48
4. Freight-Related Strategies
Truck Parking
Adequate and safe truck parking facilities are a
vital part of a safe and efficient freight
transportation system. Truck parking needs
consistently rank as a top industry issue by the
American Transportation Research Institute
(ATRI), and lack of parking results in drivers
parking in unauthorized or undesignated parking
locations, as well as losing productivity looking
for available parking.21 Providing sufficient truck
parking requires accommodating a diverse array
of truck trips, including long haul, regional, and
local travel. To help drivers comply with federal
safety regulations regarding the number of
consecutive hours they may drive without resting, and to respond to a general increase in truck traffic, the
public sector may need to support additional or expanded facilities and truck parking rest areas.
TDOT’s current Statewide Multimodal Freight Plan notes that commercial vehicles can be seen parking along
interstate entrance and exit ramps, an illegal practice which is difficult to enforce unless legal alternatives are
available and reasonably convenient. Identification of truck parking needs was a road related policy
recommendation in the Statewide Multimodal Freight Plan. One action TDOT has taken to address truck parking
needs is development of an inventory of public and private truck parking spaces along all interstate corridors in
Tennessee and portions of Alabama and Georgia, through a National Economic Partnership Grant awarded to
TDOT by FHWA in 2018.22 Products of this work include a Truck Parking Locator Map.
Recognizing additional truck parking research and investment as a potential need, TDOT is also actively
undertaking a geospatial analysis of statewide truck parking needs.23 The project will estimate truck parking
utilization and violations, develop a methodology for locating new truck rest areas, and identify potential new
rest area locations to support hours-of-service compliance and the overall efficiency of supply chains traveling
through the state. This research will help inform specific locations where additional truck parking may be
needed on both I-40 and I-81.
In anticipation of this work being completed, considerations for truck parking solutions in this report focus
primarily on needs identified through FHWA’s 2015 Jason’s Law Truck Parking Survey Results and Comparative
Analysis Report and other existing research.24 This report includes a comprehensive survey of state DOTs and
commercial motor carrier safety officials, customized questionnaires, and the development of a technical
working group to provide input on truck parking needs. The study found that Tennessee has one of the lowest
21 Critical Issues in the Trucking Industry, American Transportation Research Institute (ATRI), October 2019. 22 The final report for the NEP grant is available at https://www.tn.gov/tdot/transportation-freight-and-logistics-home/freight-planning.html
23 Strategic Freight Research Projects RES2019-16, Truck Parking Needs in Tennessee, Tennessee Department of Transportation (TDOT), https://www.tn.gov/tdot/transportation-freight-and-logistics-home/freight-planning/strategic-freight-research-projects.html. Final report not yet published as of December 2020.
24 Jason’s Law Truck Parking Survey Results and Comparative Analysis, Federal Highway Administration, August 2015, https://ops.fhwa.dot.gov/freight/infrastructure/truck_parking/jasons_law/truckparkingsurvey/index.htm, accessed July 15, 2020.
Figure 29. Trucks parked at the I-81 rest area in Greene County (Google Earth)

I-40/81 Multimodal Corridor Study
Technical Memorandum Multimodal Solutions
Page 49
rates of truck parking spaces (both public and private) per 100,000 miles of daily truck vehicle miles traveled
(VMT), implying that while truck parking supply may appear sufficient based on the miles of interstate and NHS
in Tennessee, it does not fully accommodate the amount of through-traffic traveling through the state.
Figure 30. Truck Parking Facilities
Considerations for New Truck Parking • Safety. Truck parking facilities should be well lit and include security monitoring, emergency phones, fire
extinguishers, and defibrillators.
• Amenities. Restrooms, showers, food options, and refueling capability are features often cited as the
most important to drivers. Some, but not all of these amenities are available to truck drivers at public
rest areas. 23 U.S.C. 111 limits the commercialization of rest areas on the Interstate highway system to
vending machines for the purpose of dispensing food, drink, or other articles the state determines are
appropriate and desirable. Dispensing petroleum products or motor vehicle replacement parts are not
allowed. A combination of public and private truck parking facilities should therefore be considered to
serve the corridor.
• Truck parking app usage and data-sharing. Truckers use a variety of smartphone apps to help find
available parking in real-time. Typically, these are crowd-sourced and have limited reliability, but they
are frequently used, nonetheless. Drivers can be better informed of availability at public parking areas if
public agencies install vehicle detection systems to monitor the availability of parking spaces, and share
that data with apps.
• Environmental impacts – Air quality and noise impacts of potential new truck parking facilities and idling
vehicles should be considered if located near residential neighborhoods.
• Electric charging stations. Electric truck operations are beginning to grow in popularity, although
typically reserved for regional or local operations given their operating range of 200 to 300 miles.
Electric trucks are attractive to many carriers because of their ease of driving and relatively low cost to
operate and maintain (i.e., no need for liquid fuel and less complex engines). As electric truck
technology progresses, the ability for parking facilities to accommodate electric trucks with charging
stations will be critical.
I-40/81 Multimodal Corridor Study
Technical Memorandum Multimodal Solutions
Page 50
Electric Truck Charging Stations
As the technology around electric vehicles progresses, the ability of truck parking facilities to accommodate
electric trucks with charging stations will be critical to supporting the adoption of electric vehicles in support of
I-40 and I-81’s Alternative Fuels Corridor designation. To date, electric truck operations are typically restricted to
regional and local operations given their operating range of 200 to 300 miles. Long-haul operations are on the
horizon, but today these operations cannot rely on existing electric vehicle charging infrastructure to meet their
demands for frequent stations with fast charging speeds along long highway corridors.
Regional and local freight operations do, however, use the I-40/81 corridor to move goods daily, requiring
consideration of how these operations may be encouraged to adopt electric vehicle technology. The North
American Council for Freight Efficiency (NACFE) recently released a report entitled Amping Up: Charging
Infrastructure for Electric Trucks.25 The report highlighted several key considerations for electric truck charging
infrastructure that should be considered for their benefits to freight operations along the I-40/81 corridor:
• Charging station connections – Presently, connectors are not standardized at plug-in charging stations,
with a number of connector types competing globally (SAE J1772, CCS, CHAdeMO, Tesla, etc.). Stations
may need to be developed with several connector types to ensure compatibility. It will also be
important to monitor the state of the practice and consider any new connector design standards being
developed.
• Charging speeds – As discussed previously, electric vehicle charging stations are being developed at
three different speeds. Level 3, which are DC Fast Chargers (DCFC), would be recommended for large
trucks and those with shorter breaks, traveling longer distances. Currently, DCFC stations can cost
between $15,000 and $90,000.26
• Charging locations – Electric trucks have a typical range of 200 to 300 miles. Most commercial electric
trucks currently charge at private stations at a central headquarters, warehouse, or distribution center.
Fleets may consider using the public charging network to extend their range, but the cost of using public
chargers and uncertainty of availability creates issues. Build out of the entire corridor as “Corridor
Ready” per FHWA Alternative Fuel Corridors guidelines may help encourage fleets to use publicly
available charging stations. By doing so, regional freight operations can double their range, charging
near their destination before they head back to their home base.
Alternative Truck Routing
Detours from I-40/81 onto parallel arterial roadways may affect freight operations through unfavorable
horizontal geometry, steep or long vertical grades, insufficient lane or shoulder widths, or signal plans that
induce additional acceleration/deceleration cycles. Diversion of trucks onto these routes as an incident
management strategy, at the proportions of truck traffic found on Interstates 40/81, may result in degraded
safety and operational performance at critical times. Some of the improvements identified for I-40/81 detour
routes (Table 17) are intended to help the route better accommodate higher truck volumes during interstate
traffic diversions.
25 Amping Up – Charging Infrastructure for Electric Trucks, North American Council for Freight Efficiency, https://nacfe.org/report-library/guidance-
reports/, accessed July 16, 2020. 26 Ibid.
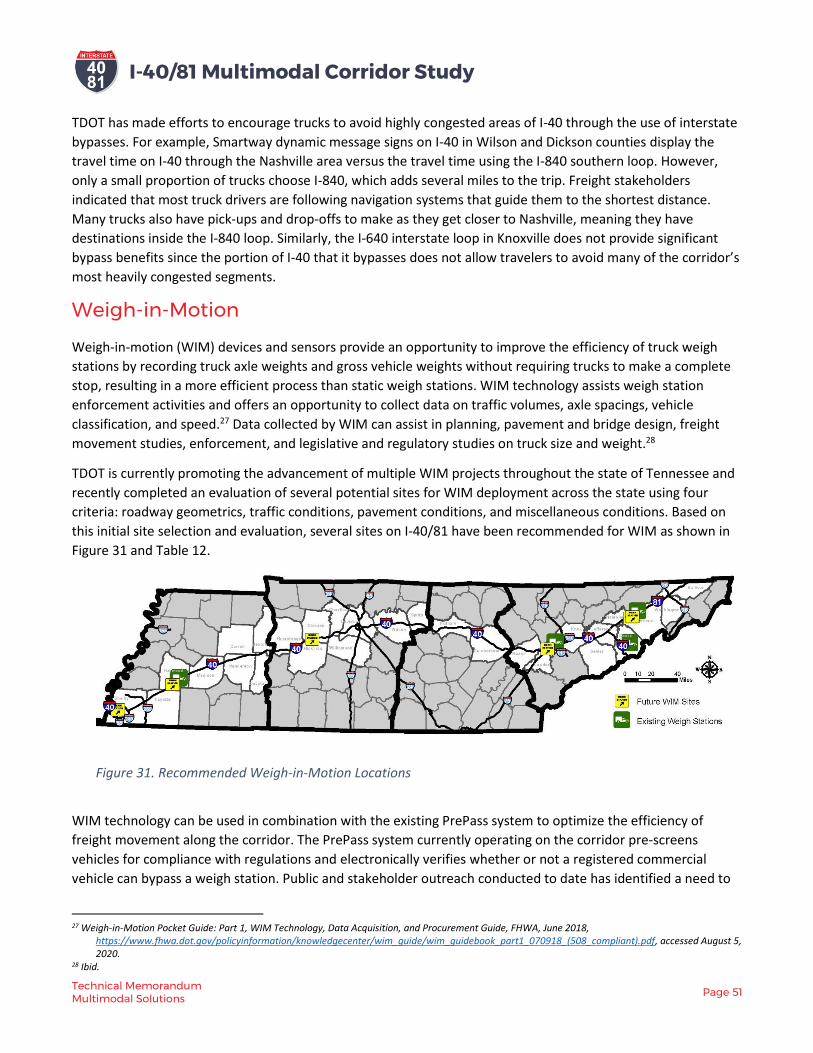
I-40/81 Multimodal Corridor Study
Technical Memorandum Multimodal Solutions
Page 51
TDOT has made efforts to encourage trucks to avoid highly congested areas of I-40 through the use of interstate
bypasses. For example, Smartway dynamic message signs on I-40 in Wilson and Dickson counties display the
travel time on I-40 through the Nashville area versus the travel time using the I-840 southern loop. However,
only a small proportion of trucks choose I-840, which adds several miles to the trip. Freight stakeholders
indicated that most truck drivers are following navigation systems that guide them to the shortest distance.
Many trucks also have pick-ups and drop-offs to make as they get closer to Nashville, meaning they have
destinations inside the I-840 loop. Similarly, the I-640 interstate loop in Knoxville does not provide significant
bypass benefits since the portion of I-40 that it bypasses does not allow travelers to avoid many of the corridor’s
most heavily congested segments.
Weigh-in-Motion
Weigh-in-motion (WIM) devices and sensors provide an opportunity to improve the efficiency of truck weigh
stations by recording truck axle weights and gross vehicle weights without requiring trucks to make a complete
stop, resulting in a more efficient process than static weigh stations. WIM technology assists weigh station
enforcement activities and offers an opportunity to collect data on traffic volumes, axle spacings, vehicle
classification, and speed.27 Data collected by WIM can assist in planning, pavement and bridge design, freight
movement studies, enforcement, and legislative and regulatory studies on truck size and weight.28
TDOT is currently promoting the advancement of multiple WIM projects throughout the state of Tennessee and
recently completed an evaluation of several potential sites for WIM deployment across the state using four
criteria: roadway geometrics, traffic conditions, pavement conditions, and miscellaneous conditions. Based on
this initial site selection and evaluation, several sites on I-40/81 have been recommended for WIM as shown in
Figure 31 and Table 12.
Figure 31. Recommended Weigh-in-Motion Locations
WIM technology can be used in combination with the existing PrePass system to optimize the efficiency of
freight movement along the corridor. The PrePass system currently operating on the corridor pre-screens
vehicles for compliance with regulations and electronically verifies whether or not a registered commercial
vehicle can bypass a weigh station. Public and stakeholder outreach conducted to date has identified a need to
27 Weigh-in-Motion Pocket Guide: Part 1, WIM Technology, Data Acquisition, and Procurement Guide, FHWA, June 2018,
https://www.fhwa.dot.gov/policyinformation/knowledgecenter/wim_guide/wim_guidebook_part1_070918_(508_compliant).pdf, accessed August 5, 2020.
28 Ibid.

I-40/81 Multimodal Corridor Study
Technical Memorandum Multimodal Solutions
Page 52
reconsider the location of PrePass sensors at weigh stations to minimize queuing of registered vehicles.
Presently, PrePass sensors in Knox County often do not identify PrePass-registered vehicles for permission to
bypass until they are already queued with non-registered vehicles.
Table 12. Future Improvements to Weigh-In-Motion Technology
Region County Corridor Termini
1 Greene I-81 MM 20.9 northbound and MM 22.4 southbound
1 Knox I-40 MM 369.8 eastbound and MM 372.2 westbound in the outside two lanes
3 Dickson I-40 MM 168.1 eastbound and MM 168.0 westbound
4 Haywood I-40 MM 51 westbound and MM 48.2 eastbound
4 Shelby I-40 MM 1.8 eastbound and westbound
Multimodal Freight Solutions The I-40/81 corridor serves several key supply chains and has a number of identified freight bottlenecks that
impede efficient freight movement. TDOT’s current Statewide Multimodal Freight Plan anticipates a significant
growth in commodities moving through Tennessee by 2040, placing a higher demand on all modes of freight
transportation. Incorporating multimodal freight solutions that enhance the capacity of east-west freight
movement throughout Tennessee can help improve the reliability and safety of freight traveling through the I-
40/81 corridor.
Diverting truck freight from roadways to other modes, particularly rail, has been widely discussed for its potential to alleviate congestion on roadways, reduce costs for shippers, and reduce roadway maintenance needs. Investments made in Norfolk Southern’s (NS) Crescent Corridor over the last several years are one example of rail investments that have the potential to encourage truck to rail diversion, and is discussed in detail in the Existing and Future Conditions Technical Memorandum.
Beyond continued investments in and promotion of the Crescent Corridor, multimodal freight research efforts
and rail investments serving the corridor have been identified through the Statewide Multimodal Freight Plan,
State Rail Plan, and various regional studies. The Statewide Multimodal Freight Plan includes a comprehensive
set of project lists that describe needed freight projects across the state. Those relevant to multimodal freight
movement on the I-40/81 corridor include intermodal facility improvements, additional rail spurs, at-grade
crossing improvements, and capacity improvements, and are listed in Table 13.
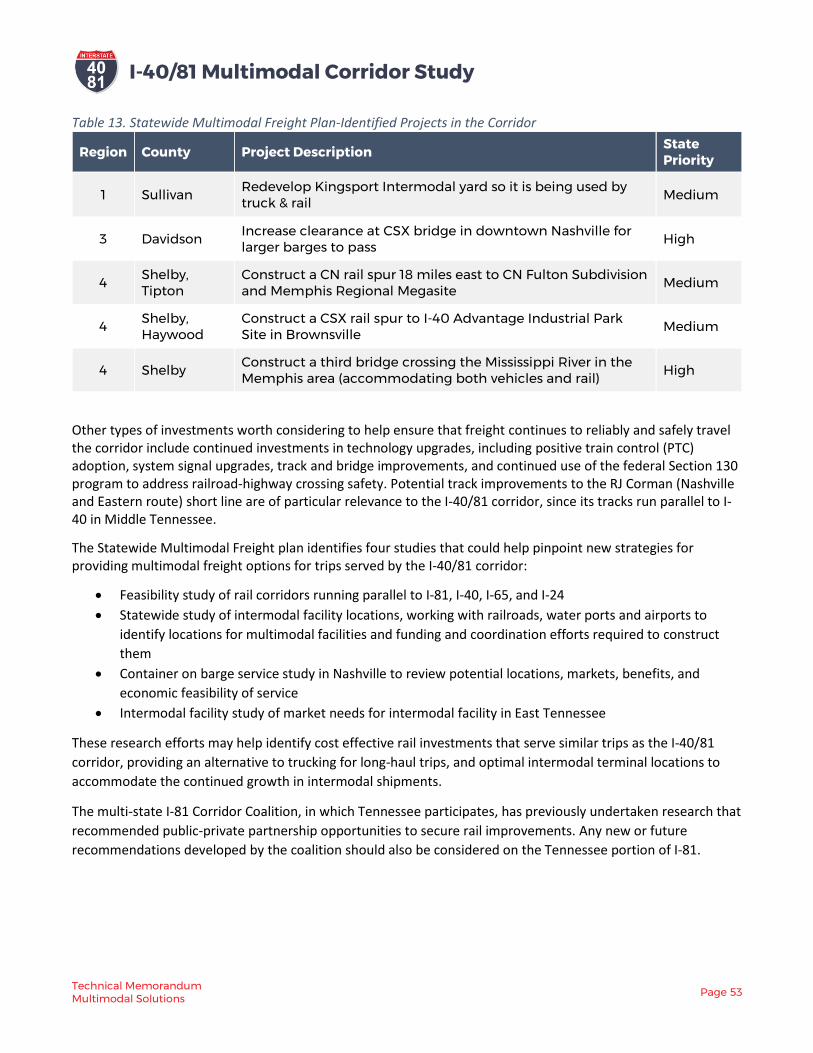
I-40/81 Multimodal Corridor Study
Technical Memorandum Multimodal Solutions
Page 53
Table 13. Statewide Multimodal Freight Plan-Identified Projects in the Corridor
Region County Project Description State Priority
1 Sullivan Redevelop Kingsport Intermodal yard so it is being used by truck & rail
Medium
3 Davidson Increase clearance at CSX bridge in downtown Nashville for larger barges to pass
High
4 Shelby, Tipton
Construct a CN rail spur 18 miles east to CN Fulton Subdivision and Memphis Regional Megasite
Medium
4 Shelby, Haywood
Construct a CSX rail spur to I-40 Advantage Industrial Park Site in Brownsville
Medium
4 Shelby Construct a third bridge crossing the Mississippi River in the Memphis area (accommodating both vehicles and rail)
High
Other types of investments worth considering to help ensure that freight continues to reliably and safely travel the corridor include continued investments in technology upgrades, including positive train control (PTC) adoption, system signal upgrades, track and bridge improvements, and continued use of the federal Section 130 program to address railroad-highway crossing safety. Potential track improvements to the RJ Corman (Nashville and Eastern route) short line are of particular relevance to the I-40/81 corridor, since its tracks run parallel to I-40 in Middle Tennessee.
The Statewide Multimodal Freight plan identifies four studies that could help pinpoint new strategies for providing multimodal freight options for trips served by the I-40/81 corridor:
• Feasibility study of rail corridors running parallel to I-81, I-40, I-65, and I-24
• Statewide study of intermodal facility locations, working with railroads, water ports and airports to
identify locations for multimodal facilities and funding and coordination efforts required to construct
them
• Container on barge service study in Nashville to review potential locations, markets, benefits, and
economic feasibility of service
• Intermodal facility study of market needs for intermodal facility in East Tennessee
These research efforts may help identify cost effective rail investments that serve similar trips as the I-40/81
corridor, providing an alternative to trucking for long-haul trips, and optimal intermodal terminal locations to
accommodate the continued growth in intermodal shipments.
The multi-state I-81 Corridor Coalition, in which Tennessee participates, has previously undertaken research that
recommended public-private partnership opportunities to secure rail improvements. Any new or future
recommendations developed by the coalition should also be considered on the Tennessee portion of I-81.
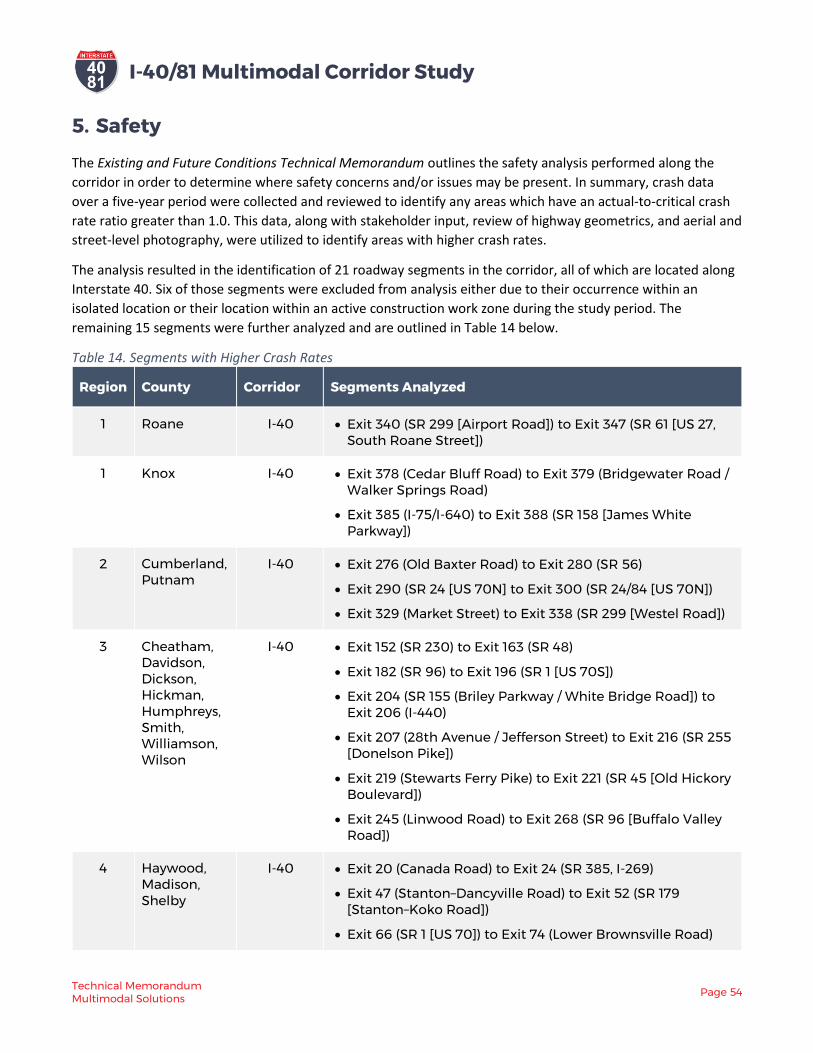
I-40/81 Multimodal Corridor Study
Technical Memorandum Multimodal Solutions
Page 54
5. Safety
The Existing and Future Conditions Technical Memorandum outlines the safety analysis performed along the
corridor in order to determine where safety concerns and/or issues may be present. In summary, crash data
over a five-year period were collected and reviewed to identify any areas which have an actual-to-critical crash
rate ratio greater than 1.0. This data, along with stakeholder input, review of highway geometrics, and aerial and
street-level photography, were utilized to identify areas with higher crash rates.
The analysis resulted in the identification of 21 roadway segments in the corridor, all of which are located along
Interstate 40. Six of those segments were excluded from analysis either due to their occurrence within an
isolated location or their location within an active construction work zone during the study period. The
remaining 15 segments were further analyzed and are outlined in Table 14 below.
Table 14. Segments with Higher Crash Rates
Region County Corridor Segments Analyzed
1 Roane I-40 • Exit 340 (SR 299 [Airport Road]) to Exit 347 (SR 61 [US 27, South Roane Street])
1 Knox I-40 • Exit 378 (Cedar Bluff Road) to Exit 379 (Bridgewater Road / Walker Springs Road)
• Exit 385 (I-75/I-640) to Exit 388 (SR 158 [James White Parkway])
2 Cumberland, Putnam
I-40 • Exit 276 (Old Baxter Road) to Exit 280 (SR 56)
• Exit 290 (SR 24 [US 70N] to Exit 300 (SR 24/84 [US 70N])
• Exit 329 (Market Street) to Exit 338 (SR 299 [Westel Road])
3 Cheatham, Davidson, Dickson, Hickman, Humphreys, Smith, Williamson, Wilson
I-40 • Exit 152 (SR 230) to Exit 163 (SR 48)
• Exit 182 (SR 96) to Exit 196 (SR 1 [US 70S])
• Exit 204 (SR 155 (Briley Parkway / White Bridge Road]) to Exit 206 (I-440)
• Exit 207 (28th Avenue / Jefferson Street) to Exit 216 (SR 255 [Donelson Pike])
• Exit 219 (Stewarts Ferry Pike) to Exit 221 (SR 45 [Old Hickory Boulevard])
• Exit 245 (Linwood Road) to Exit 268 (SR 96 [Buffalo Valley Road])
4 Haywood, Madison, Shelby
I-40 • Exit 20 (Canada Road) to Exit 24 (SR 385, I-269)
• Exit 47 (Stanton–Dancyville Road) to Exit 52 (SR 179 [Stanton–Koko Road])
• Exit 66 (SR 1 [US 70]) to Exit 74 (Lower Brownsville Road)
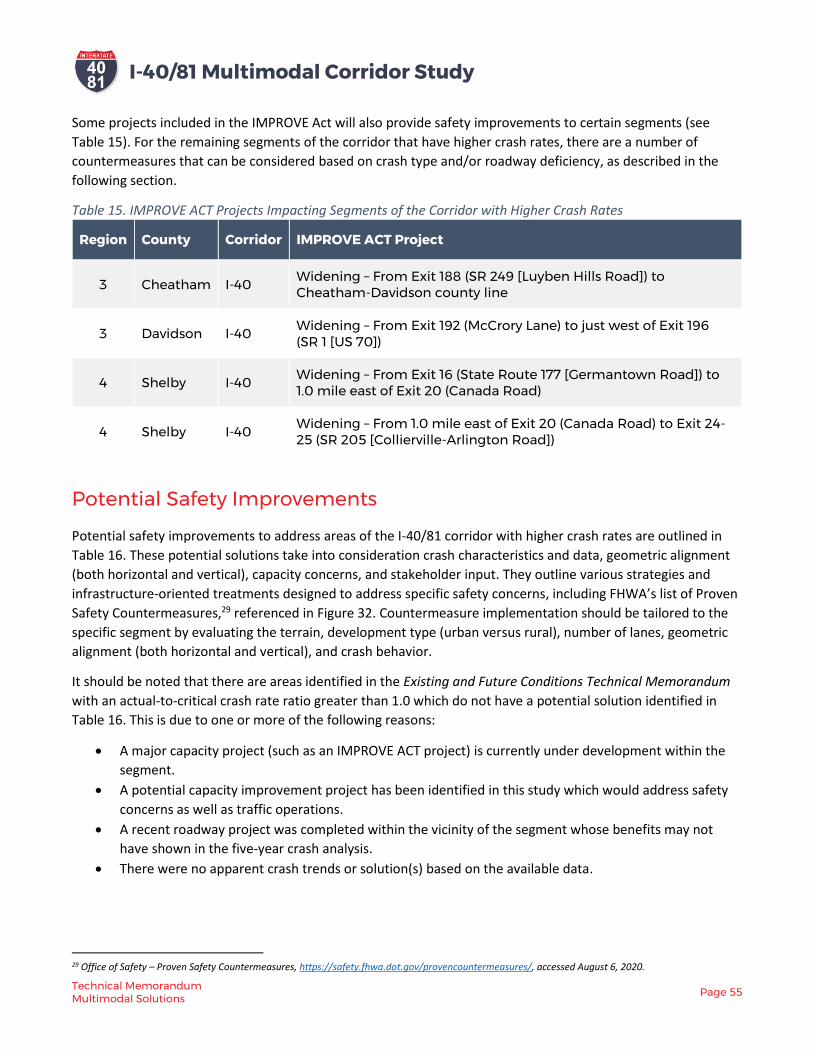
I-40/81 Multimodal Corridor Study
Technical Memorandum Multimodal Solutions
Page 55
Some projects included in the IMPROVE Act will also provide safety improvements to certain segments (see
Table 15). For the remaining segments of the corridor that have higher crash rates, there are a number of
countermeasures that can be considered based on crash type and/or roadway deficiency, as described in the
following section.
Table 15. IMPROVE ACT Projects Impacting Segments of the Corridor with Higher Crash Rates
Region County Corridor IMPROVE ACT Project
3 Cheatham I-40 Widening – From Exit 188 (SR 249 [Luyben Hills Road]) to Cheatham-Davidson county line
3 Davidson I-40 Widening – From Exit 192 (McCrory Lane) to just west of Exit 196 (SR 1 [US 70])
4 Shelby I-40 Widening – From Exit 16 (State Route 177 [Germantown Road]) to 1.0 mile east of Exit 20 (Canada Road)
4 Shelby I-40 Widening – From 1.0 mile east of Exit 20 (Canada Road) to Exit 24-25 (SR 205 [Collierville-Arlington Road])
Potential Safety Improvements
Potential safety improvements to address areas of the I-40/81 corridor with higher crash rates are outlined in
Table 16. These potential solutions take into consideration crash characteristics and data, geometric alignment
(both horizontal and vertical), capacity concerns, and stakeholder input. They outline various strategies and
infrastructure-oriented treatments designed to address specific safety concerns, including FHWA’s list of Proven
Safety Countermeasures,29 referenced in Figure 32. Countermeasure implementation should be tailored to the
specific segment by evaluating the terrain, development type (urban versus rural), number of lanes, geometric
alignment (both horizontal and vertical), and crash behavior.
It should be noted that there are areas identified in the Existing and Future Conditions Technical Memorandum
with an actual-to-critical crash rate ratio greater than 1.0 which do not have a potential solution identified in
Table 16. This is due to one or more of the following reasons:
• A major capacity project (such as an IMPROVE ACT project) is currently under development within the
segment.
• A potential capacity improvement project has been identified in this study which would address safety
concerns as well as traffic operations.
• A recent roadway project was completed within the vicinity of the segment whose benefits may not
have shown in the five-year crash analysis.
• There were no apparent crash trends or solution(s) based on the available data.
29 Office of Safety – Proven Safety Countermeasures, https://safety.fhwa.dot.gov/provencountermeasures/, accessed August 6, 2020.

I-40/81 Multimodal Corridor Study
Technical Memorandum Multimodal Solutions
Page 56
Table 16. Potential Corridor Safety Improvements
Region County Corridor Termini Potential Solution
1 Cocke I-40 Exit 447 (Hartford Road) Interchange Improvements to lengthen deceleration/acceleration lanes
1 Cocke I-40 Exit 443 (SR 339 [Foothills Parkway]) to Exit 451
Realign interstate in order to remove 45 MPH horizontal curves
2 Putnam I-40 Exit 276 (Old Baxter Road) to Exit 280 (SR 56)
Infrastructure-oriented safety treatments (see Figure 32)
2 Cumberland I-40 Exit 317 (SR 28 [US 127]) to Exit 322 (SR 101 [Peavine Road])
Addition of median cable barrier system
2 Cumberland I-40 Exit 329 (Market Street) to Exit 338 (SR 299 [Westel Road])
Infrastructure-oriented safety treatments (see Figure 32)
3 Davidson I-40 Exit 196 (SR 1 [US 70S]) Westbound Off-Ramp
Ramp improvements to WB off-ramp – add deceleration lane and widen ramp
3 Davidson I-40 Exit 204 (SR 155 [Briley Parkway / White Bridge Road]) to Exit 206 (I-440)
Infrastructure-oriented safety treatments (see Figure 32)

I-40/81 Multimodal Corridor Study
Technical Memorandum Multimodal Solutions
Page 57
Figure 32. FHWA Proven Safety Countermeasures
Detour Routes
In addition to reviewing and analyzing potential safety concerns along the I-40/81 corridor, potential safety
improvements have also been identified along state and local routes identified as detour routes by the
Interstate Incident Management Plans for each of the four TDOT regions.30 Although the detours may not be
frequently used, they experience very high volumes of traffic – including heavy trucks – when an interstate
diversion is in place. Potential safety improvements for I-40/81 detour routes (Table 17) were developed
through consideration of existing local and regional plans, stakeholder input, and geometrics. Potential safety
improvements to I-40/81 detour routes are shown in Figure 34 through 37.
30 Existing and Future Conditions Memorandum, https://www.tn.gov/content/dam/tn/tdot/long-range-planning/studies/i-40-81-study/I-40-81-
ExistingFutureConditionsReport-Final.pdf, p. 27
Ro
adw
ay D
ep
artu
re •Enhanced delineation and friction for horizontal curves
•Longitudinal rumble strips and stripes
•SafetyEdge
•Roadside design improvements at curves
•Median barriers
Inte
rse
ctio
ns •Backplates with
retroreflective borders
•Corridor access management
•Left-and right-turn lanes at two-way stop-controlled intersections
•Reduced left-turn conflict intersections
•Roundabouts
•Systemic application of multiple low-cost countermeasures at stop-controlled intersections
•Yellow change intervalsP
ed
est
rian
s/B
icyc
les •Leading
pedestrian intervals
•Medians and pedestrian crossing islands in urban and suburban areas
•Pedestrian hybrid beacons
•Road diets/ reconfigurations
•Walkways
Cro
sscu
ttin
g •Local road safety plans
•Road safety audits
•USLIMITS2 (tool used to help set appropriate speed limits)
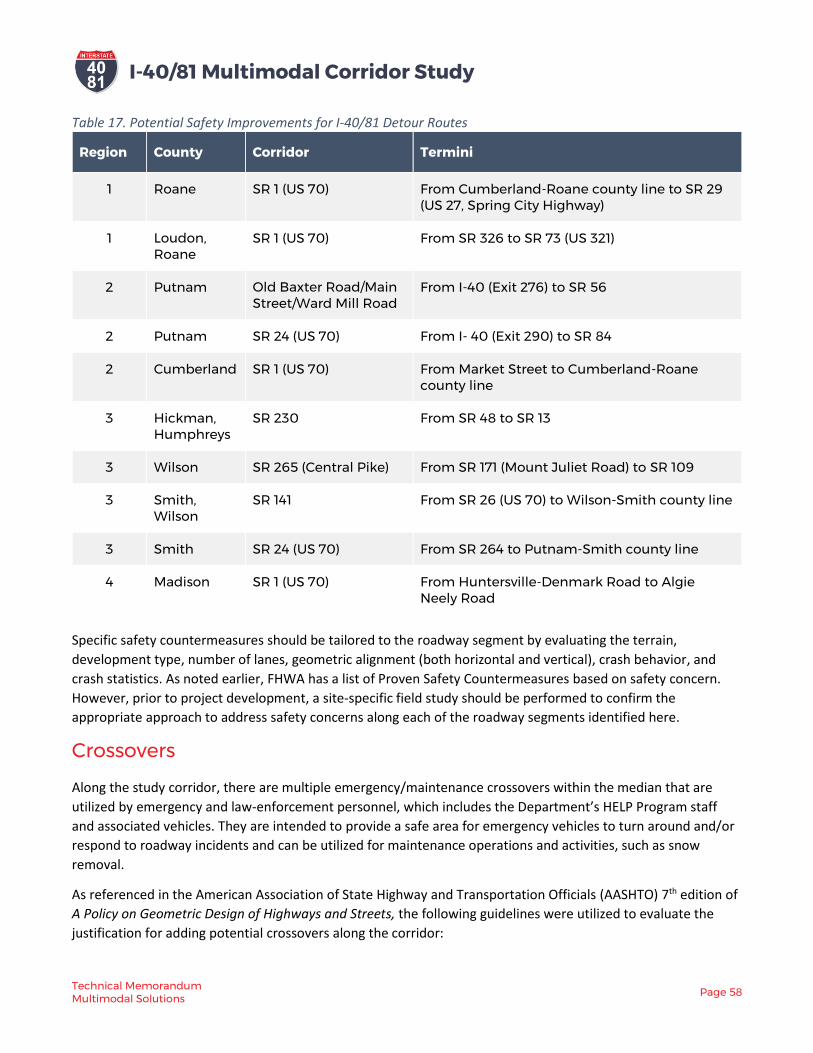
I-40/81 Multimodal Corridor Study
Technical Memorandum Multimodal Solutions
Page 58
Table 17. Potential Safety Improvements for I-40/81 Detour Routes
Region County Corridor Termini
1 Roane SR 1 (US 70) From Cumberland-Roane county line to SR 29 (US 27, Spring City Highway)
1 Loudon, Roane
SR 1 (US 70) From SR 326 to SR 73 (US 321)
2 Putnam Old Baxter Road/Main Street/Ward Mill Road
From I-40 (Exit 276) to SR 56
2 Putnam SR 24 (US 70) From I- 40 (Exit 290) to SR 84
2 Cumberland SR 1 (US 70) From Market Street to Cumberland-Roane county line
3 Hickman, Humphreys
SR 230 From SR 48 to SR 13
3 Wilson SR 265 (Central Pike) From SR 171 (Mount Juliet Road) to SR 109
3 Smith, Wilson
SR 141 From SR 26 (US 70) to Wilson-Smith county line
3 Smith SR 24 (US 70) From SR 264 to Putnam-Smith county line
4 Madison SR 1 (US 70) From Huntersville-Denmark Road to Algie Neely Road
Specific safety countermeasures should be tailored to the roadway segment by evaluating the terrain,
development type, number of lanes, geometric alignment (both horizontal and vertical), crash behavior, and
crash statistics. As noted earlier, FHWA has a list of Proven Safety Countermeasures based on safety concern.
However, prior to project development, a site-specific field study should be performed to confirm the
appropriate approach to address safety concerns along each of the roadway segments identified here.
Crossovers
Along the study corridor, there are multiple emergency/maintenance crossovers within the median that are
utilized by emergency and law-enforcement personnel, which includes the Department’s HELP Program staff
and associated vehicles. They are intended to provide a safe area for emergency vehicles to turn around and/or
respond to roadway incidents and can be utilized for maintenance operations and activities, such as snow
removal.
As referenced in the American Association of State Highway and Transportation Officials (AASHTO) 7th edition of
A Policy on Geometric Design of Highways and Streets, the following guidelines were utilized to evaluate the
justification for adding potential crossovers along the corridor:
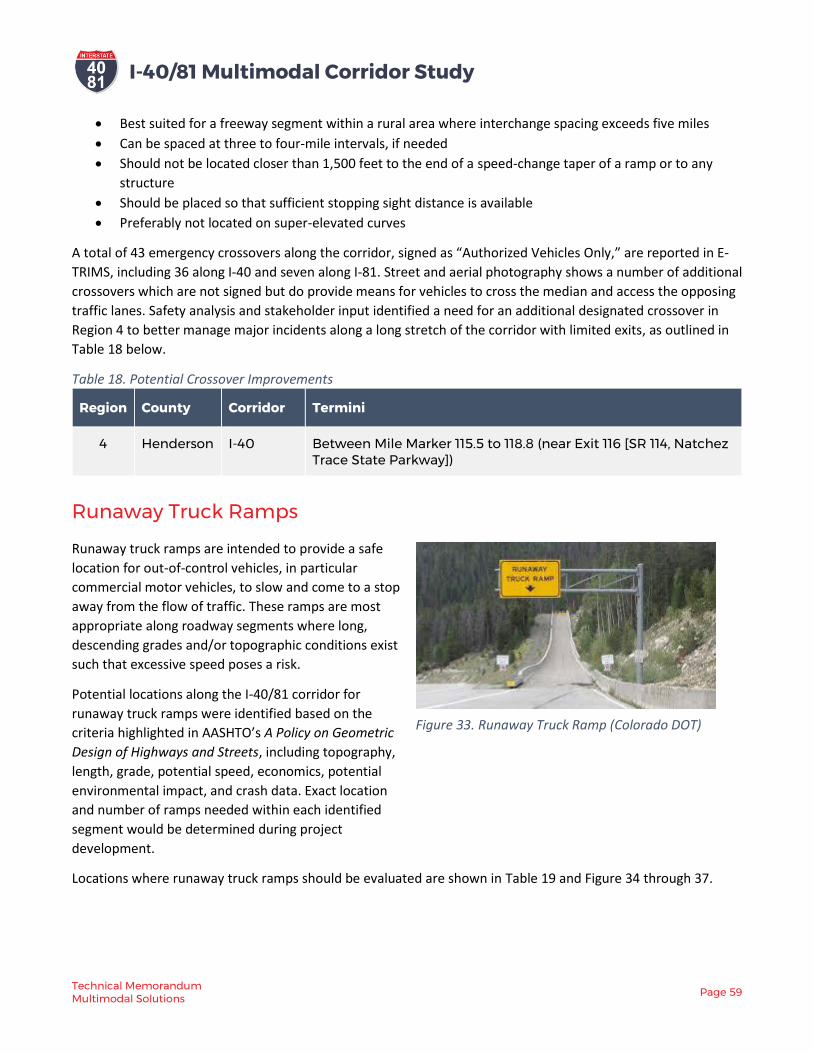
I-40/81 Multimodal Corridor Study
Technical Memorandum Multimodal Solutions
Page 59
• Best suited for a freeway segment within a rural area where interchange spacing exceeds five miles
• Can be spaced at three to four-mile intervals, if needed
• Should not be located closer than 1,500 feet to the end of a speed-change taper of a ramp or to any
structure
• Should be placed so that sufficient stopping sight distance is available
• Preferably not located on super-elevated curves
A total of 43 emergency crossovers along the corridor, signed as “Authorized Vehicles Only,” are reported in E-
TRIMS, including 36 along I-40 and seven along I-81. Street and aerial photography shows a number of additional
crossovers which are not signed but do provide means for vehicles to cross the median and access the opposing
traffic lanes. Safety analysis and stakeholder input identified a need for an additional designated crossover in
Region 4 to better manage major incidents along a long stretch of the corridor with limited exits, as outlined in
Table 18 below.
Table 18. Potential Crossover Improvements
Region County Corridor Termini
4 Henderson I-40 Between Mile Marker 115.5 to 118.8 (near Exit 116 [SR 114, Natchez Trace State Parkway])
Runaway Truck Ramps
Runaway truck ramps are intended to provide a safe
location for out-of-control vehicles, in particular
commercial motor vehicles, to slow and come to a stop
away from the flow of traffic. These ramps are most
appropriate along roadway segments where long,
descending grades and/or topographic conditions exist
such that excessive speed poses a risk.
Potential locations along the I-40/81 corridor for
runaway truck ramps were identified based on the
criteria highlighted in AASHTO’s A Policy on Geometric
Design of Highways and Streets, including topography,
length, grade, potential speed, economics, potential
environmental impact, and crash data. Exact location
and number of ramps needed within each identified
segment would be determined during project
development.
Locations where runaway truck ramps should be evaluated are shown in Table 19 and Figure 34 through 37.
Figure 33. Runaway Truck Ramp (Colorado DOT)
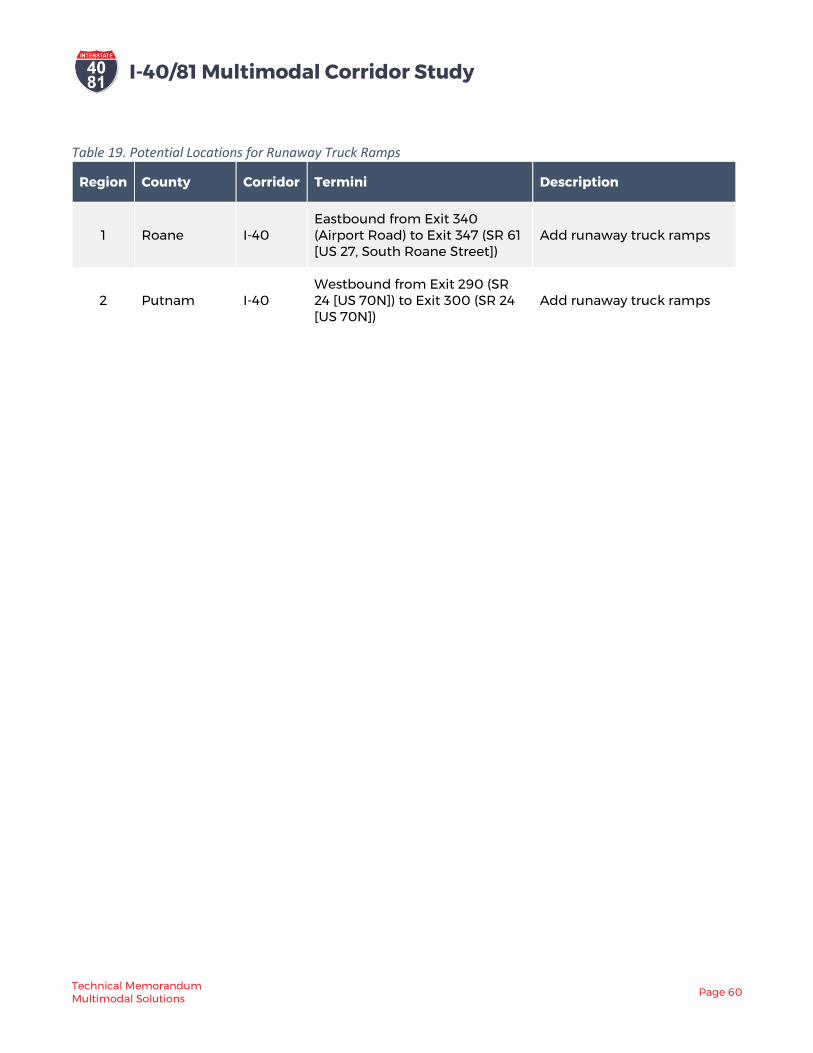
I-40/81 Multimodal Corridor Study
Technical Memorandum Multimodal Solutions
Page 60
Table 19. Potential Locations for Runaway Truck Ramps
Region County Corridor Termini Description
1 Roane I-40 Eastbound from Exit 340 (Airport Road) to Exit 347 (SR 61 [US 27, South Roane Street])
Add runaway truck ramps
2 Putnam I-40 Westbound from Exit 290 (SR 24 [US 70N]) to Exit 300 (SR 24 [US 70N])
Add runaway truck ramps
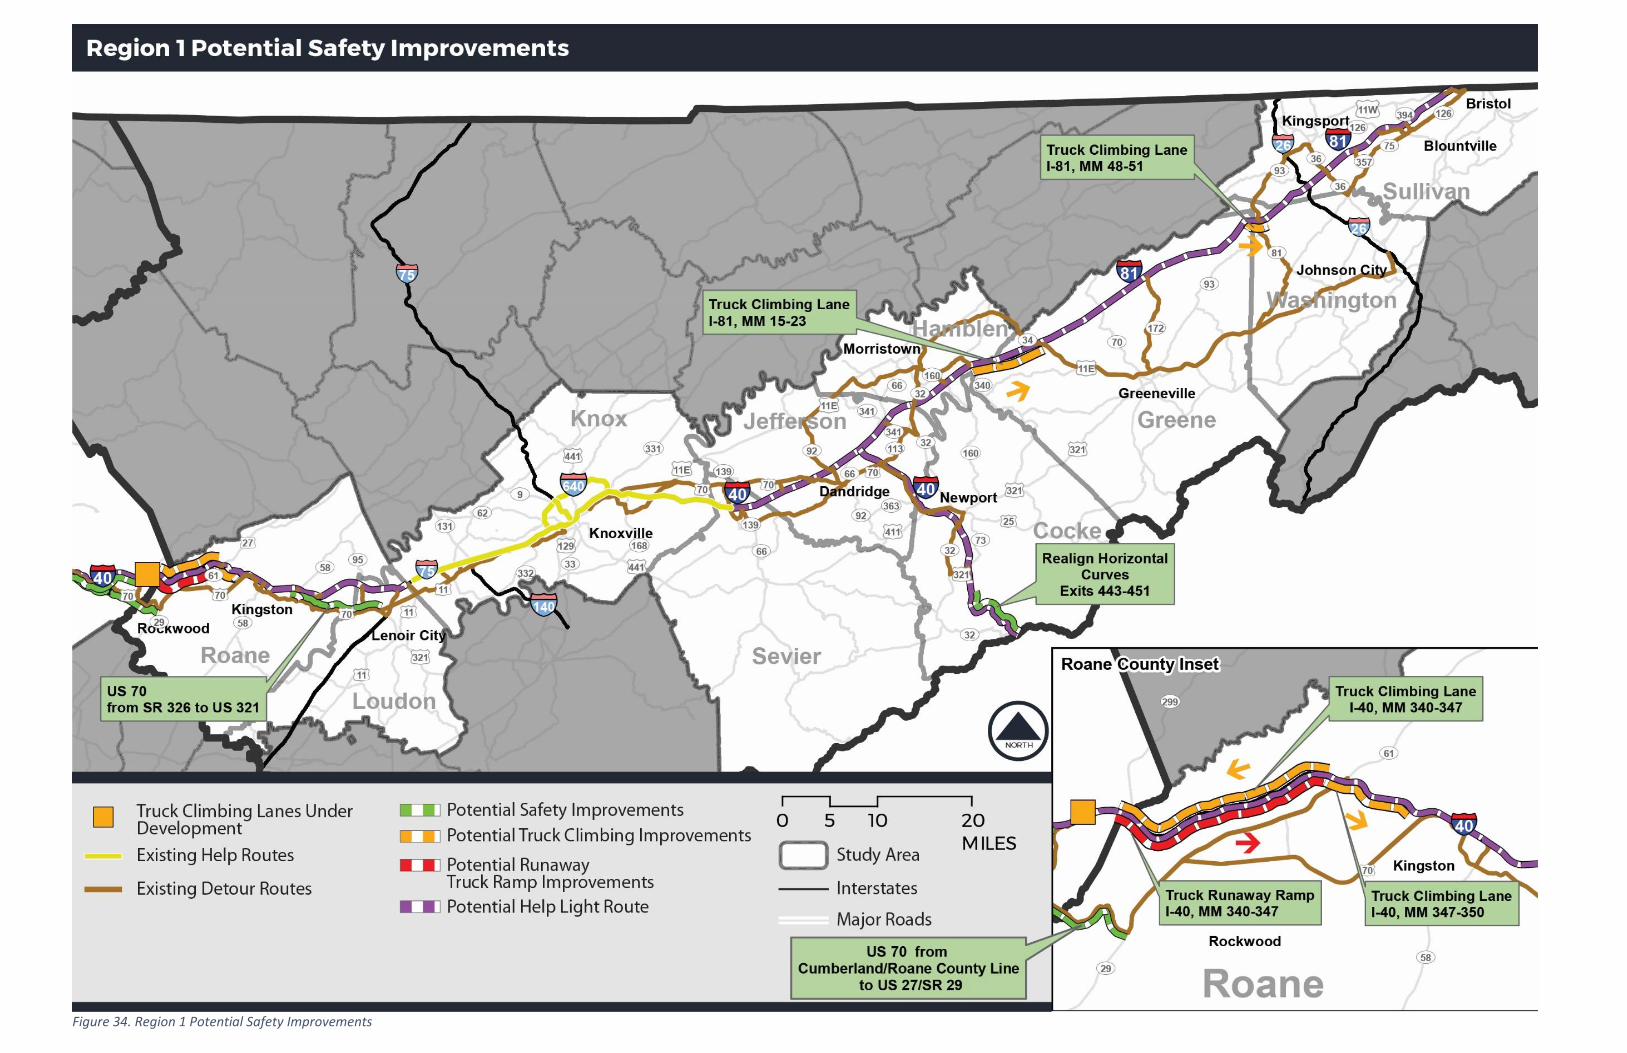
I-40/81 Multimodal Corridor Study
Technical Memorandum Multimodal Solutions
Page 61
Figure 34. Region 1 Potential Safety Improvements

I-40/81 Multimodal Corridor Study
Technical Memorandum Multimodal Solutions
Page 62
Figure 35. Region 2 Potential Safety Improvements
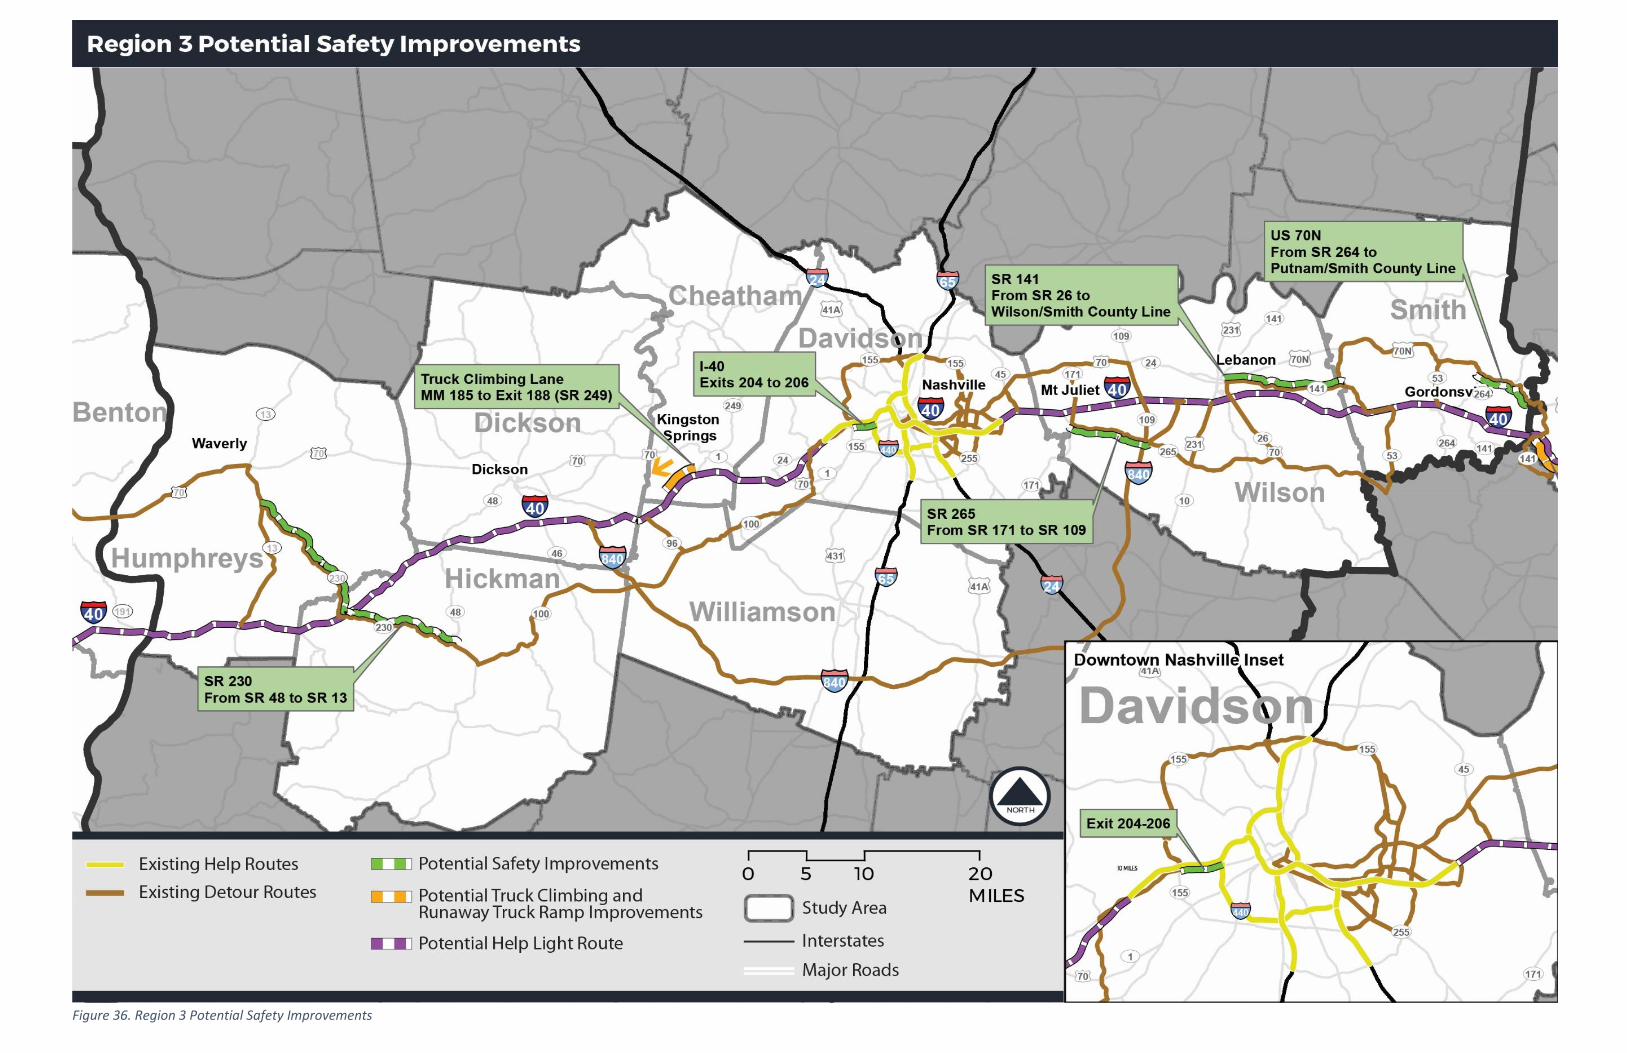
I-40/81 Multimodal Corridor Study
Technical Memorandum Multimodal Solutions
Page 63
Figure 36. Region 3 Potential Safety Improvements

I-40/81 Multimodal Corridor Study
Technical Memorandum Multimodal Solutions
Page 64
Figure 37. Region 4 Potential Safety Improvements
I-40/81 Multimodal Corridor Study
Technical Memorandum Multimodal Solutions
Page 65
6. Transit
I-40 and I-81 play an important role in transit service in several different contexts across the state. They are
critical to operations for rural public transit agencies who provide daily service to citizens traveling to and from
larger urban areas for medical appointments and other services. The corridor is also the backbone for privately
operated intercity bus service crossing the state, and in some urban areas it is used to provide local and/or
regional express service.
Transit operators – and riders – are affected by many of the same issues that confront other traffic on the I-
40/81 corridor: traffic congestion in urban areas, slower travel speeds in mountainous areas where trucks must
climb steep grades, and short merge and weave areas, as well as tight interchanges and other geometric
challenges related to maneuvering a large vehicle such as a bus or truck. Certain Transportation Systems
Management & Operations (TSMO) strategies such as enforcement of existing HOV lanes and implementation of
bus-on-shoulder operation, particularly in the Nashville area, would have an outsized benefit to public transit
while also benefitting general vehicular traffic and freight movements.
The following sections outline three categories of potential improvements that would benefit transit service on
the I-40/81 corridor: infrastructure, policies, and partnerships.
Infrastructure Improvements
A variety of potential physical improvements to the corridor that would benefit current and future bus
operations have been identified through stakeholder interviews with both rural and urban transit operators, as
well as a review of corridor conditions. Improvements have also been identified through safety and capacity
analysis and are included in other tables in this technical memo. Some may not be compatible with solutions
being considered in other categories; for example, the review of TSMO strategies suggests that corridor mobility
may benefit more from other freeway management strategies than from HOV lanes. The next technical
memorandum (Project Priorities) will weigh these factors and result in a comprehensive, multimodal list of
recommended improvements for the corridor.

I-40/81 Multimodal Corridor Study
Technical Memorandum Multimodal Solutions
Page 66
Table 20. Potential Infrastructure Improvements to Benefit Transit Service on the Corridor
Region County Corridor Termini Description
1 Sullivan I-81 I-81/I-26 interchange
Improve interchange geometry, especially southbound I-26 to westbound I-81, for safer bus maneuvers
1 Knox I-40 Throughout urban area Consider HOV lanes to help buses avoid delays caused by congestion
1 Knox I-40 Exit 388A (James White Parkway) and Exit 389 (Hall of Fame Drive)
Extend short ramp lengths for safer bus maneuvers
1, 2 ,3, 4 -- I-40, I-81 Throughout corridor
Install more cameras and other detection to provide transit agencies with more information about weather and other issues that impact safety and travel time.
2 Putnam I-40 Monterey area Add truck climbing lanes eastbound
2 Putnam,
Smith I-40 Exits 254, 258 and 286 Extend on-ramp to improve safety for buses merging onto I-40
3 Davidson I-40 I-40/65 junction (Exits 210 and 211B)
Modify interchange to improve capacity and safety for bus weaving movements
3 Davidson,
Wilson I-40
West of MM 216 and east of MM 232
Extend HOV lanes further into downtown Nashville, and eastward as further widening projects occur
4 Shelby I-40 West of MM 15 and east of MM 22
Extend HOV lanes further into downtown Memphis, and eastward as further widening projects occur
4 Shelby I-40 Exit 1F (Jackson Avenue) Extend on-ramp to improve safety for buses merging onto I-40
I-40/81 Multimodal Corridor Study
Technical Memorandum Multimodal Solutions
Page 67
Policy
Potential policy improvements to benefit transit users of the I-40/81 corridor (and, in many cases, other
interstates and roads in Tennessee) include managed lanes and bus on shoulder, as discussed below.
Managed Lanes
Multiple transit operators, both urban and rural, identified better enforcement of the Nashville area HOV lanes
as a policy action that would improve travel conditions for transit. As discussed in the TSMO section of this
memo, Tennessee faces a number of challenges with HOV enforcement. However, there are other managed
lanes strategies which could potentially achieve many of the same goals. Although not identified by
stakeholders, HOT lanes would also allow faster, more reliable travel by transit vehicles. As discussed earlier in
the TSMO section, HOT lanes could be established either as new lanes or as a conversion of existing HOV lanes.
Bus on Shoulder
Bus on shoulder operations (described in the TSMO section) would help multiple transit agencies across the
corridor to avoid traffic congestion in the Nashville and Memphis metropolitan areas and potentially in Knoxville
as well. WeGo and RTA’s commuter services would experience the greatest benefit, further reducing travel time,
making commuter services more attractive to travelers and potentially reducing bus operating costs. It is
sometimes believed that bus on shoulder is unnecessary in areas that already have HOV lanes. However, on
some segments of highway, a bus may need to travel a relatively short distance between interchanges, and/or
may find it too challenging to weave across three or four lanes during busy peak hours of traffic to access the
HOV lane and then move back to the righthand lanes to exit. While it is possible to construct HOV-only exits, bus
on shoulder can help address some of the same issues at a much lower cost.
Improvements to support bus on shoulder operation could be prioritized based on a cost-benefit analysis taking
into account both transit use of the facility and other safety benefits of shoulder improvements. Generally, bus-
on-shoulder improvements near the core of the cities of Memphis, Nashville, and Knoxville, interchanges near
bus storage facilities and park and ride lots would generate the most benefit to transit. These improvements
would be prioritized for implementation, with some identified for immediate implementation (funding
permitting), others tied to future roadway and interchange reconstruction or improvement projects, and still
others set aside for future analysis and identification of funding due to high cost or other challenges.
Partnerships
Transit service is a vital function whose success is influenced both by TDOT’s actions and by the actions of other
entities, both public and private operators. Improving transit service on the I-40/81 corridor is therefore a
shared responsibility. Discussions with transit stakeholders, as well as a review of service gaps, led to
identification of potential partnerships to improve service along the corridor. They can be categorized into three
primary areas of opportunity:
• Development of park & ride facilities for regional transit service
• Operation of commuter express and regional transit service
• Logistics, coordination, and funding support to improve intercity transit

I-40/81 Multimodal Corridor Study
Technical Memorandum Multimodal Solutions
Page 68
Park & Ride Facilities for Regional Transit Service
Multiple transit operators along the corridor report that
regional and commuter express transit service relies
heavily on the availability of park & ride facilities where
customers can leave their vehicles. Although some of the
agencies’ websites list a number of locations, the majority
are temporary lots in which a property owner (often a
shopping center or church) has agreed to allow the transit
agency to use a portion of their parking area for
commuter parking. It is common for property owners to
withdraw permission for a variety of reasons, such as an
expanded parking need for their own customers, use of
parking spaces for temporary display of merchandise, etc.
When this occurs, the transit agency must search for and
obtain a new location, publicize the change, and get
customers to make the switch. Agencies report that they
often lose ridership as a result of the change, perhaps
because the new location is not perceived as convenient,
it adds to the bus travel time, or because customers
become impatient with multiple changes.
The solution is for the agencies to acquire property for permanent park and ride lots. While cost is sometimes a
challenge in this endeavor, it is not the only obstacle. All of the agencies indicated that TDOT would be an
important and valued partner to help identify and procure park and ride facilities at specific locations along the
I-40 and I-81 corridors. This assistance could take several forms:
• Identifying unused/surplus TDOT property near interchanges;
• Acquiring property for park and ride facilities as part of new interchange construction or modification – potentially to be used first for project staging during construction, then turned over for use as a park and ride; and
• Working with private property owners near interchanges to integrate park and ride and off-street bus operating facilities as new development occurs.
Figure 38. A designated park & ride lot for Regional Transit Authority customers

I-40/81 Multimodal Corridor Study
Technical Memorandum Multimodal Solutions
Page 69
Potential locations identified on the corridor are shown in Table 21 and in Figure 39.
Figure 39. Potential Park and Ride Lot Locations
Table 21. Potential Locations for Permanent Park & Ride Facilities
Region County Corridor Termini Description
1 Sullivan I-81 Exits 56 to 66 New park & ride lots to support development of commuter services
1 Knox I-40 Exits 369, 373 and 374
New park & ride lots to facilitate commuter bus service from the Farragut/West Knox County area to downtown Knoxville
1 Knox I-40 Exits 376, 378 and 379
New park & ride lots to facilitate commuter bus service from the Cedar Bluff area to downtown Knoxville
2 Smith I-40 Exit 258 and 273 (Gordonsville/Carthage, Smithville)
New park & ride lots for Carthage/Gordonsville and Smithville to facilitate regional bus service operated by Upper Cumberland HRA
2 Putnam I-40 Exit 280 (Baxter) Expand or replace existing lot at I-40/SR 56 interchange
3 Williamson I-40 Exit 172 and/or Exit 182
New park & ride lots to facilitate commuter bus service from Centerville, Dickson, Fairview and other areas west of metropolitan Nashville
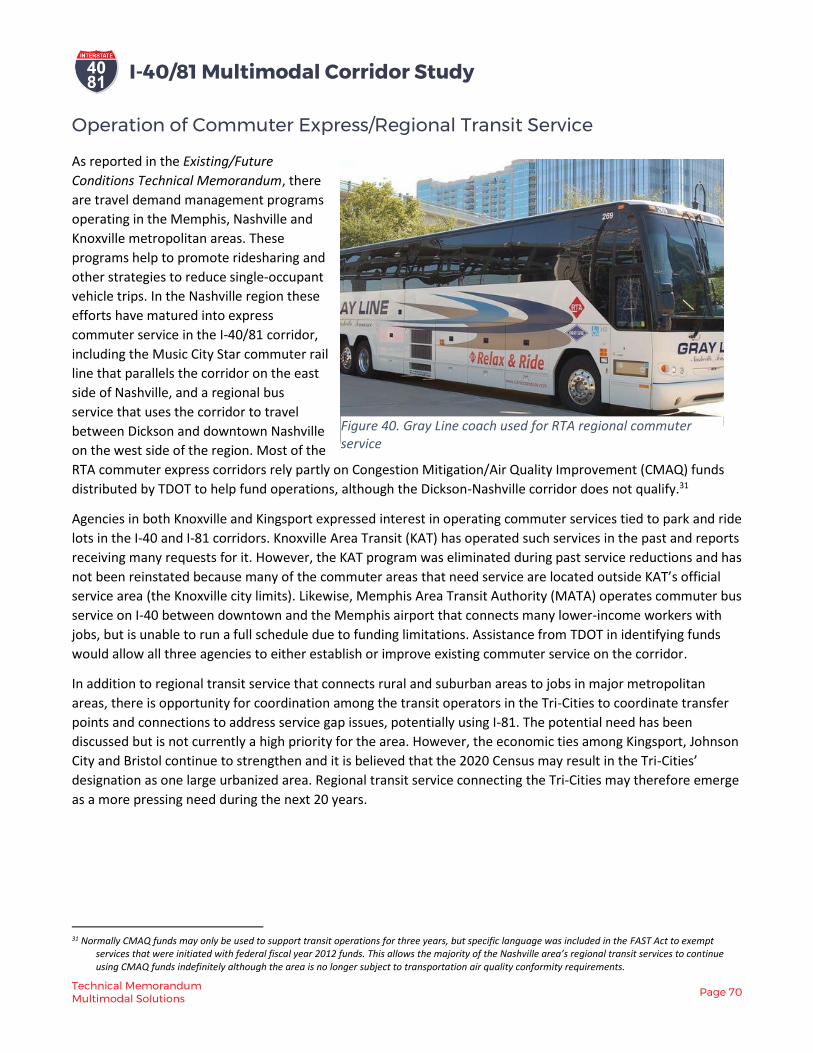
I-40/81 Multimodal Corridor Study
Technical Memorandum Multimodal Solutions
Page 70
Operation of Commuter Express/Regional Transit Service
As reported in the Existing/Future
Conditions Technical Memorandum, there
are travel demand management programs
operating in the Memphis, Nashville and
Knoxville metropolitan areas. These
programs help to promote ridesharing and
other strategies to reduce single-occupant
vehicle trips. In the Nashville region these
efforts have matured into express
commuter service in the I-40/81 corridor,
including the Music City Star commuter rail
line that parallels the corridor on the east
side of Nashville, and a regional bus
service that uses the corridor to travel
between Dickson and downtown Nashville
on the west side of the region. Most of the
RTA commuter express corridors rely partly on Congestion Mitigation/Air Quality Improvement (CMAQ) funds
distributed by TDOT to help fund operations, although the Dickson-Nashville corridor does not qualify.31
Agencies in both Knoxville and Kingsport expressed interest in operating commuter services tied to park and ride
lots in the I-40 and I-81 corridors. Knoxville Area Transit (KAT) has operated such services in the past and reports
receiving many requests for it. However, the KAT program was eliminated during past service reductions and has
not been reinstated because many of the commuter areas that need service are located outside KAT’s official
service area (the Knoxville city limits). Likewise, Memphis Area Transit Authority (MATA) operates commuter bus
service on I-40 between downtown and the Memphis airport that connects many lower-income workers with
jobs, but is unable to run a full schedule due to funding limitations. Assistance from TDOT in identifying funds
would allow all three agencies to either establish or improve existing commuter service on the corridor.
In addition to regional transit service that connects rural and suburban areas to jobs in major metropolitan
areas, there is opportunity for coordination among the transit operators in the Tri-Cities to coordinate transfer
points and connections to address service gap issues, potentially using I-81. The potential need has been
discussed but is not currently a high priority for the area. However, the economic ties among Kingsport, Johnson
City and Bristol continue to strengthen and it is believed that the 2020 Census may result in the Tri-Cities’
designation as one large urbanized area. Regional transit service connecting the Tri-Cities may therefore emerge
as a more pressing need during the next 20 years.
31 Normally CMAQ funds may only be used to support transit operations for three years, but specific language was included in the FAST Act to exempt
services that were initiated with federal fiscal year 2012 funds. This allows the majority of the Nashville area’s regional transit services to continue using CMAQ funds indefinitely although the area is no longer subject to transportation air quality conformity requirements.
Figure 40. Gray Line coach used for RTA regional commuter service
I-40/81 Multimodal Corridor Study
Technical Memorandum Multimodal Solutions
Page 71
Improvements to Intercity Transit
TDOT’s Intercity Bus Service Assessment (2015) indicated that the greatest potential area of need for intercity
bus service in the state is in western Tennessee between Memphis and Nashville, in areas both north and south
of I-40. However, the report found that the need for intercity bus service in the state is adequately served by a
combination of many intercity bus stops (23 in the state, including ten in the I-40/81 corridor) and services
provided by rural regional Human Resources Agencies (HRAs), which provide connections to intercity bus stops
from anywhere in Tennessee. The assessment noted that while many stakeholders indicated a need for intercity
bus connections that do not now exist, intercity service is a lower priority than improved or expanded local
transit, including fixed-route bus service in urban areas as well as demand-response service in rural areas (and
for the disabled in urban areas). Stakeholder discussions for this study also suggest that intercity service remains
a lower priority than fixed-route local bus and demand response services, and indicate a preference for applying
any additional funding to improving those services as opposed to developing new intercity bus connections at
public expense.
Service Quality The 2015 intercity bus service assessment focused on geographic coverage and population characteristics, and
did not give much attention to other aspects of intercity bus service, such as schedules and frequencies,
passenger fares, the quality and locations of stations and stops, and other service characteristics. In Tennessee
as elsewhere, intercity bus (and rail) service can operate relatively infrequently, often just two or three trips
each day. Schedule times are oriented to the convenience of passengers at the ends of the routes, and can be
less convenient for customers at the interim stops. Passenger fares on private intercity bus services, while very
low on a cost-per-mile basis, are high relative to public transit passenger fares, which are heavily subsidized.
These fares can represent a financial challenge to the predominantly lower-income users of intercity bus service.
Intercity bus stops in larger cities like Memphis and Nashville usually are full-service bus or intermodal transit
stations, usually in the downtown area and near the local transit system hub. However, smaller city stops often
are located near a highway interchange, sometimes miles from the city center and near the end of a local bus
route, if it is connected to local bus service at all. The stop may be located at a gas station or fast food outlets
that provides access to restrooms and food services, or at a bus turnout with no services at all.
Potential actions that TDOT could take to improve these aspects of intercity bus service include:
• Facilitating coordination among private intercity bus carriers, local and regional public transit operators,
and other government agencies to discuss customer and operator needs and service issues, and to
formulate strategies to address those needs.
• Directly subsidizing private intercity services to add service frequency and capacity.
• Subsidizing passenger fares for lower income, elderly and disabled, and student riders who are most
likely to find private intercity services unaffordable.
• Helping private intercity carriers identify appropriate smaller city stop locations that balance the
carrier’s need to minimize travel time with the customer’s safety and need for restrooms and food
services. This assistance could include investment, and/or coordination of local public investment, in
intercity bus passenger facilities.
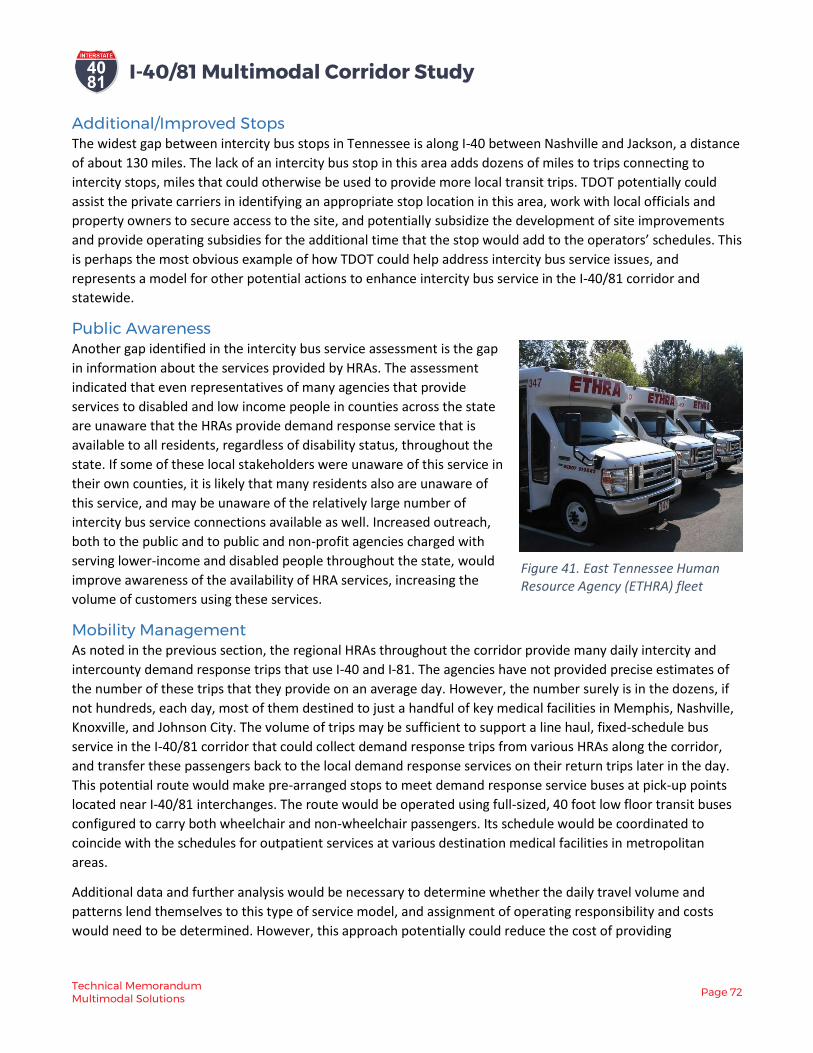
I-40/81 Multimodal Corridor Study
Technical Memorandum Multimodal Solutions
Page 72
Additional/Improved Stops The widest gap between intercity bus stops in Tennessee is along I-40 between Nashville and Jackson, a distance
of about 130 miles. The lack of an intercity bus stop in this area adds dozens of miles to trips connecting to
intercity stops, miles that could otherwise be used to provide more local transit trips. TDOT potentially could
assist the private carriers in identifying an appropriate stop location in this area, work with local officials and
property owners to secure access to the site, and potentially subsidize the development of site improvements
and provide operating subsidies for the additional time that the stop would add to the operators’ schedules. This
is perhaps the most obvious example of how TDOT could help address intercity bus service issues, and
represents a model for other potential actions to enhance intercity bus service in the I-40/81 corridor and
statewide.
Public Awareness Another gap identified in the intercity bus service assessment is the gap
in information about the services provided by HRAs. The assessment
indicated that even representatives of many agencies that provide
services to disabled and low income people in counties across the state
are unaware that the HRAs provide demand response service that is
available to all residents, regardless of disability status, throughout the
state. If some of these local stakeholders were unaware of this service in
their own counties, it is likely that many residents also are unaware of
this service, and may be unaware of the relatively large number of
intercity bus service connections available as well. Increased outreach,
both to the public and to public and non-profit agencies charged with
serving lower-income and disabled people throughout the state, would
improve awareness of the availability of HRA services, increasing the
volume of customers using these services.
Mobility Management As noted in the previous section, the regional HRAs throughout the corridor provide many daily intercity and
intercounty demand response trips that use I-40 and I-81. The agencies have not provided precise estimates of
the number of these trips that they provide on an average day. However, the number surely is in the dozens, if
not hundreds, each day, most of them destined to just a handful of key medical facilities in Memphis, Nashville,
Knoxville, and Johnson City. The volume of trips may be sufficient to support a line haul, fixed-schedule bus
service in the I-40/81 corridor that could collect demand response trips from various HRAs along the corridor,
and transfer these passengers back to the local demand response services on their return trips later in the day.
This potential route would make pre-arranged stops to meet demand response service buses at pick-up points
located near I-40/81 interchanges. The route would be operated using full-sized, 40 foot low floor transit buses
configured to carry both wheelchair and non-wheelchair passengers. Its schedule would be coordinated to
coincide with the schedules for outpatient services at various destination medical facilities in metropolitan
areas.
Additional data and further analysis would be necessary to determine whether the daily travel volume and
patterns lend themselves to this type of service model, and assignment of operating responsibility and costs
would need to be determined. However, this approach potentially could reduce the cost of providing
Figure 41. East Tennessee Human Resource Agency (ETHRA) fleet
I-40/81 Multimodal Corridor Study
Technical Memorandum Multimodal Solutions
Page 73
intercounty demand response trips by the local RTAs and HRAs, freeing up local resources to provide more local
demand response service within HRA areas.
Expanded “mobility management” programs could help identify such opportunities for coordination, and
provide staff resources to work out the logistics of these partnerships. Each regional HRA, as well as many urban
transit agencies, have at least one person on staff who answers citizens’ questions about route schedules and
pickups and assists them in determining what service(s) can best get them to the desired destination. However,
these functions are often performed in addition to other job responsibilities and there may never be time to
work on longer-term solutions because of the immediate day-to-day need to resolve specific situations. A
mobility manager could provide either, or both. This role could also coordinate with private intercity bus service
providers to identify needed improvements and coordinate with public providers.

I-40/81 Multimodal Corridor Study
Technical Memorandum Multimodal Solutions
Page 74
7. New Interchange Access
Integrating land use and transportation
decisions is necessary to provide
consistency between transportation
improvements and planned growth and
economic development. The I-40/81
corridor supports valuable statewide and
national supply chains and provides
access to jobs for workers in the study
area. Maintaining and improving this
access is critical to the continued
prosperity of our local, regional, and state
economies. For many businesses,
proximity to the interstate provides major
economic benefits, including accessibility
to customers, visibility, and access to a
greater number of potential employees.
As reported in the Existing and Future Conditions Technical Memorandum, all state-certified industrial sites
within the I-40/81 corridor are already within reasonable distance of an interchange. There are a small number
of locations where future access points are planned or have been identified based on expected growth.
The IMPROVE Act includes two new interchanges on the I-40 portion of the corridor at Central Pike in Wilson
County and at O’Neil Road in Cocke County. The Central Pike interchange has funds programmed for project
environmental and design work.
Regional planning efforts have proposed and considered several additional interchanges along the corridor to
help improve economic access and spur development throughout the study area. The Knoxville Transportation
Planning Organization (TPO) has a new interchange included in its fiscally-constrained 2040 Long Range Plan on
I-40 at Gov. John Sevier Highway planned for horizon year 2040. Other potential interchanges identified (but
unfunded) in regional plans include:
• On I-40 at:
o Peyton Road in Wilson County
o Chambers Chapel Road in Shelby County
• On I-81 at:
o Buttermilk Road in Sullivan County
Potential new interchanges are shown on the highway capacity/expansion maps earlier in this report (Figure 4
through 7).
Figure 42. Recently constructed interchange at I-40 and Tennessee Avenue in Cookeville (HMB)
Related Documents