Measure of Measure of Location and Location and Variability Variability

Welcome message from author
This document is posted to help you gain knowledge. Please leave a comment to let me know what you think about it! Share it to your friends and learn new things together.
Transcript
Measure of Location and Measure of Location and VariabilityVariability

HistogramHistogram
MultimodalMultimodal

Mean, Median and ModeMean, Median and Mode
MeanMean: average value: average value Sample mean: denoted by x-bar (English)Sample mean: denoted by x-bar (English) Population mean: Mu (Greek)Population mean: Mu (Greek) MedianMedian: value in the middle when : value in the middle when
the data are arranged in ascending the data are arranged in ascending order (smallest to largest). order (smallest to largest).
odd number of observations: the middle valueodd number of observations: the middle value even number of observations: the average of the even number of observations: the average of the
two middle valuestwo middle values

Mean, Median and Mode IIMean, Median and Mode II
ModeMode: the value that occurs with : the value that occurs with greatest frequency (may be more greatest frequency (may be more than one mode in a set of data).than one mode in a set of data).
Example: Example: Data: 1,1,2,2,2,2,3,3,4,4,5Data: 1,1,2,2,2,2,3,3,4,4,5 Mode=2Mode=2

PercentilePercentile
the pth percentile is the value such that the pth percentile is the value such that at at least p percentleast p percent of the observations are of the observations are less than or equalless than or equal to this value and to this value and at at least (100-p) percent of the least (100-p) percent of the observations are greater than or equalobservations are greater than or equal to this value. to this value.
For example: If you scored in the 90th For example: If you scored in the 90th percentile on the verbal part of your SAT’s, percentile on the verbal part of your SAT’s, this would mean that you scored above 90% this would mean that you scored above 90% of all verbal scores taken for the SAT’s at of all verbal scores taken for the SAT’s at that time. that time.

Percentile IIPercentile II
To calculate the pth percentile:To calculate the pth percentile:• arrange the data in ascending orderarrange the data in ascending order• compute an index i=(p/100)*ncompute an index i=(p/100)*n• if i is not an integer, round up, the next if i is not an integer, round up, the next
integer greater than i denotes the integer greater than i denotes the position of the pth percentileposition of the pth percentile
• if i is an integer the pth percentile is the if i is an integer the pth percentile is the average of the values in positions i and average of the values in positions i and i+1. i+1.

QuartileQuartile
used to divide the data into used to divide the data into 44 parts. parts. Q1Q1: first quartile, 25th : first quartile, 25th
percentilepercentile Q2Q2: second quartile, 50th : second quartile, 50th
percentile, medianpercentile, median Q3Q3: third quartile, 75th : third quartile, 75th
percentilepercentile

5 Number Summary5 Number Summary
1. Smallest value1. Smallest value 2. first quartile (Q1)2. first quartile (Q1) 3. Median (Q2)3. Median (Q2) 4. third quartile (Q3)4. third quartile (Q3) 5. Largest value5. Largest value

VariabilityVariability We have talked about measure of location.We have talked about measure of location.
• Mean, median, modeMean, median, mode Why do we need to look at variability?Why do we need to look at variability?
• Data with same mean or median may have different Data with same mean or median may have different variabilityvariability
• Example: two sets of quiz gradesExample: two sets of quiz grades 11 12 14 15 17 18 20 mean=15.2857111 12 14 15 17 18 20 mean=15.28571 7 11 12 18 19 19 20 mean=15.142867 11 12 18 19 19 20 mean=15.14286 The two means are similar but apparently the second The two means are similar but apparently the second
set is more spreadout set is more spreadout greater variability greater variability

How to quantify variabilityHow to quantify variability
RangeRange Inter-Quantile Range (IQR)Inter-Quantile Range (IQR) Variance Variance
• Population variancePopulation variance• Sample varianceSample variance
Standard Deviation (S.D., std dev)Standard Deviation (S.D., std dev)• Population S.D.Population S.D.• Sample S.D.Sample S.D.
Coefficients of VariationCoefficients of Variation
RangeRange
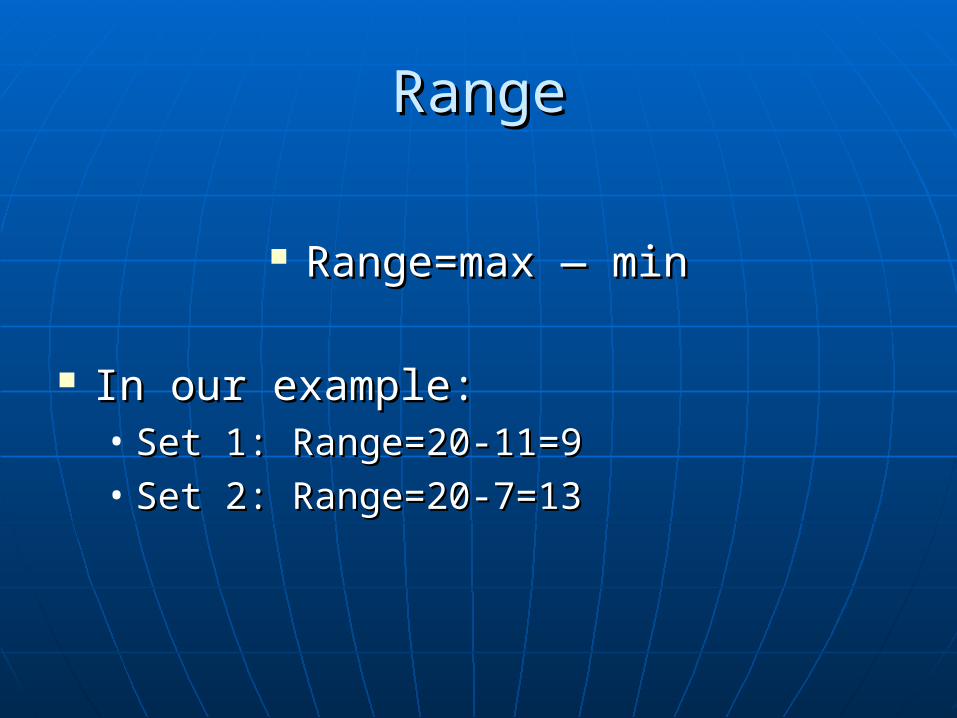
Range=max — minRange=max — min
In our example:In our example:• Set 1: Range=20-11=9Set 1: Range=20-11=9• Set 2: Range=20-7=13Set 2: Range=20-7=13
Inter-Quantile RangeInter-Quantile Range
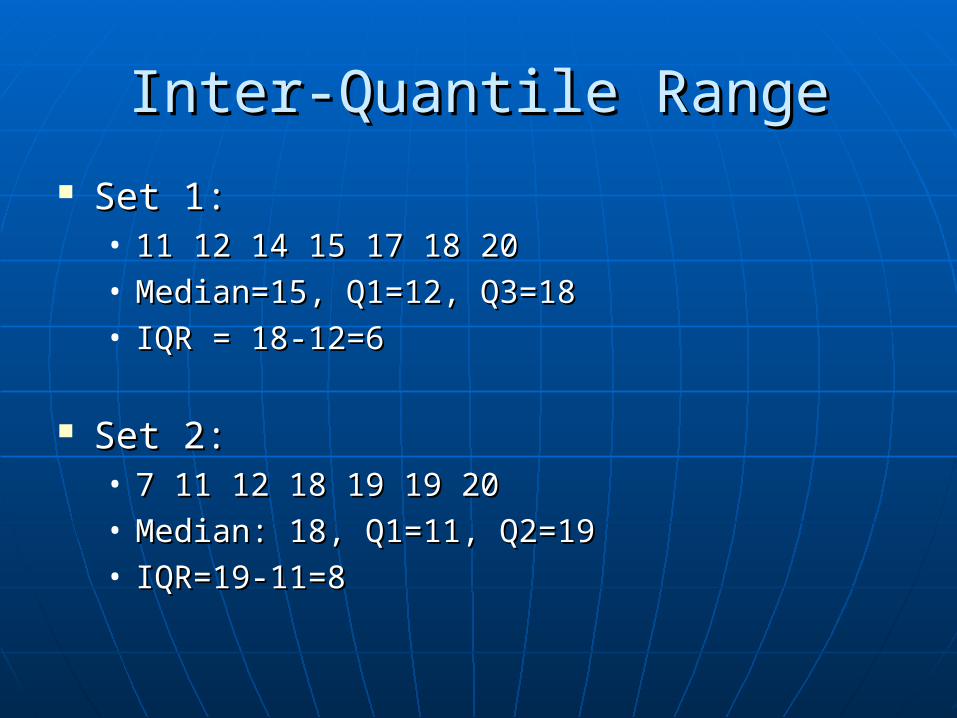
Set 1:Set 1:• 11 12 14 15 17 18 2011 12 14 15 17 18 20• Median=15, Q1=12, Q3=18Median=15, Q1=12, Q3=18• IQR = 18-12=6IQR = 18-12=6
Set 2:Set 2:• 7 11 12 18 19 19 207 11 12 18 19 19 20• Median: 18, Q1=11, Q2=19Median: 18, Q1=11, Q2=19• IQR=19-11=8IQR=19-11=8

BoxplotBoxplot
a graphical a graphical summary of data summary of data that that is based onis based on a a five-number five-number summary. summary.
Example:Example:
Related Documents


![Histogram [Www.nikonians.org]](https://static.cupdf.com/doc/110x72/577cd8911a28ab9e78a17d60/histogram-wwwnikoniansorg.jpg)