NeuroImage 235 (2021) 117998 Contents lists available at ScienceDirect NeuroImage journal homepage: www.elsevier.com/locate/neuroimage Multimodal neurocognitive markers of frontal lobe epilepsy: Insights from ecological text processing Sebastian Moguilner a,b , Agustina Birba c,d , Daniel Fino b,j , Roberto Isoardi b , Celeste Huetagoyena e,k , Raúl Otoya e , Viviana Tirapu b,e , Fabián Cremaschi b,f,g , Lucas Sedeño d , Agustín Ibáñez a,c,d,h , Adolfo M. García a,c,d,i,l,∗ a Global Brain Health Institute, UCSF, California, US, & Trinity College Dublin, Dublin, Ireland b Nuclear Medicine School Foundation (FUESMEN), National Commission of Atomic Energy (CNEA), Mendoza, Argentina c University of San Andres, Buenos Aires, Argentina d National Scientific and Technical Research Council (CONICET), Buenos Aires, Argentina e Neuromed, Clinical Neuroscience, Mendoza, Argentina f Neuroscience Department of the School of Medicine, National University of Cuyo, Mendoza, Argentina g Santa Isabel de Hungría Hospital, Mendoza, Argentina h Center for Social and Cognitive Neuroscience (CSCN), School of Psychology, Universidad Adolfo Ibáñez, Santiago, Chile i Faculty of Education, National University of Cuyo (UNCuyo), Mendoza, Argentina j Fundación Argentina para el Desarrollo en Salud, Mendoza, Argentina k Universidad Católica Argentina l Departamento de Lingüística y Literatura, Facultad de Humanidades, Universidad de Santiago de Chile, Santiago, Chile a r t i c l e i n f o Keywords: Frontal lobe epilepsy Cognitive markers Naturalistic discourse Multimodal neuroimaging, machine learning a b s t r a c t The pressing call to detect sensitive cognitive markers of frontal lobe epilepsy (FLE) remains poorly addressed. Standard frameworks prove nosologically unspecific (as they reveal deficits that also emerge across other epilepsy subtypes), possess low ecological validity, and are rarely supported by multimodal neuroimaging assessments. To bridge these gaps, we examined naturalistic action and non-action text comprehension, combined with structural and functional connectivity measures, in 19 FLE patients, 19 healthy controls, and 20 posterior cortex epilepsy (PCE) patients. Our analyses integrated inferential statistics and data-driven machine-learning classifiers. FLE patients were selectively and specifically impaired in action comprehension, irrespective of their neuropsycho- logical profile. These deficits selectively and specifically correlated with (a) reduced integrity of the anterior thalamic radiation, a subcortical structure underlying motoric and action-language processing as well as epilep- tic seizure spread in this subtype; and (b) hypoconnectivity between the primary motor cortex and the left- parietal/supramarginal regions, two putative substrates of action-language comprehension. Moreover, machine- learning classifiers based on the above neurocognitive measures yielded 75% accuracy rates in discriminating individual FLE patients from both controls and PCE patients. Briefly, action-text assessments, combined with structural and functional connectivity measures, seem to capture ecological cognitive deficits that are specific to FLE, opening new avenues for discriminatory characterizations among epilepsy types. 1. Introduction Cognitive assessments in frontal lobe epilepsy (FLE) reveal diverse deficits (Carreno and Donaire, 2008) which contribute to characterizing the pathology and its comorbidities (Braakman et al., 2013). However, most such dysfunctions (e.g., memory and fluency impairments) also oc- cur in posterior cortex epilepsies (PCEs) (Fogarasi et al., 2003), includ- ing the more frequent temporal lobe epilepsy (Cahn-Weiner et al., 2009; Lüders et al., 1998). Moreover, cognitive studies on FLE have yielded ∗ Corresponding author at: Universidad de San Andrés & CONICET; Vito Dumas 284, B1644BID Victoria, Buenos Aires, Argentina. E-mail address: [email protected] (A.M. García). mixed findings, with some showing deficits in frontal functions, such as memory and attention (Hernandez and Jambaque, 2003), and others reporting sparing of such domains (Risse, 2006). Furthermore, standard tests possess low ecological validity (Carreno and Donaire, 2008) and are rarely complemented with multimodal neuroimaging data. Thus, the need arises for establishing cognitive deficits that are differentially present in FLE, indicative of everyday performance, and specifically mapped to its core anatomo-functional signatures (Elger et al., 2004). A promising avenue is afforded by tasks tapping action language, a https://doi.org/10.1016/j.neuroimage.2021.117998 Received 25 January 2021; Received in revised form 15 March 2021; Accepted 24 March 2021 Available online 28 March 2021 1053-8119/© 2021 Published by Elsevier Inc. This is an open access article under the CC BY-NC-ND license (http://creativecommons.org/licenses/by-nc-nd/4.0/)

Welcome message from author
This document is posted to help you gain knowledge. Please leave a comment to let me know what you think about it! Share it to your friends and learn new things together.
Transcript

NeuroImage 235 (2021) 117998
Contents lists available at ScienceDirect
NeuroImage
journal homepage: www.elsevier.com/locate/neuroimage
Multimodal neurocognitive markers of frontal lobe epilepsy: Insights from
ecological text processing
Sebastian Moguilner a , b , Agustina Birba
c , d , Daniel Fino
b , j , Roberto Isoardi b ,
Celeste Huetagoyena
e , k , Raúl Otoya
e , Viviana Tirapu
b , e , Fabián Cremaschi b , f , g , Lucas Sedeño
d ,
Agustín Ibáñez a , c , d , h , Adolfo M. García
a , c , d , i , l , ∗
a Global Brain Health Institute, UCSF, California, US, & Trinity College Dublin, Dublin, Ireland b Nuclear Medicine School Foundation (FUESMEN), National Commission of Atomic Energy (CNEA), Mendoza, Argentina c University of San Andres, Buenos Aires, Argentina d National Scientific and Technical Research Council (CONICET), Buenos Aires, Argentina e Neuromed, Clinical Neuroscience, Mendoza, Argentina f Neuroscience Department of the School of Medicine, National University of Cuyo, Mendoza, Argentina g Santa Isabel de Hungría Hospital, Mendoza, Argentina h Center for Social and Cognitive Neuroscience (CSCN), School of Psychology, Universidad Adolfo Ibáñez, Santiago, Chile i Faculty of Education, National University of Cuyo (UNCuyo), Mendoza, Argentina j Fundación Argentina para el Desarrollo en Salud, Mendoza, Argentina k Universidad Católica Argentina l Departamento de Lingüística y Literatura, Facultad de Humanidades, Universidad de Santiago de Chile, Santiago, Chile
a r t i c l e i n f o
Keywords:
Frontal lobe epilepsy
Cognitive markers
Naturalistic discourse
Multimodal neuroimaging, machine learning
a b s t r a c t
The pressing call to detect sensitive cognitive markers of frontal lobe epilepsy (FLE) remains poorly addressed.
Standard frameworks prove nosologically unspecific (as they reveal deficits that also emerge across other epilepsy
subtypes), possess low ecological validity, and are rarely supported by multimodal neuroimaging assessments. To
bridge these gaps, we examined naturalistic action and non-action text comprehension, combined with structural
and functional connectivity measures, in 19 FLE patients, 19 healthy controls, and 20 posterior cortex epilepsy
(PCE) patients. Our analyses integrated inferential statistics and data-driven machine-learning classifiers. FLE
patients were selectively and specifically impaired in action comprehension, irrespective of their neuropsycho-
logical profile. These deficits selectively and specifically correlated with (a) reduced integrity of the anterior
thalamic radiation, a subcortical structure underlying motoric and action-language processing as well as epilep-
tic seizure spread in this subtype; and (b) hypoconnectivity between the primary motor cortex and the left-
parietal/supramarginal regions, two putative substrates of action-language comprehension. Moreover, machine-
learning classifiers based on the above neurocognitive measures yielded 75% accuracy rates in discriminating
individual FLE patients from both controls and PCE patients. Briefly, action-text assessments, combined with
structural and functional connectivity measures, seem to capture ecological cognitive deficits that are specific to
FLE, opening new avenues for discriminatory characterizations among epilepsy types.
1
d
t
m
c
i
L
m
a
r
t
a
t
p
m
A
h
R
A
1
. Introduction
Cognitive assessments in frontal lobe epilepsy (FLE) reveal diverse
eficits ( Carreno and Donaire, 2008 ) which contribute to characterizing
he pathology and its comorbidities ( Braakman et al., 2013 ). However,
ost such dysfunctions (e.g., memory and fluency impairments) also oc-
ur in posterior cortex epilepsies (PCEs) ( Fogarasi et al., 2003 ), includ-
ng the more frequent temporal lobe epilepsy ( Cahn-Weiner et al., 2009 ;
üders et al., 1998 ). Moreover, cognitive studies on FLE have yielded
∗ Corresponding author at: Universidad de San Andrés & CONICET; Vito Dumas 28
E-mail address: [email protected] (A.M. García).
ttps://doi.org/10.1016/j.neuroimage.2021.117998
eceived 25 January 2021; Received in revised form 15 March 2021; Accepted 24 M
vailable online 28 March 2021
053-8119/© 2021 Published by Elsevier Inc. This is an open access article under th
ixed findings, with some showing deficits in frontal functions, such
s memory and attention ( Hernandez and Jambaque, 2003 ), and others
eporting sparing of such domains ( Risse, 2006 ). Furthermore, standard
ests possess low ecological validity ( Carreno and Donaire, 2008 ) and
re rarely complemented with multimodal neuroimaging data. Thus,
he need arises for establishing cognitive deficits that are differentially
resent in FLE, indicative of everyday performance, and specifically
apped to its core anatomo-functional signatures ( Elger et al., 2004 ).
promising avenue is afforded by tasks tapping action language, a
4, B1644BID Victoria, Buenos Aires, Argentina.
arch 2021
e CC BY-NC-ND license ( http://creativecommons.org/licenses/by-nc-nd/4.0/ )
S. Moguilner, A. Birba, D. Fino et al. NeuroImage 235 (2021) 117998
c
(
2
a
a
n
c
s
h
L
s
P
n
2
p
2
c
a
B
m
v
s
c
2
a
2
a
(
d
(
l
d
I
(
c
i
n
2
a
i
l
s
r
P
m
p
a
w
t
n
t
a
h
P
g
[
2
L
s
t
b
l
b
h
f
2
2
p
t
a
2
l
p
n
o
p
c
a
n
b
r
t
c
o
h
m
i
a
s
e
w
(
S
T
w
o
v
2
2
t
G
c
N
i
l
o
a
i
a
a
f
a
i
a
m
t
a
w
t
a
N
ognitive domain that hinges on cortico-subcortical motor networks
Pulvermuller, 2018 , Llano, 2013 , Akinina et al., 2019 , Garcia et al.,
019 ) which are distinctively affected in FLE ( Carreno and Don-
ire, 2008 ). To explore this novel view, we implemented a multimodal
pproach combining inferential statistics and machine learning to tap
aturalistic action-language comprehension and its anatomo-functional
orrelates (via diffusion tensor imaging [DTI] and fMRI-derived resting-
tate functional connectivity [rsFC]) in FLE patients relative to both
ealthy controls and PCE patients.
Accounting for ≈20% of epilepsy cases ( Kellinghaus and
üders, 2004 ), FLE is a focal epilepsy subtype typified by brief, recurring
eizures arising and spreading in the frontal lobes ( Scheffer et al., 2017 ).
atients often exhibit damage in motor-related subcortico-cortical con-
ections, including the anterior thalamic radiation (ATR) ( Law et al.,
018 ); and disruptions in several rsFC networks ( Cao et al., 2014 ),
articularly involving motor network (MN) hubs ( Woodward et al.,
014 ; Widjaja et al., 2013 ). Consistently, clinical manifestations include
ontralateral clonic movements, uni- or bilateral tonic motor activity,
s well as complex automatisms ( Kellinghaus and Lüders, 2004 ).
eyond these canonical alterations, FLE also involves deficits in nu-
erous cognitive domains, such as attention, working memory, and
erbal fluency ( Carreno and Donaire, 2008 ). as well as consciousness
tates ( Moguilner et al., 2017 ). These impairments are relevant for
haracterizing the disorder, but they prove inconsistent ( Elger et al.,
004 ) and fail to differentiate it from other epilepsy types. Indeed,
ll such domains are also compromised in PCEs ( Cahn-Weiner et al.,
009 ). including temporal lobe epilepsy ( Cahn-Weiner et al., 2009 )
nd less frequent subtypes such as parietal and occipital lobe epilepsies
Traianou et al., 2019 ). This scenario calls for new approaches to track
ifferential neurocognitive signatures of FLE relative to PCEs at large
Elger et al., 2004 ).
A promising target is afforded by paradigms assessing action
anguage, namely, verbal units denoting bodily motion (as in Pe-
ro took his brother’s hand and ran towards the sea ) ( García and
báñez, 2016 ). This domain is critically subserved by frontal
Pulvermuller, 2018 ; Pulvermuller, 2013 ; García et al., 2019 ) and
ortico-subcortical ( Birba et al., 2017 ) motor circuits typically affected
n FLE ( Braakman et al., 2013 ; Woodward et al., 2014 ). In other
eurological disorders, such as Parkinson’s disease ( Abrevaya et al.,
017 ; Peran et al., 2003 ), spinocerebellar ataxia ( García et al., 2016 ),
nd stroke ( Akinina et al., 2019 ), structural and functional abnormal-
ties along those networks entail early, selective, and primary action-
anguage deficits ( Birba et al., 2017 ). Moreover, action language is
pecifically spared in conditions compromising posterior but not ante-
ior brain regions ( Birba et al., 2017 ; Bak, 2003 ). Since FLE differs from
CEs in its marked disruption of motor systems, action-language assess-
ents could reveal distinct neurocognitive alterations in the former.
Here we implemented a mixed hypothesis- and data-driven ap-
roach, including literature-based hypotheses and machine-learning
nalyses of multimodal data relevant to such predictions. Specifically,
e assessed comprehension of naturalistic action texts (ATs) and neu-
ral texts (NTs), as well as their structural (DTI) and functional (rsFC)
euroimaging signatures, in FLE patients, healthy controls, and PCE pa-
ients. Our analyses combined inferential statistics with classification
lgorithms ( Garcia et al., 2019 ; Garcia et al., 2020 ). We raised three
ypotheses. First, we predicted that, relative to controls, FLE (but not
CE) patients would exhibit selective action-language deficits. Second,
iven that FLE is characterized by alterations along cortico-subcortical
e.g., ATR ( Law et al., 2018 )] and frontal [e.g., MN ( Woodward et al.,
014 )] motor circuits subserving action language ( Pulvermuller, 2018 ;
lano, 2013 ; Akinina et al., 2019 ; Abrevaya et al., 2017 ), we hypothe-
ized that such deficits would correlate with reduced white matter in-
egrity and lower rsFC across such networks –there being no compara-
le correlations in controls or PCE patients. Lastly, concerning machine
earning analyses, we anticipated that action language outcomes would
e a crucial feature for distinguishing individual FLE patients from both
2
ealthy controls and PCE patients. Briefly, our new approach aims to in-
orm the quest for distinctive neurocognitive markers of FLE ( Elger et al.,
004 ).
. Methods
Our study comprised 58 participants, a sample size that reaches a
ower of .92 (see Supplementary Data 1). These included 19 FLE pa-
ients, showing stereotyped semiology with hypermotor seizures char-
cterized by complex high-amplitude movements ( Lüders et al., 1998 );
0 PCE patients (16 with temporal lobe epilepsy, three with parietal
obe epilepsy, and one with occipital lobe epilepsy) not showing hy-
ermotor seizures ( Yu et al., 2009 ); and 19 healthy controls. Diag-
oses were made by expert neurologists following current standards
f the International League Against Epilepsy ( Fisher et al., 2014 ). All
atients had one or more confirmed clinical seizures measured by fo-
al (i.e., not generalized) epileptic electroencephalography discharges
rising and spreading through the affected lobe. Still, all of them had
ormal structural brain MRIs (i.e., no cortical dysplasia), as verified
y a board of certified neuroradiologists. The neuroimaging and neu-
opsychological protocols were undertaken within a period no longer
han two weeks. No patient had a history of other neurological or psy-
hiatric disorders (evaluated via standardized neuropsychiatric testing),
ther disease that could cause cognitive decline, or substance abuse. The
ealthy controls also lacked these antecedents. The three groups were
atched on age, sex, and education; handedness, determined via the Ed-
nburgh Inventory ( Oldfield, 1971 ); overall cognitive status, attention,
nd general language skills, established with the Montreal Cognitive As-
essment (MoCA) and relevant subtests ( Nasreddine et al., 2005 ); overall
xecutive functions, working memory and inhibitory controls, assessed
ith the INECO Frontal Screening (IFS) battery and relevant substests
Torralva et al., 2009 ); and IQ, evaluated with the Weschler Abbreviated
cale of Intelligence (WASI) ( Wechsler, 1999 ). ( Fig. 1 A). For details, see
able 1 .
All participants provided written informed consent in accordance
ith The Code of Ethics of the World Medical Association (Declaration
f Helsinki). The study protocol was approved by the Institutional Re-
iew Board.
.1. Naturalistic text task
.1.1. Action and neutral texts
All narratives were created through a systematic protocol for es-
ablishing semantic distinctions between text sets ( Birba et al., 2020a ;
arcia et al., 2018 ). Two of the narratives were ATs, systematically fo-
used on the characters’ bodily movements; whereas the other two were
Ts, typified by low action content. Each text was based on 22 grammat-
cal patterns that were pseudo-randomly distributed and filled with se-
ected lexical items. These included 32 verbs strategically chosen based
n semantic, syntactic, and distributional criteria to operationalize the
ction/non-action distinction. The number of critical items instantiat-
ng these contrasts was statistically controlled across texts. Importantly,
ll four texts were matched for multiple key variables, namely: char-
cter count; overall and content-word-type counts; mean content-word
requency, familiarity, syllabic length, graphemic length, and image-
bility; sentence and sentence-type counts; reading difficulty; grammat-
cal correctness, coherence, and comprehensibility; readability rating;
nd emotional content ( Table 2 ). The texts communicated mostly literal
eanings and contained no jargon (for full transcriptions and English
ranslations, see supplementary data 2).
The ATs consisted in action-laden stories foregrounding their char-
cters’ multiple bodily movements (e.g., Johnny ran quickly to the place
here the clown was jumping and dancing ). Also, the texts offered rich de-
ails about the settings where the stories took place, the objects in them,
nd the manner in which bodily actions were performed. Conversely, the
Ts mainly described non-action events, such as the feelings, thoughts,
S. Moguilner, A. Birba, D. Fino et al. NeuroImage 235 (2021) 117998
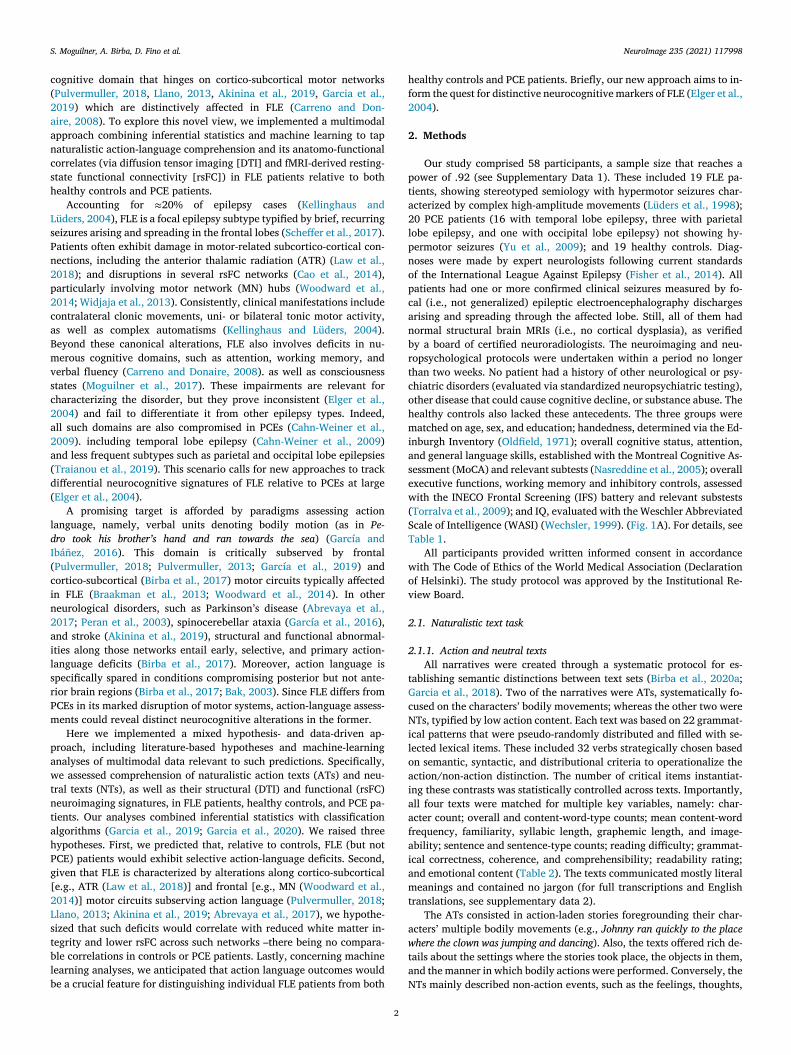
Fig. 1. Experimental protocol. (A) Samples
and neuropsychological assessment. The FLE
patients, controls, and PCE patients were
matched for demographical (sex, age, edu-
cation, handedness) and neuropsychological
(overall cognitive status, executive functions,
IQ) variables. (B) Behavioral and neuroimaging
data acquisition. Left inset . Participants listened
to four recorded texts (two ATs and two NTs),
presented in counterbalanced fashion. After
each one, they responded to the corresponding
multiple-choice questionnaire, including items
on verb-related (V) and circumstantial (C) in-
formation. Right inset . The neuroimaging sec-
tion included sequences for obtaining struc-
tural (DTI) and functional (rs-fMRI) images. (C)
Data analysis and visualization. Left inset . Box-
plot scheme for behavioral results (results for
the two ATs and the two NTs were collapsed
to obtain a single AT and a single NT score
per subject). Right inset . Neuroimaging plots for
DTI and rs-FC comparisons between each group
pair, with their respective correlations with
condition-specific (i.e., AT-V, AT-C, NT-V, NT-
C) accuracy. (D) Machine learning pipeline. Af-
ter feature normalization, we used a k -fold val-
idation scheme for Bayesian hyper-parameter
tuning to obtain trained XGBoost models, and
then we tested our classification by employ-
ing the ROC curve, confusion matrices and a
feature importance analysis. FLE: frontal lobe
epilepsy; PCE: posterior cortex epilepsy; MoCA:
Montreal Cognitive Assessment; IFS: INECO
Frontal Screening battery; WASI: Weschler Ab-
breviated Scale of Intelligence; AT1: action text
1; AT2: action text 2; NT1: neutral text 1; NT2:
neutral text 2; V: verb-related information; C:
circumstantial information; DTI: diffusion ten-
sor imaging. rs-fMRI: resting-state fMRI; rs-FC:
resting-state functional connectivity; FA: frac-
tional anisotropy; wSDM: weighted Symbolic
Dependence Metric; XGBoost: eXtreme Gradi-
ent Boosting.
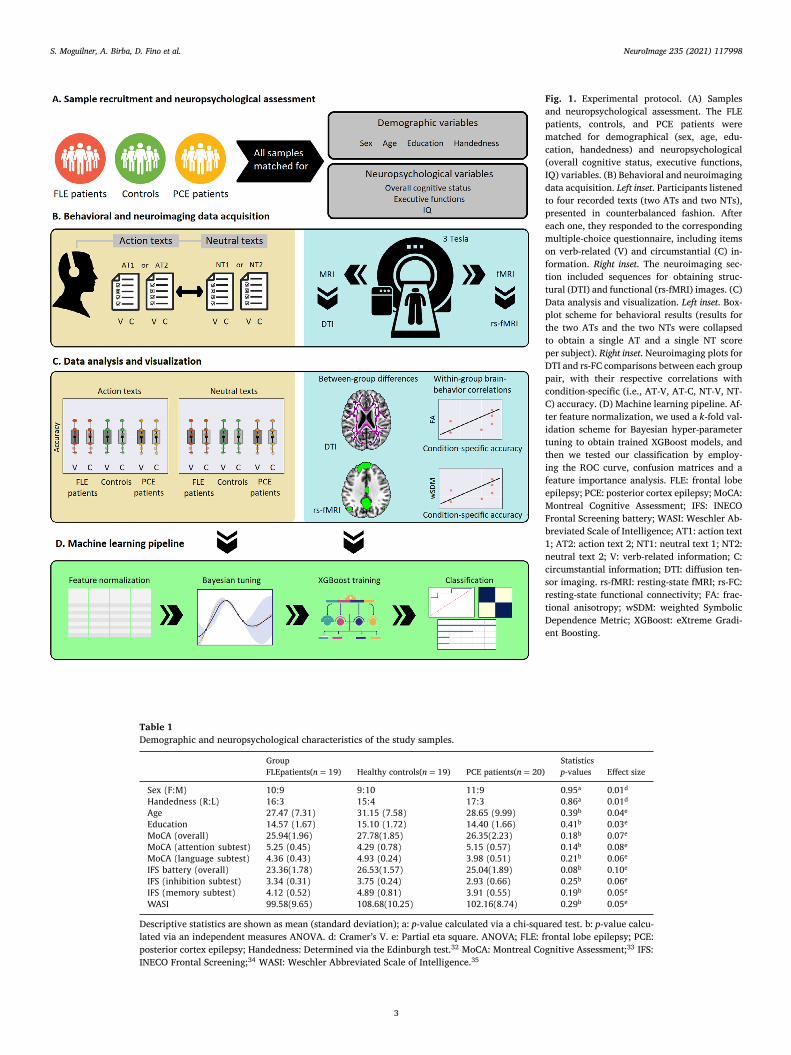
Table 1
Demographic and neuropsychological characteristics of the study samples.
Group Statistics
FLEpatients( n = 19) Healthy controls( n = 19) PCE patients( n = 20) p -values Effect size
Sex (F:M) 10:9 9:10 11:9 0.95 a 0.01 d
Handedness (R:L) 16:3 15:4 17:3 0.86 a 0.01 d
Age 27.47 (7.31) 31.15 (7.58) 28.65 (9.99) 0.39 b 0.04 e
Education 14.57 (1.67) 15.10 (1.72) 14.40 (1.66) 0.41 b 0.03 e
MoCA (overall) 25.94(1.96) 27.78(1.85) 26.35(2.23) 0.18 b 0.07 e
MoCA (attention subtest) 5.25 (0.45) 4.29 (0.78) 5.15 (0.57) 0.14 b 0.08 e
MoCA (language subtest) 4.36 (0.43) 4.93 (0.24) 3.98 (0.51) 0.21 b 0.06 e
IFS battery (overall) 23.36(1.78) 26.53(1.57) 25.04(1.89) 0.08 b 0.10 e
IFS (inhibition subtest) 3.34 (0.31) 3.75 (0.24) 2.93 (0.66) 0.25 b 0.06 e
IFS (memory subtest) 4.12 (0.52) 4.89 (0.81) 3.91 (0.55) 0.19 b 0.05 e
WASI 99.58(9.65) 108.68(10.25) 102.16(8.74) 0.29 b 0.05 e
Descriptive statistics are shown as mean (standard deviation); a: p -value calculated via a chi-squared test. b: p -value calcu-
lated via an independent measures ANOVA. d: Cramer’s V. e: Partial eta square. ANOVA; FLE: frontal lobe epilepsy; PCE:
posterior cortex epilepsy; Handedness: Determined via the Edinburgh test. 32 MoCA: Montreal Cognitive Assessment; 33 IFS:
INECO Frontal Screening; 34 WASI: Weschler Abbreviated Scale of Intelligence. 35
3
S. Moguilner, A. Birba, D. Fino et al. NeuroImage 235 (2021) 117998
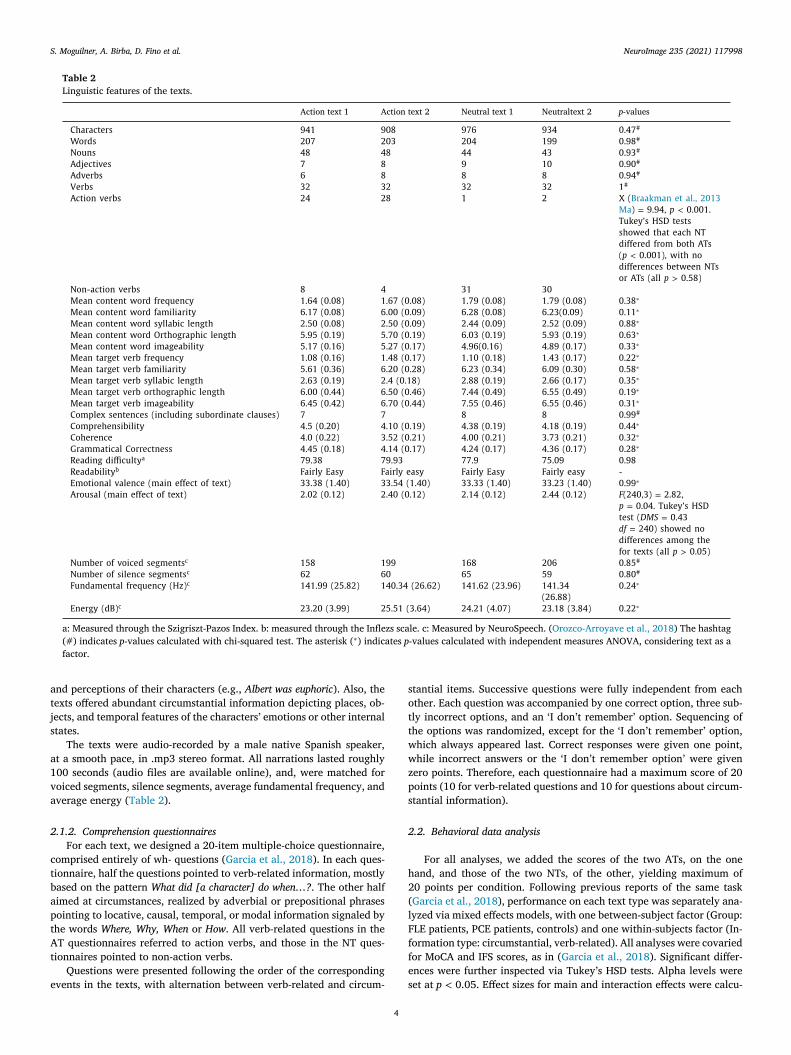
Table 2
Linguistic features of the texts.
Action text 1 Action text 2 Neutral text 1 Neutraltext 2 p- values
Characters 941 908 976 934 0.47 #
Words 207 203 204 199 0.98 #
Nouns 48 48 44 43 0.93 #
Adjectives 7 8 9 10 0.90 #
Adverbs 6 8 8 8 0.94 #
Verbs 32 32 32 32 1 #
Action verbs 24 28 1 2 X ( Braakman et al., 2013
Ma ) = 9.94, p < 0.001.
Tukey’s HSD tests
showed that each NT
differed from both ATs
( p < 0.001), with no
differences between NTs
or ATs (all p > 0.58)
Non-action verbs 8 4 31 30
Mean content word frequency 1.64 (0.08) 1.67 (0.08) 1.79 (0.08) 1.79 (0.08) 0.38 ∗
Mean content word familiarity 6.17 (0.08) 6.00 (0.09) 6.28 (0.08) 6.23(0.09) 0.11 ∗
Mean content word syllabic length 2.50 (0.08) 2.50 (0.09) 2.44 (0.09) 2.52 (0.09) 0.88 ∗
Mean content word Orthographic length 5.95 (0.19) 5.70 (0.19) 6.03 (0.19) 5.93 (0.19) 0.63 ∗
Mean content word imageability 5.17 (0.16) 5.27 (0.17) 4.96(0.16) 4.89 (0.17) 0.33 ∗
Mean target verb frequency 1.08 (0.16) 1.48 (0.17) 1.10 (0.18) 1.43 (0.17) 0.22 ∗
Mean target verb familiarity 5.61 (0.36) 6.20 (0.28) 6.23 (0.34) 6.09 (0.30) 0.58 ∗
Mean target verb syllabic length 2.63 (0.19) 2.4 (0.18) 2.88 (0.19) 2.66 (0.17) 0.35 ∗
Mean target verb orthographic length 6.00 (0.44) 6.50 (0.46) 7.44 (0.49) 6.55 (0.49) 0.19 ∗
Mean target verb imageability 6.45 (0.42) 6.70 (0.44) 7.55 (0.46) 6.55 (0.46) 0.31 ∗
Complex sentences (including subordinate clauses) 7 7 8 8 0.99 #
Comprehensibility 4.5 (0.20) 4.10 (0.19) 4.38 (0.19) 4.18 (0.19) 0.44 ∗
Coherence 4.0 (0.22) 3.52 (0.21) 4.00 (0.21) 3.73 (0.21) 0.32 ∗
Grammatical Correctness 4.45 (0.18) 4.14 (0.17) 4.24 (0.17) 4.36 (0.17) 0.28 ∗
Reading difficulty a 79.38 79.93 77.9 75.09 0.98
Readability b Fairly Easy Fairly easy Fairly Easy Fairly easy -
Emotional valence (main effect of text) 33.38 (1.40) 33.54 (1.40) 33.33 (1.40) 33.23 (1.40) 0.99 ∗
Arousal (main effect of text) 2.02 (0.12) 2.40 (0.12) 2.14 (0.12) 2.44 (0.12) F (240,3) = 2.82,
p = 0.04. Tukey’s HSD
test ( DMS = 0.43
df = 240) showed no
differences among the
for texts (all p > 0.05)
Number of voiced segments c 158 199 168 206 0.85 #
Number of silence segments c 62 60 65 59 0.80 #
Fundamental frequency (Hz) c 141.99 (25.82) 140.34 (26.62) 141.62 (23.96) 141.34
(26.88)
0.24 ∗
Energy (dB) c 23.20 (3.99) 25.51 (3.64) 24.21 (4.07) 23.18 (3.84) 0.22 ∗
a: Measured through the Szigriszt-Pazos Index. b: measured through the Inflezs scale. c: Measured by NeuroSpeech. ( Orozco-Arroyave et al., 2018 ) The hashtag
(#) indicates p -values calculated with chi-squared test. The asterisk ( ∗ ) indicates p -values calculated with independent measures ANOVA, considering text as a
factor.
a
t
j
s
a
1
v
a
2
c
t
b
a
p
t
A
t
e
s
o
t
t
w
w
z
p
s
2
h
2
(
l
F
f
f
e
s
nd perceptions of their characters (e.g., Albert was euphoric ). Also, the
exts offered abundant circumstantial information depicting places, ob-
ects, and temporal features of the characters’ emotions or other internal
tates.
The texts were audio-recorded by a male native Spanish speaker,
t a smooth pace, in .mp3 stereo format. All narrations lasted roughly
00 seconds (audio files are available online), and, were matched for
oiced segments, silence segments, average fundamental frequency, and
verage energy ( Table 2 ).
.1.2. Comprehension questionnaires
For each text, we designed a 20-item multiple-choice questionnaire,
omprised entirely of wh- questions ( Garcia et al., 2018 ). In each ques-
ionnaire, half the questions pointed to verb-related information, mostly
ased on the pattern What did [a character] do when…? . The other half
imed at circumstances, realized by adverbial or prepositional phrases
ointing to locative, causal, temporal, or modal information signaled by
he words Where, Why, When or How . All verb-related questions in the
T questionnaires referred to action verbs, and those in the NT ques-
ionnaires pointed to non-action verbs.
Questions were presented following the order of the corresponding
vents in the texts, with alternation between verb-related and circum-
4
tantial items. Successive questions were fully independent from each
ther. Each question was accompanied by one correct option, three sub-
ly incorrect options, and an ‘I don’t remember’ option. Sequencing of
he options was randomized, except for the ‘I don’t remember’ option,
hich always appeared last. Correct responses were given one point,
hile incorrect answers or the ‘I don’t remember option’ were given
ero points. Therefore, each questionnaire had a maximum score of 20
oints (10 for verb-related questions and 10 for questions about circum-
tantial information).
.2. Behavioral data analysis
For all analyses, we added the scores of the two ATs, on the one
and, and those of the two NTs, of the other, yielding maximum of
0 points per condition. Following previous reports of the same task
Garcia et al., 2018 ), performance on each text type was separately ana-
yzed via mixed effects models, with one between-subject factor (Group:
LE patients, PCE patients, controls) and one within-subjects factor (In-
ormation type: circumstantial, verb-related). All analyses were covaried
or MoCA and IFS scores, as in ( Garcia et al., 2018 ). Significant differ-
nces were further inspected via Tukey’s HSD tests. Alpha levels were
et at p < 0.05. Effect sizes for main and interaction effects were calcu-

S. Moguilner, A. Birba, D. Fino et al. NeuroImage 235 (2021) 117998
l
c
p
t
l
2
s
a
p
v
c
t
T
b
(
c
t
u
f
t
w
c
2
T
o
s
2
a
e
e
r
g
d
e
t
R
c
d
S
t
r
m
s
t
t
d
f
i
t
o
П(
w
I
w
2
w
(
w
a
a
w
X
t
w
w
t
t
c
o
i
d
t
n
u
d
d
2
s
r
v
N
T
w
f
t
t
(
p
t
e
a
q
n
p
h
2
a
2
m
2
o
o
s
a
(
(
o
o
r
i
ated through partial eta squared ( 𝜂2 ) tests, whereas those for pair-wise
omparisons were obtained via Cohen’s d . All statistical analyses were
erformed on IBM’s SPSS Statistics (v. 23) software. The structure of
he behavioral experimental session is diagrammed in Fig. 1 B and C,
eft inset.
.3. DTI methods
MRI data were acquired on a General Electric Signa PET/MR 3T
canner with a standard head coil. We obtained two types of fractional
nisotropy (FA) maps. Local FA measures were used to pairwise com-
are WM integrity between the FLE patients, PCE patients, and controls
ia one-tailed two-sample t -tests, and global FA measures were also cal-
ulated for the correlation analyses ( Section 2.6 ) by averaging across
he obtained skeletonized tracts (for details, see Supplementary data 3).
hese maps were then parsed according to the Johns Hopkins ICBM DTI-
ased WM tract probability atlas, considering a total of 10 WM tracts
Hua et al., 2008 ), namely: forceps minor (Fmin), ATR, cingulate gyrus
ingulum (CING), superior longitudinal fasciculus (SLF), inferior longi-
udinal fasciculus (ILF), corticospinal tract (CST), forceps major (Fmaj),
ncinate fasciculus (UNC), hippocampal cingulum (CING-hipp), and in-
erior fronto-occipital fasciculus (IFOF). As recommended for this set-
ing, which involves a large range of comparisons across voxel values,
e performed a permutation-based inference while maintaining a strong
ontrol over family-wise errors (FWE) (Jenkinson et al., 2012; Nichols,
002). This method enabled us to calculate data-driven clusters using
hreshold-Free Cluster Enhancement (TFCE) (Smith, 2009), which also
vercomes the need of fixing arbitrary thresholds that may bias our re-
ults.
.4. fMRI methods
In the resting-state protocol, participants were asked not to think
bout anything in particular while remaining awake, still and with
yes closed. First, we performed a seed analysis to evaluate both lin-
ar and non-linear rsFC using the weighted Symbolic Dependence Met-
ic (wSDM) ( Moguilner et al., 2018 ). This measure captures local and
lobal temporal features of the BOLD signal by weighing a copula-based
ependence measure by symbolic similarity. This property enabled us to
stimate dynamic nonlinear associations, a key aspect of neural connec-
ivity that escapes the possibility of traditional metrics, like Pearson’s
–indeed, wSDM surpasses R in identifying patients with neurologi-
al disorders based on rsFC patterns ( Moguilner et al., 2018 ). Although
ependence measures, such as mutual information (MI) and weighted
ymbolic Mutual Information (wSMI), tap into non-linear dependencies,
heir application in fMRI studies is limited because of their low temporal
esolution ( Kinney and Atwal, 2014 ). Conversely, as other dependency
easures based on statistical copulas ( Nelsen, 2006 ), wSDM uses rank
tatistics to circumvent this limitation. Let C be the copula function of
he random variables ( x , y ) defined on a unit square. According to Sklar’s
heorem ( Sklar, 1959 ), there exists a unique copula C that links the joint
istribution f and the marginals f 1 , f 2 :
( x , y ) = C
(f 1 ( x ) , f 2 ( y )
)(1)
Using the result that the variables x , y are independent if and only
f the copula C equals the product copula П defined as the product of
heir marginal distribution functions ( Nelsen, 2006 ), the independence
f the variables can be measured by a normalized L P distance of C and
:
h p ∫ ∫[0 , 1] 2 |||C(u 1 u 2 ) − Π(u 1 u 2 ) |||du 1 du 2
)
1 p , (2)
here 1 ≤ p ≤ ∞ and h p is a normalization constant.
For p = 2, we have Hoeffding’s phi-square ( I 𝜙2 ) ( Hoeffding, 1940 ),
Π2 = 90 ∫ ∫[0 , 1] 2 |||C(u 1 , u 2 ) − Π(u 1 , u 2 ) |||du 1 du 2 (3)
5
hose empirical estimation can be analytically computed ( Gaißer et al.,
010 ). The coefficients of the wSDM formula ( Moguilner et al., 2018 )
ere obtained through the Information Theoretical Estimators Toolbox
Szabo, 2014 ). Finally, to account for local variations in the time-series,
e represented the increase and decrease of the signal by symbols. That
llowed us to perform comparisons of sequences of symbols, enabling
dynamical analysis of the dependence between regions. To this end,
e defined a symbolic weight sw, which is function of the similarity of , Y (i.e., the symbolic transformation of the x , y timeseries), and mul-
iplying the copula-based measure I( x , y ) we obtain the formula for the
SDM:
SDM = sw
(X , Y
). I ( x , y ) (4)
The symbolic weights, which range from 0 (i.e., minimal similarity)
o 1 (i.e., maximal similarity), were calculated using the Hamming dis-
ance ( Lesk, 2002 ) between the obtained symbolic strings.
Our analysis targeted three different networks. First, we considered a
ritical motor network (MN), implicated in action planning, execution,
bservation, as well as in embodied semantic processes during action
magery and action-language ( Hauk et al., 2004 ) tasks. Second, as a
omain-specific (semantic) control, we examined a multimodal seman-
ic network (SemN), associated with processing of integrative, modality-
eutral concepts ( Lambon Ralph et al., 2017 ). Finally, as a functionally
nspecific control, we assessed the visual network (VN), which plays no
istinctive roles in semantic processing (for details, see Supplementary
ata 4).
.5. Correlation analyses
For each group separately, we performed linear correlations between
cores from the four conditions of the naturalistic text task (i.e., verb-
elated information in the ATs, circumstantial information in the ATs,
erb-related information in the NTs, circumstantial information in the
Ts) and measures of (a) structural and (b) functional brain networks.
he former were based on the averaged FA in the tracts parcellated
ith the JHU atlas (10 structures). The latter considered the averaged
MRI functional connectivity maps of the seeds each rsFC networks (i.e.,
he MN, the SemN, and the VN). Given that the data was normally dis-
ributed for both the neuroimaging and naturalistic text task outcomes
FA data: Shapiro–Wilk test, p = 0.12; rsFC data: Shapiro–Wilk test,
= 0.21; AT data: Shapiro–Wilk test, p = 0.11; NT data: Shapiro–Wilk
est, p = 0.13), correlations were examined via Pearson’s correlation co-
fficient, at a threshold of p < .05, corrected for multiple comparisons
mong correlations via FDR ( Cai and Liu, 2016 ). This method is ade-
uate when multiple associations are being evaluated between complex
euroimaging measures and a behavioral task with a restricted range of
ossible values, as it controls the expected proportion falsely rejected
ypotheses better than more restrictive procedures ( Genovese et al.,
002 ). The structure of the neuroimaging experimental session is di-
grammed in Fig. 1 B and C, right inset.
.6. Machine learning analysis
Following machine-learning analysis guidelines ( Dobbin and Si-
on, 2011 ), we split the datasets in a ratio of 80% for training, and
0% for testing, using random division, to test for generalizability with-
ut employing the testing dataset during the validation phase for out-
f-folds predictions (for details, see Supplementary data 5). The 80/20
plit is the gold-standard for obtaining robust cross-validation results
cross fields ( Poldrack et al., 2017 ), including neuroimaging research
e.g., ( Lanka et al., 2020 )), in general, and neurolinguistic studies (e.g.,
Soto et al., 2020 )), in particular. We trained the model with all the set
f normalized features (i.e., verb-related and circumstantial information
utcomes in each text type, FA results for the 10 JHU atlas tracts, and
esults for each of the seeds in each of the rsFC networks). For the train-
ng phase in all our analyses, following best practices, we employed
S. Moguilner, A. Birba, D. Fino et al. NeuroImage 235 (2021) 117998
a
2
f
t
t
t
s
i
u
B
t
m
g
e
s
f
n
B
f
fi
a
p
p
c
c
(
c
a
l
s
t
c
p
t
2
a
3
3
[
f
l
c
b
M
i
a
a
s
y
s
c
c
y
S
[
[
a
F
3
(
s
e
l
c
s
[
t
a
i
F
3
i
t
a
[
M
d
p
S
3
c
r
i
s
d
F
s
(
m
p
3
h
a
t
h
s
R
s
b
w
c
e
t
0
f
B
k -fold cross-validation for hyper-parameter tuning ( Poldrack et al.,
019 ). First, we ran a classifier to discriminate between FLE patients
rom controls. Then, to test the specificity of potential results from
hat analysis, we examined the classification accuracy between PCE pa-
ients and controls, and then between FLE and PCE patients. To es-
ablish which features were the most relevant for each classification
cheme, we employed the feature importance analysis technique, built-
n in our machine learning algorithm ( Chen and Xgboost, 2016 ). We
sed a GBM classifier library called eXtreme Gradient Boosting (XG-
oost) ( Chen, 2016 ), because of its high accuracy and robustness rela-
ive to other algorithms, tuning its hyper-parameters by Bayesian Opti-
ization ( Zeng and Luo, 2017 ; Feurer, 2019 ). GBMs are based on the
radient boosting technique, in which ensembles of decision trees it-
ratively attempt to correct the classification errors of their predeces-
ors by minimizing a loss function (i.e., a function representing the dif-
erence between the estimated and true values) while pointing in the
egative gradient direction ( Mason LB and Bartlett, 1999 ). The XG-
oost classifier provides parallel computation tree boosting, enabling
ast and accurate predictions which have proven successful in several
elds ( Behravan et al., 2018 ; Zheng et al., 2017 ; Torlay et al., 2017 );
nd also regularized boosting, helping to reduce overfitting and thus
roviding more generalizable results. 63, 64 Following guidelines for re-
orting machine learning results ( Uddin et al., 2019 ), classification ac-
uracy values were accompanied by (i) calculations of the area under the
urve (AUC) of the receiver operating characteristic (ROC) curve, and
ii) confusion matrices capturing the sensitivity and specificity of each
lassification. The machine learning pipeline is diagrammed in Fig. 1 D.
To further test the robustness of naturalistic language measures rel-
tive to standard cognitive tasks, we performed an additional machine
earning analysis (employing the same pipeline as in the main analy-
is), incorporating outcomes from five domain-general measures (sub-
ests of visuospatial, attentional, language, abstraction, and delayed re-
all from the MoCA) and five executive measures (subtests of motor
rogramming, conflicting instructions, inhibitory control, proverb in-
erpretation, and working memory from the IFS).
.7. Data availability
All experimental data, as well as the scripts used for their collection
nd analysis, are fully available online ( Moguilner, 2020 ).
. Results
.1. Behavioral results
The AT yielded non-significant main effects of group
F (2,110) = 1.39, p = 0.25, 𝜂2 = 0.02] and a significant main ef-
ect of information type [ F (1,110) = 3.01, p = 0.02, 𝜂2 = 0.1], with
ower outcomes for verbs than circumstances. This pattern survived
ovariation with MoCA scores [ F (2,110) = 8.19, p = 0.01, 𝜂2 = 0.28)]
ut not with IFS scores [ F (2,110) = 1.14, p = 0.70, 𝜂2 = 0.09)].
ore crucially, a significant interaction emerged between group and
nformation type, which was preserved after covariation with MoCA
nd IFS scores [ F (2,110) = 8.14, p = 0.01, 𝜂2 = 0.26)]. A post-hoc
nalysis, via Tukey’s HSD test (MSE = 65.881, df = 104.63), revealed a
ignificant selective effect in the FLE group, with verb-related questions
ielding lower outcomes compared to circumstantial questions in the
ame group ( p = 0.01, d = 0.95) and to verb-related question in the
ontrol group ( p = 0.03, d = 0.85) ( Fig. 2 A). Every other pair-wise
omparison within and across FLE patients, controls, and PCE patients
ielded non-significant differences (all p -values > 0.10). For details, see
upplementary data 6.
As regards the NT, results revealed non-significant effects of group
F (2,110) = 0.309, p = 0.73, 𝜂2 = 0.006] and information type
F (1,110) = 3.56, p = 0.5, 𝜂2 = 0.032], as well as a non-significant inter-
6
ction between both factors [ F (1,110) = 0.387, p = 0.68, 𝜂2 = 0.007].
or details, see Supplementary data 7.
.2. DTI results
Local FA measurements revealed significantly lower WM integrity
p < 0.05, FWE corrected) for FLE patients than controls in bilateral
egments corresponding to the ATR tract ( Fig. 2 B, left inlet). No tract
xhibited higher FA for FLE patients than controls. Moreover, no other
ocal FA pairwise comparison between subject groups showed signifi-
ant differences in any tract. For details, see Supplementary data 8.
Global FA measures, averaged within the 10 JHU atlas tracts,
howed significantly lower WM integrity for FLE patients than controls
t (18) = 2.45, FDR-corrected p = 0.03, d = 0.83] in the bilateral ATR
ract. No other tract showed significant differences between FLE patients
nd controls in any direction. Also, no other global FA pairwise compar-
son between subject groups showed significant differences in any tract.
or details, see Supplementary data 9.
.3. fMRI results
Relative to controls, FLE patients exhibited MN hypoconnectivity,
ndexed by significantly lower (FDR-corrected p < 0.05) rsFC between
he bilateral M1 seeds and a cluster over the left parietal operculum
nd supramarginal gyrus ( Fig. 2 C, left inlet). The cluster’s peak t -score
t (18) = 3.58, p = 0.001, d = 0.87] was located in the following
NI coordinates: -50, -42, 24. No other seed yielded significant rsFC
ifferences in any of the remaining pairwise comparisons between FLE
atients, controls and PCE patients (all p -values > 0.13). For details, see
upplementary data 10.
.4. Correlation analysis results
In FLE patients, a strong positive correlation ( r = 0.869, FDR-
orrected p = 0.03) emerged between FA in the ATR tract and verb-
elated AT accuracy scores (i.e., action comprehension) ( Fig. 2 B, right
nlet). Every other correlation between FA and performance proved non-
ignificant across groups, tracts, and conditions (all p -values > 0.21). For
etails, see Supplementary data 11.
In the FLE group, we found a strong positive correlation ( r = 0.707,
DR-corrected p = 0.04) between averaged rsFC from the bilateral MN
eed and verb-related AT accuracy scores (i.e., action comprehension)
Fig. 2 C, right inlet). Every other correlation between wSDM and perfor-
ance proved non-significant across groups, seeds, and conditions (all
-values > 0.09). For details, see Supplementary data 12.
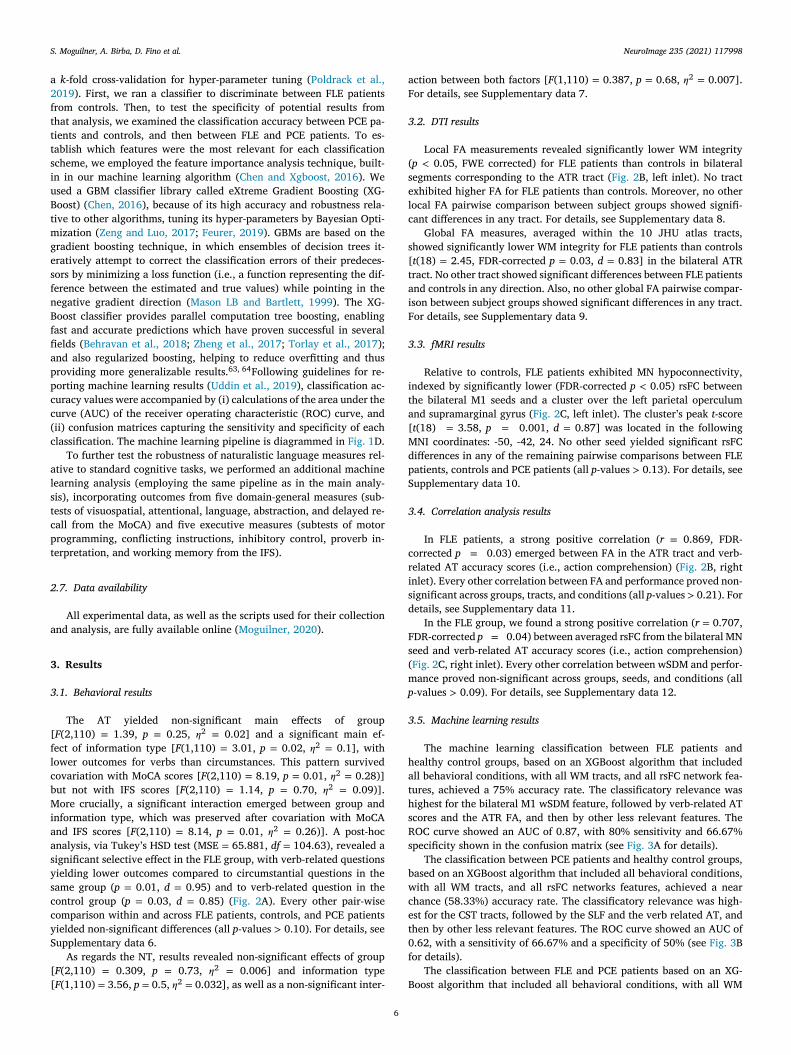
.5. Machine learning results
The machine learning classification between FLE patients and
ealthy control groups, based on an XGBoost algorithm that included
ll behavioral conditions, with all WM tracts, and all rsFC network fea-
ures, achieved a 75% accuracy rate. The classificatory relevance was
ighest for the bilateral M1 wSDM feature, followed by verb-related AT
cores and the ATR FA, and then by other less relevant features. The
OC curve showed an AUC of 0.87, with 80% sensitivity and 66.67%
pecificity shown in the confusion matrix (see Fig. 3 A for details).
The classification between PCE patients and healthy control groups,
ased on an XGBoost algorithm that included all behavioral conditions,
ith all WM tracts, and all rsFC networks features, achieved a near
hance (58.33%) accuracy rate. The classificatory relevance was high-
st for the CST tracts, followed by the SLF and the verb related AT, and
hen by other less relevant features. The ROC curve showed an AUC of
.62, with a sensitivity of 66.67% and a specificity of 50% (see Fig. 3 B
or details).
The classification between FLE and PCE patients based on an XG-
oost algorithm that included all behavioral conditions, with all WM

S. Moguilner, A. Birba, D. Fino et al. NeuroImage 235 (2021) 117998
Fig. 2. Behavioral, neuroimaging, and correlation results. (A) Behavioral results. The AT yielded a significant deficit for verbs (action verbs) in FLE patients, relative
to both circumstances in the same group and verbs in controls (no other pairwise contrast proved significant for the AT). The NT revealed non-significant differences
among groups or within any individual group. All results were covaried for MoCA and IFS scores. (B) DTI results and correlation with behavioral outcomes. Left
inset . Significant between-group differences for the FLE patients < Controls contrast in FA measures, revealing reduced white matter tract integrity in the ATR.
No differences were observed between PCE patients and any of the other two groups. Right inset . In FLE patients, FA of the ATR tracts selectively correlated with
accuracy for verbs in the ATs. No significant correlations emerged for any other tract in FLE patients nor for any tract at all in the other two groups. (C) Rs-FC
results and correlation with behavioral outcomes. Left inset . Significant between-group differences for the FLE patients < Controls contrast in the wSDM functional
connectivity map, showing reduced connectivity between the bilateral M1 region and the left parietal operculum and left supramarginal gyrus. Right inset . In FLE
patients, significant M1-posterior hypo-connectivity selectively correlated with accuracy for verbs in the ATs. No significant correlations emerged for any other
rs-FC seed in FLE patients nor for any seed at all in the other two groups. Asterisks ( ∗ ) indicate significant differences. FLE: frontal lobe epilepsy; PCE: posterior
cortex epilepsy; V: verb-related information; C: circumstantial information; DTI: diffusion tensor imaging; rs-fMRI: resting-state fMRI; re-FC: resting-state functional
connectivity; FA: fractional anisotropy; wSDM: weighted Symbolic Dependence Metric; ATR: anterior thalamic radiations; ATs: action texts; NTs: neutral texts.
7
S. Moguilner, A. Birba, D. Fino et al. NeuroImage 235 (2021) 117998
Fig. 3. Machine learning results. (A) FLE patients vs controls. ROC curve indicating specificity (true positive rate) and sensitivity (false positive rate), while calcu-
lating the area under the curve. Confusion matrix for true label and predicted label accuracy details. Feature importance plot of the most relevant features for the
classification. Results show a 75% accuracy rate, an AUC of 0.87, a sensitivity of 80%, and a specificity of 66.67%, with the bilateral M1: wSDM value as the top
feature, followed by AT verbs. (B) PCE patients vs controls. ROC curve indicating specificity (true positive rate) and sensitivity (false positive rate), while calculating
the area under the curve. Confusion matrix for true label and predicted label accuracy details. Feature importance plot of the most relevant features for the classifi-
cation. Results yielded a near-chance accuracy rate (58.33%), with an AUC of 0.62, with a sensitivity of 66.67% and a specificity of 50% specificity (C) PCE vs FLE
patients. ROC curve indicating specificity (true positive rate) and sensitivity (false positive rate), while calculating the area under the curve. Confusion matrix for
true label and predicted label accuracy details. Feature importance plot of the most relevant features for the classification. Results yielded a 75% accuracy rate, an
AUC of 0.80, a sensitivity of 66.67%, and a specificity of 80%, with the ATR FA value as the top feature, followed by bilateral M1 wSDM and then by verb-related
AT outcomes. ROC: Receiver operating characteristic, AUC: Area under the curve, FLE: Frontal lobe epilepsy, PCE: Posterior cortex epilepsy, ATR: anterior thalamic
radiations, SLF: superior longitudinal fasciculus, UNC: uncinate fasciculus, M1: Primary motor cortex, wSDM: weighted Symbolic Dependence Metric.
t
c
e
r
s
f
s
t
t
a
t
t
s
a
t
b
n
h
d
4
a
l
m
t
t
t
r
c
a
s
racts, and all rsFC networks features, achieved a 75% accuracy rate. The
lassificatory relevance was highest for ATR FA, followed by the bilat-
ral M1 wSDM value and verb-related AT scores, and then by other less
elevant features. The ROC curve showed an AUC of 0.80, with 66.67%
ensitivity and 80% specificity (see Fig. 3 C for details).
Finally, to assess the relevance of considering the naturalistic task
eatures, we executed the same classification analyses but only con-
idering the FA of the WM tracts and rsFC networks. Importantly,
he classification results reported above were markedly higher than
hose obtained upon exclusion of the linguistic variables, indicating that
ction-verb comprehension is a substantial contributor to the differen-
iation of FLE patients from both controls and PCE patients (see de-
ails in Supplementary data 13). An additional machine learning analy-
is including diverse cognitive and executive scores corroborated that
ction-language processing and its neural correlates remained at the
op of the feature importance rankings distinguishing FLE patients from
oth controls and PCE patients. Conversely, such coarse-grained cog-
itive variables had negligible contribution to classification accuracy,
h8
ighlighting the relevance of our naturalistic tasks (see Supplementary
ata 14).
. Discussion
Through a combination of multimodal (behavioral, tractographic,
nd rsFC) measures, inferential statistics, and data-driven machine
earning, our study revealed differential and ecological neurocognitive
arkers of FLE. Unlike PCE patients, those with FLE had selective ac-
ion discourse deficits specifically associated with structural and func-
ional alterations along motor-related networks. Moreover, that selec-
ive deficit had major weight in discriminating individual FLE patients
elative to controls and, more importantly, PCE patients. Below we dis-
uss these findings in detail.
FLE patients exhibited selective verb-related deficits in the ATs
nd no deficits in either NT category. This pattern, previously ob-
erved in Parkinson’s disease ( xxxxGarcia et al., 2018 ), points to
ighly focal impairments in action comprehension, as opposed to lan-

S. Moguilner, A. Birba, D. Fino et al. NeuroImage 235 (2021) 117998
g
a
i
t
s
g
r
t
c
i
t
e
c
p
r
n
s
s
t
c
t
t
F
t
t
e
t
i
m
i
(
t
A
r
a
o
t
c
e
i
P
a
s
e
a
r
u
I
F
n
i
a
c
h
n
r
a
f
F
s
1
c
f
t
fi
f
m
s
o
a
u
(
c
t
n
i
k
c
(
F
c
K
t
i
i
2
c
t
t
D
P
v
c
p
t
t
t
a
2
u
c
t
e
t
A
4
s
W
s
t
c
t
t
w
c
t
w
p
v
t
d
n
uage or even verb-related information in general. Indeed, selective
ction-semantic difficulties are systematic across disorders present-
ng frontal motor-network damage, including Parkinson’s, Hunting-
on’s, and motor-neuron disease as well as amyotrophic lateral sclero-
is ( Garcia et al., 2018 ). Crucially, this deficit was exclusive to the FLE
roup. PCE patients had preserved outcomes in all text categories, cor-
oborating previous evidence of spared action semantics following pos-
erior cortical damage ( Bak, 2003 ).
Of note, in the AT, verb scores were overall lower than those of cir-
umstantial questions, replicating previous results from the same task
n Parkinson’s disease patients ( García et al., 2018 ) and corroborating
hat verbs may involve greater processing demands than other word cat-
gories ( Vigliocco et al., 2011 ). Interestingly, this effect remained after
ovariation with MoCA scores, but not with IFS scores, suggesting that
rocessing of this category may be more related to executive function
ather than overall cognitive status –although more research would be
eeded to directly test this conjecture.
Importantly, however, patients exhibited normal MoCA and IFS
cores, all the key interaction effect survived covariation for both mea-
ures, and key subtests from these instruments exhibited negligible con-
ribution in complementary classification analyses, highlighting the dis-
riminatory value of our naturalistic measures (see Supplementary ma-
erial 14). Hence, as reported in other populations ( Garcia et al., 2018 ),
he selective and differential action-comprehension deficits observed in
LE patient cannot be attributed to domain-general cognitive dysfunc-
ion. This underscores the relevance of our text-based results, showing
hat action-language tasks can capture significant and selective deficits
ven when classical measures fail to do so.
Such deficits were distinctively correlated with reduced white mat-
er integrity along the ATR, a tract that was preserved in PCE and which
s often compromised in FLE ( Law et al., 2018 ). ATR alterations underlie
otor-function decay in healthy adults ( Philp et al., 2014 ) and neurolog-
cal conditions ( Isaacs et al., 2019 ) typified by action-semantic deficits
Birba et al., 2017 ). Indeed, this and other subcortical motor struc-
ures are directly implicated in action-language processing ( Llano, 2013 ;
kinina et al., 2019 ), and their anatomical disruption correlates with the
ecruitment of non-canonical cortical motor pathways for action-verb
ccess ( Abrevaya et al., 2017 ). Accordingly, the differential impairment
bserved in FLE was also related to putative structural networks distinc-
ively affected in this epilepsy subtype ( Lin et al., 2020 ).
Action comprehension deficits in FLE were also specifically
orrelated with hypoconnectivity between M1 and left pari-
tal/supramarginal regions. Whereas action-verb processing crit-
cally hinges on cortical motor circuits ( Pulvermuller, 2018 ;
ulvermuller, 2013 ; Birba et al., 2020a ). It has also been system-
tically related to secondary contributions of posterior areas that
ubserve multimodal semantics ( Garcia et al., 2019 ), including pari-
tal and supramarginal hubs ( Pulvermuller, 2018 ). In fact, selective
ction-verb impairments in other neurological conditions entail aber-
ant functional connectivity between motor and posterior regions
nderpinning general semantic processes ( Abrevaya et al., 2017 ).
mportantly, no other correlation with rsFC patterns emerged in either
LE or PCE patients, further highlighting the specificity of the former’s
eurocognitive disruption.
Moreover, action comprehension deficits were highly relevant to
dentify individual FLE patients. Machine learning results yielded 75%
ccuracy in discriminating these subjects from both controls and, more
rucially, PCE patients. In these settings, action comprehension showed
igh feature importance, even surpassing other structural and functional
etwork markers. Indeed, the only two features with greater weight cor-
esponded to tractographic and rsFC substrates specifically associated to
ction verbs –namely, the ATR ( Llano, 2013 ; Akinina et al., 2019 ) and
unctional motor networks ( Abrevaya et al., 2017 ; Birba et al., 2020a ).
urthermore, removal of action comprehension outcomes from the clas-
ifiers substantially reduced patient identification (Supplementary data
3), which emphasizes their discriminatory relevance. In the same vein,
9
omprehension of actions in naturalistic stories was shown to outper-
orm validated executive function tests in identifying patients with fron-
obasal atrophy, yielding over 80% accuracy ( Garcia et al., 2018 ). These
ndings, together with the near-chance classification outcomes found
or PCE patients vis-à-vis controls, suggest that action comprehension
ay contribute to the differentiation between FLE and PCE even on a
ubject-by-subject basis.
An additional highlight, in this sense, is that our task was based
n highly ecological texts. As argued elsewhere ( Carreno and Don-
ire, 2008 ), cognitive dysfunctions in frontal disorders are better tracked
nder naturalistic conditions. Yet, traditional neuropsychological tests
tapping such domains as working memory, visuo-constructional skills,
alculation, or visual memory) ( Kurzbuch et al., 2013 ) rely on decontex-
ualized and randomly sequenced materials, potentially leading to false
egatives ( Carreno and Donaire, 2008 ; Elger et al., 2004 ). Our natural-
stic text framework partly overcomes these shortcomings by capturing
ey aspects of daily language processing with context-rich narratives
haracterized by cohesion, coherence, and unfolding semantic relations
Birba et al., 2020a ; Garcia et al., 2018 ; Trevisan and García, 2019 ;
ranceschini et al., 2017 ). Accordingly, our approach also meets re-
ent demands for more ecological assessments of language ( Verga and
otz, 2018 ), in general, and FLE ( Carreno and Donaire, 2008 ), in par-
icular. More specifically, this approach informs recent calls for stud-
es that inform neurocognitive models of naturalistic language process-
ng ( Verga and Kotz, 2018 ), including embodied domains ( Birba et al.,
020b ).
Taken together, our results address recent calls for finding spe-
ific cognitive markers of FLE ( Elger et al., 2004 ). Classical cognitive
ests in epilepsy show that FLE patients are often impaired in atten-
ion, memory, verbal fluency, and language processing ( Carreno and
onaire, 2008 ). However, each of these domains is also affected in
CE ( Cahn-Weiner et al., 2009 ), which undermines their discriminatory
alue as specific cognitive markers of FLE. Moreover, coarse-grained
ognitive profiles in epilepsy are heterogeneous, with diverse patho-
hysiological mechanisms influencing their manifestation across pa-
ients ( Elger et al., 2004 ) Our embodied framework, focused on ac-
ion semantics, seems to circumvent this limitation by revealing deficits
hat are exclusive to FLE, correlated with core anatomo-functional alter-
tions of this disorder, ( Pulvermuller, 2018 , Llano, 2013 , Akinina et al.,
019 ) , ( Pulvermuller, 2013 Sep ) and robust for discriminating individ-
al FLE and PCE patients when combined with structural and functional
onnectivity measures. Thus, unlike standard cognitive tasks, paradigms
apping action semantics and relevant multimodal neuroimaging mark-
rs could complement differential diagnosis tools and even support es-
imations of the course of pathology across patients. ( Birba et al., 2017
ug 02 )
.1. Limitations and avenues for future studies
Our work is not without limitations. First, although our sample
ize was similar to or larger than those of previous reports ( Cahn-
einer et al., 2009 ; Lambon Ralph et al., 2012 ) and it conferred high
tatistical power (see Section 2.1 ), it would be desirable to replicate
his experiment with larger N s. Second, whereas our neuropsychologi-
al protocol including several tasks and subtasks tapping diverse cogni-
ive domains, future renditions should incorporate additional classical
ests for comparison across epilepsy subtypes. Moreover, further work
ould be necessary to ascertain the extent to which this new paradigm
an reveal distinguishing neurocognitive traits of FLE in clinical set-
ings. Third, behavioral outcomes were not measured whilst the subject
as in the scanner. Even though this was a strategic choice to prevent
oor audibility within the scanner, future adaptations should explore in
ivo signatures of naturalistic text processing, as recently done in elec-
roencephalographic research ( Birba et al., 2020a ). Fourth, we lacked
etailed information about the patients’ medication status. Given that
eurotransmitter bioavailability may modulate action language process-
S. Moguilner, A. Birba, D. Fino et al. NeuroImage 235 (2021) 117998
i
F
n
F
g
v
f
i
e
i
(
a
F
t
5
t
l
fi
s
t
a
C
W
D
H
T
S
&
V
E
D
a
f
2
D
A
R
1
6
C
A
i
t
c
t
b
N
i
S
t
R
A
A
B
B
B
B
B
B
C
C
C
C
C
D
E
F
F
F
F
G
G
G
G
G
G
G
G
G
H
H
ng ( Herrera et al., 2012 ), new studies should factor this variable in.
ifth, beyond our focus on FLE, our framework lays the groundwork for
ew embodied designs seeking specific markers of other epilepsy types.
inally, our study collapsed all non-frontal subtypes within a single PCE
roup ( Fogarasi et al., 2003 ; Yu et al., 2009 ). While this follows pre-
ious reports ( Bak, 2003 ) and proves strategic given our focus on FLE,
uture studies should aim to disentangle the specific patterns character-
zing ecological language processing in occipital, temporal, and parietal
pilepsy cohorts separately. Indeed, the lack of DTI and rsFC alterations
n PCE may partly reflect the conflation of heterogeneous patient profiles
Yu et al., 2009 ), as noted in a review ( Leyden et al., 2015 ). Moreover,
recent study shown that white matter disruptions are more severe in
LE than in temporal lobe epilepsy ( Lin Huan et al., 2020 ), suggesting
hat they may be better captured in the former.
. Conclusion
Our study suggests that action discourse tasks, supported with struc-
ural and functional connectivity metrics, may reveal differential, eco-
ogical, and neurally grounded markers of FLE relative to PCE. These
ndings directly address strong calls to identify sensitive cognitive mea-
ures that discriminate among epilepsy subtypes. Further work along
hese lines can nurture a promising agenda at the crossing of neurology
nd cognitive neuroscience.
redit author statement
Sebastian Moguilner: Methodology, Formal analysis, Data curation,
riting - Original draft. Agustina Birba: Methodology. Daniel Fino:
ata acquisition. Roberto Isoardi: Resources, Data acquisition. Celeste
uetagoyena: Data acquisition. Raul Otoya: Data acquisition. Viviana
irapu: Data acquisition. Fabian Cremaschi: Data acquisition. Lucas
edeño: Methodology. Agustín Ibáñez: Methodology, Writing - Review
Editing, Funding acquisition. Adolfo M. García: Conceptualization,
alidation, Methodology, Writing - Original draft, Writing - Review &
diting, Supervision, Funding acquisition, Project administration.
ata and code availability statement
All experimental data, as well as the scripts used for their collection
nd analysis, are fully available online.[1]
1. Moguilner, S., Data from “Multimodal neurocognitive markers of
rontal lobe epilepsy ” Open Science Framework. https://osf.io/csd7z/.
020.
eclaration of Competing Interest
None of the authors has any conflict of interest to disclose.
cknowledgments
This work is supported by grants from CONICET; ANID/FONDECYT
egular ( 1210176 and 1210195 ); FONCYT-PICT ( 2017-1818 , 2017-
820 ); FONDAP ( 15150012 ); Takeda (CW2680521); GBHI ALZ UK-20-
39295; Programa Interdisciplinario de Investigación Experimental en
omunicación y Cognición (PIIECC), Facultad de Humanidades, US-
CH; and the Multi-Partner Consortium to Expand Dementia Research
n Latin America (ReDLat), funded by the National Institutes of Aging of
he National Institutes of Health ( R01AG057234 ), an Alzheimer’s Asso-
iation grant (SG-20-725707-ReDLat), the Rainwater Foundation, and
he Global Brain Health Institute. The content is solely the responsi-
ility of the authors and does not represent the official views of the
ational Institutes of Health, Alzheimer’s Association, Rainwater Char-
table Foundation, or Global Brain Health Institute.
10
upplementary materials
Supplementary material associated with this article can be found, in
he online version, at doi:10.1016/j.neuroimage.2021.117998 .
eferences
brevaya, S , Sedeño, L. , Fitipaldi, S. , Pineda, D. , Lopera, F. , Buritica, O. , Villegas, A. ,
Bustamante, C. , Gomez, D. , Trujillo, N. , Pautassi, R. , Ibáñez, A. , García, A.M. , 2017.
The road less traveled: alternative pathways for action-verb processing in Parkinson’s
disease. J. Alzheimers Dis. 55, 1429–1435 .
kinina, Y , Dragoy, O. , Ivanova, M.V. , Iskra, E.V. , Soloukhina, O.A. , Petryshevsky, A.G. ,
Fedin а , O.N. , Turken, A.U. , Shklovsky, V.M. , Dronkers, N.F. , 2019. Grey and white
matter substrates of action naming. Neuropsychologia 131, 249–265 .
ak, THHJR. , 2003. Kissing and Dancing – a test to distinguish the lexical and conceptual
contributions to noun /verb and action / object dissociation. J. Neuroling 16 .
ehravan, H , Hartikainen, JM , Tengstrom, M , Pylkas, K , Winqvist, R , Kosma, VM , et al. ,
2018. Machine learning identifies interacting genetic variants contributing to breast
cancer risk: a case study in Finnish cases and controls. Sci. Rep. 8, 13149 .
irba, A , Beltran, D , Martorell Caro, M , Trevisan, P , Kogan, B , Sedeno, L , et al. , 2020a.
Motor-system dynamics during naturalistic reading of action narratives in first and
second language. Neuroimage 8, 116820 .
irba, A , Vitale, F , Padron, I , Dottori, M , de Vega, M , Zimerman, M , Sedeño, L , Ibáñez, A ,
García, AM , 2020b. Electrifying discourse: anodal tDCS of the primary motor cortex
selectively reduces action appraisal in naturalistic narratives. Cortex .
irba, A , Garcia-Cordero, I , Kozono, G , Legaz, A , Ibanez, A , Sedeno, L , et al. , 2017. Los-
ing ground: Frontostriatal atrophy disrupts language embodiment in Parkinson’s and
Huntington’s disease. Neurosci. Biobehav. Rev. 80, 673–687 .
raakman, HM , Vaessen, MJ , Jansen, JF , Debeij-van Hall, MH , de Louw, A , Hofman, PA ,
et al. , 2013. Frontal lobe connectivity and cognitive impairment in pediatric frontal
lobe epilepsy. Epilepsia 54, 446–454 .
ahn-Weiner, DA , Wittenberg, D. , McDonald, C , 2009. Everyday cognition in temporal
lobe and frontal lobe epilepsy. Epileptic Disord. 11, 222–227 .
ai, TT , Liu, W. , 2016. Large-scale multiple testing of correlations. J. Am. Stat. Assoc. 111,
229–240 .
ao, X , Qian, Z. , Xu, Q. , Shen, J. , Zhang, Z. , Lu, G. , 2014. Altered intrinsic connectivity
networks in frontal lobe epilepsy: a resting-state fMRI study. Comput. Math. Methods
Med. .
arreno, M , Donaire, A , 2008. Sanchez-Carpintero R. Cognitive disorders associated with
epilepsy: diagnosis and treatment. Neurologist 14 S26-34 .
hen, TG , Xgboost, C. , 2016. A scalable tree boosting system. In: Proceedings of the 22Nd
ACM SIGKDD International Conference on Knowledge Discovery and Data Mining,
pp. 785–794 .
obbin, KK , Simon, R.M. , 2011. Optimally splitting cases for training and testing high
dimensional classifiers. BMC Med. Genet. 2011 .
lger, CE , Helmstaedter, C. , Kurthen, M. , 2004. Chronic epilepsy and cognition. Lancet
Neurol. 3, 663–672 .
eurer, M.HF , 2019. Hyperparameter Optimization. Automated Machine Learning The
Springer Series on Challenges in Machine Learning. Springer .
isher, RS , Acevedo, C , Arzimanoglou, A , Bogacz, A , Cross, JH , Elger, CE , et al. , 2014.
ILAE official report: a practical clinical definition of epilepsy. Epilepsia 55, 475–482 .
ogarasi, A , Boesebeck, F. , Tuxhorn, I. , 2003. A detailed analysis of symptomatic posterior
cortex seizure semiology in children younger than seven years. Epilepsia 44, 89–96 .
ranceschini, S , Trevisan, P. , Ronconi, L. , Bertoni, S. , Colmar, S. , Double, K. , Facoetti, A. ,
Gori, S. , 2017. Action video games improve reading abilities and visual-to-auditory
attentional shifting in English-speaking children with dyslexia. Sci. Rep. 7, 5863 .
aißer, S , Ruppert, M , Schmid, F. , 2010. A multivariate version of Hoeffding’s Phi-Square.
J. Multivariate Anal. 101, 2571–2586 .
arcía, AM , Abrevaya, S , Kozono, G , Cordero, IG , Córdoba, M , Kauffman, MA , et al. , 2016.
The cerebellum and embodied semantics: evidence from a case of genetic ataxia due
to STUB1 mutations. J. Med. Genet. 54, 114–124 .
arcia, AM , Bocanegra, Y , Herrera, E , Moreno, L , Carmona, J , Baena, A , et al. , 2018.
Parkinson’s disease compromises the appraisal of action meanings evoked by natural-
istic texts. Cortext 100, 111–126 .
arcía, AM , Bocanegra, Y , Herrera, E , Moreno, L , Carmona, J , Baena, A , et al. , 2018.
Parkinson’s disease compromises the appraisal of action meanings evoked by natural-
istic texts. In: Cortex, 100, pp. 111–126 .
arcia, AM , Hesse, E , Birba, A , Adolfi, F , Mikulan, E , Caro, MM , et al. , 2020. Time to face
language: embodied mechanisms underpin the inception of face-related meanings in
the human brain. Cereb. Cortex .
arcía, AM , Ibáñez, A. , 2016. A touch with words: dynamic synergies between manual
actions and language. Neurosci. Biobehav. Rev. 68, 59–95 .
arcia, AM , Moguilner, S , Torquati, K , Garcia-Marco, E , Herrera, E , Munoz, E , et al. , 2019.
How meaning unfolds in neural time: Embodied reactivations can precede multimodal
semantic effects during language processing. Neuroimage 197, 439–449 .
arcía, AM , Moguilner, S , Torquati, K , García-Marco, E , Herrera, E , Muñoz, E , et al. , 2019.
How meaning unfolds in neural time: embodied reactivations can precede multimodal
semantic effects during language processing. Neuroimage 2019/05/03/ .
enovese, CR , Lazar, NA , Nichols, T. , 2002. Thresholding of statistical maps in functional
neuroimaging using the false discovery rate. Neuroimage 15, 870–878 .
auk, O , Johnsrude, I , Pulvermuller, F. , 2004. Somatotopic representation of action words
in human motor and premotor cortex. Neuron 41, 301–307 2004 1/22/ .
ernandez MT, SH , Jambaque, I , et al. , 2003. Attention, memory and behavioral adjust-
ment in children with frontal lobe epilepsy. Epilepsy Behav. 4, 522–536 .
S. Moguilner, A. Birba, D. Fino et al. NeuroImage 235 (2021) 117998
H
H
H
I
K
K
K
L
L
J
L
L
L
L
L
L
L
M
M
M
M
N
N
O
O
P
P
P
P
P
P
R
S
S
S
S
T
T
T
T
U
V
V
W
W
W
Y
Z
Z
errera, E , Cuetos, F. , Ribacoba, R. , 2012. Verbal fluency in Parkinson’s disease patients
on/off dopamine medication. Neuropsychologia 50, 3636–3640 .
oeffding, W. , 1940. Masstabinvariante korrelationstheorie schrift math seminars. Inst.
Angew. Math. Univ. Berlin 5, 181–233 .
ua, K , Zhang, J , Wakana, S , Jiang, H , Li, X , Reich, DS , et al. , 2008. Tract probability
maps in stereotaxic spaces: analyses of white matter anatomy and tract-specific quan-
tification. Neuroimage 39, 336–347 .
saacs, BR , Trutti, AC , Pelzer, E , Tittgemeyer, M , Temel, Y , Forstmann, BU , et al. , 2019.
Cortico-basal white matter alterations occurring in Parkinson’s disease. PLoS One 14
e0214343 .
ellinghaus, C , Lüders, H.O. , 2004. Frontal lobe epilepsy. Epileptic Disord. 6, 223–239 .
inney, J , Atwal, G. , 2014. Equitability, mutual information, and the maximal information
coefficient. Proc. Natl. Acad. Sci. USA 111, 3354–3359 .
urzbuch, K , Pauli, E. , Gaál, L. , Kerling, F. , Kasper, B.S. , Stefan, H. , Hamer, H. , Graf, W. ,
2013. Computerized cognitive testing in epilepsy (CCTE): a new method for cognitive
screening. Seizure 22, 424–432 .
ambon Ralph, MA , Ehsan, S , Baker, GA , Rogers, TT , 2012. Semantic memory is impaired
in patients with unilateral anterior temporal lobe resection for temporal lobe epilepsy
Brain. J. Neurol. 135, 242–258 .
ambon Ralph, MA , Jefferies, E , Patterson, K , Rogers, TT , 2017. The neural and compu-
tational bases of semantic cognition. Nat. Rev. Neurosci. 18, 42–55 .
r Lanka, P , Rangaprakash, D. , Dretsch, M.N. , Katz, J.S. , Denney, T.S. , Deshpande, G ,
2020. Supervised machine learning for diagnostic classification from large-scale neu-
roimaging datasets. Brain Imaging Behav. 14, 2378–2416 .
aw, N , Smith, ML , Widjaja, E. , 2018. Thalamocortical connections and executive func-
tion in pediatric temporal and frontal lobe epilepsy. AJNR Am. J. Neuroradiol. 39,
1523–1529 .
esk, A. , 2002. Introduction to Bioinformatics Oxford. University Press .
eyden, KM , Kucukboyaci, N.E. , Puckett, O.K. , Lee, D. , Loi, R.Q. , Paul, B. , McDonald, C.R. ,
2015. What does diffusion tensor imaging (DTI) tell us about cognitive networks in
temporal lobe epilepsy? Quant. Imaging Med. Surg. 5, 247–263 .
in Huan, L. , Chunhong, Q. , Wensheng, W. , Chi, Z. , Shijun, Q. , 2020. Altered white matter
structural network in frontal and temporal lobe epilepsy: a Graph-Theoretical Study.
Front. Neurol. 11, 561 .
in, H , Leng, X , Qin, C , Wang, W , Zhang, C , Qiu, S. , 2020. Altered white matter struc-
tural network in frontal and temporal lobe epilepsy: a graph-theoretical study. Front.
Neurol. 11 .
lano, DA. , 2013. Functional imaging of the thalamus in language. Brain Lang. 126, 62–72 .
üders, HA , Baumgartner, J. , Benbadis, C. , Bleasel, S. , A.Burgess, R. , et al. , 1998. Semio-
logical seizure classification. Epilepsia 39, 1006–1013 .
ason LB, J. , Bartlett, P.L. , 1999. Frean, Marcus. Boosting algorithms as gradient descent
in function space. In: Proceedings of the 12th International Conference on Neural
Information Processing Systems .
oguilner, S , García, A.M. , Mikulan, E. , Del Carmen García, M. , Vaucheret, E. , Amar-
illo, Y. , Bekinschtein, T.A. , Ibáñez, A. , 2017. An unaware agenda: interictal conscious-
ness impairments in epileptic patients. Neurosci. Conscious. 1 .
oguilner, S , Garcia, AM , Mikulan, E , Hesse, E , Garcia-Cordero, I , Melloni, M , et al. , 2018.
Weighted Symbolic Dependence Metric (wSDM) for fMRI resting-state connectivity:
a multicentric validation for frontotemporal dementia. Sci. Rep. 8, 11181 .
oguilner, S. , 2020. Data from “Multimodal Neurocognitive Markers of Frontal Lobe
Epilepsy ” Open Science Framework https://osf.io/csd7z/ .
asreddine, ZS , Phillips, NA , Bedirian, V , Charbonneau, S , Whitehead, V , Collin, I , et al. ,
2005. The montreal cognitive assessment, MoCA: a brief screening tool for mild cog-
nitive impairment. J. Am. Geriatr. Soc. 53, 695–699 .
elsen, R. , 2006. An Introduction to Copulas. (Springer Series in Statistics) .
ldfield, RC. , 1971. The assessment and analysis of handedness: the Edinburgh Inventory.
Neuropsychologia 9, 97–113 .
rozco-Arroyave, JR , Vásquez-Correa, JC , Vargas-Bonilla, JF , Arora, R , Dehak, N , Nida-
davolu, PS , et al. , 2018. NeuroSpeech: an open-source software for Parkinson’s speech
analysis. Digit. Signal Process. 77, 207–221 .
11
eran, P , Rascol, O. , Demonet, J.F. , Celsis, P. , Nespoulous, J.L. , Dubois, B. , Cardebat, D. ,
2003. Deficit of verb generation in nondemented patients with Parkinson’s disease.
Mov. Disord. 18, 150–156 .
hilp, DJ , Korgaonkar, M.S. , Grieve, S.M. , 2014. Thalamic volume and thalamo-cortical
white matter tracts correlate with motor and verbal memory performance. Neuroim-
age Clin. 91 .
oldrack, RA , Baker, CI , Durnez, J , Gorgolewski, KJ , Matthews, PM , Munafo, MR , et al. ,
2017. Scanning the horizon: towards transparent and reproducible neuroimaging re-
search Nature reviews. Neuroscience 18, 115–126 .
oldrack, RA , Huckins, G , Varoquaux, G. , 2019. Establishment of best practices for evi-
dence for prediction. A review. JAMA Psychiatry .
ulvermuller, F. , 2013. How neurons make meaning: brain mechanisms for embodied and
abstract-symbolic semantics. Trends Cognit. Sci. 17, 458–470 .
ulvermuller, F. , 2018. Neural reuse of action perception circuits for language, concepts
and communication. Prog. Neurobiol. 160, 1–44 .
isse, GL. , 2006. Cognitive outcomes in patients with frontal lobe epilepsy. Epilepsia 47,
87–89 .
cheffer, IE , Berkovic, S. , Capovilla, G. , Connolly, M.B. , French, J. , Guilhoto, L. , Hirsch, E. ,
Jain, S. , Mathern, G.W. , Moshé, S.L. , Nordli, D.R. , Perucca, E. , Tomson, T. , Wiebe, S. ,
Zhang, Y.H. , Zuberi, S.M , 2017. ILAE classification of the epilepsies: position paper
of the ILAE Commission for Classification and Terminology. Epilepsia 58, 512–521 .
klar, A. , 1959. Fonctions de repartition a‘ n dimensions et leurs marges. Publ. Inst. Stat.
Univ. Paris 8 .
oto, D , Sheikh, U.A. , Mei, N. , Santana, R. , 2020. Decoding and encoding models reveal
the role of mental simulation in the brain representation of meaning. R. Soc. Open
Sci. 7, 192043 .
zabo, Z. , 2014. Information theoretical estimators toolbox. J. Mach. Learn. Res. 15 .
orlay, L , Perrone-Bertolotti, M , Thomas, E , Baciu, M , 2017. Machine learning-XGBoost
analysis of language networks to classify patients with epilepsy. Brain Inform. 4,
159–169 .
orralva, T , Roca, M. , Gleichgerrcht, E. , Lopez, P. , Manes, F.I. , 2009. Frontal Screening
(IFS): a brief, sensitive, and specific tool to assess executive functions in dementia. J.
Int. Neuropsychol. Soc. 15, 777–786 .
raianou, A , Patrikelis, P. , Kosmidis, M.H. , Kimiskidis, V.K. , Gatzonis, S. , 2019. The neu-
ropsychological profile of parietal and occipital lobe epilepsy. Epilepsy Behav. 94,
137–143 .
revisan, P , García, A.M. , 2019. Systemic functional grammar as a tool for experimen-
tal stimulus design: new appliable horizons in psycholinguistics and neurolinguistics
Language. Sciences 75 .
ddin S, Khan, A., Hossain, M. et al. Comparing different supervised machine learning
algorithms for disease prediction 2019. 2019;BMC Med Inform Decis Mak:281.
erga, L , Kotz, SA. , 2018. Putting language back into ecological communication contexts
Language. Cognit. Neurosci. 34, 536–544 .
igliocco, G , Vinson, DP , Druks, J , Barber, H , Cappa, SF. , 2011. Nouns and verbs in the
brain: a review of behavioural, electrophysiological, neuropsychological and imaging
studies. In: Neurosci. Biobehav. Rev., 35, pp. 407–426 .
echsler, D. , 1999. Wechsler Abbreviated Scale of Intelligence San. The Psychological
Corporation, Antonio, TX .
idjaja, E , Zamyadi, M. , Raybaud, C. , Snead, O.C. , Smith, M.L. , 2013. Abnormal func-
tional network connectivity among resting-state networks in children with frontal
lobe epilepsy. AJNR Am. J. Neuroradiol. 34, 2386–2392 .
oodward, KE , Gaxiola-Valdez, I. , Goodyear, B.G. , Federico, P. , 2014. Frontal lobe
epilepsy alters functional connections within the brain’s motor network: a resting-s-
tate fMRI study. Brain Connect. 4, 91–99 .
u, T , Wang, Y. , Zhang, G. , Cai, L. , Du, W. , Li, Y. , 2009. Posterior cortex epilepsy: diag-
nostic considerations and surgical outcome. Seizure 18, 288–292 .
eng, X , Luo, G. , 2017. Progressive sampling-based Bayesian optimization for efficient
and automatic machine learning model selection. Health Inf. Sci. Syst., 5 .
heng, H , Yuan, J , Chen, L. , 2017. Short-term load forecasting using EMD-LSTM neural
networks with a xgboost algorithm for feature importance. Eval. Energies 10, 1168 .
Related Documents