Research Article Multifunctional Analysis of CD4 + T-Cell Response as Immune-Based Model for Tuberculosis Detection Miriam Lichtner, 1,2 Claudia Mascia, 1 Ilaria Sauzullo, 1 Fabio Mengoni, 1 Serena Vita, 1 Raffaella Marocco, 2 Valeria Belvisi, 2 Gianluca Russo, 1 Vincenzo Vullo, 1 and Claudio M. Mastroianni 1,2 1 Department of Public Health and Infectious Diseases, Istituto Pasteur-Fondazione Cenci Bolognetti, Sapienza University, Piazzale Aldo Moro 5, 00185 Rome, Italy 2 Infectious Diseases Unit, Sapienza University, Corso della Repubblica 79, 04100 Latina, Italy Correspondence should be addressed to Claudio M. Mastroianni; [email protected] Received 17 September 2014; Revised 30 December 2014; Accepted 30 December 2014 Academic Editor: Vishwanath Venketaraman Copyright © 2015 Miriam Lichtner et al. is is an open access article distributed under the Creative Commons Attribution License, which permits unrestricted use, distribution, and reproduction in any medium, provided the original work is properly cited. Mono- and multifunctional specific CD4 + and CD8 + T-cell responses were evaluated to improve the immune-based detection of active tuberculosis (TB) and latent infection (LTBI). We applied flow cytometry to investigate cytokines profile (IFN-, TNF- , and IL-2) of T cells aſter stimulation with TB antigens in 28 TB-infected subjects (18 active TB and 10 LTBI) and 10 uninfected controls. Cytokines production by CD4 + T cells at single-cell levels was higher in TB-infected subjects than uninfected controls ( < 0.0001). Assigning to activated CD4 + T cells, producing any of the three cytokines, a cut-off >0.45%, it was possible to differentiate TB-infected (>0.45%) by uninfected subjects (<0.45%). Among TB-infected subjects, the frequencies of multifunctional CD4 + T cells, simultaneously producing all 3 cytokines, are lower in active TB than LTBI subjects ( = 0.003). us, assigning to triple- positive CD4 + T cells a cut-off <0.182%, TB-infected individuals could be classified as active TB subjects (<0.182%) or LTBI subjects (>0.182%). e magnitude of CD8 + T-cell responses showed no differences between active TB and LTBI. Multifunctional CD4 + T-cell responses could have the potential to identify at single time point subjects without TB infection and patients having active or latent TB. 1. Introduction Mycobacterium tuberculosis (Mtb) infects more than 2 billion people worldwide; 90% of Mtb-infected individuals are able to resist overt tuberculosis (TB) disease determining the state of latency of infection (LTBI) [1]. Although latent and active TB disease are likely part of a dynamic spectrum [2, 3], individuals with LTBI are classically considered to be asymptomatic and not infectious; thus, the accurate classifi- cation of TB status is essential since treatment and prevention approaches are entirely different. All existing tests for LTBI diagnosis, the tuberculin skin test (TST) and the newer interferon-gamma release assays (IGRAs), are acceptable but remain imperfect tests [4]. ey represent indirect markers of Mtb exposure and provide immunological evidence of host sensitization to TB antigens. Both tests depend on cell-mediated immunity, and neither test can accurately differentiate between active TB and LTBI, distinguish reactivation from reinfection, or discriminate the various stages within the spectrum of Mtb infection [5, 6]. us, there is a need for newer biomarkers to classify patients at a single time point as having active TB, LTBI, or no infection. Alternative immunological methods have been investi- gated in recent years [7–11]. In particular, multifunctional T cells, defined by their ability to coexpress two or more cytokines, have showed a better diagnostic yield than IGRA to detect TB infection [12–14] and have improved discrimi- nation between active TB and LTBI [7–11, 15]. However, currently there is no consensus whether multi- functional T cells represent a marker of protective immunity or disease activity. Studies in animal models revealed a poten- tial association of multifunctional 1 cells with protective Hindawi Publishing Corporation Journal of Immunology Research Article ID 217287

Welcome message from author
This document is posted to help you gain knowledge. Please leave a comment to let me know what you think about it! Share it to your friends and learn new things together.
Transcript
Research ArticleMultifunctional Analysis of CD4+ T-Cell Response asImmune-Based Model for Tuberculosis Detection
Miriam Lichtner,1,2 Claudia Mascia,1 Ilaria Sauzullo,1
Fabio Mengoni,1 Serena Vita,1 Raffaella Marocco,2 Valeria Belvisi,2
Gianluca Russo,1 Vincenzo Vullo,1 and Claudio M. Mastroianni1,2
1Department of Public Health and Infectious Diseases, Istituto Pasteur-Fondazione Cenci Bolognetti, Sapienza University,Piazzale Aldo Moro 5, 00185 Rome, Italy2Infectious Diseases Unit, Sapienza University, Corso della Repubblica 79, 04100 Latina, Italy
Correspondence should be addressed to Claudio M. Mastroianni; [email protected]
Received 17 September 2014; Revised 30 December 2014; Accepted 30 December 2014
Academic Editor: Vishwanath Venketaraman
Copyright © 2015 Miriam Lichtner et al. This is an open access article distributed under the Creative Commons AttributionLicense, which permits unrestricted use, distribution, and reproduction in any medium, provided the original work is properlycited.
Mono- and multifunctional specific CD4+ and CD8+ T-cell responses were evaluated to improve the immune-based detectionof active tuberculosis (TB) and latent infection (LTBI). We applied flow cytometry to investigate cytokines profile (IFN-𝛾, TNF-𝛼, and IL-2) of T cells after stimulation with TB antigens in 28 TB-infected subjects (18 active TB and 10 LTBI) and 10 uninfectedcontrols. Cytokines production byCD4+ T cells at single-cell levels was higher in TB-infected subjects than uninfected controls (𝑃 <0.0001). Assigning to activated CD4+ T cells, producing any of the three cytokines, a cut-off >0.45%, it was possible to differentiateTB-infected (>0.45%) by uninfected subjects (<0.45%). Among TB-infected subjects, the frequencies of multifunctional CD4+ Tcells, simultaneously producing all 3 cytokines, are lower in active TB than LTBI subjects (𝑃 = 0.003). Thus, assigning to triple-positive CD4+ T cells a cut-off <0.182%, TB-infected individuals could be classified as active TB subjects (<0.182%) or LTBI subjects(>0.182%). The magnitude of CD8+ T-cell responses showed no differences between active TB and LTBI. Multifunctional CD4+T-cell responses could have the potential to identify at single time point subjects without TB infection and patients having activeor latent TB.
1. Introduction
Mycobacterium tuberculosis (Mtb) infects more than 2 billionpeople worldwide; 90% of Mtb-infected individuals are ableto resist overt tuberculosis (TB) disease determining thestate of latency of infection (LTBI) [1]. Although latent andactive TB disease are likely part of a dynamic spectrum[2, 3], individuals with LTBI are classically considered to beasymptomatic and not infectious; thus, the accurate classifi-cation of TB status is essential since treatment and preventionapproaches are entirely different.
All existing tests for LTBI diagnosis, the tuberculin skintest (TST) and the newer interferon-gamma release assays(IGRAs), are acceptable but remain imperfect tests [4]. Theyrepresent indirect markers of Mtb exposure and provideimmunological evidence of host sensitization to TB antigens.Both tests depend on cell-mediated immunity, and neither
test can accurately differentiate between active TB and LTBI,distinguish reactivation from reinfection, or discriminate thevarious stages within the spectrum of Mtb infection [5, 6].Thus, there is a need for newer biomarkers to classify patientsat a single time point as having active TB, LTBI, or noinfection.
Alternative immunological methods have been investi-gated in recent years [7–11]. In particular, multifunctionalT cells, defined by their ability to coexpress two or morecytokines, have showed a better diagnostic yield than IGRAto detect TB infection [12–14] and have improved discrimi-nation between active TB and LTBI [7–11, 15].
However, currently there is no consensus whether multi-functional T cells represent a marker of protective immunityor disease activity. Studies in animalmodels revealed a poten-tial association of multifunctional Th1 cells with protective
Hindawi Publishing CorporationJournal of Immunology ResearchArticle ID 217287
2 Journal of Immunology Research
immunity to TB [16], but some recent studies in humans haveimplicated multifunctional Th1 cells in protective immunityagainst pulmonary disease [10, 17], while others have shownthat these cells might merely reflect the presence of activedisease [7, 9].
In the present study, we applied an intracellular cytokineflow cytometry (ICCFC) to investigate monofunctional andmultifunctional Mtb-specific CD4+ and CD8+ T cells inactive TB and LTBI adults. Based on our findings, wepropose an immune-based approach, which could improvethe identification at single time point of subjects with no TBinfection or patients having active or latent TB.
2. Materials and Methods
2.1. Study Subjects. Thestudy population included 38 subjectsenrolled at the Department of Public Health and InfectiousDiseases, “Sapienza” University, Rome, Italy. The subjectswere firstly classified into 2 main groups: TB infected anduninfected subjects. TB infected people were subsequentlyclassified as active TB and latent TB. In summary, 18 patientswith active TB (age range, 26–61 years); 10 patients with LTBI(age range, 41–60 years); and 10 healthy subjects (age range,27–43 years) were recruited.
Diagnosis of active TB was made on the basis of clinicaland radiological findings andwas confirmed by identificationof M. tuberculosis with microbiological methods and/orhistological examination of affected tissues. All patientspresented tubercular lung involvement.
We classified as LTBI the subjects who tested positive forboth TST and QFT-GIT. All subjects classified as LTBI hadalso one of the following risk factors: chest X-ray suggestiveof prior TB infection (apical pleural thickening, pulmonarynodules, upper lobe bronchiectasis, interstitial granuloma-tous calcification, cavitation, and lymph node or pericardialcalcification) and a history of exposure to a case of activeTB, originating from an area with a high prevalence of TBinfection.None of the individuals had clinical, radiologic, andmicrobiological evidence of active TB, and none had receivedprior TB treatment. The healthy subjects were unexposedindividuals with no previous history of TB, no know TBcontact and tested negative for TST and QFT-GIT.
Measurement of IFN-𝛾 levels by IGRA and multifunc-tional analysis of CD4+ and CD8+ T cells were performed onthe same blood samples collected from all patients.
The study received approval from the Local Ethics Com-mittee (reference number 2669), and informed consent wasprovided by all subjects.
2.2. Tuberculin Skin Test and QuantiFERON TB Gold-InTube (QFT-GIT). After blood was drawn for the QFT-GITassay, a TST (Biocine Test PPD, Chiron, Siena, Italy) wasperformed according to the Mantoux method by the sameexperienced operator, considering an induration of ≥10mmas positive. The QFT-GIT assay (Cellestis Limited, Carnegie,Australia) was carried out and interpreted by the sametrained technician, as per the manufacturer’s instructions.Both operators were blind to the clinical status of the patients.
2.3. Intracellular Cytokine Flow Cytometry (ICCFC). Forintracellular cytokine flow cytometry, heparinized peripheralblood was collected, and 0.5mL of whole blood was addedto 3 test tubes containing, respectively, saline (negative con-trol), phytohaemagglutinin (PHA), andTB antigens (ESAT-6,CFP-10, andTB 7.7) [18].The test tubes were suppliedwith theQFT-GIT. The TB antigens are pools of overlapping peptidesand are pooled together as a single stimulation condition.
Whole blood was costimulated with anti-CD28 plus anti-CD49d (5 𝜇L/mL, BD Bioscience, Pharmingen, Italy) as indi-cated by several authors [9, 10, 19], andBrefeldinA (10 𝜇g/mL)(Sigma-Aldrich) was immediately added to each tube aspreviously described [20]. In order to avoid aspecific stimu-lation related to CD28/CD49d costimulation, we added anti-CD28/CD49d antibodies to both negative (saline) and pos-itive (PHA) control tubes and to TB antigens tubes (ESAT-6, CFP-10, and TB 7.7) and we further subtracted the back-ground values (in terms of IL-2, IFN-𝛾, and TNF-𝛼) from TBantigens tubes.
In brief, after 18 hrs of incubation, the cell surface stain-ing was performed with the following markers, anti-CD45-VioBlue, anti-CD4 PE-Vio770, and anti-CD8 PerCP (Mil-tenyi Biotec, Germany), and the red cells were lysed with1mL FACS lysing solution (BD Bioscience). Cells were thenpermeabilized with 0.5mL FACS permeabilizing solution(BD Bioscience) and intracellularly stained with anti-IFN-𝛾FITC, anti-TNF-𝛼 APC, and anti-IL-2 PE (Miltenyi Biotec).Cells were fixed in 1% paraformaldehyde and analysed within1 hr using a MACSQuant Analyzer flow cytometer (MiltenyiBiotec) after calibration and automatic compensation. Weacquired at least 100,000 cells in the lymphocyte gate. FlowJoSoftware version 7.6.5 was used to perform a “combinationgates” analysis. Seven different population cells were detectedin CD4+ and in CD8+ cell gate on the basis of IFN-𝛾, IL-2,and TNF-𝛼 produced by CD4+ and CD8+ T cells (Figure 1).Background cytokine production in negative control (salinebuffer) was subtracted from each stimulated condition. Intra-assay coefficient of variation and interassay coefficient varia-tion were estimated and were <5% and <10%, respectively.
We classed T cells producing any of the 3 cytokines (IFN-𝛾 or IL-2 or TNF-𝛼) as “activated T cells,” those producingIFN-𝛾 alone or in combination with IL-2 and/or TNF-𝛼 as“total IFN-𝛾+ T cells,” those producing IL-2 alone or in com-bination with IFN-𝛾 and/or TNF-𝛼 as “total IL-2+ T cells,”and those producing TNF-𝛼 alone or in combinationwith IL-2 and/or IFN-𝛾 as “total TNF-𝛼+ T cells.” Similarly, we classedpolyfunctional T cells (those simultaneously producing all 3cytokines) as “IFN-𝛾+ IL-2+ TNF-𝛼+ T cells.”
2.4. Statistical Analysis. GraphPad Prism Software version5 (Software MacKiev) was used. Nonparametric Kruskal-Wallis ANOVA with Dunn’s posttest comparison and non-parametric Mann-Whitney test was applied to compare T-cell frequencies and the percentage of cytokine-secreting cellsbetween 3 or 2 groups of patients, respectively. Receiveroperating characteristic (ROC) analysis was performed tocalculate optimal cut-off values for both activated CD4+ Tcells and polyfunctional CD4+ T cells. ROC curves were

Journal of Immunology Research 3
105
105
104
104
103
103
102
102
101
101
105
105
104
104
103
103
102
102
101
105
104
103
102
101
101 105104103102101
105104103102101
105104103102101
105104103102101105104103102101105104103102101
105104103102101 105104103102101
105104103102101105104103102101
105
104
103
102
101
105
104
103
102
101
105
104
103
102
101
105
104
103
102
101
105
104
103
102
101
105
104
103
102
101
LTBI Active TB ControlsCD
4 P
EVio770
105
104
103
102
101
105
104
103
102
101
105
104
103
102
101
CD8+ PerCP-Vio770 CD8+ CD8+
IFN-𝛾 FITC IFN-𝛾 FITC IFN-𝛾 FITC
TNF-𝛼 APCTNF-𝛼 APC TNF-𝛼 APC
IL-2 PE IL-2 PE IL-2 PE
CD4+
and
CD8+
cells
Tota
l IFN
-𝛾+
CD4+
T ce
llsTo
tal T
NF-𝛼+
+CD
4To
tal I
L-2+
CD4+
T ce
lls
Seven population cells
1.28 0.078 0.0060.291 0.195 0.0310.542 0.02 0.0060.436 0.137 0.0380.04 0.02 0
0.092 0.068 0.0060.951 0.332 0.025
CD4 IFN+ CD4 IL-2+ CD4 TNF+
CD4 IFN+ CD4 IL-2+ CD4 TNF−
CD4 IFN+ CD4 IL-2− CD4 TNF+
CD4 IFN+ CD4 IL-2− CD4 TNF−
CD4 IFN− CD4 IL-2+ CD4 TNF+
CD4 IFN− CD4 IL-2+ CD4 TNF−
CD4 IFN− CD4 IL-2− CD4 TNF+
CD831.7%
CD446.2%
CD834.2%
CD438.1%
CD840.8%
CD443.9%
CD831.7%
CD4 IFN0.082%
CD4 TNF0.038%CD4 TNF
0.449%
CD4 IL-20.044%CD4 IL-2
0.361%
CD4 IL-21.70%
CD4 TNF2.81%
CD4 IFN2.55%
CD4 IFN0.429%
T ce
lls
CD4+
and
CD8+
cells
Tota
l IFN
-𝛾+
CD4+
T ce
llsTo
tal T
NF-𝛼+
+CD
4To
tal I
L-2+
CD4+
T ce
llsT
cells
CD4+
and
CD8+
cells
Tota
l IFN
-𝛾+
CD4+
T ce
llsTo
tal T
NF-𝛼+
+CD
4To
tal I
L-2+
CD4+
T ce
llsT
cells
CD4
PEV
io770
CD4
PEV
io770
CD4
PEV
io770
CD4
PEV
io770
CD4
PEV
io770
CD4
PEV
io770
CD4
PEV
io770
CD4
PEV
io770
CD4
PEV
io770
CD4
PEV
io770
CD4
PEV
io770
PerCP-Vio770 PerCP-Vio770
Figure 1: Representative flow cytometry “combination gates” analysis ofCD4+ Tcells of LTBI, activeTB, and control subject under stimulationof TB antigens. Whole blood was analysed using a gating strategy to exclude debris and to identify CD4+ and CD8+ T cells on CD45+lymphocytes. The subsequent analysis was on CD4+ gate to describe IFN-𝛾, IL-2, and TNF-𝛼 producing T cells. The percentages of the sevendifferent population cells were showed at bottom and were defined in CD4+ cell gate on the basis of total IFN-𝛾, IL-2, and TNF-𝛼 producingcells.

4 Journal of Immunology Research
00
20
20
40
40
60
60
80
80
100
100100 – specificity (%)
(a)
Active TB LTBI Controls0
2
4
6
8
Freq
uenc
y of
activ
ated
CD4+
T ce
lls
∗∗∗∗
(b)
∗∗∗∗
Active TB LTBI Controls0
2
4
6
Freq
uenc
y of
IFN
-𝛾+
CD4+
T ce
lls
IFN-𝛾 response
(c)
IL-2 response
∗∗∗∗
Active TB LTBI Controls0
2
4
6Fr
eque
ncy
of IL
-2+
CD4+
T ce
lls
(d)
∗∗∗∗
Active TB LTBI Controls0
2
4
6
CD4+
T ce
llsFr
eque
ncy
of T
NF-𝛼+
TNF-𝛼 response
(e)
Figure 2: Analysis of cytokine production by CD4+ cells at the single-cell level. (a) ROC curve (plotting sensitivity versus 1 − specificity)to discriminate infected (active TB and LTBI) from uninfected patients. The area under curve (AUC) was 0.9722. (b) Analysis of activatedM. tuberculosis-specific CD4+T cells producing any of the 3 cytokines (IFN-𝛾, IL-2, or TNF-𝛼), using a cut-off to score responses as eitherpositive or negative.The subjects were considered as positive (black) whether the frequency of CD4+ T cells was >0.45% and negative (white)when the frequency was <0.45%. Horizontal bars represent the median values and horizontal dashed line indicates the cut-off of 0.45%. ((c),(d), and (e)) Frequency of “total IFN-𝛾+,” “total IL-2+,” and “total TNF-𝛼+”Mtb-specific CD4+T cells in active TB patients (𝑛 = 18), in LTBIpatients (𝑛 = 10), and in healthy controls (𝑛 = 10) is shown. Horizontal bars represent the median values. Statistical analysis was performedusing Kruskal-Wallis ANOVA with Dunn’s posttest comparison and significant differences are indicated by asterisks (∗∗𝑃 < 0.01).
generated by plotting the sensitivity against 1 − specificity,and the area under the curve (AUC) with 95% confidenceintervals (95% CIs) was calculated. All statistical analyseswere two-sided and considered significant at 𝑃 values < 0.05.
3. Results
3.1. TST andQFT-GITResults. QFT-GITwas positive in 13/18(72%), negative in 3/18 (17%), and indeterminate in 2/18 (11%)of active TB patients. As expected, QFT-GIF was positivein all 10 (100%) LTBI patients and in none of the healthycontrols. The TST was positive in all LTBI and negative in allhealthy controls, whereas it was positive in 11/18 (61%) and7/18 (39%) of active TB patients.
3.2. Cytokine Flow Cytometry Analysis of Mtb-Specific CD4+ TCells at the Single-Cell Level. The expression of CD4+ T cellsproducing any of the 3 cytokines (IFN-𝛾 or IL-2 or TNF-𝛼)was assessed in patients with active TB, LTBI, and healthycontrols, after simulation with Mtb-specific antigens. A sig-nificantly higher frequency of these CD4+ T cells was foundin active TB patients (median 1.197%, range 0.219%–3.59%)and in LTBI patients (1.666%, 0.234–5.762%) if compared to
healthy controls (0.246%, 0–0.423%; 𝑃 < 0.0001 by Kruskal-Wallis test); on the other hand, no significant differences werefound between the 2 infected group subjects. Following thisobservation, we performed a ROC analysis (Figure 2(a)) anda cut-off >0.45% for activated CD4+ T cells was found as thevalue allowing the best combination of sensitivity (94.44%,95% CI: 72.2–99.8%) and specificity (100%, 95% CI: 69.15–100%; AUC 0.9722; 95% CI: 0.9141–1.030%, 𝑃 < 0.0001) todifferentiateMtb-infected patients (active TB and LTBI) fromhealthy controls. Using this cut-off, we scored as positive 17/18(95%) of active TB patients, 9/10 (90%) of LTBI patients, andnone of 10 healthy controls (Figure 2(b)). Thus, the analysisof Mtb-specific CD4+ T cells allowed the discriminationbetweenMtb-infected and uninfected patients.
In another set of analyses, we compared the frequencyof “total IFN-𝛾+ CD4+ T cells,” “total IL-2+ CD4+ T cells,”and “total TNF-𝛼+ CD4+ T cells” (as defined in Section 2)in our 3 groups of the subjects. The frequencies of “totalIFN-𝛾+ CD4+ T cells” and “total IL-2+ CD4+ T cells”were higher in LTBI patients compared to those withactive TB and healthy controls, although these differencesattained statistical significance only between Mtb-infected(active TB and LTBI) and healthy subjects (𝑃 = 0.0014for IFN-𝛾; 𝑃 = 0.0001 for IL-2 by Kruskal-Wallis test)

Journal of Immunology Research 5
4
0.000.020.040.060.080.10
0.20.40.60.81.0
123
Active TBLTBI
Freq
uenc
y of
CD4+
T ce
lls∗∗∗
IFN-𝛾IL-2TNF-𝛼Pie slice
++
+ + +++
++
+++ −− −
−
−−−−
−
(a)
LTBIActive TB
(b)
Figure 3:Multifunctional cytokine analysis ofM. tuberculosis-specific CD4+ T cells. (a) Frequency ofMtb-specific CD4+ T cells producing allcombinations of IFN-𝛾, IL-2, and TNF-𝛼 in active TB patients (𝑛 = 18, black circles) and in LTBI patients (𝑛 = 10, white circles). Horizontalbars represent the median values. Statistical analysis was performed using Mann-Whitney test and significant differences are indicated byasterisks (∗∗𝑃 < 0.01, ∗𝑃 < 0.05). (b) Pie charts represent the relative proportions of cytokine-producing T-cell subsets in each group afterMtb-specific stimulation. A key to colours used in the pie charts is shown at the bottom of the panel (a).
(Figures 2(c) and 2(d)). The frequency of “TNF-𝛼+ CD4+T cells” was higher in patients with active and latent TBthan in healthy controls (𝑃 = 0.0003 by Kruskal-Wallis test;Figure 2(e)).
Thus, the analysis of cytokine production byMtb-specificCD4+ T cells at the single-cell level was unable to indicate TBstatus among the studied subjects not allowing a distinctionbetween active TB and LTBI.
3.3. Multifunctional Cytokine Analysis of Mtb-Specific CD4+ TCells. We analysed our samples for all possible combinationsof intracellular expression of IFN-𝛾, IL-2, and TNF-𝛼 incytokine-producing CD4+ T cells in subjects with active andlatent TB. Significantly greater frequencies of both “IFN-𝛾+TNF-𝛼+” and “IFN-𝛾+ IL-2+ TNF-𝛼+” CD4+ T-cell subsetswere observed in LTBI patients compared to active TBpatients (𝑃 = 0.003 and 𝑃 = 0.034, respectively; by Mann-Whitney test) (Figure 3(a)). Conversely, the frequency ofother single- or double-cytokine-secreting CD4+ T cells didnot differ significantly between these two groups.
However, the cytokine profile (Figure 3(b)) revealed thatin LTBI patients the proportion of polyfunctional CD4+ Tcells producing the 3 cytokines simultaneously was greater(23%) compared to other double-cytokine-producing CD4+T cells (IFN-𝛾+ TNF-𝛼+ = 4%; IL-2+ TNF-𝛼+ = 4%; IFN-𝛾+IL-2+ = 16%), but similar to single-cytokine-producing CD4+T cells (TNF-𝛼+ = 27%, IFN-𝛾+ = 18%). In contrast, subjectswith active TB showed a smaller proportion of polyfunctionalCD4+ T cells (8%) and a predominance of CD4+ T-cell subsetsecreting TNF-𝛼 alone which constituted 46% of the totalcytokine response.
Based on these differences, we performed a ROC analysis(Figure 4(a)) and cut-off < 0.182% for polyfunctional CD4+T cells allowed the best combination of sensitivity (77.78%,95% CI: 52.36–93.59) and specificity (70%, 95% CI: 34.75–93.33%; AUC 0.8444; 95% CI: 0.7021–0.9868%, 𝑃 = 0.0002)to differentiate between active TB and LTBI subjects. Usingthis cut-off to score ICCFC responses as either positive ornegative, we observed a positive response (>0.182%) in 4out of 18 (22%) active TB patients and in 7 out of 10 (70%)LTBI patients (Figure 4(b)). In our hands, the frequency ofpolyfunctional CD4+ T cells which simultaneously producedIFN-𝛾, IL-2, and TNF-𝛼may be indicative of LTBI status.
3.4. Specific CD8+ T-Cell Responses to Mtb Antigens in Intra-cellular Cytokine Flow Cytometry. The analysis of activatedCD8+ T cells, producing any of the 3 cytokines (IFN-𝛾 orIL-2 or TNF-𝛼) showed similar results to CD4+ T cells,revealing a significant greater frequency of activated CD8+T cells in both active TB (median 0.599%, range 0–4.55%)and LTBI patients (0.489%, 0–1.796%) compared to healthycontrols (0%, range 0–0.249%, 𝑃 < 0.0020 by Kruskal-Wallistest), but no difference was found between two groups ofinfected individuals (Figure 5(a)). Likewise, the frequencyof “total IFN-𝛾+ CD8+ T cells” (Figure 5(b)), “total IL-2+CD8+ T cells” (Figure 5(c)), and “total TNF-𝛼+ CD8+ T cells”(Figure 5(d)) was significantly higher in active TB patientscompared to the other 2 groups of patients. These differenceswere only statistically significant between active TB subjectsand healthy controls (𝑃 = 0.0045 for IFN-𝛾+; 𝑃 = 0.0033 forIL-2; 𝑃 = 0.0078 for TNF-𝛼 by Kruskal-Wallis test).

6 Journal of Immunology Research
0 20 40 60 80 1000
20
40
60
80
100
100 – specificity (%)
(a)
Active TB LTBI0
0.1
0.2
0.3
0.6
0.9
1.2
Freq
uenc
y of
IFN
-𝛾+
IL-2
+TN
F-𝛼+
CD4+
T ce
lls
(b)
Figure 4: Differentiation between active and latent Mtb-infected subjects. (a) ROC curve (plotting sensitivity versus 1 − specificity) todiscriminate active TB from LTBI patients. The area under curve (AUC) was 0.8444. (b) Analysis of triple-positive IFN-𝛾+ IL-2+ TNF-𝛼+CD4+ T cells, using a cut-off to score responses as either positive or negative. The subjects were considered as positive (black) whether thefrequency of CD4+ T cells was >0.182% and negative (white) when the frequency was <0.182%. Horizontal bars represent the median valuesand horizontal dashed line indicates the cut-off of 0.182%.
Active TB LTBI Controls0
1
2
3
4
5∗∗
∗∗
Freq
uenc
y of
CD8+
T ce
lls
(a)
0.00.40.81.21.62.02.42.8
Active TB LTBI Controls
Freq
uenc
y of
IFN
-𝛾+
CD8+
T ce
lls
∗∗
IFN-𝛾 response
(b)
0.00.40.81.21.62.02.42.8
Active TB LTBI ControlsIL-2 response
∗∗
Freq
uenc
y of
IL-2
+
CD8+
T ce
lls
(c)
0.00.40.81.21.62.02.42.8
Active TB LTBI Controls
∗∗
Freq
uenc
y of
TN
F-𝛼+
CD8+
T ce
lls
TNF-𝛼 response
(d)
Figure 5: Analysis of cytokine production by CD8+ T cells at the single-cell level. (a) Frequencies of activated Mtb-specific CD8+T cellsproducing any of the 3 cytokines (IFN-𝛾, IL-2, or TNF-𝛼) cells in active TB patients (𝑛 = 18), in LTBI patients (𝑛 = 10), and in healthycontrols (𝑛 = 10) are show. ((b), (c), and (d)) Frequency of “total IFN-𝛾+,” “total IL-2+,” and “total TNF-𝛼+”Mtb-specific CD8+T in active TBpatients (𝑛 = 18), in LTBI patients (𝑛 = 10), and in healthy controls (𝑛 = 10) is shown. Horizontal bars represent themedian values. Statisticalanalysis was performed using Kruskal-Wallis ANOVA with Dunn’s posttest comparison and significant differences are indicated by asterisks(∗∗𝑃 < 0.01).

Journal of Immunology Research 7
0.00.10.20.30.40.40.60.81.01.01.52.02.53.0
Freq
uenc
y of
CD8+
T ce
lls
+
+
+ +
+
++ −
−
+
+ +
++
−
−
−
−
−−
−
IFN-𝛾IL-2TNF-𝛼Pie slice
Active TBLTBI
(a)
LTBIActive TB
(b)
Figure 6: Multifunctional cytokine analysis of Mtb-specific CD8+ T cells. (a) Frequency of Mtb-specific CD8+ T cells producing allcombinations of IFN-𝛾, IL-2, and TNF-𝛼 in active TB patients (𝑛 = 18, black circles) and in LTBI patients (𝑛 = 10, white circles). Horizontalbars represent themedian values. Statistical analysis was performed usingMann-Whitney test. (b) Pie charts represent the relative proportionsof cytokine-producingT-cell subsets in each group afterMtb-specific stimulation.A key to colours used in the pie charts is shown at the bottomof the panel (a).
As regards the cytokine profiles of Mtb-specific CD8+ Tcells, we found no significant differences between active TBand LTBI subjects (𝑃 > 0.05 for each CD8+ T-cell subsetby Mann-Whitney test; Figure 6(a)). Still, observing the piecharts (Figure 6(b)) the proportions of single-, double-, ortriple-cytokine-secreting CD8+ T-cell subsets were compara-ble between two groups of individuals.
Hence, the evaluation of the Mtb-specific CD8+ T-cellresponses in both monofunctional and polyfunctional analy-ses did not allow the distinction between active TB and LTBIsubjects.
4. Discussion
In recent years, immunological response to Mtb has beenextensively studiedwith the purpose of not only better under-standing the TB pathogenesis but also improving diagnosis.The more recent IGRA offer some improvements over theTST, showing an excellent specificity for LTBI diagnosis andcorrelating well with the magnitude of exposure toM. tuber-culosis [21]. Nevertheless, they have several known limitationsincluding the reduced accuracy in immunocompromisedsubjects [22–24], the presence of conversions and reversionsof results when serially applied in the same individuals [25–27], the inability to distinguish reactivation from reinfection,and the inability to accurately differentiate between LTBI andactive TB [5, 6].
In the present study, using IGRA assay as a tool for TBdetection, no significant differences in the average IFN-𝛾responses were observed among our TB and LTBI subjects,
since similar percentages of positive IFN-𝛾 responses werepresent in both of the 2 groups.
With a view to improving discrimination between activeTB and LTBI, we applied an intracellular cytokine flowcytometry (ICCFC) to investigate monofunctional and mul-tifunctionalMtb-specific CD4+ and CD8+ T cells.
Multifunctional T cells simultaneously secreting IFN-𝛾,TNF-𝛼, and IL-2 play a critical role in the control of chronicbacterial and viral infections [28]. Changes in cytokineprofiles could be a general feature of Mtb-specific T cells inTB infection, but limited and controversial data have madeit difficult to define the role of these cells in TB [29]. Somestudies support the concept that a higher proportion of triple-positive CD4+ T cells correlates with LTBI when comparingactive TB and latent subjects, suggesting that this T-cell subsetmay be a surrogate marker of Mtb load and consequentlyof active replication control in LTBI subjects [10, 15, 17]. Incontrast, others indicate a higher proportion of triple-positiveCD4+ T cells in active TB than in LTBI subjects [7, 9], but themethodology used was different and so was the definition ofLTBI.
The present study provides a detailed analysis of thefrequency of cytokine-producing CD4+ and CD8+ T cells inMtb-infected (active TB and LTBI) and uninfected subjects.
Regarding the CD4+ T-cell compartment, the first findingwas that analysis of activated cells producing any of the 3cytokines (IFN-𝛾 or IL-2 or TNF-𝛼) may help to differentiateMtb-infected (active TB and LTBI) and uninfected subjects.In fact with a cut-off > 0.45% for activated CD4+ T cells,we scored as positive the 95% of active TB patients, the 90%
8 Journal of Immunology Research
Suspected TB patients
TB infection No TB infection
Active TB
>0.45% <0.45%
Latent TB infection
<0.182% >0.182%
Analysis of polyfunctional CD4+ T cells
Analysis of Mtb-specific activated CD4+ T cells
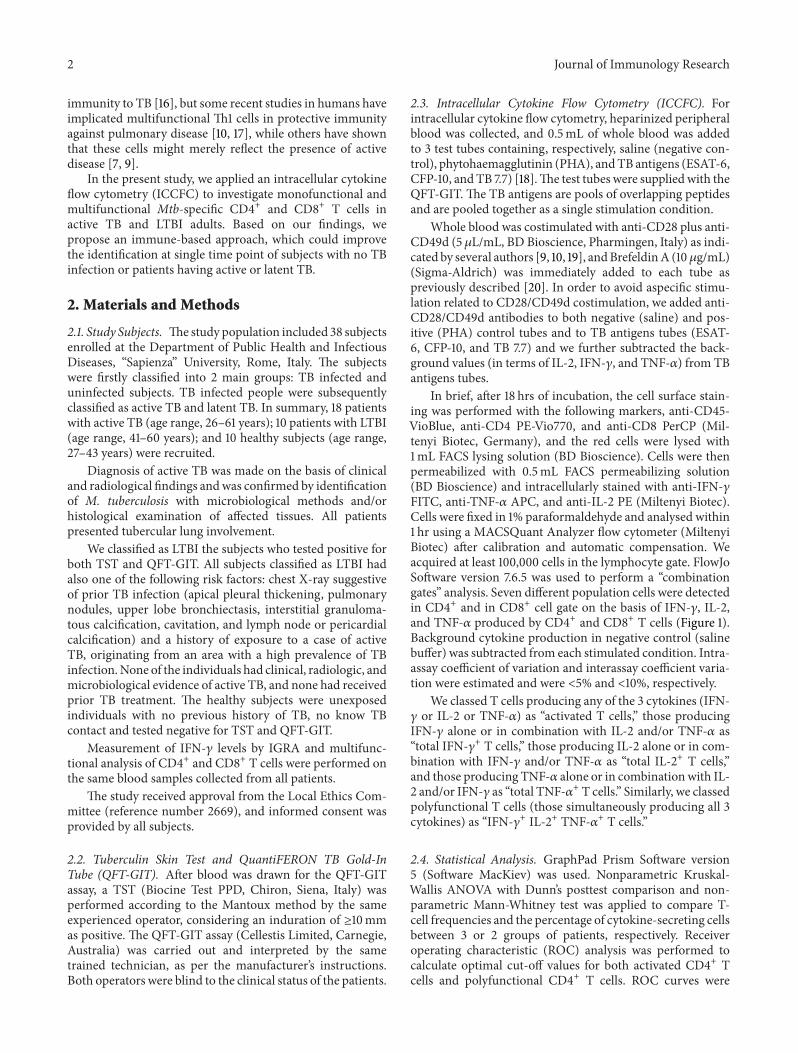
Figure 7: Proposed immune-based model for detection of active and latent TB. Taking into account the analysis of activated CD4+ T cells,it is possible to differentiate Mtb-infected subjects (>0.45%) by uninfected subjects (<0.45%). With the analysis of multifunctional CD4+ Tcells, simultaneously producing all 3 cytokines, infected individuals may be classified as active TB subjects (<0.182%) or as LTBI subjects(>0.182%).
of LTBI patients, and none of healthy controls, clearlydifferentiating Mtb-infected patients from healthy controls.It is interesting to note that active TB patients showeda low response using TST and QFT (only 61% and 72%,resp.) confirming that routinely immunological tests were notuseful in diagnosis of active disease. Our data suggest thatanalysis of activated CD4+ T cells has a good sensitivity inactive TB.
Also the analysis of CD4+ T cells secreting IFN-𝛾 alone,IL-2 alone, and TNF-𝛼 alone, revealed a prevalent frequencyof all these T cells in infected compared to uninfectedsubjects. Still, it is interesting to note a slightly higherfrequency of both “all IFN-𝛾+” and “all IL-2+” CD4+ T cells inLTBI patients with respect to active TB patients, in line withrecent studies showing that CD4+ T cells producing IFN-𝛾and IL-2 have been implicated in protective immunity to TB[30, 31]. Taken together, monofunctional analysis was able todistinguish infected and uninfected subjects but was unableto indicate TB status not allowing a clear distinction betweenactive and latent infection.
Moreover searching for a difference between active andlatent TB, we performed a broad characterization of thefunctional profiles ofMtb-specific CD4+ T cells to determineall combinations of intracellular expression of IFN-𝛾, IL-2, and TNF-𝛼. These findings revealed that latent infectionis associated with an increased frequency of two CD4+T-cell subsets, those producing IFN-𝛾, IL-2, and TNF-𝛼simultaneously (triple-positive) and those producing IFN-𝛾in combination with TNF-𝛼, indicating a possible protectiverole of these cells population in maintaining latent inflec-tion. Indeed, we found that multifunctional CD4+ T cells,in particular those producing 3 cytokines simultaneously,
provided the best discrimination between active and latentinfection. In fact using a cut-off of 0.182% for triple-positiveCD4+ T cells, most LTBI subjects (70%) showed a positiveresponse, whereas the majority of active TB patients (78%)have a response below the cut-off.
Taken together, the detection of less than 0.182% of triple-positive CD4+ T cells is strongly indicative of active TB witha specificity of 70%, whereas frequencies of these cells above0.182% could be indicative of LTBI with sensitivity of 77.7%.
Most notably and in contrast with latent infection, oursubjects with active TB disease had a predominance of CD4+T cells secreting TNF alone which constituted 46% of thetotal cytokine response. This is in agreement with previousstudies showing that TNF production is a major componentof the immune response to Mtb-antigen in active diseaseand thus the most reliable marker for diagnosing TB disease[7, 10, 11, 32, 33]. TNF expansion could be responsible for ahigh degree of inflammation, which could be linked to tissuedamage and lung lesions rather than protection and controlof the pathogen.
According to what has been assumed to be the hallmarkof a protective CD4+ T-cell response in various models ofhuman viral infections [28, 34, 35], we found a significantlyhigher proportion of multifunctional IFN-𝛾+ IL-2+ TNF-𝛼+CD4+ T cells in subjects with LTBI, which are able to controlMtb replication comparedwith thosewith current TBdisease,in which CD4+ T cells secreting TNF alone dominated theMtb-specific response.
As regards the CD8+ T-cell compartment, Rozot et al.[36, 37] recently indicated that Mtb-specific CD8+ T-cell responses can be detected predominantly in patientswith active TB as compared to LTBI subjects, suggesting

Journal of Immunology Research 9
a correlation between CD8+ T-cell responses and high anti-gen burden [19, 38]. This hypothesis is supported by a recentstudy performed in children showing thatMtb-specific CD8+T cells were detected in active TB disease but not in healthychildren recently exposed toMtb, despite the fact that similarfrequencies of CD4+ T cells were present in both groups [39].
Moreover, little is known about the size, quality, andspecificity of Mtb-specific CD8+ T-cell responses duringactive and latent infection. In our study, the monofunc-tional analysis allowed a distinction between infected anduninfected subjects, following the same trend as in CD4+ Tcells. Conversely, the polyfunctional analysis of CD8+ T-cellresponses showed no significant differences between activeand latent infected patients.
The present study has some limitations, such as therelatively small number of patients within each clinical groupand the lack of a prospective analysis. Nevertheless, theICCFC assessment of multifunctional Mob-specific CD4+ Tcells enabled us to determine the different clinical stage ofTB infection. In this respect we propose an immune model(Figure 7)which, with a cut-off of 0.45% for activatedCD4+ Tcells, may initially discriminate Mtb-infected (active TB andLTBI) patients (>0.45%) from uninfected subjects (<0.45%)with a specificity of 100%.Then, the infected individuals maybe classified as active TB subjects if they showed frequenciesof triple-positive T cells less than 0.182% and as LTBI subjectsif the frequencies of triple-positive T cells are instead above0.182% with a sensitivity of 77.78% and a specificity of 70%.
5. Conclusion
Multifunctional flow cytometry analysis of specific CD4+ T-cell response may represent a simple and rapid immune-based approach to distinguish between Mtb-infected anduninfected subjects. The more interesting result of the studyis the increased number of active TB patients detectedwith multifunctional analysis of CD4+ T-cell response incomparison to QTF-GIT or TST. As general use as a clinicaldiagnostic test in order to identify patients with active versuslatent TB infection, this immunological approach needs to bevalidated in a larger and prospective study and to be extendedto other forms of active tuberculosis.
Conflict of Interests
The authors declare that they have no conflict of interests inpublishing this paper.
Acknowledgments
The authors gratefully acknowledge the contributions to thisresearch by the study participants and staff.
References
[1] World Health Organization, Global Tuberculosis Control: WHOReport 2013,WHO,Geneva, Switzerland, 2013, http://www.who.int/tb/publications/global report/en/.
[2] C. E. Barry Jr., H. I. Boshoff, V. Dartois et al., “The spectrumof latent tuberculosis: rethinking the biology and interventionstrategies,” Nature Reviews Microbiology, vol. 7, no. 12, pp. 845–855, 2009.
[3] K. Dheda, S. K. Schwander, B. Zhu, R. N. Van Zyl-Smit, andY. Zhang, “The immunology of tuberculosis: from bench tobedside,” Respirology, vol. 15, no. 3, pp. 433–450, 2010.
[4] M. Pai, C. M. Denkinger, S. V. Kik et al., “Gamma interferonrelease assays for detection ofMycobacterium tuberculosis infec-tion,”ClinicalMicrobiology Reviews, vol. 27, no. 1, pp. 3–20, 2014.
[5] M. Sester, G. Sotgiu, C. Lange et al., “Interferon-𝛾 release assaysfor the diagnosis of active tuberculosis: a systematic review andmeta-analysis,” European Respiratory Journal, vol. 37, no. 1, pp.100–111, 2011.
[6] J. Z. Metcalfe, C. K. Everett, K. R. Steingart et al., “Interferon-𝛾 release assays for active pulmonary tuberculosis diagnosis inadults in low-and middle-income countries: systematic reviewand meta-analysis,” Journal of Infectious Diseases, vol. 204, no.4, supplement, pp. S1120–S1129, 2011.
[7] J. S. Sutherland, I. M. Adetifa, P. C. Hill, R. A. Adegbola, andM. O. C. Ota, “Pattern and diversity of cytokine productiondifferentiates between Mycobacterium tuberculosis infectionand disease,” European Journal of Immunology, vol. 39, no. 3, pp.723–729, 2009.
[8] V. Sargentini, S.Mariotti, S. Carrara et al., “Cytometric detectionof antigen-specific IFN-𝛾/IL-2 secreting cells in the diagnosis oftuberculosis,” BMC Infectious Diseases, vol. 9, article 99, 2009.
[9] N. Caccamo, G. Guggino, S. A. Joosten et al., “MultifunctionalCD4+ T cells correlate with active Mycobacterium tuberculosisinfection,” European Journal of Immunology, vol. 40, no. 8, pp.2211–2220, 2010.
[10] A. Harari, V. Rozot, F. B. Enders et al., “Dominant TNF-𝛼+Mycobacterium tuberculosis-specific CD4+ T cell responses
discriminate between latent infection and active disease,”Nature Medicine, vol. 17, no. 3, pp. 372–377, 2011.
[11] M. Streitz, S. Fuhrmann, D. Thomas et al., “The phenotypicdistribution and functional profile of tuberculin-specific CD4T-cells characterizes different stages of TB infection,”CytometryPart B, Clinical Cytometry, vol. 82, no. 6, pp. 360–368, 2012.
[12] W. L. Leung, K. L. Law, V. S. S. Leung et al., “Compari-son of intracellular cytokine flow cytometry and an enzymeimmunoassay for evaluation of cellular immune response toactive tuberculosis,” Clinical and Vaccine Immunology, vol. 16,no. 3, pp. 344–351, 2009.
[13] D. I. Won and J. R. Park, “Flow cytometric measurements ofTB-specific T cells comparing with quantiFERON-TB gold,”Cytometry Part B—Clinical Cytometry, vol. 78, no. 2, pp. 71–80,2010.
[14] J. Lee, S. Y. Lee, D. I. Won, S. I. Cha, J. Y. Park, and C. H.Kim, “Comparison of whole-blood interferon-𝛾 assay and flowcytometry for the detection of tuberculosis infection,” Journalof Infection, vol. 66, no. 4, pp. 338–345, 2013.
[15] E. Petruccioli, L. Petrone, V. Vanini et al., “IFN𝛾/TNF𝛼 specific-cells and effector memory phenotype associate with activetuberculosis,” Journal of Infection, vol. 66, no. 6, pp. 475–486,2013.
[16] E. K. Forbes, C. Sander, E. O. Ronan et al., “Multifunctional,high-level cytokine-producing Th1 cells in the lung, but notspleen, correlate with protection against Mycobacterium tuber-culosis aerosol challenge in mice,” The Journal of Immunology,vol. 181, no. 7, pp. 4955–4964, 2008.
10 Journal of Immunology Research
[17] C. L. Day, D. A. Abrahams, L. Lerumo et al., “Functionalcapacity ofMycobacterium tuberculosis-specific T cell responsesin humans is associated withmycobacterial load,”The Journal ofImmunology, vol. 187, no. 5, pp. 2222–2232, 2011.
[18] B. M. Kagina, N. Mansoor, E. P. Kpamegan et al., “Qualificationof a whole blood intracellular cytokine staining assay to mea-sure mycobacteria-specific CD4 and CD8 T cell immunity byflow cytometry,” Journal of Immunological Methods, vol. 22, no.14, pp. 356–361, 2014.
[19] S. Commandeur, K. E. Van Meijgaarden, C. Prins et al.,“An unbiased genome-wide Mycobacterium tuberculosis geneexpression approach to discover antigens targeted by humanT cells expressed during pulmonary infection,” Journal ofImmunology, vol. 190, no. 4, pp. 1659–1671, 2013.
[20] I. Sauzullo, R. Scrivo, F. Mengoni et al., “Multi-functional flowcytometry analysis of CD4+ T cells as an immune biomarkerfor latent tuberculosis status in patients treated with tumournecrosis factor (TNF) antagonists,” Clinical and ExperimentalImmunology, vol. 176, no. 3, pp. 410–417, 2014.
[21] R. Diel, D. Goletti, G. Ferrara et al., “Interferon-𝛾 release assaysfor the diagnosis of latentMycobacterium tuberculosis infection:a systematic review and meta-analysis,” European RespiratoryJournal, vol. 37, no. 1, pp. 88–99, 2011.
[22] I. Sauzullo, F. Mengoni, R. Scrivo et al., “Evaluation ofQuantiFERON-TB gold in-tube in human immunodeficiencyvirus infection and in patient candidates for anti-tumournecrosis factor-alpha treatment,” The International Journal ofTuberculosis and Lung Disease, vol. 14, no. 7, pp. 834–840, 2010.
[23] M. Santin, L. Munoz, and D. Rigau, “Interferon-gamma releaseassays for the diagnosis of tuberculosis and tuberculosis infec-tion in HIV-infected adults: a systematic review and meta-analysis,” PLoS ONE, vol. 7, no. 3, Article ID e32482, 2012.
[24] R. Scrivo, I. Sauzullo, F. Mengoni et al., “Serial interferon-𝛾 release assays for screening andmonitoring of tuberculo-sis infection during treatment with biologic agents,” ClinicalRheumatology, vol. 31, no. 11, pp. 1567–1575, 2012.
[25] R. Scrivo, I. Sauzullo, F. Mengoni et al., “Mycobacterialinterferon-𝛾 release variations during longterm treatment withtumor necrosis factor blockers: lack of correlation with clinicaloutcome,” The Journal of Rheumatology, vol. 40, no. 2, pp. 157–165, 2013.
[26] I. Sauzullo, F. Mengoni, R. Marocco et al., “Interferon-𝛾 releaseassay for tuberculosis in patients with psoriasis treated withtumour necrosis factor antagonists: in vivo and in vitro analy-sis,” British Journal of Dermatology, vol. 169, no. 5, pp. 1133–1140,2013.
[27] K. H. Kim, S. W. Lee, W. T. Chung et al., “Serial interferon-gamma release assays for the diagnosis of latent tuberculosisinfection in patients treated with immunosuppressive agents,”The Korean Journal of Laboratory Medicine, vol. 31, no. 4, pp.271–278, 2011.
[28] S. Kannanganat, C. Ibegbu, L. Chennareddi, H. L. Robinson,and R. R. Amara, “Multiple-cytokine-producing antiviral CD4T cells are functionally superior to single-cytokine-producingcells,” Journal of Virology, vol. 81, no. 16, pp. 8468–8476, 2007.
[29] J. T. Mattila, C. R. Diedrich, P. Ling Lin, J. Phuah, and J. L.Flynn, “Simian immunodeficiency virus-induced changes in Tcell cytokine responses in cynomolgus macaques with latentMycobacterium tuberculosis infection are associatedwith timingof reactivation,” Journal of Immunology, vol. 186, no. 6, pp. 3527–3537, 2011.
[30] K. A. Millington, J. A. Innes, S. Hackforth et al., “Dynamicrelationship between IFN-gamma and IL-2 profile of Mycobac-terium tuberculosis-specific T cells and antigen load,” TheJournal of Immunology, vol. 178, no. 8, pp. 5217–5226, 2007.
[31] K. A. Millington, S. Gooding, T. S. C. Hinks, D. J. M. Reynolds,and A. Lalvani, “Mycobacterium tuberculosis-specific cellularimmune profiles suggest bacillary persistence decades afterspontaneous cure in untreated tuberculosis,” The Journal ofInfectious Diseases, vol. 202, no. 11, pp. 1685–1689, 2010.
[32] M. Streitz, S. Fuhrmann, F. Powell et al., “Tuberculin-specific Tcells are reduced in active pulmonary tuberculosis compared toLTBI or status post BCG vaccination,” The Journal of InfectiousDiseases, vol. 203, no. 3, pp. 378–382, 2011.
[33] C. H. Kim, K. J. Choi, S. S. Yoo et al., “Comparative analysisof whole-blood interferon-𝛾 and flow cytometry assays fordetecting post-treatment Immune responses in patients withactive tuberculosis,” Cytometry B: Clinical Cytometry, vol. 86,no. 4, pp. 236–243, 2014.
[34] G. Pantaleo andA.Harari, “Functional signatures in antiviral T-cell immunity for monitoring virus-associated diseases,”NatureReviews Immunology, vol. 6, no. 5, pp. 417–423, 2006.
[35] M. R. Betts,M. C.Nason, S.M.West et al., “HIVnonprogressorspreferentially maintain highly functional HIV-specific CD8+ Tcells,” Blood, vol. 107, no. 12, pp. 4781–4789, 2006.
[36] V. Rozot, S. Vigano, J. Mazza-Stalder et al., “Mycobacteriumtuberculosis-specific CD8+ T cells are functionally and pheno-typically different between latent infection and active disease,”European Journal of Immunology, vol. 43, no. 6, pp. 1568–1577,2013.
[37] V. Rozot, A. Patrizia, and S. Vigano, “Combined use ofMycobac-terium tuberculosis-specific CD4 and CD8 T-cell responses isa powerful diagnostic tool of active tuberculosis,” Clinical ofInfectious Diseases, vol. 60, no. 3, pp. 432–437, 2015.
[38] D. A. Lewinsohn, A. S. Heinzel, J. M. Gardner, L. Zhu, M. R.Alderson, and D. M. Lewinsohn, “Mycobacterium tuberculosis-specific CD8+ T cells preferentially recognize heavily infectedcells,” The American Journal of Respiratory and Critical CareMedicine, vol. 168, no. 11, pp. 1346–1352, 2003.
[39] C. Lancioni, M. Nyendak, S. Kiguli et al., “CD8+ T cells providean immunologic signature of tuberculosis in young children,”TheAmerican Journal of Respiratory and Critical Care Medicine,vol. 185, no. 2, pp. 206–212, 2012.

Submit your manuscripts athttp://www.hindawi.com
Stem CellsInternational
Hindawi Publishing Corporationhttp://www.hindawi.com Volume 2014
Hindawi Publishing Corporationhttp://www.hindawi.com Volume 2014
MEDIATORSINFLAMMATION
of
Hindawi Publishing Corporationhttp://www.hindawi.com Volume 2014
Behavioural Neurology
EndocrinologyInternational Journal of
Hindawi Publishing Corporationhttp://www.hindawi.com Volume 2014
Hindawi Publishing Corporationhttp://www.hindawi.com Volume 2014
Disease Markers
Hindawi Publishing Corporationhttp://www.hindawi.com Volume 2014
BioMed Research International
OncologyJournal of
Hindawi Publishing Corporationhttp://www.hindawi.com Volume 2014
Hindawi Publishing Corporationhttp://www.hindawi.com Volume 2014
Oxidative Medicine and Cellular Longevity
Hindawi Publishing Corporationhttp://www.hindawi.com Volume 2014
PPAR Research
The Scientific World JournalHindawi Publishing Corporation http://www.hindawi.com Volume 2014
Immunology ResearchHindawi Publishing Corporationhttp://www.hindawi.com Volume 2014
Journal of
ObesityJournal of
Hindawi Publishing Corporationhttp://www.hindawi.com Volume 2014
Hindawi Publishing Corporationhttp://www.hindawi.com Volume 2014
Computational and Mathematical Methods in Medicine
OphthalmologyJournal of
Hindawi Publishing Corporationhttp://www.hindawi.com Volume 2014
Diabetes ResearchJournal of
Hindawi Publishing Corporationhttp://www.hindawi.com Volume 2014
Hindawi Publishing Corporationhttp://www.hindawi.com Volume 2014
Research and TreatmentAIDS
Hindawi Publishing Corporationhttp://www.hindawi.com Volume 2014
Gastroenterology Research and Practice
Hindawi Publishing Corporationhttp://www.hindawi.com Volume 2014
Parkinson’s Disease
Evidence-Based Complementary and Alternative Medicine
Volume 2014Hindawi Publishing Corporationhttp://www.hindawi.com
Related Documents