Enhanced diagnosis of HIV-1 associated tuberculosis by relating T-SPOT.TB and CD4 counts Tolu ONI 1,2 , Janisha PATEL 3 , Hannah P GIDEON 1 , Ronnett SELDON 1 , Kathryn WOOD 1 , Yekiwe HLOMBE 1 , Katalin A WILKINSON 1,4 , Molebogeng X RANGAKA 1,5,6 , Marc MENDELSON 7 , and Robert J WILKINSON 1,2,4 1 Institute of Infectious Diseases and Molecular Medicine, Faculty of Health Sciences, University of Cape Town, Observatory 7925, South Africa 2 Division of Medicine, Imperial College London, W2 1PG, UK 3 Brighton and Sussex University Hospital NHS Trust, Eastern Road. Brighton BN2 5BE,UK 4 National Institute for Medical Research, Mill Hill, London, NW7 1AA, UK 5 Infectious Disease Epidemiology Unit, School of Public Health, University of Cape Town, Observatory 7925, South Africa 6 London School of Hygiene and Tropical Medicine, Keppel Street, London WC1E 7HT 7 Division of Infectious Diseases and HIV Medicine, Department of Medicine, Groote Schuur Hospital, Cape Town 7925, South Africa Abstract Background—The sensitivity of the tuberculin skin test is impaired in HIV-1 infected persons. ELISpot-based detection of immune sensitisation may be less affected. Furthermore, the quantitative response can be related to the CD4 count, potentially improving specificity for active disease. Methods—T-SPOT.TB was performed on HIV-1 infected participants, 85 with active tuberculosis (TB) and 81 healthy patients (non-TB). The ratio of summed ESAT-6 and CFP-10 response to the CD4 count (SFC/CD4) was calculated. Results—Using manufacturer’s guidelines, active TB was diagnosed with 76% sensitivity and 53% specificity. Using a SFC/CD4 ratio of 0.12, sensitivity (80%) and specificity (62%) improved. The quantitative T-cell response increased with increasing smear positivity in the active TB group (p=0.0008). In the non-TB group, the proportion of persons scored positive by T-SPOT.TB was lower in the CD4<200 group (p=0.029). Conclusion—The ratio of summed T cell response to CD4 count improved diagnostic accuracy of the T-SPOT.TB assay in HIV-infected persons and ratio of SFC/CD4>0.12 should prompt investigation for active disease. A strong association between the degree of sputum positivity and T-SPOT.TB score was found. The sensitivity of T-SPOT.TB in active disease may be less impaired by advanced immunosuppression. Corresponding author: Tolu Oni, Mailing address: 3.03 Wolfson Pavillion, Institute of Infectious Diseases and Molecular Medicine, Faculty of Health Sciences, University of Cape Town, Observatory 7925, South Africa, Tel no: +27 21 406 6727, [email protected]. POTENTIAL CONFLICTS OF INTEREST T-SPOT.TB kits were supplied by Oxford Immunotec. J Patel received travel expenses from Oxford Immunotec. Europe PMC Funders Group Author Manuscript Eur Respir J. Author manuscript; available in PMC 2011 January 23. Published in final edited form as: Eur Respir J. 2010 September ; 36(3): 594–600. doi:10.1183/09031936.00171509. Europe PMC Funders Author Manuscripts Europe PMC Funders Author Manuscripts

Welcome message from author
This document is posted to help you gain knowledge. Please leave a comment to let me know what you think about it! Share it to your friends and learn new things together.
Transcript

Enhanced diagnosis of HIV-1 associated tuberculosis by relatingT-SPOT.TB and CD4 counts
Tolu ONI1,2, Janisha PATEL3, Hannah P GIDEON1, Ronnett SELDON1, Kathryn WOOD1,Yekiwe HLOMBE1, Katalin A WILKINSON1,4, Molebogeng X RANGAKA1,5,6, MarcMENDELSON7, and Robert J WILKINSON1,2,4
1Institute of Infectious Diseases and Molecular Medicine, Faculty of Health Sciences, Universityof Cape Town, Observatory 7925, South Africa2Division of Medicine, Imperial College London, W2 1PG, UK3Brighton and Sussex University Hospital NHS Trust, Eastern Road. Brighton BN2 5BE,UK4National Institute for Medical Research, Mill Hill, London, NW7 1AA, UK5Infectious Disease Epidemiology Unit, School of Public Health, University of Cape Town,Observatory 7925, South Africa6London School of Hygiene and Tropical Medicine, Keppel Street, London WC1E 7HT7Division of Infectious Diseases and HIV Medicine, Department of Medicine, Groote SchuurHospital, Cape Town 7925, South Africa
AbstractBackground—The sensitivity of the tuberculin skin test is impaired in HIV-1 infected persons.ELISpot-based detection of immune sensitisation may be less affected. Furthermore, thequantitative response can be related to the CD4 count, potentially improving specificity for activedisease.
Methods—T-SPOT.TB was performed on HIV-1 infected participants, 85 with activetuberculosis (TB) and 81 healthy patients (non-TB). The ratio of summed ESAT-6 and CFP-10response to the CD4 count (SFC/CD4) was calculated.
Results—Using manufacturer’s guidelines, active TB was diagnosed with 76% sensitivity and53% specificity. Using a SFC/CD4 ratio of 0.12, sensitivity (80%) and specificity (62%)improved.
The quantitative T-cell response increased with increasing smear positivity in the active TB group(p=0.0008). In the non-TB group, the proportion of persons scored positive by T-SPOT.TB waslower in the CD4<200 group (p=0.029).
Conclusion—The ratio of summed T cell response to CD4 count improved diagnostic accuracyof the T-SPOT.TB assay in HIV-infected persons and ratio of SFC/CD4>0.12 should promptinvestigation for active disease. A strong association between the degree of sputum positivity andT-SPOT.TB score was found. The sensitivity of T-SPOT.TB in active disease may be lessimpaired by advanced immunosuppression.
Corresponding author: Tolu Oni, Mailing address: 3.03 Wolfson Pavillion, Institute of Infectious Diseases and Molecular Medicine,Faculty of Health Sciences, University of Cape Town, Observatory 7925, South Africa, Tel no: +27 21 406 6727,[email protected].
POTENTIAL CONFLICTS OF INTERESTT-SPOT.TB kits were supplied by Oxford Immunotec. J Patel received travel expenses from Oxford Immunotec.
Europe PMC Funders GroupAuthor ManuscriptEur Respir J. Author manuscript; available in PMC 2011 January 23.
Published in final edited form as:Eur Respir J. 2010 September ; 36(3): 594–600. doi:10.1183/09031936.00171509.
Europe PM
C Funders A
uthor Manuscripts
Europe PM
C Funders A
uthor Manuscripts

KeywordsMycobacterium tuberculosis; HIV-1; interferon-gamma; diagnosis; management
INTRODUCTIONThe World Health Organisation’s strategy to halt the spread of tuberculosis (TB) outlinesamongst its targets, the improvement of TB diagnosis in HIV-infected persons. Africaaccounts for more than 31% of the global burden of TB and has an estimated 1.39 millionHIV-infected TB cases and 480,000 deaths in 2005 (1). It is well recognised that CD4 T-celldepletion increases the risk of developing HIV-associated TB (2, 3) with the risk of incidentTB shown to double within the first year after seroconversion (4). The performance ofwidely used TB diagnostic tests such as the tuberculin skin test (TST) and sputummicroscopy in HIV-infected patients is compromised (5-7).
Interferon gamma release assays (IGRA) are in vitro immuno-diagnostic tests that measureT-cell interferon-gamma response to M.tb-specific antigens. Studies have assessed thepower of IGRA-based analysis in detecting latent TB infection (LTBI) in HIV-1 (HIV) co-infected persons in endemic TB and HIV settings (8, 9). A head to head comparison ofIGRA demonstrated that the T-SPOT.TB scored a higher proportion of positive results,when compared to QuantiFERON® TB Gold (QTF) in HIV-infected adults (10). A largercomparison by Rangaka et al in a high TB endemic setting also suggested the T-SPOT.TBassay was less impaired in advanced immunosuppression (11). However, these tests, aspresently interpreted, do not allow distinction between LTBI and active disease.
A pilot study by our laboratory suggested a method of detecting active TB in HIV-infectedpatients by summing the ELISpot response to TB specific antigens (ESAT-6 and CFP-10)and dividing by the CD4 cell count (12). A ratio of >1 strongly suggested active disease. Asthese preliminary findings employed an in-house IGRA, we designed a larger study usingthe ratio of the summed ELISpot count from the T-SPOT.TB assay divided by the CD4count to diagnose active TB, and included a robust group of non-TB, HIV-infected patientsas controls.
METHODSStudy location and design
The study site at Ubuntu TB/HIV clinic is located in Khayelitsha, a peri-urban townshipnear Cape Town with a population of over 400,000. Khayelitsha has an exceptionally highburden of HIV and TB (1612 per 100,000 in 2005) (12), with approximately 67% of TBbeing HIV related. A cross-sectional study design was employed, sampling HIV-infectedpatients with active TB and HIV-infected persons without evidence of active TB as controls.
ParticipantsWritten informed consent was obtained from all participants and the study was approved bythe University of Cape Town Research Ethics Committee (REC 012/2007). All 166participants were antiretroviral therapy (ART) naïve at the time of recruitment. 85 HIV-infected TB patients with culture positive TB disease were recruited from the clinic prior tostarting anti-TB chemotherapy. These patients had presented to the clinic with signs andsymptoms of TB. 81 HIV-infected healthy participants were enrolled from the pre-ART HIVclinic with no symptoms of active TB using a symptom-screen (any cough, night sweats,loss of weight and loss of appetite). All healthy participants (non-TB group) were induced-
ONI et al. Page 2
Eur Respir J. Author manuscript; available in PMC 2011 January 23.
Europe PM
C Funders A
uthor Manuscripts
Europe PM
C Funders A
uthor Manuscripts
sputum smear and TB culture negative and had no radiological features of TB. Personsenrolled into this group received TST using 2 TU of tuberculin PPD RT23 injectedintradermally into the volar aspect of the forearm. All persons with a skin indurationdiameter of ≥5 mm were offered, and commenced on isoniazid preventive therapy (IPT)after whole blood was collected for IGRA. No participant had ever received IPT. A historyof previous TB within 3 months of recruitment was an exclusion criterion.
At the point of recruitment, questionnaires were completed and blood samples werecollected for CD4 count and T-SPOT.TB assay. Persons with CD4<200/mm3 were referredto the ART clinic to start treatment as per national guidelines. The ratio of summed ESAT-6and CFP-10 response to CD4 count was calculated and Receiver Operating Characteristic(ROC) curve analysis conducted on results.
PBMC preparationPeripheral blood mononuclear cells (PBMC) were extracted from heparinised whole bloodwithin four hours of collection. PBMC were separated from the whole blood by Ficoll-Paque™ gradient technique and stored in liquid nitrogen for batched T-SPOT.TB analysis.
ELISpotLaboratory workers were blinded to the clinical status of participants. The ELISpot assaywas performed using the T-SPOT.TB kit according to manufacturer’s instructions (13).Viable PBMC (2.5 × 10⁵ cells /well) in serum free media were added to the pre-coatedplates and stimulated with the provided antigens and controls for 16-20 hours at 37°C with5% CO2. After incubation, the plates were developed and the number of spots were countedusing ImmunoSpot 3.2 reader and verified manually. A positive response was defined,irrespective of the phytohaemaglutinin (PHA) positive control response, as greater than 6spot forming cells (SFC) in either ESAT-6 or CFP-10 wells above the SFC in the negativecontrol (if Nil control had 0-5 spots) or at least double the nil control spot count where thenil control had 6-10 SFC. A negative response was recorded if the above criteria were notmet and the positive control was valid. An indeterminate response was recorded in thepresence of less than twenty SFC in the PHA well when ESAT-6 / CFP-10 wells were non-reactive (less than six SFC) or in the presence of a nil control count greater than ten SFC.
TB Microscopy and cultureThe sputum collection, microscopy and culture were performed as part of the national TBprogramme at a national reference laboratory. The non-TB participants had study-specificsputum collection and processing done.
Statistical methodsWith a sample size of 166, we aimed to detect a 30% increase in the proportion of positiveT.SPOT-TB result in the active versus non-TB group with 95% power and a 5% level ofsignificance. Predictors of disease status were analysed by logistic regression using culturepositivity or negativity as the response variable. The model was built both manually andusing the step-wise method and we included variables considered to be associated withactive tuberculosis including age, sex, and previous TB history. Confounding variables,outlying and influential observations were identified and possible effect-modificationassessed. ROC analysis was conducted to determine sensitivity and specificity at varyingcut-off values for T-SPOT.TB. The ROC curves of the T-SPOT.TB and the ratio of spotforming cells (SFC) to CD4 count were compared by assessing equivalence of areas underthe curve (AUCs). Post-hoc analysis was done comparing the sputum smear microscopy tothe quantitative T-cell response using scatter plots and the Kruskal-Wallis test to compare
ONI et al. Page 3
Eur Respir J. Author manuscript; available in PMC 2011 January 23.
Europe PM
C Funders A
uthor Manuscripts
Europe PM
C Funders A
uthor Manuscripts
medians. All p-values were two-sided with α=0.05. All data were analysed using STATA10.0 (StataCorp, College Station, Texas).
RESULTSBaseline characteristics of study participants
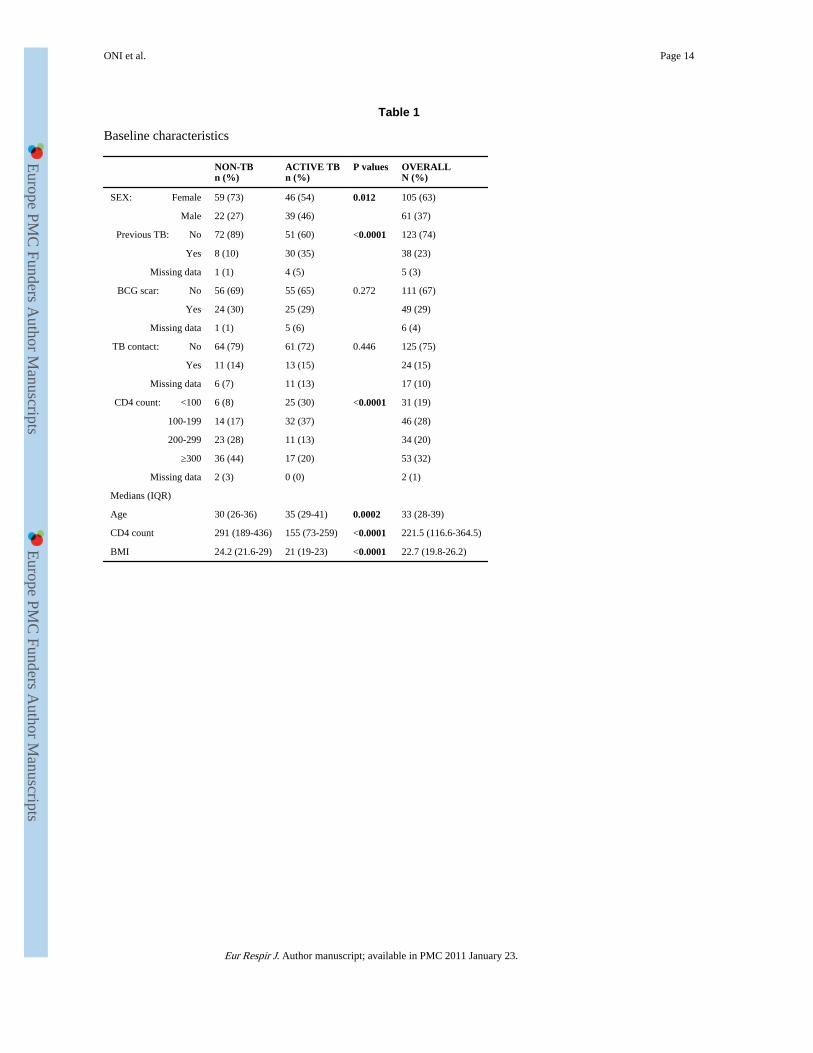
Table 1 summarises the baseline characteristics of participants. Of the 166 participants, 63%were female. TB patients were significantly more likely to be older and male with a previoushistory of TB. All TB patients were TB culture-positive with 34 (40%) smear-negative(median time to culture positivity 17 days). Stratification by CD4 showed that 44% of TBpatients with CD4<200 were smear negative compared to 32% of patients with CD4>200although not statistically significant (p=0.3).
T-SPOT.TB resultsOf the 166 participants, the T-SPOT.TB assay was positive in 92 (55.4%) overall. Themedian SFC/million was higher in the active (56, IQR 24-184) versus non-TB group (20,IQR 4-60), p<0.0001. There were a significantly higher proportion of T-SPOT.TB positiveresults in the active TB versus non-TB group (68% vs. 42% respectively, p=0.001) as shownin Figure 1A (left panel). There was a 5% indeterminate result rate (n=8, median CD4 154.5,IQR 80.5-209.5), all due to nil control spot counts>10, with a non-significant trend towardsan increased rate in those with CD4 counts<200 (6.5% vs. 3.3%, p=0.349). 71% of thesmear negative, culture positive TB patients were T-SPOT.TB positive.
Summed ESAT-6+CFP-10 response as a ratio of the CD4 count (SFC/CD4)Using the T-SPOT.TB assay, the SFC/CD4 was calculated by dividing the total number ofspot-forming cells above the negative control by the CD4 count. Overall values ranged from−0.48 to 78. The median ratio in the active TB group (0.42, IQR 0.15-1.67) was significantlyhigher (p<0.001) than in the non-TB group (median 0.079, IQR 0.02-0.21) as shown inFigure 1A (right panel).
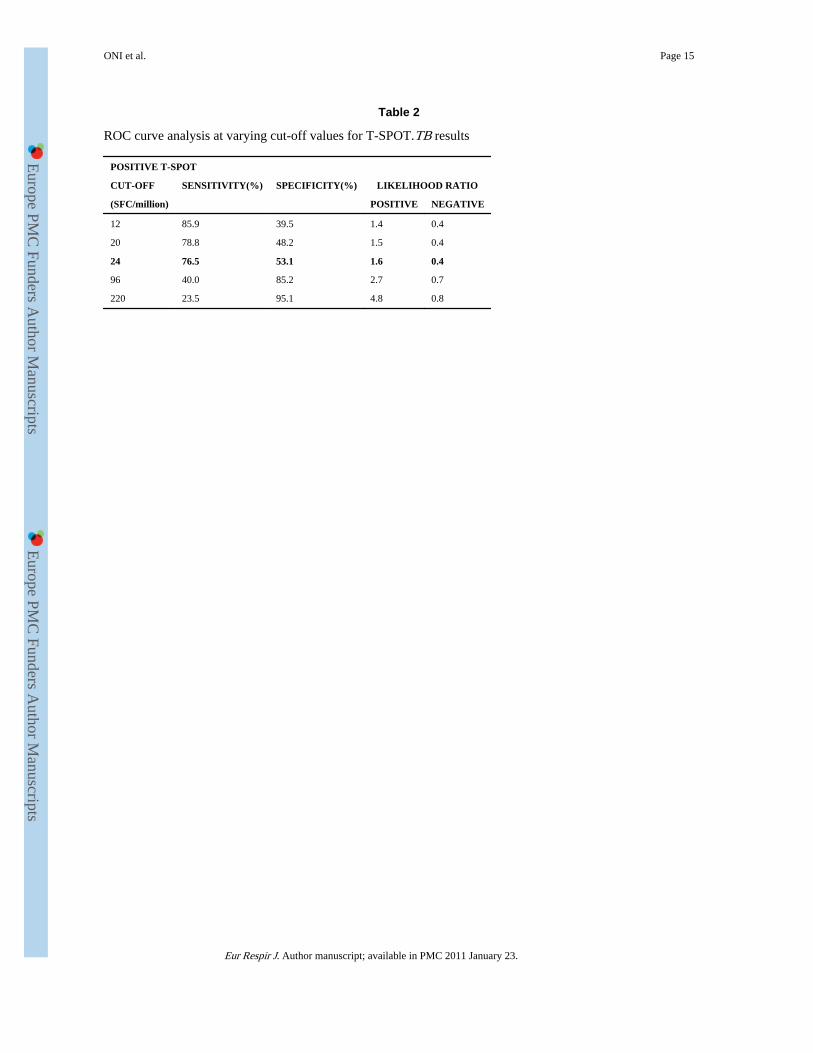
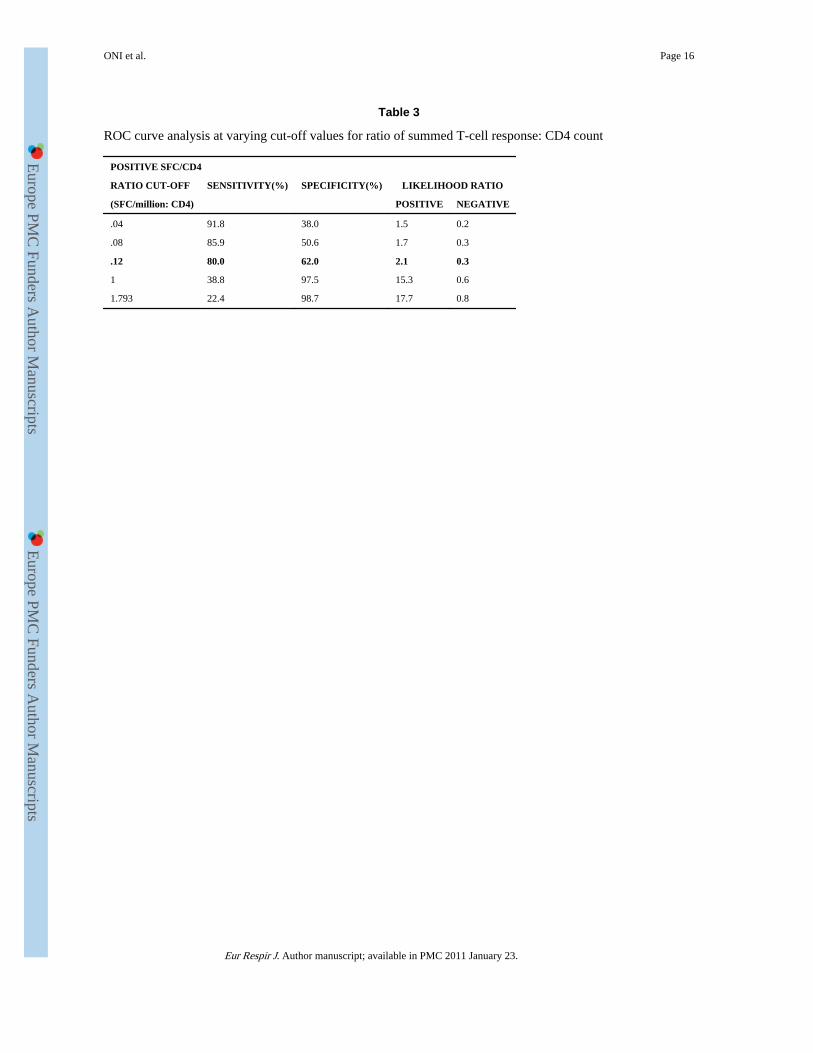
ROC AnalysisReceiver operating characteristic curve analysis was conducted on results, including thosewith indeterminate values using the TB and non-TB arms as comparator groups. Using themanufacturer’s cut-off for the T-SPOT.TB assay, the sensitivity for diagnosis of active TBwas 76% (95%CI 70-83%) with a specificity of 53% (95%CI 46-61%) and a positivelikelihood ratio of 1.63. Using a cut-off of 0.12 for the SFC/CD4, the sensitivity was 80%(95% CI 74%-86%) and specificity 62% (95% CI 56%-73%) with a likelihood ratio of 2.1.Lowering the T-SPOT.TB cut-off to achieve a similar sensitivity resulted in a lowerspecificity (see tables 2 and 3). The likelihood ratios (LR) of both the SFC/CD4 and the T-SPOT.TB tests were low at the chosen cut-off values although at any given sensitivity orspecificity, the SFC/CD4 had superior likelihood ratios. The positive predictive value (PPV)was greater using the SFC/CD4 compared to the T-SPOT.TB (70% vs. 63%). Importantly,the negative predictive value (NPV) for the SFC/CD4 was also higher than the T-SPOT.TBtest (75% vs. 67%). The area under the curve was significantly greater using the SFC/CD4compared to the T-SPOT.TB (p=0.001) as shown in Figure 1B.
Risk factors for Active Tuberculosis and T-SPOT.TB positivityIn univariate analysis, there was a positive association between active TB and older age,lower BMI, male sex, lower CD4, history of previous TB, a positive T-SPOT.TB result andSFC/CD4 above 0.12. In multivariate analysis CD4> 200 (OR 0.24, p=0.001), body massindex (OR 0.85, p=0.001), older age (OR 1.04, p=0.021) and the SFC/CD4 ratio (OR 5.99,
ONI et al. Page 4
Eur Respir J. Author manuscript; available in PMC 2011 January 23.
Europe PM
C Funders A
uthor Manuscripts
Europe PM
C Funders A
uthor Manuscripts

p<0.0001) were associated with active TB (table 4). Significant predictors of a positive T-SPOT.TB test were higher age (RR 2.2, p=0.04), history of previous TB (RR 2.8, p=0.033),and culture positive TB (RR 3.2,p=0.024). There was no significant confounding orinteraction between variables.
T-cell response and degree of immunosuppressionOverall there was no significant correlation between the IFN-γ SFC response and the degreeof immunosuppression as measured by the CD4 count (Spearman correlation coefficient r=−0.022, p=0.78). However when results were stratified by CD4 category and TB diseasestatus, a CD4>200 was found to be associated with a positive T-SPOT.TB result (p=0.029)in the non-TB group implying that advanced immunosuppression does impair theperformance of the T-SPOT.TB test in this group. Figure 2 shows an increasing proportionof T-SPOT.TB positive results with increasing CD4 counts. Interestingly, this was not thecase in the active TB disease group (p=0.939) implying that the sensitivity of the T-SPOT.TB test is impaired by advanced immunosuppression in the non-TB group but lessaffected in active TB.
Secondary AnalysisBacillary load and T-cell response—We conducted a post-hoc analysis relating thedegree of sputum positivity in active TB to the quantitative T-SPOT.TB assay response. Wefound a significant association with the bacillary load as estimated by the degree of sputumsmear microscopy positivity (Figure 3). There was a positive bacillary load-immuneresponse relationship with a significant increase in quantitative T-cell response withincreasing smear positivity (Kruskal-Wallis test p=0.0008). To further explore thisrelationship, we examined the correlation between the immune response and the number ofdays to culture positivity (CP) as an alternative surrogate marker of bacillary load. Thisshowed a non-statistically significant negative correlation between SFC and days to culturepositivity (Spearman’s co-efficient r=−0.12, p=0.29) although notably 90% of specimensthat became culture positive after 11 days (median days to CP) had SFC/million counts lessthan 290 (the 90th percentile of SFC) as shown in figure 4.
DISCUSSIONWe have assessed a novel ratio technique of diagnosing active TB in an HIV-1 co-infectedpopulation in a highly TB endemic setting by relating the total number of spot forming cellsfrom the T-SPOT.TB test to CD4 count. Other diagnostic studies assessing the diagnosis ofactive TB were conducted using the QuantiFERON-TB Gold-In-Tube test, non-commercialin-house assays, and non-commercial ELISpot assays in predominantly HIV negativepopulations, or in low TB endemicity settings (12, 14-20). We used the T-SPOT.TB test asprevious studies have reported the T-SPOT.TB to have a better sensitivity than theQuantiFERON-TB Gold-In-Tube test in HIV-1 infected persons in high prevalence settingssuch as ours (10, 11).
The T-SPOT.TB diagnosed active TB disease with a sensitivity of 76% and a specificity of53%. The SFC/CD4 diagnosed TB disease with a higher sensitivity with a ratio above 0.12indicating a 6-fold higher risk of TB disease in multivariate analysis. The sensitivity of theSFC/CD4 ratio in diagnosing active TB remained high in advanced immunosuppression.Therefore in practice, in an HIV-infected patient with a SFC/CD4>0.12, active TB should bestrongly suspected and investigated while a positive T-SPOT.TB should promptconsideration of latent infection treatment. In those with a SFC/CD4<0.12, although activeTB is not excluded, they should be considered for treatment of latent infection. However, we
ONI et al. Page 5
Eur Respir J. Author manuscript; available in PMC 2011 January 23.
Europe PM
C Funders A
uthor Manuscripts
Europe PM
C Funders A
uthor Manuscripts
acknowledge a NPV of 75% means that 25% of active TB cases would test negative usingthis method (33% using the T-SPOT.TB) potentially limiting its use in clinical practice.
In the smear-negative, culture-positive patients, the median time to culture positivity was 17days. Importantly, the time to diagnosis could potentially have been shortened by 2 weeksusing the T-SPOT.TB test with public health implications including reducing infectivity andtransmission rates as well as potentially decreasing morbidity and mortality.
In the non-TB group, a CD4 count<200/mm3 was associated with impaired testperformance. A possible reason for this is that the higher bacillary load associated withhaving TB disease drives a positive TB-specific antigen response regardless of CD4 countresulting in relatively less impaired test performance. By contrast, the positive responses inthe non-TB group would be less intense due to lower bacillary load making test accuracysusceptible to impairment in advanced immunosuppression. This hypothesis is supported inour data, both by the presence of a strong bacillary load-immune response association andthe raw data showing higher responses in the active TB group. To our knowledge, this is oneof the clearest bacillary load-immune response relationships to be demonstrated in humans,using sputum smear microscopy to estimate bacillary load. Our results showed a negativecorrelation between the immune response and number of days to culture positivity that,although we did not find statistical significance, is worthy of further investigation.
Previous studies have suggested that the infectious load is associated with the magnitude ofT-cell response. Hill et al showed that the quantitative ELISpot response reflected the likelyinfecting dose of M.tb, measured by gradient of exposure to smear and culture positive TBpatients (21). Ribeiro et al also hypothesized that IFN gamma-producing T cells might berelated to bacterial load, determined using surrogate disease severity markers of low BMIand presence of cavitatory disease (22). In these two studies, participants werepredominantly HIV-uninfected. These, and our, data suggest that the T-cell response couldbe used as a surrogate marker for treatment response, disease relapse or monitoringprogression from latent to active disease. A small pilot study conducted in Uganda byGoletti et al showed potential utility by demonstrating that RD1 T-cell responses decrease inHIV/TB patients after successful therapy for TB (23). Aiken et al achieved a similarconclusion in a predominantly HIV-uninfected cohort (24). Our results suggest that the samemight be true for HIV-infected persons. However Ribeiro et al found a high inter-patientvariability in quantitative results potentially limiting the use of post-treatment immuneresponse assessment in practice (22).
The SFC/CD4 cut-off value used in this study is lower than found in a similar pilot studyconducted by our laboratory (12). To further investigate this we conducted a parallelcomparison of the in-house assay to the T-SPOT.TB and found the in-house assay to score agreater proportion positive with a higher number of spot forming units (data not shown).This factor contributes to the difference in ratios.
This study has several strengths. The definition of the control non-TB group, who were bothasymptomatic and had two sputum TB culture negative results, is very robust. In this HIV-infected population known to have a high prevalence of asymptomatic, sub-clinical TB, wefelt the definition of non-TB persons had to be actively sought through comprehensivescreening. In addition, this is the largest study to assess the ability of the T-SPOT.TB testand the ratio of the summed T-cell response over the CD4 count to differentiate active fromlatent TB in an HIV-infected population in a highly TB endemic setting.
ONI et al. Page 6
Eur Respir J. Author manuscript; available in PMC 2011 January 23.
Europe PM
C Funders A
uthor Manuscripts
Europe PM
C Funders A
uthor Manuscripts
LimitationsThe relatively low specificity of the SFC/CD4 ratio, although higher than the T-SPOT.TBtest alone, means that it would be more suitable as a ‘rule-in’ test to seek a diagnosis ofactive TB than as a rule-out test to exclude TB. A higher proportion of active TB patientshad a history of previous TB, potentially biasing this group towards a higher response rateand ratio compared to the non-TB group. However, as the T-SPOT.TB assay is a shortovernight assay, the T-cell response is thought to predominantly constitute effector, and notmemory, T-cells. Therefore, a previous history of TB, which would induce memory T-cells,should not significantly influence our results.
Active TB patients were significantly older, with lower CD4 counts and BMI as well as ahigher proportion of males compared to the non-TB group. In multivariate analysis, age,BMI and a low CD4 count were significant risk factors for active TB. This difference inbaseline characteristics between the 2 groups could be a potential source of bias.
In relating smear microscopy results to the T-cell response, our analysis was post-hoc andsmear microscopy was performed at reference laboratories as per programmatic guidelinesand not study-specific. As a result, performer-related variability could affect the validity ofresults. Nonetheless, the findings are interesting and warrant further investigation undermore controlled conditions.
In addition, frozen cells were used instead of fresh as recommended by the manufacturer,due to logistic constraints of the study. As a result, we conducted a direct comparison offresh and frozen cells from 11 patients (frozen for a mean of 2.5 days) and showed nodifference in proportion of non-responders between fresh and frozen samples (data notshown).
In conclusion, in this high TB burden setting, a PPV of 70% and NPV of 75% could limit itsclinical use as 30% of persons testing positive using the ratio would be unnecessarily treatedand 25% of those testing negative will have a TB diagnosis missed. As a result, our findingsare more easily translated into practice in low TB prevalence areas where the pre-testprobability of latent infection is lower than in our setting. Nonetheless, that the novel ratiotechnique could aid the clinical decision to start TB treatment, particularly in advancedimmunosuppression, shortening the time to TB treatment merits further evaluation.
AcknowledgmentsRJW is funded by the Wellcome Trust (072070, 084323, 088316) and MRC (UK).
Grant support from the European Union (EU Sante 121404C/G/Multi).
Grant support from the National Institutes of Health (NIH 1RO1HD058791-01)
JP received travel support from Oxford Immunotec.
T-SPOT.TB kits were supplied by Oxford Immunotec.
MM receives funding support from PEPFAR/USAID.
Oxford Immunotec had no part in the design of the study or the decision to publish the findings of this study.
REFERENCES1. Global tuberculosis control : epidemiology, strategy, financing : WHO report 2009. 2009. Report
No.: 978 92 4 156380 2
ONI et al. Page 7
Eur Respir J. Author manuscript; available in PMC 2011 January 23.
Europe PM
C Funders A
uthor Manuscripts
Europe PM
C Funders A
uthor Manuscripts
2. Wood R, Maartens G, Lombard CJ. Risk factors for developing tuberculosis in HIV-1-infectedadults from communities with a low or very high incidence of tuberculosis. J Acquir Immune DeficSyndr. Jan 1; 2000 23(1):75–80. [PubMed: 10708059]
3. Elliott AM, Hodsdon WS, Kyosiimire J, Quigley MA, Nakiyingi JS, Namujju PB, et al. Cytokineresponses and progression to active tuberculosis in HIV-1-infected Ugandans: a prospective study.Trans R Soc Trop Med Hyg. Nov; 2004 98(11):660–70. [PubMed: 15363646]
4. Sonnenberg P, Glynn JR, Fielding K, Murray J, Godfrey-Faussett P, Shearer S. How soon afterinfection with HIV does the risk of tuberculosis start to increase? A retrospective cohort study inSouth African gold miners. J Infect Dis. Jan 15; 2005 191(2):150–8. [PubMed: 15609223]
5. Elliott AM, Namaambo K, Allen BW, Luo N, Hayes RJ, Pobee JO, et al. Negative sputum smearresults in HIV-positive patients with pulmonary tuberculosis in Lusaka, Zambia. Tuber Lung Dis.Jun; 1993 74(3):191–4. [PubMed: 8369514]
6. Huebner RE, Schein MF, Bass JB Jr. The tuberculin skin test. Clin Infect Dis. Dec; 1993 17(6):968–75. [PubMed: 8110954]
7. Duncan LE, Elliott AM, Hayes RJ, Hira SK, Tembo G, Mumba GT, et al. Tuberculin sensitivity andHIV-1 status of patients attending a sexually transmitted diseases clinic in Lusaka, Zambia: a cross-sectional study. Trans R Soc Trop Med Hyg. Jan-Feb;1995 89(1):37–40. [PubMed: 7747304]
8. Clark SA, Martin SL, Pozniak A, Steel A, Ward B, Dunning J, et al. Tuberculosis antigen-specificimmune responses can be detected using enzyme-linked immunospot technology in humanimmunodeficiency virus (HIV)-1 patients with advanced disease. Clin Exp Immunol. Nov; 2007150(2):238–44. [PubMed: 17672869]
9. Chapman AL, Munkanta M, Wilkinson KA, Pathan AA, Ewer K, Ayles H, et al. Rapid detection ofactive and latent tuberculosis infection in HIV-positive individuals by enumeration ofMycobacterium tuberculosis-specific T cells. AIDS. Nov 22; 2002 16(17):2285–93. [PubMed:12441800]
10. Mandalakas AM, Hesseling AC, Chegou NN, Kirchner HL, Zhu X, Marais BJ, et al. High level ofdiscordant IGRA results in HIV-infected adults and children. Int J Tuberc Lung Dis. Apr; 200812(4):417–23. [PubMed: 18371268]
11. Rangaka MX, Wilkinson KA, Seldon R, Van Cutsem G, Meintjes GA, Morroni C, et al. Effect ofHIV-1 infection on T-Cell-based and skin test detection of tuberculosis infection. Am J Respir CritCare Med. Mar 1; 2007 175(5):514–20. [PubMed: 17158278]
12. Rangaka MX, Diwakar L, Seldon R, van Cutsem G, Meintjes GA, Morroni C, et al. Clinical,immunological, and epidemiological importance of antituberculosis T cell responses in HIV-infected Africans. Clin Infect Dis. Jun 15; 2007 44(12):1639–46. [PubMed: 17516410]
13. T-SPOT® Oxford Immunotec. Oxford UK: www.oxfordimmunotec.com [Accessed 6 July 2009]
14. Chen X, Yang Q, Zhang M, Graner M, Zhu X, Larmonier N, et al. Diagnosis of active tuberculosisin China using an in-house gamma interferon enzyme-linked immunospot assay. Clin VaccineImmunol. Jun; 2009 16(6):879–84. [PubMed: 19339489]
15. Chee CB, Gan SH, Khinmar KW, Barkham TM, Koh CK, Liang S, et al. Comparison ofsensitivities of two commercial gamma interferon release assays for pulmonary tuberculosis. JClin Microbiol. Jun; 2008 46(6):1935–40. [PubMed: 18400912]
16. Nishimura T, Hasegawa N, Mori M, Takebayashi T, Harada N, Higuchi K, et al. Accuracy of aninterferon-gamma release assay to detect active pulmonary and extra-pulmonary tuberculosis. Int JTuberc Lung Dis. Mar; 2008 12(3):269–74. [PubMed: 18284831]
17. Kang YA, Lee HW, Hwang SS, Um SW, Han SK, Shim YS, et al. Usefulness of whole-bloodinterferon-gamma assay and interferon-gamma enzyme-linked immunospot assay in the diagnosisof active pulmonary tuberculosis. Chest. Sep; 2007 132(3):959–65. [PubMed: 17505029]
18. Dewan PK, Grinsdale J, Kawamura LM. Low sensitivity of a whole-blood interferon-gammarelease assay for detection of active tuberculosis. Clin Infect Dis. Jan 1; 2007 44(1):69–73.[PubMed: 17143818]
19. Syed Ahamed Kabeer B, Sikhamani R, Swaminathan S, Perumal V, Paramasivam P, Raja A. Roleof interferon gamma release assay in active TB diagnosis among HIV infected individuals. PLoSONE. 2009; 4(5):e5718. [PubMed: 19479058]
ONI et al. Page 8
Eur Respir J. Author manuscript; available in PMC 2011 January 23.
Europe PM
C Funders A
uthor Manuscripts
Europe PM
C Funders A
uthor Manuscripts
20. Ewer K, Deeks J, Alvarez L, Bryant G, Waller S, Andersen P, et al. Comparison of T-cell-basedassay with tuberculin skin test for diagnosis of Mycobacterium tuberculosis infection in a schooltuberculosis outbreak. Lancet. Apr 5; 2003 361(9364):1168–73. [PubMed: 12686038]
21. Hill PC, Fox A, Jeffries DJ, Jackson-Sillah D, Lugos MD, Owiafe PK, et al. Quantitative T cellassay reflects infectious load of Mycobacterium tuberculosis in an endemic case contact model.Clin Infect Dis. Jan 15; 2005 40(2):273–8. [PubMed: 15655747]
22. Ribeiro S, Dooley K, Hackman J, Loredo C, Efron A, Chaisson RE, et al. T-SPOT.TB responsesduring treatment of pulmonary tuberculosis. BMC Infect Dis. 2009; 9:23. [PubMed: 19250549]
23. Goletti D, Carrara S, Mayanja-Kizza H, Baseke J, Mugerwa MA, Girardi E, et al. Response to M.tuberculosis selected RD1 peptides in Ugandan HIV-infected patients with smear positivepulmonary tuberculosis: a pilot study. BMC Infect Dis. 2008; 8:11. [PubMed: 18226199]
24. Aiken AM, Hill PC, Fox A, McAdam KP, Jackson-Sillah D, Lugos MD, et al. Reversion of theELISPOT test after treatment in Gambian tuberculosis cases. BMC Infect Dis. 2006; 6:66.[PubMed: 16573826]
ONI et al. Page 9
Eur Respir J. Author manuscript; available in PMC 2011 January 23.
Europe PM
C Funders A
uthor Manuscripts
Europe PM
C Funders A
uthor Manuscripts
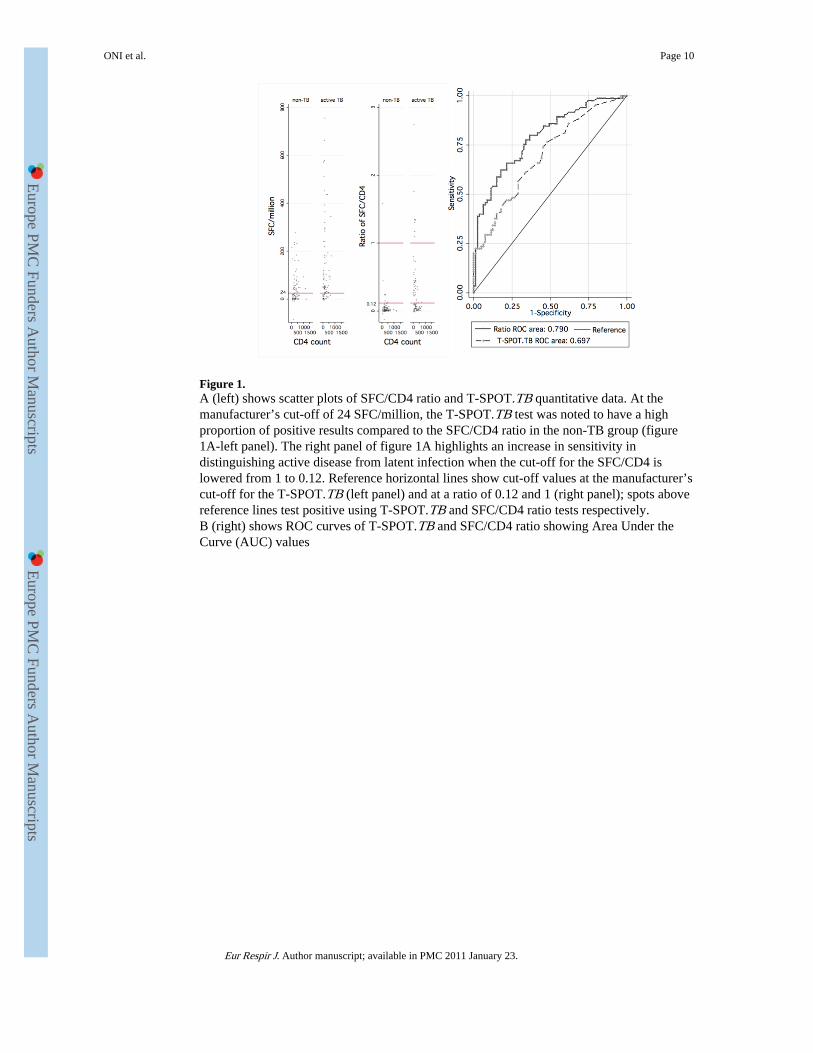
Figure 1.A (left) shows scatter plots of SFC/CD4 ratio and T-SPOT.TB quantitative data. At themanufacturer’s cut-off of 24 SFC/million, the T-SPOT.TB test was noted to have a highproportion of positive results compared to the SFC/CD4 ratio in the non-TB group (figure1A-left panel). The right panel of figure 1A highlights an increase in sensitivity indistinguishing active disease from latent infection when the cut-off for the SFC/CD4 islowered from 1 to 0.12. Reference horizontal lines show cut-off values at the manufacturer’scut-off for the T-SPOT.TB (left panel) and at a ratio of 0.12 and 1 (right panel); spots abovereference lines test positive using T-SPOT.TB and SFC/CD4 ratio tests respectively.B (right) shows ROC curves of T-SPOT.TB and SFC/CD4 ratio showing Area Under theCurve (AUC) values
ONI et al. Page 10
Eur Respir J. Author manuscript; available in PMC 2011 January 23.
Europe PM
C Funders A
uthor Manuscripts
Europe PM
C Funders A
uthor Manuscripts
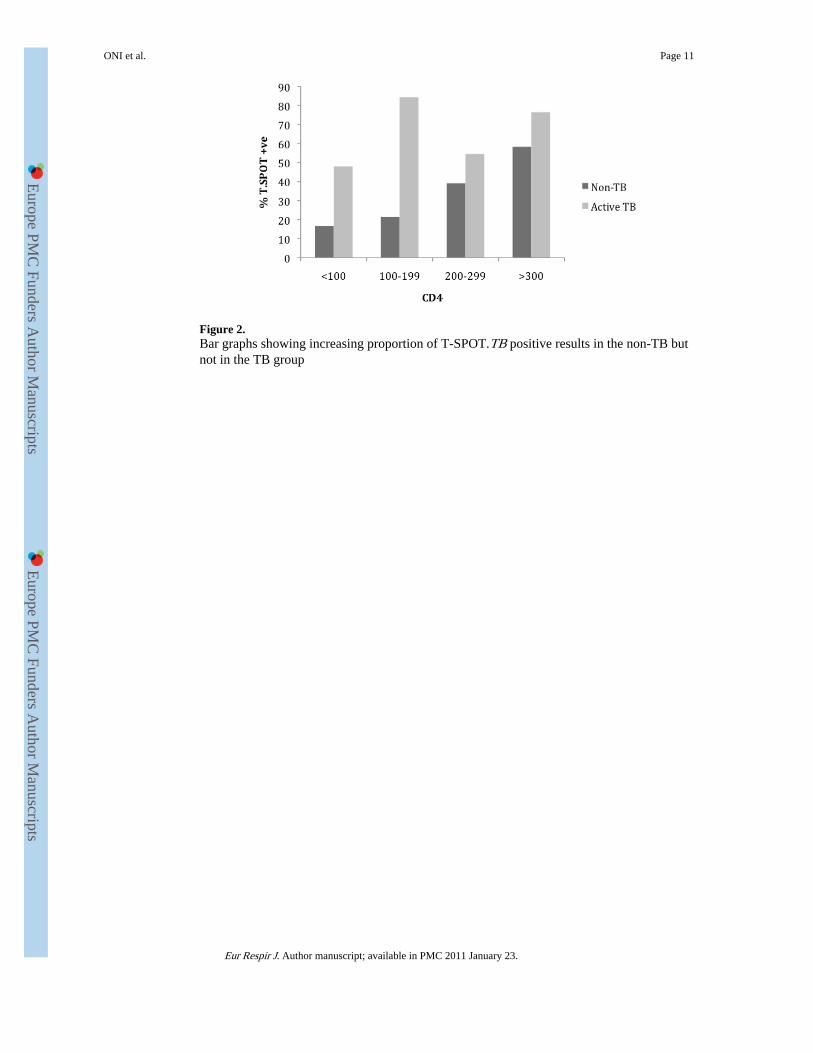
Figure 2.Bar graphs showing increasing proportion of T-SPOT.TB positive results in the non-TB butnot in the TB group
ONI et al. Page 11
Eur Respir J. Author manuscript; available in PMC 2011 January 23.
Europe PM
C Funders A
uthor Manuscripts
Europe PM
C Funders A
uthor Manuscripts
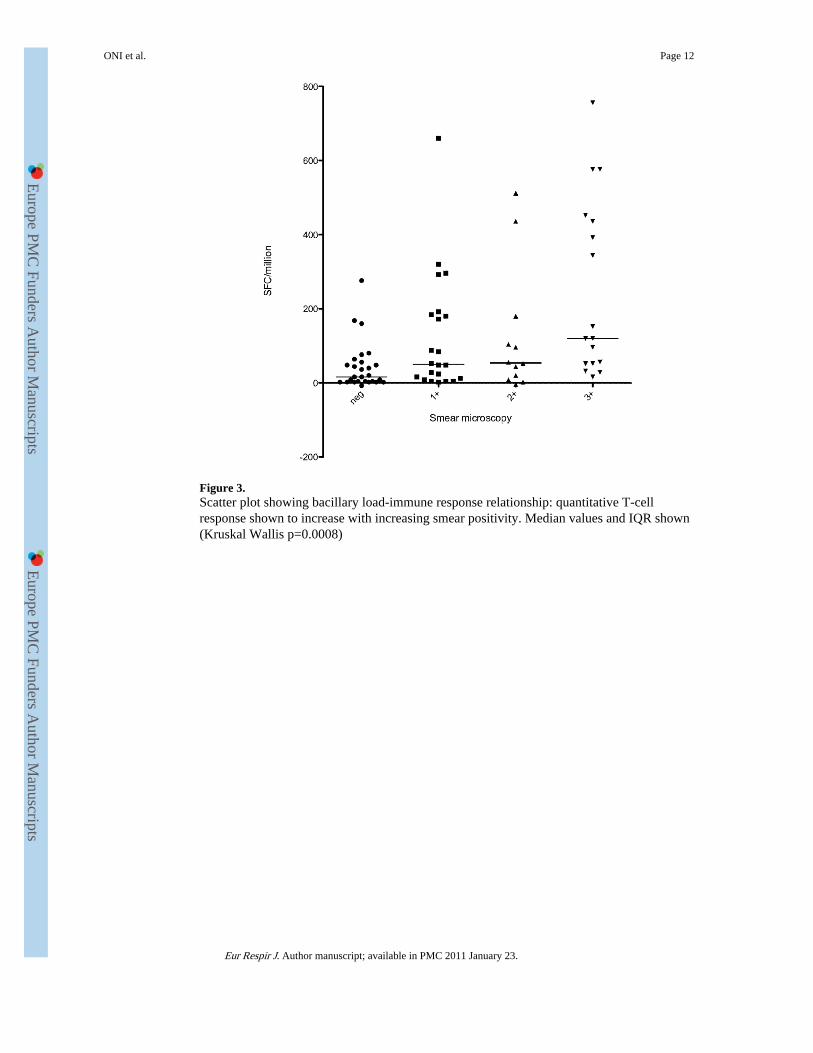
Figure 3.Scatter plot showing bacillary load-immune response relationship: quantitative T-cellresponse shown to increase with increasing smear positivity. Median values and IQR shown(Kruskal Wallis p=0.0008)
ONI et al. Page 12
Eur Respir J. Author manuscript; available in PMC 2011 January 23.
Europe PM
C Funders A
uthor Manuscripts
Europe PM
C Funders A
uthor Manuscripts
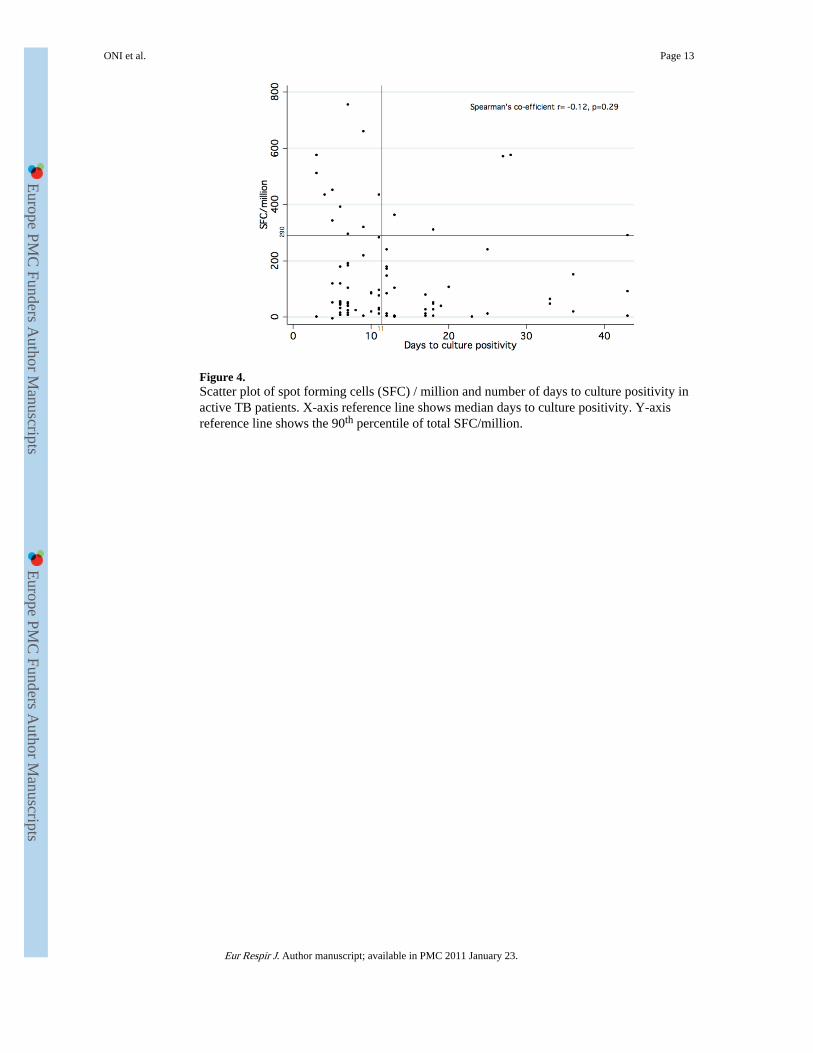
Figure 4.Scatter plot of spot forming cells (SFC) / million and number of days to culture positivity inactive TB patients. X-axis reference line shows median days to culture positivity. Y-axisreference line shows the 90th percentile of total SFC/million.
ONI et al. Page 13
Eur Respir J. Author manuscript; available in PMC 2011 January 23.
Europe PM
C Funders A
uthor Manuscripts
Europe PM
C Funders A
uthor Manuscripts
Europe PM
C Funders A
uthor Manuscripts
Europe PM
C Funders A
uthor Manuscripts
ONI et al. Page 14
Table 1
Baseline characteristics
NON-TBn (%)
ACTIVE TBn (%)
P values OVERALLN (%)
SEX: Female 59 (73) 46 (54) 0.012 105 (63)
Male 22 (27) 39 (46) 61 (37)
Previous TB: No 72 (89) 51 (60) <0.0001 123 (74)
Yes 8 (10) 30 (35) 38 (23)
Missing data 1 (1) 4 (5) 5 (3)
BCG scar: No 56 (69) 55 (65) 0.272 111 (67)
Yes 24 (30) 25 (29) 49 (29)
Missing data 1 (1) 5 (6) 6 (4)
TB contact: No 64 (79) 61 (72) 0.446 125 (75)
Yes 11 (14) 13 (15) 24 (15)
Missing data 6 (7) 11 (13) 17 (10)
CD4 count: <100 6 (8) 25 (30) <0.0001 31 (19)
100-199 14 (17) 32 (37) 46 (28)
200-299 23 (28) 11 (13) 34 (20)
≥300 36 (44) 17 (20) 53 (32)
Missing data 2 (3) 0 (0) 2 (1)
Medians (IQR)
Age 30 (26-36) 35 (29-41) 0.0002 33 (28-39)
CD4 count 291 (189-436) 155 (73-259) <0.0001 221.5 (116.6-364.5)
BMI 24.2 (21.6-29) 21 (19-23) <0.0001 22.7 (19.8-26.2)
Eur Respir J. Author manuscript; available in PMC 2011 January 23.
Europe PM
C Funders A
uthor Manuscripts
Europe PM
C Funders A
uthor Manuscripts
ONI et al. Page 15
Table 2
ROC curve analysis at varying cut-off values for T-SPOT.TB results
POSITIVE T-SPOT
CUT-OFF SENSITIVITY(%) SPECIFICITY(%) LIKELIHOOD RATIO
(SFC/million) POSITIVE NEGATIVE
12 85.9 39.5 1.4 0.4
20 78.8 48.2 1.5 0.4
24 76.5 53.1 1.6 0.4
96 40.0 85.2 2.7 0.7
220 23.5 95.1 4.8 0.8
Eur Respir J. Author manuscript; available in PMC 2011 January 23.
Europe PM
C Funders A
uthor Manuscripts
Europe PM
C Funders A
uthor Manuscripts
ONI et al. Page 16
Table 3
ROC curve analysis at varying cut-off values for ratio of summed T-cell response: CD4 count
POSITIVE SFC/CD4
RATIO CUT-OFF SENSITIVITY(%) SPECIFICITY(%) LIKELIHOOD RATIO
(SFC/million: CD4) POSITIVE NEGATIVE
.04 91.8 38.0 1.5 0.2
.08 85.9 50.6 1.7 0.3
.12 80.0 62.0 2.1 0.3
1 38.8 97.5 15.3 0.6
1.793 22.4 98.7 17.7 0.8
Eur Respir J. Author manuscript; available in PMC 2011 January 23.

Europe PM
C Funders A
uthor Manuscripts
Europe PM
C Funders A
uthor Manuscripts
ONI et al. Page 17
Table 4
Univariate and Multivariate logistic regression analysis for culture positive TB disease
Univariate analysis Multivariate analysis
OR P values OR P values
Age (years) 1.08(1.04-1.13)
<0.0001 1.038(0.98-1.1)
0.021
Male sex 2.27(1.19-4.35)
0.013 0.75(0.29-1.96)
0.562
BMI 0.84(0.77-0.91)
<0.0001 0.85(0.78-0.93)
0.001
CD4>200 0.16(0.08-0.32)
<0.0001 0.24(0.11-0.54)
0.001
History ofprevious TB
4.19(1.95-8.97)
<0.0001 1.78(0.68-4.62)
0.239
Positive T.SPOT 2.72(1.52-4.86)
0.001 0.81(0.31-2.11)
0.660
Positive ratio 6.9(3.42-13.91)
<0.0001 5.99(2.61-13.77)
<0.0001
BCG scarpresence
1.35(0.77-2.36)
0.291 1.00(0.42-2.41)
1.000
Contact with TB 1.3(0.81-2.11)
0.282 1.43(0.68-2.99)
0.346
Eur Respir J. Author manuscript; available in PMC 2011 January 23.
Related Documents