Working Paper Series Multidimensional poverty and material deprivation Walter Bossert Satya R. Chakravarty Conchita D'Ambrosio ECINEQ WP 2009 – 129

Welcome message from author
This document is posted to help you gain knowledge. Please leave a comment to let me know what you think about it! Share it to your friends and learn new things together.
Transcript

Working Paper Series
Multidimensional poverty and material deprivation Walter Bossert Satya R. Chakravarty Conchita D'Ambrosio
ECINEQ WP 2009 – 129

ECINEQ 2009-129
September 2009
www.ecineq.org
Multidimensional poverty and material
deprivation*
Conchita D'Ambrosio
Walter Bossert Department of Economics and CIREQ, University of Montreal
Satya R. Chakravarty
Indian Statistical Institute, Kolkata
†
* Financial support from the Social Sciences and Humanities Research Council of Canada and MIUR (Prin 2007) is gratefully acknowledged. D'Ambrosio thanks Fondazione Debenedetti for access to the dataset. For helpful comments and suggestions we thank participants at the New Directions in Welfare Conference, Oxford, 2009 and the ECINEQ Conference, Buenos Aires, 2009. † Corresponding author: [email protected]
Università di Milano-Bicocca, DIW Berlin and Econpubblica, Università Bocconi
Abstract
We examine the measurement of multidimensional poverty and material deprivation following the counting approach. In contrast to earlier contributions, dimensions of well-being are not forced to be equally important but different weights can be assigned to different dimensions. We characterize a class of individual measures reflecting this feature. In addition, we axiomatize an aggregation procedure to obtain a class of indices for entire societies allowing for different degrees of inequality aversion in poverty. We apply the proposed measures to European Union member states where the concept of material deprivation was initiated. Keywords: Multidimensional poverty measurement, material deprivation, equity JEL Classification: D63.

1 Introduction
An important development in the study of inequality and poverty in the recent past is
the shift of emphasis from a single dimension, such as income, to a multidimensional
framework. There are several reasons for this.
First, the influential work of some scholars such as Townsend (1979), Streeten (1981)
and Sen (1992), highlighted that the well-being of an individual, and hence inequality and
poverty of a population, is dependent on many dimensions of human life, such as housing,
education, life expectancy, and income is just one of these dimensions. In this framework
poverty is better defined as a situation that reflects failures in different dimensions of
human well-being.
Second, in the income distribution literature income is not important per se but it is
supposed to be a measure of an individual’s command over economic resources. As such
it is not always a good measure since it neglects command over resources out of wealth,
non-cash transfers from the government and support from family and friends. (For a
discussion on this point see, among others, Ringen, 1988.) To measure command over
economic resources insufficient to reach a decent standard of living, aspects in addition
to income should be included. In this process it is necessary to distinguish the absence
of consumption of a good due to individual preferences or that due to inability to afford.
Obviously, the first case should not be considered in the poverty measure. In addition, for
policy purposes, it is necessary to identify the fragment of the population who is currently
poor. In the dataset, the information on income collected regards the previous calendar
year (and is more likely to be misreported—particularly, underreported) while items of
consumption are contemporaneously reported.
The third reason concerns particularly the European Union member states. Within the
EU, the shift in policy focus from pure income poverty towards a wider multidimensional
deprivation framework is particularly intense. Changes in public policies implemented
by the member states were initiated at the March 2000 Lisbon European Council. At
this Council the member states agreed to adopt the Open Method of Coordination which
involves the definition of a set of common objectives on poverty and social exclusion for
the EU as a whole. The Laeken European Council in December 2001 endorsed a first
set of 18 indicators (now known as the Laeken indicators) to evaluate the well-being of
the population. Among the so-called primary indicators are not only measures of income
poverty and inequality but also life expectancy at birth, health status, unemployment and
early school leavers. “Member States are expected to use at least the primary indicators in
1

their national strategy reports, if only to emphasise that in the context of the EU social
inclusion process poverty and social exclusion are a relative concept that encompasses
income, access to essential durables, education, health care, adequate housing, distance
from the labour market.” (European Commission, p.16.)
The European Union distinguishes itself from other countries with a clear endorsement
of the relative concept of poverty. The measures of income poverty within the Laeken
indicators are based on member specific poverty lines, that is, for each member state
the income threshold depends on the income distribution of the specific country and
does not take into account inequality between member states (see Section 4 for details).
This practice has become more problematic with the enlargement of the Union and the
wide differences existing between the income distributions of old and new member states.
Someone poor in one of the old member states will be richer than average in a new
member state. Should the rich be taxed and the poor receive the transfer? This is clearly
a paradoxical situation. Hence, other indicators of the quality of life of an individual are
necessary to evaluate the well-being of a EU resident. (For a discussion on this point,
see, among others, Fahey, 2007, and Whelan, Nolan and Maıtre, 2008.) To distinguish
these multidimensional indicators from pure income poverty measures, the term material
deprivation measures is used.
This shift of emphasis towards multidimensionality has raised many challenges for
social scientists interested in measuring poverty in well-being. The two-stage procedure
suggested by Sen (1976)—consisting of first identifying the poor and then aggregating the
information available on this segment of the population into an index of poverty for the
entire society—has to be extended.
In the multidimensional framework each person possesses a vector of several attributes
that represent different dimensions of well-being. For measuring multidimensional poverty,
it then becomes necessary to check whether a person has “minimally acceptable levels”
(Sen, 1992, p.139) of these attributes. These minimally acceptable quantities of the
attributes represent their threshold limits or cut-offs that are necessary for a subsistence
standard of living. Therefore, a person is treated as deprived or poor in a dimension if
its consumption level of the dimension falls below its cut-off. In this case we say that
the individual is experiencing a functioning failure. Poverty at the individual level is an
increasing function of these failures.
The first stage consisting of the identification of the poor in a multivariate framework
is still a debatable issue. One obvious way of regarding a person as poor is if it experiences
a functioning failure in all dimensions, which enables us to identify the number of poor
2
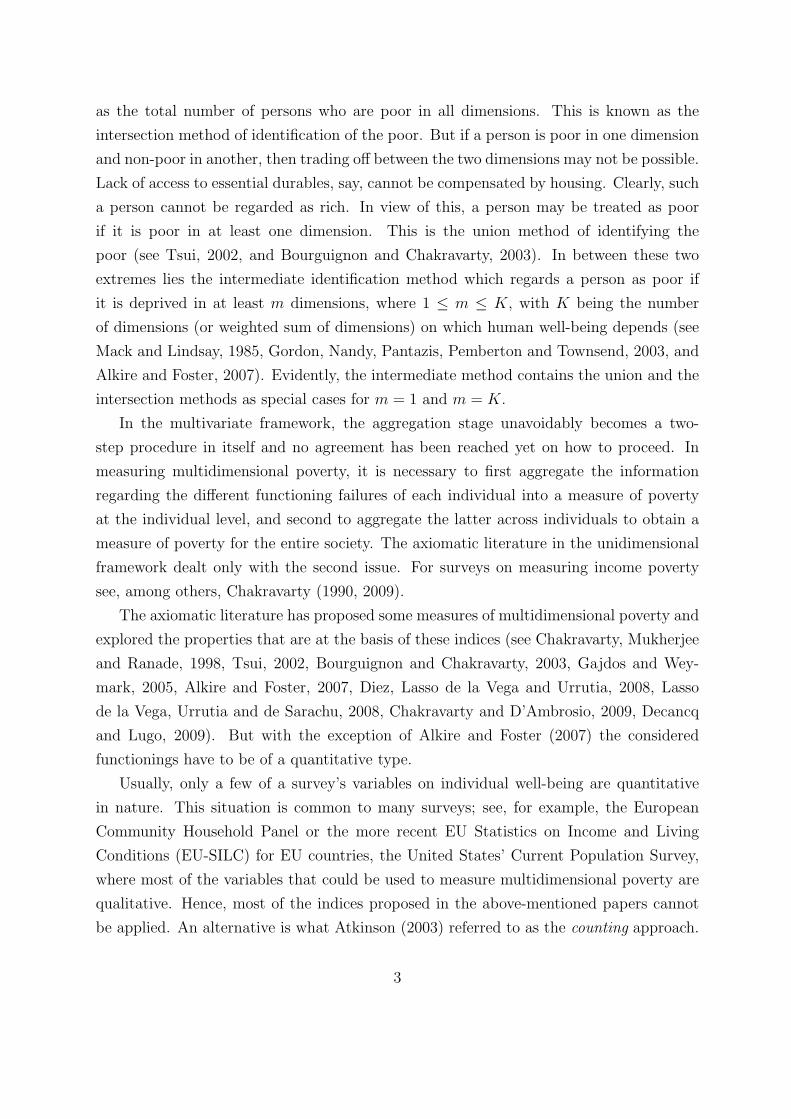
as the total number of persons who are poor in all dimensions. This is known as the
intersection method of identification of the poor. But if a person is poor in one dimension
and non-poor in another, then trading off between the two dimensions may not be possible.
Lack of access to essential durables, say, cannot be compensated by housing. Clearly, such
a person cannot be regarded as rich. In view of this, a person may be treated as poor
if it is poor in at least one dimension. This is the union method of identifying the
poor (see Tsui, 2002, and Bourguignon and Chakravarty, 2003). In between these two
extremes lies the intermediate identification method which regards a person as poor if
it is deprived in at least m dimensions, where 1 ≤ m ≤ K, with K being the number
of dimensions (or weighted sum of dimensions) on which human well-being depends (see
Mack and Lindsay, 1985, Gordon, Nandy, Pantazis, Pemberton and Townsend, 2003, and
Alkire and Foster, 2007). Evidently, the intermediate method contains the union and the
intersection methods as special cases for m = 1 and m = K.
In the multivariate framework, the aggregation stage unavoidably becomes a two-
step procedure in itself and no agreement has been reached yet on how to proceed. In
measuring multidimensional poverty, it is necessary to first aggregate the information
regarding the different functioning failures of each individual into a measure of poverty
at the individual level, and second to aggregate the latter across individuals to obtain a
measure of poverty for the entire society. The axiomatic literature in the unidimensional
framework dealt only with the second issue. For surveys on measuring income poverty
see, among others, Chakravarty (1990, 2009).
The axiomatic literature has proposed some measures of multidimensional poverty and
explored the properties that are at the basis of these indices (see Chakravarty, Mukherjee
and Ranade, 1998, Tsui, 2002, Bourguignon and Chakravarty, 2003, Gajdos and Wey-
mark, 2005, Alkire and Foster, 2007, Diez, Lasso de la Vega and Urrutia, 2008, Lasso
de la Vega, Urrutia and de Sarachu, 2008, Chakravarty and D’Ambrosio, 2009, Decancq
and Lugo, 2009). But with the exception of Alkire and Foster (2007) the considered
functionings have to be of a quantitative type.
Usually, only a few of a survey’s variables on individual well-being are quantitative
in nature. This situation is common to many surveys; see, for example, the European
Community Household Panel or the more recent EU Statistics on Income and Living
Conditions (EU-SILC) for EU countries, the United States’ Current Population Survey,
where most of the variables that could be used to measure multidimensional poverty are
qualitative. Hence, most of the indices proposed in the above-mentioned papers cannot
be applied. An alternative is what Atkinson (2003) referred to as the counting approach.
3
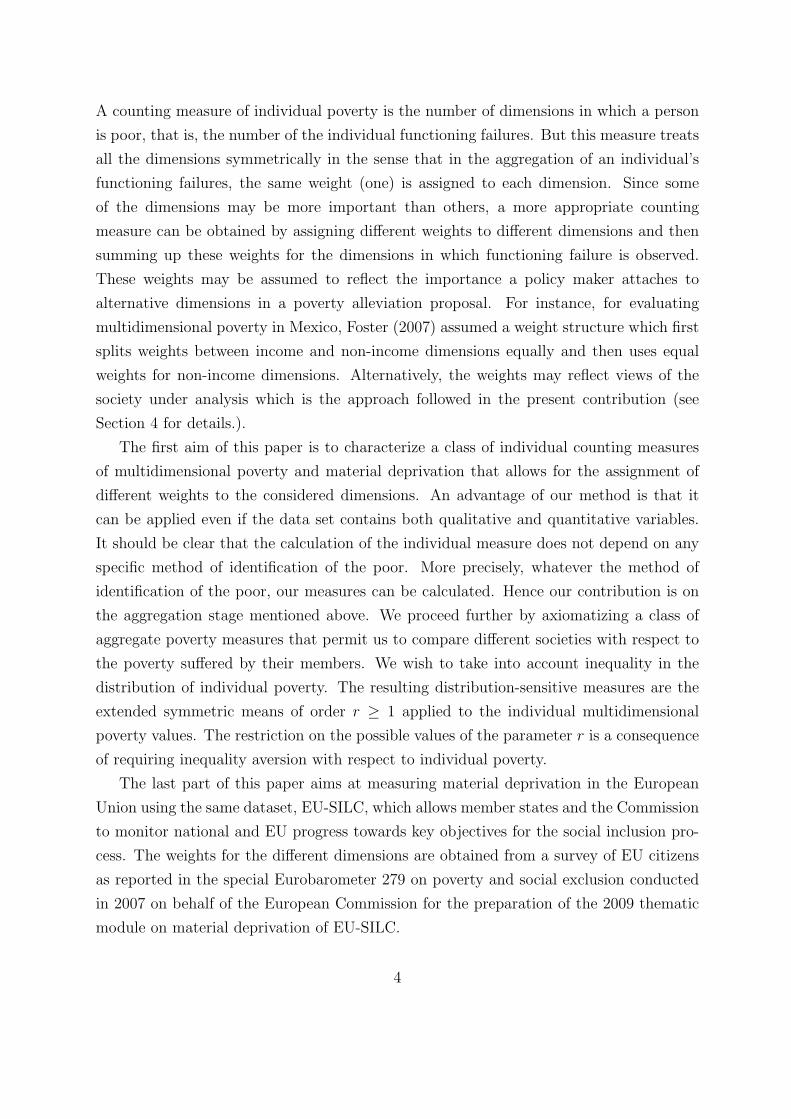
A counting measure of individual poverty is the number of dimensions in which a person
is poor, that is, the number of the individual functioning failures. But this measure treats
all the dimensions symmetrically in the sense that in the aggregation of an individual’s
functioning failures, the same weight (one) is assigned to each dimension. Since some
of the dimensions may be more important than others, a more appropriate counting
measure can be obtained by assigning different weights to different dimensions and then
summing up these weights for the dimensions in which functioning failure is observed.
These weights may be assumed to reflect the importance a policy maker attaches to
alternative dimensions in a poverty alleviation proposal. For instance, for evaluating
multidimensional poverty in Mexico, Foster (2007) assumed a weight structure which first
splits weights between income and non-income dimensions equally and then uses equal
weights for non-income dimensions. Alternatively, the weights may reflect views of the
society under analysis which is the approach followed in the present contribution (see
Section 4 for details.).
The first aim of this paper is to characterize a class of individual counting measures
of multidimensional poverty and material deprivation that allows for the assignment of
different weights to the considered dimensions. An advantage of our method is that it
can be applied even if the data set contains both qualitative and quantitative variables.
It should be clear that the calculation of the individual measure does not depend on any
specific method of identification of the poor. More precisely, whatever the method of
identification of the poor, our measures can be calculated. Hence our contribution is on
the aggregation stage mentioned above. We proceed further by axiomatizing a class of
aggregate poverty measures that permit us to compare different societies with respect to
the poverty suffered by their members. We wish to take into account inequality in the
distribution of individual poverty. The resulting distribution-sensitive measures are the
extended symmetric means of order r ≥ 1 applied to the individual multidimensional
poverty values. The restriction on the possible values of the parameter r is a consequence
of requiring inequality aversion with respect to individual poverty.
The last part of this paper aims at measuring material deprivation in the European
Union using the same dataset, EU-SILC, which allows member states and the Commission
to monitor national and EU progress towards key objectives for the social inclusion pro-
cess. The weights for the different dimensions are obtained from a survey of EU citizens
as reported in the special Eurobarometer 279 on poverty and social exclusion conducted
in 2007 on behalf of the European Commission for the preparation of the 2009 thematic
module on material deprivation of EU-SILC.
4

2 Individual Measures
Suppose there are K ∈ N\1 attributes that are relevant for the degree of well-being of an
individual, such as housing conditions, access to certain goods and services, employment
status, ability to satisfy basic needs. These characteristics are the same across societies
and represented by binary variables: a value of one indicates that the individual is poor
with respect to this attribute, a value of zero identifies a characteristic with respect to
which the individual is not poor. Thus, an individual characteristics vector is an element
of P = 0, 1K and an individual multidimensional poverty measure for individual i is a
function Pi:P → R. This paper is concerned with the aggregation of individual poverty
over characteristics and the across-society aggregation of these individual measures into
a social measure of multidimensional poverty. We begin with a discussion of individual
multidimensional poverty.
Let 0 be the vector consisting of K zeroes and, for all j ∈ 1, . . . , K, let 1j be the
K-dimensional jth unit vector, defined by
1jk =
1 if k = j
0 if k 6= j.
We require Pi to possess the following properties.
Zero normalization. For all j ∈ 1, . . . , K,
Pi(1j) > Pi(0) = 0.
Additive decomposability. For all x, y ∈ P such that (x+ y) ∈ P ,
Pi(x+ y) = Pi(x) + Pi(y).
The normalization assumption is very standard: when the individual is not poor in any
attribute we require the value of the index to be zero. The additive decomposability
property we use is very straightforward as well. Many social index numbers have an
additive structure.
Additive decomposability entails a separability property: the contribution of any vari-
able to the overall index value can be examined in isolation, without having to know the
values of the other variables. In other words, if an individual is poor in some attributes
as indicated by the vector x and becomes also poor in other attributes according to the
vector y then its individual poverty will be simply given by the sum of the poverty values
5

reached separately under x and y. Thus, additive decomposability properties are often
linked to independence conditions of various forms. Note that, because of the finite do-
main considered here, an independence condition is not sufficient unless there are at most
four dimensions to poverty; this can be seen by adapting the corresponding result in Kraft,
Pratt and Seidenberg (1959) to our setting. Because we work with a general number of
poverty attributes and, moreover, the data set used in our application covers well over four
attributes, the full force of additive decomposability is required in our characterization of
the individual generalized counting measure.
The above two properties characterize the class of measures identified in the following
theorem.
Theorem 1 An individual multidimensional poverty measure Pi satisfies zero normaliza-
tion and additive decomposability if and only if there exists α ∈ RK++ such that, for all
x ∈ P,
Pi(x) =
0 if x = 0∑
j∈1,...,K:xj=1 αj if x 6= 0.(1)
Proof. ‘If.’ Clearly, the measures defined in (1) satisfy the required axioms.
‘Only if.’ Suppose Pi satisfies zero normalization and additive decomposability. That
Pi(0) = 0 follows immediately from the equality in zero normalization. Define, for all
j ∈ 1, . . . , K, αj = Pi(1j). By the inequality in the definition of zero normalization,
it follows that αj > 0 for all j ∈ 1, . . . , K. Finally, consider the case in which x 6= 0.
Writing x as
x =∑
j∈1,...,K:xj=1
1j,
additive decomposability requires
Pi(x) =∑
j∈1,...,K:xj=1
Pi(1j) =
∑j∈1,...,K:
xj=1
αj
which completes the proof.
3 Aggregate Measures
Given the individual multidimensional poverty measures Pi for each individual in a so-
ciety, we use an aggregate multidimensional poverty index to obtain an overall measure
6
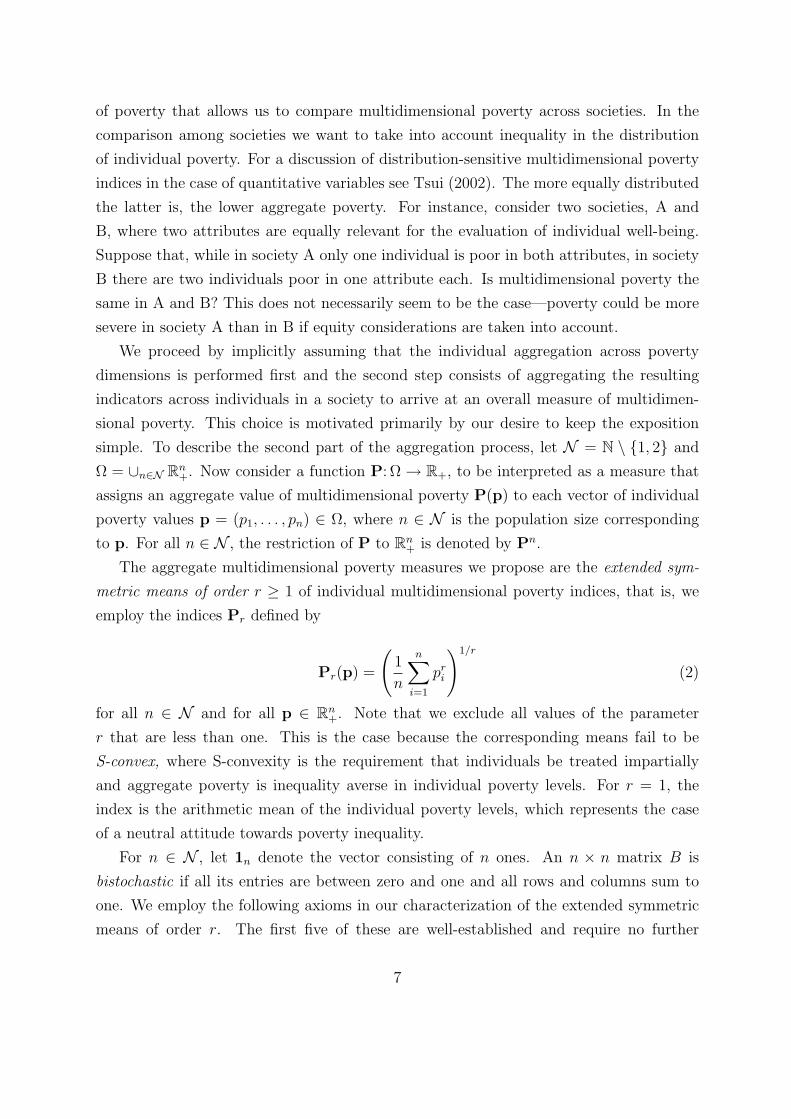
of poverty that allows us to compare multidimensional poverty across societies. In the
comparison among societies we want to take into account inequality in the distribution
of individual poverty. For a discussion of distribution-sensitive multidimensional poverty
indices in the case of quantitative variables see Tsui (2002). The more equally distributed
the latter is, the lower aggregate poverty. For instance, consider two societies, A and
B, where two attributes are equally relevant for the evaluation of individual well-being.
Suppose that, while in society A only one individual is poor in both attributes, in society
B there are two individuals poor in one attribute each. Is multidimensional poverty the
same in A and B? This does not necessarily seem to be the case—poverty could be more
severe in society A than in B if equity considerations are taken into account.
We proceed by implicitly assuming that the individual aggregation across poverty
dimensions is performed first and the second step consists of aggregating the resulting
indicators across individuals in a society to arrive at an overall measure of multidimen-
sional poverty. This choice is motivated primarily by our desire to keep the exposition
simple. To describe the second part of the aggregation process, let N = N \ 1, 2 and
Ω = ∪n∈N Rn+. Now consider a function P: Ω→ R+, to be interpreted as a measure that
assigns an aggregate value of multidimensional poverty P(p) to each vector of individual
poverty values p = (p1, . . . , pn) ∈ Ω, where n ∈ N is the population size corresponding
to p. For all n ∈ N , the restriction of P to Rn+ is denoted by Pn.
The aggregate multidimensional poverty measures we propose are the extended sym-
metric means of order r ≥ 1 of individual multidimensional poverty indices, that is, we
employ the indices Pr defined by
Pr(p) =
(1
n
n∑i=1
pri
)1/r
(2)
for all n ∈ N and for all p ∈ Rn+. Note that we exclude all values of the parameter
r that are less than one. This is the case because the corresponding means fail to be
S-convex, where S-convexity is the requirement that individuals be treated impartially
and aggregate poverty is inequality averse in individual poverty levels. For r = 1, the
index is the arithmetic mean of the individual poverty levels, which represents the case
of a neutral attitude towards poverty inequality.
For n ∈ N , let 1n denote the vector consisting of n ones. An n × n matrix B is
bistochastic if all its entries are between zero and one and all rows and columns sum to
one. We employ the following axioms in our characterization of the extended symmetric
means of order r. The first five of these are well-established and require no further
7
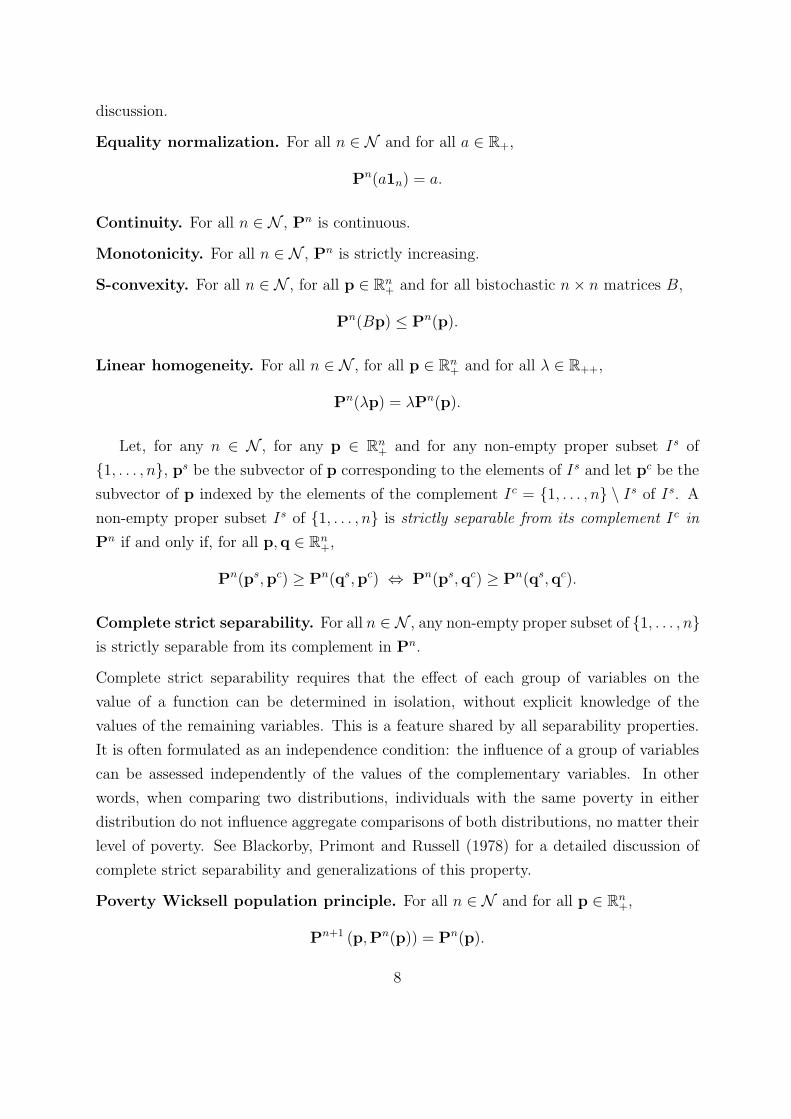
discussion.
Equality normalization. For all n ∈ N and for all a ∈ R+,
Pn(a1n) = a.
Continuity. For all n ∈ N , Pn is continuous.
Monotonicity. For all n ∈ N , Pn is strictly increasing.
S-convexity. For all n ∈ N , for all p ∈ Rn+ and for all bistochastic n× n matrices B,
Pn(Bp) ≤ Pn(p).
Linear homogeneity. For all n ∈ N , for all p ∈ Rn+ and for all λ ∈ R++,
Pn(λp) = λPn(p).
Let, for any n ∈ N , for any p ∈ Rn+ and for any non-empty proper subset Is of
1, . . . , n, ps be the subvector of p corresponding to the elements of Is and let pc be the
subvector of p indexed by the elements of the complement Ic = 1, . . . , n \ Is of Is. A
non-empty proper subset Is of 1, . . . , n is strictly separable from its complement Ic in
Pn if and only if, for all p,q ∈ Rn+,
Pn(ps,pc) ≥ Pn(qs,pc) ⇔ Pn(ps,qc) ≥ Pn(qs,qc).
Complete strict separability. For all n ∈ N , any non-empty proper subset of 1, . . . , nis strictly separable from its complement in Pn.
Complete strict separability requires that the effect of each group of variables on the
value of a function can be determined in isolation, without explicit knowledge of the
values of the remaining variables. This is a feature shared by all separability properties.
It is often formulated as an independence condition: the influence of a group of variables
can be assessed independently of the values of the complementary variables. In other
words, when comparing two distributions, individuals with the same poverty in either
distribution do not influence aggregate comparisons of both distributions, no matter their
level of poverty. See Blackorby, Primont and Russell (1978) for a detailed discussion of
complete strict separability and generalizations of this property.
Poverty Wicksell population principle. For all n ∈ N and for all p ∈ Rn+,
Pn+1 (p,Pn(p)) = Pn(p).
8

The poverty Wicksell population principle establishes a link between societies with dif-
ferent population sizes. It requires that the ceteris-paribus addition of an individual with
aggregate poverty to a given society does not change overall poverty. Intuitively, this
implies that variable-population comparisons are based on average poverty rather than
on total poverty or other aggregation methods across population sizes. See Blackorby
and Donaldson (1984) for a discussion of this property and its link to general averaging
principles.
We obtain
Theorem 2 A function P: Ω → R+ satisfies equality normalization, continuity, mono-
tonicity, S-convexity, linear homogeneity, complete strict separability and the poverty
Wicksell population principle if and only if there exists r ≥ 1 such that P = Pr.
Proof. The ‘if’ part of the theorem statement is straightforward to verify. To prove the
‘only if’ part, suppose P satisfies the required axioms.
Consider first the fixed-population-size case. It is well-known that, for any n ∈ N ,
the class of symmetric means of order rn ≥ 1 is characterized by the fixed-population
restrictions of the axioms equality normalization, continuity, monotonicity, S-convexity,
linear homogeneity and complete strict separability; see, for instance, Hardy, Littlewood
and Polya (1934) and Kolm (1976), among others. Note that the possible values of the
parameter rn are restricted due to our assumption of S-convexity. Furthermore, note that,
without invoking additional properties, the parameter rn can depend on the population
size n and only vectors of dimension n can be compared according to Pn. Thus, we have,
for all n ∈ N and for all p ∈ Rn+,
Pn(p) =
(1
n
n∑i=1
prni
)1/rn
where this function can be used to compare vectors of population size n.
We complete the proof of the theorem by using the poverty Wicksell population prin-
ciple to establish that the rn must be identical for all n and that the resulting function P
can be employed in the comparison of any two vectors of different dimensions as well.
Let n ∈ N and define r = rn+1. Thus,
Pn+1(p) =
(1
n+ 1
n+1∑i=1
pri
)1/r
(3)
for all p ∈ Rn+1+ .
9

Now let p ∈ Rn+. By the poverty Wicksell population principle and (3), we must have
Pn(p) = Pn+1 (p,Pn(p))
=
(1
n+ 1
(n∑
i=1
pri + (Pn(p))r
))1/r
and, solving for Pn(p), we obtain Pn(p) = Pn+1r (p). Thus, the same parameter value r
can be used for population size n and for population size n + 1. Because this is true for
all values of n, P is an extended symmetric mean of order r ≥ 1, as was to be established.
4 Material Deprivation within the EU
The purpose of this section is to illustrate the poverty index Pr, as defined in (2), using
EU-SILC, the dataset used by European Union member states and the Commission to
monitor national and EU progress towards key objectives for the social inclusion process.
We base our analysis on the last two surveys of available cross-sectional data, 2005 and
2006, in order to maximize the number of included countries (in our dataset 23 EU mem-
ber states plus Norway and Iceland). We decided not to consider 2004, the year when
the survey started, since only few member states participated in that year. Unfortunately
we did not have access to data on the Netherlands for bureaucratic reasons. EU-SILC
is an annual survey which provides comparable, cross-sectional and longitudinal multi-
dimensional data on living conditions in the European Union. The variables that could
be used to measure multidimensional poverty are available mainly at the household level.
At the individual level we have information only on education and health. The presence
of many missing values in the latter would compromise the results and, for this reason,
we concentrate on variables at the household level where the problem of missing values
is less severe. We decided to follow a conservative approach since we treated the house-
holds reporting a missing value as those reporting not to have the functioning failure.
As a result, we could be underestimating material deprivation since we are attributing
a functioning failure exclusively to households who explicitly claim to have the failure.
The unit of our analysis is the individual, that is, the household failure is attributed to
each household member and we analyze the distribution of functioning failures among
individuals. The poverty line applied follows the Laeken indicators in being 60% of the
median of the distribution of equivalent income in each country. The equivalence scale
applied is the modified OECD equivalence scale. This scale gives a weight of 1.0 to the
10
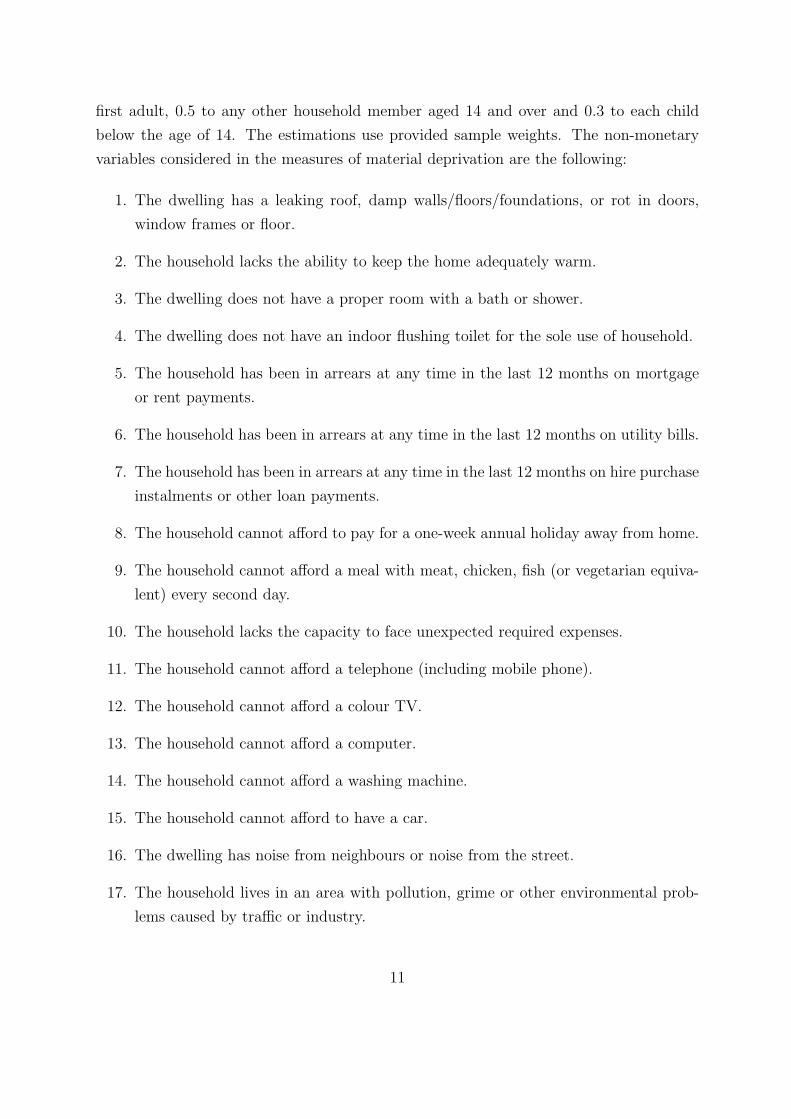
first adult, 0.5 to any other household member aged 14 and over and 0.3 to each child
below the age of 14. The estimations use provided sample weights. The non-monetary
variables considered in the measures of material deprivation are the following:
1. The dwelling has a leaking roof, damp walls/floors/foundations, or rot in doors,
window frames or floor.
2. The household lacks the ability to keep the home adequately warm.
3. The dwelling does not have a proper room with a bath or shower.
4. The dwelling does not have an indoor flushing toilet for the sole use of household.
5. The household has been in arrears at any time in the last 12 months on mortgage
or rent payments.
6. The household has been in arrears at any time in the last 12 months on utility bills.
7. The household has been in arrears at any time in the last 12 months on hire purchase
instalments or other loan payments.
8. The household cannot afford to pay for a one-week annual holiday away from home.
9. The household cannot afford a meal with meat, chicken, fish (or vegetarian equiva-
lent) every second day.
10. The household lacks the capacity to face unexpected required expenses.
11. The household cannot afford a telephone (including mobile phone).
12. The household cannot afford a colour TV.
13. The household cannot afford a computer.
14. The household cannot afford a washing machine.
15. The household cannot afford to have a car.
16. The dwelling has noise from neighbours or noise from the street.
17. The household lives in an area with pollution, grime or other environmental prob-
lems caused by traffic or industry.
11

18. The household lives in an area with crime, violence or vandalism.
The weights are constructed from the views of EU citizens as surveyed in 2007 in the
special Eurobarometer 279 on poverty and social exclusion. This weighing method has
first been proposed by Fusco, Guio and Marlier (2009). Part of the survey is aimed at
understanding what Europeans regard necessary in order to have a decent standard of
living with regards to financial means, housing needs, ownership of durable goods and
basic necessities. The sample is composed of 26,466 EU citizens aged 15 and over living
in the 27 European Union Member States and 1,000 residents of Croatia. Since the special
Eurobarometer was commissioned by the European Commission for the preparation of the
2009 thematic module on material deprivation of EU-SILC, all the non-monetary variables
described above and available in EU-SILC are contained in it. The only discrepancy
concerns the affordability of a telephone since the Eurobarometer distinguishes between
landlines and mobile phones. In this paper we decided to weigh according to the answer
given to landline since we believe that it is less problematic not to have access to a
mobile phone. For each non-monetary variable we use as weight the percentage of the
EU citizens answering “absolutely necessary, no one should have to do without” to the
following “In the following questions, we would like to understand better what, in your
view, is necessary for people to have what can be considered as an acceptable or decent
standard of living in (OUR COUNTRY). For a person to have a decent standard of living
in (OUR COUNTRY), please tell me how necessary do you think it is ... (if one wants
to)”. The potential answers included also “necessary”, “desirable but not necessary” and
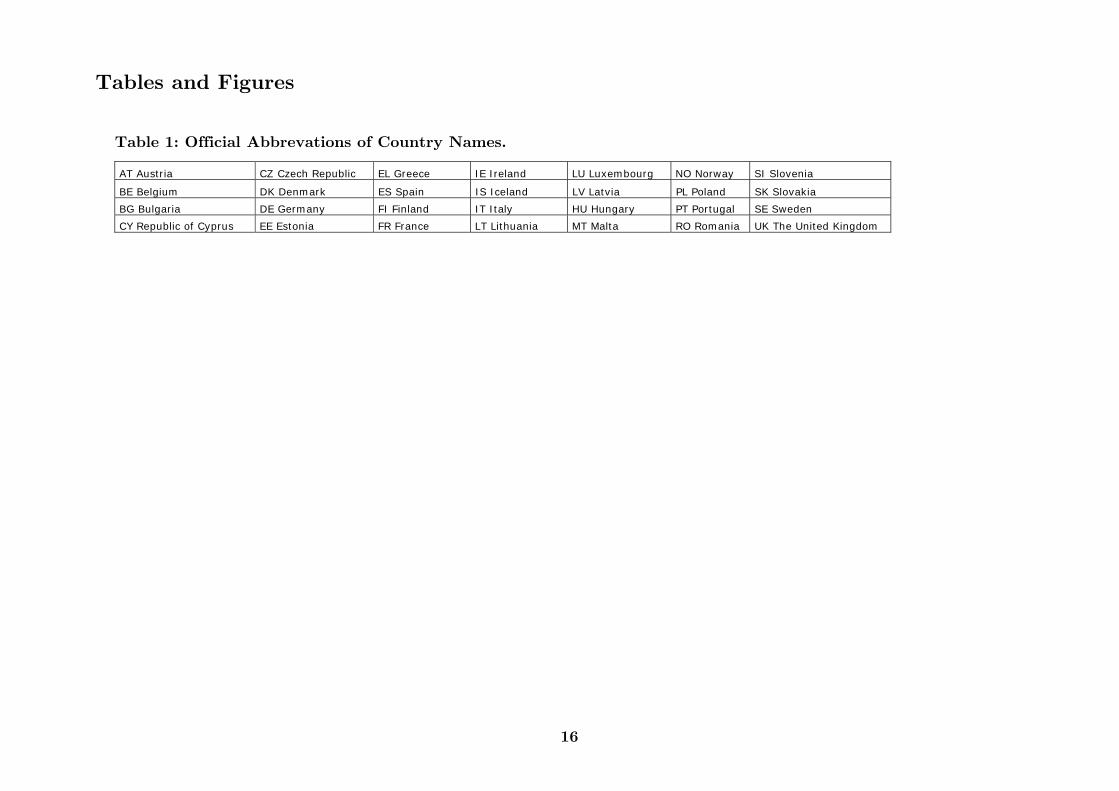
“not at all necessary”. Table 1 lists the official abbreviations of country names that we
use in the remaining tables and figures. The answers given by citizens living in EU27 are
reported in Table 2. The weights used in this paper are contained in column 2. They
range from 69% for the absolutely necessity of an indoor flushing toilet for the sole use
of the household to 9% for the absolutely necessity of affordability of a computer. We
compare the results with that obtained computing indices where all failures are weighed
equally.
Insert Tables here
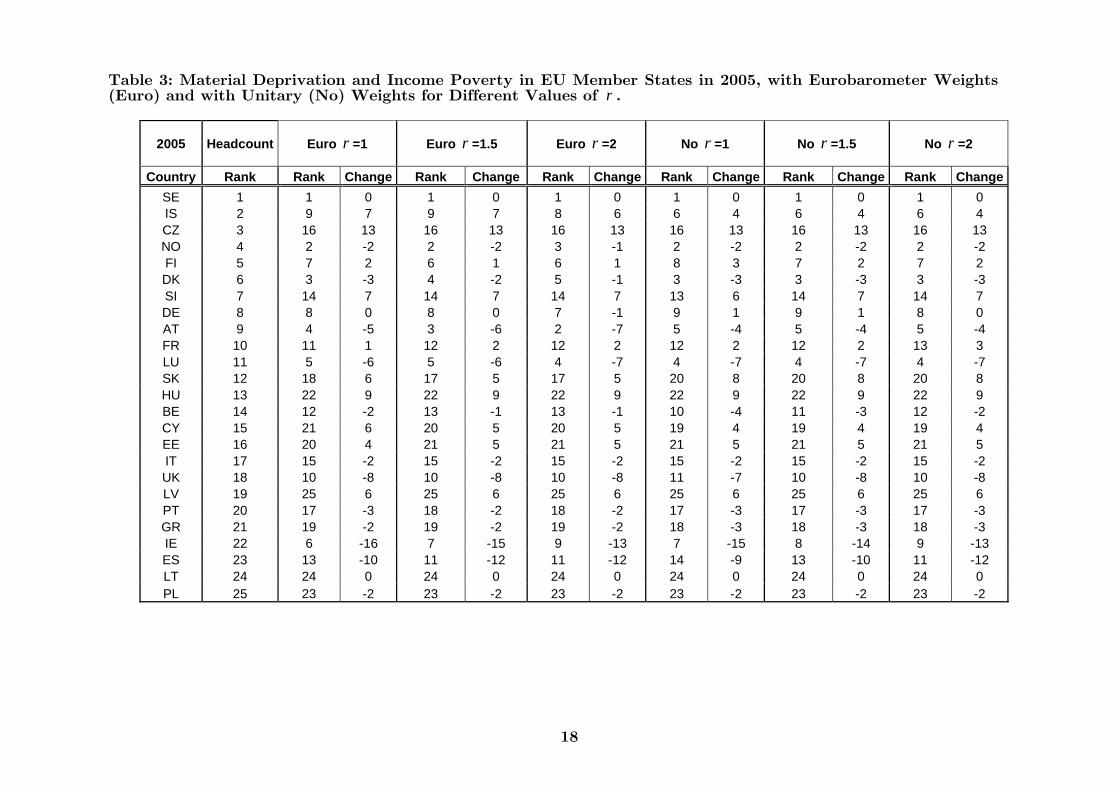
Results of the analysis for 2005 are contained in Table 3 while those for 2006 are in
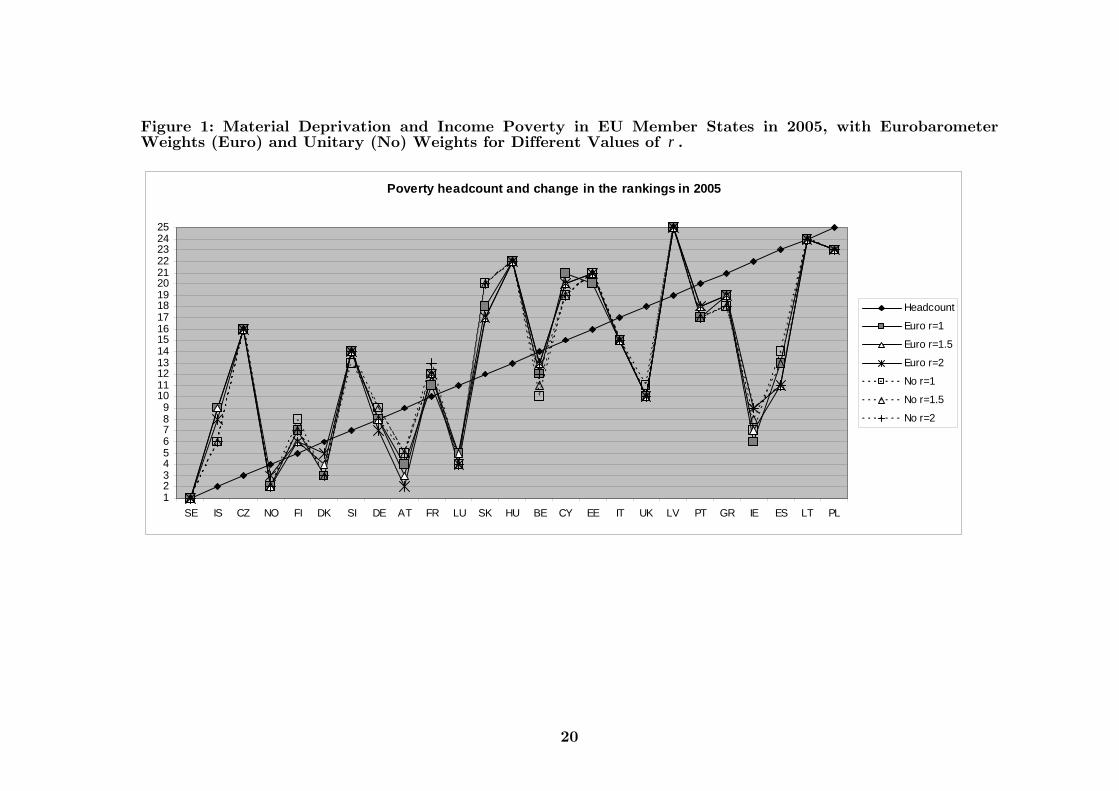
Table 4. In Figures 1 and 2 we plot the change in the rankings as opposed to those
obtained according to the headcount on household equivalent income. A very different
picture emerges confirming that income poverty and material deprivation differ consider-
ably among European countries (on similar findings, see among others Fusco, Guio and
12

Marlier, 2009, Whelan and Maıtre, 2009). European social policy aiming at assisting
citizens with low well-being should better be performed complementing information on
both income poverty and material deprivation. Ireland, Luxembourg, the UK and Spain
are the countries which considerably improve their position in both years, while for the
Republic of Cyprus, the Czech Republic, Slovenia and Slovakia we observe the reverse
phenomenon. On average, changes in the inequality aversion parameter, r, do not produce
a relevant effect showing that the differences among the countries are stable to various
perturbations. This is also the case when we compute the indices using the alternative
equal weighting scheme. Here the greatest effect occurs for Iceland and Slovakia. Iceland’s
position improves by two when equal weighting is given to all dimensions while Slovakia
moves down in the rankings by three positions (with one exception in 2005).
Insert Figures here
5 Conclusion
In this paper we provide a theoretical foundation of the most popular index of multi-
dimensional poverty and material deprivation computed on available data, namely, the
average weighted sum of functionings failures. At the aggregate (societal) level, we sug-
gest a way to include considerations on inequality in the distribution of the index at the
individual level. In addition to the arithmetic mean (represented by a parameter value of
r = 1), symmetric means of order greater than one are included in our characterization.
The higher the order of the mean r, the more inequality averse is the resulting aggregate
poverty measure.
Our index resembles Bourguignon and Chakravarty’s (2003) index for measuring mul-
tidimensional poverty in the case of quantitative variables. The exact generalization of the
latter to the case of quantitative variables could be obtained by imposing decomposability
among population subgroups in our framework. We leave this for future research.
References
Alkire, S. and J.E. Foster (2007), “Counting and Multidimensional Poverty Measure-
ment,” OPHI Working Paper No.7.
Atkinson, A.B. (2003), “Multidimensional Deprivation: Contrasting Social Welfare and
Counting Approaches,” Journal of Economic Inequality, 1, 51–65.
13

Blackorby, C. and D. Donaldson, “Social Criteria for Evaluating Population Change,”
Journal of Public Economics, 25, 13–33.
Blackorby, C., D. Primont and R.R. Russell (1978), Duality, Separability, and Functional
Structure: Theory and Economic Applications, North-Holland, Amsterdam.
Bourguignon, F. and S.R. Chakravarty (2003), “The Measurement of Multidimensional
Poverty,” Journal of Economic Inequality, 1, 25–49.
Chakravarty, S.R. (1990), Ethical Social Index Numbers, Springer-Verlag, New York.
Chakravarty, S.R. (2009), Inequality, Polarization and Poverty: Advances in Distribu-
tional Analysis, Springer-Verlag, New York.
Chakravarty, S.R. and C. D’Ambrosio (2009), “A Family of Unit Consistent Multidimen-
sional Poverty Indices,” mimeo.
Chakravarty, S.R., D. Mukherjee and R. Ranade (1998), “On the Family of Subgroup
and Factor Decomposable Measures of Multidimensional Poverty,” Research on Economic
Inequality, 8, 175–194.
Decancq, K. and M.A. Lugo (2009), “Measuring Inequality of Well-Being with a Correlation-
Sensitive Multidimensional Gini Index,” mimeo.
Diez, H, M.C. Lasso de la Vega and A.M. Urrutia (2008), “Multidimensional Unit- and
Subgroup Consistent Inequality and Poverty Measures: Some Characterization Results,”
Research on Economic Inequality, 16, 189–211.
Duclos, J.-Y., D. Sahn and S.D. Younger (2006), “Robust Multidimensional Poverty Com-
parisons,” Economic Journal, 116, 943–968.
European Commission (2006), “Portfolio of Overarching Indicators and Streamlined So-
cial Inclusion, Pensions, and Health Portfolios,” available at:
http://ec.europa.eu/employment social/spsi/spc indicators subgroup en.htm
Fahey, T. (2007), “The Case for an EU-wide Measure of Poverty,” European Sociological
Review, 23, 35–47.
Foster, J.E. (2007), “Report on Multidimensional Poverty Measurement,” El Colegio de
Mexico, Mexico City.
Fusco, A., A.-C. Guio and E. Marlier (2009), “An EU Approach to Material Deprivation
using EU-SILC and Eurobarometer Data,” paper presented at the Workshop on Multidi-
mensional Poverty and Pro-poor Growth in the MENA Countries, Nice.
14

Gajdos, T. and J.A. Weymark (2005), “Multidimensional Generalized Gini Indices,” Eco-
nomic Theory, 26, 471–496.
Gordon, G., S. Nandy, C. Pantazis, S. Pemberton and P. Townsend (2003), Child Poverty
in the Developing World, The Policy Press, Bristol.
Hardy, G.H., J.E. Littlewood and G. Polya (1934), Inequalities, Cambridge University
Press, Cambridge.
Kolm, S-C. (1976), “Unequal Inequalities I,” Journal of Economic Theory, 12, 416–442.
Kraft, C.H., J.W. Pratt and A. Seidenberg (1959), “Intutive Probability on Finite Sets,”
Annals of Mathematical Statistics, 30, 408–419.
Lasso de la Vega, M.C., A. Urrutia and A. de Sarachu (2008), “Characterizing Multidi-
mensional Inequality Measures which Fulfil the Pigou-Dalton Bundle Principle,” ECINEQ
Working Paper 2008-99.
Mack, J. and S. Lindsay (1985), Poor Britain, George Allen and Unwin Ltd., London.
Ringen, S. (1988), “Direct and Indirect Measures of Poverty,” Journal of Social Policy,
17, 351–365.
Sen, A.K. (1992), Inequality Re-examined, Harvard University Press, Cambridge, MA.
Streeten, P. (1981), First Things First: Meeting Basic Human Needs in Developing Coun-
tries, Oxford University Press, New York.
TNS Opinion & Social (2007), “Poverty and Exclusion,” Report on the Special Euro-
barometer N279/Wave 67.1. available at:
http://ec.europa.eu/public opinion/archives/ebs/ebs 279.pdf
Townsend , P. (1979), Poverty in the United Kingdom, Penguin, Harmondsworth.
Tsui, K.-Y. (2002), “Multidimensional Poverty Indices,” Social Choice and Welfare, 19,
69–93.
Whelan, C.T. and B. Maıtre, (2009), “Europeanization of Inequality and European Ref-
erence Groups,” Journal of European Social Policy, 19, 117–130.
Whelan, C.T., B. Nolan and B. Maıtre, (2008), “Measuring Material Deprivation in the
Enlarged EU,” ESRI Working Paper No.249.
15
16
Tables and Figures
Table 1: Official Abbrevations of Country Names.
AT Austria CZ Czech Republic EL Greece IE Ireland LU Luxembourg NO Norway SI Slovenia
BE Belgium DK Denmark ES Spain IS Iceland LV Latvia PL Poland SK Slovakia
BG Bulgaria DE Germany FI Finland IT Italy HU Hungary PT Portugal SE Sweden
CY Republic of Cyprus EE Estonia FR France LT Lithuania MT Malta RO Romania UK The United Kingdom

17
Table 2: Answers in percentages to: “In the following questions, we would like to understand better what, in your view, is necessary for people to have what can be considered as an acceptable or decent standard of living in (OUR COUNTRY). For a person to have a decent standard of living in (OUR COUNTRY), please tell me how necessary do you think it is…(if one wants to)”.
EU27 Absolutely
necessary, no one should have
to do without Necessary
Desirable but not
necessaryNot at all
necessary
A place to live without a leaking roof, damp walls, floors, foundation 68% 28% 3% 1% To be able to keep one’s home adequately warm 62% 35% 3% 0% A place to live with its own bath or shower 63% 31% 6% 0% An indoor flushing toilet for sole use of the household 69% 27% 4% 0% To be able to pay rent or mortgage payments on time 62% 34% 3% 0% To be able to pay utility bills (electricity, water, gas, etc.) on time 68% 30% 2% 0% To be able to repay loans (such as loans to buy electrical appliances, furniture, a car or student loans, etc.) on time 48% 40% 9% 2% Paying for one week annual holiday away from home 15% 29% 43% 13% A meal with meat, chicken or fish at least once every two days 43% 37% 17% 3% To be able to cope with an unexpected financial expense of X (NATIONAL CURRENCY) 32% 43% 21% 2% A fixed telephone, landline 18% 37% 32% 13% A mobile phone 12% 26% 37% 25% A colour TV 19% 36% 35% 10% A computer 9% 21% 41% 28% A washing machine 48% 41% 10% 1% A car 17% 34% 36% 13% A place to live without too much noise from neighbours or noise from the street (traffic, businesses, factories, etc.) 28% 43% 27% 2% A place to live without too much pollution or other environmental problems (such as air pollution, grime or rubbish) 42% 44% 13% 1% A place to live without crime, violence or vandalism in the area 49% 38% 12% 1%
18
Table 3: Material Deprivation and Income Poverty in EU Member States in 2005, with Eurobarometer Weights (Euro) and with Unitary (No) Weights for Different Values of r .
2005 Headcount
Euro r =1
Euro r =1.5
Euro r =2
No r =1
No r =1.5
No r =2
Country Rank Rank Change Rank Change Rank Change Rank Change Rank Change Rank Change
SE 1 1 0 1 0 1 0 1 0 1 0 1 0 IS 2 9 7 9 7 8 6 6 4 6 4 6 4 CZ 3 16 13 16 13 16 13 16 13 16 13 16 13 NO 4 2 -2 2 -2 3 -1 2 -2 2 -2 2 -2 FI 5 7 2 6 1 6 1 8 3 7 2 7 2 DK 6 3 -3 4 -2 5 -1 3 -3 3 -3 3 -3 SI 7 14 7 14 7 14 7 13 6 14 7 14 7 DE 8 8 0 8 0 7 -1 9 1 9 1 8 0 AT 9 4 -5 3 -6 2 -7 5 -4 5 -4 5 -4 FR 10 11 1 12 2 12 2 12 2 12 2 13 3 LU 11 5 -6 5 -6 4 -7 4 -7 4 -7 4 -7 SK 12 18 6 17 5 17 5 20 8 20 8 20 8 HU 13 22 9 22 9 22 9 22 9 22 9 22 9 BE 14 12 -2 13 -1 13 -1 10 -4 11 -3 12 -2 CY 15 21 6 20 5 20 5 19 4 19 4 19 4 EE 16 20 4 21 5 21 5 21 5 21 5 21 5 IT 17 15 -2 15 -2 15 -2 15 -2 15 -2 15 -2 UK 18 10 -8 10 -8 10 -8 11 -7 10 -8 10 -8 LV 19 25 6 25 6 25 6 25 6 25 6 25 6 PT 20 17 -3 18 -2 18 -2 17 -3 17 -3 17 -3 GR 21 19 -2 19 -2 19 -2 18 -3 18 -3 18 -3 IE 22 6 -16 7 -15 9 -13 7 -15 8 -14 9 -13 ES 23 13 -10 11 -12 11 -12 14 -9 13 -10 11 -12 LT 24 24 0 24 0 24 0 24 0 24 0 24 0 PL 25 23 -2 23 -2 23 -2 23 -2 23 -2 23 -2

19
Table 4: Material Deprivation and Income Poverty in EU Member States in 2006, with Eurobarometer Weights (Euro) and without (No) Weights for Different Values of r .
2006 Headcount
Euro r =1
Euro r =1.5
Euro r =2
No r =1 No r =1.5 No r =2
Country Rank Rank Change Rank Change Rank Change Rank Change Rank Change Rank Change IS 1 7 6 7 6 7 6 5 4 4 3 4 3 CZ 2 16 14 16 14 16 14 16 14 16 14 16 14 NO 3 1 -2 2 -1 3 0 1 -2 2 -1 3 0 SK 4 17 13 17 13 17 13 20 16 20 16 20 16 SI 5 14 9 14 9 14 9 13 8 13 8 13 8 DK 6 4 -2 6 0 6 0 4 -2 5 -1 5 -1 SE 7 2 -5 1 -6 1 -6 2 -5 1 -6 1 -6 FI 8 6 -2 5 -3 4 -4 7 -1 7 -1 7 -1 AT 9 5 -4 4 -5 5 -4 6 -3 6 -3 6 -3 DE 10 13 3 13 3 13 3 14 4 14 4 14 4 FR 11 10 -1 10 -1 11 0 11 0 11 0 11 0 LU 12 3 -9 3 -9 2 -10 3 -9 3 -9 2 -10 BE 13 11 -2 12 -1 12 -1 10 -3 10 -3 10 -3 CY 14 22 8 22 8 21 7 21 7 21 7 21 7 HU 15 21 6 21 6 22 7 22 7 22 7 22 7 EE 16 20 4 20 4 20 4 19 3 19 3 19 3 PT 17 18 1 18 1 18 1 18 1 18 1 18 1 IE 18 8 -10 9 -9 9 -9 9 -9 9 -9 9 -9 PL 19 23 4 23 4 23 4 23 4 23 4 23 4 UK 20 9 -11 8 -12 8 -12 8 -12 8 -12 8 -12 IT 21 15 -6 15 -6 15 -6 15 -6 15 -6 15 -6 ES 22 12 -10 11 -11 10 -12 12 -10 12 -10 12 -10 LT 23 24 1 24 1 24 1 24 1 24 1 24 1 GR 24 19 -5 19 -5 19 -5 17 -7 17 -7 17 -7 LV 25 25 0 25 0 25 0 25 0 25 0 25 0
20
Figure 1: Material Deprivation and Income Poverty in EU Member States in 2005, with Eurobarometer Weights (Euro) and Unitary (No) Weights for Different Values of r .
Poverty headcount and change in the rankings in 2005
123456789
10111213141516171819202122232425
SE IS CZ NO FI DK SI DE AT FR LU SK HU BE CY EE IT UK LV PT GR IE ES LT PL
Headcount
Euro r=1
Euro r=1.5
Euro r=2
No r=1
No r=1.5
No r=2

21
Figure 2: Material Deprivation and Income Poverty in EU Member States in 2006, with Eurobarometer Weights (Euro) and without (No) Weights for Different Values of r .
Poverty headcount and change in the rankings in 2006
123456789
10111213141516171819202122232425
IS CZ NO SK SI DK SE FI AT DE FR LU BE CY HU EE PT IE PL UK IT ES LT GR LV
Headcount
Euro r=1
Euro r=1.5
Euro r=2
No r=1
No r=1.5
No r=2
Related Documents