arXiv:astro-ph/9711130v2 13 Nov 1997 Mon. Not. R. Astron. Soc. 000, 000–000 (0000) Printed 1 February 2008 (MN L A T E X style file v1.4) Multicolour imaging of z = 2 QSO hosts Itziar Aretxaga 1 , Roberto J. Terlevich 2 , B.J. Boyle 3 1 Max-Planck-Institut f¨ ur Astrophysik, Karl Schwarzschildstr. 1, Postfach 1523, 85740 Garching, Germany 2 Royal Greenwich Observatory, Madingley Road, Cambridge CB3 0EZ, U.K. 3 Anglo-Australian Observatory, PO Box 296, Epping, NSW 2121 Australia M¨ unchen 97 July ABSTRACT We present multicolour images of the hosts of three z = 2 QSOs previously detected in R-band by our group. The luminosities, colours and sizes of the hosts overlap with those of actively star-forming galaxies in the nearby Universe. Surface brightness radial profiles over the outer resolved areas roughly follow either a r 1/4 or an exponential law. These properties give support to the young host galaxy interpretation of the extended light around QSOs at high-redshift. The rest-frame UV and UV-optical colours are inconsistent with the hypothesis of a scattered halo of light from the active nucleus by a simple optically-thin scattering process produced by dust or hot electrons. If the UV light is indeed stellar, star formation rates of hundreds of solar masses per year are implied, an order of magnitude larger than in field galaxies at similar redshifts and above. This might indicate that the QSO phenomenon (at least the high-luminosity one) is preferentially acompanied by enhanced galactic activity at high-redshifts. Key words: galaxies: active – galaxies: photometry – galaxies: quasars: general 1. INTRODUCTION Recent deep-imaging studies have discovered a large pop- ulation of young galaxies at redshifts z> 0.3, about 3% being at z > ∼ 2.5 for R < ∼ 25 (e.g. Steidel et al. 1996a). The galaxies have properties very similar to those of present day star-forming dwarf galaxies or H II galaxies, but with star formation rates SFR < ∼ 30 M⊙/yr they are not particu- larly luminous objects (Guzm´an et al. 1997; Phillips et al. 1997). The field population of high-z galaxies has been as- sociated with early counterparts of disks (Wolfe et al. 1995), small spheroids of present-day L > ∼ L ∗ galaxies (Steidel et al. 1996a) and/or with a collection of star-forming knots being merged into galaxies (Lowenthal et al. 1997). On the other hand, detailed studies of the intrinsic properties of nearby cluster ellipticals indicate that their stellar population was formed at z> 2 (Bower, Lucey & Ellis 1992). One long standing view is that these were systems formed monolithi- cally in an early burst of star formation (e.g. Larson 1974), and have been passively evolving since then. Thus, for a first rank elliptical we expect SFR ∼ 10 12 M⊙/10 9 yr. Several at- tempts to find the early counterparts of these galaxies in large areas of the sky have been conducted (see Pritchet 1994 for a review) but to date just a handful of candi- dates that still need spectroscopic confirmation have been found (e.g. Pahre et al. 1997). Where are these bright ob- jects hiding? In galaxy formation models based on the hier- archical merging of dark matter halos the majority of large spheroids are formed at lower redshifts (Kauffmann, White & Guiderdoni 1993), so that the present-day large systems were previously broken-up into small fainter pieces of a yet not completely assembled whole. Although they are an at- tractive solution, it still needs to be demonstrated whether these models can reproduce the intrinsic properties of mas- sive ellipticals, such as their large nuclear metal content, the thinness of the fundamental plane, the small scatter of the colour-luminosity relation, the large colour/metal gradients, etc. (but see Kauffmann & Charlot 1997 for first positive re- sults on the colour-luminosity relation). There is also a good possibility that some large spheroids may have gone unde- tected as the host galaxies of bright QSOs. Two pieces of observational evidence support this hypothesis. First, a sig- nificant number of nearby bright QSOs are associated with luminous ellipticals (McLeod & Rieke 1995; Disney et al. 1996; Taylor et al. 1996). Secondly, many of the properties of high-z QSOs are consistent with their association with the cores of early luminous spheroids. Among them, a) the high metal content of the Broad Line Region of high-z QSOs (Hamman & Ferland 1993); b) the detection of large masses of dust in z ≈ 4 QSOs (Isaak et al. 1994); and c) the cor- respondence of the observed luminosity function of QSOs and ellipticals (Terlevich & Boyle 1993 , Haehnelt & Rees 1993) do suggest that QSO activity might be occurring in the central regions of young massive ellipticals. All these points are reinforced by the recent discovery that about 5 to 20% of the luminosity of both radio-loud and radio-quiet QSOs at z ≈ 2 arises from extended structures c 0000 RAS

Welcome message from author
This document is posted to help you gain knowledge. Please leave a comment to let me know what you think about it! Share it to your friends and learn new things together.
Transcript

arX
iv:a
stro
-ph/
9711
130v
2 1
3 N
ov 1
997
Mon. Not. R. Astron. Soc. 000, 000–000 (0000) Printed 1 February 2008 (MN LATEX style file v1.4)
Multicolour imaging of z = 2 QSO hosts
Itziar Aretxaga1, Roberto J. Terlevich2, B.J. Boyle3
1 Max-Planck-Institut fur Astrophysik, Karl Schwarzschildstr. 1, Postfach 1523, 85740 Garching, Germany2 Royal Greenwich Observatory, Madingley Road, Cambridge CB3 0EZ, U.K.3 Anglo-Australian Observatory, PO Box 296, Epping, NSW 2121 Australia
Munchen 97 July
ABSTRACT
We present multicolour images of the hosts of three z = 2 QSOs previously detectedin R-band by our group. The luminosities, colours and sizes of the hosts overlap withthose of actively star-forming galaxies in the nearby Universe. Surface brightness radialprofiles over the outer resolved areas roughly follow either a r
1/4 or an exponential law.These properties give support to the young host galaxy interpretation of the extendedlight around QSOs at high-redshift. The rest-frame UV and UV-optical colours areinconsistent with the hypothesis of a scattered halo of light from the active nucleusby a simple optically-thin scattering process produced by dust or hot electrons. If theUV light is indeed stellar, star formation rates of hundreds of solar masses per yearare implied, an order of magnitude larger than in field galaxies at similar redshifts andabove. This might indicate that the QSO phenomenon (at least the high-luminosityone) is preferentially acompanied by enhanced galactic activity at high-redshifts.
Key words: galaxies: active – galaxies: photometry – galaxies: quasars: general
1. INTRODUCTION
Recent deep-imaging studies have discovered a large pop-ulation of young galaxies at redshifts z > 0.3, about 3%being at z >∼ 2.5 for R <∼ 25 (e.g. Steidel et al. 1996a).The galaxies have properties very similar to those of presentday star-forming dwarf galaxies or H II galaxies, but withstar formation rates SFR<∼ 30 M⊙/yr they are not particu-larly luminous objects (Guzman et al. 1997; Phillips et al.1997). The field population of high-z galaxies has been as-sociated with early counterparts of disks (Wolfe et al. 1995),small spheroids of present-day L >∼ L∗ galaxies (Steidel et al.1996a) and/or with a collection of star-forming knots beingmerged into galaxies (Lowenthal et al. 1997). On the otherhand, detailed studies of the intrinsic properties of nearbycluster ellipticals indicate that their stellar population wasformed at z > 2 (Bower, Lucey & Ellis 1992). One longstanding view is that these were systems formed monolithi-cally in an early burst of star formation (e.g. Larson 1974),and have been passively evolving since then. Thus, for a firstrank elliptical we expect SFR∼ 1012M⊙/109yr. Several at-tempts to find the early counterparts of these galaxies inlarge areas of the sky have been conducted (see Pritchet1994 for a review) but to date just a handful of candi-dates that still need spectroscopic confirmation have beenfound (e.g. Pahre et al. 1997). Where are these bright ob-jects hiding? In galaxy formation models based on the hier-archical merging of dark matter halos the majority of largespheroids are formed at lower redshifts (Kauffmann, White
& Guiderdoni 1993), so that the present-day large systemswere previously broken-up into small fainter pieces of a yetnot completely assembled whole. Although they are an at-tractive solution, it still needs to be demonstrated whetherthese models can reproduce the intrinsic properties of mas-sive ellipticals, such as their large nuclear metal content, thethinness of the fundamental plane, the small scatter of thecolour-luminosity relation, the large colour/metal gradients,etc. (but see Kauffmann & Charlot 1997 for first positive re-sults on the colour-luminosity relation). There is also a goodpossibility that some large spheroids may have gone unde-tected as the host galaxies of bright QSOs. Two pieces ofobservational evidence support this hypothesis. First, a sig-nificant number of nearby bright QSOs are associated withluminous ellipticals (McLeod & Rieke 1995; Disney et al.1996; Taylor et al. 1996). Secondly, many of the propertiesof high-z QSOs are consistent with their association withthe cores of early luminous spheroids. Among them, a) thehigh metal content of the Broad Line Region of high-z QSOs(Hamman & Ferland 1993); b) the detection of large massesof dust in z ≈ 4 QSOs (Isaak et al. 1994); and c) the cor-respondence of the observed luminosity function of QSOsand ellipticals (Terlevich & Boyle 1993 , Haehnelt & Rees1993) do suggest that QSO activity might be occurring inthe central regions of young massive ellipticals.
All these points are reinforced by the recent discoverythat about 5 to 20% of the luminosity of both radio-loud andradio-quiet QSOs at z ≈ 2 arises from extended structures
c© 0000 RAS
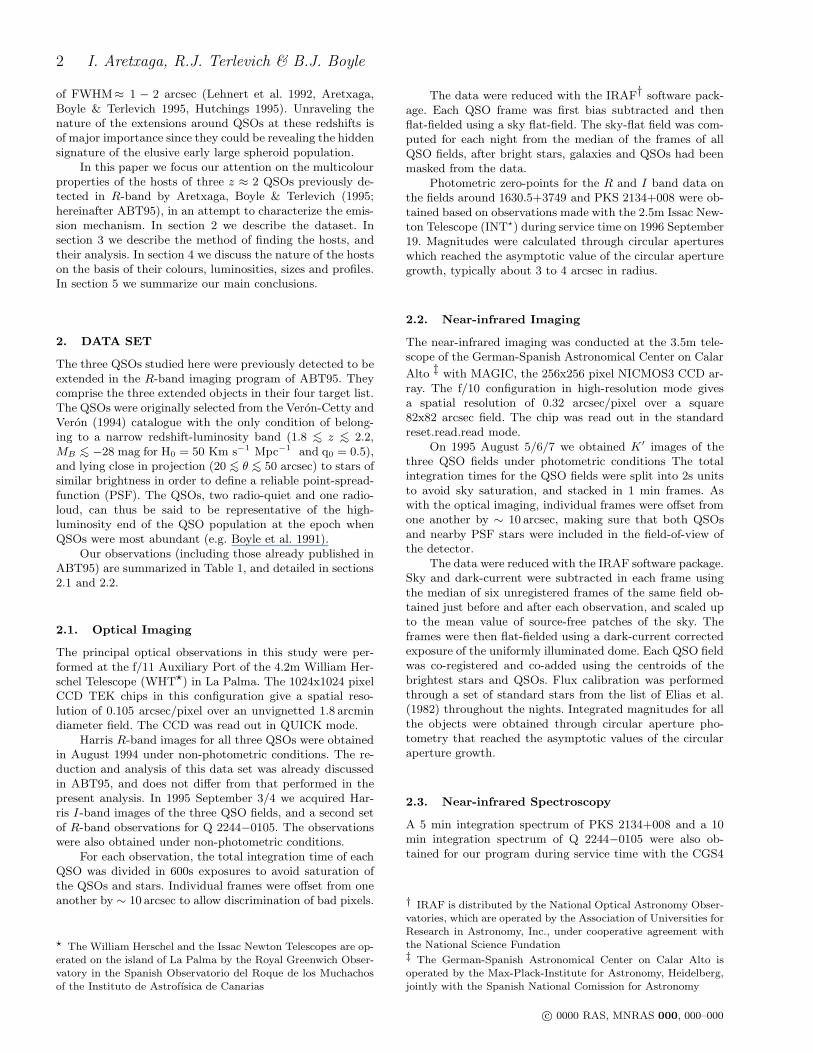
2 I. Aretxaga, R.J. Terlevich & B.J. Boyle
of FWHM≈ 1 − 2 arcsec (Lehnert et al. 1992, Aretxaga,Boyle & Terlevich 1995, Hutchings 1995). Unraveling thenature of the extensions around QSOs at these redshifts isof major importance since they could be revealing the hiddensignature of the elusive early large spheroid population.
In this paper we focus our attention on the multicolourproperties of the hosts of three z ≈ 2 QSOs previously de-tected in R-band by Aretxaga, Boyle & Terlevich (1995;hereinafter ABT95), in an attempt to characterize the emis-sion mechanism. In section 2 we describe the dataset. Insection 3 we describe the method of finding the hosts, andtheir analysis. In section 4 we discuss the nature of the hostson the basis of their colours, luminosities, sizes and profiles.In section 5 we summarize our main conclusions.
2. DATA SET
The three QSOs studied here were previously detected to beextended in the R-band imaging program of ABT95. Theycomprise the three extended objects in their four target list.The QSOs were originally selected from the Veron-Cetty andVeron (1994) catalogue with the only condition of belong-ing to a narrow redshift-luminosity band (1.8 <∼ z <∼ 2.2,MB <∼ −28 mag for H0 = 50 Km s−1 Mpc−1 and q0 = 0.5),and lying close in projection (20 <∼ θ <∼ 50 arcsec) to stars ofsimilar brightness in order to define a reliable point-spread-function (PSF). The QSOs, two radio-quiet and one radio-loud, can thus be said to be representative of the high-luminosity end of the QSO population at the epoch whenQSOs were most abundant (e.g. Boyle et al. 1991).
Our observations (including those already published inABT95) are summarized in Table 1, and detailed in sections2.1 and 2.2.
2.1. Optical Imaging
The principal optical observations in this study were per-formed at the f/11 Auxiliary Port of the 4.2m William Her-schel Telescope (WHT⋆) in La Palma. The 1024x1024 pixelCCD TEK chips in this configuration give a spatial reso-lution of 0.105 arcsec/pixel over an unvignetted 1.8 arcmindiameter field. The CCD was read out in QUICK mode.
Harris R-band images for all three QSOs were obtainedin August 1994 under non-photometric conditions. The re-duction and analysis of this data set was already discussedin ABT95, and does not differ from that performed in thepresent analysis. In 1995 September 3/4 we acquired Har-ris I-band images of the three QSO fields, and a second setof R-band observations for Q 2244−0105. The observationswere also obtained under non-photometric conditions.
For each observation, the total integration time of eachQSO was divided in 600s exposures to avoid saturation ofthe QSOs and stars. Individual frames were offset from oneanother by ∼ 10 arcsec to allow discrimination of bad pixels.
⋆ The William Herschel and the Issac Newton Telescopes are op-erated on the island of La Palma by the Royal Greenwich Obser-vatory in the Spanish Observatorio del Roque de los Muchachosof the Instituto de Astrofısica de Canarias
The data were reduced with the IRAF† software pack-age. Each QSO frame was first bias subtracted and thenflat-fielded using a sky flat-field. The sky-flat field was com-puted for each night from the median of the frames of allQSO fields, after bright stars, galaxies and QSOs had beenmasked from the data.
Photometric zero-points for the R and I band data onthe fields around 1630.5+3749 and PKS 2134+008 were ob-tained based on observations made with the 2.5m Issac New-ton Telescope (INT⋆) during service time on 1996 September19. Magnitudes were calculated through circular apertureswhich reached the asymptotic value of the circular aperturegrowth, typically about 3 to 4 arcsec in radius.
2.2. Near-infrared Imaging
The near-infrared imaging was conducted at the 3.5m tele-scope of the German-Spanish Astronomical Center on Calar
Alto ‡ with MAGIC, the 256x256 pixel NICMOS3 CCD ar-ray. The f/10 configuration in high-resolution mode givesa spatial resolution of 0.32 arcsec/pixel over a square82x82 arcsec field. The chip was read out in the standardreset.read.read mode.
On 1995 August 5/6/7 we obtained K′ images of thethree QSO fields under photometric conditions The totalintegration times for the QSO fields were split into 2s unitsto avoid sky saturation, and stacked in 1 min frames. Aswith the optical imaging, individual frames were offset fromone another by ∼ 10 arcsec, making sure that both QSOsand nearby PSF stars were included in the field-of-view ofthe detector.
The data were reduced with the IRAF software package.Sky and dark-current were subtracted in each frame usingthe median of six unregistered frames of the same field ob-tained just before and after each observation, and scaled upto the mean value of source-free patches of the sky. Theframes were then flat-fielded using a dark-current correctedexposure of the uniformly illuminated dome. Each QSO fieldwas co-registered and co-added using the centroids of thebrightest stars and QSOs. Flux calibration was performedthrough a set of standard stars from the list of Elias et al.(1982) throughout the nights. Integrated magnitudes for allthe objects were obtained through circular aperture pho-tometry that reached the asymptotic values of the circularaperture growth.
2.3. Near-infrared Spectroscopy
A 5 min integration spectrum of PKS 2134+008 and a 10min integration spectrum of Q 2244−0105 were also ob-tained for our program during service time with the CGS4
† IRAF is distributed by the National Optical Astronomy Obser-vatories, which are operated by the Association of Universities forResearch in Astronomy, Inc., under cooperative agreement withthe National Science Fundation‡ The German-Spanish Astronomical Center on Calar Alto isoperated by the Max-Plack-Institute for Astronomy, Heidelberg,jointly with the Spanish National Comission for Astronomy
c© 0000 RAS, MNRAS 000, 000–000

Multicolour imaging of z= 2 QSO hosts 3
Table 1. Summary of observations
Name M∗B z∗ Filter Exposure seeing† Telescope Detector Date
(seconds) (arcsec)1630.5+3749 −28.3 2.037 R 10500 0.6 WHT 4.2m TEK1 1994 Aug
I 4800 0.75 WHT 4.2m TEK5 1995 SepK ′ 13320 1.0 Calar Alto 3.5m MAGIC 1995 Aug
PKS 2134+008‡ −29.6 1.936 R 5850 0.6 WHT 4.2m TEK1 1994 AugI 4800 0.9 WHT 4.2m TEK5 1995 Sep
K ′ 5220 1.1 Calar Alto 3.5m MAGIC 1995 AugQ 2244−0105 −28.6 2.040 R 5400 0.7 WHT 4.2m TEK1 1994 Aug
R 3600 0.9 WHT 4.2m TEK5 1995 SepI 3600 0.7 WHT 4.2m TEK5 1995 Sep
K ′ 7670 1.0 Calar Alto 3.5m MAGIC 1995 Aug
∗ MB and z from Veron–Cetty and Veron (1994).† Stellar FWHM measured on co-added frame.‡ radio-loud QSO
spectrograph at the 3.8m UK Infrared Telescope (UKIRT§)on Mauna Kea. The observations were acquired with spec-tral resolution R=550 and spectral coverage 1.45–2.05µ, inorder to contain the rest-frame [O III]λ5007 A to Hα region.The spectra were flux and wavelength calibrated at the ob-servatory following their standard procedures.
3. DATA ANALYSIS
3.1. Optical Imaging
3.1.1. PSF subtraction
The procedure used to fit and subtract the stellar PSF fromthe images was described in ABT95 in detail. Briefly, it in-volved the definition of a two-dimensional PSF from thebrightest stellar companion to the QSO (marked in Fig. 1 ofABT95), and the subtraction of the 2D-profile from the QSOand nearby stars, following three recipes: (1) flux-scaled sub-traction; (2) subtraction that yields zero flux in the centerof the QSO; (3) subtraction that yields a smooth flat-topprofile with no depression in the center. Criteria (2) and (3)were evaluated for each frame after smoothing the residu-als of the subtraction with a Gaussian filter of σ = 1 pixel.This procedure provided stability to the solution found fromframe to frame. The frames were then registered and co-added using the centroids of stars and QSOs in the originalunsubtracted frames. Only non-smoothed frames were usedin the co-addition.
Flux-scaled subtraction typically produces solutionswith negative flux in the center, defined as the centroid of theoriginal QSO position, surrounded by a ring of positive flux(see Fig. 1a). For the three QSOs the flux-scaled PSF sub-traction is a solution that is inconsistent with QSOs and PSFstars having the same spatial profiles. The QSO residuals leftafter the QSO−PSF subtraction depart from the subtractionerror (σ) by over 3σ in both R and I-band images, with theonly exception being the I-band image of Q 2244−0105 (2σ).
§ The United Kingdom Infrared Telescope is operated by theJoint Astronomy Center on behalf of the UK Particle Physicsand Astronomy Research Council
As a check, bright nearby PSF-subtracted stars leave residu-als around 1σ (see also Figure 2 in ABT95 for a graphic com-parison of stellar and QSO residuals in the R-band frames).
Fig. 1b and 1c show typical radial profiles for the twoother subtraction criteria. These will be regarded as a lowerlimit and a good approximation to the actual profile of thehosts.
Fig. 2 shows contour plots of the central-zero-flux sub-traction solutions. The putative hosts are roundish and showno obvious signs of disrupted morphologies for our limit-ing PSF-subtraction backgrounds (µR ≈ 25.0 to 25.5 mag,µI ≈ 23.0 to 23.5 mag at 1σ per pixel, evaluated from thesky in the PSF-subtracted area around the QSOs).
3.1.2. Accuracy of PSF subtractions
To assess the accuracy of the PSF subtractions and esti-mate the errors on the derived properties of the hosts, wehave constructed a set of simulated QSOs by superposingobserved stellar PSFs on compact faint field galaxies andalso on compact simulated galaxies (FWHM≈ 0.8− 1.2 arc-sec). The simulated galaxies were introduced in our imageswith the package ARTDAT of IRAF with the same Poisso-nian noise as that of the observations. Nuclear componentsusing PSF models derived from field stars and containing90, 95, 97, and 99 per cent of the total luminosity of thesimulated QSOs were superposed on the galaxies, and thePSF subtraction was then attempted with the same PSFmodels. The results for two of these galaxies are shown inFig. 3.
As one would assume intuitively, the simulations showthat the larger the size and the larger the contribution of thehost to the total luminosity of the QSO, the easier it is to re-cover its true luminosity, radius and profile. The simulationsalso show that flat-top subtractions tend to underestimatethe total luminosity of the hosts. This effect is actually intro-duced by design through the smoothing performed in orderto evaluate whether a flat regime had been attained. Thisshows that although flat-top PSF subtractions yield betterestimates for the host properties than central-zero-flux sub-tractions, they are still conservative. The biggest departuresfrom the true profiles (about a factor of 2) are expected inthe inner stellar FWHM scale for the range of galaxy com-
c© 0000 RAS, MNRAS 000, 000–000

4 I. Aretxaga, R.J. Terlevich & B.J. Boyle
0 5 10 15 20-150
-100
-50
0
50
r(pixels)
(a) flux-scaled
0 5 10 15 200
50
100
150
200
r(pixels)
(b) positive-flux
0 5 10 15 200
100
200
300
r(pixels)
(c) flat top
1630.5+3749 R
PSF subtraction methods
Figure 1. Radial profiles of the solutions found by performing PSF subtractions on the R-band frames of 1630.5+3749. Error barsrepresent the scatter around the mean value, and do not include the subtraction error. (a) flux-scaled subtraction; (b) subtraction toobtain zero flux in the position of the QSO centroid; (c) subtraction to obtain a smooth flat-top profile
pactness explored. These discrepancies will be even greaterfor even more compact galaxies. As an example, from the cir-cular aperture curves of growth of the most compact galaxiesin our simulations (FWHM≈ 0.8− 1 arcsec), we derive thatthe flux of the hosts can be measured within better than afactor of 2 if the host contribution is between 1 and 5 percent of the total QSO luminosity, and increasingly better forlarger luminosities and sizes. The effective radii of the hostscan be derived with relative errors between 20 and 10 percent, for contributions of the galaxy between 3 and 5 percent of the QSO luminosity.
3.1.3. Properties of the hosts
Integrated magnitudes, effective radii, and radial profiles ofthe flat-top PSF subtracted hosts were computed. The re-sults are summarized in Table 2 and Fig. 4.
The magnitudes of the QSO systems (i.e. nuclear + hostlight) are calibrated using our own observations, except forthe R-band image of Q 2244−0105, which was calibratedusing the crude zero-points of ABT95 based on the APMNorthern Sky Catalogue (Irwin, Maddox & McMahon 1994).The difference between these zero-points and our calibrationfor the objects in the other two QSO fields is within the
error bars of both measurements, but our new calibration istypically 0.4 mag fainter.
Flat-top PSF subtractions yield hosts that comprisebetween 5 and 12 per cent of the total luminosity of theQSO+host systems.
Table 3 contains the colours of the nuclei and host galax-ies. The colours of 1630.5+3749 (R−I = 0.8±0.1 mag) andPKS 2134+008 (R − I = 0.6 ± 0.1) are within the range ofobserved colours of QSOs at that redshift (Veron & Hawkins1995). These colours are somewhat bluer than those derivedfor the hosts: R−I ∼ 1.1±0.1 mag and R−I ∼ 0.8±0.1 mag,respectively. However, the errors associated with the PSFsubtraction are usually larger than the calibration errors,and could easily account for this discrepancy between QSOand host colours. In order to obtain a more reliable value ofthe colours of the hosts, we have integrated the total lumi-nosity enclosed between two concentric circular apertures ofradius 0.7 arcsec and 3 arcsec. The outer aperture reachesthe plateau of the aperture growth curves, and the innerone neglects the part of the hosts more affected by subtrac-tion errors (see Fig.3). For the host of 1630.5+3749 we findR − I = 1.03 and for that of PKS 2134+008 R − I = 1.1,redder by 0.24 and 0.51 mag, respectively, than the totallight of the QSOs. The colours remain similar within rmsfluctuations of 0.15 and 0.06 mag respectively when the in-
c© 0000 RAS, MNRAS 000, 000–000

Multicolour imaging of z= 2 QSO hosts 5
5"
Q1630.5+3749
PKS2134+008
Q2244-0105
R I
Figure 2. R and I-band contour plots of the solutions found after performing a PSF subtraction that yields zero flux in the centroid ofthe QSO. The minimum contour level was set at 1σ of the sky noise after subtraction of the PSF. Further levels indicate 1σ incrementsover the minimum level. North is to the left, and East is down.c© 0000 RAS, MNRAS 000, 000–000

6 I. Aretxaga, R.J. Terlevich & B.J. Boyle
0 1 2 30
20
40
60
80
100
r (arcsec)
original
gal=3%
gal=5%
gal=10%
(a) FWHM(gal)=0.9 arcsec
0 1 2 30
20
40
60
80
100
r (arcsec)
(b) FWHM(gal)=1.2 arcsec
Figure 3. Results of flat-top PSF subtractions on simulated QSOs that use galaxies of (a) FWHM= 0.9 and (b) FWHM= 1.2 arcsec,with nuclear profiles of FWHM= 0.8 arcsec. The solid lines represent the original profiles of the galaxies before superposing the unresolvedcomponents. Dashed lines represent the recovered profiles of the galaxies after PSF subtraction. For the simulations presented here, thegalaxies comprised 3, 5, and 10 per cent of the total luminosity of the simulated QSOs.
Table 2. Integrated optical magnitudes and scale-lengths of hosts and QSOs. The columns give: name ofthe QSO; filter; m(QSO) magnitude of QSO+host; m1 magnitude of the hosts found with central zero-fluxPSF subtraction; m2 magnitude of the hosts found with flat-top PSF subtraction ; Deff effective diameterof the hosts found with flat-top PSF subtraction; seeing of the co-added frames, defined as the FWHM ofthe stellar profiles.
Name Filter m(QSO) m1 m2 Deff seeing(mag) (mag) (mag) (arcsec) (arcsec)
1630.5+3749 R 18.34 ± 0.12 22.0 21.3 0.9 0.6I 17.55 ± 0.10 20.6 20.2 1.0 0.75
PKS 2134+008 R 16.78 ± 0.10 20.8 20.2 0.95 0.6I 16.19 ± 0.10 19.7 19.4 1.2 0.9
Q 2244−0105 R 17.5 ± 0.30 † m(QSO) +3.4 m(QSO) +2.3 0.8 0.7I — m(QSO) +3.6 m(QSO) +3.3 1.0 0.7
† Flux calibration based on APM Northern Sky Catalogue.
ner aperture is set from 0.7 arcsec to 1 arcsec, indicatingthat the outermost regions of the hosts of PKS 2134+008and 1630.5+3749 are redder than their nuclei.
3.2. Infrared Imaging
A two-dimensional PSF subtraction technique similar tothat described above for the optical images was also per-formed in the infrared frames. The only difference is thatthe individual frames were registered and co-added beforeperforming the subtraction. The residuals left in the QSOpositions were in all cases negligible.
Radial profile comparison of QSOs and PSF stars inthe field show that the differences between them are indeedsmall, and located in the outermost regions, where the skysubtraction is critical. Fig. 5 shows the radial profiles nor-malized to the first computed ring at 0.32 arcsec for QSOsand stars. Only 1630.5+3749 has a marginal excess abovethe stellar profile at 2 to 4 arcsec from the center. The ex-cess does not disappear even after allowance for shifts in thesky level.
The colours of the QSOs 1630.5+3749 (R − K = 2.5 ±
0.1 mag), PKS 2134+008 (R − K = 2.1 ± 0.1 mag) and Q
2244−0105 (R − K ≈ 3.4 ± 0.3 mag) are similar to thosemeasured in other QSOs at these redshifts (Hewett, priv.communication). If we assume that the excess present in1630.5+3749 is real, the surface brightness colour over the2–3 arcsec region is R−K = 3.3±0.2 mag, redder by about0.8 mag than the observed colour of the QSO.
The surface brightness limits for the K-band imagesare between 22.1 and 21.8 mag/arcsec2 at 1σ per pixel. Thelimits for 3σ detections of point-like objects with a typicalseeing-disk range between 20.8 and 21.1 mag. These limitsare similar to those obtained in a previous K-band imagingprogram of radio-quiet QSOs at z ≈ 2 that yielded non-detections (Lowenthal et al. 1995).
From the K-band limits we can set the colours of thehosts of PKS 2134+008 and Q 2244−0105 to be R − K <∼3.3 mag, consistent with those of the unresolved nuclearlight.
c© 0000 RAS, MNRAS 000, 000–000

Multicolour imaging of z= 2 QSO hosts 7
1630.5+3749 R 1630.5+3749 I
PKS2134+008 R PKS2134+008 I
0 0.5 1 1.5
r (arcsec)
Q2244-0105 R
0 0.5 1 1.5
r (arcsec)
Q2244-0105 I
Figure 4. Radial profiles of the hosts derived from flat-top PSF subtractions. The error bars in the inner regions are dominated by theerror in the subtractions, estimated from the simulations, and in the outer regions by sky subtraction. The I-band profile of Q 2244−0105is not flux-calibrated.
Table 3. Colours of nuclei and hosts. The columns give: name of the QSO; colour; colour of nucleus; totalcolour of host (1) from the flat-top subtractions; colour of the host (2) in the outer 1 to 3 arcsec.
Name Colour colour(AGN) colour(host)1 colour(host)2
(mag) (mag) (mag)1630.5+3749 R − I 0.8 ± 0.1 1.1 ± 0.1 1.0 ± 0.15
R − K 2.5 ± 0.1 — 3.3 ± 0.1PKS 2134+008 R − I 0.6 ± 0.1 0.8 ± 0.1 1.1 ± 0.1
R − K 2.1 ± 0.1 — <∼ 3.3Q 2244−0105 R − I — — —
R − K 3.4 ± 0.3 — <∼ 3.3
4. DISCUSSION: THE NATURE OF THE
HOSTS
The hosts we have detected have luminosities that con-tribute between 5 and 12% of the luminosity of the QSOs(nucleus+extension) both in R and I-bands (λ2300 A and
λ2800 A rest-frame). If the marginal excess over the stellarprofile of 1630.5+3749 is real, the K-band (λ7600 A rest-frame) luminosity of the host as derived from the measuredcolours would also contribute to the total K-band QSO lu-minosity about 5%. Our measurements indicate large and
c© 0000 RAS, MNRAS 000, 000–000

8 I. Aretxaga, R.J. Terlevich & B.J. Boyle
0 1 2 3 415
10
5
0
Q2244-0105
0 1 2 3 415
10
5
0
1630.5+3749
0 1 2 3 415
10
5
0
PKS 2134+008
K’
QSO profile
PSF profile
Figure 5. K ′-band radial profiles of QSOs and stars in the field, normalized to their central flux.
luminous extended systems (Deff ≈ 4 Kpc, R ≈ 21 to22 mag). We will consider three alternative explanations fortheir nature: scattered light from the active nucleus, neb-ular continuum produced by the gas ionized by the activenucleus, and stellar light.
4.1. Scattering
The large structures detected in high-redshift radio-galaxies(e.g. Chambers et al. 1987) have been attributed to lightscattered from the active nucleus by a powerful trans-verse radio-jet (e.g. Fabian 1989). Indeed, recent spectro-polarimetry of two z ≈ 1 radio-galaxies that exhibit ’align-ment effects’ (optical structures oriented in the direction ofthe radio-jet) indicates that around 80% of the total UV con-tinuum emission at rest-frame λ2800 A is non-stellar scat-tered light (Cimatti et al. 1997). Since radio-galaxies andradio-loud QSOs could be identical objects viewed from dif-ferent angles (Barthel 1989), an important amount of scat-tered light may be present around radio-loud nuclei (see Fos-bury 1997 for a detailed discussion).
The host of the core-dominated radio-loud QSO studiedin this paper, PKS 2134+008, has an R − I colour thatis 0.52 mag redder than the nucleus. This argues againstthe simple optically-thin scattering case, which would yield
colours as blue as or bluer than the nucleus itself. The R−Klimits for this host (<∼ 3.3 mag) are not deep enough to probethe optically-thin scattering case value. Note that four of thesix lobe-dominated radio-loud QSOs at z ≈ 2 − 2.5 studiedby Lehnert et al. (1992) have hosts with B − K coloursredder than the nuclei. However the B − K (or R − K)analysis discriminates poorly the origin of the light belowthe λ4000 A break, since scattered light would contributepredominantly in B-band (rest frame λ1400 A) and stellarlight would contribute predominantly in K-band (rest-frameλ7300 A) (e.g. Fosbury 1997).
The host of our radio-quiet QSO with calibrated pho-tometry, 1630.5+3749, exhibits the same general properties,with colours 0.25 and 0.8 mag redder than the nucleus inR − I and R − K, respectively. These colours are inconsis-tent with the optically-thin scattering case as an explanationfor the UV hosts of our QSOs. An optically-thick mediumshould be invoked in order to produce colours redder thanthose of the scattered source, but then the geometry of thescatterers should not be symmetrical since we still see theblue colours of the nucleus itself. This could be an alterna-tive mechanism for the origin of the extended light in oursample, although there is no evidence in general for asym-metric scattering in radio-quiet QSOs.
c© 0000 RAS, MNRAS 000, 000–000
Multicolour imaging of z= 2 QSO hosts 9
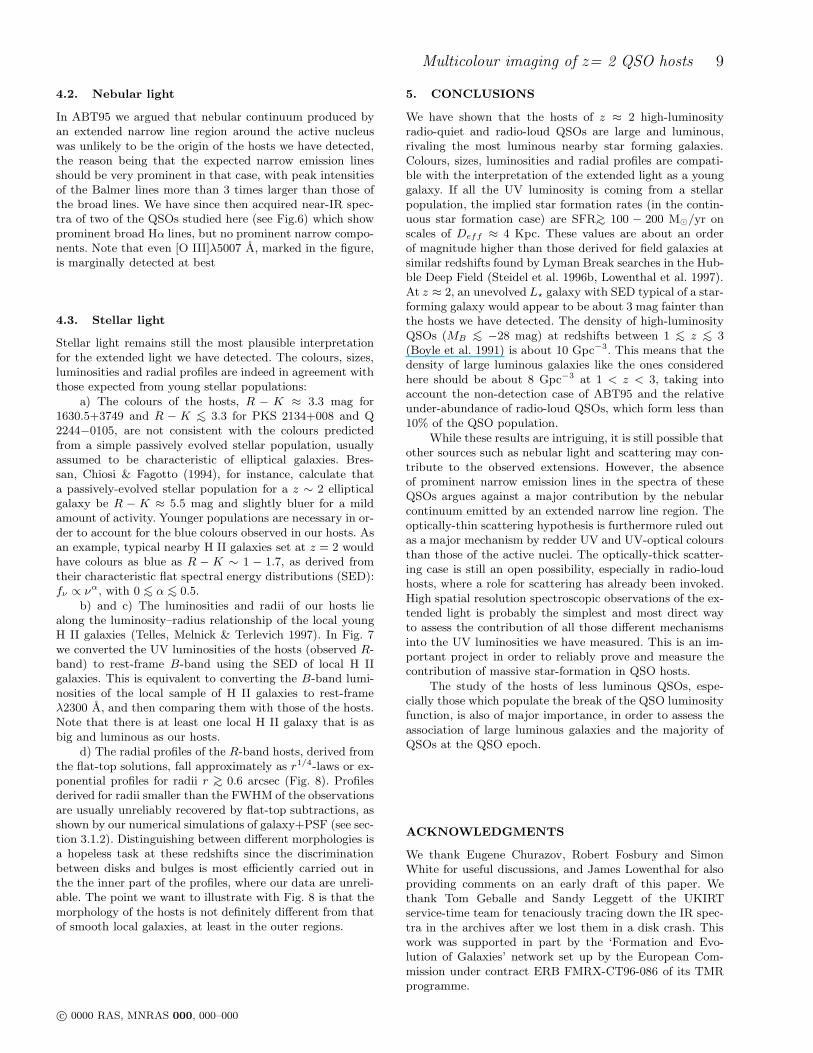
4.2. Nebular light
In ABT95 we argued that nebular continuum produced byan extended narrow line region around the active nucleuswas unlikely to be the origin of the hosts we have detected,the reason being that the expected narrow emission linesshould be very prominent in that case, with peak intensitiesof the Balmer lines more than 3 times larger than those ofthe broad lines. We have since then acquired near-IR spec-tra of two of the QSOs studied here (see Fig.6) which showprominent broad Hα lines, but no prominent narrow compo-nents. Note that even [O III]λ5007 A, marked in the figure,is marginally detected at best
4.3. Stellar light
Stellar light remains still the most plausible interpretationfor the extended light we have detected. The colours, sizes,luminosities and radial profiles are indeed in agreement withthose expected from young stellar populations:
a) The colours of the hosts, R − K ≈ 3.3 mag for1630.5+3749 and R − K <∼ 3.3 for PKS 2134+008 and Q2244−0105, are not consistent with the colours predictedfrom a simple passively evolved stellar population, usuallyassumed to be characteristic of elliptical galaxies. Bres-san, Chiosi & Fagotto (1994), for instance, calculate thata passively-evolved stellar population for a z ∼ 2 ellipticalgalaxy be R − K ≈ 5.5 mag and slightly bluer for a mildamount of activity. Younger populations are necessary in or-der to account for the blue colours observed in our hosts. Asan example, typical nearby H II galaxies set at z = 2 wouldhave colours as blue as R − K ∼ 1 − 1.7, as derived fromtheir characteristic flat spectral energy distributions (SED):fν ∝ να, with 0 <∼ α <∼ 0.5.
b) and c) The luminosities and radii of our hosts liealong the luminosity–radius relationship of the local youngH II galaxies (Telles, Melnick & Terlevich 1997). In Fig. 7we converted the UV luminosities of the hosts (observed R-band) to rest-frame B-band using the SED of local H IIgalaxies. This is equivalent to converting the B-band lumi-nosities of the local sample of H II galaxies to rest-frameλ2300 A, and then comparing them with those of the hosts.Note that there is at least one local H II galaxy that is asbig and luminous as our hosts.
d) The radial profiles of the R-band hosts, derived fromthe flat-top solutions, fall approximately as r1/4-laws or ex-ponential profiles for radii r >∼ 0.6 arcsec (Fig. 8). Profilesderived for radii smaller than the FWHM of the observationsare usually unreliably recovered by flat-top subtractions, asshown by our numerical simulations of galaxy+PSF (see sec-tion 3.1.2). Distinguishing between different morphologies isa hopeless task at these redshifts since the discriminationbetween disks and bulges is most efficiently carried out inthe the inner part of the profiles, where our data are unreli-able. The point we want to illustrate with Fig. 8 is that themorphology of the hosts is not definitely different from thatof smooth local galaxies, at least in the outer regions.
5. CONCLUSIONS
We have shown that the hosts of z ≈ 2 high-luminosityradio-quiet and radio-loud QSOs are large and luminous,rivaling the most luminous nearby star forming galaxies.Colours, sizes, luminosities and radial profiles are compati-ble with the interpretation of the extended light as a younggalaxy. If all the UV luminosity is coming from a stellarpopulation, the implied star formation rates (in the contin-uous star formation case) are SFR>∼ 100 − 200 M⊙/yr onscales of Deff ≈ 4 Kpc. These values are about an orderof magnitude higher than those derived for field galaxies atsimilar redshifts found by Lyman Break searches in the Hub-ble Deep Field (Steidel et al. 1996b, Lowenthal et al. 1997).At z ≈ 2, an unevolved L⋆ galaxy with SED typical of a star-forming galaxy would appear to be about 3 mag fainter thanthe hosts we have detected. The density of high-luminosityQSOs (MB <∼ −28 mag) at redshifts between 1 <∼ z <∼ 3(Boyle et al. 1991) is about 10 Gpc−3. This means that thedensity of large luminous galaxies like the ones consideredhere should be about 8 Gpc−3 at 1 < z < 3, taking intoaccount the non-detection case of ABT95 and the relativeunder-abundance of radio-loud QSOs, which form less than10% of the QSO population.
While these results are intriguing, it is still possible thatother sources such as nebular light and scattering may con-tribute to the observed extensions. However, the absenceof prominent narrow emission lines in the spectra of theseQSOs argues against a major contribution by the nebularcontinuum emitted by an extended narrow line region. Theoptically-thin scattering hypothesis is furthermore ruled outas a major mechanism by redder UV and UV-optical coloursthan those of the active nuclei. The optically-thick scatter-ing case is still an open possibility, especially in radio-loudhosts, where a role for scattering has already been invoked.High spatial resolution spectroscopic observations of the ex-tended light is probably the simplest and most direct wayto assess the contribution of all those different mechanismsinto the UV luminosities we have measured. This is an im-portant project in order to reliably prove and measure thecontribution of massive star-formation in QSO hosts.
The study of the hosts of less luminous QSOs, espe-cially those which populate the break of the QSO luminosityfunction, is also of major importance, in order to assess theassociation of large luminous galaxies and the majority ofQSOs at the QSO epoch.
ACKNOWLEDGMENTS
We thank Eugene Churazov, Robert Fosbury and SimonWhite for useful discussions, and James Lowenthal for alsoproviding comments on an early draft of this paper. Wethank Tom Geballe and Sandy Leggett of the UKIRTservice-time team for tenaciously tracing down the IR spec-tra in the archives after we lost them in a disk crash. Thiswork was supported in part by the ‘Formation and Evo-lution of Galaxies’ network set up by the European Com-mission under contract ERB FMRX-CT96-086 of its TMRprogramme.
c© 0000 RAS, MNRAS 000, 000–000

10 I. Aretxaga, R.J. Terlevich & B.J. Boyle
[O III] λ5007Å ?
Hα
Hα
[O III] λ5007 Å
Figure 6. Near-IR spectrum of the QSOs PKS 2134+008 and Q 2244−0105
REFERENCES
Aretxaga I., Boyle B.J., Terlevich R.J., 1995, MNRAS, 275,L27(ABT95)
Barthel P.D. , 1989, ApJ, 336,606
Bower R.G., Lucey J. & Ellis R.S., 1992, MNRAS, 254, 601
Boyle B.J., Jones L. R., Shanks T., Marano, Zitelli V., ZamoraniG., 1991, ‘The Space Distribution of Quasars’, ed. Crampton,
ASP Conf. Ser., 21, p.191.
Bressan et al. 1994, ApJS, 94,63.
Chambers K., Miley G. & van Breugel W., 1987, Nat, 329, 604.
Cimatti A., Dey A., van Breugel W., Hurt T., Antonucci R., 1997,ApJ, 476,677
Disney M.J., Boyce P.J., Blades J.C. et al. 1996, Nat, 376, 150.
Elias J.H., Frogel J.A., Matthews K., Neugebauer G., 1982, AJ,87,1029
Fabian A.C., 1989, MNRAS, 238, 41P.
Fosbury R. 1997. in ‘QSO Hosts’, ed. Clemens et al., ESO ConfSer., in press.
Guzman R., Gallego J., Koo D.C., Phillips A.C., Lowenthal J.D.,Vogt N.P., Faber S.M., Illingworth G.D. 1997, ApJ, in press.
Haehnelt M.G. & Rees, M., 1993, MNRAS, 263,168.
Hamann F., Ferland G., 1993, ApJ, 418, 11Hutchings J. 1995 AJ, 110, 994.Irwin M.J., Maddox S., McMahon R.G., 1994, Spectrum, 2,14Isaak K. G., McMahon, R.G., Hills, R.E., Withington, S. 1994,
MNRAS,269, 28Kauffman G.A.M., White S.D.M., Guiderdoni B., 1993, MNRAS,
264,201.Kauffman G.A.M. & Charlot S., 1997, MNRAS, submittedLandolt A.U., 1991, AJ, 104,340
Larson R.B. 1974, MNRAS, 166, 585Lehnert M.D, Heckman T., Chambers K.C. & Miley G.K., 1992,
ApJ, 393, 68.Lowenthal J.D., Heckman T.M., Lehnert M.D. & Elias J.H., 1995,
ApJ, 439, 588.Lowenthal J.D., Koo D.C., Guzman R., Gallego J. Phillips A.C.,
Faber S.M., Vogt N.P., Illingworth G.D., Gronwall C., 1997,ApJ, 481,673
McLeod K.K. & Rieke G.H. 1995, ApJ, 454, L77.Pahre M.A., Djorgovsi S.G., Bechtold J., Elson R. 1997, in ‘Young
Galaxies and QSO absorvers’ eds. Viegas et al., ASP Conf.Ser.
Phillips A.C., Guzman R., Gallego J., Koo D.C., Lowenthal J.D.,
c© 0000 RAS, MNRAS 000, 000–000

Multicolour imaging of z= 2 QSO hosts 11
Figure 7. Luminosity–size relationship for nearby H II galaxies and QSOs hosts. H II galaxies are marked with filled squares. The threeQSOs studied here lie in this relation if their SEDs are fν ∝ ν0 (open triangles) to fν ∝ ν0.5 (open squares). These SEDs are typical ofyoung H II galaxies
1 1.5 2 0 0.5 1 1.5
log (r)
Figure 8. Radial profile of the R-band host of the QSO 1630.5+3749, in a log counts vs. r1/4 and in a log(r) diagram. Elliptical profilesand disk-like profiles give linear relationships in the right-hand and left-hand panel, respectively.
Vogt N.P., Faber S.M., Illinworth G.D. 1997, ApJ, in press.Pritchet C.J. 1994, PASP, 106, 1052.Steidel C.C. et al. 1996a, ApJ, 462, L17Steidel C.C., Giavalisco M., Dickinson M., & Adelberger K.L.,
1996b, ApJ, 112,352Taylor G.L., Dublop J.S., Hughes D.H., Robson E.I. 1996, MN-
RAS, 283,930.Telles E., Melnick J. & Terlevich R.J., 1997,MNRAS, in pressTerlevich R. & Boyle 1993, MNRAS, 262, 491Veron-Cetty M.-P. & Veron P. 1994. A Catalogue of Quasars and
Active Galactic Nuclei. ESO.Veron P. & Hawkins M.R.S.1995. A&A 296, 665.Wolfe et al. 1995, ApJ, 454, 698.
c© 0000 RAS, MNRAS 000, 000–000
Related Documents