For Peer Review Only Multi-element survey of wild edible fungi and blackberries in the UK Journal: Food Additives and Contaminants Manuscript ID: TFAC-2005-190.R1 Manuscript Type: Original Research Paper Date Submitted by the Author: 29-Sep-2005 Complete List of Authors: Weeks, Claire; University of Bristol, School of Veterianry Science Osborne, Mark; University of Bristol, School of Veterinary Science Hewitt, Leisha; University of Bristol, School of Veterianry Science Miller, Patrick; Food Standards Agency Croasdale, Michelle; Food Standards Agency Baxter, Malcolm; CSL Robb, Paul; CSL Warriss, Paul; University of Bristol, School of Veterinary Science Knowles, Toby; University of Bristol, School of Veterinary Science Methods/Techniques: Survey Additives/Contaminants: Heavy metals Food Types: Fruit, Mushrooms http://mc.manuscriptcentral.com/tfac Email: [email protected] Food Additives and Contaminants peer-00577563, version 1 - 17 Mar 2011 Author manuscript, published in "Food Additives and Contaminants 23, 02 (2006) 140" DOI : 10.1080/02652030500386184

Welcome message from author
This document is posted to help you gain knowledge. Please leave a comment to let me know what you think about it! Share it to your friends and learn new things together.
Transcript

For Peer Review O
nly
Multi-element survey of wild edible fungi and blackberries in the UK
Journal: Food Additives and Contaminants
Manuscript ID: TFAC-2005-190.R1
Manuscript Type: Original Research Paper
Date Submitted by the Author:
29-Sep-2005
Complete List of Authors: Weeks, Claire; University of Bristol, School of Veterianry Science Osborne, Mark; University of Bristol, School of Veterinary Science Hewitt, Leisha; University of Bristol, School of Veterianry Science Miller, Patrick; Food Standards Agency Croasdale, Michelle; Food Standards Agency
Baxter, Malcolm; CSL Robb, Paul; CSL Warriss, Paul; University of Bristol, School of Veterinary Science Knowles, Toby; University of Bristol, School of Veterinary Science
Methods/Techniques: Survey
Additives/Contaminants: Heavy metals
Food Types: Fruit, Mushrooms
http://mc.manuscriptcentral.com/tfac Email: [email protected]
Food Additives and Contaminantspe
er-0
0577
563,
ver
sion
1 -
17 M
ar 2
011
Author manuscript, published in "Food Additives and Contaminants 23, 02 (2006) 140" DOI : 10.1080/02652030500386184

For Peer Review O
nly
1
Page 1 of 22
http://mc.manuscriptcentral.com/tfac Email: [email protected]
Food Additives and Contaminants
123456789101112131415161718192021222324252627282930313233343536373839404142434445464748495051525354555657585960
peer
-005
7756
3, v
ersi
on 1
- 17
Mar
201
1

For Peer Review O
nly
2
Abstract 1 2
A survey of 12 metals including lead (Pb), copper (Cu), cadmium (Cd), mercury (Hg), 3
arsenic (As) and platinum(Pt) was carried out using ICP-MS in 34 samples of wild 4
fungi and 48 samples of wild blackberries collected from sites across the UK. On a 5
fresh weight basis (mg/kg) levels of Pb were in the range 0.003-5.990, Cu 0.596-6
34.800, Cd <0.001-19.6, Hg <0.001-4.150, As 0.001 – 0.972 and Pt (µg/kg) 0.006 – 7
0.200, with higher concentrations found in fungi than in blackberries. 8
The results of the survey showed that the concentrations of the metals were consistent 9
with previous studies, where available. Concentrations in wild fungi of Pt, tin (Sn), 10
and titanium(Ti) were significantly higher at urban sites than at rural sites. Urban 11
blackberries had significantly higher levels of Pb, Ti, and Cd than rural ones, but 12
lower levels of manganese (Mn). Pb, Ti and Sn concentrations were significantly 13
higher in blackberries sampled near main roads rather than in rural areas. 14
Page 2 of 22
http://mc.manuscriptcentral.com/tfac Email: [email protected]
Food Additives and Contaminants
123456789101112131415161718192021222324252627282930313233343536373839404142434445464748495051525354555657585960
peer
-005
7756
3, v
ersi
on 1
- 17
Mar
201
1

For Peer Review O
nly
3
Introduction 1
2
The survey aimed to provide an index of levels of environmental pollution, and to 3
provide a baseline against which to monitor future changes in pollution. Levels of 4
arsenic, cadmium, chromium, copper, lead, manganese, mercury, nickel, platinum, 5
tin, titanium and zinc were measured. It also assessed the levels in the most popular 6
types of wild food collected and eaten in the UK, but not seafoods or game, which are 7
now often farmed and are included in other MAFF surveys (Veterinary Residues 8
Committee, 2002). Therefore, the chosen wild foods were fungi and blackberries. 9
Edible wild fungi were selected because they can accumulate contaminants from the 10
soil (e.g. cadmium, mercury and lead). The accumulation of contaminants by fungi is 11
dependant both on environmental factors such as metal concentrations in the soil and 12
pH, and on factors such as fungal structure (Garcia et al. 1998). Several studies have 13
shown that the fruiting bodies (i.e. mushrooms) of many fungal species can 14
accumulate mercury, cadmium and lead (Kalac et al. 1991, Garcia et al. 1998, Kalac 15
et al. 1996, Falandysz et al. 2004), with some very high lead concentrations being 16
reported in mushrooms growing in the vicinity of highways or other sources of lead 17
(Kalac et al. 1996). 18
19
Wild blackberries were analysed as indicators of surface pollution (e.g. from traffic 20
exhausts). There have been recent concerns about the potential for increases in the 21
levels of platinum in the environment due to emissions from catalytic converters in 22
car exhausts (Anon, 1998, Farago et al., 1998, Hees et al., 1998, Ravindra et al, 23
2004). At the time of sampling, it is believed that approximately half the cars 24
registered in the UK had catalytic converters fitted, whereas virtually none was fitted 25
before 1993. Platinum was therefore included in this survey to compare its levels of 26
contamination in wild foods growing close to roads with those grown away from 27
traffic. 28
29
Manganese was also included in this survey in order to provide baseline data against 30
which any increase in contamination can be compared, should manganese-based fuel 31
additives be used in the future as replacements for leaded fuel. Titanium was 32
analysed as an indicator of soil contamination. Plants do not take up titanium 33
Page 3 of 22
http://mc.manuscriptcentral.com/tfac Email: [email protected]
Food Additives and Contaminants
123456789101112131415161718192021222324252627282930313233343536373839404142434445464748495051525354555657585960
peer
-005
7756
3, v
ersi
on 1
- 17
Mar
201
1

For Peer Review O
nly
4
internally, and so the presence of titanium in plant samples can be used to indicate the 1
presence of soil or dust on the outer surface of the plant sample. 2
3
Samples of wild fungi and blackberries were taken from both rural and urban 4
locations, and from roadside sites and those distant from roads around the UK in order 5
to reflect potential localised sources of contamination. There are no data for wild 6
foods from previous UK surveys, however several surveys have measured elements in 7
commercially-grown mushrooms and blackberries (MAFF, 1982, 1983, 1985, 8
1987a,b, 1997a). Such commercial samples are likely to have been produced under 9
much more controlled conditions and, for fungi, comprise different species to some of 10
the wild fungi in this survey. 11
12
Some metals and other elements (e.g. zinc, selenium, cobalt, copper) can act as 13
nutrients and are essential for health, while others (e.g. mercury, cadmium, lead) have 14
no known beneficial health effects (MAFF, 1998 a,b). All may be harmful if 15
excessive amounts are consumed. Metals and other elements are present in foods 16
naturally; as a result of human activities (e.g. agricultural practices, industrial 17
emissions, car exhausts); from contamination during manufacture/processing and 18
storage; or may be added directly (MAFF, 1998 a,b, Peshin et al., 2002). 19
20
21
Materials and methods 22
23
The survey was undertaken between June and November 1998. Samples (ideally at 24
least 200 g) of wild fungi and blackberries were collected from the ‘North’, the 25
‘Midlands’ and the ‘South’ of mainland Great Britain. 26
27
Fungi samples 28
29
30
Samples were collected by Members of the British Mycological Society, with half 31
from urban and half from rural locations. These volunteers were used 32
as types of edible fungi can be difficult to find and to identify. They were provided 33
with written instructions on sample collection. Records included the date of 34
Page 4 of 22
http://mc.manuscriptcentral.com/tfac Email: [email protected]
Food Additives and Contaminants
123456789101112131415161718192021222324252627282930313233343536373839404142434445464748495051525354555657585960
peer
-005
7756
3, v
ersi
on 1
- 17
Mar
201
1
For Peer Review O
nly
5
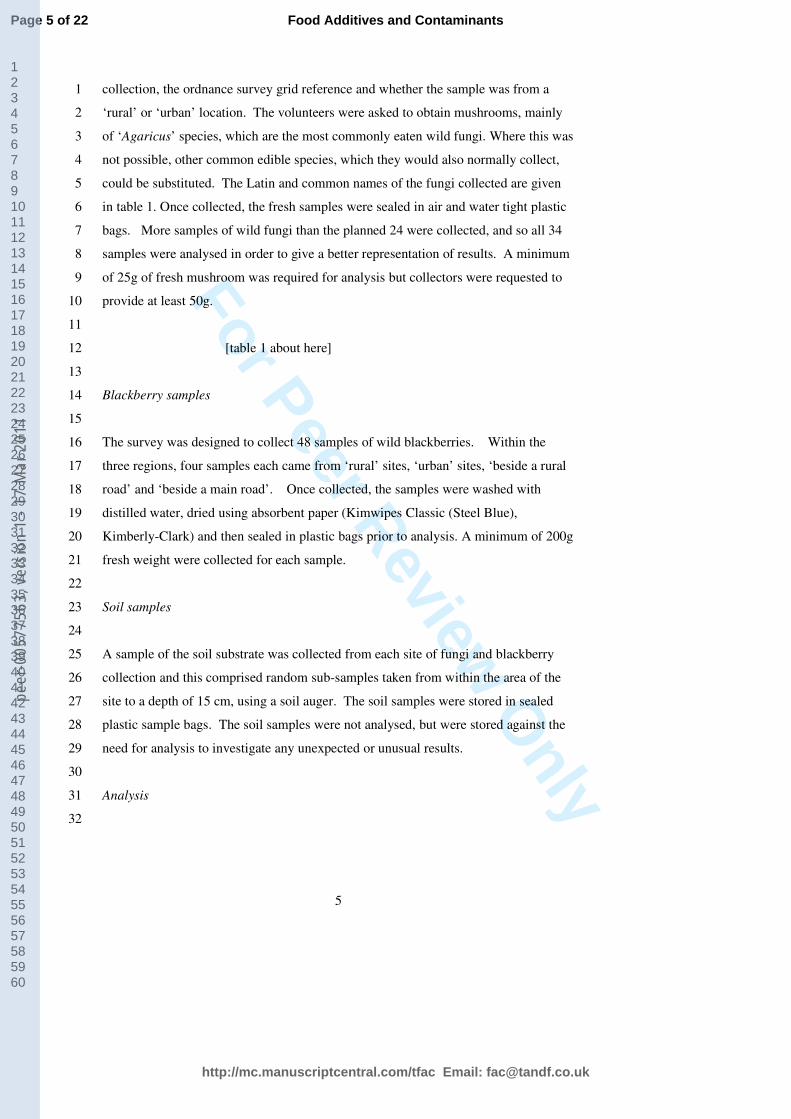
collection, the ordnance survey grid reference and whether the sample was from a 1
‘rural’ or ‘urban’ location. The volunteers were asked to obtain mushrooms, mainly 2
of ‘Agaricus’ species, which are the most commonly eaten wild fungi. Where this was 3
not possible, other common edible species, which they would also normally collect, 4
could be substituted. The Latin and common names of the fungi collected are given 5
in table 1. Once collected, the fresh samples were sealed in air and water tight plastic 6
bags. More samples of wild fungi than the planned 24 were collected, and so all 34 7
samples were analysed in order to give a better representation of results. A minimum 8
of 25g of fresh mushroom was required for analysis but collectors were requested to 9
provide at least 50g. 10
11
[table 1 about here] 12
13
Blackberry samples 14
15
The survey was designed to collect 48 samples of wild blackberries. Within the 16
three regions, four samples each came from ‘rural’ sites, ‘urban’ sites, ‘beside a rural 17
road’ and ‘beside a main road’. Once collected, the samples were washed with 18
distilled water, dried using absorbent paper (Kimwipes Classic (Steel Blue), 19
Kimberly-Clark) and then sealed in plastic bags prior to analysis. A minimum of 200g 20
fresh weight were collected for each sample. 21
22
Soil samples 23
24
A sample of the soil substrate was collected from each site of fungi and blackberry 25
collection and this comprised random sub-samples taken from within the area of the 26
site to a depth of 15 cm, using a soil auger. The soil samples were stored in sealed 27
plastic sample bags. The soil samples were not analysed, but were stored against the 28
need for analysis to investigate any unexpected or unusual results. 29
30
Analysis 31
32
Page 5 of 22
http://mc.manuscriptcentral.com/tfac Email: [email protected]
Food Additives and Contaminants
123456789101112131415161718192021222324252627282930313233343536373839404142434445464748495051525354555657585960
peer
-005
7756
3, v
ersi
on 1
- 17
Mar
201
1

For Peer Review O
nly
6
The wild fungi and blackberry samples were prepared and analysed for arsenic, 1
cadmium, chromium, copper, lead, manganese, mercury, nickel, platinum, tin, 2
titanium, and zinc. 3
4
All samples were washed thoroughly with distilled water and the edible portions 5
prepared. Aliquots of the homogenised edible portion of each sample (equivalent to 6
approximately 0.5 g dry weight) were digested with nitric acid by microwave heating 7
in a CEM MDS 2000 UDV system. All elements were measured by inductively 8
coupled plasma-mass spectrometry (ICP-MS) using a Perkin Elmer Elan 6000. All 9
measurements were covered by the United Kingdom Accreditation Service (UKAS) 10
accreditation, except titanium which was used as a screen only and thus outside the 11
scope of UKAS accreditation, and platinum, which was analysed by a different 12
method in order to obtain a lower limit of detection (LOD). For the platinum 13
samples, aliquots of each sample (equivalent to approximately 0.5 g dry weight) were 14
digested a form of aqua regia (4+1, concentrated nitric and hydrochloric acids (v/v)) 15
by microwave heating in a Perkin Elmer Multiwave microwave digestion system. 16
This method was chosen because platinum that is emitted from car exhausts fitted 17
with catalytic converters is likely to be in resilient forms that are difficult to digest 18
fully by nitric acid digestion alone. However, this method was outside the scope of 19
UKAS accreditation. 20
21
Quality Control 22
23
The approach for quality control in multi-element analyses by the analyst has been 24
discussed elsewhere (Baxter et al. 1997). Every multi-element analysis in this study 25
included the following quality control checks: 26
27
• Measurement of a calibration standard at the start and end of each ICP-MS run – 28
values to be within ± 20% of each other; 29
• Spiked reagent blank recoveries to be within ± 20% of the expected value (and all 30
results are corrected for spike recovery); 31
• Replicate determinations to give a relative standard deviation of ≤ 20% or twice 32
the LOD; and 33
Page 6 of 22
http://mc.manuscriptcentral.com/tfac Email: [email protected]
Food Additives and Contaminants
123456789101112131415161718192021222324252627282930313233343536373839404142434445464748495051525354555657585960
peer
-005
7756
3, v
ersi
on 1
- 17
Mar
201
1

For Peer Review O
nly
7
• Certified Reference Material (CRM) results – values to be within the certified 1
range or ± 40% of the certified value, whichever was the greater. 2
3
Every microwave digestion batch included a National Institute of Standards 4
Technology (NIST) certified reference material (CRM) (BCR 60 – Aquatic Plant; 5
BCR 61 – Aquatic Moss; NIST 1547 – Peach leaves; NIST 1570 – Spinach; NIST 6
1573 – Tomato leaves) and a duplicate sample. Each batch also contained reagent 7
blanks, and a reagent blank spiked with a known amount of each element for recovery 8
estimate purposes. Rhodium and indium were added to the digests as internal 9
standards before element concentrations were measured by ICP-MS. 10
11
The limits of detection of the elements analysed in the fungi and blackberries 12
surveyed are shown in table 2. 13
14
[table 2 about here] 15
16
17
Results and discussion 18
19
There were detectable levels of titanium on all the samples, indicating contamination 20
by soil. For blackberries, this was significantly greater for samples obtained next to 21
major roads, presumably as a result of splashing from vehicle wheels in wet weather. 22
Titanium concentrations in urban fungi samples (1.4 mg/kg) were found to be 23
significantly higher (P < 0.05) than in rural samples (0.35 mg/kg), however, it should 24
be noted that species of fungi were not matched between the two types of site. For 25
blackberries, the highest concentration of 1.8 mg/kg was found in an urban roadside 26
sample and, as with the fungi, titanium was significantly higher (p<0.01) in the urban 27
samples. 28
29
The results for titanium suggest that, not surprisingly, significant levels of soil and 30
dust may remain in the wild fungi and berry samples even after washing with clean 31
water. Any surface soil remaining in samples would have contributed to the titanium 32
concentrations reported. However, since none of the reported concentrations were 33
above guideline limits, this was not pursued. 34
Page 7 of 22
http://mc.manuscriptcentral.com/tfac Email: [email protected]
Food Additives and Contaminants
123456789101112131415161718192021222324252627282930313233343536373839404142434445464748495051525354555657585960
peer
-005
7756
3, v
ersi
on 1
- 17
Mar
201
1

For Peer Review O
nly
8
1
The results for each element are shown in tables 3 for wild fungi and 4 for wild 2
blackberries. Further details can be found elsewhere (University of Bristol, 1999; 3
MAFF 2000) . All results are reported on a fresh weight basis. 4
5
[tables 3 and 4 about here] 6
7
Several of the samples for both fungi and blackberries contained relatively high 8
concentrations of some elements, and highly skewed distributions of values were 9
obtained. This is consistent with previous studies (Kalac et al., 1991, Kalac et al., 10
1996, Barcan et al., 1998, Garcia et al., 1998, Michelot et al., 1999). 11
12
Fungi 13
14
Over half the samples collected were Agaricus species. No urban samples were 15
collected from the north but two extra samples were collected from each of urban 16
midlands and urban south. These four extra samples were used in an analysis of urban 17
– rural differences in order to maintain the urban/rural balance within the survey. 18
Several samples of wild fungi did show the ability to accumulate some relatively high 19
concentrations of certain elements, especially cadmium, copper, arsenic, mercury, 20
zinc and lead. This is consistent with earlier studies, which show that certain fungi 21
can accumulate very high concentrations of metals (Anon, 1998, Barcan et al., 1998, 22
Farago et al., 1998, Garcia et al. 1998, Hees et al., 1998, Kalac et al. 1991, Kalac et 23
a.l 1996, Michelot et al., 1999, Falandysz et al. 2004). 24
25
Overall, there appeared to be few large or significant differences between samples 26
from the rural and urban sites. Statistical analysis showed samples of fungi from 27
urban sites contained significantly higher concentrations of titanium, tin and platinum 28
and lower levels of zinc (Mann Whitney, exact P values = 0.014, 0.019, 0.003, 0.028 29
respectively). 30
31
Blackberries 32
33
Page 8 of 22
http://mc.manuscriptcentral.com/tfac Email: [email protected]
Food Additives and Contaminants
123456789101112131415161718192021222324252627282930313233343536373839404142434445464748495051525354555657585960
peer
-005
7756
3, v
ersi
on 1
- 17
Mar
201
1

For Peer Review O
nly
9
In general, the concentrations of the chemical elements in the samples of blackberries 1
were low, with many falling below the limits of detection. Kruskal Wallis tests were 2
used on the non-parametric data to test for regional and site variation. There were few 3
regional differences but levels of arsenic and chromium were significantly lower (P < 4
0.001) in the north than in the midlands and south of the UK. Levels of copper were 5
also lower in the north but platinum was higher in the samples from this region (P < 6
0.01). Manganese concentrations were significantly higher (P < 0.001) in samples 7
from rural locations, with median levels of 11.7 mg/kg almost six times as high as 8
urban samples (Table 4). Manganese is commonly applied to agricultural crops, 9
which are often deficient in this trace element. Mean concentrations of lead were 10
almost nine times higher (P < 0.001) in samples by major roads and at urban sites than 11
rural sites. Significantly elevated levels of tin (P < 0.01), chromium (P < 0.05), 12
arsenic (P < 0.05) and titanium (P = 0.001) were also found in blackberries in those 13
locations. These results for lead and platinum are as expected because road traffic 14
represents a significant localised source of emissions of these elements to the 15
environment. 16
17
The levels of the four elements (arsenic, cadmium, mercury and lead) with the 18
greatest potential to be toxic to humans are illustrated for edible fungi in figure 1 and 19
for blackberries in figure 2, with further comments on these results given below. 20
21
[Figures 1 and 2 about here] 22
23
Arsenic 24
25
Several samples of fungi showed high arsenic levels, the highest being in Agaricus 26
macrosporus (0.97 mg/kg), Lepiota procera (0.83 mg/kg) and Agaricus arvensis (0.73 27
mg/kg). These concentrations are, nonetheless, below the statutory limit of 1 mg/kg 28
for arsenic in commercial foods set by The Arsenic in Food Regulations 1959, as 29
amended, although those Regulations do not apply to wild foods collected for 30
personal consumption. There was no significant difference between arsenic 31
concentrations in urban and rural samples of fungi. 32
33
Page 9 of 22
http://mc.manuscriptcentral.com/tfac Email: [email protected]
Food Additives and Contaminants
123456789101112131415161718192021222324252627282930313233343536373839404142434445464748495051525354555657585960
peer
-005
7756
3, v
ersi
on 1
- 17
Mar
201
1

For Peer Review O
nly
10
Levels of arsenic were very low in all the blackberry samples with the highest 1
concentration being 0.069 mg/kg. The results show significantly (P < 0.05) higher 2
concentrations in urban samples (mean 0.0102 mg/kg, range 0.0015 mg/kg to 0.0690 3
mg/kg) than rural samples (mean 0.0032 mg/kg, range 0.0011 mg/kg to 0.0079 4
mg/kg). However, there were no significant differences in arsenic levels between 5
roadside and non-roadside samples of blackberries. 6
7
Cadmium 8
9
Cadmium concentrations in wild fungi ranged from 0.02 mg/kg to 20.0 mg/kg with a 10
mean of 1.6 mg/kg. Relatively high concentrations of cadmium were found in several 11
species (Agaricus macrosporus, 20 mg/kg; Agaricus campestris, 8.7 mg/kg; and 12
Agaricus arvensis, 5.3 mg/kg). This could reflect either a higher rate of cadmium 13
accumulation in these species, or it could be that these samples happened to be 14
growing in soil that had higher levels of cadmium. 15
16
Some results from this study are somewhat higher than those from a study of wild 17
fungi undertaken in Croatia (Mandic et al., 1992) (mean 1.2 mg/kg, range 0.3 mg/kg 18
to 4.87 mg/kg dry weight) although different species were analysed. The mean 19
concentration of 1.6 mg/kg from this study is greater than the mean concentration of 20
0.018 mg/kg found in samples of commercial fungi reported elsewhere (MAFF 1997) 21
and also in 4 samples of mushroom in an earlier study of background levels of 22
cadmium in foods (MAFF 1983) where the mean concentration was 0.06 mg/kg (0.02 23
mg/kg to 0.08 mg/kg). Directive 2001/22/EC sets a limit of 0.2 mg/kg wet weight for 24
Cd in all cultivated fungi. Fourteen out of 34 samples exceeded this limit,which is not 25
applicable to wild fungi. 26
27
Cadmium concentrations in the blackberry samples ranged from 0.0007 mg/kg to 28
0.094 mg/kg with a mean concentration of 0.011 mg/kg. There was no significant 29
difference between the urban and rural samples or between roadside and non-roadside 30
samples. A MAFF study analysing foods grown in the Shipham area (MAFF 1983) 31
where elevated levels of cadmium are found as a result of historic mining activity, 32
found a commercial sample of blackberry with a cadmium level of 0.08 mg/kg, which 33
is at the higher end of the range found in samples from this survey. Although not a 34
Comment [C1]: Toby – can we give
the exact numbers or proportion of
samples over 0.2 mg/kg?
Page 10 of 22
http://mc.manuscriptcentral.com/tfac Email: [email protected]
Food Additives and Contaminants
123456789101112131415161718192021222324252627282930313233343536373839404142434445464748495051525354555657585960
peer
-005
7756
3, v
ersi
on 1
- 17
Mar
201
1

For Peer Review O
nly
11
direct comparison, strawberries analysed in a Finnish study (Tahvonen et al., 1995) 1
had a mean cadmium concentration of 0.007 mg/kg, which is similar to concentrations 2
in this survey. 3
4
Lead 5
6
Lead was detected in all of the wild fungi samples (mean 0.7 mg/kg, range 0.012 7
mg/kg to 6 mg/kg). The majority of the samples had lead concentrations below the 8
EU statutory limit of 0.3 mg/kg for lead in commercial fungi (Directive 2001/22/EC), 9
although, as noted above for arsenic, these statutory limits do not apply to wild foods 10
collected for personal consumption. Five samples with higher lead concentrations 11
were found, with the greatest (6.0 mg/kg) being in a sample of ‘Wrinkled Club’ 12
(Clavaria species). Statistical analysis showed there to be no significant difference 13
between urban and rural samples. 14
15
The mean concentration from this survey (0.7 mg/kg) is greater than results for 16
commercial fungi tested in an earlier JFSSG study, (MAFF, 1997a) where a mean 17
concentration of 0.01 mg/kg was obtained. However, this result is expected as 18
commercial fungi are different species, grown in controlled conditions and are 19
unlikely to be exposed to the same types of contaminant as those growing in the wild. 20
This has been shown in a previous study (Borella et al., 1994). A study in Croatia 21
measured a range of lead concentrations in edible wild fungi up to a high of 7.72 22
mg/kg (Mandic et al., 1992). 23
24
None of the wild blackberry samples had lead concentrations above 1 mg/kg. There 25
was no significant difference between the samples taken from urban sites and main 26
road sites. However, the mean concentration of lead in urban samples (0.093 mg/kg) 27
was significantly greater (P < 0.01) than in the rural samples (0.012 mg/kg), which 28
suggests that localised environmental contamination in urban areas and near main 29
roads does contribute to higher lead levels in wild blackberries. The mean 30
concentration of lead found in blackberries in this survey (0.05 mg/kg) is less than 31
that found in commercial fresh blackberries (0.07 mg/kg) in a previous survey 32
(MAFF, 1987a). 33
34
Page 11 of 22
http://mc.manuscriptcentral.com/tfac Email: [email protected]
Food Additives and Contaminants
123456789101112131415161718192021222324252627282930313233343536373839404142434445464748495051525354555657585960
peer
-005
7756
3, v
ersi
on 1
- 17
Mar
201
1

For Peer Review O
nly
12
Mercury 1
2
The concentrations, on a fresh weight basis, in all of the wild fungi samples were 3
above the LOD of 0.0006 mg/kg (mean 0.64 mg/kg, range 0.006 mg/kg to 4.2 mg/kg) 4
and there was no significant difference in levels of mercury between urban and rural 5
samples of fungi. Mean levels measured were greater than those for commercial 6
fungi (mean 0.02 mg/kg) in a survey of individual foods (MAFF, 1987b). However, 7
as noted above, commercial fungi samples may be different species and are grown in 8
controlled conditions and so this difference is not surprising. Falandysz et al. (2004) 9
found that bioconcentration factors of different species of wild edible mushroom 10
sampled in Poland varied on average between none and 73 times the concentration of 11
the soil substrate. The range for the majority of species was between 4 and 23 in the 12
caps. Actual values (on a dry matter basis) were between 0.17 mg/kg in the stalks and 13
0.92 mg/kg in the caps. They concluded from their study that even at a high 14
consumption level of 23 g per day of the most contaminated species (Amanita 15
muscaria), there was no risk to human health. 16
17
In wild blackberries, the mercury concentrations were very low (mean 0.00088 18
mg/kg, range 0.0006 mg/kg to 0.0079 mg/kg) with only 8 samples having mercury 19
concentrations above the LOD of 0.0006 mg/kg. 20
21
Conclusions 22
23
The levels of potentially harmful elements in wild foods were in general these low, 24
and often below the limit of detection. Concentrations of tin and titanium were 25
significantly higher at urban sites than at rural sites in both wild fungi and 26
blackberries. Platinum concentrations in blackberries were significantly higher at 27
roadside locations. Levels of platinum are believed to reflect its use in catalytic 28
converters and could be used to monitor future pollution. Levels of lead, which were 29
significantly greater in blackberries sampled within urban areas and adjacent to main 30
roads, might be expected to decrease in future, as lead is no longer added to petrol in 31
the UK. 32
33
34
Page 12 of 22
http://mc.manuscriptcentral.com/tfac Email: [email protected]
Food Additives and Contaminants
123456789101112131415161718192021222324252627282930313233343536373839404142434445464748495051525354555657585960
peer
-005
7756
3, v
ersi
on 1
- 17
Mar
201
1

For Peer Review O
nly
13
1
References 2
3
Anon, 1998, Determination of bioavailability: platinum particles emitted from 4
automobile exhaust catalysts. News report - Institut Toxikologie und 5
Aerosolforschung. 6
7
The Arsenic in Food Regulations 1959 (S.I. [1959] No. 831), as amended by The 8
Arsenic in Food (Amendment) Regulations 1960 (S.I. [1960] No. 2261) and The 9
Arsenic in Food (Amendment) Regulations 1973 (S.I. [1973] No. 1052). HMSO, 10
London. 11
12
Barcan, V.S.H., Kovnatsky, E.F., Smetannikova, M.S., 1998, Absorption of heavy 13
metals in wild berries and edible mushrooms in an area affected by smelter emissions. 14
Water, Air and Soil Pollution, 103, 173-195. 15
16
Baxter, M.J., Crews, H.M., Robb, P., Strutt, P., 1997, Quality control in the multi-17
element analysis of foods using ICP-MS. Plasma source mass spectrometry: 18
developments and applications, edited by G. Holland and S.D. Tanner. The Royal 19
Society of Chemistry, London. 20
21
Borella, P., Caselgrandi, E., Fabio, G., Gibertoni, C., 1994, Risk of intake for 22
cadmium and lead with consumption of fresh mushrooms on sale. L’Igiene Moderna, 23
101, 323-331. 24
25
Falandysz, J., Jedrusiak, A., Lipka, K., Kannan, K., Kanwo. M., Gucia, M., 26
Brzostowski, A. and Dadej, M. (2004) Mercury in wild mushrooms and underlying 27
soil substrate from Koszalin, North-central Poland. Chemosphere, 54, 461-466. 28
29
Farago, M.E, Kavanagh, P., Blanks, R., Kelly, J., Kazantis, G., Thornton, I., Simpson, 30
P.R., Cook, J.M., Delves, H.T., Hall, G.E.M., 1998, Platinum concentrations in urban 31
road dust and soil, and in blood and urine in the United Kingdom. Analyst, 123, 451-32
454. 33
34
Page 13 of 22
http://mc.manuscriptcentral.com/tfac Email: [email protected]
Food Additives and Contaminants
123456789101112131415161718192021222324252627282930313233343536373839404142434445464748495051525354555657585960
peer
-005
7756
3, v
ersi
on 1
- 17
Mar
201
1

For Peer Review O
nly
14
Garcia, M.A., Alonso, J., Fernandez, M.I., Melgar, M.J., 1998, Lead content in edible 1
wild mushrooms in northwest Spain as indicator of environmental contamination. 2
Archives of Environmental Contamination and Toxicology, 34, 330-335. 3
4
Hees, T., Wenclawiak, B., Lustig, S., Schramel, P., Schwarzer, M., Schuster, M., 5
Verstraete, D., Dams, D., Helmers, E., 1998, Distribution of platinum group elements 6
(Pt, Pd, Rh) in environmental and clinical matrices: composition, analytical 7
techniques and scientific outlook. Environmental Science and Pollution Research, 5, 8
105-111. 9
10
Kalac, P., Burda, J., Staskova, I., 1991, Concentrations of lead, cadmium, mercury 11
and copper in mushrooms in the vicinity of a lead smelter. Science of the Total 12
Environment, 105, 109-119. 13
14
Kalac, P., Niznanska, M., Bevilaqua, D., Staskova, I., 1996, Concentrations of 15
mercury, copper, cadmium and lead in fruiting bodies of edible mushrooms in the 16
vicinity of a mercury smelter and a copper smelter. The Science of the Total 17
Environment, 177, 251-258. 18
19
20
MAFF, 1982, Survey of Lead in Food: Second Supplementary Report. Food 21
Surveillance paper No.10. HMSO, London. 22
23
MAFF, 1983, Survey of Cadmium in Foods: First Supplementary Report. Food 24
Surveillance Paper No. 12. HMSO, London. 25
26
MAFF, 1985, Survey of Aluminium, Antimony, Chromium, Cobalt, Indium, Nickel, 27
Thallium and Tin in Food. Food Surveillance Paper No. 15. HMSO, London. 28
29
MAFF, 1987a, Lead in Food: Progress Report. Food Surveillance Paper No.27. 30
HMSO, London. 31
32
MAFF, 1987b, Survey of Mercury in Food: Second Supplementary Report. Food 33
Surveillance Paper No. 17. HMSO, London. 34
Page 14 of 22
http://mc.manuscriptcentral.com/tfac Email: [email protected]
Food Additives and Contaminants
123456789101112131415161718192021222324252627282930313233343536373839404142434445464748495051525354555657585960
peer
-005
7756
3, v
ersi
on 1
- 17
Mar
201
1

For Peer Review O
nly
15
1
MAFF, 1997 Survey of Lead and Cadmium in Foods. Food Surveillance Information 2
Sheet No. 113. HMSO, London. 3
4
MAFF, 1998a, Lead, Arsenic and Other Metals in Food. Food Surveillance Paper 5
No.52. HMSO, London. 6
7
MAFF, 1998b, Cadmium, Mercury and Other Metals in Food. Food Surveillance 8
Paper No.53. HMSO, London. 9
10
MAFF, 2000, Multi-element survey of wild edible fungi and blackberries. Food 11
Surveillance Information Sheet 199. HMSO, London. 12
<http://archive.food.gov.uk/maff/archive/food/infsheet/2000/no199/199multi.htm> 13
14
Mandic, M.L., Grgic, J., Grgic, Z., Servga, M., 1992, The natural levels of aluminium, 15
cadmium and lead in wild mushrooms in Eastern Croatia. Deutsche Lebensmittel-16
Rundschau 88, 76-77. 17
18
Michelot, D., Poirier, P., Melendez-Howell, L.M., 1999, Metal content profiles in 19
mushrooms collected in primary forests of Latin America. Archives of Environmental 20
Contamination and Toxicology, 36, 256-263. 21
22
Peshin, S.S., Lall, S.B. and Gupta, S.K., 2002, Potential food contaminants and 23
associated health risks. Acta Pharmacologica Sinica, 23, 193-202. 24
25
Ravindra, K., Bencs, L. and Van Grieken, R., 2004, Platinum group elements in the 26
environment and their health risk. Science of the Total Environment, 318, 1-43. 27
28
Tahvonen, R., Kumpulainen, J., 1995, Lead and Cadmium in some Berries and 29
Vegetables on the Finnish Market in 1991-1993. Food Additives and Contaminants, 30
12, 263-279. 31
32
University Of Bristol, 1999, Multi-Element Survey of Free Foods (FS2699). 33
34
Page 15 of 22
http://mc.manuscriptcentral.com/tfac Email: [email protected]
Food Additives and Contaminants
123456789101112131415161718192021222324252627282930313233343536373839404142434445464748495051525354555657585960
peer
-005
7756
3, v
ersi
on 1
- 17
Mar
201
1

For Peer Review O
nly
16
Veterinary Residues Committee, 2002, The Veterinary Residues Committee Annual 1
Report on Surveillance for Veterinary Residues in Food in the UK, 2002. Veterinary 2
Residues Committee, Addlestone, Surrey. 3
4
5
Page 16 of 22
http://mc.manuscriptcentral.com/tfac Email: [email protected]
Food Additives and Contaminants
123456789101112131415161718192021222324252627282930313233343536373839404142434445464748495051525354555657585960
peer
-005
7756
3, v
ersi
on 1
- 17
Mar
201
1

For Peer Review O
nly
17
Table 1. Common names of fungi collected. 1
2
LATIN NAME COMMON NAME Number sampled
Corprinus atramentarius Shaggy Ink Cap 1
Corprinus comatus Common Ink Cap 3
Agaricus campestris Common Field Mushroom 9
Agaricus augustus The Prince 1
Agaricus arvensis Horse Mushroom 5
Agaricus silvaticus Brown Wood Mushroom 2
Agaricus langei No widely used specific
common name
1
Agaricus macrosporus No widely used specific
common name
1
Agaricus bisporus Cultivated Mushroom 1
Mycena pura No widely used specific
common name
1
Lepista nuda Wood Blewit 3
Lepiota procera Parasol Mushroom 2
Hygrocybe pratensis Meadow Wax Cap 2
Langermannia gigantea Giant Puff Ball 1
Clavariaceae Wrinkled Club 1
3
4
Page 17 of 22
http://mc.manuscriptcentral.com/tfac Email: [email protected]
Food Additives and Contaminants
123456789101112131415161718192021222324252627282930313233343536373839404142434445464748495051525354555657585960
peer
-005
7756
3, v
ersi
on 1
- 17
Mar
201
1

For Peer Review O
nly
18
1
Table 2. Limits of Detection (LOD) 2
3
ELEMENT SYMBOL LOD (mg/kg)*
Arsenic As 0.0005
Cadmium Cd 0.0001
Chromium Cr 0.01
Copper Cu 0.002
Lead Pb 0.0006
Manganese Mn 0.01
Mercury Hg 0.0006
Nickel Ni 0.002
Platinum Pt 0.00001**
Tin Sn 0.001
Titanium Ti 0.001
Zinc Zn 0.04
4 * fresh weight 5 NB The LODs shown above are for a nominal sample weight of 4g, as taken in this survey 6 ** For the wild blackberries, a more sensitive procedure using aqua regia digestion was used for which 7 an LOD of 0.000006 mg/kg was obtained (see text) 8 9
Page 18 of 22
http://mc.manuscriptcentral.com/tfac Email: [email protected]
Food Additives and Contaminants
123456789101112131415161718192021222324252627282930313233343536373839404142434445464748495051525354555657585960
peer
-005
7756
3, v
ersi
on 1
- 17
Mar
201
1

For Peer Review O
nly
19
Table 3. Summary statistics of the levels of the elements found within the mushroom 1
samples (mg/kg fresh weight). 2
3
N Median Range Minimum Maximum
Ti 34 0.41 6.03 0.03 6.06
Cr 34 0.04 0.96 0.01 0.97
Mn 34 1.44 8.36 0.45 8.81
Ni 34 0.044 0.348 0.009 0.357
Cu 34 6.0 32.1 2.7 34.8
Zn 34 11.4 31.0 3.6 34.6
As 34 0.109 0.961 0.011 0.972
Cd 34 0.17 19.58 0.02 19.60
Sn 34 0.003 0.079 0.001 0.080
Pt 34 0.00002 0.00019 0.00001 0.00020
Hg 34 0.36 4.14 0.01 4.15
Pb 34 0.22 5.98 0.01 5.99
Page 19 of 22
http://mc.manuscriptcentral.com/tfac Email: [email protected]
Food Additives and Contaminants
123456789101112131415161718192021222324252627282930313233343536373839404142434445464748495051525354555657585960
peer
-005
7756
3, v
ersi
on 1
- 17
Mar
201
1

For Peer Review O
nly
20
1 Table 4. Summary statistics of the levels of the elements found within the blackberry 2
samples (mg/kg (*Pt µg/kg) fresh weight). 3
4
N Median Range Minimum Maximum
Ti 48 0.071 1.777 0.033 1.810
Cr 48 0.02 1.23 0.01 1.24
Mn 48 4.61 151.88 1.12 153.00
Ni 48 0.087 0.670 0.025 0.695
Cu 48 0.938 2.694 0.596 3.290
Zn 48 2.55 4.03 1.52 5.55
As 48 0.0035 0.0680 0.0011 0.0691
Cd 48 0.0044 0.0936 0.0007 0.0943
Sn 48 0.001 0.189 0.001 0.190
Pt* 48 0.006 0.070 0.006 0.076
Hg 48 0.0006 0.0073 0.0006 0.0079
Pb 48 0.0128 0.5458 0.0032 0.5490
5
Page 20 of 22
http://mc.manuscriptcentral.com/tfac Email: [email protected]
Food Additives and Contaminants
123456789101112131415161718192021222324252627282930313233343536373839404142434445464748495051525354555657585960
peer
-005
7756
3, v
ersi
on 1
- 17
Mar
201
1

For Peer Review O
nly
21
1
Figure 1. Levels of arsenic, cadmium, mercury and lead in wild mushrooms. Two 2
extreme sample values for cadmium have not been plotted and were 8.67 and 19.6 3
mg/kg. Values are fresh weight basis with the centre line of the box representing the 4
median of the distribution, the box the interquartile range. The whiskers extend to 1.5 5
times the box length with outliers (circles) from 1.5 to 3.0 x box length and extreme 6
values (stars) above 3 x box length. 7
8 9
As Cd Hg Pb
0.00
1.00
2.00
3.00
4.00
5.00
6.00
mg
/kg
10 11 12 13 14 15 16 17 18 19 20 21 22 23 24 25 26 27 28 29 30 31 32 33 34 35 36 37 38 39 40
Page 21 of 22
http://mc.manuscriptcentral.com/tfac Email: [email protected]
Food Additives and Contaminants
123456789101112131415161718192021222324252627282930313233343536373839404142434445464748495051525354555657585960
peer
-005
7756
3, v
ersi
on 1
- 17
Mar
201
1
For Peer Review O
nly
22
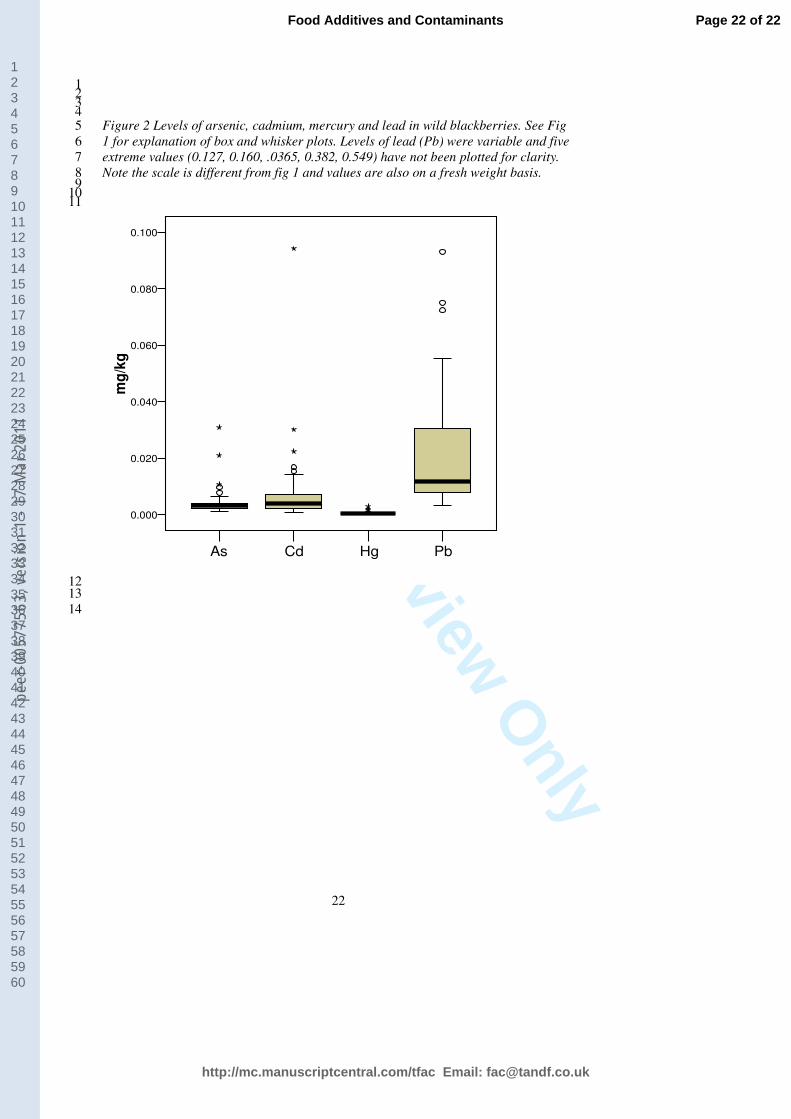
1 2 3 4 Figure 2 Levels of arsenic, cadmium, mercury and lead in wild blackberries. See Fig 5
1 for explanation of box and whisker plots. Levels of lead (Pb) were variable and five 6
extreme values (0.127, 0.160, .0365, 0.382, 0.549) have not been plotted for clarity. 7
Note the scale is different from fig 1 and values are also on a fresh weight basis. 8 9 10 11
As Cd Hg Pb
0.000
0.020
0.040
0.060
0.080
0.100
mg
/kg
12 13
14
Page 22 of 22
http://mc.manuscriptcentral.com/tfac Email: [email protected]
Food Additives and Contaminants
123456789101112131415161718192021222324252627282930313233343536373839404142434445464748495051525354555657585960
peer
-005
7756
3, v
ersi
on 1
- 17
Mar
201
1
Related Documents