SANDIA REPORT SAND2004-2864 Unlimited Release Printed June 2004 Multi-dimensional Multi-species Modeling of Transient Electrodeposition in LIGA Microfabrication Ken S. Chen and Gregory H. Evans Prepared by Sandia National Laboratories Albuquerque, New Mexico 87185 and Livermore, California 94550 Sandia is a multiprogram laboratory operated by Sandia Corporation, a Lockheed Martin Company, for the United States Department of Energy’s National Nuclear Security Administration under Contract DE-AC04-94AL85000. Approved for public release; further dissemination unlimited.

Welcome message from author
This document is posted to help you gain knowledge. Please leave a comment to let me know what you think about it! Share it to your friends and learn new things together.
Transcript

SANDIA REPORT
SAND2004-2864 Unlimited Release Printed June 2004 Multi-dimensional Multi-species Modeling of Transient Electrodeposition in LIGA Microfabrication
Ken S. Chen and Gregory H. Evans
Prepared by Sandia National Laboratories Albuquerque, New Mexico 87185 and Livermore, California 94550 Sandia is a multiprogram laboratory operated by Sandia Corporation, a Lockheed Martin Company, for the United States Department of Energy’s National Nuclear Security Administration under Contract DE-AC04-94AL85000. Approved for public release; further dissemination unlimited.

Issued by Sandia National Laboratories, operated for the United States Department of Energy by Sandia Corporation.
NOTICE: This report was prepared as an account of work sponsored by an agency of the United States Government. Neither the United States Government, nor any agency thereof, nor any of their employees, nor any of their contractors, subcontractors, or their employees, make any warranty, express or implied, or assume any legal liability or responsibility for the accuracy, completeness, or usefulness of any information, apparatus, product, or process disclosed, or represent that its use would not infringe privately owned rights. Reference herein to any specific commercial product, process, or service by trade name, trademark, manufacturer, or otherwise, does not necessarily constitute or imply its endorsement, recommendation, or favoring by the United States Government, any agency thereof, or any of their contractors or subcontractors. The views and opinions expressed herein do not necessarily state or reflect those of the United States Government, any agency thereof, or any of their contractors. Printed in the United States of America. This report has been reproduced directly from the best available copy. Available to DOE and DOE contractors from
U.S. Department of Energy Office of Scientific and Technical Information P.O. Box 62 Oak Ridge, TN 37831 Telephone: (865)576-8401 Facsimile: (865)576-5728 E-Mail: [email protected] Online ordering: http://www.osti.gov/bridge
Available to the public from
U.S. Department of Commerce National Technical Information Service 5285 Port Royal Rd Springfield, VA 22161 Telephone: (800)553-6847 Facsimile: (703)605-6900 E-Mail: [email protected] Online order: http://www.ntis.gov/help/ordermethods.asp?loc=7-4-0#online
2

SAND2004-2864 Unlimited Release Printed June 2004
Multi-dimensional Multi-species Modeling of Transient Electrodeposition in LIGA Microfabrication
Ken S. Chen* and Gregory H. Evans** * Multiphase Transport Processes Department
Sandia National Laboratories P.O. Box 5800 Albuquerque, New Mexico 87185-0834
** Fluid and Thermal Science Department Sandia National Laboratories Livermore, CA 94550-9042
Abstract
This report documents the efforts and accomplishments of the LIGA electrodeposition modeling project which was h d e d by the ASCI Materials and Physics Modeling Program. A multi-dimensional framework based on GOMA was developed for modeling time-dependent diffusion and migration of multiple charged species in a dilute electrolyte solution with reduction electro-chemical reactions on moving deposition surfaces. By combining the species mass conservation equations with the electroneutrality constraint, a Poisson equation that explicitly describes the electrolyte potential was derived. The set of coupled, nonlinear equations governing species transport, electric potential, velocity, hydrodynamic pressure, and mesh motion were solved in GOMA, using the finite- element method and a fully-coupled implicit solution scheme via Newton’s method. By treating the finite-element mesh as a pseudo solid with an arbitrary Lagrangian-Eulerian formulation and by repeatedly performing re-meshing with CUBIT and re-mapping with MAPVAR, the moving deposition surfaces were tracked explicitly from start of deposition until the trenches were filled with metal, thus enabling the computation of local current densities that potentially influence the microstructure and hctional/mechanical properties of the deposit. The multi-dimensional, multi-species, transient computational framework was demonstrated in case studies of two-dimensional nickel electrodeposition in single and multiple trenches, without and with bath stirring or forced flow. Effects of buoyancy-induced convection on deposition were also investigated. To further illustrate its utility, the framework was employed to simulate deposition in microscreen-based LIGA molds. Lastly, future needs for modeling LIGA electrodeposition are discussed.

4
Acknowledgment
This project was funded entirely by the Materials and Physics Modeling Program within
ASCI (the Accelerated Scientific Computing Initiative). We would like to thank Bob
Nilson (8752) and Stewart Griffiths (8750) for helpful discussions on LIGA
electrodeposition. Discussions with Rich Larson (8752) and Prof. Ralph Greif (UC
Berkeley) on modeling electrodeposition were very helpful. We also want to thank Randy
Schunk (9114) and other members of the GOMA team for various discussions related to
GOMA. We wish to acknowledge the contributions by Prof. Branko N. Popov of the
University of South Carolina on the study of nickel-plating-bath solution chemistry and
the nickel-plating data for model validation. Assistance by summer student intern, Justin
O’Neal, in our modeling-validation work is also appreciated.
5
Contents
1 Introduction 6
2 Governing Equations and Numerical Solution Methods 10
2.1 Species concentrations 10
2.2 Electrolyte potential 11
2.3 Velocity and hydrodynamic pressure 11
2.4 Pseudo-solid mesh nodal displacement 12
2.5 Rate of metal-ion reduction via Butler-Volmer kinetics 13
2.6 Electrical current density on deposition surface 13
2.7 Position of the moving deposition surface 13
2.8 Theoretical or maximum thickness of deposition 14
2.9 Asymptotic thickness of deposition in the dominating migration flux regime 14
2.10 Numerical solution methods, re-meshing and re-mapping 15
3 Computational Results and Discussion 15
3.1 Model geometries and electrolyte system 15
3.2 Boundary conditions 17
3.3 An example of re-meshing 18
3.4 Goma electrodeposition model verification and validation 18
3.5 Electrodeposition in absence of bath stirring 20
3.6 Effects of bath stirring 24
3.7 Effects of buoyancy-induced convection 24
3.8 Electrodeposition in microscreen-based LIGA molds 26
4 Summary and Concluding Remarks 27
5 References 30
6 Appendix – A Study of Solution Chemistry of Watts Nickel Plating
Bath in Absence of Additives and Deposition Mechanism 32
7 Distribution 41

6
1 Introduction
In recent years LIGA (LIthographie, Galvanoformung, Abformung, which are German
words for lithography, electroplating and molding) is increasingly demonstrated to be a
viable technology in fabrication of micro-devices or parts (see, e.g., Hruby 2001).
Electrodeposition is a key process in LIGA microfabrication, which consists of three
essential steps as depicted in Figure 1: i) exposing non-conducting PMMA (polymethyl-
methacrylate) molds by deep or high-energy x-ray lithography; ii) removing the exposed
PMMA in a developer bath to produce feature cavities or trenches; and iii) filling the
feature trenches with a desired metal such as nickel or an alloy such as nickel-cobalt-iron.
The widths of the feature trenches can be as small as ten microns or less whereas the
depths are on the order of hundreds to thousands of microns – this means that the
resultant aspect ratio is high. Understanding how depositing metal ions are transported
from the electrolyte bath to the bottom surfaces of the trenches is a key in fabricating
quality LIGA parts that possess the desired and uniform functional and mechanical
properties. In a LIGA electrodeposition process, an external voltage is applied between
the target-metal anode and the metal-deposit cathode under constant load or current
density. To keep the electrolyte solution well mixed and to shorten deposition time, the
electrolyte bath is usually stirred. Several sample test structures and parts made at Sandia
by LIGA microfabrication are shown in Figures 2 – 4.
Pioneering work of modeling LIGA electrodeposition was carried out by Griffiths et al.
(1998a, 1998b), who developed one- and two-dimensional numerical models describing
electrodeposition of metal into high aspect-ratio molds. On the one hand, their one-
dimensional model describes dissociation, diffusion, electromigration, and deposition of
multiple ionic species. One the other hand, their two-dimensional model focuses on
single-species transport including forced flow due to bath stirring and buoyancy-induced
natural convection due to density variations. However, none of the prior work addresses
all of these phenomena within a single fully-coupled framework and there has been no
prior modeling of the transient and moving boundary effects of importance in LIGA.
More recently, Nilson and Griffiths (2003) reported their study of transport enhancement
by buoyancy-driven convection induced by metal-ion depletion adjacent to the plating
surface. They found that significant transport enhancement may be achieved during
electrodeposition into features having depths greater than about 100 µm and that
“enhancement exceeding a factor of ten may occur in LIGA features having depths of 1
mm or more”. Hayashi et al. (2001) reported (based on their experimental observations)
that the natural convection due to density difference is effective in stirring the inside of
cavity with 200 µm width but “the natural convection is not effective for cavities smaller
than 100 µm in width”. Although these studies demonstrate the importance of
convection, there has been no prior modeling of the effects of convection on the shape of
the evolving electrodeposit.
Our efforts were motivated by the generally accepted view that computational modeling
can help to improve the understanding of these complex, coupled phenomena and aid in
elucidating the mechanisms involved in LIGA electrodeposition. Specifically, by
computing local current densities along the moving deposition surfaces, one can
potentially relate deposit microstructure (which controls the functional and mechanical
properties of the structure) to process conditions (e.g., applied current load, bath compo-

7
Figure 1. Steps involved in a typical LIGA microfabrication process (Christenson 2000).
synchrotronradiation
x-ray mask
PMMA
plating base
substrate
1) EXPOSE
6) RELEASE
4) PLANARIZE 5) REMOVE PMMA
2) DEVELOP 3) ELECTROFORM

8
(a)
(b)
Figure 2. Sample test structures made by direct LIGA microfabrication
(Chrsitenson 2000).
(a) 200 µm tall nickel structures;
(b) close-up of 5 µm nickel lines and spaces
500 µµµµm
100 µm

9
Figure 3. More sample part made by direct LIGA microfabrication – micro gear
(Christenson 2000).
Figure 4. Contact spring made from LIGA microfabrication (Good et al. 2003).
sition, pH, and temperature) and trench geometries (widths, aspect ratios), provided that
constitutive models relating current density to microstructure (e.g., grain size and
orientation) and microstructure to functional/mechanical properties are available.
In the present work, we developed a multi-dimensional framework based on GOMA (a
multi-physics multi-dimensional finite-element computer code developed and being
enhanced at Sandia National Laboratories; see Schunk et al. 1997, 2002) for modeling
time-dependent diffusion and migration of multiple charged species in a dilute electrolyte
solution with reduction electrochemical reactions on moving deposition surfaces. By

10
combining the species mass conservation equations with the electroneutrality constraint,
a Poisson equation that explicitly describes the electrolyte potential was derived. The set
of coupled, nonlinear equations governing species concentration, electric potential,
velocity, hydrodynamic pressure, and mesh motion were solved in GOMA, using the
finite-element method and a fully-coupled implicit solution scheme via Newton’s
method. By treating the finite-element mesh as a pseudo solid with an arbitrary
Lagrangian-Eulerian formulation and by repeatedly performing re-meshing with CUBIT
(a meshing toolkit developed at Sandia; see CUBIT website at
http://sass1693.Sandia.gov/cubit) and re-mapping with MAPVAR (a Sandia-developed
utility program, see Wellman 1999), the moving deposition surfaces were tracked
explicitly from start of deposition until the trenches were filled with metal, thus enabling
the computation of local current densities that influence the microstructure and
functional/mechanical properties of the deposit. The multi-dimensional, multi-species,
transient computational framework was demonstrated in case studies of two-dimensional
nickel electrodeposition in single and multiple trenches, without and with bath stirring or
forced flow. Effects of buoyancy-induced convection on deposition were also
investigated. To further illustrate its utility, the framework was employed to simulate
deposition in microscreen-based LIGA molds. Lastly, future needs for modeling LIGA
electrodeposition are discussed.
Portions of the work documented here have been reported elsewhere (Chen 2003, Chen
and Evans 2004, Evans et al. 2002). In the following, governing equations are presented
and numerical solution methods discussed in Section 2. Computational results of several
case studies are documented in Section 3. We summarize our efforts and
accomplishments, and provide comments on future work in Section 4. Lastly, a study of
solution chemistry of Watts nickel plating bath in the absence of additives and deposition
mechanism is attached as the Appendix. This study was carried out by our collaborator,
Prof. Branko Popov, at the University of South Carolina as part of a contract project with
Sandia (Popov 2002).
2 Governing Equations and Numerical Solution Methods
2.1 Species concentrations
Concentrations of individual species are described by the law of species mass
conservation with the aqueous electrolyte solution being treated as an incompressible
fluid, i.e., 0=⋅∇ u ( cf. Schunk et al. 1997, and Newman 1991 ):
iiimi rc
dt
dc=⋅∇+∇⋅−+ Juu )( (1)
for i =1,..., (n-1) with n being the total number of species; ci is the concentration of
species i, t is time, u is the mixture velocity, um is the mesh velocity, d/dt (≡ ∂/∂t + um·∇∇∇∇)
is the total time derivative, and ri is the net rate of generation or consumption from
homogeneous electrochemical reactions for species i. In Equation 1, Ji are the combined
11
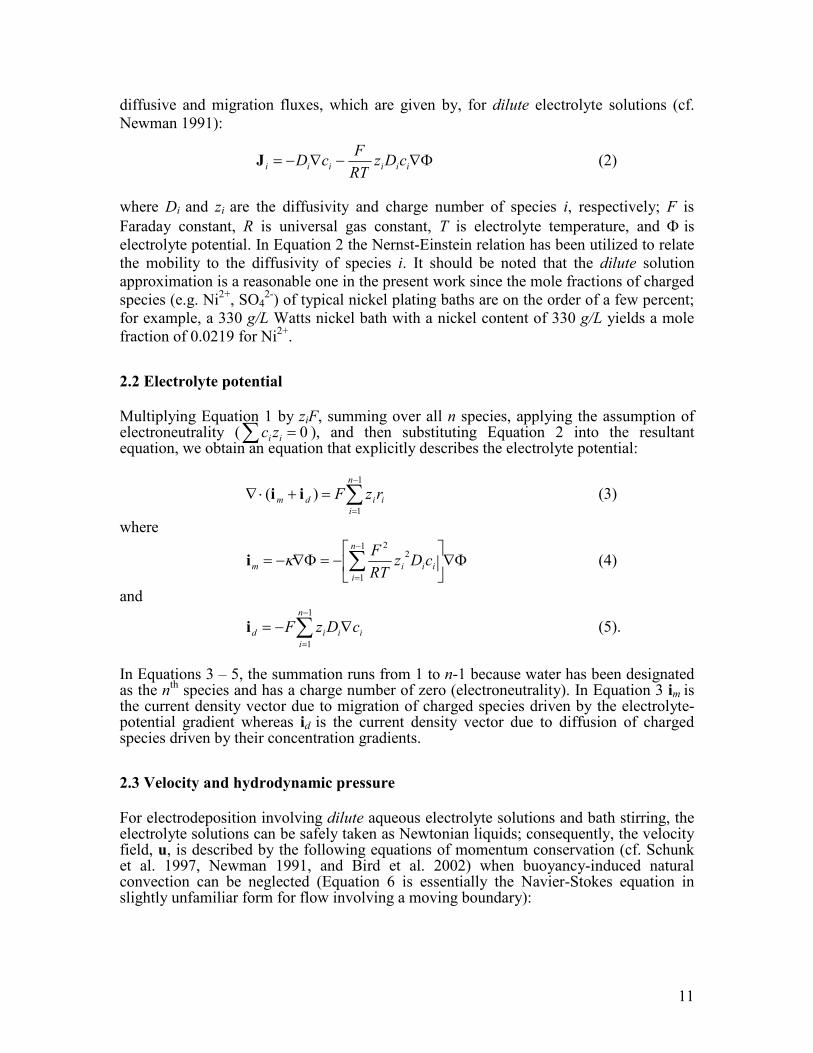
diffusive and migration fluxes, which are given by, for dilute electrolyte solutions (cf.
Newman 1991):
Φ∇−∇−= iiiiii cDzRT
FcDJ (2)
where Di and zi are the diffusivity and charge number of species i, respectively; F is
Faraday constant, R is universal gas constant, T is electrolyte temperature, and Φ is
electrolyte potential. In Equation 2 the Nernst-Einstein relation has been utilized to relate
the mobility to the diffusivity of species i. It should be noted that the dilute solution
approximation is a reasonable one in the present work since the mole fractions of charged
species (e.g. Ni2+
, SO42-
) of typical nickel plating baths are on the order of a few percent;
for example, a 330 g/L Watts nickel bath with a nickel content of 330 g/L yields a mole
fraction of 0.0219 for Ni2+
.
2.2 Electrolyte potential
Multiplying Equation 1 by ziF, summing over all n species, applying the assumption of electroneutrality (∑ = 0ii zc ), and then substituting Equation 2 into the resultant equation, we obtain an equation that explicitly describes the electrolyte potential:
∑−
=
=+⋅∇1
1
)(n
i
iidm rzFii (3)
where
Φ∇
−=Φ∇−= ∑
−
=
1
1
22n
i
iiim cDzRT
Fκi (4)
and
∑−
=
∇−=1
1
n
i
iiid cDzFi (5).
In Equations 3 – 5, the summation runs from 1 to n-1 because water has been designated as the n
th species and has a charge number of zero (electroneutrality). In Equation 3 im is
the current density vector due to migration of charged species driven by the electrolyte-potential gradient whereas id is the current density vector due to diffusion of charged species driven by their concentration gradients.
2.3 Velocity and hydrodynamic pressure
For electrodeposition involving dilute aqueous electrolyte solutions and bath stirring, the electrolyte solutions can be safely taken as Newtonian liquids; consequently, the velocity field, u, is described by the following equations of momentum conservation (cf. Schunk et al. 1997, Newman 1991, and Bird et al. 2002) when buoyancy-induced natural convection can be neglected (Equation 6 is essentially the Navier-Stokes equation in slightly unfamiliar form for flow involving a moving boundary):
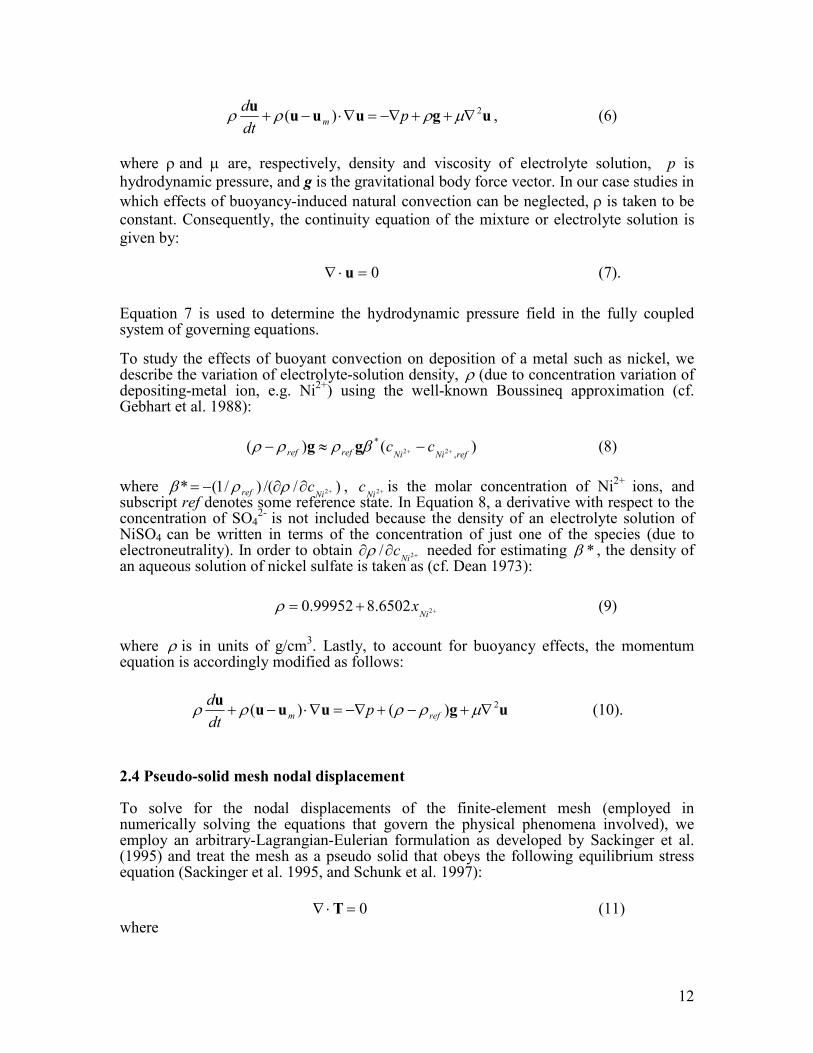
12
uguuuu 2)( ∇++−∇=∇⋅−+ µρρρ pdt
dm , (6)
where ρ and µ are, respectively, density and viscosity of electrolyte solution, p is
hydrodynamic pressure, and g is the gravitational body force vector. In our case studies in
which effects of buoyancy-induced natural convection can be neglected, ρ is taken to be
constant. Consequently, the continuity equation of the mixture or electrolyte solution is
given by:
0=⋅∇ u (7).
Equation 7 is used to determine the hydrodynamic pressure field in the fully coupled system of governing equations.
To study the effects of buoyant convection on deposition of a metal such as nickel, we describe the variation of electrolyte-solution density, ρ (due to concentration variation of depositing-metal ion, e.g. Ni
2+) using the well-known Boussineq approximation (cf.
Gebhart et al. 1988):
)()(,
*22 refNiNirefref cc ++ −≈− βρρρ gg (8)
where )//()/1(* 2+∂∂−=Niref cρρβ , +2Ni
c is the molar concentration of Ni2+
ions, and subscript ref denotes some reference state. In Equation 8, a derivative with respect to the concentration of SO4
2- is not included because the density of an electrolyte solution of
NiSO4 can be written in terms of the concentration of just one of the species (due to electroneutrality). In order to obtain +∂∂ 2/
Nicρ needed for estimating *β , the density of
an aqueous solution of nickel sulfate is taken as (cf. Dean 1973):
++= 26502.899952.0Ni
xρ (9)
where ρ is in units of g/cm3. Lastly, to account for buoyancy effects, the momentum
equation is accordingly modified as follows:
uguuuu 2)()( ∇+−+−∇=∇⋅−+ µρρρρ refm pdt
d (10).
2.4 Pseudo-solid mesh nodal displacement To solve for the nodal displacements of the finite-element mesh (employed in numerically solving the equations that govern the physical phenomena involved), we employ an arbitrary-Lagrangian-Eulerian formulation as developed by Sackinger et al. (1995) and treat the mesh as a pseudo solid that obeys the following equilibrium stress equation (Sackinger et al. 1995, and Schunk et al. 1997):
0=⋅∇ T (11)
where

13
IEET )(2 trmm λµ += (12)
and
[ ]T)()(2
1ddE ∇+∇= (13).
In the above equations d is the mesh displacement vector, I is the identity matrix, and
µm and λm are the Lame elastic coefficients, which are related to the familiar Young’s
modulus and Poisson ratio of the pseudo solid.
2.5 Rate of metal-ion reduction via Butler-Volmer kinetics
The rate of reduction reaction for metal-ion species i is taken to be described by the
Butler-Volmer kinetics (cf. Newman 1991, Pollard and Newman 1981):
−=
−Φ−−−Φ− )()( ,0,,0, iiciiai
UVRT
FUV
RT
F
iii eeckrααβ
(14),
where ki, βι, αa,i, and αc,i are, respectively, the rate constant, reaction order, anodic
transfer coefficient and cathodic transfer coefficient of metal-ion species i; U0,i is the
thermodynamic open-circuit potential of the reduction reaction involving metal-ion
species i. V is the external voltage applied to the cathode (i.e., deposition surface).
2.6 Electrical current density on deposition surface
Using Faraday’s law the electrical current density normal to the deposition surface can be
computed as follows:
∑∑==
=⋅=⋅m
i
ii
m
i
i Frz11
)( inin (15)
where i is the total current density whereas ii denotes the partial current density for metal-ion species i, n is a unit vector normal to the deposition surface, and m is the total number of reducible metal ions present in the electrolyte solution.
2.7 Position of the moving deposition surface
The position of the moving deposition surface is determined by local mass balances on the metal being deposited at the surface. For pure nickel metal deposition, which is the focus of the present work, local mass balance on the nickel at the surface yields:

14
iN
iN
iN
ms rM
dt
dh
ρ=−⋅= )( uun (16)
where h is the displacement or movement normal to the moving deposition surface relative to a mesh moving with local velocity um, n is unit vector normal to the deposition surface, and us is velocity of the deposition surface; Niρ is the density of the nickel deposit,
iNM is the molecular weight of the nickel deposit, and iNr is the molar rate of
Ni2+
reduction as given by Equation 14.
2.8 Theoretical or maximum thickness of deposition
The theoretical or maximum thickness of nickel deposition can be obtained from Faraday’s law under the supposition of a current efficiency of 100%:
F
tiM
Fz
tiMh ave
Ni
Ni
NiNi
aveNi
22
0ρρ
==+
(17) where h0 denotes the theoretical or maximum deposition thickness; iave is average applied current density; t is deposition time; and
+2Niz is the charge number for Ni
2+ ions
( )22 ≡+Niz . Using NiM = 58.71 g/mole, Niρ = 8.9 g/cm
3, and we obtain a simple equation
for the maximum achievable thickness of nickel deposition:
h0 = 3.42x10⁻⁵iavet (18).
In Equation 18 h0 is in units of cm; iave is in units of A/cm
2; and t is in units of seconds. It
is informative to find from Equation 18 the theoretical or minimum time needed to deposit 1 mm thick nickel metal. Using an average current density of 50 mA/cm
2, it takes
a minimum of 16.2 hours to achieve a 1 mm thick nickel deposit. Of course, it takes longer in practice since electrode efficiencies are less than 100% and transport resistance is significant, particularly for deposition in deep trenches.
2.9 Asymptotic thickness of deposition in the dominating migration flux regime
When migration flux dominates over diffusion flux (as is the case when deposition operates at sufficiently high current densities and species concentration gradient is small), the flux for Ni
2+ can be obtained from Equation 2 by dropping the diffusive-flux term:
Φ∇−=Φ∇−≈++
++++
RT
cFDcDz
RT
F NiNi
NiNiNiNi
22
2222
2J (19).
From Equation 4, we have:
κκavem ii
−≈−=Φ∇ (20)
where )(
4)( 2
42
422
2
22
2
211
2
1
22
1
22
−−++ +=+==∑=
SOSONiNii
iii cDcDRT
FcDzcDz
RT
FcDz
RT
Fκ (21).

15
Substituting Equation 21 into Equation 20 and then into Equation 19 yields:
)(2 2
42
422
22
2
−−++
++
+
+≈
SOSONiNi
NiNiave
Ni cDcDF
cDiJ (22).
Now, electroneutrality (∑ = 0ii zc ) demands that −+ = 2
42
SONicc , consequently Equation
22 reduces to:
)(2 2
42
2
2
−+
+
+
+≈
SONi
Niave
Ni DDF
DiJ (23).
Using the fact that one mole Ni
2+ ions produces one mole of Ni, assuming that
+2NiJ remains constant during the course of deposition, and making use of Faraday’s law, we arrive at an approximate expression for the nickel deposition thickness in the regime of dominating migration flux:
)(2 2
42
2
1−+
+
+≈
SONi
Niave
Ni
Ni
DD
D
F
tiMh
ρ (24).
2.10 Numerical solution method, re-meshing and re-mapping The governing equations (1) – (5), (6) – (7) or (8) – (10), and (11) – (14) are solved in GOMA, using i) finite-element discretization with structured/unstructured meshes generated by CUBIT (see [4]); ii) Galerkin weighted residuals with quadratic basis function for species concentrations, electrolyte potential, velocity, pressure, and nodal displacement unknowns; iii) a fully-coupled implicit solution scheme via Newton’s method; adaptive time-step control (Adams-Bashforth predictor, Moulton corrector); and parallel computing employing an iterative solver for the solution of the resultant bAx = matrix-vector equations. Further details on the numerical solution method can be found in the GOMA user’s guide (Schunk et al. 1997, Schunk et al. 2002). Results presented in this paper were all computed on a 48-processor network of 400 MHz Sun Workstations using eight processors. To handle the dramatic reduction in the depth of trench-like electrolyte domain(s) and to avoid mesh distortion, we perform re-meshing every 10 – 20 time steps (depending on process conditions and whether or not the deposition surface is approaching the top of the trench) using CUBIT. Solution variables were mapped from the old mesh to the new mesh using MAPVAR. We automated the process of re-meshing and re-mapping using a Unix script.
3. Computational Results and Discussion 3.1 Model geometry and electrolyte system Figure 5 shows the single-trench model geometry used in our studies, which consists of a
1cm x 1cm square electrolyte bath and a 1mm x 1mm square trench. Figure 6 displays the
two-trench model geometry, which consists of a 1cm x 2cm rectangular electrolyte bath, a

1 cm
anode
1 cm
Fi
16
cathode
1 mm x mm trench
Figure 5. Model geometry of LIGA electrodeposition in a single trench – initial finite
element mesh employed in the case study simulations.
anode anode
gure 6. Model geometry of LIGA electrodeposition in two trenches – initial finite
element mesh employed in the case study simulations.
2 cm
1 cm
1mm x 1mm trench (1:1)
1mm x 0.2mm
trench (5:1)
17
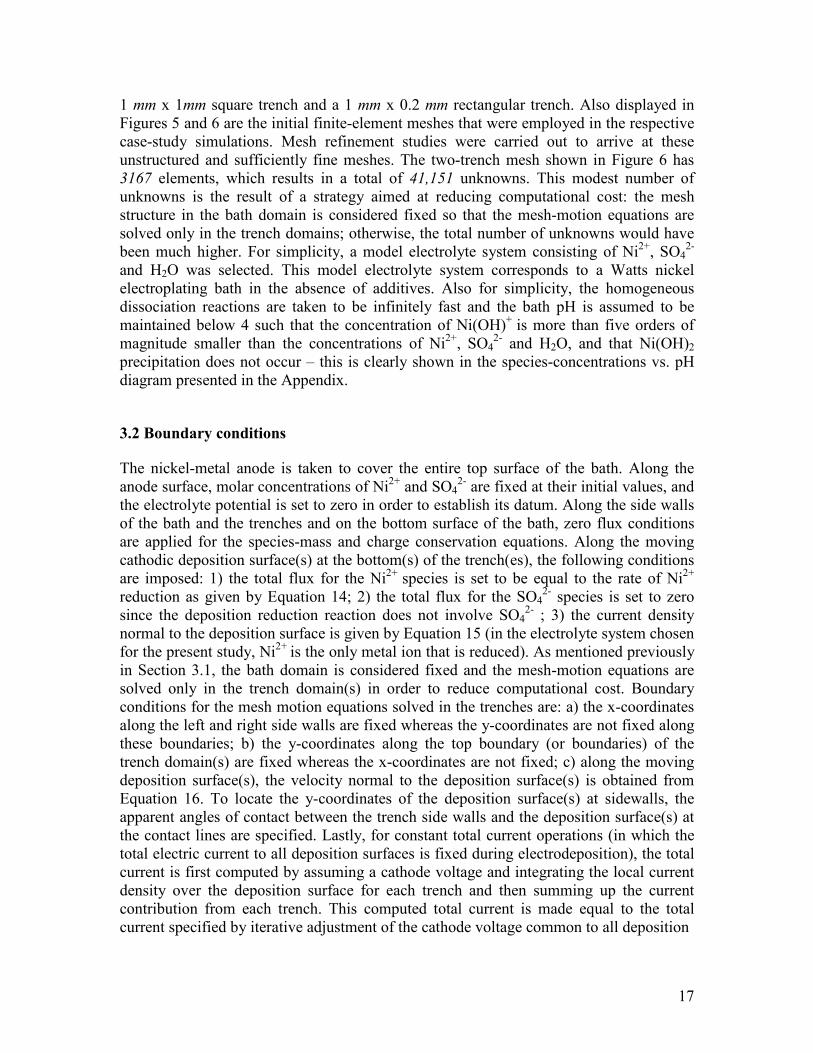
1 mm x 1mm square trench and a 1 mm x 0.2 mm rectangular trench. Also displayed in
Figures 5 and 6 are the initial finite-element meshes that were employed in the respective
case-study simulations. Mesh refinement studies were carried out to arrive at these
unstructured and sufficiently fine meshes. The two-trench mesh shown in Figure 6 has
3167 elements, which results in a total of 41,151 unknowns. This modest number of
unknowns is the result of a strategy aimed at reducing computational cost: the mesh
structure in the bath domain is considered fixed so that the mesh-motion equations are
solved only in the trench domains; otherwise, the total number of unknowns would have
been much higher. For simplicity, a model electrolyte system consisting of Ni2+
, SO42-
and H2O was selected. This model electrolyte system corresponds to a Watts nickel
electroplating bath in the absence of additives. Also for simplicity, the homogeneous
dissociation reactions are taken to be infinitely fast and the bath pH is assumed to be
maintained below 4 such that the concentration of Ni(OH)+
is more than five orders of
magnitude smaller than the concentrations of Ni2+
, SO42-
and H2O, and that Ni(OH)2
precipitation does not occur – this is clearly shown in the species-concentrations vs. pH
diagram presented in the Appendix.
3.2 Boundary conditions
The nickel-metal anode is taken to cover the entire top surface of the bath. Along the
anode surface, molar concentrations of Ni2+
and SO42-
are fixed at their initial values, and
the electrolyte potential is set to zero in order to establish its datum. Along the side walls
of the bath and the trenches and on the bottom surface of the bath, zero flux conditions
are applied for the species-mass and charge conservation equations. Along the moving
cathodic deposition surface(s) at the bottom(s) of the trench(es), the following conditions
are imposed: 1) the total flux for the Ni2+
species is set to be equal to the rate of Ni2+
reduction as given by Equation 14; 2) the total flux for the SO42-
species is set to zero
since the deposition reduction reaction does not involve SO42-
; 3) the current density
normal to the deposition surface is given by Equation 15 (in the electrolyte system chosen
for the present study, Ni2+
is the only metal ion that is reduced). As mentioned previously
in Section 3.1, the bath domain is considered fixed and the mesh-motion equations are
solved only in the trench domain(s) in order to reduce computational cost. Boundary
conditions for the mesh motion equations solved in the trenches are: a) the x-coordinates
along the left and right side walls are fixed whereas the y-coordinates are not fixed along
these boundaries; b) the y-coordinates along the top boundary (or boundaries) of the
trench domain(s) are fixed whereas the x-coordinates are not fixed; c) along the moving
deposition surface(s), the velocity normal to the deposition surface(s) is obtained from
Equation 16. To locate the y-coordinates of the deposition surface(s) at sidewalls, the
apparent angles of contact between the trench side walls and the deposition surface(s) at
the contact lines are specified. Lastly, for constant total current operations (in which the
total electric current to all deposition surfaces is fixed during electrodeposition), the total
current is first computed by assuming a cathode voltage and integrating the local current
density over the deposition surface for each trench and then summing up the current
contribution from each trench. This computed total current is made equal to the total
current specified by iterative adjustment of the cathode voltage common to all deposition

18
(a) (b)
(c) (d)
Figure 7. Mesh topology employed at four different deposition times (a) 1 second; (b) 10 hours; (c) 19 hours; and (d) 29 hours.
surfaces. This iteration is accomplished by augmenting a total specified current constraint
to the overall matrix system of equations.
3.3 An example of re-meshing Figure 7 shows an example of re-meshing in the trench and its vicinity in the case of single-trench deposition. As clearly displayed in Figure 7, the trench height or depth shrinks as time increases and the number of rows of elements are accordingly reduced. Initially (at 1 second), 21 rows of elements were called for along the y-axis whereas only four rows of elements were needed toward the end of deposition (at 29 hours).
3.4 Goma electrodeposition model verification and validation To verify that the GOMA electrodeposition model works properly, we first check if the electroneutrality constraint is satisfied. For the chosen electrolyte model system that consists of Ni
2+, SO4
2-, and H2O, electroneutrality requires that the concentrations of Ni
2+
(species 1) and SO42-
(species 2) be equal. Figure 8 shows the species concentration profiles (from the top bath surface to the deposition surface) computed by GOMA for one-dimensional electrodeposition after 25 hours of deposition. Clearly from Figure 8, the electroneutrality constraint is completely satisfied since the concentrations of Ni
2+
(species 1) and SO42-
(species 2) are identical from the top bath surface to the deposition
19
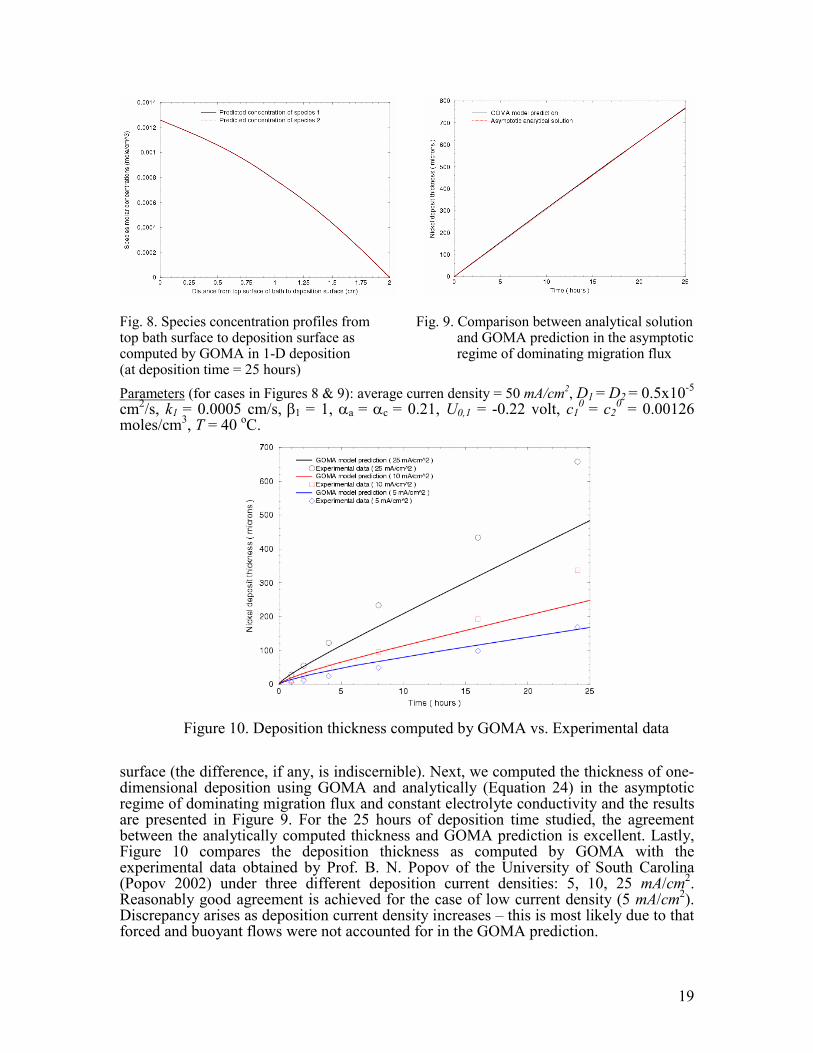
Fig. 8. Species concentration profiles from Fig. 9. Comparison between analytical solution top bath surface to deposition surface as and GOMA prediction in the asymptotic computed by GOMA in 1-D deposition regime of dominating migration flux (at deposition time = 25 hours)
Parameters (for cases in Figures 8 & 9): average curren density = 50 mA/cm2, D1 = D2 = 0.5x10
-5
cm2/s, k1 = 0.0005 cm/s, β1 = 1, αa = αc = 0.21, U0,1 = -0.22 volt, c1
0 = c2
0 = 0.00126
moles/cm3, T = 40
oC.
Figure 10. Deposition thickness computed by GOMA vs. Experimental data
surface (the difference, if any, is indiscernible). Next, we computed the thickness of one-dimensional deposition using GOMA and analytically (Equation 24) in the asymptotic regime of dominating migration flux and constant electrolyte conductivity and the results are presented in Figure 9. For the 25 hours of deposition time studied, the agreement between the analytically computed thickness and GOMA prediction is excellent. Lastly, Figure 10 compares the deposition thickness as computed by GOMA with the experimental data obtained by Prof. B. N. Popov of the University of South Carolina (Popov 2002) under three different deposition current densities: 5, 10, 25 mA/cm
2.
Reasonably good agreement is achieved for the case of low current density (5 mA/cm2).
Discrepancy arises as deposition current density increases – this is most likely due to that forced and buoyant flows were not accounted for in the GOMA prediction.

20
(a) (b) (c)
Figure 11. Computed contours of electrolyte potential & position of deposition surface in nickel deposition with a single trench: (a) 5 hours; (c) 20 hours; (c) 30 hours.
3.5 Electrodeposition in absence of bath stirring
Nickel deposition in a single trench. Figure 11 shows the computed electrolyte potential
and position of the moving deposition surface in nickel deposition with a single trench in
the absence of bath stirring at three different times: 5, 20, and 30 hours (when the trench
is filled). The parameters used in the computations are (subscripts 1 and 2 denote Ni2+
and SO42-
, respectively): µm = 1, λm = 0.1, D1 = D2 = 10-5
cm2/s, k1 = 0.0001 cm/s, β1 = 1,
αa = αc = 0.21, V = -0.6 volt, U0,1 = -0.22 volt, c10 = c2
0 = 0.00126 moles/cm
3, T = 40
oC,
θc (contact angle at side walls) = 90o. Since the cathode (i.e., deposit) potential is fixed at
-0.6 volt so this is a constant voltage operation. In Figure 11, colors in the bath and trench
regions indicate electrolyte potential levels with red (top of the bath) denoting the datum
(i.e., Φ = 0) and light blue (deposition surface) referring to the most negative value of Φ.
The black regions indicate the nickel deposit. As shown in Figure 11, electrolyte potential
becomes increasingly more negative from the anode (top of bath) to the cathode
(deposition surface), which creates a positive potential gradient for charge-species
migration. Moreover, the deposition surface is essentially flat at early times of deposition
but it then becomes increasingly curved as deposition approaches the top of the trench.
Figure 12a shows concentration profiles of Ni2+
(species 1) and SO42-
(species 2) at time = 20 hours whereas Figure 12b displays species concentrations at the center and side walls of the single trench of the deposition surface as a function of time. Parameters used here are the same as those in Figure 11. That the concentrations of species 1 and 2 are equal indicates that the electroneutrality constraint is perfectly met and that the governing equations are solved properly. As expected, the concentration of species 1 (Ni
2+)
decreases from the anode surface to the cathodic deposition surface due to the reduction reaction in which Ni
2+ is consumed.
Figure 13 shows the computed Ni2+
current density on the single-trench deposition
surface (at the center and side walls) as a function of time. Parameters used here are the
same as those in Figure 11. As can be seen clearly, current density is fairly uniform along
deposition surface for the first 14 hours or so of electrodeposition (the trench is about
40% filled at this point). As the trench is filled to beyond 40%, the current density at the
center of the deposition surface decreases whereas it increases at side walls. It is expected
that microstructure (e.g., grain size) of nickel deposit will vary from the center to the side

Distance from top bath surface to deposition surface (cm) Time (hours)
(a) (b)
Figure 12. Computed species concentrations (single trench): (a) concentr h and trench centerline at 20 hours; (b) concentration as a funct deposition surface. Parameters here are the same as those in F
Figure 13. Computed Ni2+
current density on deposition surface vs. time
walls of the trench due to variation in current density. Though at pr
models are still lacking to relate deposit grain size to current density, p
current density at the deposition surface, it is well known that grain
dependent on the alloy composition which in turn, depends upon the cu
shown in Figure 14, the yield stress of nickel deposit inversely varies w
size – the smaller the grain size, the higher the yield stress. In practic
grain size can be reduced by the use of grain-refinement additives such
pulse plating (e.g., Goods et al. 2003).
At sidewalls
of trench
At center of trench
At sidewalls
of trench
At center of
trench
ations along bat
21
ion of time at igure 11.
(single trench).
esent constitutive
articularly to the
size is strongly
rrent density. As
ith deposit grain
e, nickel deposit
as saccharin and

22
Figure 14. Yield stress as a function of nickel grain size (Ebrabimi et al. 1999, courtesy of Steve Goods (8754))
(a) (b)
(c) (d)
Figure 15. Computed contours of electrolyte potential and position of deposition
surfaces ( two trenches ).
(a) 1 second; (b) 5 hours; (c) 13 hours; (d) 16 hours.

23
Fig. 16a. Computed Ni2+
current density at Fig. 16b. Computed Ni2+
current density the deposition surfaces as a function of time at the deposition surfaces as a function for both trenches – constant voltage operation of time – constant total current operation
Nickel deposition in two trenches. Figure 15 displays the electrolyte potential field and
positions of deposition surfaces in nickel deposition with two trenches in the absence of
bath stirring at four different times: at one second and at five, thirteen, and sixteen hours.
Parameters used in the computation are the same as those for Figure 11, and similarly
since the cathode (i.e., deposit) potential is fixed at -0.6 volt so this is a constant voltage
operation. Colors in the bath and trench regions indicate electrolyte potential levels with
red (top of the bath) denoting the datum (i.e., Φ = 0) and light blue (deposition surface)
referring to the most negative value of Φ. The black regions indicate the nickel deposit.
The electrolyte potential becomes increasingly more negative from the anode (top of
bath) to the cathodes (deposition surfaces), creating the potential gradients necessary for
current flow. For the process conditions and trench geometry chosen, it takes about 16
hours for the narrow trench to fill (Figure 15.d) whereas it takes about 30 hours for the
wide trench to be completely filled. Although not apparent in Figure 15, the deposition
surfaces are essentially flat at early times of deposition but they then become increasingly
curved as deposited material approaches the tops of the trenches.
In Figure 16a, computed Ni2+
current density at the center of the narrow trench (with a
5:1 height-to-width aspect ratio) is compared with that of the wide trench under constant
voltage operation with process parameters being the same as those for Figure 11. Clearly,
the current density for the narrow trench is consistently higher than that for the wide
trench, and this difference is more evident as deposition proceeds and approaches the top
of the trenches – this explains why the narrow trench needs only about 16 hours to fill
whereas the wide trench requires about 30 hours. Due to the different current densities,
the microstructure of the deposit in the narrow trench may differ from that in the wide
trench, which may result in differences in the mechanical properties of the deposits
formed, particularly near the tops of the trenches.
Figure 16b shows a case of constant total current operation in which the total current applied is held at 1.8 mA (which gives an average current density of 15 mA/cm
2). The
parameters used in the computations are the same as those for Figure 16a except here k1 = 0.0001 cm/s and the cathode or deposit potential varies to accommodate a constant total current of 1.8 mA, which is supplied to the deposition surfaces in both trenches.

24
3.6 Effects of bath stirring
The effects of bath stirring on nickel electrodeposition in the 1 mm x 1 mm wide trench
are illuminated in Figure 17 (in which the computed velocity field within the trench and
immediately outside at six different times is shown) and Figure 18 (in which the
computed streamlines both within and outside the trench at four different times are
shown). Along the anode surface, the horizontal and vertical velocity components are set
to 2 cm/s and 0, respectively. The no-slip condition is imposed on the side walls of the
bath and trench. Other parameters are the same as those in Figure 15, except that here k1 =
0.0005 cm/s and a current density of 50 mA/cm2
is imposed on the deposition. As can be
seen in Figure 18, only one re-circulation loop is present at the start of deposition
whereas two re-circulations are present when the trench is about 65% filled.
Approximately 18 hours are required to completely fill the trench as compared with about
24 hours in the absence of bath stirring, resulting in a desirable 25% speed up in
deposition time. However, bath stirring also results in an undesirable curved deposition
surface (i.e., local non-uniformity) as can be seen from Figures 17.f and 18.d .
3.7 Effects of buoyancy-induced convection
Effects of buoyancy-induced convection on the deposition process was investigated and
the computed results are displayed in Figures 19 and 20. To simplify our analysis, only
the trench domain was considered and the boundary conditions imposed at the top of the
trench surface were: 1) horizontal velocity component was set at 1 cm/s whereas the
vertical velocity component was set to zero; 2) molar concentrations of Ni2+
and SO42-
were fixed at 0.00126 moles/cm3. The other parameters were the same as those used for
(a) (b) (c)
(d) (e) (f)
Figure 17. Effect of bath stirring on a single-trench deposition: velocity fields in the
trench and its vicinity. (a) 1 second; (b) 5 hours; (c) 10 hours;
(d) 12 hours; (e) 14 hours; and (f) 16 hours.

25
(a) (b)
(c) (d)
Figure 18. Effect of bath stirring on a single-trench deposition: streamlines in the trench
and its vicinity. (a) 1 second; (b) 5 hours; (c) 12 hours; (d) 16 hours.
(a) (b)
Figure 19. Effects of buoyancy on nickel electrodeposition: velocity vectors.
(a) t = 15 seconds; (b) t = 360 seconds.
Parameters: velocity at top surface – 0.01 m/s; 1 mm by 1 mm trench.
Other parameters are the same as those for Figure 11.

26
(a) (b)
Figure 20. Effects of buoyancy on nickel electrodeposition: Ni2+
ions concentration
contours. (a) t = 15 seconds; (b) t = 360 seconds.
Parameters: velocity at top surface – 0.01 m/s; 1 mm by 1 mm trench.
Other parameters are the same as those for Figure 11.
Figure 11. Figures 19 and 20 show, respectively, the velocity vectors and Ni2+
ion
concentration at two different times: 15 seconds and 360 seconds. From Figure 19, it is
seen that fresh electrolyte solution is drawn from the center of the top surface and moves
toward the bottom deposition surface whereas spent electrolyte solution rises upward
near the side walls. Six minutes later, flow structure in the trench has changed
significantly: two horizontal circulation cells have formed at 360 seconds as compared
with one vertical cell at 15 seconds. A separate study in which longer deposition (up to
1650 seconds) was simulated though the horizontal velocity component imposed at the
top surface was smaller (0.01 cm/s) was carried out and the results are documented
elsewhere (Evans et al. 2002). In both studies, numerical instability in the form of
wiggles at the deposition surface near the contact lines were observed when velocity at
the top surface was raised or simulated deposition time was increased. Gradual mesh
refinement did help alleviate the wiggle problem to a certain extent but eventually
wiggles would appear at the deposition surface near the contact lines when sufficiently
large velocity was imposed at the top surface of the trench or when long enough
simulated deposition was carried out. Subsequent discussions with Prof. Thomas Hughes
(who is an internationally renowned authority in computational mechanics and currently
a professor of Aerospace and Engineering Mechanics at UT Austin) on this issue reveal
that a variational multiscale formulation is required to resolve at a fine scale the wiggles
(or numerical instabilities) appearing on the deposition surface though such studies await
future efforts.
3.8 Electrodeposition in a microcreen-based LIGA mold
A novel process that enables the rapid and economical replication of plastic
electroforming molds was developed recently by Domeier et al. (2002) at Sandia

27
National Laboratories. This process employs the hot embossing or the injection molding
technique to force a metal microscreen into a softened thermoplastic disk to produce
sacrificial electroforming molds with conducting metal bases and insulating sidewalls.
Figure 21 shows a schematic of mold replication by hot embossing through a microscreen
(Domeier et al. 2002). Figures 23 and 24 show the simulated effects of mold geometry
(in terms of elevation of the conducting microscreen metal relative to the insulating
polymethylmethacrylate or PMMA plastic) on deposition uniformity in the absence of
bath stirring. In both calculations the modeled portion of the mold has a plating substrate
comprised of two 50 µm wide metal electrode sections separated by a 100 µm PMMA
insulator. Thus, in view of the symmetry conditions applied on the model sidewalls, the
results apply to the infinite array of 100 µm electrodes separated by 100 µm PMMA
insulators. Other parameters used in the computation are: µm = 1, λm = 0.1, D1 = D2 = 10-5
cm2/s, k1 = 0.000005 cm/s, βST= 1, αa = αc = 0.21, I = 0.3 mA, U0,1 = -0.22 volt, c1
0 = c2
0 =
0.00126 moles/cm3 and T = 40º C. Here I is the total applied electric current; for I = 0.3
mA, an average current density of 15 mA/cm2 (based on the microscreen metal areas) is
applied to the deposition process. In Figure 23 the microscreen metal is elevated relative
to the base PMMA whereas in Figure 24 the base PMMA is elevated relative to the
microscreen metal. The computations indicate that dimples will be formed on the deposit
surface when the microscreen metal is elevated relative to the base PMMA (Figure 23);
this prediction is born out by experimental observation shown in Figure 22. On the other
hand, the deposit surface is essentially flat when the base PMMA is elevated relative to
the microscreen metal (Figure 24). Thus, mold geometry appears to have an important
effect on the deposition uniformity, which in turn may affect microstructure and
functional/mechanical properties of the deposit.
4 Summary and Conclusions
Two dimensional processes of nickel electrodeposition were simulated using a
framework that is based on the finite-element method and a fully coupled implicit
solution scheme via Newton’s technique. By coupling an ALE (arbitrary-Lagrangian-
Eulerian) pseudo-solid mesh-motion formulation with repeated re-meshing and re-
mapping, the evolving deposition surfaces were tracked and current densities (or rates of
deposition) along deposition surfaces were computed. The relatively large computed
variations in current density may cause significant variations in the microstructure and
functional/mechanical properties of the deposit. The effects of bath stirring were also
investigated; it was found that bath stirring can effectively reduce deposition time but
also results in curved deposition surface(s) (and thus locally non-uniform rates of
deposition). The Effect of buoyancy-induced convection on nickel electrodeposition was
examined. Our preliminary results show that buoyancy strongly affects flow-field
structure, and incorporating buoyancy in our computation model results in a much more
stiff and challenging numerical problem to solve. More specifically, the numerical
instability encountered when buoyancy is incorporated may be resolved by employing a
variational multiscale formulation but such investigation awaits future efforts. Lastly,
deposition in microscreen-based LIGA molds was simulated and it was discovered: i)
elevating microscreen metal relative to adjacent base PMMA results in a deposit with

28
100µm 100µm
Fig. 21. Schematic of mold replication by Fig. 22. Dimple deposit formed over
hot embossing through a microscreen. a PMMA-filled microscreen hole.
(Reference: Domeier et al. 2002) (Reference: Morales A. M. et al. 2003)
300 µm
microscreen metal microscreen metal microscreen metal
(a) (b)
Figure 23. Electrodeposition in a microscreen-based LIGA mold — microscreen metal
regions are elevated relative to insulating PMMA areas.
(a) at time = 0; (b) at time = 9.8 hours.
PMMA-filled microscreen hole
contours of electrolyte potential contours of electrolyte potential
electrodeposited nickel

29
(a) (b)
Figure 24. Electrodeposition in a microscreen-based LIGA mold — insulating PMMA
regions are elevated relative to microscreen metal areas.
(a) at time = 0; (b) at time = 9.8 hours.
dimples, which is born out by experimental observation; and ii) elevating base PMMA
relative to microscreen metal yields a nearly flat deposition surface, in which case the
functional/mechanical properties may be essentially uniform.
The work reported here is part of a larger effort that aims at developing a model-based
predictive computational capability at Sandia National Laboratories for simulating
electrodeposition in LIGA microfabrication. Ongoing and future efforts include: 1)
incorporating homogeneous (e.g., dissociation reactions, precipitation of Ni(OH)2+
) and
additional heterogeneous reactions (e.g., hydrogen generation) to study effects of
electrolyte-solution pH and bath additives; 2) modeling alloy (e.g., Ni-Co) deposition; 3)
determining effects of trench aspect ratio on current distribution; 4) studying effects of
pulse plating on deposition dynamics and current distribution; 5) investigating effects of
the use of insulating shields and location of anodes on current distribution; 6) developing
models to relate deposit microstructure (e.g., grain size and orientation) to deposition
current density; this will help us to better relate functional/mechanical properties of metal
or alloy deposits to process conditions and bath chemistry; and 7) extending the
application to the high aspect ratios (feature depth/width) of great importance to LIGA.
PMMA
electrodeposited nickel
PMMA
microscreen metal
100 µm 100 µm
300 µm
contours of electrolyte potential contours of electrolyte potential
microscreen metal microscreen metal

30
5 References
Bird, R. B., Stewart, W. E., and Lightfoot, E. N., Transport Phenomena, Second Edition, John Wiley & Sons, New York (2002). Chen, K. S., “Modeling electrodeposition in LIGA microfabrication using an arbitrary-Lagrangian-Eulerian formulation for moving boundary tracking with repeated re-meshing”, In Moving Boundaries VII: Computational Modeling of Free and Moving Boundary Problems, edited by Mammoli, A. A. and Brebbia, C. A., WIT Press Southampton, Boston, pp. 245 – 255 (2003). Chen, K. S. and Evans, G. H., “Two-dimensional modeling of nickel electrodeposition in LIGA microfabrication”, Microsystem Technologies (2004), in press. Christenson, T., private communication (2000). CUBIT, Version 8.0, Sandia National Laboratories (2003), URL: http://endo.sandia.gov/cubit . Dean, J. A. (ed.), Lange’s Handbook of Chemistry, 11
th edition, McGraw-Hill, New York
(1973). Domeier, L. A., Gonzales, M., Hachman, J., Hruby, J. M., Janek, R., and Morales, A. M., “Microscreen-based replication of electroforming micromolds”, Microsystem Technologies, 8, p.78-82 (2002). Evans, G. H., Chen, K. S., Larson, R. S., and Greif, R., “Forced and buoyancy-induced convection in LIGA electrodeposition”, in Proceedings of the Twelfth International Heat Transfer Conference held in Grenoble, France, August 18 – 23, 2002. Edited by Jean Taine (2002). Hruby, J. M., “LIGA technologies and applications”, MRS Bulletin, April 2001. Gebhart, B., Jaluria, Y., Mahajan, R. L., Sammakia, B., Buoyancy-Induced Flows and Transport, Textbook Edition, Hemisphere Publishing Corporation, New York, p.23 (1988). Goods, S. H., Kelly, J. J., and Yang, N. Y. C., “Electrodeposited nickel-manganese: an alloy for microsystem applications”, paper presented at the Fifth International Workshop on High Aspect Ratio Micro Structure Technology, HARMST’03, Monterey Plaza Hotel, Monterey, CA, June 15 – 17, 2003. Also to appear in Microsystem Technologies. Griffiths, S. K., Nilson, R. H., Ting, A., Bradshaw, R. W., Bonivert, W. D., and Hruby, J. M., “Modeling electrodeposition for LIGA microdevice fabrication”, Microsystem Technologies, 4, pp. 98 - 101 (1998a). Griffiths, S. K., Nilson, R. H., Bradshaw, R. W., Ting, A., Bonivert, W. D., Hachman, J. T., and Hruby, J. M., “Modeling electrodeposition for LIGA microdevice fabrication”, Sandia Technical Report SAND98-8231 (1998b). Hayashi, K., Fukui, K., Tanaka, Z., and Konko, K., “Shape evolution of electrodeposition bumps into deep cavities”, J. Electrochem. Soc., 148, C145 – C148.

31
Morales, A. M., Domeier, L. A., Gonzales, M., Hachman, J., Hruby, J. M., Goods, S. H., McLean, D. E., Yang, N., Gardea, A. D., “Microstructure and mechanical properties of nickel microparts electroformed in replicated LIGA molds”, SPIE Proceedings, 4979: 440-447. Newman, J. S., Electrochemical Systems, Second Edition, Prentice Hall, Inc., Englewood Cliffs, New Jersey (1991). Nilson, R. H. and Griffiths, S. K., “Natural convection in trenches of high aspect ratio”, J. Electrochem. Soc., 150, C401 – C412. Polard, R. and Newman, J., “Mathematical modeling of the litium-aluminum, iron sulfide battery I. Galvanostatic discharge behavior”, J. Electrochem. Soc., 128, 491 – 502. Popov, B. N., “Electrodeposition of thin films of Ni in presence of organic additives”, final report submitted to Sandia, April 2002. Sackinger, P. A., Schunk, P. R., and Rao, R. R., A Newton-Raphson pseudo-solid domain mapping technique for free and moving boundary problems: a finite-element implementation, J. Comp. Phys., 125, p. 83-103 (1995). Schunk, P. R., Sackinger, P. A., Rao, R. R., Chen, K. S., Cairncross, R. A., Baer, T. A., Labreche, D. A., “GOMA 2.0 - a full-Newton finite element program for free and moving boundary problems with coupled fluid/solid momentum, energy, mass, and chemical species transport: user’s guide”, Sandia Technical Report SAND97-2404 (1997). Schunk, P. R., Sackinger, P. A., Rao, R. R., Chen, K. S., Baer, T. A., Labreche, D. A., Sun, A. C., Hopkins, M. M., Subia, S. R., Moffat, H. K., Secor, R. B., Roach, R. A., Wilkes, E. D., Noble, D. R., Hopkins, P. L., and Notz, P. K., “GOMA 4.0 - a full-Newton finite element program for free and moving boundary problems with coupled fluid/solid momentum, energy, mass, and chemical species transport: user’s guide”, Sandia Tech. Report SAND2002-3204 (2002). Wellman, G. W., “MAPVAR – a computer program to transfer solution data between
finite element meshes”, Sandia Technical Report SAND97-0466 (1999).

32
6 Appendix – A Study of Solution Chemistry of Watts Nickel Plating
Bath in Absence of Additives and Deposition Mechanism¥
Solution Chemistry: The solution chemistry of the Watts Nickel plating bath in absence
of additives was studied by determining the equilibrium concentrations of the various
species at different pH levels. The concentrations of all the electroactive species were
determined by using various element balances, equilibrium conditions, and the
electroneutrality condition at a specified pH. It was assumed that the bath consists of
NiSO4 and Na2SO4 dissolved in water. Suitable concentrations of H2SO4 or NaOH were
used in the computation to obtain the concentration dependence as a function of pH.
Sodium sulfate acts as a supporting electrolyte and helps in simplifying the mathematical
computations. Nickel sulfate is the only source of nickel considered to simplify the
number of species involved. The calculations had two parts - region I and region II. In
region I, all electroactive species are completely dissolved. In region II, Ni(OH)2
precipitates at higher pH levels. The governing equations for the various regions are as
follows:
For region I, the variables to be determined are [Ni2+
], [Ni(OH)+], [OH
-], [H2O], [SO4
2-],
[HSO4-] and [H2SO4] ad. The equations needed are
a) Element balance on Nickel
2
4[ ] [ ( ) ] [ ]adNi Ni OH NiSO+ ++ = [1]
b) Element balance on Sulphur
2
4 4 2 4 4 2 4[ ] [ ] [ ] [ ] [ ]ad ad adHSO SO Na SO NiSO H SO− −
+ = + + [2]
c) Element balance on Oxygen
2
2 4 4
2 2 4 4 2 4
[ ] [ ( ) ] [ ] 4[ ] 4[ ]
[ ] 4[ ] 4[ ] 4[ ]ad ad ad ad
OH Ni OH H O HSO SO
H O Na SO NiSO H SO
− −− ++ + + +
= + + + [3]
d) Electroneutrality condition
2
4 4
2
2 4
[ ] [ ] 2[ ]
2[ ] [ ] 2[ ] [ ( ) ]ad
OH HSO SO
Na SO H Ni Ni OH
− −−
+ + +
+ +
= + + + [4]
e) Equilibrium relations
2
4 1 4[ ][ ] [ ] 0H SO K HSO− −+ − = [5]
2
2[ ][ ] [ ( ) ] 0Ni OH K Ni OH+ − +− = [6]
3[ ][ ] 0H OH K+ − − = [7]
¥ Contribution from Prof. B. N. Popov (2002) as part of a final contract-project report to Sandia.
33
For region II, the variables to be determined are [Ni2+
], [Ni(OH)+], [Ni(OH)2(s)],[OH
-],
[H2O], [SO42-
], [HSO4-] and [NaOH] ad. The equations needed are
a) Element balance on Nickel
ad422 ]NiSO[)]s()OH(Ni[])OH(Ni[]Ni[ =++ ++
[8]
b) Element balance on Sulphur
ad4ad422
44 ]NiSO[]SONa[]SO[]HSO[ +=+−−
[9]
c) Element balance on Oxygen
2
2 4 4 2
2 2 4 4
[ ] [ ( ) ] [ ] 4[ ] 4[ ] 2[ ( ) ( )]
[ ] 4[ ] 4[ ] [ ]ad ad ad ad
OH Ni OH H O HSO SO Ni OH s
H O Na SO NiSO NaOH
− −− ++ + + + +
= + + + [10]
d) Electroneutrality condition
2
4 4
2
2 4
[ ] [ ] 2[ ]
2[ ] [ ] 2[ ]
[ ( ) ] [ ]
ad
ad
OH HSO SO
Na SO H Ni
Ni OH NaOH
− −−
+ +
+
+ +
= + + +
+
[11]
e) In addition to the equilibrium conditions given above, we also have the relation
0K]OH][Ni[2)OH(Ni,d
22 =−−+ [12]
The above set of equations were solved using Maple with the use of appropriate values
for the various constants.
Mechanism of Nickel Deposition: An adsorption model was developed in order to
understand the mechanism of Ni deposition in sulfate electrolytes. In sulfate electrolyte,
Ni2+
can be considered as the reactive species and the electrode kinetics is mainly
governed by the competing reactions between hydrogen and nickel discharges. Nickel
deposition involves the formation and subsequent reduction of intermediate adion (such
as NiOHads), while the parasitic hydrogen evolution takes place through the formation of
intermediate Hads. For simplicity, the intermediate adsorbate of nickel is denoted as
(Ni+)ad. The mechanism of nickel deposition occurs via the reactions given below:
adsH e H+ −+ → [13]
2
adsNi e Ni+ − ++ → [14]

34
adsNi e Ni+ −+ → [15]
2 2ads adsNi Ni e Ni Ni+ + − ++ + → + [16]
ads ads adsNi H e Ni H+ + − ++ + → + [17]
22 adsH H→ [18]
2ads ads inclNi H e Ni H+ −+ + → + [19]
According to these reactions, the adsorbed species Ni+
ads is a precursor and a catalyst for
the formation of the Ni deposit. However, this species also acts as a catalyst for hydrogen
adsorption. Hence the surface coverages of these adsorbates will give an insight of the
two cathodic processes occurring on the electrode surface. The material balance for the
surface species are given by
121 1 2 22 1(1 )
dA A
dt
θθ θ θ= − − − [20]
220 1 2 24 1
2
25 2 26 1 2
(1 )d
A Adt
A A
θθ θ θ
θ θ θ
= − − +
− −
[21]
where θ1 and θ2 are the electrode surface coverages of the two adsorbed species Ni+
ads
and Hads respectively. Each reaction has a rate constant An (in mole cm-2
s-1
), which are
defined according to the relation
n n n 0A = a exp (b (E-E )) [22]
where bn is the activation co-efficient, an includes both the rate constant and the
concentration of the reacting species and E0 is an arbitrarily chosen origin of potential to
calculate the overpotential (set to zero in our simulations). With these formulations, the
electron balances will yield the current relationship with the surface coverages. This
relationship is given by the equation
1 1 2 2 1 2
3 1 5 1 4 1
( (1 ) (1 )
2
i F A A
A A A
β θ θ θ θ
θ θ θ
= − − + − −
+ + + [23]
where F is the Faradaic constant and β is the maximum surface concentration on the
electrode. In our work, simulations were performed using three different sets of
parameters. The various sets of parameters are given below

35
In the case of Case2 and Case 3 parameters, the values except those shown were the same
as in Case 1 parameters.
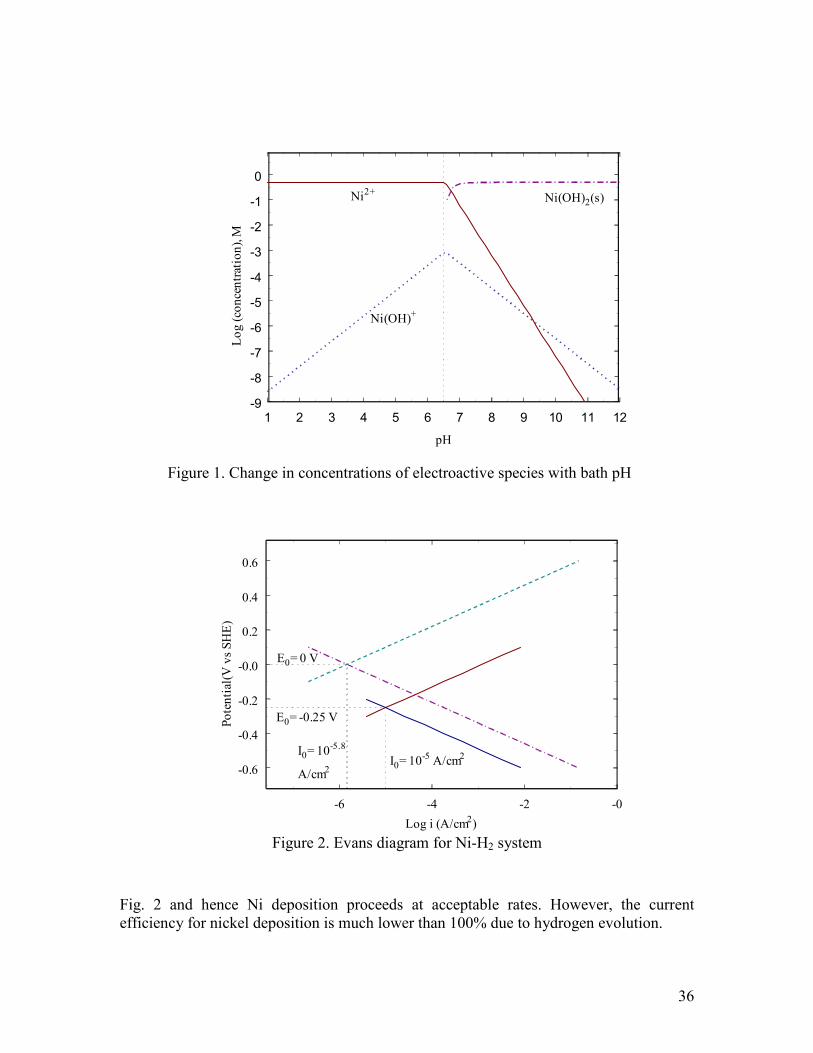
Results and Discussion: Figure 1 presents the concentration dependence of the
electroactive species on the pH of the bath. The plot shows that before pH 6.5, the
electroactive species are completely dissolved in the bath and that the major part of Ni
remains as Ni2+
. The concentration of Ni(OH)+increases logarithmically with pH. After
pH 6.5, the concentration of Ni2+
and Ni(OH)+ reduce drastically, and almost all the
nickel is precipitated as Ni(OH)2. So, it is apparent from the plot that the bath becomes
unstable after a pH of 6.5, and that it is essential to keep the pH level below 6.5.
Evan’s diagram was constructed to understand the thermodynamics of nickel deposition
process along with hydrogen evolution as a parasitic reaction. The Evans diagram was
obtained for both nickel reduction and the hydrogen evolution process. The values of ‘a’
and ‘b’ were found from literature1, and the potentials were plotted as a function of log i
using the given relations. Figure 2 presents the Evans diagram for nickel reduction and
hydrogen evolution in a Watt’s bath. The potential shown in the plot is with respect to the
Standard Hydrogen Electrode (SHE). The plot shows that the equilibrium potential for
nickel is –0.25 V. The equilibrium potential for hydrogen is 0 V. The plot also shows that
the equilibrium exchange current density of hydrogen is almost one order of magnitude
lesser than that of nickel. As seen from Figure 2, for a given overpotential, the partial
current density due to hydrogen evolution is at least one order of magnitude higher than
that of nickel reduction. In other words, thermodynamics favor more hydrogen evolution
than nickel deposition. Ideally no amount of Ni deposition can take place in aqueous
electrolytes since most of the current goes towards hydrogen evolution according to
Figure 2. In practice the overpotential for hydrogen evolution is larger than that shown in
7 2 1
20
9 2 1
21
8 2 1
22
7 2 1
23
9 2 1
24
11 2 1
25
9 2 1
26
1
20 22 23 24 26
1
21
1.2*10
3.8*10
1.52*10
4*10
1.08*10
2*10
1.56*10
16
30
a cm s
a cm s
a cm s
a cm s
a cm s
a cm s
a cm s
b b b b b V
b V
− − −
− − −
− − −
− − −
− − −
− − −
− − −
−
−
=
=
=
=
=
=
=
= = = = =
=
6 2 1
20
7 2 1
21
7 2 1
22
9 2 1
24
1
22 23 24 26
1.2*10
1.52*10
6.08*10
1.22*10
14
a cm s
a cm s
a cm s
a cm s
b b b b V
− − −
− − −
− − −
− − −
−
=
=
=
=
= = = =
9 2 1
21
7 2 1
23
1
22 23 24 26
1
20
1.9*10
2*10
14
18
a cm s
a cm s
b b b b V
b V
− − −
− − −
−
−
=
=
= = = =
=
Case 1 parameters Case 2 parameters
Case 3 parameters
36
Figure 1. Change in concentrations of electroactive species with bath pH
Figure 2. Evans diagram for Ni-H2 system
Fig. 2 and hence Ni deposition proceeds at acceptable rates. However, the current
efficiency for nickel deposition is much lower than 100% due to hydrogen evolution.
-6 -4 -2 -0
Log i (A/cm2)
-0.6
-0.4
-0.2
-0.0
0.2
0.4
0.6
Po
ten
tial
(V v
s S
HE
)
I0= 10-5 A/cm2
E0= -0.25 V
E0= 0 V
I0= 10-5.8
A/cm2
1 2 3 4 5 6 7 8 9 10 11 12
pH
-9
-8
-7
-6
-5
-4
-3
-2
-1
0
Lo
g (
con
cen
trat
ion
), M
Ni2+
Ni(OH)+
Ni(OH)2(s)
37
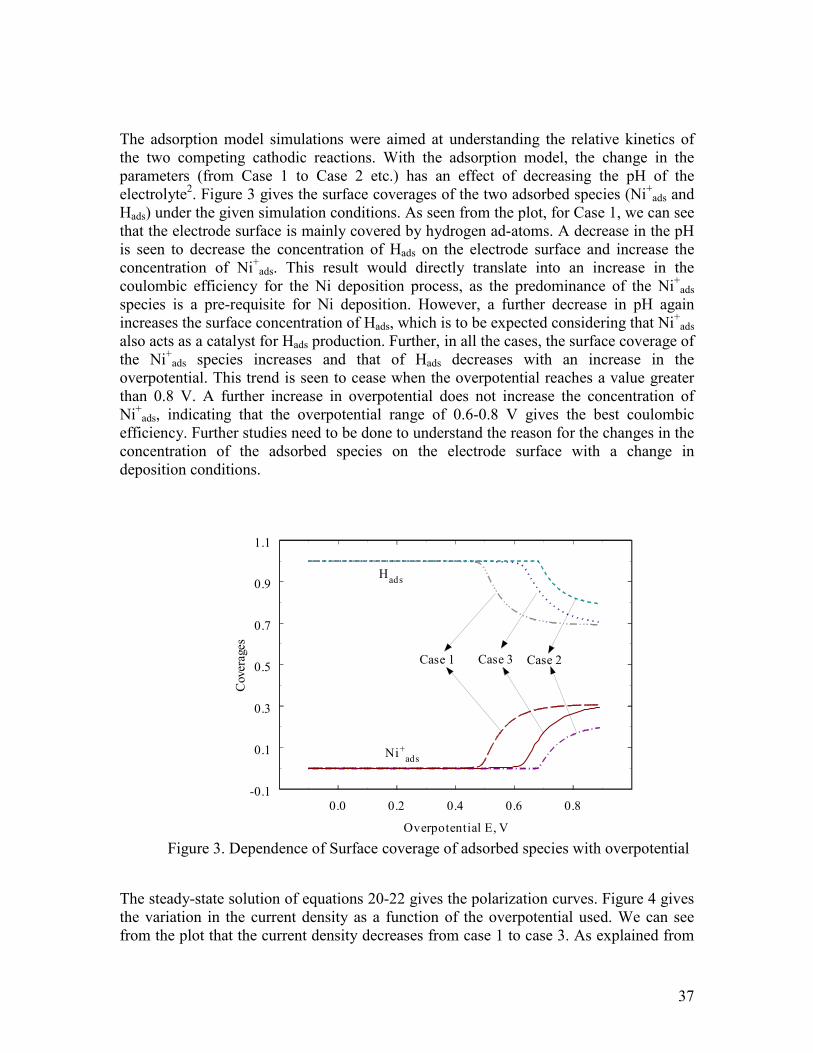
The adsorption model simulations were aimed at understanding the relative kinetics of
the two competing cathodic reactions. With the adsorption model, the change in the
parameters (from Case 1 to Case 2 etc.) has an effect of decreasing the pH of the
electrolyte2. Figure 3 gives the surface coverages of the two adsorbed species (Ni
+ads and
Hads) under the given simulation conditions. As seen from the plot, for Case 1, we can see
that the electrode surface is mainly covered by hydrogen ad-atoms. A decrease in the pH
is seen to decrease the concentration of Hads on the electrode surface and increase the
concentration of Ni+
ads. This result would directly translate into an increase in the
coulombic efficiency for the Ni deposition process, as the predominance of the Ni+
ads
species is a pre-requisite for Ni deposition. However, a further decrease in pH again
increases the surface concentration of Hads, which is to be expected considering that Ni+
ads
also acts as a catalyst for Hads production. Further, in all the cases, the surface coverage of
the Ni+
ads species increases and that of Hads decreases with an increase in the
overpotential. This trend is seen to cease when the overpotential reaches a value greater
than 0.8 V. A further increase in overpotential does not increase the concentration of
Ni+
ads, indicating that the overpotential range of 0.6-0.8 V gives the best coulombic
efficiency. Further studies need to be done to understand the reason for the changes in the
concentration of the adsorbed species on the electrode surface with a change in
deposition conditions.
Figure 3. Dependence of Surface coverage of adsorbed species with overpotential
The steady-state solution of equations 20-22 gives the polarization curves. Figure 4 gives
the variation in the current density as a function of the overpotential used. We can see
from the plot that the current density decreases from case 1 to case 3. As explained from
0.0 0.2 0.4 0.6 0.8
Overpotential E, V
-0.1
0.1
0.3
0.5
0.7
0.9
1.1
Cov
erag
es
Ni+ads
Hads
Case 1 Case 3 Case 2

38
figure 3, case 2 gives the optimal surface coverage of the Ni+
ads. Again, in the
polarization curve also shows the least current for a given overpotential for case 2
parameters. This result indicates that the increased current density values seen in Case 1
and Case 3 is utilized mainly for hydrogen evolution reaction. The increased hydrogen
Figure 4. Dependence of Current density with overpotential
Figure 5. Tafel Polarization studies of Ni deposition from Watts bath at different
temperatures
0.0 0.2 0.4 0.6 0.8
Overpotential E, V
0
100
200
300
400
I (m
A/c
m2)
Case 1
Case 2
Case 3
10-8 10-7 10-6 10-5 10-4 10-32 3 4 56 2 3 4 56 2 3 4 56 2 3 4 56 2 3 4 56
Log I (A/cm2)
-0.6
-0.5
-0.4
-0.3
-0.2
-0.1
-0.0
Po
ten
tial
(V
vs
SC
E)
25 C
35 C
45 C
55 C
65 C
75 C

39
evolution reaction would lead to a decrease in the current efficiency for the deposition
process, which again corroborates the results found in Figure 3. However, it must be
mentioned that the reason for the presence of an optimal pH for the deposition process
has to be explored to understand the mechanism of Ni deposition process in sulfate
electrolytes.
Effect of Temperature: Tafel polarization studies were done for the deposited nickel
under the bath conditions. Figure 5 gives the Tafel plots of the deposited nickel at various
temperatures. According to the Evan’s diagram shown in Figure 2, a plot of E vs. log I
should yield a straight line with the slope equal to the Tafel constant. However, the Tafel
plots in Figure 3 reveal two different Tafel slopes. At low to moderate overpotentials, one
slope is observed. At high overpotentials a different slope is observed. The Tafel slope at
low overpotentials can be attributed to Ni deposition and dissolution. The Tafel slopes at
high overpotentials are due to the hydrogen evolution/oxidation reaction. Current studies
are focused on obtaining the parameters that characterize the kinetics involved in both these processes.
Figures 6a and 6b present the cyclic voltammograms (CVs) obtained at various
temperatures at a scan rate of 1 mV/s. The CVs were done by sweeping the potential
from –0.15 V to –0.8 V in the forward scan and then back from –0.8 V to –0.15 V in the
reverse scan. The sweep rate was kept the same during both forward and reverse scans.
During the forward sweep from –0.15 V to –0.8, both Ni deposition and hydrogen
evolution occur. Since, the solution contains excess H+ ions hydrogen evolution is not
rate limited. This is seen by the rapid increase in current density beyond –0.65 V in
Figure 6a. The plot also shows that hydrogen evolution does not begin at –0.25 V (0 V vs.
SHE) as predicted by the Evan’s diagram (Figure 2). This is due to the overpotential for
hydrogen evolution on the copper substrate. Hence, at low temperatures we observe a
reduction peak, which corresponds to Ni deposition. However, this peak vanishes with
increase in temperature. This can be attributed to the enhancement of the hydrogen
evolution reaction with temperature. Hydrogen evolution masks the Ni deposition
reaction and hence the reduction peaks cannot be seen clearly.
During the reverse sweep from –0.8 V to –0.15 V, two peaks are seen at different
temperatures. The first peak corresponds to that of Ni dissolution and the second peak to
that of adsorbed hydrogen oxidation. Since a limited amount of hydrogen is adsorbed on
the surface, a clear peak appears during the forward scan. Increasing the temperature
increases the kinetics for both Ni reduction/oxidation and hydrogen evolution/oxidation.
References:
1. L. I. Antropov, Theoretical Electrochemistry, Mir publishers, Moscow (1972).
2. I. Epelboin, M. Joussellin, R. Wiart, J. Electroanal. Chem., 119, 61 (1981).

40
Figure 6a. Cyclic Voltammograms of Ni deposition from Watts bath at different
temperatures
Figure 6b. Cyclic Voltammograms of Ni deposition from Watts bath at different
temperatures.
-0.8 -0.6 -0.4 -0.2
Potential (V vs SCE)
-0.004
-0.003
-0.002
-0.001
0.000
0.001
0.002
0.003
Cu
rren
t (A
/cm
2)
35 C
45 C
55 C
65 C
75 C
Anodic scan
Cathodic scan
-0.8 -0.6 -0.4 -0.2
Potential (V vs SCE)
-0.0007
-0.0002
0.0003
Cu
rren
t (A
/cm
2)
35 C
45 C
Cathodic scan
Anodic scan
41
7 DISTRIBUTION
MS 0384 9140 H. S. Morgan
MS 0825 9110 W. H. Hermina
MS 0826 9113 S. N. Kempka
MS 0826 9113 D. R. Noble
MS 0826 9113 P. A. Sackinger
MS 0826 9113 C. C. Wong
MS 0826 9114 J. E. Johannes
MS 0826 9114 T. A. Baer
MS 0826 9114 K. S. Chen (5)
MS 0826 9114 H. K. Moffat
MS 0826 9114 R. R. Rao
MS 0826 9114 P. R. Schunk
MS 0826 9114 A. C.-T. Sun
MS 9404 8750 G. D. Kubiak
MS 9042 8750 S. K. Griffiths
MS 9401 8751 D. M. Skala
MS 9042 8752 C. D. Moen
MS 9042 8752 G. H. Evans (2)
MS 9042 8752 R. S. Larson
MS 9042 8752 R. H. Nilson
MS 9042 8752 A. Ting
MS 9401 8753 G. F. Cardinale
MS 9401 8753 J. J. Kelly
MS 9401 8753 D. R. Boehme
MS 9409 8754 S. H. Goods
MS 9403 8762 L. A. Domeier
MS 9403 8762 A. M. Morales
MS 9403 8773 N. Y. C. Yang
MS 0311 2618 R. Wild
MS 0619 12690 Review and Approval Desk (2) for DOE/OSTI
MS 0899 4916 Technical Library (2)
MS 9018 8940-2 Central Technical Files
Honeywell FM&T
P. O. Box 419159
Kansaa City, MO 64141-6159
MS 1C41 R. Steinhoff
MS MD40 M. Widmer
MS MD40 K. Mandl

42
Prof. Branko N. Popov
Department of Chemical Engineering
University of South Carolina
Columbia, SC 29209
Prof. Ralph Greif
Department of Mechanical Engineering
University of California, Berkeley
Berkeley, CA 94720
Related Documents