Presented by: Preeti Sagar Mishra(10DF 043) Sudipta Neogi(10DF044) Glory Sinha(10DF045) I.Menka(10DF046) Alok Agarwal(10DF047) Himanshu S. Sahoo(10DF048) Nishant Nanda(10DF049) TM

Welcome message from author
This document is posted to help you gain knowledge. Please leave a comment to let me know what you think about it! Share it to your friends and learn new things together.
Transcript

8/4/2019 Msme Ppt Final
http://slidepdf.com/reader/full/msme-ppt-final 1/27
Presented by:
Preeti Sagar Mishra(10DF043)
Sudipta Neogi(10DF044)
Glory Sinha(10DF045)
I.Menka(10DF046)
Alok Agarwal(10DF047)
Himanshu S. Sahoo(10DF048)
Nishant Nanda(10DF049)
TM

8/4/2019 Msme Ppt Final
http://slidepdf.com/reader/full/msme-ppt-final 2/27
Flow of presentation Introduction
Market potential
Manufacturing process
Quality control Pollution control
Implementation Schedule
Assumptions
Cost of project
Working Capital Requirement
Means of finance
Profitability Statement
Cash Flow Statement
Projected Balance Sheet

8/4/2019 Msme Ppt Final
http://slidepdf.com/reader/full/msme-ppt-final 3/27
INTRODUCTION Why is the project chosen????
Water is very essential for all living things. Drinking
water contains some useful minerals such as sulphur,iron, manganese, calcium which are essential and
useful for human body to regulate certain body
functions.
It has been provided in survey of WORLD HEALTHORGANISATION(WHO) that 80% of the diseases
are water borne.

8/4/2019 Msme Ppt Final
http://slidepdf.com/reader/full/msme-ppt-final 4/27
In addition to biological and chemical contamination
water sources are often polluted by external sourcesmaking them totally unsafe foe drinking purposes.
The water which is free from physical, chemical and
biological contamination but at the same time having alladequate minerals is called Mineral Water.
Due to health consciousness and living standard there is
great demand of mineral water in hotels, restaurants,
tourism dept. railway dept.
8/4/2019 Msme Ppt Final
http://slidepdf.com/reader/full/msme-ppt-final 5/27
It is also becoming fashion in conferences, parties,
meetings and other celebrations.
Soft drink beverages such as cola type, oranges, lime,lemon, ginger etc. have become very popular in recent
years.

8/4/2019 Msme Ppt Final
http://slidepdf.com/reader/full/msme-ppt-final 6/27
8/4/2019 Msme Ppt Final
http://slidepdf.com/reader/full/msme-ppt-final 7/27
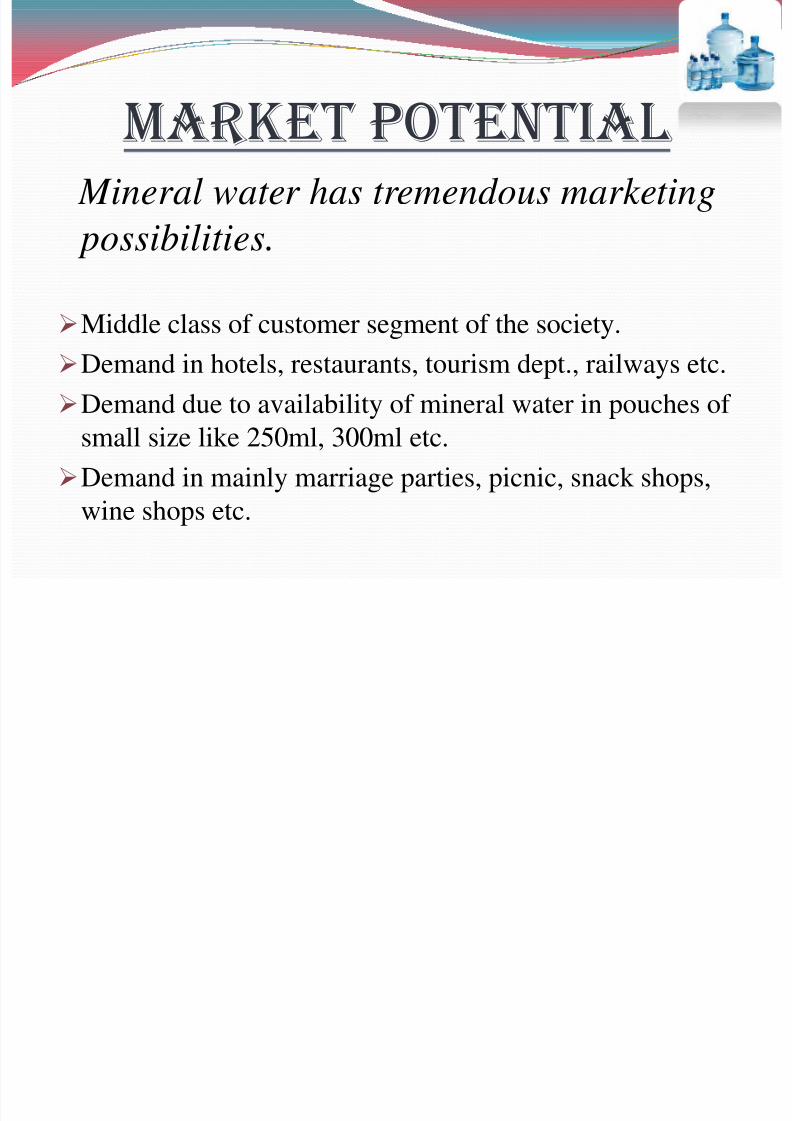
MARKET POTENTIAL Mineral water has tremendous marketing
possibilities.
Middle class of customer segment of the society.
Demand in hotels, restaurants, tourism dept., railways etc.
Demand due to availability of mineral water in pouches of small size like 250ml, 300ml etc.
Demand in mainly marriage parties, picnic, snack shops,
wine shops etc.

8/4/2019 Msme Ppt Final
http://slidepdf.com/reader/full/msme-ppt-final 8/27
Demand for 20 litres jars are consumed mainly in
conferences, marriage parties, offices, hotels and houses.
The customers range from a 5 star hotel to a cinema hall toa small eating place and a pan shop.
In the state of Odissa there are only about 7 to 8 unitsmanufacturing mineral water in small scale sector mainlylocated in Rourkela, Cuttack, Bhubaneswar, Berhampur
and Puri. Still there exists plenty scope for setting up of small scale units for the manufacture of mineral water inthe state.
The proposed scheme is prepared for mineral waterpacked in PET bottels.
8/4/2019 Msme Ppt Final
http://slidepdf.com/reader/full/msme-ppt-final 9/27
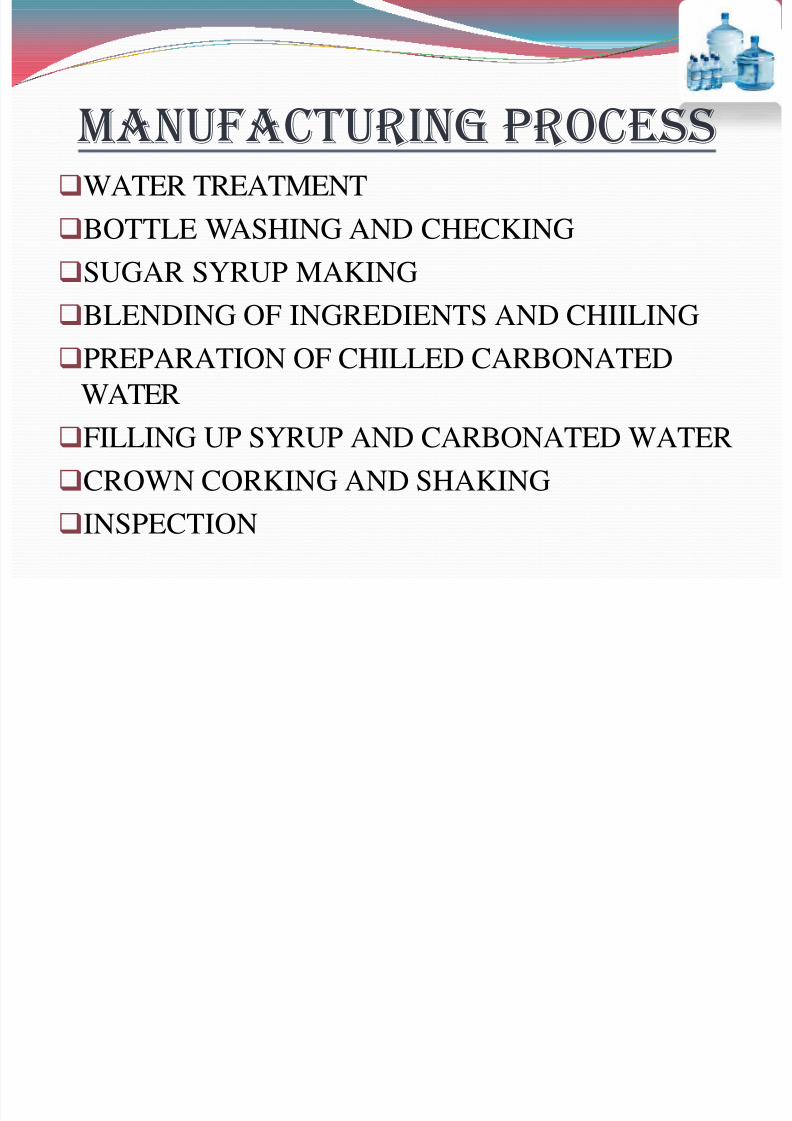
MANUFACTURING PROCESSWATER TREATMENT
BOTTLE WASHING AND CHECKING
SUGAR SYRUP MAKINGBLENDING OF INGREDIENTS AND CHIILING
PREPARATION OF CHILLED CARBONATED
WATERFILLING UP SYRUP AND CARBONATED WATER
CROWN CORKING AND SHAKING
INSPECTION

8/4/2019 Msme Ppt Final
http://slidepdf.com/reader/full/msme-ppt-final 10/27
QUALITY CONTROL
Raw material from the proposed source has to be tasted in
laboratory for the presence of various impurities based on
which suitable line of treatment is designed to provide
water free from physical, chemical and biological
contamination.
Energy coservation

8/4/2019 Msme Ppt Final
http://slidepdf.com/reader/full/msme-ppt-final 11/27
Parameter Drinking water
(IS:10500)
Mineral Water
(IS:13428)
1 pH 6.5-8.5 6.5-8.5
2 Colour(Pt-Co units) 5-25 5 Max
3 Turbidity 5-10 5 Max
4 Total dissolved
solids
500-2000 1-500
5 Alkalinity as CaCo3 200-600(H2Co3) 600
6 Chlorides as CI 250-1000 200
7 Sulphates as So4 200-400 250
8 Total hardness as
CaCo3
300-600 300
9 Calcium as Ca++ 75-200 40
10 Magnesium as
Mg++
30-100 20
11 Nitrates as No3 45-100 45 Max
12 Floride as F 1-1.5 1.0 Max
13 Total Iron as Fe 0.3-1 0.3 Max

8/4/2019 Msme Ppt Final
http://slidepdf.com/reader/full/msme-ppt-final 12/27
POLLUTION CONTROL
There is no pollution being emitted in the manufacture of
distilled water as such no pollution control equipment are
required for the manufacture of mineral water. However,the unit should adopt proper storage and handling
practices in various operations.

8/4/2019 Msme Ppt Final
http://slidepdf.com/reader/full/msme-ppt-final 13/27
IMPLEMENTATION SCHEDULE I. Preparation of project report : 1 month
II. Selection of site : 1/2 month
III. Arrangement of finance : 4 ½month
IV. Registration with various authorities : 1 month
V. Procurement of machinery : 1 month
VI. Recruitment of staff : 1/2 month
VII. Trial run : 1/2 month
TOTAL : 9 months
90% capacity utilization.

8/4/2019 Msme Ppt Final
http://slidepdf.com/reader/full/msme-ppt-final 14/27
ASSUMPTIONS1. Means of finance: Debt: Equity- 2:1
2. Sales- 150 1st year to be increased 20% every year
3. Working capital requirement to remain same.4. In order to prevent working capital shortage the
promoter wants margin money for the 1st year to be
included in project cost.
5. Term loan interest rate is 17% to be paid in 5 years.
8/4/2019 Msme Ppt Final
http://slidepdf.com/reader/full/msme-ppt-final 15/27
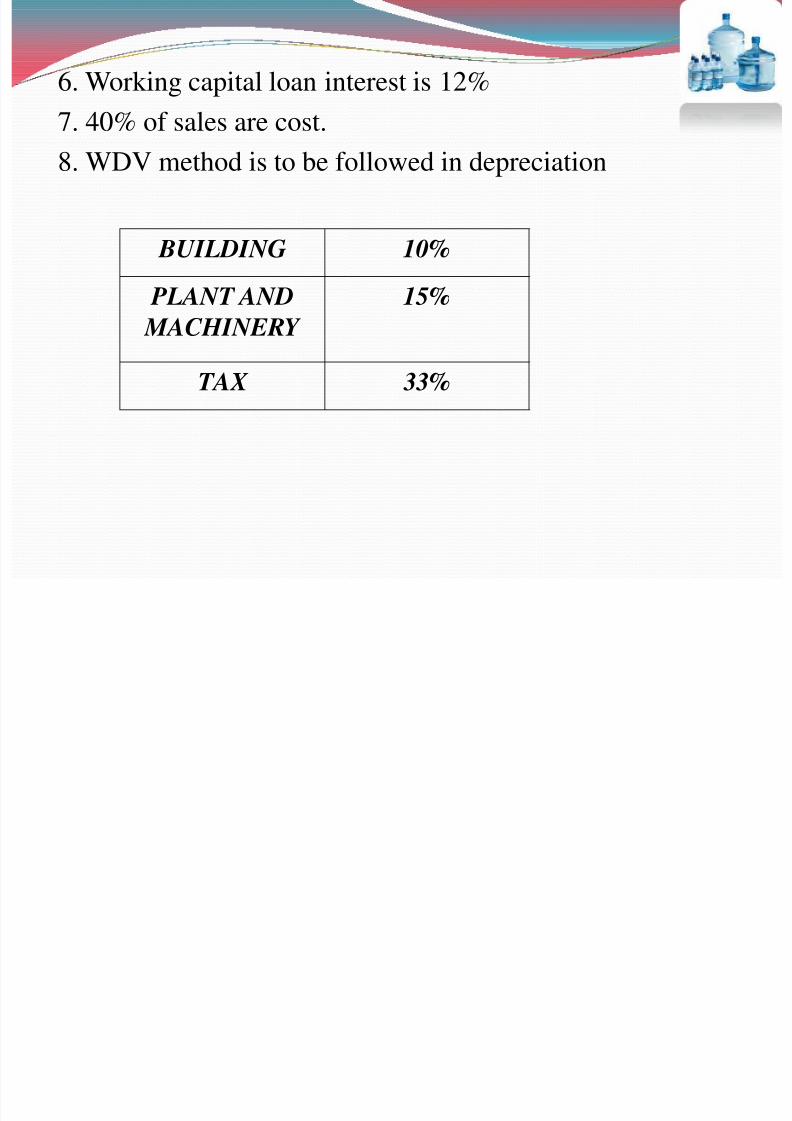
6. Working capital loan interest is 12%
7. 40% of sales are cost.
8. WDV method is to be followed in depreciation
BUILDING 10%
PLANT AND
MACHINERY
15%
TAX 33%
8/4/2019 Msme Ppt Final
http://slidepdf.com/reader/full/msme-ppt-final 16/27
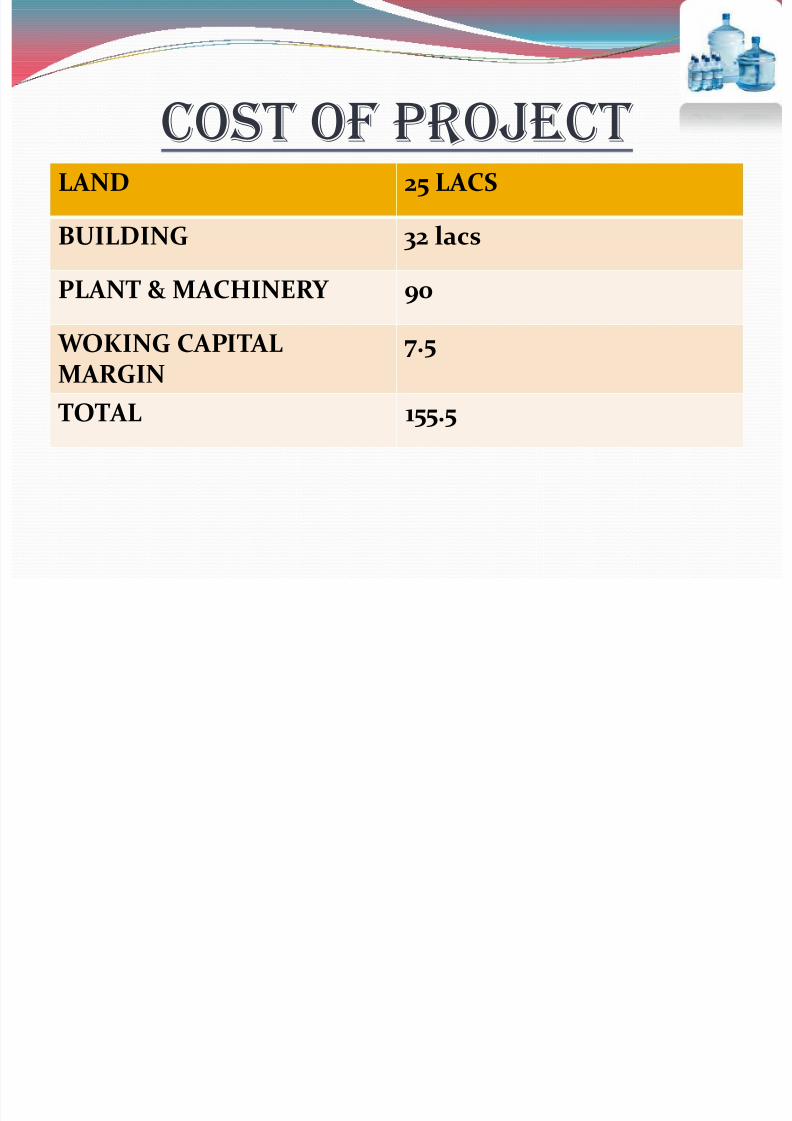
COST OF PROJECT LAND 25 LACS
BUILDING 32 lacs
PLANT & MACHINERY 90
WOKING CAPITALMARGIN
7.5
TOTAL 155.5

8/4/2019 Msme Ppt Final
http://slidepdf.com/reader/full/msme-ppt-final 17/27
WORKING CAPITAL
REQUIREMENT BANKS FOLLWS NAYAK COMMITE SO ACCRODING
TO THAT WORKING CAPITAL REQUIREMENT FOR THE COMPANY IS 25% OF SALES OF 1ST YEAR!( 150
LACS)
YEAR WCR WCBF MARGIN
1 37.5 30 7.5
2 37.5 30 7.5
3 37.5 30 7.5
4 37.5 30 7.5
5 37.5 30 7.5

8/4/2019 Msme Ppt Final
http://slidepdf.com/reader/full/msme-ppt-final 18/27
MEANS OF FINANCE AS THE COST OF PROJECT IS 155.5 LACS SO
ACCORDING TO 2:1 EQUITY RATIO:
DEBT/ TERM LOAN: 103.67
EQUITY/PROMOTERS CONTRIBUTION: 51.83

8/4/2019 Msme Ppt Final
http://slidepdf.com/reader/full/msme-ppt-final 19/27
PROFITABILITY STATEMENT

8/4/2019 Msme Ppt Final
http://slidepdf.com/reader/full/msme-ppt-final 20/27
Particulars 1 2 3 4 5
sales 150 180 216 259.2 311.04
cost of Sales
(40%) 60 72 86.4 103.68 124.41
Deprecition 16.7 14.34 12.34 10.62 9.14
Total Interest
(TL+WC) 21.22 17.69 14.17 10.65 7.12
PBT 52.08 75.97 103.09 134.25 170.37
Tax (33%) 17.1864 25.07 34.02 44.303 56.222
PAT 34.8936 50.9 69.07 89.948 114.15
8/4/2019 Msme Ppt Final
http://slidepdf.com/reader/full/msme-ppt-final 21/27
CASH FLOW STATEMENT

8/4/2019 Msme Ppt Final
http://slidepdf.com/reader/full/msme-ppt-final 22/27
PARTICULARS
PREOPERATIVE
YEAR 1 2 3 4 5
INFLOWS
Promoters contribution 51.83
Term Loan 103.67PAT 34.89 50.89 69.07 89.95 114.15
Dep 16.7 14.35 12.34 10.62 9.14
WCBF 30 - - - -
TOTAL INFLOW (A) 155.5 81.59 65.24 81.41 100.57 123.29
OUTFLOWS
Fixed Asset 147
Preoperative exp 1
Repayment of loan 20.73 20.73 20.73 20.73 20.73
Increase in w.c. 37.5 - - - -
TOTAL OUTFLOW (B) 148 58.23 20.73 20.73 20.73 20.73
Opening Balance 0 7.5 30.86 75.37 136.05 215.89
Cash (A-B) 7.5 23.36 44.51 60.68 79.84 102.56
9.14Closing Balance 7.5 30.86 75.37 136.05 215.89 318.45
8/4/2019 Msme Ppt Final
http://slidepdf.com/reader/full/msme-ppt-final 23/27
PROJECTED BALANCE SHEET

8/4/2019 Msme Ppt Final
http://slidepdf.com/reader/full/msme-ppt-final 24/27
ASSET 1 2 3 4 5
FIXED ASSET+ pre
operative 148 131.37 116.95 104.61 93.99
(-)Dep 16.7 14.35 12.34 10.62 9.14Net block 131.3 117.02 104.61 93.99 84.85
W.C.(net current asset) 37.5 37.5 37.5 37.5 37.5
Cash 30.86 75.37 136.05 215.89 318.45
TOTAL ASSET 199.66 229.89 278.16 347.38 440.8
LIABILITIES
Promoters contribution 51.83 51.83 51.83 51.83 51.83Reserve and surplus 34.89 85.79 154.86 244.81 358.96
Term loan 82.94 62.21 41.48 20.75 0.02
WCBF 30 30 30 30 30
TOTAL LIABILITIES 199.66 229.83 278.17 347.39 440.81

8/4/2019 Msme Ppt Final
http://slidepdf.com/reader/full/msme-ppt-final 25/27
CONCLUSION DSCR FOR THE 5YEARS ARE:
YEAR NET DSCR
1 2.49
2 3.14
3 3.92
4 4.855 5.94

8/4/2019 Msme Ppt Final
http://slidepdf.com/reader/full/msme-ppt-final 26/27
8/4/2019 Msme Ppt Final
http://slidepdf.com/reader/full/msme-ppt-final 27/27
Related Documents