Smarter Cities May 4, 2011 Paul Chang Business Strategy and Development, Emerging Technologies IBM Software Group

Mr. Paul Chang's presentation at QITCOM 2011
Jan 12, 2015
QITCOM 2011
Presentation:
City Operations Centre for Managing City
Presenter:
Mr. Paul Chang - Business Development Executive for Emerging Markets, IBM
Presentation:
City Operations Centre for Managing City
Presenter:
Mr. Paul Chang - Business Development Executive for Emerging Markets, IBM
Welcome message from author
This document is posted to help you gain knowledge. Please leave a comment to let me know what you think about it! Share it to your friends and learn new things together.
Transcript
Smarter Cities
May 4, 2011
Paul ChangBusiness Strategy and Development, Emerging Technologies
IBM Software Group
Paul ChangBusiness Strategy and Development, Emerging Technologies
IBM Software Group
2
IBM Smarter Cities
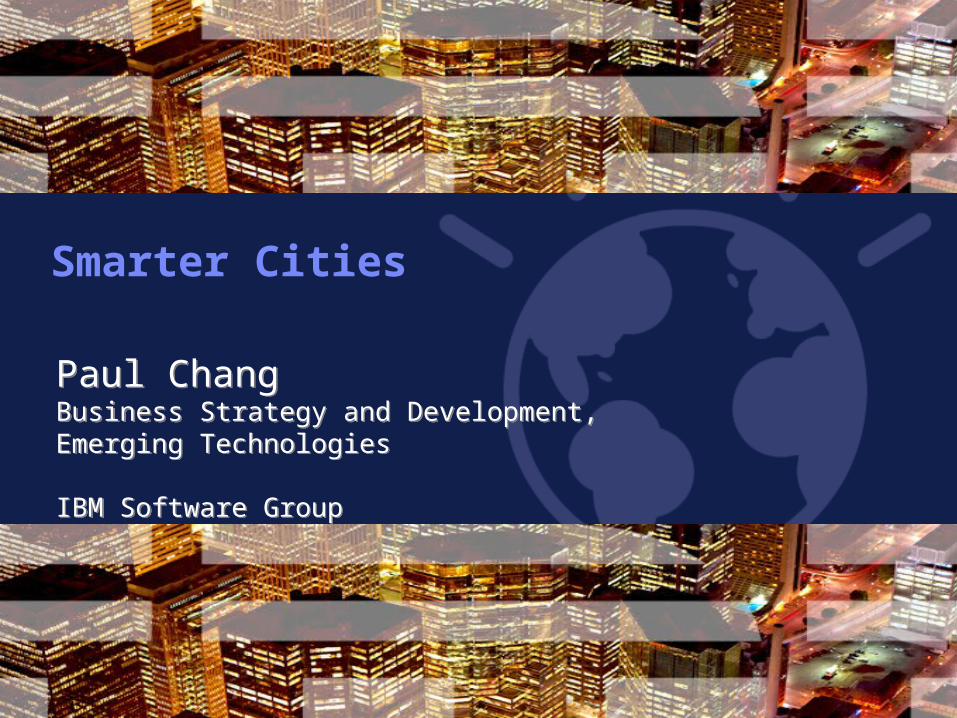
Why Smarter Cities? Why now?
Source: Various; IBM MI Analysis
Technological
Social/Demographic
Economic
Environmental
•Economic development, business locate where human and physical capital is – i.e. cities
• Developed world has underinvested in its cities; the developing world needs new urban infrastructure ($41T needed by 2030)
• Rise of “new” cities (MASDAR, New Songho City, GIFT, KAEC, etc.)
•Global financial crisis is spurring government stimulus, creating new jobs
•At the end of 2008, 50% of the world population lived in a city
•Urban population will almost double between 2010-50 (to 6.4B!)
•18 countries in the world with contracting populations (in 2050, 44)
•Asia will become 50% urban in next 15 years
•Rapid urbanization is creating high stresses for many Asian cities, in turn driving the construction of hundreds of new cities
• Convergence of pervasive digital networks, sensors, advanced analytics
• There are over 4 billion mobile cellular subscribers in the world today (60% penetration)
• Location-based services and social networking continue to grow in capability and popularity
• IT has made it possible for global enterprises to operate anywhere in the world
•Drive for cities to cut carbon emissions and increase the energy they get from renewable sources
•There will be 1.2 billion cars on the road by 2015 (~1 car/6 people)
•95% of the world's cities still dump raw sewage into their waters
Copyright Colin Harrison 2009
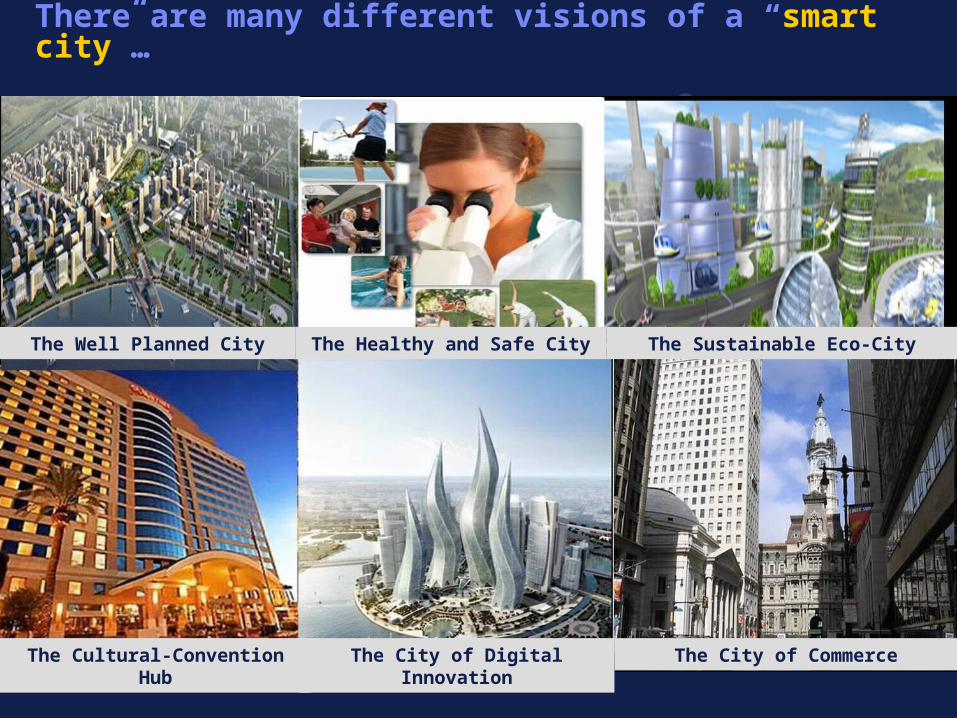
There are many different visions of a “smart city”…
The Sustainable Eco-CityThe Well Planned City The Healthy and Safe City
The Cultural-Convention Hub
The City of Digital Innovation
The City of Commerce
4
IBM Smarter Cities
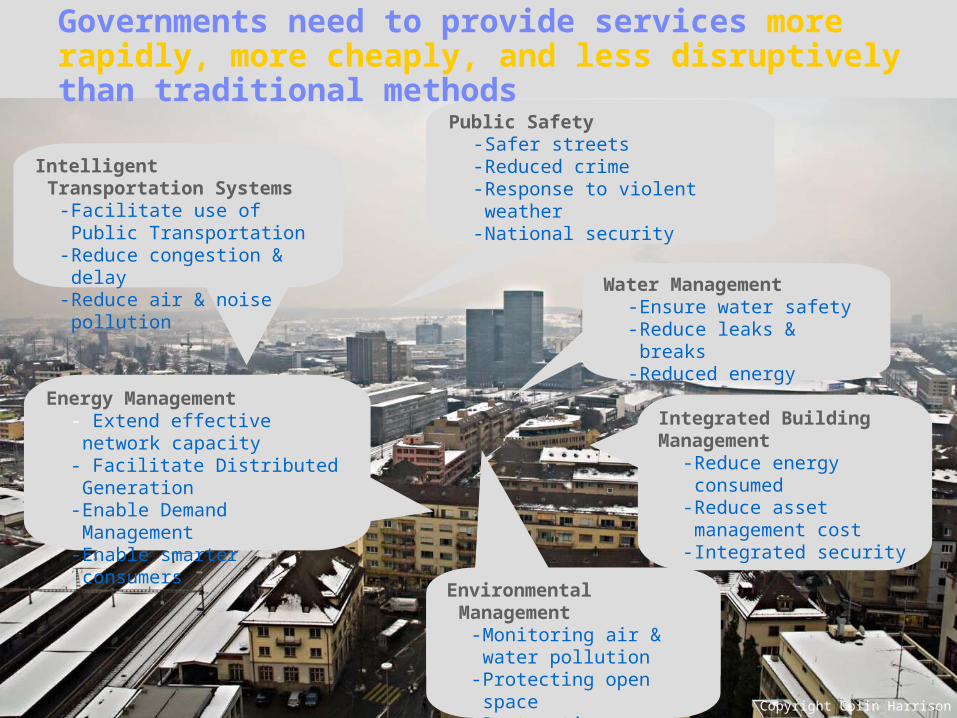
Intelligent Transportation Systems
- Facilitate use of Public Transportation
- Reduce congestion & delay
- Reduce air & noise pollution
Energy Management- Extend effective network
capacity- Facilitate Distributed
Generation- Enable Demand
Management- Enable smarter consumers
Environmental Management
- City-wide Measurements
- KPI’s, scorecards- CO2 Management
Public Safety- Safer streets- Reduced crime- Response to violent weather- National security
Governments need to provide services more rapidly, more cheaply, and less disruptively than traditional methods
Environmental Management
- Monitoring air & water pollution
- Protecting open space- Restoration
Integrated Building Management
- Reduce energy consumed
- Reduce asset management cost
- Integrated security
Copyright Colin Harrison 2009
Water Management- Ensure water safety- Reduce leaks & breaks- Reduced energy
5
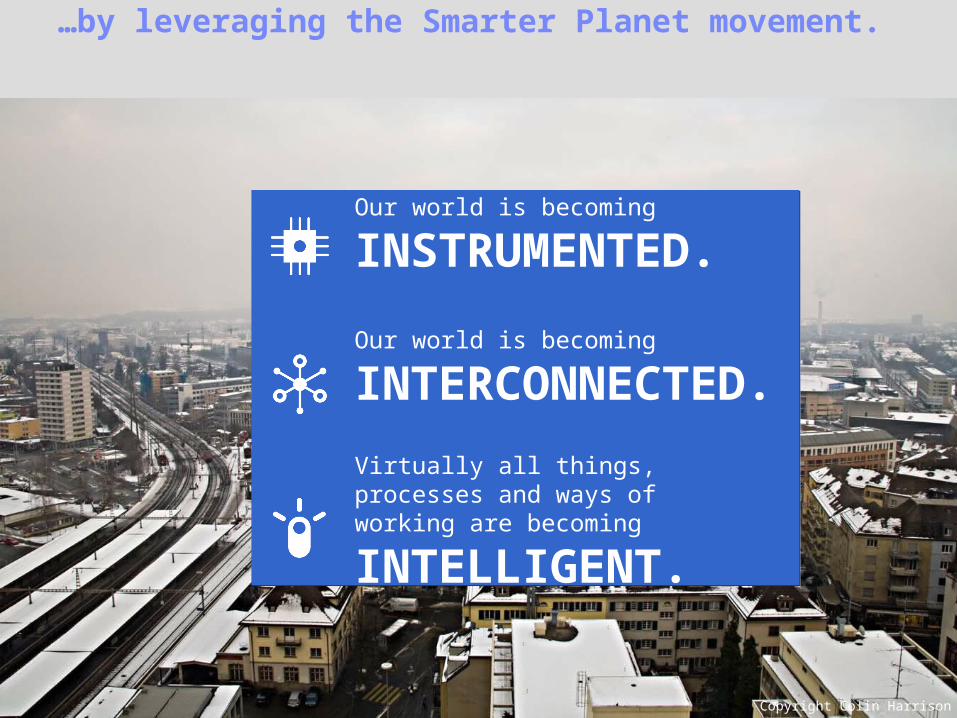
IBM Smarter Cities …by leveraging the Smarter Planet movement.
Copyright Colin Harrison 2009
Our world is becoming
INSTRUMENTED.
Our world is becoming
INTERCONNECTED.
Virtually all things, processes and ways of working are becoming
INTELLIGENT.
6
IBM Smarter Cities
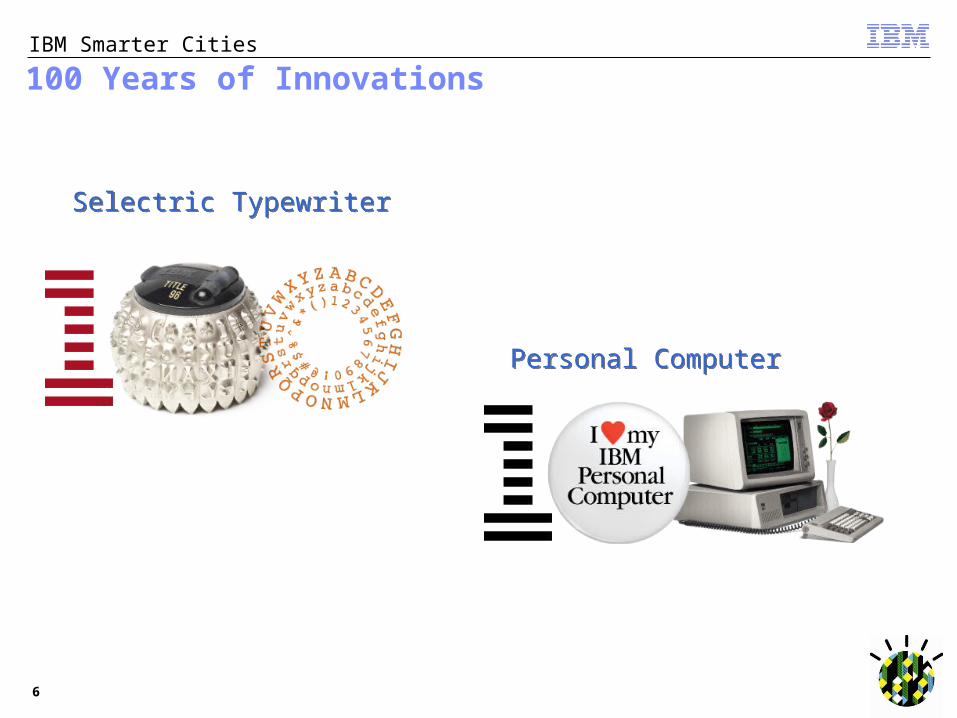
100 Years of Innovations
Selectric TypewriterSelectric Typewriter
Personal ComputerPersonal Computer
7
IBM Smarter Cities
100 Years of Innovations
BarcodesBarcodes
Magnetic StripeMagnetic Stripe
8
IBM Smarter Cities
100 Years of Innovations
Magnetic Disc DriveMagnetic Disc Drive
Excimer LaserExcimer Laser
9
IBM Smarter Cities
100 Years of Innovations
SABRESABRE
Deep ThunderDeep Thunder
10
IBM Smarter Cities
100 Years of Innovations
Predictive Crime FightingPredictive Crime Fighting
WatsonWatson
11
IBM Smarter Cities
100 Years of Innovations
Smarter CitiesSmarter Cities
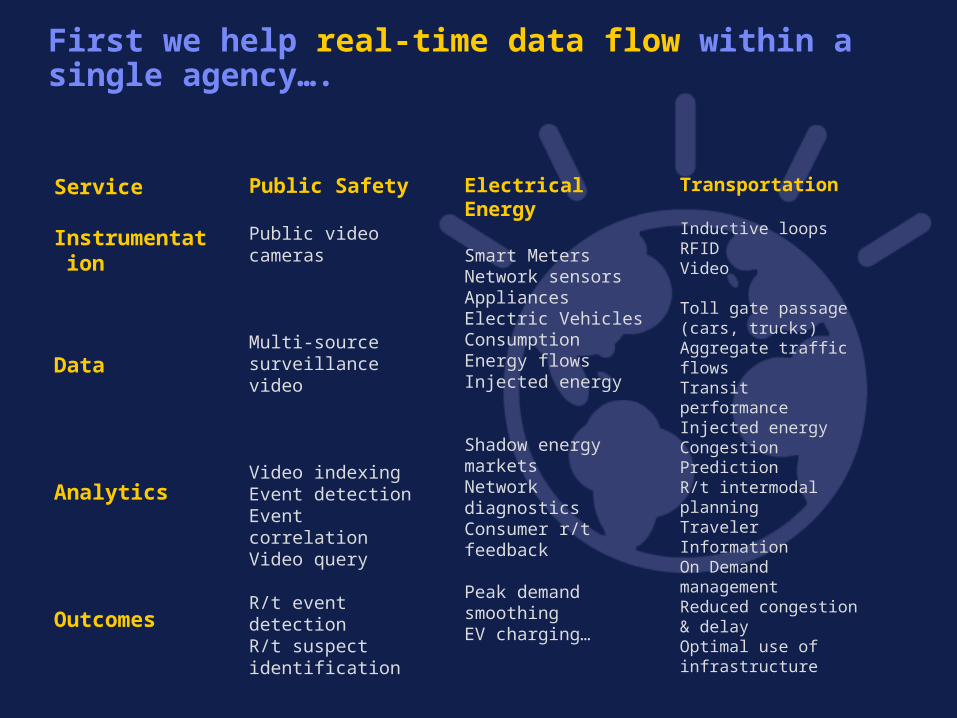
First we help real-time data flow within a single agency….
Service
Instrumentation
Data
Analytics
Outcomes
Electrical Energy
Smart MetersNetwork sensorsAppliancesElectric VehiclesConsumptionEnergy flowsInjected energy
Shadow energy marketsNetwork diagnosticsConsumer r/t feedback
Peak demand smoothingEV charging…
Transportation
Inductive loopsRFIDVideo
Toll gate passage (cars, trucks)Aggregate traffic flowsTransit performanceInjected energyCongestion PredictionR/t intermodal planningTraveler InformationOn Demand managementReduced congestion & delayOptimal use of infrastructure
Public Safety
Public video cameras
Multi-source surveillance video
Video indexingEvent detectionEvent correlationVideo query
R/t event detectionR/t suspect identification
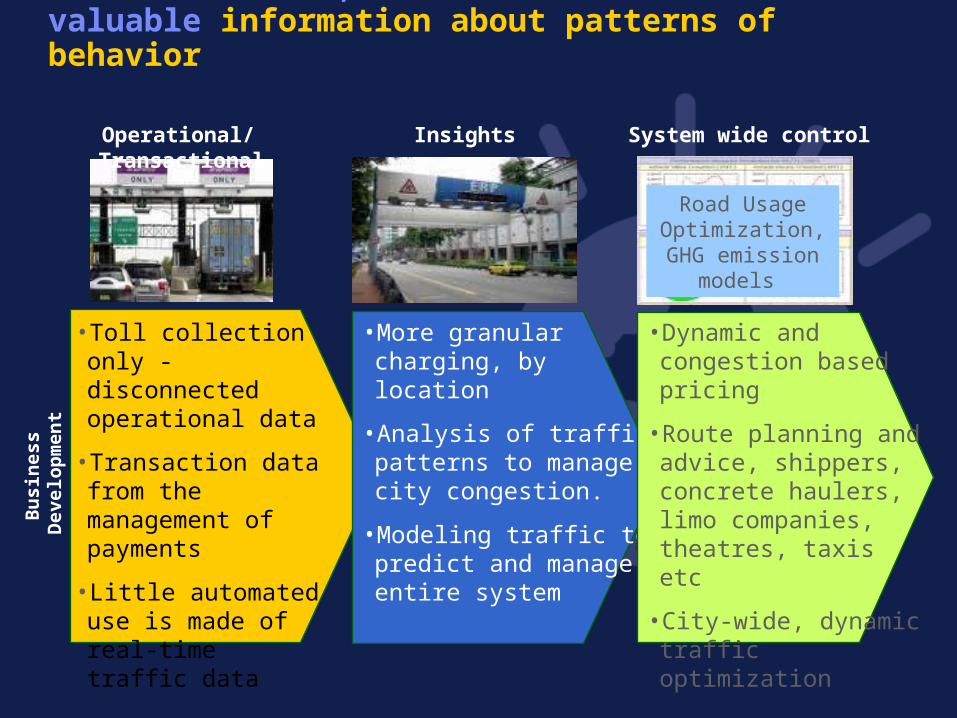
…this real-time, real-world data contains valuable information about patterns of behavior
Operational/Transactional
Road Usage Optimization,
GHG emission models
• More granular charging, by location
• Analysis of traffic patterns to manage city congestion.
• Modeling traffic to predict and manage entire system
• Dynamic and congestion based pricing
• Route planning and advice, shippers, concrete haulers, limo companies, theatres, taxis etc
• City-wide, dynamic traffic optimization
• Toll collection only - disconnected operational data
• Transaction data from the management of payments
• Little automated use is made of real-time traffic data
Bu
sin
ess
Dev
elo
pm
ent
Operational/ Transactional Insights System wide control
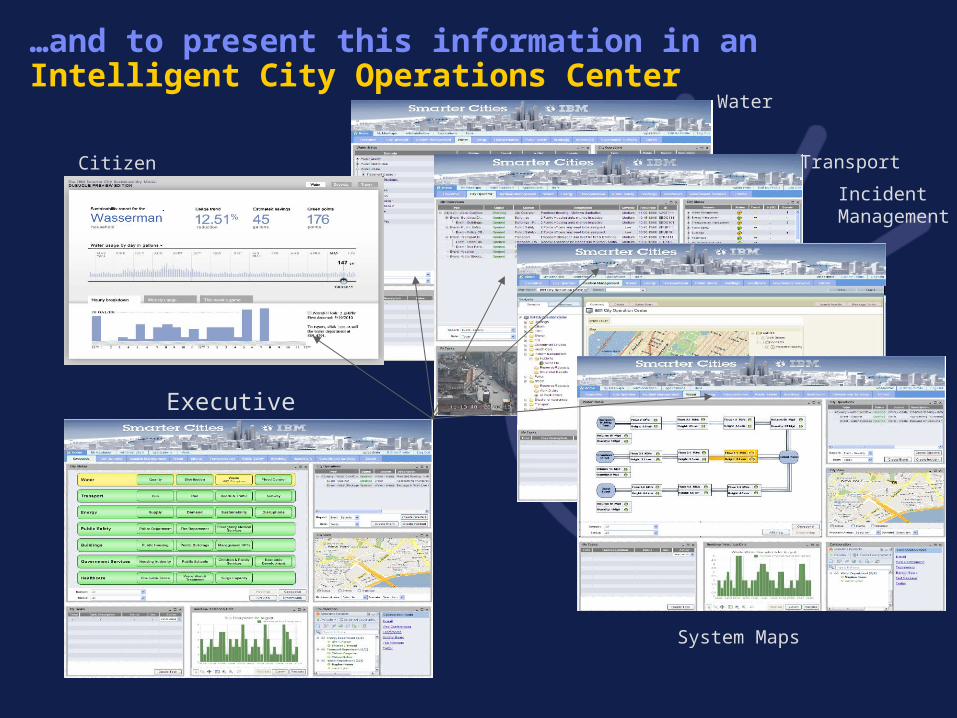
Executive
Citizen
Water
Transport
Incident Management
System Maps
…and to present this information in an Intelligent City Operations Center
Intelligent City Operation Centre
Copyright Colin Harrison 2009
16
IBM Smarter Cities
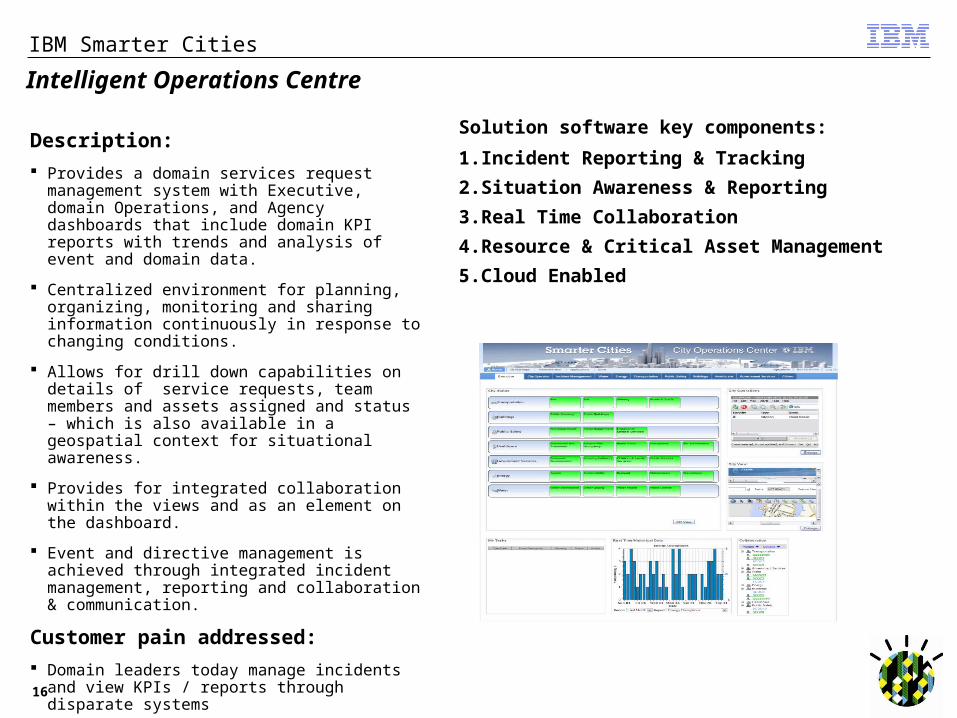
Description:
Provides a domain services request management system with Executive, domain Operations, and Agency dashboards that include domain KPI reports with trends and analysis of event and domain data.
Centralized environment for planning, organizing, monitoring and sharing information continuously in response to changing conditions.
Allows for drill down capabilities on details of service requests, team members and assets assigned and status – which is also available in a geospatial context for situational awareness.
Provides for integrated collaboration within the views and as an element on the dashboard.
Event and directive management is achieved through integrated incident management, reporting and collaboration & communication.
Customer pain addressed:
Domain leaders today manage incidents and view KPIs / reports through disparate systems
Lack of domain to domain coordination and collaboration in the planning and execution of events
Solution software key components:
1. Incident Reporting & Tracking
2. Situation Awareness & Reporting
3. Real Time Collaboration
4. Resource & Critical Asset Management
5. Cloud Enabled
Intelligent Operations Centre
17
IBM Smarter Cities
Description:
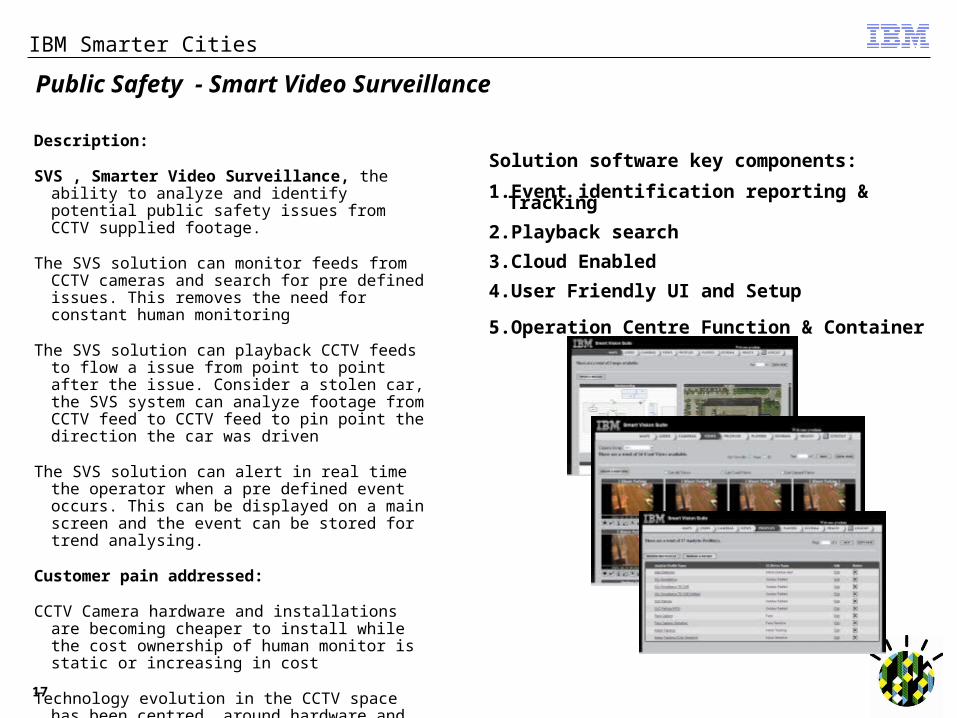
SVS , Smarter Video Surveillance, the ability to analyze and identify potential public safety issues from CCTV supplied footage.
The SVS solution can monitor feeds from CCTV cameras and search for pre defined issues. This removes the need for constant human monitoring
The SVS solution can playback CCTV feeds to flow a issue from point to point after the issue. Consider a stolen car, the SVS system can analyze footage from CCTV feed to CCTV feed to pin point the direction the car was driven
The SVS solution can alert in real time the operator when a pre defined event occurs. This can be displayed on a main screen and the event can be stored for trend analysing.
Customer pain addressed:
CCTV Camera hardware and installations are becoming cheaper to install while the cost ownership of human monitor is static or increasing in cost
Technology evolution in the CCTV space has been centred around hardware and not software analyzing
Public Safety - Smart Video Surveillance
Solution software key components:
1. Event identification reporting & Tracking
2. Playback search
3. Cloud Enabled
4. User Friendly UI and Setup
5. Operation Centre Function & Container
18
IBM Smarter Cities
18
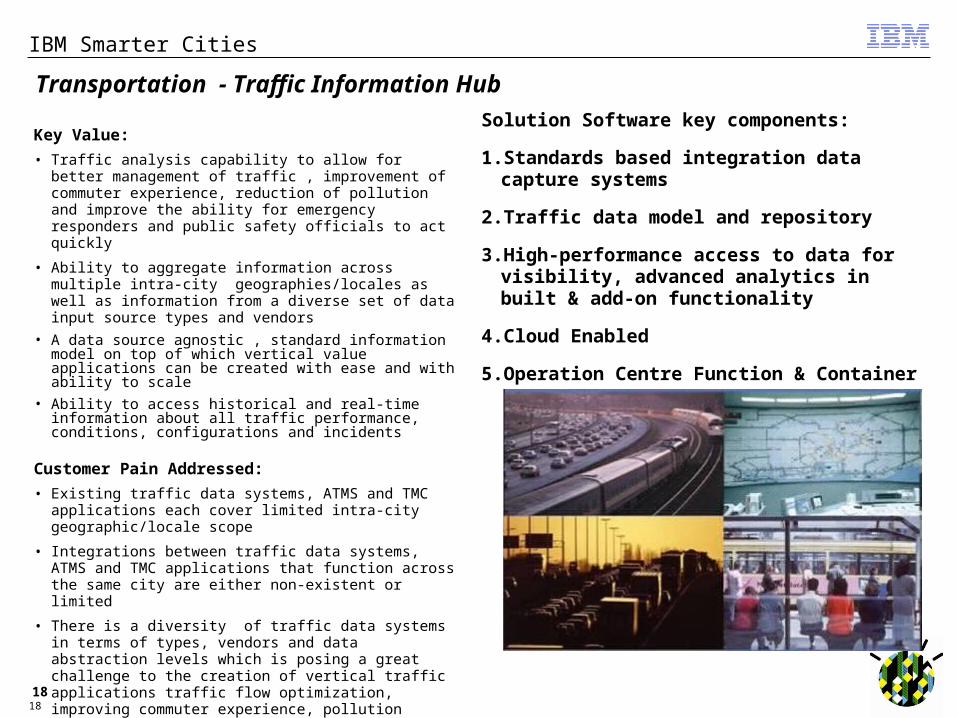
Key Value:
• Traffic analysis capability to allow for better management of traffic , improvement of commuter experience, reduction of pollution and improve the ability for emergency responders and public safety officials to act quickly
• Ability to aggregate information across multiple intra-city geographies/locales as well as information from a diverse set of data input source types and vendors
• A data source agnostic , standard information model on top of which vertical value applications can be created with ease and with ability to scale
• Ability to access historical and real-time information about all traffic performance, conditions, configurations and incidents
Customer Pain Addressed:
• Existing traffic data systems, ATMS and TMC applications each cover limited intra-city geographic/locale scope
• Integrations between traffic data systems, ATMS and TMC applications that function across the same city are either non-existent or limited
• There is a diversity of traffic data systems in terms of types, vendors and data abstraction levels which is posing a great challenge to the creation of vertical traffic applications traffic flow optimization, improving commuter experience, pollution reduction & emergency response
• There is no way to have city-wide visibility for traffic performance, conditions, configurations and incidents
Solution Software key components:
1. Standards based integration data capture systems
2. Traffic data model and repository
3. High-performance access to data for visibility, advanced analytics in built & add-on functionality
4. Cloud Enabled
5. Operation Centre Function & Container
Transportation - Traffic Information Hub
19
IBM Smarter Cities
19
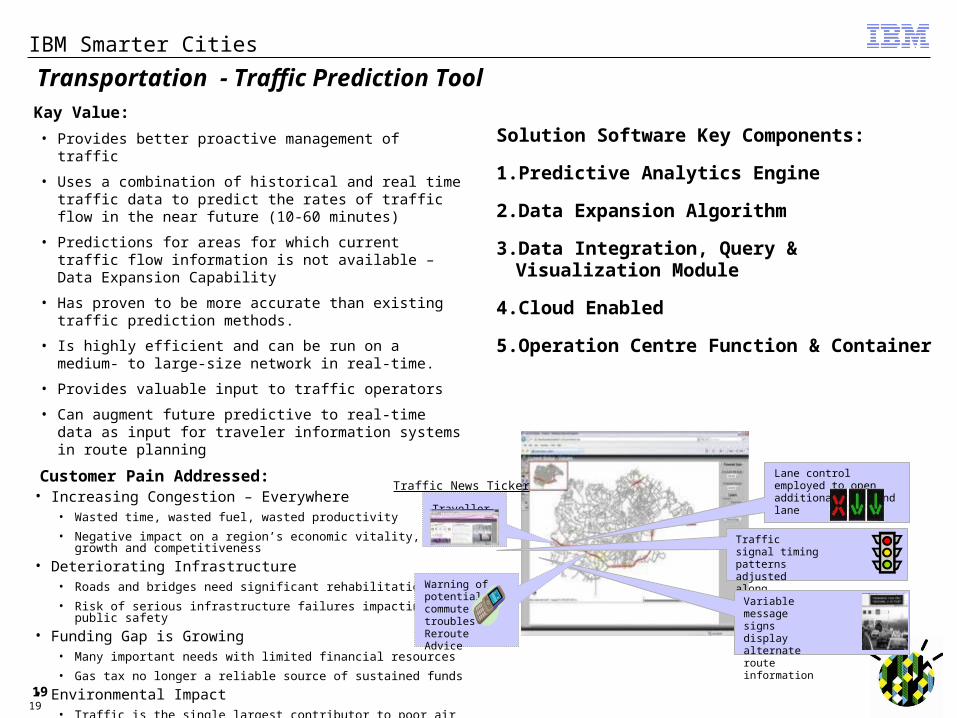
Kay Value:
• Provides better proactive management of traffic
• Uses a combination of historical and real time traffic data to predict the rates of traffic flow in the near future (10-60 minutes)
• Predictions for areas for which current traffic flow information is not available – Data Expansion Capability
• Has proven to be more accurate than existing traffic prediction methods.
• Is highly efficient and can be run on a medium- to large-size network in real-time.
• Provides valuable input to traffic operators
• Can augment future predictive to real-time data as input for traveler information systems in route planning
Customer Pain Addressed:• Increasing Congestion – Everywhere
• Wasted time, wasted fuel, wasted productivity
• Negative impact on a region’s economic vitality, growth and competitiveness
• Deteriorating Infrastructure• Roads and bridges need significant rehabilitation
• Risk of serious infrastructure failures impacting public safety
• Funding Gap is Growing• Many important needs with limited financial resources
• Gas tax no longer a reliable source of sustained funds
• Environmental Impact• Traffic is the single largest contributor to poor air quality
• Negative impact on health and quality of life
• Safety• Traffic crash statistics improved; yet, always more to do
Lane control employed to open additional outbound lane
Traffic signal timing patterns adjusted along parallel arterials
Variable message signs display alternate route information
Warning of potential commute troubles -Reroute Advice
Traveller Portal
Traffic News Ticker
Solution Software Key Components:
1. Predictive Analytics Engine
2. Data Expansion Algorithm
3. Data Integration, Query & Visualization Module
4. Cloud Enabled
5. Operation Centre Function & Container
Transportation - Traffic Prediction Tool
20
IBM Smarter Cities
20
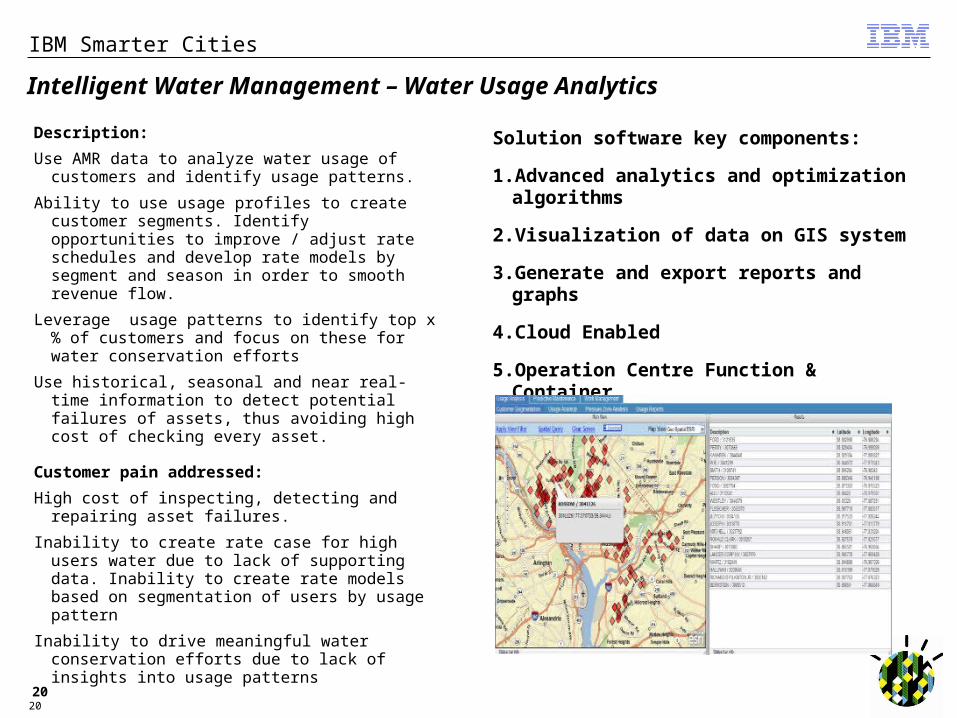
Description:
Use AMR data to analyze water usage of customers and identify usage patterns.
Ability to use usage profiles to create customer segments. Identify opportunities to improve / adjust rate schedules and develop rate models by segment and season in order to smooth revenue flow.
Leverage usage patterns to identify top x% of customers and focus on these for water conservation efforts
Use historical, seasonal and near real-time information to detect potential failures of assets, thus avoiding high cost of checking every asset.
Customer pain addressed:
High cost of inspecting, detecting and repairing asset failures.
Inability to create rate case for high users water due to lack of supporting data. Inability to create rate models based on segmentation of users by usage pattern
Inability to drive meaningful water conservation efforts due to lack of insights into usage patterns
Solution software key components:
1. Advanced analytics and optimization algorithms
2. Visualization of data on GIS system
3. Generate and export reports and graphs
4. Cloud Enabled
5. Operation Centre Function & Container
Intelligent Water Management – Water Usage Analytics
21
IBM Smarter Cities
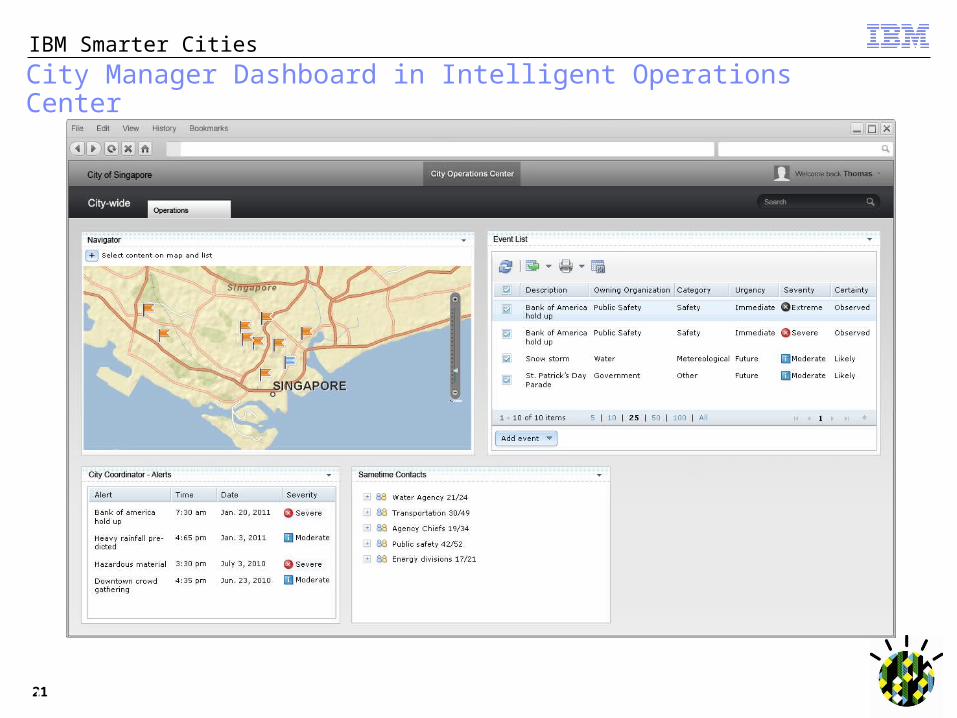
City Manager Dashboard in Intelligent Operations Center
21
22
IBM Smarter Cities
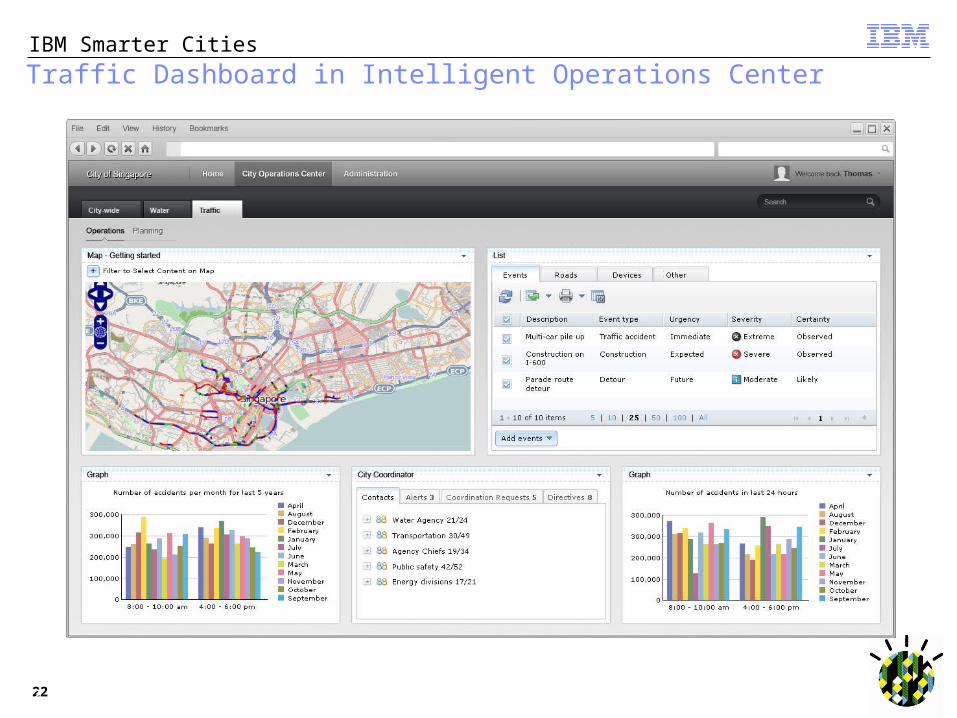
Traffic Dashboard in Intelligent Operations Center
22
23
IBM Smarter Cities
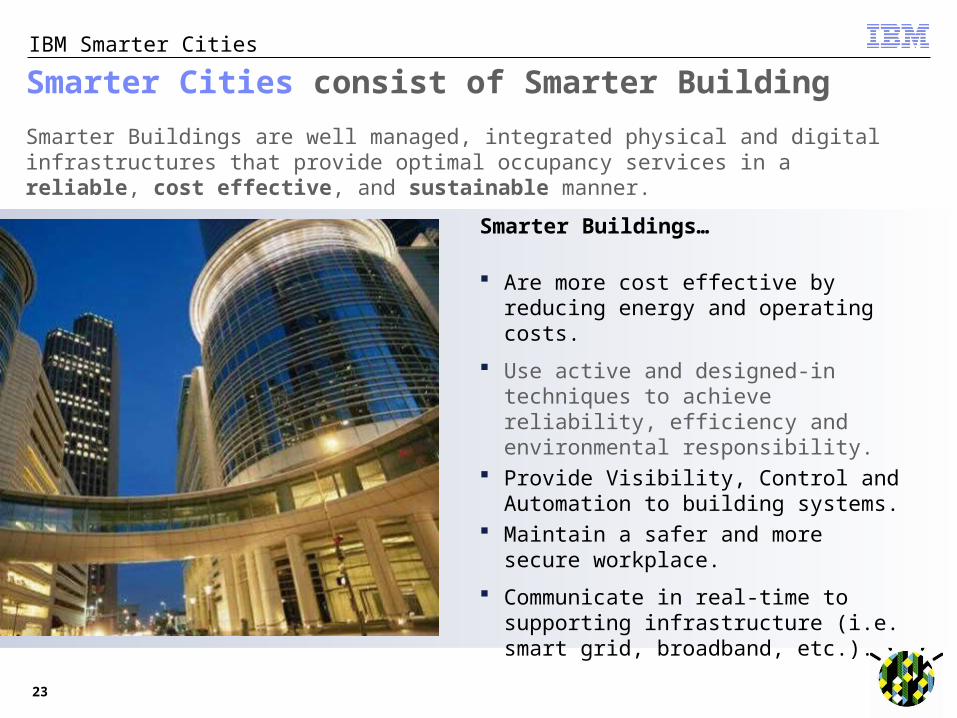
Smarter Cities consist of Smarter Building
Smarter Buildings…
Are more cost effective by reducing energy and operating costs.
Use active and designed-in techniques to achieve reliability, efficiency and environmental responsibility.
Provide Visibility, Control and Automation to building systems.
Maintain a safer and more secure workplace.
Communicate in real-time to supporting infrastructure (i.e. smart grid, broadband, etc.).
Smarter Buildings are well managed, integrated physical and digital infrastructures that provide optimal occupancy services in a reliable, cost effective, and sustainable manner.
24
IBM Smarter Cities
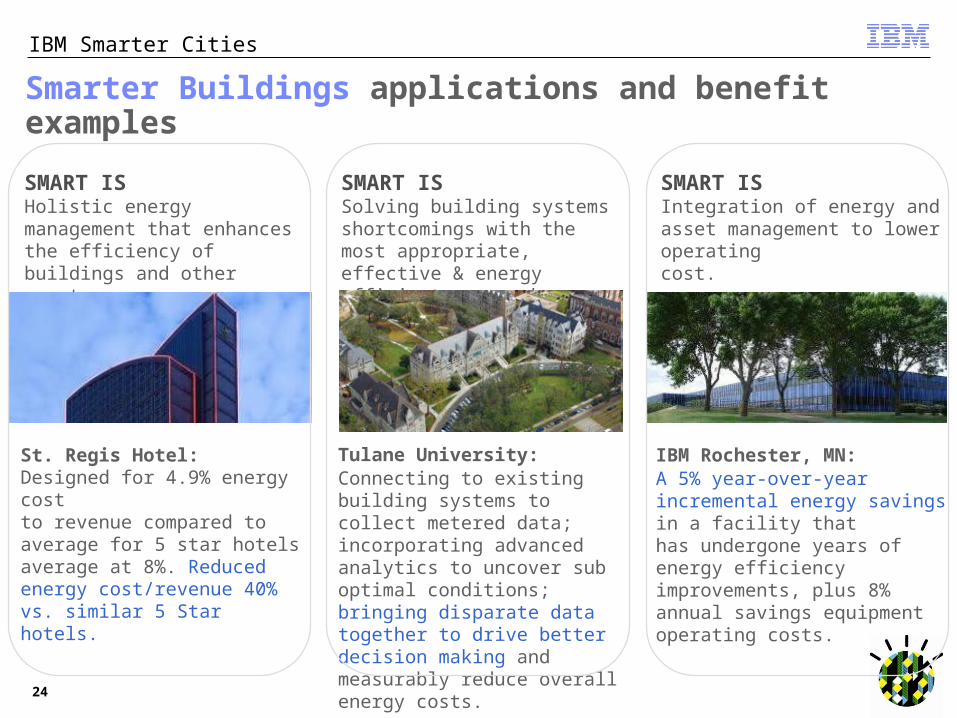
Smarter Buildings applications and benefit examples
SMART ISHolistic energy management that enhances the efficiency of buildings and other assets.
St. Regis Hotel:Designed for 4.9% energy cost to revenue compared to average for 5 star hotels average at 8%. Reduced energy cost/revenue 40% vs. similar 5 Star hotels.
SMART ISSolving building systems shortcomings with the most appropriate, effective & energy efficient approaches.
Tulane University:Connecting to existing building systems to collect metered data; incorporating advanced analytics to uncover sub optimal conditions; bringing disparate data together to drive better decision making and measurably reduce overall energy costs..
IBM Rochester, MN:A 5% year-over-year incremental energy savings in a facility that has undergone years of energy efficiency improvements, plus 8% annual savings equipment operating costs.
SMART ISIntegration of energy and asset management to lower operating cost.

25
•Smarter Cities - Examples
Copyright Colin Harrison 2010
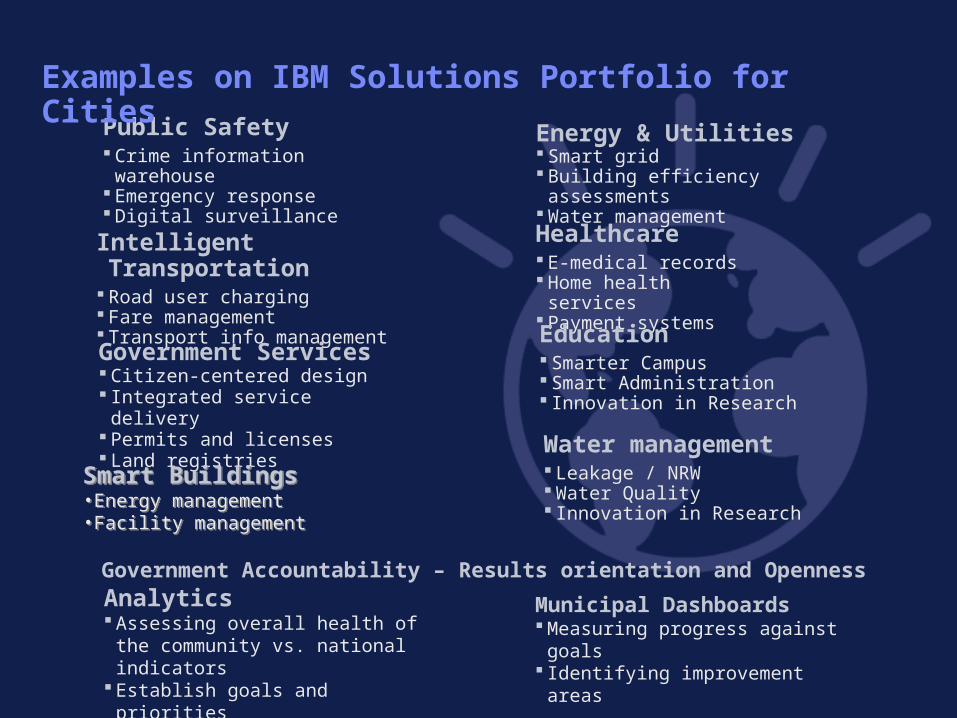
Analytics Assessing overall health of the
community vs. national indicators Establish goals and priorities
Municipal Dashboards Measuring progress against goals Identifying improvement areas
Public Safety Crime information warehouse Emergency response Digital surveillance
Energy & Utilities Smart grid Building efficiency assessments Water management
Intelligent Transportation Road user charging Fare management Transport info management
Healthcare E-medical records Home health services Payment systems
Education Smarter Campus Smart Administration Innovation in Research
Government Services Citizen-centered design Integrated service delivery Permits and licenses Land registries
Examples on IBM Solutions Portfolio for Cities
Government Accountability – Results orientation and Openness
Water management Leakage / NRW Water Quality Innovation in Research
Smart Buildings•Energy management•Facility management
Smart Buildings•Energy management•Facility management
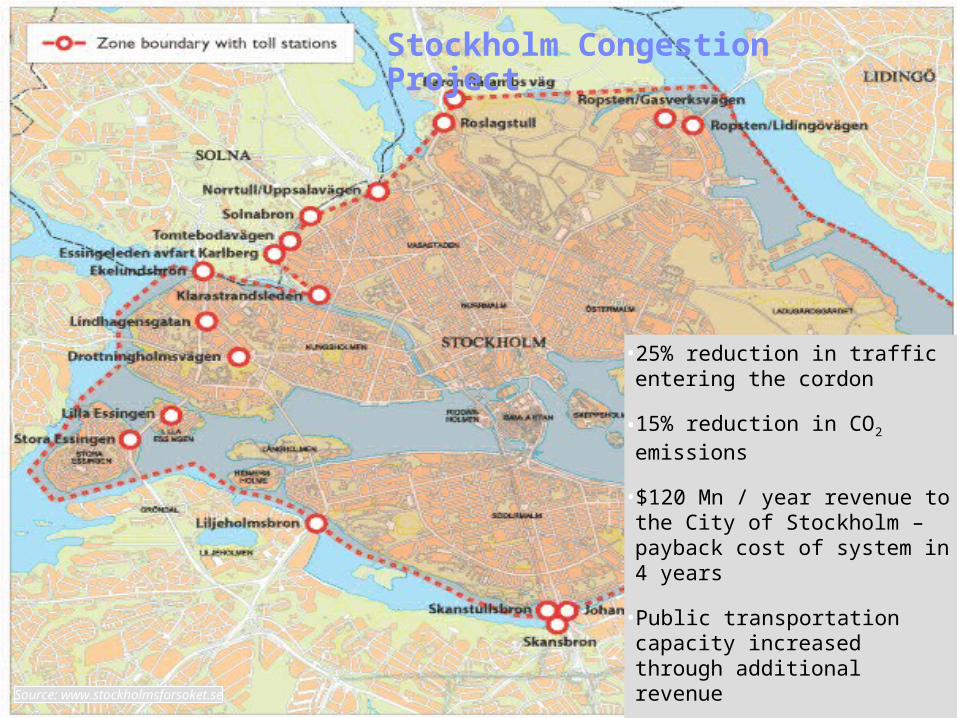
Stockholm Congestion Project
• 25% reduction in traffic entering the cordon
• 15% reduction in CO2 emissions
• $120 Mn / year revenue to the City of Stockholm – payback cost of system in 4 years
• Public transportation capacity increased through additional revenueSource: www.stockholmsforsoket.se
28
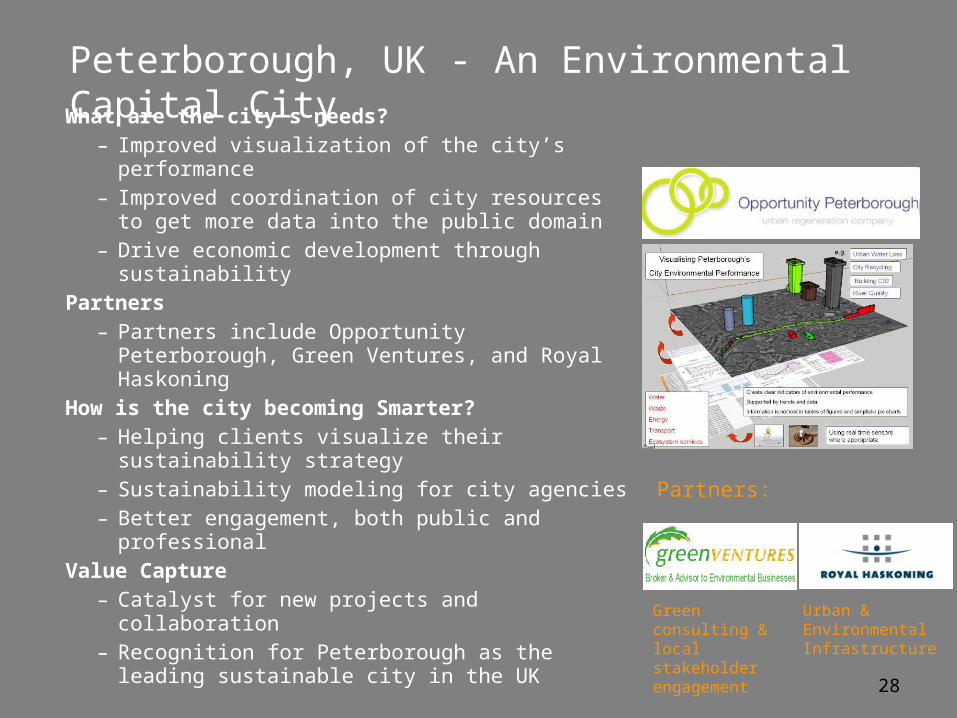
What are the city's needs?– Improved visualization of the city’s
performance– Improved coordination of city resources to
get more data into the public domain– Drive economic development through
sustainabilityPartners
– Partners include Opportunity Peterborough, Green Ventures, and Royal Haskoning
How is the city becoming Smarter? – Helping clients visualize their sustainability
strategy– Sustainability modeling for city agencies – Better engagement, both public and
professionalValue Capture
– Catalyst for new projects and collaboration– Recognition for Peterborough as the leading
sustainable city in the UK
Peterborough, UK - An Environmental Capital City
Partners:
Green consulting & local stakeholder engagement
Urban & Environmental Infrastructure
29
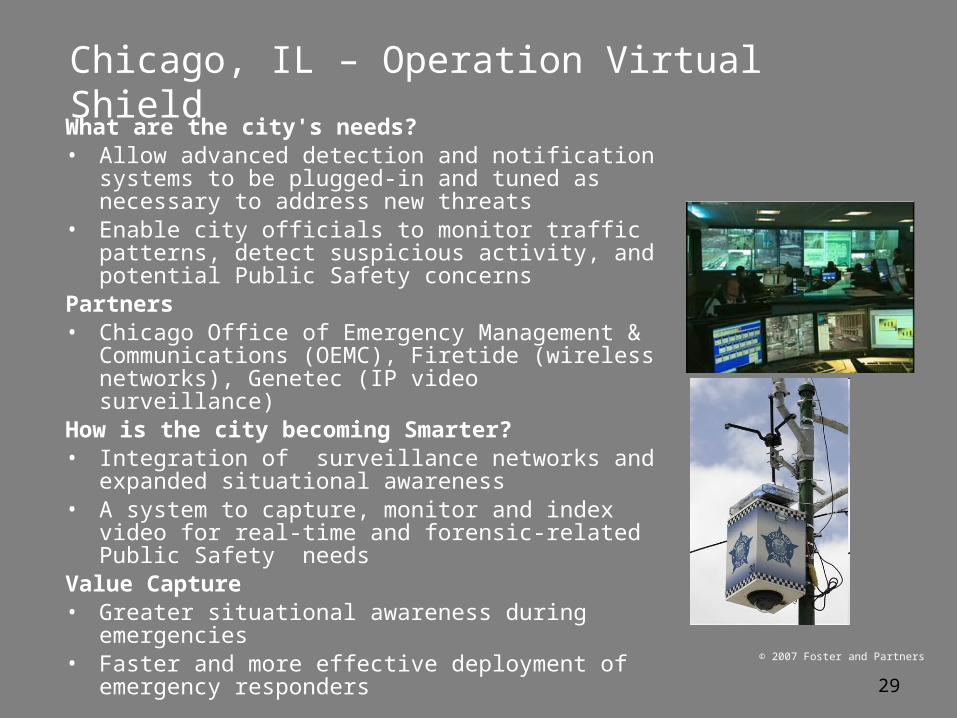
What are the city's needs?• Allow advanced detection and notification
systems to be plugged-in and tuned as necessary to address new threats
• Enable city officials to monitor traffic patterns, detect suspicious activity, and potential Public Safety concerns
Partners• Chicago Office of Emergency Management &
Communications (OEMC), Firetide (wireless networks), Genetec (IP video surveillance)
How is the city becoming Smarter? • Integration of surveillance networks and
expanded situational awareness • A system to capture, monitor and index video
for real-time and forensic-related Public Safety needs
Value Capture• Greater situational awareness during
emergencies• Faster and more effective deployment of
emergency responders
Chicago, IL – Operation Virtual Shield
© 2007 Foster and Partners
30
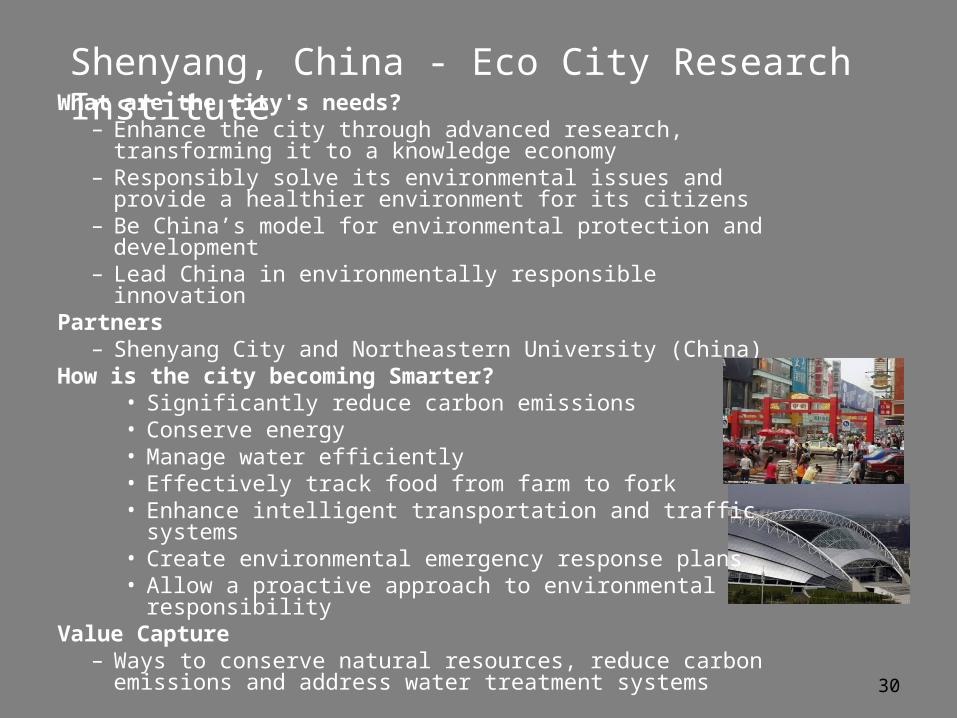
What are the city's needs?– Enhance the city through advanced research,
transforming it to a knowledge economy– Responsibly solve its environmental issues and provide
a healthier environment for its citizens– Be China’s model for environmental protection and
development– Lead China in environmentally responsible innovation
Partners– Shenyang City and Northeastern University (China)
How is the city becoming Smarter? • Significantly reduce carbon emissions• Conserve energy• Manage water efficiently• Effectively track food from farm to fork• Enhance intelligent transportation and traffic
systems• Create environmental emergency response plans• Allow a proactive approach to environmental
responsibilityValue Capture
– Ways to conserve natural resources, reduce carbon emissions and address water treatment systems
Shenyang, China - Eco City Research Institute
31
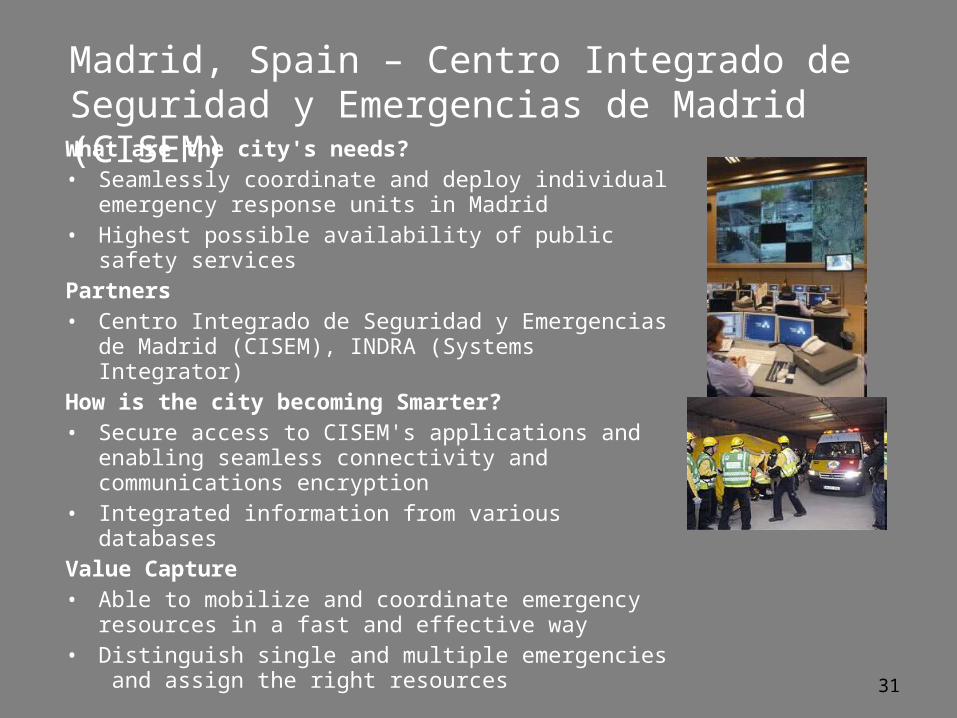
What are the city's needs?• Seamlessly coordinate and deploy individual
emergency response units in Madrid• Highest possible availability of public safety
servicesPartners• Centro Integrado de Seguridad y Emergencias
de Madrid (CISEM), INDRA (Systems Integrator)How is the city becoming Smarter? • Secure access to CISEM's applications and
enabling seamless connectivity and communications encryption
• Integrated information from various databasesValue Capture• Able to mobilize and coordinate emergency
resources in a fast and effective way• Distinguish single and multiple emergencies
and assign the right resources
Madrid, Spain – Centro Integrado de Seguridad y Emergencias de Madrid (CISEM)
32
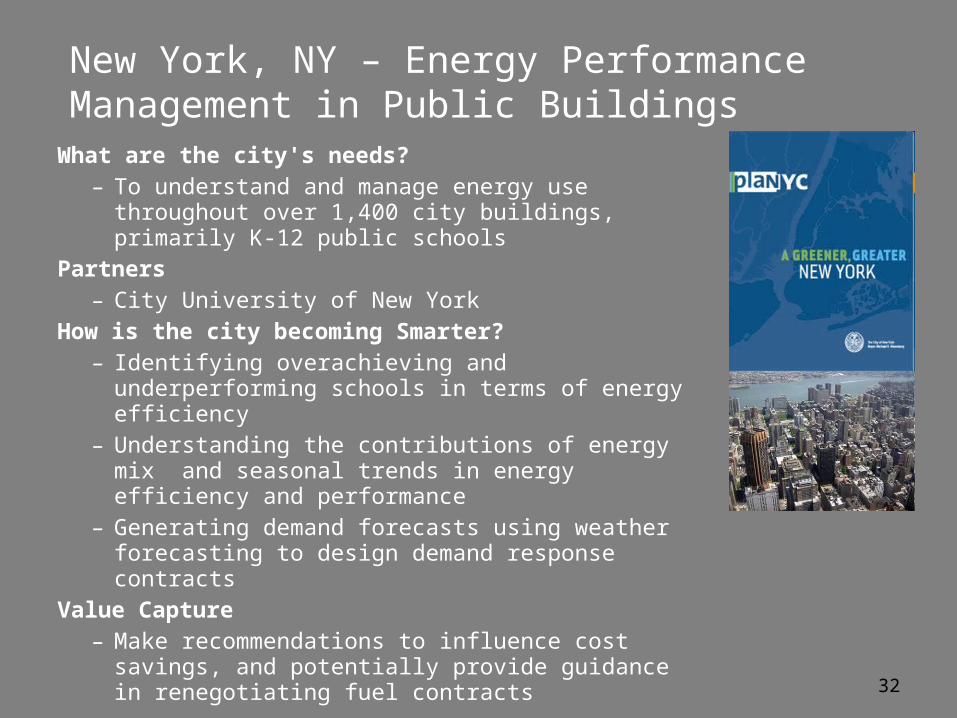
What are the city's needs?– To understand and manage energy use
throughout over 1,400 city buildings, primarily K-12 public schools
Partners– City University of New York
How is the city becoming Smarter? – Identifying overachieving and underperforming
schools in terms of energy efficiency– Understanding the contributions of energy mix
and seasonal trends in energy efficiency and performance
– Generating demand forecasts using weather forecasting to design demand response contracts
Value Capture– Make recommendations to influence cost
savings, and potentially provide guidance in renegotiating fuel contracts
New York, NY – Energy Performance Management in Public Buildings
33
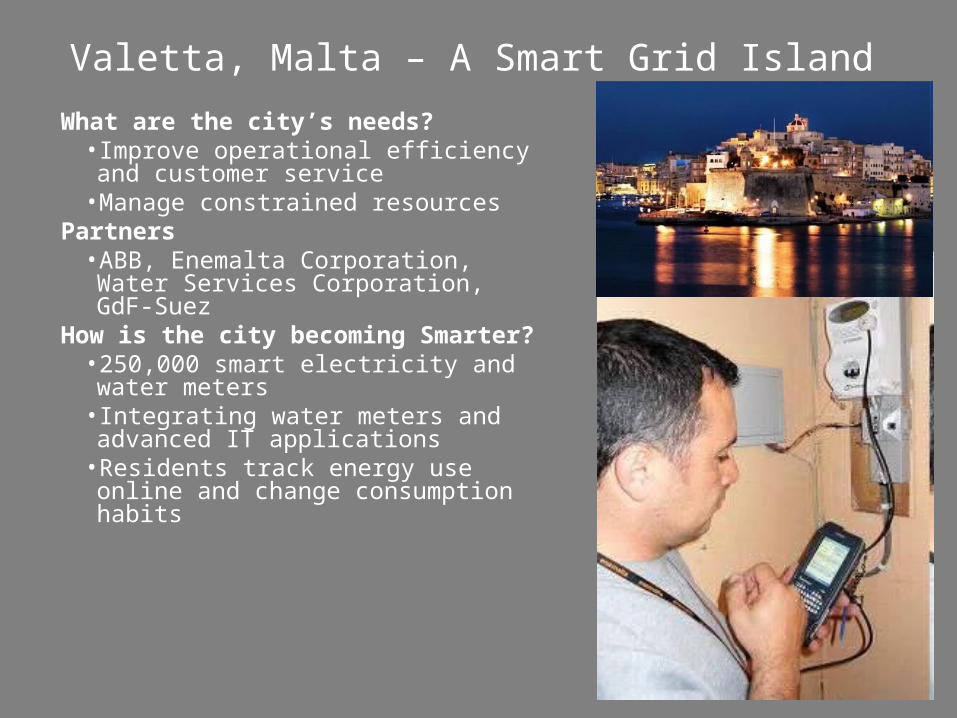
Valetta, Malta – A Smart Grid Island
What are the city’s needs?•Improve operational efficiency and customer service
•Manage constrained resourcesPartners
•ABB, Enemalta Corporation, Water Services Corporation, GdF-Suez
How is the city becoming Smarter? •250,000 smart electricity and water meters
•Integrating water meters and advanced IT applications
•Residents track energy use online and change consumption habits
IBM Internal Use
Let’s Build Smarter Buildings…Let’s Build Smarter Cities…Let’s Build a Smarter Planet…
Please visit the IBM booth for more details
Related Documents