J. Phys II Franc-e 4 (1994) 100I-1019 JUNE 1994, PAGE 1001 Classification Physics Abstracts 61.25H 82.70 05.90 Further evidence of liquid-like correlations in polyelectrolyte solutions Isabelle Morfin, Wayne F. Reed (**), Marguerite Rinaudo and Redouane Borsali (*) CERMAV-CNRS and University Joseph Fourier, P-O- Box 53. 38041 Grenoble Cedex 9, France (Receii'ed 29 June 1993~ revised 21 February 1994, accepted 3 March 1994) Abstract. Elastic. quasi elastic light scattering and viscosity experiments were used to investigate polyelectrolytic polysaccharide succinoglycan solutions at low solute concentration C~, and salt concentration C,. The highest degree of « organization » in the solution necessary to describe the observations is a simple liquid type correlation, manifested by broad angular static and dynamic scattering maxima of visible light for solutions at very low ionic strength. Letting the solutions stand undisturbed for a few days did not lead to a sharpening of the broad maxima, nor did lowering the temperature. The positions of these maxima scale roughly as C ('~. By adding salt, the maxima were found to maintain roughly the same position. The reciprocal diffusion coefficient D~ '(q) corresponding to the liquid-like correlation state followed the intensity maxima, as has often been demonstrated for similar systems. No « slow mode » or « extraordinary regime » of diffusion was found associated with the static and dynamic light scattering maxima although extreme care in filtration of solution was necessary to avoid a spurious slow diffusional mode due to aggregates. 1. Introduction. The solution properties of polyelectrolytes in media of different ionic strength are characterized by complex mechanisms involving interacting polyions, counterions and co-ions. Over the past decade there has been considerable interest in the static and dynamic properties of such systems from both theoretical and experimental points of view. Theoretical models include : crystal-solution of rods Ii, notion of correlation hole [2-5], concept of electrostatic persistence length [6-8], counterion condensation [9], mode-mode coupling theory [10-12], entangled solution behavior [13,14], phase transitions [15,16] and weakly charged polyelectrolyte solutions based on the random phase approximation [17]. Various experimental techniques have been used to understand the behavior of such charged complex systems small angle X- (*) To whom correspondence should be addressed. (**) On Sabbatical leave from Physics department, Tulane University, New orleans, LA 70118 USA.

Welcome message from author
This document is posted to help you gain knowledge. Please leave a comment to let me know what you think about it! Share it to your friends and learn new things together.
Transcript
J. Phys II Franc-e 4 (1994) 100I-1019 JUNE 1994, PAGE 1001
Classification
Physics Abstracts
61.25H 82.70 05.90
Further evidence of liquid-like correlations in polyelectrolytesolutions
Isabelle Morfin, Wayne F. Reed (**), Marguerite Rinaudo and Redouane Borsali (*)
CERMAV-CNRS and University Joseph Fourier, P-O- Box 53. 38041 Grenoble Cedex 9, France
(Receii'ed 29 June 1993~ revised 21 February 1994, accepted 3 March 1994)
Abstract. Elastic. quasi elastic light scattering and viscosity experiments were used to
investigate polyelectrolytic polysaccharide succinoglycan solutions at low solute concentration
C~, and salt concentration C,. The highest degree of«
organization»
in the solution necessary to
describe the observations is a simple liquid type correlation, manifested by broad angular static and
dynamic scattering maxima of visible light for solutions at very low ionic strength. Letting the
solutions stand undisturbed for a few days did not lead to a sharpening of the broad maxima, nor
did lowering the temperature. The positions of these maxima scale roughly as C ('~. By adding salt,
the maxima were found to maintain roughly the same position. The reciprocal diffusion coefficient
D~ '(q) corresponding to the liquid-like correlation state followed the intensity maxima, as has
often been demonstrated for similar systems. No«
slow mode» or «
extraordinary regime»
of
diffusion was found associated with the static and dynamic light scattering maxima although
extreme care in filtration of solution was necessary to avoid a spurious slow diffusional mode due
to aggregates.
1. Introduction.
The solution properties of polyelectrolytes in media of different ionic strength are characterized
by complex mechanisms involving interacting polyions, counterions and co-ions. Over the
past decade there has been considerable interest in the static and dynamic properties of such
systems from both theoretical and experimental points of view. Theoretical models include :
crystal-solution of rods Ii, notion of correlation hole [2-5], concept of electrostatic persistencelength [6-8], counterion condensation [9], mode-mode coupling theory [10-12], entangled
solution behavior [13,14], phase transitions [15,16] and weakly charged polyelectrolyte
solutions based on the random phase approximation [17]. Various experimental techniques
have been used to understand the behavior of such charged complex systems small angle X-
(*) To whom correspondence should be addressed.
(**) On Sabbatical leave from Physics department, Tulane University, New orleans, LA 70118 USA.

1002 JOURNAL DE PHYSIQUE II N° 6
rays [18, 19] and neutron [20, 21] scattering, elastic and quasi elastic light scattering [22, 33],and viscosity [34-37].
A question which seems to have plagued researchers involved with dilute polyelectrolytesolutions is what type of
« structure » or «organization
»exists in polyelectrolyte solutions
without added salt or at low ionic strength. A variety of hypotheses, involving high degrees of
long-range order, no long-range order, domain formation, exotic mechanisms for interaction,
conventional mechanisms of interaction,«
extraordinary regimes»
of diffusion, absence of
«extraordinary regimes », etc. have marked the work in this area during the past decade.
Rather than reviewing and comparing the various theories, the present work is offered as a
case study in which it is unnecessary to involve notions of long-range order,«
extraordinaryregimes », domain formation or any other unusual mechanism involved in the properties of
these dilute polyelectrolyte solutions. These results are consistent with the body of evidence
produced over the last several years [?4-28, 38, 39].
Specifically, the broad angular scattering maxima found for dilute polyelectrolyte solutions
in this study are most simply interpreted in terms of ordinary liquid-like correlations, in which,
due to their electrostatically enhanced volume, there are strong repulsive interactions between
nearest neighbors. Although not observed in this work, there might be very weak secondaryand even feebler tertiary maxima, corresponding to weak correlations between second and
third neighbors, just as in normal liquids. One notes, as we shall show later, that all these
polyelectrolyte features can be observed only when all possible aggregates are removed byfiltration on a proper type of membrane and pore size.
2. Experimental section.
2. I MATERIALS. METHODS AND SAMPLE PREPARATION. Succinoglycan (SG) is an exocellu-
lar polysaccharide produced by the bacteria Pseudomonas sp. NCIB II 592. Its repeat unit is
composed of D-glucose:D-galactose:pyruvate:succinate in molar ratio of 7:1:1:1 in some cases
the content of pyruvate and succinate can be modified by experimental conditions [40, 41].The chemical structure of the repeat unit is :
~4)-fl-D-Glcp-(1~4)-fl-D-Glcp-(1~3)-fl-D-Galp-(I-4)-fl-D-Glcp-(1
6
I
fl D Glcp (1~3) fl D Glcp (1~3) fl D Glcp (I -+6) fl D Glcp~ ~40 60~ / 0 2 moles succinate monoester
~
0 2 moles acetate/ ~
CH~ C02H
In dilute and salt-free solution this polysaccharide adopts a disordered conformation but in
presence of external salt its conformation is a single helical chain [40].
The starting material was a bacterial broth supplied by Shell Research limited (SittingboumeResearch Center, Sittingboume, Kent England). The samples were obtained by alcohol

N° 6 LIQUID-LIKE CORRELATIONS IN POLYELECTROLYTE SOLUTIONS 1003
precipitation and subsequent reduced pressure room temperature drying, as has been alreadydescribed [40, 41].
In this study, three different SG samples were studied. Virtually all the results presented here
are from a fairly narrow molecular weight distribution of sonicated SG. Similar scatteringbehavior in all aspects was found also for the native SG sample. We concentrated on the
sonicated sample because the lower mass solutions were easier to filter and handle.
Pure water was doubly distilled, de-ionized and filtered in a Millipore Alpha-Q its
conductivity was less than 0.05 ~LS corresponding to an equivalent Nacl concentration of
around 3.3 x10~7 M. SG solutions were allowed to dissolve and equilibrate few days prior to
filtration and measurements.
The characteristics of SG in its disordered conformation corresponds to one charge every16.8h, which gives a linear charge parameter A
=
0.42 as deduced from the chemical
structure in the Na-salt form. The molar mass per unit length is 66.7 g/I.mol. These values
were obtained from the ~H NMR spectrum in D20 in the presence of an internal standard
which gave 0.98 pyruvate and 0.24 succinate groups/repeat unit. In this disordered form the
contribution to the total salt concentration due to the SG counterions and bare polyelectrolyte is
roughly C~ ~[equill]=
0.864 x C~(g/cm~). In excess of salt, the SG macromolecule adoptsand extended helical conformation (stabilized by intramolecular H-bonds) the above values
correspond to one charge every 15.65 h, A=
0.45 and 73.7 g/I mol for the molar mass perunit length. The helix-coil transition is induced by temperature increase or NaOH addition.
Like Xanthan gum, the transition from disordered to helical state of SG is only 10 fb of changein axial ratio. This explains why the molar mass/unit length and the charge parameter are
slightly different in both conformations.
We give upper and lower estimates of the overlap concentration C * based on the well-
known formula C* =MJ(N~4 wR~/3), where R is a characteristic dimension of the
molecule and N~ is Avogadro's number. We use the GPC results M~=
7.74 x10~ g/mol. The
lower limit is obtained by assuming the SG to be fully extended occupying a spherical volume
whose radius R is half the rod length. With R=
5 800 1, this gives C *=
1.57 x 10~ ~ g/cm~.The upper limit makes the assumption that R
=
(S~) ~~ where (S~) ~'~ is about 1001, the
roughly constant value obtained at all C~, as discussed below. This givesC *
=
2.3 x10~~ g/cm~.
To eliminate dust and other large particles, all samples were filtered. Both the pore size and
material composition of the membrane filters used prior to light scattering experiments had
large effects on the light scattering results. Due to the relative solvent affinity and the degree of
swelling, the type of membrane (material) as well as the effective pore diameter indeed may
play an important role on the filtration. All filters were 2.5 cm diameter membranes held in a
stainless steel holder. The holders were attached via Luer lock fittings to glass syringes and
Steady manual pressure was used to filter the solutions. Three different types of filters were
used : Ii all solutions not otherwise noted were filtered through 0. I ~Lm cellulose nitrate filters
(CN) (Sartorius, W-3400, Germany). 2) Comparisons with filtration through 0.2 ~Lm cellulose
nitrate filters were also made (Sartorius), as well as comparisons with 3) 0. I ~Lm polyvinylidenedifluoride (PVDF) filters from Millipore which are more hydrophobic than the CN membranes.
Concentration losses upon filtering were estimated by different techniques (UV absorption and
conductivity) and found to be roughly on the order of 10 fb. All concentations in this work are
expressed in terms of weighed, dry material per ml of solvent, and thus represent an upper
limit.
2.2 EQUIPMENT AND DATA ANALYSIS.
2.2. I Static and dynamic light scattering- The elastic and quasi-elastic scattering measure-
ments were performed using the ALV (Langen-FRG) apparatus with an automatic goniometer

1004 JOURNAL DE PHYSIQUE II N° 6
table, a digital ratemeter and a temperature controlled sample cell. Temperature was
25 ± 0.I °C unless otherwise noted.
The scattered light of a vertically polarized A~= 48801argon laser (Spectra-
Physics 2020, 3 W, operating around 0.3 WI was measured at different angles in the range of
20-150° corresponding to 0.6 x10~~
<
q/1< 3.3 x 10~ ~ where q =
(4 wn/A~) sin (R/2),
the scattering angle, n the refractive index of the medium (n=
1.33 ). The reduced elastic
scattering I (q)/kC~, with k=
4w
~ n((dn/dc )~(I(°'/R~°')/A N~, was measured in steps of 5° in
the scattering angle, where n~ is the refractive index of standard (toluene), I(°' and
R~°°are respectively the intensity and the Rayleigh ratio of the standard at
=
90°,
(dn/dc ) the increment of refractive index, C~ the polyelectrolyte concentration, expressed in
g/cm3 and I (q) the intensity scattered by the polymer. All elastic intensities were calculated
according to standard procedures using toluene as reference with known absolute scattering
intensity.Because the total scattering intensity of the highly dilute SG in salt-free solution is scarcely
above the scattering level of pure water the slightest amount of scattering impurities (e.g.
«dust ») led to unacceptably noisy data. Consequently, an algorithm was written to extract
the minimum intensity reading from a group of typically 50 separate intensity readings at each
angle which are stored to disk by the ALV static data gathering program. The experimental and
theoretical justification for this procedure has been previously given [24].
The full homodyne autocorrelation functions of the Scattered intensity, also measured in
steps of 5° in the scattering angle, were obtained using the ALV-5000 autocorrelator from
ALV, Langen, FRG. The intermediate scattering function S(q, t) is related to the measured
homodyne intensity-intensity time correlation function by the Siegert-relation [42]
G~~~(q, t)=
B ii + ajS(q, t)j~] (I)
where B is the base line anda
is the spatial coherence factor depending upon the geometry of
the detection and the ratio of the intensity scattered by the polymer to that scattered by the
solvent. The autocorrelation functions of the scattered intensity were analyzed by means of the
cumulant method to yield the effective diffusion coefficient as a function of the scatteringangle. Additionally, inverse Laplace transform (ILT) and constrained regularization method
(Contin) developed by Provencher [43] were used to obtain the distribution A(r) of decaytimes. For the latter, a statistical parameter «
probability to reject»
is calculated for each
solution, and the suggested one is that closest to 0.5.
~~~~~~' ~~l
~~~
ml~ A (r e~ "'~~ dr (2)
B~
These methods are now routinely used to analyze the quasi elastic light scattering (QELS data
for polymer systems and allows the determination of the relaxation modes which characterize
the dynamic of such systems.
Static experiments were performed with a wide aperture for the phototube (300 ~m pinhole),whereas the dynamic experiments used the narrowest possible (typically 100 ~Lm in this range
of concentration).
2.2.2 Size exclusion chromatography. Size Exclusion Chromatography (SEC) characteri-
zation was carried out using a Waters150C ALC/GPC with multiple detectors a singlecapillary viscometer [44], a Wyatt Technology Dawn F multi-angle laser light scattering
detector (MALLS) with a vertically polarized He-Ne laser at ho=
6 3201, and a refractive
index detector built into the Waters unit. The simultaneous interfacting and operation of this
system, as well as problems and procedures in data analysis will be presented in a

N° 6 LIQUID-LIKE CORRELATIONS IN POLYELECTROLYTE SOLUTIONS 1005
forthcoming paper. With specially written software the Dawn F was also used for«
batch»
measurements on the SG I) Zimm plots, it) determination of (S~)"~ and second virial
coefficients, A~, versus salt concentration C~, and iii) dimensions and A~ versus [NaOH].
2.2.3 Viscosity measurements. The reduced viscosity ~~ =
(~ ~o)/~o C~, where ~~ is
the solvent viscosity, measurements were made with a Low Shear 30 cylinder in cupviscometer. This allowed measurements to be made on the Newtonian plateau. The viscosity
measurements made in pure water as solvent in the range of polymer concentration from
10~5g/cm3 to 10~3g/cm3, which includes the domain over which the light scatteringexperiments were performed. These solutions were also filtered through 0.I ~Lm and 0.2 ~Lm
cellulose nitrate membranes.
3. Results and discussion.
3.I SEC RESULTS. Figure I shows SEC results for filtered through 0.I ~Lm cellulose
nitrate. using the increment of refractive index (dn/dc )=
0.154 for SG in 100 mM NH~NH4yielded number, weight and z-average molecular weights M~, M~, M~ respectively given in the
figure. The slope of the root mean square radius of gyration (S~) ~'~ is 0.584 +/- 0.04. The
intrinsic viscosity was around 2 600 cm3/g.Using the coil limit of the worm-like chain formula (S~)
=
LL(/3 where L is the contour
length of the molecule, allows apparent persistence length L( to be estimated from the data in
figure I. One notes that this so-called apparent persistence length includes the electrostatic
contribution as well as the excluded volume effect. It has been defined and discussed
elsewhere [24-27, 45-47]. This value is around 3001at C~ =100mM. This is in good
agreement with earlier report [48] and shows that SG is a rather stiff polymer, in the class of
xanthan, for example, and quite a bit stiffer than hyaluronate (L~=
87 h, where Lu is the
intrinsic persistence length, estimated by extrapolation of L( to infinite ionic strength). With
L(=
3001 for SG, the number of Kuhn segments is about 19. This value is not far from that
of the coil limit for static dimensions, and certainly too many for the SG to be considered as a
rod at this salt concentration.
~s2~l/2M~=774,COO
~z=870,COO
Ii) <S~>~'~"°.3~~'°'~~~
loo2E5 3E5 4E5 5E5 6E5 7E5 8E5 9E5
Fig. I. SEC results for SG at C, 0.I M. M~, M~ and M~ are given.
1006 JOURNAL DE PHYSIQUE II N° 6
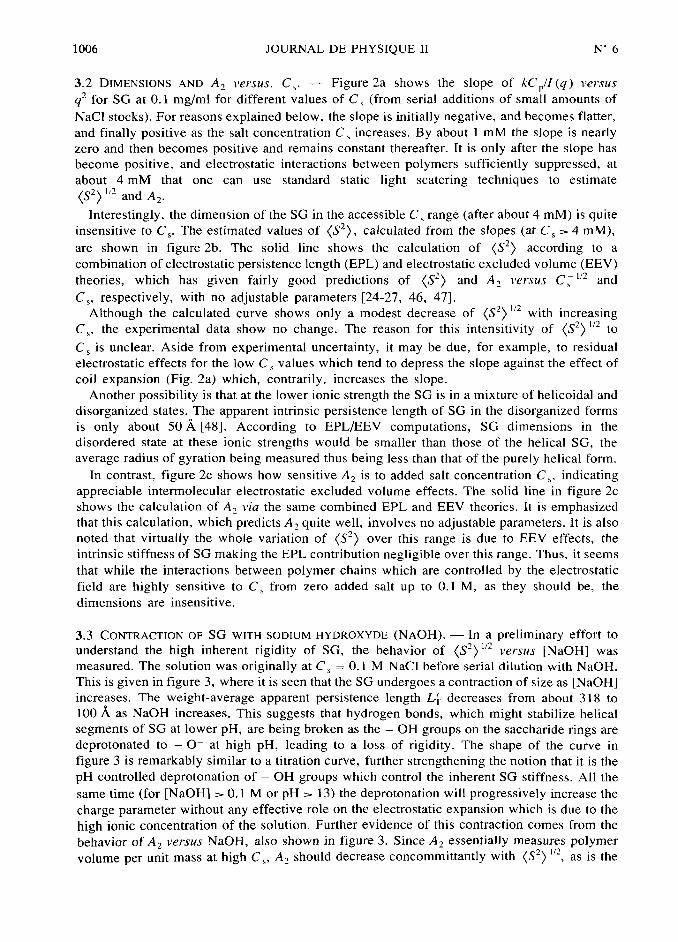
3.2 DIMENSIONS AND A~ i'ersus. C,. Figure 2a shows the slope of kC~/I(q) i>eisus
q~ for SG at 0.I mg/ml for different values of C~ (from serial additions of small amounts of
Nacl stocks). For reasons explained below, the slope is initially negative, and becomes flatter,
and finally positive as the salt concentration C, increases. By about I mM the slope is nearly
zero and then becomes positive and remains constant thereafter. It is only after the slope has
become positive, and electrostatic interactions between polymers sufficiently suppressed, at
about 4mM that one can use standard static light scatering techniques to estimate
(S~) ~'~ and A~.
Interestingly, the dimension of the SG in the accessible C, range (after about 4 mM) is quiteinsensitive to C~. The estimated values of (S~), calculated from the slopes (at C~
~4 mM),
are shown in figure 2b. The solid line shows the calculation of (S~) according to a
combination of electrostatic persistence length (EPL) and electrostatic excluded volume (EEV
theories, which has given fairly good predictions of (S~) and A~ versusCj~'~ and
C~, respectively, with no adjustable parameters [24-27, 46, 47].
Although the calculated curve shows only a modest decrease of (S~) "~ with increasing
C~, the experimental data show no change. The reason for this intensitivity of (S~) ~'~to
C~ is unclear. Aside from experimental uncertainty, it may be due, for example, to residual
electrostatic effects for the low C~ values which tend to depress the slope against the effect of
coil expansion (Fig. 2a) which, contrarily, increases the slope.Another possibility is that at the lower ionic strength the SG is in a mixture of helicoidal and
disorganized states. The apparent intrinsic persistence length of SG in the disorganized forms
is only about 50h [48]. According to EPL/EEV computations, SG dimensions in the
disordered state at these ionic strengths would be smaller than those of the helical SG, the
average radius of gyration being measured thus being less than that of the purely helical form.
In contrast, figure 2c shows how sensitive A~ is to added salt concentration C~, indicatingappreciable intermolecular electrostatic excluded volume effects. The solid line in figure 2c
shows the calculation of A~ i'ia the same combined EPL and EEV theories. It is emphasizedthat this calculation, which predicts A~ quite well, involves no adjustable parameters. It is also
noted that virtually the whole variation of (S~) over this range is due to EEV effects, the
intrinsic stiffness of SG making the EPL contribution negligible over this range. Thus, it seems
that while the interactions between polymer chains which are controlled by the electrostatic
field are highly sensitive to C~ from zero added salt up to 0.I M, as they should be, the
dimensions are insensitive.
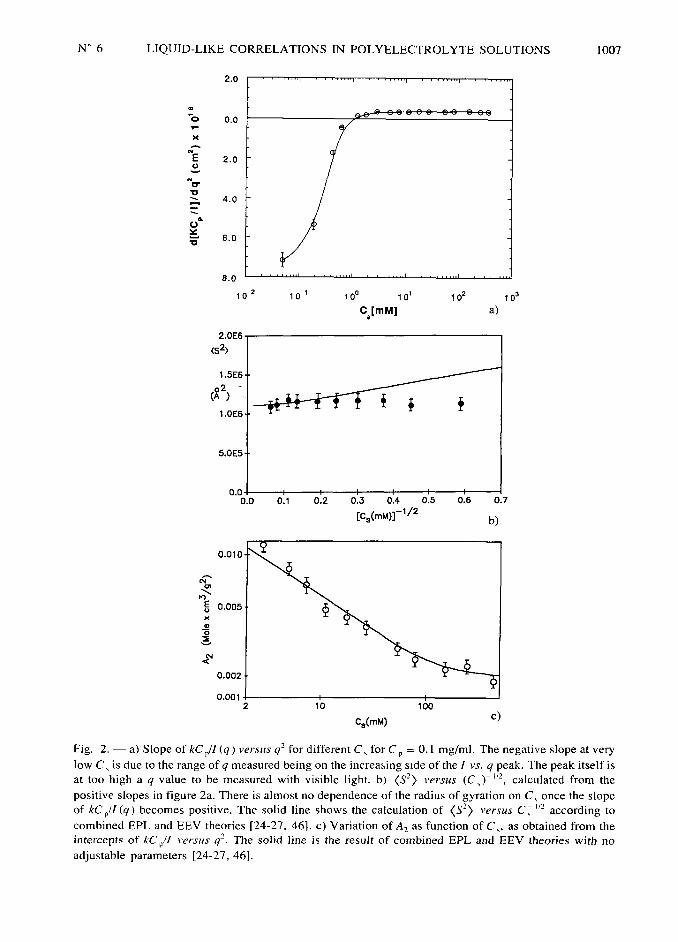
3.3 CONTRACTION OF SG WITH SODIUM HYDROXYDE (NAOH). In a preliminary effort to
understand the high inherent rigidity of SG, the behavior of (S~)~'~ versus [NaOH] was
measured. The solution was originally at C~=
0. I M Nacl before serial dilution with NaOH.
This is given in figure 3, where it is seen that the SG undergoes a contraction of size as [NaOH]increases. The weight-average apparent persistence length L( decreases from about 318 to
1001as NaOH increases. This suggests that hydrogen bonds, which might stabilize helical
segments of SG at lower pH, are being broken as the OH groups on the saccharide rings are
deprotonated to O- at high pH, leading to a loss of rigidity. The shape of the curve in
figure 3 is remarkably similar to a titration curve, further strengthening the notion that it is the
pH controlled deprotonation of OH groups which control the inherent SG stiffness. All the
same time (for [NaOH]~
0. I M or pH~
13) the deprotonation will progressively increase the
charge parameter without any effective role on the electrostatic expansion which is due to the
high ionic concentration of the solution. Further evidence of this contraction comes from the
behavior of A~ versus NaOH, also shown in figure 3. Since A~ essentially measures polymer
volume per unit mass at high C~, A~ should decrease concommittantly with (S~) ~'~, as is the
N° 6 LIQUID-LIKE CORRELATIONS IN POLYELECTROLYTE SOLUTIONS 1007
2.0
«
+ o-o
w
4~
E«~
~
£>
~8.0
10
C al
s2)
~~
0.1 .2 .4.5 06
~~
~«/[ o.oos
x
£
j~
J~
0.0012 lo loo
C~(mM)~~
Fig. 2. al Slope of kC ~/l (q ) versus q~ for different C, for C~
=
O. I mg/ml. The negative slope at very
low C, is due to the range of q measured being on the increa~ing side of the I v.<. q peak. The peak itself is
at too high a q value to be measured with visible light. b) (S~)versus (C,)~ "~, calculated from the
positive slopes in figure 2a. There is almost no dependence of the radius of gyration on C, once the slopeof kC~/I (q) becomes positive. The solid line shows the calculation of (S~)
versus Co "~ according to
combined EPL and EEV theories [24-27, 46j. c) Variation of A~ as function of C,. as obtained from the
intercepts of I.C~/I iersus q~. The solid line is the result of combined EPL and EEV theories with no
adjustable parameters [24-27, 46].
1008 JOURNAL DE PHYSIQUE II N° 6
1.2 10~ 3.2 1 0" ~
~
i j § §~ ~ ~ ~_ ~
~ ~
~ ~§
~2.4 0" ~
~J>-X 8.0 0~ ~ ~
~~
~~fp
~ ~~~~~ , ~ #~2.0 0'
~
~6.0 10~
.
~~l.6 0" ~
v .~
~ ,l.2 lo" ~ f$»
4.0 10
B-O 0" ~
2.0 0~
.4.O 1 0" ~
lo ~ lo 10°
NaOH [Mole/L]
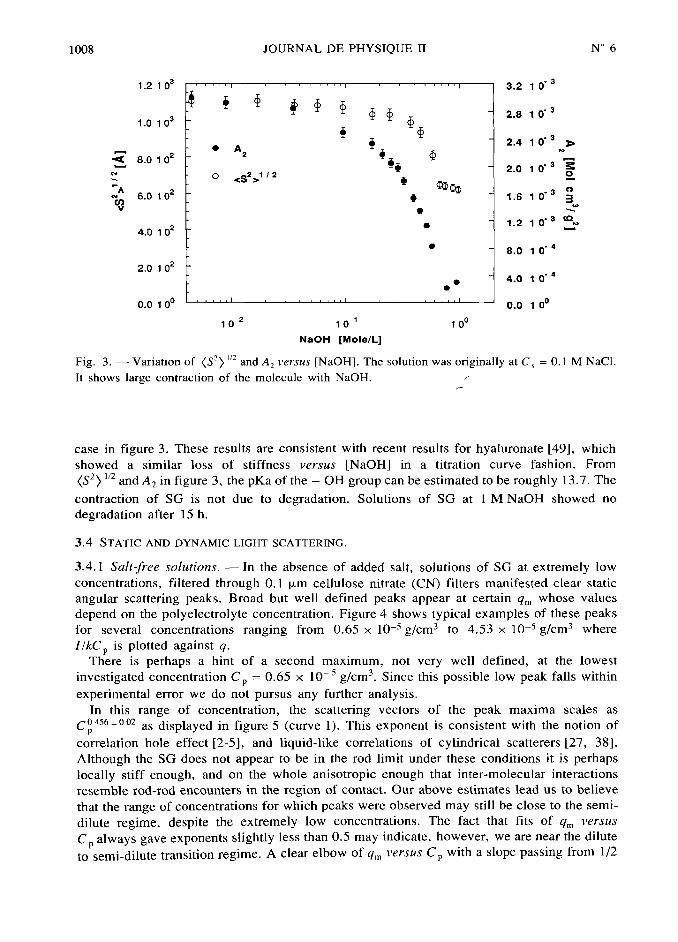
Fig. 3. Variation of (S~) "~ and A~ versus [NaoH]. The solution was originally at C~=
0. I M Nacl.
It shows large contraction of the molecule with NaoH./
case in figure 3. These results are consistent with recent results for hyaluronate [49], which
showed a similar loss of stiffness versus [NaOH] in a titration curve fashion. From
(S~ ) "~ and A~ in figure 3, the pKa of the OH group can be estimated to be roughly 13.7. The
contraction of SG is not due to degradation. Solutions of SG at I MNaOH showed no
degradation after 15 h.
3.4 STATIC AND DYNAMIC LIGHT SCATTERING.
3.4.I Salt-free solutions. In the absence of added salt, solutions of SG at extremely low
concentrations, filtered through 0. ~Lm cellulose nitrate (CN) filters manifested clear static
angular scattering peaks. Broad but well defined peaks appear at certain q~ whose values
depend on the polyelectrolyte concentration. Figure 4 shows typical examples of these peaks
for several concentrations ranging from 0.65 x10~5g/cm3 to 4.53 x10⁻⁵g/cm3 where
I/kC~ is plotted against q.
There is perhaps a hint of a second maximum, not very well defined, at the lowest
investigated concentration C~=
0.65 x 10~ ~ g/cm~. Since this possible low peak falls within
experimental error we do not pursus any further analysis.In this range of concentration, the scattering vectors of the peak maxima scales as
C(~~~~°°~ as displayed in figure 5 (curve I). This exponent is consistent with the notion of
correlation hole effect [2-5], and liquid-like correlations of cylindrical scatterers [27, 38].
Although the SG does not appear to be in the rod limit under these conditions it is perhapslocally stiff enough, and on the whole anisotropic enough that inter-molecular interactions
resemble rod-rod encounters in the region of contact. Our above estimates lead us to believe
that the range of concentrations for which peaks were observed may still be close to the semi-
dilute regime, despite the extremely low concentrations. The fact that fits of q~ i>ersus
c always gave exponents slightly less than 0.5 may indicate, however, we are near the dilute
t~~serni-dijute transition regime. A clear elbow of q~ i>ersus C~ with a slope passing from 1/2

N° 6 LIQUID-LIKE CORRELATIONS lN POLYELECTROLYTE SOLUTIONS 1009
4.0 0~
3.5 0~
3.0 0~
~~~~2.5 1O~
kC~
2.O 0~
1.5 o~
i-o i o~
5.o i o~
o-o i o°
0.0 0~ 5.0 0~ 1.0 1 O~ I-S I O~ 2.O 0~ 2.S 0~ 3.0 0~ 3.5 0~
q [cm ~j
Fig. 4. I(q)/kC versus q for salt-free solutions of SG at various polyelectrolyte concentrations
C~ (o ) 0.65 x 10~ g/cm' j. j 1.01 x 10~ ~ g/cm~ (A 1.59 x 10~ ~ g/cm' ix ) 2.38 x 10~ ~ g/cm~
j+ 3.03 x10~~ g/cm'; IA ) 3.84 x
10~~ g/cm'; (m) 4.53 x10~~ g/cm'.
~ °~ 2DS'ope=1/2
@
~
o_456
~
__
3 °q~~~#2.981xi
EI $
#~ ~5~
3D
Slope=1/3
~s
10"~ l 0"~
C [g/cm~l
Fig. 5. Variation of Log [q~j as a function of Log [C~] (curve I ). A 10 §b concentration loss due to
filtration is assumed. Curve 2 corresponds to rod limit, hexagonal 2D packing
q~ 2gr
[3 (d/m C~
jg/cm') N ~/4 ]"~, and curve 3 corresponds to a cubic arrangement of scatterers in the
dilute regime, q~ 2gr
jC~(g/cm') N ~/M] '"

1010 JOURNAL DE PHYSIQUE II N° 6
in the semi-dilute regime to 1/3 in the dilute regime has been demonstrated in several works for
hard cylinders [38], DNA [50] and the semi-flexible polyelectrolyte sodium polystyrene
sulfonate (NAPSS [39].
Assuming a hexagonal 2D arrangement of infinitely long cylinders (although the SG is not
expected to be in the rod limit) leads to a prediction of q~ =
2 fir [3 (d/m ) C~(g/cm~) N~/4]"~
where (d/m) is the distance/molar mass (cm.mot/g) of the polymer, taken as
(1.45x10-'° cm.mol/g) in this case. This corresponds to curve (2) in figure 5. It is stressed
that this simple picture is a means of estimating average distances between idealized rods in the
semi-dilute regime and in no way is meant to imply that liquid crystals or other types of static,
organized domains exist. Assuming a cubic arrangement of scatterers in the dilute regime gives
q~ =
2w
[C~(g/cm~) N~/M]"~, where M is the molecular weight of the polyelectrolyte. This
function for the SG with M=
7.74 x10~ is also shown in figure 5. Taking account of possible
concentration losses on the order often percent yields curve (3) in figure 5 for the cylindricalpacking estimate. In this respect, the effect of the molecular weight on the slope is in progress
in our laboratory.At this level one notes that the negative values of ihe slojes reported it figure 2a are due to
C~ being high enough and the I(q) peak occurs above the highest accessible C~(q~=
4.47x10~cm~') and the monotonically increasing I(q) gives a negative slope for
kC~/I (q).
The shape and values of I(q)/kC~ versus q were insensitive to time and only slightly
sensitive to the temperature (over the range 12 °C to 50 °C). This behavior is illustrated in
figure 6. It seems that there is a slight broadening and a decrease in peak height with increasing
temperature. This is consistent with a slight increase of thermal motion between scatterers.
One notes that earlier reports have indicated that scattering peaks associated with latex spheres
evolved and sharpened over a time scale of many hours or even days to crystallize into lattices
with long range order [5 II. The dashed curve in figure 6 shows the scattering peak remained
2.0 1 0~
1.6 0~
'(q)$ 1.2 105
p
B-O 1 0~
4.0 1 0~
o-o i o°
O-O 1 0° 9.0 1 0' 1.8 1 0~ 2.7 1 0~ 3.6 1 0~
q icm ii
Fig. 6. Variation off (q )/lC~ as a function of q for C~=
3 x 10~ g/cm~ SG with no added salt. The
symbols (D, &~, o) show I/kC~ at t=
50 °C, t=
25 °C. t=12 °C, respectively and (.) shows the same
solution after being left for 3 days at room temperature. No peak narrowing or other changes in the
scattering suggest the liquid-like correlated state is an equilibrium state.
N° 6 LIQUID-LIKE CORRELATIONS IN POLYELECTROLYTE SOLUTIONS loll
unchanged after 4 days of remaining undisturbed at t=
25 °C. Thus, there is no evidence that
the SG solutions «crystallize» into Systems with long range order over the time and
temperature scales studied here.
QELS experiments were also performed on salt-free SG solutions. The autocorrelation
functions for solutions filtered through 0.I ~Lm (CN) filters were described by a singleexponential decay (see the discussion in the section below,
«the problem of aggregates »).
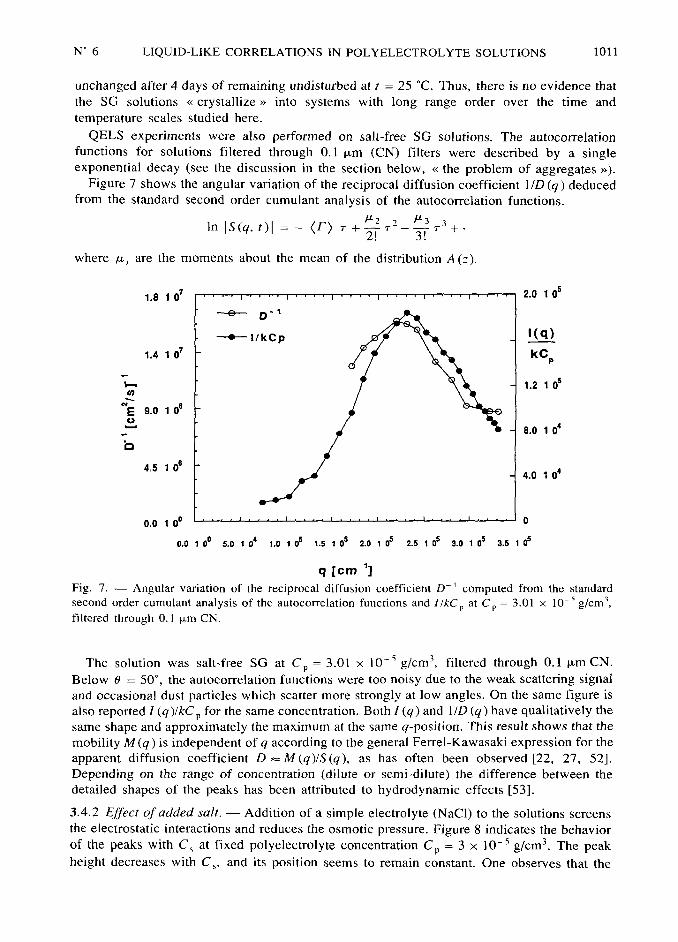
Figure 7 shows the angular variation of the reciprocal diffusion coefficient I/D (q) deduced
from the standard second order cumulant analysis of the autocorrelation functions.
In jsiq, t)j=
<l~)T + ~/ ~~ ~/ ~~
~'
where v, are the moments about the mean of the distribution A(=).
1-S 10~ 2.0 10~
-- ~ i
-i/kcp '(q)
1,4 1o~ kC~
~p1,2 1 o~
"E 9,o i o~
u,©' 8,o i o
k3
4.5 0~4,o i o'
0.0 0° 0
o.010°
5.O 10~1-O
10~ 1.510~
2.O10~
2.510~ 3.0 10~ 3.5 10~
q (Cm ~]
Fig. 7. Angular variation of the reciprocal diffusion coefficient D~ ' computed from the standard
second order cumulant analysis of the autocorrelation functions and I/kC~ at C~ 3.01 x 10~ ~ g/cm~,
filtered through 0,I ~m CN,
The solution was salt-free SG at C~=
3.01 x10~~ g/cm~, filtered through 0.I ~Lm CN.
Below R=
50°, the autocorrelation functions were too noisy due to the weak scattering signal
and occasional dust particles which scatter more strongly at low angles. On the same figure is
also reported I (q)/kC~
for the same concentration. Both I (q) and I/D (q) have qualitatively the
same shape and approximately the maximum at the Same q-position. This result shows that the
mobility M (q is independent of q according to the general Ferrel-Kawasaki expression for the
apparent diffusion coefficient D wmjq)/S(q), as has often been observed [22, 27, 52].Depending on the range of concentration (dilute or semi-dilute) the difference between the
detailed shapes of the peaks has been attributed to hydrodynamic effects [53].
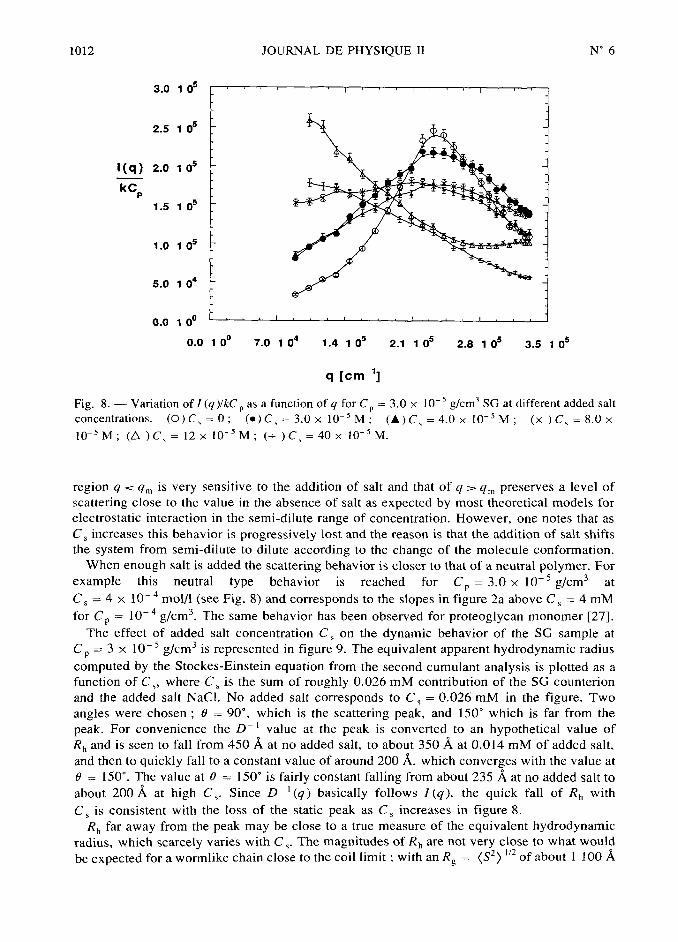
3.4.2 Effect ofadded salt, Addition of a simple electrolyte (Nacl) to the solutions screens
the electrostatic interactions and reduces the osmotic pressure. Figure 8 indicates the behavior
of the peaks with C~ at fixed polyelectrolyte concentration C~=
3 x10~~ g/cm~. The peak
height decreases with C~, and its position Seems to remain constant. One observes that the
1012 JOURNAL DE PHYSIQUE II N° 6
3,0 1 0~
2.5 1 0~
1(q) 2.0 10~
)1,5 10~
1 ,0 1 0~
5,0 1 0~
0,0 1 0°
0,0 10° 7,0 1 0~ 1,4 1 0~ 2.I 0~ 2.8 1 0~ 3,5 0~
q [cm ~j
Fig. 8. Variation off (q )/kC~
as a function of q for C~=
3,0 x 10~ g/cm' SG at different added salt
concentrations, lo C,=
0 (.) C,=
3.0 x10~~ M jai C, 4.0 x
10~~ M ix C,=
8,0 x
10~~ M IA C, 12 x 10~ ~ M ; j+ C,=
40 x 10~ M.
region q < q~ is very sensitive to the addition of salt and that of q ~ q~ preserves a level of
scattering close to the value in the absence of salt as expected by most theoretical models for
electrostatic interaction in the semi-dilute range of concentration. However, one notes that as
C~ increases this behavior 15 progressively lost and the reason is that the addition of salt shifts
the system from semi-dilute to dilute according to the change of the molecule conformation.
When enough salt is added the Scattering behavior is closer to that of a neutral polymer. For
example this neutral type behavior is reached for C~=3.0x10~~g/cm~ at
C~
=
4 x 10~ ~ mol/I (see Fig. 8) and corresponds to the slopes in figure 2a above C~
=4 mM
for C~=
10~ ~ g/cm~. The same behavior has been observed for proteoglycan monomer [27].
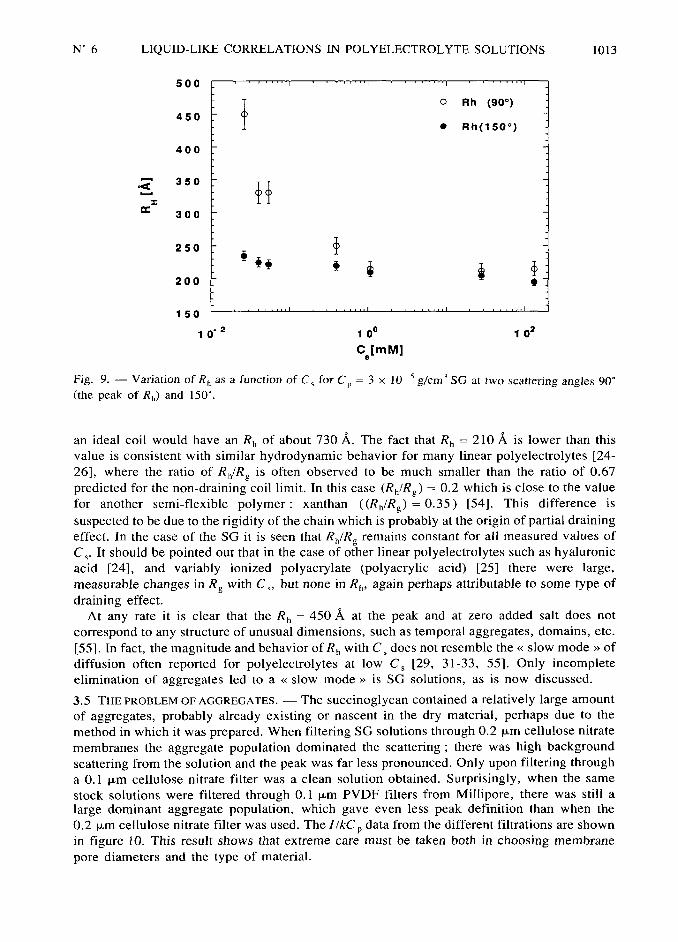
The effect of added salt concentration C~ on the dynamic behavior of the SG sample at
C~=
3 x 10~ ~ g/cm~ is represented in figure 9. The equivalent apparent hydrodynamic radius
computed by the Stockes-Einstein equation from the second cumulant analysis is plotted as a
function of C~, where C~ is the sum of roughly 0.0?6 mM contribution of the SG counterion
and the added salt Nacl. No added salt corresponds to C,=
0.026 mM in the figure. Two
angles were chosen R=
90°, which is the scattering peak, and 150° which is far from the
peak, For convenience the D~ value at the peak is converted to an hypothetical value of
R~ and is seen to fall from 4501atno added salt, to about 3501
at 0.014 mM of added salt,
and then to quickly fall to a constant value of around 200 1, which converges with the value at
=
150°. The value at R=
150° is fairly constant falling from about 235 1at no added salt to
about 2001at high C,. Since D~ ~(q) basically follows I(q), the quick fall of R~ with
C~ is consistent with the loss of the static peak as C~ increases in figure 8.
R~ far away from the peak may be close to a true measure of the equivalent hydrodynamic
radius, which scarcely varies with C~.
The magnitudes of R~ are not very close to what would
be expected for a wormlike chain close to the coil limit ; with an R~=
(S~ ~'~ of about I 100 1
N° 6 LIQUID-LIKE CORRELATIONS IN POLYELECTROLYTE SOLUTIONS 1013
soo
O Rh (90°)
450. Rh(150°)
400
-t~~° jj
~x~
300
~~~~ #~ , j
200 ~
iso
10" ~ l 0° 10~
C [mM]
Fig. 9. Variation of R~ as a function of C~ for C~ 3 x 10~ ~ g/cm~ SG at two scattering angles 90°
(the peak of Rh) and 150°.
an ideal coil would have an R~ of about 7301. The fact that R~=
210 h is lower than this
value is consistent with similar hydrodynamic behavior for many linear polyelectrolytes [24-
26], where the ratio of R~/R~ is often observed to be much smaller than the ratio of 0.67
predicted for the non-draining coil limit. In this case (R~/R~=
0.2 which is close to the value
for another semi-flexible polymer: xanthan ((R~/R~)= 0.35) [54]. This difference is
suspected to be due to the rigidity of the chain which is probably at the origin of partial draining
effect. In the case of the SG it is seen that R~/R~ remains constant for all measured values of
C,. It should be pointed out that in the case of other linear polyelectrolytes such as hyaluronicacid [24], and variably ionized polyacrylate (polyacrylic acid) [25] there were large,
measurable changes in R~ with C~, but none in R~, again perhaps attributable to some type of
draining effect.
At any rate it is clear that the R~=
4501 at the peak and at zero added salt does not
correspond to any structure of unusual dimensions, such as temporal aggregates, domains, etc.
[55]. In fact, the magnitude and behavior of R~ with C~ does not resemble the«
slow mode»
of
diffusion often reported for polyelectrolytes at low C~ [29, 31-33, 55]. Only incompleteelimination of aggregates led to a «
slow mode»
is SG solutions, as is now discussed.
3.5 THE PROBLEM OF AGGREGATES. The succinoglycan contained a relatively large amount
of aggregates, probably already existing or nascent in the dry material, perhaps due to the
method in which it was prepared. When filtering SG solutions through 0.2 ~Lm cellulose nitrate
membranes the aggregate population dominated the scattering ; there was high background
scattering from the solution and the peak was far less pronounced. Only upon filtering through
a 0. I ~Lm cellulose nitrate filter was a clean solution obtained. Surprisingly, when the same
stock solutions were filtered through 0.I ~Lm PVDF filters from Millipore, there was still a
large dominant aggregate population, which gave even less peak definition than when the
0.2 ~Lm cellulose nitrate filter was used. The I/kC~ data from the different filtrations are shown
in figure 10. This result shows that extreme care must be taken both in choosing membrane
pore diameters and the type of material.

1014 JOURNAL DE PHYSIQUE II N° 6
5.o i o~
0.lpm (PVDF)
4.0 0~
'(ql~
kC ~'° °
~'° °~0.2pm (CN)
i-o i o~
o,ipm jcN)
o-o i o°
O-o 0° 7.0 0~ 1.4 0~ 2.i 0~ 2.8 10~ 3.5 0~
~ ~~ i~
Fig. lo. Variation of I/kC~ as function of q for SG filtered through different types of membranes
(C~ 3 x10~~ g/cm'). Top to bottom ; 0. ~m PVFD, 0.2 ~m cellulose nitrate and 0. I ~m cellulose
nitrate.
As to the fact that cellulose nitrate cleans up the systems better than PVDF of the same
« pore size », we are not sure exactly why. We now mention, however, that the manufactures
quoted« pore size
»for most polymeric membranes does not refer to clean, cylindrical round
holes in the membranes, actually refers to a sort of average porosity, the«
holes»
being
torturous, complex paths in the membrane. (Exceptions to this are the nucleopore series of
membranes, for which the pores are actually close to cylindrical, but which we did not use),
Added to this are possible effects of chemical specificity and retention in the membranes.
The possibility that there is only« one characteristic length
»in
«such complex systems »
in
understandable in the context of cleaning up the solutions with a particular membrane type and
nominal pore size : basically the system is not so complex. In terms of filtrable, largemolecules, there are the well-dispersed polymers, which constitute the vast weight percentage
of the solute and lead to the interesting physical properties, and a small population of
aggregates of entanglements which lead to a «slow
»diffusive mode and reduced scattering
peak definition, whose average dimensions are larger than the well-dispersed polymers.Using the proper membrane preferentially filters out a large percentage of these large
aggregates, allowing the remaining well-dispersed polyelectrolytes to dominate the solution
scattering.Figure I la shows autocorrelation functions for SG solutions at C~
=3 x
10~~ g/cm~ and
0=
70°, filtered through 0. I ~Lm cellulose nitrate (curve a) and 0. I ~Lm PVDF filters (curve b),
with monoexponential fits to each shown by the solid lines, As the scattered intensity bypolymer changes with the filtration (see Fig. 10) the parameter a (in Eq. I)) changes. The CN
autocorrelation function (curve a), corresponding to the best defined I/kC~ peak in figure 10
(symbol o) is well fit by a single exponential (solid line), whose equivalent Rh~
3201. The
N° 6 LIQUID-LIKE CORRELATIONS IN POLYELECTROLYTE SOLUTIONS 1015
1 0 4
o(b)
1. 03
(a)
$ 1.02
,
~i.oi
m
t$
'~ l
I o~~ I o~ ~ l o~ l o'~ I o~ I o~
Delay Tine lsl
a)
1.2
0.lpm CN Filter .C0NilN
~o ILT
0.8
m~~fl
0.6~~~* 0.4
~$ 0.2
o
0. 2
1o~ i o~ 103 1o~
HYDRODYNAMIC RADIUS (I)
b)
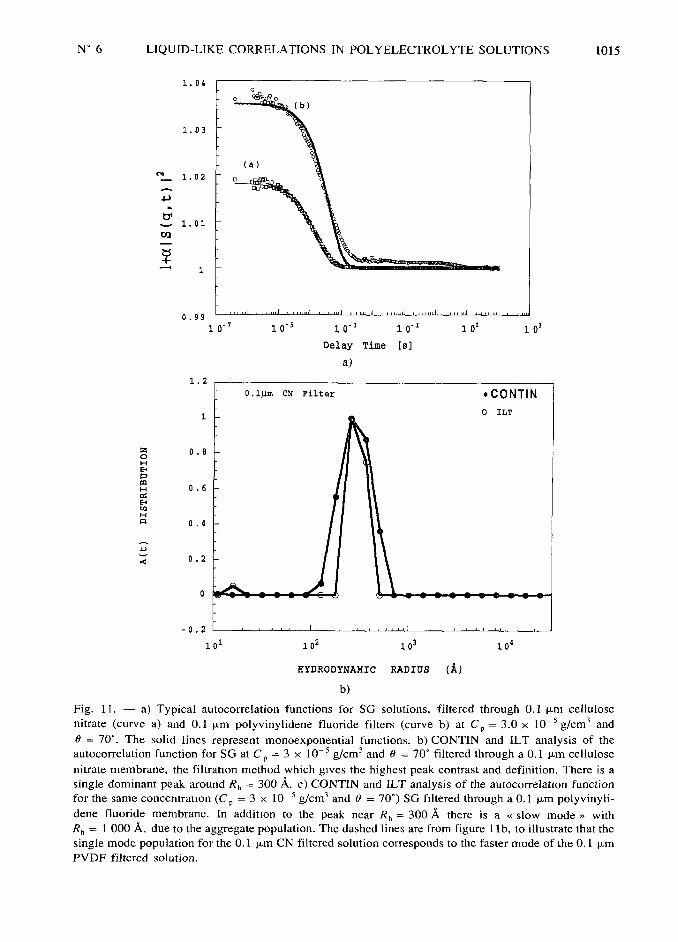
Fig. I, al Typical autocorrelation functions for SG solutions, filtered through 0.I ~m cellulose
nitrate (curve a) and 0.I ~m polyvinylidene fluoride filters (curve b) at C~ 3.0 x10~~ g/cm~ and
0=
70°. The solid lines represent monoexponential functions. b) CONTIN and ILT analysis of the
autocorrelation function for SG at C~=
3 x 10~ ~ g/cm~ and o=
70° filtered through a 0. I ~m cellulose
nitrate membrane, the filtration method which gives the highest peak contrast and definition. There is a
single dominant peak around Rh~
300 h. cl CONTIN and ILT analysis of the autocorrelation function
for the same concentration (C~ 3 x lo ~ g/cm' and 9 70°) SG filtered through a 0. I ~m polyvinyli-dene fluoride membrane, In additlon to the peak near R~
=
300h there is a «slow mode
»with
R~=
000 h, due to the aggregate population. The dashed lines are from figure I16, to illustrate that the
single mode population for the 0. I ~m CN filtered solution corresponds to the faster mode of the 0,1 ~m
PVDF filtered solution.

1016 JOURNAL DE PHYSIQUE II N° 6
1 2
~ ~ cN Filter
~~~~~"~ ~
pitter0.I#m PVDFqI
I'W
~j~i
8
i~~fl
I'0-6
'( ~'M#m
(4#M
~ 4*
I'p
o
0. 2
10~ 10~ 10~ 10'
HYDRODYNAMIC RADIUS (I)
C)
Fig. ll (continued).
function for the 0. I ~Lm PVDF filtered solution corresponding to top curve (.) in figure 10, is
not well fit by the single exponential as is readily seen. The same behavior for the other
autocorrelation functions and their fits was observed for the angles ranging from 50° to 150°.
One notes that the extremely low values of the intercepts of autocorrelation curves is due to the
fact that I~~j~/I~~j~ is extremely low. For the range of concentration studied in this work, the
value of the ratio I~~j~/I,~j~ was about 1.6.
As shown in figures I16 and II c these results are confirmed by CONTIN and ILT analysesof the same autocorrelation functions. The autocorrelation function for a solution filtered with
0.I ~Lm CN filter, which corresponds to the cleanest solutions with the highest contrast and
definition peaks, shows a single main CONTIN/ILT peak at R~=
3001 (Fig. I16). There is
no «slow mode », indicating that virtually all the aggregates have been successfully removed
by the filtration. The CONTIN/ILT analysis in figure llc shows that the solution is full of
aggregates, as reflected by the«
slow mode»
in the distribution function A (r ), corresponding
to the dominant peak with R~ around 000 1. The smaller peak is from the non-aggregated SG
and has an R~ around 200-300 1, which is close to the value of the single peak in figure I16. It
should be noted that multimodal decay functions have commonly been observed for salt-free
solutions even at such low concentrations as reported here [Refs. 22, 31 and 33].Thus, the static peaks are most strong and well-defined when there is no slow mode of
diffusion. As seen in figure10, the existence of the slow mode actually decreases the
amplitude and contrast of the static scattering peaks the static scattering peaks and the slow
mode are antagonistic to each other.
3.6 VISCOSITY MEASUREMENTS. Reduced viscosity ~~ i'ersus C~ taken on the low shear
rate Newtonian plateau for SG in pure water is shown in figure12.
q~ increases monotonically over the studied C~ range for the two curves. Thus, over the
regime where the pronounced static and dynamic scattering peaks occur, the reduced viscositybehavior is similar to that of most neutral polymers. Conspicuously absent is any trend towards
increasing ~~ with decreasing C~, as is found for dilution with pure water (or low

N° 6 LIQUID-LIKE CORRELATIONS IN POLYELECTROLYTE SOLUTIONS 1017
.8 0~
_
I/f Scattering Peaks §~ 4
§_
1.4 0
~
9.010~ ~~
~~©
£ .
©(4.5 0~
a
~~#
O-O i o°
10 ~10 ~
10 ~ 10 ~ iO ~
C~[g/cm~]
Fig. 12. Variation of the reduced viscosity ~, as function of C~ for SG in pure water. It increases
monotonically with C~. The symbol (o) is for the fractionated sonicated sample filtered through0.I ~Lm CN. The j.) curve is for the same sample filtered through 0.2 ~m CN,
C, solutions) for such semi-flexible polyelectrolytes as polystyrene sulfonate [35], hyaluronicacid [56], gellan, polyvinyl sulphate [57] and charged inextensible latex spheres [58]. Such an
effect is traced to the fact that ionic concentration decreases as dilution proceeds. This decrease
of ionic strength leads to effects such as : polyelectrolyte expansion, increase in the
electrostatic screening length, increase in polyelectrolyte-polyelectrolyte friction, etc. There is
no general agreement currently on the exact mechanism of the effects in different situations,
although abundant models exist.
Absence of the polyelectrolyte effect I.e. monotonic increase of ~~ with C~ has been
reported long time ago for thymonucleic acid TNA [59].
We do not speculate here on whether the monotonic decrease of ~~ with decreasing
C~ is due to the more rigid nature of SG compared to these other polyelectrolytes, or possibly
to such an effect lying at concentrations lower than the sensitivity of the viscosimeters
permitted to measure. In the absence of extemal salt, the investigated domain of concentration
remains in the semi-dilute. The polyelectrolyte effect is usually observed on flexible
molecules, short rigid molecules [37] or charged spheres [18]. Moreover, for low chargedspheres, it was shown [60] that the behavior mimics that of neutral one (monotonic increase of
~~ with increasing C~).Succinoglycan has relatively a low charge density (A
=
0.45) as compared to other
polysaccharides. However, the viscosity peak exists for a more flexible polyelectrolyte,hyaluronate (A
=
0.7 ) having a charge parameter in the same order as SG. To draw a definitive
conclusion on this peculiar behavior, further experiments should be done on different semi-
rigid polyelectolytes having different molecular weigths and different charge densities. What is
clear is that the existence of the static and dynamic scattering peaks do not depend on their
being any reduced viscosity peak versus C~,
nor even a simple increase in ~~ with decreasing
C~ in the concentration ranges where the scattering peaks are observed. Furthermore, the fact
that the viscosity behavior of the SG when filtered through 0. I and 0.2 ~Lm CN filters is nearly
the same illustrates the fact that the viscosity is closer to a number averaging technique, and is
JOURN~L DE PHYSIQUE ii T 4 N' b JUNE iv94

1018 JOURNAL DE PHYSIQUE II N° 6
not nearly as sensitive to aggregates as light scattering, which combines weight and z-
averaging of the particle populations, and is hence extremely sensitive to even small
populations of aggregates and other large particles.
4, Conclusion,
In this paper we have investigated the structure and dynamic properties of succinoglycansolutions at very low concentrations and ionic strength. Static and dynamic light scattering
measurements show the existence of single, pronounced peaks, which are rapidly lost with the
addition of salt. While clearly electrostatic in origin, there may yet be some debate about the
exact origin of the peaks. The simplest explanation consistent with all the observations is that
the electrostatic repulsions at very low C~ produce enhanced effective volumes for SG which
lead to liquid like correlations. This mechanism has been discussed previously [?7, 38].Liquid-like correlations generally imply Strong neighbor-neighbor correlations, with veryquickly damped second and more distant neighbor interactions.
It has been demonstrated that the static and dynamic light scattering peaks are unrelated to
any slow mode of diffusion (also previously demonstrated for PG [27]), and that in fact such a
slow mode, which corresponds to incompletely eliminated aggregates, actually decreases the
contrast and definition of the peak when present. Fortunately, these aggregates can be virtuallytotally eliminated by proper filtration (0.I ~Lm cellulose nitrate membrane diameter in this
case). Such a «slow mode », commonly observed in many polyelectrolyte solutions at low
added salt concentration C,, has recently been traced to the presence of aggregates and/or other
particles for a variety of polyelectrolyte solutions studied [28].
It has been further demonstrated that the scattering peaks in this case are not related to anypeaked behavior of the reduced viscosity ~
~as a function of C~, nor to any Fuoss-type increase
of ~~ with decreasing C~. The lack of Such an effect is perhaps related in this case to the
Stiffness and to the low charge parameter of this polysaccharide. The effects of chargeparameter A, preliminary results are presented elsewhere [61].
Acknowledgments,
R. B. is grateful to Professor M. Benmouna for many helpful discussions. W. R. acknowledgessupport from NSF (U.S.A.) MCB 9116605, and ELF Aquitaine and the CNRS during hissabbatical as Professeur de l'Acaddmie des Sciences (1992/93).
References
[Ii Katchalsky A., Alexandrowicz Z, and Kedem O., Chemical Physics of Ionic Solutions, Conwayand Barradas Eds. (Willey, N.Y., 1976).
[2] de Gennes P. G,, Scaling Concepts in Polymer Physics (Cornell University Press, Ithaca, N-Y-,
1979), p, 64, 65,
[3] Hayter J., Jannink G., Brochard F. and de Gennes P. G.. J Phys. Lent. France 41(1980) L-451,
[4] de Gennes P. G,, Pincus P,, Velasco R.~ M. and Brochard F., J. Phys. F;ance 37 (1976) 1461.
[5] Benmouna M., Weill G., Benoit H. and Akcasu A. Z,, J. Phys. Fiance 43 (1982) 1679.
[6] Odijk T., J. Poly. Sci. Polym. Phys. Ed. is (1977) 477,
[7] SkoInick J. and Fixman M., Macromolecules lo (1977) 9444.
[8] Le Bret M,, J. Chem. Phys, 76 (1982) 6273.
[9] Manning G. S., Q. Rev Biophys. ii (1978) 179,
[10] Hess W. and Klein R., Adv. Polym, Sci. 32 (1982) 173.
[I ii Belloni L. and Drifford M., J. Phys. Lent. France 46 j1985) L-1183.
l12] al Borsali R.. Vilgis T. A. and Benmouna M., Macromolecules 25 (1992) 5313
b) Borsali R. and Rinaudo M., Die Makromol. Theor. Simul. 2 jI993) 179
c) Borsali R., Vilgis T. A, and Benmouna M., Die Makromol. Theor. Simul. 3 (1994) 73.
[13] Odijk T., Macromolecules 12 (1979) 688.

N° 6 LIQUID-LIKE CORRELATIONS IN POLYELECTROLYTE SOLUTIONS 1019
[14] Witten T. and Pincus P., Europhys. Lent. 3 (1987) 315.
[15] Joanny J. F. and Leibler L., J. Phys. Franc-e 51 jI990) 545.
[16] Khokhlov A., J. Phys. A 13 (1980) 979.
[17] Vilgis T. A. and Borsali R., Phys. Rev. A 43 (1991) 6857.
[18] Ise N., Angew. Chem. IJ1t. Ed. Engl. 25 (1986) 323.
[19] Kaji K., Urakawa H., Kanaya T. and Kitamaru R., J. Phys. France 49 j1988) 993.
[20] Nierlich M. et al., J. Phys. France 40 (1979) 701.
[21] Plestil J. et al., Polymer 27 (1986) 839.
[22] Drifford M. and Dalbiez J. P., J. Phys. Chem. 88 (1984) 5368.
[23] Drifford M. and Dalbiez J. P., Biopolymei 24 (1985) I50I.
[24] Ghosh S., Xiao L., Reed C. E. and Reed W. F., Biopolymers 28 (1990) IIOI.
[25] Reed W. F., Ghosh S., Medjhadi G. and Frangois J., Macromolecules 24 (I991) 6189.
[26] Peitzsch R. M., Burt M. and Reed W. F., Macromolecules 25 (1992) 806.
[27] Xiao L. and Reed W. F., J. CheJ1i. Phys. 94 (1991) 4568.
[28] Ghosh S., Peitzsch R. M. and Reed W. F., Biopolymers 32 (1992) 1105.
[29] Lin S. C., Li W. I. and Schurr M. J., Biopolymers 17 j1978) I04I.
[30] Sedlak M. and Amis E. J., J. Chem. Ph_vs. 96 (1992) 817.
[31] Sedlak M. and Amis E. J., J. Chem. Phys. 96 (1992) 826.
[32] Sedlak M., Macromolecules 26 (1993) 1158.
[33] Forster S., Schmidt M. and Antonietti M., Polymer 31 j1990) 781.
[34] Palo D. T. F. and Hermans J. J., Rec. Trai>. Chim. (Pays-Bas) 71jI952) 433.
[35] Cohen J., Priel Z. and Rabin Y., J. Chem. Phys. 88 (1988) 71il.
[36] Ganter J. L., Milas M. and Rinaudo M., Polymer 33 (1992) 113.
[37] Malovikova A., Milas M., Borsali R. and Rinaudo M., Polymer (Preprints) 34 (1993) 101,1.
[38] Maier E. E., Krause R., Deggelmann M., Hagenbtchle M.. Weber R. and Fraden S., Macromol-
ecules 25 (1992) 1125.
[39] Krause R., Maier E. E., Doggelmann M., Angenbiichle M., Schulz S. F. and Weber R., Physica A
160 (1989) 135.
[40] Gravanis G., Milas L., Rinaudo M. and Clarke-Sturman A. J., Int. J. Biol. Macromol. 12 (1990)
195.
[41] Gravanis G., Milas M., Rinaudo M. and Clarke-Sturrnan A. J., IJ1t. J. Biol. Macromol. 12 (1990)
201.
[42] Siegert A. J., MIT Rad. Lab Rep (1943) No 465.
143] Provencher S. W., Comput. Phys. Commiin. 27 (1982) 213 ; ibid 27 (1982) 229.
144] Tinland B., Mazet J. and Rinaudo M., Makromol. Chem. Rap. Comm. 9 (1988) 69.
[45] Fouissac E., Milas M., Rinaudo M. and Borsali R., Macromolecules 25 (1992) 5613.
146] Reed C. E. and Reed W. F., J. Chem. Phys. 94 (1991) 8479.
147] Reed C. E. and Reed W. F., J. Chem Phys. 92 (1990) 6916.
148] Rinaudo M., Gum Stabilisers for the Food Industry, G. O. Phillips, D. G. Wedlock, P. A. Williams
Eds., vol. 6 lElsevier, 1992) pp. 51-61.
[49] Ghosh S., Kobal I., Zanette D. and Reed W. F.. Macromolecules j1994) in press.
150] Wang L. and Bloomfield V., Macromolecules 24 (1991) 5791.
lsl] Murray C. A., Sprenger W. O. and Wenk R. A., Phys. Ret'. B 42 (1990) 668.
152] Brown J. C,, Pusey P. N., Goodwin J. W., Hewill R. H., J. Phys. A 8 (1975) 664.
153] Van Winkle D. H. and Murray C. A., Phys. Rev. A 36 j1986) 562.
154] Tinland B., Maret G. and Rinaudo M., MacJ.omolecules 23 (1990) 596.
[55] Schmitz K., Dynamic Light Scattering by Macromolecules, Chap. 10 (Academic Press, 1990).156] Rinaudo M., Milas M., Jouon N. and Borsali R., Poljmei 34 (1993) 37 lo.
157] Imai N. and Gekka K., Biophys. Chem. 41 (I991) 31.
158] Yamanaka J., Hashimoto S., Matsuoka H., Kitano H., Ise N., Yamaguchi Y., Saeki S. and
Tsubukawa M., Polymer Int. 30 (1993) 233.
159] Conway B. E. and Butter J. A. V,, J. Polym. Sci, 12 (1954) 199.
[60] Yamanaka J., Matsuoka H., Kitano H. and Ise N., J. Colloid. Inteif Sci, 134 (1990) 92.
[6 Ii Borsah R., Morfin I. and Rinaudo M., Palj,meJ. (Preprints) 35 (1994) 136.
Related Documents