YTD Variance YTD Revenues and Favorable May 31, 2016 Budget Budget Expenditures (Unfavorable) Unaudited REVENUES: 1 General property taxes $28,072,500 $11,696,875 $12,181,161 $484,286 $12,561,746 2 Sales taxes 101,416,870 42,257,029 39,962,640 (2,294,390) 39,759,458 3 Licenses and permits 11,235,660 4,681,525 8,237,463 3,555,938 7,752,067 4 Intergovernmental 8,625,400 3,593,917 0 (3,593,917) 0 5 Charges for services 10,120,020 4,216,675 3,649,615 (567,060) 3,708,224 6 Fines and fees 2,483,840 1,034,933 794,570 (240,363) 1,007,978 7 Utility franchise fees 27,994,177 11,664,240 9,955,035 (1,709,206) 9,873,978 8 Investment income 306,000 127,500 363,945 236,445 146,591 9 Miscellaneous 1,772,417 738,507 404,893 (333,614) 475,059 10 TOTAL REVENUES 192,026,884 80,011,202 75,549,321 (4,461,881) 75,285,102 EXPENDITURES: GENERAL GOVERNMENT: 11 General Administration 32,043,411 13,351,421 12,012,539 1,338,882 12,397,057 12 Board of Directors 343,902 143,293 162,790 (19,498) 135,390 13 Community Programs 610,085 254,202 274,231 (20,029) 218,007 14 City Attorney 1,892,930 788,721 765,629 23,091 740,669 15 District Court - First Division (Criminal) 1,293,690 539,038 492,995 46,042 534,098 16 District Court - Third Division (Environmental) 525,000 218,750 209,197 9,553 243,138 17 District Court - Second Division (Traffic) 1,214,701 506,125 511,554 (5,429) 582,183 18 Finance 3,489,254 1,453,856 1,377,880 75,976 1,430,766 19 Human Resources 1,762,467 734,361 658,370 75,991 694,947 20 Information Technology 4,867,370 2,028,071 1,672,369 355,702 1,599,066 21 Planning and Development 2,496,263 1,040,110 996,270 43,840 976,568 22 TOTAL GENERAL GOVERNMENT 50,539,073 21,057,947 19,133,825 1,924,122 19,551,890 23 PUBLIC WORKS 1,088,005 453,335 353,622 99,714 344,527 24 PARKS & RECREATION 10,422,139 4,342,558 3,909,962 432,596 3,668,921 25 RIVERMARKET 1,151,840 479,933 474,033 5,901 466,219 26 GOLF 2,343,445 976,435 1,102,856 (126,421) 1,045,535 27 JIM DAILEY FITNESS & AQUATICS 921,660 384,025 383,103 922 336,137 28 ZOO 6,732,089 2,805,037 2,925,627 (120,590) 2,891,365 29 FIRE 47,873,345 19,947,227 19,595,851 351,376 19,324,707 30 POLICE 69,630,246 29,012,603 26,424,869 2,587,733 26,609,311 31 HOUSING & NEIGHBORHOOD PROGRAMS 5,441,607 2,267,336 2,094,057 173,279 2,093,407 32 VACANCY SAVINGS (3,378,159) (1,407,566) 0 (1,407,566) 0 33 TOTAL EXPENDITURES 192,765,290 80,318,871 76,397,805 3,921,065 76,332,019 34 REVENUES OVER (UNDER) EXPENDITURES (738,406) (307,669) (848,484.27) (540,815) (1,046,916.94) OTHER FINANCING SOURCES/(USES): 35 CARRYOVER - PRIOR YEAR 2,200,000 916,667 0 (916,667) 0 36 TRANSFERS IN 10,295,386 4,289,744 5,449,378 1,159,634 4,347,101 37 TRANSFERS OUT (11,756,980) (4,898,742) (11,756,980) (6,858,238) (11,609,856) REVENUES AND OTHER FINANCING SOURCES OVER (UNDER) 38 EXPENDITURES AND OTHER FINANCING USES 0 0 (7,156,086) (7,156,086) (8,309,672) 39 BEGINNING FUND BALANCE 23,174,193 23,174,193 23,174,193 0 22,158,829 40 ENDING FUND BALANCE (Notes 1 and 2) $23,174,193 $23,174,193 $16,018,107 ($7,156,086) $13,849,157 Note 1: Total encumbrances included in the reported expenditures are $475,934. Note 2: This presentation includes Fund 100A restricted reserves of $10,000,000. Note 3: Fund 108, General Fund Special Projects and Fund 110, Seized Money Fund, are considered part of the General Fund. The May 31, 2017 fund balance in Fund 108 is $23,378,678. The May 31, 2017 fund balance in Fund 110 is $14,393. This Monthly Financial Report was distributed to the Little Rock Board of Directors on September 08, 2017. 1 (Unaudited) City of Little Rock, Arkansas Monthly Financial Report General Fund For the Period Ended May 31, 2017

Welcome message from author
This document is posted to help you gain knowledge. Please leave a comment to let me know what you think about it! Share it to your friends and learn new things together.
Transcript
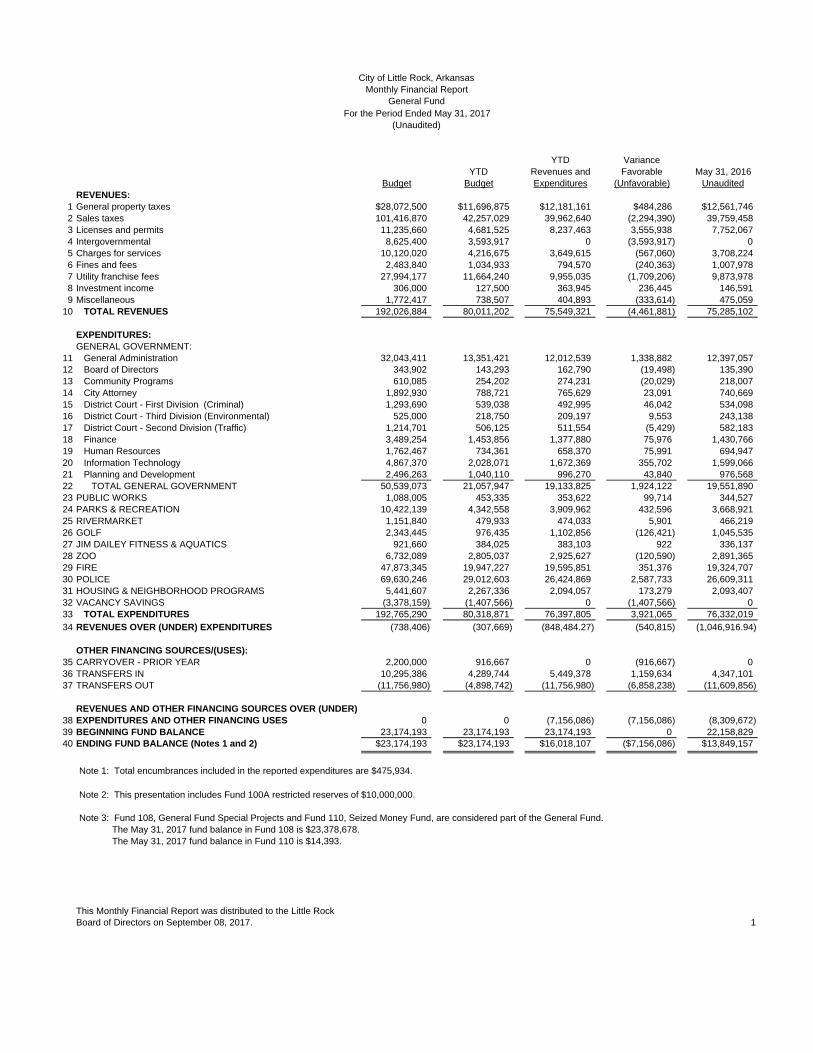
YTD VarianceYTD Revenues and Favorable May 31, 2016
Budget Budget Expenditures (Unfavorable) UnauditedREVENUES:
1 General property taxes $28,072,500 $11,696,875 $12,181,161 $484,286 $12,561,7462 Sales taxes 101,416,870 42,257,029 39,962,640 (2,294,390) 39,759,4583 Licenses and permits 11,235,660 4,681,525 8,237,463 3,555,938 7,752,0674 Intergovernmental 8,625,400 3,593,917 0 (3,593,917) 05 Charges for services 10,120,020 4,216,675 3,649,615 (567,060) 3,708,2246 Fines and fees 2,483,840 1,034,933 794,570 (240,363) 1,007,9787 Utility franchise fees 27,994,177 11,664,240 9,955,035 (1,709,206) 9,873,9788 Investment income 306,000 127,500 363,945 236,445 146,5919 Miscellaneous 1,772,417 738,507 404,893 (333,614) 475,059
10 TOTAL REVENUES 192,026,884 80,011,202 75,549,321 (4,461,881) 75,285,102
EXPENDITURES:GENERAL GOVERNMENT:
11 General Administration 32,043,411 13,351,421 12,012,539 1,338,882 12,397,057 12 Board of Directors 343,902 143,293 162,790 (19,498) 135,390 13 Community Programs 610,085 254,202 274,231 (20,029) 218,00714 City Attorney 1,892,930 788,721 765,629 23,091 740,66915 District Court - First Division (Criminal) 1,293,690 539,038 492,995 46,042 534,098 16 District Court - Third Division (Environmental) 525,000 218,750 209,197 9,553 243,138 17 District Court - Second Division (Traffic) 1,214,701 506,125 511,554 (5,429) 582,183 18 Finance 3,489,254 1,453,856 1,377,880 75,976 1,430,766 19 Human Resources 1,762,467 734,361 658,370 75,991 694,947 20 Information Technology 4,867,370 2,028,071 1,672,369 355,702 1,599,066 21 Planning and Development 2,496,263 1,040,110 996,270 43,840 976,568 22 TOTAL GENERAL GOVERNMENT 50,539,073 21,057,947 19,133,825 1,924,122 19,551,890 23 PUBLIC WORKS 1,088,005 453,335 353,622 99,714 344,527 24 PARKS & RECREATION 10,422,139 4,342,558 3,909,962 432,596 3,668,921 25 RIVERMARKET 1,151,840 479,933 474,033 5,901 466,219 26 GOLF 2,343,445 976,435 1,102,856 (126,421) 1,045,53527 JIM DAILEY FITNESS & AQUATICS 921,660 384,025 383,103 922 336,13728 ZOO 6,732,089 2,805,037 2,925,627 (120,590) 2,891,36529 FIRE 47,873,345 19,947,227 19,595,851 351,376 19,324,70730 POLICE 69,630,246 29,012,603 26,424,869 2,587,733 26,609,311 31 HOUSING & NEIGHBORHOOD PROGRAMS 5,441,607 2,267,336 2,094,057 173,279 2,093,407 32 VACANCY SAVINGS (3,378,159) (1,407,566) 0 (1,407,566) 033 TOTAL EXPENDITURES 192,765,290 80,318,871 76,397,805 3,921,065 76,332,019
34 REVENUES OVER (UNDER) EXPENDITURES (738,406) (307,669) (848,484.27) (540,815) (1,046,916.94)
OTHER FINANCING SOURCES/(USES):35 CARRYOVER - PRIOR YEAR 2,200,000 916,667 0 (916,667) 036 TRANSFERS IN 10,295,386 4,289,744 5,449,378 1,159,634 4,347,101 37 TRANSFERS OUT (11,756,980) (4,898,742) (11,756,980) (6,858,238) (11,609,856)
REVENUES AND OTHER FINANCING SOURCES OVER (UNDER)38 EXPENDITURES AND OTHER FINANCING USES 0 0 (7,156,086) (7,156,086) (8,309,672)39 BEGINNING FUND BALANCE 23,174,193 23,174,193 23,174,193 0 22,158,829 40 ENDING FUND BALANCE (Notes 1 and 2) $23,174,193 $23,174,193 $16,018,107 ($7,156,086) $13,849,157
Note 1: Total encumbrances included in the reported expenditures are $475,934.
Note 2: This presentation includes Fund 100A restricted reserves of $10,000,000.
Note 3: Fund 108, General Fund Special Projects and Fund 110, Seized Money Fund, are considered part of the General Fund. The May 31, 2017 fund balance in Fund 108 is $23,378,678. The May 31, 2017 fund balance in Fund 110 is $14,393.
This Monthly Financial Report was distributed to the Little RockBoard of Directors on September 08, 2017. 1
(Unaudited)
City of Little Rock, ArkansasMonthly Financial Report
General FundFor the Period Ended May 31, 2017
YTD Variance YTD Revenues and Favorable May 31, 2016
Budget Budget Expenditures (Unfavorable) UnauditedREVENUES:
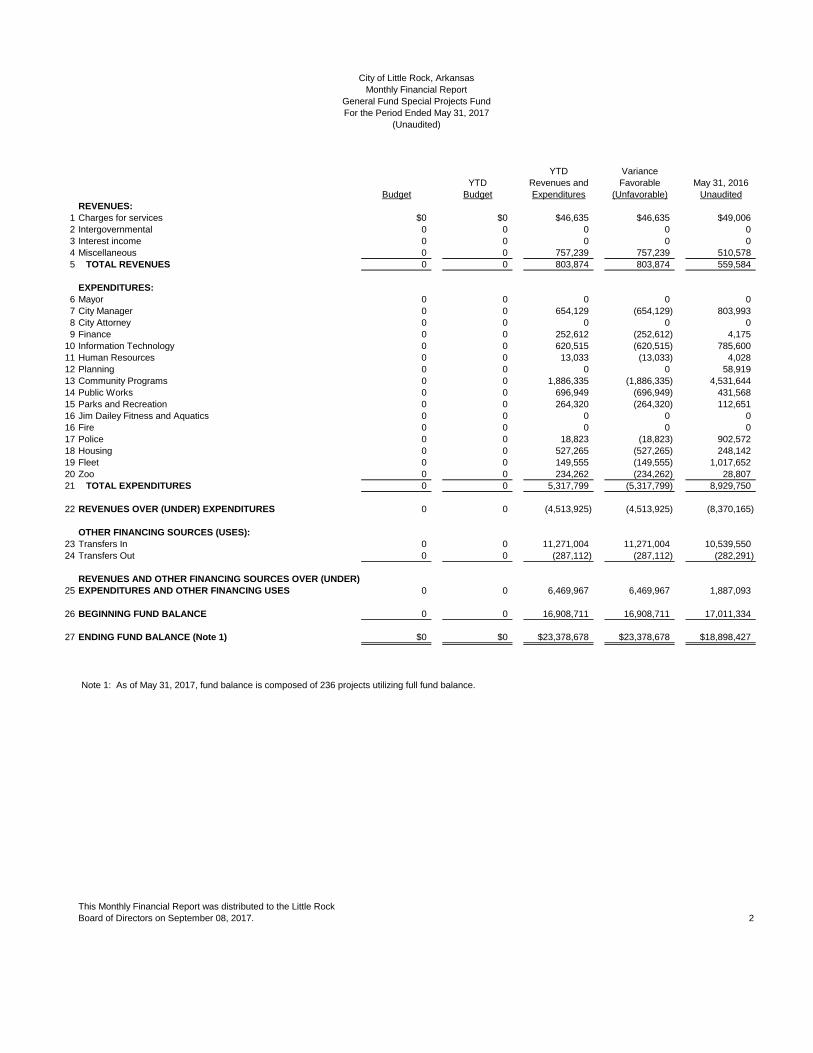
1 Charges for services $0 $0 $46,635 $46,635 $49,0062 Intergovernmental 0 0 0 0 03 Interest income 0 0 0 0 04 Miscellaneous 0 0 757,239 757,239 510,578 5 TOTAL REVENUES 0 0 803,874 803,874 559,584
EXPENDITURES: 6 Mayor 0 0 0 0 07 City Manager 0 0 654,129 (654,129) 803,9938 City Attorney 0 0 0 0 09 Finance 0 0 252,612 (252,612) 4,175
10 Information Technology 0 0 620,515 (620,515) 785,60011 Human Resources 0 0 13,033 (13,033) 4,02812 Planning 0 0 0 0 58,91913 Community Programs 0 0 1,886,335 (1,886,335) 4,531,64414 Public Works 0 0 696,949 (696,949) 431,56815 Parks and Recreation 0 0 264,320 (264,320) 112,65116 Jim Dailey Fitness and Aquatics 0 0 0 0 016 Fire 0 0 0 0 017 Police 0 0 18,823 (18,823) 902,57218 Housing 0 0 527,265 (527,265) 248,14219 Fleet 0 0 149,555 (149,555) 1,017,65220 Zoo 0 0 234,262 (234,262) 28,80721 TOTAL EXPENDITURES 0 0 5,317,799 (5,317,799) 8,929,750
22 REVENUES OVER (UNDER) EXPENDITURES 0 0 (4,513,925) (4,513,925) (8,370,165)
OTHER FINANCING SOURCES (USES):23 Transfers In 0 0 11,271,004 11,271,004 10,539,55024 Transfers Out 0 0 (287,112) (287,112) (282,291)
REVENUES AND OTHER FINANCING SOURCES OVER (UNDER)25 EXPENDITURES AND OTHER FINANCING USES 0 0 6,469,967 6,469,967 1,887,093
26 BEGINNING FUND BALANCE 0 0 16,908,711 16,908,711 17,011,334
27 ENDING FUND BALANCE (Note 1) $0 $0 $23,378,678 $23,378,678 $18,898,427
Note 1: As of May 31, 2017, fund balance is composed of 236 projects utilizing full fund balance.
This Monthly Financial Report was distributed to the Little RockBoard of Directors on September 08, 2017. 2
(Unaudited)
City of Little Rock, ArkansasMonthly Financial Report
General Fund Special Projects FundFor the Period Ended May 31, 2017
YTD Variance YTD Revenues and Favorable May 31, 2016
Budget Budget Expenditures (Unfavorable) UnauditedREVENUES:
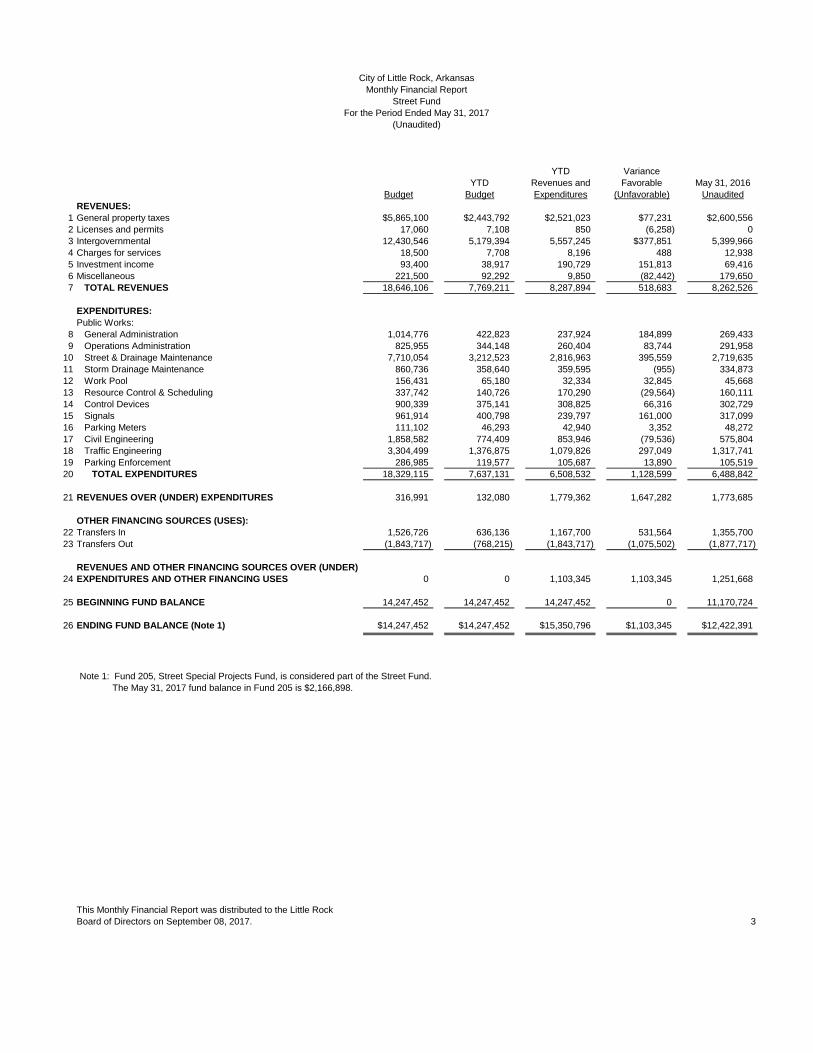
1 General property taxes $5,865,100 $2,443,792 $2,521,023 $77,231 $2,600,5562 Licenses and permits 17,060 7,108 850 (6,258) 03 Intergovernmental 12,430,546 5,179,394 5,557,245 $377,851 5,399,9664 Charges for services 18,500 7,708 8,196 488 12,9385 Investment income 93,400 38,917 190,729 151,813 69,4166 Miscellaneous 221,500 92,292 9,850 (82,442) 179,6507 TOTAL REVENUES 18,646,106 7,769,211 8,287,894 518,683 8,262,526
EXPENDITURES:Public Works:
8 General Administration 1,014,776 422,823 237,924 184,899 269,4339 Operations Administration 825,955 344,148 260,404 83,744 291,958
10 Street & Drainage Maintenance 7,710,054 3,212,523 2,816,963 395,559 2,719,63511 Storm Drainage Maintenance 860,736 358,640 359,595 (955) 334,87312 Work Pool 156,431 65,180 32,334 32,845 45,66813 Resource Control & Scheduling 337,742 140,726 170,290 (29,564) 160,11114 Control Devices 900,339 375,141 308,825 66,316 302,72915 Signals 961,914 400,798 239,797 161,000 317,09916 Parking Meters 111,102 46,293 42,940 3,352 48,27217 Civil Engineering 1,858,582 774,409 853,946 (79,536) 575,80418 Traffic Engineering 3,304,499 1,376,875 1,079,826 297,049 1,317,74119 Parking Enforcement 286,985 119,577 105,687 13,890 105,51920 TOTAL EXPENDITURES 18,329,115 7,637,131 6,508,532 1,128,599 6,488,842
21 REVENUES OVER (UNDER) EXPENDITURES 316,991 132,080 1,779,362 1,647,282 1,773,685
OTHER FINANCING SOURCES (USES):22 Transfers In 1,526,726 636,136 1,167,700 531,564 1,355,70023 Transfers Out (1,843,717) (768,215) (1,843,717) (1,075,502) (1,877,717)
REVENUES AND OTHER FINANCING SOURCES OVER (UNDER)24 EXPENDITURES AND OTHER FINANCING USES 0 0 1,103,345 1,103,345 1,251,668
25 BEGINNING FUND BALANCE 14,247,452 14,247,452 14,247,452 0 11,170,724
26 ENDING FUND BALANCE (Note 1) $14,247,452 $14,247,452 $15,350,796 $1,103,345 $12,422,391
Note 1: Fund 205, Street Special Projects Fund, is considered part of the Street Fund.
The May 31, 2017 fund balance in Fund 205 is $2,166,898.
This Monthly Financial Report was distributed to the Little RockBoard of Directors on September 08, 2017. 3
(Unaudited)
City of Little Rock, ArkansasMonthly Financial Report
Street FundFor the Period Ended May 31, 2017

YTD Variance YTD Revenues and Favorable May 31, 2016
Budget Budget Expenditures (Unfavorable) UnauditedREVENUES:
1 Charges for services $0 $0 $0 $0 $02 Interest income 0 0 0 0 03 Miscellaneous 0 0 0 0 191,4104 TOTAL REVENUES 0 0 0 0 191,410
EXPENDITURES:5 Public Works 0 0 594,137 (594,137) 1,270,7936 TOTAL EXPENDITURES 0 0 594,137 (594,137) 1,270,793
7 REVENUES OVER (UNDER) EXPENDITURES 0 0 (594,137) (594,137) (1,079,383)
OTHER FINANCING SOURCES (USES):8 Transfers In 0 0 1,100,000 0 1,400,0009 Transfers Out 0 0 0 0 0
REVENUES AND OTHER FINANCING SOURCES OVER (UNDER)10 EXPENDITURES AND OTHER FINANCING USES 0 0 505,863 (594,137) 320,617
11 BEGINNING FUND BALANCE 0 0 1,661,036 1,661,036 1,506,361
12 ENDING FUND BALANCE (Note 1) $0 $0 $2,166,898 $1,066,898 $1,826,978
Note 1: As of May 31, 2017, special project commitments for 12 projects utilizing full fund balance.
This Monthly Financial Report was distributed to the Little RockBoard of Directors on September 08, 2017. 4
(Unaudited)
City of Little Rock, ArkansasMonthly Financial Report
Street Fund Special Projects FundFor the Period Ended May 31, 2017
YTD Variance YTD Revenues and Favorable May 31, 2016
Budget Budget Expenditures (Unfavorable) UnauditedREVENUES:
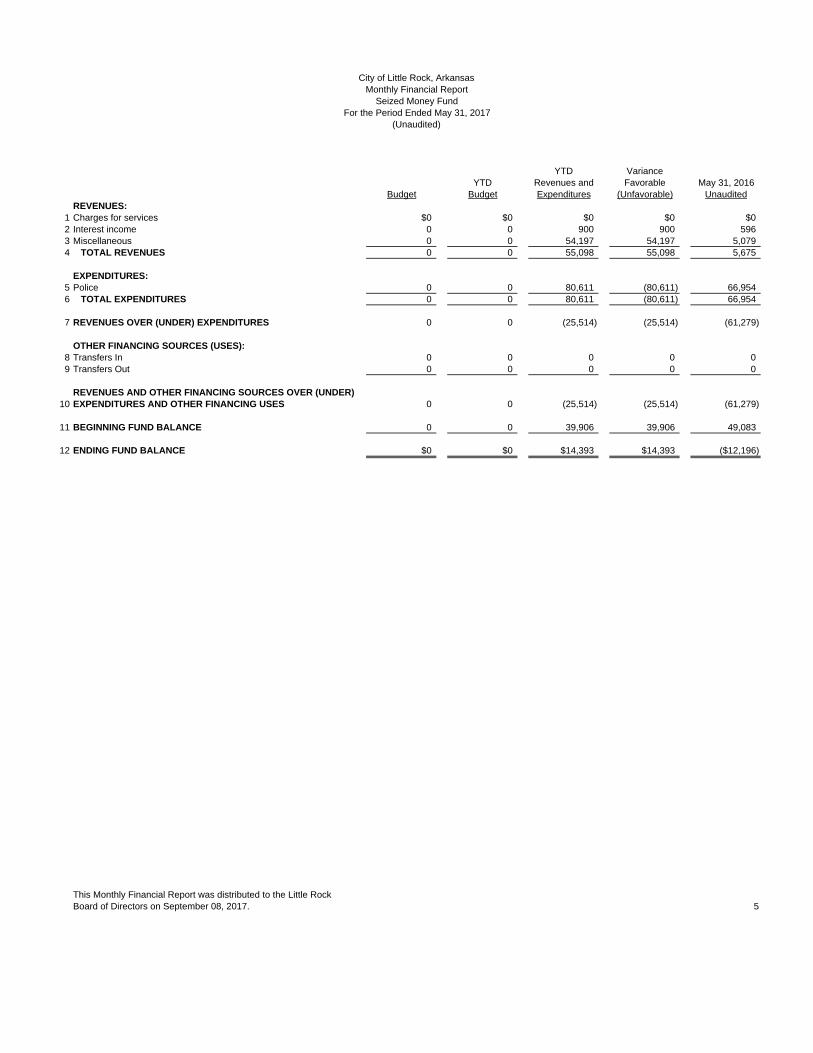
1 Charges for services $0 $0 $0 $0 $02 Interest income 0 0 900 900 5963 Miscellaneous 0 0 54,197 54,197 5,0794 TOTAL REVENUES 0 0 55,098 55,098 5,675
EXPENDITURES:5 Police 0 0 80,611 (80,611) 66,9546 TOTAL EXPENDITURES 0 0 80,611 (80,611) 66,954
7 REVENUES OVER (UNDER) EXPENDITURES 0 0 (25,514) (25,514) (61,279)
OTHER FINANCING SOURCES (USES):8 Transfers In 0 0 0 0 09 Transfers Out 0 0 0 0 0
REVENUES AND OTHER FINANCING SOURCES OVER (UNDER)10 EXPENDITURES AND OTHER FINANCING USES 0 0 (25,514) (25,514) (61,279)
11 BEGINNING FUND BALANCE 0 0 39,906 39,906 49,083
12 ENDING FUND BALANCE $0 $0 $14,393 $14,393 ($12,196)
This Monthly Financial Report was distributed to the Little RockBoard of Directors on September 08, 2017. 5
City of Little Rock, Arkansas
(Unaudited)For the Period Ended May 31, 2017
Seized Money FundMonthly Financial Report
YTD Variance YTD Revenues and Favorable May 31, 2016
Budget Budget Expenditures (Unfavorable) UnauditedREVENUES:
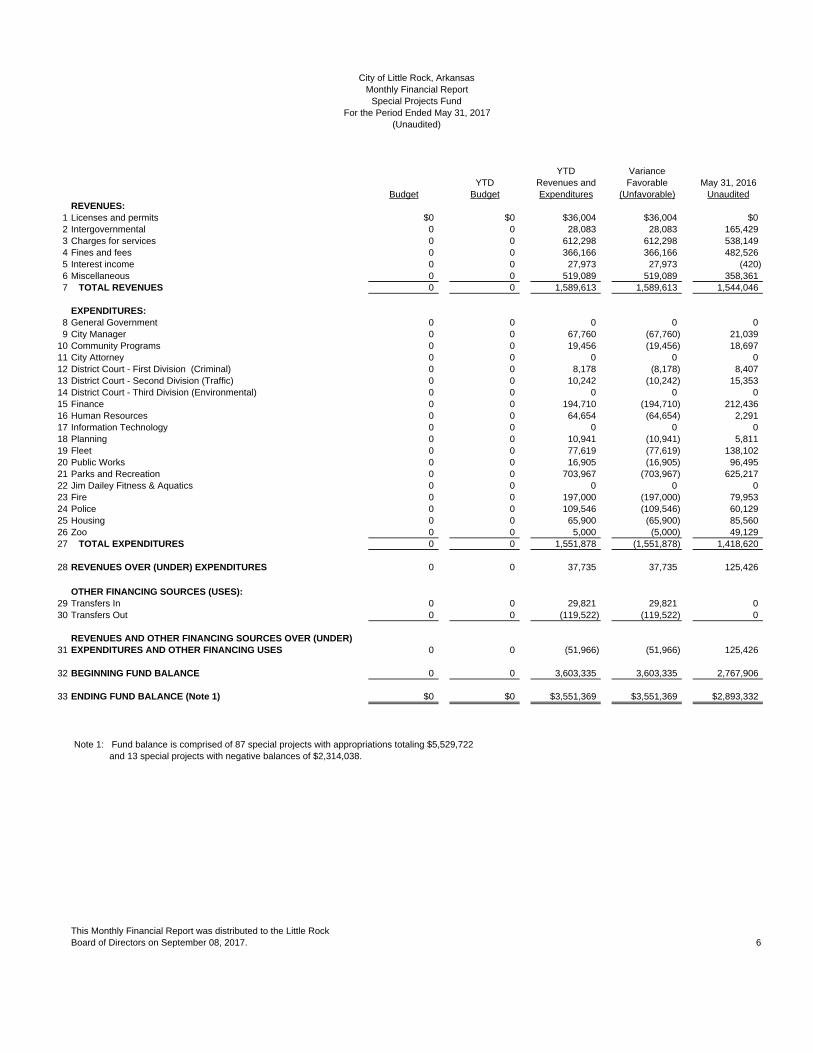
1 Licenses and permits $0 $0 $36,004 $36,004 $02 Intergovernmental 0 0 28,083 28,083 165,4293 Charges for services 0 0 612,298 612,298 538,149 4 Fines and fees 0 0 366,166 366,166 482,526 5 Interest income 0 0 27,973 27,973 (420)6 Miscellaneous 0 0 519,089 519,089 358,361 7 TOTAL REVENUES 0 0 1,589,613 1,589,613 1,544,046
EXPENDITURES:8 General Government 0 0 0 0 09 City Manager 0 0 67,760 (67,760) 21,039
10 Community Programs 0 0 19,456 (19,456) 18,69711 City Attorney 0 0 0 0 012 District Court - First Division (Criminal) 0 0 8,178 (8,178) 8,40713 District Court - Second Division (Traffic) 0 0 10,242 (10,242) 15,35314 District Court - Third Division (Environmental) 0 0 0 0 015 Finance 0 0 194,710 (194,710) 212,43616 Human Resources 0 0 64,654 (64,654) 2,29117 Information Technology 0 0 0 0 018 Planning 0 0 10,941 (10,941) 5,81119 Fleet 0 0 77,619 (77,619) 138,10220 Public Works 0 0 16,905 (16,905) 96,49521 Parks and Recreation 0 0 703,967 (703,967) 625,21722 Jim Dailey Fitness & Aquatics 0 0 0 0 023 Fire 0 0 197,000 (197,000) 79,95324 Police 0 0 109,546 (109,546) 60,12925 Housing 0 0 65,900 (65,900) 85,56026 Zoo 0 0 5,000 (5,000) 49,12927 TOTAL EXPENDITURES 0 0 1,551,878 (1,551,878) 1,418,620
28 REVENUES OVER (UNDER) EXPENDITURES 0 0 37,735 37,735 125,426
OTHER FINANCING SOURCES (USES):29 Transfers In 0 0 29,821 29,821 030 Transfers Out 0 0 (119,522) (119,522) 0
REVENUES AND OTHER FINANCING SOURCES OVER (UNDER)31 EXPENDITURES AND OTHER FINANCING USES 0 0 (51,966) (51,966) 125,426
32 BEGINNING FUND BALANCE 0 0 3,603,335 3,603,335 2,767,906
33 ENDING FUND BALANCE (Note 1) $0 $0 $3,551,369 $3,551,369 $2,893,332
Note 1: Fund balance is comprised of 87 special projects with appropriations totaling $5,529,722and 13 special projects with negative balances of $2,314,038.
This Monthly Financial Report was distributed to the Little RockBoard of Directors on September 08, 2017. 6
City of Little Rock, Arkansas
(Unaudited)For the Period Ended May 31, 2017
Special Projects FundMonthly Financial Report
YTD Variance YTD Revenues and Favorable May 31, 2016
Budget Budget Expenditures (Unfavorable) UnauditedREVENUES:
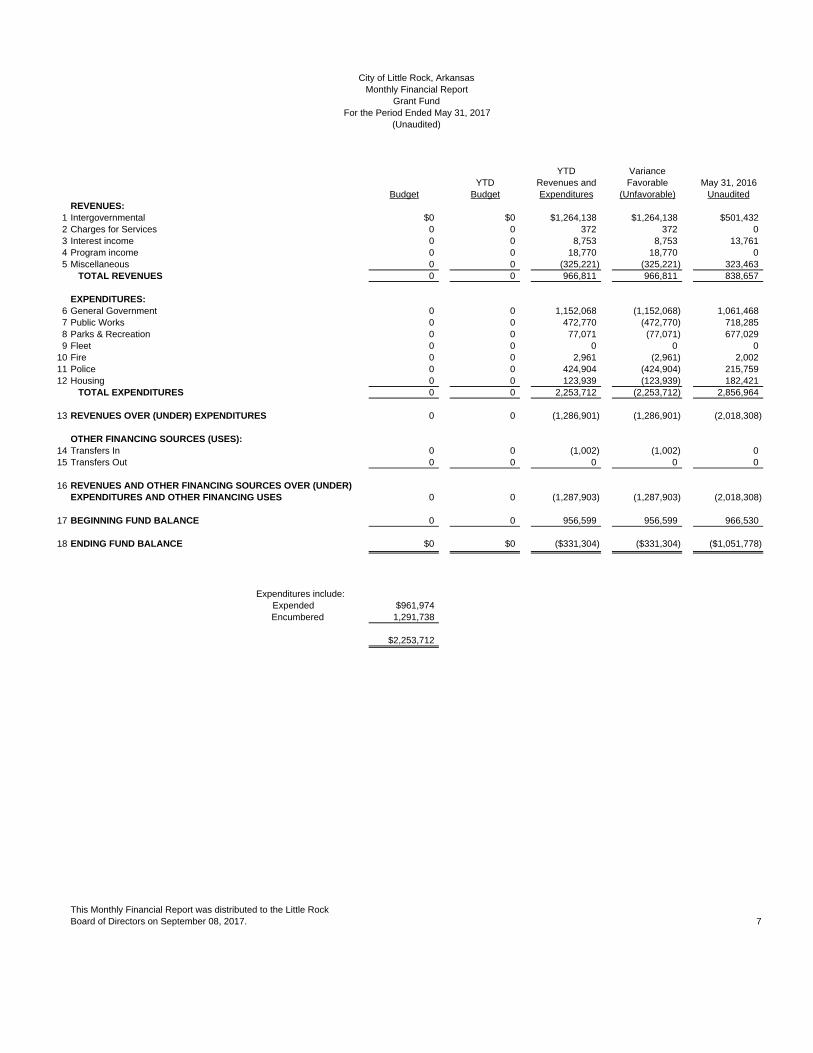
1 Intergovernmental $0 $0 $1,264,138 $1,264,138 $501,4322 Charges for Services 0 0 372 372 03 Interest income 0 0 8,753 8,753 13,7614 Program income 0 0 18,770 18,770 05 Miscellaneous 0 0 (325,221) (325,221) 323,463
TOTAL REVENUES 0 0 966,811 966,811 838,657
EXPENDITURES:6 General Government 0 0 1,152,068 (1,152,068) 1,061,4687 Public Works 0 0 472,770 (472,770) 718,2858 Parks & Recreation 0 0 77,071 (77,071) 677,0299 Fleet 0 0 0 0 0
10 Fire 0 0 2,961 (2,961) 2,00211 Police 0 0 424,904 (424,904) 215,75912 Housing 0 0 123,939 (123,939) 182,421
TOTAL EXPENDITURES 0 0 2,253,712 (2,253,712) 2,856,964
13 REVENUES OVER (UNDER) EXPENDITURES 0 0 (1,286,901) (1,286,901) (2,018,308)
OTHER FINANCING SOURCES (USES):14 Transfers In 0 0 (1,002) (1,002) 015 Transfers Out 0 0 0 0 0
16 REVENUES AND OTHER FINANCING SOURCES OVER (UNDER)EXPENDITURES AND OTHER FINANCING USES 0 0 (1,287,903) (1,287,903) (2,018,308)
17 BEGINNING FUND BALANCE 0 0 956,599 956,599 966,530
18 ENDING FUND BALANCE $0 $0 ($331,304) ($331,304) ($1,051,778)
Expenditures include: Expended $961,974
Encumbered 1,291,738
$2,253,712
This Monthly Financial Report was distributed to the Little RockBoard of Directors on September 08, 2017. 7
(Unaudited)
City of Little Rock, ArkansasMonthly Financial Report
Grant FundFor the Period Ended May 31, 2017
YTD Variance YTD Revenues and Favorable May 31, 2016
Budget Budget Expenditures (Unfavorable) UnauditedREVENUES:
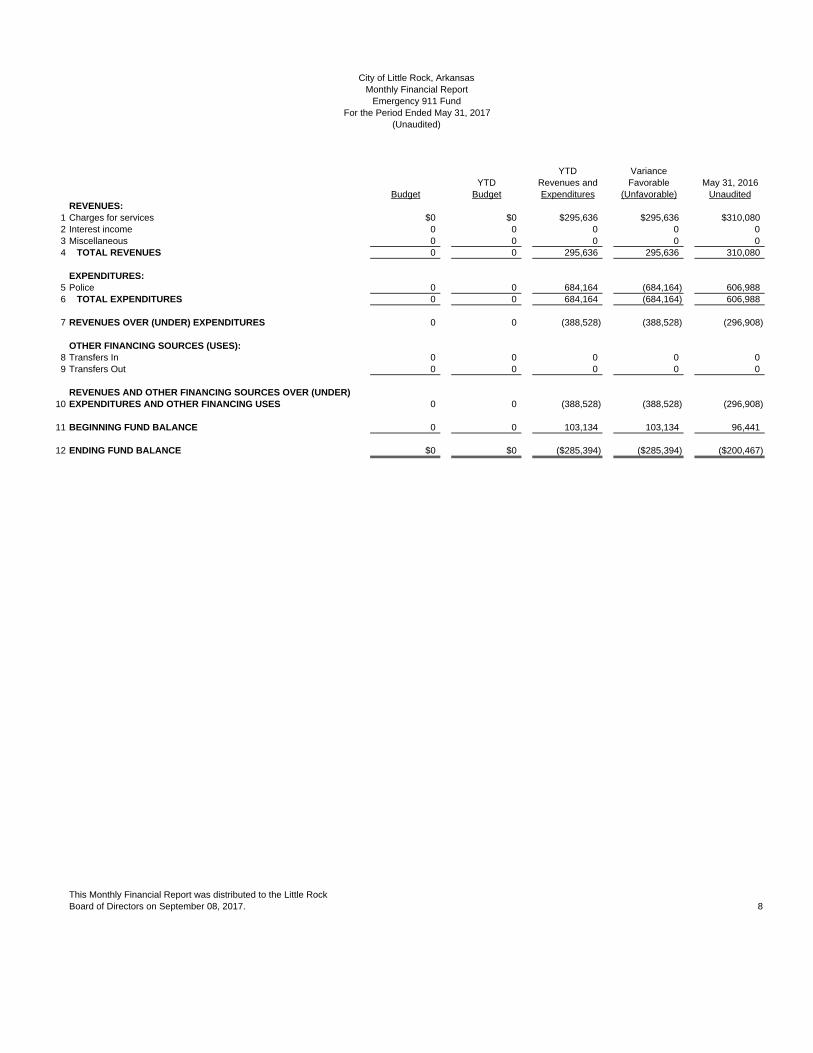
1 Charges for services $0 $0 $295,636 $295,636 $310,0802 Interest income 0 0 0 0 03 Miscellaneous 0 0 0 0 04 TOTAL REVENUES 0 0 295,636 295,636 310,080
EXPENDITURES:5 Police 0 0 684,164 (684,164) 606,9886 TOTAL EXPENDITURES 0 0 684,164 (684,164) 606,988
7 REVENUES OVER (UNDER) EXPENDITURES 0 0 (388,528) (388,528) (296,908)
OTHER FINANCING SOURCES (USES):8 Transfers In 0 0 0 0 09 Transfers Out 0 0 0 0 0
REVENUES AND OTHER FINANCING SOURCES OVER (UNDER)10 EXPENDITURES AND OTHER FINANCING USES 0 0 (388,528) (388,528) (296,908)
11 BEGINNING FUND BALANCE 0 0 103,134 103,134 96,441
12 ENDING FUND BALANCE $0 $0 ($285,394) ($285,394) ($200,467)
This Monthly Financial Report was distributed to the Little RockBoard of Directors on September 08, 2017. 8
(Unaudited)
City of Little Rock, ArkansasMonthly Financial Report
Emergency 911 FundFor the Period Ended May 31, 2017

YTD Variance YTD Revenues and Favorable May 31, 2016
Budget Budget Expenditures (Unfavorable) UnauditedREVENUES:
1 Intergovernmental $0 $0 $655,889 $655,889 $521,6242 Charges for Services 0 0 0 0 03 Miscellaneous 0 0 0 0 04 TOTAL REVENUES 0 0 655,889 655,889 521,624
EXPENDITURES:5 General Government 0 0 0 0 06 Housing 0 0 742,610 (742,610) 736,1307 TOTAL EXPENDITURES 0 0 742,610 (742,610) 736,130
8 REVENUES OVER (UNDER) EXPENDITURES 0 0 (86,721) (86,721) (214,506)
OTHER FINANCING SOURCES (USES):9 Transfers In 0 0 0 0 0
10 Transfers Out 0 0 0 0 0
REVENUES AND OTHER FINANCING SOURCES OVER (UNDER)11 EXPENDITURES AND OTHER FINANCING USES 0 0 (86,721) (86,721) (214,506)
12 BEGINNING FUND BALANCE 0 0 839,253 839,253 1,059,167
13 ENDING FUND BALANCE $0 $0 $752,532 $752,532 $844,660
Expenditures include: Expended $663,554
Encumbered 79,055
$742,610
This Monthly Financial Report was distributed to the Little RockBoard of Directors on September 08, 2017. 9
(Unaudited)
City of Little Rock, ArkansasMonthly Financial Report
Community Development Block Grant FundFor the Period Ended May 31, 2017

YTD Variance YTD Revenues and Favorable May 31, 2016
Budget Budget Expenditures (Unfavorable) UnauditedREVENUES:
1 Intergovernmental $0 $0 $250,754 $250,754 $327,6292 Charges for Services 0 0 0 0 03 Miscellaneous 0 0 0 0 04 TOTAL REVENUES 0 0 250,754 250,754 327,629
EXPENDITURES:5 General Government 0 0 0 0 06 Housing 0 0 268,943 (268,943) 953,0327 TOTAL EXPENDITURES 0 0 268,943 (268,943) 953,032
8 REVENUES OVER (UNDER) EXPENDITURES 0 0 (18,189) (18,189) (625,403)
OTHER FINANCING SOURCES (USES):9 Transfers In 0 0 0 0 0
10 Transfers Out 0 0 0 0 0
REVENUES AND OTHER FINANCING SOURCES OVER (UNDER)11 EXPENDITURES AND OTHER FINANCING USES 0 0 (18,189) (18,189) (625,403)
12 BEGINNING FUND BALANCE 0 0 884,211 884,211 872,326
13 ENDING FUND BALANCE $0 $0 $866,022 $866,022 $246,923
Expenditures include: Expended $183,042
Encumbered 85,901
$268,943
This Monthly Financial Report was distributed to the Little RockBoard of Directors on September 08, 2017. 10
(Unaudited)
City of Little Rock, ArkansasMonthly Financial Report
HIPP FundFor the Period Ended May 31, 2017

YTD Variance YTD Revenues and Favorable May 31, 2016
Budget Budget Expenditures (Unfavorable) UnauditedREVENUES:
1 Intergovernmental $0 $0 $8,994 $8,994 $652 Charges for Services 0 0 0 0 03 Miscellaneous 0 0 4 4 04 TOTAL REVENUES 0 0 8,998 8,998 65
EXPENDITURES:5 General Government 0 0 0 0 06 Housing 0 0 9,161 (9,161) 3,2057 TOTAL EXPENDITURES 0 0 9,161 (9,161) 3,205
8 REVENUES OVER (UNDER) EXPENDITURES 0 0 (163) (163) (3,140)
OTHER FINANCING SOURCES (USES):9 Loan Proceeds 0 0 0 0 0
10 Transfers In 0 0 0 0 011 Transfers Out 0 0 0 0 0
REVENUES AND OTHER FINANCING SOURCES OVER (UNDER)12 EXPENDITURES AND OTHER FINANCING USES 0 0 (163) (163) (3,140)
13 BEGINNING FUND BALANCE 0 0 25,656 25,656 32,568
14 ENDING FUND BALANCE $0 $0 $25,493 $25,493 $29,427
Expenditures include: Expended $9,161
Encumbered 0
$9,161
This Monthly Financial Report was distributed to the Little RockBoard of Directors on September 08, 2017. 11
(Unaudited)
City of Little Rock, ArkansasMonthly Financial Report
NHSP FundFor the Period Ended May 31, 2017
YTD VarianceYTD Revenues and Favorable May 31, 2016
Budget Budget Expenditures (Unfavorable) UnauditedREVENUES:
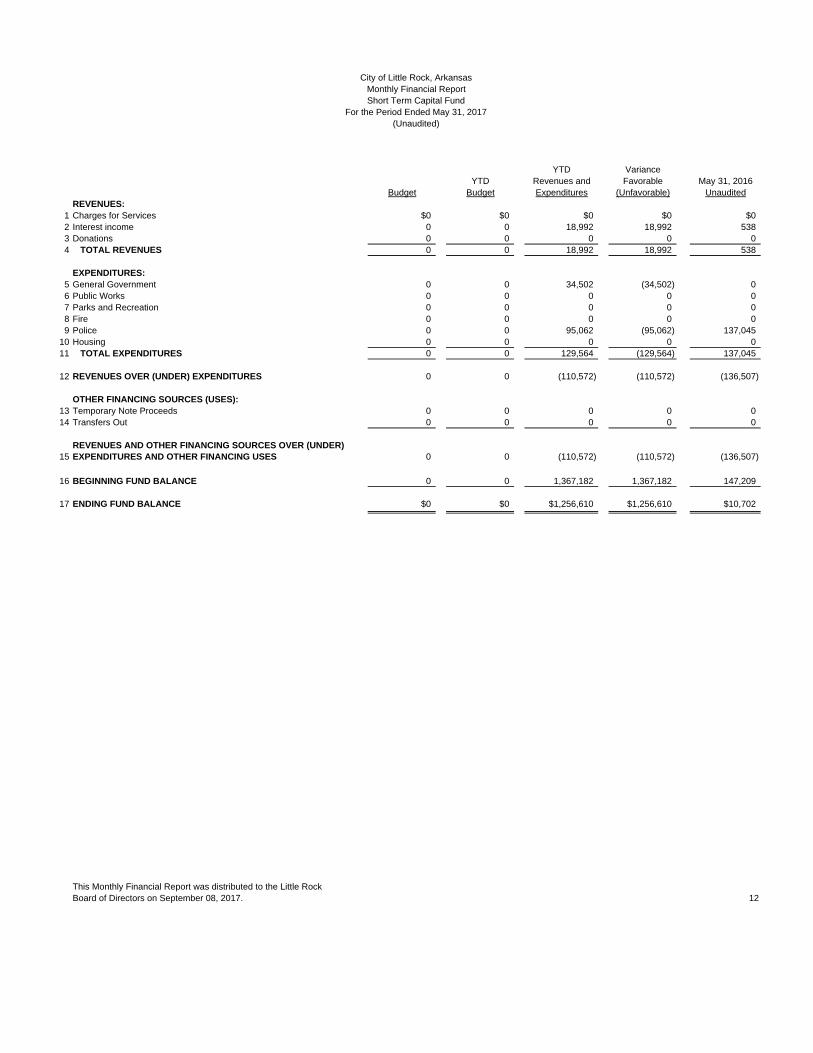
1 Charges for Services $0 $0 $0 $0 $02 Interest income 0 0 18,992 18,992 5383 Donations 0 0 0 0 04 TOTAL REVENUES 0 0 18,992 18,992 538
EXPENDITURES:5 General Government 0 0 34,502 (34,502) 06 Public Works 0 0 0 0 07 Parks and Recreation 0 0 0 0 08 Fire 0 0 0 0 09 Police 0 0 95,062 (95,062) 137,045
10 Housing 0 0 0 0 011 TOTAL EXPENDITURES 0 0 129,564 (129,564) 137,045
12 REVENUES OVER (UNDER) EXPENDITURES 0 0 (110,572) (110,572) (136,507)
OTHER FINANCING SOURCES (USES):13 Temporary Note Proceeds 0 0 0 0 014 Transfers Out 0 0 0 0 0
REVENUES AND OTHER FINANCING SOURCES OVER (UNDER)15 EXPENDITURES AND OTHER FINANCING USES 0 0 (110,572) (110,572) (136,507)
16 BEGINNING FUND BALANCE 0 0 1,367,182 1,367,182 147,209
17 ENDING FUND BALANCE $0 $0 $1,256,610 $1,256,610 $10,702
This Monthly Financial Report was distributed to the Little RockBoard of Directors on September 08, 2017. 12
For the Period Ended May 31, 2017(Unaudited)
City of Little Rock, ArkansasMonthly Financial ReportShort Term Capital Fund

YTD VarianceYTD Revenues and Favorable May 31, 2016
Budget Budget Expenditures (Unfavorable) UnauditedREVENUES:
1 3/8 Cent Sales Tax $0 $0 $7,377,709 $7,377,709 $7,241,8512 Interest income 0 0 500,228 500,228 168,1853 Miscellaneous Income 0 0 0 0 04 TOTAL REVENUES 0 0 7,877,937 7,877,937 7,410,037
EXPENDITURES:5 General Government 0 0 4,338,454 (4,338,454) 1,407,4306 Housing 0 0 61,944 (61,944) 19,4537 Public Works 0 0 15,326,576 (15,326,576) 2,615,5198 Parks and Recreation 0 0 471,864 (471,864) 3,803,4489 Fire 0 0 79,461 (79,461) 9,553
10 Police 0 0 394,647 (394,647) 1,361,89011 Fleet 0 0 0 0 1,63912 Zoo 0 0 364,950 (364,950) 409,65913 TOTAL EXPENDITURES 0 0 21,037,897 (21,037,897) 9,628,590
14 REVENUES OVER (UNDER) EXPENDITURES 0 0 (13,159,961) (13,159,961) (2,218,554)
OTHER FINANCING SOURCES (USES):15 Temporary Note Proceeds 0 0 0 0 016 Transfers Out 0 0 (3,487,990) (3,487,990) (2,438,434)
REVENUES AND OTHER FINANCING SOURCES OVER (UNDER)17 EXPENDITURES AND OTHER FINANCING USES 0 0 (16,647,951) (16,647,951) (4,656,988)
18 BEGINNING FUND BALANCE 0 0 38,727,096 38,727,096 29,813,516
19 ENDING FUND BALANCE $0 $0 $22,079,146 $22,079,146 $25,156,528
Expenditures include: Expended $9,098,784
Encumbered 11,939,114
Total $21,037,897
This Monthly Financial Report was distributed to the Little RockBoard of Directors on September 08, 2017. 13
For the Period Ended May 31, 2017(Unaudited)
City of Little Rock, ArkansasMonthly Financial Report
2012-2021 Capital Project Fund
YTD Variance YTD Revenues and Favorable May 31, 2016
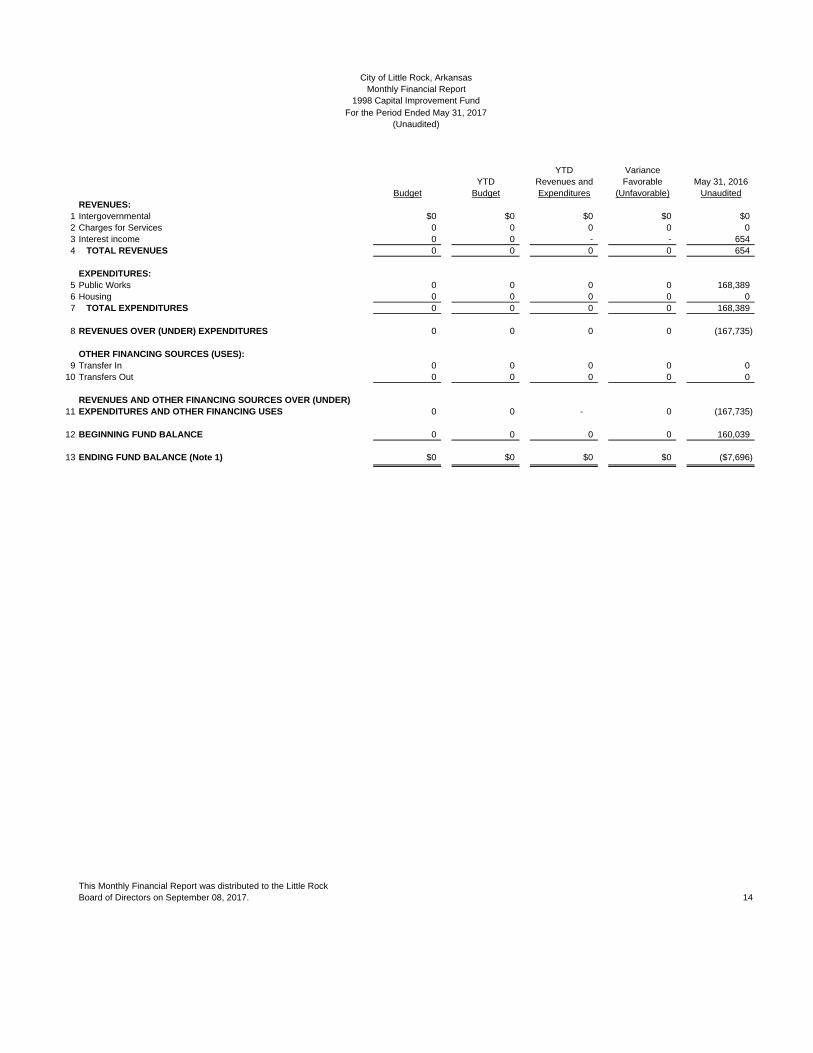
Budget Budget Expenditures (Unfavorable) UnauditedREVENUES:
1 Intergovernmental $0 $0 $0 $0 $02 Charges for Services 0 0 0 0 03 Interest income 0 0 - - 654 4 TOTAL REVENUES 0 0 0 0 654
EXPENDITURES:5 Public Works 0 0 0 0 168,3896 Housing 0 0 0 0 07 TOTAL EXPENDITURES 0 0 0 0 168,389
8 REVENUES OVER (UNDER) EXPENDITURES 0 0 0 0 (167,735)
OTHER FINANCING SOURCES (USES):9 Transfer In 0 0 0 0 0
10 Transfers Out 0 0 0 0 0
REVENUES AND OTHER FINANCING SOURCES OVER (UNDER)11 EXPENDITURES AND OTHER FINANCING USES 0 0 - 0 (167,735)
12 BEGINNING FUND BALANCE 0 0 0 0 160,039
13 ENDING FUND BALANCE (Note 1) $0 $0 $0 $0 ($7,696)
This Monthly Financial Report was distributed to the Little RockBoard of Directors on September 08, 2017. 14
(Unaudited)
City of Little Rock, ArkansasMonthly Financial Report
1998 Capital Improvement FundFor the Period Ended May 31, 2017

YTD VarianceYTD Revenues and Favorable May 31, 2016
Budget Budget Expenditures (Unfavorable) UnauditedREVENUES:
1 Interest income $0 $0 $33 $33 $362 Miscellaneous 0 0 0 0 03 TOTAL REVENUES 0 0 33 33 36
EXPENDITURES:4 General Government 0 0 84 (84) 845 TOTAL EXPENDITURES 0 0 84 (84) 84
6 REVENUES OVER (UNDER) EXPENDITURES 0 0 (51) (51) (48)
OTHER FINANCING SOURCES (USES):7 Bond Proceeds 0 0 0 0 08 Transfers In 0 0 0 0 09 Transfers Out 0 0 0 0 0
REVENUES AND OTHER FINANCING SOURCES OVER (UNDER)10 EXPENDITURES AND OTHER FINANCING USES 0 0 (51) (51) (48)
11 BEGINNING FUND BALANCE 0 0 1,872 1,872 5,835
12 ENDING FUND BALANCE $0 $0 $1,821 $1,821 $5,788
Note 1: As of May 31, 2017, the fund balance has been allocated to 3 special projects.
This Monthly Financial Report was distributed to the Little RockBoard of Directors on September 08, 2017. 15
(Unaudited)
City of Little Rock, ArkansasMonthly Financial Report
2004 Capital ImprovementsFor the Period Ended May 31, 2017
YTD VarianceYTD Revenues and Favorable May 31, 2016
Budget Budget Expenditures (Unfavorable) ActualREVENUES:
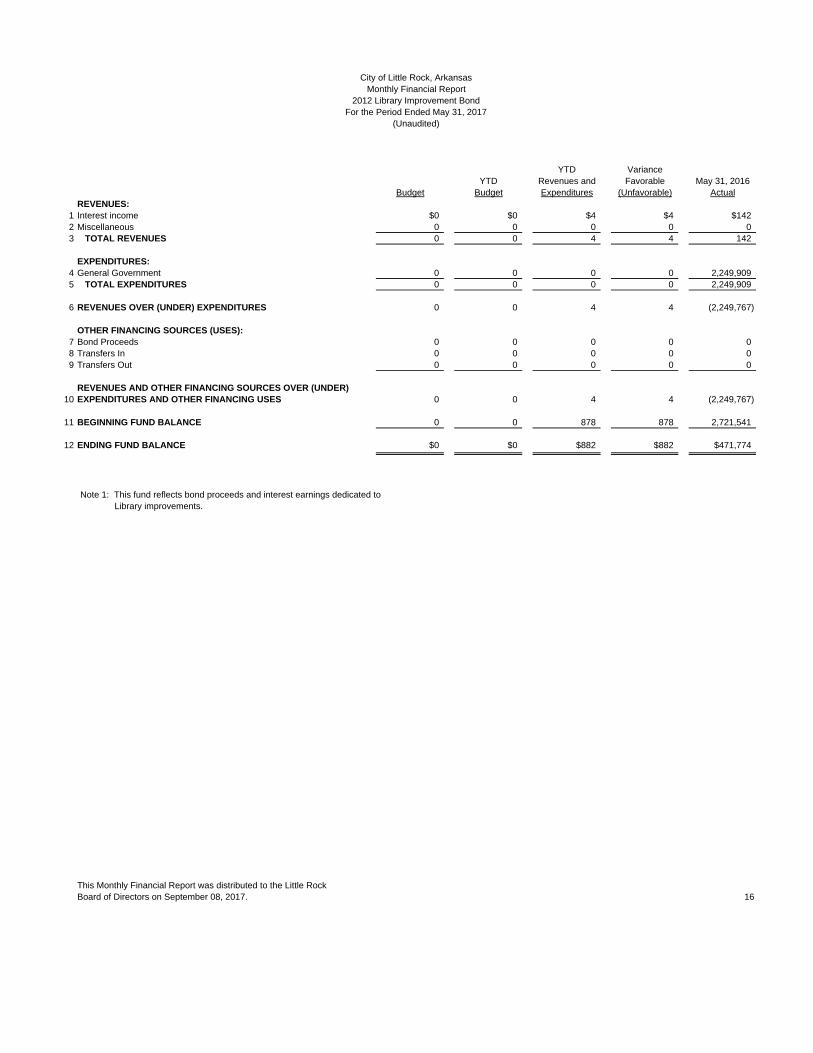
1 Interest income $0 $0 $4 $4 $1422 Miscellaneous 0 0 0 0 03 TOTAL REVENUES 0 0 4 4 142
EXPENDITURES:4 General Government 0 0 0 0 2,249,9095 TOTAL EXPENDITURES 0 0 0 0 2,249,909
6 REVENUES OVER (UNDER) EXPENDITURES 0 0 4 4 (2,249,767)
OTHER FINANCING SOURCES (USES):7 Bond Proceeds 0 0 0 0 08 Transfers In 0 0 0 0 09 Transfers Out 0 0 0 0 0
REVENUES AND OTHER FINANCING SOURCES OVER (UNDER)10 EXPENDITURES AND OTHER FINANCING USES 0 0 4 4 (2,249,767)
11 BEGINNING FUND BALANCE 0 0 878 878 2,721,541
12 ENDING FUND BALANCE $0 $0 $882 $882 $471,774
Note 1: This fund reflects bond proceeds and interest earnings dedicated to Library improvements.
This Monthly Financial Report was distributed to the Little RockBoard of Directors on September 08, 2017. 16
(Unaudited)
City of Little Rock, ArkansasMonthly Financial Report
2012 Library Improvement BondFor the Period Ended May 31, 2017
YTD VarianceYTD Revenues and Favorable May 31, 2016
Budget Budget Expenditures (Unfavorable) ActualREVENUES:
1 Interest income $0 $0 $18,703 $18,703 $60,3892 Miscellaneous 0 0 - 0 03 TOTAL REVENUES 0 0 18,703 18,703 60,389
EXPENDITURES:4 General Government 0 0 3,617,603 (3,617,603) 1,901,2265 TOTAL EXPENDITURES 0 0 3,617,603 (3,617,603) 1,901,226
6 REVENUES OVER (UNDER) EXPENDITURES 0 0 (3,598,900) (3,598,900) (1,840,837)
OTHER FINANCING SOURCES (USES):7 Bond Proceeds 0 0 - 0 08 Discount on Bonds Issued 0 0 - 0 09 Bond Reoffering Premium 0 0 - 0 0
10 Other, net 0 0 - 0 011 Transfers In 0 0 - 0 012 Transfers Out 0 0 - 0 0
REVENUES AND OTHER FINANCING SOURCES OVER (UNDER)13 EXPENDITURES AND OTHER FINANCING USES 0 0 (3,598,900) (3,598,900) (1,840,837)
14 BEGINNING FUND BALANCE 0 0 10,600,674 10,600,674 18,353,173
15 ENDING FUND BALANCE $0 $0 $7,001,774 $7,001,774 $16,512,336
Note 1: This fund reflects bond proceeds and interest earnings dedicated to Library improvements.
This Monthly Financial Report was distributed to the Little RockBoard of Directors on September 08, 2017. 17
City of Little Rock, ArkansasMonthly Financial Report
2015 Library Improvement BondFor the Period Ended May 31, 2017
(Unaudited)

YTD VarianceYTD Revenues and Favorable May 31, 2016
Budget Budget Expenditures (Unfavorable) UnauditedREVENUES:
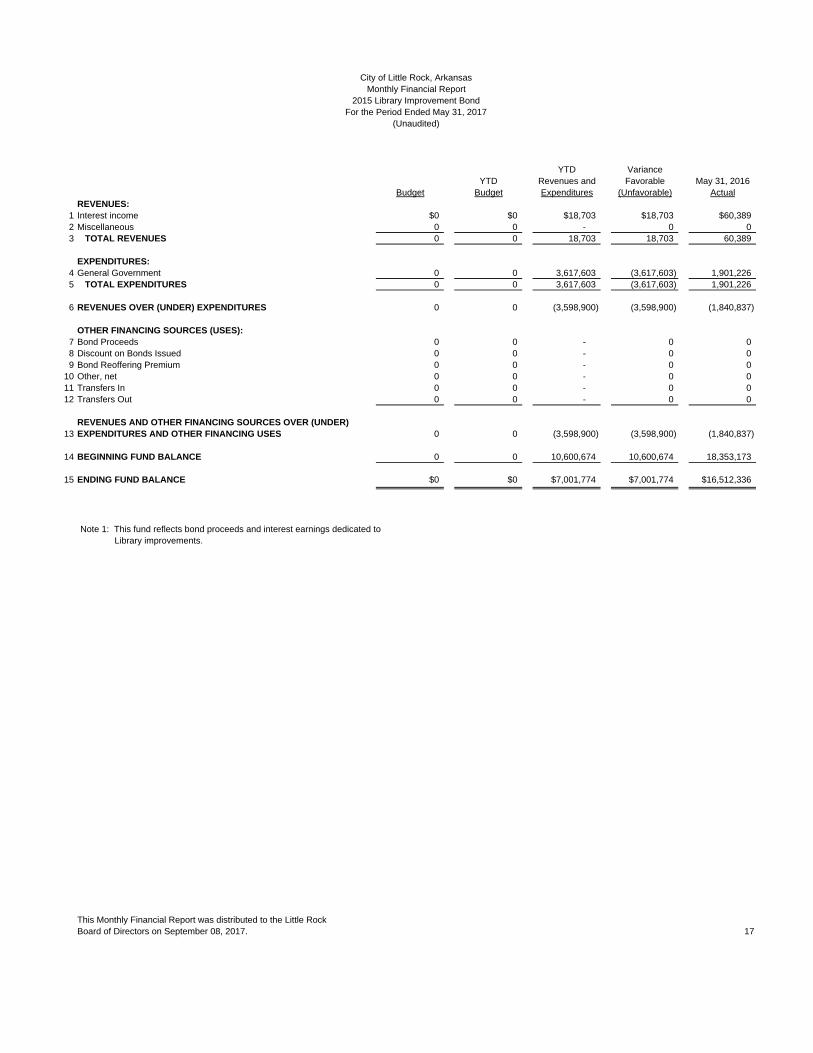
1 Interest income $0 $0 $42,222 $42,222 $147,3032 Miscellaneous 0 0 0 0 03 TOTAL REVENUES 0 0 42,222 42,222 147,303
EXPENDITURES:4 Public Works 0 0 11,421,155 (11,421,155) 24,055,4275 TOTAL EXPENDITURES 0 0 11,421,155 (11,421,155) 24,055,427
6 REVENUES OVER (UNDER) EXPENDITURES 0 0 (11,378,933) (11,378,933) (23,908,124)
OTHER FINANCING SOURCES (USES):7 Bond Proceeds 0 0 0 0 08 Transfers In 0 0 0 0 09 Transfers Out 0 0 0 0 0
REVENUES AND OTHER FINANCING SOURCES OVER (UNDER)10 EXPENDITURES AND OTHER FINANCING USES 0 0 (11,378,933) (11,378,933) (23,908,124)
11 BEGINNING FUND BALANCE 0 0 12,121,119 12,121,119 35,208,660
12 ENDING FUND BALANCE $0 $0 $742,187 $742,187 11,300,536
Expenditures include: Expended 3,576,563
Encumbered 7,844,592
Total $11,421,155
Note 1: As of May 31, 2017, the fund balance has been allocated to 35 special projects.
This Monthly Financial Report was distributed to the Little RockBoard of Directors on September 08, 2017. 18
City of Little Rock, ArkansasMonthly Financial Report
2013 Capital Improvement BondsFor the Period Ended May 31, 2017
(Unaudited)

YTD VarianceYTD Revenues and Favorable May 31, 2016
Budget Budget Expenditures (Unfavorable) UnauditedREVENUES:
1 Interest income $0 $0 $13 $13 $12 Miscellaneous 0 0 0 0 03 TOTAL REVENUES 0 0 13 13 1
EXPENDITURES:4 Public Works 0 0 0 0 05 TOTAL EXPENDITURES 0 0 0 0 0
6 REVENUES OVER (UNDER) EXPENDITURES 0 0 13 13 1
OTHER FINANCING SOURCES (USES):7 Bond Proceeds 0 0 0 0 08 Transfers In 0 0 0 0 09 Transfers Out 0 0 0 0 0
REVENUES AND OTHER FINANCING SOURCES OVER (UNDER)10 EXPENDITURES AND OTHER FINANCING USES 0 0 13 13 1
11 BEGINNING FUND BALANCE 0 0 6 6 2
12 ENDING FUND BALANCE $0 $0 $19 $19 $3
Expenditures include: Expended -
Encumbered -
Total $0
This Monthly Financial Report was distributed to the Little RockBoard of Directors on September 08, 2017. 19
City of Little Rock, ArkansasMonthly Financial Report
2014 TIF #1 Capital Improvement BondFor the Period Ended May 31, 2017
(Unaudited)
YTD VarianceYTD Revenues and Favorable May 31, 2016
Budget Budget Expenditures (Unfavorable) UnauditedREVENUES:
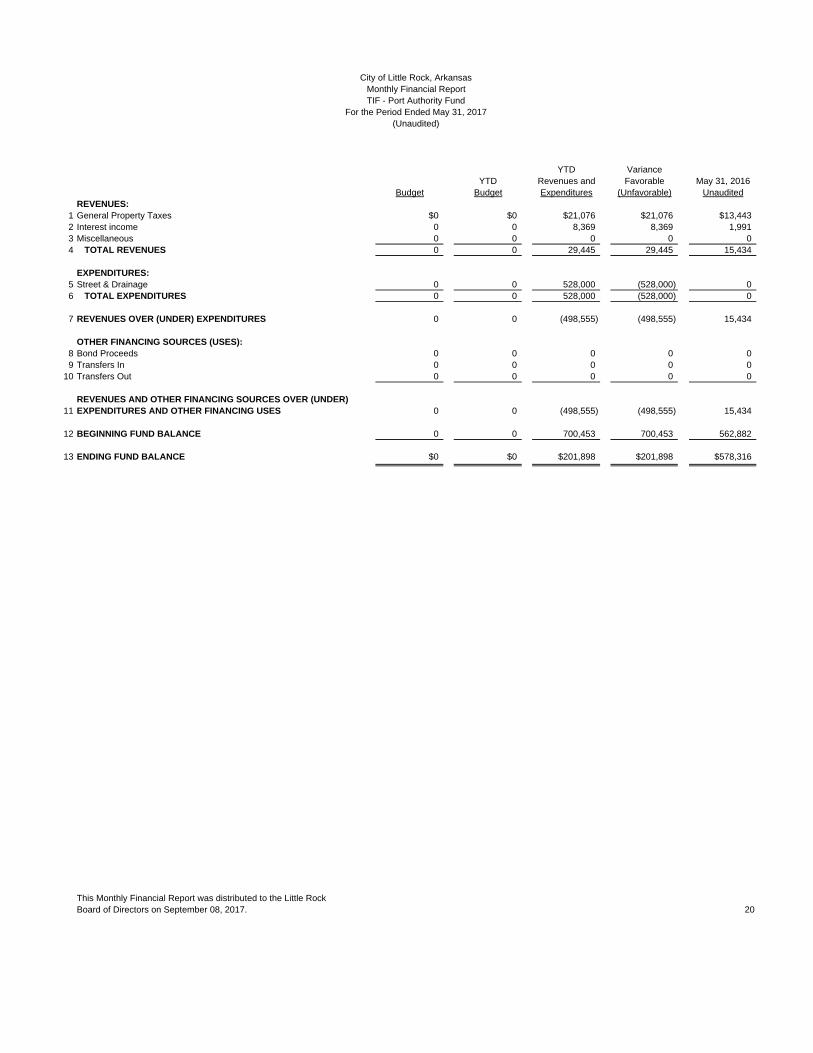
1 General Property Taxes $0 $0 $21,076 $21,076 $13,4432 Interest income 0 0 8,369 8,369 1,9913 Miscellaneous 0 0 0 0 04 TOTAL REVENUES 0 0 29,445 29,445 15,434
EXPENDITURES:5 Street & Drainage 0 0 528,000 (528,000) 06 TOTAL EXPENDITURES 0 0 528,000 (528,000) 0
7 REVENUES OVER (UNDER) EXPENDITURES 0 0 (498,555) (498,555) 15,434
OTHER FINANCING SOURCES (USES):8 Bond Proceeds 0 0 0 0 09 Transfers In 0 0 0 0 0
10 Transfers Out 0 0 0 0 0
REVENUES AND OTHER FINANCING SOURCES OVER (UNDER)11 EXPENDITURES AND OTHER FINANCING USES 0 0 (498,555) (498,555) 15,434
12 BEGINNING FUND BALANCE 0 0 700,453 700,453 562,882
13 ENDING FUND BALANCE $0 $0 $201,898 $201,898 $578,316
This Monthly Financial Report was distributed to the Little RockBoard of Directors on September 08, 2017. 20
City of Little Rock, ArkansasMonthly Financial ReportTIF - Port Authority Fund
For the Period Ended May 31, 2017(Unaudited)
YTD Variance YTD Revenues and Favorable May 31, 2016
Budget Budget Expenditures (Unfavorable) UnauditedREVENUES:
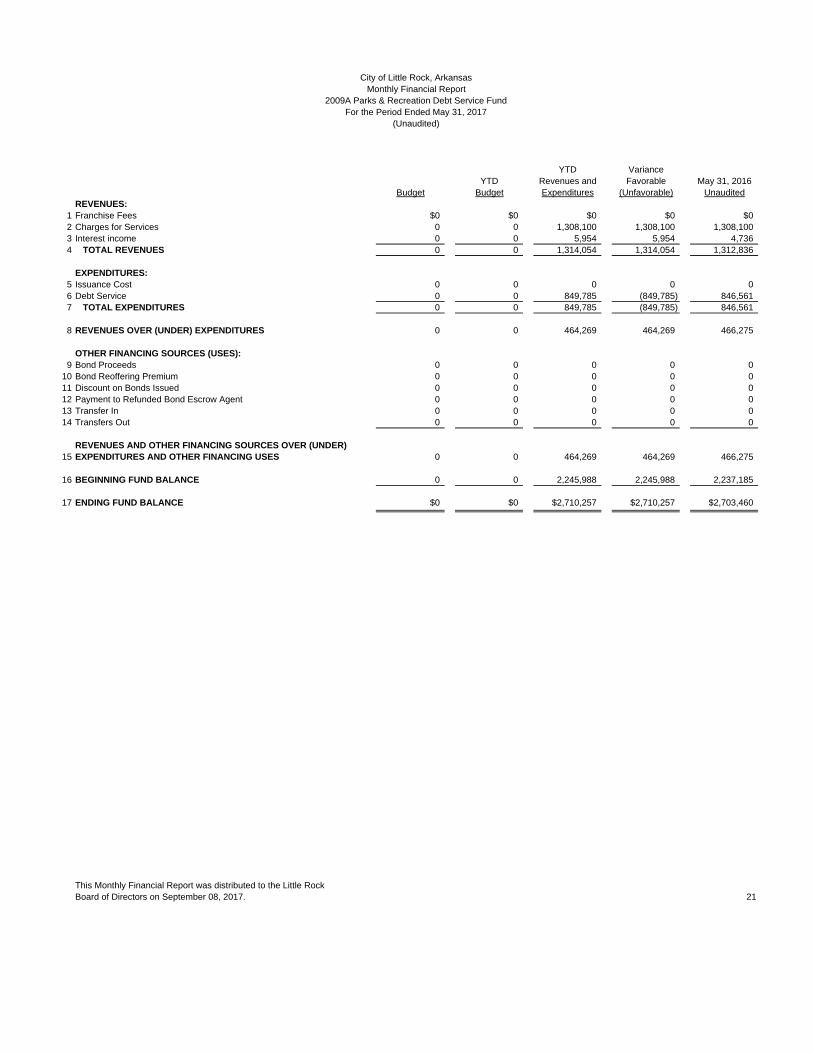
1 Franchise Fees $0 $0 $0 $0 $02 Charges for Services 0 0 1,308,100 1,308,100 1,308,1003 Interest income 0 0 5,954 5,954 4,7364 TOTAL REVENUES 0 0 1,314,054 1,314,054 1,312,836
EXPENDITURES:5 Issuance Cost 0 0 0 0 06 Debt Service 0 0 849,785 (849,785) 846,5617 TOTAL EXPENDITURES 0 0 849,785 (849,785) 846,561
8 REVENUES OVER (UNDER) EXPENDITURES 0 0 464,269 464,269 466,275
OTHER FINANCING SOURCES (USES):9 Bond Proceeds 0 0 0 0 0
10 Bond Reoffering Premium 0 0 0 0 011 Discount on Bonds Issued 0 0 0 0 012 Payment to Refunded Bond Escrow Agent 0 0 0 0 013 Transfer In 0 0 0 0 014 Transfers Out 0 0 0 0 0
REVENUES AND OTHER FINANCING SOURCES OVER (UNDER)15 EXPENDITURES AND OTHER FINANCING USES 0 0 464,269 464,269 466,275
16 BEGINNING FUND BALANCE 0 0 2,245,988 2,245,988 2,237,185
17 ENDING FUND BALANCE $0 $0 $2,710,257 $2,710,257 $2,703,460
This Monthly Financial Report was distributed to the Little RockBoard of Directors on September 08, 2017. 21
(Unaudited)
City of Little Rock, ArkansasMonthly Financial Report
2009A Parks & Recreation Debt Service FundFor the Period Ended May 31, 2017
YTD Variance YTD Revenues and Favorable May 31, 2016
Budget Budget Expenditures (Unfavorable) UnauditedREVENUES:
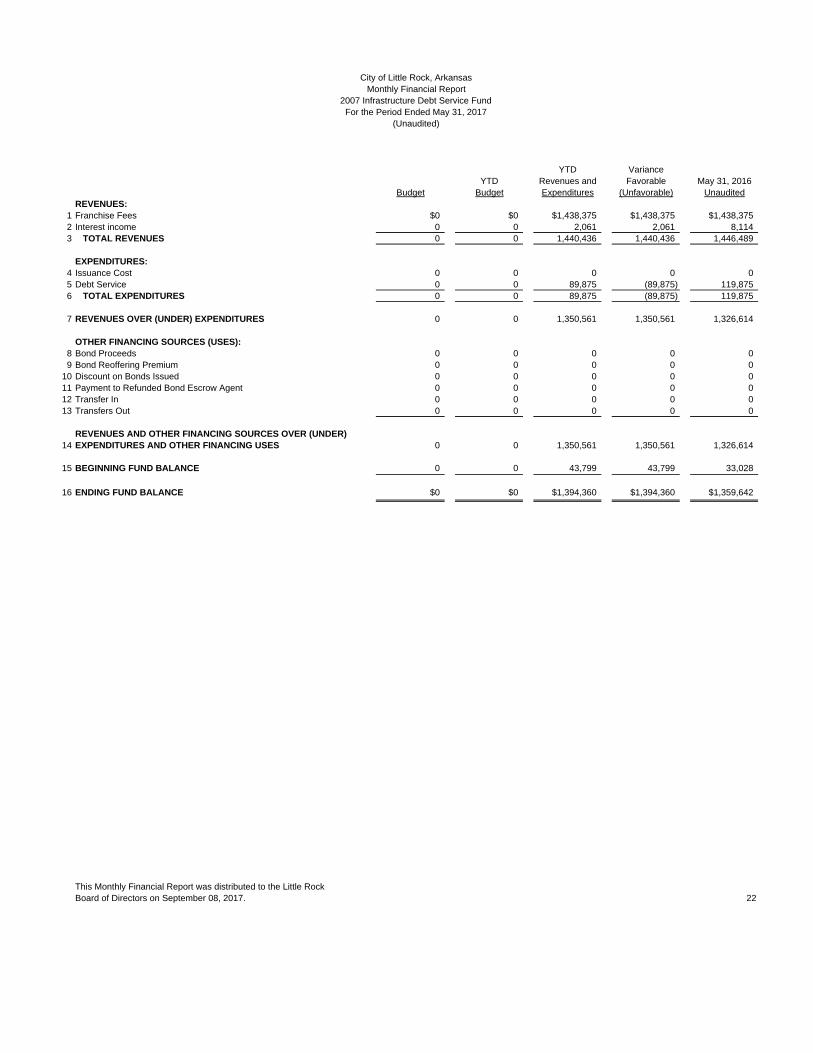
1 Franchise Fees $0 $0 $1,438,375 $1,438,375 $1,438,3752 Interest income 0 0 2,061 2,061 8,1143 TOTAL REVENUES 0 0 1,440,436 1,440,436 1,446,489
EXPENDITURES:4 Issuance Cost 0 0 0 0 05 Debt Service 0 0 89,875 (89,875) 119,8756 TOTAL EXPENDITURES 0 0 89,875 (89,875) 119,875
7 REVENUES OVER (UNDER) EXPENDITURES 0 0 1,350,561 1,350,561 1,326,614
OTHER FINANCING SOURCES (USES):8 Bond Proceeds 0 0 0 0 09 Bond Reoffering Premium 0 0 0 0 0
10 Discount on Bonds Issued 0 0 0 0 011 Payment to Refunded Bond Escrow Agent 0 0 0 0 012 Transfer In 0 0 0 0 013 Transfers Out 0 0 0 0 0
REVENUES AND OTHER FINANCING SOURCES OVER (UNDER)14 EXPENDITURES AND OTHER FINANCING USES 0 0 1,350,561 1,350,561 1,326,614
15 BEGINNING FUND BALANCE 0 0 43,799 43,799 33,028
16 ENDING FUND BALANCE $0 $0 $1,394,360 $1,394,360 $1,359,642
This Monthly Financial Report was distributed to the Little RockBoard of Directors on September 08, 2017. 22
(Unaudited)
City of Little Rock, ArkansasMonthly Financial Report
2007 Infrastructure Debt Service FundFor the Period Ended May 31, 2017

YTD Variance YTD Revenues and Favorable May 31, 2016
Budget Budget Expenditures (Unfavorable) UnauditedREVENUES:
1 Franchise Fees $0 $0 $322,838 $322,838 $320,2982 Interest income 0 0 535 535 1,8933 TOTAL REVENUES 0 0 323,373 323,373 322,191
EXPENDITURES:4 Debt Service 0 0 14,606 (14,606) 20,8365 TOTAL EXPENDITURES 0 0 14,606 (14,606) 20,836
6 REVENUES OVER (UNDER) EXPENDITURES 0 0 308,767 308,767 301,354
OTHER FINANCING SOURCES (USES):7 Transfer In 0 0 0 0 08 Transfers Out 0 0 0 0 0
REVENUES AND OTHER FINANCING SOURCES OVER (UNDER)9 EXPENDITURES AND OTHER FINANCING USES 0 0 308,767 308,767 301,354
10 BEGINNING FUND BALANCE 0 0 19,535 19,535 18,496
11 ENDING FUND BALANCE $0 $0 $328,302 $328,302 $319,851
This Monthly Financial Report was distributed to the Little RockBoard of Directors on September 08, 2017. 23
(Unaudited)
City of Little Rock, ArkansasMonthly Financial Report
2002 CIP Junior Lien Bonds Debt Service FundFor the Period Ended May 31, 2017

YTD Variance YTD Revenues and Favorable May 31, 2016
Budget Budget Expenditures (Unfavorable) UnauditedREVENUES:
1 Property Tax $0 $0 $0 $0 $02 Interest Income 0 0 0 0 3313 TOTAL REVENUES 0 0 0 0 331
EXPENDITURES:4 Debt Service 0 0 0 0 05 TOTAL EXPENDITURES 0 0 0 0 0
6 REVENUES OVER (UNDER) EXPENDITURES 0 0 0 0 331
OTHER FINANCING SOURCES (USES):7 Bond Proceeds 0 0 0 0 08 Payment to Refunded Bond Escrow Agent 0 0 0 0 09 Transfers In 0 0 0 0 0
10 Transfers Out 0 0 0 0 0
REVENUES AND OTHER FINANCING SOURCES OVER (UNDER)11 EXPENDITURES AND OTHER FINANCING USES 0 0 0 0 331
12 BEGINNING FUND BALANCE 0 0 0 0 100,316
13 ENDING FUND BALANCE $0 $0 $0 $0 $100,646
This Monthly Financial Report was distributed to the Little RockBoard of Directors on September 08, 2017. 24
(Unaudited)
City of Little Rock, ArkansasMonthly Financial Report
2008 & 2009 Library Improvement Bonds Debt Service FundFor the Period Ended May 31, 2017
YTD Variance YTD Revenues and Favorable May 31, 2016
Budget Budget Expenditures (Unfavorable) UnauditedREVENUES:
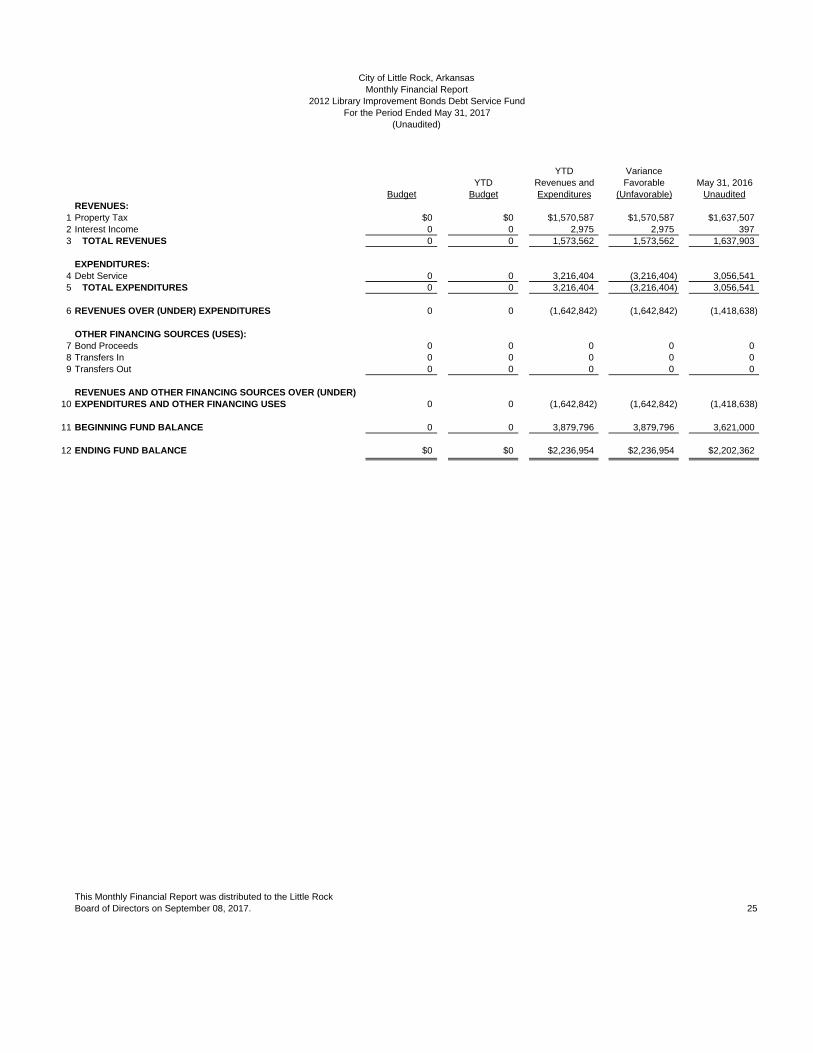
1 Property Tax $0 $0 $1,570,587 $1,570,587 $1,637,5072 Interest Income 0 0 2,975 2,975 3973 TOTAL REVENUES 0 0 1,573,562 1,573,562 1,637,903
EXPENDITURES:4 Debt Service 0 0 3,216,404 (3,216,404) 3,056,5415 TOTAL EXPENDITURES 0 0 3,216,404 (3,216,404) 3,056,541
6 REVENUES OVER (UNDER) EXPENDITURES 0 0 (1,642,842) (1,642,842) (1,418,638)
OTHER FINANCING SOURCES (USES):7 Bond Proceeds 0 0 0 0 08 Transfers In 0 0 0 0 09 Transfers Out 0 0 0 0 0
REVENUES AND OTHER FINANCING SOURCES OVER (UNDER)10 EXPENDITURES AND OTHER FINANCING USES 0 0 (1,642,842) (1,642,842) (1,418,638)
11 BEGINNING FUND BALANCE 0 0 3,879,796 3,879,796 3,621,000
12 ENDING FUND BALANCE $0 $0 $2,236,954 $2,236,954 $2,202,362
This Monthly Financial Report was distributed to the Little RockBoard of Directors on September 08, 2017. 25
(Unaudited)
City of Little Rock, ArkansasMonthly Financial Report
2012 Library Improvement Bonds Debt Service FundFor the Period Ended May 31, 2017

YTD Variance YTD Revenues and Favorable May 31, 2016
Budget Budget Expenditures (Unfavorable) UnauditedREVENUES:
1 Property Tax $0 $0 $1,570,587 $1,570,587 $1,622,0402 Interest Income 0 0 1,908 1,908 203 TOTAL REVENUES 0 0 1,572,495 1,572,495 1,622,060
EXPENDITURES:4 Debt Service 0 0 2,462,306 (2,462,306) 303,0215 TOTAL EXPENDITURES 0 0 2,462,306 (2,462,306) 303,021
6 REVENUES OVER (UNDER) EXPENDITURES 0 0 (889,811) (889,811) 1,319,039
OTHER FINANCING SOURCES (USES):7 Bond Proceeds 0 0 0 0 08 Transfers In 0 0 0 0 09 Transfers Out 0 0 0 0 0
REVENUES AND OTHER FINANCING SOURCES OVER (UNDER)10 EXPENDITURES AND OTHER FINANCING USES 0 0 (889,811) (889,811) 1,319,039
11 BEGINNING FUND BALANCE 0 0 3,057,407 3,057,407 136,121
12 ENDING FUND BALANCE $0 $0 $2,167,596 $2,167,596 $1,455,160
This Monthly Financial Report was distributed to the Little RockBoard of Directors on September 08, 2017. 26
City of Little Rock, ArkansasMonthly Financial Report
2015 Library Improvement Bonds Debt Service FundFor the Period Ended May 31, 2017
(Unaudited)

YTD Variance YTD Revenues and Favorable May 31, 2016
Budget Budget Expenditures (Unfavorable) UnauditedREVENUES:
1 Property Tax $0 $0 $5,232,225 $5,232,225 $5,388,7602 Interest Income 0 0 19,433 19,433 6,8593 Miscellaneous 0 0 0 0 04 TOTAL REVENUES 0 0 5,251,658 5,251,658 5,395,619
EXPENDITURES:5 Debt Service 0 0 11,225,319 (11,225,319) 10,652,8246 TOTAL EXPENDITURES 0 0 11,225,319 (11,225,319) 10,652,824
7 REVENUES OVER (UNDER) EXPENDITURES 0 0 (5,973,661) (5,973,661) (5,257,205)
OTHER FINANCING SOURCES (USES):8 Bond Proceeds 0 0 0 0 09 Transfers In 0 0 0 0 0
10 Transfers Out 0 0 0 0 0
REVENUES AND OTHER FINANCING SOURCES OVER (UNDER)11 EXPENDITURES AND OTHER FINANCING USES 0 0 (5,973,661) (5,973,661) (5,257,205)
12 BEGINNING FUND BALANCE 0 0 12,363,961 12,363,961 11,295,331
13 ENDING FUND BALANCE $0 $0 $6,390,300 $6,390,300 $6,038,126
This Monthly Financial Report was distributed to the Little RockBoard of Directors on September 08, 2017. 27
City of Little Rock, ArkansasMonthly Financial Report
2013 Capital Improvement Bonds Debt Service FundFor the Period Ended May 31, 2017
(Unaudited)
YTD Variance YTD Revenues and Favorable May 31, 2016
Budget Budget Expenditures (Unfavorable) UnauditedREVENUES:
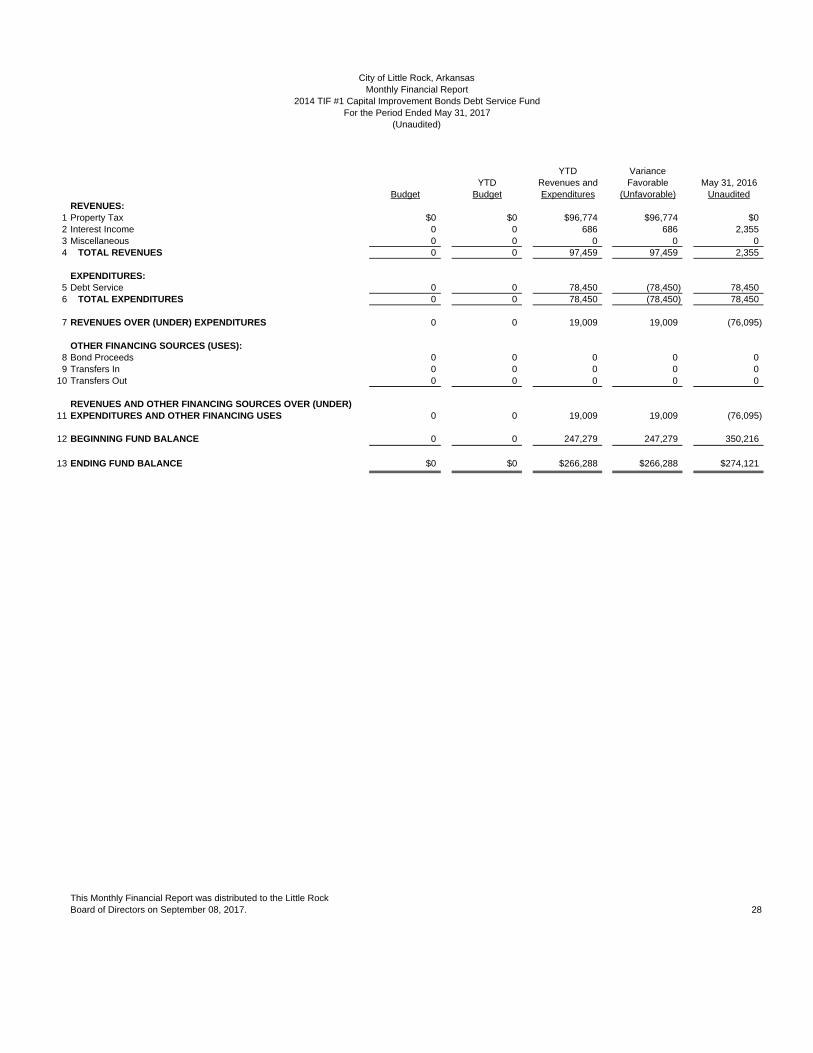
1 Property Tax $0 $0 $96,774 $96,774 $02 Interest Income 0 0 686 686 2,3553 Miscellaneous 0 0 0 0 04 TOTAL REVENUES 0 0 97,459 97,459 2,355
EXPENDITURES:5 Debt Service 0 0 78,450 (78,450) 78,4506 TOTAL EXPENDITURES 0 0 78,450 (78,450) 78,450
7 REVENUES OVER (UNDER) EXPENDITURES 0 0 19,009 19,009 (76,095)
OTHER FINANCING SOURCES (USES):8 Bond Proceeds 0 0 0 0 09 Transfers In 0 0 0 0 0
10 Transfers Out 0 0 0 0 0
REVENUES AND OTHER FINANCING SOURCES OVER (UNDER)11 EXPENDITURES AND OTHER FINANCING USES 0 0 19,009 19,009 (76,095)
12 BEGINNING FUND BALANCE 0 0 247,279 247,279 350,216
13 ENDING FUND BALANCE $0 $0 $266,288 $266,288 $274,121
This Monthly Financial Report was distributed to the Little RockBoard of Directors on September 08, 2017. 28
City of Little Rock, ArkansasMonthly Financial Report
2014 TIF #1 Capital Improvement Bonds Debt Service FundFor the Period Ended May 31, 2017
(Unaudited)

YTD Variance YTD Revenues and Favorable May 31, 2016
Budget Budget Expenditures (Unfavorable) UnauditedOPERATING REVENUES:
1 Charges for services $12,241,727 $5,100,720 $4,908,241 ($192,479) $4,646,5922 Interest Income 0 0 0 0 03 TOTAL OPERATING REVENUES 12,241,727 5,100,720 4,908,241 (192,479) 4,646,592
OPERATING EXPENSES:4 Personnel Services 3,707,793 1,544,914 1,403,244 141,670 1,459,8445 Supplies and materials 5,227,640 2,178,183 1,730,020 448,163 1,707,2436 Services and other expenses 2,529,201 1,053,834 934,197 119,637 798,0747 Repairs and maintenance 529,965 220,819 33,351 187,468 70,9268 Capital outlay 0 0 0 0 09 Depreciation and amortization 237,953 99,147 117,538 (18,391) 77,454
10 TOTAL OPERATING EXPENSES 12,232,552 5,096,897 4,218,350 878,546 4,113,54111 OPERATING INCOME/(LOSS) 9,175 3,823 689,890 686,068 533,051
NONOPERATING REVENUES/(EXPENSES):12 Investment income 0 0 20,707 20,707 6,31113 Grants received 0 0 0 0 014 Interest expense 0 0 0 0 015 Gain (loss) on disposal of fixed assets 0 0 0 0 016 Other, net 0 0 0 0 017 INCOME (LOSS) BEFORE OPERATING TRANSFERS 9,175 3,823 710,597 706,774 539,362
OPERATING TRANSFERS:18 Operating transfers in 0 0 0 0 019 Operating transfers out 0 0 0 0 020 NET INCOME/(LOSS) 9,175 3,823 710,597 706,774 539,362
21 BEGINNING NET POSITION 5,330,363 5,330,363 5,330,363 0 4,255,387
22 ENDING NET POSITION $5,339,538 $5,334,186 $6,040,960 $706,774 $4,794,749
Cash Operating $2,496,360 Debt Reserve - Receivable 18,589 Inventory 431,361 Capital Assets, net 3,438,238 Other Assets 463,669 Liabilities (807,256)
Net Position $6,040,960
This Monthly Financial Report was distributed to the Little RockBoard of Directors on September 08, 2017. 29
Analysis of Net Position
(Unaudited)
City of Little Rock, ArkansasMonthly Financial Report
Fleet Services FundFor the Period Ended May 31, 2017

YTD VarianceYTD Revenues and Favorable May 31, 2016
Budget Budget Expenditures (Unfavorable) UnauditedOPERATING REVENUES:
1 Licenses and permits $22,300 $9,292 $18,260 $8,968 $02 Charges for services 1,353,710 564,046 592,685 28,639 612,7153 Other 0 0 0 0 04 TOTAL OPERATING REVENUES 1,376,010 573,338 610,945 37,607 612,715
OPERATING EXPENSES:5 Personnel Services 712,530 296,888 292,550 4,338 292,1536 Supplies and materials 39,270 16,363 15,062 1,301 16,1797 Services and other expenses 570,850 237,854 209,202 28,652 235,1698 Repairs and maintenance 21,460 8,942 6,731 2,211 13,2299 Capital outlay 0 0 0 0 0
10 Depreciation and amortization 31,900 13,292 11,216 2,076 11,00911 TOTAL OPERATING EXPENSES 1,376,010 573,338 534,760 38,578 567,73912 OPERATING INCOME/(LOSS) 0 0 76,185 76,185 44,975
NONOPERATING REVENUES/(EXPENSES):13 Investment income 0 0 92 92 014 Grants received 0 0 0 0 015 Interest expense 0 0 0 0 016 Gain (loss) on disposal of fixed assets 0 0 0 0 017 Other, net 0 0 0 0 018 INCOME (LOSS) BEFORE OPERATING TRANSFERS 0 0 76,277 76,277 44,975
OPERATING TRANSFERS:19 Operating transfers in 0 0 0 0 020 Operating transfers out 0 0 0 0 021 NET INCOME/(LOSS) 0 0 76,277 76,277 44,975
22 BEGINNING NET POSITION (906,881) (906,881) (906,881) 0 (786,455)
23 ENDING NET POSITION ($906,881) ($906,881) ($830,604) $76,277 ($741,479)
Cash Operating ($765,919) Debt Reserve 0Receivable 0Inventory 0Capital Assets, net 113,836Other Assets 42,052Liabilities (220,574)
Net Position ($830,604)
This Monthly Financial Report was distributed to the Little RockBoard of Directors on September 08, 2017. 30
Analysis of Net Position
(Unaudited)
City of Little Rock, ArkansasMonthly Financial Report
Vehicle Storage Facility FundFor the Period Ended May 31, 2017
YTD Variance
YTD Revenues and Favorable May 31, 2016Budget Budget Expenditures (Unfavorable) Unaudited
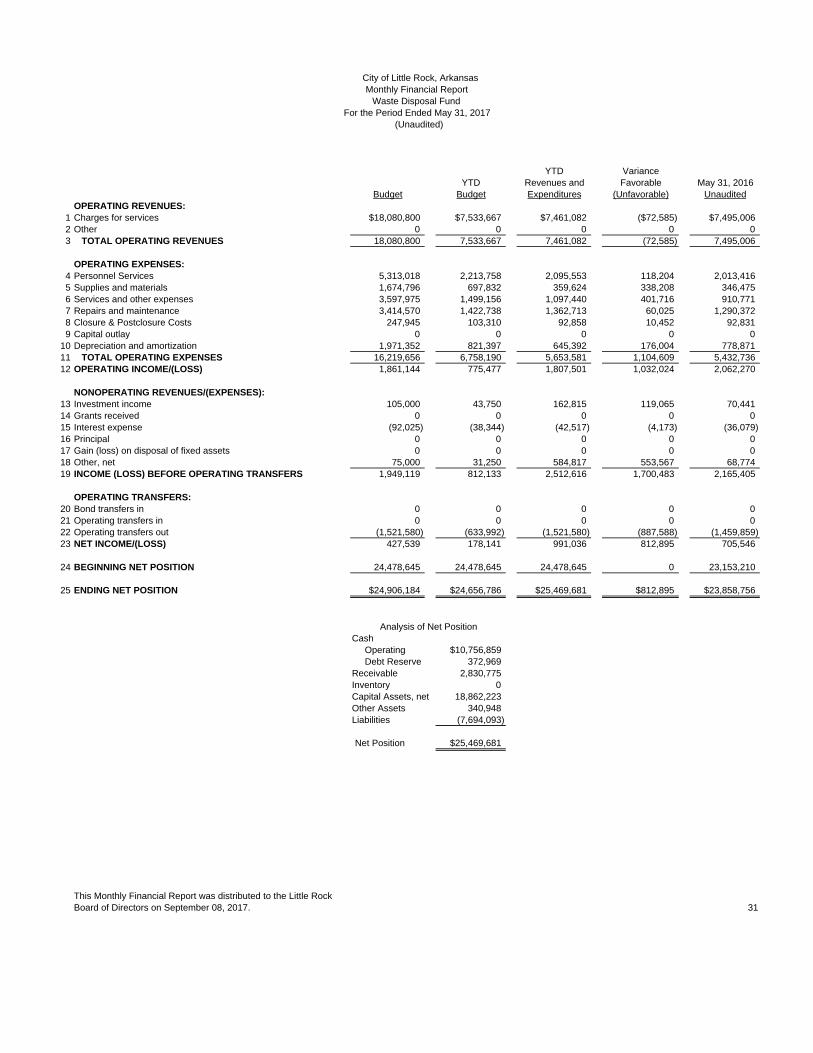
OPERATING REVENUES:1 Charges for services $18,080,800 $7,533,667 $7,461,082 ($72,585) $7,495,0062 Other 0 0 0 0 03 TOTAL OPERATING REVENUES 18,080,800 7,533,667 7,461,082 (72,585) 7,495,006
OPERATING EXPENSES:4 Personnel Services 5,313,018 2,213,758 2,095,553 118,204 2,013,4165 Supplies and materials 1,674,796 697,832 359,624 338,208 346,4756 Services and other expenses 3,597,975 1,499,156 1,097,440 401,716 910,7717 Repairs and maintenance 3,414,570 1,422,738 1,362,713 60,025 1,290,3728 Closure & Postclosure Costs 247,945 103,310 92,858 10,452 92,8319 Capital outlay 0 0 0 0 0
10 Depreciation and amortization 1,971,352 821,397 645,392 176,004 778,87111 TOTAL OPERATING EXPENSES 16,219,656 6,758,190 5,653,581 1,104,609 5,432,73612 OPERATING INCOME/(LOSS) 1,861,144 775,477 1,807,501 1,032,024 2,062,270
NONOPERATING REVENUES/(EXPENSES):13 Investment income 105,000 43,750 162,815 119,065 70,44114 Grants received 0 0 0 0 015 Interest expense (92,025) (38,344) (42,517) (4,173) (36,079)16 Principal 0 0 0 0 017 Gain (loss) on disposal of fixed assets 0 0 0 0 018 Other, net 75,000 31,250 584,817 553,567 68,77419 INCOME (LOSS) BEFORE OPERATING TRANSFERS 1,949,119 812,133 2,512,616 1,700,483 2,165,405
OPERATING TRANSFERS:
20 Bond transfers in 0 0 0 0 021 Operating transfers in 0 0 0 0 022 Operating transfers out (1,521,580) (633,992) (1,521,580) (887,588) (1,459,859)23 NET INCOME/(LOSS) 427,539 178,141 991,036 812,895 705,546
24 BEGINNING NET POSITION 24,478,645 24,478,645 24,478,645 0 23,153,210
25 ENDING NET POSITION $24,906,184 $24,656,786 $25,469,681 $812,895 $23,858,756
Cash Operating $10,756,859 Debt Reserve 372,969Receivable 2,830,775Inventory 0Capital Assets, net 18,862,223Other Assets 340,948Liabilities (7,694,093)
Net Position $25,469,681
This Monthly Financial Report was distributed to the Little RockBoard of Directors on September 08, 2017. 31
Analysis of Net Position
(Unaudited)
City of Little Rock, ArkansasMonthly Financial Report
Waste Disposal FundFor the Period Ended May 31, 2017
YTD VarianceYTD Revenues and Favorable May 31, 2016
Budget Budget Expenditures (Unfavorable) UnauditedOPERATING REVENUES:
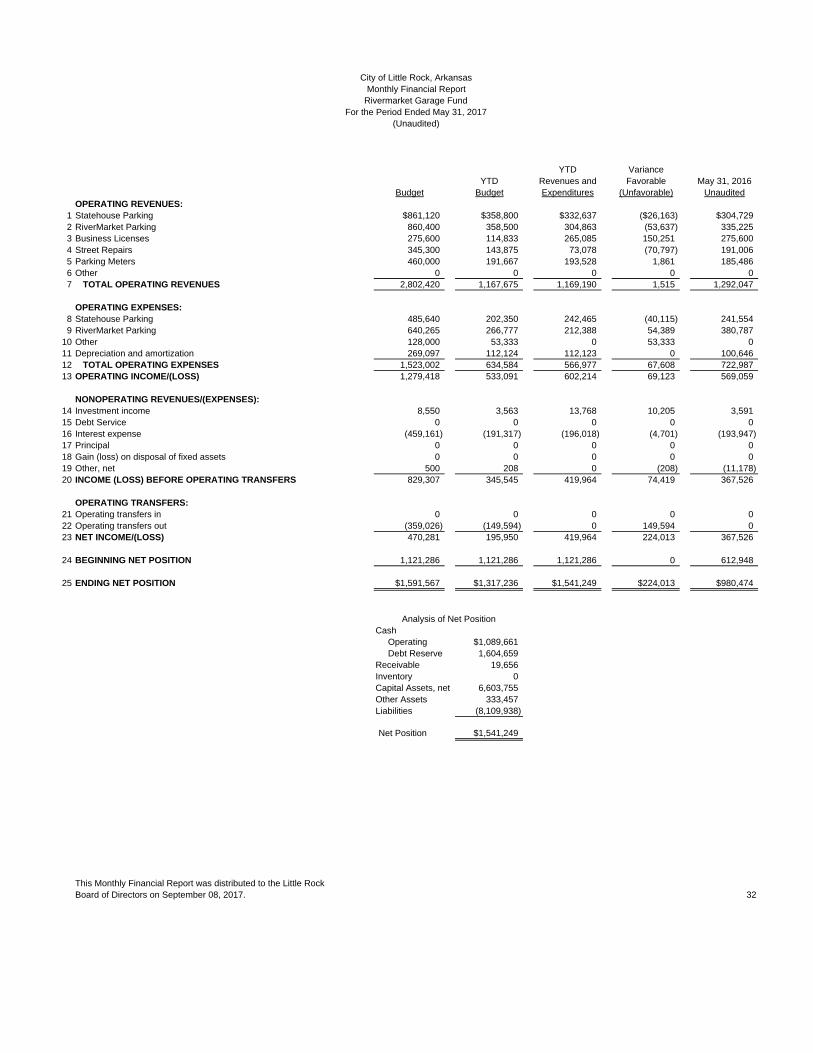
1 Statehouse Parking $861,120 $358,800 $332,637 ($26,163) $304,7292 RiverMarket Parking 860,400 358,500 304,863 (53,637) 335,2253 Business Licenses 275,600 114,833 265,085 150,251 275,6004 Street Repairs 345,300 143,875 73,078 (70,797) 191,0065 Parking Meters 460,000 191,667 193,528 1,861 185,4866 Other 0 0 0 0 07 TOTAL OPERATING REVENUES 2,802,420 1,167,675 1,169,190 1,515 1,292,047
OPERATING EXPENSES:8 Statehouse Parking 485,640 202,350 242,465 (40,115) 241,5549 RiverMarket Parking 640,265 266,777 212,388 54,389 380,787
10 Other 128,000 53,333 0 53,333 011 Depreciation and amortization 269,097 112,124 112,123 0 100,64612 TOTAL OPERATING EXPENSES 1,523,002 634,584 566,977 67,608 722,98713 OPERATING INCOME/(LOSS) 1,279,418 533,091 602,214 69,123 569,059
NONOPERATING REVENUES/(EXPENSES):14 Investment income 8,550 3,563 13,768 10,205 3,59115 Debt Service 0 0 0 0 016 Interest expense (459,161) (191,317) (196,018) (4,701) (193,947)17 Principal 0 0 0 0 018 Gain (loss) on disposal of fixed assets 0 0 0 0 019 Other, net 500 208 0 (208) (11,178)20 INCOME (LOSS) BEFORE OPERATING TRANSFERS 829,307 345,545 419,964 74,419 367,526
OPERATING TRANSFERS:21 Operating transfers in 0 0 0 0 022 Operating transfers out (359,026) (149,594) 0 149,594 023 NET INCOME/(LOSS) 470,281 195,950 419,964 224,013 367,526
24 BEGINNING NET POSITION 1,121,286 1,121,286 1,121,286 0 612,948
25 ENDING NET POSITION $1,591,567 $1,317,236 $1,541,249 $224,013 $980,474
Cash Operating $1,089,661 Debt Reserve 1,604,659Receivable 19,656Inventory 0Capital Assets, net 6,603,755Other Assets 333,457Liabilities (8,109,938)
Net Position $1,541,249
This Monthly Financial Report was distributed to the Little RockBoard of Directors on September 08, 2017. 32
Analysis of Net Position
(Unaudited)
City of Little Rock, ArkansasMonthly Financial Report
Rivermarket Garage FundFor the Period Ended May 31, 2017

YTD VarianceYTD Revenues and Favorable May 31, 2016
Budget Budget Expenditures (Unfavorable) UnauditedADDITIONS:
Contributions:1 Employer $0 $0 $0 $0 $02 Plan members 0 0 0 0 03 General property taxes 0 0 0 0 04 State insurance turnback and guarantee fund 0 0 0 0 05 Other 0 0 0 0 06 Total Contributions 0 0 0 0 0
Investment income (loss):7 Net increase (decrease) in fair value of investments 0 0 0 0 08 Interest and dividends 0 0 0 0 09 0 0 0 0 0
10 Less investment expense 0 0 0 0 011 Net investment income (loss) 0 0 0 0 012 TOTAL ADDITIONS 0 0 0 0 0
DEDUCTIONS:13 Benefits paid directly to participants 0 0 0 0 014 Administrative expenses 0 0 0 0 015 Other Deductions 0 0 0 0 016 TOTAL DEDUCTIONS 0 0 0 0 017 NET INCREASE (DECREASE) 0 0 0 0 0
18 NET POSITION HELD IN TRUST FOR PENSION BENEFITS, BEGINNING 0 0 1,744,382 1,744,382 2,205,615
19 NET POSITION HELD IN TRUST FOR PENSION BENEFITS, ENDING $0 $0 $1,744,382 $1,744,382 $2,205,615
Note 1: Administration of the Police Pension and Relief Fund was transferred to LOPFI in December 2013.
This Monthly Financial Report was distributed to the Little RockBoard of Directors on September 08, 2017. 33
(Unaudited)
City of Little Rock, ArkansasMonthly Financial Report
Police Pension and Relief FundFor the Period Ended May 31, 2017
YTD Variance
YTD Revenues and Favorable May 31, 2016Budget Budget Expenditures (Unfavorable) Unaudited
ADDITIONS:Contributions:
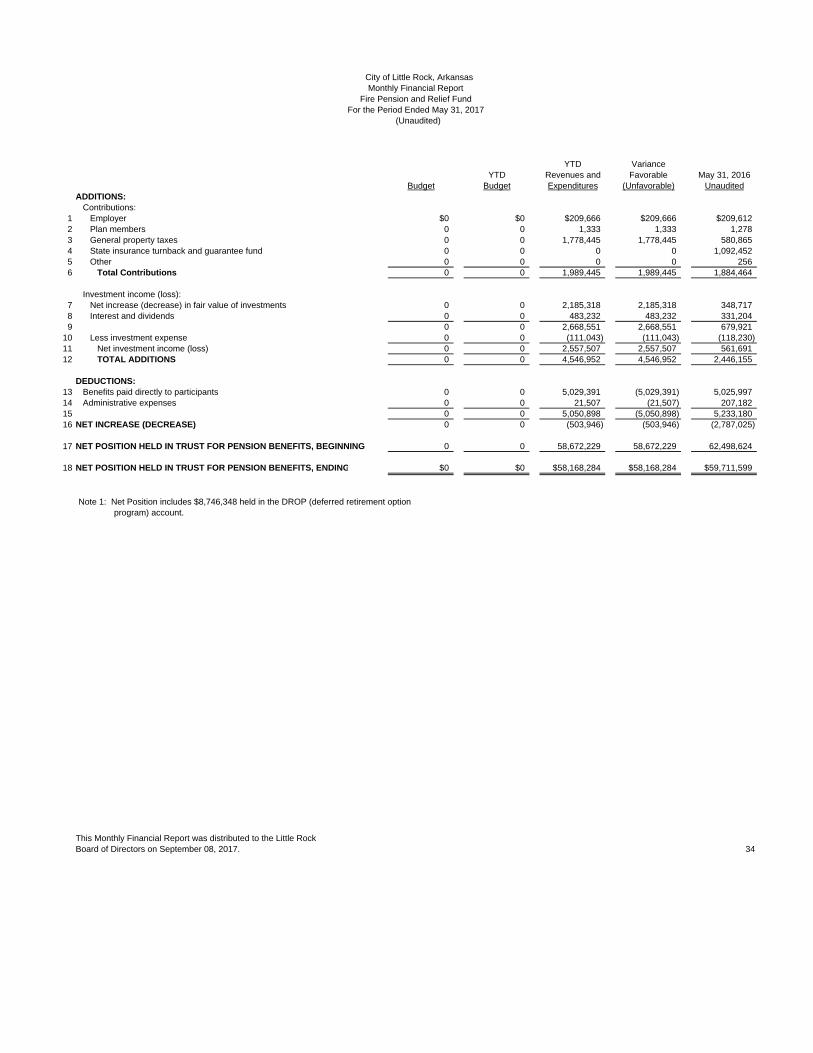
1 Employer $0 $0 $209,666 $209,666 $209,6122 Plan members 0 0 1,333 1,333 1,2783 General property taxes 0 0 1,778,445 1,778,445 580,8654 State insurance turnback and guarantee fund 0 0 0 0 1,092,4525 Other 0 0 0 0 2566 Total Contributions 0 0 1,989,445 1,989,445 1,884,464
Investment income (loss):7 Net increase (decrease) in fair value of investments 0 0 2,185,318 2,185,318 348,7178 Interest and dividends 0 0 483,232 483,232 331,2049 0 0 2,668,551 2,668,551 679,921
10 Less investment expense 0 0 (111,043) (111,043) (118,230)11 Net investment income (loss) 0 0 2,557,507 2,557,507 561,69112 TOTAL ADDITIONS 0 0 4,546,952 4,546,952 2,446,155
DEDUCTIONS:13 Benefits paid directly to participants 0 0 5,029,391 (5,029,391) 5,025,99714 Administrative expenses 0 0 21,507 (21,507) 207,18215 0 0 5,050,898 (5,050,898) 5,233,18016 NET INCREASE (DECREASE) 0 0 (503,946) (503,946) (2,787,025)
17 NET POSITION HELD IN TRUST FOR PENSION BENEFITS, BEGINNING 0 0 58,672,229 58,672,229 62,498,624
18 NET POSITION HELD IN TRUST FOR PENSION BENEFITS, ENDING $0 $0 $58,168,284 $58,168,284 $59,711,599
Note 1: Net Position includes $8,746,348 held in the DROP (deferred retirement option program) account.
This Monthly Financial Report was distributed to the Little RockBoard of Directors on September 08, 2017. 34
(Unaudited)
City of Little Rock, ArkansasMonthly Financial Report
Fire Pension and Relief FundFor the Period Ended May 31, 2017
YTD Variance
YTD Revenues and Favorable May 31, 2016Budget Budget Expenditures (Unfavorable) Unaudited
ADDITIONS:Contributions:
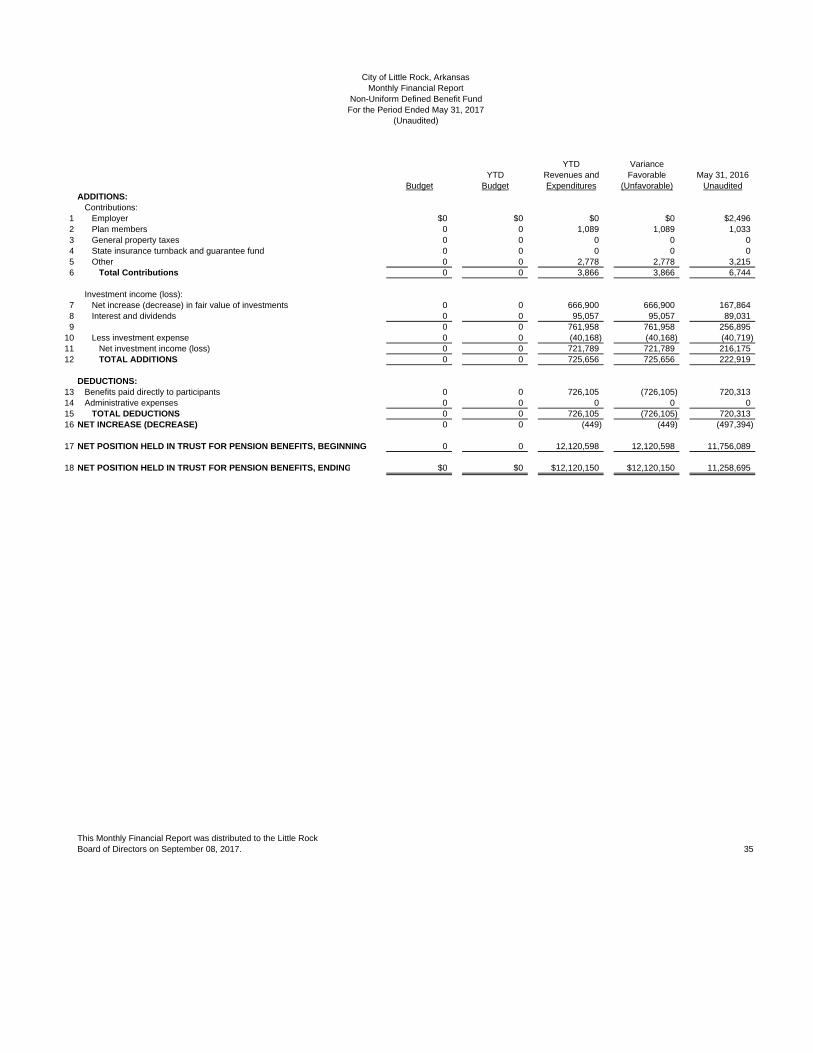
1 Employer $0 $0 $0 $0 $2,4962 Plan members 0 0 1,089 1,089 1,0333 General property taxes 0 0 0 0 04 State insurance turnback and guarantee fund 0 0 0 0 05 Other 0 0 2,778 2,778 3,2156 Total Contributions 0 0 3,866 3,866 6,744
Investment income (loss):7 Net increase (decrease) in fair value of investments 0 0 666,900 666,900 167,8648 Interest and dividends 0 0 95,057 95,057 89,0319 0 0 761,958 761,958 256,895
10 Less investment expense 0 0 (40,168) (40,168) (40,719)11 Net investment income (loss) 0 0 721,789 721,789 216,17512 TOTAL ADDITIONS 0 0 725,656 725,656 222,919
DEDUCTIONS:13 Benefits paid directly to participants 0 0 726,105 (726,105) 720,31314 Administrative expenses 0 0 0 0 015 TOTAL DEDUCTIONS 0 0 726,105 (726,105) 720,31316 NET INCREASE (DECREASE) 0 0 (449) (449) (497,394)
17 NET POSITION HELD IN TRUST FOR PENSION BENEFITS, BEGINNING 0 0 12,120,598 12,120,598 11,756,089
18 NET POSITION HELD IN TRUST FOR PENSION BENEFITS, ENDING $0 $0 $12,120,150 $12,120,150 11,258,695
This Monthly Financial Report was distributed to the Little RockBoard of Directors on September 08, 2017. 35
(Unaudited)For the Period Ended May 31, 2017
City of Little Rock, ArkansasMonthly Financial Report
Non-Uniform Defined Benefit Fund

YTD Variance
YTD Revenues and Favorable May 31, 2016Budget Budget Expenditures (Unfavorable) Unaudited
ADDITIONS:Contributions:
1 Employer $0 $0 $56,558 $56,558 $62,4992 Plan members 0 0 50,987 50,987 33,7243 General property taxes 0 0 0 0 04 State insurance turnback and guarantee fund 0 0 0 0 05 Other 0 0 3,327 3,327 3,5236 Total Contributions 0 0 110,872 110,872 99,747
Investment income (loss):7 Net increase (decrease) in fair value of investments 0 0 974,796 974,796 181,2688 Interest and dividends 0 0 115,664 115,664 105,5939 0 0 1,090,460 1,090,460 286,860
10 Less investment expense 0 0 (31,831) (31,831) (30,547)11 Net investment income (loss) 0 0 1,058,629 1,058,629 256,31312 TOTAL ADDITIONS 0 0 1,169,501 1,169,501 356,060
DEDUCTIONS:13 Benefits paid directly to participants 0 0 461,911 (461,911) 296,65714 Administrative expenses 0 0 0 0 015 TOTAL DEDUCTIONS 0 0 461,911 (461,911) 296,65716 NET INCREASE (DECREASE) 0 0 707,591 707,591 59,403
17 NET POSITION HELD IN TRUST FOR PENSION BENEFITS, BEGINNING 0 0 17,816,452 17,816,452 18,460,917
18 NET POSITION HELD IN TRUST FOR PENSION BENEFITS, ENDING $0 $0 $18,524,043 $18,524,043 $18,520,319
Note: The City implemented a new defined benefit plan for non-uniform employees in 2014. Employees were given the option topurchase prior service credit by rolling over assets from the Non-Uniform Defined Contribution Fund.
This Monthly Financial Report was distributed to the Little RockBoard of Directors on September 08, 2017. 36
City of Little Rock, Arkansas
(Unaudited)For the Period Ended May 31, 2017
Non-Uniform Defined Contribution FundMonthly Financial Report
YTD Variance
YTD Revenues and Favorable May 31, 2016Budget Budget Expenditures (Unfavorable) Unaudited
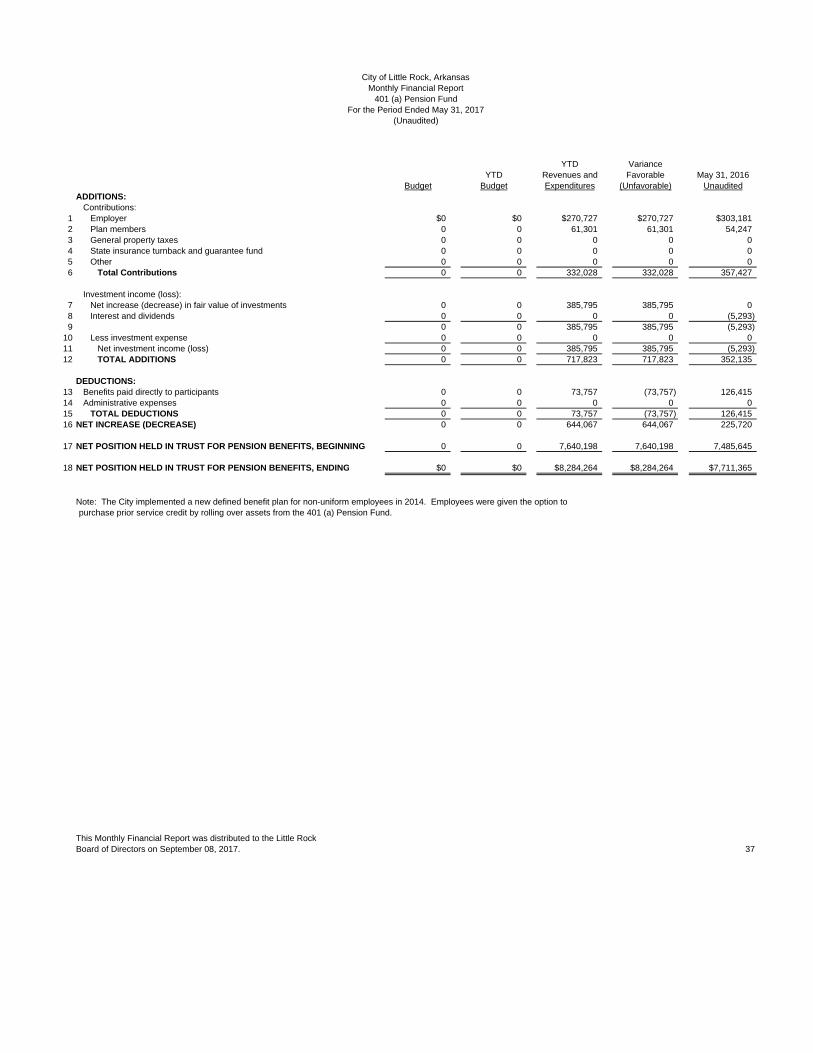
ADDITIONS:Contributions:
1 Employer $0 $0 $270,727 $270,727 $303,1812 Plan members 0 0 61,301 61,301 54,2473 General property taxes 0 0 0 0 04 State insurance turnback and guarantee fund 0 0 0 0 05 Other 0 0 0 0 06 Total Contributions 0 0 332,028 332,028 357,427
Investment income (loss):7 Net increase (decrease) in fair value of investments 0 0 385,795 385,795 08 Interest and dividends 0 0 0 0 (5,293)9 0 0 385,795 385,795 (5,293)
10 Less investment expense 0 0 0 0 011 Net investment income (loss) 0 0 385,795 385,795 (5,293)12 TOTAL ADDITIONS 0 0 717,823 717,823 352,135
DEDUCTIONS:13 Benefits paid directly to participants 0 0 73,757 (73,757) 126,41514 Administrative expenses 0 0 0 0 015 TOTAL DEDUCTIONS 0 0 73,757 (73,757) 126,41516 NET INCREASE (DECREASE) 0 0 644,067 644,067 225,720
17 NET POSITION HELD IN TRUST FOR PENSION BENEFITS, BEGINNING 0 0 7,640,198 7,640,198 7,485,645
18 NET POSITION HELD IN TRUST FOR PENSION BENEFITS, ENDING $0 $0 $8,284,264 $8,284,264 $7,711,365
Note: The City implemented a new defined benefit plan for non-uniform employees in 2014. Employees were given the option topurchase prior service credit by rolling over assets from the 401 (a) Pension Fund.
This Monthly Financial Report was distributed to the Little RockBoard of Directors on September 08, 2017. 37
(Unaudited)
City of Little Rock, ArkansasMonthly Financial Report
401 (a) Pension FundFor the Period Ended May 31, 2017

YTD Variance
YTD Revenues and Favorable May 31, 2016Budget Budget Expenditures (Unfavorable) Unaudited
ADDITIONS:Contributions:
1 Employer $0 $0 $0 $0 $02 Plan members 0 0 531,555 531,555 618,9033 General property taxes 0 0 0 0 04 State insurance turnback and guarantee fund 0 0 0 0 05 Other 0 0 0 0 06 Total Contributions 0 0 531,555 531,555 618,903
Investment income (loss):7 Net increase (decrease) in fair value of investments 0 0 95,534 95,534 68,6918 Interest and dividends 0 0 25,635 25,635 21,7479 0 0 121,169 121,169 90,437
10 Less investment expense 0 0 (18,229) (18,229) (15,442)11 Net investment income (loss) 0 0 102,940 102,940 74,99512 TOTAL ADDITIONS 0 0 634,495 634,495 693,898
DEDUCTIONS:13 Benefits paid directly to participants 0 0 0 0 014 Administrative expenses 0 0 0 0 015 TOTAL DEDUCTIONS 0 0 0 0 016 NET INCREASE (DECREASE) 0 0 634,495 634,495 693,898
17 NET POSITION HELD IN TRUST FOR PENSION BENEFITS, BEGINNING 0 0 3,575,345 3,575,345 2,780,728
18 NET POSITION HELD IN TRUST FOR PENSION BENEFITS, ENDING $0 $0 $4,209,840 $4,209,840 $3,474,626
This Monthly Financial Report was distributed to the Little RockBoard of Directors on September 08, 2017. 38
City of Little Rock, ArkansasMonthly Financial Report
Health Management Trust FundFor the Period Ended May 31, 2017
(Unaudited)
YTD Variance
YTD Revenues and Favorable May 31, 2016Budget Budget Expenditures (Unfavorable) Unaudited
ADDITIONS:Contributions:
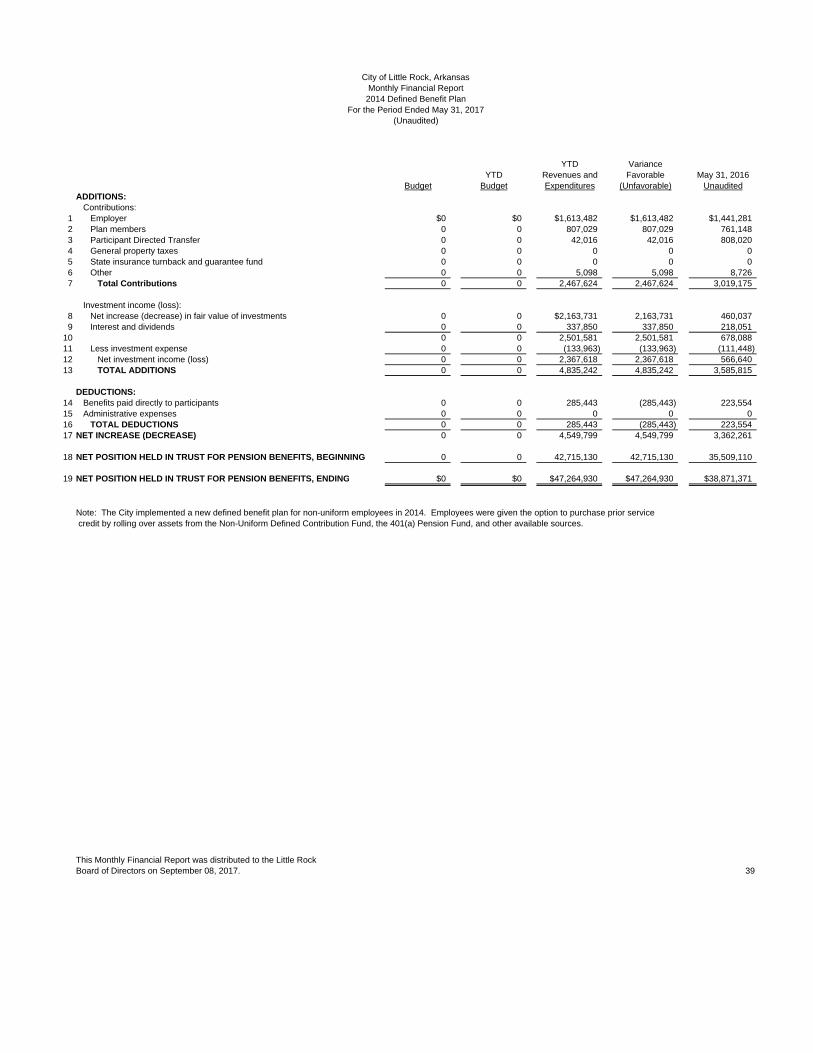
1 Employer $0 $0 $1,613,482 $1,613,482 $1,441,2812 Plan members 0 0 807,029 807,029 761,1483 Participant Directed Transfer 0 0 42,016 42,016 808,0204 General property taxes 0 0 0 0 05 State insurance turnback and guarantee fund 0 0 0 0 06 Other 0 0 5,098 5,098 8,7267 Total Contributions 0 0 2,467,624 2,467,624 3,019,175
Investment income (loss):8 Net increase (decrease) in fair value of investments 0 0 $2,163,731 2,163,731 460,0379 Interest and dividends 0 0 337,850 337,850 218,051
10 0 0 2,501,581 2,501,581 678,08811 Less investment expense 0 0 (133,963) (133,963) (111,448)12 Net investment income (loss) 0 0 2,367,618 2,367,618 566,64013 TOTAL ADDITIONS 0 0 4,835,242 4,835,242 3,585,815
DEDUCTIONS:14 Benefits paid directly to participants 0 0 285,443 (285,443) 223,55415 Administrative expenses 0 0 0 0 016 TOTAL DEDUCTIONS 0 0 285,443 (285,443) 223,55417 NET INCREASE (DECREASE) 0 0 4,549,799 4,549,799 3,362,261
18 NET POSITION HELD IN TRUST FOR PENSION BENEFITS, BEGINNING 0 0 42,715,130 42,715,130 35,509,110
19 NET POSITION HELD IN TRUST FOR PENSION BENEFITS, ENDING $0 $0 $47,264,930 $47,264,930 $38,871,371
Note: The City implemented a new defined benefit plan for non-uniform employees in 2014. Employees were given the option to purchase prior service credit by rolling over assets from the Non-Uniform Defined Contribution Fund, the 401(a) Pension Fund, and other available sources.
This Monthly Financial Report was distributed to the Little RockBoard of Directors on September 08, 2017. 39
City of Little Rock, ArkansasMonthly Financial Report2014 Defined Benefit Plan
For the Period Ended May 31, 2017(Unaudited)
City of Little Rock, ArkansasMonthly Financial Report
DefinitionsFor the Period Ended May 31, 2017
(Unaudited)
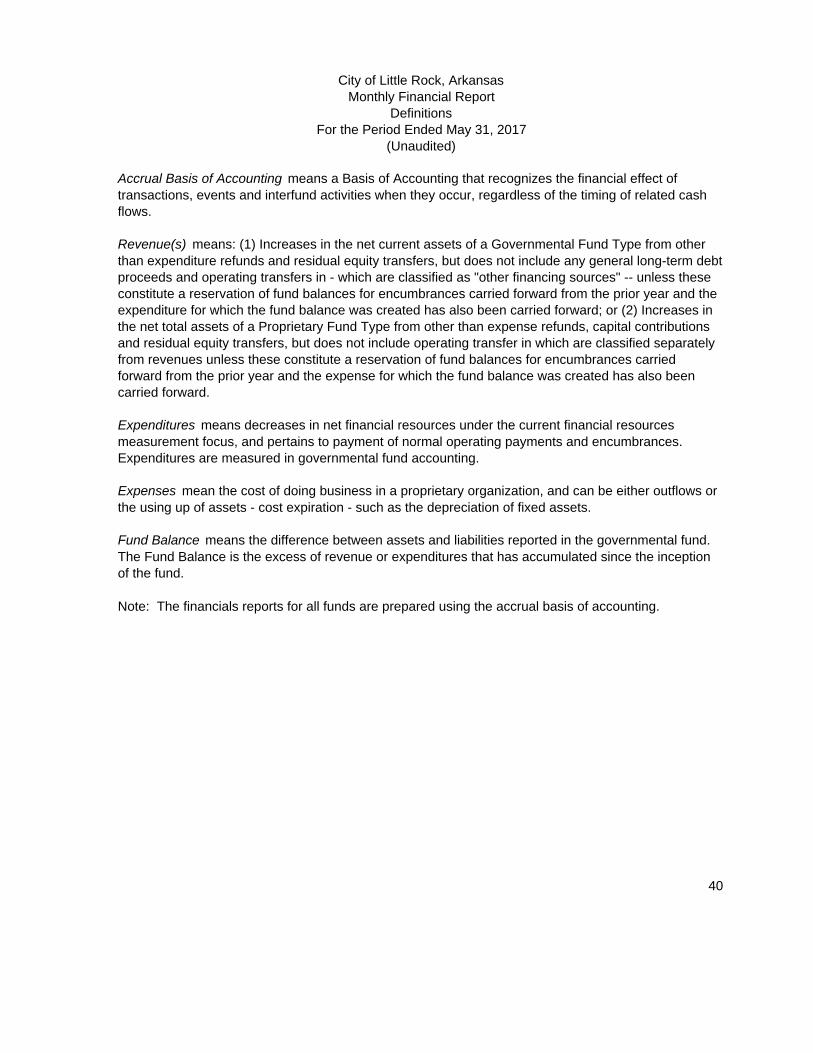
Accrual Basis of Accounting means a Basis of Accounting that recognizes the financial effect of transactions, events and interfund activities when they occur, regardless of the timing of related cash flows.
Revenue(s) means: (1) Increases in the net current assets of a Governmental Fund Type from other than expenditure refunds and residual equity transfers, but does not include any general long-term debt proceeds and operating transfers in - which are classified as "other financing sources" -- unless these constitute a reservation of fund balances for encumbrances carried forward from the prior year and the expenditure for which the fund balance was created has also been carried forward; or (2) Increases in the net total assets of a Proprietary Fund Type from other than expense refunds, capital contributions and residual equity transfers, but does not include operating transfer in which are classified separately from revenues unless these constitute a reservation of fund balances for encumbrances carried forward from the prior year and the expense for which the fund balance was created has also been carried forward.
Expenditures means decreases in net financial resources under the current financial resources measurement focus, and pertains to payment of normal operating payments and encumbrances. Expenditures are measured in governmental fund accounting.
Expenses mean the cost of doing business in a proprietary organization, and can be either outflows or the using up of assets - cost expiration - such as the depreciation of fixed assets.
Fund Balance means the difference between assets and liabilities reported in the governmental fund. The Fund Balance is the excess of revenue or expenditures that has accumulated since the inception of the fund.
Note: The financials reports for all funds are prepared using the accrual basis of accounting.
40
Accounts Payable, Bonds Payable and Other PayablesFor the Period Ended May 31, 2017
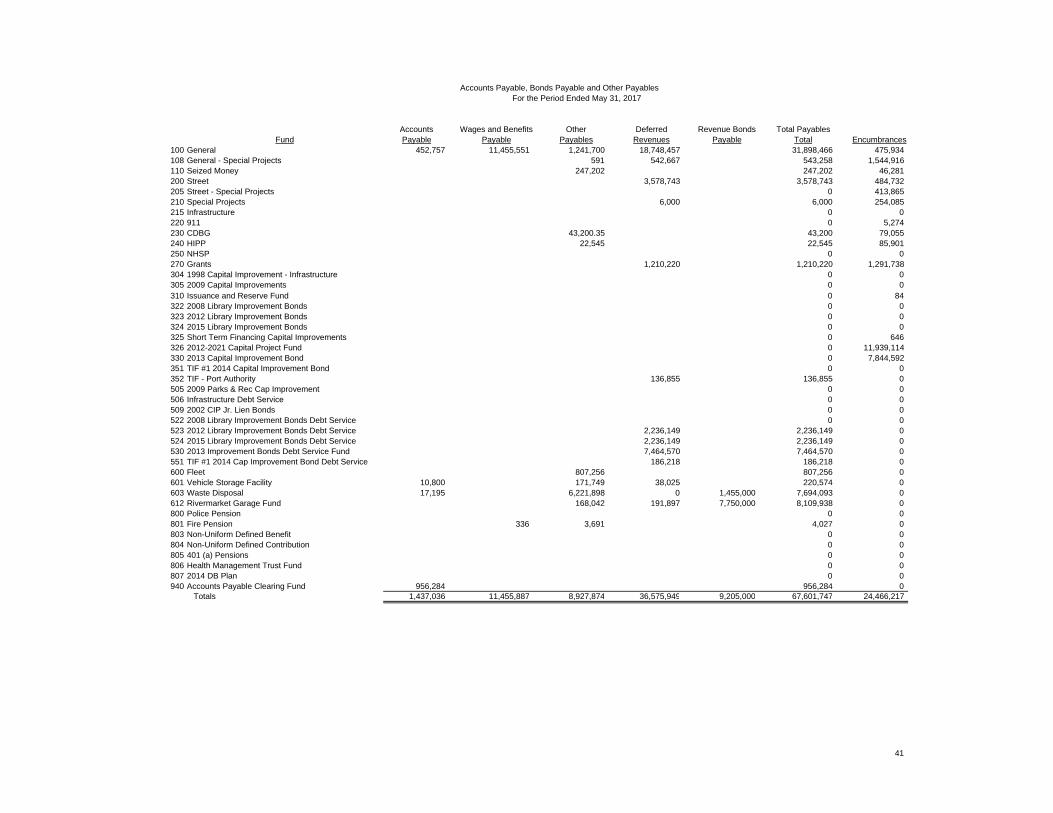
Accounts Wages and Benefits Other Deferred Revenue Bonds Total PayablesFund Payable Payable Payables Revenues Payable Total Encumbrances
100 General 452,757 11,455,551 1,241,700 18,748,457 31,898,466 475,934108 General - Special Projects 591 542,667 543,258 1,544,916110 Seized Money 247,202 247,202 46,281200 Street 3,578,743 3,578,743 484,732205 Street - Special Projects 0 413,865210 Special Projects 6,000 6,000 254,085215 Infrastructure 0 0220 911 0 5,274230 CDBG 43,200.35 43,200 79,055240 HIPP 22,545 22,545 85,901250 NHSP 0 0270 Grants 1,210,220 1,210,220 1,291,738304 1998 Capital Improvement - Infrastructure 0 0305 2009 Capital Improvements 0 0310 Issuance and Reserve Fund 0 84322 2008 Library Improvement Bonds 0 0323 2012 Library Improvement Bonds 0 0324 2015 Library Improvement Bonds 0 0325 Short Term Financing Capital Improvements 0 646326 2012-2021 Capital Project Fund 0 11,939,114330 2013 Capital Improvement Bond 0 7,844,592351 TIF #1 2014 Capital Improvement Bond 0 0352 TIF - Port Authority 136,855 136,855 0505 2009 Parks & Rec Cap Improvement 0 0506 Infrastructure Debt Service 0 0509 2002 CIP Jr. Lien Bonds 0 0522 2008 Library Improvement Bonds Debt Service 0 0523 2012 Library Improvement Bonds Debt Service 2,236,149 2,236,149 0524 2015 Library Improvement Bonds Debt Service 2,236,149 2,236,149 0530 2013 Improvement Bonds Debt Service Fund 7,464,570 7,464,570 0551 TIF #1 2014 Cap Improvement Bond Debt Service 186,218 186,218 0600 Fleet 807,256 807,256 0601 Vehicle Storage Facility 10,800 171,749 38,025 220,574 0603 Waste Disposal 17,195 6,221,898 0 1,455,000 7,694,093 0612 Rivermarket Garage Fund 168,042 191,897 7,750,000 8,109,938 0800 Police Pension 0 0801 Fire Pension 336 3,691 4,027 0803 Non-Uniform Defined Benefit 0 0804 Non-Uniform Defined Contribution 0 0805 401 (a) Pensions 0 0806 Health Management Trust Fund 0 0807 2014 DB Plan 0 0940 Accounts Payable Clearing Fund 956,284 956,284 0
Totals 1,437,036 11,455,887 8,927,874 36,575,949 9,205,000 67,601,747 24,466,217
41

PRINCIPAL BONDS PRINCIPAL BONDS PRINCIPAL INTERESTORIGINAL MATURITY INTEREST BALANCE ISSUED PAID IN RETIRED BALANCE PAID IN
GENERAL OBLIGATION DEBT TRUSTEE AMOUNT DATE RATE AT 12/31/16 2017 2017 2017 AT 01/31/17 2017
2012 Library Construction and Refunding Bonds Regions Bank (Paying Agent & Registrar) $31,015,000 3/1/2032 2.00% - 4.00% $22,420,000 $0 $1,290,000 $1,540,000 $19,590,000 $386,4042015 Library Construction and Refunding Bonds Regions Bank (Paying Agent & Registrar) 36,620,000 3/1/2038 2.05% - 4.00% 36,620,000 0 1,135,000 765,000 34,720,000 562,3062013 Limited Tax Capital Improvement First Security Bank (Paying Agent & Registrar) 58,105,000 4/1/2033 1.00% - 5.00% 29,455,000 0 1,895,000 8,750,000 18,810,000 576,9192014 Tax Increment Improvement Bonds (Redevelopment District No. 1.) Regions Bank 2,615,000 3/1/2036 6.00% 2,615,000 0 0 0 2,615,000 78,450
REVENUE BONDS
2007 Capital Improvement Revenue Refunding Bonds U.S, Bank 13,350,000 10/1/2019 4.00% - 5.00% 3,935,000 0 0 0 3,935,000 89,1882002 Junior Lien Revenue Bonds U.S, Bank 3,630,000 10/1/2018 3.50% - 4.65% 605,000 0 0 0 605,000 13,9192009A Parks & Rec Revenue Bonds Bank of the Ozarks 7,830,000 1/1/2039 2.00% - 5.50% 6,690,000 0 150,000 0 6,540,000 174,5032009B Parks & Rec Bank of the Ozarks 12,120,000 1/1/2039 2.00% - 5.375% 10,660,000 0 245,000 0 10,415,000 277,9482003 Capital Improvement and Refunding-Parking Projects U.S. Bank 11,855,000 7/1/2028 1.50% - 5.30% 7,750,000 0 0 0 7,750,000 201,6502007 Waste Disposal Revenue Bond Citizens Bank 3,400,000 5/1/2022 5.30% - 5.87% 1,700,000 0 245,000 0 1,455,000 48,814
TEMPORARY NOTE
2012 Temporary Note Banc of America Public Capital Corp. 18,580,000 3/28/2017 1.38% 3,818,573 0 3,818,573 0 0 52,5862013 Temporary Note USBank 7,700,000 7/30/2018 1.61% 3,153,909 0 0 0 3,153,909 02014 Temporary Note Branch Banking and Trust Company 5,916,000 6/27/2019 1.46% 3,601,033 0 0 0 3,601,033 02015 Temporary Note First Security Bank 5,910,000 6/24/2020 1.81% 4,769,785 0 0 0 4,769,785 02016 1st Temporary Note Banc of America Public Capital Corp. 4,525,000 6/10/2021 1.54% 4,525,000 0 0 0 4,525,000 02016 A&P Temporary Note Simmons First National Bank 2,850,000 10/25/2021 1.89% 2,850,000 0 0 0 2,850,000 02016 2nd Temporary Note Relyance Bank 4,603,000 12/22/2021 1.85% 4,603,000 0 0 0 4,603,000 0
Grand Total $230,624,000 $149,771,300 $0 $8,778,573 $11,055,000 $129,937,727 $2,462,685
SUMMARY OF BOND INDEBTEDNESSFor the month ended May 31, 2017
Related Documents