MONTANA’s Education Pipeline Montana in Two Dimensional Space

Welcome message from author
This document is posted to help you gain knowledge. Please leave a comment to let me know what you think about it! Share it to your friends and learn new things together.
Transcript
MONTANA’sEducation PipelineMontana in
Two Dimensional Space
Montana’s Challenges: The Big Three
The Demand Dilemma
The Leaky Pipeline
Constrained Finances

The 1st Challenge – The DemandDilemma
Precipitous Projected drop in college enrollment
WHY?
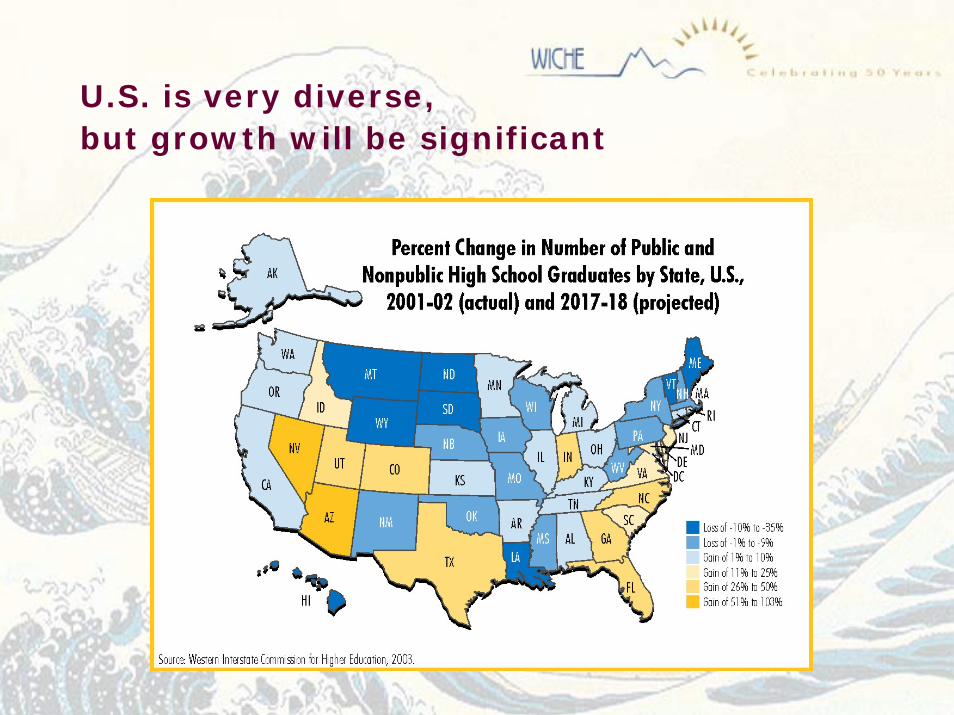
U.S. is very diverse, but growth will be significant

A couple of neighbors face growth that is off the charts
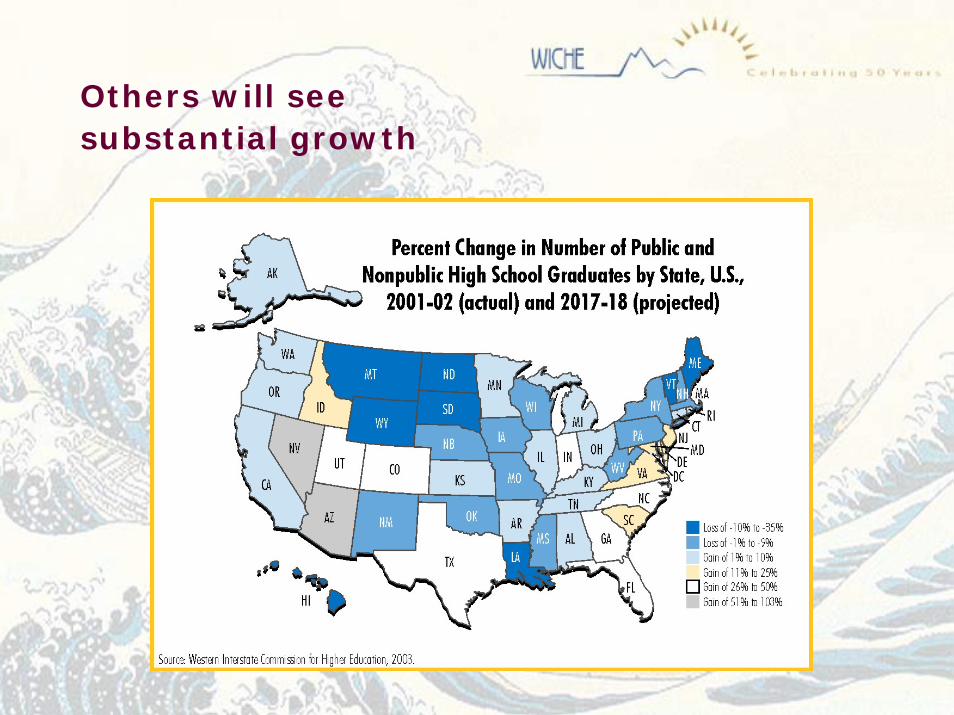
Others will seesubstantial growth
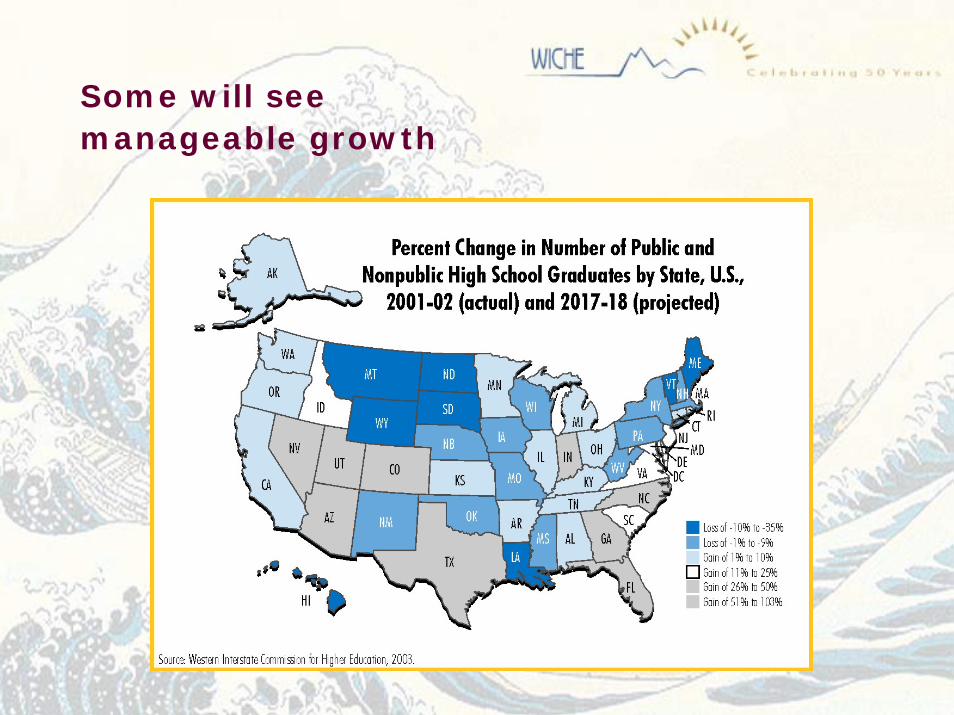
Some will seemanageable growth
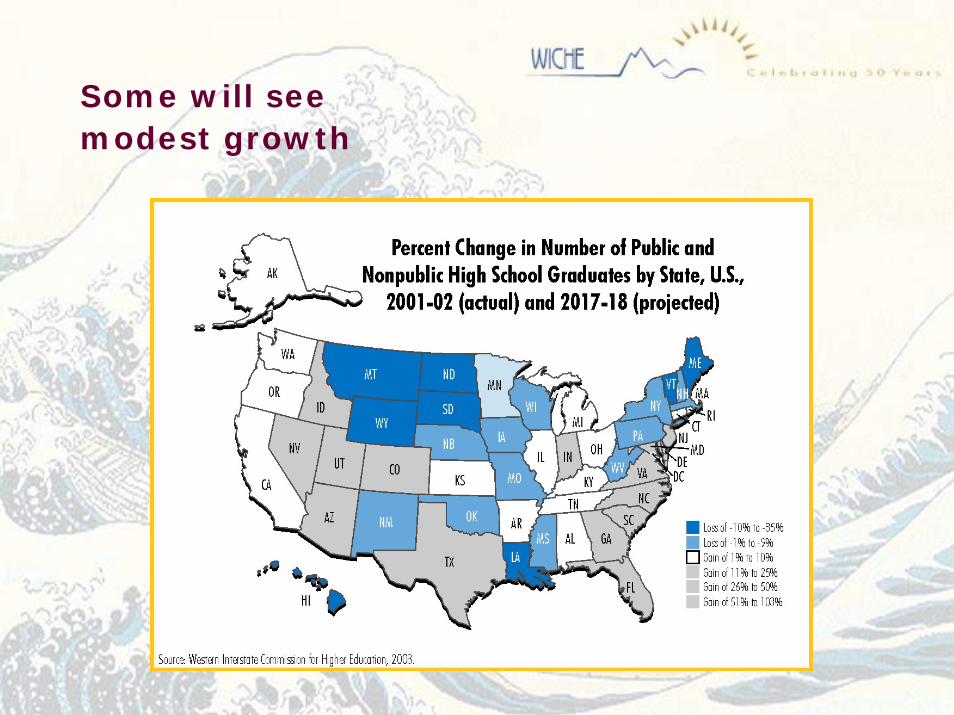
Some will seemodest growth
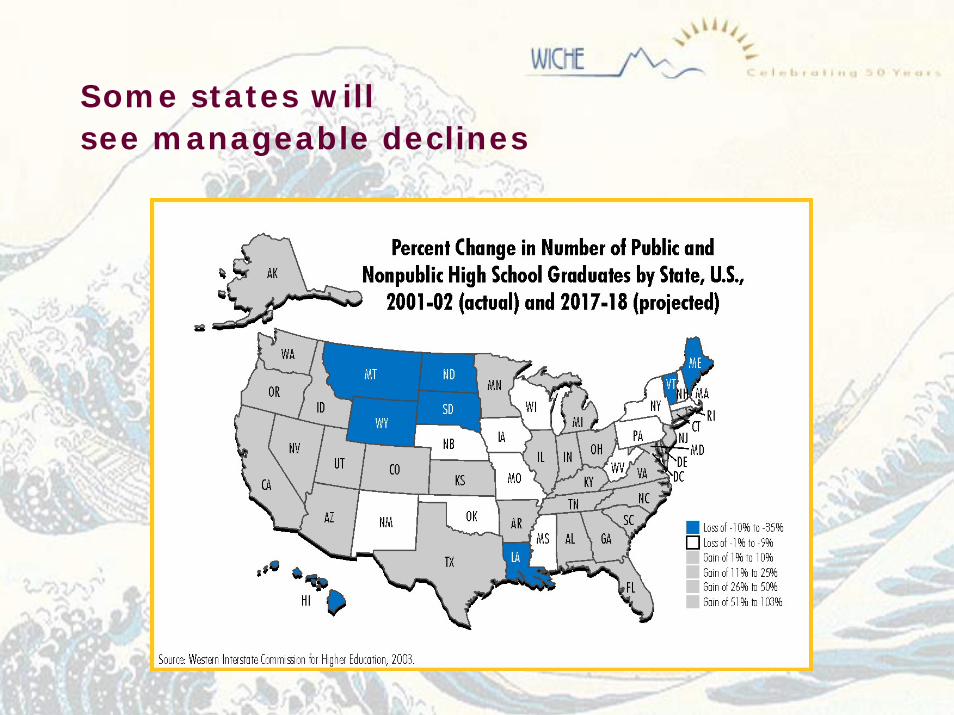
Some states willsee manageable declines
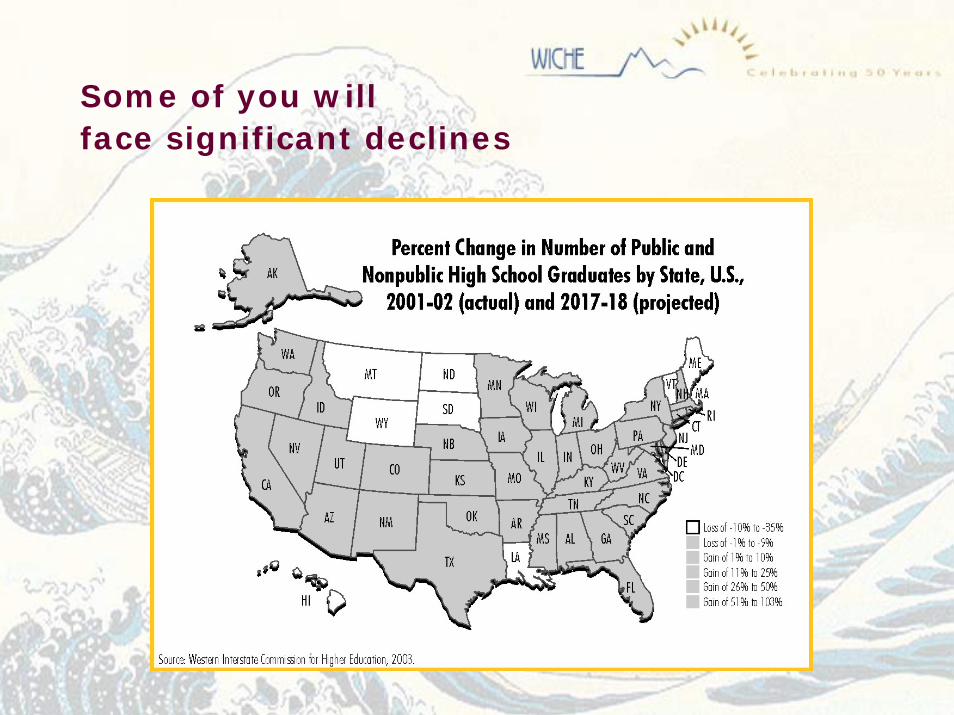
Some of you will face significant declines
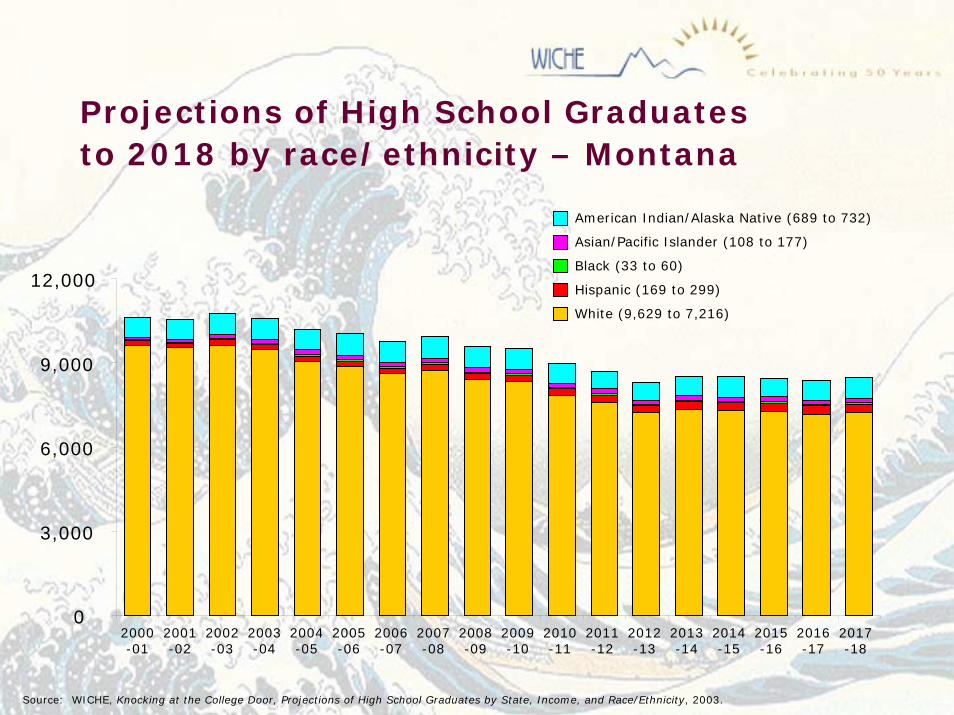
Projections of High School Graduates to 2018 by race/ethnicity – Montana
0
3,000
6,000
9,000
12,000
2000-01
2001-02
2002-03
2003-04
2004-05
2005-06
2006-07
2007-08
2008-09
2009-10
2010-11
2011-12
2012-13
2013-14
2014-15
2015-16
2016-17
2017-18
American Indian/Alaska Native (689 to 732)
Asian/Pacific Islander (108 to 177)
Black (33 to 60)
Hispanic (169 to 299)
White (9,629 to 7,216)
Source: WICHE, Knocking at the College Door, Projections of High School Graduates by State, Income, and Race/Ethnicity, 2003.

The Second Challenge – the Leaky Pipeline
Two Dimensions of High School completion
The Good News
Measuring Up 2002: A- on preparation
In Montana, 78.1% of 9th graders earned high school diplomas (good, but a 3% decline, 1996-2000)
In the WICHE West – it’s 69.8%
In the U.S. – it’s 68.1%

Leaks continued – high school completion
The Bad News
Averages mask the two Montanas
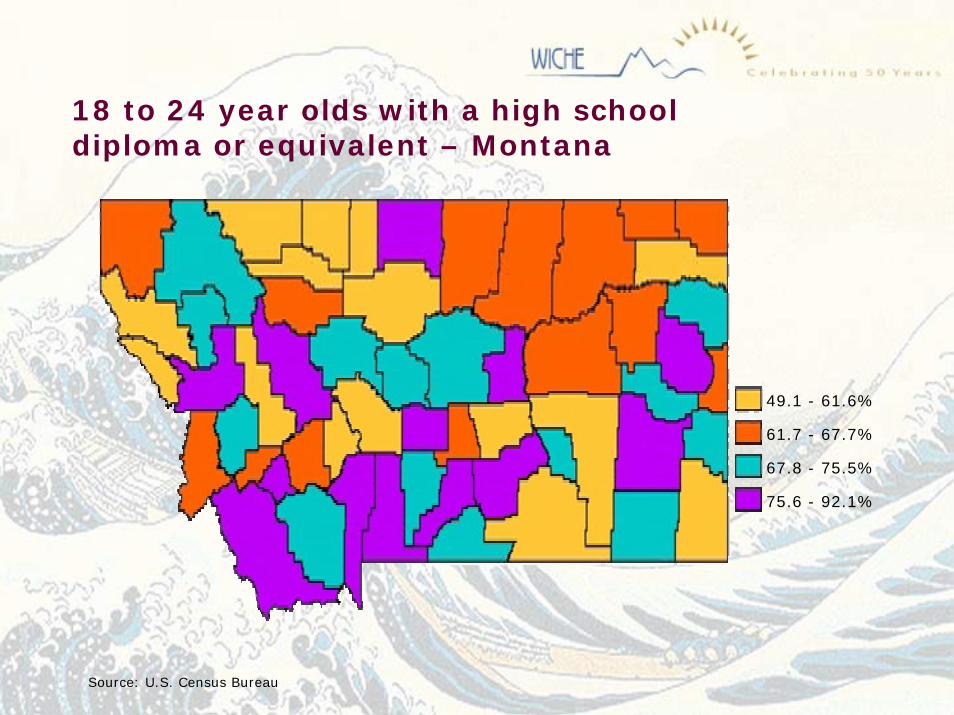
18 to 24 year olds with a high school diploma or equivalent – Montana
49.1 - 61.6%
61.7 - 67.7%
67.8 - 75.5%
75.6 - 92.1%
Source: U.S. Census Bureau

Leaks Continued – Post-secondary participation
Measuring Up 2002 gives a D+
WICHE data looks better
Montana – 53.8%WICHE West – 48%U.S. – 56.1%

Leaks continued -- Completing college
Measuring Up 2002: C on Completion
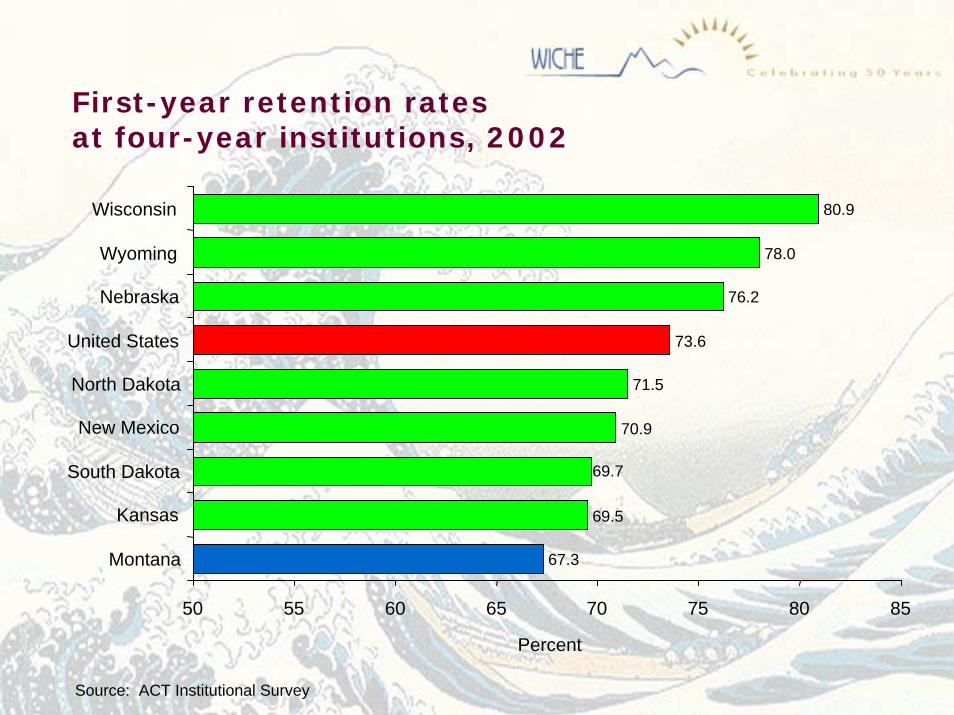
First-year retention rates at four-year institutions, 2002
Source: ACT Institutional Survey
67.3
69.5
70.9
71.5
73.6
76.2
78.0
80.9
69.7
50 55 60 65 70 75 80 85
Montana
Kansas
South Dakota
New Mexico
North Dakota
United States
Nebraska
Wyoming
Wisconsin
Percent

First-year retention rates at two-year institutions, 2002
Source: ACT Institutional Survey
NA
43.9
51.0
51.5
51.6
54.8
55.0
57.0
48.7
30 35 40 45 50 55 60
North Dakota
Montana
Wisconsin
Kansas
Nebraska
New Mexico
United States
Wyoming
South Dakota
Percent

Graduation rates forresearch institutions, 2002
Source: NCES, IPEDS 2002 Graduation Rates
43.1
45.7
51.0
53.8
54.3
54.4
62.2
67.1
48.8
0 25 50 75
Montana
New Mexico
North Dakota
South Dakota
Kansas
Wyoming
Nebraska
United States
Wisconsin
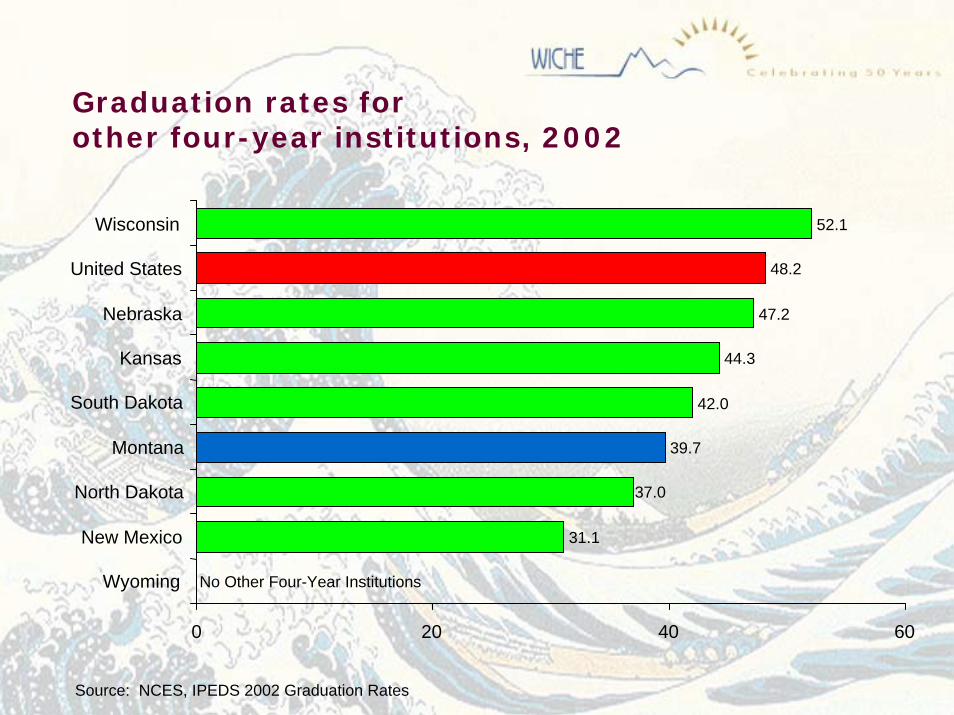
Graduation rates for other four-year institutions, 2002
Source: NCES, IPEDS 2002 Graduation Rates
No Other Four-Year Institutions
31.1
39.7
42.0
44.3
47.2
48.2
52.1
37.0
0 20 40 60
Wyoming
New Mexico
North Dakota
Montana
South Dakota
Kansas
Nebraska
United States
Wisconsin

Graduation rates fortwo-year institutions, 2002
Source: NCES, IPEDS 2002 Graduation Rates
12.9
29.1
37.7
39.6
43.2
44.0
52.2
60.6
30.2
0 10 20 30 40 50 60 70
New Mexico
United States
Montana
Kansas
Wisconsin
Nebraska
North Dakota
Wyoming
South Dakota
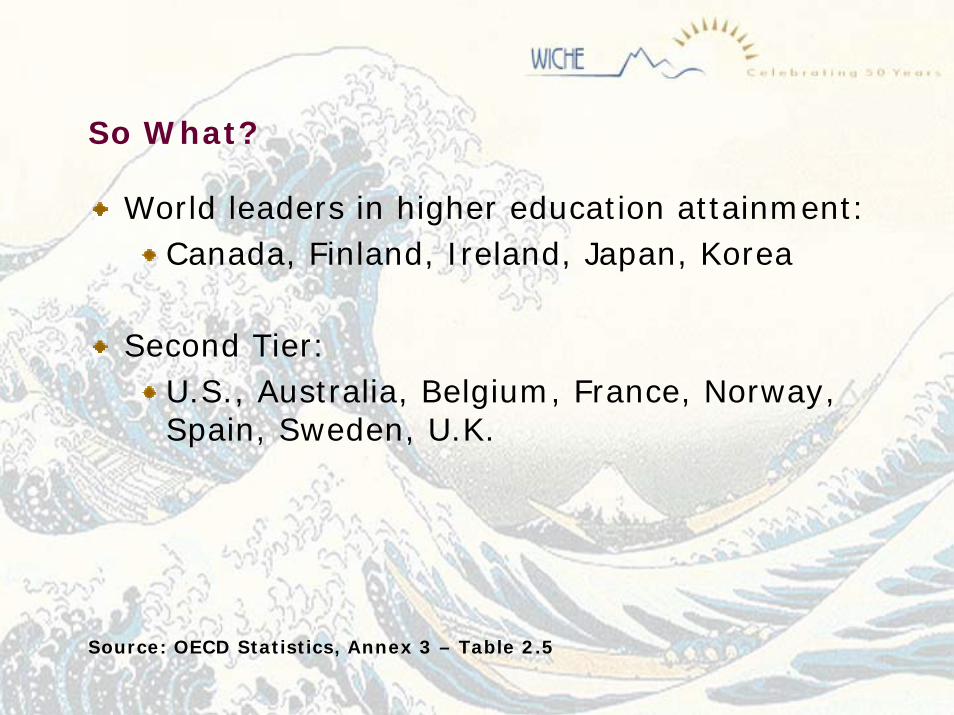
So What?
World leaders in higher education attainment:Canada, Finland, Ireland, Japan, Korea
Second Tier:U.S., Australia, Belgium, France, Norway, Spain, Sweden, U.K.
Source: OECD Statistics, Annex 3 – Table 2.5
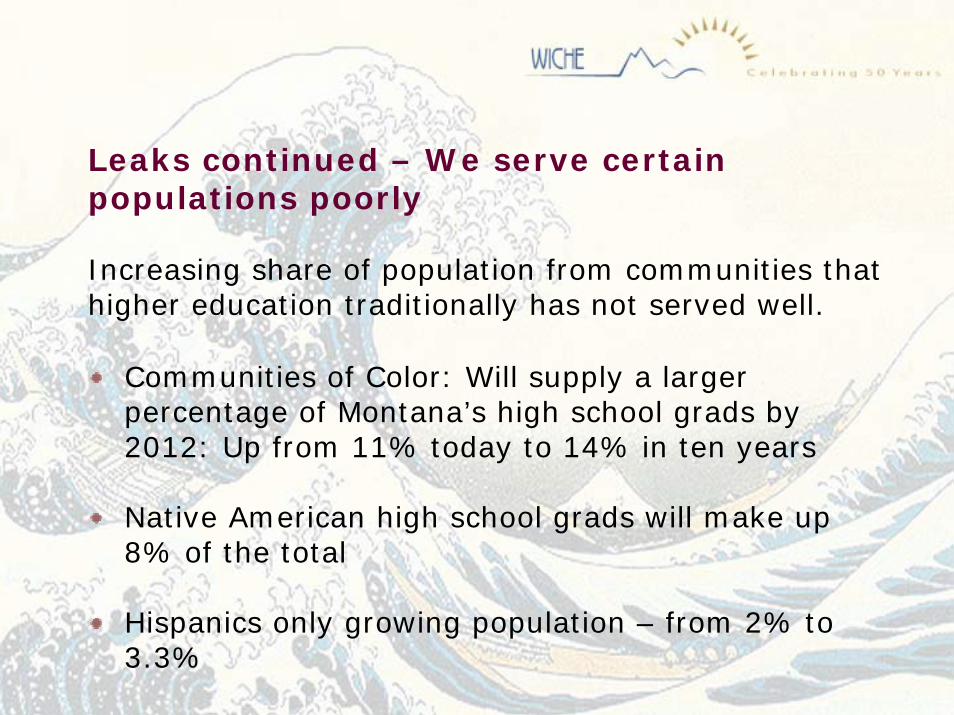
Leaks continued – We serve certain populations poorly
Increasing share of population from communities that higher education traditionally has not served well.
Communities of Color: Will supply a larger percentage of Montana’s high school grads by 2012: Up from 11% today to 14% in ten years
Native American high school grads will make up 8% of the total
Hispanics only growing population – from 2% to 3.3%
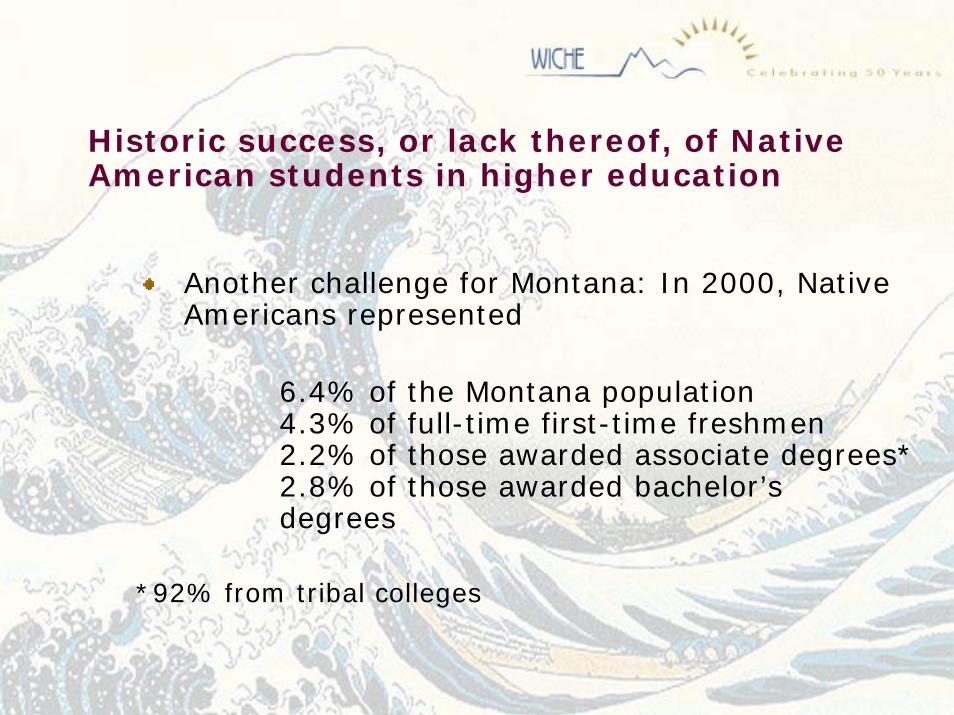
Historic success, or lack thereof, of Native American students in higher education
Another challenge for Montana: In 2000, Native Americans represented
6.4% of the Montana population4.3% of full-time first-time freshmen2.2% of those awarded associate degrees*2.8% of those awarded bachelor’s degrees
*92% from tribal colleges

Historic Success, or lack thereof, of low-income students
In the U.S.: Participation dropped from 27.5% to 23.1% between 1999 and 2001..In Montana: 27.9% of low income participation.
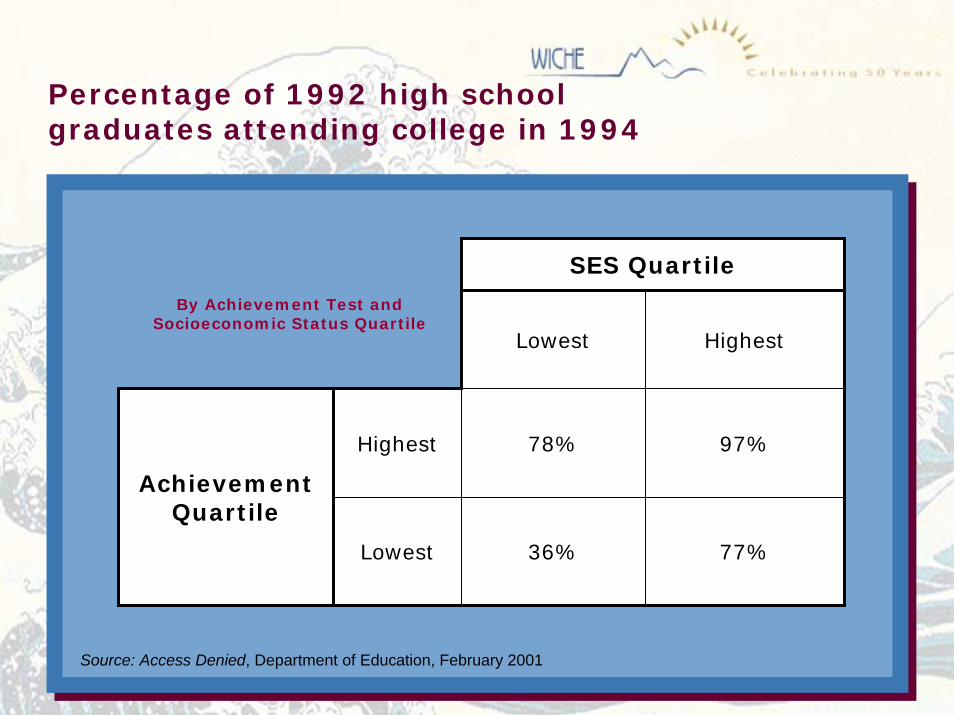
Percentage of 1992 high schoolgraduates attending college in 1994
AchievementQuartile
By Achievement Test and Socioeconomic Status Quartile
HighestLowest
77%36%Lowest
97%78%Highest
SES Quartile
Source: Access Denied, Department of Education, February 2001
The 3rd Challenge – Limited Resources
State appropriations make up 33.1% of funding for Montana’s baccalaureate institutions. The WICHE average: 42.9%
Montana funds its two-year institutions at a rate of 18.9%. The WICHE average: 36.6%

State and local surplus or shortfall as a percent of baseline revenues
VT ND ME NJ DE WI
KS MT MD NH AZ MA UT OK OR NE OH SD MI RI MN CO AK CA CT WV PA VA GA US KY AR HI NM IA NY IL MO WA ID IN NC TX FL SC WY MS LA AL NV TN
Source: National Center for Higher Education Management Systems (NCHEMS)-10
-8
-6
-4
-2
0
2
4

Access is at risk
Montana trails the West and the rest in need-based financial assistance.
State need-based aidMontana - $62WICHE average - $238U.S. average - $316
The Makings of The Brewing Storm
Declining demand
Increasingly difficult-to-serve clientele
Limited finances
The Brewing Storm –Facing The Challenge
The solutions for higher education lie both within and outside higher education in Montana – your revenue structure won’t support your anticipated level of public services
Planning is essential
Leadership makes the real difference
Outside Solutions: Interstate collaboration makes sense, if done smartly.
Other states can help fill excess capacity (i.e., WICHE’s WUE program)
Other states can help Montana focus its resources (i.e., WICHE’s PSEP program)
In/Pre-Service Teacher Prep & Certification
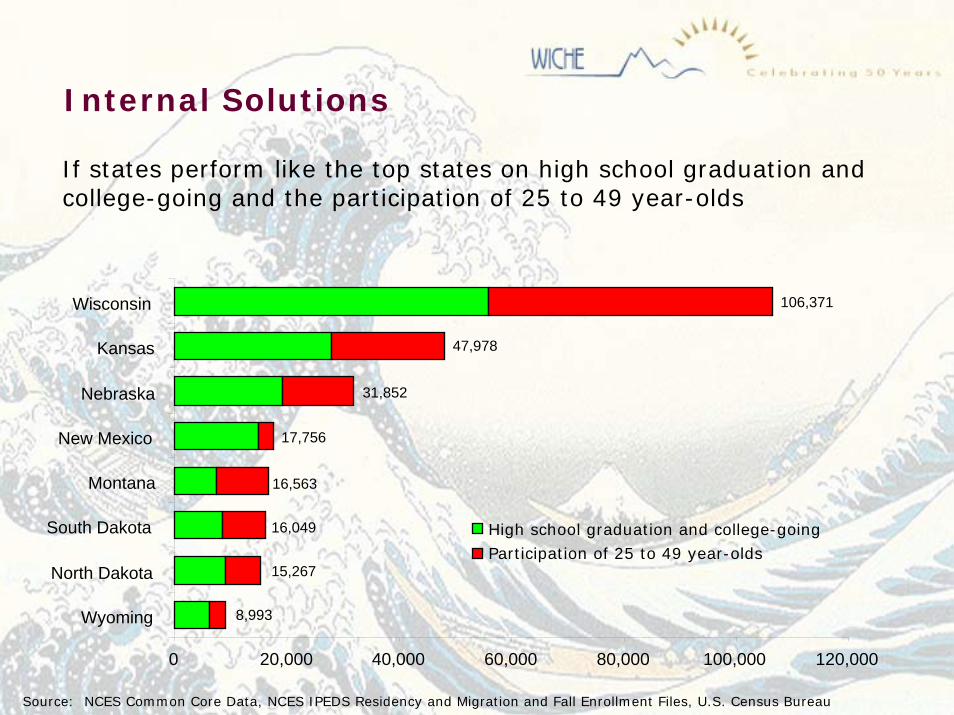
Internal Solutions
If states perform like the top states on high school graduation and college-going and the participation of 25 to 49 year-olds
20,000 40,000 60,000 80,000 100,000 120,000
Wyoming
North Dakota
South Dakota
Montana
New Mexico
Nebraska
Kansas
Wisconsin
High school graduation and college-goingParticipation of 25 to 49 year-olds
106,371
47,978
31,852
17,756
16,563
16,049
15,267
8,993
0
Source: NCES Common Core Data, NCES IPEDS Residency and Migration and Fall Enrollment Files, U.S. Census Bureau

P-20 in Montana
Policies In Sync
Teachers & TeachingCurriculum and StandardsOutreachFinancing the EnterpriseData & Accountability

Related Documents