1 1 Table of Contents NANSLO Overview Lab Manual Survey of Chemistry Lab Manual

Welcome message from author
This document is posted to help you gain knowledge. Please leave a comment to let me know what you think about it! Share it to your friends and learn new things together.
Transcript

1 1
Table of Contents
NA
NSLO
Overv
iew
Lab M
anual Survey of Chemistry
Lab Manual
2 2
Table of Contents
NA
NSLO
Overv
iew
Lab M
anual
NANSLO Overview • NANSLO Mission– p. 3 • How NANSLO works – p. 4 • NANSLO Laboratory Locations – p. 5 • Lab Equipment – pp. 6-9
Instructor Background Info • Background Information for Instructor – p. 10 • Using this Lab Manual – p. 11 • NANSLO Network Scheduling System – p. 12 • Scheduling a Lab – p. 13 • Faculty Dashboard – p. 14 • Preparation Tips – p. 15 • Preparing Students for Success – p. 16 • Reports and Assessment – p. 17 • Getting Help – p. 18 • Instructor Checklist – p. 19
Instructions for Students • Instructions for Students – p. 20 • Preparing for Each Lab – p .21 • Technical Requirements – p. 22 • Scheduling a Lab Appointment – p. 23 • Student Dashboard – p. 24 • Completing a Lab – p. 25 • Getting Help – p. 26 • Student Checklist – p. 27
Survey of Chemistry Lab Activities • Survey of Chemistry Lab Activities Cover Page – p. 28 • NANSLO Survey of Chemistry Introduction – p. 29 • Lab Descriptions – pp. 30-32 • Measurements – pp. 33-52 • Density – pp. 53-70 • Emission Spectrum – pp. 71-92 • Exothermic/Endothermic Reaction – pp. 93-112 • Beer-Lambert Law (Absorbance/Concentration) – pp.113-131 • Enzyme Kinetics– pp.132-155 • Radiation – pp. 156-172 • Reaction Rate – pp. 173-186 • Acid/Base Titration – pp. 187-203 • Membrane Diffusion – pp. 204-224

3
NA
NSLO
Overv
iew
Lab M
anual
NANSLO Mission
NANSLO provides a consortium approach to the development
and deployment of high-quality, modular, openly licensed
courseware integrating learner-centered and immersive web-
based labs using software, video, and robotics for the study of
science courses.
The North American Network of Science Labs Online
(NANSLO) provides students the ability to conduct lab
activities with state-of-the-art science equipment using
robotics, software, and web cams over the Internet. From any
computer, students can log into a lab interface and manipulate
the controls to conduct real-time experiments. The interface
also allows participants to communicate with lab partners, ask
for assistance from a knowledgeable lab technician, and
collect data and images for their assignments.

4
NA
NSLO
Overv
iew
Lab M
anual
How NANSLO works
1. Faculty use the centralized scheduling system to reserve a block of time for students to perform assigned NANSLO lab activities.
2. When a reservation is made, a unique URL and PIN are generated. Faculty give their students this information, and students use it to access the scheduling system and select a day and time within the reserved block to complete the lab activity.
3. Once connected to the NANSLO lab, students have access to real scientific lab equipment that lets them:
• Engage in authentic instrumental experimentation;
• Collect real-time data and capture it electronically;
• Experiment with different settings to see the impact on the data being observed and collected;
• Generate graphs and data to insert into lab reports;
• Capture high-resolution images;
• Collaborate with classmates and lab personnel through voice conferencing.

5
NA
NSLO
Overv
iew
Lab M
anual
Remote Labs
The NANSLO network’s hub is based at the Western Interstate Commission for Higher Education (WICHE) in
Boulder, CO. Currently, the network includes two laboratories.
North Island College (NIC), Courtenay, British Columbia
Great Falls College Montana State University (GFCMSU), Great Falls, Montana

6
NA
NSLO
Overv
iew
Lab M
anual
Lab Equipment
Each lab that you will be conducting uses robotics that you control to complete the experiment. The robotics are
attached to scientific equipment that correspond to each specific experiment.
Density Emission Spectrum
• Cube
• Scale balance
• Beaker 1; Beaker 2 with vegetable oil
with red food coloring and a metal
bolt; Beaker 3 with corn syrup and a
ping pong ball; and Beaker 4 with
vegetable oil with red food coloring,
corn syrup, a metal bolt, and a ping
pong ball
• Video camera
• Spectrometer
• Emission lamps
• Gases
• Video camera
Measurement
• Controllable camera
• Fish tank
• Measuring Tools
• Video camera

7
NA
NSLO
Overv
iew
Lab M
anual
Lab Equipment
Each lab that you will be conducting uses robotics that you control to complete the experiment. The robotics are
attached to scientific equipment that correspond to each specific experiment.
Exothermic/Endothermic
Reaction
Beer-Lambert Law
(Absorbance/Concentration)
Enzyme Kinetics
• Beakers with CaCl2 (calcium
chloride; NaCl (sodium chloride;
NaHCO3 (sodium acetate); NH4Cl
(ammonium chloride); and NH4NO3
(ammonium nitrate)
• Water
• Temperature gauge
• Video camera
• Spectrometer
• NiSo4
• Pumps
• Cuvettes and cuvette carousel
• Temperature gauge
• Heater unit
• Video camera
• Spectrometer
• Enzyme solution
• Glucose Solution
• Pumps
• Cuvettes and cuvette carousel
• Temperature gauge
• Heater unit
• Video camera

8
NA
NSLO
Overv
iew
Lab M
anual
Lab Equipment
Each lab that you will be conducting uses robotics that you control to complete the experiment. The robotics are
attached to scientific equipment that correspond to each specific experiment.
Radiation Reaction Rate Acid/Base Titration
• Beakers
• Alka-Seltzer tablets
• Water
• Measuring device
• Video camera
• Probe assembly
• Solutions in beakers
• Rinse beaker
• Acid solution (tank A)
• Base solution (tank B)
• Burettes
• pH and temperature sensors
• Heating unit
• Video camera
• Radiation detector
• Radiation source
• Radiation measuring device
• Shielding – paper, tin foil,
and aluminum
• Video camera

9
NA
NSLO
Overv
iew
Lab M
anual
Lab Equipment
Each lab that you will be conducting uses robotics that you control to complete the experiment. The robotics are
attached to scientific equipment that correspond to each specific experiment.
Membrane Diffusion
• Spectrophotometer
• Cuvettes and cuvette carousel
• Robotic syringe pump

10 10
Instr
ucto
r B
ackgro
und Info
Lab M
anual
Background Information for Instructor
Materials contained in this section:
• Using this Lab Manual
• NANSLO Network Scheduling System
• Scheduling a Lab
• Faculty Scheduling System Dashboard
• Preparation Tips
• Preparing Students for Success
• Reports and Assessment
• Getting Support
• Instructor Checklist
11
Instr
ucto
r B
ackgro
und Info
Lab M
anual
Using this Lab Manual NANSLO Overview provides general information about NANSLO, the capabilities it offers to you and your
students, our laboratory locations, and the equipment used for the NANSLO lab activities included in this lab
manual.
Background Information for Instructors provides general information for scheduling your assigned NANSLO lab
activities; technical tips; things to consider in preparing students for success in these lab activities; reports
available for use in determining student completion of lab activities; and a general checklist that can be used in
preparing for assigned lab activities.
Instructions for Students provides general information for students to use in preparing for each NANSLO lab
activity; technical requirements; instructions for making an appointment based on the times you have reserved;
functions available on the scheduling system student dashboard; general instructions for completing assigned labs;
and a general checklist that can be used in preparing for each assigned lab activity. NOTE: This complete section should be given to students as it is applicable to all NANSLO lab activities in this lab manual.
Survey of Biology Lab Activities contains ten lab activities. Each lab activity is complete. It contains a description
of the lab activity; its purpose; essential question(s) to be answered; lab activity objectives; pre- and post-lab
questions; background information; its applicability in real life and the work place; equipment setup; the control
panel and instructions on how to use this web-enabled interface; a lab day checklist; information, observations,
and activities to be completed while connected to the NANSLO Laboratory; an area to use in documenting data
collected and images captured; analysis questions and procedures; reviewing results; and conclusions and
reflections. Each lab activity has been written using an inquiry-based format. NOTE: This section can be given to students as their lab manual or can be provided in modules as the student is assigned to each lab activity.
instructors but may be shared with students
instructor use only
student use only
student use only
Designed for

12
Instr
ucto
r B
ackgro
und Info
Lab M
anual
NANSLO Network Scheduling System In order to use these NANSLO lab activities through a NANSLO laboratory, your Institution must have an agreement
with NANSLO to use its services and have a NANSLO Scheduling System Account.
Institution Administrator: Each Institution using NANSLO has appointed an Institution Administrator who enters
course and faculty information into the system (see scheduler.nanslo.org for more information about this
system.) This centralized system allows institutions from across the country and the world to provide students
with access to NANSLO’s laboratories and NANSLO lab activities through the Internet.
Username and Password: Your Institution Administrator is responsible for determining who will have access to
this scheduling system. Once a faculty member record is entered into the scheduling system by the Institution
Administrator, a unique username and password is generated and an email is sent to the primary email address
entered.
Faculty Dashboard: If you have been given a username and password by your Institution Administrator, you have
access to a Faculty Dashboard. Through that dashboard, you can make reservations, update reservations, send
email notification to students who have made appointments for assigned NANSLO lab activities, and view student
reports.
Have Questions? • Is your Institution using NANSLO?
• Who is your Institution Administrator?
• Need more information on using your Faculty Dashboard or making a reservation?
Send your questions to [email protected]. Please include your contact name and number and
information on the topic you need help on.

13
Instr
ucto
r B
ackgro
und Info
Lab M
anual
Scheduling a Lab
Ten reservations are required as a reservation is made by you or your Scheduling System Institution Administrator
for each lab activity in this Lab Manual. Each reservation generates a unique URL and PIN number that you will
provide to your students to enable them to make appointments during the block of time reserved. The information
entered for each reservation is:
1. The name of the NANSLO lab activity.
2. A range of dates when that NANSLO lab activity is assigned to your students.
3. The number of students who are assigned to that NANSLO lab activity.
4. The number of students who will work together online. Typically 4 or 5 students work together and use a
teleconferencing capability to collaborate.
5. The number of laboratory sessions needed for that reservation are computed (number of students/team size.)
Select the number of laboratory sessions needed from the list of available time blocks during the selected date
range.
6. Upon completion of a reservation, an email is automatically generated to you if you are associated to the
course/Section ID.
Lab Usage and Capacity • NANSLO laboratories offer flexible hours (days and evenings)
• NANSLO laboratories are usually open on Saturday
• Multiple laboratory stations allow large numbers of students to be served at the same time
• Each student group can access different scientific equipment at the same time through the NANSLO
laboratory

14
Instr
ucto
r B
ackgro
und Info
Lab M
anual
Faculty Scheduling System Dashboard
If you have been given a username and password by your Scheduling System Institution Administrator, you will have
access to a customized dashboard. Use the Faculty Dashboard to:
1. Add reservations and update reservations you have already made.
2. Access Student Rosters to determine which students have and have not made appointments to complete each of
these assigned NANSLO lab activities.
3. Access Student Reports to determine which students accessed the NANSLO laboratory, how long they remained
online, and viewing any comments appended to individual student records.
4. Review information on reservations made.
5. Edit your profile.
6. Assign a Section ID to your course if not done by the Institution Administrator.
If you have been given a Username and Password by your Scheduling System Institution Administrator, go to scheduler.nanslo.org, select the “I am a faculty or administrator” button, and enter your username and password to access the Faculty Dashboard. Need to know who your Institution Administrator is? Send an email to [email protected].

15
Instr
ucto
r B
ackgro
und Info
Lab M
anual
Preparation Tips Unique URL and PIN for Each Reservation: Remember to give students the unique URL and PIN for each
reservation made for each NANSLO lab activity.
Try It Out Before Assigning it to Students: NANSLO encourages faculty to try out NANSLO before assigning
students a NANSLO lab activity. It helps you answer your student’s questions about how to set up an appointment,
how to use the equipment, and other basic questions. The measurement activity is a good one to use.
Computer Equipment: Currently NANSLO lab activities cannot be performed on cell phones and tablets. We’re
working on it. So students need to use a computer for these activities.
Technical Issues and Internet Connectivity: Most students have had very little technical difficult when accessing
NANSLO laboratories. However, very slow connections may impact your student’s experience especially when
viewing the video stream on the NANSLO control panel showing the equipment and activity as it is performed.
Access to NANSLO Control Panel: We are moving toward delivering our control panel using HTML 5; however, in
some instances, your students may be required to download a piece of software (Citrix receiver) to their
computers.
Campus Firewalls: On occasion, accessing the NANSLO laboratory through campus computers my be an issue. If
you are demonstrating a NANSLO lab activity to students, it is a good idea to test it out in advance.
We’re Here to Help: Email NANSLO at [email protected]

16
Instr
ucto
r B
ackgro
und Info
Lab M
anual
Preparing Students for Success
• Review the lab information, objectives, and essential questions to identify questions your students may have or to make changes
you see appropriate for your course.
• Recommend students make appointments as soon as possible (window for making appointments begins two weeks before the
reservation start date) if specific days of the week or times of the day are needed.
• Access your Faculty Dashboard, review your Roster, and remind students that have not made an appointment to do so.
• Discuss or demonstrate how students access the NANSLO laboratory before the start date of the assigned NANSLO lab activity.
• Show students how to capture images on their computer and paste them into a document and how to use a spreadsheet to
document data that has been collected.
• Provide additional resources that assist students in understanding the concepts they will be learning in the assigned NANSLO lab
activity.
• Share samples of lab reports with your students.
• Encourage students to review tutorials and other material to prepare themselves before connecting to the NANSLO laboratory.
• Remind students to connect to the teleconferencing capability as soon as they connect to the NANSLO laboratory to collaborate
with team members and NANSLO lab technicians.
• Let students know that lab technicians are online and available to help them with technical issues.
• After the lab, provide time for students to share and compare results, discuss challenges, and reflect on learning.
• Facilitate group discussions on how these NANSLO lab activities complement everyday life and work experiences.
.

17
Instr
ucto
r B
ackgro
und Info
Lab M
anual
Reports and Assessment
Student Activity Reports: Several reports are available through your Faculty Dashboard you can use determine if
students have made an appointment for an assigned NANSLO lab activity and the time spent working through the
activity.
Assessments: The lab objectives and essential questions serve to guide the outcomes for each lab. Look for pre-
and post-quizzes, guiding questions, data analysis, and lab reports to assess learning. Rubrics may also be
associated with labs to assist in scoring.
Detailed Student Reports provide information about:
• Who made an appointment for an assigned lab.
• Who made an appointment and didn’t show up for the lab.
• Who attempted to access the lab on the selected date and time and were
unable to log into the lab station computer.
• What time a student logged in and logged out, allowing faculty to determine
time spent in the laboratory.
• Notes appended to individual student records by lab technicians.
Student Roster
• Lists the names, contact information, and date and time selected by those
students to access the NANSLO laboratory and perform the NANSLO lab
activity.

18
Instr
ucto
r B
ackgro
und Info
Lab M
anual
Getting Help
Provide information on who to contact

19
Instr
ucto
r B
ackgro
und Info
Lab M
anual
Instructor Checklist
Preview lab, watch tutorials
Test software
Schedule lab
Introduce concepts and lab to students
Guide students by assigning tutorials on NANSLO and NANSLO lab activities
Preview NANSLO lab activities with students and conduct a Q & A session
Show examples of same lab procedure done in person
Clarify your expectations for outcomes
Review Student Activity Reports, and contact students as needed
Conduct discussions to review results, challenges, and questions
Encourage student reflection and self-assessment for learning
Assess outcomes and student learning

20 20
Instr
uctions
for
Stu
dents
Lab M
anual
Instructions for Students
Material contained in this section:
• Preparing for Each Lab
• Technical Requirements
• Scheduling a Lab Appointment
• Student Dashboard
• Completing a Lab
• Getting Help
• Student Checklist

21 21
Instr
uctions
for
Stu
dents
Lab M
anual
Preparing for Each Lab
There are ten NANSLO lab activities within this manual. Your instructor will provide dates when each activity will
be completed by you and other details on turning in your work and a unique URL and PIN number for EACH activity.
Here are your steps for success.
1. Carefully review the entire NANSLO lab activity.
2. Watch any accompanying videos or tutorials one or more times so you have a strong understanding of the
content and experiment you will be conducting.
3. Copy any lab report sheets, as necessary, or create the digital documents and spreadsheets you will be using
during the experiment.
4. Review the technical requirements for the lab and make sure you have access to a computer, Internet
connection, and software that meets these requirements. (see p. XX)
5. Once you receive the unique URL and PIN from your instructor for this NANSLO lab activity, schedule your
appointment as soon as possible (the appointment window begins two weeks before the start date of this
NANSLO lab activity.) (see p. xx)

22 22
Instr
uctions
for
Stu
dents
Lab M
anual
Technical Requirements
To prepare for a NANSLO lab activity, you must have:
• An Internet connection.
• Sufficient bandwidth (for example, your Internet Service Provider download speed is 5MB per second). If you
have very slow Internet access, it will have an impact on your ability to view the images being transmitted to
your computer.
• A computer (Mac or PC) — currently the NANSLO lab activities do not run on iPads, notepads, or cell phones.
• Sufficient knowledge on how to use a computer, e.g., how to use the right and left mouse buttons, capture images
using those buttons, open software such as Word to paste images captured, where you have saved files on your
computer.
• The appropriate browser to access the NANSLO lab activity. Currently, Google Chrome seems to be most
effective; however, you can use Internet Explorer and Mozilla Firefox. Irrespective of the browser you use to
access the NANSLO lab activity, the NANSLO web interface opens in Internet Explorer.

23 23
Instr
uctions
for
Stu
dents
Lab M
anual
Scheduling a Lab Appointment
Using the NANSLO Network Scheduling System
This centralized system allows you to access NANSLO’s laboratories and your assigned
NANSLO lab activities through the Internet from across the country and the world.
• Your instructor reserves a block of time (dates and times) for you to perform each assigned NANSLO lab activity.
• You will be provided with a unique URL and PIN number for each of these NANSLO lab activities.
• Enter that unique URL and PIN number to schedule an appointment within the specified block of time reserved.
• The system is set up on a first come, first serve basis so make your appointment early. The appointment window begins two weeks
before the start date of your assigned lab (the first date selected by your instructor for his/her reservation.)
• An email notification is automatically sent out to you when an appointment is made providing more detailed information about your
appointment and the NANSLO lab activity.
• The first time you use the scheduling system, you will also set up your scheduling system account. A username and password is
automatically generated for you.
• Write down your scheduling system USERNAME and PASSWORD so you can access your Student Dashboard.
• Use your Student Dashboard to update your appointments and click on the links to those NANSLO lab activities you’ve made
appointments posted on that dashboard to access the NANSLO lab activity on the date/time selected you selected for that appointment.
• See Scheduling a Lab – Students for information on how to set up an appointment, setting up your scheduling system account, and
scheduling additional appointments.
Making your appointment:

24 24
Instr
uctions
for
Stu
dents
Lab M
anual
Student Dashboard After creating an account in the scheduling system and making an appointment, you have access to a student dashboard.
To access your student dashboard, go to http://scheduler.nanslo.org. Select “I am a student." Enter your username and
password.*
• Access your scheduled NANSLO lab activities
on the dates and times selected;
• Modify your profile (including your
email address, if it has changed or was entered incorrectly);
• Reschedule an appointment when needed;
• Resend the appointment confirmation email; and
• Perform other miscellaneous activities.
YOU DO NOT MAKE APPOINTMENTS through this dashboard.
If you have forgotten your username or password, select "Forgot my login or password." The information will be sent to your primary email address.
Your Student Dashboard is used to:
Forgot Your Username or Password?

25 25
Instr
uctions
for
Stu
dents
Lab M
anual
Completing a Lab
• Study available NANSLO tutorials prior to the lab.
• Use the control panel to conduct the experiments.
• Record data using the functions available to collect data, create graphs, and take images.
• Copy these elements to the clipboard and then paste them into your lab reports, spreadsheets, or documents
prepared for this lab.
• On the day and time of your lab appointment, use your Student Dashboard to access the link to your appointment.
• Use the Voice Conferencing tools to dial in and communicate with team members as soon as you connect to the
laboratory. .
• Talk to the lab technicians to answer questions or help with technical issues as they are there to assist you.
• Once you have completed the steps in the laboratory, be sure you have copied and saved your data, graphs, and
images for your reports to your computer (not the lab computer.)
You are now ready to review and analyze your results more deeply. Follow the lab and your instructor’s directions
to conclude the lab report and reflect on your learning.
Typically, NANSLO lab activities reference tutorials used to walk you through the specific functions on the NANSLO web interface used to control the scientific equipment for that activity.
Steps for Success:

26 26
Instr
uctions
for
Stu
dents
Lab M
anual
Getting Help Provide information on who to contact

27 27
Instr
uctions
for
Stu
dents
Lab M
anual
Student Checklist
Preview lab, watch tutorials, videos, and pre-lab activities
Test software
Schedule lab appointment
Participate in discussions to prepare for lab
Prepare documents needed to record lab work
Review tutorials and support materials
Complete lab at appointed time
Participate in discussions through voice conferencing
Analyze data and results and complete assignment
Self-assess your learning

28
Lab A
ctivitie
s for
Surv
ey o
f C
hem
istr
y L
ab M
anual
Survey of Chemistry Lab Activities

29
Lab A
ctivitie
s for
Surv
ey o
f C
hem
istr
y L
ab M
anual
NANSLO Survey of Chemistry Introduction Survey of Chemistry introduces students to basic chemistry concepts. Students learn how to use scientific
measurements, convert measurements, connect real world applications to chemical principles learned, use the
scientific method tin forming hypotheses, collecting data, interpreting data, and validating and modifying
hypotheses, use basic laboratory equipment that supports theoretical principles presented, and prepare laboratory
reports.
The NANSLO lab activities included here build on the skills introduced in the Survey of Chemistry course by
providing students an opportunity to demonstrate competency in these areas.
Objectives:
• Use scientific measurements and convert measurements.
• Apply the scientific method when completing lab activities.
• Use the scientific equipment appropriately when working
on lab activities.
• Demonstrate improvement in learning through pre- and
post-lab questions.
• Connect how lab activities performed are used in real world
applications by reviewing the examples provided.

30
Lab A
ctivitie
s for
Surv
ey o
f C
hem
istr
y L
ab M
anual
Lab Descriptions The Survey of Chemistry Lab Manual contains ten lab activities for you to complete all included in
this Survey of Chemistry Lab Activities section of this Manual. As a guide, the icons shown here
appear on all pages applicable to material included for each of these lab activity.
Measurement
Pages: 33-52
Density
Pages: 53-70
Emission Spectrum
Pages: 71-92
In this lab, you will study the different types of measurements commonly used in labs, conversion between the metric and English systems, and how scientific notation is used to express large numbers. You will apply this understanding by taking remote measurements of temperature and volume of a fish tank.
In this lab, you will explore how to observe, measure, calculate, and compare density of solids and liquids. During this lab you will access the NANSLO lab to take measurements of a solid object to calculate its density using two different methods. You will also collect and compare qualitative data to observe how substances with different densities relate when combined.
In this lab, you will access the NANSLO lab to collect emission wavelength data to discover and compare the emission spectrum results for different chemicals.

31
Lab A
ctivitie
s for
Surv
ey o
f C
hem
istr
y L
ab M
anual
Lab Descriptions
Enzyme Kinetics
Pages: 132-155
Endothermic/Exothermic Reactions
Pages: 93-112
In this lab, you will access the NANSLO lab to observe and collect data on the processes of different salts dissolving in water to determine if there is an endothermic or exothermic result.
In this lab, you will use the NANSLO lab equipment to experiment with the effects of solute concentration and temperature on reaction rate, measured by spectrum absorption of resulting products.
Beer-Lambert Law
Pages: 113-131
In this lab, you will study the Beer-Lambert law and see first-hand how it is used for analysis.
Radiation
Pages: 156-172
In this lab, you will use the NANSLO lab equipment to measure and compare three different forms of radiation — alpha, beta, and gamma — and determine their strength based on distance and blockage by different shielding materials. In the final activity, you will use your experiment techniques and comparison data to identify an unknown type of radiation.
Reaction Rates
Pages: 173-186
The rate of a chemical reaction is the time it takes for a given amount of a reactant to change into a product. For this lab, you will observe how reaction conditions change the rate of reaction in a mixture of Alka-Seltzer tablets and water.
Acid/Base Titration
Pages: 187-203
Titration is a procedure to analyze a substance for particular compounds and their concentrations. In this lab, you will use remote acid/base titration lab equipment to determine the concentration (molarity) of acid in a sample solution.

32
Lab A
ctivitie
s for
Surv
ey o
f C
hem
istr
y L
ab M
anual
Lab Descriptions
Membrane Diffusion
Pages: 204-224
Diffusion is a process where molecules disperse from areas of high concentration to areas of low concentration to establish equilibrium. In this lab, you will experiment with the rate of diffusion across a membrane. A spectrophotometer will be used to track the diffusion of iodine across a membrane. This is accomplished by measuring the light absorbed by the dark color of iodine as it reacts in the starch solution on the other side of the membrane. You will be setting up trials using different temperatures to find the impact of heat on the rate of diffusion.

33
Lab A
ctivitie
s for
Surv
ey o
f C
hem
istr
y L
ab M
anual
Lab Description:
Purpose:
Essential Question:
Objectives:
Measurement
In this lab, you will study the different types of measurements commonly used in labs, conversion between the metric and English
systems, and how scientific notation is used to express large numbers You will also learn to apply this understanding by taking remote
measurements of temperature and volume of a fish tank.
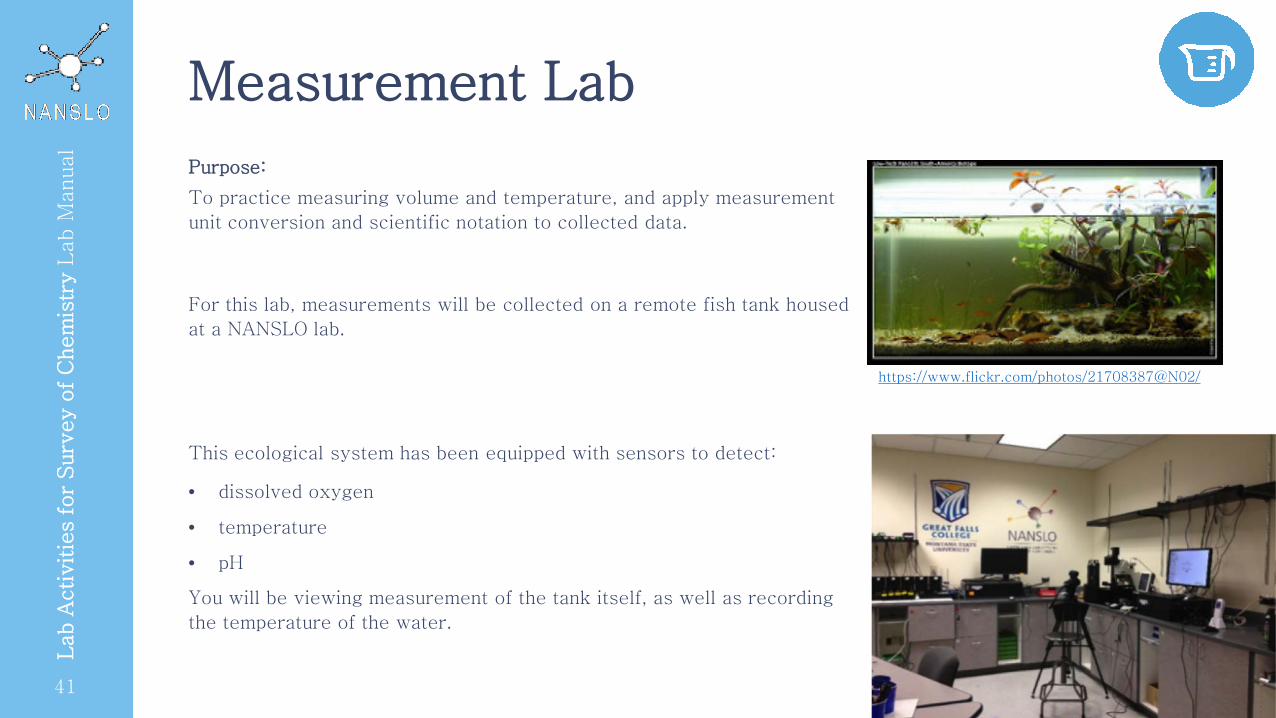
To practice measuring volume and temperature, and apply
measurement unit conversion and scientific notation to
collected data.
How is measurement used to record data in chemistry?
At the completion of this lab, you should be able to:
1. Identify units of measurement for temperature, volume,
mass, and length in metric and English (Imperial) systems.
2. Convert measurements between the metric and English
units.
3. Use the NANSLO lab equipment to take length and
temperature measurements.
4. Calculate volume in both metric and standard units.
5. Convert temperature between metric and standard units.
6. Express numbers using scientific notation.

34
Lab A
ctivitie
s for
Surv
ey o
f C
hem
istr
y L
ab M
anual
Pre-Lab Questions
These pre-lab questions are to help you think about the measurement lab and self-assess what you know and what
you want to know about the topic. By the end of the lab, you should be able to answer these questions in more
detail. Compare your answers to see what you have learned.
1. What is the difference between the metric and English (Imperial) system of measurement?
2. Why is the metric system applied to science investigations?
3. How are units converted between the two systems?
4. How is volume measured?
5. What is the difference between mass and weight?
6. What is scientific notation and how is it used?

35
Lab A
ctivitie
s for
Surv
ey o
f C
hem
istr
y L
ab M
anual
Background Information
There are 4 basic types of measurements: length, volume, temperature, and mass. There are two main systems of
measurement: the English (or Imperial) system and the metric system. The US and the UK are the main users of the
English system, while the rest of the world primarily uses the metric system. You will need to become comfortable
with conversions within and between the two systems. Since the metric system is a base 10 system, you can make
conversions by moving the decimal to the left or right. If you know the prefix and the base unit, you can multiply or
divide. For instance, to convert from centimeters to meters, jump two to the left, e.g., 360 centimeters is equal to
3.6 meters.

36
Lab A
ctivitie
s for
Surv
ey o
f C
hem
istr
y L
ab M
anual
Background Information The English (or Imperial) system is not so user friendly. To convert from one unit to another, you need to know the
conversion factor. For instance, to go from inches to feet you need to know that there are 12 inches in 1 foot. So,
to convert 360 inches to feet, use the conversion factor of 12 inches = 1 foot
Measuring Length: In the metric system, length has a base unit of meter (m).
Measuring Volume: The base unit for volume is liter. One liter is equivalent to 1 cubic decimeter, which is 1
decimeter x 1 decimeter x 1 decimeter. Volume is really a combination of three length measurements (length x
width x height).
Measuring Temperature: Temperature can be measured in Fahrenheit °F or Celsius °C. In most science labs,
temperature is measured using the Celsius scale. It is called a centigrade thermometer because there are 100
(centi) divisions, i.e., degrees between freezing of water at 0° C and the boiling point of water at 100° C. In
Fahrenheit, freezing is 32° F and boiling is 212° F, which is 180 divisions.
To convert between °F and °C, do the following:
From °F to °C: 1) Subtract 32° from °F. 2) Multiply by 5. 3) Divide by 9.
From °C to °F: 1) Multiply °C by 9. 2) Divide by 5. 3) Add 32.

37
Lab A
ctivitie
s for
Surv
ey o
f C
hem
istr
y L
ab M
anual
Background Information
Measuring Mass:
Grams are the base unit of mass in the metric system, and mass measures the amount of matter in an object. Mass
does not change. Weight, on the other hand, which is commonly mistaken for mass, varies based on gravity. A
person’s weight is less on the moon than on earth because of gravitational forces, while the mass is always the
same. Typically, a digital balance or a triple weight balance is used to measure mass. A digital balance works by
tarring, or starting, at zero point and then weighing the object that is placed on the top of the detector. A triple
weight balance works by using counterbalance to find the weight that corresponds to the object being measured.
The metric base unit of weight is gram (g) while the SI base unit is pound (lb) or ounce (oz).
Scientific notation is a way to refine very large or very small numbers. It makes data easier to record and compare
to other numbers. For instance, the number 320000033994 is a very long number that would take you a minute to
say accurately. Adding commas helps — 320,000,033,994 — but it would still probably take a minute to come up
with “three hundred and twenty quadrillion, thirty-three thousand, nine hundred and ninety-four.” If we were
collecting data and had to compare two of these numbers, say 444430000 to 320000033994, would that be an easy
task to do? It can be done, but it takes some time. At a quick glance, it would be tough to say which one is bigger or
smaller. Scientific notation can help. 4.44 x 10⁹ vs. 3.2 x 10¹¹ is easier to compare. Scientific notation is not
difficult, but it does have a set of steps that you will need to follow.

38
Lab A
ctivitie
s for
Surv
ey o
f C
hem
istr
y L
ab M
anual
Background Information
Writing Numbers Using Scientific Notation
1. Rewrite your number and put a decimal after the first non-zero digit.
1. 1234567 will become 1.234567
2. 0.000000098765 becomes 9.8765
2. Add “x 10” to the end of the digits.
1. 1.234567 becomes 1.234567 x 10
2. 9.8765 becomes 9.8765 x 10
3. Count how many place values the decimal has moved from its original placement to its current spot. Write that
number as your exponent.
1. If the number becomes smaller when you move the decimal, the exponent will be positive.
4. 1.234567 x 10⁶
1. If the number becomes bigger when you move the decimal, the exponent will be negative.
5. 9.8765 x 10⁻⁸

39
Lab A
ctivitie
s for
Surv
ey o
f C
hem
istr
y L
ab M
anual
Background Information
Important Terms
English or Imperial system - the measurement system used in only a few countries
including the United States using feet, pounds, quarts, and seconds as standards of
measurement
mass - the property of a body that is a measure of its inertia; commonly taken as a
measure of the amount of material it contains and causes it to have weight in a
gravitational field
metric system - any decimal system of units based on the meter; for scientific purposes,
the Système International d'Unités (SI units)
scientific notation - a method for expressing a given quantity as a number having
significant digits necessary for a specified degree of accuracy, multiplied by 10 to the
appropriate power, as 1385.62 written as 1.386 × 10³
unit conversion - a multi-step process that involves multiplication or division by a
numerical factor and selection of the correct number of significant digits
volume - the amount of space occupied by a three-dimensional object, as measured in
cubic units (quarts or liters)
weight - the force with which a body is attracted toward the earth or a celestial body by
gravity and which is equal to the product of the mass and the local gravitational
acceleration
Resources Scientific Notation. Math is Fun. https://www.mathsisfun.com/numbers/scientific-notation.html Mass vs. Weight. NASA. http://education.ssc.nasa.gov/massvsweight.asp The Metric System: Units, Definitions, and History. Science Made Simple. http://www.sciencemadesimple.com/metric_system.html Volume Formulas. Math.com. http://www.math.com/tables/geometry/volumes.htm

40
Lab A
ctivitie
s for
Surv
ey o
f C
hem
istr
y L
ab M
anual
Measurement in Chemistry Chemistry is divided into five main disciplines: organic, inorganic, physical,
biochemical, and analytical. Analytical chemistry specifically involves the
development of tools and methods to identify and measure the properties of
matter.
Measurement is crucial to the scientific process in all chemistry labs; it is
the basis for study and research. The following are some common areas
where measurement is an integral part of chemistry in everyday life
products.
Pharmaceuticals
Chemists support the development of medications to treat illnesses and
conditions. You can imagine the vital role of accurate measurement in
producing, testing, and determining correct dosages for human and animal
use.
Agriculture and Food
Chemistry measurements are used to set standards for the safety and quality
of food, including detecting traces of pesticides and growth hormones, and
determining nutritional value for labeling of food products. Cooking is also a
form of chemistry and measurement, as you may have experienced when a
recipe went wrong!
Water Quality
Every water source for drinking should be tested for safety using chemical
analysis and measurement. Levels of lead and other metals, bacteria, radon,
Resources Analytical Chemistry. American Chemical Society. http://www.acs.org/content/acs/en/careers/college-to-career/areas-of-chemistry/analytical-chemistry.html Water. United States Environmental Protection Agency. http://www.epa.gov/learn-issues/learn-about-water Analytical Chemistry. UC Davis ChemWiki. http://chemwiki ucdavis edu/Core/Analytical Che
41
Lab A
ctivitie
s for
Surv
ey o
f C
hem
istr
y L
ab M
anual
Purpose:
Measurement Lab
To practice measuring volume and temperature, and apply measurement
unit conversion and scientific notation to collected data.
For this lab, measurements will be collected on a remote fish tank housed
at a NANSLO lab.
This ecological system has been equipped with sensors to detect:
• dissolved oxygen
• temperature
• pH
You will be viewing measurement of the tank itself, as well as recording
the temperature of the water.
https://www.flickr.com/photos/21708387@N02/

42
Lab A
ctivitie
s for
Surv
ey o
f C
hem
istr
y L
ab M
anual
Pre-Lab Problems
1. Convert 12 inches (in) to centimeters (cm).
2. Convert 400000 milliliters (mL) to kiloliters (kL).
3. What is the temperature in °C if the outside temperature is 43° F?
4. Evaluate your answer to #3. Is it smaller or larger than 43? Does this make sense?
5. Find a food product in your house and record the weight on the label (should be in ounces). Convert the weight to grams.
6. Convert the food weight in #5 to kilograms.
7. Compare your answers for #5 and #6. Do these make sense?
8. Write the following in scientific notation:
• 1345635000
• 477777.00000000000
• 4570000
• 0.00000000567
9. Convert the following from scientific notation to full number (i.e., normal):
• 6.789 x 10⁵
• 9.112 x 10⁻⁴
• 4.56 x 10⁷
• 8.43 x 10⁻²

43
Lab A
ctivitie
s for
Surv
ey o
f C
hem
istr
y L
ab M
anual
Variables and Controls:
Control Panel
The Control Panel is where you access the
equipment controls, collect data, and communicate
with others participating at the same time as you.
In this experiment, you will use a video camera to
view and zoom into different areas of the aquarium.
You will also use the controls to monitor the sensors
that will allow you to record temperature.
1. Temperature reading
2. pH reading
3. Dissolved oxygen reading
4. Message screen
5. Camera image
6. Camera view
7. Camera controls
8. Voice conference

44
Lab A
ctivitie
s for
Surv
ey o
f C
hem
istr
y L
ab M
anual
Tutorial
This tutorial introduces you to the lab. You will see how the equipment is set up as well as the view you will have
from your control panel. For this lab, you will be using the video camera to record measurements of the tank and
take digital and analog readings of temperature.
The demonstration shows how to control the equipment, read the settings, collect data, and collaborate with others.
Watch the tutorial a second time, immediately before your lab appointment, to refresh your memory about the
function and purpose of the different features in this lab setup.
Things to Notice / Questions:
1. What does each of the sensors monitor?
2. How will you measure the volume of the tank?
3. How will you capture and record your data?
4. How will you measure the temperature?
• Add link when available

45
Lab A
ctivitie
s for
Surv
ey o
f C
hem
istr
y L
ab M
anual
Measurement Lab Procedure
Exercise 1: Measuring length and volume
1. Using the NANSLO lab equipment, you will log in and take the indicated measurements and observations at the
times you are scheduled to take the lab.
2. Connect to the voice conferencing tool to talk with teammates and the lab technician. Look for the controls and
sensor data.
3. Use the video camera to zoom in and record the following measurements:
• What is the length of the fish tank in inches?
• What is the length of the fish tank in cm?
• What is the height of the fish tank in cm?
Exercise 2: Measuring temperature
1. Use the video camera to zoom in and read the analog thermometer in the fish tank. What is the temperature
and what are the units?
2. Use the video camera to zoom in and read the digital thermometer in the fish tank. What are the units on the
digital thermometer?

46
Lab A
ctivitie
s for
Surv
ey o
f C
hem
istr
y L
ab M
anual
Measurement Lab Procedure
Exercise 1: Measuring length and volume
1. Using the NANSLO lab equipment, you will log in and take the indicated measurements and observations at the
times you are scheduled to take the lab.
2. Connect to the voice conferencing tool to talk with teammates and the lab technician. Look for the controls and
sensor data.
3. Use the video camera to zoom in and record the following measurements:
• What is the length of the fish tank in inches?
• What is the length of the fish tank in cm?
• What is the height of the fish tank in cm?
Exercise 2: Measuring temperature
1. Use the video camera to zoom in and read the analog thermometer in the fish tank. What is the temperature
and what are the units?
2. Use the video camera to zoom in and read the digital thermometer in the fish tank. What are the units on the
digital thermometer?

47
Lab A
ctivitie
s for
Surv
ey o
f C
hem
istr
y L
ab M
anual
Lab Day Checklist
On the day of your scheduled lab, review the items on this checklist to make sure you are prepared before logging
into NANSLO.
Read and review all lab materials
Prepare and organize lab charts and recording materials
Watch the lab tutorial again as a review before the lab
Log in to your lab session – two options:
Retrieve your email from the scheduler with your appointment info or
Log in to the student dashboard and join your session by going to
http://scheduler.nanslo.org
NOTE: You cannot log in to your session before the date and start time of your
appointment. Use Internet Explorer or Mozilla Firefox.

48
Lab A
ctivitie
s for
Surv
ey o
f C
hem
istr
y L
ab M
anual
Measurement Lab Report
Exercise 1: Measuring length and volume
Use the video camera to zoom in and record the following measurements:
1. What is the length of the fish tank in inches?
2. What is the length of the fish tank in cm?
3. What is the height of the fish tank in cm?
Exercise 2: Measuring temperature
1. Use the video camera to zoom in and read the analog thermometer in the fish tank. What is the temperature and
what are the units?
2. Use the video camera to zoom in and read the digital thermometer in the fish tank. What are the units on the
digital thermometer?

49
Lab A
ctivitie
s for
Surv
ey o
f C
hem
istr
y L
ab M
anual
Measurement Lab Analysis
Exercise 1
1. Convert your answer to #1 to cm.
2. Convert your answer to #2 to inches.
3. Do your conversions match your measurements above? Why or why not?
4. What is the volume of the fish tank if the width (i.e., depth) is 20 cm?
5. Convert the volume to liters and gallons.
6. Write your answer in scientific notation.
Exercise 2
1. Convert your answer to #1 to °F.
2. Go back through and convert all of your measurements and your analysis to scientific notation. Put these next
to your original answers.
3. Imagine you have been made the ruler of a new island and your first mandate is to pick a units system to adopt
for your new nation. Which system would you choose and why?

50
Lab A
ctivitie
s for
Surv
ey o
f C
hem
istr
y L
ab M
anual
Reviewing Results
1. How accurate was the data you collected? How do you know?
2. How might an accurate record of temperature be important in a fish tank?
1. What other types of measurements would a biologist be interested in collecting in a fish tank ecosystem? List at
least six.
1.
2.
3.
4.
5.
6.

51
Lab A
ctivitie
s for
Surv
ey o
f C
hem
istr
y L
ab M
anual
Conclusion and Reflection
Write a thoughtful conclusion to the lab, answering the essential question: How is measurement used
to record data in chemistry?

52
Lab A
ctivitie
s for
Surv
ey o
f C
hem
istr
y L
ab M
anual
Post-Lab Questions
Answer the following questions as completely as possible. Use evidence from your lab to help support answers
where possible. Use these questions to demonstrate your learning. You may want to review your pre-lab answers
and see what you have gained in understanding.
1. What is the difference between the metric and English (Imperial) systems of measurement?
2. Why is the metric system applied to science investigations?
3. How are units converted between the two systems?
4. How is volume measured?
5. What is the difference between mass and weight?
6. What is scientific notation and how is it used?

53
Lab A
ctivitie
s for
Surv
ey o
f C
hem
istr
y L
ab M
anual
Lab Description:
Purpose:
Essential Question:
Objectives:
Density
In this lab, you will explore how to observe, measure, calculate, and compare density of solids and liquids. You will access the
NANSLO lab to take measurements of a solid object to calculate its density using two different methods. You will also collect and
compare qualitative data on how substances with different densities relate when combined.
To explore the concept of density and use qualitative and
quantitative methods to study how objects and liquids with
different densities interrelate.
What are two ways to determine the density of substances, and
how is knowing density important in chemistry?
At the completion of this lab, you should be able to:
1. Define density.
2. Use the remote NANSLO equipment to take measurements
and make observations related to density.
3. Identify the units used in density measurements.
4. Demonstrate two ways to quantitatively measure density.
5. Describe how qualitative observations can be used to
compare densities.
6. Describe an application of density in chemistry.

54
Lab A
ctivitie
s for
Surv
ey o
f C
hem
istr
y L
ab M
anual
Pre-Lab Questions
These pre-lab questions are to help you think about the density lab and self-assess what you know and what you
want to know about the topic. By the end of the lab, you should be able to answer these questions in more detail.
Compare your answers to see what you have learned.
1. What is the difference between density and mass, and how are the two related?
2. What do you need to know in order to calculate the density of a solid object?
3. How might you measure the volume of an irregular shaped object, such as a rock?
4. How is volume related to density?
5. If you know the volume and density of an object, what else can you determine?
6. A block of wood has a mass of 50 g and occupies a volume of 0.4 L. What is the density?
7. An unknown object made of a single material has a mass of 79 g and occupies 10 mL. How can
you determine the unknown material?

55
Lab A
ctivitie
s for
Surv
ey o
f C
hem
istr
y L
ab M
anual
Background Information
All matter has mass and volume.
Volume is the amount of space an object occupies and is measured by units
such as liters (L), gallons (gal), cubic centimeters (cm3), cubic meters (m3), or
cubic feet (ft3).
Mass is the amount of matter an object has.
Density is the amount of mass divided by the volume of the object or D = M
/ V Where M is mass, V is volume, and D is density.
• Density is measured in units of mass divided by volume. For example,
grams per milliliter.
• Mass and volume can be different in two objects, but if they are made of the
same material their densities will be equivalent.
• Density is a physical property of a material and can be used to compare
objects and identify unknowns.
Resource
Density Calculations – Chemistry Tutorial. TheChemistrySolution.
https://www.youtube.com/watch?v=REtBibhIqfo
Solid Density g/c3
Lead 11.37
Silver 10.57
Copper 8.92
Brass 8.90
Nickel 8.57
Iron 7.90
Aluminum 2.67
Marble 2.60-2.84
Granite 2.65
Rubber 1.10-1.19
Oak 0.80
Pine 0.35-0.50

56
Lab A
ctivitie
s for
Surv
ey o
f C
hem
istr
y L
ab M
anual
Background Information
Quantitative Measurement
To calculate density, you need to measure the mass and volume of the specimen.
Volume: Liquid is measured using a standard graduated cylinder or pipette. With a solid cube or rectangular object,
simply measure the length x width x height. If an object is not a regular shape, how can you find the volume? Say
you pick up a rock and you want to measure its density. The mass is straightforward — you would use a scale —
but the volume would be trickier. One way to figure out volume is to use displacement. Take a container of water
with a known volume and drop the rock in. The level of water will rise as the rock takes up space. The difference
between the volume of the water with and without the rock is the volume of the rock itself. With the volume and
mass known, you can calculate for the unknown density by applying D = M / V.
Qualitative Observations
Talk show host David Letterman used to feature a science segment called “Will it Float.” It used the principles of
density and buoyancy to determine whether an object placed in water would float. Less dense items will float and
more dense items will sink. This is qualitative data and relies on observation rather than knowing or calculating the
actual density of material. This lab will look at density qualitatively and quantitatively.

57
Lab A
ctivitie
s for
Surv
ey o
f C
hem
istr
y L
ab M
anual
Density Applications Density has many applications in the sciences, including chemistry.
Researchers are continually looking at ways to measure the density of
different types of matter, even at the cellular level. For example, some of
the current research includes development of ways to measure density of
radicals in plasma in order to study tissue regeneration and targeted
treatment effects in medicine. Scientists are working on a way to measure
the density of a single cell by a method called buoyant mass. This would
provide new insight into cellular processes and research at the cellular level.
Other important applications include the density comparisons of:
• different types of fuel for assessment of heat produced
• different metals to determine content and percentages
• beverages to determine amount of sugars or alcohol
• saltwater to determine changing concentrations
• carbon dioxide to track climate change
Resources How Can the Study of Density Be Used in the Real World? GlobalPost. http://everydaylife.globalpost.com/can-study-density-used-real-world-41598.html Density and Volume - Real-life Applications. Science Clarified. http://www.scienceclarified.com/everyday/Real-Life-Chemistry-Vol-3-Physics-Vol-1/Density-and-Volume-Real-life-applications.html Density. ScienceDaily. https://www.sciencedaily.com/terms/density.htm
https://www.flickr.com/photos/la_riviere/ cropped

58
Lab A
ctivitie
s for
Surv
ey o
f C
hem
istr
y L
ab M
anual
Purpose:
Density Lab
To explore the concept of density and use qualitative and quantitative
methods to study how objects and liquids with different densities
interrelate.
For this lab, measurements will be collected on a remote fish tank housed
at a NANSLO lab.
This ecological system has been equipped with sensors to detect:
• dissolved oxygen
• temperature
• pH
You will be viewing measurement of the tank itself, as well as recording
the temperature of the water.
https://www.flickr.com/photos/21708387@N02/

59
Lab A
ctivitie
s for
Surv
ey o
f C
hem
istr
y L
ab M
anual
Variables and Controls:
Control Panel The Density Lab Control Panel is where you access the
equipment controls, collect data, and communicate with
others participating at the same time as you.
In this experiment, you will use the camera to zoom into the
setup and take measurements and make observations.
There are four beakers labeled 1-4. During Exercise 2, you
will be using the burettes to add specified amounts of water
to the beakers.
1. Selection of beaker
2. Acid tank
3. Base tank
4. Burettes
5. Temperature reading
6. pH reading
7. Volume
8. Message screen
9. Camera image
10.Camera view
11.Camera controls
12.Voice conference

60
Lab A
ctivitie
s for
Surv
ey o
f C
hem
istr
y L
ab M
anual
Tutorial
This tutorial introduces you to the density lab. You will see how the equipment is set up as well as the view you will
have from your control panel. For this lab, you will be using the video camera to record measurements of the tank
and take digital and analog readings of temperature.
The demonstration shows how to control the equipment, read the settings, collect data, and collaborate with others.
Watch the tutorial a second time, immediately before your lab appointment, to refresh your memory about the
function and purpose of the different features in this lab setup.
Things to Notice / Questions:
1. How do you join the voice conference?
2. How do you measure a rubix Cube?
3. How can you view a close-up of each beaker?
4. What steps do you take to add water?
5. How do you allow others to take over the controls?
• Add link when available

61
Lab A
ctivitie
s for
Surv
ey o
f C
hem
istr
y L
ab M
anual
Density Lab Procedure Exercise 1: Determine the density of a cube quantitatively
1. Using the NANSLO interface, zoom in on the rubix cube. Measure the height and width of the cube. Assume the
depth is equivalent to the height. Record in your lab report.
2. Read the measurement on the balance setup with the cube. Record in your lab report.
3. Read the volume measurement of the liquid in Beaker 1. Ask the lab technician to add the cube. Read the
volume measurement again. Add this data to your lab report.
Exercise 2: Comparison of density qualitatively
1. Using the NANSLO titration setup, zoom in on Beaker 2. Beaker 2 contains vegetable oil with red food coloring
and another substance (a metal bolt). Record what you see in Beaker 2.
2. Using the titration setup, add 10 mL of water to Beaker 2. Record your observations in your lab report.
3. Move to Beaker 3, which contains corn syrup and another substance (a ping pong ball). Record what you
observe in Beaker 3.
4. Using the titration setup, add 10 mL of water to Beaker 3. Record your observations in your lab report.
5. Move to Beaker 4, which contains vegetable oil, corn syrup, and the two other substances you identified in
Beakers 2 and 3. Record your observations in your lab report.
6. Again add 10 mL of water to the system and record your observations in your lab report.

62
Lab A
ctivitie
s for
Surv
ey o
f C
hem
istr
y L
ab M
anual
Lab Day Checklist
On the day of your scheduled lab, review the items on this checklist to make sure you are prepared before logging
into NANSLO.
Read and review all lab materials
Prepare and organize lab charts and recording materials
Watch the lab tutorial again as a review before the lab
Log in to your lab session – two options:
Retrieve your email from the scheduler with your appointment info or
Log in to the student dashboard and join your session by going to
http://scheduler.nanslo.org
NOTE: You cannot log in to your session before the date and start time of your
appointment. Use Internet Explorer or Mozilla Firefox.

63
Lab A
ctivitie
s for
Surv
ey o
f C
hem
istr
y L
ab M
anual
Density Lab Report Exercise 1: Determine the density of a cube quantitatively
1. Rubix Cube: Measure the height and width of the cube (assume the depth is equivalent to the height)
2. Mass of cube: ____________ units: ___________
3. Beaker 1: Volume displacement
Dimension Measurement Units
Height
Depth
Length
Beaker 1 Starting Volume
Ending Volume
Unit
Height
Depth
Length

64
Lab A
ctivitie
s for
Surv
ey o
f C
hem
istr
y L
ab M
anual
Density Lab Report Exercise 2: Qualitative comparison of density
1. Beaker 2 contains vegetable oil with red food coloring and a metal bolt. Record what you see in Beaker 2.
2. Using the titration setup, add 10 mL of water to Beaker 2. Record your observations.
3. Beaker 3 contains corn syrup and a ping pong ball. Record what you observe in Beaker 3.
4. Using the titration setup, add 10 mL of water to Beaker 3. Record your observations in your lab report.

65
Lab A
ctivitie
s for
Surv
ey o
f C
hem
istr
y L
ab M
anual
Density Lab Report Exercise 2: Qualitative comparison of density
5. Beaker 4 contains vegetable oil, corn syrup, and the two other substances you identified in Beakers 2 and 3.
Record your observations in your lab report.
6. Again add 10 mL of water to the system and record your observations in your lab report.

66
Lab A
ctivitie
s for
Surv
ey o
f C
hem
istr
y L
ab M
anual
Density Lab Analysis Exercise 1
1. Calculate the volume of the cube from your measurements. ______________ units ________
2. Using the mass measurement from procedure step 2, calculate the density ______________ units ________
3. If the volume in the beaker started at 100 mL, what is the volume measurement from the liquid displaced?
_________ mL
4. Do your values from #1 and #2 match? If not, provide a reason they may not.
Exercise 2
1. Draw a diagram comparing what you saw in Beakers 2, 3, and 4. Label your drawing.

67
Lab A
ctivitie
s for
Surv
ey o
f C
hem
istr
y L
ab M
anual
Density Lab Analysis
1. For each beaker, make a list of the items in it after the water was added and create a list of materials listing
them from least dense to most dense.
2. Imagine someone takes a deep breath and jumps into a swimming pool. He immediately floats. Is he more or
less dense than water?
3. If the same swimmer goes underwater and breathes out the air in his lungs as bubbles, he starts to sink.
Speculate on why the same person will float in the above situation and sink in this one.
4. Identify an instance where density can be used in everyday life.

68
Lab A
ctivitie
s for
Surv
ey o
f C
hem
istr
y L
ab M
anual
Reviewing Results
Write a review of your experiment. Include your findings and an explanation of your results.

69
Lab A
ctivitie
s for
Surv
ey o
f C
hem
istr
y L
ab M
anual
Conclusion and Reflection
Write a thoughtful conclusion to the lab, answering the essential question: What are two ways to
determine the density of substances, and how is knowing density important in chemistry?

70
Lab A
ctivitie
s for
Surv
ey o
f C
hem
istr
y L
ab M
anual
Post-Lab Questions
Answer the following questions as completely as possible. Use evidence from your lab to help support answers
where possible. Use these questions to demonstrate your learning. You may want to review your pre-lab answers
and see what you have gained in understanding.
1. What is the difference between density and mass, and how are the two related?
2. What do you need to know in order to calculate the density of a solid object?
3. How might you measure the volume of an irregular shaped object, such as a rock?
4. How is volume related to density?
5. If you know the volume and density of an object, what else can you determine?
6. A block of wood has a mass of 50 g and occupies a volume of 0.4 L. What is the density?
7. An unknown object made of a single material has a mass of 79 g and occupies 10 mL. How can
you determine the unknown material?

71
Lab A
ctivitie
s for
Surv
ey o
f C
hem
istr
y L
ab M
anual
Lab Description:
Purpose:
Essential Question:
Objectives:
Emission Spectrum Lab
In this lab, you access the NANSLO lab to collect emission wavelength data to discover and compare the emission
spectrum results for different chemicals.
To determine the wavelength and frequency of light emitted
from a substance in order to help ascertain its chemical
makeup.
How can emission spectra be used to study the makeup of a
substance, and how does this apply to chemistry?
At the completion of this lab, you should be able to:
1. Measure the emission spectrum of a source of light using the
digital spectrometer.
2. Find the wavelengths at a peak of intensity.
3. Determine where these wavelengths lie on the electromagnetic
spectrum.
4. Calculate the frequency of each peak wavelength.
5. Calculate the intensity of each peak wavelength.
6. Compare and contrast the spectra of various light sources.
7. Explain how emission spectra are used to identify elements or
molecules.

72
Lab A
ctivitie
s for
Surv
ey o
f C
hem
istr
y L
ab M
anual
Pre-Lab Questions
These pre-lab questions are to help you think about the emission spectrum lab and self-assess what you know and
what you want to know about the topic. By the end of the lab, you should be able to answer these questions in more
detail. Compare your answers to see what you have learned.
1. What is an emission spectrum?
2. How is the spectrum related to chemical composition?
3. How can you find the wavelength using a spectrometer?
4. How can you calculate intensity with a known frequency and wavelength?
5. How can emission spectra be used to identify elements or molecules?
6. Explain why higher frequency waves are more dangerous.

73
Lab A
ctivitie
s for
Surv
ey o
f C
hem
istr
y L
ab M
anual
Background Information
Important Terms
amplitude - the absolute value of the height of a wave from the midline to the crest; symbol: a
emission spectrum - the spectrum formed by electromagnetic radiation emitted by a given source, characteristic of
the source and the type of excitation inducing the radiation
frequency - the number of cycles or completed alternations per unit of time of a wave or oscillation; symbol: f
nanometer - one billionth of a meter (nm)
photoelectric effect - the phenomenon in which the absorption of electromagnetic radiation, as light, of sufficiently
high frequency by a surface, usually metallic, induces the emission of electrons from the surface
photon - a quantum of electromagnetic radiation, usually considered as an elementary particle, that is its own
antiparticle and that has zero rest mass and charge and a spin of one; symbol: γ
wavelength - the distance, measured in the direction of propagation, between two points of the same phase in
consecutive cycles of a wave; symbol: λ

74
Lab A
ctivitie
s for
Surv
ey o
f C
hem
istr
y L
ab M
anual
Background Information It’s taken many years and much debate for scientists to agree on the shape and
properties of the atom. In 1803, John Dalton was the first chemist to publish the
idea that all matter is made up of atoms. Although many of Dalton’s theories were
correct, his atomic model was not as evolved as the atom we know today. Dalton
thought that an atom was a solid, indivisible ball, without electrons or a nucleus.
In 1879, J. J. Thomson, a physicist, discovered the existence of electrons by using
a cathode ray tube. He also discovered that the same element could have different
atomic weights, now called isotopes. Thomson’s atomic model, also known as the
plum pudding model, edged closer to the model of today, but he thought that
electrons were positioned all throughout the atom with a cloud of positive charge
surrounding them.
To see if Thomson’s model was correct, in 1911 Ernest Rutherford used his
famous gold foil experiment to fire radioactive particles through gold foil at zinc
sulfide. If Thompson was correct, the particles should have gone straight through
the foil, but they did not. While most made it through, some shot off in different
directions. This could only mean that an atom was made up of mainly empty
space. Rutherford came to the conclusion
that the atom was actually a mix of both Dalton’s and Thomson’s atomic models.
The atom had a solid center, called the nucleus, which contained the protons and
neutrons. The electrons were in orbitals around the nucleus, with the majority of

75
Lab A
ctivitie
s for
Surv
ey o
f C
hem
istr
y L
ab M
anual
Background Information Light can act as both a wave and a particle, as discovered by Albert
Einstein in 1905. He stated that light is not actually a continuous wave,
but rather a collection of wave packets, or photons, that have a certain
amount of energy. Since the discovery of a wave’s ability to act like
particles, it has also been discovered that subatomic particles can act like
waves. This means that if an electron were to be dislodged from its
orbital after being hit with a photon, it would gain energy. The electron
would then fall back into its original orbital and give off that photon in the
form of light. Because different frequencies have higher and lower
energy levels, they can raise the electron into different level orbitals.
This photoelectric effect is defined as the ability for light to dislodge
electrons from their orbits in certain metals, creating a current.
There are electrons in many different orbitals around an element, and
there are many different orbitals for them to rise to once they are hit by
photons. This means that when the electron falls back into place, there
are many different frequencies, or colors, that are emitted by the
element. All elements have electrons circling their nuclei in different
orbitals. Where an element is on the periodic table determines the type of
orbital the outermost electrons are traveling in. Each element and
molecule have distinct patterns of color that they emit. This allows us to
identify an element or molecule by looking at the visible light it gives off.

76
Lab A
ctivitie
s for
Surv
ey o
f C
hem
istr
y L
ab M
anual
Background Information Electromagnetic waves are responsible for visible light, radio waves, and X-rays. James Maxwell, a Scottish
mathematical physicist, discovered the electromagnetic field by recognizing the relationship between
electricity and magnetism. All waves have certain properties. A wavelength (λ) is the distance between two
identical points on a wave, typically measured at the crest, or the highest point. Amplitude (a) is the absolute
value of the height of a wave from the midline to the crest. Frequency (f) is how many times a wave passes a
certain point in time. Typically, frequency is measured in one-second intervals, or hertz (Hz). Therefore, 1 Hz
is equivalent to 1 wave per second. Wavelength and frequency have an inverse relationship, meaning the
higher the frequency the shorter the wavelength. The higher the frequency and the shorter the wavelength,
the greater the amount of energy contained in a wave.

77
Lab A
ctivitie
s for
Surv
ey o
f C
hem
istr
y L
ab M
anual
Background Information
This explains why red light, no matter how bright, will not produce a current, but even dim blue light will. If
light was only a wave, the brightness of the light would affect how much of a current is created because there
is more energy in the wave; in reality, it does not. Red light does not have enough energy per photon to
dislodge an electron, while blue light does.
In this lab, you will be exploring emission spectroscopy, which involves the examination of the wavelengths of
photons discharged by atoms and molecules as they transit from a high energy state to a low energy state. As
this happens, a set of wavelengths are emitted by each element or molecule depending on its electronic
structure. A study of these wavelengths is used to identify the unique elemental structure of the substance.
Resources
The Atomic Hydrogen Emission Spectrum. ChemGuide.
http://www.chemguide.co.uk/atoms/properties/hspectrum.html
Atomic Emission Spectroscopy. Chemistry Learner.
http://www.chemistrylearner.com/atomic-emission-spectroscopy.html
Atomic Spectra. UC Davis ChemWiki.
http://chemwiki.ucdavis.edu/Core/Physical_Chemistry/Quantum_Mechanics/09._The_Hydrogen_Atom/Atomic_
Theory/Electrons_in_Atoms/Atomic_Spectra

78
Lab A
ctivitie
s for
Surv
ey o
f C
hem
istr
y L
ab M
anual
Emission Spectrum Applications
Chemical Makeup of Stars
Spectroscopy is widely used in astronomy to learn about the makeup of distant stars
and galaxies. Each element emits or absorbs light at characteristic wavelengths.
Astronomers can identify the element makeup of stars from the lines in their spectra
seen from celestial bodies light-years away.
Spectrum Emission Study in Forensics
Studying the emission spectra of shots from various guns, chemists can detect
characteristic factors to help forensic experts determine factors such as the site of a
gunshot injury, presence of obstacles, distance, and order of the shot.
Resource
Spectra School. Learn Chemistry, Royal Society of Chemistry.
http://www.rsc.org/learn-
chemistry/collections/spectroscopy/introduction#Introduction

79
Lab A
ctivitie
s for
Surv
ey o
f C
hem
istr
y L
ab M
anual
Emission Spectrum Lab
Purpose: To determine the wavelength and frequency of light emitted
from a substance to help ascertain its chemical makeup.
Spectroscopy involves the examination of the wavelengths of photons
discharged by atoms and molecules when changing from a high energy
state to a low energy state. This characteristic set of wavelengths
depends on the electronic structure of the atoms that make up the
substance.
In this lab, you will be viewing five samples heated by lamps. You will
study a graphic display screen that shows the wavelength and intensity of
light emitted. From this data, you will determine the peak wavelengths of
light for each sample. The lab report and analysis sections of the lab will
guide you to make further calculations, which you can use to make
comparisons between the samples.

80
Lab A
ctivitie
s for
Surv
ey o
f C
hem
istr
y L
ab M
anual
Pre-Lab Problems The energy of a photon is directly proportional to the frequency of the electromagnetic radiation involved.
The equation used to calculate the amount of energy in a photon is: E = hv • E = energy (J) • h = Planck’s constant (6.62607 x 10⁻³⁴ J·s) • v = frequency (measured in s-1, or hertz)
The equation to calculate wavelength, frequency, or energy: c = λv
Wavelength and frequency are inversely related.
• c = speed of light (299,792,458 m/s) • λ = wavelength (typically measured in nanometers) • v = frequency (measured in s-1, or hertz)
By using these two equations, it is possible to calculate the wavelength, frequency, or energy of a photon.
1. Determine the type of wave based on its wavelength or frequency, below. If visible light, determine the color.
(Note: Make sure to check units. Wavelength could be in either meters or nanometers. You must convert between the two.)
① Frequency of 1013 Hz
② Wavelength of 10-13 m
③ Wavelength of 530 nm
④ Frequency of 10-9 Hz
⑤ Wavelength of 100 nm
2. A laser emits a light with a frequency of 4.70 x 10¹¹ Hz. Determine the wavelength in nm.
3. A light is found to have energy of 3.18 x 10⁻¹⁹J. What is the wavelength (nm) and frequency (Hz) of the wave?
Resources Wavelength/Energy Practice Problems. Basic Chemistry from a Mad Scientist. https://drmadscientist.wordpress.com/2013/06/24/wavelengthpracticeproblems/ Two Equations Governing Light’s Behavior: Part Two. ChemTeam. http://www.chemteam.info/Electrons/LightEquations2.html Calculate the Wavelength When Given the Frequency. ChemTeam. http://www.chemteam.info/Electrons/calc-wavelength-given-freq.html Calculating Energy of a Photon. https://www.youtube.com/watch?v=ITna7F7fG0Q

81
Lab A
ctivitie
s for
Surv
ey o
f C
hem
istr
y L
ab M
anual
Variables and Controls:
Control Panel
The Emission Spectrum Control Panel is where you
access the equipment controls, collect data, and
communicate with others participating at the same
time as you.
In this experiment, you will have five light sources
labeled A-E.
Your job will be to determine the optimum
wavelengths emitted for each of these light samples.
1. Voice conference
2. Start/pause
3. Light selector
4. Lamp status
5. Wavelength field
6. Intensity field
7. Nudge positioning
8. Spectrum graph
9. Graph selection/zoom controls
10. Spectrograph
11. Light sources
12. Camera position controls
13. User controls
14. Camera selection

82
Lab A
ctivitie
s for
Surv
ey o
f C
hem
istr
y L
ab M
anual
Tutorial
This tutorial introduces you to the spectrometer used in this lab. You will see how the equipment is set up as well
as the view you will have from your control panel. The demonstration shows how to control the equipment, read the
settings, collect data, and collaborate with others. Watch the tutorial a second time, immediately before your lab
appointment, to refresh your memory about the function and purpose of the different features in this lab setup.
Things to Notice / Questions:
• What might be the cause if you can see, but can’t
operate, the controls?
• How do you change light sources?
• What are you looking for? How are you finding the
information you need?
• If you don’t see vertical change in the lines of the
graph, what could be the cause?
• How do you ask for assistance?
• http://www.wiche.edu/nanslo/lab-tutorials#emissionspec

83
Lab A
ctivitie
s for
Surv
ey o
f C
hem
istr
y L
ab M
anual
Lab Procedure
1. Using the NANSLO lab equipment, you will log in and perform the indicated activity measurements at the time
you are scheduled to take the lab. Feel free to “play around” a little to get comfortable with the equipment
before you begin.
2. Be sure to start the spectrometer, so you can view the spectra when the lamps are energized.
3. Use the camera to zoom in on each emission lamp and read the labels to determine what gas is in each one.
4. Use the nudge right and nudge left robot controls to position the fiber optic cable for the spectrometer.
5. While viewing each spectrum, use the cursor to find the wavelength of the three most intense peaks for each of
the gases. Record these in the table in your lab report.
6. Also, while each lamp is glowing, zoom in close with the camera and see what color it appears to be. Record
this observation in the table.
7. Repeat these measurements for all five lamps.

84
Lab A
ctivitie
s for
Surv
ey o
f C
hem
istr
y L
ab M
anual
Lab Day Checklist
On the day of your scheduled lab, review the items on this checklist to make sure you are prepared before logging
into NANSLO.
Read and review all lab materials
Prepare and organize lab charts and recording materials
Watch the lab tutorial again as a review before the lab
Log in to your lab session – two options:
Retrieve your email from the scheduler with your appointment info or
Log in to the student dashboard and join your session by going to
http://scheduler.nanslo.org
NOTE: You cannot log in to your session before the date and start time of your
appointment. Use Internet Explorer or Mozilla Firefox.

85
Lab A
ctivitie
s for
Surv
ey o
f C
hem
istr
y L
ab M
anual
Lab Report Data
Observation notes:
Element of Molecule
Visual Color of Lamp
Peak 1 Wavelength
(nm)
Peak 2 Wavelength
(nm)
Peak 3 Wavelength
(nm) A
B
C
D
E

86
Lab A
ctivitie
s for
Surv
ey o
f C
hem
istr
y L
ab M
anual
Lab Analysis
1. Use the wavelengths you recorded and the equations in the Pre-Lab Problems section to determine the frequency and
energy of each wavelength.
2. For each lamp, you recorded data for the wavelengths of three peaks. Locate the wavelength on the visible spectrum and
determine what color it is; record it for each peak.
3. Calculate the frequency of each peak using the equations in the Pre-Lab Problems section.
4. Calculate the energy of each peak using the equations in the Pre-Lab Problems section.
5. Repeat for each lamp (A-E).
6. You will notice you did not record the data for all of the peaks in each lamp. Speculate on why each spectrum looked
different.
7. Calculate the frequency of each peak using the equations in the Pre-Lab Problems section.
8. Calculate the energy of each peak using the equations in the Pre-Lab Problems section.
9. Repeat for each lamp (A-E).
10 You will notice you did not record the data for all of the peaks in each lamp Speculate on why each spectrum looked

87
Lab A
ctivitie
s for
Surv
ey o
f C
hem
istr
y L
ab M
anual
Lab Analysis
A Element of Molecule in Lamp:_____________________________ Visual Color of Lamp: _____________________
Peak 1 Peak 2 Peak 3
Wavelength (nm)
Location of peak on visual spectrum (color)
Frequency (Hz)
Energy (J)
B Element of Molecule in Lamp:_____________________________ Visual Color of Lamp:_____________________
Peak 1 Peak 2 Peak 3
Wavelength (nm)
Location of peak on visual spectrum (color)
Frequency (Hz)
Energy (J)

88
Lab A
ctivitie
s for
Surv
ey o
f C
hem
istr
y L
ab M
anual
Lab Analysis
C Element of Molecule in Lamp:_____________________________ Visual Color of Lamp:_____________________
Peak 1 Peak 2 Peak 3
Wavelength (nm)
Location of peak on visual spectrum (color)
Frequency (Hz)
Energy (J)
D Element of Molecule in Lamp:_____________________________ Visual Color of Lamp:_____________________
Peak 1 Peak 2 Peak 3
Wavelength (nm)
Location of peak on visual spectrum (color)
Frequency (Hz)
Energy (J)

89
Lab A
ctivitie
s for
Surv
ey o
f C
hem
istr
y L
ab M
anual
Lab Analysis
E Element of Molecule in Lamp:_____________________________ Visual Color of Lamp:_____________________
Peak 1 Peak 2 Peak 3
Wavelength (nm)
Location of peak on visual spectrum (color)
Frequency (Hz)
Energy (J)

90
Lab A
ctivitie
s for
Surv
ey o
f C
hem
istr
y L
ab M
anual
Reviewing Results
Write a review of your experiment. Include your findings and an explanation of your results.

91
Lab A
ctivitie
s for
Surv
ey o
f C
hem
istr
y L
ab M
anual
Conclusion and Reflection
Write a thoughtful conclusion to the lab, answering the essential question: How can emission spectra
be used to study the makeup of a substance, and how does this apply to chemistry?

92
Lab A
ctivitie
s for
Surv
ey o
f C
hem
istr
y L
ab M
anual
Post-Lab Questions
Answer the following questions as completely as possible. Use evidence from your lab to help support answers
where possible. Use these questions to demonstrate your learning. You may want to review your pre-lab answers
and see what you have gained in understanding.
1. What is an emission spectrum?
2. How is the spectrum related to chemical composition?
3. How can you find the wavelength using a spectrometer?
4. How can you calculate intensity with a known frequency and wavelength?
5. How can emission spectrums be used to identify elements or molecules?
6. Explain why higher frequency waves are more dangerous.

93
Lab A
ctivitie
s for
Surv
ey o
f C
hem
istr
y L
ab M
anual
Lab Description:
Purpose:
Essential Question:
Objectives:
Endothermic/Exothermic Reactions
In this lab, you will access the NANSLO lab to observe and collect data on the processes of different salts
dissolving in water to determine if there is an endothermic or exothermic result.
To collect and analyze data to determine if salts added to
water produce an endothermic or exothermic reaction.
What is the difference between endothermic and exothermic
reactions, and how can this be determined when dissolving
different salts in water?
At the completion of this lab, you should be able to:
1. Describe the difference between endothermic and exothermic
reactions.
2. Provide examples of each in everyday processes.
3. Collect and analyze data using the NANSLO lab equipment.
4. Interpret graphs and data to determine if results demonstrate
endothermic or exothermic reactions.
5. Explain chemical energy factors that determine if a reaction will
be endothermic or exothermic.

94
Lab A
ctivitie
s for
Surv
ey o
f C
hem
istr
y L
ab M
anual
Pre-Lab Questions
These pre-lab questions are to help you think about the Endothermic and Exothermic Reactions lab and self-assess
what you know and what you want to know about the topic. By the end of the lab, you should be able to answer
these questions in more detail. Compare your answers to see what you have learned.
1. What is the difference between an endothermic reaction and an exothermic reaction?
2. How might you set up an experiment to see if a specific salt added to water creates an
endothermic or exothermic reaction?
3. What can you measure to determine which type of reaction is occurring?
4. What factors involved in the chemical makeup of a solute determine if it will cause an
endothermic or exothermic reaction when added to water?
5. What is an example of an exothermic reaction in everyday life?
6. What is an example of an endothermic reaction in everyday life?

95
Lab A
ctivitie
s for
Surv
ey o
f C
hem
istr
y L
ab M
anual
Background Information In a chemical reaction, reactants are changed in some way to
become products. Reactants are to the left of the arrow and
products are shown on the right of the arrow.
Any chemical reaction will involve breaking some bonds and making
new ones. Energy is needed to break bonds and is then given off
when the new bonds are formed. When those bonds are broken and
formed, the amount of energy is not equal, so some energy will be
absorbed or released during a reaction. A reaction in which heat is
given off is called exothermic.
In exothermic reactions, the products have a lower energy than the
reactants. The lost energy is given off as heat, so the surroundings
warm up. If heat energy is absorbed, the reaction is called
endothermic. The products have a higher energy than the reactants.
This energy is absorbed from the surroundings.

96
Lab A
ctivitie
s for
Surv
ey o
f C
hem
istr
y L
ab M
anual
Background Information
In order for a reaction to occur, the reactants must overcome a
barrier called activation energy to begin the reaction.
Think about riding a bicycle over a hill. To ride down the hill, you
must pedal the bike over the top to reach the other side. In an
exothermic reaction, the reactants start at the beginning energy
level, as shown in the diagram. Energy input is needed to overcome
the “energy hill” to start the reaction.
In the exothermic reaction, energy is released into the surroundings,
often in the form of heat and products. The products end up at a
lower energy level than the reactants.
In a reaction such as Alka-Seltzer and water, the activation energy is
low, and simply mixing the two provides enough kinetic energy to
start the process. The mixture heats up as the energy from the
reaction is absorbed by the water.

97
Lab A
ctivitie
s for
Surv
ey o
f C
hem
istr
y L
ab M
anual
Background Information
In an endothermic reaction, the energy hill also must be overcome,
but the energy barrier is higher and the reaction has to absorb
energy from the surroundings. In this case, enough energy is
absorbed that the products end up at a higher energy level than the
reactants at the start. The surroundings, in this case the water, give
up energy and the temperature drops.

98
Lab A
ctivitie
s for
Surv
ey o
f C
hem
istr
y L
ab M
anual
Background Information Salts are interesting examples to study when exploring the differences between endothermic and exothermic
reactions, since you can observe both processes. As salt dissolves in water, two exchanges of energy happen. In
the first, energy is necessary to pull the positively and negatively charged ions apart. This energy is called the
lattice energy.
As the water molecules surround the ions from the salt, energy is released into the solution. This energy is called
hydration energy.
Lattice Energy: Energy needed to separate ions.
Hydration Energy: Energy released as water molecules surround the ions.
Whether the dissolving of a salt in water is an exothermic or endothermic reaction depends on which energy is
larger — the lattice or the hydration. If it takes more energy to separate the ions (lattice energy) than is released
into the solution (hydration energy), the reaction will be endothermic. As opposed to the opposite conditions, in
which the hydration energy is greater than the lattice energy, which result in an exothermic reaction.
Resources Exothermic vs. Endothermic and K. UC Davis ChemWiki. http://chemwiki.ucdavis.edu/Core/Physical_Chemistry/Equilibria/Le_Chatelier's_Principle/Effect_Of_Temperature_On_Equilibrium_Composition/Exothermic_Versus_Endothermic_And_K Dissolving Salts in Water. PBS LearningMedia. http://www.pbslearningmedia.org/resource/lsps07.sci.phys.matter.dissolvesalt/dissolving-salts-in-water/

99
Lab A
ctivitie
s for
Surv
ey o
f C
hem
istr
y L
ab M
anual
Endothermic/Exothermic Reaction Examples Examples of Exothermic Reactions (processes that release energy):
• combustion (burning)
• rusting of iron
• mixing water with anhydrous salts (anhydrous salts to hydrous salts)
• mixing water with calcium chloride
• making ice cubes
• formation of snow in clouds
• condensation of water from vapor
• respiration (burning of food in body)
• synthesis (two or more simple substances forming more complex compounds, e.g., Haber Process, except photosynthesis)
Examples of Endothermic Reactions (processes that absorb energy):
• mixing water with ammonium and potassium salts (ammonium chloride dissolved in water)
• separating ion pairs
• baking food
• melting solid salts
• melting ice cubes
• evaporation of water
• dissolving hydrated salts in water
• photosynthesis

100
Lab A
ctivitie
s for
Surv
ey o
f C
hem
istr
y L
ab M
anual
Endothermic/Exothermic Lab Purpose: To collect and analyze data to determine if salts added to
water produce an endothermic or exothermic result.
The titration experiment is set up with five beakers and burettes you
control virtually to add solutions with precise measurements.
The image at right shows a close-up of the double burettes that add
the amounts you specify to the beaker.

101
Lab A
ctivitie
s for
Surv
ey o
f C
hem
istr
y L
ab M
anual
Pre-Lab Problems 1. Draw a graph showing how the temperature would change in an
exothermic reaction.
2. Classify the following examples as either exothermic or endothermic
reactions.
Example Exothermic
Reaction Endothermic
Reaction
Burning wood
Icy hot pack
Cold ice pack
Baking a cake
Making ice cream

102
Lab A
ctivitie
s for
Surv
ey o
f C
hem
istr
y L
ab M
anual
Pre-Lab Problems
3. Name the salt being added to the water below, and predict whether you
think the reaction will be endothermic or exothermic.
Example Name of Salt
Exothermic Reaction
Endothermic Reaction
H2O + NH4NO3
H2O + CaCl2
H2O + NaCl
H2O + NaHCO3
H2O + NH4Cl

103
Lab A
ctivitie
s for
Surv
ey o
f C
hem
istr
y L
ab M
anual
Variables and Controls:
Control Panel
The Control Panel is where you access the
equipment controls, collect data, and communicate
with others participating at the same time as you.
In this experiment, you will be changing beakers and
adding water to view and track the reaction of
different salts dissolving in water. This will include
monitoring and recording temperature change, as
well as capturing images of the graphs.
1. Selection of beaker
2. Acid tank
3. Base tank
4. Burettes
5. Temperature reading
6. pH reading
7. Volume
8. Message screen
9. Camera image
10.Camera view
11.Camera controls
12.Voice conference

104
Lab A
ctivitie
s for
Surv
ey o
f C
hem
istr
y L
ab M
anual
Tutorial
This tutorial introduces you to the Endothermic/Exothermic Reactions lab. You will see how the equipment is set up
as well as the view you will have from your control panel. For this lab, you will be adding water to five different
beakers to observe reactions and track temperature change.
The demonstration shows how to control the equipment, read the settings, collect data, and collaborate with others.
Watch the tutorial a second time, immediately before your lab appointment, to refresh your memory about the
function and purpose of the different features in this lab setup.
Things to Notice / Questions:
1. How do you join the voice conference?
2. What steps do you take to add water to a beaker?
3. How do you keep track of the temperature?
4. How and when do you capture an image of a
temperature graph?
5. How do you change from Beaker 1 to Beaker 2?
6. How can you view a close-up of each beaker?
• Add link when available

105
Lab A
ctivitie
s for
Surv
ey o
f C
hem
istr
y L
ab M
anual
Lab Procedure 1. Using the NANSLO lab equipment, you will log in and take the indicated measurements at the time you
scheduled to take the lab.
2. Each beaker contains 10 g of a salt. Using the equipment setup, you will add 20 mL of water to each beaker.
3. After the water is added, record the starting temperature in your lab report.
4. Record temperature over time, as the reaction progresses.
5. In your lab report, record any observations that you make while the reaction is occurring.
6. After the temperature has stabilized, take a screen shot of the temperature graph.
7. Move the apparatus to the next beaker.
8. Repeat steps 2-7 for each of the five beakers.
• Beaker 1: CaCl2 (calcium chloride)
• Beaker 2: NaCl (sodium chloride)
• Beaker 3: NaHCO3 (sodium acetate)
• Beaker 4: NH4Cl (ammonium chloride)
• Beaker 5: NH4NO3 (ammonium nitrate) + a penny and an Alka-Seltzer tablet

106
Lab A
ctivitie
s for
Surv
ey o
f C
hem
istr
y L
ab M
anual
Lab Day Checklist
On the day of your scheduled lab, review the items on this checklist to make sure you are prepared before logging
into NANSLO.
Read and review all lab materials
Prepare and organize lab charts and recording materials
Watch the lab tutorial again as a review before the lab
Log in to your lab session – two options:
Retrieve your email from the scheduler with your appointment info or
Log in to the student dashboard and join your session by going to
http://scheduler.nanslo.org
NOTE: You cannot log in to your session before the date and start time of your
appointment. Use Internet Explorer or Mozilla Firefox.

107
Lab A
ctivitie
s for
Surv
ey o
f C
hem
istr
y L
ab M
anual
Lab Report Data
Observation notes:
Beaker 1:
Beaker 2:
Beaker 3:
Beaker 4:
Beaker 5:
Beaker Beaker
Contents Starting
Temperature Ending
Temperature Time Duration
1
2
3
4
5
Complete the table using data you collect during the lab.

108
Lab A
ctivitie
s for
Surv
ey o
f C
hem
istr
y L
ab M
anual
Lab Report Data
Beaker 1: Beaker 2:
Beaker 3: Beaker 4:
Beaker 5:
Insert images of the temperature graph once each reaction has stabilized.

109
Lab A
ctivitie
s for
Surv
ey o
f C
hem
istr
y L
ab M
anual
Lab Analysis Add the following to the table below and compare your results.
1. Use the data you collected in the table to calculate the change in temperature (temperature final minus
temperature starting). Make sure you indicate if it is an increase (+) or a decrease (-).
2. Identify each reaction as endothermic or exothermic.
Beaker
Beaker Contents
Starting Temperature
Ending Temperature
Time Duration Change in
Temperature Endothermic or
Exothermic? 1
2
3
4
5

110
Lab A
ctivitie
s for
Surv
ey o
f C
hem
istr
y L
ab M
anual
Reviewing Results
Write a review of your experiment. Include your findings and an explanation of your results. Then
answer the following questions.
1. Which reaction absorbed the most heat? Support your answer with data from your activity.
2. Which reaction released the most heat? Support your answer with data from your activity.
3. What affect do you think the penny and Alka-Seltzer tablet had on the reaction in Beaker 5?

111
Lab A
ctivitie
s for
Surv
ey o
f C
hem
istr
y L
ab M
anual
Conclusion and Reflection
Write a thoughtful conclusion to the lab, answering the essential question: What is the difference
between endothermic and exothermic reactions, and how can this be determined when dissolving
different salts in water?

112
Lab A
ctivitie
s for
Surv
ey o
f C
hem
istr
y L
ab M
anual
Post-Lab Questions
Answer the following questions as completely as possible. Use evidence from your lab to help support answers
where possible. Use these questions to demonstrate your learning. You may want to review your pre-lab answers
and see what you have gained in understanding.
1. What is the difference between an endothermic reaction and an exothermic reaction?
2. How might you set up an experiment to see if a specific salt added to water creates an
endothermic or exothermic reaction?
3. What can you measure to determine which type of reaction is occurring?
4. What factors involved in the chemical makeup of a solute determine if it will cause an
endothermic or exothermic reaction when added to water?
5. What is an example of an exothermic reaction in everyday life?
6. What is an example of an endothermic reaction in everyday life?

113
Lab A
ctivitie
s for
Surv
ey o
f C
hem
istr
y L
ab M
anual
Lab Description:
Purpose:
Essential Question:
Objectives:
Beer-Lambert Law
In this lab, you will study the Beer-Lambert law and see first-hand how it is used for analysis.
To use the Beer-Lambert law to calculate the concentration of
a solute using data collected through spectrophotometry.
How does the Beer-Lambert law apply to chemical analysis?
At the completion of this lab, you should be able to:
1. Define the Beer-Lambert law and explain how it is applied.
2. Determine what is being measured in a spectrophotometer,
and explain the basics of spectrophotometry.
3. Collect and interpret quantitative data.
4. Complete calculations using the Beer-Lambert law.
5. Describe how the Beer-Lambert law is used in chemistry.

114
Lab A
ctivitie
s for
Surv
ey o
f C
hem
istr
y L
ab M
anual
Pre-Lab Questions
These pre-lab questions are to help you think about the Beer-Lambert Law lab and self-assess what you know and
what you want to know about the topic. By the end of the lab, you should be able to answer these questions in more
detail. Compare your answers to see what you have learned.
1. What is the Beer-Lambert law, and how is it used?
2. Why is the absorption or transmission of specific wavelengths important in analysis?
3. How does measuring wavelengths help determine the presence of a compound?
4. What do you expect the spectrum of distilled water to look like? Why?
5. How can the Beer-Lambert law be applied to chemistry?

115
Lab A
ctivitie
s for
Surv
ey o
f C
hem
istr
y L
ab M
anual
Background Information Visible light represents only a very small part of the electromagnetic spectrum. Visible light consists of light with
wavelengths from about 3.8 m x 10-7 m to 7.8 m x 10-7 m (380-780 nm). Substances that have color absorb some
wavelengths from the visible region of the spectrum and reflect others. Wavelengths that are not absorbed are
transmitted. We inherently know that if something is darker in color, it must be more concentrated. (Think of
making Kool-Aid or coffee.) This relationship is called the Beer-Lambert law, after Augustus Beer (a German
physicist) and Johann Lambert (a Swiss physicist), but is commonly referred to as Beer’s Law. The Beer-Lambert
law can be expressed as: A = abc
• A = absorbance
• a = molar absorptivity (molarity-1·cm-1), which is a constant that depends on the molecules
• b = path length, or thickness of the liquid the light is shining through (cm)
• c = concentration of the solution (molarity)
Beer’s law tells us that the absorbance of a particular species is directly proportional to the concentration of the
absorbing species, i.e., darker = more. The measurement of a blank, as described above, allows us to factor out the
effects of the environment, including the solvent (in this case, water) and the containers’ material (in this case,
plastic). So if A can be measured, a = a constant, and b is set, c can then be solved.
Any measurement can have noise, also known as error. The goal of any scientific data collection is to gather data
with as little noise as possible, although it can never be totally eliminated. In this lab, you will use a spectrometer
with a fiber optic cable to carry the light and help eliminate noise from sending the light beam through the air.

116
Lab A
ctivitie
s for
Surv
ey o
f C
hem
istr
y L
ab M
anual
Background Information Another way to reduce noise is to record a lot of data and average the results. The
spectrometer will collect an entire spectrum about once per second. The spectrum
consists of many thousands of points, and each time a spectrum is collected, these points
are slightly different (due to random noise). If you average two spectra together, you
reduce the noise by a factor of √2. If you average three spectra, you reduce the noise by
a factor of √3, etc. Of course, the more spectra you average, the longer it takes to get a
result. There is a balance between decreasing noise and collecting data in a reasonable
amount of time.
As stated earlier, “a” is a value that is unique to each substance you are measuring. So if
you know what substance you are measuring, you can look up the value. However, if you
don’t know the substance, you can create what is known as a standard curve. In a
standard curve, you take known values, measure absorbance, and then plot them on a
graph.
Let’s use Kool-Aid as an example. Say I measure out 1 spoonful of Kool-Aid mix and stir
it into 1 cup of water. If I measure the absorbance, I might get a reading of 0.5. If I
continue, and I measure out 2 spoonfuls into 1 cup of water, I will get a second reading
as shown at right. If I do this enough, I can plot my points and get my standard curve.
Now imagine I randomly added powder to 1 cup of water, and I wanted to find out how
much powder I added. I could use my curve to find out the amount (i.e., the
concentration) of my mixture.
Wavelength is the measurement used in the lab activity, so be sure to use the same
wavelength of light for each measurement you take, as you want to compare the same
thi I th K l Aid l it ld b lik it hi f t t
Spoonfuls of Kool-Aid
Absorbance Reading
0 0
1 0.5
2 1.0
2.5 1.25
3 1.5

117
Lab A
ctivitie
s for
Surv
ey o
f C
hem
istr
y L
ab M
anual
Explore Beer-Lambert Law
The Beer-Lambert law is used by chemists and other
researchers to compare the absorbance of unknown samples.
The data collected allow them to determine the concentrations
of particular substances in diluted solutions. It is important to
know the concentrations of solutions in lab work.
This applies to the identification of a wide range of unknown
substance concentrations in analysis of samples. Some areas
where this is used include:
• Medical research: bacteria concentrations, analysis of fluids
• Water quality: the concentrations of various compounds
present in water samples
• Forensics: detecting the presence and concentrations of
substances
A = abc
Resources The Beer-Lambert Law. ChemGuide. http://www.chemguide.co.uk/analysis/uvvisible/beerlambert.html Beer-Lambert Law and Visible Light Spectrometers. Harper College. http://www.harpercollege.edu/tm-ps/chm/100/dgodambe/thedisk/labtech/spec20.htm Beer-Lambert Law. College of Life Science, National Tsing Hua University. http://life.nthu.edu.tw/~labcjw/BioPhyChem/Spectroscopy/beerslaw.htm

118
Lab A
ctivitie
s for
Surv
ey o
f C
hem
istr
y L
ab M
anual
Beer-Lambert Lab
Purpose: To use the Beer-Lambert law to calculate the
concentration of a solute using data collected through
spectrophotometry.
The Beer-Lambert lab is set up with the equipment
shown here.

119
Lab A
ctivitie
s for
Surv
ey o
f C
hem
istr
y L
ab M
anual
Variables and Controls:
Control Panel The Control Panel is where you access the equipment
controls, collect data, and communicate with others
participating at the same time as you.
In this experiment, you will view different samples and
collect the spectrum wavelengths. You will also capture
images of the graphs and record the wavelength data for the
analysis portion of the lab.
1. Start button
2. Light
3. Spectra value
4. Store dark spectrum
5. Temperature control tab
6. Camera view
7. Camera controls
8. Voice conference

120
Lab A
ctivitie
s for
Surv
ey o
f C
hem
istr
y L
ab M
anual
Absorbance Spectrometer Tutorial
This tutorial introduces you to the absorbance spectrometer, which is used for several labs. You will see how the
equipment is set up as well as the view you will have from your control panel. The demonstration shows how to
control the equipment, read the settings, collect data, and collaborate with others. Watch the tutorial a second time,
immediately before your lab appointment, to refresh your memory about the function and purpose of the different
features in this lab setup.
Things to Notice / Questions:
1. How do you store a dark spectrum? Why is this
stored?
2. What are you measuring, and how does it relate to
the Beer-Lambert Law?
3. How will the graphs help you understand the results?
• http://www.wiche.edu/nanslo/lab-tutorials#beerlambert

121
Lab A
ctivitie
s for
Surv
ey o
f C
hem
istr
y L
ab M
anual
Lab Procedure Using the NANSLO lab equipment, you will log in and take the
indicated measurements at the time you are scheduled to take
the lab.
Join the voice conference so you can communicate with the lab
technician and other lab partners.
1. Turn on the temperature controller. Ensure the temperature
of the system is adjusted to 25.0° C.
2. Ensure the spectrometer’s light source is turned off.
3. Store a Dark Spectrum.
4. Ensure that Cuvette 0 (the reference sample) is selected.
5. Turn on the light to see the spectrum of the light source.
6. Play around with the Boxcar Width and # Spectra to
Average to get the least noisy spectrum.
7. Store the Reference spectrum.
8. Ask the lab tech for information about the standard NiSO4
solutions. You will use this information to calculate the
concentration of each standard solution (during data, the
analysis portion of the activity).

122
Lab A
ctivitie
s for
Surv
ey o
f C
hem
istr
y L
ab M
anual
Lab Procedure
9. Select one of the NiSO4 standards (Cuvettes 1-4) in the Q
pod in the Cuvette Selector tab.
10. Return to the Spectrometer tab to view the absorbance
spectrum.
11. Determine the location of λ max.
12. Record the absorbance of the NiSO4 sample at λmax in your
lab report. Each student in the group must write the
measurement down for later use.
13. Capture an image of the graph and insert in your lab report.
14. Repeat step 9 for all remaining samples, including Cuvette 5,
which contains the unknown concentration of NiSO4. If
working in a group, be sure to switch controls and share in
this process.
15. After each student has collected a complete set of data (and
everyone has recorded each data set in lab reports), you
can log out of the lab and work on the data analysis
portion. If you have time left in your scheduled lab period,
you can continue working with your lab partners to analyze
the data.

123
Lab A
ctivitie
s for
Surv
ey o
f C
hem
istr
y L
ab M
anual
Lab Day Checklist
On the day of your scheduled lab, review the items on this checklist to make sure you are prepared before logging
into NANSLO.
Read and review all lab materials
Prepare and organize lab charts and recording materials
Watch the lab tutorial again as a review before the lab
Log in to your lab session – two options:
Retrieve your email from the scheduler with your appointment info or
Log in to the student dashboard and join your session by going to
http://scheduler.nanslo.org
NOTE: You cannot log in to your session before the date and start time of your
appointment. Use Internet Explorer or Mozilla Firefox.

124
Lab A
ctivitie
s for
Surv
ey o
f C
hem
istr
y L
ab M
anual
Lab Report Lab Observations and Data Cuvette 1 Data: Observation notes:
Lab Observations and Data Cuvette 2 Data: Observation notes:
Insert images of graphs

125
Lab A
ctivitie
s for
Surv
ey o
f C
hem
istr
y L
ab M
anual
Lab Report Lab Observations and Data Cuvette 3 Data: Observation notes:
Lab Observations and Data Cuvette 4 Data: Observation notes:
Insert images of graphs

126
Lab A
ctivitie
s for
Surv
ey o
f C
hem
istr
y L
ab M
anual
Lab Report Lab Observations and Data Cuvette 5 Data: Observation notes:
Insert images of graphs

127
Lab A
ctivitie
s for
Surv
ey o
f C
hem
istr
y L
ab M
anual
Lab Analysis
1. Plot a standard graph using the concentration and absorbance
values for the standard solutions. Plot the concentrations on
the X-axis and absorbance values on the Y-axis. (This can be
done in Excel.)
2. From the absorbance of the unknown solution, you can
calculate
its concentration using the line equation of the standard curve.
3. Why do you have to first take an absorbance measurement of
a cuvette filled with distilled water? Why does this
measurement
have to be subtracted from the measurements of the NiSO4
samples?
4. Why didn’t you just measure one or two samples with known
concentrations of NiSo4?
5. Given the wavelength you measured, determine on what part
of the visible spectrum it falls?

128
Lab A
ctivitie
s for
Surv
ey o
f C
hem
istr
y L
ab M
anual
Lab Analysis 6. The figure to the right demonstrates the relationship between
absorbed and reflected colors of light. Absorbed is opposite of
reflected on the wheel. For example, if a substance absorbs
orange light, it will reflect blue light, and therefore appear
blue. Compare the color of the NiSO4 solution to the color of
the light it absorbs. Does it agree with the color wheel? What
can you deduce from this?
7. If a chemical solution is primarily orange in color,
approximately what wavelength would you expect λmax to
be? Why?
Sakurambo at English Wikipedia [GFDL ) http://www.gnu.org/copyleft/fdl.html

129
Lab A
ctivitie
s for
Surv
ey o
f C
hem
istr
y L
ab M
anual
Reviewing Results
Write a review of your experiment. Include your findings and an explanation of your results. Then
answer the following questions.
1. How accurate was the data you collected? How do you know?
2. How do the graphs show the maximum wavelength?
3. How does wavelength relate to visible colors?
4. How are visible colors different from absorbed colors?

130
Lab A
ctivitie
s for
Surv
ey o
f C
hem
istr
y L
ab M
anual
Conclusion and Reflection
Write a thoughtful conclusion to the lab, answering the essential question: How does the Beer-
Lambert law apply to chemical analysis?

131
Lab A
ctivitie
s for
Surv
ey o
f C
hem
istr
y L
ab M
anual
Post-Lab Questions
Answer the following questions as completely as possible. Use evidence from your lab to help support answers
where possible. Use these questions to demonstrate your learning. You may want to review your pre-lab answers
and see what you have gained in understanding.
1. What is the Beer-Lambert Law, and how is it used?
2. Why is the absorption or transmission of specific wavelengths important in analysis?
3. How does measuring wavelengths help determine the presence of a compound?
4. What do you expect the spectrum of distilled water to look like? Why?
5. How can the Beer-Lambert law be applied to chemistry?

132
Lab A
ctivitie
s for
Surv
ey o
f C
hem
istr
y L
ab M
anual
Lab Description:
Purpose:
Essential Question:
Objectives:
Enzyme Kinetics
In this lab, you will use the NANSLO lab equipment to experiment with the effects of solute concentration and temperature on reaction
rate as measured by spectrum absorption of resulting products.
To use absorption spectrometry to calculate the effect of
enzymes as catalysts when increasing solute concentration
and temperature.
What factors increase the ability of enzymes to act as catalysts,
and how can you calculate results using the absorption
spectrum?
At the completion of this lab, you should be able to:
1. Define enzyme, catalyst, and other key terms.
2. Determine the effects of increasing temperature and solute
concentration on enzyme kinetics.
3. Determine what is being measured in a spectrophotometer,
and explain the basics of spectrophotometry.
4. Collect and interpret quantitative data.
5. Complete tables and graphs with collected data.
6. Summarize findings using evidence from lab exercises.

133
Lab A
ctivitie
s for
Surv
ey o
f C
hem
istr
y L
ab M
anual
Pre-Lab Questions
These pre-lab questions are to help you think about the Enzyme Kinetics lab and self-assess what you know and
what you want to know about the topic. By the end of the lab, you should be able to answer these questions in more
detail. Compare your answers to see what you have learned.
1. What are enzymes?
2. What effect do enzymes have on reaction rates?
3. How does measuring wavelengths help determine the presence of a compound?
4. How does concentration relate to enzyme effects?
5. What happens to reaction rates and enzyme effectiveness when temperature increases?
6. How is the area of enzyme kinetics applied to chemistry?

134
Lab A
ctivitie
s for
Surv
ey o
f C
hem
istr
y L
ab M
anual
Background Information Living organisms contain enzymes, which are protein molecules with specific
functions and characteristics. Enzymes are vital to all living organisms.
Without their actions, chemical reactions would not occur rapidly enough to
support life. To illustrate this, think about the process of eating. We know
that in a healthy diet, we gain important nutrients. Nutrients are the
molecules necessary for organisms to grow, reproduce, and repair
themselves. The breakdown of these nutrients provides energy and building
blocks for living organisms via chemical reactions that will in turn result in
growth, reproduction, and repair; enzymes facilitate all of these functions.
The basic function of any enzyme is to increase the rate of a reaction. Most
cellular reactions occur about a million times faster in the presence of an
enzyme. Enzymes are also specific, and typically one reactant (called
a substrate) utilizes the catalyst (another term for enzyme) to produce
products.
An enzyme works just like a catalyst (in fact, it is one), by lowering the
amount of energy it takes to produce a reaction. This energy is called
activation energy and is required to break existing bonds and start a
chemical reaction. For example, to get a rock rolling down a hill, it needs a
push. The initial energy to get the rock to roll is the activation energy. A
catalyst (aka, enzyme) acts to lower the activation energy of a reaction. It
reduces the “nudge” needed to get the rock rolling down the hill. A catalyst
is not used up in the reaction and can be employed over and over again.

135
Lab A
ctivitie
s for
Surv
ey o
f C
hem
istr
y L
ab M
anual
Background Information As noted, an enzyme is not used up in the reaction; it can be reused when the reaction is complete.
And, like all other proteins in a living cell, enzymes are produced from genes in an organism’s DNA.
In summary, enzymes are protein biological catalysts used by cells to drive chemical reactions. They
are reusable and are produced under the direct control of an organism’s genetic material. They work
by binding to a specific molecule and putting stress on the bonds of that molecule so the reaction is
more likely to occur. If enzymes didn’t exist, it might take weeks for our bodies to break down food.
All of these processes are occurring in three dimensions. A protein at its base level is a string of
individual units, called amino acids. That string then is twisted and will condense (picture a Slinky). If
that twisted string wraps on top of itself, it becomes a jumbled mess (picture a Slinky that has been
folded back on itself). The mangled mess has crevices and holes that things can fit in — that’s where
the substrates go. Substrates will only fit into specific holes, like a lock and key. The enzyme brings
two substrate molecules into closer proximity, which allows the bonds to more easily alter; this is
what decreases the activation energy.
The figure below shows the breakdown of a large molecule into two smaller molecules, with the use
of an enzyme. Enzyme activity can be measured in the amount of product formed, also known as the
turnover rate.
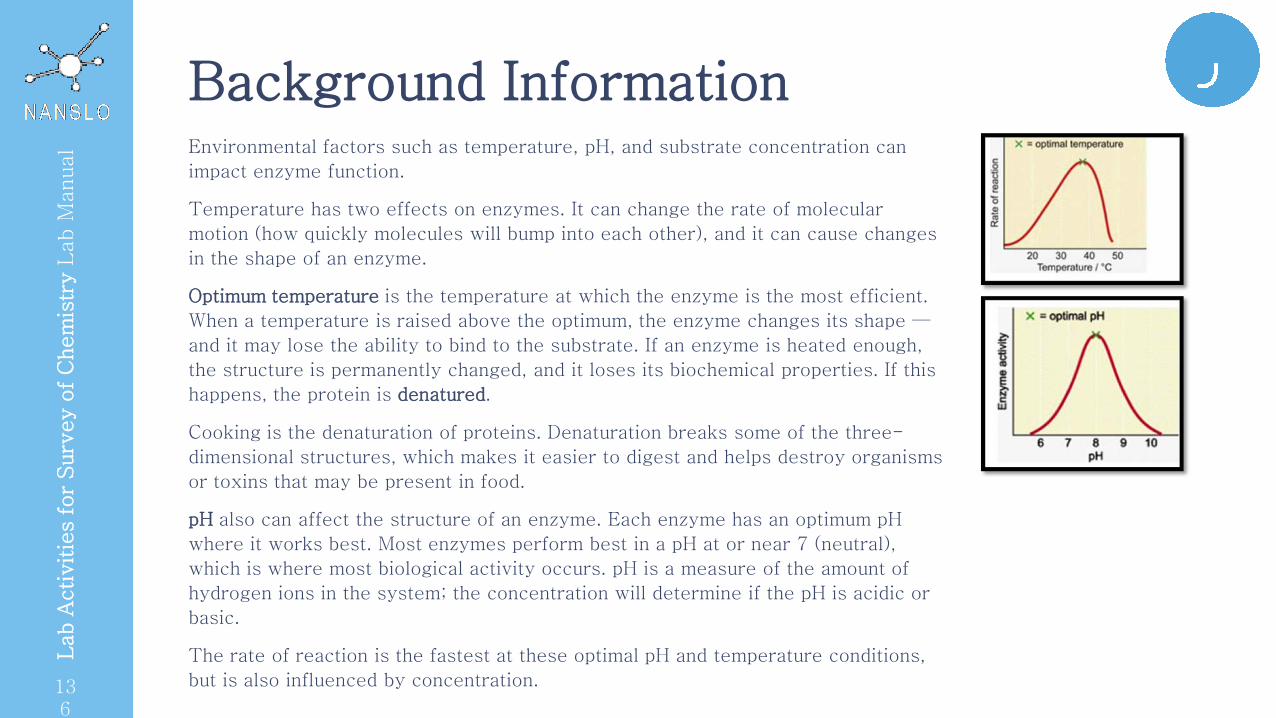
136
Lab A
ctivitie
s for
Surv
ey o
f C
hem
istr
y L
ab M
anual
Background Information Environmental factors such as temperature, pH, and substrate concentration can
impact enzyme function.
Temperature has two effects on enzymes. It can change the rate of molecular
motion (how quickly molecules will bump into each other), and it can cause changes
in the shape of an enzyme.
Optimum temperature is the temperature at which the enzyme is the most efficient.
When a temperature is raised above the optimum, the enzyme changes its shape —
and it may lose the ability to bind to the substrate. If an enzyme is heated enough,
the structure is permanently changed, and it loses its biochemical properties. If this
happens, the protein is denatured.
Cooking is the denaturation of proteins. Denaturation breaks some of the three-
dimensional structures, which makes it easier to digest and helps destroy organisms
or toxins that may be present in food.
pH also can affect the structure of an enzyme. Each enzyme has an optimum pH
where it works best. Most enzymes perform best in a pH at or near 7 (neutral),
which is where most biological activity occurs. pH is a measure of the amount of
hydrogen ions in the system; the concentration will determine if the pH is acidic or
basic.
The rate of reaction is the fastest at these optimal pH and temperature conditions,
but is also influenced by concentration.

137
Lab A
ctivitie
s for
Surv
ey o
f C
hem
istr
y L
ab M
anual
Background Information Environmental factors such as temperature, pH, and substrate concentration can
impact enzyme function.
Temperature has two effects on enzymes. It can change the rate of molecular
motion (how quickly molecules will bump into each other), and it can cause changes
in the shape of an enzyme.
Optimum temperature is the temperature at which the enzyme is the most efficient.
When a temperature is raised above the optimum, the enzyme changes its shape —
and it may lose the ability to bind to the substrate. If an enzyme is heated enough,
the structure is permanently changed, and it loses its biochemical properties. If this
happens, the protein is denatured.
Cooking is the denaturation of proteins. Denaturation breaks some of the three-
dimensional structures, which makes it easier to digest and helps destroy organisms
or toxins that may be present in food.
pH also can affect the structure of an enzyme. Each enzyme has an optimum pH
where it works best. Most enzymes perform best in a pH at or near 7 (neutral),
which is where most biological activity occurs. pH is a measure of the amount of
hydrogen ions in the system; the concentration will determine if the pH is acidic or
basic.
The rate of reaction is the fastest at these optimal pH and temperature conditions,
but is also influenced by concentration.

138
Lab A
ctivitie
s for
Surv
ey o
f C
hem
istr
y L
ab M
anual
Background Information Important Terms
activation energy - the minimum amount of energy required to convert a normal, stable molecule into a reactive
molecule
amino acids - any one of many acids that occur naturally in living things; includes some which form proteins
catalyst - a substance that causes a chemical reaction to happen more quickly
denature - to modify the molecular structure of a protein (or DNA), especially by heat, acid, alkali, or ultraviolet
radiation so as to destroy or diminish some of the original properties and the specific biological activity
enzyme - a chemical substance in animals and plants that helps to cause natural processes (such as digestion)
kinetics - the rate of change in a physical or chemical system
pH - a number between 0 and 14 that indicates if a chemical is an acid or a base
substrate - the substance acted upon by an enzyme.
Resources
Enzyme Kinetics. Columbia University. http://www.columbia.edu/itc/chemistry/chem-c2407/hw/ENZYME_KINETICS.pdf
An Introduction to Enzyme Kinetics. Khan Academy. https://www.khanacademy.org/test-prep/mcat/biomolecules/enzyme-
kinetics/v/an-introduction-to-enzyme-kinetics
Enzyme Kinetics. Kimball's Biology Pages. http://users.rcn.com/jkimball.ma.ultranet/BiologyPages/E/EnzymeKinetics.html

139
Lab A
ctivitie
s for
Surv
ey o
f C
hem
istr
y L
ab M
anual
Enzyme Applications Enzymes increase the ability and rate of many different types of chemical reactions. Here a
just a few examples of how we depend on enzyme kinetics in everyday life.
Animals
Biochemical reactions occur in human and animal body functions. Many extracellular enzymes
are involved in digestion; they break down food into smaller molecules that can be absorbed
and used for body processes and growth. These enzymes are located in the salivary glands,
stomach, pancreas, and intestines. Other enzymes break open and destroy bacteria.
Plants
Plants depend on intercellular enzymes that catalyze photosynthesis, which is needed to
produce the energy that is the basis for all food webs and the source of energy for life.
Food and Drink
Enzymes in yeast have been used for thousands of years to make bread, beer, and wine.
Enzyme technology has allowed scientists to isolate and use specific enzymes.
Cleaners
Many detergents include enzymes. These enzymes react with proteins catalyzed at lower
temperatures. This has resulted in more efficient and cost-effective cleaning products.

140
Lab A
ctivitie
s for
Surv
ey o
f C
hem
istr
y L
ab M
anual
Enzyme Kinetics Lab This laboratory activity focuses on how different temperatures and different substrate concentrations affect
the rate of an enzyme reaction.
We will be using the enzyme glucose oxidase. The reaction of the enzyme glucose oxidase with the β-D-
glucose produces D-gluconic acid and hydrogen peroxide (H2O2). The hydrogen peroxide then reacts with a
color-producing chemical to create a pink hue.
β-D-glucose + O22 + H2O → D-gluconic acid + H2O2
You will use a device called a spectrophotometer to measure the concentration of the oxidized dye using
absorbance. The higher the solute in a a liquid, the more light is absorbed. A spectrophotometer works by
shining a light through a sample and measuring how much comes out the other side. If there is more color, less
will transmit through to the detector, which tells us more product has been formed. Water will absorb a little
bit of the light, so it is important that the amount absorbed by the water be accounted for by first taking a
blank, or reference reading, before you start.
The lab has two exercises.
Exercise 1
You will be examining the effect of glucose concentration on the rate of the reaction. For this experiment, you
will want to keep the concentration of the enzyme constant while varying the concentration of glucose.
Exercise 2
You will be increasing temperature to examine how this changes the reaction rate and effectiveness of the
enzyme catalyst.

141
Lab A
ctivitie
s for
Surv
ey o
f C
hem
istr
y L
ab M
anual
Pre-Lab Problems 1. Do you think you will see an increase or decrease in absorbance as concentration changes? Explain your
answer.
2. Do you need a new blank for this experiment? Why or why not?
3. Do you think you will see an increase or decrease in absorbance as temperature changes? Explain your
answer.
4. What color do you predict the product of the reaction will be? Explain your answer.
5. What is the enzyme used in this experiment?
6. What is the substrate used in this experiment?
7. What solutions should be in the blank?
8. Hypothesis/Prediction: Set this up as an if-then statement. For example: If heat is applied to particles in
random motion, then observable differences will be seen in the absorption at various temperatures. This
example is meant to be very general. You will need to take your answer to Problem 1 and make it a more
specific if-then statement, based on your understanding prior to conduction of the experiment.

142
Lab A
ctivitie
s for
Surv
ey o
f C
hem
istr
y L
ab M
anual
Variables and Controls:
Control Panel The Control Panel is where you access the equipment
controls, collect data, and communicate with others
participating at the same time as you.
In this experiment, you will view different samples and
collect the spectrum wavelengths. You will also capture
images of the graphs and record the wavelength data for the
analysis portion of the lab.
1. Start button
2. Light
3. Spectra value
4. Store dark spectrum
5. Temperature control tab
6. Camera view
7. Camera controls
8. Voice conference

143
Lab A
ctivitie
s for
Surv
ey o
f C
hem
istr
y L
ab M
anual
Absorbance Spectrometer Tutorial
This tutorial introduces you to the absorbance spectrometer, which is used for several labs. You will see how the
equipment is set up as well as the view you will have from your control panel. The demonstration shows how to
control the equipment, read the settings, collect data, and collaborate with others. Watch the tutorial a second time,
immediately before your lab appointment, to refresh your memory about the function and purpose of the different
features in this lab setup.
Things to Notice / Questions:
1. How do you store a dark spectrum? Why is this
stored?
2. What are you measuring, and how does it relate to
the study of enzymes?
3. How will the graphs help you understand the results?
• http://www.wiche.edu/nanslo/lab-tutorials#emissionspec

144
Lab A
ctivitie
s for
Surv
ey o
f C
hem
istr
y L
ab M
anual
Lab Procedure Using the NANSLO lab equipment, you will log in and take the indicated measurements at the time you are
scheduled to take the lab. Join the voice conference so you can communicate with the lab technician and
other lab partners.
Exercise 1
In this experiment, the stock concentration of enzyme solution is 2 u/mL. Each cuvette used in this
experiment will contain 1 mL of a stock glucose solution with a concentration of 0.2 mg/mL; the maximum
volume of a cuvette is 4 mL. Create a table and determine the volumes you are going to add to buffer the
enzyme solution. Record both volumes in the table in your lab report.
1. Click the cuvette holder tab. Set the volume of enzyme and running buffer to match your first
concentration.
2. Set the temperature to 37° C.
3. Select Cuvette 0.
4. Click the spectrometer tab, set the total length of time to collect data to a value between 3-5 minutes.
Set the collections interval to a value between 10-20 seconds.
5. Set your dark and reference points.
6. Inject your enzyme and running buffer, and start recording.
7. Click the spectrometer tab and export your data to your lab report. Enter data into your table.
8. Repeat these steps with Cuvette 1 and your second concentration.
9. Repeat steps with Cuvette 2 and your third concentration.
10. Repeat steps with Cuvette 3 and your fourth concentration.

145
Lab A
ctivitie
s for
Surv
ey o
f C
hem
istr
y L
ab M
anual
Lab Procedure Exercise 2 Temperature can have two effects on enzymes: There can be a change in the rate of molecular activity or there can be a change in
the shape of the molecule. In Exercise 2, you will explore the change in reaction rate at different temperatures. The reaction rate is
defined as the amount of substrate formed per unit of time. You will measure the change in the absorption spectrum as either more
or less product is produced.
When the data is graphed, you can determine the slope of the line, which will give you the reaction rate. However, before we can
begin, you will need to determine the wavelength at which the product absorbs light maximally. You must keep in mind that even
when you are taking your absorbance measurement the reaction will be proceeding, and more enzymatic product will be forming.
Do not wait for the numbers to stop changing — they won’t!
1. From the graph you collected in Activity 1, identify the wavelength of the highest peak.
2. Click the cuvette holder tab. Set the volumes of enzyme and running buffer to match your fastest reaction in Exercise 1.
3. Set the temperature to 10° C.
4. Select Cuvette 4.
5. Click the spectrometer tab, and set the total length of time to collect data to a value between 3-5 minutes. Set the collections
interval to a value between 10-20 seconds.
6. Set your dark and reference points.
7. Inject your enzyme and running buffer, and start recording.
8. Click the spectrometer tab and export your data.
9. Repeat steps 1-8 at 70° C.

146
Lab A
ctivitie
s for
Surv
ey o
f C
hem
istr
y L
ab M
anual
Lab Day Checklist
On the day of your scheduled lab, review the items on this checklist to make sure you are prepared before logging
into NANSLO.
Read and review all lab materials
Prepare and organize lab charts and recording materials
Watch the lab tutorial again as a review before the lab
Log in to your lab session – two options:
Retrieve your email from the scheduler with your appointment info or
Log in to the student dashboard and join your session by going to
http://scheduler.nanslo.org
NOTE: You cannot log in to your session before the date and start time of your
appointment. Use Internet Explorer or Mozilla Firefox.

147
Lab A
ctivitie
s for
Surv
ey o
f C
hem
istr
y L
ab M
anual
Enzyme Kinetics Lab Report Exercise 1
Enzyme activity is measured in units. In this experiment, the stock concentration of enzyme
solution is 2 u/mL. Each cuvette used in this experiment will contain 1mL of a stock glucose
solution with a concentration of 0.2 mg/mL; the maximum volume of a cuvette is 4 mL.
Create a table and determine the volumes you are going to add to buffer the enzyme
solution. Record both volumes in your table in your lab report.
Create a data table that shows the concentration, absorbance, and time.

148
Lab A
ctivitie
s for
Surv
ey o
f C
hem
istr
y L
ab M
anual
Enzyme Kinetics Lab Report Exercise 2
Record data and graphs.

149
Lab A
ctivitie
s for
Surv
ey o
f C
hem
istr
y L
ab M
anual
Lab Analysis Exercise 1
1. Using the data from your table in the lab report, create a graph. On the graph
you will plot time as the independent variable and absorbance as the dependent
variable. You should have three different lines for the concentration ratio
variables.

150
Lab A
ctivitie
s for
Surv
ey o
f C
hem
istr
y L
ab M
anual
Lab Analysis Exercise 1
2. Using your graphed data, calculate the slope of the line for the last 5 minutes of the data collected at each
concentration. Slope is calculated by first choosing two points on the graph, then determining the change in
the horizontal points and the change in the vertical points. For example, your coordinates on the graph at
point 1 are
1 (X-axis) and 6 (Y-axis), and at point 2 the coordinates are 4 (X-axis) and 12 (Y-axis). This means the
vertical change is 12 - 6 and the horizontal change is 4 – 1, or vertical change = 6 and horizontal change =
3. To find the slope, you divide the vertical change by the horizontal change. 6 / 3 for a slope of 2. Be sure
to include the correct units for your data. What information can you get from this graph?
3. In what way is the rate of the reaction dependent on the concentration of the substrate? How would this
change if you were testing the concentration of the enzyme?
4. Based on the data you collected, write a claim-evidence statement. In other words, make a claim based on
what you learned in this experiment, and back it up with the data you collected.

151
Lab A
ctivitie
s for
Surv
ey o
f C
hem
istr
y L
ab M
anual
Lab Analysis
Exercise 2
1. Create a data table that shows the temperature, absorbance, and time at 10° C, 37° C (from Exercise 1), and
70° C.
2. Using the data, create a graph. On the graph, plot time as the independent variable and absorbance as the
dependent variable. You should have three different lines for the temperature variables.

152
Lab A
ctivitie
s for
Surv
ey o
f C
hem
istr
y L
ab M
anual
Lab Analysis
Exercise 2
3. Using your graphed data, calculate the slope of the line for the last 5 minutes of the data collected at each
temperature. Slope is calculated by first choosing two points on the graph, then determining the change in
the horizontal points and the change in the vertical points. For example, your coordinates on the graph at
point 1 are
1 (X-axis) and 6 (Y-axis), and at point 2 the coordinates are 4 (X-axis) and 12 (Y-axis). This means the
vertical change is 12 - 6 and the horizontal change is 4 – 1, or vertical change = 6 and horizontal change =
3. To find the slope, you divide the vertical change by the horizontal change. 6 / 3 for a slope of 2. Be sure
to include the correct units for your data. What information can you get from this graph?
4. How is the activity of the enzyme affected by temperature?

153
Lab A
ctivitie
s for
Surv
ey o
f C
hem
istr
y L
ab M
anual
Reviewing Results
Write a review of your experiment. Include your findings and an explanation of your results. Then answer the
following questions.
1. Based on the data you collected, write a claim-evidence statement for each exercise. In other words, make a
claim based on what you learned in each experiment, and back it up with the data you collected.
2. What do you predict will happen if the enzyme is boiled (100° C) for 10 minutes?

154
Lab A
ctivitie
s for
Surv
ey o
f C
hem
istr
y L
ab M
anual
Conclusion and Reflection
Write a thoughtful conclusion to the lab, answering the essential question: What factors increase the
ability of enzymes to act as catalysts, and how can you calculate results using absorption spectrum?

155
Lab A
ctivitie
s for
Surv
ey o
f C
hem
istr
y L
ab M
anual
Post-Lab Questions
Answer the following questions as completely as possible. Use evidence from your lab to help support answers
where possible. Use these questions to demonstrate your learning. You may want to review your pre-lab answers
and see what you have gained in understanding.
1. What are enzymes?
2. What effect do enzymes have on reaction rates?
3. How does measuring wavelengths help determine the presence of a compound?
4. How does concentration relate to enzyme effects?
5. What happens to reaction rates and enzyme effectiveness when temperature increases?
6. How is the area of enzyme kinetics applied to chemistry?

156
Lab A
ctivitie
s for
Surv
ey o
f C
hem
istr
y L
ab M
anual
Lab Description:
Purpose:
Essential Question:
Objectives:
Radiation Lab
In this lab, you will use the NANSLO lab equipment to measure and compare three different forms of radiation — alpha, beta, and
gamma — and determine their strength based on distance and blockage by different shielding materials. In the final activity, you will
use your experiment techniques and comparison data to identify an unknown type of radiation.
To conduct experiments to determine and compare the
strength of three radiation sources as they relate to changing
distances and different shielding materials.
How can different forms of radiation be measured and
compared, and how can this data help you identify an unknown
source?
At the completion of this lab, you should be able to:
1. Define ionizing radiation and name the three types used in this
lab.
2. Conduct experiments to determine the effects of increasing
distance from the radiation source.
3. Conduct experiments to determine the results of using different
types of shield materials with different radiation sources.
4. Conduct experiments and interpret results to solve for an
unknown radiation type.
5. Collect and interpret quantitative data.
6. Complete tables and graphs with collected data.
7. Summarize findings using evidence from lab exercises.

157
Lab A
ctivitie
s for
Surv
ey o
f C
hem
istr
y L
ab M
anual
Pre-Lab Questions
These pre-lab questions are to help you think about the Radiation Lab and self-assess what you know and what
you want to know about the topic. By the end of the lab, you should be able to answer these questions in more
detail. Compare your answers to see what you have learned.
1. What are some characteristics of radiation?
2. How does radiation travel?
3. What impact does distance have on the strength of radiation? Is this the same for all radiation
forms?
4. How does shielding work?
5. How can an unknown type of radiation be identified?
6. What types of materials block the most radiation?
7. How is radiation harmful?
8. What are some examples of beneficial applications of radiation?

158
Lab A
ctivitie
s for
Surv
ey o
f C
hem
istr
y L
ab M
anual
Background Information Radiation, the emission of energy, is all around us and can come in many forms. The
particular type of radiation we will be discussing in this lab is ionizing radiation. Ionizing
radiation occurs when an unstable element emits charged particles, or ions, that can
travel through space and matter. There are three types of ionizing radiation: alpha (α),
beta (β), and gamma (ɣ) (also called X-rays).
Alpha particles were discovered by Ernest Rutherford in 1899. Alpha particles have two
protons and two neutrons, so they have a +2 charge. Alpha particles are the largest of
all of the types of radiation, and it is because of their size that they travel the slowest,
at 1/20 the speed of light. Alpha particles are emitted by elements that are larger
(>106).
Henri Becquerel discovered beta particles in 1900. Beta particles are emitted electrons,
and therefore have a charge of -1. The speed of a beta particle varies depending on the
amount of energy the particular beta particle has, but all are faster than alpha particles.
Beta radiation occurs when the neutron to proton ratio in the nucleus is too high. When
this happens, the neutron converts into a proton that stays and an electron that is
ejected.
Gamma radiation was also discover by Becquerel in 1896. Gamma radiation is pure
electromagnetic energy, meaning it has no mass or charge and travels at the speed of
light. Gamma radiation and X-rays are only different in the location of the atom they
originate from. Gamma rays come from the nucleus, while X-rays come from the
electron field. Gamma radiation is produced when an unstable isotope moves into a
more stable energy state.
All three types of radiation can be harmful if the dose or exposure time is too long. And
it is important to know that they can be stopped by shielding. Because of the different
sizes and energies of the radiations, different types of shielding are required for each

159
Lab A
ctivitie
s for
Surv
ey o
f C
hem
istr
y L
ab M
anual
Radiation Applications Nuclear radiation changes atoms or molecules into charged particles. Radiation is found
naturally in the ground, water, and air. It is found in building materials and even in food.
Radiation also occurs in space, in the form of cosmic rays. It can be harmless or life
threatening, depending on the type of radiation, distance from source, and length of
exposure. This lab will focus on three types of ionizing radiation. Here are some examples
of the how we use each type.
Alpha Radiation
One of the most common uses of alpha radiation is in smoke detectors. Radioactive
americium releases alpha radiation. Smoke from a fire absorbs alpha radiation, altering the
ionization that triggers the alarm. Alpha particles are normally harmless, but can be
potentially dangerous if they are inhaled or swallowed.
Beta Radiation
Beta radiation is used in medicine. These radioactive chemicals are called tracers and are
used to locate tumors or other diseased parts when the body is scanned.
Beta radiation is also used in industry to monitor and control the thickness of materials
during manufacturing. The thicker the material, the more radiation is absorbed, and the less
radiation reaches the detector. These signals are then used to adjust the equipment to
maintain the correct thickness.
https://www.flickr.com/photos/calliope/
https://www.flickr.com/photos/thirteenofclubs/

160
Lab A
ctivitie
s for
Surv
ey o
f C
hem
istr
y L
ab M
anual
Radiation Applications Gamma Radiation
The uses of gamma radiation are most prevalent in medicine. This is the type of radiation
used in cancer treatments. X-rays are also typically used to take images of the solid parts
of the body (such as teeth and bones), and are also used in industry to find defects in
welds.
Ionizing radiation is potentially harmful if not used correctly. It all depends on the type of
radiation, the length of exposure, and the distance from the source. In general,
overexposure to radiation can cause changes in the body’s cells and can lead to cancer,
blood disease, and other malfunctions in the body.
Resources Radiation. Center for Nuclear Science and Technology Information of the American Nuclear Society. http://nuclearconnect.org/know-nuclear/science/radiation What Types of Radiation Are There? Health Physics Society. http://hps.org/publicinformation/ate/faqs/radiationtypes.html Types of Ionizing Radiation. Mirion Technologies. https://www.mirion.com/introduction-to-radiation-safety/types-of-ionizing-radiation/ Nuclear Chemistry - Radioactivity & Radiation - Alpha, Beta, Gamma. Sciencepost. https://www.youtube.com/watch?v=cOE40P5rHCA Radiation Basics. United States Nuclear Regulatory Commission. http://www.nrc.gov/about-nrc/radiation/health-effects/radiation-b i h l
"The Röntgen rays in medical w
ork" (1907)- public domain

161
Lab A
ctivitie
s for
Surv
ey o
f C
hem
istr
y L
ab M
anual
Radiation Lab Purpose: To conduct experiments to determine and compare the strength of
three radiation sources as they relate to changing distances and different
shielding materials.
This laboratory activity focuses on three different kinds of radiation and
their characteristic strengths related to distance and three different shields.
You will be using the NANSLO lab equipment to move the source to
measure radiation strength at different distances. You will also be testing
the strength as radiation passes through three different shielding materials:
a piece of paper, a piece of tin foil, and a piece of aluminum.
This data will be collected and compared to assist you in identifying a final
unknown radiation source.
<insert image of lab set-up>

162
Lab A
ctivitie
s for
Surv
ey o
f C
hem
istr
y L
ab M
anual
Variables and Controls:
Control Panel The Control Panel is where you access the equipment
controls, collect data, and communicate with others
participating at the same time as you.
In this experiment, you will test different sources of radiation
by changing the distance from the source and using different
types of shielding materials.
<Insert numbered controls that correlate to labeled image>
<Insert photo of labeled control panel when available>

163
Lab A
ctivitie
s for
Surv
ey o
f C
hem
istr
y L
ab M
anual
Radiation Tutorial
This tutorial introduces you to the radiation lab apparatus. You will see how the equipment is set up as well as the
view you will have from your control panel. The demonstration shows how to control the equipment, read the
settings, collect data, and collaborate with others. Watch the tutorial a second time, immediately before your lab
appointment, to refresh your memory about the function and purpose of the different features in this lab setup.
Things to Notice / Questions:
1. How do you change radiation sources?
2. How do you adjust the distance?
3. What other controls will you be using?
4. How do you share the controls with others in your
group?
• <add link when available>

164
Lab A
ctivitie
s for
Surv
ey o
f C
hem
istr
y L
ab M
anual
Radiation Lab Procedure Using the NANSLO lab equipment, you will log in and take the indicated measurements at the time you are
scheduled to take the lab.
Exercise 1
1. Using the lab interface, turn on the radiation detector.
2. Record any background radiation.
3. Select a radiation source and take note of the amount of radiation being detected in Position 1.
4. Start by moving the source further away to Positions 2-4. Record the radiation counts at each of these
distances.
Exercise 2
1. Move the source to Position 1.
2. Insert a shield material in front of the detector and record the radiation count.
3. Repeat with each of the the shield materials.
4. Select the second radiation type and repeat steps 2 and 3. Record all data in your lab report.
Exercise 3
1. Select the unknown type of radiation.
2. Using the knowledge you have gained, change distance, shielding, or both to determine what type of
radiation is being emitted from the source.

165
Lab A
ctivitie
s for
Surv
ey o
f C
hem
istr
y L
ab M
anual
Lab Day Checklist
On the day of your scheduled lab, review the items on this checklist to make sure you are prepared before logging
into NANSLO.
Read and review all lab materials
Prepare and organize lab charts and recording materials
Watch the lab tutorial again as a review before the lab
Log in to your lab session – two options:
Retrieve your email from the scheduler with your appointment info or
Log in to the student dashboard and join your session by going to
http://scheduler.nanslo.org
NOTE: You cannot log in to your session before the date and start time of your
appointment. Use Internet Explorer or Mozilla Firefox.

166
Lab A
ctivitie
s for
Surv
ey o
f C
hem
istr
y L
ab M
anual
Radiation Lab Report Exercise 1
Fill in the table with the results and data from the procedure, including the background radiation and
radiation readings at the four positions for each of the three known radiation sources, and the final
unknown source (Exercise 3).
Radiation Source
Background Radiation
Position 1 Position 2 Position 3 Position 4
alpha
beta
gamma
unknown

167
Lab A
ctivitie
s for
Surv
ey o
f C
hem
istr
y L
ab M
anual
Radiation Lab Report
Exercise 2
Fill in the table with the results and data from the procedure, including the background radiation and
radiation readings using the three different shield materials for each of the three known radiation
sources, and the final unknown source (Exercise 3).
Radiation Source
Background Radiation
Paper Shield
Tin Foil Aluminum
alpha
beta
gamma
unknown
Exercise 3
Fill in the last table rows in Exercises 1 and 2 to record the measurements for the unknown radiation
source.

168
Lab A
ctivitie
s for
Surv
ey o
f C
hem
istr
y L
ab M
anual
Radiation Analysis Exercise 1
1. Create a data table and subtract your background radiation counts from all of your
collected experimental data.
2. Which type of ionizing radiation was most impacted by distance? How do you know?
Exercise 2
1. Which type of ionizing radiation was the paper able to block?
2. Which type of ionizing radiation was the tin foil able to block?
3. Which type of ionizing radiation was the aluminum able to block?

169
Lab A
ctivitie
s for
Surv
ey o
f C
hem
istr
y L
ab M
anual
Radiation Analysis
Exercise 3
Make a case for the identity of the unknown type of radiation. Explain how you reached your conclusion
and support your claim with evidence from your experiments.

170
Lab A
ctivitie
s for
Surv
ey o
f C
hem
istr
y L
ab M
anual
Reviewing Results
Write a review of your experiment. Include your findings and an explanation of your results. Then
answer the following questions.
1. Given the types of shielding used in this lab, what do you think the most effective shielding will be? Why?
2. Based on the information given, rank the types of radiation (gamma, alpha, and beta) in order of most easily
absorbed to hardest to absorb. Explain your answer.

171
Lab A
ctivitie
s for
Surv
ey o
f C
hem
istr
y L
ab M
anual
Conclusion and Reflection Write a thoughtful conclusion to the lab, answering the essential question: How can different forms
of radiation be measured and compared, and how can this data help you identify an unknown source?

172
Lab A
ctivitie
s for
Surv
ey o
f C
hem
istr
y L
ab M
anual
Post-Lab Questions
Answer the following questions as completely as possible. Use evidence from your lab to help support answers
where possible. Use these questions to demonstrate your learning. You may want to review your pre-lab answers
and see what you have gained in understanding.
1. What are some characteristics of radiation?
2. How does radiation travel?
3. What impact does distance have on the strength of radiation? Is this the same for all radiation
forms?
4. How does shielding work?
5. How can an unknown type of radiation be identified?
6. What types of materials block the most radiation?
7. How is radiation harmful?
8. What are some examples of beneficial applications of radiation?

173
Lab A
ctivitie
s for
Surv
ey o
f C
hem
istr
y L
ab M
anual
Lab Description:
Purpose:
Essential Question:
Objectives:
Reaction Rates
The rate of a chemical reaction is the time it takes for a given amount of a reactant to change into the product. For this lab, you will
observe how reaction conditions change the rate of reaction in an Alka-Seltzer tablets and water mixture.
To determine how surface area affects the reaction rate of
Alka-Seltzer and water.
What are some of the factors affecting reaction rates and how
is this applicable to chemistry?
At the completion of this lab, you should be able to:
1. Define reaction rate and explain how and why it is measured.
2. Explain the process of determining reaction rate.
3. Complete reaction rate experiments using virtual equipment.
4. Use collected data to make calculations.
5. Analyze and compare results.
6. Describe an application of reaction rates in biology.

174
Lab A
ctivitie
s for
Surv
ey o
f C
hem
istr
y L
ab M
anual
Pre-Lab Questions
These pre-lab questions are to help you think about the reaction rate lab and self-assess what you know and what
you want to know about the topic. By the end of the lab, you should be able to answer these questions in more
detail. Compare your answers to see what you have learned.
1. What is a reaction rate? Provide an example.
2. What are four factors that affect reaction rate?
3. How does increased surface area of the reactants affect reaction rate?
4. In what circumstances is it important to understand reaction rates in chemistry? Give an example.

175
Lab A
ctivitie
s for
Surv
ey o
f C
hem
istr
y L
ab M
anual
Background Information In a chemical reaction you start with reactants, which are changed
in some fashion to become products. Reactants are to the left of the
arrow and products are shown on the right of the arrow.
The rate of a chemical reaction is the time it takes for a given
amount of a reactant (what you start with) to change into the
product (what you end with). Rate is affected by several factors,
including:
1) Reactant concentration
2) Temperature
3) Pressure
4) Catalysts
5) Physical state of reactants
In this lab, you will be examining how one of the physical states of
the reactants (surface area) affects reaction rate.
Important Terms
catalyst - a substance that causes a chemical reaction to
happen more quickly
enzymes - proteins that speed up the rate of a reaction by
lowering the amount of energy required for a reaction to
take place
equilibrium - a state in which opposing forces or actions are
balanced so that one is not stronger or greater than the
other
ion - an atom, or group of atoms, that has a positive or
negative electric charge from losing or gaining one or more
electrons
molarity (M) - a measure of concentration; the number of
moles of solute per liter of solution
mole (m) - the amount of pure substance containing the same
number of chemical units as there are atoms in exactly 12
grams of carbon-12
products - the resulting substances of a chemical reaction
reactant - a solution with a known chemical makeup and
concentration
reaction rate - a measure of the change in the concentration
of reactants or products over time in a chemical reaction

176
Lab A
ctivitie
s for
Surv
ey o
f C
hem
istr
y L
ab M
anual
Background Information Chemical Reactions in Cells
Reaction rate applies to biology, since all living cells carry out continuous cycles of
chemical reactions to keep functioning. The reaction rates of these processes are
interdependent and complex.
Metabolism
The series of reactions needed to keep an organism alive is called metabolism. It is
imperative that most of these reactions occur at a rapid rate. Since increasing
temperature would be detrimental to the cells and body structures, enzymes are used
as catalysts.
Medical Applications
Many diseases and conditions can be detected by studying enzymes, including
diseases affecting the heart, liver, kidney, pancreas, blood, and digestive tract.
Food Industry
Enzymes are used to control the process of making many different foods, such as:
• Ice cream • Coffee • Juice • Wine • Beer • Cheese
Resources Digestive Enzymes. Biology Online. http://www.biology-online.org/articles/digestive_enzymes.html The Central Role of Enzymes as Biological Catalysts. In: The Cell: A Molecular Approach. 2nd ed. Sinauer Associates (via NCBI). http://www.ncbi.nlm.nih.gov/books/NBK9921/
USDA 20150320-OSEC-LSC-0098

177
Lab A
ctivitie
s for
Surv
ey o
f C
hem
istr
y L
ab M
anual
Reaction Rate Experiment Purpose: To determine how surface area affects the reaction rate of Alka-
Seltzer and water.
For this lab, you will observe how reaction conditions change the rate of
reaction in an Alka-Seltzer tablet and water mixture. The main ingredients of
Alka-Seltzer tablets are aspirin, citric acid, and sodium bicarbonate
(NaHCO3). When sodium bicarbonate dissolves in water, it splits apart, or
dissociates, into sodium (Na+) and bicarbonate (HCO3-).
The bicarbonate reacts with hydrogen ions (H+) from the citric acid to form
water and carbon dioxide, which is a gas that can be seen by the bubbles
produced. This reaction is shown below:
C6H8O7 + 3NaHCO3 → 3H2O + 3CO2 + Na3C6H5O7
Contact area, also known as surface area, can affect a chemical reaction.
Alka-Seltzer is commonly packaged as one large tablet with a set surface
area. As the tablet is crushed or broken up, the total surface area increases.
Instead of one big tablet, there are lots of little tablets, and this affects the
rate of the reaction.

178
Lab A
ctivitie
s for
Surv
ey o
f C
hem
istr
y L
ab M
anual
Reaction Rate Experiment
The volume, or space, of one tablet that is 1 inch across and 0.25 inch tall is the same as ten tablets that are 0.5
inch across and 0.1 inch tall. The surface area, which is the contact area with the environment, however, is very
different between the two.
Pre-Lab Questions and Calculations:
C6H8O7 + 3NaHCO3 → 3H2O + 3CO2 + Na3C6H5O7
1. What are the products for the above reaction?
2. What are the reactants for the above reaction?
3. Calculate the surface area for the unbroken, large Alka-Seltzer tablet shown above on the left.
4. Calculate the surface area for ten smaller tablets with the given dimensions: diameter = 0.5 inch and height =
0.1 inch.
5. Predict whether a crushed tablet (i.e., more surface area) will react faster or slower than a non-crushed
tablet.

179
Lab A
ctivitie
s for
Surv
ey o
f C
hem
istr
y L
ab M
anual
Variables and Controls:
Control Panel
The Control Panel is where you access the
equipment controls, collect data, and communicate
with others participating at the same time as you.
In this experiment, you will be changing beakers and
adding water to view and track the reaction rate.
This will include monitoring the camera and
recording images.
1. Selection of beaker
2. Acid tank
3. Base tank
4. Burettes
5. Temperature reading
6. pH reading
7. Volume
8. Message screen
9. Camera image
10.Camera view
11.Camera controls
12.Voice conference

180
Lab A
ctivitie
s for
Surv
ey o
f C
hem
istr
y L
ab M
anual
Tutorial
This tutorial introduces you to the Reactions Rate lab. You will see how the equipment is set up as well as the view
you will have from your control panel. For this lab, you will be adding water to different beakers to observe
reactions and track changes.
The demonstration shows how to control the equipment, read the settings, collect data, and collaborate with others.
Watch the tutorial a second time, immediately before your lab appointment, to refresh your memory about the
function and purpose of the different features in this lab setup.
Things to Notice / Questions:
1. How do you join the voice conference?
2. What steps will you take to add water to a beaker?
3. How will you change from Beaker 1 to Beaker 2?
4. How can you view a close-up of each beaker?
5. How and when will you capture an image?
• Add link when available

181
Lab A
ctivitie
s for
Surv
ey o
f C
hem
istr
y L
ab M
anual
Reaction Rate Procedure Using the NANSLO lab equipment, you will log in and take the indicated
measurements at the time you are scheduled to take the lab.
1. In this experiment, two compounds will be mixed, and you will predict
what will happen. Record your observations on the Lab Report chart.
2. Using the NANSLO interface, zoom in on the Beaker 1. Make
observations about what is in the beaker. Take note of the ruler next to
the beaker.
3. Predict what will happen in this beaker before you continue.
4. Add 10 mL of water to the beaker. Start your timer, and see how long it
takes for the fizzing to stop. Also watch the height of the bubbles/liquid,
and record the highest point that the bubbles reach.
5. Repeat with Beakers 2, 3, and 4.

182
Lab A
ctivitie
s for
Surv
ey o
f C
hem
istr
y L
ab M
anual
Lab Day Checklist
On the day of your scheduled lab, review the items on this checklist to make sure you are prepared before logging
into NANSLO.
Read and review all lab materials
Prepare and organize lab charts and recording materials
Watch the lab tutorial again as a review before the lab
Log in to your lab session – two options:
Retrieve your email from the scheduler with your appointment info or
Log in to the student dashboard and join your session by going to
http://scheduler.nanslo.org
NOTE: You cannot log in to your session before the date and start time of your
appointment. Use Internet Explorer or Mozilla Firefox.

183
Lab A
ctivitie
s for
Surv
ey o
f C
hem
istr
y L
ab M
anual
Lab Report
Beaker Pre-lab Observations Pre-lab
Predictions Reaction
Time Height of Bubbles
Observation Notes and Questions
1
2
3
4

184
Lab A
ctivitie
s for
Surv
ey o
f C
hem
istr
y L
ab M
anual
Reviewing Results
Write a review of your experiment. Include your findings and an explanation of your results. Use the following
prompts to guide you.
1. Which beaker had the fastest reaction?
2. Which beaker had the slowest reaction?
3. Which beaker had the most bubbles?
4. Which beaker generated the least bubbles?
5. Speculate on why your answer to #1 had the fastest reaction. Support your answer with evidence.
6. What other measurement would have been useful?
7. Beakers 3 and 4 had seemingly the same conditions, but one was faster than the other. Explain why?

185
Lab A
ctivitie
s for
Surv
ey o
f C
hem
istr
y L
ab M
anual
Conclusion and Reflection Write a thoughtful conclusion to the lab, answering the essential question: What are some of the
factors affecting reaction rates and how is this applicable to chemistry?

186
Lab A
ctivitie
s for
Surv
ey o
f C
hem
istr
y L
ab M
anual
Post-Lab Questions
Answer the following questions as completely as possible. Use evidence from your lab to help support answers
where possible. Use these questions to demonstrate your learning. You may want to review your pre-lab answers
and see what you have gained in understanding.
1. What is a reaction rate? Provide an example.
2. What are four factors that affect reaction rate?
3. How does increased surface area of the reactants affect reaction rate?
4. In what circumstances is it important to understand reaction rates in chemistry? Give an example.

187
Lab A
ctivitie
s for
Surv
ey o
f C
hem
istr
y L
ab M
anual
Lab Description:
Purpose:
Essential Question:
Objectives:
Acid/Base Titration
Titration is a procedure to analyze a substance for particular compounds and their concentrations. In this lab, you will use remote
acid/base titration lab equipment to determine the concentration (molarity) of acid in the sample solution.
To determine the concentration of an acid in a sample by
adding a known quantity of a base through the process of
titration.
How can titration be used to calculate unknown concentrations
of acids in a solution, and how does this apply to chemistry?
At the completion of this lab, you should be able to:
1. Define titration and explain how and why it is used.
2. Explain the process of acid/base titration.
3. Complete acid/base titrations using virtual equipment.
4. Create graphs from collected data and interpret for completing
calculations.
5. Calculate the concentration (molarity) of an acid using
experiment data.
6. Describe an application of titration in chemistry.

188
Lab A
ctivitie
s for
Surv
ey o
f C
hem
istr
y L
ab M
anual
Pre-Lab Questions
These pre-lab questions are to help you think about the titration lab and self-assess what you know and what you
want to know about the topic. By the end of the lab, you should be able to answer these questions in more detail.
Compare your answers to see what you have learned.
1. What is titration?
2. How does pH help determine how acidic or alkaline a solution is?
3. How does pH relate to acid/base titration?
4. In what circumstances might it be important to know the concentration of acid in a solution?

189
Lab A
ctivitie
s for
Surv
ey o
f C
hem
istr
y L
ab M
anual
Background Information Important Terms
acid - a compound with a pH less than 7, that in a solution donates hydrogen ions and is
able to accept an unshared pair of electrons from a base
base - a compound with a pH greater than 7, that in a solution accepts hydrogen ions; also
known as alkaline
equivalence point - the point at which chemically equivalent amounts of reactants have
reacted to cancel each other out
ion - an atom or group of atoms that has a positive or negative electric charge from losing
or gaining one or more electrons
molarity (M) - a measure of concentration; the number of moles of solute per liter of
solution
mole (m) - the amount of pure substance containing the same number of chemical units as
there are atoms in exactly 12 grams of carbon-12
neutral - an even number of hydrogen ions (+) and hydroxide ions (-), so the solution is
neutral; a substance that is neutral has a pH of 7
pH - a number between 0 and 14 that indicates if a chemical is an acid or a base
reagent - a solution with a known chemical makeup and concentration
The pH values of some common substances
are shown in the chart above. A pH of 7 is
neutral. Substances above 7 are alkaline, and
substances below 7 are acidic. Take a look at
the pH of some common foods. Any
surprises?

190
Lab A
ctivitie
s for
Surv
ey o
f C
hem
istr
y L
ab M
anual
Explore Titration The chemical process of titration is used to support study, analysis, and monitoring of chemicals related to the following fields and processes:
Medical Uses
• Titration is used for analyzing samples of blood and urine to measure the concentration of different chemicals.
• Acids and bases are important in living things to maintain the proper pH for enzymes to work.
• New drugs are tested and analyzed using the process of titration.
• It is used to determine the correct proportion of different medicines in an intravenous drip.
• Titration is also used to monitor blood glucose levels in patients with diabetes, as well as in pregnancy tests and other applications of urinalysis.
Food Industry
• Titration helps identify fat and water content and the presence of vitamins in foods.
• It is used to test for the amount of salt, sugar, and proteins.
• Titration is also used in wine and cheese production to meet standards, test for acidity, and determine product readiness.
Biodiesel
• Titration is used to determine the acidity of waste vegetable oil, one of the primary ingredients in biodiesel production.
Ecology – Water Protection
• Titration is used to test the underwater environment in fresh water and marine water.
• It is used to monitor aquarium pH and other chemical concentrations.
• Titration is a precise method for the determination of the acidity in rain or snow samples associated with acid rain.
Resources Titratable Acidity. Iowa State University Extension and Outreach. http://goo.gl/tA9Iog The Big Reveal: What’s Behind Nutrition Labels. American Chemical Society. http://goo.gl/rycf8f Acid-Base Titrations. SparkNotes. http://www.sparknotes.com/chemistry/acidsbases/titrations/section1.rhtml

191
Lab A
ctivitie
s for
Surv
ey o
f C
hem
istr
y L
ab M
anual
Titration Experiment Purpose: To determine the concentration of an acid in a sample by adding a
known quantity of a base through the process of titration.
The titration experiment is set up with five beakers and burettes you
control virtually to add solutions with precise measurements.
The image at right shows a close-up of the double burettes that add
amounts you specify, or drops of solution, to the beaker.

192
Lab A
ctivitie
s for
Surv
ey o
f C
hem
istr
y L
ab M
anual
Variables and Controls:
Control Panel The Titration Lab Control Panel is where you access the
equipment controls, collect data, and communicate with
others participating at the same time as you.
In this experiment, you will have five beakers labeled A-E.
Beaker A is filled with clear water to sterilize the probe after
each use.
Each of the other four beakers contains an acidic solution.
Your job will be to use titration to determine the
concentration in each of these beakers.
1. Selection of beaker
2. Acid tank
3. Base tank
4. Burettes
5. Temperature reading
6. pH reading
7. Volume
8. Message screen
9. Camera image
10.Camera view
11.Camera controls
12.Voice conference

193
Lab A
ctivitie
s for
Surv
ey o
f C
hem
istr
y L
ab M
anual
Tutorial
This tutorial introduces you to the titration apparatus, which is used for several labs. You will see how the
equipment is set up as well as the view you will have from your control panel. The demonstration shows how to
control the equipment, read the settings, collect data, and collaborate with others. Watch the tutorial a second time,
immediately before your lab appointment, to refresh your memory about the function and purpose of the different
features in this lab setup.
Things to Notice / Questions:
1. Why should you rinse the probe in Beaker A between
samples?
2. What might be some reasons why you can’t add solution to a
beaker?
3. When is it a good idea to switch to using the drop feature?
4. How will you know when you have added enough base
solution?
5. How will creating a graph help you visualize your data?
• http://www.wiche.edu/nanslo/lab-tutorials#titration

194
Lab A
ctivitie
s for
Surv
ey o
f C
hem
istr
y L
ab M
anual
Titration Lab Procedure Using the NANSLO lab equipment, you will log in and take the
indicated measurements at the time you are scheduled to take the
lab.
Exercise 1: Qualitative measurement
1. The first titration is qualitative, where you will make
observations about how the acid in the beaker reacts with the
base you add from the dropper.
2. Slowly add a small amount of base to Beaker B. Keep track of
the volume and pH changes by adding data points to a graph.
3. Try adding different volumes and see what happens. For
instance, try a tenth of a milliliter up to a few milliliters.
4. See if you can determine the equivalence point. Use the
interface to add the volumes. Save the titration graph/data for
this run and move on to the next one.
5. If you have lab partners, take turns adding fluid.

195
Lab A
ctivitie
s for
Surv
ey o
f C
hem
istr
y L
ab M
anual
Titration Lab Procedure
Exercise 2: Quantitative measurement
1. From your first measurement, you should have a good
guess as to what volume you need to add to reach the
equivalent point.
2. This time, try to get close to that, and then add volume
slowly around that volume.
3. You have three more titrations to try this.
4. Save the titration graph for each titration to use for your
analysis.

196
Lab A
ctivitie
s for
Surv
ey o
f C
hem
istr
y L
ab M
anual
Tips for Recording Information
• Keep a record of each step you take in the experiment
to refer to after you are finished.
• Make a chart and record the volume, temperature, and
pH of the acidic solution in each beaker before adding
the base.
• Record the amount you add and wait for the solution to
stabilize before recording the changes in temperature,
volume, and pH.
• Start a graph and add the data point.
• Continue adding information to your own records and to
the computer generated data/graph. This way, you will
have two sources of information.

197
Lab A
ctivitie
s for
Surv
ey o
f C
hem
istr
y L
ab M
anual
Lab Day Checklist
On the day of your scheduled lab, review the items on this checklist to make sure you are prepared before logging
into NANSLO.
Read and review all lab materials
Prepare and organize lab charts and recording materials
Watch the lab tutorial again as a review before the lab
Log in to your lab session – two options:
Retrieve your email from the scheduler with your appointment info or
Log in to the student dashboard and join your session by going to
http://scheduler.nanslo.org
NOTE: You cannot log in to your session before the date and start time of your
appointment. Use Internet Explorer or Mozilla Firefox.

198
Lab A
ctivitie
s for
Surv
ey o
f C
hem
istr
y L
ab M
anual
Lab Report Sample B Lab Images
Start Volume Start pH Volume Added pH Temperature Change
Start Volume Start pH Volume Added pH Temperature Change
Sample C
Observation notes:
Observation notes:

199
Lab A
ctivitie
s for
Surv
ey o
f C
hem
istr
y L
ab M
anual
Lab Report Sample D Lab Images
Start Volume Start pH Volume Added pH Temperature Change
Start Volume Start pH Volume Added pH Temperature Change
Sample E
Observation notes:
Observation notes:

200
Lab A
ctivitie
s for
Surv
ey o
f C
hem
istr
y L
ab M
anual
Titration Lab Analysis The purpose of the acid/base titration is to determine the concentration (molarity) of acid in the beaker. Taking a look at the data, you
will see there are some constants and some variables. Using the following equation, information, and your data, you will be able to
solve for the unknown M of the acid.
Molarity (concentration) of Acid (MA) x the Volume of Acid (VA) is equivalent to Molarity of Base (MB) x the Volume of Base (VB) or
MA x VA = MB x VB
Constants and Variables
Each beaker contained 5.0 mL of HCL acid of unknown
concentration and 0.1 M NaOH was added to the beaker to a
volume you determined doing the titration.
Use your graphs to find the equivalence point in which the solution
was neutralized by reaching a pH of 7. Find the volume of base
added at this point on each of your four trials.
MA = concentration of acid, solving for this unknown
VA = volume of acid, 5.0 mL
MB = concentration of base, 0.1 M
VB = volume of base; use your data to find volume of base added to
reach equivalence point
Calculate the molarity of the acid for all four of the titrations you
performed.
Titration 1 MA =
Titration 2 MA =
Titration 3 MA =
Titration 4 MA =

201
Lab A
ctivitie
s for
Surv
ey o
f C
hem
istr
y L
ab M
anual
Reviewing Results
Write a review of your experiment. Include your findings and an explanation of your results. Use the following
questions as prompts to include in your review and learning reflection.
1. Were your results consistent for each sample? If not, what might have been the reason?
2. How accurate was the data you collected? How do you know?
3. How do the graphs show the equivalence point?
4. Was temperature a factor in the titration? Explain.

202
Lab A
ctivitie
s for
Surv
ey o
f C
hem
istr
y L
ab M
anual
Conclusion and Reflection Write a thoughtful conclusion to the lab, answering the essential question: How can titration be used
to calculate unknown concentrations of acids in a solution, and how does this apply to chemistry?

203
Lab A
ctivitie
s for
Surv
ey o
f C
hem
istr
y L
ab M
anual
Post-Lab Questions
Answer the following questions as completely as possible. Use evidence from your lab to help support answers
where possible. Use these questions to demonstrate your learning. You may want to review your pre-lab answers
and see what you have gained in understanding.
1. What is titration?
2. How does pH help determine how acidic or alkaline a solution is?
3. How does pH relate to acid/base titration?
4. In what circumstances might it be important to know the concentration of acid in a solution?

204
Lab A
ctivitie
s for
Surv
ey o
f C
hem
istr
y L
ab M
anual
Lab Description:
Purpose:
Essential Question:
Objectives:
Membrane Diffusion
Diffusion is a process in which molecules disperse from areas of high concentration to areas of low concentration to establish
equilibrium. In this lab, you will experiment with the rate of diffusion across a membrane. A spectrophotometer will be used to track
the diffusion of iodine across a membrane. This is accomplished by measuring the light absorbed by the dark color of iodine as it
reacts in the starch solution on the other side of the membrane. You will be setting up trials using different temperatures to find the
impact of heat on the rate of diffusion.
To determine the rate of diffusion related to increasing
temperature.
How can diffusion be measured to better understand the
movement of molecules?
At the completion of this lab, you should be able to:
1. Define diffusion and identify the conditions necessary for it to
occur.
2. Determine what is being measured in a spectrophotometer, and
explain the basics of spectrophotometry.
3. Collect quantitative data on the rate of diffusion at different
temperatures.
4. Graph the data collected and interpret the data.
5. Explain how temperature impacts molecular movement.
6. Determine the effect of temperature on the diffusion rate of
iodine through a dialysis tube membrane.
7. Apply diffusion concepts with specific examples.

205
Lab A
ctivitie
s for
Surv
ey o
f C
hem
istr
y L
ab M
anual
Pre-Lab Questions
These pre-lab questions are to help you think about the diffusion lab and self-assess what you know and what you
want to know about the topic. By the end of the lab, you should be able to answer these questions in more detail.
Compare your answers to see what you have learned.
1. What is diffusion and how does it apply to chemistry?
2. What are the conditions necessary for diffusion to occur?
3. What is a method for determining the rate of diffusion?
4. How does temperature relate to the rate of diffusion in liquids?
5. In what circumstances is it important to know the rate of diffusion?

206
Lab A
ctivitie
s for
Surv
ey o
f C
hem
istr
y L
ab M
anual
Background Information Diffusion is the movement of things from a high concentration to a low
concentration. Imagine you are adding cream to coffee. The spot where the
cream hits the milk is highly concentrated, and it diffuses out to areas of
low concentrations. Perfume works the same way but in the air. Someone
wearing the scent is highly concentrated and you can smell it as it diffuses
across the room and hits your nose.
Atoms and molecules are in constant motion. Even in a solid state, the
molecules exhibit vibrational movement as they move against each other in
position. When molecules are in a liquid state, they can be farther apart
than in a solid, but not nearly as far apart as in a gas.
Because molecules are in constant motion, the molecules are colliding with
each other. This type of motion is called Brownian movement. As a
substance heats up, the motion becomes faster and molecules collide more
frequently. Think for a minute about a drop of food coloring in a glass of
water. If the water is hot, the water molecules move faster and the
collisions with the food coloring molecules are more frequent, causing the
food coloring to diffuse more rapidly. On the other hand, ice water will have
the opposite effect. Simple diffusion relies on Brownian motion and
temperature.
There is an interesting simulation here, if you want to learn more:
http://phet.colorado.edu/en/simulation/states-of-matter-basics
Resources Diffusion and Osmosis. Khan Academy. https://www.khanacademy.org/science/biology/membranes-and-transport/diffusion-and-osmosis/v/diffusion-and-osmosis https://www.youtube.com/watch?v=aubZU0iWtgI

207
Lab A
ctivitie
s for
Surv
ey o
f C
hem
istr
y L
ab M
anual
Background Information The life of a cell is dependent on efficiently moving molecules
into and out of the cell. A factor of this movement is the cell
membrane. Molecules in living things move in a variety of ways,
but for the purposes of this lab the focus will be on simple
diffusion. Small, uncharged molecules are able to move easily
across the cell membrane in a process known as simple diffusion.
The process of simple diffusion relies on the inherent nature of
molecules to move from high concentration to lower
concentration. This laboratory activity will focus on the transport
of molecules across a barrier via diffusion, which can be applied
to the diffusion process in other situations.
The difference between the highly concentrated substance and
the lower concentrated substance is called the concentration
gradient. Diffusion can only happen if there is a concentration
gradient present. When there is no longer a net movement,
equilibrium has been reached.
There are both qualitative and quantitative methods that can be
used to record and observe diffusion. Qualitative data are based
on the five senses and observations. For instance in the perfume
example, as you get closer to the person, i.e., the concentrated
sample, your nose gets overwhelmed, and as you walk away it
goes away. Quantitative data, on the other hand, are measured
and numerical, and are not subjective to our individual senses. In
this lab we will be using a spectrophotometer to quantitatively
Important Terms
absorbance - the measure of the quantity of light
absorbed by a sample
Brownian movement - the irregular motion of small
particles suspended in a liquid or a gas, caused by the
bombardment of the particles by molecules of the
medium
concentration gradient - the gradual difference in
concentration of a dissolved substance in a solution
between a region of high density and one of lower
density
cuvette - a straight-sided, optically clear container for
holding liquid samples in a spectrophotometer or other
instrument
diffusion - an intermingling of molecules, ions, etc.,
resulting from random thermal agitation
equilibrium - a state of rest or balance
equivalence point - the point at which chemically
equivalent
of concentration, the number of moles of solute per liter
of solution
solute - the substance dissolved in a given solution
solution - a homogeneous, molecular mixture of two or
more substances
solvent - a substance that dissolves another to form a
solution
spectrophotometer - an apparatus for measuring the
intensity of light in a part of the spectrum, especially as
t itt d itt d b ti l b t

208
Lab A
ctivitie
s for
Surv
ey o
f C
hem
istr
y L
ab M
anual
Diffusion in Chemistry Dialysis
The process of dialysis involves passing through a tube made of a semipermeable
material. On the other side is a liquid of a certain concentration. The blood is passed
over the membrane and materials diffuse into or out of the bloodstream.
Smoke Diffusion
The study of the chemical makeup of smoke and how it diffuses through air is used to
determine health risks from forest fires and second-hand smoke.
Animal Physiology- Human Health
Digestion: Particles of food diffuse in the colon. Respiration: Exchange of oxygen and
carbon dioxide diffuses between the lungs and bloodstream. Food molecules and
oxygen diffuse from the mother’s blood to the fetus’s blood supply through the
placenta.
Alloy Production
Alloys are formed when two or more types of metal are combined, such as steel
formed from iron, carbon, aluminum, and other trace metals. Particles within the
metals combine from areas of high to low concentration in the process of alloy
formation.
Resources
How Does a Kidney Dialysis Machine Work? HowStuffWorks. http://science.howstuffworks.com/innovation/everyday-innovations/question17.htm

209
Lab A
ctivitie
s for
Surv
ey o
f C
hem
istr
y L
ab M
anual
Diffusion Lab Purpose:
To determine the rate of diffusion related to increasing temperature.
The diffusion lab is set up with the equipment shown here.
This image shows a close-up of a cuvette that contains a starch solution.
Each cuvette includes a diffusion membrane insert you will be filling with an
iodine solution. The iodine will be added in small amounts using a syringe
controlled by a robotic pump.

210
Lab A
ctivitie
s for
Surv
ey o
f C
hem
istr
y L
ab M
anual
Diffusion Experiment How a spectrometer measures diffusion:
When light is directed at a colored liquid, a certain amount of light is absorbed. The more color that is present, the
more light gets absorbed. If we watch for a color change as something moves from one liquid to another, we can
measure that change by looking at how much light is absorbed.
[Rate of Diffusion = Change in Absorbance/Time]
The independent variable in this experiment will be time. You will have three temperature variables. In the cuvette
will be a starch solution; an iodine solution will be in the diffusion membrane insert. The bottom of the pink cup has
a permeable barrier that will allow the iodine to pass through. The iodine will be added in small amounts using a
syringe controlled by a robotic pump.
When iodine and starch interact, the iodine diffuses to form a dark pigment. The rate of diffusion can be measured
by how much pigment is present. More color equals more iodine, indicating more has diffused.
The cuvettes will be pre-loaded with starch solution (clear) and a small stir-bar to stir the solution. You will be
able to select a cuvette by rotating the carousel. You will deliver a small, pre-measured amount of iodine solution
(red-brown) with the robotic syringe pump, and it will begin moving through the diffusion membrane into the starch
solution and will react chemically with the starch to form a starch-iodine complex (blue-black). You will be able to
control the temperature of the cuvette carousel, so you can see how different temperatures affect the rate of
diffusion. There are six cuvettes in the carousel, so you will have up to six opportunities to measure diffusion rates.

211
Lab A
ctivitie
s for
Surv
ey o
f C
hem
istr
y L
ab M
anual
Diffusion Experiment
The Diffusion Lab Control Panel is where you access the
equipment controls, collect data, and communicate with
others participating at the same time as you.
In this experiment, you will control the temperature as
diffusion occurs. You will be able to track and save the data
on the graphs.

212
Lab A
ctivitie
s for
Surv
ey o
f C
hem
istr
y L
ab M
anual
Tutorial
This tutorial introduces you to the spectrophotometer, which is used for several labs. You will see how the
equipment is set up as well as the view you will have from your control panel. The demonstration shows how to
control the equipment, read the settings, collect data, and collaborate with others. Watch the tutorial a second time,
immediately before your lab appointment, to refresh your memory about the function and purpose of the different
features in this lab setup.
Things to Notice / Questions:
1. How do you store a dark spectrum? Why is this
stored?
2. What is the timer used for?
3. Why do you think stirring is used in this lab?
4. What are you measuring and how does it relate to
diffusion?
5. How will the graphs help you understand the results?
• http://www.wiche.edu/nanslo/lab-tutorials#beerlambert

213
Lab A
ctivitie
s for
Surv
ey o
f C
hem
istr
y L
ab M
anual
Diffusion Lab Procedure Using the NANSLO lab equipment, you will log in and take the
indicated measurements at the time you are scheduled to take the lab.
Exercise 1: Diffusion
From the Spectrometer tab
1. Click on the Start button to start the spectrophotometer data feed.
2. Ensure that the spectrophotometer light is turned off.
3. Set # Spectra to Average to a value of 20.
4. Store a dark spectrum.
From the Cuvette Holder/Temp Control/Display tab
5. Turn on the Temperature Controller and select an initial temperature
of 20° C.
6. Ensure that the stirrer is turned on so the solutions are being
mixed. Use camera preset 2 to verify that the Cuvette Holder
controller screen says "Stir On."
7. Wait until the temperature has been stable for at least 2 minutes.

214
Lab A
ctivitie
s for
Surv
ey o
f C
hem
istr
y L
ab M
anual
Diffusion Lab Procedure From the Spectrometer tab
8. Turn on the spectrophotometer light.
9. Store a reference spectrum.
10.Select the Show Absorbance Spectrum button to view the
absorbance spectrum and Zoom Out on the graph.
11.Turn on the cursor and drag it to 351.8 nm. This is where an
absorbance peak will appear when the starch-iodine complex
forms.
From the Spectrometer/Value log tab
12.Ensure that Minutes to Collect is set to 10 minutes and Collect
Every (x) Seconds is set to 30 seconds.
From the Cuvette Holder/Cuvette Select and Volume tab
13.Select Pump 1 and ensure that Volume to be Added is set to 0.25
mL.
14.Click the Add Volume button and observe the volume in the
cuvette increasing from 3.75 to 4.0 mL as the iodine solution is
added.

215
Lab A
ctivitie
s for
Surv
ey o
f C
hem
istr
y L
ab M
anual
Diffusion Lab Procedure From the Spectrometer/Value Log tab
15.Click Start.
16.Time and Absorbance data will now be collected every 30 seconds for 10 minutes.
17.You can watch the absorbance peak grow on the Spectrometer tab.
18.Value Log data to the clipboard and paste it into a document.
From the Cuvette Holder/Cuvette Select and Volume tab
19.Select another cuvette on the Cuvette Selector tab to start with a clean starch solution.
20.Another student should take control of the control panel at this point (right click to release your control or
take control).
21.Set the temperature to 30° C.
22.Start over with step 2, and collect another set of data.
23.Another student should now take control and set the temperature to any setting between 30° C and 50° C.
24.Start over with step 2, and collect another set of data.
25.If there are students who haven't collected any data, and there is time remaining in your lab period, collect
more data sets if you would like. Do not exceed 50° C!

216
Lab A
ctivitie
s for
Surv
ey o
f C
hem
istr
y L
ab M
anual
Lab Day Checklist
On the day of your scheduled lab, review the items on this checklist to make sure you are prepared before logging
into NANSLO.
Read and review all lab materials
Prepare and organize lab charts and recording materials
Watch the lab tutorial again as a review before the lab
Log in to your lab session – two options:
Retrieve your email from the scheduler with your appointment info or
Log in to the student dashboard and join your session by going to
http://scheduler.nanslo.org
NOTE: You cannot log in to your session before the date and start time of your
appointment. Use Internet Explorer or Mozilla Firefox.

217
Lab A
ctivitie
s for
Surv
ey o
f C
hem
istr
y L
ab M
anual
Lab Report
Cuvette 1 Data: Observation notes:
Cuvette 2 Data: Observation notes:
Insert images of graphs Lab Observations and Data

218
Lab A
ctivitie
s for
Surv
ey o
f C
hem
istr
y L
ab M
anual
Lab Report
Cuvette 3 Data: Observation notes:
Cuvette 4 Data: Observation notes:
Insert images of graphs Lab Observations and Data

219
Lab A
ctivitie
s for
Surv
ey o
f C
hem
istr
y L
ab M
anual
Lab Report
Cuvette 5 Data: Observation notes:
Cuvette 6 Data: Observation notes:
Insert images of graphs Lab Observations and Data

220
Lab A
ctivitie
s for
Surv
ey o
f C
hem
istr
y L
ab M
anual
Diffusion Lab Analysis
Using the Value Log data, create a graph. On the graph, you will plot
time as the independent variable and absorbance as the dependent
variable. You should have three different lines for the three
temperature variables (or more, if you collected more data).
Analyze the graph by relating the shape of the curve to an underlying
mechanism that might govern the phenomenon being studied. Discuss
factors involved in diffusion that might cause this curve shape to be
true.
Calculate the rate of absorbance change for each of the temperatures
with the following equation: Rate of Diffusion = Change in Absorbance/Time, and add these values to your data table.
Insert student graph

221
Lab A
ctivitie
s for
Surv
ey o
f C
hem
istr
y L
ab M
anual
Diffusion Lab Analysis With your graphed data, calculate the slope of the line for the last 5 minutes
of the data collected at each temperature. Slope is calculated by first
choosing two points on the graph, then determining the change in the
horizontal points and the change in the vertical points.
For example, if your coordinates on the graph at point #1 are 0.5 (X-axis)
and 6 (Y-axis) and at point #2 the coordinates are 4 (X-axis) and 12 (Y-
axis), the vertical change is 12 - 6 and the horizontal change is 4 - 0.5, or
vertical change = 6 and horizontal change = 3.5. To find the slope, divide the
vertical change by the horizontal change. 6 / 3.5 for a slope of 1.7. The slope is the rate of diffusion. Be sure to include the correct units for your data.
Show your calculations, and then plot on a graph the diffusion rate (slope of
the last 5 minutes worth of data) vs. temperature. What information can you
get from this graph?
On your initial time vs. absorbance graph, interpolate what the absorbance
curve would look like at 25° C. On the highest temperature absorbance curve
that you graphed, extrapolate out to 40 minutes — what do you think the
absorbance would be at that point? Would the values continue to increase
linearly?
Membrane systems often have folds in the membrane which function to
increase surface area. Based on what you know about molecular movement,
explain why it is important for cells to have an increased surface area.
Insert student graph

222
Lab A
ctivitie
s for
Surv
ey o
f C
hem
istr
y L
ab M
anual
Reviewing Results
Write a review of your experiment. Include your findings and an explanation of your results. Then answer the
following questions.
1. How accurate was the data you collected? How do you know?
2. Was temperature a factor in the diffusion rate? Explain.
3. How do the graphs show the equivalence point?

223
Lab A
ctivitie
s for
Surv
ey o
f C
hem
istr
y L
ab M
anual
Conclusion and Reflection Write a thoughtful conclusion to the lab, answering the essential question: How can diffusion be
measured to better understand the movement of molecules?

224
Lab A
ctivitie
s for
Surv
ey o
f C
hem
istr
y L
ab M
anual
Post-Lab Questions
Answer the following questions as completely as possible. Use evidence from your lab to help support answers
where possible. Use these questions to demonstrate your learning. You may want to review your pre-lab answers
and see what you have gained in understanding.
1. What is diffusion and how does it apply to chemistry?
2. What are the conditions necessary for diffusion to occur?
3. What is a method for determining the rate of diffusion?
4. How does temperature relate to the rate of diffusion in liquids?
5. In what circumstances is it important to know the rate of diffusion?
Related Documents