Monitoring Systems for Feral Pigs : Monitoring the Economic Damage to Agricultural Industries and the Population Dynamics of Feral Pigs in the Wet Tropics of Queensland Final Report To Bureau of Resource Science National Feral Animal Control Program By Jim Mitchell and William Dorney Department of Natural Resources and Mines Queensland September 2002

Welcome message from author
This document is posted to help you gain knowledge. Please leave a comment to let me know what you think about it! Share it to your friends and learn new things together.
Transcript

Monitoring Systems for Feral Pigs : Monitoring the Economic Damage to Agricultural
Industries and the Population Dynamics of
Feral Pigs in the Wet Tropics of Queensland
Final Report
To
Bureau of Resource Science
National Feral Animal Control Program
By
Jim Mitchell and William Dorney
Department of Natural Resources and Mines
Queensland
September 2002

Executive Summary
• This project quantified the economic damage (in terms of real on farm costs)
caused by feral pigs to sugar cane and banana production on the tropical north
coast of Queensland.
• 30 representative farms were monitored every 2 to 3 months for 28 months to
record the pig population index, costs of direct damage to the crop and costs of
pig management programs.
• A feral pig population monitoring system was used to determined the spatial
and temporal patterns of feral pig population distribution.
• Feral pigs caused (on average) 0.08% direct damage to the banana industry,
equivalent to $828 / farm / annum.
• Only a small proportion of banana farms reported feral pig damage, these
farms lost $1824 / farm / annum to pig damage.
• Feral pigs caused (on average) 3.5% damage to the sugar cane industry
estimated from landholder assessments, equivalent to $5352 / farm / annum.
• Feral pigs caused (on average) 5.6% damage to the sugar cane industry,
estimated from harvest returns, equivalent to $8515 / farm / annum.
• Landholders underestimated the loss to feral pigs by 37%.
• No direct relationship between the amount of damage recorded and the pig
population present could be determined. Damage is not determined by the pig
population density but by the presence of mature male pigs.
• 1,122 pigs were captured by pig management techniques during the project at
an average cost of $250 / pig capture.
• Landholder trapping was the most cost effective control technique at $141 /
pig capture; contract trapping cost $209 / pig capture; dogging cost $257 / pig
capture and shooting cost $1048 / pig capture.
• Total on farm pig damage and management costs were $4099 / banana farm /
annum and $10632 / cane farm / annum.
• Feral pig damage equates to $300 for every 1,000 cartons of bananas
produced.
• Feral pig damage equates to $813 for every 1,000 tonnes of cane harvested.
2

• “An economic evaluation of the damage by or control of vertebrate pests
is essential to an understanding of the pest’s role in a
production or conservation system” (Hone 1994).
Abstract.
Agricultural industries in the wet tropics of north Queensland region identify feral
pigs as a significant pest species due to the economic damage they cause. Thirty farms
were selected as a sample of the two main agricultural industries, (sugar cane and
banana production) in this region. Each farm was regularly surveyed over a 28
month period to assess feral pig population levels, to quantify the associated
economic damage they cause in terms of actual on farm dollar costs and to quantify
the costs associated with control techniques employed. A feral pig population
monitoring technique was established to assess temporal trends in pig populations.
Pig populations fluctuated in response to climate, crop maturity and control
operations. Feral pigs were estimated to cause, on average, direct economic damage
of $1824 / banana farm / annum and $5352 / cane farm /annum. This represents
0.08% of the value of banana production and 3.5% of the cane production value of
the sampled farms. From sugar cane harvest data, feral pigs caused damage to
16,147 tonnes(valued at $377,517) or 5.65% of the sugar crop. No significant
relationship between pig population levels and the economic damage they cause could
be detected. The total on farm costs of feral pigs damage and costs of control
averaged $4099 / annum for each banana farm and $10,633 / annum for each cane
farm. Control techniques cost, on average, $4010 / farm / annum. In total 1,122 pigs
were destroyed at an average control cost of $250 / pig. The most cost effective
control technique employed was trapping. The cost effectiveness of other control
techniques are also discussed.
1. Introduction
Feral pigs (Sus scrofa) inhabiting the wet tropics region of north Queensland are
perceived to cause substantial and diverse economic damage to most of the agricultural
industries within this region, and are regarded as a significant animal pest species.
Pest animals can be defined as those animal species that cause economic, environmental
or epidemiological harm. It is the harm or damage that feral pigs cause that justifies the
3

expenditure associated with their control. For effective pest control it is fundamental to
determine the pest status of an animal (Hone 1994).
Feral pigs reduce the profitability of agricultural enterprises through reduced yields
through consumptive losses, increased costs due to expenditure on pig control and
cost of lost profit opportunities of control expenditure (Choquenot et al 1996). Feral
pigs are an acknowledged economic pest of growing importance due to the severe
crop damage they cause to some sugar cane, banana and tropical fruit and small crops
farms. Feral pigs also pose a threat of a huge probabilistic cost as a vector for exotic
livestock diseases such as Foot-and-Mouth Disease. Pigs are vectors for diseases of
humans such as Leptospirosis and Brucellosis, and these pose a health threat and
economic costs to communities in north Queensland. Feral pigs could also have a
large negative impact on tourism in north Queensland as they are regarded as a
significant threat to the conservation values of the Wet Tropics World Heritage Area
(WTWHA).
Management of the pig problem must be developed by firstly defining the scope and
extent of the problem (Choquenot et al. 1996). Problem definition must have a
foundation of quantitative data. Feral pigs cause documented economic losses to
individual sugar cane, bananas, tropical fruits and small crops farms in this region
(Mitchell, 1993; McIlroy, 1993). However there is a distinct lack of this economic
damage information being quantified in terms of real on farm costs and this has
restricted the development and adoption of best practice management strategies. The
BRS publication “Managing Vertebrate Pests : Feral Pigs” Choquenot et al (1996)
highlighted three deficiencies in knowledge and practice which are relevant to this
region i.e.
1. There is a lack of objective, quantitative data on the impact of feral pigs on
agricultural industries.
2. There is a lack of reliable data on the “real” costs of controlling feral pigs in
normal on-property control programs. Comparison of impacts/control costs
between areas will allow prioritisation of where and when to initialise control
effort. This will also allow the threshold density of feral pigs for acceptable
levels of pig impact to be established, and the reduction of pig populations
required to achieve a desired reduction in impacts.
4

3. There is a paucity of reliable data on accurate population monitoring
techniques and assessing real costs and benefits of control for management/
decision support systems for feral pigs.
To develop effective management plans for this pest animal species, defining the
problem is the first priority. The aims of this project were to quantify the above
deficiencies in knowledge in the context of economic agricultural impact of feral pigs
within the north tropical coastal region of Queensland. Specifically the project
objectives were to :-
1. Establish a feral pig population assessment monitoring system.
2. Establish baseline damage assessment levels for sugar cane and banana industries.
3. Derive a relationship between pig population levels and damage assessment.
4. Use this information to develop a best practice management decision system.
5. Disseminate information from this project throughout the region.
2. Methodology
2.1. Study Site
The wet tropical coast of north Queensland, extending from Townsville to Cooktown,
is characterised by a narrow strip of coastal lowlands of intensive agricultural
production bordering on tropical rainforest which extend to the top of coastal ranges.
Feral pig populations exist continuously throughout this region, both within cropping
systems and within the Wet Tropics World Heritage Area (WTWHA) and privately
owned tropical rainforests. The WTWHA is predominately State owned lands. Feral
pigs are perceived to inhabit the rainforests and to move into the surrounding
agricultural areas for food.
To provide an accurate cross section of pig population levels, agricultural production
and habitat factors within this region, a number of geographically separated
experimental units termed “areas” were selected. Each of the selected areas were
based on one of the 35 management units established within a Community Based
Feral Pig Trapping Program (CBFPTP). Each management unit consists of an area of
responsibility of a community or conservation group, rural organisation, Defence
Force site or one of seven Cane Pest and Productivity Boards in this region. The
5

CBFPTP is a regionally based large scale feral pig control program initiated by
government agencies to assist landholders in controlling feral pigs.
Preliminary assessments were conducted in most CBFPTP management units in the
pilot phase of the program (July to December 1999). Pig populations and economic
impacts levels within these management units were subjectively rated by landholders
as ranging from severe to none. Seven of these management units were subsequently
selected based on their rankings of population and economic impact levels, highest
too lowest, so that a range of experimental data could be obtained. The seven areas
were spread over 200km between Cairns and Ingham, the main cane and banana
producing areas of the wet tropics coastal belt.
To quantify economic parameters of feral pigs, a range of data variables need to be
collected over a prolonged period. Collecting data from all landholders and
agricultural industries within each area was beyond the scope of this project. Thus a
number of participating individual farms within each area were selected as a
representative sample of the two main agricultural enterprises within this region
(sugar cane and banana production). Most landholders producing banana and/or sugar
cane within each area were initially visited and asked to participate in this project. All
landholders subsequently agreeing to participate were then surveyed on a regular basis
to collect the required data. The survey technique consisted of a personal interview
style where the project officer asked standardised questions and recorded the answers
on pro-forma data sheets. Interviews were conducted as often as possible but were
constrained by landholder availability, distances involved, seasonal farming activity,
seasonal flooding and inaccessibility to farms as a consequence of road damage
during wet weather. Each participating farm was surveyed a maximum of 10 times
from January 2000 to June 2002. All participating farms were assigned a code to
protect the privacy of the landholders.
2.2. Population monitoring.
No reliable method of estimating feral pig populations or densities has been
documented within rainforest environments. A novel population index monitoring
system (based on population monitoring research in other regions) was therefore
established to quantify pig population level fluctuations between survey periods and
6

to enable comparison of population levels between the areas. The population index
was derived from regularly monitoring a series of permanently established 10m x 2 m
“activity plots” (Hone 1988b). The observer walked down the centre of each plot and
recorded as a presence or absence any of the pig sign criteria occurring within the
plot. The number of plots established on each farm was determined by the farm size
and the available length of tracks and headlands.
The criteria of pig signs recorded within each plot is shown below.
1. Diggings – soil disturbance due to pigs digging in the soil.
2. Wallowing – diggings in mud used for wallowing activity.
3. Footprints – one or more pig footprints contained with each plot.
4. Faeces – any part of faecal material within the plot.
5. Pads – distinguishable active travel pads that may or may not contain footprints.
6. Sightings – Live pigs sighted within a plot.
7. Plant damage – damage to plants caused by pig foraging activity.
8. Rub trees – trees that pigs use to rub on.
For each farm for each survey period, an index score for each pig sign criteria was
calculated based on the frequency of occurrence of each pig sign being present within
the activity plots. All pig sign criteria frequencies were then averaged to derive a
population index (average frequency of occurrence of all pig sign) for each cane and
banana farm for each survey period. The population index for each farm was then
plotted over time to derive temporal trends in population indices for cane and banana
farms.
Population index plots were to be replicated in “control” areas where feral pig
management was not conducted (rainforest areas), and monitored over time to
standardise the population index taking into account normal seasonal population
fluctuations. This aspect of the project was not undertaken due to the difficulty of
finding sites in proximity to the experimental areas where the influence of pig
management was not felt. Seasonal fluctuations in populations indices were therefore
contrasted with seasonal digging indices data obtained in highland rainforest areas
where no pig management has been conducted (Mitchell 2000).
7

2.3. Economic Damage Assessment
All participating farms within the seven selected areas were interviewed on a regular
basis to provide an estimate of the level and scope (spatial and temporal) of the
economic damage, in terms of real on farm losses ($), that feral pigs cause to the two
major agricultural industries within this region (sugar cane and bananas). The damage
data was the landholders estimation of the amount of damage caused by pig activity
that had occurred since the last survey. Although the data was subjective in nature, all
participating landholders were experienced farmers with many years in their
respective industries. The project officer also spent 6 months in the pilot stage of the
project verifying each landholder damage estimates and was satisfied of their
commitment and experience prior to the initial data survey. The project officer would
also verify losses by farm inspections during the course of recording the population
index plots. Losses for banana farms were estimated in terms of the number of cases
of bananas destroyed, mature trees destroyed, number of man hours and kilometres
used in replanting trees, repairing irrigation lines, repairing tracks etc. Losses in cane
farms were estimated tonnage of cane damaged or consumed, man hours and
kilometres used in repairing irrigation systems, roads, drainage lines and in some
cases replanting.
For cane farms, an actual estimate of cane losses was also obtained from harvesting
records. Cane Pest and Productivity Boards would predict the tonnage of harvested
cane for each farm; after harvest the actual amount of tonnage harvested was obtained
from documented mill returns. A proportion of the difference between the estimated
harvest tonnage and actual harvest tonnage was allocated to feral pigs damage based
on the contract harvesters perception of the damage. The project extended over two
sugar cane harvest seasons - September to December for 2000 and 2001. All damage
estimates were recorded for each farm survey and standardised by converting all
damage into dollar terms. The parameters used in converting damage estimates into
dollars are shown in Table 1. The costs were supplied from James Cook university
economics department, and represent known parameters derived from industrial
awards, standardised vehicle costs and machinery depreciation. Unit prices of banana
and cane production were derived from a 10 year average. The value of hunting was a
subjective assessment.
8

Table 1. Costs($)associated with feral pig damage.
Parameters Conversion Cost ($)
Labour (per hour) 11.52
Vehicle (per km) 0.81
Tractor (per km) 1.5
Trailer Trap Deprecation (per month) 33.3
Box Trap Deprecation ( per month) 10.0
Silo Trap Deprecation (per month) 4.17
Sugar cane price (per tonne) 23.38
Banana price (per carton) 20.0
Replacement bananas plant 1.0
2.4. The Relationship of Economic damage and Population levels
Damage values($) were directly compared to the population index for all banana and
cane farms at each survey periods. A regression relationship was calculated to derive
the association of pig population index and the economic damage they caused for each
agricultural industry. The total damage costs of very large farms and the large range
of property sizes involved in the survey tended to bias the relationship. Recorded
damage costs were therefore converting into a standardised damage costs ($) per unit
of farm production. For banana farms, the standard unit of production was 1000
cartons and for cane farms, the standard unit of production was 1000 tonnes of
harvested cane.
2.5. Costs and Benefits of Pig Control Techniques
Information was collected to establish the costs associated with the main pig control
techniques used by the surveyed farms (trapping, dogging, poisoning, fencing and
rifle hunting). For each survey period, each landholders estimated the actual man
hours, kilometres travelled and associated effort and costs involved in pursuing these
control techniques. All estimates were then converted to dollars for standardisation.
The cost effectiveness of each control technique could then be calculated. The direct
benefits of pig control, using pigs for human or dog consumption or as crab pot baits
etc, were also collected during the surveys. The recreational benefits of hunting was
not considered due to the difficulty of allocating a realistic dollar value.
9
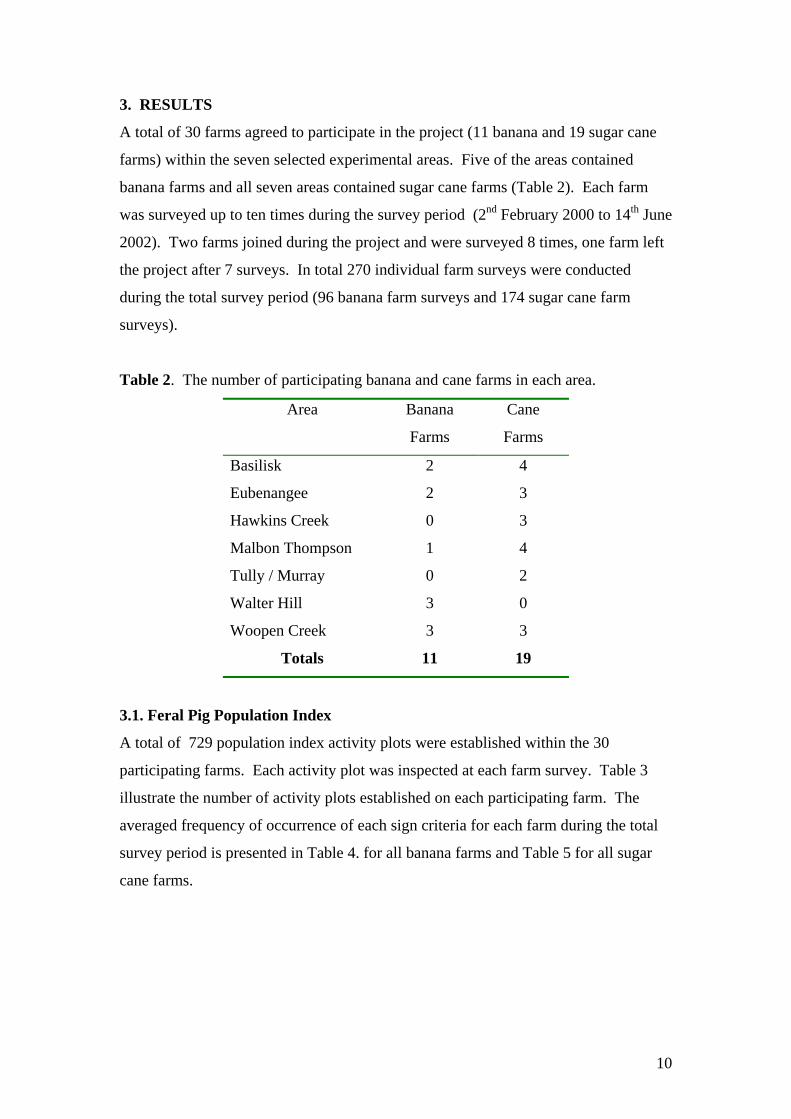
3. RESULTS
A total of 30 farms agreed to participate in the project (11 banana and 19 sugar cane
farms) within the seven selected experimental areas. Five of the areas contained
banana farms and all seven areas contained sugar cane farms (Table 2). Each farm
was surveyed up to ten times during the survey period (2nd February 2000 to 14th June
2002). Two farms joined during the project and were surveyed 8 times, one farm left
the project after 7 surveys. In total 270 individual farm surveys were conducted
during the total survey period (96 banana farm surveys and 174 sugar cane farm
surveys).
Table 2. The number of participating banana and cane farms in each area.
Area Banana
Farms
Cane
Farms
Basilisk 2 4
Eubenangee 2 3
Hawkins Creek 0 3
Malbon Thompson 1 4
Tully / Murray 0 2
Walter Hill 3 0
Woopen Creek 3 3
Totals 11 19
3.1. Feral Pig Population Index
A total of 729 population index activity plots were established within the 30
participating farms. Each activity plot was inspected at each farm survey. Table 3
illustrate the number of activity plots established on each participating farm. The
averaged frequency of occurrence of each sign criteria for each farm during the total
survey period is presented in Table 4. for all banana farms and Table 5 for all sugar
cane farms.
10

Table 3. The number (n) of population index plots established within each farm.
Area Farm Code Crop No Plots (n) Basilisk J1 cane 15 Basilisk J2 cane 25 Basilisk M1 banana 25 Basilisk M2 cane 20 Basilisk Mo1 cane 30 Basilisk Mo2 banana 32 Eubenangee E1c cane 20 Eubenangee E1b banana 12 Eubenangee E2 cane 25 Eubenangee E3 cane 17 Eubenangee E4 banana 25 Hawkins Creek H1 cane 25 Hawkins Creek H2 cane 25 Hawkins Creek H3 cane 30 Malbon Thompson G1c cane 17 Malbon Thompson G1b banana 13 Malbon Thompson G2 cane 20 Malbon Thompson G3 cane 20 Malbon Thompson G4 cane 20 Tully / Murray T1 cane 37 Tully / Murray T2 cane 30 Walter Hill WH1 banana 20 Walter Hill WH2 banana 25 Walter Hill WH3 banana 30 Woopen Creek W1 banana 18 Woopen Creek W2 banana 25 Woopen Creek W3c cane 26 Woopen Creek W3b banana 14 Woopen Creek W4 cane 20 Woopen Creek W5 cane 25
Table 4. Average population indices for each sign criteria for all banana farms during
the total survey period
Farm Code Digging Tracks Wallows Dung Pad
Rub Tree Sighting
Plant Damage
Average Population
Index E1b 0.00 0.00 0.00 0.00 0.00 0.00 0.00 0.00 0.00 E4 2.22 11.11 0.44 0.00 7.11 0.00 0.00 0.00 2.61
G1b 0.00 4.62 0.00 0.00 1.54 0.00 0.77 0.00 0.87 M1 29.48 39.81 0.80 0.00 9.20 0.00 1.60 0.80 10.21
Mo2 2.81 10.08 0.00 0.31 3.50 0.94 0.31 0.00 2.24 W1 2.22 7.22 0.00 0.56 6.67 2.22 0.00 0.56 2.43 W2 4.67 16.00 0.67 0.00 6.67 0.00 0.00 0.00 3.50
W3b 1.55 6.93 0.00 0.00 5.52 0.00 0.00 0.00 1.75 WH1 12.86 32.86 2.86 2.14 26.43 6.43 0.00 2.86 10.80 WH2 4.57 9.71 1.14 0.00 0.57 0.00 0.00 0.00 2.00 WH3 3.81 16.67 0.95 0.95 12.38 0.95 1.43 0.95 4.76
11

Table 5. Average population indices for each sign criteria for all cane farms during
the total survey period.
Farm Code Digging Tracks Wallows Dung Pad
Rub Tree Sighting
Plant Damage
Average Population
Index E1c 2.00 7.61 0.50 0.00 2.06 0.00 0.00 0.50 1.58 E2 5.11 28.33 0.90 0.00 2.05 0.00 0.00 1.25 4.71 E3 0.00 1.31 0.65 0.00 0.65 0.00 0.00 0.00 0.33
G1c 6.71 14.27 0.59 0.00 1.76 0.00 0.00 0.59 2.99 G2 17.22 23.33 1.67 0.00 9.44 0.00 1.67 0.00 6.67 G3 3.89 11.67 0.56 0.00 7.22 0.00 0.00 0.00 2.92 G4 3.33 6.67 0.00 0.00 7.22 0.00 1.11 0.00 2.29 H1 19.11 23.11 1.78 0.00 6.67 0.44 0.44 0.00 6.44 H2 8.00 16.00 1.33 0.00 7.11 0.00 0.00 0.44 4.11 H3 10.00 20.48 1.43 0.00 3.81 0.48 0.48 0.95 4.70 J1 7.62 20.00 1.90 0.00 1.90 0.00 0.00 0.00 3.93 J2 4.80 7.20 0.00 0.00 0.40 0.00 0.00 0.00 1.55 M2 6.50 7.50 0.00 0.00 2.00 0.00 0.00 1.00 2.13
Mo1 0.69 3.71 0.33 0.00 0.36 0.00 0.33 1.00 0.80 T1 10.75 23.11 3.45 0.00 4.94 0.00 0.34 1.01 5.45 T2 12.45 25.42 5.42 0.00 9.63 0.42 1.67 3.98 7.37
W3c 2.51 12.31 0.00 0.00 3.45 0.33 0.00 0.00 2.32 W4 6.50 7.76 0.00 0.00 3.09 0.00 0.00 0.00 2.17 W5 8.40 11.20 0.00 0.00 4.40 1.60 0.00 2.00 3.45
The average population indices for each of the sign criteria were also calculated for
each crop type (Table 6). The average population index of all sign criteria for all
banana farms was 4.6%, (S.E. = 0.54, 95% C.I. = 1.07), and 4.32% (S.E. = 0.35, 95%
C.I. = 0.68) for cane farms. No significant differences could be detected during this
survey between the average pig population indices of banana and cane farms.
Table 6. Population indices for each sign criteria average for each crop type.
Crop Sign Criteria Average
Diggings Tracks Wallows Dung Pads
Rub
Trees
Sightings
Plant
Damage
Banana
5.8 13.51 0.53 0.32 6.71 0.87
0.37
0.47 4.6
Cane
6.93 13.85 0.98 0.00 4.01
0.17
0.67
0.32 4.32
12

The population index for each farm survey were plotted against time for all survey
periods to illustrate temporal fluctuations in pig populations indices (Figure 1 for
banana farms and Figure 2 for sugar cane farms). A plot of the average population
index for all surveyed farms over the total survey period is shown in Figure 3.
Figure 1. The average population index of all sign categories for each banana farm
for each farm survey. The moving average of population indices (10) over time is
also indicated.
0.00
5.00
10.00
15.00
20.00
25.00
30.00
Dec-99 Mar-00 Jun-00 Oct-00 Jan-01 Apr-01 Jul-01 Nov-01 Feb-02 May-02 Sep-02
Survey Date
All
popu
laio
n In
dici
es (a
vera
ge sc
ore)
Figure 2. The average population index of all sign categories for each cane farm for
each farm survey. The moving average of population indices (10) over time is also
indicated.
0.00
5.00
10.00
15.00
20.00
25.00
Feb-
00
Apr
-00
Jun-
00
Aug
-00
Oct
-00
Dec
-00
Feb-
01
Apr
-01
Jun-
01
Aug
-01
Oct
-01
Dec
-01
Feb-
02
Apr
-02
Jun-
02
Survey date
Ave
rage
Pop
ulat
ion
Sco
re
13
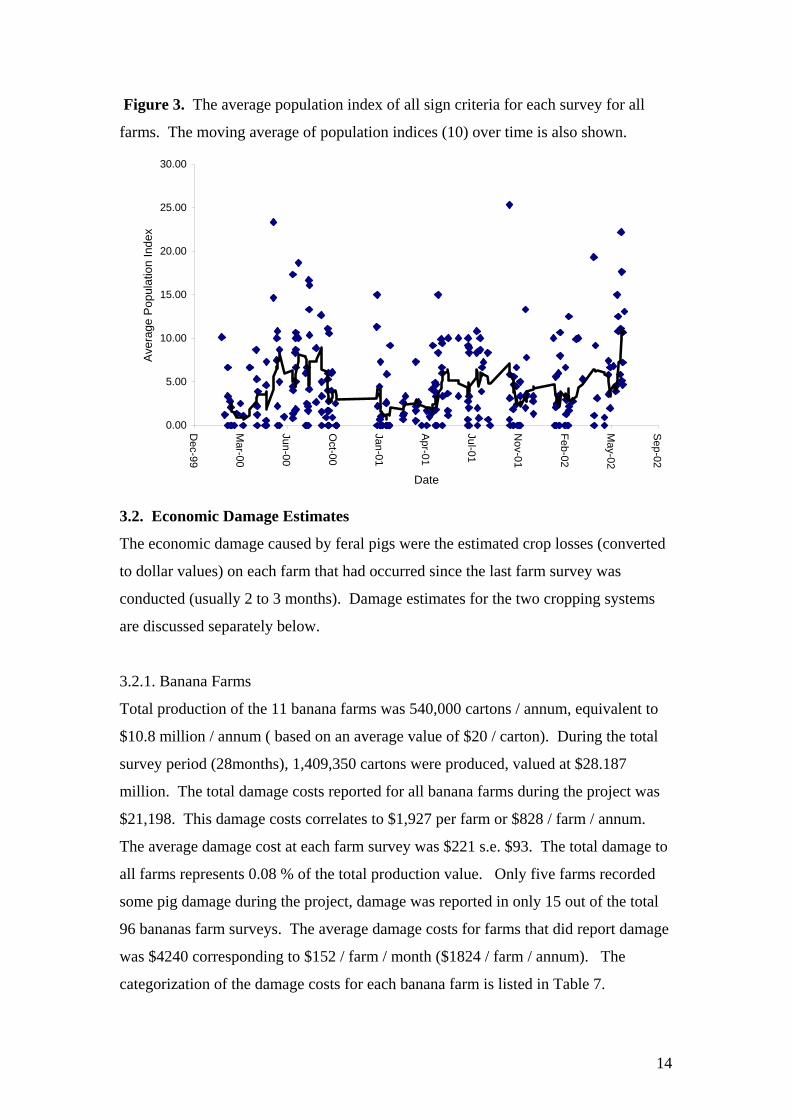
Figure 3. The average population index of all sign criteria for each survey for all
farms. The moving average of population indices (10) over time is also shown.
0.00
5.00
10.00
15.00
20.00
25.00
30.00
Dec-99
Mar-00
Jun-00
Oct-00
Jan-01
Apr-01
Jul-01
Nov-01
Feb-02
May-02
Sep-02
Date
Aver
age
Popu
latio
n In
dex
3.2. Economic Damage Estimates
The economic damage caused by feral pigs were the estimated crop losses (converted
to dollar values) on each farm that had occurred since the last farm survey was
conducted (usually 2 to 3 months). Damage estimates for the two cropping systems
are discussed separately below.
3.2.1. Banana Farms
Total production of the 11 banana farms was 540,000 cartons / annum, equivalent to
$10.8 million / annum ( based on an average value of $20 / carton). During the total
survey period (28months), 1,409,350 cartons were produced, valued at $28.187
million. The total damage costs reported for all banana farms during the project was
$21,198. This damage costs correlates to $1,927 per farm or $828 / farm / annum.
The average damage cost at each farm survey was $221 s.e. $93. The total damage to
all farms represents 0.08 % of the total production value. Only five farms recorded
some pig damage during the project, damage was reported in only 15 out of the total
96 bananas farm surveys. The average damage costs for farms that did report damage
was $4240 corresponding to $152 / farm / month ($1824 / farm / annum). The
categorization of the damage costs for each banana farm is listed in Table 7.
14

Table 7. Total damage ($) caused to each banana farms during the survey period.
Replanting Effort
Labour (hrs)
Machine(hrs)
Production Lost (%)
Farm Code Total Carton Production
(n).
Cartons lost (n)
Trees damaged
(n)
Other damage
($)
Total Damage
($)
1b 51260 0 0 0 0 0 0 0 E4 163100 0 0 0 0 0 0 0
G1b 230000 0 0 0 0 0 0 0 M1 139800 0 9 12 12 724 856 0
Mo2 51260 114 20 0 0 0 2280 0.22 W1 69900 0 0 0 0 0 0 0 W2 151450 0 0 0 0 0 0 0 W3b 37280 16 0 0 0 0 320 0.04 WH1 139800 90 30 8 4 0 1898 0.06 WH2 163100 0 0 0 0 0 0 0 WH3 419400 791 68 0 0 24 15844 0.19
Total 1,409,350 1011 127 20 16 na na 0.08
Costs ($) 28,187,000 20,220 na 230 24 748 21,198 na
The temporal distribution of damage costs over the survey period is illustrated in
Figure 4. A non-significant linear trend of increasing pig damage over time was
evident due to the large damage cost of an individual farm in 2002. This tended to
bias the trend so a plot of the temporal trend in damage per unit of production
estimates was conducted and is illustrated in Figure 5. No significant temporal trend
in damage estimates was detected.
Figure 4. Total damage ($)for each banana farm for each farm survey
0
1000
2000
3000
4000
5000
6000
7000
8000
Dec-99
Mar-00
Jun-00
Oct-00
Jan-01
Apr-01
Jul-01
Nov-01
Feb-02
May-02
Sep-02
Survey Period
Dam
age
Cos
t ($)
15

Figure 5. Damage ($) of feral pigs (per 1000 cartons of production) for each banana
farm for each survey.
0.0
5.0
10.0
15.0
20.0
25.0
30.0
35.0
40.0
45.0
50.0D
ec-9
9
Mar
-00
Jun-
00
Oct
-00
Jan-
01
Apr
-01
Jul-0
1
Nov
-01
Feb-
02
May
-02
Sep-
02
Survey Date
Dam
age
($) p
er u
nit o
f pro
duct
ion
3.2.2 Sugar Cane Farms
The combined 2000 and 2001 harvest estimates for the 19 sugar cane farms was
289,362 tonnes or the equivalent value of $6.77million (based on the standard value
of $23 / tonne). The average farm production was 45,918 tonnes / annum. In total,
8,715.5 tonnes or 39.2 ha of cane was damaged by pigs during the project. The total
costs of this damage was $237,268 equivalent to an average damage cost of $446 /
farm / month or $5352 / farm / annum. The total damage costs for all farms
represents 3.5% of the total production value. All farms recorded some degree of
feral pig damage during the project.
In contrast with the damage estimates from the farm surveys obtained during the cane
growing season, damage estimates were also obtained from the actual harvest data.
The contract harvester provided records of the actual cane tonnage harvested and an
estimate of the tonnage destroyed by feral pigs. The estimated and harvested damage
tonnage is presented in Table 8. A comparison of the survey estimates and the actual
harvest estimates for each area are shown in Table 9. The harvest shortfall
(difference of estimated crop harvest and actual harvest tonnage) was 72,460 tonnes.
The tonnage attributed to pig damage was 16,147 tonnes which cost $377,517. Actual
harvest damage estimates were approximately twice as much as the damage estimated
by landholders during the farm surveys.
16

Table 8. Damage (tonnes) estimated from farm surveys during the growing season
for all sugar cane farms.
Farm Code Estimated
Harvest
(tonnes)
Actual
Harvest
(tonnes)
Estimated
Total
Shortfall
(tonnes)
Harvested
Total
Shortfall
(tonnes
Loss
(% of
Estimated
Harvest)
Loss
(% of
Cane
Harvested
E1c 5070 3932 70 110 1.4 2.2
E2 18000 14000 735 1600 4.1 8.9
E3 20000 20400 9 20 0.0 0.1
G1c 2400 1850 145 150 6.0 6.3
G2 12850 7100 121 225 0.9 1.8
G3 3600 2600 17 45 0.5 1.3
G4 12000 9600 20 20 0.2 0.2
H1 3200 2150 627 775 19.6 24.2
H2 33100 22400 23 200 0.1 0.6
H3 4000 1300 53 1000 1.3 25.0
J1 3150 2800 91 100 2.9 3.2
J2 2450 1496 136 20 5.6 0.8
M2 5700 3912 9 34 0.2 0.6
Mo1 3772 983 47 777 1.2 20.6
T1 74000 60000 2211 6000 3.0 8.1
T2 78499 57565 4100 5017 5.2 6.4
W3c 5500 3600 4 4 0.1 0.1
W4 1200 1130 201 50 16.8 4.2
W5 871 684 96 126 11.0 14.5
Total (t) 289,362 216,818 8, 715 16,147 3.5 5.6
Costs ($) 6,777,000 4,986,814 237,268 377,517
17

Table 9. Summary of production totals and pig damage from farm surveys and
harvest estimates for all sugar cane farms within each survey areas.
Area Estimated
harvest
(tonnes)
Estimate
damage
(tonnes)
Estimated
damage
(%)
Actual
Harvested
(tonnes)
Actual
damage
(tonnes)
Actual
damage
(%)
Basilisk 15072 283 1.9 9191 931 6.2
Eubenangee 43070 814 1.9 38332 1730 4.0
Hawkins Creek 40300 703 1.8 25850 1975 4.9
Malbon 30850 303 1.0 21150 440 1.4
Tully 152499 6311 4.1 117565 11017 7.2
Walter Hill 7571 301 4.0 5414 180 2.4
Totals 289,362 8,715 3.5 217,502 16,273 5.6
Temporal trends in damage over the survey period is shown in Figure 6. No
significant trend in damage over time was detected. Due to the bias associated with
large variations in farm size and associated large variations in damage costs, all
damage estimates were converted into damage cost per unit of production (1000
tonnes of cane). The temporal trend in damage/ unit of production over the survey
periods is illustrated in Figure 7. A negative trend in damage over time was apparent
although this trend was not statistically significant.
Figure 6. Temporal trends in damage estimates for all sugar cane farms for each
survey.
0
10000
20000
30000
40000
50000
60000
70000
Dec-99
Mar-00
Jun-00
Oct-00
Jan-01
Apr-01
Jul-01
Nov-01
Feb-02
May-02
Sep-02
Farm Survey Date
dam
age
($)
18

Figure 7. Temporal trends in unit of production damage estimates ($ damage per
1000 tonnes of cane produced) for all sugar cane farms for each survey.
0
500
1000
1500
2000
2500
3000
3500
4000
4500
5000D
ec-9
9
Mar
-00
Jun-
00
Oct
-00
Jan-
01
Apr-
01
Jul-0
1
Nov
-01
Feb-
02
May
-02
Sep-
02
Survey Date
Dam
age
($) p
er U
nit o
f Pro
duct
ion
3. 3. Association of pig damage with pig population index
For each cropping system the damage costs ($ per unit of production) were compared
with the average population index (derived from all sign criteria) recorded at each
farm survey. A plot of the relationship for each cropping system is shown in Figure 8
for bananas and Figure 9 for cane farms.
For banana farms, no significant relationship was detected for best fit regression
analysis. A large proportion of banana farms reported no damage occurred during
each farm survey although a positive pig population index showed feral pigs were
present. Also on a number of occasions damage was reported although the pig
population index recorded no pig signs were present. No significant best fit
regression relationship could be detected in cane farms. Again a positive pig
population index was recorded on farms where no damage was reported and
conversely damage occurred on a number of occasions where a zero pig population
index was recorded.
19

Figure 8. Best fit relationship (and 95% C.I.) of the average population index (for
each farm survey) with damage ($) per 1000 cartons of production for all banana
farms.
Best Fit Equation y=a+be -xr2=0.026767147 DF Adj r 2=0.0058374077 FitStdErr=8.2230057 Fstat=2.5853132
a=3.7592126 b=-3.0604381
0 10 20 30Average Population Index
0
5
10
15
20
25
30
35
40
45
50
Dam
age
($) p
er U
nit o
f Pro
duct
ion
0
5
10
15
20
25
30
35
40
45
50
Dam
age
($) p
er U
nit o
f Pro
duct
ion
Figure 9. Best fit relationship (and 95% C.I.) of average population index with
damage ($) per 1000 tonnes of production for all sugar cane farms. Best Fit Equation y=a+bx
r2 =0.00017560257 DF Adj r 2 =0 FitStdErr=673.04733 Fstat=0.030208947a=234.81447 b=1.9563734
0 5 10 15 20 25Average population Index (%)
0
500
1000
1500
2000
2500
3000
3500
4000
4500
Dam
age
($) p
er U
nit o
f Pro
duct
ion
0
500
1000
1500
2000
2500
3000
3500
4000
4500
Dam
age
($) p
er U
nit o
f Pro
duct
ion
20

Best Fit Equation y=axbr2=1e-08 DF Adj r 2=0 FitStdErr=551.51071 Fstat=2.68e-06
a=136.0725 b=0.44666787
0 10 20 30Average Population Index (%)
21
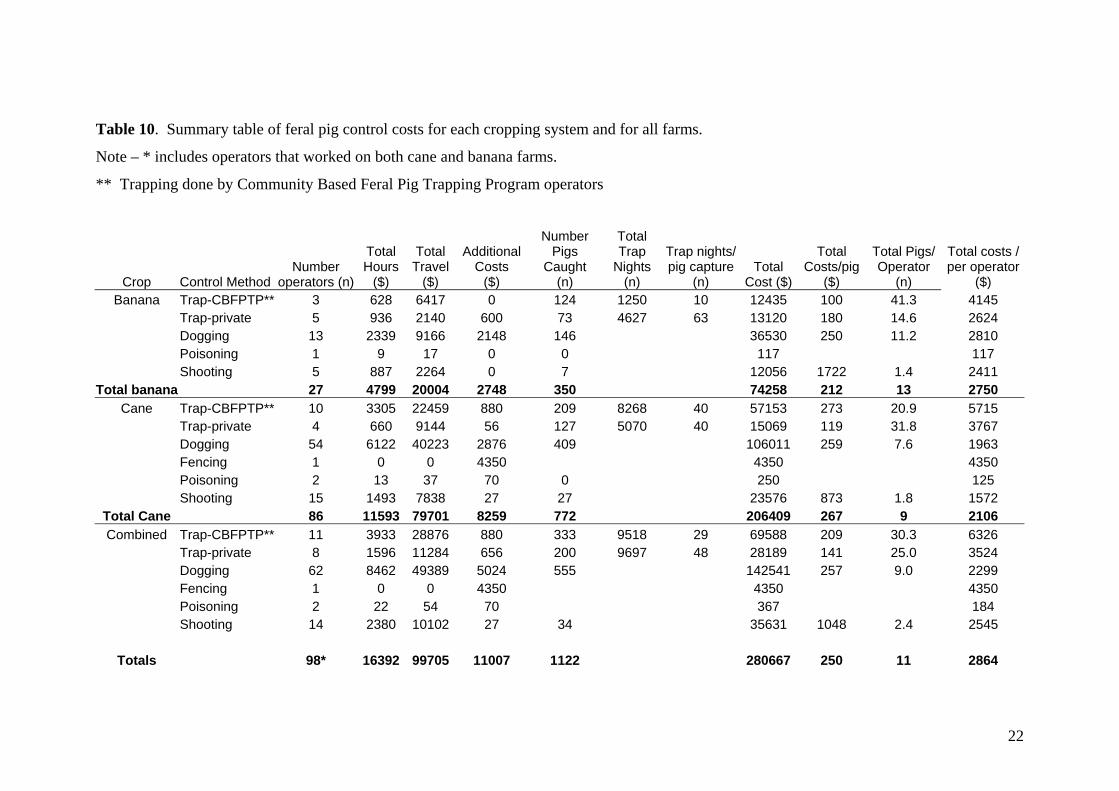
During the project, 1,122 pigs were captured or destroyed by 98 pig control operators
(acting as individuals or as teams) On average, each operator captured approximately
11 pigs during the project. Dogging as a control technique captured 555 pigs, trapping
533, and shooting 34 pigs. The total costs associated with all feral pig control
techniques employed during the project totalled $280,667; $74,258 for banana farms
and $206,409 for cane farms. The cost associated with the control of each captured
pig average $250. The 98 control operators for the 30 farms spent, on average, $3204
dollars each over the 28 month survey period. A summary of the effectiveness and
cost associated with the various control techniques are presented in Table 10.
4.0 Management Costs and Benefits
Figure 10. Best fit regression analysis (and 95% C.I.) of damage per unit of
production and the average population index for all cane and banana farms for the
total survey period.
regression analysis of the relationship was not significant.
The overall relationship for all farms in the survey is shown in Figure 10. The best fit
0
500
1000
1500
2000
2500
3000
3500
4000
4500
Dam
age
(4) p
er u
nit o
f Pro
duct
ion
0
500
1000
1500
2000
2500
3000
3500
4000
4500
Dam
age
(4) p
er u
nit o
f Pro
duct
ion
22
Crop Control Method Number
operators (n)
Total Hours
($)
Total Travel
($)
Additional Costs
($)
Number Pigs
Caught (n)
Total Trap
Nights (n)
Trap nights/ pig capture
(n) Total
Cost ($)
Total Costs/pig
($)
Total Pigs/ Operator
(n)
Total costs / per operator
($) Banana Trap-CBFPTP** 3 628 6417 0 124 1250 10 12435 100 41.3 4145
Trap-private
5
936 2140 600 73 4627 63 13120 180 14.6 2624Dogging 13 2339 9166 2148 146 36530 250 11.2 2810Poisoning 1 9 17 0 0 117 117
Shooting 5 887 2264 0 7 12056 1722 1.4 2411 Total banana
27 4799 20004 2748 350 74258 212 13 2750
Cane Trap-CBFPTP** 10 3305 22459 880 209 8268 40 57153 273 20.9 5715
Trap-private
4 660 9144 56 127 5070 40 15069 119 31.8 3767Dogging 54 6122 40223 2876 409 106011 259 7.6 1963Fencing 1 0 0 4350 4350 4350Poisoning 2 13 37 70 0 250 125
Shooting 15 1493 7838 27 27 23576 873 1.8 1572 Total Cane
86 11593 79701 8259
772 206409 267
9 2106
Combined Trap-CBFPTP** 11 3933 28876 880 333 9518 29 69588 209 30.3 6326 Trap-private
8
1596 11284 656 200 9697 48 28189 141 25.0 3524Dogging 62 8462 49389 5024 555 142541 257 9.0 2299Fencing 1 0 0 4350 4350 4350Poisoning 2 22 54 70 367 184Shooting
14
2380
10102
27
34
35631
1048
2.4
2545
Totals 98* 16392 99705 11007 1122 280667 250 11 2864
Table 10. Summary table of feral pig control costs for each cropping system and for all farms.
** Trapping done by Community Based Feral Pig Trapping Program operators
Note – * includes operators that worked on both cane and banana farms.

The cost / benefits of all pig control techniques were calculated for each farm. Table
11 lists the total direct management costs and the management costs per unit of
production for each banana farm. Similarly Table 12 lists the total management costs
for all cane farms. The total management cost of pigs to each farm is calculated as the
direct damage cost, the addition of costs associated with implementing control
techniques and subtracting the value of any indirect benefit derived from pig control.
The overall costs that feral pigs cause to banana farms totaled $105, 194. This is
equivalent to $4099 / farm / annum. The overall costs of pig damage also equate to an
average, for each banana farm, of $300 per 1000 cartons of production. The overall
costs that feral pigs caused to sugar cane farms totaled $471,392. This is equivalent to
$10,632 / farm / annum or $813 per 1000 tonnes of production.
Table 11. The total actual management costs ($) and costs per unit of production ($ /
1000 cartons) associated with direct feral pig damage, costs of control and the benefits
of pig control for each banana farm.
Farm
Code
Direct
Damage
($)
Direct
Damage
($/1000C)
Damage plus
Control
($)
Damage plus
Control
($/1000C)
Damage plus
Control Minus
Benefits
($)
Damage plus
Control Minus
Benefits
($/1000C)
M1 856 14 11668 194 10068 167
Mo2 2280 103 2521 114 2521 114
E1b 0 0 13031 592 12981 590
E4 0 0 4438 63 4353 62
G1b 0 0 11956 1195 11936 1193
WH1 1898 31 13440 224 13440 224
WH2 0 0 87 1 87 1
WH3 15844 88 38496 213 38136 211
W1 0 0 12 0 12 0
W2 0 0 0 0 0 0
W3b 320 20 11816 738 11656 728
Total 21198 107469 105194 Average 23 303 299
23
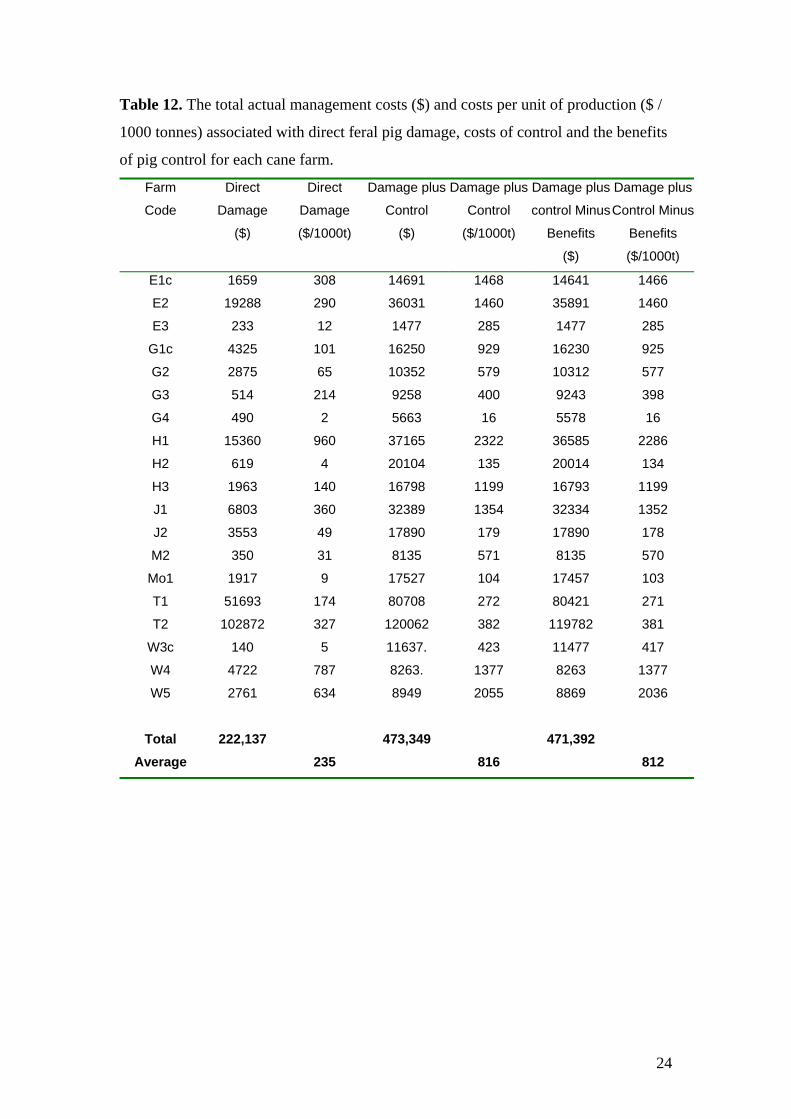
Table 12. The total actual management costs ($) and costs per unit of production ($ /
1000 tonnes) associated with direct feral pig damage, costs of control and the benefits
of pig control for each cane farm.
Farm
Code
Direct
Damage
($)
Direct
Damage
($/1000t)
Damage plus
Control
($)
Damage plus
Control
($/1000t)
Damage plus
control Minus
Benefits
($)
Damage plus
Control Minus
Benefits
($/1000t)
E1c 1659 308 14691 1468 14641 1466
E2 19288 290 36031 1460 35891 1460
E3 233 12 1477 285 1477 285
G1c 4325 101 16250 929 16230 925
G2 2875 65 10352 579 10312 577
G3 514 214 9258 400 9243 398
G4 490 2 5663 16 5578 16
H1 15360 960 37165 2322 36585 2286
H2 619 4 20104 135 20014 134
H3 1963 140 16798 1199 16793 1199
J1 6803 360 32389 1354 32334 1352
J2 3553 49 17890 179 17890 178
M2 350 31 8135 571 8135 570
Mo1 1917 9 17527 104 17457 103
T1 51693 174 80708 272 80421 271
T2 102872 327 120062 382 119782 381
W3c 140 5 11637. 423 11477 417
W4 4722 787 8263. 1377 8263 1377
W5 2761 634 8949 2055 8869 2036
Total 222,137 473,349 471,392 Average 235 816 812
24

5. DISCUSSION
The determination of the pest status of the feral pig in the wet tropical region of
northern Queensland is fundamental for developing effective management options on
a regional scale. Economic impact of a pest is an important component of the pest
status assessment process. This report quantified, in discrete sampled areas, feral pig
population trends, direct and indirect economic burdens to sugar cane and banana
producers and established the costs and effectiveness of the various control techniques
used by producers to reduce feral pig impacts.
The discussion of the economic pest status of feral pigs in this region will focus on the
varied segments of the project by addressing each of the project objectives.
5.1 Establish a feral pig population monitoring system.
There is no standardised technique to identify feral pig population trends or relative
abundances in this region. Standard techniques used in other regions to estimate pig
abundance are restricted in their application due to environmental factors unique to
the wet tropics region. For example aerial survey techniques are ineffective in this
environment due to the dense ground cover of the rainforests and dung counts and
digging indices are often adversely effected by high rainfall. Ground survey
techniques are restricted by the lack of access to large areas of the region and by the
difficult terrain.
A modified ground survey technique was developed in this project to monitor pig
population trends, as no other suitable survey technique was available. Population
monitoring was accomplished by establishing a population abundance index,
calculated as the frequency of occurrence of pig signs on permanently established
monitoring plots. This technique has been used in other habitats and established as a
reliable method of monitoring feral pig population trends (Hone 1995). As individual
pig signs can vary by the influence of prevailing seasons, habitat preferences, food
availability and movements (Choquenot, et al. 1996), a broad range of pig sign criteria
were observed to reduce the influence of these factors on individual sign criteria. As
the plots were permanently established, this population index technique is accurate in
monitoring changes in pig populations. It does not allow calculation of actual pig
population densities. This technique was used to monitor temporal changes in pig
25

populations and to enable relative pig population level comparisons between the
sampled areas and between the sampled farms.
Overall trends in the population index were observed during this project. The indices
for all of the sign criteria were averaged for each farm survey visit and used to
highlight population trends over the total survey time of 28 months. The pig
population index tended to fluctuate with prevailing seasons as shown in both the
individual cane and banana cropping farms and in the overall combined cropping
systems. For both cane and banana farms population indices tended to be highest
during the dry season and lowest during the wet season. The overall average
frequency of occurrence of pig sign was 4.5% . This level of occurrence of sign was
very low compared to previous studies in this region. Mitchell (1993) found for his
dry season study a frequency of occurrence of 67% while Mitchell and Mayer (1997)
reported a frequency of occurrence of 23% and Laurance and Harrington (1997)
reported 22% frequency of occurrence on quadrats. Hone (1995) found in his
temperate study a frequency of occurrence of pig sign of 13%.
The low frequency of pig sign is difficult to explain, although differences in
methodology between these studies may have an influence. This project measured
pig sign essentially on crop headlands which are narrow corridors and have a high
disturbance due to machinery and human movements. Headlands would also be seen
as a transitional area only, a crossing place between the crop and the rainforest cover.
Thus the pig sign would not be expected to be as frequent as would be observed in
preferred pig habitats such as creek beds.
Another potential limitation of the monitoring technique used in this project was the
time period between the farm surveys. With an average period of 2.8 months between
farm surveys, the pig sign observed on the monitoring plots would be subject to a
range of environmental conditions that would reduce the persistence of the sign. For
example heavy rain would wash all sign away – if rain occurred shortly prior to the
farm survey then the population index may be reduced. Similarly varying levels of
control effort caused by varying crop conditions (growing season compared to
harvesting season for example) occurred during the project. This may also influence
the matching of the population index with damage estimates.
26

Averaging the frequency of occurrence of a range of pig sign criteria was thought to
minimise the loss of sign due to weather conditions. Reduction in the time between
recording periods would obviously increase the accuracy of the monitoring, in this
study logistic considerations prevented monitoring at a higher rate.
The limitations of the monitoring technique are particularly relevant when developing
a relationship between the population index and the damage estimate. Inaccuracies in
estimating the feral pig population causing the observed damage estimates is believed
to be responsible for the lack of any significant trend in the population index / damage
relationship.
5.2 Quantify Economic Damage
The extent of damage by pests has been described by Cherrett, et al. (1971) as a
function of four variables: (i) the destructive potential per pest which may vary with
pest age, size, genotype and environment, (ii) the duration of exposure, (iii) the
resistance of the host or object being attacked and (iv) the number of pests. Thus the
relationship between damage and pest abundance is not always clear. In this project
the variables that influenced the amount of economic damage (listed below) need to
be considered when developing a relationship between the pest population and the
amount of damage being caused.
1. The destructive potential per individual is variable in feral pigs. Many of the
surveyed farms reported that mature boars (adult male pigs) were the major
cause of damage and were actively targeted through the use of bounties or
other incentives. Immature pigs and small females were regarded as being
incapable of knocking down mature banana trees to reach the fruit. Tree
damage was reported as the major economic loss caused by pigs on banana
farms. Similarly on cane farms mature boars were regarded as the main
destructive segment of the pig population.
2. The duration of exposure to damage was relatively constant throughout the
year for banana farms although most fruit production is in the summer.
However the economic costs associated with this damage was variable due to
changing value of production due to market pressure. The value of the
damage to bananas varied by seasons. For sugar cane, a marked increase in
damage occurred prior to harvest. While some damage can be caused
27

throughout the growing season, the majority of damage is caused when the
cane is enriched with sugar prior to harvest. Thus for both crops the duration
of damage is variable.
3. The resistance of the host being attacked variable was evident in banana farms
where different varieties of banana grow to different heights. Some tall
varieties do not attract pigs as the fruit is out of reach and the trunks are too
strong for pigs to knock over. Conversely in some varieties or older crops,
the banana trees are smaller and tend to fall over, thus pigs are able to easily
knock them over to reach the fruit or damage fruit on fallen trees before the
trees can be up-righted. Varieties of sugar cane also have variable levels of
sugar and have variable amounts of leaf material influencing the resistance of
the crop to damage. Irrigated farms verses dry farmed farms can also
influence the level of pig activity due to irrigated soils containing more
earthworm populations or green forage then in dry farms.
4. The number of pigs that are in proximity to the crops also influence the
amount of damage. Pig movements are seasonal (Mitchell 2000) and are
influenced by the availability of food resources. Thus pig populations in
proximity to crops can be variable due to weather patterns and crop maturity.
The damage caused by feral pigs can vary in space and time (Hone 1994). Spatial
patterns of damage can be regarded as fitting a frequency distribution and can vary
from negative exponential to normal to positively skewed. Negative exponential
frequency distributions have been previously reported for damage by feral pigs in
south eastern Australia (Hone 1988) and in this wet tropics region (Mitchell and
Mayer 1997). Temporal patterns of feral pig damage (soil disturbance) have also been
established in this region (Mitchell 2000).
In this study spatial damage patterns were assessed by comparing damage estimates
between the sampling areas and between the two cropping systems. Temporal
damage patterns were assessed by comparing damage estimates between each farm
survey and plotting damage estimates over time. The recorded economic damage
caused by feral pigs was extremely variable between the areas, between the two
cropping systems and also between individual farms.
28

Banana farms
For the banana farms, on average only a 0.08% loss of the total production of cartons
of bananas was directly caused by feral pigs. Each farm reported, on average, a real
on farm direct loss of $828 / annum. However as only 5 of the 9 banana farms
reported any pig damage during the project, a loss of $1824 / annum was calculated
for these farms. A feature of the results for the banana farms is the range of damage
between the individual farms. Damage ranged from zero for 4 farms to one farm
(WH3) reporting a total of 791 cartons lost ($15,800). However, when put in
perspective of the size of this farm production ($8.39 million for the study period),
this damage estimate represents only 0.19% of the total production for this farm. The
maximum proportional crop loss reported was for farm Mo2 which experienced a net
production loss of 0.22%. Only one farm incurred costs due to replanting damaged
banana trees and only two farms reported other damage costs not related to damaged
trees.
There was no overall trend in damage over the survey period but seasonal fluctuations
were evident with the majority of economic damage occurring during the dry season.
Pigs would be attracted to the irrigated soil in banana plantations especially when the
surrounding areas would have hard dry compacted soils during this season.
Abundance of green grass on the headlands and the presence of earthworms and other
soil invertebrates in the moist soil would also be attractive to pigs.
In summary feral pigs are not a major economic problem to the banana industry as a
whole. It is only a minority of banana farmers on a few occasions that receive
economic injury levels that cause concern to the farmers. Many banana farmers stated
during the survey that they actually benefit from pigs inhabiting their farms as they
clean up the waste fruit which will reduce pest infestations such as fruit fly.
Cane farms
All cane farms reported some damage at some time during the project. The estimated
direct damage caused by feral pigs to all cane farms was 8,715 tonnes during the total
survey period. This represents 3.6% of the estimated harvested (289,362 tonnes).
The average on farm direct costs caused by feral pigs to sugar cane farms was $5,352
per annum. Damage to the overall sugar industry (as represented by the sampled
29
survey farms) is relatively minor. However there was a large variation between
individual farms with three farms reporting damage estimates of more than 10%
compared with 12 farms of less then 5% damaged.
No significant temporal trends in estimated damage were evident. Landholder
estimates of pig damage to cane farms was constant throughout the survey, and
throughout the cane growing season. Harvest records from annual crushing returns
estimated that the proportion of the harvest shortfall – the difference between
estimated yield and actual harvest yield (72,460 tonnes) attributed to feral pigs was
16,147 tonnes compared to 8,715 from landholder estimates. The difficulty of
accurately estimating damage in mature cane which can grow to 3 m tall and is
difficult to walk through is obvious. This may explain the 50% underestimate from
landholder surveys compared to actual harvest estimates. From mill returns the
average damage caused by feral pigs to each sugar cane farm was $8,515 or 5.6% of
the total harvest.
Rodent and bird damage is significantly more of an economic problem to the sugar
industry overall (BSES annual reports). However feral pig damage appears to be
more sporadic with some individual farmers enduring up to 20% damage rates while
the majority of other farms receive less then 5%. In summary feral pigs are more of
an economic problem to cane farmers then banana farmers. Cane farmers receiving
three times the economic loss due to feral pigs compared to banana farmers.
5.3 Relationships of Pig Abundance and Damage
Knowledge of the relationship between changes in population levels and the
corresponding changes in impact levels can help determine the cost-effectiveness of
management. The shape of the relationship is important when considering how to
evaluate agricultural impact on a per animal? basis (linear, curvilinear, negative or
positive Y intercept, etc).
“Any estimate of the economic damage of feral pigs must be able to estimate yield in
the absence of pigs either directly or indirectly through extrapolation of some density-
dependent relationship and contrasted with a range of pig densities” (Choquenot, et al.
1996). The generalised curvilinear relationship of pig densities and damage reflects
30
the density related consumptive impacts of most pest species. Choquenot, et al.
(1996) stated that a subjective assessment of the likely shape of the relationship
between reduction in yield and pig density for sugar cane and fruit crops would be
linear at low pig densities and curvilinear at high pig densities.
A feature of this relationship analysis for both cropping systems is the large
variations in damage between individual farms. While many farms reported minimal
damage costs at each farm survey, a small number of farms would report substantial
damage. Damage was not constant across all farms; individual farmers suffered
severe sporadic damage while the remainder suffered only minimal damage for the
majority of the survey period. This is very similar to Hone (1995) analysis of feral
pig damage being described as a negative exponential frequency distribution; many
sites of minimal damage and few sites of major damage.
A confounding feature of this study is the problem of individual animals (usually
large males). Many of the survey farms regard lone males as the major cause of the
crop damage. These animals target crops as their main food source and cause severe
economic damage while they comprise only a very small portion of the pig
population. Other sections of the pig population such as adolescents or small females
are regarded as causing little to no damage at all. This confounds the population /
damage relationship when a low population monitoring index caused by problematic
individual is compared with the high damage estimates they cause. The reverse is also
true where a high population score caused by a large section of the pig population is
compared with the small amount of damage they cause. Thus the calculated
population / damage relationship is heavily manipulate by the various segments of the
pig population.
5.4 Control Costs
Over the total project period, 1,122 feral pigs were captured by various control
techniques employed during the 28 month survey. Each individual control operator
captured an average of 11.5 pigs, which cost an estimated $2,864; an average of $250
for each pig capture.
31

The most cost efficient control technique employed was trapping. Private trapping
captured 200 pigs at an overall cost of $141 / pig while the trapping conducted with
the CBFPTP captured more pigs (333) but at a higher cost of $209 / pig. Dogging
captured the most pigs (555) but was less cost efficient at $259 / pig capture.
Hunting was the least cost efficient technique employed at $1048 / pig capture.
Banana farms captured 350 pigs which cost on average $212 per pig captured.
Trapping was again the most cost effective control technique employed where each
pig cost $100 / pig capture in the CBFPTP system and $180 / pig capture for
landholder trapping. Dogging was less cost effective ($250 / pig capture) while
hunting was the least cost effective ($1722 / pig capture).
Sugar cane farms captured 772 pigs which cost on average $267 / pig captured, 21%
higher costs then for the banana farms. The reason for this higher control costs in
cane farms is unquantified, however, the increased difficulty in capturing pigs in
dense cane blocks would increase costs and efforts. Trapping was again the most
cost effective control technique employed but contrary to the banana farms the
landholder trapping system was more cost effective ($119 / pig capture) compared to
$273 / pig capture for the CBFPTP.
Dogging ($259 / pig capture) and hunting ($873 / pig capture) was again the least cost
effective. Dogging on cane farms however, was very effective in terms of the total
number of pigs removed. Dogging has been the primary technique for controlling
feral pigs since settlement of this region and is also a traditional recreational pursuit.
One feature of this technique was the large variation in the catch / effort rate. This
reflects the varying levels of operators skills and dedication and the varying pig
population levels between the farms. Also some operators tended to target individual
pigs and not the general pig population. This results in a low catch per unit effort rate
but a significant damage reduction within the crop. Problematic individual pigs are
targeted as they tend to cause the most damage in both cane and banana farms and are
often targeted when bounties paid by landholders are offered for their capture.
32

In conclusion, trapping was the most cost efficient control technique employed for
both banana and cane cropping systems. Trapping and dogging were comparable in
terms of the total number of pigs captured.
5.5. Management Costs and Benefits of feral Pig Control
The overall real cost of feral pigs to farms in this region is a combination of the cost
of the actual direct damage, the costs associated with controlling this damage and the
value of any benefits derived from the captured pigs.
The overall costs of feral pigs to all banana farms during the project totalled $105,194
which is equivalent to $4,099 / annum for each banana farm or standardised as $300
for every 1000 cartons ($20,000 value) of bananas produced. The real on farm cost of
pigs to the banana industry is equivalent to 1.5 % of the value of production. The
actual direct damage estimates for banana farms only comprise 20% of the total costs,
80% of the true cost of pigs is related to the costs associated with the control effort
applied. Banana farms are spending on mitigation pig damage even though only a
small portion of the industry as a whole is directed effected by pig damage.
The overall cost of pig management to all sugar cane farms during the project totalled
$471,392 equivalent to $10632 / annum or standardised as $813 damage for every
1000 tonnes of cane ($23,380 value) produced. The real on farm costs of feral pigs to
the cane industry represents 3.5 % of the value of production. The actual damage
costs represent 52% of the total costs with 48% representing costs associated with
control effort. Again cane farmers are committing financial resources to pig damage
mitigation, spending almost as much on damage prevention as the actual damage cost
received.
Overall for all surveyed farms, feral pigs cost $576,586 which is equivalent to an
average of $8,237 / annum for cane and banana farms in the region.
33
References
Cherrett, J. M., J. B. Ford, et al. (1971). The Control of Injurious Animals. London, English Universities Press.
Choquenot, D., J. C. McIlroy, et al. (1996). Managing Vertebrate Pests: Feral Pigs. Canberra, Bureau of Resource Sciences. Australian Government Publishing Service.
Hone, J. (1988a). "Evaluation of methods for ground survey of feral pigs and their sign." Acta Theriologica 33: 451-465.
Hone, J. (1988b). "Feral pig rooting in a mountain forest and woodland: distribution, abundance and relationships with environmental variables." Australian Journal of Ecology 13: 393-400.
Hone, J. (1994). Analysis of Vertebrate Pest Control. Cambridge, Canbridge University Press.
Hone, J. (1995). "Spatial and temporal aspects of vertebrate pest damage with emphasis on feral pigs." Journal of Applied Ecology 32: 311-319.
Laurance, W. F. and G. N. Harrington (1997). "Ecological associations of feeding sites of feral pigs in the Queensland wet tropics." Wildlife Research 24(5): 579-591.
Mitchell, J. L. (1993). Systematic assessment of feral pig damage and recommended pig control methods in the wet tropics World Heritage Area, Wet Tropics Management Agency.
Mitchell, J. L. (2000). Ecology and management of feral pigs in Australian tropical rainforests. Vertebrate Pest Conference, San Diego, California, USA.
Mitchell, J. L. and R. Mayer (1997). "Digging by feral pigs within the wet tropics World Heritage Area of north Queensland." Wildlife Research 24(5): 591-603.
34
Related Documents