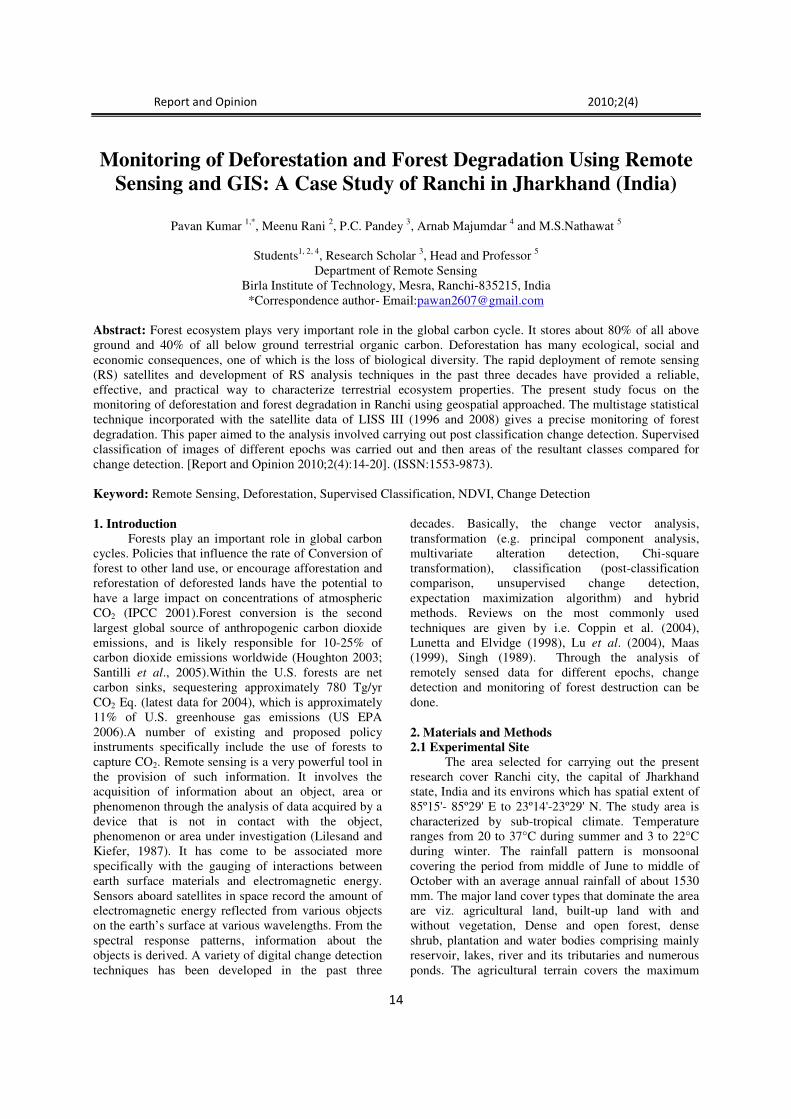
Report and Opinion 2010;2(4) 14 Monitoring of Deforestation and Forest Degradation Using Remote Sensing and GIS: A Case Study of Ranchi in Jharkhand (India) Pavan Kumar 1,* , Meenu Rani 2 , P.C. Pandey 3 , Arnab Majumdar 4 and M.S.Nathawat 5 Students 1, 2, 4 , Research Scholar 3 , Head and Professor 5 Department of Remote Sensing Birla Institute of Technology, Mesra, Ranchi-835215, India *Correspondence author- Email:[email protected] Abstract: Forest ecosystem plays very important role in the global carbon cycle. It stores about 80% of all above ground and 40% of all below ground terrestrial organic carbon. Deforestation has many ecological, social and economic consequences, one of which is the loss of biological diversity. The rapid deployment of remote sensing (RS) satellites and development of RS analysis techniques in the past three decades have provided a reliable, effective, and practical way to characterize terrestrial ecosystem properties. The present study focus on the monitoring of deforestation and forest degradation in Ranchi using geospatial approached. The multistage statistical technique incorporated with the satellite data of LISS III (1996 and 2008) gives a precise monitoring of forest degradation. This paper aimed to the analysis involved carrying out post classification change detection. Supervised classification of images of different epochs was carried out and then areas of the resultant classes compared for change detection. [Report and Opinion 2010;2(4):14-20]. (ISSN:1553-9873). Keyword: Remote Sensing, Deforestation, Supervised Classification, NDVI, Change Detection 1. Introduction Forests play an important role in global carbon cycles. Policies that influence the rate of Conversion of forest to other land use, or encourage afforestation and reforestation of deforested lands have the potential to have a large impact on concentrations of atmospheric CO 2 (IPCC 2001).Forest conversion is the second largest global source of anthropogenic carbon dioxide emissions, and is likely responsible for 10-25% of carbon dioxide emissions worldwide (Houghton 2003; Santilli et al., 2005).Within the U.S. forests are net carbon sinks, sequestering approximately 780 Tg/yr CO 2 Eq. (latest data for 2004), which is approximately 11% of U.S. greenhouse gas emissions (US EPA 2006).A number of existing and proposed policy instruments specifically include the use of forests to capture CO 2 . Remote sensing is a very powerful tool in the provision of such information. It involves the acquisition of information about an object, area or phenomenon through the analysis of data acquired by a device that is not in contact with the object, phenomenon or area under investigation (Lilesand and Kiefer, 1987). It has come to be associated more specifically with the gauging of interactions between earth surface materials and electromagnetic energy. Sensors aboard satellites in space record the amount of electromagnetic energy reflected from various objects on the earth’s surface at various wavelengths. From the spectral response patterns, information about the objects is derived. A variety of digital change detection techniques has been developed in the past three decades. Basically, the change vector analysis, transformation (e.g. principal component analysis, multivariate alteration detection, Chi-square transformation), classification (post-classification comparison, unsupervised change detection, expectation maximization algorithm) and hybrid methods. Reviews on the most commonly used techniques are given by i.e. Coppin et al. (2004), Lunetta and Elvidge (1998), Lu et al. (2004), Maas (1999), Singh (1989). Through the analysis of remotely sensed data for different epochs, change detection and monitoring of forest destruction can be done. 2. Materials and Methods 2.1 Experimental Site The area selected for carrying out the present research cover Ranchi city, the capital of Jharkhand state, India and its environs which has spatial extent of 85º15'- 85º29' E to 23º14'-23º29' N. The study area is characterized by sub-tropical climate. Temperature ranges from 20 to 37°C during summer and 3 to 22°C during winter. The rainfall pattern is monsoonal covering the period from middle of June to middle of October with an average annual rainfall of about 1530 mm. The major land cover types that dominate the area are viz. agricultural land, built-up land with and without vegetation, Dense and open forest, dense shrub, plantation and water bodies comprising mainly reservoir, lakes, river and its tributaries and numerous ponds. The agricultural terrain covers the maximum

Welcome message from author
This document is posted to help you gain knowledge. Please leave a comment to let me know what you think about it! Share it to your friends and learn new things together.
Transcript
Report and Opinion 2010;2(4)
14
Monitoring of Deforestation and Forest Degradation Using Remote
Sensing and GIS: A Case Study of Ranchi in Jharkhand (India)
Pavan Kumar
1,*, Meenu Rani
2, P.C. Pandey
3, Arnab Majumdar
4 and M.S.Nathawat
5
Students1, 2, 4
, Research Scholar 3, Head and Professor
5
Department of Remote Sensing
Birla Institute of Technology, Mesra, Ranchi-835215, India
*Correspondence author- Email:[email protected]
Abstract: Forest ecosystem plays very important role in the global carbon cycle. It stores about 80% of all above
ground and 40% of all below ground terrestrial organic carbon. Deforestation has many ecological, social and
economic consequences, one of which is the loss of biological diversity. The rapid deployment of remote sensing
(RS) satellites and development of RS analysis techniques in the past three decades have provided a reliable,
effective, and practical way to characterize terrestrial ecosystem properties. The present study focus on the
monitoring of deforestation and forest degradation in Ranchi using geospatial approached. The multistage statistical
technique incorporated with the satellite data of LISS III (1996 and 2008) gives a precise monitoring of forest
degradation. This paper aimed to the analysis involved carrying out post classification change detection. Supervised
classification of images of different epochs was carried out and then areas of the resultant classes compared for
change detection. [Report and Opinion 2010;2(4):14-20]. (ISSN:1553-9873).
Keyword: Remote Sensing, Deforestation, Supervised Classification, NDVI, Change Detection
1. Introduction
Forests play an important role in global carbon
cycles. Policies that influence the rate of Conversion of
forest to other land use, or encourage afforestation and
reforestation of deforested lands have the potential to
have a large impact on concentrations of atmospheric
CO2 (IPCC 2001).Forest conversion is the second
largest global source of anthropogenic carbon dioxide
emissions, and is likely responsible for 10-25% of
carbon dioxide emissions worldwide (Houghton 2003;
Santilli et al., 2005).Within the U.S. forests are net
carbon sinks, sequestering approximately 780 Tg/yr
CO2 Eq. (latest data for 2004), which is approximately
11% of U.S. greenhouse gas emissions (US EPA
2006).A number of existing and proposed policy
instruments specifically include the use of forests to
capture CO2. Remote sensing is a very powerful tool in
the provision of such information. It involves the
acquisition of information about an object, area or
phenomenon through the analysis of data acquired by a
device that is not in contact with the object,
phenomenon or area under investigation (Lilesand and
Kiefer, 1987). It has come to be associated more
specifically with the gauging of interactions between
earth surface materials and electromagnetic energy.
Sensors aboard satellites in space record the amount of
electromagnetic energy reflected from various objects
on the earth’s surface at various wavelengths. From the
spectral response patterns, information about the
objects is derived. A variety of digital change detection
techniques has been developed in the past three
decades. Basically, the change vector analysis,
transformation (e.g. principal component analysis,
multivariate alteration detection, Chi-square
transformation), classification (post-classification
comparison, unsupervised change detection,
expectation maximization algorithm) and hybrid
methods. Reviews on the most commonly used
techniques are given by i.e. Coppin et al. (2004),
Lunetta and Elvidge (1998), Lu et al. (2004), Maas
(1999), Singh (1989). Through the analysis of
remotely sensed data for different epochs, change
detection and monitoring of forest destruction can be
done.
2. Materials and Methods
2.1 Experimental Site
The area selected for carrying out the present
research cover Ranchi city, the capital of Jharkhand
state, India and its environs which has spatial extent of
85º15'- 85º29' E to 23º14'-23º29' N. The study area is
characterized by sub-tropical climate. Temperature
ranges from 20 to 37°C during summer and 3 to 22°C
during winter. The rainfall pattern is monsoonal
covering the period from middle of June to middle of
October with an average annual rainfall of about 1530
mm. The major land cover types that dominate the area
are viz. agricultural land, built-up land with and
without vegetation, Dense and open forest, dense
shrub, plantation and water bodies comprising mainly
reservoir, lakes, river and its tributaries and numerous
ponds. The agricultural terrain covers the maximum
Report and Opinion 2010;2(4)
15
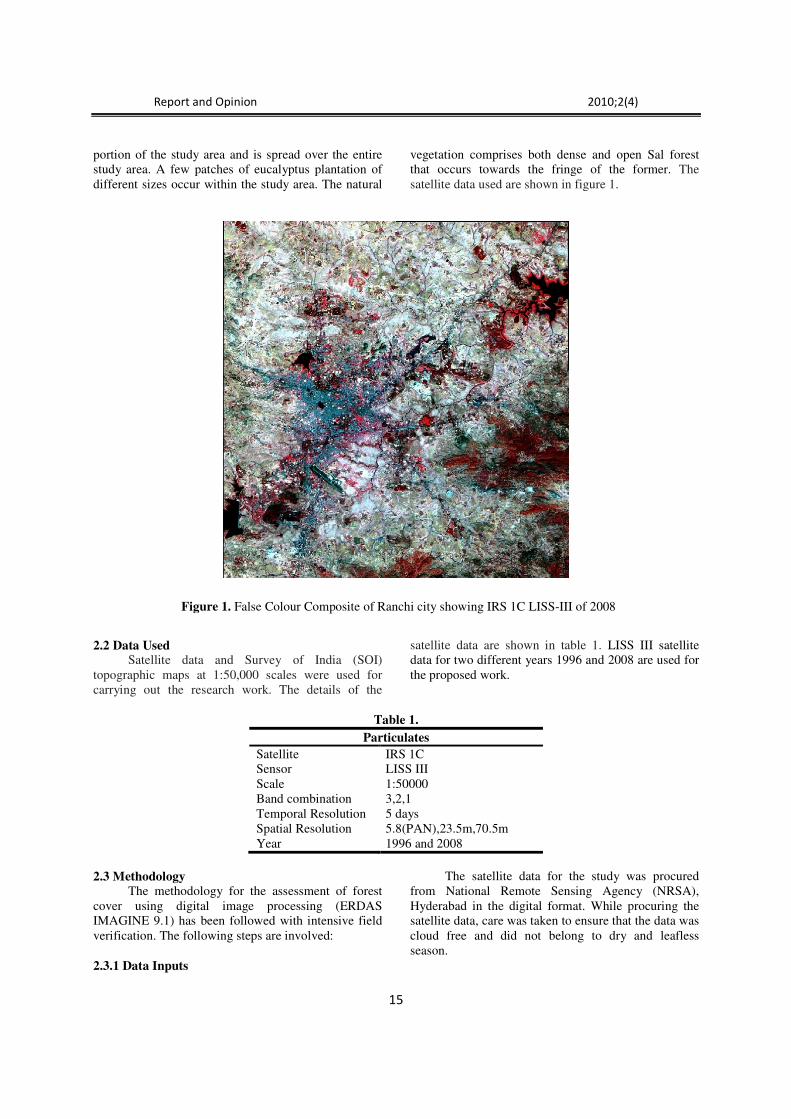
portion of the study area and is spread over the entire
study area. A few patches of eucalyptus plantation of
different sizes occur within the study area. The natural
vegetation comprises both dense and open Sal forest
that occurs towards the fringe of the former. The
satellite data used are shown in figure 1.
2.2 Data Used Satellite data and Survey of India (SOI)
topographic maps at 1:50,000 scales were used for
carrying out the research work. The details of the
satellite data are shown in table 1. LISS III satellite
data for two different years 1996 and 2008 are used for
the proposed work.
Table 1.
Particulates
Satellite IRS 1C
Sensor LISS III
Scale 1:50000
Band combination 3,2,1
Temporal Resolution 5 days
Spatial Resolution 5.8(PAN),23.5m,70.5m
Year 1996 and 2008
2.3 Methodology
The methodology for the assessment of forest
cover using digital image processing (ERDAS
IMAGINE 9.1) has been followed with intensive field
verification. The following steps are involved:
2.3.1 Data Inputs
The satellite data for the study was procured
from National Remote Sensing Agency (NRSA),
Hyderabad in the digital format. While procuring the
satellite data, care was taken to ensure that the data was
cloud free and did not belong to dry and leafless
season.
Figure 1. False Colour Composite of Ranchi city showing IRS 1C LISS-III of 2008

Report and Opinion 2010;2(4)
16
2.3.2 Flow Chart The flow chart of the applied methodology is shown in figure 2.
2.3.3 Digital Interpretation
Using ERDAS EMAGINE 9.1 software, the
data was loaded onto the computer. Radiometric and
correction was applied for removing radiometric
defects and improving the visual impact of satellite
data. Geometric rectification of the data was carried
out with the help of scanned Survey of India (SOI)
toposheets for assigning geographical coordinates to
keep pixel of the image. Supervised image
classification is a method in which the analyst defines
small areas, called training sites, on the image which
are representative of each desired land cover
category. The delineation of training areas
representatives of a cover type is most effective when
an image analyst has knowledge of the geography of
a region and experience with the spectral properties
of the cover classes. The image analyst then trains the
software to recognize spectral values or signatures
associated with the training sites. After the signatures
for each land cover category have been defined, the
software then uses these signatures to classify the
remaining (figure 3 and figure 4). Areas were
calculated using ARC GIS 9.3 software and
compared changes for both images.
Satellite Data
Multi-temporal LISS III images of
1996 and 2008
Geo-referencing
Image Processing
and
Image Rectification
Recoeivence Survey
Spectral Enhancement
Classified Image
Ancillary Data
SOI Toposheet
Geo-referencing
Geo-referencing
Figure 2.Paradigm for monitoring of forest

Report and Opinion 2010;2(4)
17
Figure 3. False Colour Composite of classified image for Ranchi city, year 1996.
Figure 4. False Colour Composite of classified image for Ranchi city, year 2008.

Report and Opinion 2010;2(4)
18
3. Results In the below classified images dense forest
cover is represented by dark green color and degraded
forest is represented by light green color. Figure 5 and
figure 6 are resultant classified images. ARC GIS 9.3
software was used to compute areas of the dense forest
and degraded forest that resulted from the supervised
classification approach. The summary of the forested
area results are shown in table 2.
Table 2. Total forest area
Total forest area 1996
(hectare)
Total forest area 2008
(hectare)
5248.52 4683.50
3.1 NDVI Differencing Change Detection
Vegetation index reflects the approximation
relation between the spectral response and vegetation
cover. The essential characteristic of desertification is
the lower the productivity of land. Changes in
vegetation index can reflect the changing process of
land productivity. Therefore vegetation index can be
used as desertification monitoring indicators to monitor
land desertification and dynamic changes.
The Normalized Difference Vegetation Index
(NDVI) is a simple numerical indicator that can be
used to analyze remote sensing measurements,
typically but not necessarily from a space platform, and
assess whether the target being observed contains live
green vegetation or not.
NDVI = (near I.R - Red)/ (near I.R + Red)
The sub-scene bands 2 and 3 for each were used to
create an NDVI image for each year and then
differencing of the images was carried out to detect
change. Differencing involved the subtraction of the
2008 NDVI image from the 1996 NDVI image using
an image calculator in the software. Table 3 and table 4
is showing histogram data for NDVI difference (NDVI
1996-NDVI 2008).
Figure 5. 1996 NDVI image for Ranchi city
Figure 6. 2008 NDVI image for Ranchi city
Report and Opinion 2010;2(4)
19
Table 3. NDVI results under frequency classes
Class Lower
Limit
Upper
Limit
Frequency Cumulative
Frequency
1 -0.955 -0.875 108 108
2 -0.875 -0.759 660 768
3 -0.759 -0.652 1636 2404
4 -0.652 -0.551 3184 5588
5 -0.551 -0.458 7860 13448
6 -0.458 -0.359 16552 30000
7 -0.359 -0.258 47924 77924
8 -0.258 -0.152 195615 273539
9 -0.152 -0.052 1169760 1443299
10 -0.052 +0.051 2693796 4137095
11 +0.051 +0.158 571480 4708575
12 +0.158 +0.251 13162 4721737
13 +0.251 +0.352 2828 4724565
14 +0.352 +0.458 366 4724931
15 +0.458 +0.555 44 4724975
16 +0.555 +0.678 36 4725011
Table 4. Statistical parameter of NDVI results
Actual Maximum 0.679
Mean +0.068
Standard Deviation 0.080
3.4 Analyses of Results
A positive mean of 2008-1996 NDVI
differencing is an indication of reduction in above
ground biomass within 12 years. This implies a decline
in vegetation. It thus confirms the change detected
through post classification analysis. From the post
classification results there was tremendous reduction in
forest cover area by 565.02 hectares within a period of
12 years between 1996 and 2008.So it is equivalent to
10.76% decrease in the forest area. With the help of
remote sensing and GIS techniques it is clearly shows
that the total forest cover is continuously degrading and
transforming into various land use/land cover category.
Acknowledgements
We are thankful to Department of Remote
Sensing, B.I.T.-Mesra, Ranchi, India for providing
satellite data and software support. We are grateful to
Dr. M.S.Nathawat for their cooperation and valuable
suggestions.
Correspondence to: Pavan Kumar
M.Tech (Remote Sensing)
B.I.T.-Mesra, Ranchi,
Jharkhand, India
� +91-9415388874
E-mail:[email protected]
References
(1) J.T. Houghton, Y. Ding, D.J. Griggs, M. Noguer,
P.J. van der Linden, X. Dai, C.A. Johnson, and K.
Maskell.The Scientific Basis, Intergovernmental
Panel on Climate Change IPCC 2001; Edited by.
Cambridge, UK: Cambridge University Press.
(2) Houghton, R. A. Revised estimates of the annual
net flux of carbon to the atmosphere from
changes in land use and land management
(2003);1850-2000:Tellus 55B: 378-390.
(3) Santilli, M., P. Moutinho, S. Schwartzman, D.
Nepstad, L. Curran and C. Nobre.Tropical
Deforestation and the Kyoto Protocol, Climatic
Change (2005); 71: 267-276.
(4) U.S. Environmental Protection Agency.
Inventory of U.S. greenhouse gas emissions and
sinks (2006); 1990-2004: EPA 430-R-06-002.
U.S. Environmental Protection Agency.
(5) Lillesand and Kieffer. Remote Sensing and Image
Interpretation. John Wiley and Sons, NewYork
1994.

Report and Opinion 2010;2(4)
20
(6) Singh, A. Digital change detection techniques
using remotely-sensed data 1989; Int. J. Remote
Sensing: 10(6):pp.989-100.
(7) Coppin, P. Jonckheere, I.Nackaerts, K. Muys, P
and Lambin, E. Digital Change Detection in
Ecosystem Monitoring 2004; A Review,
International Journal of Remote Sensing 25(9):
pp: 1565-1596.
(8) Coppin, P. Jonckheere, I.Nackaerts, K. Muys, P
and Lambin, E.Digital Change Detection in
Ecosystem Monitoring 2004; A Review,
International Journal of Remote Sensing 25(9):
pp: 1565-1596.
(9) Mas, J. F. Monitoring land-cover changes: a
comparison of change detection techniques 1999;
International Journal of Remote Sensing 20(1):
pp: 139-152.
(10) Lu, D. Mausel, P. Brondizio, E and Moran, E.
Change Detection Techniques, International
Journal of Remote Sensing 2004; 25(12): pp:
2365-2407.
3/30/2010
Related Documents