Monetary Policy and Current Economic Conditions

Welcome message from author
This document is posted to help you gain knowledge. Please leave a comment to let me know what you think about it! Share it to your friends and learn new things together.
Transcript
Monetary Policy and
Current Economic Conditions
Part 1: Monetary Policy
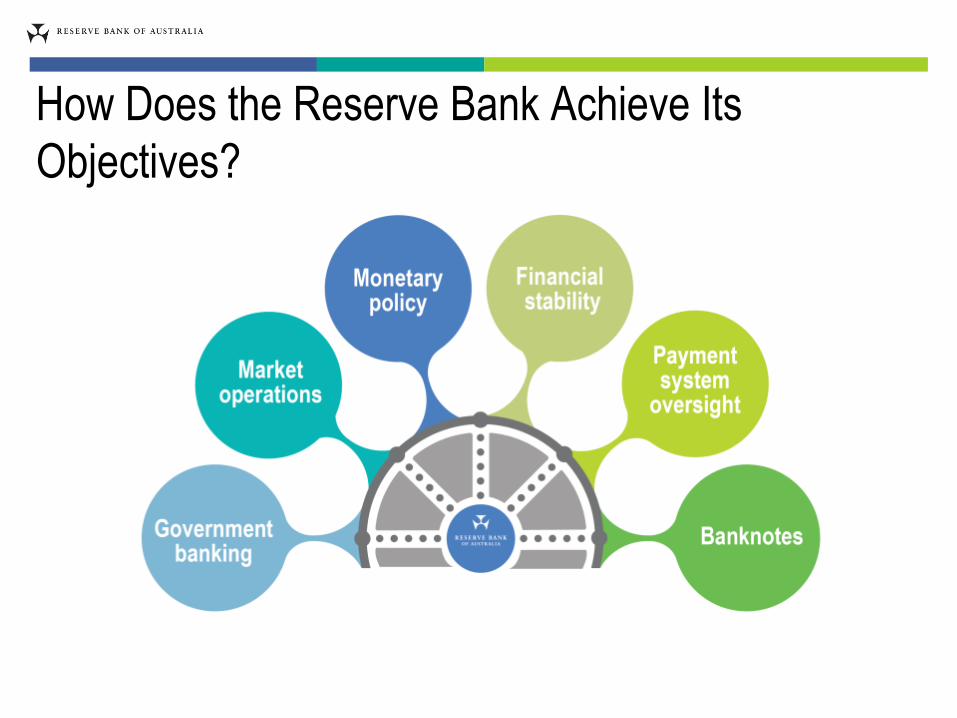
How Does the Reserve Bank Achieve Its
Objectives?
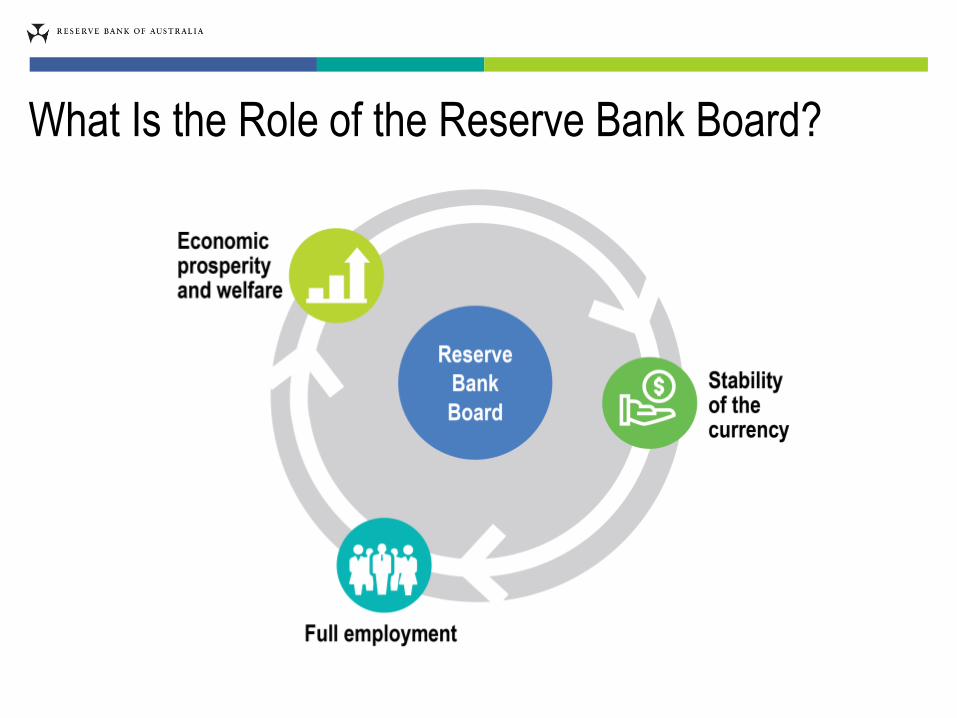
What Is the Role of the Reserve Bank Board?
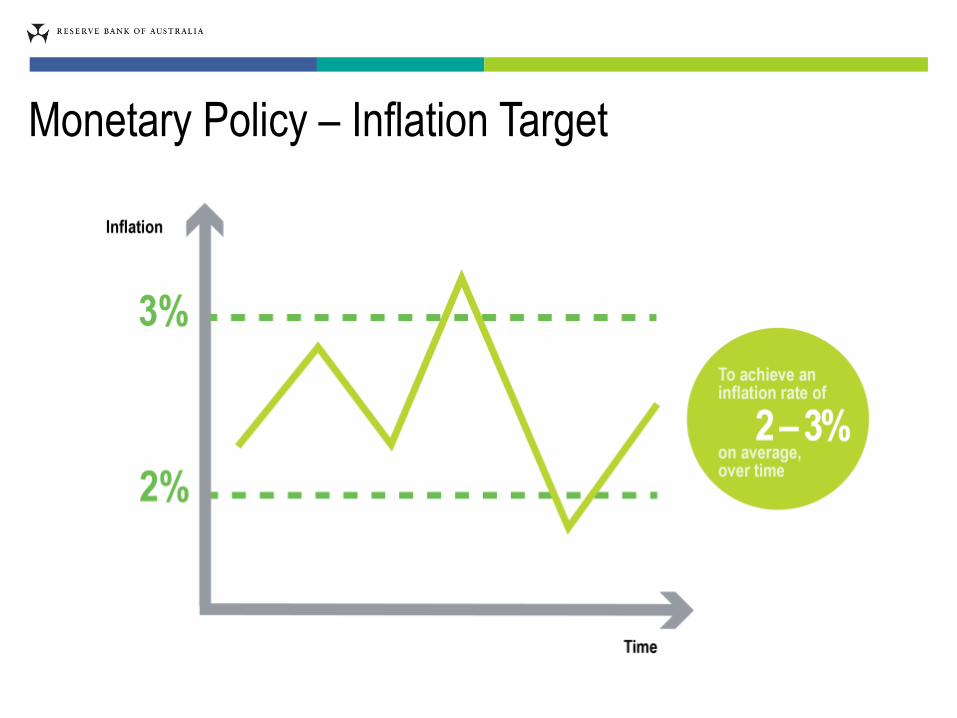
Monetary Policy – Inflation Target
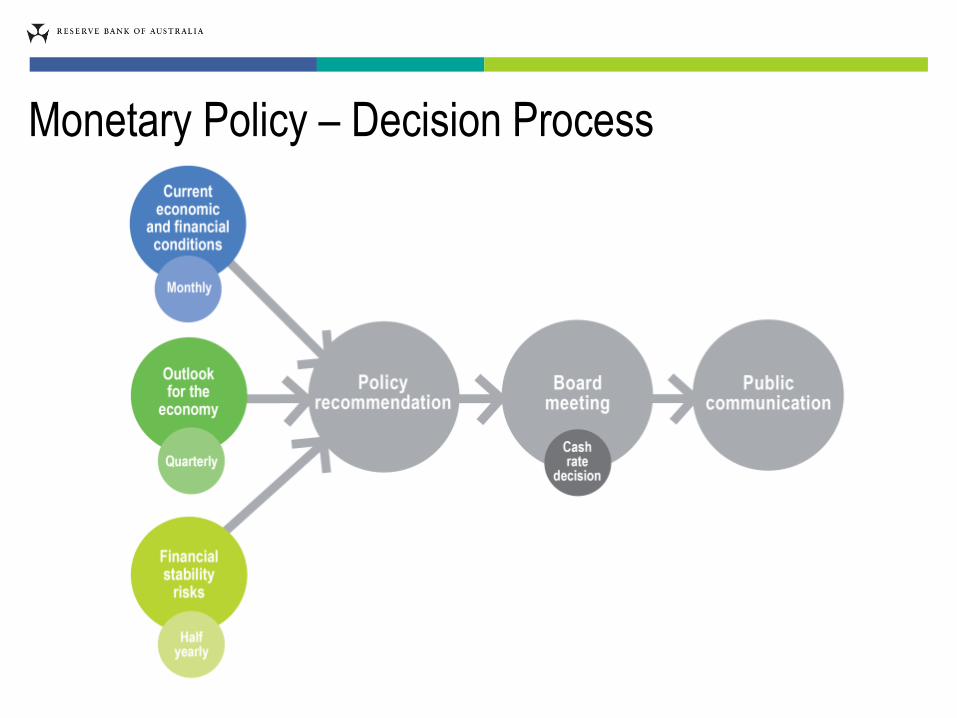
Monetary Policy – Decision Process
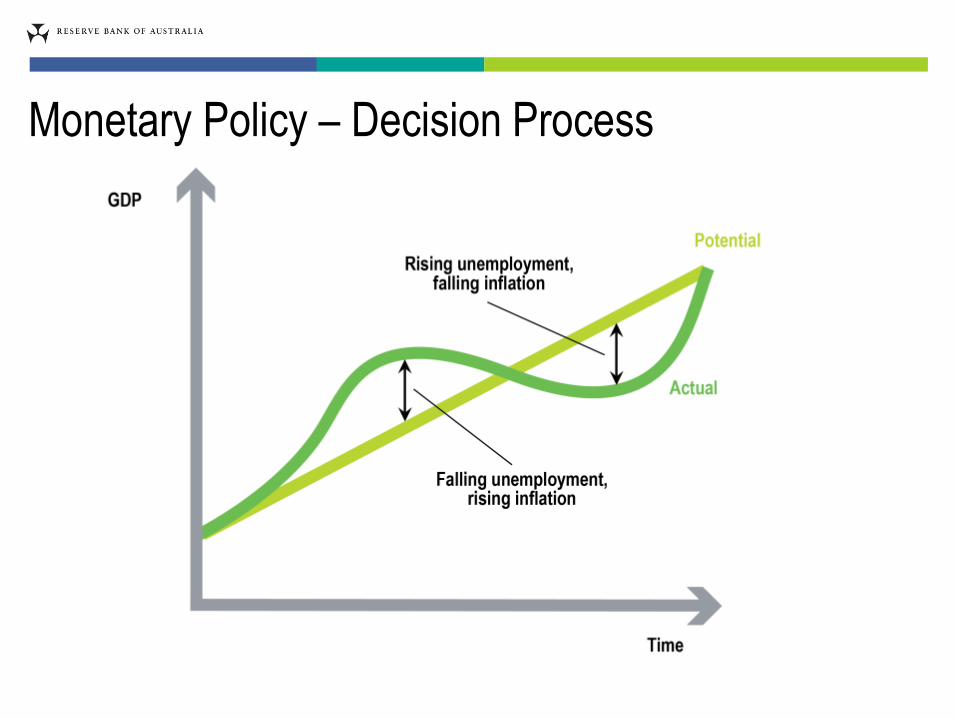
Monetary Policy – Decision Process
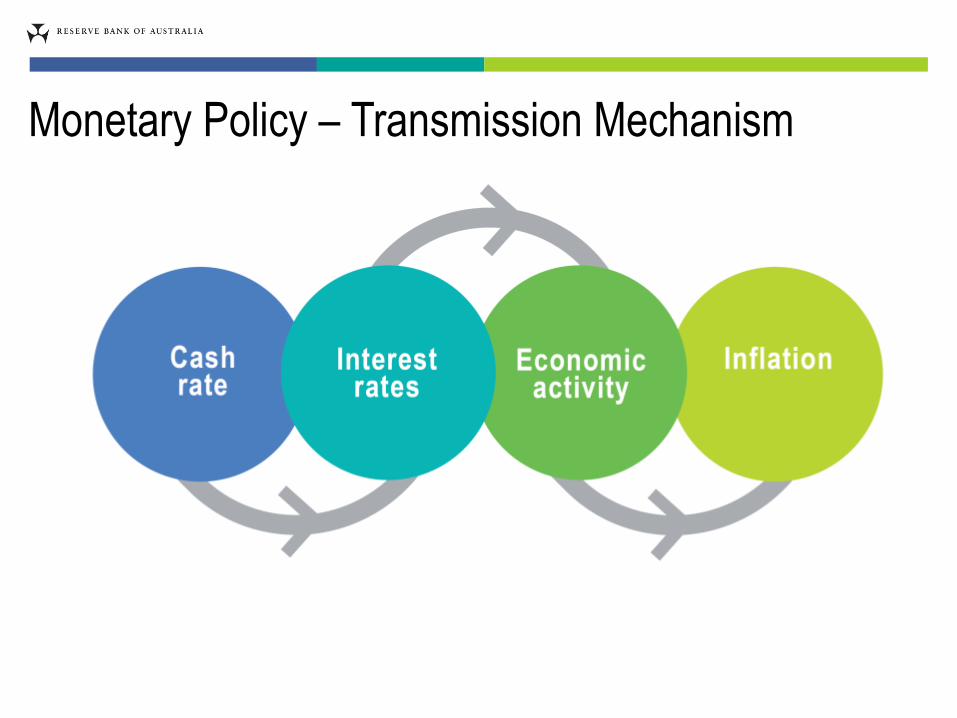
Monetary Policy – Transmission Mechanism
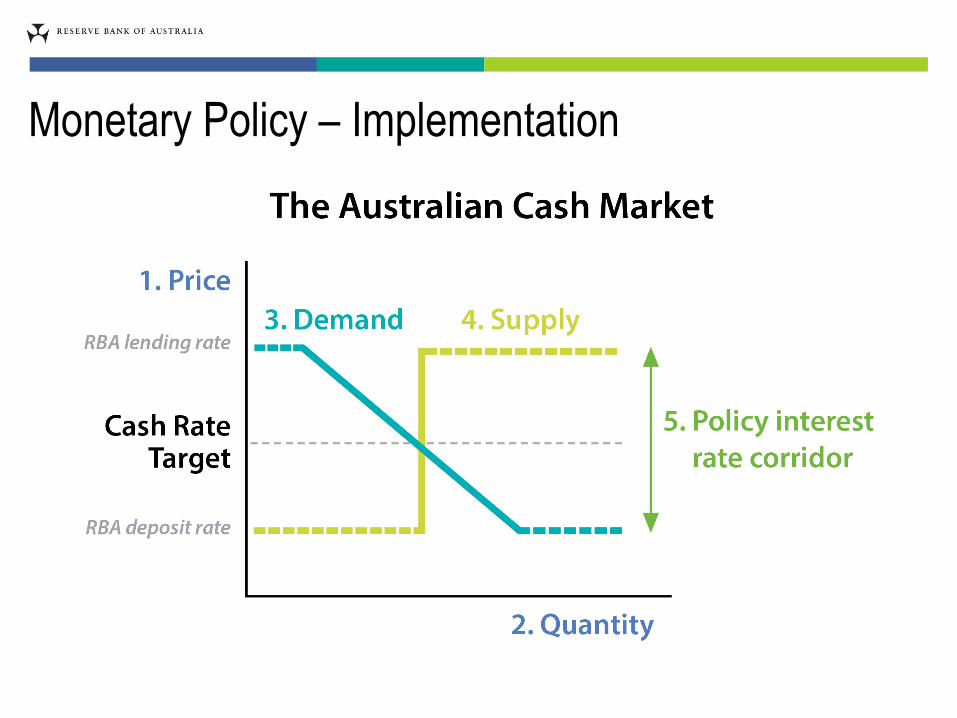
Monetary Policy – Implementation
Part 2: Current Economic Conditions
20102000199019801970 202050
75
100
125
150
index
50
75
100
125
150
index
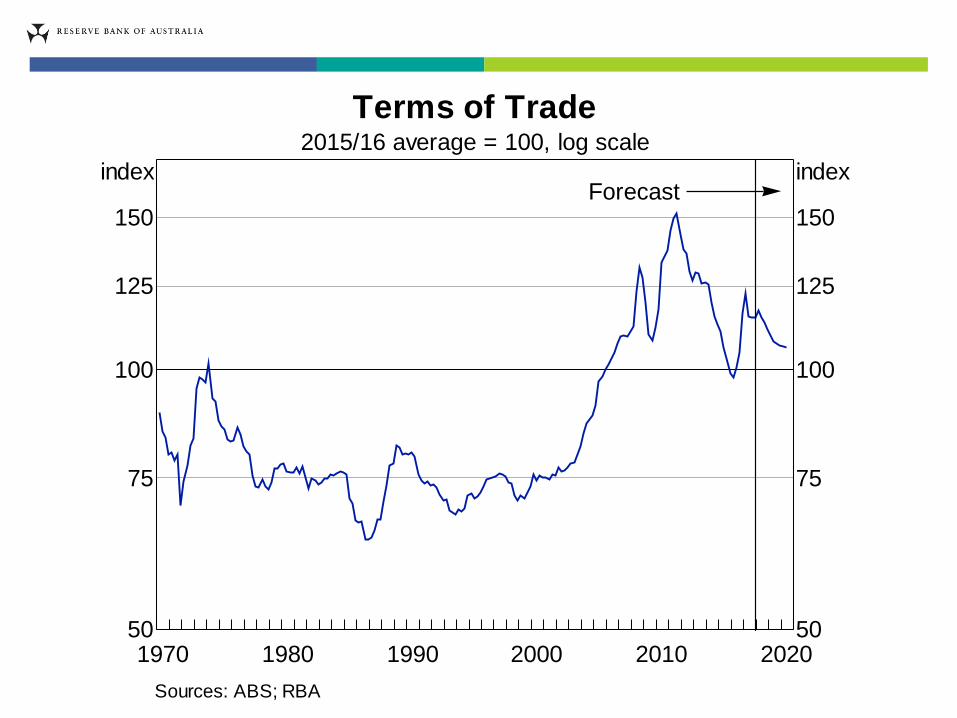
Terms of Trade2015/16 average = 100, log scale
Forecast
Sources: ABS; RBA
RBA forecast
20132007200119951989 2019-2
0
2
4
6
%
-2
0
2
4
6
%
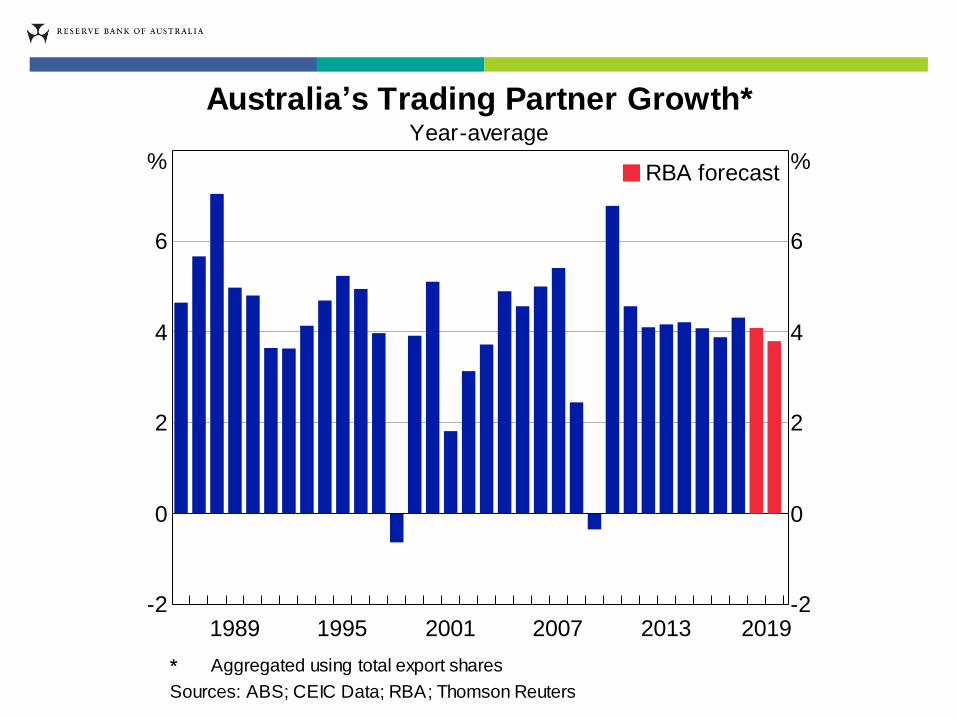
Australia’s Trading Partner Growth*Year-average
Aggregated using total export shares
Sources: ABS; CEIC Data; RBA; Thomson Reuters
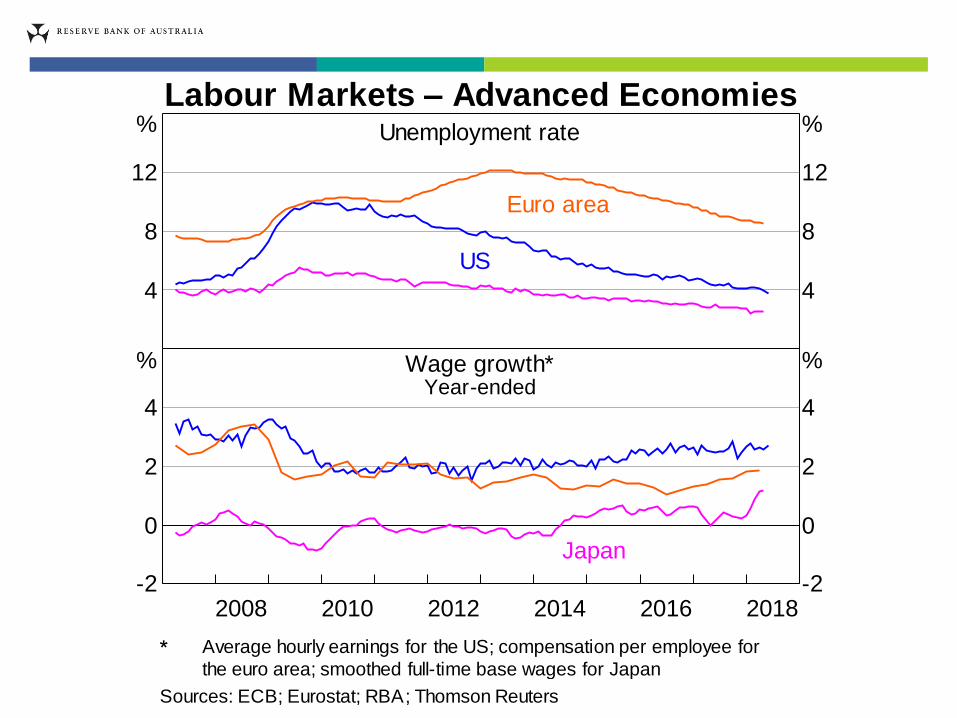
Labour Markets – Advanced EconomiesUnemployment rate
4
8
12
%
4
8
12
%
Euro area
US
Wage growth*Year-ended
20162014201220102008 2018-2
0
2
4
%
-2
0
2
4
%
Japan
Average hourly earnings for the US; compensation per employee for
the euro area; smoothed full-time base wages for Japan
Sources: ECB; Eurostat; RBA; Thomson Reuters
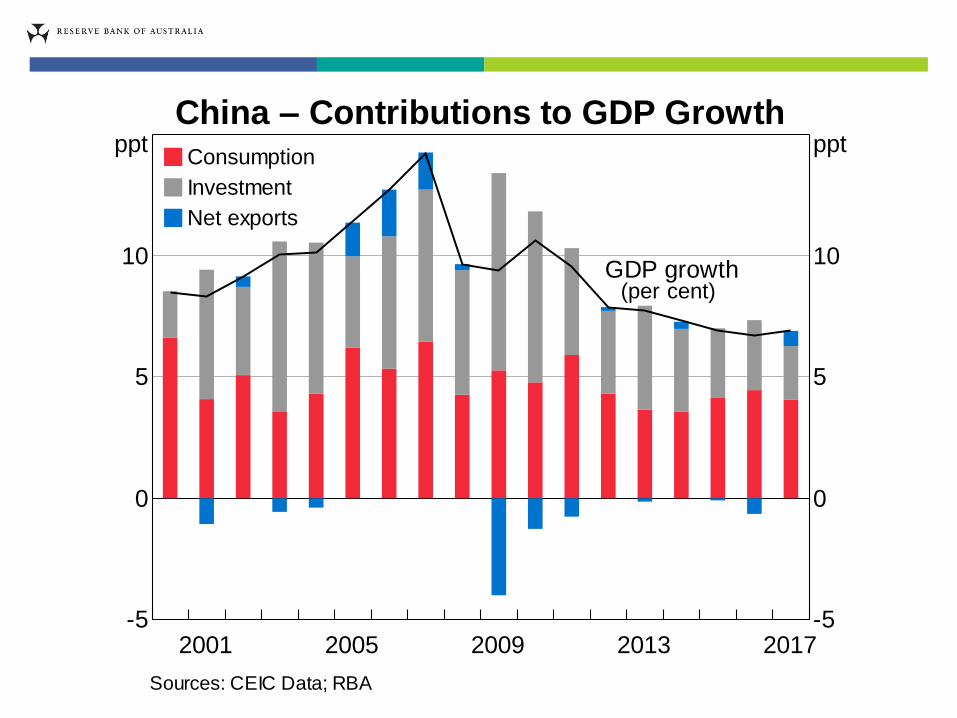
Consumption
Investment
Net exports
2013200920052001 2017-5
0
5
10
ppt
-5
0
5
10
pptChina – Contributions to GDP Growth
GDP growth(per cent)
Sources: CEIC Data; RBA
2013200920052001 20170
5
10
15
20
25
30
%
0
5
10
15
20
25
30
%
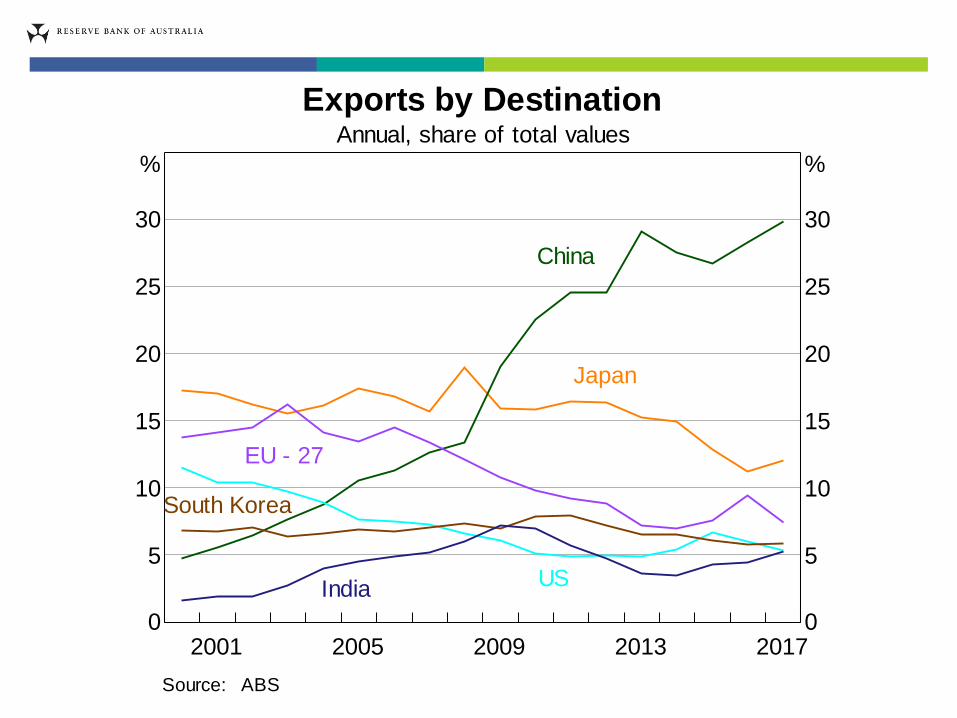
Exports by DestinationAnnual, share of total values
Japan
China
USIndia
South Korea
EU - 27
Source: ABS
2013200820031998 2018-2
0
2
4
%
-2
0
2
4
%
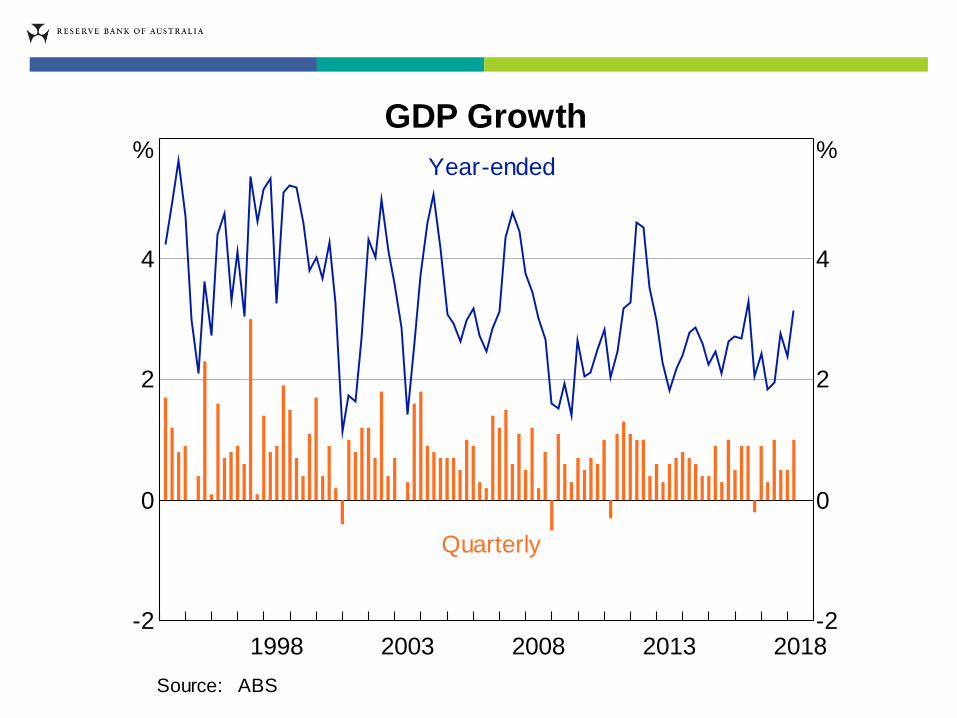
GDP Growth
Year-ended
Quarterly
Source: ABS
20122006200019941988 201840
60
80
100
index
0.40
0.60
0.80
1.00
US$
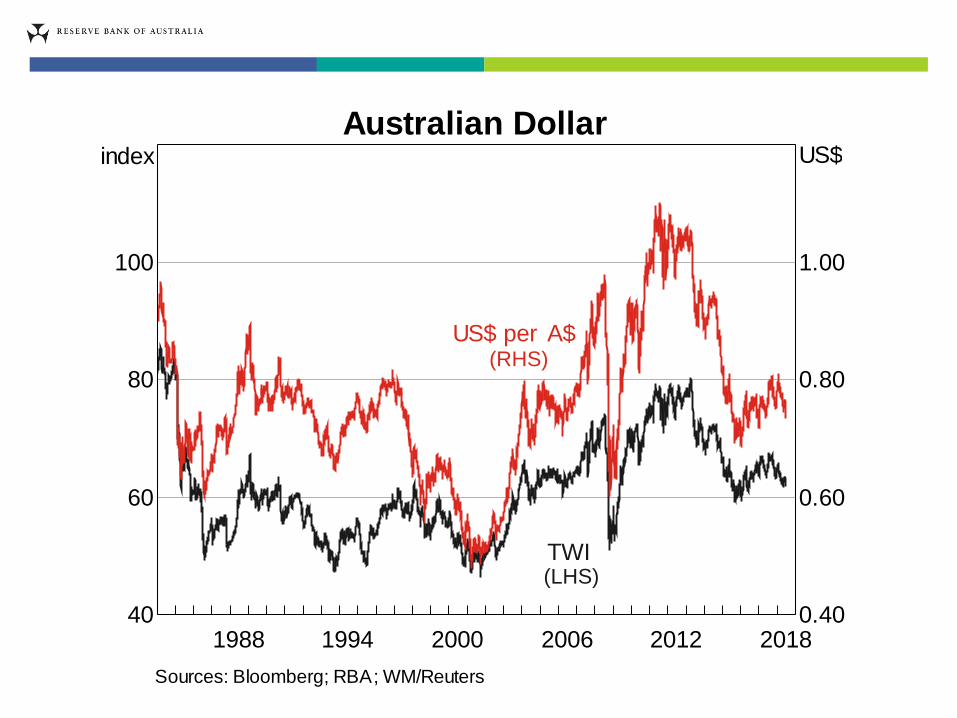
Australian Dollar
US$ per A$(RHS)
(LHS)TWI
Sources: Bloomberg; RBA; WM/Reuters
2015201120072003 20191
2
3
4
5
6
7
%
1
2
3
4
5
6
7
%
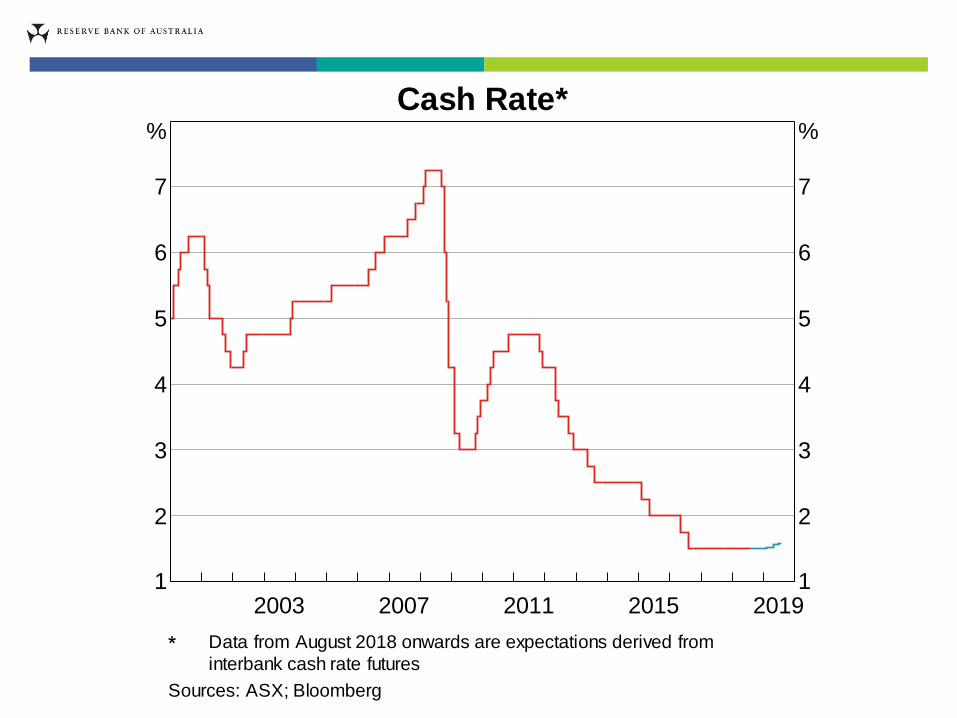
Cash Rate*
Data from August 2018 onwards are expectations derived from
interbank cash rate futures
Sources: ASX; Bloomberg
2013200920052001 2017-15
-10
-5
0
5
10
15
%
-15
-10
-5
0
5
10
15
%
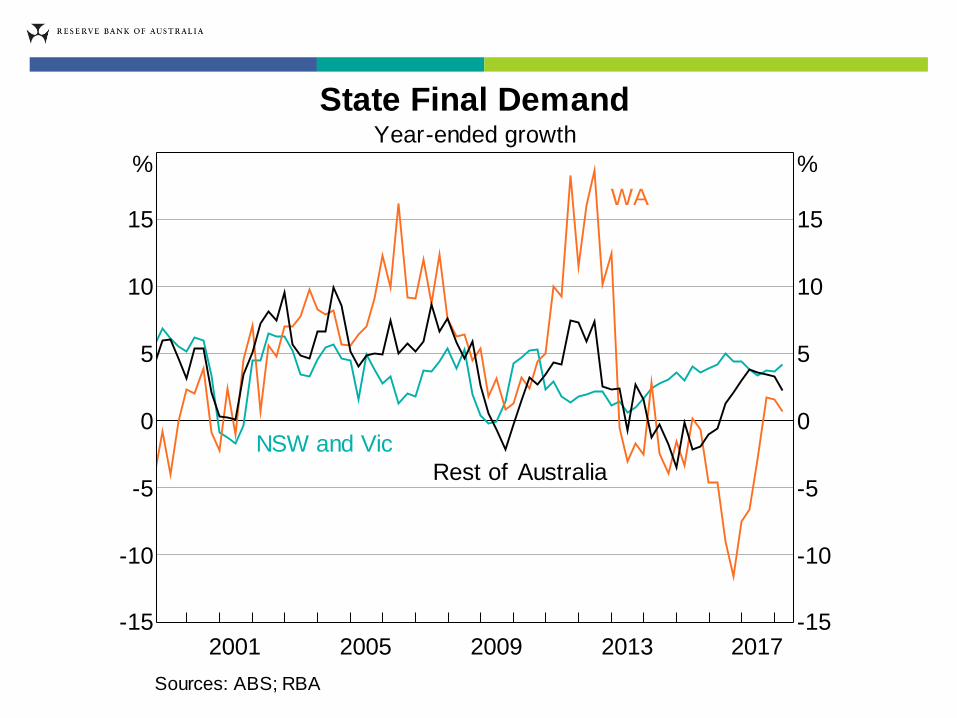
State Final DemandYear-ended growth
Rest of Australia
WA
NSW and Vic
Sources: ABS; RBA
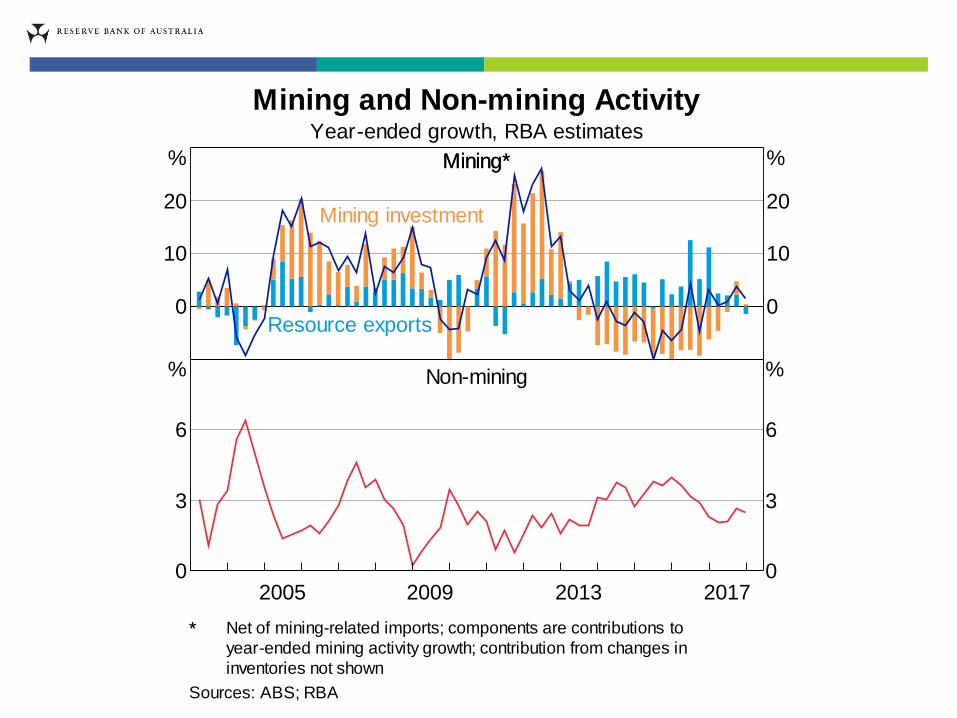
Mining and Non-mining ActivityYear-ended growth, RBA estimates
Mining*Mining*
201320092005 2017
0
10
20
%
0
10
20
%
Mining investment
Resource exports
Non-mining
201320092005 20170
3
6
%
0
3
6
%
Net of mining-related imports; components are contributions to
year-ended mining activity growth; contribution from changes in
inventories not shown
Sources: ABS; RBA
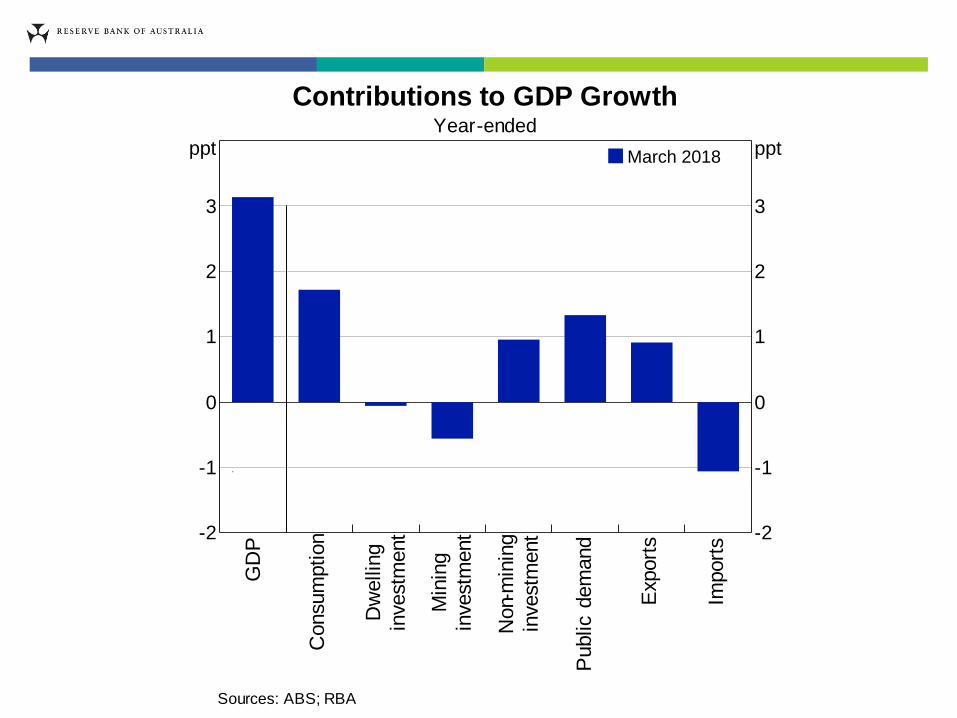
March 2018
GD
P
Consum
ption
Dw
ellin
g
investm
ent
Min
ing
investm
ent
Non-
min
ing
investm
ent
Public
dem
and
Export
s
Import
s-2
-1
0
1
2
3
ppt
-2
-1
0
1
2
3
ppt
Contributions to GDP GrowthYear-ended
Sources: ABS; RBA
20132008200319981993 20186
12
18
24
$b
6
12
18
24
$b
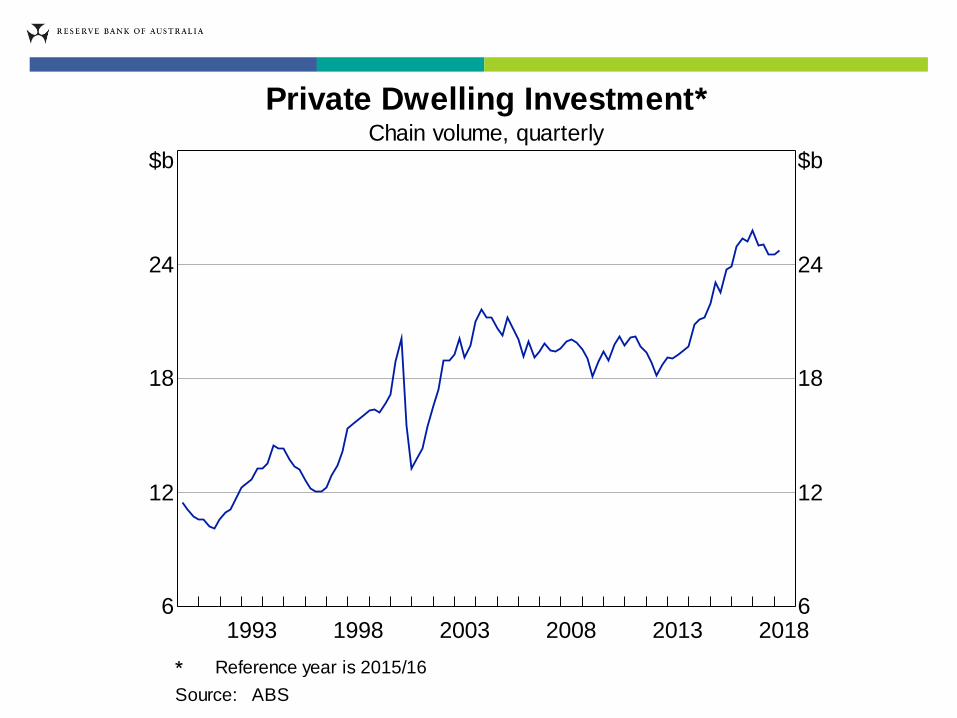
Private Dwelling Investment*Chain volume, quarterly
Reference year is 2015/16
Source: ABS
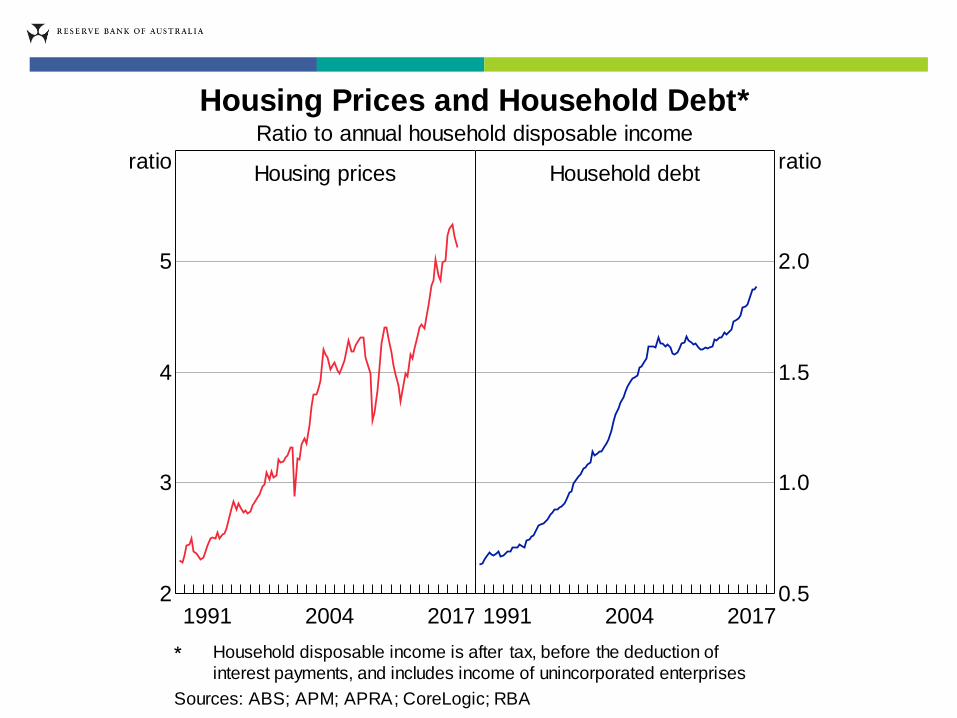
Housing Prices and Household Debt*Ratio to annual household disposable income
Housing prices
20041991 20172
3
4
5
ratioHousehold debt
20041991 20170.5
1.0
1.5
2.0
ratio
Household disposable income is after tax, before the deduction of
interest payments, and includes income of unincorporated enterprises
Sources: ABS; APM; APRA; CoreLogic; RBA
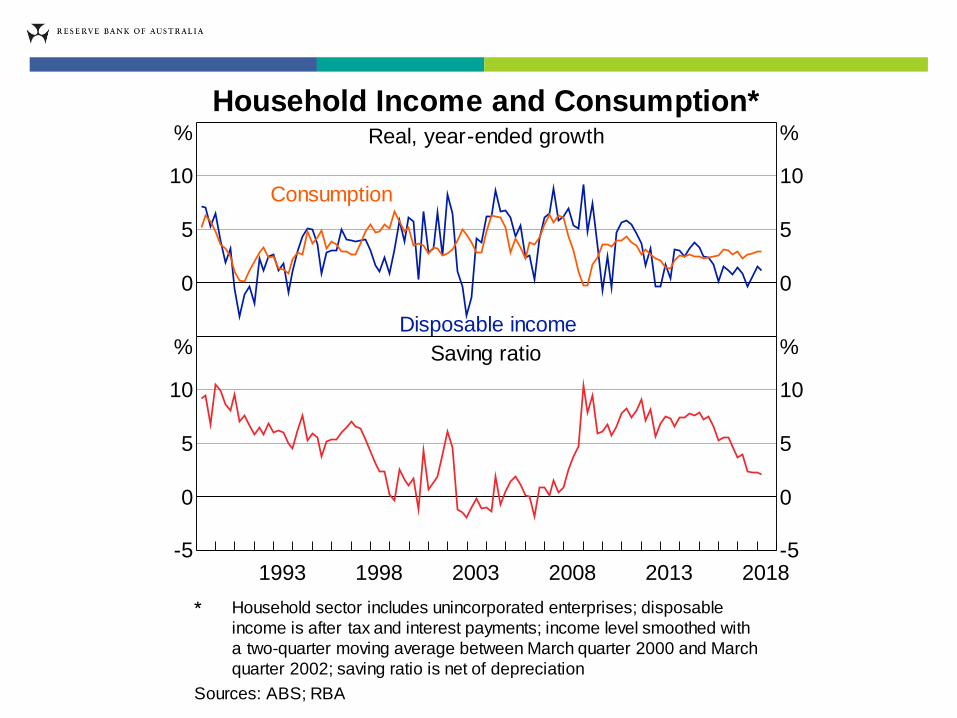
Household Income and Consumption*Real, year-ended growth
0
5
10
%
0
5
10
%
Disposable income
Consumption
Saving ratio
20132008200319981993 2018-5
0
5
10
%
-5
0
5
10
%
Household sector includes unincorporated enterprises; disposable
income is after tax and interest payments; income level smoothed with
a two-quarter moving average between March quarter 2000 and March
quarter 2002; saving ratio is net of depreciation
Sources: ABS; RBA
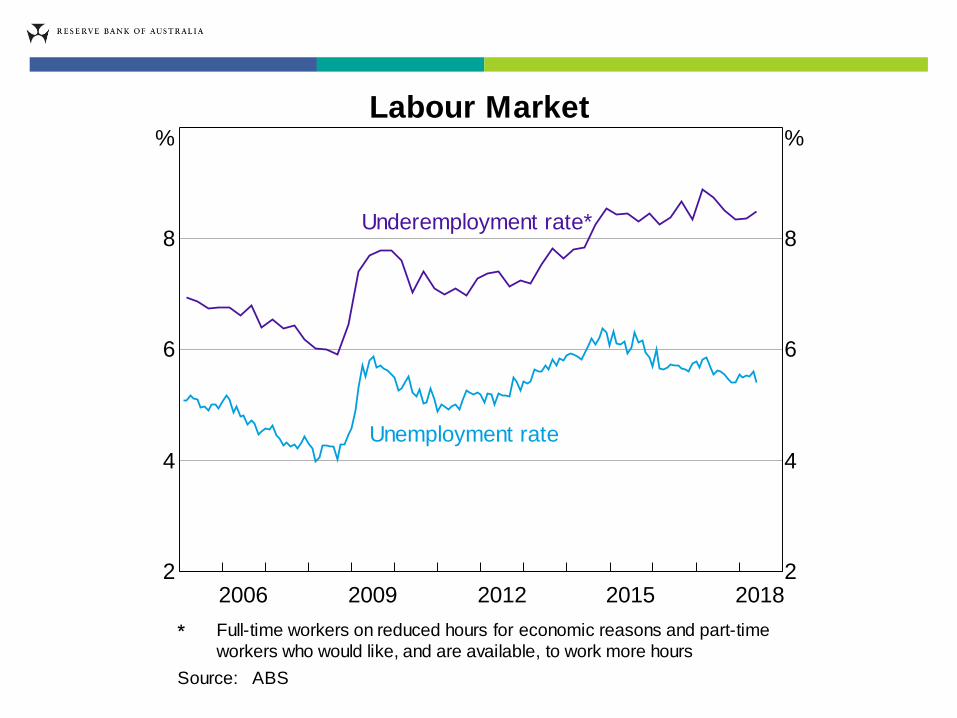
2015201220092006 20182
4
6
8
%
2
4
6
8
%
Labour Market
Underemployment rate*
Unemployment rate
Full-time workers on reduced hours for economic reasons and part-time
workers who would like, and are available, to work more hours
Source: ABS
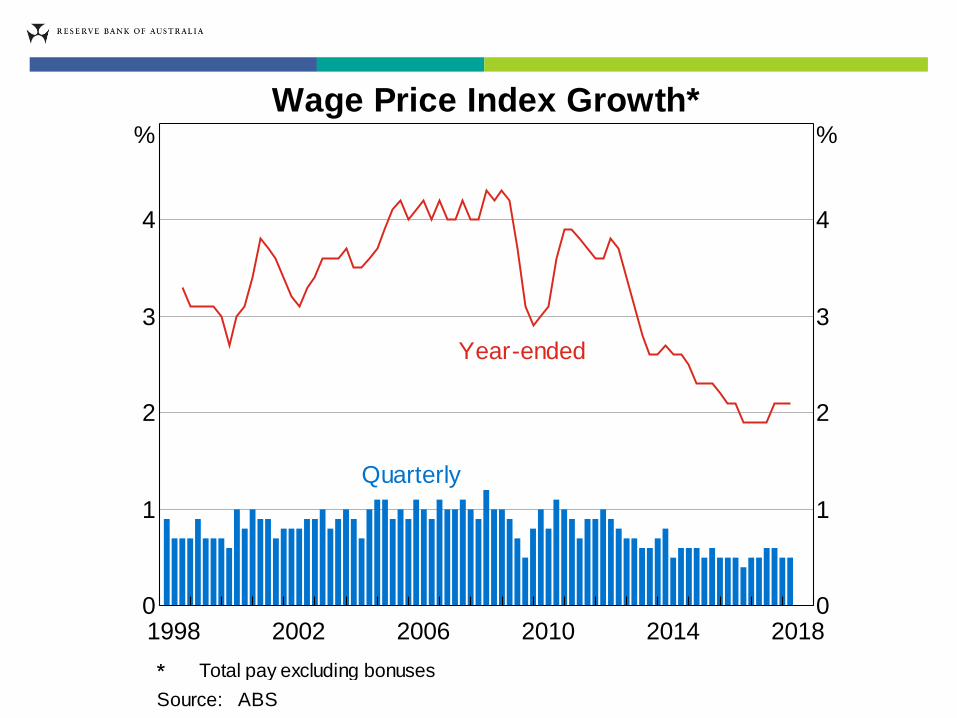
20142010200620021998 20180
1
2
3
4
%
0
1
2
3
4
%
Wage Price Index Growth*
Year-ended
Quarterly
Total pay excluding bonuses
Source: ABS
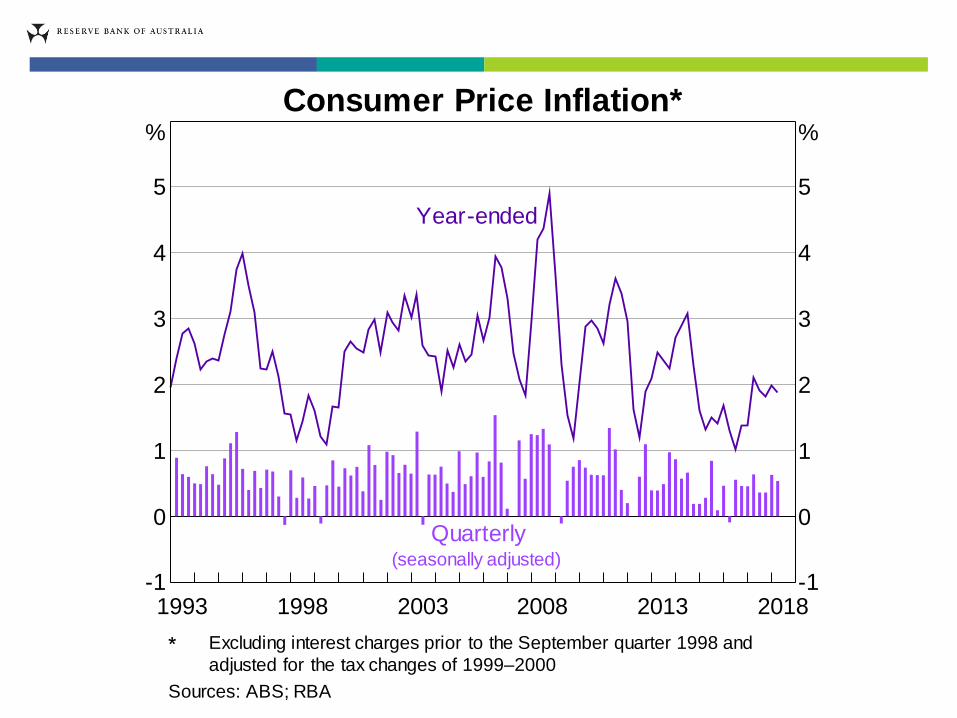
20132008200319981993 2018-1
0
1
2
3
4
5
%
-1
0
1
2
3
4
5
%
Consumer Price Inflation*
Year-ended
Quarterly(seasonally adjusted)
Excluding interest charges prior to the September quarter 1998 and
adjusted for the tax changes of 1999–2000
Sources: ABS; RBA
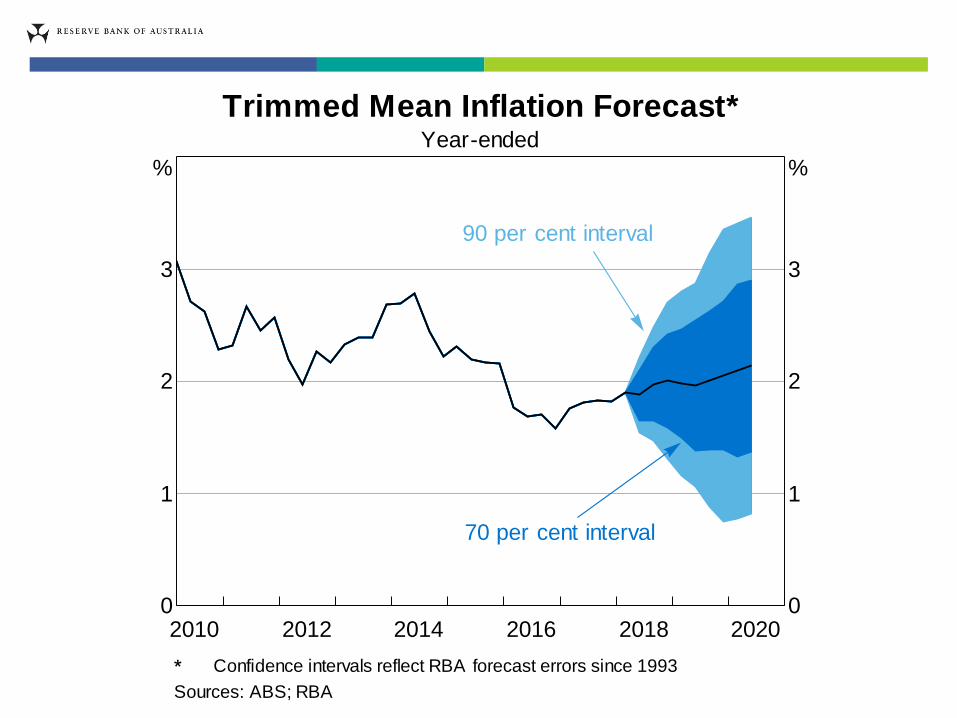
20182016201420122010 20200
1
2
3
%
0
1
2
3
%
Trimmed Mean Inflation Forecast*Year-ended
70 per cent interval
90 per cent interval
Confidence intervals reflect RBA forecast errors since 1993
Sources: ABS; RBA
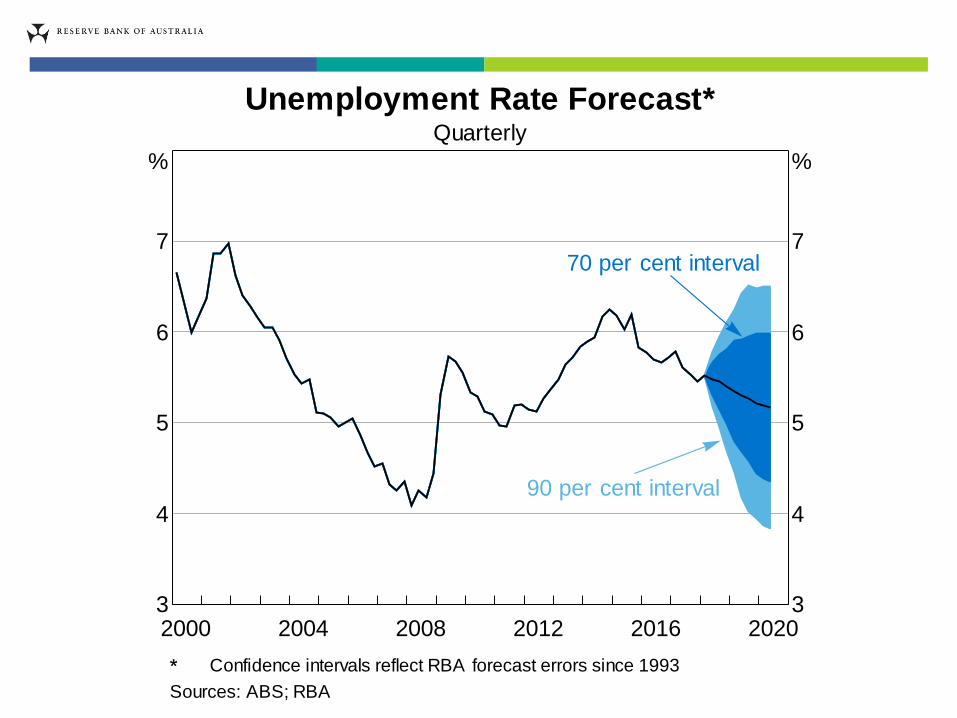
20162012200820042000 20203
4
5
6
7
%
3
4
5
6
7
%
Unemployment Rate Forecast*Quarterly
70 per cent interval
90 per cent interval
Confidence intervals reflect RBA forecast errors since 1993
Sources: ABS; RBA
More Information
Related Documents


