JOURNAL OF CELLULAR PHYSIOLOGY 200:440–450 (2004) Molecular Identification of ERa-Positive Breast Cancer Cells by the Expression Profile of an Intrinsic Set of Estrogen Regulated Genes ALESSANDRO WEISZ, 1 * WALTER BASILE, 1 CLAUDIO SCAFOGLIO, 1 LUCIA ALTUCCI, 1 FRANCESCO BRESCIANI, 1 ANGELO FACCHIANO, 2 PIERO SISMONDI, 3,4 LUIGI CICATIELLO, 1 AND MICHELE DE BORTOLI 3,5 1 Dipartimento di Patologia Generale, Seconda Universita ` Degli Studi di Napoli, Vico L. De Crecchio 7, Napoli, Italy 2 Istituto di Scienze dell’Alimentazione del Consiglio Nazionale delle Ricerche, Avellino, Italy 3 IRCC-Institute for Cancer Research & Treatment, University of Turin, Candiolo (TO), Italy 4 Department of Gynecology & Obstetrics, University of Turin, Candiolo (TO), Italy 5 Department of Oncological Sciences, University of Turin, Candiolo (TO), Italy Estrogens exert a key biological role in mammary gland epithelial cells and promote breast carcinogenesis and tumor progression. We recently identified a new large set of estrogen responsive genes from breast cancer (BC) cells by DNA microarray analysis of the gene expression profiles induced by 17b-estradiol in ZR-75.1 and MCF-7 cells. The purpose of the present study was to test whether the expression pattern of hormone regulated genes from this set identifies estrogen receptor (ERa) positive, hormone responsive BC cells. To this aim, we carried out in silico metanalysis of ERa positive and ERa negative human BC cell line transcriptomes, focusing on two sets of 171 and 218 estrogen responsive genes, respectively. Results show that estrogen dependent gene activity in hormone responsive BC cells is significantly different from that of non-responsive cells and, alone, allows to discriminate these two cellular phenotypes. Indeed, we have identified 61 genes whose expression profile specifically marks ERa positive BC cells, suggesting that this gene set may be exploited for phenotypic characterization of breast tumors. This possibility was tested with data obtained by gene expression profiling of BC surgical samples, where the ERa positive phenotypes were highlighted by the expression profile of a subset of 27 such hormone responsive genes and four additional BC marker genes, not including ERs. These results provide direct evidence that the expression pattern of a limited number of estrogen responsive genes can be exploited to assess the estrogen signaling status of BC cells both in vitro and ex-vivo. J. Cell. Physiol. 200: 440 – 450, 2004. ß 2004 Wiley-Liss, Inc. Breast cancer (BC) remains a serious threat to the patients, despite significant improvements in its clinical management (Harris et al., 2000). The most informative prognostic factor for primary BC is the presence of lymph node metastases: around 70% of node-negative patients can be expected to survive BC without additional treatments beyond surgical resection of the lump. Since no marker is available today to distinguish cancers most likely to recur, there is today a tendency to prescribe adjuvant treatments to all patients. The kind of pharmacological treatment is based on clinico- pathological criteria and on the expression of biological markers in tumor cells, since lymph-node metastasis per se is not predictive of sensitivity or resistance of the ß 2004 WILEY-LISS, INC. Contract grant sponsor: Italian Association for Cancer Research (to AW and PS); Contract grant numbers: IG 2002, IG 2003; Contract grant sponsor: Italian Ministry for Education, Univer- sity and Research (PRIN 2002-03 and FIRB Post-genoma Grant to AW and MDB); Contract grant numbers: 2002067514_002, RBNE0157EH; Contract grant sponsor: European Commission (contracts to AW and LA); Contract grant numbers: BMH4-CT98- 3433, QLG1-CT-2000-01935, QLK3-CT-2002-02029; Contract grant sponsor: Ministry of Health; Progetti Speciali 2000 and 2002 (to AW, MDB, and PS); Contract grant sponsor: Second University of Naples; Ricerca di Ateneo 2002 and 2003 (to AW, FB, and LA); Contract grant sponsor: Regione Piemonte, Ricerca Sanitaria Finalizzata 2002, 2003 (to PS). *Correspondence to: Alessandro Weisz, Dipartimento di Patologia Generale, Seconda Universita ` degli Studi di Napoli, Vico L. De Crecchio, 7, 80138 Napoli, Italy. E-mail: [email protected] Received 31 July 2003; Accepted 3 December 2003 DOI: 10.1002/jcp.20039

Welcome message from author
This document is posted to help you gain knowledge. Please leave a comment to let me know what you think about it! Share it to your friends and learn new things together.
Transcript

JOURNAL OF CELLULAR PHYSIOLOGY 200:440–450 (2004)
Molecular Identification of ERa-Positive Breast CancerCells by the Expression Profile of an Intrinsic Set
of Estrogen Regulated Genes
ALESSANDRO WEISZ,1* WALTER BASILE,1 CLAUDIO SCAFOGLIO,1 LUCIA ALTUCCI,1
FRANCESCO BRESCIANI,1 ANGELO FACCHIANO,2 PIERO SISMONDI,3,4 LUIGI CICATIELLO,1
AND MICHELE DE BORTOLI3,5
1Dipartimento di Patologia Generale, Seconda Universita Degli Studi di Napoli,Vico L. De Crecchio 7, Napoli, Italy
2Istituto di Scienze dell’Alimentazione del Consiglio Nazionale delle Ricerche, Avellino, Italy3IRCC-Institute for Cancer Research & Treatment, University of Turin, Candiolo (TO), Italy
4Department of Gynecology & Obstetrics, University of Turin, Candiolo (TO), Italy5Department of Oncological Sciences, University of Turin, Candiolo (TO), Italy
Estrogens exert a key biological role inmammary gland epithelial cells andpromotebreast carcinogenesis and tumor progression.We recently identified a new large setof estrogen responsive genes from breast cancer (BC) cells by DNA microarrayanalysis of the gene expression profiles induced by 17b-estradiol in ZR-75.1 andMCF-7 cells. The purpose of the present study was to test whether the expressionpattern of hormone regulated genes from this set identifies estrogen receptor (ERa)positive, hormone responsive BC cells. To this aim, we carried out in silicometanalysis of ERa positive and ERa negative human BC cell line transcriptomes,focusing on two sets of 171 and 218 estrogen responsive genes, respectively.Results show that estrogen dependent gene activity in hormone responsive BC cellsis significantly different from that of non-responsive cells and, alone, allows todiscriminate these two cellular phenotypes. Indeed, we have identified 61 geneswhose expression profile specifically marks ERa positive BC cells, suggesting thatthis gene set may be exploited for phenotypic characterization of breast tumors.This possibility was tested with data obtained by gene expression profiling of BCsurgical samples, where the ERa positive phenotypes were highlighted by theexpression profile of a subset of 27 such hormone responsive genes and fouradditional BC marker genes, not including ERs. These results provide directevidence that the expression pattern of a limited number of estrogen responsivegenes canbe exploited to assess the estrogen signaling status of BCcells both in vitroand ex-vivo. J. Cell. Physiol. 200: 440–450, 2004. � 2004 Wiley-Liss, Inc.
Breast cancer (BC) remains a serious threat to thepatients, despite significant improvements in its clinicalmanagement (Harris et al., 2000). The most informativeprognostic factor for primary BC is the presence oflymph node metastases: around 70% of node-negativepatients can be expected to survive BC withoutadditional treatments beyond surgical resection of the
lump. Since no marker is available today to distinguishcancers most likely to recur, there is today a tendency toprescribe adjuvant treatments to all patients. The kindof pharmacological treatment is based on clinico-pathological criteria and on the expression of biologicalmarkers in tumor cells, since lymph-node metastasis perse is not predictive of sensitivity or resistance of the
� 2004 WILEY-LISS, INC.
Contract grant sponsor: Italian Association for Cancer Research(to AW and PS); Contract grant numbers: IG 2002, IG 2003;Contract grant sponsor: Italian Ministry for Education, Univer-sity and Research (PRIN 2002-03 and FIRB Post-genoma Grantto AW and MDB); Contract grant numbers: 2002067514_002,RBNE0157EH; Contract grant sponsor: European Commission(contracts to AW and LA); Contract grant numbers: BMH4-CT98-3433, QLG1-CT-2000-01935, QLK3-CT-2002-02029; Contractgrant sponsor: Ministry of Health; Progetti Speciali 2000 and2002 (to AW, MDB, and PS); Contract grant sponsor: SecondUniversity of Naples; Ricerca di Ateneo 2002 and 2003 (to AW, FB,and LA); Contract grant sponsor: Regione Piemonte, RicercaSanitaria Finalizzata 2002, 2003 (to PS).
*Correspondence to: Alessandro Weisz, Dipartimento di PatologiaGenerale, Seconda Universita degli Studi di Napoli, Vico L. DeCrecchio, 7, 80138 Napoli, Italy.E-mail: [email protected]
Received 31 July 2003; Accepted 3 December 2003
DOI: 10.1002/jcp.20039
disease to any of the adjuvant treatments available(Lønning et al., 2001).
Adjuvant therapy is the most effective weaponavailable today against recurrence and systemic spreadof BC. Pharmacological treatments, involving the use ofnon-selective cytotoxic treatments and/or endocrinetherapy, reduce the recurrence rate and the risk ofdistant metastases. Similar pharmacological treat-ments are also used in the advanced disease. Endocrinetherapy, based on systemic estrogen ablation by drugsaffecting hormone synthesis, metabolisms or actions intarget cells, is very effective on selected patients andgenerally well tolerated, both in the adjuvant settingand in the metastatic disease. Hormone responsivebreast tumors are currently identified by the presence ofERs (ERa and in some cases also ERb) and of theestrogen regulated progesterone receptors (PgRs). Pre-diction of BC responsiveness to hormones, based oncurrent assays for ERa expression in tumor cells can,however, be misled by the existence of differentmolecular situations in which the ER is present butinactive (Ferguson et al., 1998; Hopp and Fuqua, 1998).Indeed, comprehensive clinical trials have shown thatabout one third of ER/PgR-positive tumors fail torespond to endocrine therapy, while about 10% ofreceptor-negative ones do respond (Harris et al., 2000).Receptor-positive tumors are thus heterogeneous withrespect to estrogen sensitivity and, for this reason,functional markers of hormone dependent signaling orERs function in BC cells are being actively searched for(Biswas et al., 1998; Bouras et al., 2001; Finlin et al.,2001). Identification of such markers is complicated,however, by the fact that hormone receptors expressionin BC cells more often is associated with cell differentia-tion and low proliferation rates.
Gene expression profiling is a promising new way toclassify BC in clinically relevant subtypes according tomolecular ‘signatures’ of tumor biopsies (Martin et al.,2000; Perou et al., 2000; Sørlie et al., 2001; West et al.,2001; Bertucci et al., 2002; van’t Veer et al., 2002). Toprovide the logical framework required for interpretingthe biological significance of the gene expressionpatterns observed in tumor samples, however, theidentification of the transcriptional programs associatedwith BC cell responses to relevant physiological stimuliis much sought after. Perou et al. (1999), for example,found that clusters of coexpressed genes identifiedthrough manipulations of mammary epithelial cellsin vitro, including stimulation with growth factors andcytokines, showed consistent patterns of variation inexpression among BC specimens. Also, Ross et al. (2000),by comparing the gene expression patterns of BCbiopsies and breast and mesenchymal cell lines foundspecific gene expression features in tumors whichappeared to be related to what observed in vitro in celllines, where specific gene expression signatures could belinked to defined biological properties of the cells, suchas doubling time, drug metabolism, or response tointerferon stimulation. Gene expression studies led infact to the identification of cluster of genes whoseexpression pattern appear to relate to the presence ofERa in the tumor (Perou et al., 2000; Dressman et al.,2001; Gruvberger et al., 2001; Sørlie et al., 2001; Westet al., 2001; van de Vijver et al., 2002; van’t Veer et al.,
2002). It is not clear, however, whether such patternsare indeed related to the estrogen signaling status of thetumor or, instead, if they reflect its differentiationstatus.
To help address this problem, we speculated that theidentification of a set of hormone responsive genes inhuman BC cells could provide specific markers tomonitor the hormone signaling status of tumors.Expression profiling of a specific set of estrogenresponsive genes, in fact, would allow focusing theanalysis on the hormone dependent transcriptome of BCcells. We present here evidence that a subgroup ofhormone-responsive genes is indeed sufficient to iden-tify ER-positive BC cells, either in culture or from tumorbiopsies. This is proof of concept that hormone-depen-dent gene expression profiles can identify ER pathwayactivation in tumors and thus may be used to predicthormone-responsiveness in BC.
MATERIALS AND METHODSSelection of the starting set ofestrogen-responsive genes
The starting set of estrogen responsive genes used forall the analysis was derived from our microarray studyof the genomic response of human MCF-7 and ZR75.1BC cell lines to estrogen treatment (Weisz et al., 1999;Cicatiello et al., 2001; Cicatiello L, Natoli G, Scafoglio C,Altucci L, Cancemi M, Facchiano A, Calogero R, IazzettiG, De Bortoli M, Sfiligoi C, Sismondi P, Biglia N,Bresciani F, and Weisz A. The gene expression programactivated by estrogen in hormone responsive human BCcells. Submitted for publication elsewhere). This set wasproduced using cDNA microarrays containing probes for8,372 unique human genes/EST and allowed to identify344 genes whose expression is either increased ordecreased after estrogen stimulation.
Expression data extraction and evaluation
The first set of data was derived from the NCI60 geneexpression database for the molecular pharmacology ofcancer (Ross et al., 2000) that includes the data relative tothe expression of approximately 8,000 genes in 60 celllines of different tissue origin. Seven BC cell lines arepresent in this database, 2 ERa positive and estrogenresponsive (T-47D and MCF-7) and 5 ERa negative,hormone unresponsive (BT-549, Hs578T, MDA-MB-231,MDA-MB-435, and MDA-N, an ERBB2-transfected sub-clone of MDA-MB-435 cells). For comparison, datarelative to one normal breast tissue biopsy (normalbreast) and 16 human cell lines from brain (SF-268 andU251), colon (COLO205 and HCT-116), kidney (A498and 786-0), lung (A549 and NCI-H322), ovary (OVCAR-4and -8), and prostate (DU-145 and PC-3) cancer,melanoma(SKMEL-5and -28), chronicmyeloid leukemia(K-562), and multiple myeloma (RPMI-8226) wereconsidered. The microarray data relative to each of thesecell lines were downloaded from the NCI60 Cancer Micro-array Project web site (http://genome-www.stanford.edu/nci60/). Each dataset included the normalized fluores-cence data obtained by co-hybridization of Cy5-labelledcDNA reverse transcribed from mRNA isolated from thecell line under study and Cy3-labelled cDNA reversetranscribed from a reference mRNA sample, whichconsisted of a mix of mRNA extracted from 12 cell lines
MOLECULAR TYPING OF ERa POSITIVE BREAST CANCER CELLS 441

of different histotype, chosen to maximize diversity ingene expression. Thanks to this common internalreference, relative variations in gene expression acrossall cell lines can be inferred directly from the changes ofnormalized Cy3/Cy5 ratios (Ross et al., 2000). On theother hand, these fluorescence ratios do not represent theabsolute mRNA expression value in a given cell line.Following elimination of low quality spots (FLAG>0)and spots characterized by hybridization signals below athreshold, set to 1/10th the average fluorescence data(Cy3þCy5) of the array, the expression data relative to171 of the 344 estrogen-responsive genes mentionedabove were found in the NCI60 database and used forfurtheranalysis.ThecDNAprobes for 28 suchgenes werepresent in duplicate or triplicate and allowed control forreproducibility of the measurements. An internal controlwas also provided by the presence of triplicate measure-ments relative to two cell lines (MCF-7 and K-562) thatcould be compared. The second set of experimental dataon cell lines was obtained from the ‘Molecular Portraitsof Human Breast Tumors’ web site (http://genome-www.stanford.edu/breast_cancer/molecularportraits/).These data had been generated in a microarray studythat focused mainly on analysis of surgical BC speci-mens (Perou et al., 2000), but included also threeestrogen-responsive (BT-474, MCF-7, and T-47D) andfour-unresponsive (BT-549, Hs578T, MDA-MB-231, andSK-BR-3) BC cell lines, two normal mammary epithelialcell lines (HMEC and 184), analyzed under differentculture conditions, and five mesenchymal-like cell lines(HUVEC, MOLT4, NB4, RPMI-8226, SW872). Dataconcerning the expression of >8,000 human genes wereavailable in this database. Proceedingas abovedescribed,218 informative genes were found among the 344estrogen-regulated gene set, including 129 in commonwith those of the NCI60 database and 52 present inreplicate.
The dataset relative to breast tumor biopsies wereextracted from the same database (http://genome-www.stanford.edu/breast_cancer/molecularportraits/).Here, the data relative to a comprehensive geneexpression analysis performed in 62 tumor specimensfrom 40 patients, comprising also 22 sample pairs fromthe same tumor, obtained either before and afterneoadjuvant chemotherapy or from the primary lesionand its lymph node metastasis (Perou et al., 2000).
Clustering analysis
The log-transformed expression data relative toestrogen-responsive genes from either data set wereanalyzed by unsupervised two-dimensional hierarchicalclustering (Eisen et al., 1998). This algorithm produceda table of results, with the array elements—represent-ing specific genes—on the first dimension, groupedtogether according to similarities in their pattern ofexpression in the different samples, while clusteringtogether on the ‘second’ dimension the different samplesunder analysis (cell lines and tumors) according tosimilarities in their overall gene expression patterns.Search for the best clustering subsets was carried out bycalculating the cell line clustering efficiency relative toindividual gene clusters identified during the initialclustering analysis, and combinations thereof, followedby iterative exclusion tests and calculation, at each
round of testing, of the resulting correlation coefficientsfor cell line clustering.
Representation of results
The visualization software Tree-View (Eisen et al.,1998) was used to graphically display. In the output,expression data are colored using a green/red color code,as shown in Figure 1, were red colors represent geneswhose expression in the sample were lower than in thereference sample (pool of 12 lines, see: Perou et al.,2000).
RESULTSTyping of human breast cancer cell lines according
to the activity of the estrogen-responsivetranscriptome
We have recently characterized the hormone depen-dent transcriptome of BC by cDNA microarray analysisof the gene expression changes induced by a physiolo-gical dose of 17b-estradiol in hormone responsivehuman BC cells (Weisz et al., 1999; Cicatiello et al.,2001; Cicatiello L, Natoli G, Scafoglio C, Altucci L,Cancemi M, Facchiano A, Calogero R, Iazzetti G, DeBortoli M, Sfiligoi C, Sismondi P, Biglia N, Bresciani Fand Weisz A. The gene expression program activated byestrogen in hormone responsive human BC cells.Submitted for publication elsewhere). This work led sofar to the identification of a set of 344 genes whoseexpression is either increased or decreased in ZR-75.1and/or MCF-7 cells upon estrogen stimulation. Thisgene set, that includes a large series of newly identifiedhormonal targets but does not include not ERa (ESR1),ERb (ESR2), or PgRs (PGR), provides the opportunity totest whether the expression pattern of hormone respon-sive genes represents a molecular signature specific forestrogen dependent BC cells, and thus may allow toidentify them independently from other molecularmarkers used to date, including estrogen and PgRsthemselves.
To this aim, as a first step we explored the NCI60 geneexpression database for the molecular pharmacology ofcancer (Ross et al., 2000), containing the expression datarelative to approximately 8,000 genes in 60 cell lines ofdifferent tissue origin. The data relative to two ERapositive and five ERa negative human BC cell lines,present in this data base and to one normal breast tissuebiopsy and 16 human cell lines of different origin, wereextracted (see Materials and Methods). Following around of selection, based on the quality of the individualspots, the expression data relative to 171 out of the 344estrogen-responsive genes of our set were found in theNCI60 database and used for further analysis. cDNAprobes for 28 such genes were present in duplicate ortriplicate and data relative to two cell lines (MCF-7 andK-562) were present from three independent analyses,offering an internal validation of the data. Unsuper-vised two-dimensional hierarchical clustering analysis(Eisen et al., 1998) of log-transformed expression data,relative to these 171 estrogen-responsive genes,produced the results that are illustrated in Figure 1,as colored matrices. The data relative to each cell lineanalyzed were displayed as a column and the datarelative to each gene disposed as a row. All columns were
442 WEISZ ET AL.

Fig. 1. Cluster analysis of estrogen responsive gene expression innormal and cancer cell lines from breast and other tissues. Two-wayhierarchical clustering analysis was applied to characterize ERapositive (red) and negative (purple) BC cell lines, normal mammarygland tissue and cell lines (brown), and non-BC cells (black) based onthe expression pattern of sets of genes selected on the basis of theirestrogen responsiveness in ZR-75.1 and MCF-7 cells. Each column ofthe expression matrixes represents the cell line/tissue sampleindicated at its top and each row refer to a gene, colors of the matrixelements represent mRNA expression levels relative to a commonreference sample (green for sample/reference ratios <1, red for ratios>1, black for ratios near 1, and gray for missing data). Dendrogramsrepresenting hierarchical relationships between cell lines have theterminal branches colored to reflect the nature of the cell line; the
scales to the right of each dendrogram mark the correlation coefficientrepresented by the length of the dendrogram branches connectingpairs of nodes. Part a: Clustering analysis based on relative expressiondata of 171 estrogen responsive genes from the NCI60 set (top-rightand left) or of 49 genes selected among them during this study(bottom-right). Part b: Clustering analysis based on relative expres-sion data of 218 estrogen responsive genes from the ‘MolecularPortraits of Human Breast Tumors’ set (top-right and left) or of 19selected genes (bottom-right). In the smaller matrixes, the expressionpatterns of cytokeratin 5 (KRT5), 8 (KRT8), and 17 (KRT17), integrinb4 (ITGB4), laminin g1 (LAMC1), GATA binding protein 3 (GATA3),estrogen regulated LIV-1 protein (LIV-1) and/or ERa (ESR1) genes,which where not part of the clustering analysis, are included forreference.
MOLECULAR TYPING OF ERa POSITIVE BREAST CANCER CELLS 443

thus ordered along the horizontal axis so that cell lineswith the most similar patterns of expression across allgenes analyzed are placed adjacent to each other. Alongthe vertical axis, all rows are instead ordered accordingto similarities in the expression pattern of the corre-sponding genes in all cell lines. Similarities between celllines and genes, respectively, are measured by standardcorrelation analysis, whose results are visualized aboveand sidewise the color matrix by ‘correlation trees.’ Inthese trees, each node represents a calculated correla-tion coefficient value (CC), ranging from þ1.00 (max-imum degree of correlation between samples/genes) to�1.00 (lack of correlation). The results obtained from theNCI60 data set are displayed in Figure 1a, where the BCcell lines responsive to estrogen are depicted in red,those unresponsive in purple, the Normal Breast samplein brown, and the remaining, non-BC cell lines in black.The correlation tree relative to the clustering analysis ofall cell lines selected is reported at the top-right of thefigure. The highest correlation among cell lines (CC:0.92–0.95) was observed for MCF-7 and K-562 cellreplicates, respectively, and for the MDA-N clone andthe parental cells MDA-MB-435, indicating good repro-ducibility of the mRNA profiling results as well asreliability of the data analysis performed here. The celllines analyzed are grouped in two main clusters, whichdisplay the lowest degree of correlation observed (CC0.07). The estrogen-responsive BC cell lines are in theleft cluster, where they are disposed sidewise to eachother and clearly separated from two non-BC lines(COLO205 and OVCAR-4) and the Normal Breastsample. The closest correlation observed in the leftcluster (CC: 0.55) was among the MCF-7 cell replicatesand T-47D cells (the other ERa positive BC cell lineanalyzed). All hormone unresponsive BC cell linesbelong, instead, to the right cluster, where they do notappear related to each other (with the notable exceptionof the related MDA-MB-435 and MDA-N lines). Thesame clustering pattern was obtained for BC cell linesalone, that evidentiate segregation of ERa positive andnegative BC cell lines in separate clusters (left partof Fig. 1a). These results provide evidence that theexpression profile of a set of estrogen-regulated genescan detect the phenotype of BC cells. We therefore askedwhether we could identify a subset of these genesdisplaying increased power for discriminating ER-positive from ER-negative cells and searched for thesubcluster of genes having the greatest differenceamong the different BC cell lines. By visual inspection,we detected about 12 subclusters of such differentiallyexpressed genes. To assess the weight of each subclusterin discrimination of ER positive from negative BC celllines, we performed a series of hierarchical clusteringtests where, in each case, genes belonging to onesubcluster were excluded from the analysis set. As aselection criteria, we considered changes in the correla-tion coefficient measured at the first node of the cell linedendrogram following exclusion from the analysis of thedata relative to the subcluster under study, and setapart those genes whose absence caused the majorincrease of this coefficient, corresponding to a reductionof the overall measurable distance between ERapositiveand negative cell lines. This led us to identify 49 genes(bottom-right of Fig. 1a and No. 1–49 in Table 1) whose
expression profile is almost the same in the two estrogenresponsive BC cells (CC MCF-7 vs. T-47D: 0.81) butclearly differs among them and non-responsive cells(CC: �0.75). For comparison, this part of the figureincludes also a color matrix showing the relativeexpression of several markers of breast epithelial celllineage (see Discussion).
The possibility of identifying estrogen responsive BCcell lines based exclusively on expression of hormoneregulated genes was controlled by repeating the cluster-ing analysis using a second group of 218 genes, amongour estrogen-regulated gene set, whose expression datawas available in the ‘Molecular Portraits of HumanBreast Tumors’ web site (Perou et al., 2000). This sitecontains the cDNA microarray data obtained on threeER-positive and four ER-negative BC cell lines, twonormal mammary epithelial, and five mesenchymal-likecell lines, along with data relative to several breasttumor biopsies (see above). Of these 218 informativegenes, 129 were in common with those from the NCI60set and 52 had been analyzed using replicate probes. Theresults of hierarchical clustering analysis of these dataare summarized in Figure 1b (top-right). Even in thiscase, all estrogen responsive BC cell lines clusteredtogether and with SK-BR-3 cells in a cluster that isclearly distinguishable (CC: 0.01) from a second clustercomprising all remaining cell lines. This clusteringpattern becomes even more evident upon exclusion fromthe analysis of the data relative to the mesenchymal celllines (left part of Fig. 1b). Interestingly, in the rightcluster normal and cancerous mammary epithelial cellsappears now clearly distinct, with the former linesshowing more similarities among each other than thelatter (CCs: 0.64 and 0.39, respectively). The search for asubset of genes to better distinguish hormone respon-sive and non-responsive BC cells led in this case to theidentification of a subset of 19 genes (No. 35–53 inTable 1), of which 15 were in common with the intrinsicNCI60 subset described above (No. 35–49). Clusteringagainst the expression data of these genes (bottom-rightof Fig. 1b) indicates high similarity among all estrogenresponsive lines (CC: 0.83), that were highly dissimilarfrom all normal breast epithelial cells and from BT-549,Hs578T, and MDA-MB-231 BC cell lines (CC: �0.79).Interestingly, this analysis indicates that the ER-SK-BR-3 cell line is more related to ER-positive than to theother ER-negative BC cell lines.
Analysis of estrogen-responsive genes in breastcancer biopsies
The results obtained by analysis of the estrogenresponsive transcriptome in BC cell lines support thepossibility that the set of informative genes herebyidentified may be useful also to characterize hormoneresponsiveness and signaling in BC in surgical tumorspecimens. It is possible, in fact, that the expressionprofile of genes belonging to the informative subset ofestrogen responsive genes characterizing BC cell linesmay specify also ERa positive breast tumors, wherethese genes could collectively represent a marker toassess estrogen signaling. This possibility was tested insilico using the ‘Molecular Portraits of Human BreastTumors’ data relative to a comprehensive gene expres-sion analysis performed in 62 tumor specimens from 40
444 WEISZ ET AL.

TABLE 1. Panel of estrogen-responsive genes whose expression profiles discriminate ERa-positive and -negative breast cancer (BC) cell linesand tumor biopsies
Symbola UniGenea Descriptiona Functionb E-resp.c Referencesd
1 ABCG1 Hs.10237 ATP-binding cassette, sub-fam. G(WHITE), member 1
Transporters þ 1–2
2 ACTG1 Hs.14376 Actin, gamma 1 Cell communication, adhesion, ormotility
þ 1–2
3 ACTN1 Hs.119000 Actinin, alpha 1 Cell communication, adhesion, ormotility
þ 1–2
4 ADCY3 Hs.8402 Adenylate cyclase 3 Signal transduction þ 1–25 ANXA9 Hs.279928 Annexin A9 Cell communication, adhesion, or
motility� 1–2
6 ATP5G3 Hs.429 ATP synthase, Hþ transporting,mitochondrial F0 complex, subunitc (subunit 9) isoform 3
Electron transport and oxidativephosphorylation
þ 1–2
7 ATP9A Hs.70604 ATPase, Class II, type 9A Transporters � 1–28 CCT4 Hs.79150 Chaperonin containing TCP1, subunit 4
(delta)Protein folding þ 1–2
9 CCT5 Hs.1600 Chaperonin containing TCP1, subunit 5(epsilon)
Protein folding þ 1–2
10 CKS2 Hs.83758 CDC28 protein kinase 2 Cell cycle þ 1–211 COX5A Hs.296585 Cytochrome c oxidase subunit Va Ribosome biogenesis þ 1–212 DKC1 Hs.4747 Dyskeratosis congenita 1, dyskerin Ribosome biogenesis þ 1–213 FKBP4 Hs.848 FK506 binding protein 4 (59 kDa) Protein folding þ 1–214 FLJ13187 Hs.29724 FLJ13187 Phafin 2 Unnamed � 1–215 FLJ14299 Hs.288042 Hypothetical protein FLJ14299 Unnamed þ 1–216 HSPA8 Hs.180414 Heat shock 70 kDa protein 8 Protein folding þ 1–217 LGALS1 Hs.227751 Lectin, galactoside-binding, soluble, 1
(galectin 1)Cell communication, adhesion, or
motilityþ 1–2
18 MAD2L1 Hs.79078 MAD2 mitotic arrest deficient-like 1(yeast)
Cell cycle þ 1–2
19 MARS Hs.279946 Methionine-tRNA synthetase Protein biosynthesis þ 1–220 MCM2 Hs.57101 Minichromosome maintenance deficient
2, mitotin (S. cerevisiae)DNA replication and repair þ 1–2
21 MRPL3 Hs.79086 Mitochondrial ribosomal protein L3 Ribosome biogenesis þ 1–221 NOLC1 Hs.75337 Nucleolar and coiled-body phosphprotein
1Unknown þ 1–2
22 NP Hs.75514 Nucleoside phosphorylase Purine and pyrimidine metabolism þ 1–223 NRP1 Hs.69285 Neuropilin 1 Signal transduction þ 1–224 NTRK1 Hs.85844 Neurotrophic tyrosine kinase, receptor,
type 1Signal transduction þ 1–2
25 PMAIP1 Hs.96 Phorbol-12-myristate-13-acetate-inducedprotein 1
Unknown þ 1–2
26 PMSCL2 Hs.75584 Polymyositis/scleroderma autoantigen 2(100 kDa)
Protein kinase þ 1–2
27 RXRA Hs.20084 Retinoid X receptor, alpha Transcription � 1–228 SLC25A5 Hs.79172 Solute carrier family 25 (mitochondrial
carrier; adenine nucleotide transloca-tor), member 5
Transporters þ 1–2
29 SNRPG Hs.77496 Small nuclear ribonucleoprotein poly-peptide G
MRNA processing þ 1–2
30 STXBP1 Hs.239356 Syntaxin binding protein 1 Exocytosis þ 1–231 TAF9 Hs.60679 TAF9 RNA polymerase II, TATA box
binding protein (TBP)-associatedfactor, 32 kDa
Transcription þ 1–2
32 TPD52L1 Hs.16611 Tumor protein D52-like 1 Unknown þ 1–233 TUBB Hs.336780 Tubulin, beta polypeptide Cell communication, adhesion, or
motilityþ 1–2
34 VARS2 Hs.159637 Valyl-tRNA synthetase 2 Protein biosynthesis þ 1–235 BLVRB Hs.76289 Biliverdin reductase B (flavin reductase
(NADPH))Xenobiotic metabolism þ 1–2
36 CLDN4 Hs.5372 Claudin 4 Cell communication, adhesion, ormotility
� 1–2
37 ERBB3 Hs.199067 V-erb-b2 erythroblastic leukemia viraloncogene homol. 3
Signal transduction � 1–2
38 ESTsR99207/H72722
Hs.36102 ESTs, Highly similar to SMHU1Bmetallothionein 1B [H. sapiens]
Unnamed þ 1–2
39 FEN1 Hs.4756 Flap structure-specific endonuclease 1 DNA replication and repair þ 1–240 FLJ11796 Hs.284186 Homo sapiens cDNA FLJ11796 fis, clone
HEMBA1006158, highly similar toHomo sapiens transcription factorforkhead-like 7 (FKHL7) gene
Unnamed þ 1–2
41 IGFBP5 Hs.180324 Insulin-like growth factor bindingprotein 5
Signal transduction � 1–2
42 LDHA Hs.2795 Lactate dehydrogenase A Glycid metabolism þ 1–2
MOLECULAR TYPING OF ERa POSITIVE BREAST CANCER CELLS 445

patients (Perou et al., 2000). These data were foundparticularly apt for this test, since they have beenthoroughly controlled and can thus be considered veryrobust. Furthermore, the tumor samples included inthat study were well characterized and their molecularsubtyping can be used as reference. We thus performedthe hierarchical clustering of the expression data,retrieved from the ‘Molecular Portraits of HumanBreast Tumors’ web site, relative to the same 218estrogen responsive genes used in the case of cell lines,to verify whether the expression profile could classifythe tumors in a significant fashion. The results obtainedby this direct approach did not give informativeclassification, since the differences between the twomain clusters obtained were not significant (CC: 0.92).For this reason, we pursued our analysis by focusing onthe specific subset of estrogen responsive genes thatallow us to discriminate hormone responsive from non-responsive BC cell lines (Fig. 1). Therefore, we includedfor further analysis the data relative to the 19 hormoneresponsive genes selected for the BC cell clustering in
Figure 1b (Table 1: ASAH, CEACAM5, ERBB2, LIV-1,MGP, SCNN1A, TFF3, XBP1) and eight additionalestrogen responsive genes (No. 54–61 in Table 1) whichhave been proposed, or even demonstrated, to mark theestrogen responsive transcriptome of BC cells (see Refs.in Table 1). In addition, a survey of the literature led usto identify 4 additional genes (Table 1: CYP2B6, GATA3,HNF3A, and HPN) that were consistently reported asexpressed in ERa positive, but not in ER-negative, BCcells, and tumors and for this reason proposed to play arole in hormone signaling and/or in maintenance of theestrogen responsive phenotype of the cell (Perou et al.,2000; Dressman et al., 2001; Gruvberger et al., 2001;Sørlie et al., 2001; West et al., 2001; van’t Veer et al.,2002). When expression data relative to these 31 geneswere included for the hierarchical clustering analysis, asignificant classification was obtained. As depicted inFigure 2, the samples separate now in two easilydistinguishable main clusters (CC: 0.52). The smallerof such clusters (positioned to the right in Fig. 2)includes all ERa-negative tumor samples, characterized
TABLE 1. (Continued)
Symbola UniGenea Descriptiona Functionb E-resp.c Referencesd
43 ME1 Hs.14732 Malic enzyme 1, NADP(þ)-dependent,cytosolic
Citrate metabolism þ 1–2
44 MT1L Hs.94360 Metallothionein 1L Heavy metal binding þ 1–245 MUC1 Hs.89603 Mucin 1, transmembrane Cell communication, adhesion,
or motility� 1–2
46 PFKP Hs.99910 Phosphofructokinase, platelet Glycid metabolism þ 1–247 SDF1 Hs.237356 Stromal cell-derived factor 1 Signal transduction þ 1–248 SLC9A3R1 Hs.184276 Solute carrier family 9 (sodium/hydrogen
exchanger), isoform 3 regulatoryfactor 1
Transporters þ 1–2
49 YARS Hs.239307 Tyrosyl-tRNA synthetase Protein biosynthesis þ 1–250 CD44 Hs.169610 CD44 antigen (homing function and
Indian blood group system)Cell communication, adhesion,
or motilityþ 1–2
51 JUN Hs.78465 V-jun sarcoma virus 17 oncogenehomolog (avian)
Transcription þ 1–2
52 RERG Hs.21594 RAS-like, estrogen-regulated,growth-inhibitor
Signal transduction þ 1–2
53 TFF1 Hs.350470 Trefoil factor 1 (BC, estrogen-induciblesequence expressed in)
Secreted protein þ 1–2
54 ASAH Hs.75811 N-acylsphingosine amidohydrolase(acid ceramidase)
Fatty acid metabolism þ 3–4
55 CEACAM5 Hs.220529 Carcinoembryonic antigen-related celladhesion molecule 5
Cell communication, adhesion,or motility
� 3
56 ERBB2 Hs.323910 v-erb-b2 erythroblastic leukemia viraloncogene homolog 2
Signal transduction � 1, 3, 5
57 LIV-1 Hs.79136 LIV-1 protein, estrogen regulated Unknown þ 1, 3, 758 MGP Hs.365706 Matrix Gla protein Cell communication, adhesion,
or motilityþ 1, 3, 8
59 SCNN1A Hs.78853 Sodium channel, nonvoltage-gated1 alpha
Transporter � 3
60 TFF3 Hs.352107 Trefoil factor 3 (intestinal) Secreted protein þ 4, 961 XBP1 Hs.149923 X-box binding protein 1 Transcription þ 1, 3, 10
CYP2B6 Hs.1360 Cytochrome P450, subfamily IIB(phenobarbital-inducib.)
Xenobiotic metabolism na
GATA3 Hs.169946 GATA-binding protein 3 Transcription naHNF3A Hs.299867 Hepatocyte nuclear factor 3, alpha Transcription naHPN Hs.823 Hepsin (transmembrane protease,
serine 1)Cell communication, adhesion,
or motilityna
aGene symbol, UniGene cluster number and description (http://www.ncbi.nlm.nih.gov/UniGene/).bFunction assigned according to Gene Ontology categories from LocusLink (http://www.ncbi.nlm.nih.gov/LocusLink/) and/or GeneCards (http://bioinfo.weizmann.ac.il/cards/).cResponse to estrogen in human BC cells in vitro.d(1) Cicatiello et al., 2001 and Weisz et al., 1999; (2) Cicatiello Cicatiello L, Natoli G, Scafoglio C, Altucci L, Cancemi M, Facchiano A, Calogero R, Iazzetti G, De BortoliM, Sfiligoi C, Sismondi P, Biglia N, Bresciani F and Weisz A. The gene expression program activated by estrogen in hormone-responsive human BC cells. 2003.Submitted; (3) Finlin et al., 2001; (4) Charpentier et al., 2000; (5) Perissi et al., 2000; (6) Hoch et al., 1999; (7) Seth et al., 2002; (8) Sheikh et al., 1993; (9) May andWestley 1997; (10) Bouras et al., 2002. na: not applicable.
446 WEISZ ET AL.
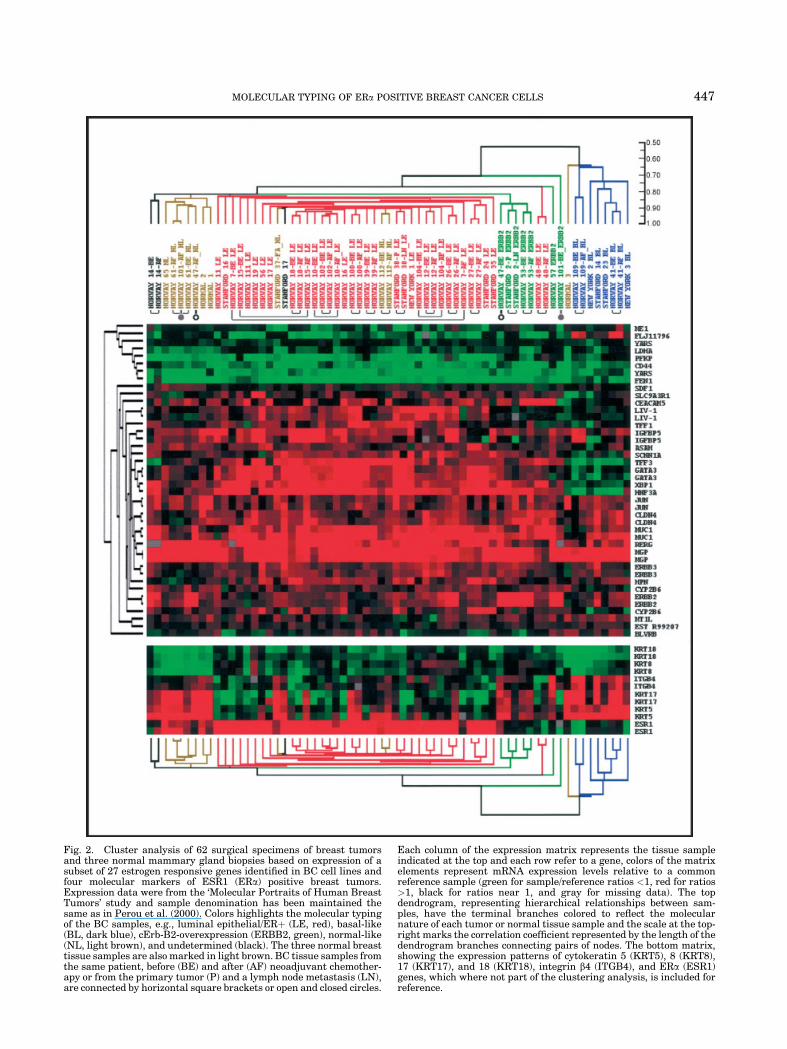
Fig. 2. Cluster analysis of 62 surgical specimens of breast tumorsand three normal mammary gland biopsies based on expression of asubset of 27 estrogen responsive genes identified in BC cell lines andfour molecular markers of ESR1 (ERa) positive breast tumors.Expression data were from the ‘Molecular Portraits of Human BreastTumors’ study and sample denomination has been maintained thesame as in Perou et al. (2000). Colors highlights the molecular typingof the BC samples, e.g., luminal epithelial/ERþ (LE, red), basal-like(BL, dark blue), cErb-B2-overexpression (ERBB2, green), normal-like(NL, light brown), and undetermined (black). The three normal breasttissue samples are also marked in light brown. BC tissue samples fromthe same patient, before (BE) and after (AF) neoadjuvant chemother-apy or from the primary tumor (P) and a lymph node metastasis (LN),are connected by horizontal square brackets or open and closed circles.
Each column of the expression matrix represents the tissue sampleindicated at the top and each row refer to a gene, colors of the matrixelements represent mRNA expression levels relative to a commonreference sample (green for sample/reference ratios <1, red for ratios>1, black for ratios near 1, and gray for missing data). The topdendrogram, representing hierarchical relationships between sam-ples, have the terminal branches colored to reflect the molecularnature of each tumor or normal tissue sample and the scale at the top-right marks the correlation coefficient represented by the length of thedendrogram branches connecting pairs of nodes. The bottom matrix,showing the expression patterns of cytokeratin 5 (KRT5), 8 (KRT8),17 (KRT17), and 18 (KRT18), integrin b4 (ITGB4), and ERa (ESR1)genes, which where not part of the clustering analysis, is included forreference.
MOLECULAR TYPING OF ERa POSITIVE BREAST CANCER CELLS 447
by a basal-like molecular phenotype, plus one biopsy ofreceptor negative normal breast tissue. All ERa-positivetumors partition, instead, to the second primary cluster(on the left), where they are clearly separated from ERa-negative tumors overexpressing ERBB2 and from tworeceptor negative samples, characterized by a luminal-like signature. Sample pairs from the same tumor arealways more similar to each other than to any of theother samples present in the set, with three exceptions,including two ERBB2-positive tumors which resultednormal-like following successful chemotherapy (Perouet al., 2000) (marked by open and closed circles,respectively, in Fig. 2), and one luminal-like tumor(NORWAY 7), that appeared to express very differentamounts of ERa mRNA before and after chemotherapy.These results indicate that ERa positive and negativeBC phenotypes are indeed characterized by specificexpression ‘signatures’ of at least a subset of estrogenresponsive genes.
DISCUSSION
The work presented here was performed to verifywhether the expression profile of a novel subset of genes,whose regulation by estrogens has been demonstratedin the experimental model system, can be used todistinguish the activity of estrogen-dependent path-ways in BC cells and tumors, independently of theirreceptor status. This was first suggested to us byquantitative real-time RT-PCR expression analysis ofeight such estrogen-regulated genes in BC biopsies(Sorbello et al., 2003). By exploiting a group of 344estrogen-responsive genes discovered by expressionprofiling of BC cells in culture, we have tested thishypothesis by exploring the NCI60 (Ross et al., 2000)and ‘‘Molecular portrait of human BC cells’’ (Perou et al.,2000) data sets, generated by profiling cell line andbreast tumor biopsies, respectively. Since the datasets to be aligned were generated with microarrayplatforms including different target cDNA sets, theanalysis was limited to the 179 and 219 estrogen-responsive genes, respectively. The first hierarchicalclustering analysis performed on the NCI60 datasetgrouped ER-positive and ER-negative cells in clearlydistinct clusters, directly confirming our startinghypothesis. It is important to note that neither ER norPgR genes were included among those analyzed, to avoidintroducing strong bias in the analysis. In ERa positivecells, activity of the estrogen responsive genes analyzedappears considerably different than in receptor negativecells. This was expected, since gene expression measure-ments were carried out under conditions of cell stimula-tion with estrogen (the cultures used for mRNAextraction were maintained in the presence of estrogenrich whole serum and phenol red). It is conceivable, onthe other side, that the expression of a fraction ofestrogen-regulated genes may be sustained, in ER-negative cells, by activation of other regulatory path-ways. This brought us to consider the possibility toidentify among the genes analyzed a specific subset thatcan allow to discriminate hormone responsive from non-responsive BC cells even more effectively and this wasindeed verified, by identifying a subset of 49 genes,among the 179 genes used for the first study and a subsetof only 19 genes among the 219 genes used for the second
analysis on cell lines, which clustered very efficientlyER-positive and -negative cell lines and distinguishedthem clearly from lines derived from other tissues. TheER phenotype appears thus clearly linked to otherphenotypic markers of the cells. For comparison, inFigure 2 a color matrix showing the relative expressionof molecular markers of breast epithelial cell lineagewas included, which distinguish basal—from luminal—like BC cells (Perou et al., 2000), i.e., cytokeratin 5(KRT5), 8 (KRT8), and 17 (KRT17), integrin b4 (ITGB4)and laminin g1 (LAMC1). The expression pattern of suchmarkers confirms that ERa expressing cells belong tothe luminal-like cell lineage. The GATA binding protein3 (GATA3) and estrogen regulated LIV-1 protein (LIV-1)genes, also included in this matrix are previouslycharacterized molecular markers of ERa positive cells(Perou et al., 2000; Dressman et al., 2001; Gruvbergeret al., 2001; Sørlie et al., 2001; West et al., 2001; van’tVeer et al., 2002) whose expression pattern confirms thenature of the cell lines analyzed. It is noteworthy that inour analysis, SK-BR-3 cells were found to segregate withER-positive cells, despite the fact that these cells do notcontain measurable ER and are unresponsive to estro-gen stimulation (Cavailles et al., 2002). An intriguingpossibility to account for the discrepancy is thatthe estrogen responsive transcriptome could mimic herethe presence of hormone even in the absence ofdetectable ER. Indeed, SK-BR-3 cells that do not expressERa, ERb, or GATA3, but show the same pattern ofKRT8 and 18 expression that characterizes luminal-likeestrogen responsive BC cells (Fig. 1b). Interesting, SK-BR-3 cells show a gene expression pattern characteristicof the luminal-like phenotype also when considering theexpression profile of 1,753 genes (Perou et al., 2000). SK-BR-3 cells could thus derive from a luminal-like cellclone where steroid signaling was initially inducible butbecome constitutive during progression of the carcino-genic process, perhaps concomitant with ERRB2 ampli-fication and overexpression, a genetic lesion thatcharacterizes this cell line. It has been shown, in fact,that hyperactivity of the p185c-erbB2 oncoprotein mayinduce loss of ERa expression (Pietras et al., 1995; Ohet al., 2001) and contribute to acquisition of a hormoneindependent growth phenotype in estrogen responsiveBC cells (Liu et al., 1995; Tang et al., 1996). Thepossibility that SK-BR-3 cells share a gene expressionbackground with hormone responsive cells couldexplain also the responses to estrogens that can beobserved in this cell line under certain experimentalconditions (Yoo et al., 1998; Filardo et al., 2002), whichmay reflect here a residual activity of the estrogendependent signal transduction pathway.
It is worth noting that 9 out of 53 genes identified inthis analysis were described as estrogen-responsive alsoin two published studies (Inoue et al., 2002; Frasor et al.,2003). These authors used different platforms, withdifferent probe sets, to analyze response to estrogen inMCF-7 cells, while our original set was identified inZR75.1 cells (Weisz et al., 1999; Cicatiello et al., 2001;Cicatiello L, Natoli G, Scafoglio C, Altucci L, Cancemi M,Facchiano A, Calogero R, Iazzetti G, De Bortoli M,Sfiligoi C, Sismondi P, Biglia N, Bresciani F and WeiszA. The gene expression program activated by estrogen inhormone responsive human BC cells. Submitted for
448 WEISZ ET AL.
publication elsewhere) and this explains clearly therelatively low occurrence value observed.
Clustering analysis of expression data relative to 219estrogen-regulated genes of 62 breast tumor biopsies didnot result in a biologically relevant clustering of thetumors. One possible explanation for this finding resideson the fact that surgical tumor specimens are nothomogeneous in their cellular composition and includemany cell types, which are generally present in varyingproportions in different tissue samples. As a consequ-ence, the gene expression profile of these tissue biopsiesmay have predominantly reflected, under these condi-tions, their histological complexity. As it has been shownthat variations in the activity of specific subsets of genesmay indeed uncover important similarities and differ-ences among breast tumors (Perou et al., 2000;Gruvberger et al., 2001; Sørlie et al., 2001; West et al.,2001; van’t Veer et al., 2002), we searched for geneswhich may differentiate ER-positive from ER-negativetumors among those which allowed to discriminateamong these two phenotypes in BC cell lines. In theprocess, we combined the 19 more informative ones with12 additional genes reported to be estrogen-responsiveor expressed consistently in ER-positive, but not ER-negative, tumors. The clustering analysis of tumors,carried out with such estrogen-regulated gene set,confirmed, and in some instances improved, the classi-fication originally proposed using 1,753 genes (Perouet al., 2000). Interestingly, certain distinctive molecularproperties of the tumor samples were still reflected,under these conditions, by their clustering pattern as,for example, most BCs previously classified as ‘normal-like’ resulted here more closely related to normal breasttissue than to other BC specimens (Fig. 2).
Since ERa-positive and -negative BC phenotypesare characterized by specific estrogen responsive geneexpression ‘signatures,’ the gene set identifiedhere appear to be exploitable to improve the definitionof the hormone responsive BC phenotype, suggesting anew way to complement the informations currentlyprovided by other molecular markers, in particular thepresence of ERs and PgRs in tumor cells. This alsoprovides direct evidence that gene regulation patternsidentified in experimental model systems can beexploited to identify molecular phenotypes of tumorswhich relate to responsiveness to endocrine therapy.This hypothesis can now be tested retrospectively ontumors whose response to hormone therapy has beenassessed or in prospective studies of neoadjuvanttreatments. A further result of this study worth, in ouropinion, to be highlighted is represented by thepossibility that a relatively small set of selected genesmay reveal important features of the hormone respon-sive phenotype of BC. If the activity of so few genes canindeed be used to effectively monitor ER signaling statusof tumors for diagnostic/predictive purposes, in fact,cost-effective, focused transcriptome analysis of smalltissue samples, like core biopsies or microdissectedspecimens, may become feasible. This hypothesis is nowworth being thoroughly tested in clinical settings.
In conclusion, we have shown how ERa positive andnegative BC phenotypes are characterized by specificestrogen-dependent gene expression ‘signatures,’ andidentified at the same time a relatively small set of genes
which may be exploitable to improve the definition of thehormone responsive BC phenotype, providing a newway to complement the informations currently providedby classical molecular markers, in particular thepresence of ERs and PgRs in tumor cells.
ACKNOWLEDGMENTS
We thank Raffaele Calogero and Massimo Cancemifor technical assistance and useful comments andsuggestions.
LITERATURE CITED
Bertucci F, Nasser V, Granjeaud S, Eisinger F, Adelaide J, Tagett R,Loriod B, Giaconia A, Benziane A, Devilard E, Jacquemier J, ViensP, Nguyen C, Birnbaum D, Houlgatte R. 2002. Gene expressionprofiles of poor-prognosis primary breast cancer correlate withsurvival. Hum Mol Genet 11:863–872.
Biswas DK, Averboukh L, Sheng S, Martin K, Ewaniuk DS, Jawde TF,Wang F, Pardee AB. 1998. Classification of breast cancer cells on thebasis of a functional assay for estrogen receptor. Mol Med 4:454–467.
Bouras T, Southey MC, Chang AC, Reddel RR, Willhite D, Glynne R,Henderson MA, Armes JE, Venter DJ. 2002. Stanniocalcin 2 is anestrogen-responsive gene coexpressed with the estrogen receptor inhuman breast cancer. Cancer Res 62:1298–1295.
Cavailles V, Gompel A, Portois MC, Thenot S, Mabon N, Vignon F.2002. Comparative activity of pulsed or continuous estradiolexposure on gene expression and proliferation of normal andtumoral human breast cells. J Mol Endocrinol 28:165–175.
Charpentier AH, Bednarek AK, Daniel RL, Hawkins KA, Laflin KJ,Gaddis S, MacLeod MC, Aldaz CM. 2000. Effects of estrogen onglobal gene expression: identification of novel targets of estrogenaction. Cancer Res 60:5977–5983.
Cicatiello L, Facchiano A, Caligero R, De Bortoli M, Bresciani F, WeiszA. 2001. Gene expression monitoring in hormone-responsive humanbreast cancer cells during estrogen-induced cell cycle progression.Proceedings of the AACR/Nature Genetics Joint Conference: Onco-genomics: Dissecting Cancer through Genome Research. p 95. (http://www.nature.com/cgi-taf/DynaPage.taf?file¼/ng/journal/v27/n4s/full/ng0401supp_95a.html&_UserReference¼C0A804EC4650B9B7E02-E44E479153B0D3D72).
Dressman MA, Walz TM, Lavedan C, Barnes L, Buchholtz S, Kwon I,Ellis MJ, Polymeropoulos MH. 2001. Genes that co-cluster withestrogen receptor alpha in microarray analysis of breast biopsies.Pharmacogenomics J 1:135–141.
Eisen MB, Spellman PT, Brown PO, Botstein D. 1998. Clusteranalysis and display of genome-wide expression patterns. Proc NatlAcad Sci USA 95:14863–14868.
Ferguson AT, Lapidus RG, Davidson NE. 1998. The regulation ofestrogen receptor expression and function in human breast cancer.Cancer Treat Res 94:255–278.
Filardo EJ, Quinn JA, Frackelton AR Jr, Bland KI. 2002. Estrogenaction via the G protein-coupled receptor, GPR30: stimulation ofadenylyl cyclase and cAMP-mediated attenuation of the epidermalgrowth factor receptor-to-MAPK signaling axis. Mol Endocrinol16:70–84.
Finlin BS, Gau CL, Murphy GA, Shao H, Kimel T, Seitz RS, Chiu YF,Botstein D, Brown PO, der CJ, Tamanoi F, Andres DA, Perou CM.2001. RERG is a novel ras-related, estrogen-regulated and growth-inhibitory gene in breast cancer. J Biol Chem 276:42259–42267.
Frasor J, Danes JM, Komm B, Chang KCN, Lyttle CR, Katzenellenbo-gen BS. 2003. Profiling of estrogen up- and down-regulated geneexpression in human breast cancer cells: insights into genenetworks and pathways underlying estrogenic control of prolifera-tion and cell phenotype. Endocrinology 144:4562–4574.
Gruvberger S, Ringner M, Chen Y, Panavally S, Saal LH, Borg A,Ferno M, Peterson C, Meltzer PS. 2001. Estrogen receptor status inbreast cancer is associated with remarkably distinct gene expres-sion patterns. Cancer Res 61:5979–5984.
Harris JR, Lippman ME, Morrow M, Osborne CK. 2000. Diseases ofthe breast. Philadelphia: Lippincott, Williams & Wilkins.
Hoch RV, Thompson DA, Baker RJ, Weigel RJ. 1999. GATA-3 isexpressed in association with estrogen receptor in breast cancer. IntJ Cancer 84:122–128.
MOLECULAR TYPING OF ERa POSITIVE BREAST CANCER CELLS 449

Hopp TA, Fuqua SA. 1998. Estrogen receptor variants. J MammaryGland Biol Neoplasia 3:73–83.
Ince TA, Weinberg RA. 2002. Functional genomics and the breastcancer problem. Cancer Cell 1:15–17.
Inoue A, Yoshida N, Omoto Y, Oguchi S, Yamori T, Kiyama R, HayashiS. 2002. Development of cDNA microarray for expression profiling ofestrogen-responsive genes. J Mol Endocrinol 29:175–192.
Liu Y, el-Ashry D, Chen D, Ding IY, Kern FG. 1995. MCF-7 breastcancer cells overexpressing transfected c-erbB-2 have an in vitrogrowth advantage in estrogen-depleted conditions and reducedestrogen-dependence and tamoxifen-sensitivity in vivo. BreastCancer Res Treat 34:97–117.
Lønning PE, Sørlie T, Perou CM, Brown PO, Botstein D, Børresen-Dale A-L. 2001. Microarrays in primary breast cancer–lessons fromchemotherapy studies. Endocr Relat Cancer 8:259–263.
Martin KJ, Kritzman BM, Price LM, Koh B, Kwan CP, Zhang X,Mackay A, O’Hare MJ, Kaelin CM, Mutter GL, Pardee AB, Sager R.2000. Linking gene expression patterns to therapeutic groups inbreast cancer. Cancer Res 60:2232–2238.
May FE, Westley BR. 1997. Expression of human intestinal trefoilfactor in malignant cells and its regulation by oestrogen in breastcancer cells. J Pathol 182:404–413.
Oh AS, Lorant LA, Holloway JN, Miller DL, Kern FG, El-Ashry D.2001. Hyperactivation of MAPK induces loss of ERalpha expressionin breast cancer cells. Mol Endocrinol 15:1344–1359.
Perissi V, Menini N, Cottone E, Capello D, Sacco M,Montaldo F, De Bortoli M. 2000. AP-2 transcription factors in theregulation of ERBB2 gene transcription by oestrogen. Oncogene19:280–288.
Perou CM, Jeffrey SS, van de Rijn M, Rees CA, Eisen MB, Ross DT,Pergamenschikov A, Williams CF, Zhu SX, Lee JC, Lashkari D,Shalon D, Brown PO, Botstein D. 1999. Distinctive gene expressionpatterns in human mammary epithelial cells and breast cancers.Proc Natl Acad Sci USA 96:9212–9217.
Perou CM, Sørlie T, Eisen MB, van de Rijn M, Jeffrey SS, Rees CA,Pollack JR, Ross DT, Johnsen H, Akslen LA, Fluge O, Perga-menschikov A, Williams C, Zhu SX, Lønning PE, Børresen-DaleA-L, Brown PO, Botstein D. 2000. Molecular portraits of humanbreast tumours. Nature 406:747–752.
Pietras RJ, Arboleda J, Reese DM, Wongvipat N, Pegram MD, RamosL, Gorman CM, Parker MG, Sliwkowski MX, Slamon DJ. 1995.HER-2 tyrosine kinase pathway targets estrogen receptor andpromotes hormone-independent growth in human breast cancercells. Oncogene 10:2435–2446.
Ross DT, Scherf U, Eisen MB, Perou CM, Rees C, Spellman P, Iyer V,Jeffrey SS, Van de Rijn M, Waltham M, Pergamenschikov A, Lee JC,Lashkari D, Shalon D, Myers TG, Weinstein JN, Botstein D,
Brown PO. 2000. Systematic variation in gene expression patternsin human cancer cell lines. Nat Genet 24:227–235.
Seth P, Krop I, Porter D, Polyak K. 2002. Novel estrogen andtamoxifen induced genes identified by SAGE (Serial Analysis ofGene Expression). Oncogene 21:836–843.
Sheikh MS, Shao ZM, Chen JC, Fontana JA. 1993. Differentialregulation of matrix Gla protein (MGP) gene expression by retinoicacid and estrogen in human breast carcinoma cells. Mol CellEndocrinol 92:153–160.
Sorbello V, Fuso L, Sfiligoi C, Scafoglio C, Ponzone R, Biglia N, WeiszA, Sismondi P, De Bortoli M. 2003. Quantitative real-time RT-PCRanalysis of eight novel estrogen-regulated genes in breast cancer.Int J Biol Markers 18:123–129.
Sørlie T, Perou CM, Tibshirani R, Aas T, Geisler S, Johnsen H, HastieT, Eisen MB, van de Rijn M, Jeffrey SS, Thorsen T, Quist H, MateseJC, Brown PO, Botstein D, Eystein Lønning P, Børresen-Dale A-L.2001. Gene expression patterns of breast carcinomas distinguishtumor subclasses with clinical implications. Proc Natl Acad Sci USA98:10869–10874.
Tang CK, Perez C, Grunt T, Waibel C, Cho C, Lupu R. 1996.Involvement of heregulin-beta2 in the acquisition of the hormone-independent phenotype of breast cancer cells. Cancer Res 56:3350–3358.
van de Vijver MJ, He YD, van’t Veer LJ, Dai H, Hart AA, Voskuil DW,Schreiber GJ, Peterse JL, Roberts C, Marton MJ, Parrish M, AtsmaD, Witteveen A, Glas A, Delahaye L, van der Velde T, Bartelink H,Rodenhuis S, Rutgers ET, Friend SH, Bernards R. 2002. A gene-expression signature as a predictor of survival in breast cancer. NEngl J Med 347:1999–2009.
van’t Veer LJ, Dai H, van de Vijver MJ, He YD, Hart AA, Mao M,Peterse HL, van der Kooy K, Marton MJ, Witteveen AT, SchreiberGJ, Kerkhoven RM, Roberts C, Linsley PS, Bernards R, Friend SH.2002. Gene expression profiling predicts clinical outcome of breastcancer. Nature 415:530–536.
Weisz A, Cicatiello L, Bresciani F. 1999. Microarray-based geneexpression monitoring of hormone-responsive human breast cancercells during estrogen-induced G1 progression. Proceedings of theEMBO Workshop ‘Structure and Function of Nuclear Receptors’.p 60.
West M, Blanchette C, Dressman H, Huang E, Ishida S, Spang R,Zuzan H, Olson JA Jr, Marks JR, Nevins JR. 2001. Predicting theclinical status of human breast cancer by using gene expressionprofiles. Proc Natl Acad Sci USA 98:11462–11467.
Yoo JY, Lessor T, Hamburger AW. 1998. Inhibition of cell proliferationby 17beta-estradiol and heregulin beta1 in estrogen receptornegative human breast carcinoma cell lines. Breast Cancer ResTreat 51:71–81.
450 WEISZ ET AL.
Related Documents