Molecular Detective: Interdisciplinary Proteomics Unit in the Advanced Science Curriculum University of Florida Center for Precollegiate Education and Training

Welcome message from author
This document is posted to help you gain knowledge. Please leave a comment to let me know what you think about it! Share it to your friends and learn new things together.
Transcript
Molecular Detective: Interdisciplinary Proteomics Unit in the Advanced Science Curriculum
University of Florida Center for Precollegiate Education and Training
HTTP://XDSCIENCE.COM/FINGERPRINTSCANNER-TOUCHID/

Author: Dr. Iris Payan
Curriculum Team: Houda Darwiche, Drew Joseph, Mary Jo Koroly
This curriculum was developed as part of Biomedical Explorations: Bench to Bedside, which is supported
by the Office Of The Director, National Institutes Of Health of the National Institutes of Health under
Award Number R25 OD016551. The content is solely the responsibility of the authors and does not
necessarily represent the official views of the National Institutes of Health.
Please direct inquiries Iris Payan at [email protected] or 754-323-1050
Last updated: 7/14/2016
© 2012 University of Florida
Center for Precollegiate Education and Training
PO Box 112010 • Yon Hall, Room 331
Gainesville, FL 32611
Phone 352.392-2310• Fax 352.392-2311
This curriculum was developed in the laboratory of:
Sixue Chen, PhD
Associate Professor
Department of Biology
College of Liberal Arts and Sciences
Director, Proteomics and Mass Spectrometry Core
Interdisciplinary Center for Biotechnology Research
My research is focused on the signaling and metabolic mechanisms underlying plant interaction with the
environment. My lab research has been particularly focused on three topics: glucosinolate metabolism, guard cell
signal transduction, and plant pathogen interaction.
Project 1. Glucosinolate metabolism. Glucosinolates are a group of naturally occurring thioglucosides, present in
Brassica plants (e.g., canola and cabbage). Glucosinolate degradation products display diverse biological activities,
including defense against insects and herbivores, N/S nutrition and growth regulation. From a human perspective,
glucosinolate metabolites account for the distinctive flavors of cabbage and condiments. Some of the metabolites
such as isothiocyanates exhibit anticarcinogenic properties. The core glucosinolate pathway has been well studied
in Arabidopsis. However, we know little about how the components in different pathways interact to produce
plant phenotypes and traits. Nor do we know how different layers of molecular control work together. The lack of
such fundamental knowledge is a major reason why plant genetic engineering has been largely unsuccessful. It
poses a chronic problem for rational engineering of crops for better quality and defense. Research in this project is
focused on characterizing the regulatory and metabolic networks involving glucosinolate metabolism using
multidisciplinary approaches. We aim to identify protein and metabolite changes in response to perturbation of
glucosinolate metabolism and to integrate the data into glucosinolate networks. The process of networking will
generate new testable hypotheses concerning glucosinolate metabolic pathways and related pathways. The
ultimate objective is to use the immense biosynthetic potential of plants as an efficient, environmentally friendly
and renewable source of fine chemicals and pharmaceuticals.
Project 2. Guard cell signaling networks. Guard cells are highly specialized plant epidermal cells that enclose tiny
pores called stomata. Stomatal movements control both uptake of carbon dioxide and loss of water, and thus play
important roles in plant growth and acclimation to environmental stresses. The plant hormone abscisic acid (ABA)
is a key indicator of drought stress. ABA induces stomatal closure via an intricate intracellular signaling network in
guard cells, thereby promoting plant water conservation. It is our central hypothesis that protein redox
modification and dynamic changes in key metabolites are critical regulatory mechanisms in ABA signaling. We are
testing the hypothesis by pursuing: identification of guard cell proteins whose redox status is altered in response
to ABA and determination of their specific redox-sensitive amino acid residues, quantification of ABA-induced
changes in metabolites implicated in guard cell signaling, and integration of the new information into a dynamic
model of ABA-induced stomatal closure. Accomplishing these objectives is significant because it will reveal novel
components of ABA signaling networks and provide knowledge of regulatory mechanisms underlying stomatal
movements that will help to develop crops with enhanced stress tolerance and productivity.
Project 3. Plant pathogen interaction. The study of pathogen response and defense in crop species is of essential
importance as the applications are directly related to agricultural production. Pseudomonas syringae pv tomato
(Pst DC3000) causes speck disease in tomato (Solanum Lycopersicum), a crop growing in large quantities in Florida
and having both nutritional and economical value. The goal of this project is to take what is known about pathogen
host interactions and observe in greater detail mechanisms that plants utilize in response to pathogen infection at
the posttranscriptional levels, including protein expression, redox and phosphorylation/dephosphorylation
switches. Understanding changes in protein expression as well as redox and phospho-switches will provide
important insights into how plant response and resistance to pathogens are occurring. Further investigation into
unique/novel proteins and regulations will advance our knowledge of plant defense against pathogens, and allow
researchers to use biotechnology to prevent future bacterial speck disease outbreaks.
Interestingly, as we gain more and more knowledge, the above projects have become interconnected with each
other. Glucosinolate metabolism plays a role in pathogen defense and affects stomatal movement, which serves as
the first line of defense against pathogen invasion. In addition to hypothesis generation projects, another major
part of my research program has been hypothesis driven, i.e., characterizing molecular, biochemical and
physiological functions of specific genes and proteins identified by proteomics and metabolomics approaches. One
of the projects has been focused on understanding the key steps in the methionine chain-elongation pathway,
which directly connects methionine (primary) metabolism to glucosinolate (spealized) metabolism. Our integration
of hypothesis generation and hypothesis driven research will ultimately lead to a holistic view of cellular networks
and processes in plants and will create important stepping stones towards potential biotechnological applications
in enhanced yield, bioenergy and defense.
TABLE OF CONTENTS
Author’s note ................................................................................................................................................................. 7
Introduction ................................................................................................................................................................... 8
Tips about this Curriculum ............................................................................................................................................. 9
Lesson Summaries ....................................................................................................................................................... 11
Lesson Sequencing Guide ............................................................................................................................................ 11
Vocabulary ................................................................................................................................................................... 12
Next Generation Sunshine State Standards – Science.................................................... Error! Bookmark not defined.
Background information .............................................................................................................................................. 20
LESSON ONE: THE P4 SITUATION: PROTEINS, PROTEOMES, PHOTOSYNTHESIS AND PLANT ADAPTATION ......... Error!
Bookmark not defined.
LESSON TWO -A: WHAT IS YOUR COLOR? - BEER-LAMBERT’S LAW .......................................................................... 22
LESSON THREE: : FRAGMENTED AND POSITIVE – MASS SPECTROMETRY AND BIOINFORMATICS .... Error! Bookmark
not defined.
Resources..................................................................................................................................................................... 93
References ................................................................................................................................................................... 94
Student Pages: Content Assessment .......................................................................................................................... 95
Teacher Answer Key: Content Assessment ................................................................................................................ 97
Content Area Expert Evaluation .................................................................................................................................. 99
Teacher Feedback Form ............................................................................................................................................ 101
Student Feedback Form ............................................................................................................................................. 104
AUTHOR’S NOTE
I started my professional career as a research chemist. Asking questions about the world around us is in my nature.
I like to know the how and the why of nature patterns. I am most intrigued about the chemistry of life. How and
why (what happens at the molecular level) living things behave, evolve, adapt. As a research scientist, I contributed
to science by conducting investigations and sharing knowledge with peers. Later in life, I became a teacher. This
career change did not diminish my passion for science. It only takes a few days for my students to see my intense
questioning of the unknown. Students also quickly learn that I expect them, similarly, to be observant of nature,
inquisitive, and thinkers.
As teachers, we share scientific knowledge with students in a very special way. Teachers take simple and complex
science concepts and present them to the students in engaging, yet accurate, manner. Teachers must develop
strategies to enthusiastically help student uncover the wonderful world around them and to discover the scientific
laws. Teachers must guide students in the understanding of scientific theories, which often are abstract and only
visible by microscopic eyes. Finding relevancy in every scientific concept is at times challenging for teachers but
necessary to keep high school students searching for scientific answers. The ultimate goal of a science teacher is to
make all students science literate so that later in life they can make informed and intelligent decisions. If in doing
all this we also ignite the spark in students to select a career in the science field, then we have done our job very
well.
As a teacher, I still contribute to science by lighting the path to science careers to my students. In order to show
my students what possible career choices are available in the science fields, I have to keep myself abreast of new
technologies and the choices currently available in the field. This is the reason I have attended the programs
offered by the Center for Precollegiate Education and Training (CPET) at the University of Florida (UF). This summer
programs provide teachers with the chance to learn the latest science research opportunities high school
graduates could consider in their future. The lessons in this unit were generated while I participated in my second
year CPET summer program, working side-by-side with graduate students and doctoral candidates at one of the
university’s research laboratories.
In order to prepare students for careers in science, technology, engineering, and math (STEM), teachers must
become familiar with the 21st century tools in those fields. Proteomics is truly a 21st century science, emerging
after the post-genomic era. Proteomics has benefited from technological advantages in protein analysis like mass
spectrometry and rapidly emerging bioinformatics field where computerized databases are easily searched to
obtain valuable information. The three lessons in this unit present an introduction to Proteomics to high school
students, using plants as a model to learn analytical techniques used in this field.
INTRODUCTION
Proteomics is the comprehensive study of proteins, their abundance, modifications, structures, functions and
overall interaction patterns within cells. Proteomics is an emerging science, its name was first coined in the late
1990s as an analogy to genomics (the comprehensive study of genes in an organism). It is only logical that in the
post-genomic world, the study of cellular proteomes would follow. Proteins are involved in every level of cellular
function and they are at the culprit of many biological disorders and diseases. In spite of being a relatively new
science, a search of scientific literature on proteomics returns an overwhelming amount of information from the
isolation, purification, and preparation of all different biological samples to the applications of proteomics by
evaluating, monitoring, and targeting proteins involved in medical conditions.
It is my intension with these lessons to have the high school student become familiar with the technological
processes used in the proteomics field. Proteomics is not a one science field. It incorporates biology, chemistry,
engineering and mathematics. Students usually take compartmentalized classes; just biology, just chemistry, just
math. However, students must be aware of the interconnections of all these disciplines and how they play
together in the latest cutting-age research.
In the first lesson, The P4 Situation: Proteins, Proteomes, Photosynthesis and Plant Adaptation, they are
introduced to the concepts necessary to understand the subsequent activities, from proteins to plant adaptation.
This lesson targets many of the biology and chemistry standards. In the second lesson, What is your color?: Plant
Protein Extraction and Colorimetric Protein Determination, the students learn about Beer’s Law which allows them
to measure concentrations of solutes in solution based on spectroscopy. This technique is then used to determine
the concentration of leaf proteins in a sample extract. This technique is one of the student learning objectives for
advance science, like Advanced Placement® Chemistry (AP Chem). In the last and final lesson, Fragmented and
Positive: Mass Spectrometry Peptide Analysis, and with the aid of animations and simulations, students are
presented with the concepts of gel electrophoresis, mass spectrometry and bioinformatics. The students then will
be analyze and identify proteins based on mass spectrometry data, using bioinformatics. Separation techniques
and understanding the intermolecular forces disrupted by such techniques are learning objectives in the chemistry
and in the AP Chem curriculum. Mass spectrometry analysis is also part of the student learning objectives in the AP
Chem curriculum.

TIPS ABOUT THIS CURRICULUM
Lesson Plan Format: All lessons in this curriculum unit are formatted in the same manner. In each lesson you will
find the following components:
ESSENTIAL QUESTION(S): Identifies key questions the lesson will explore.
OVERALL TIME ESTIMATE: Indicates total amount of time needed for the lesson, including advanced preparation.
LEARNING STYLES: Visual, auditory, and/or kinesthetic.
VOCABULARY: Lists key vocabulary terms used and defined in the lesson. Also collected in master vocabulary list.
LESSON SUMMARY: Provides a 1-2 sentence summary of what the lesson will cover and how this content will be
covered. Also collected in one list.
STUDENT LEARNING OBJECTIVES: Focuses on what students will know, feel, or be able to do at the conclusion of
the lesson.
STANDARDS: Specific state benchmarks addressed in the lesson. Also collected in one list.
MATERIALS: Items needed to complete the lesson. Number required for different types of grouping formats (Per
class, Per group of 3-4 students, Per pair, Per student) is also indicated.
BACKGROUND INFORMATION: Provides accurate, up-to-date information from reliable sources about the lesson
topic.
ADVANCE PREPARATION: This section explains what needs to be done to get ready for the lesson.
PROCEDURE WITH TIME ESTIMATES: The procedure details the steps of implementation with suggested time
estimates. The times will likely vary depending on the class.
ASSESSMENT SUGGESTIONS: Formative assessment suggestions have been given. Additionally, there is a brief
summative assessment (pre/post test) that can be given. Teachers should feel free to create additional formative
and summative assessment pieces.
EXTENSIONS: (ACTIVITIES/LITERATURE) There are many activities and reading sources available to augment and
enhance the curriculum. They have been included. If you find additional ones that should be added, please let us
know.
RESOURCES/REFERENCES: This curriculum is based heavily on primary sources. As resources and references have
been used in a lesson, their complete citation is included as well as a web link if available. All references and
resources are also collected in one list.
STUDENT PAGES: Worksheets and handouts to be copied and distributed to the students.
TEACHER MASTERS: Versions of the student pages with answers or the activity materials for preparation.
Collaborative Learning: The lessons in this curriculum have been developed to include many collaborative learning
opportunities. Rather than presenting information in lecture format and teacher driven, the activities involve the
students in a more engaged manner. For classrooms not accustomed to using collaborative learning strategies,
have patience. It can be difficult to communicate instructions, particularly for students who are visual learners.
For these students, use of visual clues such as flowcharts and graphics can help them understand how they are to
move to different groups.
Groups: Most of the lessons are carried out in groups. While it isn’t necessary for students to remain in the same
groups the entire unit, if they work well together, it may foster students to think deeper as they are comfortable
with their teammates and willing to ask questions of each other.
Inquiry-based: The lessons in the curriculum invite students to be engaged and ask questions. They work through
background information in a guided fashion, but are challenged to think beyond what they have read or done. The
teacher serves as the facilitator in these activities, not the deliverer of information.
Technology: Lessons have been written to be mindful of varying availability of technology in schools and homes.
Lesson 2 requires a spectrophotomer or colorimeter. Lesson 3 requires the access to the internet via computer or
personal devices.
Content: The content of these lessons is interdisciplinary. They cover both chemistry and biology standards. The
lessons are intended to introduce students to general procedural concepts involved in Proteomics; a subject that is
not commonly found in the high school science curriculum.
Implementation notes: This curriculum should be modified and adapted to suit the needs of the teacher and
students. To help make implementation easier in this first draft, notes have been included in lessons as needed.
Extensions: All three lessons have the potential for extensions. Each lesson has a section of resources for possible
extension.
Science Subject: Chemistry, Biology
Grade and ability level: 10-12 students in advanced biology or chemistry Science concepts: enzymes, DNA, transcription, translation, protein structure, protein function, proteomics, genetics, colorimetric assay, Beer’s Law, Mass Spectrometry, Bioinformatics, plant regulation and adaptation
LESSON SUMMARIES
LESSON ONE. The P4 Situation: Proteins, Proteomes, Photosynthesis and Plant Adaptation . Using a jigsaw approach, students will learn about the fundamentals of proteins, proteomes, photosynthesis, and plant adaption. This activity provides students with the background knowledge necessary to have a working understanding of what proteomics is about and how it can be used in deciphering key components from plant metabolism and adaptation to human diseases and conditions.
LESSON TWO: What is your color?: Plant Protein Extraction and Colorimetric Protein Determination Students will be presented with the concepts of light absorbance and colorimetry. They will generate a linear plot of absorbance versus concentration of known solution to establish the mathematical relationships between those two parameters. They will test their accuracy and precision by determining the concentration of an unknown sample. They will then extract proteins from a leaf sample and will then test for protein concentration. LESSON THREE: Fragmented and Positive: Mass Spectrometry and Bioinformatics Analysis Students will use simulation and animation programs to learn the next critical steps in analyzing proteins: gel electrophoresis and mass spectrometry. After students become familiar with these techniques, they will do a hands-on bioinformatics activity. They will be provided with mass spectrometry fragments to be analyzed by the MASCOT on-line program in an attempt to determine the protein the given fragments come from. Upon successful identification, students will be then guided to determine the protein structure and function by using other databases.
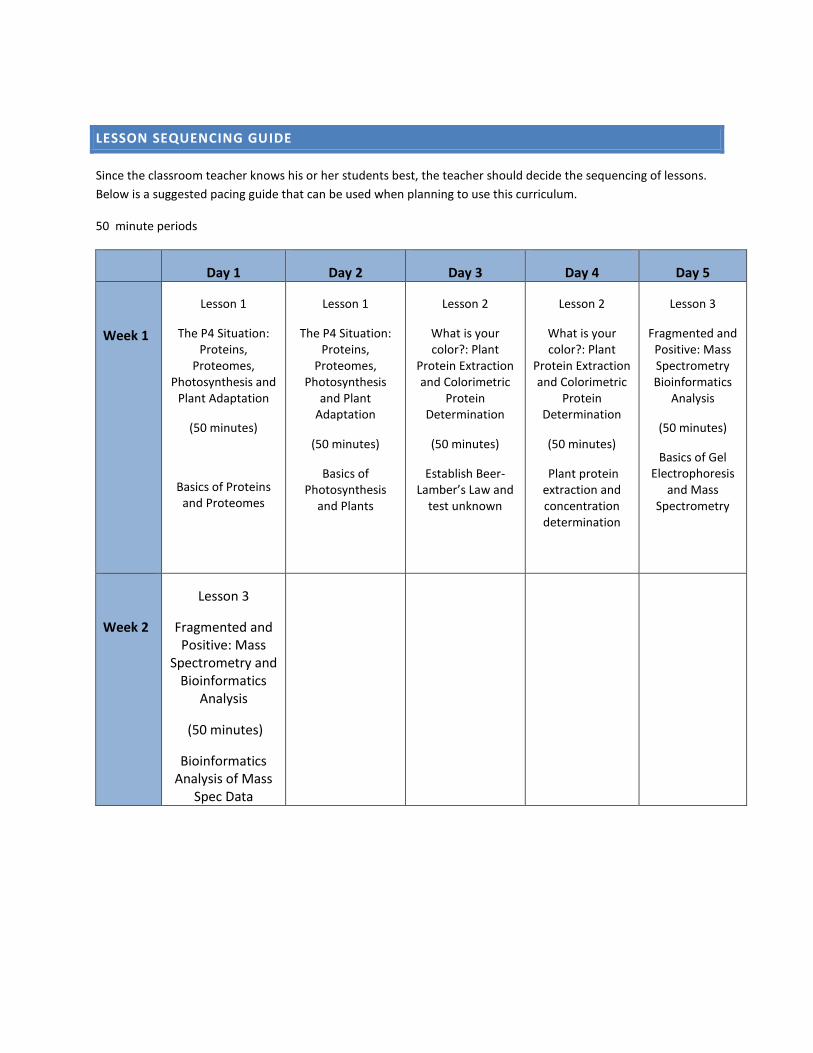
LESSON SEQUENCING GUIDE
Since the classroom teacher knows his or her students best, the teacher should decide the sequencing of lessons.
Below is a suggested pacing guide that can be used when planning to use this curriculum.
50 minute periods
Day 1 Day 2 Day 3 Day 4 Day 5
Week 1
Lesson 1
The P4 Situation: Proteins,
Proteomes, Photosynthesis and
Plant Adaptation
(50 minutes)
Basics of Proteins and Proteomes
Lesson 1
The P4 Situation: Proteins,
Proteomes, Photosynthesis
and Plant Adaptation
(50 minutes)
Basics of Photosynthesis
and Plants
Lesson 2
What is your color?: Plant
Protein Extraction and Colorimetric
Protein Determination
(50 minutes)
Establish Beer-Lamber’s Law and
test unknown
Lesson 2
What is your color?: Plant
Protein Extraction and Colorimetric
Protein Determination
(50 minutes)
Plant protein extraction and concentration determination
Lesson 3
Fragmented and Positive: Mass Spectrometry Bioinformatics
Analysis
(50 minutes)
Basics of Gel Electrophoresis
and Mass Spectrometry
Week 2
Lesson 3
Fragmented and Positive: Mass
Spectrometry and Bioinformatics
Analysis
(50 minutes)
Bioinformatics Analysis of Mass
Spec Data

VOCABULARY
Absorbance - the capacity of a substance to absorb radiation (light), expressed as the common logarithm of the reciprocal of the transmittance of the substance Adaptation - any alteration in the structure or function of an organism or any of its parts that results from natural selection and by which the organism becomes better fitted to survive and multiply in its environment Amino Acids - any of a class of organic compounds that contains at least one amino group, –NH 2, and one carboxyl group, –COOH: the alpha-amino acids, RCH(NH 2)COOH, are the building blocks from which proteins are constructed Assay – test or analysis Beer’s Law - also known as the Beer–Lambert law relates the attenuation of light to the properties of the material through which the light is traveling Bioinformatics - the retrieval and analysis of biochemical and biological data using mathematics and computer science, as in the study of genomes and proteomes Calvin Cycle - a series of reactions, occurring during photosynthesis, in which glucose is synthesized from carbon dioxide Catalyst - a substance that causes or accelerates a chemical reaction without itself being affected Codon - a triplet of adjacent nucleotides in the messenger RNA chain that codes for a specific amino acid in the synthesis of a proteins Concentration - (in a solution) a measure of the amount of dissolved substance contained per unit of volume Denature - to treat (a protein or the like) by chemical or physical means so as to alter its original state Digestion – the process by which larger molecules are broken down into smaller ones by the action of enzymes
Electrophoresis - technique applied to sorting proteins according to their responses to an electric field Enzyme - any of various proteins, as pepsin, originating from living cells and capable of producing certain chemical changes in organic substances by catalytic action, as in digestion Gel Electrophoresis - a technique for separating protein molecules of varying sizes in a mixture by moving them through a block of gel, as of agarose or polyacrylamide, by means of an electric field, with smaller molecules moving faster and therefore farther than larger ones Mass Spectrometer - a device for identifying the kinds of particles present in a given substance: the particles are ionized and beamed through an electromagnetic field and the manner in which they are deflected is indicative of their mass and, thus, their identity Photosynthesis - the complex process by which carbon dioxide, water, and certain inorganic salts are converted into carbohydrates by green plants, algae, and certain bacteria, using energy from the sun and chlorophyll Polymers - a compound of high molecular weight derived either by the addition of many smaller molecules

Proteins - highly varied organic molecules constituting a large portion of the mass of every life form and necessary in the diet of all animals and other nonphotosynthesizing organisms Proteome - the entire complement of proteins found in an organism over its entire life cycle, or in a particular cell type at a particular time under defined environmental conditions Proteomics - the study of the functions, structures, and interactions of proteins; the study of the proteome Rubisco - a plant protein which fixes carbon in photosynthetic organisms and accepts oxygen in place of carbon dioxide Standard Solution - A solution of known concentration, used as a standard of comparison or analysis Stoma - any of various small apertures, especially one of the minute orifices or slits in the epidermis of leaves, stems, etc., through which gases are exchanged Supernatant - floating above or on the surface Surfactant - A substance that, when dissolved in water, lowers the surface tension of the water and increases the solubility of organic compounds Transcription - the process by which genetic information on a strand of DNA is used to synthesize a strand of complementary RNA Translation - the process by which a messenger RNA molecule specifies the linear sequence of amino acids on a ribosome for protein synthesis Transmittance - the ratio of the amount of light (energy) transmitted through and emerging from a body to the total light (energy) incident on it: equivalent to one minus the absorbance Trypsin - a proteolytic enzyme of the pancreatic juice, capable of converting proteins into peptides
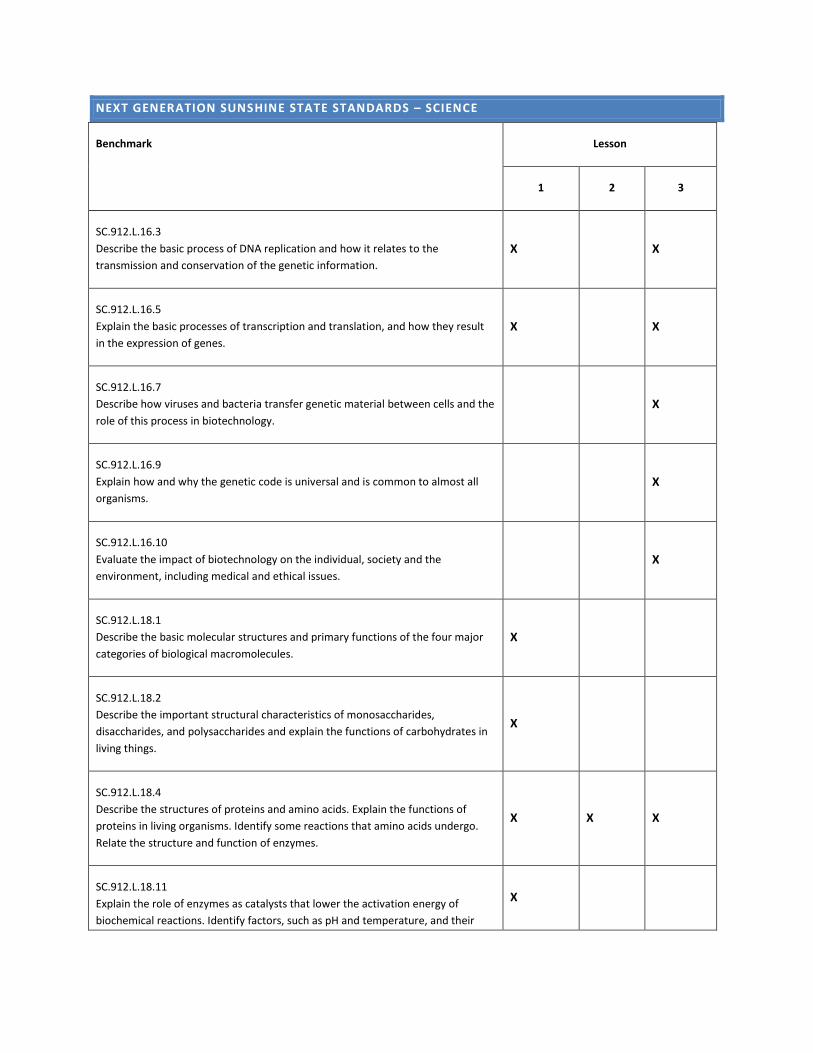
NEXT GENERATION SUNSHINE STATE STANDARDS – SCIENCE
Benchmark Lesson
1 2 3
SC.912.L.16.3
Describe the basic process of DNA replication and how it relates to the
transmission and conservation of the genetic information. X X
SC.912.L.16.5
Explain the basic processes of transcription and translation, and how they result
in the expression of genes. X X
SC.912.L.16.7
Describe how viruses and bacteria transfer genetic material between cells and the
role of this process in biotechnology. X
SC.912.L.16.9
Explain how and why the genetic code is universal and is common to almost all
organisms. X
SC.912.L.16.10
Evaluate the impact of biotechnology on the individual, society and the
environment, including medical and ethical issues. X
SC.912.L.18.1
Describe the basic molecular structures and primary functions of the four major
categories of biological macromolecules.
X
SC.912.L.18.2
Describe the important structural characteristics of monosaccharides,
disaccharides, and polysaccharides and explain the functions of carbohydrates in
living things.
X
SC.912.L.18.4
Describe the structures of proteins and amino acids. Explain the functions of
proteins in living organisms. Identify some reactions that amino acids undergo.
Relate the structure and function of enzymes.
X X X
SC.912.L.18.11
Explain the role of enzymes as catalysts that lower the activation energy of
biochemical reactions. Identify factors, such as pH and temperature, and their
X
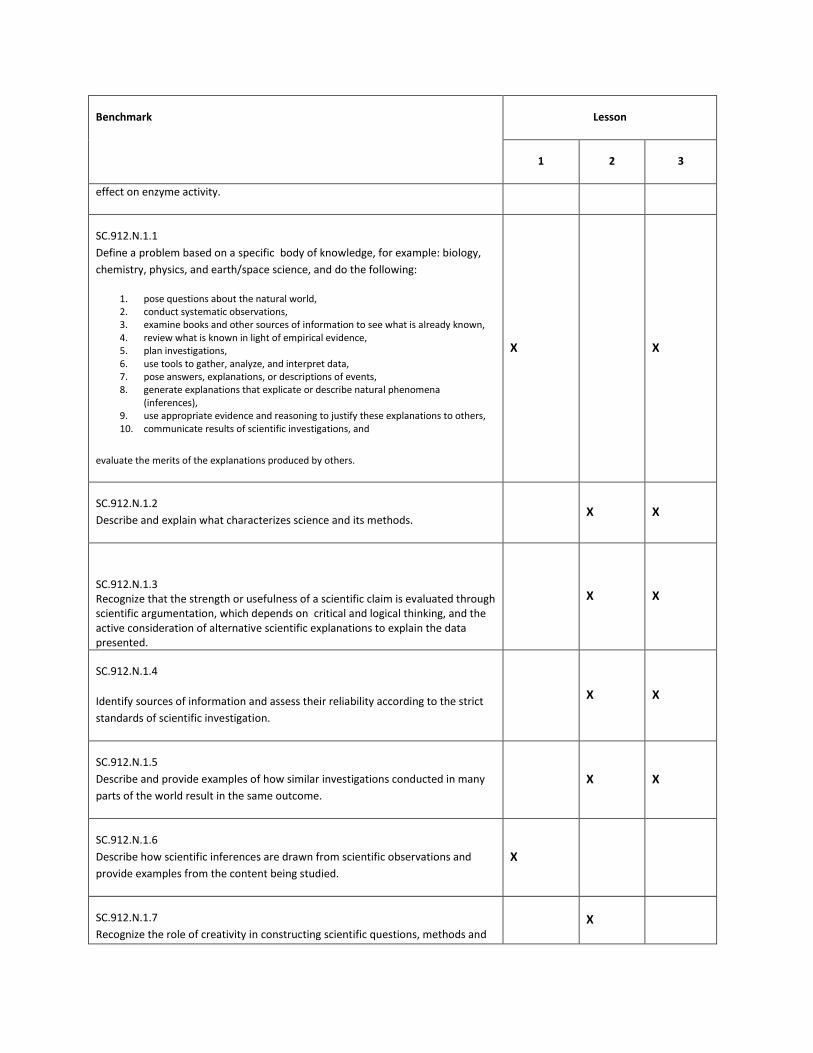
Benchmark Lesson
1 2 3
effect on enzyme activity.
SC.912.N.1.1
Define a problem based on a specific body of knowledge, for example: biology,
chemistry, physics, and earth/space science, and do the following:
1. pose questions about the natural world, 2. conduct systematic observations, 3. examine books and other sources of information to see what is already known, 4. review what is known in light of empirical evidence, 5. plan investigations, 6. use tools to gather, analyze, and interpret data, 7. pose answers, explanations, or descriptions of events, 8. generate explanations that explicate or describe natural phenomena
(inferences), 9. use appropriate evidence and reasoning to justify these explanations to others, 10. communicate results of scientific investigations, and
evaluate the merits of the explanations produced by others.
X X
SC.912.N.1.2
Describe and explain what characterizes science and its methods. X X
SC.912.N.1.3 Recognize that the strength or usefulness of a scientific claim is evaluated through scientific argumentation, which depends on critical and logical thinking, and the active consideration of alternative scientific explanations to explain the data presented.
X X
SC.912.N.1.4
Identify sources of information and assess their reliability according to the strict
standards of scientific investigation.
X X
SC.912.N.1.5
Describe and provide examples of how similar investigations conducted in many
parts of the world result in the same outcome.
X X
SC.912.N.1.6
Describe how scientific inferences are drawn from scientific observations and
provide examples from the content being studied.
X
SC.912.N.1.7
Recognize the role of creativity in constructing scientific questions, methods and X

Benchmark Lesson
1 2 3
explanations.
SC.912.N.2.4
Explain that scientific knowledge is both durable and robust and open to change.
Scientific knowledge can change because it is often examined and re-examined by
new investigations and scientific argumentation. Because of these frequent
examinations, scientific knowledge becomes stronger, leading to its durability.
X X
SC.912.N.2.5
Describe instances in which scientists' varied backgrounds, talents, interests, and
goals influence the inferences and thus the explanations that they make about
observations of natural phenomena and describe that competing interpretations
(explanations) of scientists are a strength of science as they are a source of new,
testable ideas that have the potential to add new evidence to support one or
another of the explanations.
X X
SC.912.N.3.3
Explain that scientific laws are descriptions of specific relationships under given
conditions in nature, but do not offer explanations for those relationships.
X
SC.912.N.3.5
Describe the function of models in science, and identify the wide range of models
used in science.
X X
SC.912.N.4.1
Explain how scientific knowledge and reasoning provide an empirically-based
perspective to inform society's decision making.
X X
SC.912.N.4.2
Weigh the merits of alternative strategies for solving a specific societal problem
by comparing a number of different costs and benefits, such as human, economic,
and environmental.
X X
SC.912.P.8.10
Describe oxidation-reduction reactions in living and non-living systems. X
SC.912.P.8.12
Describe the properties of the carbon atom that make the diversity of carbon
X
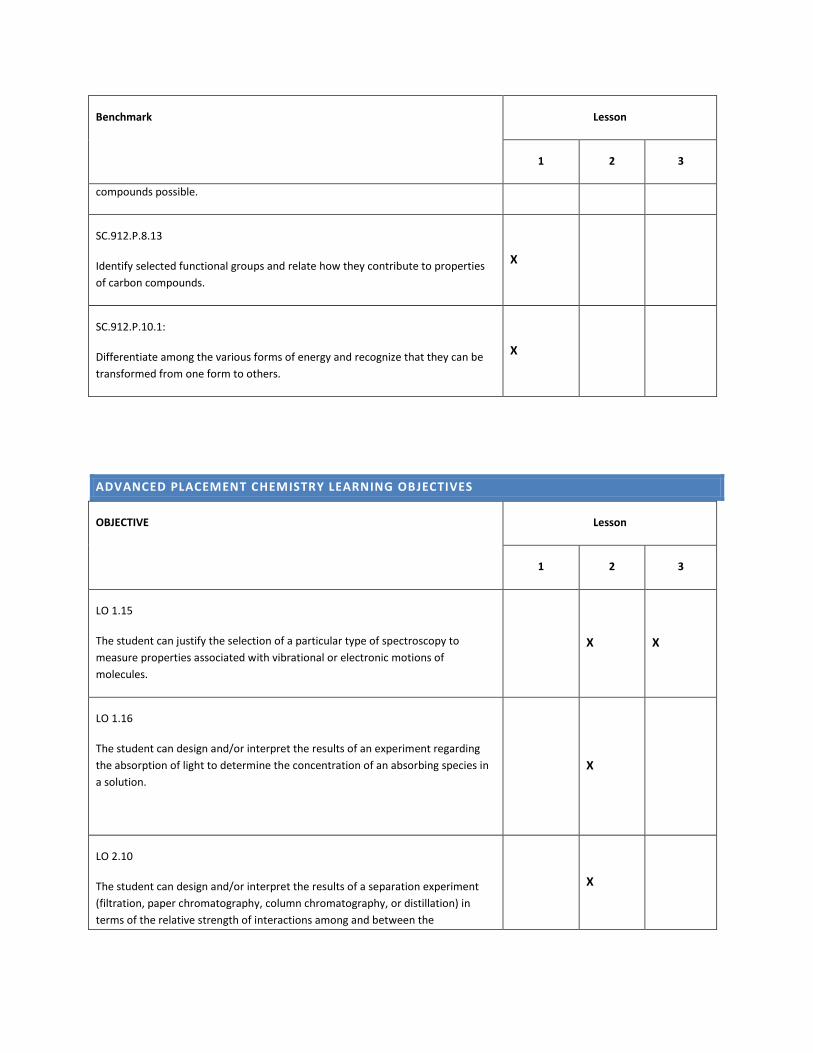
Benchmark Lesson
1 2 3
compounds possible.
SC.912.P.8.13
Identify selected functional groups and relate how they contribute to properties
of carbon compounds.
X
SC.912.P.10.1:
Differentiate among the various forms of energy and recognize that they can be
transformed from one form to others.
X
ADVANCED PLACEMENT CHEMISTRY LEARNING OBJECTIVES
OBJECTIVE Lesson
1 2 3
LO 1.15
The student can justify the selection of a particular type of spectroscopy to
measure properties associated with vibrational or electronic motions of
molecules.
X X
LO 1.16
The student can design and/or interpret the results of an experiment regarding
the absorption of light to determine the concentration of an absorbing species in
a solution.
X
LO 2.10
The student can design and/or interpret the results of a separation experiment
(filtration, paper chromatography, column chromatography, or distillation) in
terms of the relative strength of interactions among and between the
X

OBJECTIVE Lesson
1 2 3
components.
LO 3.8
The student is able to identify redox reactions and justify the identification in
terms of electron transfer.
X
LO 4.9
The student is able to explain changes in reaction rates arising from the use of
acid-base catalysts, surface catalysts, or enzyme catalysts, including selecting
appropriate mechanisms with or without the catalyst present.
X
LO 5.10
The student can support the claim about whether a process is a chemical or
physical change (or may be classified as both) based on whether the process
involves changes in intramolecular versus intermolecular interactions.
X X
BACKGROUND INFORMATION
General background information is given here. More detail is provided in the individual lessons as needed as well in the student information in lesson one.
Proteins
Proteins are one of the four major macromolecules found in living organisms. The word protein comes from the Greek word meaning ‘holding first place’, proteios. Proteins are essential to all organisms due to their numerous functions. They are involved in cell structure and function. Many of them are inside as well as outside the cells. They also form bridges in the cell membrane and control the movement of nutrients and other substances in and out of the cells. Proteins serve as hormones, antibodies, and fibers. They are the major component of blood, hair, skin, muscle, cartilage, and ligament. All chemical reactions in living organisms are aided by special proteins called enzymes. Enzymes are biological catalysts that lower the energy required for a chemical reaction to occur. Without enzymes there will be no life since they are involved in the replication of the genetic code and in the chemical reactions that make carbohydrates, lipids, nucleic acids, and more proteins.
Proteins are considered polymers made up of basic units called amino acids. Amino acids come together in different combinations to create different proteins. The protein structure determined by the string of amino acids is called the protein primary structure. The protein structure becomes more complex after the amino acid sequence is strung together. Proteins can fold and form three-dimensional structures. Furthermore, these folded structures can aggregate with other proteins, forming even more complex structures. The protein function is intrinsically tied to the protein overall structure. An average protein have approximately 300 amino acids.
Instructions for making proteins in the cell come from the nucleus, from the DNA codons. Transcription of the DNA code in the nucleus results in a messenger RNA molecule which then moves to the cytoplasm where the RNA codon is translated into an amino acid sequence of a protein in the cell ribosome. Cells make proteins based on the gene expression coded by the DNA at a given life stage or as a result of environmental factors.
Proteomes
Proteome is the complete set of proteins of an organism or a cellular system at a given time. The proteome is not constant, organisms can have different proteins at different stages. Also, proteins can be modified as a response to environmental stressors. The large scale study of a specific entire proteome is called proteomics, analogous to genome and genomics.
Proteomics studies aim to characterize when and where proteins are expressed, how proteins interact, how do post-translational modifications occur, rates of protein production and degradation. The study of proteins involved in diseases or medical conditions can lead to targeted treatment.
In order to study proteins, they have to be extracted, separated from the rest of cellular components, and identified. Extraction techniques include physical rupturing of the cells and dissolving the proteins in a specific buffered solution. The most common separation technique used is gel electrophoresis which separates the proteins based on their electrical charges (1D gel). A most effective separation of the large number of proteins in living systems is the 2D gel electrophoresis which separates based on charges and also by the molecular mass (2D gel). The separated proteins are then broken down (digested) and the fragmented peptides are analyzed by mass spectrometry. Each protein breaks apart in a very specific set of fragment peptides. The fragment peptides can be considered the protein ‘fingerprint’. The mass spectrometer identifies the abundance of each of the fragment peptides, after separating them by their mass and charge. This analysis is coupled to a computerized search in databases that allow for the identification of the protein. The technique is called Peptide Mass Fingerprinting

(PMF). PMF is a common and powerful technique. It only requires minute amounts of protein; however, the analysis can be compromised if a mixture of proteins is analyzed all together.
Oxidation and Reduction Reactions
Chemical reactions can be group in different categories. Reactions that are relevant to the photosynthesis process are the synthesis reactions, where larger molecules are made from smaller ones; decomposition reactions, where a larger molecule is broken down to smaller ones; and the oxidation and reduction reactions, where electrons are transferred from one compound (substance being oxidized) to a another compound (substance being reduced).
The oxidation and reduction reactions occur together, that is, a substance cannot get reduced if there is no substance being oxidized. Hence, these reactions are called ‘redox’ reactions, making it clearer that the actual chemical reaction is only one overall reaction where one reactant is being oxidized and another reactant is being reduced.
Many of plant regulatory metabolic pathways occur via a reduction/oxidation pathways (redox reactions). These pathways involve numerous chemical reactions where different compounds become electron donors (getting oxidized) or electron acceptors (getting reduced).
Photosynthesis
In green plants photosynthesis takes place in the chloroplast. Photosynthesis is a multi-step process where many proteins participate. Many chemical reactions occur during photosynthesis. Reactions are grouped into the light-dependent and light-independent reactions.
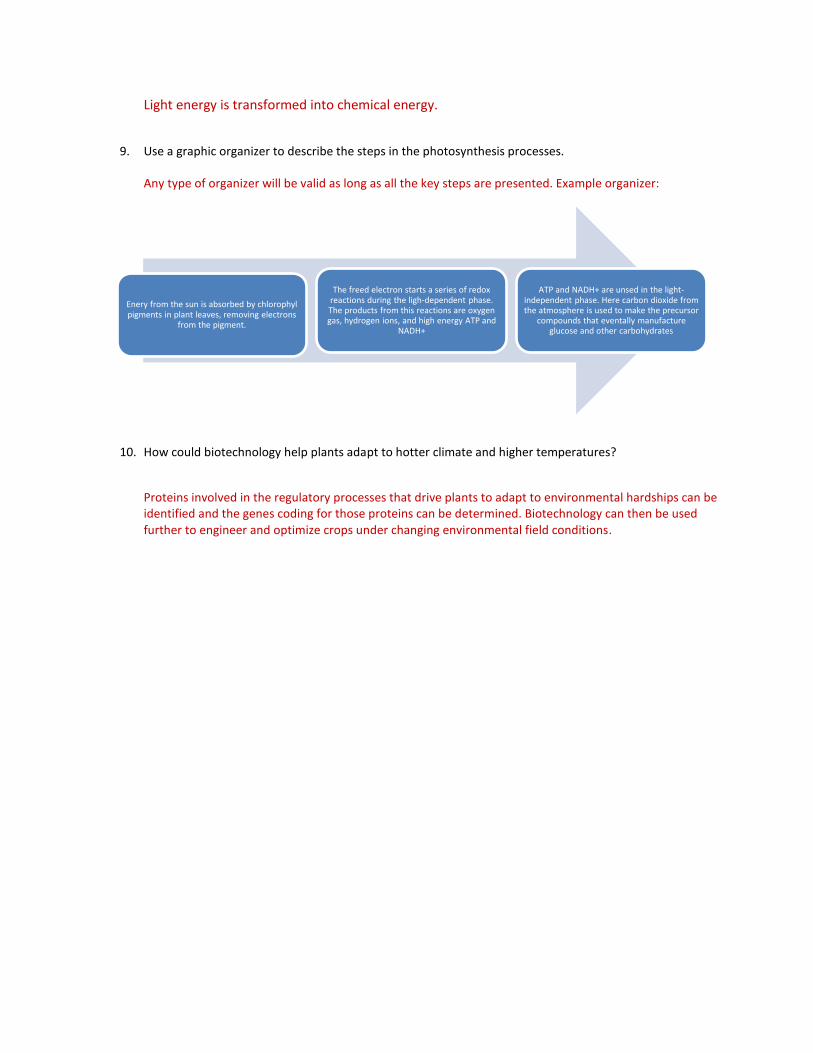
In the light-dependent reaction, the energy from the sun is absorbed by the chlorophyll pigment. This energy removes electrons from the chlorophyll molecule and transfers the excited electrons into an electron chain series of reactions. Removal of electrons is an oxidation reaction. As the chlorophyll is oxidized, the freed electrons reduce other compounds. A series of oxidation and reduction reactions occur and, ultimately, the oxygen in the surrounding water molecules gets oxidized to diatomic oxygen gas. The hydrogen from water molecules turns into hydrogen ions. This process is the source of all the oxygen gas in the atmosphere. Additionally, the light-dependent reactions produce two other key players, NADPH (reduced form of NADP+) and ATP. These last two compounds are used in the light-independent reactions (Calvin cycle) of the photosynthesis process. In the Calvin cycle, carbon dioxide from the atmosphere is used to synthesize glucose in reactions where ATP and NADPH participate, together with multiple enzymes. Carbon dioxide is reduced when it is converted into glucose.
Plant Adaptation
There are plants that have developed mechanism of adaptation to environmental stresses like drought or pathogen infections. These adaptive mechanisms involve proteins and, even when many of the chemical reactions and pathways are known, there is a lot more that is yet to be clearly understood. How is it that some plants like the ice plant (Mesembryanthemum crystallinum, family Aizoaceae) can adapt to drought conditions and in doing so change the mechanism of photosynthesis for better chance of survival? Identifying the proteins and proteomics of this plant could help us understand how exactly the adaptation process occurs. Identifying the genetic code that prescribes those proteins could lead to genetic engineering of more robust plants.
LESSON ONE: THE P4 SITUATION: PROTEINS, PROTEOMES, PHOTOSYNTHESIS AND PLANT
ADAPTATION
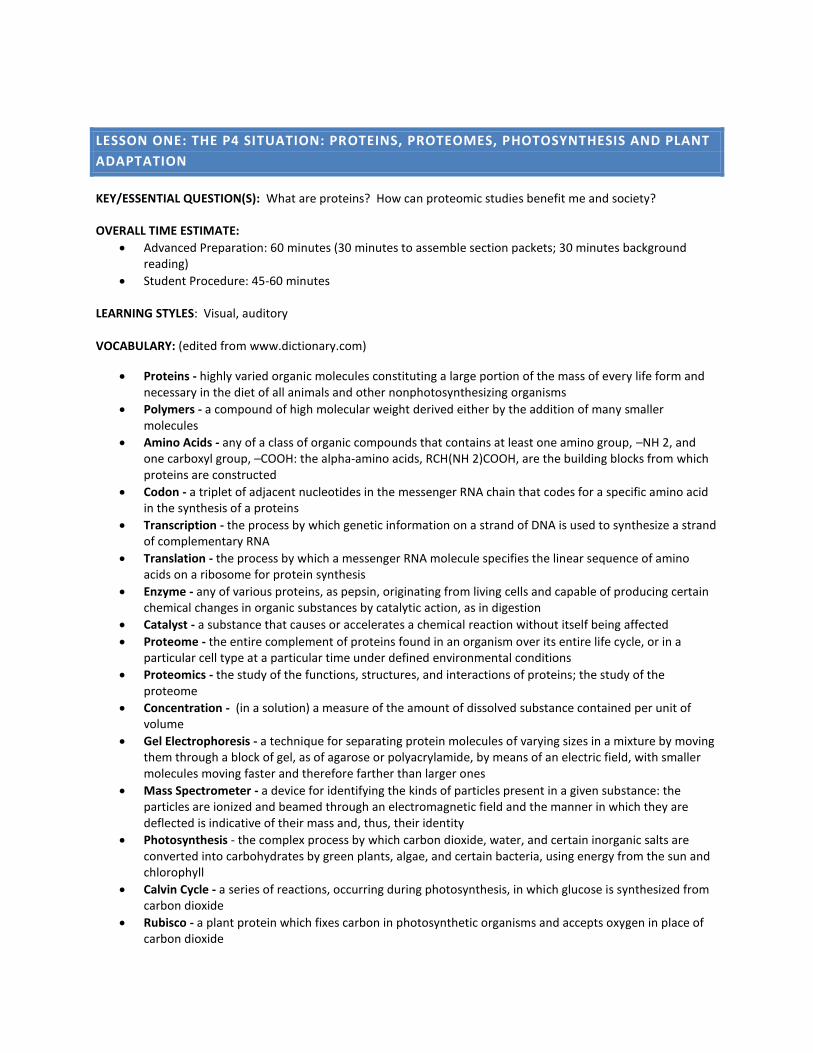
KEY/ESSENTIAL QUESTION(S): What are proteins? How can proteomic studies benefit me and society? OVERALL TIME ESTIMATE:
Advanced Preparation: 60 minutes (30 minutes to assemble section packets; 30 minutes background reading)
Student Procedure: 45-60 minutes LEARNING STYLES: Visual, auditory VOCABULARY: (edited from www.dictionary.com)
Proteins - highly varied organic molecules constituting a large portion of the mass of every life form and necessary in the diet of all animals and other nonphotosynthesizing organisms
Polymers - a compound of high molecular weight derived either by the addition of many smaller molecules
Amino Acids - any of a class of organic compounds that contains at least one amino group, –NH 2, and one carboxyl group, –COOH: the alpha-amino acids, RCH(NH 2)COOH, are the building blocks from which proteins are constructed
Codon - a triplet of adjacent nucleotides in the messenger RNA chain that codes for a specific amino acid in the synthesis of a proteins
Transcription - the process by which genetic information on a strand of DNA is used to synthesize a strand of complementary RNA
Translation - the process by which a messenger RNA molecule specifies the linear sequence of amino acids on a ribosome for protein synthesis
Enzyme - any of various proteins, as pepsin, originating from living cells and capable of producing certain chemical changes in organic substances by catalytic action, as in digestion
Catalyst - a substance that causes or accelerates a chemical reaction without itself being affected
Proteome - the entire complement of proteins found in an organism over its entire life cycle, or in a particular cell type at a particular time under defined environmental conditions
Proteomics - the study of the functions, structures, and interactions of proteins; the study of the proteome
Concentration - (in a solution) a measure of the amount of dissolved substance contained per unit of volume
Gel Electrophoresis - a technique for separating protein molecules of varying sizes in a mixture by moving them through a block of gel, as of agarose or polyacrylamide, by means of an electric field, with smaller molecules moving faster and therefore farther than larger ones
Mass Spectrometer - a device for identifying the kinds of particles present in a given substance: the particles are ionized and beamed through an electromagnetic field and the manner in which they are deflected is indicative of their mass and, thus, their identity
Photosynthesis - the complex process by which carbon dioxide, water, and certain inorganic salts are converted into carbohydrates by green plants, algae, and certain bacteria, using energy from the sun and chlorophyll
Calvin Cycle - a series of reactions, occurring during photosynthesis, in which glucose is synthesized from carbon dioxide
Rubisco - a plant protein which fixes carbon in photosynthetic organisms and accepts oxygen in place of carbon dioxide
Stoma - any of various small apertures, especially one of the minute orifices or slits in the epidermis of leaves, stems, etc., through which gases are exchanged
Adaptation - any alteration in the structure or function of an organism or any of its parts that results from natural selection and by which the organism becomes better fitted to survive and multiply in its environment
Bioinformatics - the retrieval and analysis of biochemical and biological data using mathematics and computer science, as in the study of genomes and proteomes
LESSON SUMMARY: Using a jigsaw reading approach, students will learn about the fundamentals of proteins, proteomes, photosynthesis, and plant adaption. This activity provides students with the background knowledge necessary to have a working understanding of what proteomics is about and how it can be used in deciphering key components from plant metabolism and adaptation to human diseases and conditions.
STUDENT LEARNING OBJECTIVES: The student will be able to...
1. Correctly sequence the translation and transcription steps resulting in protein synthesis. 2. Identify an amino acid by its structure (carboxylic acid and amino end). Formulate how the peptide bond
is made (condensation) and how is broken (hydrolysis). 3. Explain the function of enzymes (catalysts) in terms of energy required for reactions (Energy of
activation). 4. Draw conclusions and inferences based on their own data. Give possible valid explanations to a set of data
collected by experimentation. 5. Explain the role of oxidized and reduced compounds in the Photosynthesis cycle (including the Calvin
Cycle). Identify reactants and products and function of APT in Photosynthesis. 6. Identify the type of bonding that carbon makes that results in the diversity of carbon compounds. 7. Identify different organic functional groups and how their difference contributes to protein (carbon
compounds) structure. 8. Identify the flow of energy in the Photosynthesis processes and in the synthesis of other compounds in
plants. 9. Correctly sequence the steps in the Photosynthesis processes (light-dependent and light-independent
reactions) 10. Give one example of the large-scale environmental impacts resulting from human activity.
STANDARDS: SC.912.L.16.5 SC.912.L.18.4 SC.912.L.18.11 and AP CHEM LO 4.9 SC.912.N.1.6 SC.912.P.8.10, AP CHEM LO 3.8, SC.912.L.18.10, SC.912.L.18.17 SC.912.P.8.12 SC.912.P.8.13 SC.912.P.10.1 SC.8.L.18.1 SC.912.L.17.16 MATERIALS:
1 copy of Teacher Pages: Jigsaw – Proteins, Proteomes, Photosynthesis, Plant Adaptation
1 copy of Teacher Pages: Section Name Cards
Envelopes or clips (for keeping information pages together)
BACKGROUND INFORMATION: Teachers are encouraged to read the student information (four sections: Proteins, Proteomes, Photosynthesis, Plant Adaptation) prior to the activity. This activity specifically focuses on the fundamentals of proteomics and how it is interrelated to the other topics described in this lesson. ADVANCE PREPARATION:
1. Make section cards: Teacher Pages: Section Name Cards, laminate if desired, and cut into individual cards.
2. Make information section packets: Copy Teacher Pages: Proteins, Proteomes, Photosynthesis, Plant Adaptation. Laminate if desired. Cut into smaller reading sections by cutting between paragraphs. Place all slips for a section in an envelope or clip together.
3. Make 1 copy of Student Worksheet: The P4 Situation.
Implementation note: For students and classrooms unaccustomed to jigsaws, it can seem a bit confusing and chaotic. Have patience. Collaborative learning experiences are a valuable part of scientific discovery.
PROCEDURE AND DISCUSSION QUESTIONS WITH TIME ESTIMATES:
1. (5 minutes) Start the lesson by writing the 4 words on the board: Proteins, Proteomes, Photosynthesis, Plant Adaptation. These words can be circled to start a ‘spider web’ organizer out each one. Ask student volunteers to write something they know about these four main topics. If students have taken biology prior to this class, it is very likely that the students know about protein, photosynthesis, and plant adaptation; however, their knowledge of proteomes will be limited, if they know anything at all. Point out that in this lesson they will learn basic information regarding these four topics.
2. (5 minutes) Have students assemble into groups of 4. This is their home group, so encourage them to remember the members of their home group. For a class with extra students, have them join to make groups of 5 rather than have a group without a member which would put extra burden on the smaller group to read more.
Once settled, give each member a card with one of the following section names: Proteins, Proteomes, Photosynthesis, or Plant Adaptation. See Teacher Pages: Section Name Cards.

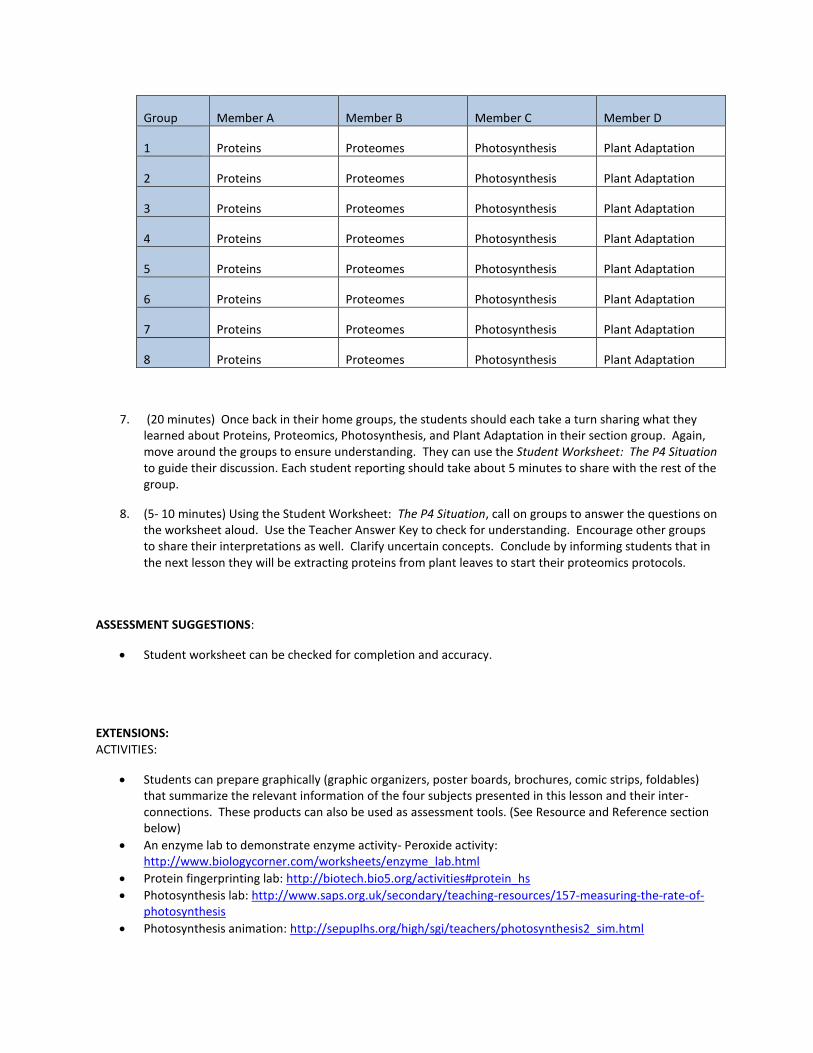
Group Member A Member B Member C Member D
1 Proteins Proteomes Photosynthesis Plant Adaptation
2 Proteins Proteomes Photosynthesis Plant Adaptation
3 Proteins Proteomes Photosynthesis Plant Adaptation
4 Proteins Proteomes Photosynthesis Plant Adaptation
5 Proteins Proteomes Photosynthesis Plant Adaptation
6 Proteins Proteomes Photosynthesis Plant Adaptation
7 Proteins Proteomes Photosynthesis Plant Adaptation
8 Proteins Proteomes Photosynthesis Plant Adaptation
3. Ask students to regroup according to their section name, forming four large groups.
You can allow students to stay in these large groups, or subdivide them in half yielding 2 Proteins sections, 2 Proteomes sections, 2 Photosynthesis sections, and 2 Plant Adaptation sections. This option requires producing two copies of each section information packet.
Section Name Group Member #
Proteins Group 1-8 Member A
Proteomes Group 1-8 Member B
Photosynthesis Group 1-8 Member C
Plant Adaptation Group 1-8 Member D
4. Distribute information packets to each section.
5. (15 minutes) Have students remove and equally distribute the information slips from the envelope, read their slip(s), and share with the other members of their section. Encourage students to take notes and summarize their section to share back in their home group. Move around the groups to ensure understanding. Monitor for understanding by asking students probing questions regarding their reading slips.
6. Ask students to put their information slips back in the envelope or clip. Have one member return the envelope to the front of the room while the groups redistribute back to their home group.
Group Member A Member B Member C Member D
1 Proteins Proteomes Photosynthesis Plant Adaptation
2 Proteins Proteomes Photosynthesis Plant Adaptation
3 Proteins Proteomes Photosynthesis Plant Adaptation
4 Proteins Proteomes Photosynthesis Plant Adaptation
5 Proteins Proteomes Photosynthesis Plant Adaptation
6 Proteins Proteomes Photosynthesis Plant Adaptation
7 Proteins Proteomes Photosynthesis Plant Adaptation
8 Proteins Proteomes Photosynthesis Plant Adaptation
7. (20 minutes) Once back in their home groups, the students should each take a turn sharing what they learned about Proteins, Proteomics, Photosynthesis, and Plant Adaptation in their section group. Again, move around the groups to ensure understanding. They can use the Student Worksheet: The P4 Situation to guide their discussion. Each student reporting should take about 5 minutes to share with the rest of the group.
8. (5- 10 minutes) Using the Student Worksheet: The P4 Situation, call on groups to answer the questions on the worksheet aloud. Use the Teacher Answer Key to check for understanding. Encourage other groups to share their interpretations as well. Clarify uncertain concepts. Conclude by informing students that in the next lesson they will be extracting proteins from plant leaves to start their proteomics protocols.
ASSESSMENT SUGGESTIONS:
Student worksheet can be checked for completion and accuracy.
EXTENSIONS: ACTIVITIES:
Students can prepare graphically (graphic organizers, poster boards, brochures, comic strips, foldables) that summarize the relevant information of the four subjects presented in this lesson and their inter-connections. These products can also be used as assessment tools. (See Resource and Reference section below)
An enzyme lab to demonstrate enzyme activity- Peroxide activity: http://www.biologycorner.com/worksheets/enzyme_lab.html
Protein fingerprinting lab: http://biotech.bio5.org/activities#protein_hs
Photosynthesis lab: http://www.saps.org.uk/secondary/teaching-resources/157-measuring-the-rate-of-photosynthesis
Photosynthesis animation: http://sepuplhs.org/high/sgi/teachers/photosynthesis2_sim.html
Photosynthesis tutorials and animations: http://www.northernhighlands.org/cms/lib5/NJ01000179/Centricity/Domain/38/photosynthesis-virtual-labs.pdf
Cell Biology animations: http://www.science.smith.edu/departments/Biology/Bio231/
Reading passage: The Glory of Leaves, http://ngm.nationalgeographic.com/2012/10/leaves/dunn-text
Reading passage: A Desert Shrub’s Crystallized Protein Sheds Light on Photosynthesis https://agresearchmag.ars.us
Reading passage questions: A Desert Shrub’s Crystallized Protein Sheds Light on Photosynthesis https://docs.google.com/document/d/1lXeIWhs6QhPj5U6xDIzjABQptTZxAt5yrYKs1bH95c/edit?pref=2&pli=1da.gov/2013/mar/protein
RESOURCES/REFERENCES:
Spider Web organizer: https://www.eduplace.com/graphicorganizer/pdf/spider.pdf
Graphic Organizers: https://www.eduplace.com/graphicorganizer/
Foldables: http://www.boostconference.org/workshop_pdf/Hands%20On%20Doesn't%20Mean%20Minds%20Off-Foldables.pdf
Background information, proteins: http://abyss.uoregon.edu/~js/glossary/proteins.html
Background information, proteins: http://serendip.brynmawr.edu/exchange/bioactivities/macromolecules
Background information, proteins: http://www.bozemanscience.com/proteins
Background information, proteins: https://www.khanacademy.org/test-prep/mcat/biomolecules/amino-acids-and-proteins1/v/four-levels-of-protein-structure
Background information: http://www.moleculardetective.org/Tutorials.html
Background information, proteomics: http://proteomics.cancer.gov/whatisproteomics
Background information, proteomics: https://www.researchgate.net/search?q=Proteomics
Background information, photosynthesis: http://www.bozemanscience.com/photosynthesis/
Background information, photosynthesis: http://nationalgeographic.org/media/calvincycle/
Background information, plants and adaptation: http://www.cpbr.gov.au/cpbr/WfHC/Mesembryanthemum/index.html
Background information, plants and adaptation: http://ipef.br/melhoramento/genoma/pdfs/cushman2000.pdf

TEACHER PAGES: JIGSAW - PROTEINS
A. The majority of the compounds in living organisms are carbon-containing molecules. Carbon is unique atom in that it has four valence electrons which means that it can form up to four bonds with other atoms. It can form single, double, and triple bonds with other atoms as well. However, in living organisms, the greatest feature of the carbon atom is its ability of forming compounds by bonding with itself in long chains and in close loops. These characteristics allow carbon to form a great variety of compounds which are constantly undergoing chemical reactions in living cells.
B. Proteins are one of the four major macromolecules (large covalently bonded compounds) found in living organisms, together with lipids, nucleotides, and carbohydrates. The word protein comes from the Greek word meaning ‘holding first place’, proteios. Proteins are essential to all organisms due to their numerous functions. Proteins can be considered to be the cell ‘doers’, being involved in everything the cell does. They are involved in all facets of cell structure and function. Many of them are inside as well as outside the cells. They also form bridges in the cell membrane and control the movement of nutrients and other substances in and out of the cells. Proteins serve as hormones, antibodies, and fibers. They are the major component of blood, hair, skin, muscle, cartilage, and ligament.
C. Proteins are considered polymers made up of basic units called amino acids. There are 20 essential amino acids found in living organisms. Amino acids are small molecules that contain an amino (-NH2) basic group at one end and acidic group, carboxylic acid (COOH), at the other end. Amino acids also contain other string of carbon atoms that determine whether they are considered hydrophobic (non-polar) or hydrophilic (polar) amino acids. In general acids and bases tend to react in a dehydration or condensation reaction. This is also true for amino acids, different amino acids react with each to form proteins. The reaction involves the formation of a chemical bond between the acidic end of one amino acid and the basic end of another amino acid, forming what is called the peptide bond. Peptide bond formation results in the loss of a water molecule. Peptide bonds can be broken by the addition of water across the bond, a reaction called hydrolysis.
http://chemwiki.ucdavis.edu/Core/Organic_Chemistry/Glossary/Peptide_Bond

D. The protein structure determined by the string of amino acids is called the protein primary structure. The protein structure becomes more complex after the amino acid sequence is strung together. Proteins can fold in a zig-zag fashion and form three-dimensional structures called pleated sheets. They can also curl in helixes. The pleated sheets and helixes are called the secondary structures of proteins. Due to intramolecular forces been the hydrophobic (non-polar) and hydrophilic (polar) amino acids, 3-dimensional folds and turns are common in most proteins; these are the tertiary structures of proteins. Furthermore, these folded structures can aggregate, forming even more complex structures, the quaternary structure of proteins. The protein function is intrinsically tied to the overall protein structure. An average protein has approximately 300 amino acids.
E. Instructions for making proteins in the cell come from the nucleus, from the DNA codons. Codons are groups of three nucleotides that dictate a message or a code. Transcription, the copying of the genetic DNA code, in the nucleus results in a messenger RNA molecule which then moves to the cytoplasm of the cell. The RNA codon is then translated into an amino acid sequence of a protein in the cell ribosome, this process is called translation. Cells make proteins based on the gene expression coded by the DNA at a given life stage or as a result of environmental factors.
F. All chemical reactions in living organisms are aided by special proteins called enzymes. Reactants need energy to produce the product. Enzymes are biological catalysts that lower the energy required for a chemical reaction to occur. Without enzymes there will be no life since they are involved in the replication of the genetic code and in the chemical reactions that make carbohydrates, lipids, nucleic acids, and…. more proteins.
https://www.biologycorner.com/worksheets/enzyme_lab.html

TEACHER PAGES: JIGSAW - PROTEOMES
A. Proteome is the complete set of proteins of an organism or a cellular system at a given time. Proteomes are considered ‘fingerprints’ for cells or organisms. The large scale study of a specific entire proteome is called proteomics, analogous to genome and genomics. Genome is the complete set of genes in a cell or an organism, and it relatively constant throughout the life of the cell or organism. However, protein manufacturing depends on the gene expression at a particular time, and therefore, organisms can have different proteins at different stages of their life cycle, depending on gene expression. Also, proteins can be modified after they have been manufactured as a response to environmental stressors. These types of changes are called post-translational modifications.
B. Proteomics is a relative new science that combines biology, chemistry, mathematics and computer science. Proteomics studies aim to characterize when and where proteins are expressed, how proteins interact, how do post-translational modifications occur, rates of protein production and degradation. Understanding the protein modifications and expressions involved in diseases or medical conditions can lead to targeted treatment. Many diseases like cancer, heart diseases and Alzheimer’s produce very specific proteins called biomarkers. A better understanding of biomarkers can lead to a better understanding of how these diseases start and how they can be prevented. Proteomic studies have been conducted in bacteria, viruses, plants, and animals. Examples of human cell proteomic studies that have been conducted are cancer, heart, kidney and liver conditions, aging bones, sleeping disorders, abnormal pregnancies and premature babies.
C. In order to study proteins, these molecules have to be extracted, separated from the rest of
cellular components, and identified. Extraction techniques include physical rupturing of the cells and dissolving the proteins in a specific buffered solution where all proteins are easily dissolved. One characterization that is usually done at this point is to determine the total protein concentration. Concentration refers to how much proteins (solute) are dissolved a given volume of the buffer (solvent). The concentration of the protein solution will be important in the next step, the process of protein separation.
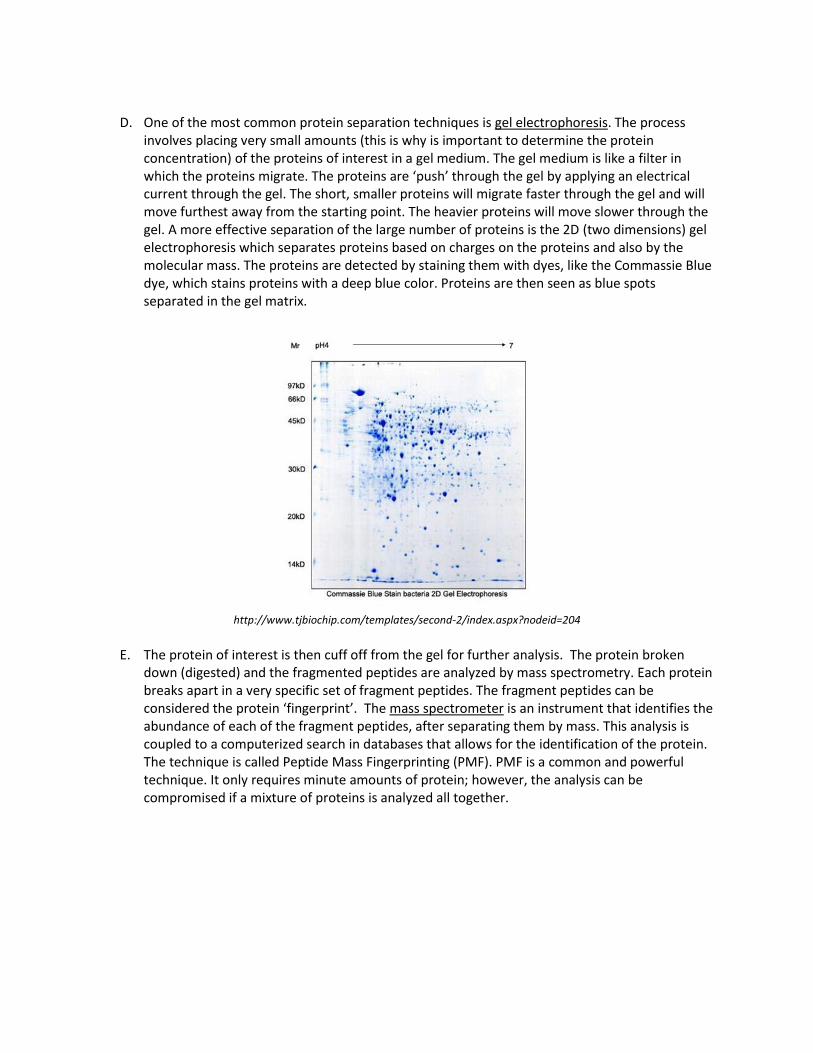
D. One of the most common protein separation techniques is gel electrophoresis. The process
involves placing very small amounts (this is why is important to determine the protein concentration) of the proteins of interest in a gel medium. The gel medium is like a filter in which the proteins migrate. The proteins are ‘push’ through the gel by applying an electrical current through the gel. The short, smaller proteins will migrate faster through the gel and will move furthest away from the starting point. The heavier proteins will move slower through the gel. A more effective separation of the large number of proteins is the 2D (two dimensions) gel electrophoresis which separates proteins based on charges on the proteins and also by the molecular mass. The proteins are detected by staining them with dyes, like the Commassie Blue dye, which stains proteins with a deep blue color. Proteins are then seen as blue spots separated in the gel matrix.
http://www.tjbiochip.com/templates/second-2/index.aspx?nodeid=204
E. The protein of interest is then cuff off from the gel for further analysis. The protein broken down (digested) and the fragmented peptides are analyzed by mass spectrometry. Each protein breaks apart in a very specific set of fragment peptides. The fragment peptides can be considered the protein ‘fingerprint’. The mass spectrometer is an instrument that identifies the abundance of each of the fragment peptides, after separating them by mass. This analysis is coupled to a computerized search in databases that allows for the identification of the protein. The technique is called Peptide Mass Fingerprinting (PMF). PMF is a common and powerful technique. It only requires minute amounts of protein; however, the analysis can be compromised if a mixture of proteins is analyzed all together.

http://www.moleculardetective.org/TutorialProteomics/TutorialProteomicsPage6.html
TEACHER PAGES: JIGSAW - PHOTOSYNTHESIS
A. In green plants photosynthesis takes place in the chloroplast. Photosynthesis is a multi-step process where many proteins participate. Many chemical reactions occur during photosynthesis. In photosynthesis, the energy from the sun is transformed into chemical energy in a series of oxidation and reduction reactions. When an electron is transferred in a chemical reaction, the substance that is doing the transferring gets oxidized. The substance that is receiving the electron gets reduced. Reactions where electrons are being transferred are called redox (reduction and oxidation) reactions. Many of the reactions in the photosynthesis process are redox reactions.
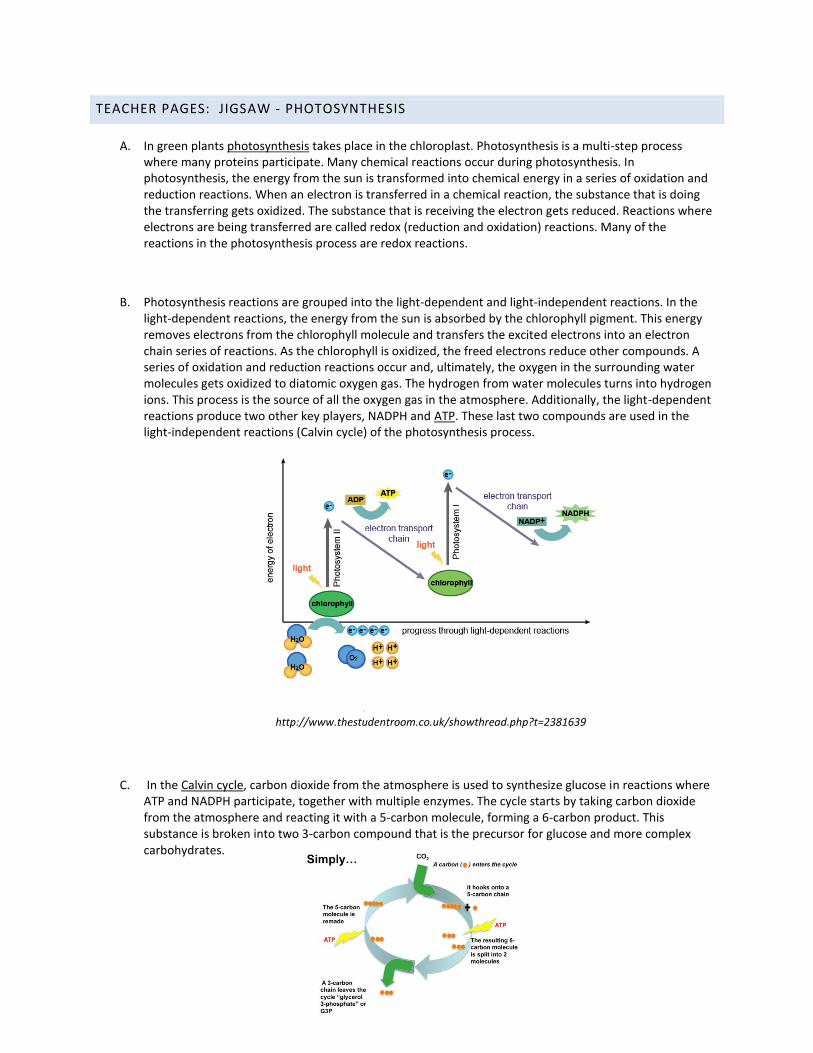
B. Photosynthesis reactions are grouped into the light-dependent and light-independent reactions. In the light-dependent reactions, the energy from the sun is absorbed by the chlorophyll pigment. This energy removes electrons from the chlorophyll molecule and transfers the excited electrons into an electron chain series of reactions. As the chlorophyll is oxidized, the freed electrons reduce other compounds. A series of oxidation and reduction reactions occur and, ultimately, the oxygen in the surrounding water molecules gets oxidized to diatomic oxygen gas. The hydrogen from water molecules turns into hydrogen ions. This process is the source of all the oxygen gas in the atmosphere. Additionally, the light-dependent reactions produce two other key players, NADPH and ATP. These last two compounds are used in the light-independent reactions (Calvin cycle) of the photosynthesis process.
http://www.thestudentroom.co.uk/showthread.php?t=2381639
C. In the Calvin cycle, carbon dioxide from the atmosphere is used to synthesize glucose in reactions where ATP and NADPH participate, together with multiple enzymes. The cycle starts by taking carbon dioxide from the atmosphere and reacting it with a 5-carbon molecule, forming a 6-carbon product. This substance is broken into two 3-carbon compound that is the precursor for glucose and more complex carbohydrates.
http://www.trunity.net/lifeonthisrocksample/view/article/534eafa10cf226e0bdbfc918/?topic=538dd80b0cf226e0bdbffa0e
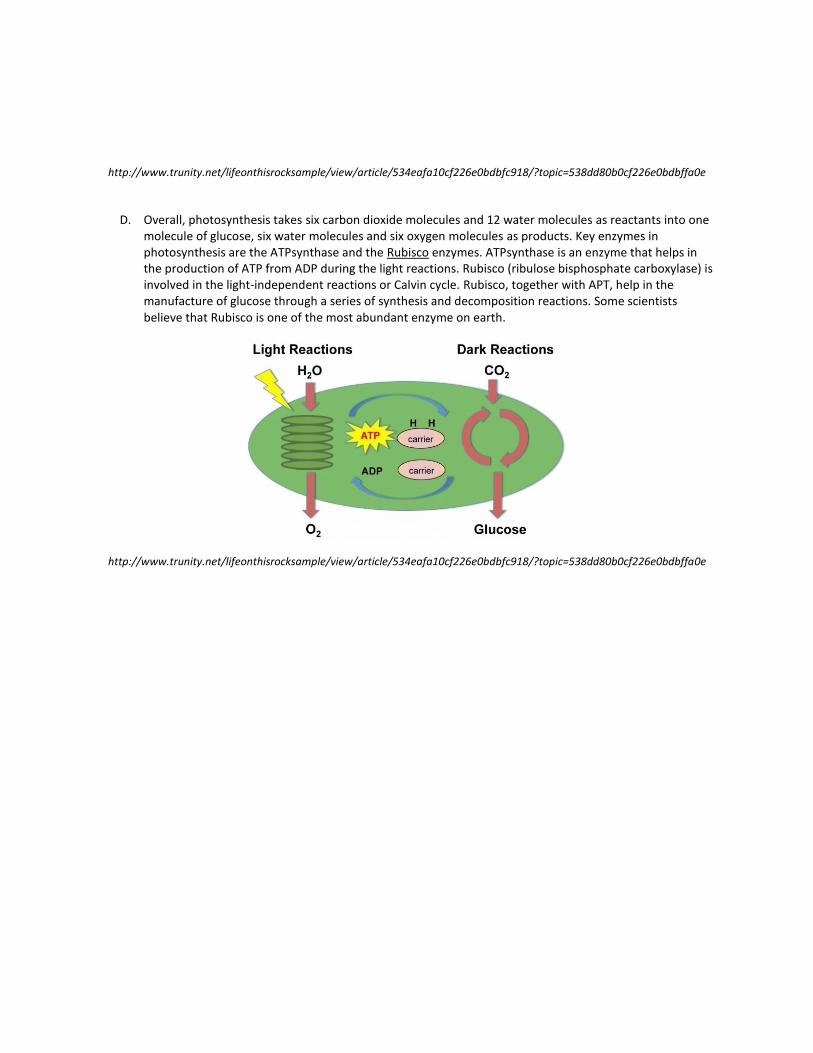
D. Overall, photosynthesis takes six carbon dioxide molecules and 12 water molecules as reactants into one molecule of glucose, six water molecules and six oxygen molecules as products. Key enzymes in photosynthesis are the ATPsynthase and the Rubisco enzymes. ATPsynthase is an enzyme that helps in the production of ATP from ADP during the light reactions. Rubisco (ribulose bisphosphate carboxylase) is involved in the light-independent reactions or Calvin cycle. Rubisco, together with APT, help in the manufacture of glucose through a series of synthesis and decomposition reactions. Some scientists believe that Rubisco is one of the most abundant enzyme on earth.
http://www.trunity.net/lifeonthisrocksample/view/article/534eafa10cf226e0bdbfc918/?topic=538dd80b0cf226e0bdbffa0e
TEACHER PAGES: JIGSAW - PLANT ADAPTATIONS
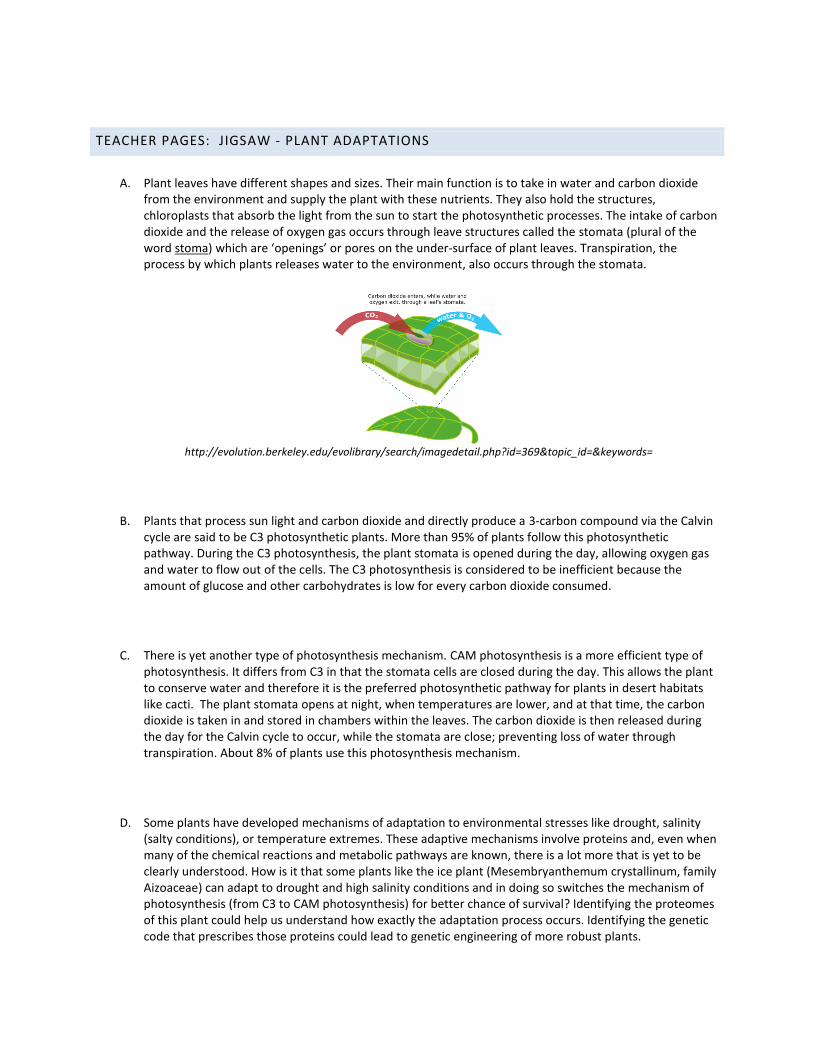
A. Plant leaves have different shapes and sizes. Their main function is to take in water and carbon dioxide from the environment and supply the plant with these nutrients. They also hold the structures, chloroplasts that absorb the light from the sun to start the photosynthetic processes. The intake of carbon dioxide and the release of oxygen gas occurs through leave structures called the stomata (plural of the word stoma) which are ‘openings’ or pores on the under-surface of plant leaves. Transpiration, the process by which plants releases water to the environment, also occurs through the stomata.
http://evolution.berkeley.edu/evolibrary/search/imagedetail.php?id=369&topic_id=&keywords=
B. Plants that process sun light and carbon dioxide and directly produce a 3-carbon compound via the Calvin cycle are said to be C3 photosynthetic plants. More than 95% of plants follow this photosynthetic pathway. During the C3 photosynthesis, the plant stomata is opened during the day, allowing oxygen gas and water to flow out of the cells. The C3 photosynthesis is considered to be inefficient because the amount of glucose and other carbohydrates is low for every carbon dioxide consumed.
C. There is yet another type of photosynthesis mechanism. CAM photosynthesis is a more efficient type of photosynthesis. It differs from C3 in that the stomata cells are closed during the day. This allows the plant to conserve water and therefore it is the preferred photosynthetic pathway for plants in desert habitats like cacti. The plant stomata opens at night, when temperatures are lower, and at that time, the carbon dioxide is taken in and stored in chambers within the leaves. The carbon dioxide is then released during the day for the Calvin cycle to occur, while the stomata are close; preventing loss of water through transpiration. About 8% of plants use this photosynthesis mechanism.
D. Some plants have developed mechanisms of adaptation to environmental stresses like drought, salinity (salty conditions), or temperature extremes. These adaptive mechanisms involve proteins and, even when many of the chemical reactions and metabolic pathways are known, there is a lot more that is yet to be clearly understood. How is it that some plants like the ice plant (Mesembryanthemum crystallinum, family Aizoaceae) can adapt to drought and high salinity conditions and in doing so switches the mechanism of photosynthesis (from C3 to CAM photosynthesis) for better chance of survival? Identifying the proteomes of this plant could help us understand how exactly the adaptation process occurs. Identifying the genetic code that prescribes those proteins could lead to genetic engineering of more robust plants.

http://www.florasilvestre.es/mediterranea/Aizoaceae/Mesembryanthemum_crystallinum.htm
E. Determining plant stress-adaptation networks is a major biotechnology research objective. Using proteomics, proteins involved in the regulatory processes that drive plants to adapt to environmental hardships can be identified. With the use of bioinformatics, the genes coding for those proteins can also be identified. Biotechnology can then be used further to engineer and optimize crops under changing environmental field conditions. The ice plant described above is currently being investigated to determine its regulatory and metabolic networks involved in its adaptation. Which proteins are present, which specific proteins interact, what chemical modifications (reactions) proteins undergo at specific temperatures or concentration of salts? These types of studies can be set up with controlled conditions with plants of the same family. Plants can be found everywhere and grow easily in the laboratory. Plant systems are excellent candidates to study proteomics. In the next two lessons you will use plants to learn the processes involved in proteomic studies.
Lab Plat from CPET SRE2016. Dr. Chen’s Laboratory
STUDENT WORKSHEET: THE P4 SITUATION
Name: Date: Home group members:
1. Prepare a graphic representation of the processes on transcription and translation. Write a short paragraph of the
sequence of steps that results in the expression of genes.
2. How are proteins synthesized? What is the similarity and differences of a protein synthesis and protein hydrolysis?
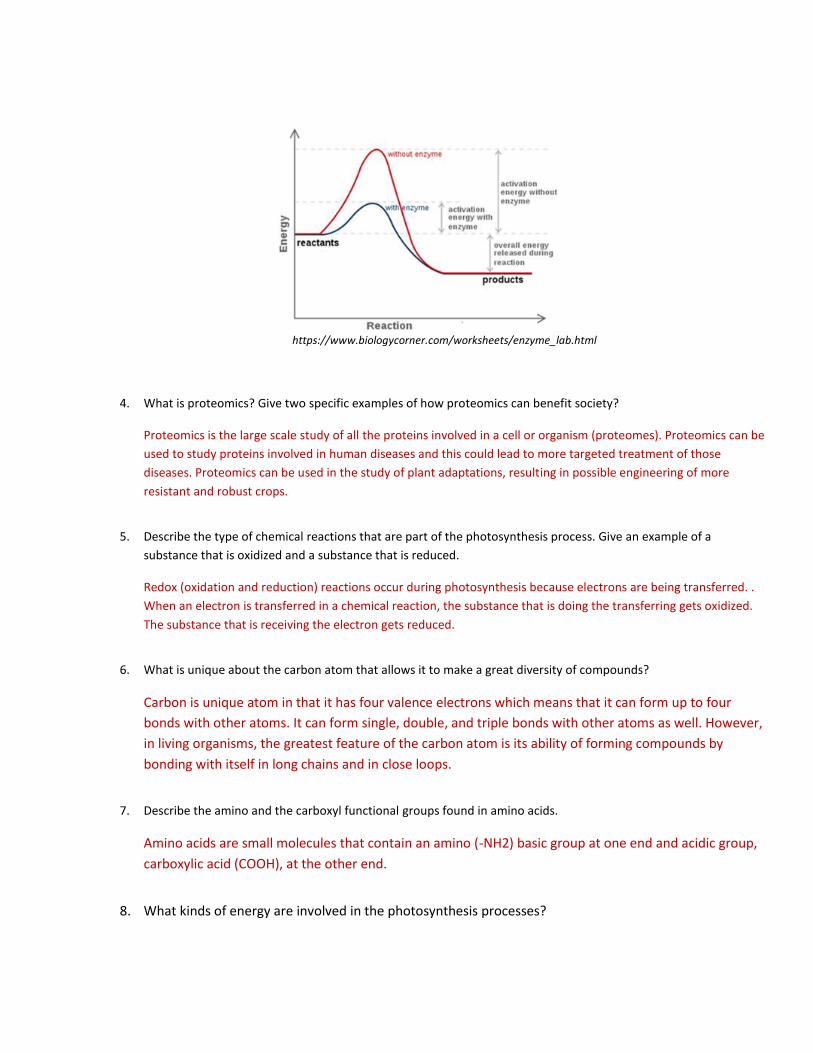
3. Draw an energy diagram representing the uncatalyzed reaction and then drawn the catalyzed reaction path in the same
graph. Identify what is difference between the catalyzed and uncatalyzed reactions.

4. What is proteomics? Give two specific examples of how proteomics can benefit society?
5. Describe the type of chemical reactions that are part of the photosynthesis process. Give an example of a substance
that is oxidized and a substance that is reduced.
6. What is unique about the carbon atom that allows it to make a great diversity of compounds?
7. Describe the amino and the carboxyl functional groups found in amino acids.
8. What kinds of energy are involved in the photosynthesis processes?
9. Use a graphic organizer to describe the steps in the photosynthesis processes.
10. How could biotechnology help plants adapt to hotter climate and higher temperatures?

TEACHER PAGES: ANSWER KEY- LOOKING THROUGH A FATHER’S EYES WORKSHEET
Name: Date: Home group members:
1. Prepare a graphic representation of the processes on transcription and translation. Write a short paragraph of the
sequence of steps that results in the expression of genes.
Any type of organizer will be valid as long as all the key steps are presented. Example organizer:
Transcription, the copying of the genetic DNA code, in the nucleus results in a messenger RNA molecule
which then moves to the cytoplasm of the cell. The RNA codon is then translated into an amino acid
sequence of a protein in the cell ribosome.
2. How are proteins synthesized? What is the similarity and differences of a protein synthesis and protein hydrolysis?
Proteins are synthesized in cells in the ribosomes. . The code for which amino acid to string together is
dictated by the message RNA codon. Different amino acids are strung together in a chemical reaction
where peptide bonds are formed between amino acids The reaction involves the formation of a chemical
bond between the acidic end of one amino acid and the basic end of another amino acid. In the
formation of a peptide bond, a water molecule is released. In a hydrolysis reaction, a water molecule is
added across the peptide bond to brake the bond.
3. Draw an energy diagram representing the uncatalyzed reaction and then drawn the catalyzed reaction path in the
same graph. Identify what is difference between the catalyzed and uncatalyzed reactions.
In a catalyzed reaction, the requirements for the energy needed to start a reaction is lower than in the uncatalyzed
reaction.
The nucleus of the cell contains the
genetic code in the DNA molecule
Transcription of the DNA codes results in
the synthesis of a messenger RNA
(mRNA) molecule
mRNA molecules leaves the nucleus of the cell and travels to the ribosomes.
Amino acids are put together in the order
dictated by the mRNA molecule.
Protein is synthesized
https://www.biologycorner.com/worksheets/enzyme_lab.html
4. What is proteomics? Give two specific examples of how proteomics can benefit society?
Proteomics is the large scale study of all the proteins involved in a cell or organism (proteomes). Proteomics can be
used to study proteins involved in human diseases and this could lead to more targeted treatment of those
diseases. Proteomics can be used in the study of plant adaptations, resulting in possible engineering of more
resistant and robust crops.
5. Describe the type of chemical reactions that are part of the photosynthesis process. Give an example of a
substance that is oxidized and a substance that is reduced.
Redox (oxidation and reduction) reactions occur during photosynthesis because electrons are being transferred. .
When an electron is transferred in a chemical reaction, the substance that is doing the transferring gets oxidized.
The substance that is receiving the electron gets reduced.
6. What is unique about the carbon atom that allows it to make a great diversity of compounds?
Carbon is unique atom in that it has four valence electrons which means that it can form up to four
bonds with other atoms. It can form single, double, and triple bonds with other atoms as well. However,
in living organisms, the greatest feature of the carbon atom is its ability of forming compounds by
bonding with itself in long chains and in close loops.
7. Describe the amino and the carboxyl functional groups found in amino acids.
Amino acids are small molecules that contain an amino (-NH2) basic group at one end and acidic group,
carboxylic acid (COOH), at the other end.
8. What kinds of energy are involved in the photosynthesis processes?
Light energy is transformed into chemical energy.
9. Use a graphic organizer to describe the steps in the photosynthesis processes.
Any type of organizer will be valid as long as all the key steps are presented. Example organizer:
10. How could biotechnology help plants adapt to hotter climate and higher temperatures?
Proteins involved in the regulatory processes that drive plants to adapt to environmental hardships can be identified and the genes coding for those proteins can be determined. Biotechnology can then be used further to engineer and optimize crops under changing environmental field conditions.
Enery from the sun is absorbed by chlorophyl pigments in plant leaves, removing electrons
from the pigment.
The freed electron starts a series of redox reactions during the ligh-dependent phase. The products from this reactions are oxygen gas, hydrogen ions, and high energy ATP and
NADH+
ATP and NADH+ are unsed in the light-independent phase. Here carbon dioxide from the atmosphere is used to make the precursor
compounds that eventally manufacture glucose and other carbohydrates

TEACHER PAGES: SECTION NAME CARDS
Copy and cut. Distribute one card per student. (Laminate for repeated use.)
Plant Adaptation Plant Adaptation
Plant Adaptation Plant Adaptation
Plant Adaptation Plant Adaptation
Plant Adaptation Plant Adaptation
Proteins Proteins
Proteins Proteins
Proteins Proteins
Proteins Proteins

Teacher Page: Section Cards, second page
Copy and cut. Distribute one card per student. (Laminate for repeated use.)
Proteomes Proteomes
Proteomes Proteomes
Proteomes Proteomes
Proteomes Proteomes
Photosynthesis Photosynthesis
Photosynthesis Photosynthesis
Photosynthesis Photosynthesis
Photosynthesis Photosynthesis

LESSON TWO-A: WHAT IS YOUR COLOR? - BEER-LAMBERT’S LAW
KEY/ESSENTIAL QUESTION(S): How does light interact with matter? What is a spectrophotometer used for?
OVERALL TIME ESTIMATE:
Advanced Preparation: 30 minutes
Student Procedure: 50 minutes. o Students should complete the phet.colorado.com assignment outside the classroom and come
prepared with the answers to the questions in the Student Worksheet: BEER’S LAW ASSIGNMENT, USING PHET SIMULATION. Alternatively, the phet simulation can be done in class. This will add another 45 minutes to this activity.
o Spectrophotometer or colorimeter must be turned on and be ready for measurement as specified by vendor.
o If the spectrophotometer or colorimeter is coupled to a software system (like the Pasco Colorimeter 2121 and the Spark software), students should be familiar with the software system prior to doing this activity.
LEARNING STYLES: Visual, auditory, and kinesthetic. VOCABULARY: adopted from http://www.dictionary.com/browse/absorbance?s=t
Beer’s Law - also known as the Beer–Lambert law relates the attenuation of light to the properties of the material through which the light is traveling
Transmittance - the ratio of the amount of light (energy) transmitted through and emerging from a body to the total light (energy) incident on it: equivalent to one minus the absorbance
Absorbance - the capacity of a substance to absorb radiation (light), expressed as the common logarithm of the reciprocal of the transmittance of the substance
Standard Solution - A solution of known concentration, used as a standard of comparison or analysis
Supernatant - floating above or on the surface
Assay – test or analysis
LESSON SUMMARY: Part A: The students learn about Beer’s Law which allows them to measure concentrations of solutes in solution based on spectroscopy. Part B: This technique is then used to determine the concentration of leaf proteins in a sample extract. STUDENT LEARNING OBJECTIVES: The student will be able to...
1. Identify key factors in Beer’s Law and light absorption based on a simulation program from http://phet.colorado.edu/sims/html/beers-law-lab/latest/beers-law-lab_en.html Internet access is necessary.
2. Prepare and test absorbance of five standards of known concentration, given a stock solution. 3. Determine the mathematical relationship between absorption and concentration of the blue dye standard
solutions 4. Test the absorbance of two sport drinks, containing the same food coloring as on the standard solutions. 5. Test the absorbance of an unknown solution provided by the teacher. 6. Determine the molar concentration of the two sport drinks and the teacher-provided unknown solutions.
STANDARDS: SC.912.N.1.5 SC.912.N.1.6 SC.912.N.1.7 AP CHEM LO 2.10 AP CHEM LO 5.10 SC.912.N.3.3 AP CHEM LO 1.15 AP CHEM LO 1.16 SC.912.N.3.5 MATERIALS:
1. Spectrophotometer or colorimeter (example: Pasco Colorimeter 2121 or Spec 20) 2. Distilled water 3. Pipets for dilutions 4. Test tube rack 5. Five Test tubes 20 X 150 mm (approximate size – must hold 10 mL minimum) 6. Vortex (not necessary) 7. Two different brand sport drinks (blue color) 8. Teacher-provided unknown sample 9. Parafilm paper or equivalent (to cover test tubes and conduct appropriate mixing, if vortex is not
available) 10. Water-proof markers to mark test tubes 11. Cuvettes 12. 10 mL graduated cylinder 13. Lint-free tissues 14. Graphing program, preferable with best fit line capability for students to create a graphical representation
of standard solutions. 15. Calculator
BACKGROUND INFORMATION: (adapted from https://cheo.pbworks.com/w/file/87391546/NANSLO_beer_lambert_law_NANSLO_lab_activity_last_update_October_8_2014.docx)
Food dyes are used in many products to enhance or provide colors that make foods and drinks more appealing or
unique in some way. Sports drinks come in a wide variety of colors in an attempt to appeal to different consumer
groups. Food colorings are used in very small quantities and provide no nutritional value at all. Because these
molecules contain light-absorbing features, which absorb visible light very strongly, even a small amount of food
coloring can result in very strong colors.
Anything that absorbs light can be quantified by using the Beer-Lambert Law, also sometimes just called “Beer’s
Law”:
A=abc
Where A=Absorbance (unitless); a = molar absorptivity (molarity-1
∙cm-1
), which is a constant for the absorbing species, b = path length, or thickness of the absorbing layer of a solution (cm), and c = concentration of the solution (molarity).
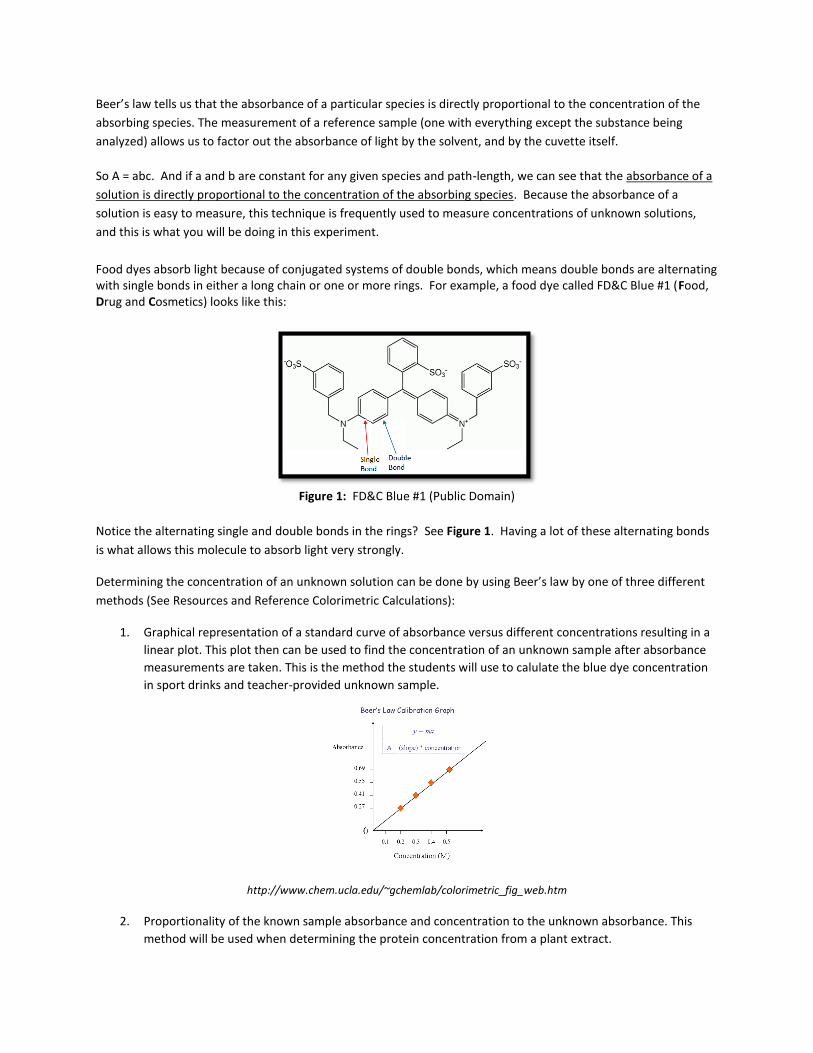
Beer’s law tells us that the absorbance of a particular species is directly proportional to the concentration of the
absorbing species. The measurement of a reference sample (one with everything except the substance being
analyzed) allows us to factor out the absorbance of light by the solvent, and by the cuvette itself.
So A = abc. And if a and b are constant for any given species and path-length, we can see that the absorbance of a
solution is directly proportional to the concentration of the absorbing species. Because the absorbance of a
solution is easy to measure, this technique is frequently used to measure concentrations of unknown solutions,
and this is what you will be doing in this experiment.
Food dyes absorb light because of conjugated systems of double bonds, which means double bonds are alternating with single bonds in either a long chain or one or more rings. For example, a food dye called FD&C Blue #1 (Food, Drug and Cosmetics) looks like this:
Figure 1: FD&C Blue #1 (Public Domain)
Notice the alternating single and double bonds in the rings? See Figure 1. Having a lot of these alternating bonds
is what allows this molecule to absorb light very strongly.
Determining the concentration of an unknown solution can be done by using Beer’s law by one of three different
methods (See Resources and Reference Colorimetric Calculations):
1. Graphical representation of a standard curve of absorbance versus different concentrations resulting in a
linear plot. This plot then can be used to find the concentration of an unknown sample after absorbance
measurements are taken. This is the method the students will use to calulate the blue dye concentration
in sport drinks and teacher-provided unknown sample.
http://www.chem.ucla.edu/~gchemlab/colorimetric_fig_web.htm
2. Proportionality of the known sample absorbance and concentration to the unknown absorbance. This
method will be used when determining the protein concentration from a plant extract.

3. Beer’s Law mathematical equation, A = a b c. To use this equation, the path length of the cuvette and the
molar absorptivity of the colored substance must be known.
ADVANCE PREPARATION: 1. Prepare a 0.040% stock solution in water of blue food coloring obtained from any manufacturing
company. Add 1.0 mL of pure blue food coloring in a total volume of 1000 mL. This is a super stock solution. Then take 4.0 mL of the super stock solution and dilute to 1000 mL with water. This solution is the stock solution that the students will use.
2. Obtain two different brand of blue sport drink. Read the labels and make sure the blue dye used is the same as the blue dye found in your food coloring standards. The most commonly use blue dye is Blue #1.
3. Prepare an unknown sample for students to test by diluting your stock blue dye solution. Best to dilute the stock to a final concentration between 0.0032% and 0.0024%.
PROCEDURE AND DISCUSSION QUESTIONS WITH TIME ESTIMATES:
1. Make copies of the Student Sheet – Beer’s Law phet Simulation. Students should complete the phet.colorado.com assignment outside the classroom and come prepared with the answers to the questions in the Student Worksheet: BEER’S LAW ASSIGNMENT, USING PHET SIMULATION.
2. Instrument must be turned on to read absorbance at 630 nm and be ready for measurement as specified by vendor.
3. (10 minutes) Go over the answers to the simulation questions. Students should be able to arrive at the correct answers of questions 5 and 6. These two questions lead to the mathematical formula used in Beer’s Law: A=abc Where A=Absorbance (unitless); a = molar absorptivity (molarity-1∙cm-1), which is a constant for the absorbing species, b = path length, or thickness of the absorbing layer of a solution (cm), and c = concentration of the solution (molarity). Present a linear plot of Absorbance versus concentration and ask students to determine what information is found on the slope of this line (the slope = a*b). By plotting the data of Absorbance versus Concentration, the molar absorptivity of a substance is not required to determine the concentration of an unknown solution containing the same solute as the standards.
4. (5 minutes) Review how to prepare dilutions from a stock solution and how to calculate final concentrations.
5. Students should be grouped to conduct the experiment. Groups of 3 or 4 students will work nicely for this activity.
6. Provide each group with 30 mL of stock blue food coloring dye. Provide students a copy of Student Page: BEER’S LAW Student Worksheet: DATA SHEET – BLUE FOOD COLORING IN SPORTS DRINK. They will use this sheet to input data.
7. (10 min) Students must dilute the stock solutions to prepare 5 diluted standards as specified in the data collection sheet.
8. (15 min) Students must place distilled water in the cuvette to zero the instrument. This will be followed by the absorbance reading of all the standards. Students can make the reading of the two sport drinks as well as the teacher-provided unknown at this time as well.

9. Sport drink blue dye concentrations are very high to read the absorbance directly without any prior dilution. Guide students to recognize this by pointing out the color of the sport drinks compared to the colors of the standard solutions. Teacher can point this out as she is circulating around the laboratory to ensure students are engaged. See Teacher’s Sheet. Probing Question – Assessing for Understanding.
10. (10 minutes) Students should clean up their working stations. Graphing of data can be done in the
classroom if computers area available with graphing software. Determination of unknown concentrations can be obtain from the graphed standard information. Alternatively, students can take their data home and do the graphing and unknown concentration determination as homework.
ASSESSMENT SUGGESTIONS:
Student can be assessed by checking their answers to the questions from the phet simulation activity. See the TEACHER’S PAGE: BEER’S LAW – ANSWERS. STUDENT WORKSHEET: BEER’S LAW ASSIGNMENT, USING PHET SIMULATION
Assessment for accuracy of measurements can be done by accepting approximately 80% accuracy on the teacher-provided unknown sample student-calculated concentration.
Teacher can assess understanding as students are conducting their laboratory activity. See Teacher’s Sheet. Assessing for Understanding.
EXTENSIONS: ACTIVITIES:
1. Students can calculate Molarities instead of Percentages to measure concentrations. Concentration for commercial food coloring is approximately 0.026 M.
2. For students that do not have access to the internet at home, the teacher could print the information found in the Beer’s Law tutorial web page (see Resources/References) and provide that information in the form of a handout for the students to review prior to conducting the this activity.
3. The determination of the sport drink blue dye concentration can be introduced to the students as a ‘real scenario’ with the situation presented to them in a letter from the principal. See Teacher’s Page: Beer’s Law. Letter from the Principal Guided Inquiry. Student might need guidance in the calculations necessary to answer the questions posed in this activity.
4. A whole class data sharing of the concentrations of blue food coloring can be done by having all groups post their data on the front board. Mathematical average and each group % deviation from the average can be calculated. This will generate discussion about accuracy and precision of measurements.
RESOURCES/REFERENCES:
Beer’s Law Simulation: http://phet.colorado.edu/en/simulation/beers-law-lab
Beer’s Law tutorial: http://chemwiki.ucdavis.edu/Core/Physical_Chemistry/Spectroscopy/Electronic_Spectroscopy/Electronic_Spectroscopy_Basics/The_Beer-Lambert_Law
Background Beer’s Law: http://www.seattlecentral.edu/faculty/tschultz/161LabBeersLaw.pdf
Background Beer’s Law: http://phs.princetonk12.org/teachers/rcorell/GatoraideLab.pdf
Colorimetric calculations: http://www.chem.ucla.edu/~gchemlab/colorimetric_web.htm
Pasco probe tutorial: ftp://ftp.pasco.com/Training/ACSD/Teacher%20Guides/Concentration%20of%20a%20Solution%20TN.pdf
Vernier probe tutorial: http://www2.vernier.com/sample_labs/CHEM-A-17-COMP-beers_law.pdf

STUDENT PAGE: WHAT IS YOUR COLOR? – BEER-LAMBERT’S LAW
STUDENT WORKSHEET: BEER’S LAW ASSIGNMENT, USING PHET SIMULATION
Name: Date:
1. Take a minute to explore the sim (http://phet.colorado.edu/en/simulation/beers-law-lab). Go to the Beer’s
Law tab and use the virtual spectrophotometer in the Beer’s Law tab.
2. Wavelength selection:
a. Select the blue solution of copper (II) sulfate and move the concentration bar to increase or decrease
the concentration of the blue solution. Notice what happens to the absorbance as you move the
concentration up and down.
b. Select the red drink mix. What wavelength does the virtual spectrophotomer selects when you select
the blue solution?
c. Select any other color solution. What wavelength does the virtual spectrophotomer selects when you
select the blue solution?
d. Look at the color wheel below (found at http://www.cengage.com/school/corpview/Mission-
CriticalFunctions/CorpCommunications/color.htm)
e. What can you conclude regarding the selection of wavelength and the color of the solution to be
tested?
3. Concentration effects:
a. Go back to the blue color solution and adjust the concentration by moving the sliding the blue knob
at the bottom right.
b. Note the values of absorbance as you change concentration.
c.
d. Select reading of transmittance. Repeat changing of concentrations and note what happens to the
transmittance values and the concentration is changed.

e. What can you conclude regarding the concentration of your sample with respect to absorbance and
transmittance?
4. Length of the cuvette (small container where the testing solution is placed):
a. Use the small ruler to measure the cuvette width.
b. Leave the concentration of the blue solution set at a given point.
c. Make measurements of absorbance.
d. With the large yellow arrow, change the width of the cuvette to a small value and see what happened
to the absorbance reading.
e. With the large yellow arrow, change the width of the cuvette to a larger value and see what
happened to the absorbance reading.
f. What can you conclude regarding the width of the cuvette and the reading of absorbance for a given
concentration of a solution?
5. What is the mathematical relationship (direct or indirect) between the concentration of a solution and its
absorbance at a given wavelength? What is happening at the particulate level that will explain this
observation?
6. 6. What is the mathematical relationship (direct or indirect) between the width of the cuvette (path length)
and width of the measured absorbance at a given wavelength? What is happening at the particulate level that
will explain this observation?

TEACHER’S PAGE: WHAT IS YOUR COLOR? – BEER-LAMBERT’S LAW
STUDENT WORKSHEET: BEER’S LAW ASSIGNMENT, USING PHET SIMULATION- ANSWERS
Name: Date:
1. Take a minute to explore the sim (http://phet.colorado.edu/en/simulation/beers-law-lab). Go to the
Beer’s Law tab and use the virtual spectrophotometer in the Beer’s Law tab.
2. Wavelength selection:
a. Select the red drink mix. What wavelength does the virtual spectrophotomer selects when you
select the blue solution?
Instruments selects 508 nm (green light).
b. Select the red drink mix. What wavelength does the virtual spectrophotomer selects when you
select the blue solution?
Instruments selects 780 nm (reddish brown light).
c. Select any other color solution. What wavelength does the virtual spectrophotomer selects when
you select the blue solution?
Answers will vary
d. Look at the color wheel below (found at http://www.cengage.com/school/corpview/Mission-
CriticalFunctions/CorpCommunications/color.htm)
e. What can you conclude regarding the selection of wavelength and the color of the solution to be
tested?
The wavelength selected to read a colored substance is the wavelength of the color the
substance ABSORB, not the color of the wavelength of the emitted color.
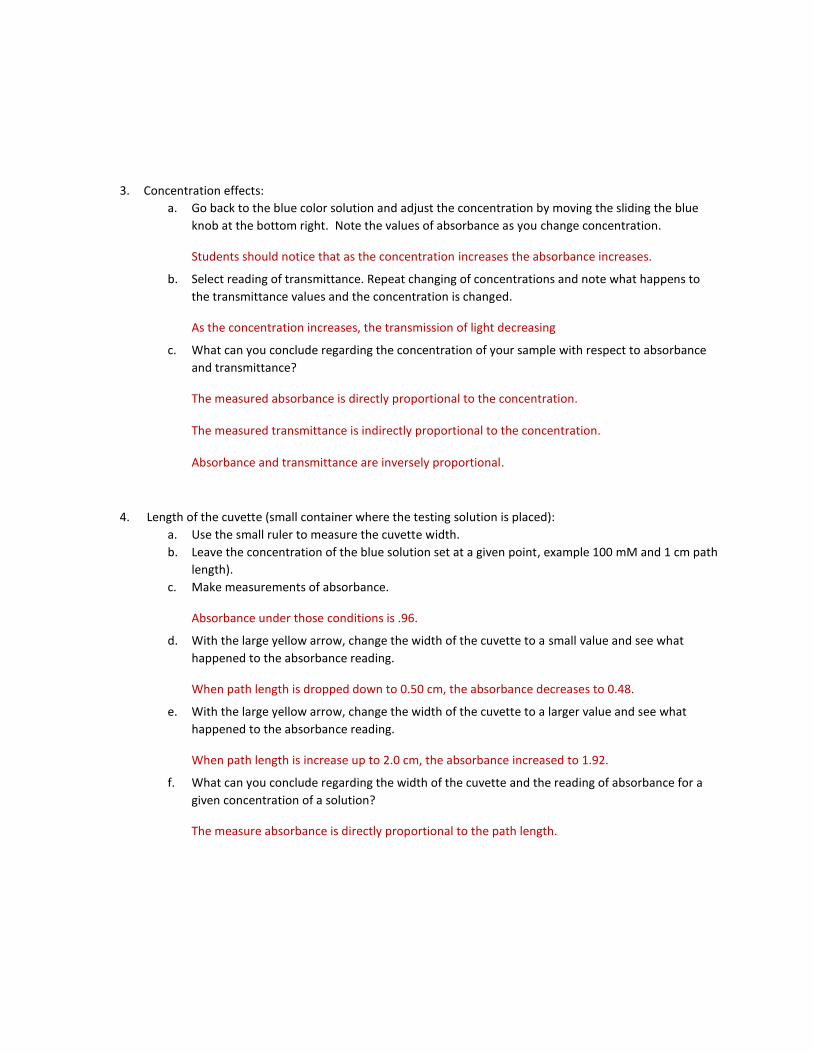
3. Concentration effects:
a. Go back to the blue color solution and adjust the concentration by moving the sliding the blue
knob at the bottom right. Note the values of absorbance as you change concentration.
Students should notice that as the concentration increases the absorbance increases.
b. Select reading of transmittance. Repeat changing of concentrations and note what happens to
the transmittance values and the concentration is changed.
As the concentration increases, the transmission of light decreasing
c. What can you conclude regarding the concentration of your sample with respect to absorbance
and transmittance?
The measured absorbance is directly proportional to the concentration.
The measured transmittance is indirectly proportional to the concentration.
Absorbance and transmittance are inversely proportional.
4. Length of the cuvette (small container where the testing solution is placed):
a. Use the small ruler to measure the cuvette width.
b. Leave the concentration of the blue solution set at a given point, example 100 mM and 1 cm path
length).
c. Make measurements of absorbance.
Absorbance under those conditions is .96.
d. With the large yellow arrow, change the width of the cuvette to a small value and see what
happened to the absorbance reading.
When path length is dropped down to 0.50 cm, the absorbance decreases to 0.48.
e. With the large yellow arrow, change the width of the cuvette to a larger value and see what
happened to the absorbance reading.
When path length is increase up to 2.0 cm, the absorbance increased to 1.92.
f. What can you conclude regarding the width of the cuvette and the reading of absorbance for a
given concentration of a solution?
The measure absorbance is directly proportional to the path length.

5. What is the mathematical relationship (direct or indirect) between the concentration of a solution and its
absorbance at a given wavelength? What is happening at the particulate level that will explain this
observation?
Mathematically, there is a direct relationship between concentration of the solution and the measured
absorbance at a given wavelength.
At the particulate level, as the concentration increases, there is more solute particles that will then absorb
more of the incoming light. This results in a higher measured absorbance.
6. What is the mathematical relationship (direct or indirect) between the width of the cuvette (path length)
and width of the measured absorbance at a given wavelength? What is happening at the particulate level
that will explain this observation?
Mathematically, there is a direct relationship between width of the cuvette (path length) and the
measured absorbance at a given wavelength.
At the particulate level, as the path of the incoming light (path length) gets longer, there is more solute
particles that will then absorb more of the incoming light. This results in a higher measured absorbance.
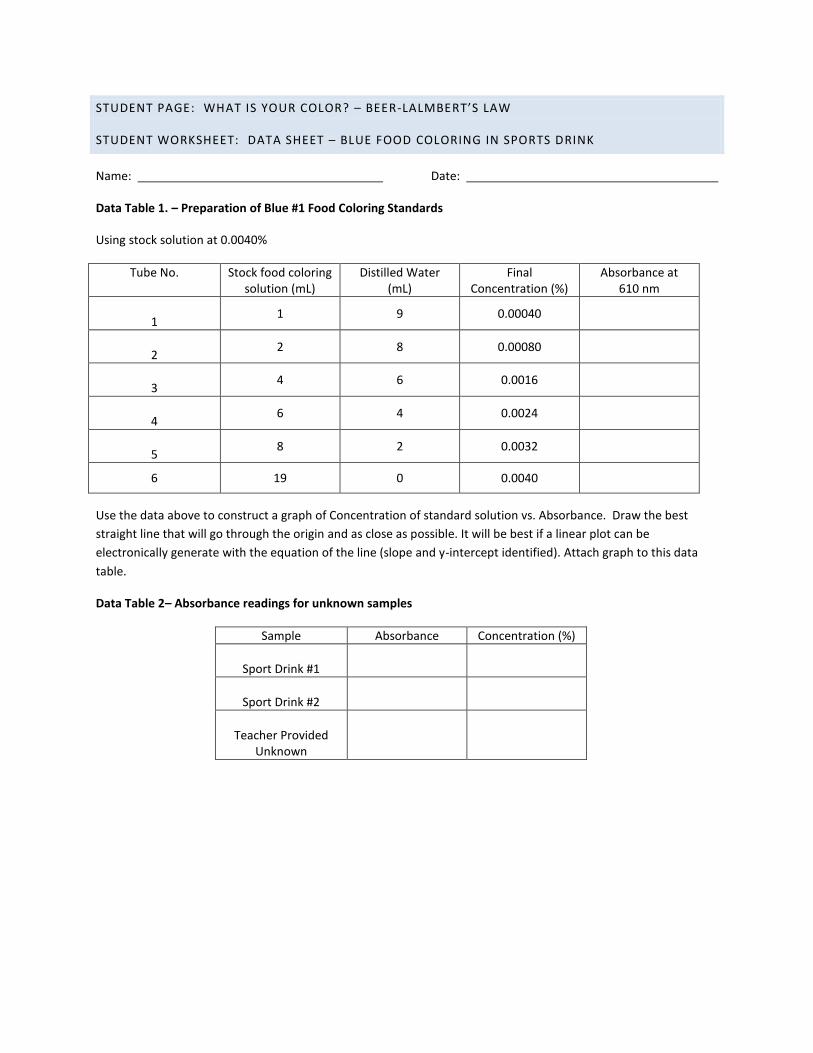
STUDENT PAGE: WHAT IS YOUR COLOR? – BEER-LALMBERT’S LAW
STUDENT WORKSHEET: DATA SHEET – BLUE FOOD COLORING IN SPORTS DRINK
Name: Date:
Data Table 1. – Preparation of Blue #1 Food Coloring Standards
Using stock solution at 0.0040%
Tube No. Stock food coloring solution (mL)
Distilled Water (mL)
Final Concentration (%)
Absorbance at 610 nm
1
1 9 0.00040
2
2 8 0.00080
3
4 6 0.0016
4
6 4 0.0024
5
8 2 0.0032
6 19 0 0.0040
Use the data above to construct a graph of Concentration of standard solution vs. Absorbance. Draw the best
straight line that will go through the origin and as close as possible. It will be best if a linear plot can be
electronically generate with the equation of the line (slope and y-intercept identified). Attach graph to this data
table.
Data Table 2– Absorbance readings for unknown samples
Sample Absorbance Concentration (%)
Sport Drink #1
Sport Drink #2
Teacher Provided
Unknown
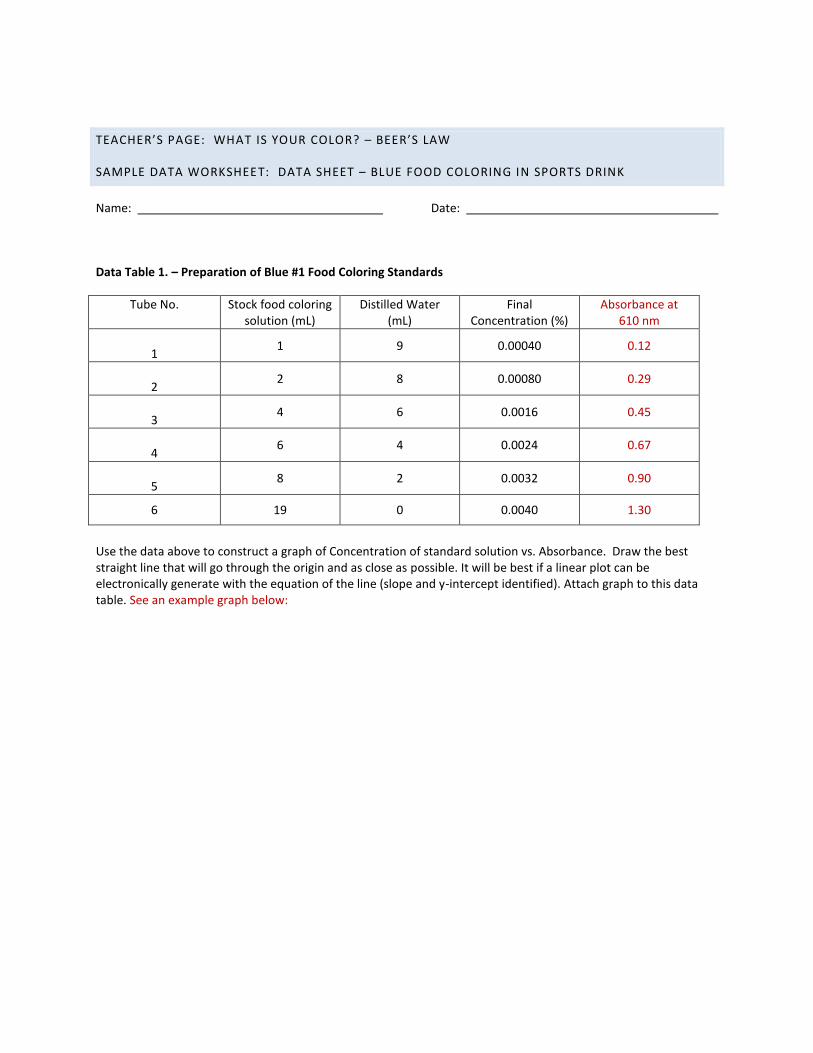
TEACHER’S PAGE: WHAT IS YOUR COLOR? – BEER’S LAW
SAMPLE DATA WORKSHEET: DATA SHEET – BLUE FOOD COLORING IN SPORTS DRINK
Name: Date:
Data Table 1. – Preparation of Blue #1 Food Coloring Standards
Tube No. Stock food coloring solution (mL)
Distilled Water (mL)
Final Concentration (%)
Absorbance at 610 nm
1
1 9 0.00040 0.12
2
2 8 0.00080 0.29
3
4 6 0.0016 0.45
4
6 4 0.0024 0.67
5
8 2 0.0032 0.90
6 19 0 0.0040 1.30
Use the data above to construct a graph of Concentration of standard solution vs. Absorbance. Draw the best straight line that will go through the origin and as close as possible. It will be best if a linear plot can be electronically generate with the equation of the line (slope and y-intercept identified). Attach graph to this data table. See an example graph below:
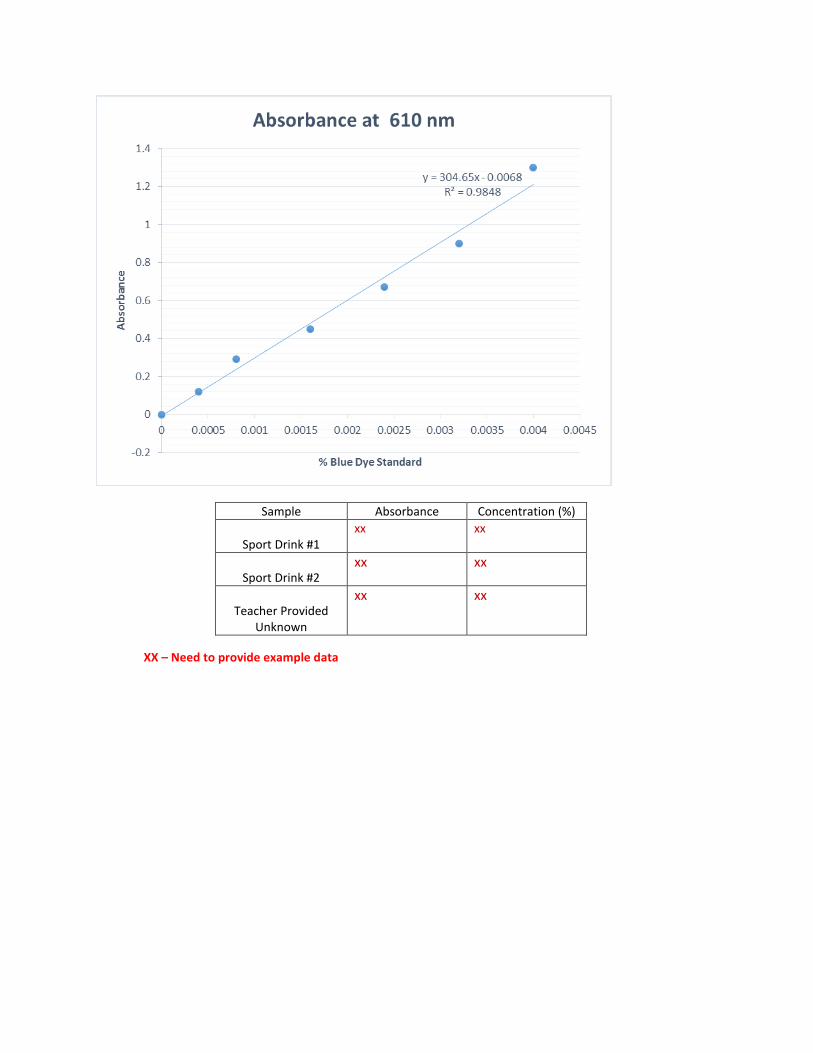
Sample Absorbance Concentration (%)
Sport Drink #1
xx
xx
Sport Drink #2
xx xx
Teacher Provided
Unknown
xx xx
XX – Need to provide example data
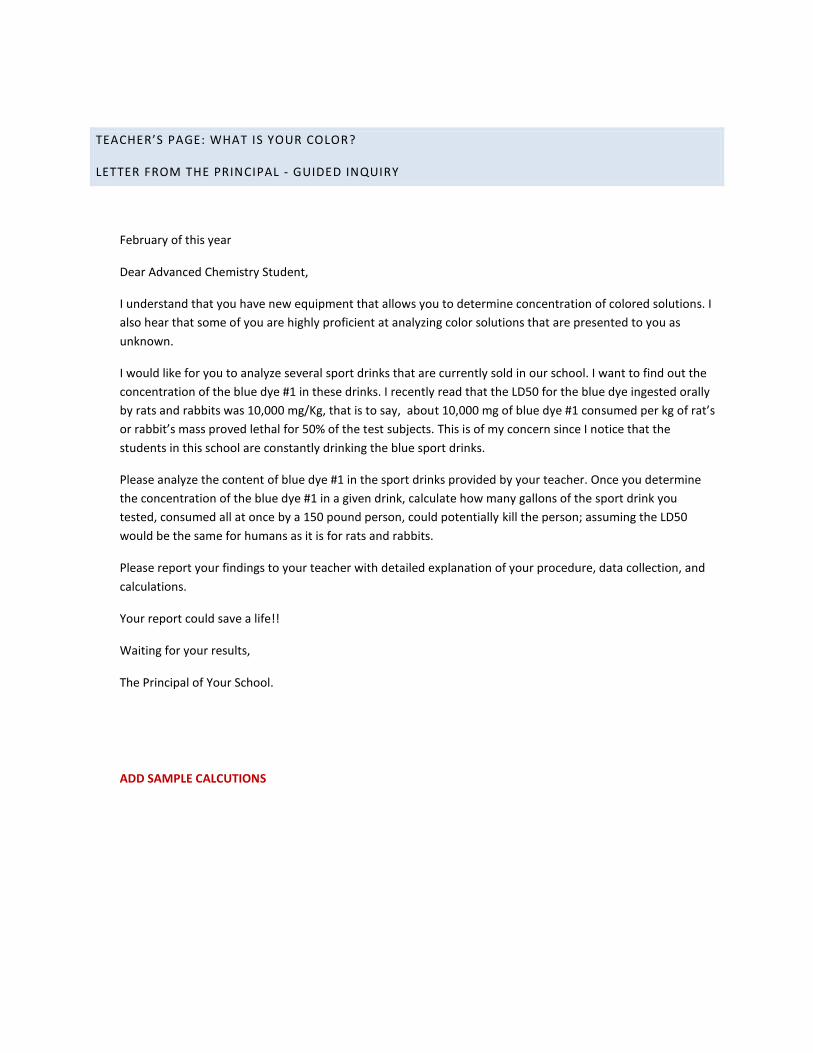
TEACHER’S PAGE: WHAT IS YOUR COLOR?
LETTER FROM THE PRINCIPAL - GUIDED INQUIRY
February of this year
Dear Advanced Chemistry Student,
I understand that you have new equipment that allows you to determine concentration of colored solutions. I
also hear that some of you are highly proficient at analyzing color solutions that are presented to you as
unknown.
I would like for you to analyze several sport drinks that are currently sold in our school. I want to find out the
concentration of the blue dye #1 in these drinks. I recently read that the LD50 for the blue dye ingested orally
by rats and rabbits was 10,000 mg/Kg, that is to say, about 10,000 mg of blue dye #1 consumed per kg of rat’s
or rabbit’s mass proved lethal for 50% of the test subjects. This is of my concern since I notice that the
students in this school are constantly drinking the blue sport drinks.
Please analyze the content of blue dye #1 in the sport drinks provided by your teacher. Once you determine
the concentration of the blue dye #1 in a given drink, calculate how many gallons of the sport drink you
tested, consumed all at once by a 150 pound person, could potentially kill the person; assuming the LD50
would be the same for humans as it is for rats and rabbits.
Please report your findings to your teacher with detailed explanation of your procedure, data collection, and
calculations.
Your report could save a life!!
Waiting for your results,
The Principal of Your School.
ADD SAMPLE CALCUTIONS
LESSON TWO-B: WHAT IS YOUR COLOR? - PROTEIN EXTRACTION AND CONCENTRATION
DETERMINATION
KEY/ESSENTIAL QUESTION(S): How could light and matter interactions be used for a practical application? What are the first steps in proteomic studies?
OVERALL TIME ESTIMATE:
Advanced Preparation: 30 minutes
Student Procedure: 50 - 60 minutes. LEARNING STYLES: Visual, auditory, and kinesthetic. VOCABULARY: See Vocabulary from LESSON TWO-A LESSON SUMMARY: Part A: The students learn about Beer’s Law which allows them to measure concentrations of solutes in solution based on spectroscopy. Part B: This technique is then used to determine the concentration of leaf proteins in a sample extract. STUDENT LEARNING OBJECTIVES: The student will be able to...
1. Extract proteins from plant leaves. 2. Determine the concentration of proteins in plant extract by conducting a colorimetric determination
as previously done with the sport drink. They will use a protein standard (Bovine Serum Albumin, BSA) stained with the Bradford Reagent instead of the food coloring stock.
STANDARDS: See Vocabulary from LESSON TWO-A MATERIALS:
1. Pipettors and appropriate size tips 2. Conical micro test tubes and test tube rack 3. Colorimeter or Spectrophotometer 4. Cuvettes 5. Lint-free tissue 6. Pierce Coomassie Plus Bradford Reagent (ThermoFisher catalog# 23238) 7. Bovine Serum Albumin (BSA) 8. Balance 9. Vortex (not necessary) 10. Parafilm paper or equivalent (to cover test tubes and conduct appropriate mixing, if vortex is not
available) 11. Water-proof markers to mark test tubes 12. Calculator 13. Centrifuge 14. Distilled water 15. Extraction Buffer*:
a. Tris-HCl 1M buffer solution pH 7.5 (ThermoFisher catalog # 15567027) b. Dithiothreitol (DTT) (ThermoFisher catalog # PR-V3151)
c. Triton-X 100 (ThermoFisher catalog # M1122980101) 16. Protease Inhibitor Cocktail Tablets (ThermoFisher catalog#88266)
*Commercially available Plant Extraction Kits can be purchased to substitute the ingredients above. Example: ThermoFisher P-PER® Protein Extraction Kit catalog # 89803 or Sigma Protein Extraction Kit catalog # PE0230).
BACKGROUND INFORMATION
Proteins are part of all living organisms. The question is then, which organism do we study at the high school level to get the students introduced to the proteomics science?
In this lesson, plants are selected for many reasons. Plants area abundant, we can obtain plant samples just outside the classroom or in our own backyard or grocery store. They are diverse and have numerous types of proteins. We can set up control experiments to test different environmental variables (like temperature, light source, salinity, potential herbicides and even pathogens) and determine their effect on different plant species. A small supply of seeds can yield plants for several generations. Plants are relatively easy to maintain, monitor and sample. Plants like the ice plant (Mesembryanthemum crystallinum, family Aizoaceae) have developed mechanism of adaptation to environmental stresses like drought or pathogen infections. These adaptive mechanisms involve proteins and, even when many of the chemical reactions and pathways are known, there is a lot more that is yet to be clearly understood. How is it that some plants, like the ice plant, can adapt to drought conditions and in doing so change the mechanism of photosynthesis for better chance of survival? Identifying the proteins and proteomics of this plant could help us understand how exactly the adaptation process occurs. Identifying the genetic code that prescribes those proteins could lead to genetic engineering of more robust plants.
For these reasons, plants were selected as the model to use in this lesson. This lesson will have the students extract and analyze protein concentration of the extract. The method for analysis is a colorimetric assay using Coommassie Blue dye (Bradford).
ADVANCE PREPARATION:
1. Plan ahead of time to have sample ice plants, Aptenia cordifolia Aizoaceae, or other available plant with enough leaves (5-6) per group of students.
2. One day prior to this activity prepare Extraction Buffer (10 mL for each extraction) by mixing 400 uL of 1M Tris-HCl (pH 7.5), 10 uL DDT stock and add enough distilled water to make up to 10.0 mL.
3. If using a commercially available Protein Extraction Kit, the previous step will be omitted. You will follow the manufacturing instructions in preparing the extraction solution.
4. Prepare a working Bradford Reagent solution, following the instructions provided by the vendor.
PROCEDURE AND DISCUSSION QUESTIONS WITH TIME ESTIMATES:
1. Students will be working in groups of 2 or 3. Larger groups might have too many members to keep them engaged and on task.
2. (5 min) Ask students what will possible be the first step in studying proteins in living systems. Have a short
interactive discussion as to what would be the best system to study proteins, leading the students to the idea that plants can be a great starting point for doing protein analysis.
3. (5 minutes) Also through questioning, ask students what would be the first thing that needs to be done to
study proteins. Again, the idea is to guide the students to realize that the FIRST thing that must be done is to extract the proteins from the living system. After extractions, the students might not realize that it is important to determine protein concentration in your sample in order to conduct separation and purification. Teacher will provide guidance for the students to understand the importance of protein concentration determination.
4. Provide each student with a copy of the STUDENT PAGE: PROTEIN EXTRACTION AND CONCENTRATION
DETERMINATION and the STUDENT WORKSHEET: DATA SHEET
5. (15 minutes) Allow students to do the plant protein extraction procedure.
6. (15 minutes) Allow students to prepare the BSA standard solution (only two points) and perform the
Bradford assay.
7. (10 minutes) After data collection, students can perform indicated calculations.
8. (10 minutes) Optional – Overall class discussion of data can be done by allowing groups to present their %
Protein by mass of their samples.
9. Students can take home the STUDENT PAGE: WHAT IS YOUR COLOR STUDENT WORKSHEET: QUESTIONS tp answer the questions and be assessed.
ASSESSMENT SUGGESTIONS:
Student assessment can be done by evaluating their answers to the questions in STUDENT PAGE: WHAT IS YOUR COLOR STUDENT WORKSHEET: QUESTIONS
EXTENSIONS: ACTIVITIES:
1. If all students use the process the same plant, mathematical average and each group % deviation from the average can be calculated. This will generate discussion about accuracy and precision of measurements.
2. Students can be assigned to investigate the literature to determine the linearity range of the Bradford reagent with the BSA standard.
3. Students can compare the colorimetric assay with two different dyes (Food Coloring Blue #1 and Commassie Bradford). Students can present similarities and differences of the processes.
4. This lesson can be presented to students in a Guided Inquiry format, where the students can develop their protein method on their own, given certain reagents and equipment. This will add more time to the lesson since the students need to develop their design and the teacher must review their design protocols to ensure students are on target to meet the lesson objectives. The procedures in this lesson are all prescribed to ensure the lesson is covered in the time suggested.
5. The students, instead of the teacher, can prepare the buffers and all solutions required in the day prior to the lesson. This will add an additional day to this lesson, but will enhance the solution preparation skills of students and sharpen their mathematical skills.
6. Students can set up numerous investigations to study different variables that can affect the overall protein extraction yield (examples: age of plant, temperature, light exposure, amount of extraction buffer, time exposure to extraction buffer, etc.).
RESOURCES/REFERENCES:
Bradford Protein Assay: http://teaching.drnickmorris.com/2010/10/why-can-i-extrapolate-bradford-assay.html
Bradford Protein Assay: http://www.ncbi.nlm.nih.gov/pmc/articles/PMC3164080/
Plant Protein Extraction: http://www.mobitec.com/cms/products/bio/03_proteomics/total_protein_extraction_for_plant_tissues.html?pdf=SD-008_SN-009-2.pdf
Plant Protein Extraction: https://tools.thermofisher.com/content/sfs/manuals/MAN0011557_PPER_Plant_Protein_Extract_UG.pdf
BioVision Protein Extraction Kit: http://www.biovision.com/manuals/K296.pdf
Assay for Total Protein: http://www.ibt.lt/uploads/file/bvtl-2/assays_3.pdf
Extraction of Proteins from Plant Tissue: Contributed by William Laing and John Christeller Current Protocols in Protein Science (2004) 4.7.1-4.7.7 Copyright C 2004 by John Wiley & Sons, Inc.
Protein Expression and Purification: http://www.bio-rad.com/webroot/web/pdf/lse/literature/pepsi_hr_1665067.pdf
STUDENT PAGE: WHAT IS YOUR COLOR? - PROTEIN EXTRACTION AND CONCENTRATION
DETERMINATION
STUDENT WORKSHEET: PROTEIN EXTRACTION PROTOCOL AND COLORIMETRIC PROTEIN
DETERMINATION.
1 PROTEIN EXTRACTION - Follow the steps listed below to extract proteins from plant leaves (20 minutes)
a. Obtain 5 – 6 leaves of the ice plant provided by your teacher. Cut leaves that are equivalent in
size (about the same age).
b. Obtain the Extraction Buffer from your teacher. Add 1 tablet of the Protease Inhibitor Cocktail
tablet to 10mL of this buffer. Add 50 uL of TritonX-100 to the 10mL of Extraction Buffer. At this
point, the Extraction Buffer is ready to be used.
c. Place all leaves in a clean pre-weighted test tube.
d. Weight the test tube with the leaves and determine the mass of the leaves (should be between
0.5 to 1 gram of leaves).
e. Grind the leaves using a mortar and pestle xx?.
f. Cool a test tube in water. Also cool the spatula that you will use to transfer the ground leaves
into the tube.
g. Transfer all the sample into the tube.
h. Using a Pipettor, add 800 uL of Extraction Buffer (that has been kept in ice).
i. Keep the sample tubes in ice, while you constantly shake the mixture for 5 minutes.
Alternatively, vortex for 5 minutes.
j. Centrifuge at 1200 rpm for 10 minutes.
k. Remove supernatant without disturbing the pellet. Transfer to another labeled conical micro
tube. The supernatant will contain the extracted proteins. Proceed to the Protein Determination
section.
2 PROTEIN DETERMINATION
a. Set up spectrophotometer or colorimeter to 610 nm, as in Lesson Two – A.
b. Dilute the BSA stock solution to obtain 1ug/uL. Example: if BSA stock is 2mg/mL = 2 ug/uL, take
100 uL of stock and place in a micro tube then add 100 uL of water to have a final volume of 200
uL. This will result in a working standard of 1 ug/uL
c. Prepare duplicate samples of BSA standard and the plant protein extract (4 test tubes).
d. For each test tube, add
10 uL of either the standard (duplicate tubes) or the protein extract sample (duplicate tubes)
790 uL of distilled water
200 uL of Bradford Reagent
e. Mix all test tubes.
f. Transfer the content of each tube to a clean cuvette.
g. Measure absorbance at 610 nm.

3 CALCULATIONS
a. To determine the concentration of the protein extract, use the proportionality of absorbance and
concentration of the standard to the absorbance and concentration of the unknown.
C unknown = C standard/A standard (A unknown), where C = concentration and A= absorbance
b. Determine the total amount of protein extracted from the original sample:
Protein ug/uL = ug of protein in cuvette / 10 uL
c. Determine the percent of protein by mass of your sample:
[Total Protein (ug/uL) X total volume of extract] / mass of leaves prior to processing X 100
Samples Ready for Bradford Protein Analysis in Dr. Chen Laboratory – CPET SER 2016

STUDENT PAGE: WHAT IS YOUR COLOR? - PROTEIN EXTRACTION AND CONCENTRATION
DETERMINATION
STUDENT WORKSHEET: DATA SHEET
A. PROTEIN EXTRACTION
Mass Data Quantity
Test Tube alone (milligrams)
Test Tube + Plant Sample (milligrams)
Sample mass (milligrams)
Total supernatant volume after protein extraction (uL)
B. PROTEIN DETERMINATION (10uL of sample + 790 uL water + 200 ul Bradford Reagent)
Colorimetric Assay
Volume in Cuvette
(uL)
Absorbance at 610 nm
Amount in Cuvette (ug)
Total protein
(ug/uL) *
Average Total
Protein (ug/uL)
BSA standard #1 10 10 1 ug/uL
BSA standard #2 10 10 1 ug/uL x
Plant Extract #1 10
Plant Extract #2 10 x
C. Calculations
a. Plant Protein (ug) in 10 uL (in cuvette):
C unknown = C standard/A standard (A unknown), where C = concentration and A= absorbance

b. Total Protein in extraction sample:
Total Protein ug/uL = ug of protein in cuvette / 10 uL
c. Percent Protein by mass:
[Total Protein (ug/uL) X total volume of extract] / mass of leaves prior to processing X 100
STUDENT PAGE: WHAT IS YOUR COLOR?
STUDENT WORKSHEET: ASSESSING FOR UNDERSTANDING
1. Your colorimeter is set for orange (610 nm) What experiment could you do, what data would you collect, and
how would you analyze the data to ensure that 610 nm is the “best” setting for measuring the absorbance of
blue dye #1 in this experiment?
2. You are analyzing an unknown concentration of blue dye #1 solution. Fingerprint smudges are present on the
cuvette containing the solution placed into the colorimeter for analysis. How does this technique error affect
the calculated concentration of blue dye #1? [Hint: consider the amount of light reaching the detector.]
3. We cannot use a colorimeter to measure the amount of NaCl in a sample. Why?
4. What do you do if your sample has an absorbance greater than 2.0? What does it mean at the molecular level
if the solution absorbance is that high?
5. Beer’s Law is a mathematical model. Describe Beer’s Law and the parameters (variables) that it deals with.
Why is it called a mathematical model?
6. When extracting the proteins from plant cells, you used a buffer that allowed the non-protein components of
the plants to precipitate and allowed the proteins to be in the supernatant. Most proteins are considered to
be non-polar or hydrophobic. What can you deduct about the polarity of the extraction buffer? Is the
extraction of protein from living cells a chemical or a physical process? Support your answers with molecular
behavior – what is happening at the molecular level.
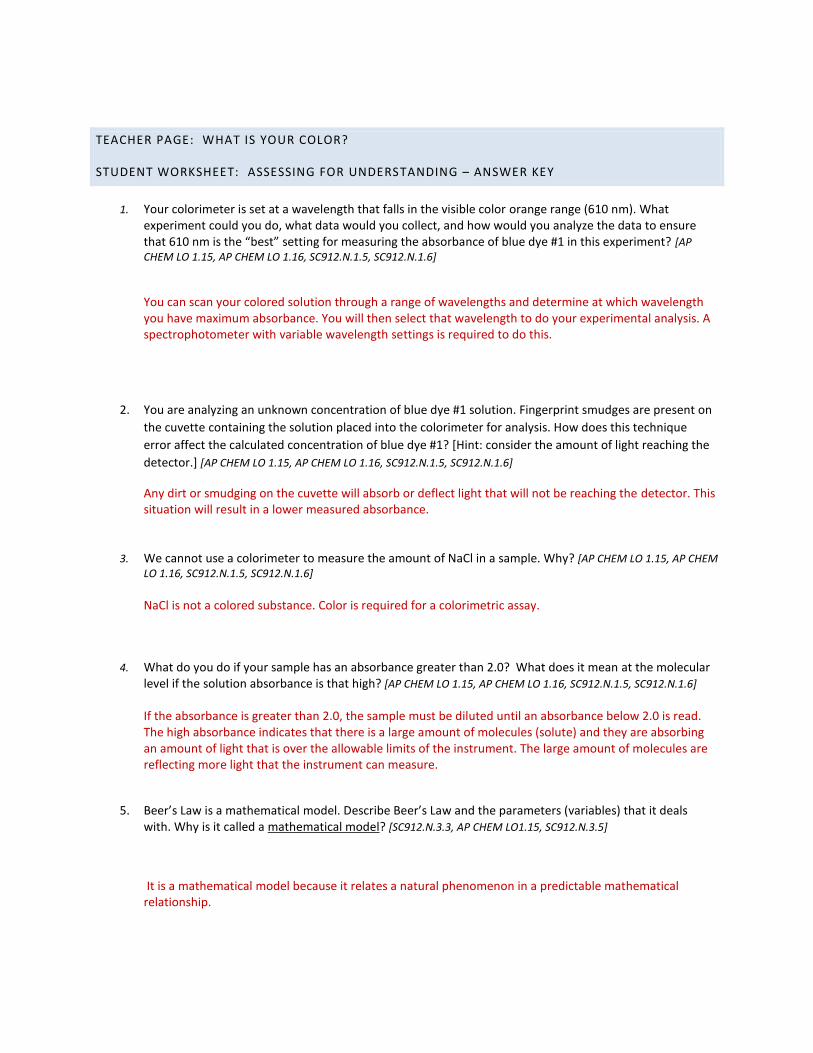
TEACHER PAGE: WHAT IS YOUR COLOR?
STUDENT WORKSHEET: ASSESSING FOR UNDERSTANDING – ANSWER KEY
1. Your colorimeter is set at a wavelength that falls in the visible color orange range (610 nm). What experiment could you do, what data would you collect, and how would you analyze the data to ensure that 610 nm is the “best” setting for measuring the absorbance of blue dye #1 in this experiment? [AP CHEM LO 1.15, AP CHEM LO 1.16, SC912.N.1.5, SC912.N.1.6]
You can scan your colored solution through a range of wavelengths and determine at which wavelength you have maximum absorbance. You will then select that wavelength to do your experimental analysis. A spectrophotometer with variable wavelength settings is required to do this.
2. You are analyzing an unknown concentration of blue dye #1 solution. Fingerprint smudges are present on
the cuvette containing the solution placed into the colorimeter for analysis. How does this technique
error affect the calculated concentration of blue dye #1? [Hint: consider the amount of light reaching the
detector.] [AP CHEM LO 1.15, AP CHEM LO 1.16, SC912.N.1.5, SC912.N.1.6]
Any dirt or smudging on the cuvette will absorb or deflect light that will not be reaching the detector. This situation will result in a lower measured absorbance.
3. We cannot use a colorimeter to measure the amount of NaCl in a sample. Why? [AP CHEM LO 1.15, AP CHEM LO 1.16, SC912.N.1.5, SC912.N.1.6]
NaCl is not a colored substance. Color is required for a colorimetric assay.
4. What do you do if your sample has an absorbance greater than 2.0? What does it mean at the molecular
level if the solution absorbance is that high? [AP CHEM LO 1.15, AP CHEM LO 1.16, SC912.N.1.5, SC912.N.1.6]
If the absorbance is greater than 2.0, the sample must be diluted until an absorbance below 2.0 is read. The high absorbance indicates that there is a large amount of molecules (solute) and they are absorbing an amount of light that is over the allowable limits of the instrument. The large amount of molecules are reflecting more light that the instrument can measure.
5. Beer’s Law is a mathematical model. Describe Beer’s Law and the parameters (variables) that it deals
with. Why is it called a mathematical model? [SC912.N.3.3, AP CHEM LO1.15, SC912.N.3.5]
It is a mathematical model because it relates a natural phenomenon in a predictable mathematical relationship.

A=abc
Where A=Absorbance (unitless); a = molar absorptivity (molarity-1
∙cm-1
), which is a constant for the absorbing species, b = path length, or thickness of the absorbing layer of a solution (cm), and c = concentration of the solution (molarity).
Beer’s law tells us that the absorbance of a particular species is directly proportional to the concentration
of the absorbing species. The measurement of a reference sample (one with everything except the
substance being analyzed) allows us to factor out the absorbance of light by the solvent, and by the
cuvette itself.
So A = abc. And if a and b are constant for any given species and path-length, we can see that the
absorbance of a solution is directly proportional to the concentration of the absorbing species. Because
the absorbance of a solution is easy to measure, this technique is frequently used to measure
concentrations of unknown solutions, and this is what you will be doing in this experiment.
6. When extracting the proteins from plant cells, you used a buffer that allowed the non-protein
components of the plants to precipitate and allowed the proteins to be in the supernatant. Most proteins
are considered to be non-polar or hydrophobic. What can you deduct about the polarity of the extraction
buffer? Is the extraction of protein from living cells a chemical or a physical process? Support your
answers with molecular behavior – what is happening at the molecular level. [APCHEM LO 2.10, AP CHEM LO
5.10]
The protein extraction buffer must be non-polar in order for the proteins to be dissolved in that medium.
Extraction of proteins is a physical process because the proteins and other components are not changing
in chemical identity. Proteins are pooled away by intermolecular interaction (hydrophobic) with the
extraction buffer. No inTRA molecular bonds are broken, hence, there is no chemical changes.

LESSON THREE: FRAGMENTED AND POSITIVE – MASS SPECTROMETRY AND
BIOINFORMATICS
ESSENTIAL/KEY QUESTION(S): How are proteins purified and tested? How can you determine the identity of a protein? How can bioinformatics help anyone in everyday life? OVERALL TIME ESTIMATE:
Advanced Preparation: 50 minutes
Student Procedure: 100 minutes or two 50-minutes sessions
LEARNING STYLES: Visual, Auditory VOCABULARY: (adapted from http://www.dictionary.com)
Trypsin - a proteolytic enzyme of the pancreatic juice, capable of converting proteins into peptides
Electrophoresis - this technique, applied to sorting proteins according to their responses to an electric field
Mass Spectrometer - a device for identifying the kinds of particles present in a given substance: the particles are ionized and beamed through an electromagnetic field and the manner in which they are deflected is indicative of their mass and, thus, their identity
Denature - to treat (a protein or the like) by chemical or physical means so as to alter its original state
Digestion – the process by which larger molecules are broken down into smaller ones by the action of enzymes
Surfactant - A substance that, when dissolved in water, lowers the surface tension of the water and increases the solubility of organic compounds
LESSON SUMMARY: With the aid of animations and simulations, students are presented with the concepts of gel electrophoresis. The students then will analyze and identify proteins based on mass spectrometry data, using bioinformatics. The lesson ends with students proposing a scientific investigation that will incorporate the techniques learned to test a control and an experimental condition regarding plant adaptation.
STUDENT LEARNING OBJECTIVES:
The student will be able to...
1. Analyze separate proteins with gel electrophoresis, using a simulation program. 2. Explain how gel electrophoresis separates protein molecules present in a mixture. 3. Describe the relationship between fragment size and migration rate in a gel. 4. Describe the use of mass spectrometers in Proteomics studies. 5. Use bioinformatics by accessing a web-based programs (MASCOT and UniProt) to determine the protein
identity from data of protein extracted and purified from plants and processed in a real laboratory setting.
STANDARDS: See table on page xxx. SC.912.N.1.1 SC.912.N.1.2 SC.912.N.1.3 SC.912.N.1.5 SC.912.N.1.6 SC.912.N.1.7 AP CHEM LO 5.10 SC.912.N.3.5 SC.912.L.16.10 SC.912.L.18.4 SC.912.N.2.4 SC.912.N.2.5 SC.912.N.3.5

MATERIALS:
1. Computer or electronic device with access to the internet to access the SDS PAGE simulation web page : http://vlab.amrita.edu/?sub=3&brch=186&sim=319&cnt=1
2. Computer or electronic device with access to the internet to evaluate mass spectra, MASCOT, and protein function: http://www.moleculardetective.org/FPLibrary/FPLibraryMenu.html, http://www.matrixscience.com/search_form_select.html, and http://www.uniprot.org/
BACKGROUND INFORMATION:
In order to study proteins, they have to be extracted, separated from the rest of cellular components, and identified. Extraction techniques include physical rupturing of the cells and dissolving the proteins in a specific buffered solution.
Electrophoresis
The most common protein separation technique is gel electrophoresis which separates the proteins based on their masses (1D gel). A most effective separation of the large number of proteins in living systems is the 2D gel electrophoresis which separates based on charges and also by the molecular mass (2D gel).
Electrophoresis uses a porous matrix, gel, in which the samples are placed. The gel could be made of agarose (traditionally used for DNA fragment separations) or Polyacrylamide gel, PAGE. PAGE is used for protein separation because the proteins have smaller sizes than DNA or RNA; hence the matrix should have relative smaller pores (holes) to have an effective separation. Agarose pore size is relative larger than the ones in polyacrylamide gels.
Prior to loading the sample in the gel, the protein sample is denatured by heating the sample, breaking the 3-dimensional structures of the proteins and creating linear, cigar-shape molecules. Proteins are also treated with sodium dodecyl sulfate (SDS). This substance is a surfactant that helps denature the proteins and adds a negative charge to the proteins.
After treatment, the proteins are loaded on the gel and an electrical current is applied to the gel. When the negatively charged proteins experience the electric field, they move to the positive side of the gel. As the proteins move to the positive side of the gel, their movement is hindered by the gel. The smaller proteins will move faster than the larger ones, arriving to the end of the gel quicker.
In order to visualize the separated proteins, the gel is stained with a dye that will target the proteins; usually Coomassie Blue. The dye is added to the gel and then excess dye is washed off until the bands of stained proteins are clearly visible in the gel.
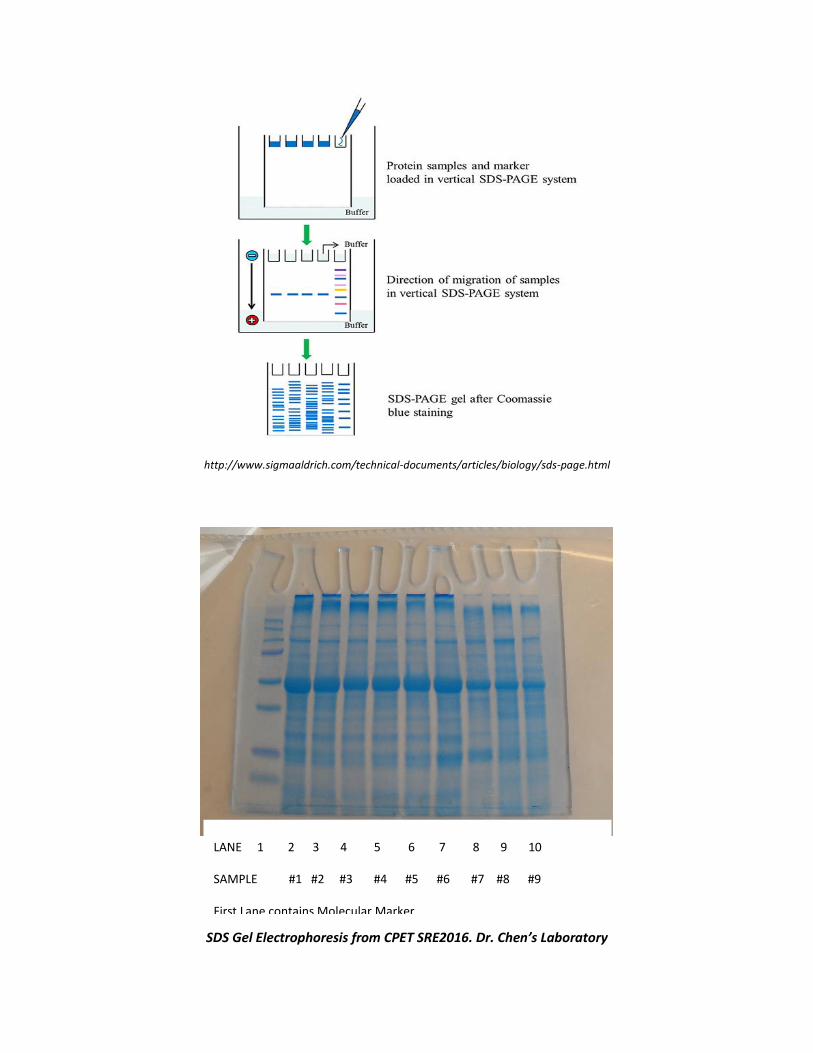
http://www.sigmaaldrich.com/technical-documents/articles/biology/sds-page.html
SDS Gel Electrophoresis from CPET SRE2016. Dr. Chen’s Laboratory
LANE 1 2 3 4 5 6 7 8 9 10
SAMPLE #1 #2 #3 #4 #5 #6 #7 #8 #9
First Lane contains Molecular Marker

The separated proteins are then broken down (digested) by an enzyme, usually trypsin. The resulting fragments are then further analyzed.
Mass Spectrometry and PMF
After the band of proteins are analyzed, scientists literally cut away the bands of the proteins of interest for their investigation. The next step of in the process is the analysis using a mass spectrometer (MS). In order to use this instruments, the proteins must be fragmented into smaller mass peptides. The most common way of generating smaller peptides from large proteins is by using an enzyme called Trypsin. Trypsin digests or breaks large proteins in specific locations, creating specific fragments for each protein tested. The fragment peptides can be considered the protein ‘fingerprint’. The mass spectrometer identifies the abundance of each of the fragment peptides, after separating them by their mass and charge (ionization).
MS instruments have three main components: an ionization source, a mass analyzer, and a detector. Each of the components have different options on as to how to perform the process; that is, there are different types or ways of ionizing the sample, many different ways of analyzing the mass, and different types of detectors.
The MALDI/TOF is one of the types of instrument used for the analysis of protein fragments. MALDI stands for matrix assisted laser desorption ionization process. This process mixes the trypsin-fragmented peptide to be tested with another substance, called the matrix that helps ionize the peptide for analysis. The peptide/matrix mixture is then placed on a plate that is then hit with a laser beam. When the beam hits the plate, the peptide gets ionized, losing an electron and taking a positive charge.
http://www.chm.bris.ac.uk/ms/maldi-ionisation.xhtml
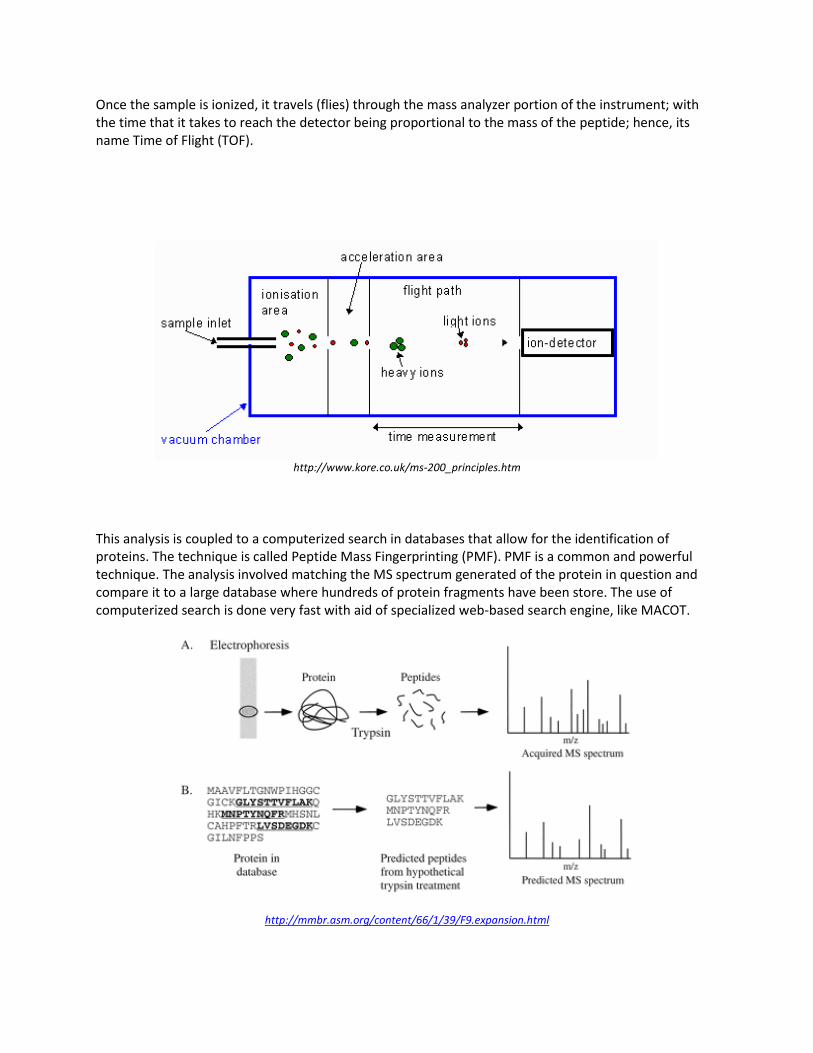
Once the sample is ionized, it travels (flies) through the mass analyzer portion of the instrument; with the time that it takes to reach the detector being proportional to the mass of the peptide; hence, its name Time of Flight (TOF).
http://www.kore.co.uk/ms-200_principles.htm
This analysis is coupled to a computerized search in databases that allow for the identification of proteins. The technique is called Peptide Mass Fingerprinting (PMF). PMF is a common and powerful technique. The analysis involved matching the MS spectrum generated of the protein in question and compare it to a large database where hundreds of protein fragments have been store. The use of computerized search is done very fast with aid of specialized web-based search engine, like MACOT.
http://mmbr.asm.org/content/66/1/39/F9.expansion.html
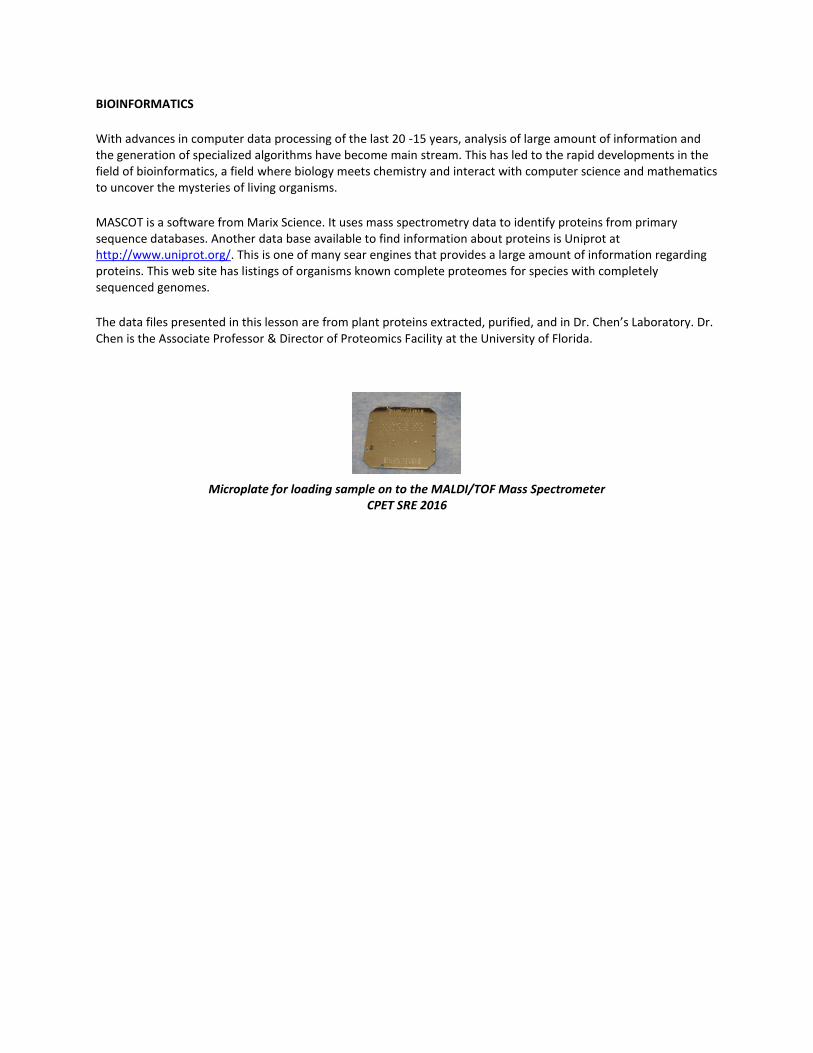
BIOINFORMATICS
With advances in computer data processing of the last 20 -15 years, analysis of large amount of information and the generation of specialized algorithms have become main stream. This has led to the rapid developments in the field of bioinformatics, a field where biology meets chemistry and interact with computer science and mathematics to uncover the mysteries of living organisms.
MASCOT is a software from Marix Science. It uses mass spectrometry data to identify proteins from primary sequence databases. Another data base available to find information about proteins is Uniprot at http://www.uniprot.org/. This is one of many sear engines that provides a large amount of information regarding proteins. This web site has listings of organisms known complete proteomes for species with completely sequenced genomes.
The data files presented in this lesson are from plant proteins extracted, purified, and in Dr. Chen’s Laboratory. Dr. Chen is the Associate Professor & Director of Proteomics Facility at the University of Florida.
Microplate for loading sample on to the MALDI/TOF Mass Spectrometer CPET SRE 2016
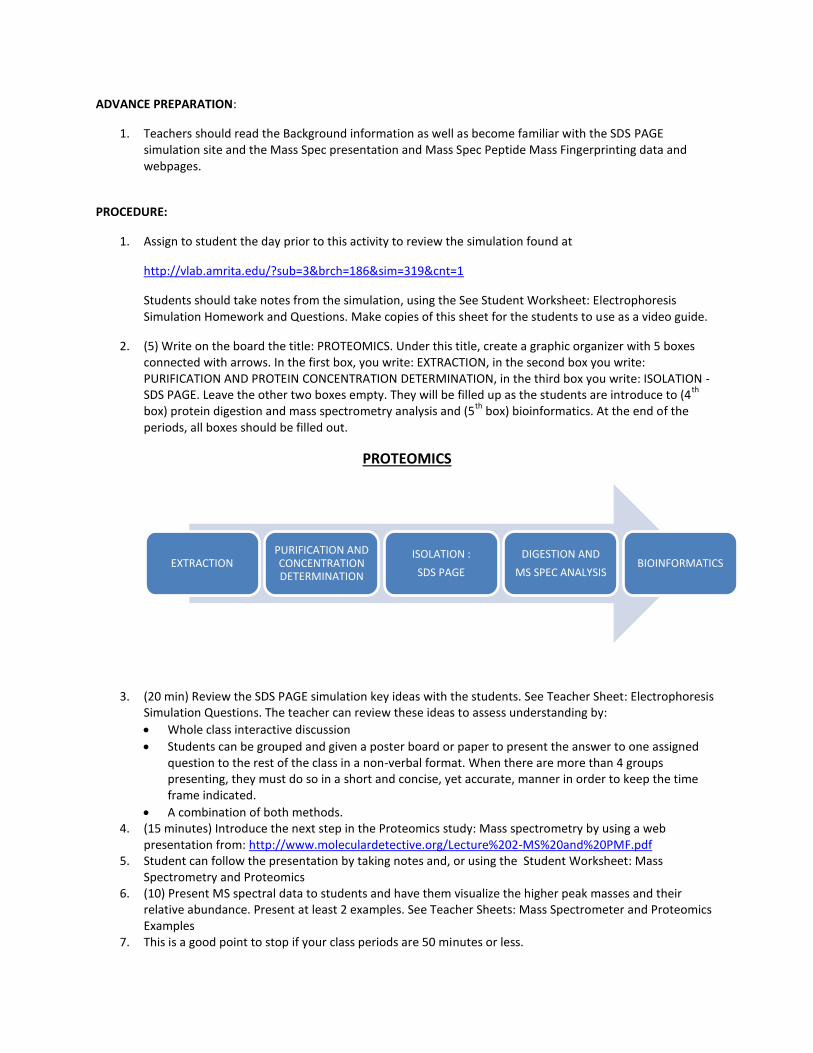
EXTRACTION PURIFICATION AND CONCENTRATION DETERMINATION
ISOLATION :
SDS PAGE
DIGESTION AND
MS SPEC ANALYSIS BIOINFORMATICS
ADVANCE PREPARATION:
1. Teachers should read the Background information as well as become familiar with the SDS PAGE simulation site and the Mass Spec presentation and Mass Spec Peptide Mass Fingerprinting data and webpages.
PROCEDURE:
1. Assign to student the day prior to this activity to review the simulation found at
http://vlab.amrita.edu/?sub=3&brch=186&sim=319&cnt=1
Students should take notes from the simulation, using the See Student Worksheet: Electrophoresis Simulation Homework and Questions. Make copies of this sheet for the students to use as a video guide.
2. (5) Write on the board the title: PROTEOMICS. Under this title, create a graphic organizer with 5 boxes connected with arrows. In the first box, you write: EXTRACTION, in the second box you write: PURIFICATION AND PROTEIN CONCENTRATION DETERMINATION, in the third box you write: ISOLATION - SDS PAGE. Leave the other two boxes empty. They will be filled up as the students are introduce to (4
th
box) protein digestion and mass spectrometry analysis and (5th
box) bioinformatics. At the end of the periods, all boxes should be filled out.
PROTEOMICS
3. (20 min) Review the SDS PAGE simulation key ideas with the students. See Teacher Sheet: Electrophoresis Simulation Questions. The teacher can review these ideas to assess understanding by:
Whole class interactive discussion
Students can be grouped and given a poster board or paper to present the answer to one assigned question to the rest of the class in a non-verbal format. When there are more than 4 groups presenting, they must do so in a short and concise, yet accurate, manner in order to keep the time frame indicated.
A combination of both methods. 4. (15 minutes) Introduce the next step in the Proteomics study: Mass spectrometry by using a web
presentation from: http://www.moleculardetective.org/Lecture%202-MS%20and%20PMF.pdf 5. Student can follow the presentation by taking notes and, or using the Student Worksheet: Mass
Spectrometry and Proteomics 6. (10) Present MS spectral data to students and have them visualize the higher peak masses and their
relative abundance. Present at least 2 examples. See Teacher Sheets: Mass Spectrometer and Proteomics Examples
7. This is a good point to stop if your class periods are 50 minutes or less.
8. Give student the STUDENT WORKSHEET: MASS SPECTROMETRY AND PMF HANDS-ON ACTIVITY.
9. Students should have their own computer station. For this activity to be effective, no more than two students can work together at a computer.
10. (20 minutes) Work together with the students to model how to follow the instructions outlined in STUDENT WORKSHEET: MASS SPECTROMETRY AND PMF HANDS-ON PRACTICE. Analyse the Sample Fingerprint 01. Carry the investigation of Sample Fingerprint #01 from the Molecular Detective web page to the MASCOT web page to the Uniprot web page: http://www.uniprot.org/
11. Have students work on TWO of the samples found in the Molecular Detective web pages, either Samples Fingerprint #2, #3, or #4. Encourage students to save the files they to a flash-drive. They can take the files from the flash drive and access the MASCOT program from any computer with internet access
12. Have students process Sample Fingerprint #5 for assessment.
They can save the files in a flash drive and turn in the flashdrive to be graded by the teacher.
They can email the teacher the files to be graded.
They can print the files and turn in to the teacher
ASSESSMENT SUGGESTIONS:
1. Student worksheets can be used for assessment.
EXTENSIONS: ACTIVITIES:
At the Molecular Detective web site, http://www.moleculardetective.org/FPLibrary/FPLibraryMenu.html, there are 10 other samples that the students can analyze.
2. As an extension, the teacher can challenge the students to work in groups to design an experimental sequence to test a question or a hypothesis of their own regarding plant proteins. Students will have to
Identify a problem
Research the problem
Propose parameters/conditions to be tested
Identify a control condition and parameters to be kept constant
Identify conditions that will ensure robust data collection (replicates, type of measurements)
Sequence the steps necessary to conduct the protein investigation
Suggest possible outcomes/results from this investigation
Present the possible impact their investigation will have in society
The group project can be presented to the rest of the class to have peer input and feedback on the designs.
RESOURCES/REFERENCES:
DNA electrophoresis simulation: http://www.scienceteacherprogram.org/biology/NLee05.html
Fish Proteins and Gel Electrophoresis: http://www.oxy.edu/sites/default/files/assets/TOPS/fishproteinprepost.pdf
Ice Plant Adaptation: http://www.ncbi.nlm.nih.gov/pmc/articles/PMC160917/pdf/071099.pdf
Electrophoresis Simulation: https://www.classzone.com/books/hs/ca/sc/bio_07/virtual_labs/virtualLabs.html
A Guide to Polyacrylamide Gel Electrophoresis and Detection: http://www.bio-rad.com/webroot/web/pdf/lsr/literature/Bulletin_6040.pdf
Comparison of Agarose and Polyacrylamide gels: http://bitesizebio.com/20395/agarose-versus-polyacrylamide-not-all-gels-are-created-equal/
Proteomics in High School: Student Handout: http://eric.ed.gov/?id=EJ997042
Bioinformatics: http://teachingbioinformatics.fandm.edu/activities/proteomics-protein-identification-using-line-databases
Mass Spectrometry Basics: http://www.asms.org/docs/what-is-ms-booklet/mass-spec-basics-for-young-students.pdf?sfvrsn=0
Mass Spectrometry and Proteomics: Mass Spectrometry Data Analysis in Proteomics By Rune Matthiesen: https://books.google.com/books?id=36gLdyXvi5EC&pg=PA118&lpg=PA118&dq=Aebersold+,Goodlett;+Chem.+Rev.+2001,+101,+26&source=bl&ots=IXJLVrdOx8&sig=feWqCFoS1A2xpKPJn9UbO51wc7s&hl=en&sa=X&ved=0ahUKEwi5s6H3huDNAhXH1CYKHTxOAl0Q6AEIOTAE#v=onepage&q=Aebersold%20%2CGoodlett%3B%20Chem.%20Rev.%202001%2C%20101%2C%2026&f=false
Protein SDS PAGE Electrophoresis Simulation: http://vlab.amrita.edu/?sub=3&brch=186&sim=319&cnt=1
MALDI/TOF: http://www.ncbi.nlm.nih.gov/pubmed/21964792
Protein and Peptide Analysis by Mass Spec: https://masspec.scripps.edu/publications/public_pdf/78_art.pdf
Mass Spec tutorial: http://www.chem.arizona.edu/massspec/intro_html/intro.html
Mass Spec tutorial: http://www.astbury.leeds.ac.uk/facil/MStut/mstutorial.htm
Bioinformatic tutorials: http://www.moleculardetective.org/
Bioinformatic tutorials: http://www.matrixscience.com/search_intro.html
PMF and MASCOT: http://www.mi.fu-berlin.de/wiki/pub/ABI/QuantProtP4/peptide-id-scope.pdf
PMF: http://www.ionsource.com/tutorial/protID/fingerprint.htm
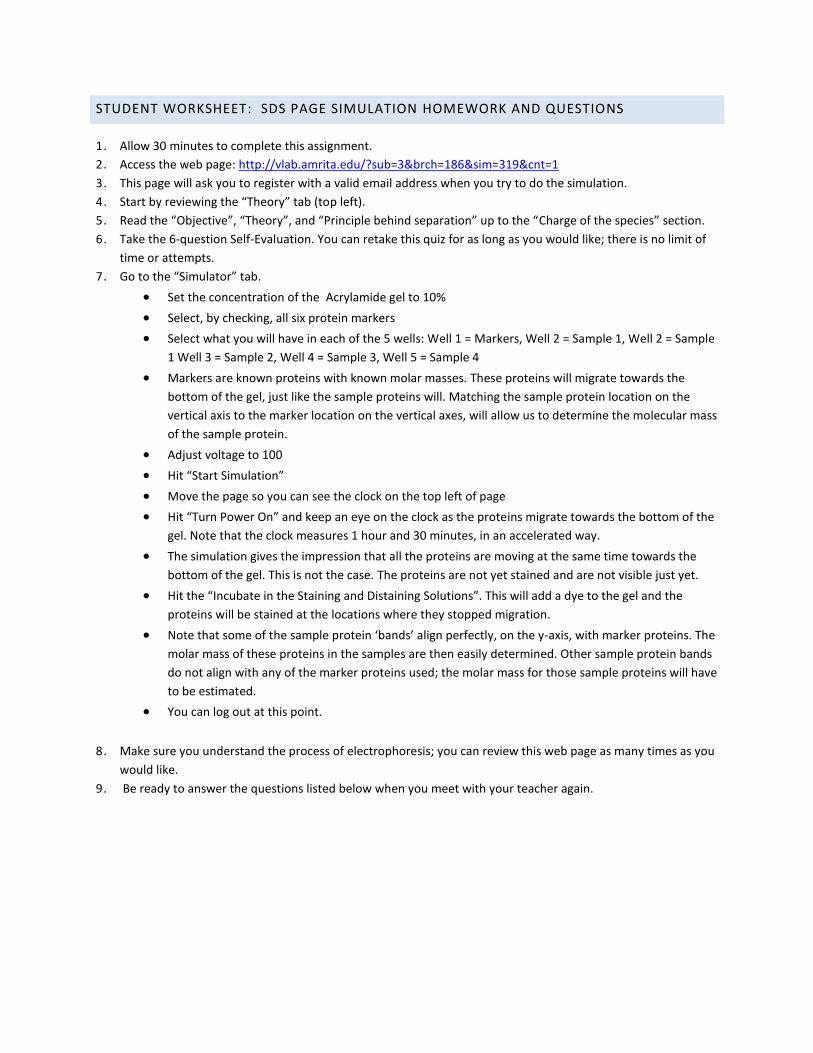
STUDENT WORKSHEET: SDS PAGE SIMULATION HOMEWORK AND QUESTIONS
1. Allow 30 minutes to complete this assignment.
2. Access the web page: http://vlab.amrita.edu/?sub=3&brch=186&sim=319&cnt=1
3. This page will ask you to register with a valid email address when you try to do the simulation.
4. Start by reviewing the “Theory” tab (top left).
5. Read the “Objective”, “Theory”, and “Principle behind separation” up to the “Charge of the species” section.
6. Take the 6-question Self-Evaluation. You can retake this quiz for as long as you would like; there is no limit of
time or attempts.
7. Go to the “Simulator” tab.
Set the concentration of the Acrylamide gel to 10%
Select, by checking, all six protein markers
Select what you will have in each of the 5 wells: Well 1 = Markers, Well 2 = Sample 1, Well 2 = Sample
1 Well 3 = Sample 2, Well 4 = Sample 3, Well 5 = Sample 4
Markers are known proteins with known molar masses. These proteins will migrate towards the
bottom of the gel, just like the sample proteins will. Matching the sample protein location on the
vertical axis to the marker location on the vertical axes, will allow us to determine the molecular mass
of the sample protein.
Adjust voltage to 100
Hit “Start Simulation”
Move the page so you can see the clock on the top left of page
Hit “Turn Power On” and keep an eye on the clock as the proteins migrate towards the bottom of the
gel. Note that the clock measures 1 hour and 30 minutes, in an accelerated way.
The simulation gives the impression that all the proteins are moving at the same time towards the
bottom of the gel. This is not the case. The proteins are not yet stained and are not visible just yet.
Hit the “Incubate in the Staining and Distaining Solutions”. This will add a dye to the gel and the
proteins will be stained at the locations where they stopped migration.
Note that some of the sample protein ‘bands’ align perfectly, on the y-axis, with marker proteins. The
molar mass of these proteins in the samples are then easily determined. Other sample protein bands
do not align with any of the marker proteins used; the molar mass for those sample proteins will have
to be estimated.
You can log out at this point.
8. Make sure you understand the process of electrophoresis; you can review this web page as many times as you
would like.
9. Be ready to answer the questions listed below when you meet with your teacher again.

STUDENT WORKSHEET: SDS PAGE SIMULATION HOMEWORK AND QUESTIONS
ELECTROPHORESIS QUESTIONS
1. What is the PAGE acronym stand for; what is the technique used for? What is PAGE basic principle?
2. What is the SDS used for?
3. Why does the proteins move down the gel when an electrical current is applied to the gel? What would
happen if you make a run with a certain current and then you make another run with the same samples
but at a higher voltage?
4. How can you identify the molar mass of the sample proteins?
5. What is the dye used for after the gel run is completed? Is this an essential step? Explain why or why not.
6. Which protein in a sample protein band profile will be the protein with the lowest molar mass?

TEACHER WORKSHEET: SDS PAGE SIMULATION HOMEWORK AND QUESTIONS - ANSWERS
ELECTROPHORESIS QUESTIONS
1. What is the PAGE acronym stand for; what is the technique used for? What is PAGE basic principle?
PAGE stands for polyacrylamide gel electrophoresis. This technique is used to separate large molecules,
like DNA fragments or proteins, from a mixture.
The basic separation principle is that negatively charged proteins will move at different rates through a
matrix or gel when an electrical current is applied to the gel.
2. What is the SDS used for?
Sodium dodecyl sulfate is a surfactant added to the protein sample prior to running PAGE. The surfactant
helps denature the proteins to be analyzed. It also provides negative charges to the denature proteins.
3. Why is it that the proteins move down the gel when an electrical current is applied to the gel? What
would happen if you make a run with a certain current and then you make another run with the same
samples but at a higher voltage?
The electricity is applied to the top of the gel (negative end of the gel) and the proteins then move
towards the bottom, where the positive side of the gel is. If you run a second run with higher current, the
proteins will move faster down the gel.
4. How can you identify the molar mass of the sample proteins?
Sample proteins move down the gel at the same rate as proteins of known molar masses, known as
markers. By aligning on the y-axis of the gel the sample proteins with the markers, one can figure out the
molar mass of the sample proteins.
5. What is the dye used for after the gel run is completed? Is this an essential step? Explain why or why not.
A dye is used to stain the proteins that have been separated from the gel. This step is essential to visualize
the bands of proteins from a given sample.
6. Which protein in a sample protein band profile will be the protein with the lowest molar mass?
Proteins move down the gel based on their molar masses. The smallest (lowest molar mass) protein will
be at the bottom of the gel because it moves the fastest down the gel.
STUDENT WORKSHEET: MASS SPECTROMETRY AND PMF HANDS-ON ACTIVITY
MASS SPECTROMETRY
1. List the three components of a mass spectrometer.
2. What is it that the mass spectrometer instruments detect?
3. What is PMF and how does it work together with mass spectrometry?
4. What kind of disciplines do you think are necessary to complete studies in a complete Proteomics project?
5. The numbers that are entered in the MASCOT Query box come from the “m/z program”. Take a good look
at those numbers that are copied in the MASCOT Query box, then go back to the mass spectrum of the
sample you are dealing with. What are the numbers that are pasted in the MASCOT Query box
representing?
6. Identify the protein that is labeled “Fingerprint 5”.
What is its name?
What is the confidence value (> 30 is a great confidence value)
What organism carries this protein? What is it used for? (You might have to do a web search to find
this answer).
7. You used 3 web pages to perform your analysis. List the pages and describe what information you
obtained from each of those sites.
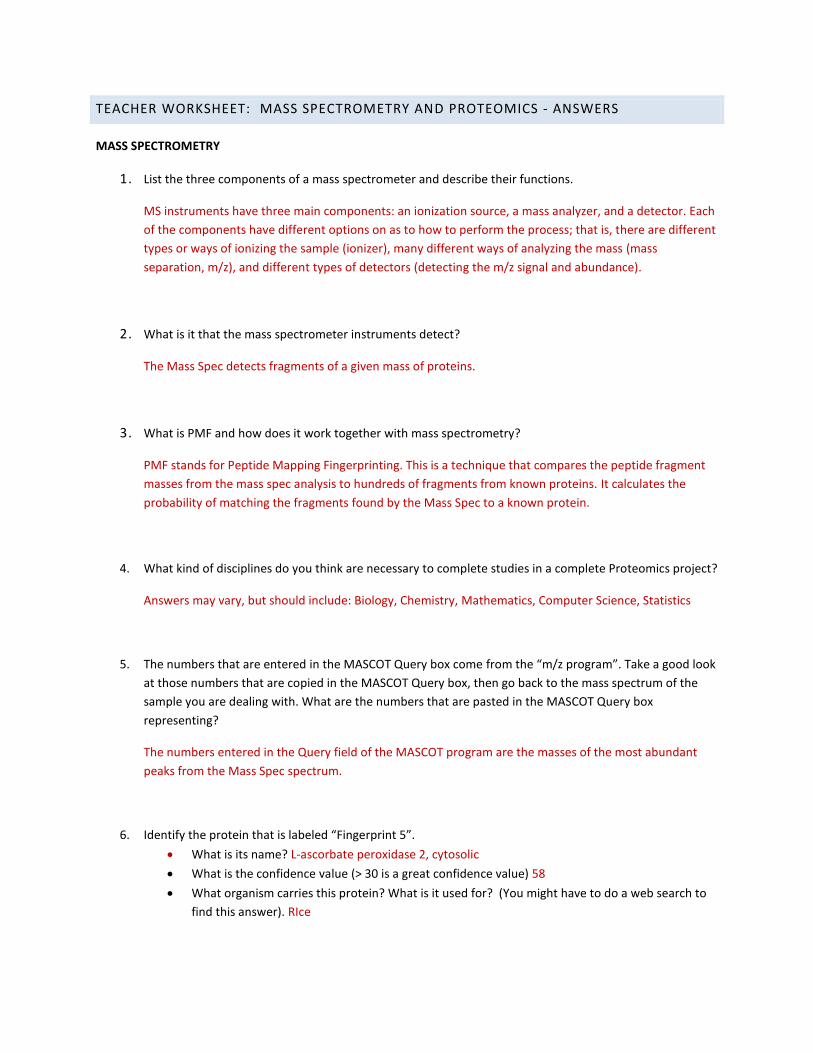
TEACHER WORKSHEET: MASS SPECTROMETRY AND PROTEOMICS - ANSWERS
MASS SPECTROMETRY
1. List the three components of a mass spectrometer and describe their functions.
MS instruments have three main components: an ionization source, a mass analyzer, and a detector. Each
of the components have different options on as to how to perform the process; that is, there are different
types or ways of ionizing the sample (ionizer), many different ways of analyzing the mass (mass
separation, m/z), and different types of detectors (detecting the m/z signal and abundance).
2. What is it that the mass spectrometer instruments detect?
The Mass Spec detects fragments of a given mass of proteins.
3. What is PMF and how does it work together with mass spectrometry?
PMF stands for Peptide Mapping Fingerprinting. This is a technique that compares the peptide fragment
masses from the mass spec analysis to hundreds of fragments from known proteins. It calculates the
probability of matching the fragments found by the Mass Spec to a known protein.
4. What kind of disciplines do you think are necessary to complete studies in a complete Proteomics project?
Answers may vary, but should include: Biology, Chemistry, Mathematics, Computer Science, Statistics
5. The numbers that are entered in the MASCOT Query box come from the “m/z program”. Take a good look
at those numbers that are copied in the MASCOT Query box, then go back to the mass spectrum of the
sample you are dealing with. What are the numbers that are pasted in the MASCOT Query box
representing?
The numbers entered in the Query field of the MASCOT program are the masses of the most abundant
peaks from the Mass Spec spectrum.
6. Identify the protein that is labeled “Fingerprint 5”.
What is its name? L-ascorbate peroxidase 2, cytosolic
What is the confidence value (> 30 is a great confidence value) 58
What organism carries this protein? What is it used for? (You might have to do a web search to
find this answer). RIce

7. You used 3 web pages to perform your analysis. List the pages and describe what information you
obtained from each of those sites.
Molecular Detective: http://www.moleculardetective.org/FPLibrary/FPLibraryMenu.html - provided the
mass spectral data in the correct format (mass/charge, m/z) to be analyzed further.
MASCOT: http://www.matrixscience.com/cgi/search_form.pl - provided Peptide Mass Fingerprinting,
matching the sample to known sequences of peptides
Unipro: www.uniprot.org/ - Proivded information about the identified protein
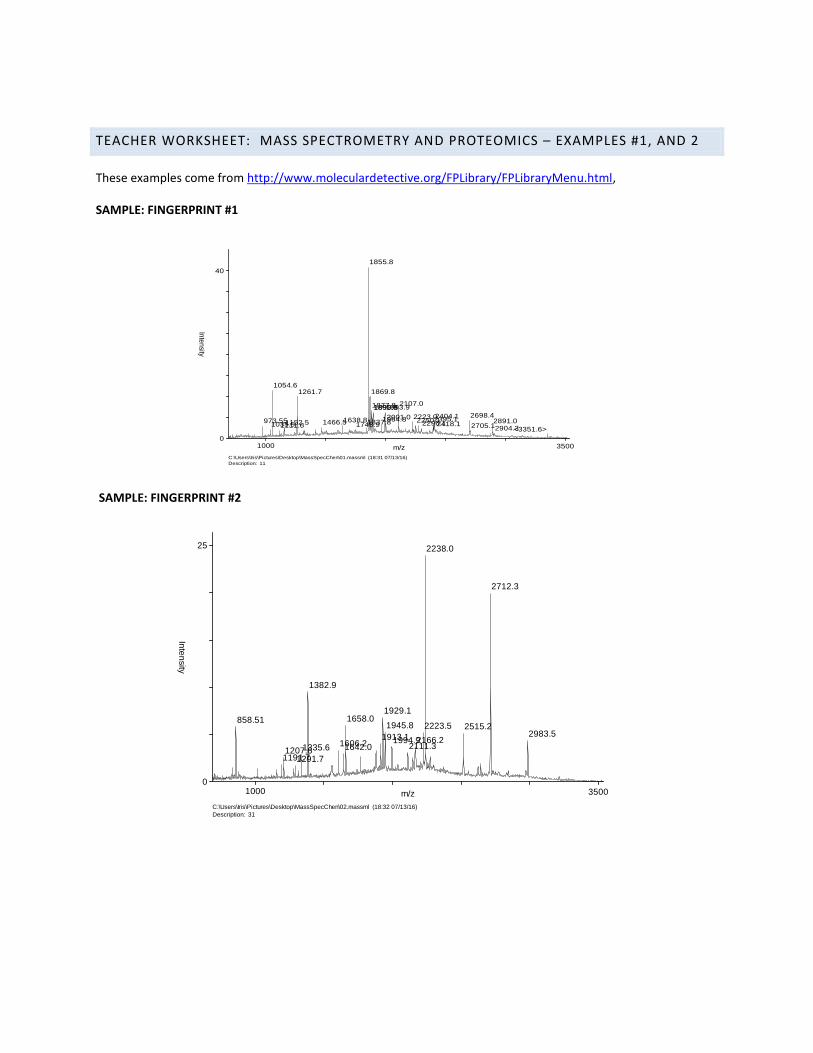
m/z1000 3500
Inte
nsity
40
0
1855.8
<3351.6>
1869.81054.6
1261.7
2107.01877.81993.91893.8
2404.1 2698.42223.02001.01964.81638.8 2250.12395.1 2891.01837.8 2296.12418.11035.5973.55
1743.9 2705.11152.51111.6 2904.3
1466.5
1890.9
C:\Users\Iris\Pictures\Desktop\MassSpecChen\01.massml (18:31 07/13/16)
Description: 11
m/z1000 3500
Inte
nsity
25
0
2238.0
2712.3
1929.11658.0
2515.22223.51945.82983.51913.1
858.51
2166.21994.91606.21642.0 2111.31207.6
1291.71191.71335.6
1382.9
C:\Users\Iris\Pictures\Desktop\MassSpecChen\02.massml (18:32 07/13/16)
Description: 31
TEACHER WORKSHEET: MASS SPECTROMETRY AND PROTEOMICS – EXAMPLES #1, AND 2
These examples come from http://www.moleculardetective.org/FPLibrary/FPLibraryMenu.html,
SAMPLE: FINGERPRINT #1
SAMPLE: FINGERPRINT #2
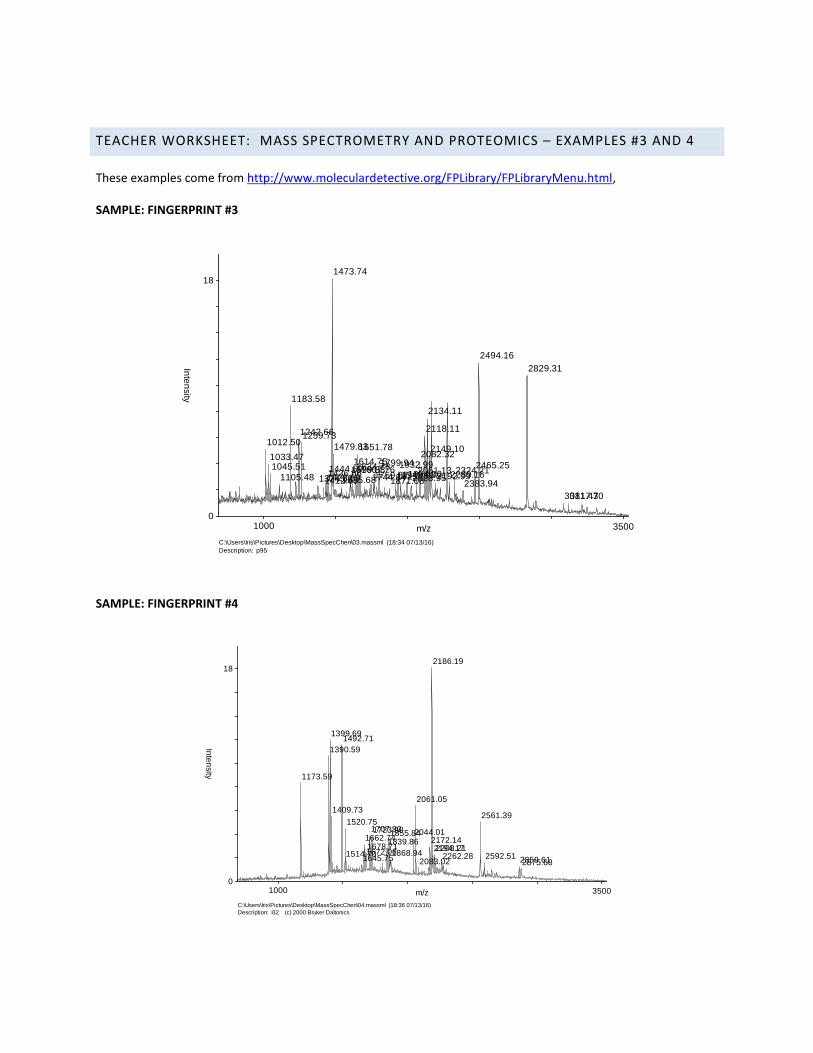
TEACHER WORKSHEET: MASS SPECTROMETRY AND PROTEOMICS – EXAMPLES #3 AND 4
These examples come from http://www.moleculardetective.org/FPLibrary/FPLibraryMenu.html,
SAMPLE: FINGERPRINT #3
SAMPLE: FINGERPRINT #4
m/z1000 3500
Inte
nsity
18
0
1473.74
2494.16
2829.31
2134.11
1183.58
2118.111259.731242.66
2149.101479.832082.32
1651.78
1799.941614.75
1012.50
1932.99 2465.251634.781444.69 2061.131667.761436.66 1994.00
1033.47
2289.161045.51
1105.48 1374.621412.691428.691535.681599.88
1744.841759.871871.08
1915.901949.932023.952192.992324.21
2383.94
3081.473117.30
C:\Users\Iris\Pictures\Desktop\MassSpecChen\03.massml (18:34 07/13/16)
Description: p95
m/z1000 3500
Inte
nsity
18
0
2186.19
1492.711399.69
1390.59
2061.05
1173.59
2561.391409.73
1520.751707.901723.90 2044.011855.84
1662.74 2172.141839.861678.71 2194.172208.211672.081514.70 1868.94 2592.512262.28
2875.682859.611645.75 2083.02
C:\Users\Iris\Pictures\Desktop\MassSpecChen\04.massml (18:36 07/13/16)
Description: I32 (c) 2000 Bruker Daltonics

STUDENT WORKSHEET: MASS SPECTROMETRY AND PMF HANDS-ON PRACTICE
PMF hands-on practice
1. Using the Firefox browser, go to FingerPrint Library (FPLibrary) and practice with Mass Spectra Examples from
different plants: http://www.moleculardetective.org/FPLibrary/FPLibraryMenu.html
2. Download and run the Moverz Bioinformatics Software. Once done, it will appear in your favored ribbon at
the bottom of the screen with the symbols “m/z”.
3. Practice with Mass Spectra Examples labeled Fingerprint 1, 2, 3, 4, and 5. Hover the mouse cursor on top of
the second hyperlink identifying the 5 Fingerprint samples. Select one of the five “Fingerprint” files, right-click
to “Save Target As” onto your desktop or any file you select. The file format should be “Moverz document”,
ending in .massml
4. If the file does not save with the *.massml extension, it will not be recognized by the Moverz program.
5. Run Moverz software. It will show a blank screen and only the ‘open’ icon will be active.
6. Select open and find the *.massml file you just downloaded/saved.
7. At this point, you can try all the options that are active on the top screen ribbon. Practice delete all masses
and autolabel peaks (A). Inspect isotope evelopes and peptide charge states. If you mess up the spectrum, you
can always go back to the library and download again.
8. Save the mass spectrum generated for your sample protein. The mass spectrum electronic files will be saved
with the *.massml extension. Use the same electronic folder where you saved the original *.massml files.
9. Repeat steps 3 – 8 for each of the 3 Fingerprint files assigned to you by your teacher.
10. To work with the Peptide Mass Fingerprinting program, you will need to import the masses of the highest
peaks in your mass spectrum to the online database called MASCOT.
11. In the Moverz screen of the sample you will be further analyzing, Go to Edit, and select “Copy masses”.
Minimize this program and go back to the internet browser.
12. Go to http://www.matrixscience.com/cgi/search_form.pl?FORMVER=2&SEARCH=PMF
13. Make sure you are in the search page; if you are on the main page find and click on “Protein Search Engine”
14. Put in your name, e-mail and search title (your sample name).
15. Choose SwissProt database or the other databases for testing
16. Since these fingerprints are from plants, select “Viridiplantae (Green plants).
17. Make sure you have the following parameters:
Enzyme: Trypsin
Up to 1 missed cleavage
Fixed and variable modifications, protein
mass: leave blank
Peptide tolerance: 1.2 Da
Mass value = H+ Monoisotopic
18. Select Query and paste the copied mass data in the query box and Start the search program.
19. The program will return with the most likely protein that contains those fragments.
20. Evaluate whether the identification is confident by examining the Score and the peptide matching result, e.g.,
number of peptides matched, score, sequence coverage, and mass accuracy.
21. The red letter code in the line labeled “Top Score” provides the code name for the identified protein. The
protein proper name is the long name that follows.
22. Highlight the red code name and copy it to a new web-based program: http://www.uniprot.org/
23. Paste the red code name in the search line on top of the UniProt home page. This program will give you all the
known information regarding this protein. Take a moment to see all the information presented in this page.
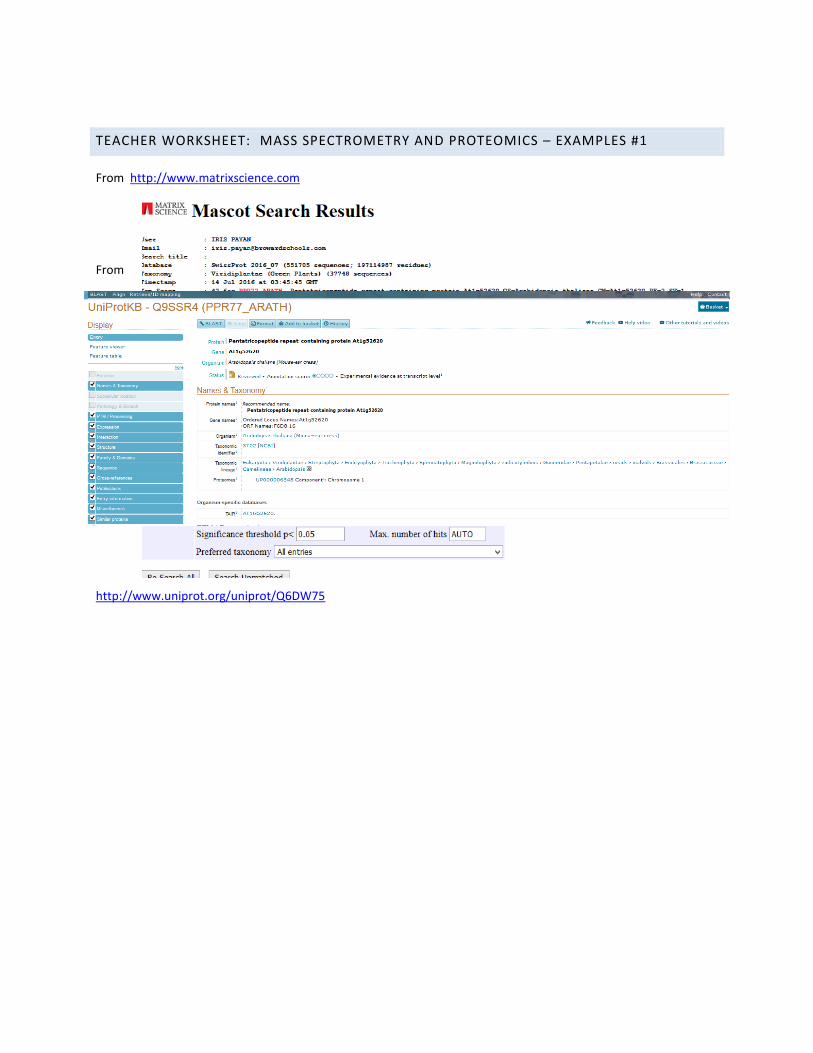
TEACHER WORKSHEET: MASS SPECTROMETRY AND PROTEOMICS – EXAMPLES #1
From http://www.matrixscience.com
From
http://www.uniprot.org/uniprot/Q6DW75

TEACHER WORKSHEET: MASS SPECTROMETRY AND PROTEOMICS – EXAMPLES #2
From http://www.matrixscience.com
From http://www.uniprot.org/uniprot/Q6DW75

TEACHER WORKSHEET: MASS SPECTROMETRY AND PROTEOMICS – EXAMPLE #3
From http://www.matrixscience.com
From http://www.uniprot.org/uniprot/Q6DW75
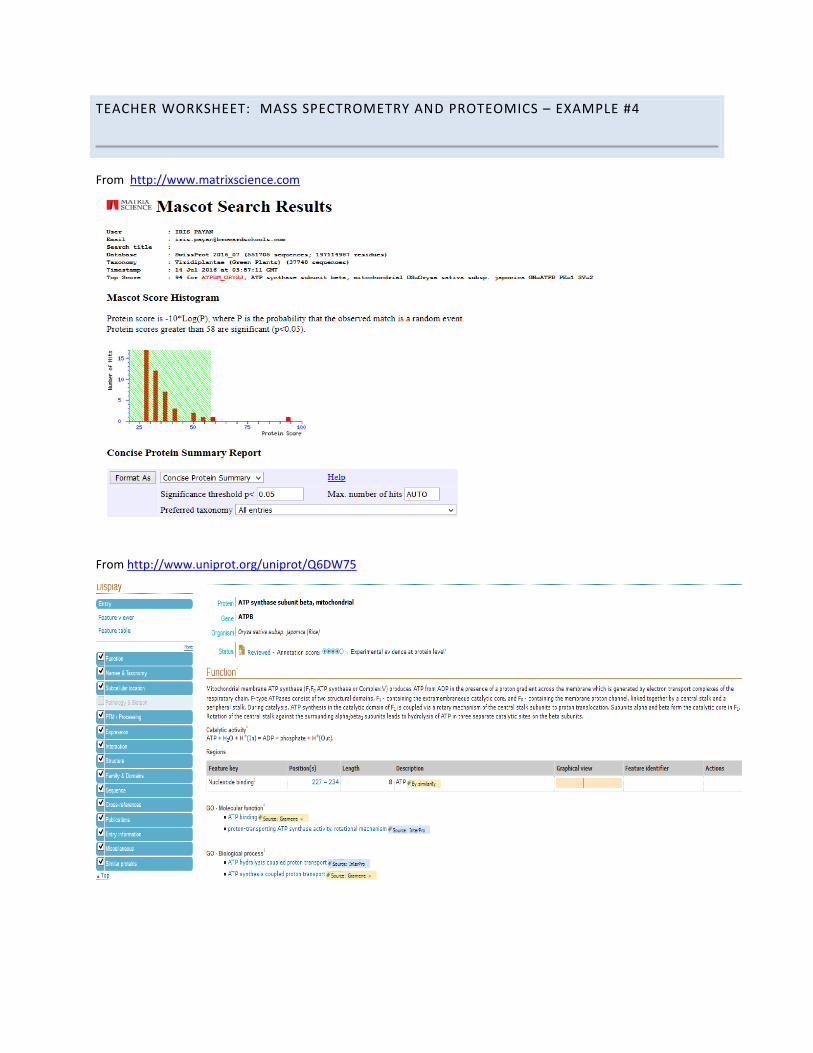
TEACHER WORKSHEET: MASS SPECTROMETRY AND PROTEOMICS – EXAMPLE #4
From http://www.matrixscience.com
From http://www.uniprot.org/uniprot/Q6DW75

m/z1000 3500
Inte
nsity
9.00
0
2046.89
1573.84
1819.91
2712.401533.75
1557.852586.37
2603.35
1521.991904.01
2660.561751.89
1309.64
2108.841599.791638.832570.30
974.440
2193.02
990.420
1475.74 1881.861232.56
2704.28938.5581149.571249.62 2551.45
C:\Users\Iris\Dropbox\SRE2016\ms_pmfLesson3\fingerprint05.massml (22:48 07/13/16)
Description: I46 (c) 2000 Bruker Daltonics
TEACHER WORKSHEET: MASS SPECTROMETRY AND PROTEOMICS – EXAMPLE #5
These examples come from http://www.moleculardetective.org/FPLibrary/FPLibraryMenu.html,

From http://www.matrixscience.com/cgi/search_form.pl
From http://www.uniprot.org/uniprot/Q9FE01

RESOURCES
ADD CHEMICAL TABLE

REFERENCES
COMPILE ALL REFERENCES FROM THE INDIVIDUAL UNITS
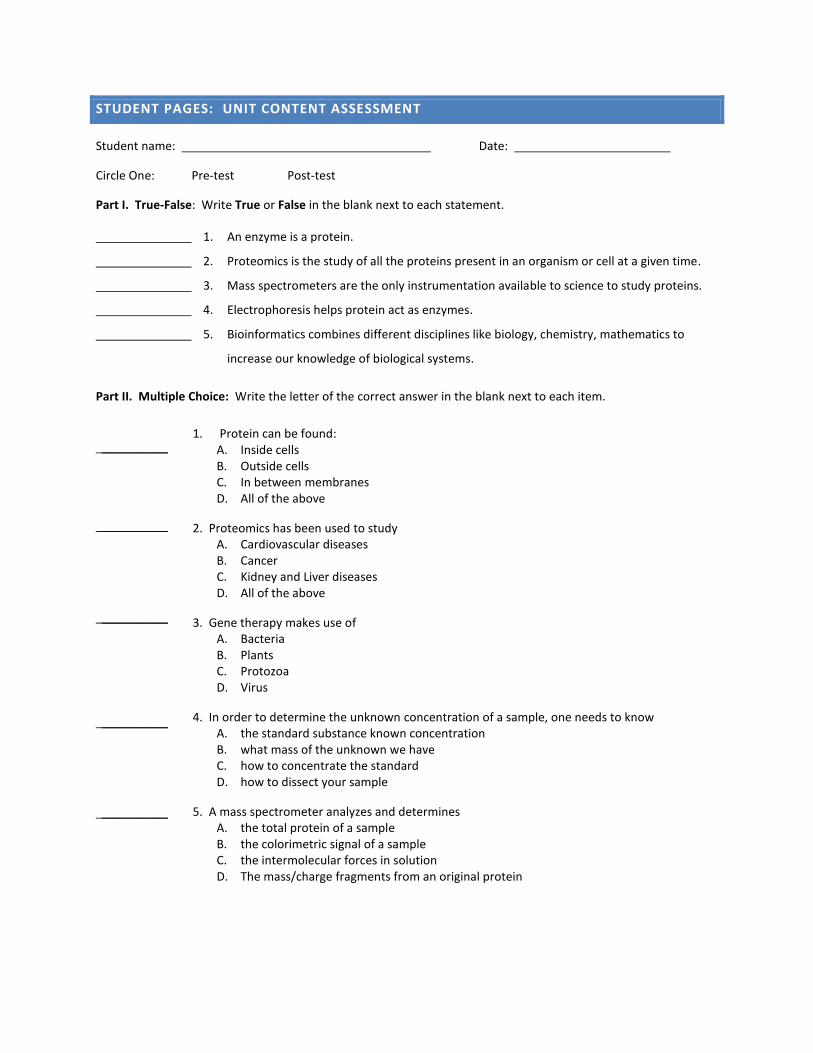
STUDENT PAGES: UNIT CONTENT ASSESSMENT
Student name: Date:
Circle One: Pre-test Post-test
Part I. True-False: Write True or False in the blank next to each statement.
1. An enzyme is a protein.
2. Proteomics is the study of all the proteins present in an organism or cell at a given time.
3. Mass spectrometers are the only instrumentation available to science to study proteins.
4. Electrophoresis helps protein act as enzymes.
5. Bioinformatics combines different disciplines like biology, chemistry, mathematics to
increase our knowledge of biological systems.
Part II. Multiple Choice: Write the letter of the correct answer in the blank next to each item.
__________
__________
__________
__________
__________
1. Protein can be found: A. Inside cells B. Outside cells C. In between membranes D. All of the above
2. Proteomics has been used to study A. Cardiovascular diseases B. Cancer C. Kidney and Liver diseases D. All of the above
3. Gene therapy makes use of A. Bacteria B. Plants C. Protozoa D. Virus
4. In order to determine the unknown concentration of a sample, one needs to know A. the standard substance known concentration B. what mass of the unknown we have C. how to concentrate the standard D. how to dissect your sample
5. A mass spectrometer analyzes and determines A. the total protein of a sample B. the colorimetric signal of a sample C. the intermolecular forces in solution D. The mass/charge fragments from an original protein

Part III. Short answer
Directions: Write your answers in the spaces below each item.
1. If I want to prepare 1.0 mL of a 0.001% solution of a standard solution and my stock has a concentration
of 0.100%, how would I process (show calculations).
2. What is the purpose of the electrical field applied to the gel of an electrophoresis procedure?
3. Describe 2 reasons why plants are a good model to study use to apply proteomic techniques and
protocols.
4. Use a particular model to describe the separation of proteins from other cellular components. Indicate
hydrophobic (nonpolar) and hydrophilic (polar) interactions.
5. How does Bioinformatics help scientists and society?
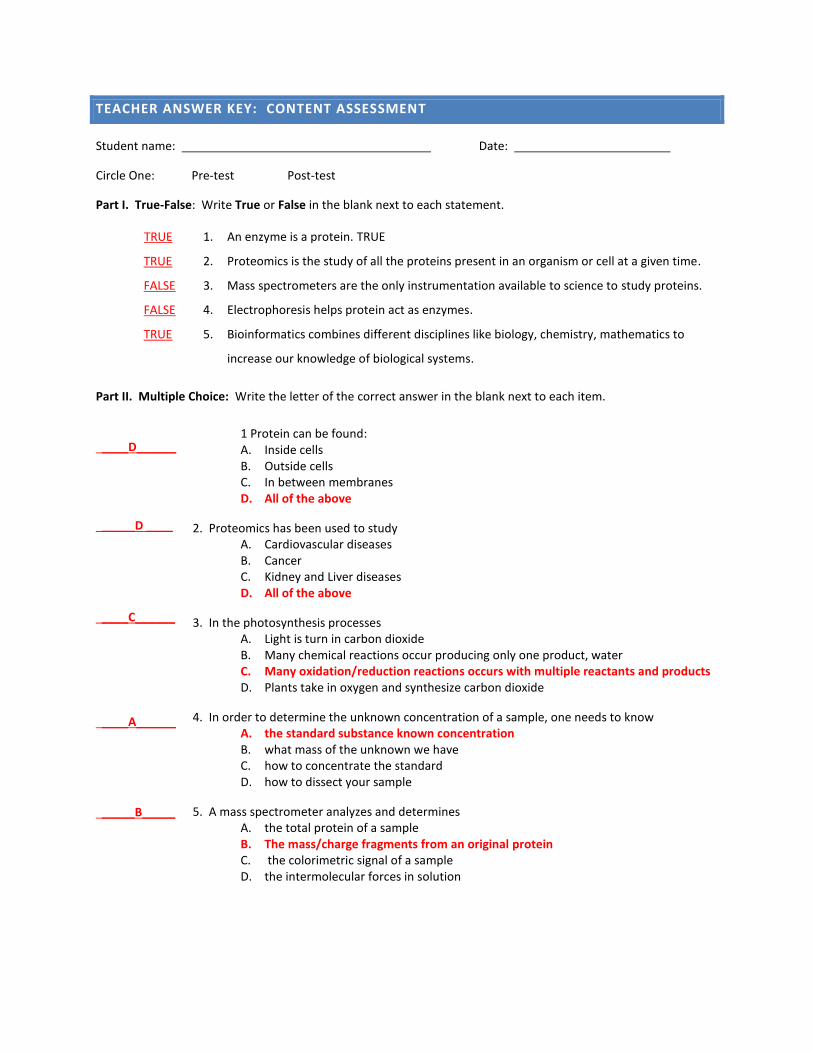
TEACHER ANSWER KEY: CONTENT ASSESSMENT
Student name: Date:
Circle One: Pre-test Post-test
Part I. True-False: Write True or False in the blank next to each statement.
TRUE
TRUE
FALSE
FALSE
TRUE
1. An enzyme is a protein. TRUE
2. Proteomics is the study of all the proteins present in an organism or cell at a given time.
3. Mass spectrometers are the only instrumentation available to science to study proteins.
4. Electrophoresis helps protein act as enzymes.
5. Bioinformatics combines different disciplines like biology, chemistry, mathematics to
increase our knowledge of biological systems.
Part II. Multiple Choice: Write the letter of the correct answer in the blank next to each item.
____D______
_____D ____
____C______
____A______
_____B_____
1 Protein can be found: A. Inside cells B. Outside cells C. In between membranes D. All of the above
2. Proteomics has been used to study A. Cardiovascular diseases B. Cancer C. Kidney and Liver diseases D. All of the above
3. In the photosynthesis processes A. Light is turn in carbon dioxide B. Many chemical reactions occur producing only one product, water C. Many oxidation/reduction reactions occurs with multiple reactants and products D. Plants take in oxygen and synthesize carbon dioxide
4. In order to determine the unknown concentration of a sample, one needs to know A. the standard substance known concentration B. what mass of the unknown we have C. how to concentrate the standard D. how to dissect your sample
5. A mass spectrometer analyzes and determines A. the total protein of a sample B. The mass/charge fragments from an original protein C. the colorimetric signal of a sample D. the intermolecular forces in solution
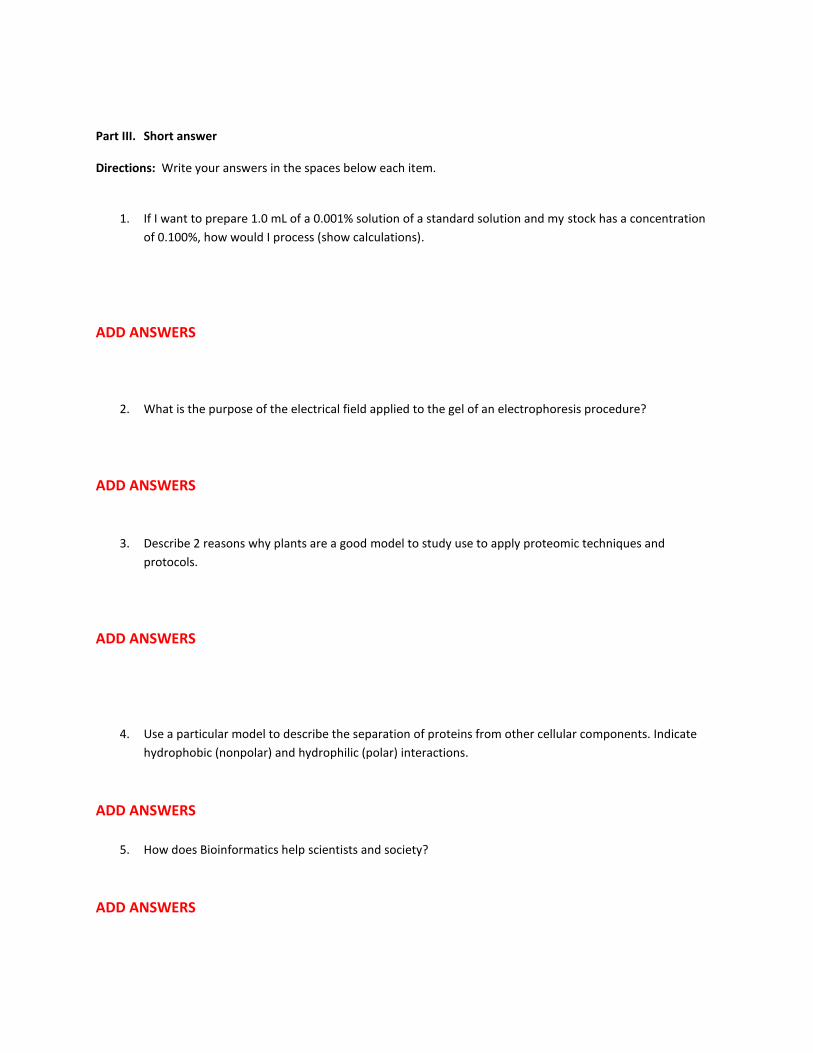
Part III. Short answer
Directions: Write your answers in the spaces below each item.
1. If I want to prepare 1.0 mL of a 0.001% solution of a standard solution and my stock has a concentration
of 0.100%, how would I process (show calculations).
ADD ANSWERS
2. What is the purpose of the electrical field applied to the gel of an electrophoresis procedure?
ADD ANSWERS
3. Describe 2 reasons why plants are a good model to study use to apply proteomic techniques and
protocols.
ADD ANSWERS
4. Use a particular model to describe the separation of proteins from other cellular components. Indicate
hydrophobic (nonpolar) and hydrophilic (polar) interactions.
ADD ANSWERS
5. How does Bioinformatics help scientists and society?
ADD ANSWERS
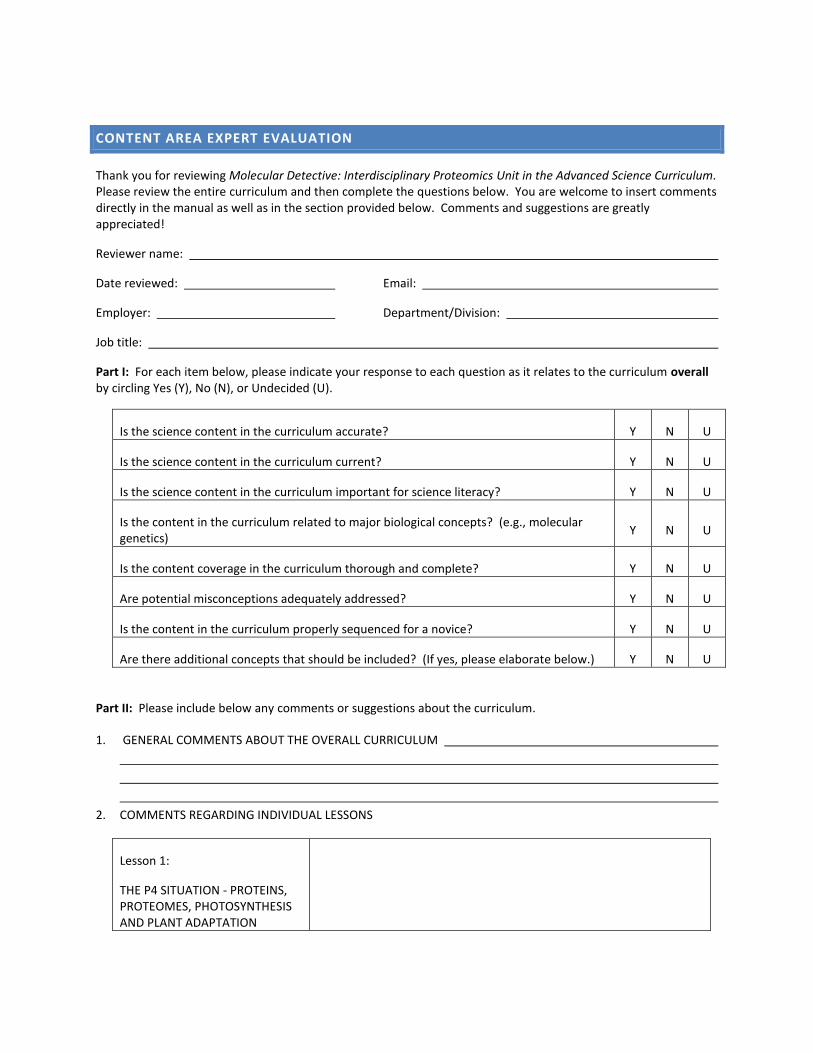
CONTENT AREA EXPERT EVALUATION
Thank you for reviewing Molecular Detective: Interdisciplinary Proteomics Unit in the Advanced Science Curriculum. Please review the entire curriculum and then complete the questions below. You are welcome to insert comments directly in the manual as well as in the section provided below. Comments and suggestions are greatly appreciated!
Reviewer name:
Date reviewed: Email:
Employer: Department/Division:
Job title:
Part I: For each item below, please indicate your response to each question as it relates to the curriculum overall by circling Yes (Y), No (N), or Undecided (U).
Is the science content in the curriculum accurate? Y N U
Is the science content in the curriculum current? Y N U
Is the science content in the curriculum important for science literacy? Y N U
Is the content in the curriculum related to major biological concepts? (e.g., molecular genetics)
Y N U
Is the content coverage in the curriculum thorough and complete? Y N U
Are potential misconceptions adequately addressed? Y N U
Is the content in the curriculum properly sequenced for a novice? Y N U
Are there additional concepts that should be included? (If yes, please elaborate below.) Y N U
Part II: Please include below any comments or suggestions about the curriculum.
1. GENERAL COMMENTS ABOUT THE OVERALL CURRICULUM
2. COMMENTS REGARDING INDIVIDUAL LESSONS
Lesson 1:
THE P4 SITUATION - PROTEINS, PROTEOMES, PHOTOSYNTHESIS AND PLANT ADAPTATION

Lesson 2:
WHAT IS YOUR COLOR? – BEER-LALMBERT’S LAW
Lesson 3: FRAGMENTED AND POSITIVE – MASS SPECTROMETRY AND BIOINFORMATICS
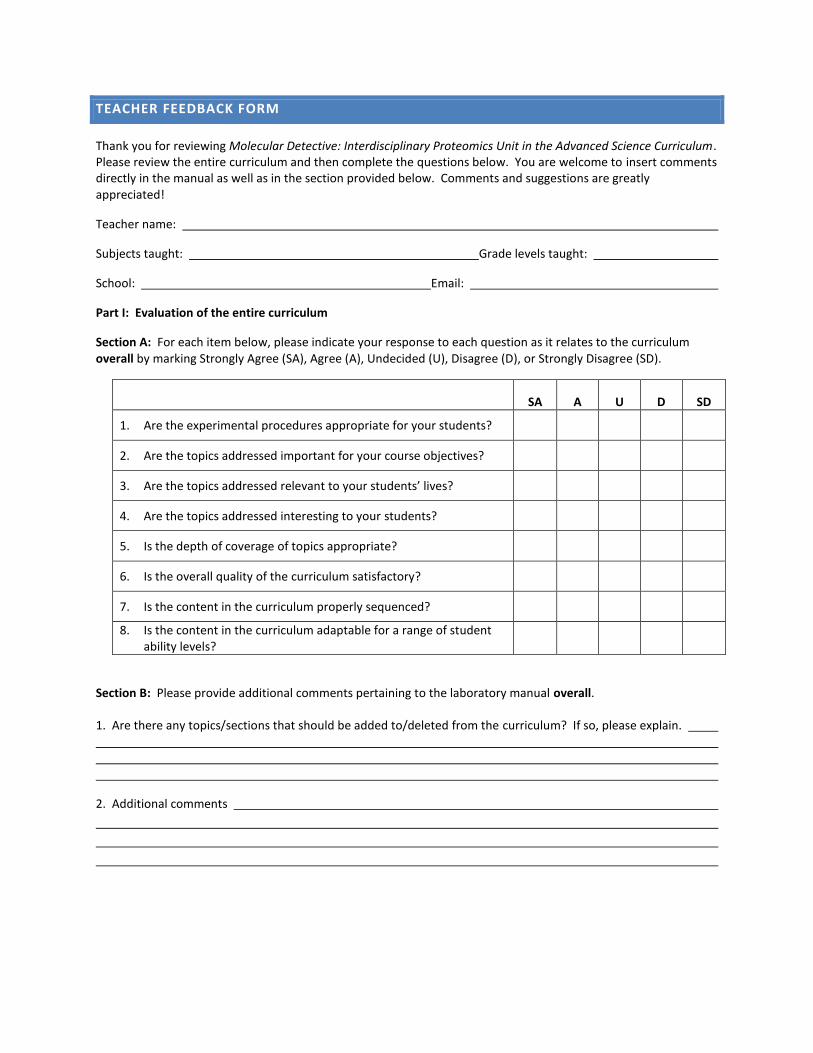
TEACHER FEEDBACK FORM
Thank you for reviewing Molecular Detective: Interdisciplinary Proteomics Unit in the Advanced Science Curriculum. Please review the entire curriculum and then complete the questions below. You are welcome to insert comments directly in the manual as well as in the section provided below. Comments and suggestions are greatly appreciated!
Teacher name:
Subjects taught: Grade levels taught:
School: Email:
Part I: Evaluation of the entire curriculum
Section A: For each item below, please indicate your response to each question as it relates to the curriculum overall by marking Strongly Agree (SA), Agree (A), Undecided (U), Disagree (D), or Strongly Disagree (SD).
SA A U D SD
1. Are the experimental procedures appropriate for your students?
2. Are the topics addressed important for your course objectives?
3. Are the topics addressed relevant to your students’ lives?
4. Are the topics addressed interesting to your students?
5. Is the depth of coverage of topics appropriate?
6. Is the overall quality of the curriculum satisfactory?
7. Is the content in the curriculum properly sequenced?
8. Is the content in the curriculum adaptable for a range of student ability levels?
Section B: Please provide additional comments pertaining to the laboratory manual overall. 1. Are there any topics/sections that should be added to/deleted from the curriculum? If so, please explain.
2. Additional comments
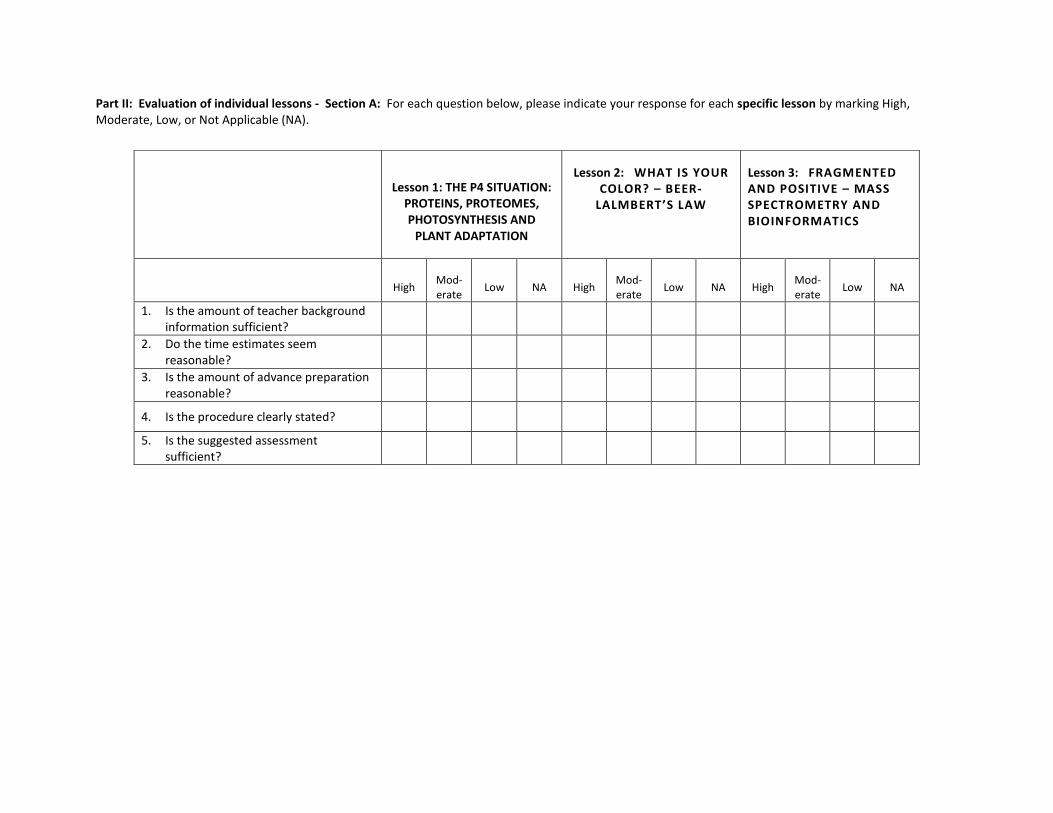
Part II: Evaluation of individual lessons - Section A: For each question below, please indicate your response for each specific lesson by marking High, Moderate, Low, or Not Applicable (NA).
Lesson 1: THE P4 SITUATION: PROTEINS, PROTEOMES, PHOTOSYNTHESIS AND
PLANT ADAPTATION
Lesson 2: WHAT IS YOUR COLOR? – BEER-
LALMBERT’S LAW
Lesson 3: FRAGMENTED AND POSITIVE – MASS SPECTROMETRY AND BIOINFORMATICS
High Mod-erate
Low NA High Mod-erate
Low NA High Mod-erate
Low NA
1. Is the amount of teacher background information sufficient?
2. Do the time estimates seem reasonable?
3. Is the amount of advance preparation reasonable?
4. Is the procedure clearly stated?
5. Is the suggested assessment sufficient?
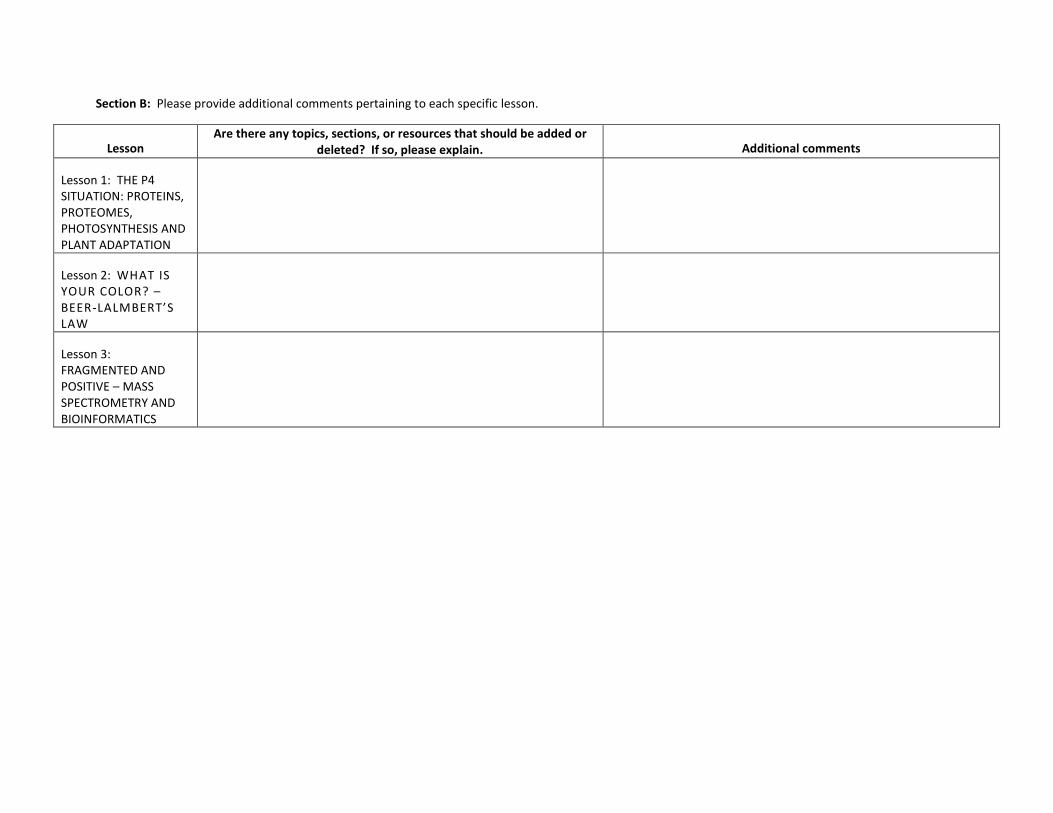
Section B: Please provide additional comments pertaining to each specific lesson.
Lesson Are there any topics, sections, or resources that should be added or
deleted? If so, please explain. Additional comments
Lesson 1: THE P4 SITUATION: PROTEINS, PROTEOMES, PHOTOSYNTHESIS AND PLANT ADAPTATION
Lesson 2: WHAT IS YOUR COLOR? – BEER-LALMBERT’S LAW
Lesson 3: FRAGMENTED AND POSITIVE – MASS SPECTROMETRY AND BIOINFORMATICS
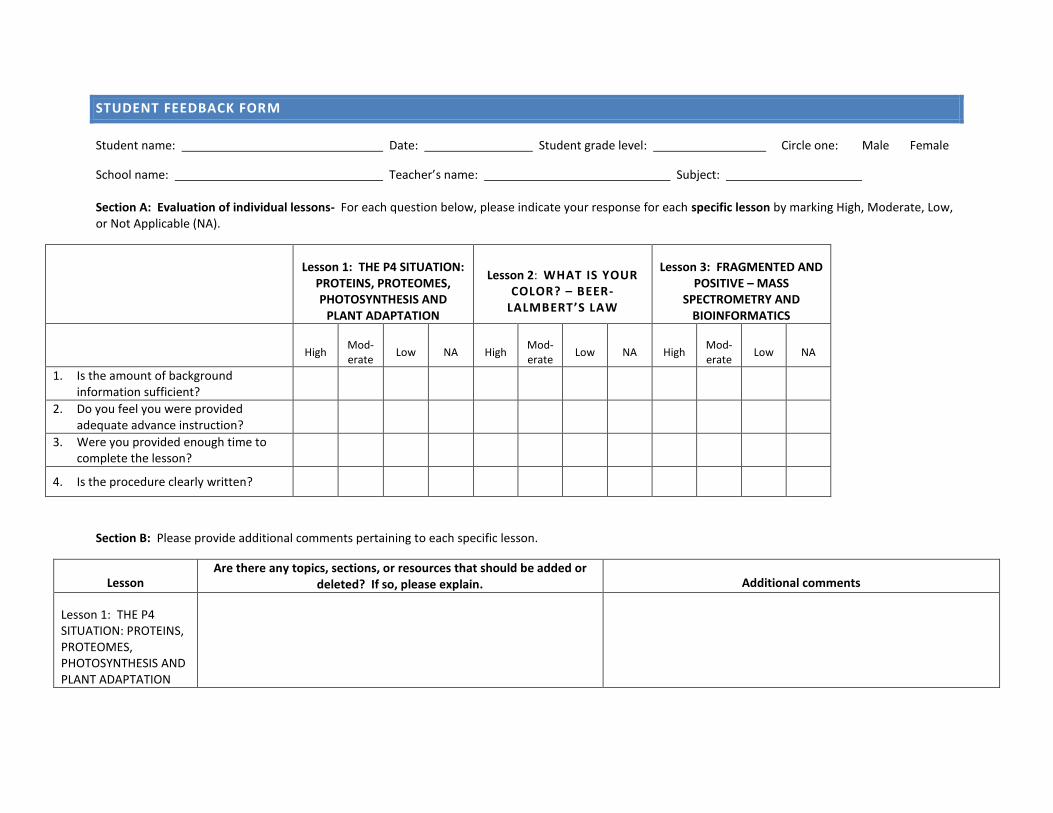
STUDENT FEEDBACK FORM
Student name: Date: Student grade level: Circle one: Male Female
School name: Teacher’s name: Subject: Section A: Evaluation of individual lessons- For each question below, please indicate your response for each specific lesson by marking High, Moderate, Low, or Not Applicable (NA).
Lesson 1: THE P4 SITUATION: PROTEINS, PROTEOMES, PHOTOSYNTHESIS AND
PLANT ADAPTATION
Lesson 2: WHAT IS YOUR COLOR? – BEER-
LALMBERT’S LAW
Lesson 3: FRAGMENTED AND POSITIVE – MASS
SPECTROMETRY AND BIOINFORMATICS
High Mod-erate
Low NA High Mod-erate
Low NA High Mod-erate
Low NA
1. Is the amount of background information sufficient?
2. Do you feel you were provided adequate advance instruction?
3. Were you provided enough time to complete the lesson?
4. Is the procedure clearly written?
Section B: Please provide additional comments pertaining to each specific lesson.
Lesson Are there any topics, sections, or resources that should be added or
deleted? If so, please explain. Additional comments
Lesson 1: THE P4 SITUATION: PROTEINS, PROTEOMES, PHOTOSYNTHESIS AND PLANT ADAPTATION

Lesson 2: WHAT IS YOUR COLOR? – BEER-LALMBERT’S LAW
Lesson 3: FRAGMENTED AND POSITIVE – MASS SPECTROMETRY AND BIOINFORMATICS
Related Documents