The Analysis of Financial The Analysis of Financial Statements Statements BA 617 BA 617 Module 7 Module 7

Welcome message from author
This document is posted to help you gain knowledge. Please leave a comment to let me know what you think about it! Share it to your friends and learn new things together.
Transcript

The Analysis of Financial StatementsThe Analysis of Financial StatementsBA 617BA 617
Module 7Module 7

Step OneStep One
Who is the user?Who is the user?
Different users have different information Different users have different information needs.needs.
Potential Financial Statement Potential Financial Statement Users:Users:
CreditorsCreditors
InvestorsInvestors
ManagersManagers
What types of questions do each of What types of questions do each of these users seek answers to?these users seek answers to?

CreditorsCreditors
Why does the firm want/need to borrow Why does the firm want/need to borrow funds?funds?
What is the firm’s capital structure? How What is the firm’s capital structure? How leveraged are they?leveraged are they?
How will they pay it back? What kind of How will they pay it back? What kind of cash flows are being generated by cash flows are being generated by operations?operations?
InvestorsInvestors
How has the firm performed/what are How has the firm performed/what are future expectations?future expectations?
How much RISK is inherent in the capital How much RISK is inherent in the capital structure?structure?
What are expected returns from the firm?What are expected returns from the firm?
What is firm’s competitive position? What is firm’s competitive position?
ManagersManagers
Need all info creditors and investors need Need all info creditors and investors need PLUS:PLUS:
What operating areas have contributed to What operating areas have contributed to success and which have not?success and which have not?
What are strengths/weaknesses of What are strengths/weaknesses of company’s financial position?company’s financial position?
What changes are indicated to improve What changes are indicated to improve future performance?future performance?
Caution!!!Caution!!!
Keep in mind: management PREPARES Keep in mind: management PREPARES financial statementsfinancial statements
Analyst should be alert to potential for Analyst should be alert to potential for management to influence reporting to management to influence reporting to make data more “appealing”make data more “appealing”
May want to supplement analysis with May want to supplement analysis with information apart from Annual Report information apart from Annual Report prepared by managementprepared by management

Steps 2 and 3Steps 2 and 3
Where to look for data...Where to look for data...
Financial statements (and notes)Financial statements (and notes)
Auditor’s reportAuditor’s report
MD&AMD&A
Supplementary schedulesSupplementary schedules
All of the above are in Annual Report -- All of the above are in Annual Report -- can also look further...can also look further...

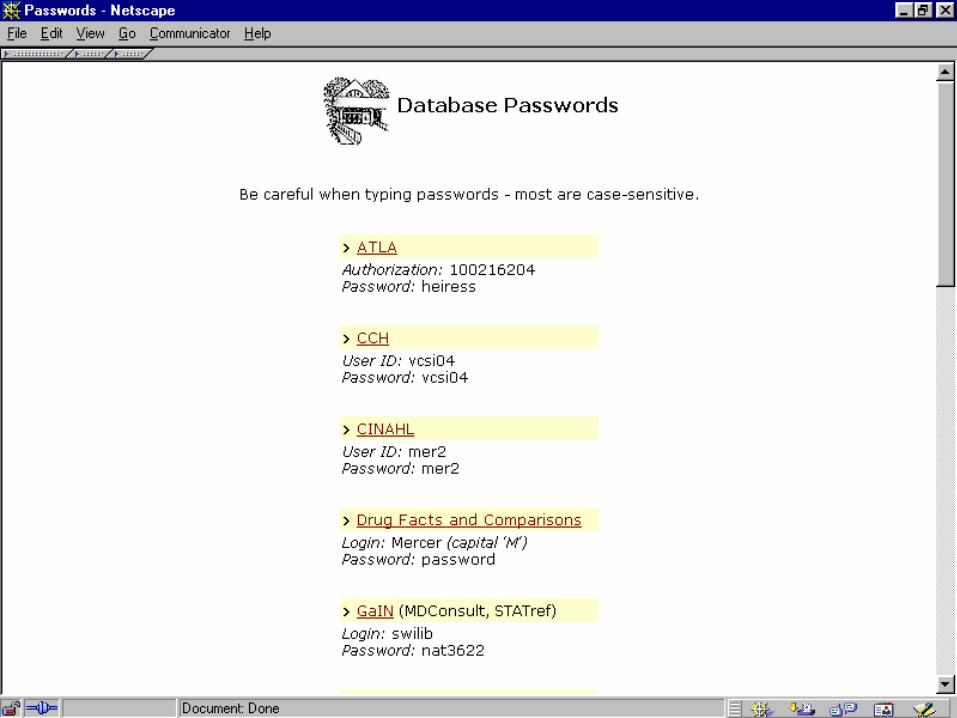
Other Data SourcesOther Data Sources
10K and 10Q reports filed with SEC10K and 10Q reports filed with SEC
Computerized data basesComputerized data bases– Info on industry norms/ratiosInfo on industry norms/ratios– Info on particular companies/industries/mutual Info on particular companies/industries/mutual
fundsfunds
Articles in popular/business press Articles in popular/business press
Ever-expanding websitesEver-expanding websites


ValueLineValueLineUsername and PasswordUsername and Password
Available to Mercer students Available to Mercer students only!only!
USERID: 156339USERID: 156339
Password: stocksPassword: stocks
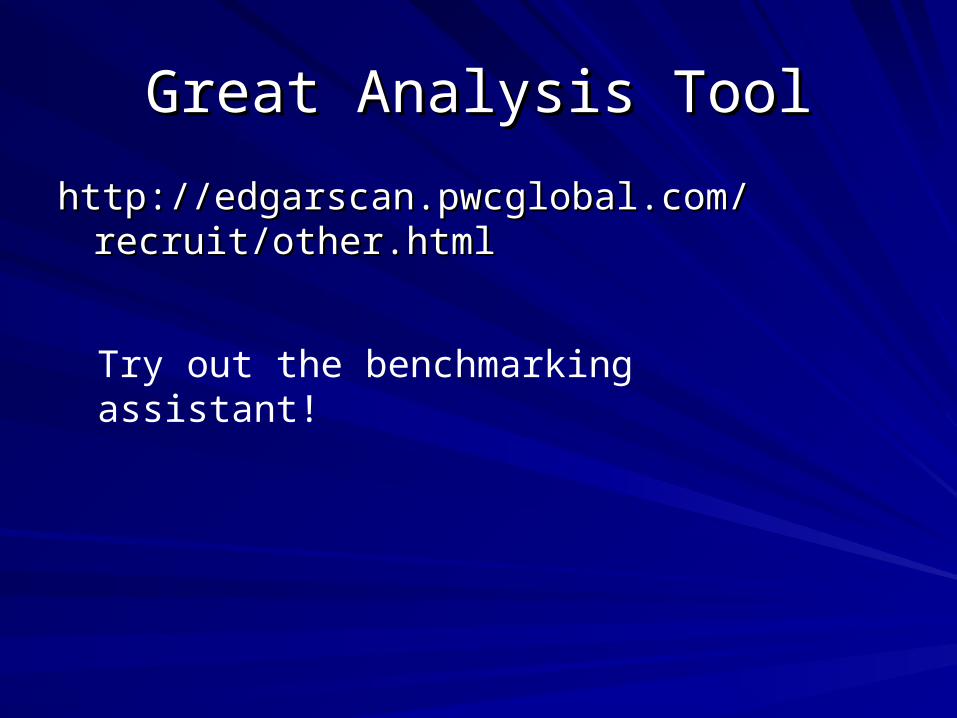
Great Analysis ToolGreat Analysis Tool
http://edgarscan.pwcglobal.com/recruit/other.htmlhttp://edgarscan.pwcglobal.com/recruit/other.html
Try out the benchmarking assistant!

More sources of infoMore sources of info
SIC ManualSIC Manual
Industry Averages and Comparison with Industry Averages and Comparison with CompetitorsCompetitors– The Dept of Commerce Financial ReportThe Dept of Commerce Financial Report– Robert Morris Associates Annual Statement StudiesRobert Morris Associates Annual Statement Studies– Standard & Poor’s Industry SurveysStandard & Poor’s Industry Surveys– Almanac of Business and Industrial Financial RatiosAlmanac of Business and Industrial Financial Ratios– D&B Industry Norms and Key Business RatiosD&B Industry Norms and Key Business Ratios
Compact DisclosureCompact Disclosure

Step 4Step 4
Basic ToolsBasic Tools
Common size financial statementsCommon size financial statements
Financial ratiosFinancial ratios
Trend analysisTrend analysis
Structural analysisStructural analysis
Industry comparisonsIndustry comparisons
Common sense and judgment (often the Common sense and judgment (often the hardest to use!)hardest to use!)
Common Size StatementsCommon Size Statements
Common size income statementCommon size income statement– expresses each income statement category expresses each income statement category
as a percentage of net salesas a percentage of net sales
Common size balance sheetCommon size balance sheet– expresses each item on balance sheet as a expresses each item on balance sheet as a
percentage of total assets or equitiespercentage of total assets or equities
Both statements facilitate structural Both statements facilitate structural analysis of the firmanalysis of the firm
Financial Ratio CategoriesFinancial Ratio Categories
Liquidity RatiosLiquidity Ratios– measure a firm’s ability to meet cash needs measure a firm’s ability to meet cash needs
as they ariseas they arise
Activity RatiosActivity Ratios– measure the liquidity of specific assets and measure the liquidity of specific assets and
the efficiency of managing assetsthe efficiency of managing assets
Ratio Categories (continued)Ratio Categories (continued)
Leverage RatiosLeverage Ratios– measure the extent of a firm’s financing with measure the extent of a firm’s financing with
debt relative to equity and its ability to cover debt relative to equity and its ability to cover interest and other fixed chargesinterest and other fixed charges
Profitability RatiosProfitability Ratios– measure the overall performance of a firm and measure the overall performance of a firm and
its efficiency in managing assets, liabilities its efficiency in managing assets, liabilities and equityand equity

Caution!!!!!!Caution!!!!!!
Ratios are valuable, BUT…..Ratios are valuable, BUT…..– They do not provide answers in an of themselves and They do not provide answers in an of themselves and
are not predictiveare not predictive– They should be used with other elements of financial They should be used with other elements of financial
analysisanalysis– There are no “rules of thumb” that apply to There are no “rules of thumb” that apply to
interpretation of ratiosinterpretation of ratios
KEEPING THIS IN MIND, LET’S TAKE A LOOK KEEPING THIS IN MIND, LET’S TAKE A LOOK AT SOME OF THE RATIOS….AT SOME OF THE RATIOS….
Liquidity RatiosLiquidity Ratios
Current RatioCurrent Ratio– Current Assets/Current LiabilitiesCurrent Assets/Current Liabilities– Measures ability to meet short-term cash needs Measures ability to meet short-term cash needs
Quick or Acid Test RatioQuick or Acid Test Ratio– Current Assets-Inventory/Current LiabilitiesCurrent Assets-Inventory/Current Liabilities– Measure ability to meet short-term cash needs Measure ability to meet short-term cash needs
more rigorouslymore rigorously
Liquidity Ratios (continued)Liquidity Ratios (continued)
Cash Flow Liquidity RatioCash Flow Liquidity Ratio– Cash+Marketable Securities+Cash Flow from Cash+Marketable Securities+Cash Flow from
Operating Activities/Current LiabilitiesOperating Activities/Current Liabilities– Focuses on ability of the firm to generate Focuses on ability of the firm to generate
operating cash flows as a source of liquidityoperating cash flows as a source of liquidity
Activity RatiosActivity Ratios
Average Collection PeriodAverage Collection Period– Accounts Receivable/Average Daily SalesAccounts Receivable/Average Daily Sales– Helps gauge liquidity of accounts receivable (ability to Helps gauge liquidity of accounts receivable (ability to
collect cash from customers)collect cash from customers)
Accounts Receivable TurnoverAccounts Receivable Turnover– Net Sales/Accounts ReceivableNet Sales/Accounts Receivable– Another measure of efficiency of firm’s collection and Another measure of efficiency of firm’s collection and
credit policiescredit policies

Activity Ratios (continued)Activity Ratios (continued)
Inventory TurnoverInventory Turnover– Cost of Goods Sold/InventoryCost of Goods Sold/Inventory– Measures efficiency of inventory managementMeasures efficiency of inventory management
Fixed Asset and Total Asset TurnoverFixed Asset and Total Asset Turnover– Net Sales/Net PP&E (Fixed Asset T/O)Net Sales/Net PP&E (Fixed Asset T/O)– Net Sales/Total Assets (Total Asset T/O)Net Sales/Total Assets (Total Asset T/O)– Both assess effectiveness in generating sales from Both assess effectiveness in generating sales from
investment in assetsinvestment in assets
Leverage: Debt RatiosLeverage: Debt Ratios
Debt RatioDebt Ratio– Total Liabilities/Total AssetsTotal Liabilities/Total Assets
Long-Term Debt to Total CapitalizationLong-Term Debt to Total Capitalization– Long-term Debt/Long-term Debt + Stockholders’ Long-term Debt/Long-term Debt + Stockholders’
EquityEquity
Debt to Equity RatioDebt to Equity Ratio– Total Liabilities/Stockholders’ EquityTotal Liabilities/Stockholders’ Equity
All three measure extent of firm’s financing with All three measure extent of firm’s financing with debtdebt

Leverage: Coverage RatiosLeverage: Coverage Ratios
Proportion and amount of debt in capital Proportion and amount of debt in capital structure is important to analyststructure is important to analyst
Tradeoff between risk and returnTradeoff between risk and return
Use of debt involves risk -- commitment to Use of debt involves risk -- commitment to fixed chargesfixed charges
Fixed charges must be COVERED -- Fixed charges must be COVERED -- following are some ratios to assess following are some ratios to assess coverage…...coverage…...
Coverage Ratios (continued)Coverage Ratios (continued)
Times Interest EarnedTimes Interest Earned– Operating Profit/Interest ExpenseOperating Profit/Interest Expense– Indicates how well operating earnings cover Indicates how well operating earnings cover
fixed interest chargesfixed interest charges
Fixed Charge CoverageFixed Charge Coverage– Operating Profit + Lease Payments/Interest Operating Profit + Lease Payments/Interest
Expense + Lease PaymentsExpense + Lease Payments– Broader measure of how well operating Broader measure of how well operating
earnings cover fixed chargesearnings cover fixed charges
Coverage Ratios (continued)Coverage Ratios (continued)
Cash Flow AdequacyCash Flow Adequacy– Cash Flow from Operating Activities/ Average Cash Flow from Operating Activities/ Average
Annual Long-Term Debt MaturitiesAnnual Long-Term Debt Maturities– Measures firm’s ability to cover long-term debt Measures firm’s ability to cover long-term debt
maturities each yearmaturities each year– Rationale is that over the long-run operating Rationale is that over the long-run operating
cash flows must be adequate to cover cash flows must be adequate to cover investing activities financed with debtinvesting activities financed with debt

Profitability RatiosProfitability Ratios
Gross Profit MarginGross Profit Margin– Gross Profit/Net SalesGross Profit/Net Sales
Operating Profit MarginOperating Profit Margin– Operating Profit/Net SalesOperating Profit/Net Sales
Net Profit MarginNet Profit Margin– Net Earnings/Net SalesNet Earnings/Net Sales
All measure firm’s ability to translate sales All measure firm’s ability to translate sales dollars into profitsdollars into profits

Profitability Ratios (continued)Profitability Ratios (continued)
Cash Flow MarginCash Flow Margin– Cash Flow from Operating Activities / Net Cash Flow from Operating Activities / Net
SalesSales– Measures ability to translate sales into cash Measures ability to translate sales into cash
(with which to pay bills!)(with which to pay bills!)
Profitability Ratios (continued)Profitability Ratios (continued)
Return on Investment (or Return on Return on Investment (or Return on Assets -- same thing, different words!)Assets -- same thing, different words!)– Net Earnings/Total AssetsNet Earnings/Total Assets
Return on EquityReturn on Equity– Net Earnings/Stockholders’ EquityNet Earnings/Stockholders’ Equity
Both measure overall efficiency of firm in Both measure overall efficiency of firm in managing investment in assets and managing investment in assets and generating return to stockholdersgenerating return to stockholders
Profitability Ratios (continued)Profitability Ratios (continued)
Cash Return on AssetsCash Return on Assets– Cash Flow from Operating Activities / Total Cash Flow from Operating Activities / Total
AssetsAssets– Useful comparison to return on investmentUseful comparison to return on investment– Indicates firm’s ability to generate cash from Indicates firm’s ability to generate cash from
utilizing its assetsutilizing its assets
Other Ratios You Hear About..Other Ratios You Hear About..
Earnings per Common ShareEarnings per Common Share– Net Earnings/Average Common Shares Net Earnings/Average Common Shares
OutstandingOutstanding– Indicates return on a per share basisIndicates return on a per share basis
Price to EarningsPrice to Earnings– Market Price of Common Stock/Earnings per Market Price of Common Stock/Earnings per
Common ShareCommon Share– Expresses a multiple the stock market places Expresses a multiple the stock market places
on earningson earnings
Other Ratios (continued)Other Ratios (continued)
Dividend PayoutDividend Payout– Dividends per Share/Earnings per ShareDividends per Share/Earnings per Share– Shows percentage of earnings paid out to Shows percentage of earnings paid out to
stockholdersstockholders
Dividend YieldDividend Yield– Dividends per Share/Market Price of Common Dividends per Share/Market Price of Common
ShareShare– Shows rate earned by shareholders from dividends Shows rate earned by shareholders from dividends
relative to current stock pricerelative to current stock price

Analyzing the CompanyAnalyzing the Company
Now that some of the “tools” of financial Now that some of the “tools” of financial analysis have been illustrated, where does analysis have been illustrated, where does one go from here?one go from here?

Step 5Step 5
Red FlagsRed Flags
Changes in top company managementChanges in top company management
Key financial ratios indicating deteriorating Key financial ratios indicating deteriorating trends and/or weaknesses relative to trends and/or weaknesses relative to industry competitorsindustry competitors
Cash flow from operations declining, Cash flow from operations declining, negative, volatile, or not tracking with net negative, volatile, or not tracking with net income.income.
Lack of profitability in key operating areas.Lack of profitability in key operating areas.
More Red FlagsMore Red Flags
Price to earnings ratio low relative to Price to earnings ratio low relative to competitorscompetitors
Firm’s earnings less than after-tax cost of Firm’s earnings less than after-tax cost of debtdebt
Declining operating profits when debt is Declining operating profits when debt is risingrising
Deteriorating trends in operating segmentsDeteriorating trends in operating segments

AccomplishmentsAccomplishments
Reviewed all the basic financial Reviewed all the basic financial statements and know what they arestatements and know what they are
Practiced the rudiments of financial Practiced the rudiments of financial analysisanalysis
If nothing else, hopefully gained an If nothing else, hopefully gained an appreciation of what information is appreciation of what information is available and how one might use it...available and how one might use it...
A Final NoteA Final Note
Financial analysis is only as good as the Financial analysis is only as good as the information upon which it is based -- information upon which it is based -- hence we need to be concerned about hence we need to be concerned about honest, straightforward, comprehensible honest, straightforward, comprehensible financial reportingfinancial reporting
Financial analysis is only valuable to me if Financial analysis is only valuable to me if it answers MY questions -- I need to it answers MY questions -- I need to THINK about what I need/would like to THINK about what I need/would like to know BEFORE I crunch numbersknow BEFORE I crunch numbers
A Final Final Note (really!)A Final Final Note (really!)
Analyzing financial information can be fun Analyzing financial information can be fun (as well as profitable)(as well as profitable)
You can never know too much about a You can never know too much about a company you plan to have a relationship company you plan to have a relationship with (as an investor, a creditor, a manager, with (as an investor, a creditor, a manager, an employee)an employee)
Related Documents