CUSUM Module 1. Minitab basics Presented by: QE NPI Andrés Ruelas Created by: QE NPI Andrés Ruelas www.cusum.mx Minitab Masters Thank you for helping us grow! WhatsApp us at +52-664-518-4302 https://www.facebook.com/CusumMx/

Welcome message from author
This document is posted to help you gain knowledge. Please leave a comment to let me know what you think about it! Share it to your friends and learn new things together.
Transcript

CUSUM
Module 1. Minitab basics
Presented by: QE NPI Andrés Ruelas
Created by: QE NPI Andrés Ruelaswww.cusum.mx
Minitab MastersThank you for helping us grow!
WhatsApp us at +52-664-518-4302https://www.facebook.com/CusumMx/
Speaker: Andrés Ruelas• Quality and New Product Introduction Engineer
• Medical sector (Cardinal Health, Medtronic, Stryker)
• Specialized in molding, extrusion, sealing with Urania and Multivac equipment, and automatic inspection systems
• 2 published textbooks, available at Amazon• Quality Engineering for Recent College Graduates (Enginerring / Quality)• Guía Para la inversión utilizando Cetes Directo (Finance / Costs)
• Cetys Universidad: Diploma in Medical Manufacturing Engineering
• Cetys Universidad: Diploma in Cost Engineering
• Cetys Universidad: Diploma in Project Management
• Eje Instituto: Seminar in Scientific Molding
• Trained for Certified Quality Engineer Exam
• Minitab YouTube channel with more than 10,000 views and 1,200 of training hours given
CUSUM
Created by: QE NPI Andrés Ruelaswww.cusum.mx
Minitab MastersThank you for helping us grow!
WhatsApp us at +52-664-518-4302https://www.facebook.com/CusumMx/

Training and Courses Given• YouTube Channel: CUSUM –
Training For Professionals
• Views: +10,000 People
• Videos: 6 Videos focused on Minitab
• Hours given: 1,200 hours
Instructor at Academia Lean Six Sigma – Bit Center
Courses given
• Root Cause Analysis in Minitab (RCA)
• Statistical Analysis for Validations with Minitab
CUSUM
Created by: QE NPI Andrés Ruelaswww.cusum.mx
Minitab MastersThank you for helping us grow!
WhatsApp us at +52-664-518-4302https://www.facebook.com/CusumMx/
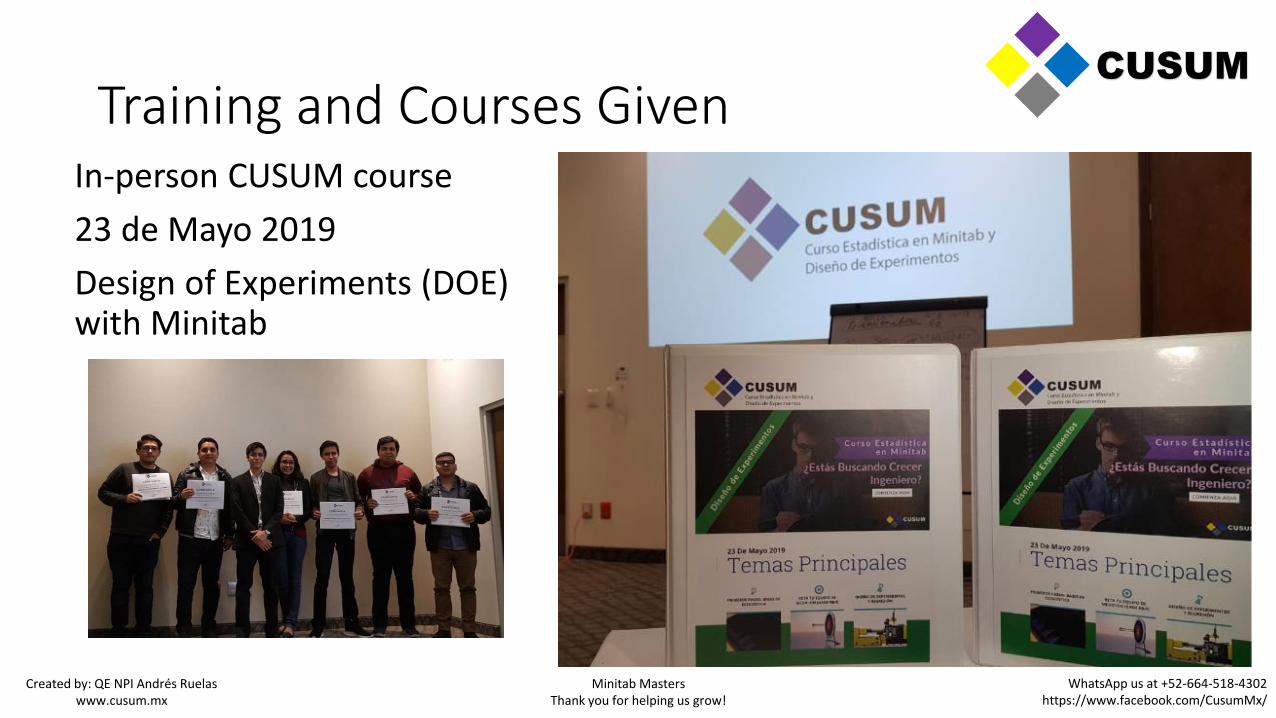
Training and Courses GivenIn-person CUSUM course
23 de Mayo 2019
Design of Experiments (DOE) with Minitab
CUSUM
Created by: QE NPI Andrés Ruelaswww.cusum.mx
Minitab MastersThank you for helping us grow!
WhatsApp us at +52-664-518-4302https://www.facebook.com/CusumMx/

Note on Minitab 19 CUSUM
• To this date, there are multiple Minitab versions available (16, 17, 18 and 19)
• All of them contain the same features, though the arrangement can be slightly different.
• Minitab 19 has been just launched on June 1, 2019, and is not currently being used by most companies. However, the interface and analyses are very similar. The distinctions will be apparent through the course.
Created by: QE NPI Andrés Ruelaswww.cusum.mx
Minitab MastersThank you for helping us grow!
WhatsApp us at +52-664-518-4302https://www.facebook.com/CusumMx/
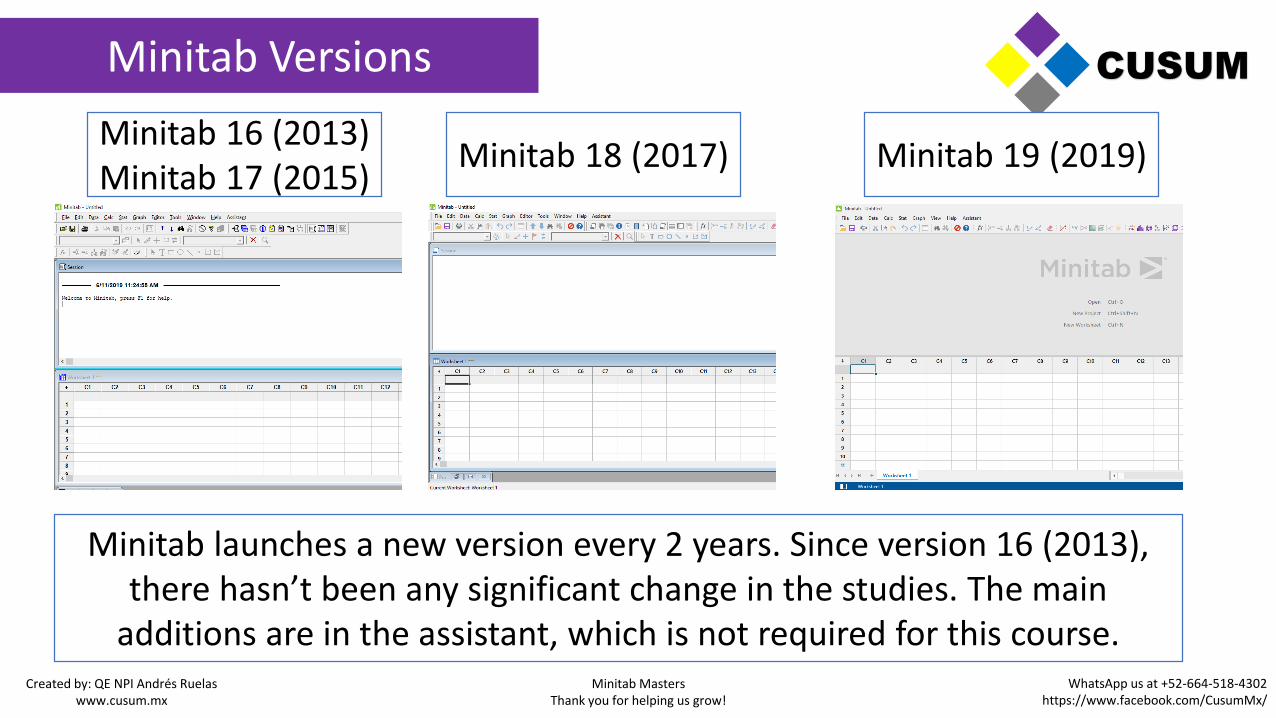
Minitab Versions CUSUM
Minitab 16 (2013)Minitab 17 (2015)
Minitab 18 (2017) Minitab 19 (2019)
Minitab launches a new version every 2 years. Since version 16 (2013), there hasn’t been any significant change in the studies. The main
additions are in the assistant, which is not required for this course.Created by: QE NPI Andrés Ruelas
www.cusum.mxMinitab Masters
Thank you for helping us grow!WhatsApp us at +52-664-518-4302
https://www.facebook.com/CusumMx/

Minitab Interface
Toolbars
Session window
Worksheet
CUSUM
Created by: QE NPI Andrés Ruelaswww.cusum.mx
Minitab MastersThank you for helping us grow!
WhatsApp us at +52-664-518-4302https://www.facebook.com/CusumMx/
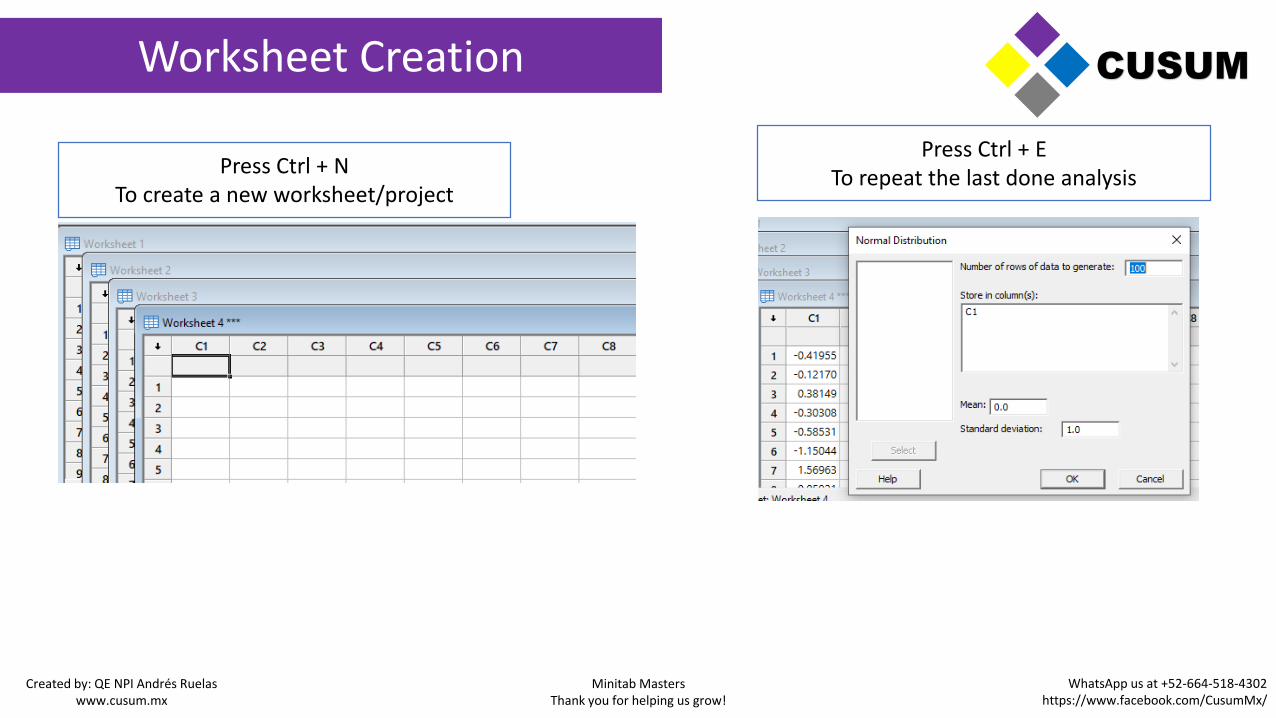
Worksheet Creation
Press Ctrl + NTo create a new worksheet/project
Press Ctrl + ETo repeat the last done analysis
CUSUM
Created by: QE NPI Andrés Ruelaswww.cusum.mx
Minitab MastersThank you for helping us grow!
WhatsApp us at +52-664-518-4302https://www.facebook.com/CusumMx/
Types of Data in Minitab
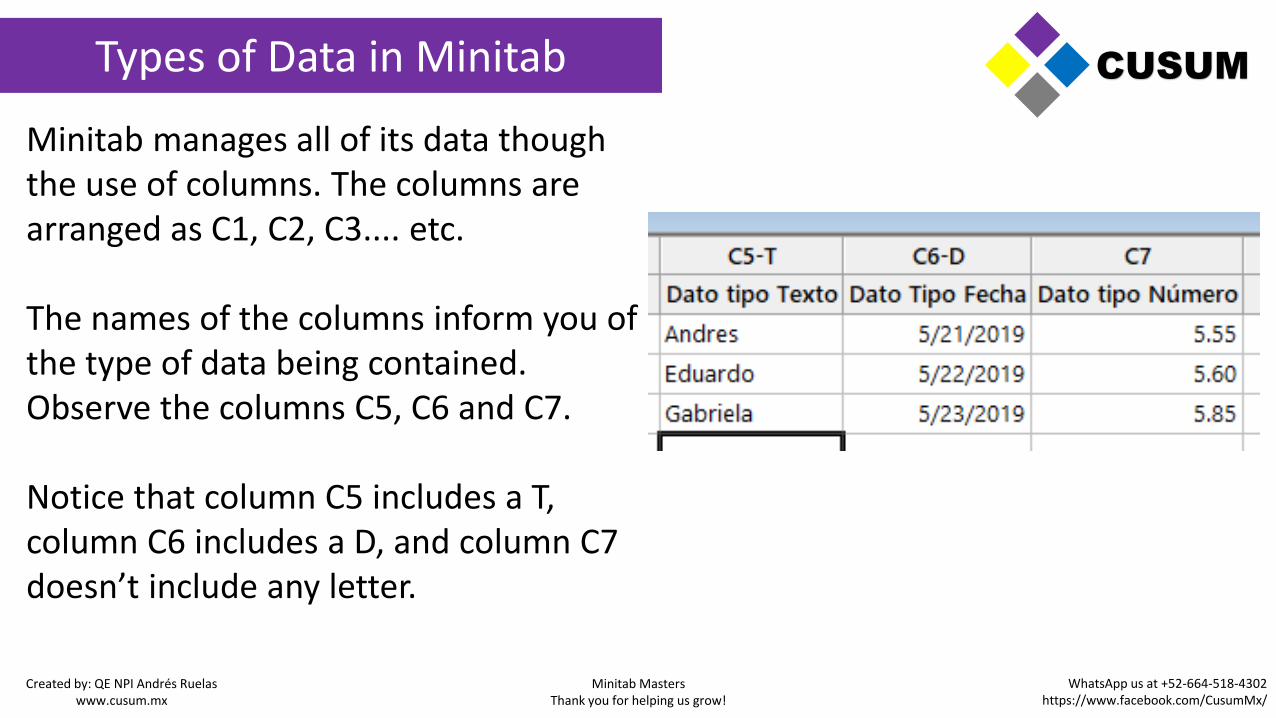
Minitab manages all of its data though the use of columns. The columns are arranged as C1, C2, C3.... etc.
The names of the columns inform you of the type of data being contained.Observe the columns C5, C6 and C7.
Notice that column C5 includes a T, column C6 includes a D, and column C7 doesn’t include any letter.
CUSUM
Created by: QE NPI Andrés Ruelaswww.cusum.mx
Minitab MastersThank you for helping us grow!
WhatsApp us at +52-664-518-4302https://www.facebook.com/CusumMx/
Types of Data in Minitab
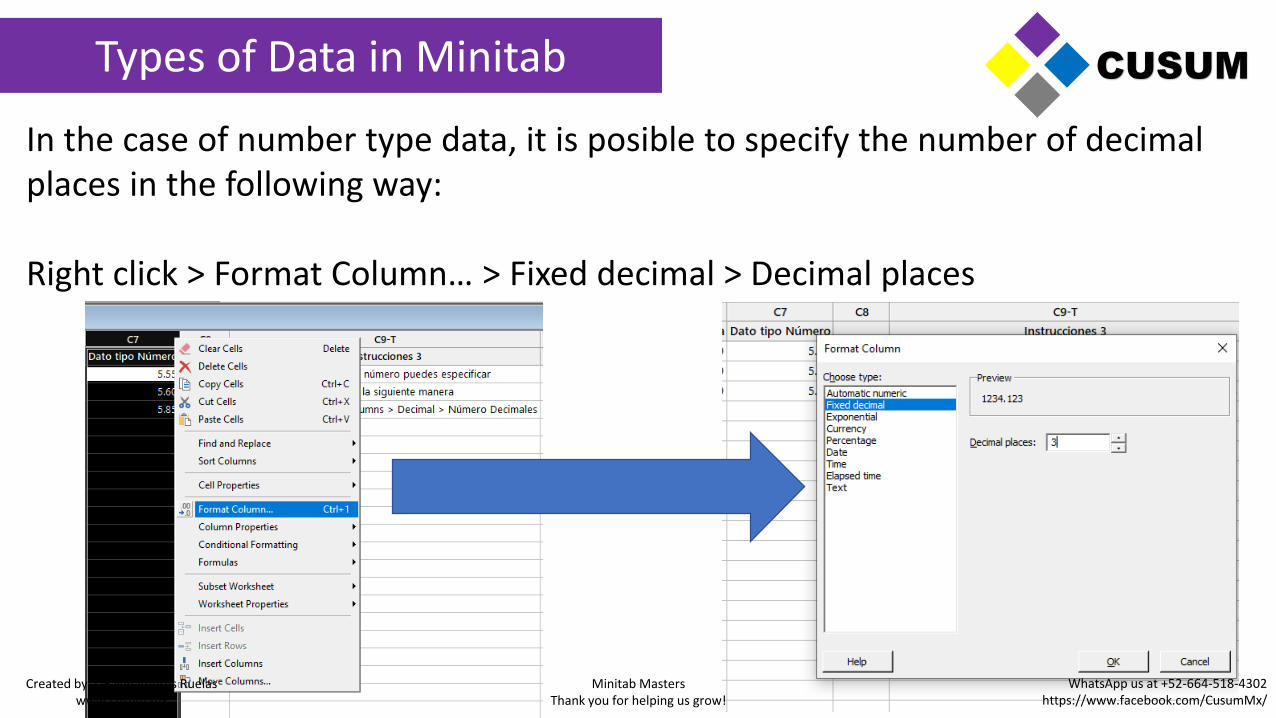
In the case of number type data, it is posible to specify the number of decimal places in the following way:
Right click > Format Column… > Fixed decimal > Decimal places
CUSUM
Created by: QE NPI Andrés Ruelaswww.cusum.mx
Minitab MastersThank you for helping us grow!
WhatsApp us at +52-664-518-4302https://www.facebook.com/CusumMx/

Types of Data in Minitab
You can also specify date and currency format (e.g. Dollars):
Right click > Format Column… > Date > Date formatRight click > Format Column… > Currency > Currency format
CUSUM
Created by: QE NPI Andrés Ruelaswww.cusum.mx
Minitab MastersThank you for helping us grow!
WhatsApp us at +52-664-518-4302https://www.facebook.com/CusumMx/
Types of Data in Minitab
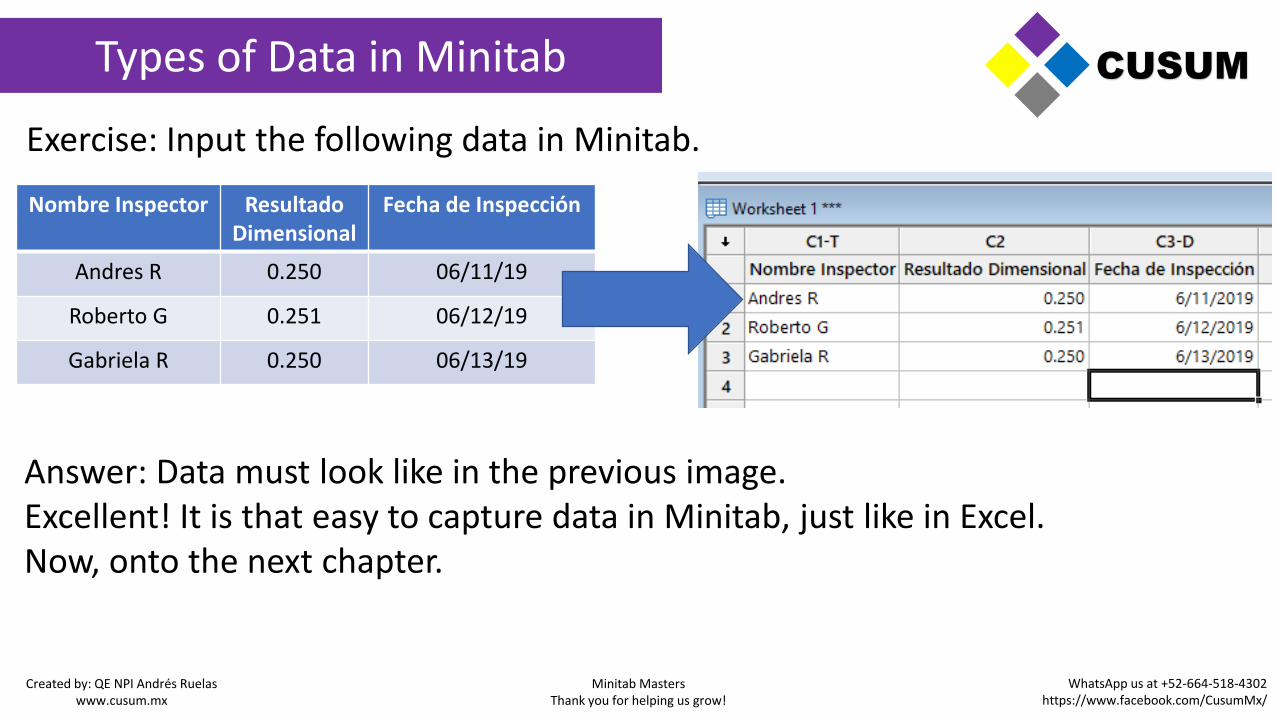
Exercise: Input the following data in Minitab.
CUSUM
Nombre Inspector Resultado Dimensional
Fecha de Inspección
Andres R 0.250 06/11/19
Roberto G 0.251 06/12/19
Gabriela R 0.250 06/13/19
Answer: Data must look like in the previous image.Excellent! It is that easy to capture data in Minitab, just like in Excel.Now, onto the next chapter.
Created by: QE NPI Andrés Ruelaswww.cusum.mx
Minitab MastersThank you for helping us grow!
WhatsApp us at +52-664-518-4302https://www.facebook.com/CusumMx/

Organizing Data in Minitab
Notice that the worksheet has a name. In this case, it is called “Worksheet 1”. You can assign a unique name to this worksheet through the Project Manager.
CUSUM
Created by: QE NPI Andrés Ruelaswww.cusum.mx
Minitab MastersThank you for helping us grow!
WhatsApp us at +52-664-518-4302https://www.facebook.com/CusumMx/
Organizing Data in Minitab
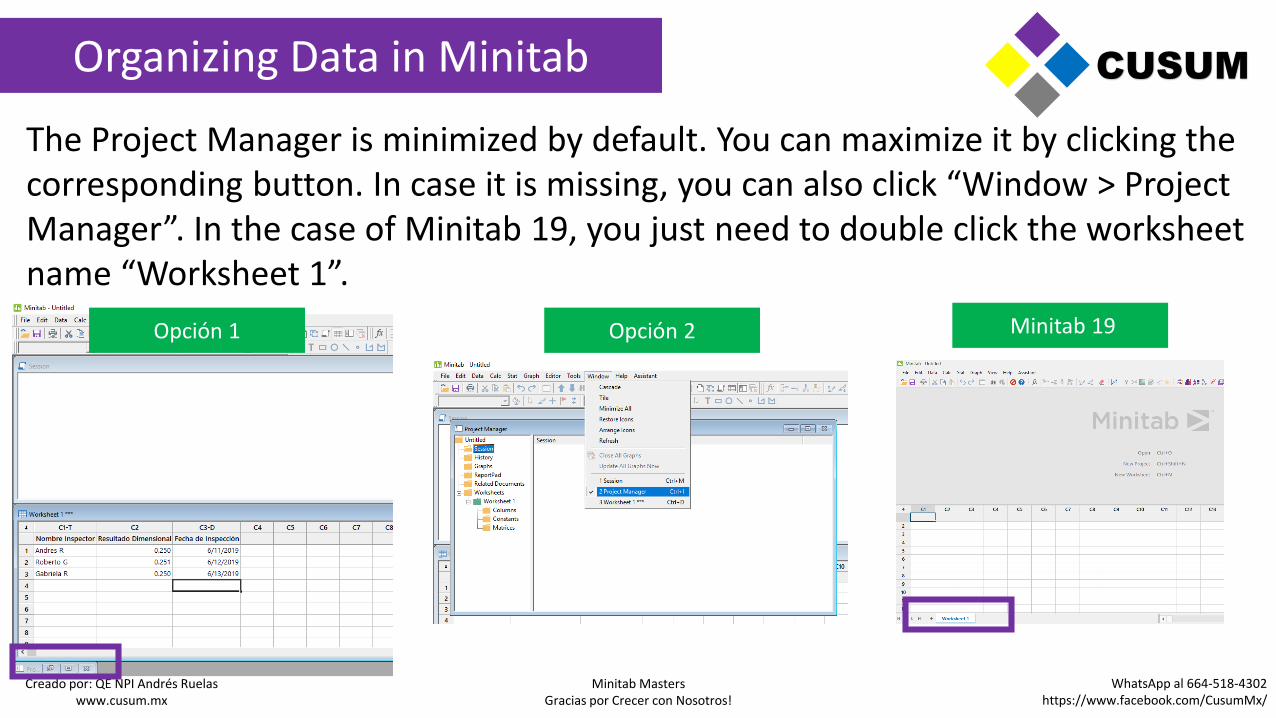
The Project Manager is minimized by default. You can maximize it by clicking thecorresponding button. In case it is missing, you can also click “Window > Project Manager”. In the case of Minitab 19, you just need to double click the worksheetname “Worksheet 1”.
Creado por: QE NPI Andrés Ruelaswww.cusum.mx
Minitab MastersGracias por Crecer con Nosotros!
WhatsApp al 664-518-4302https://www.facebook.com/CusumMx/
CUSUM
Opción 1 Opción 2 Minitab 19
Organizing Data in Minitab
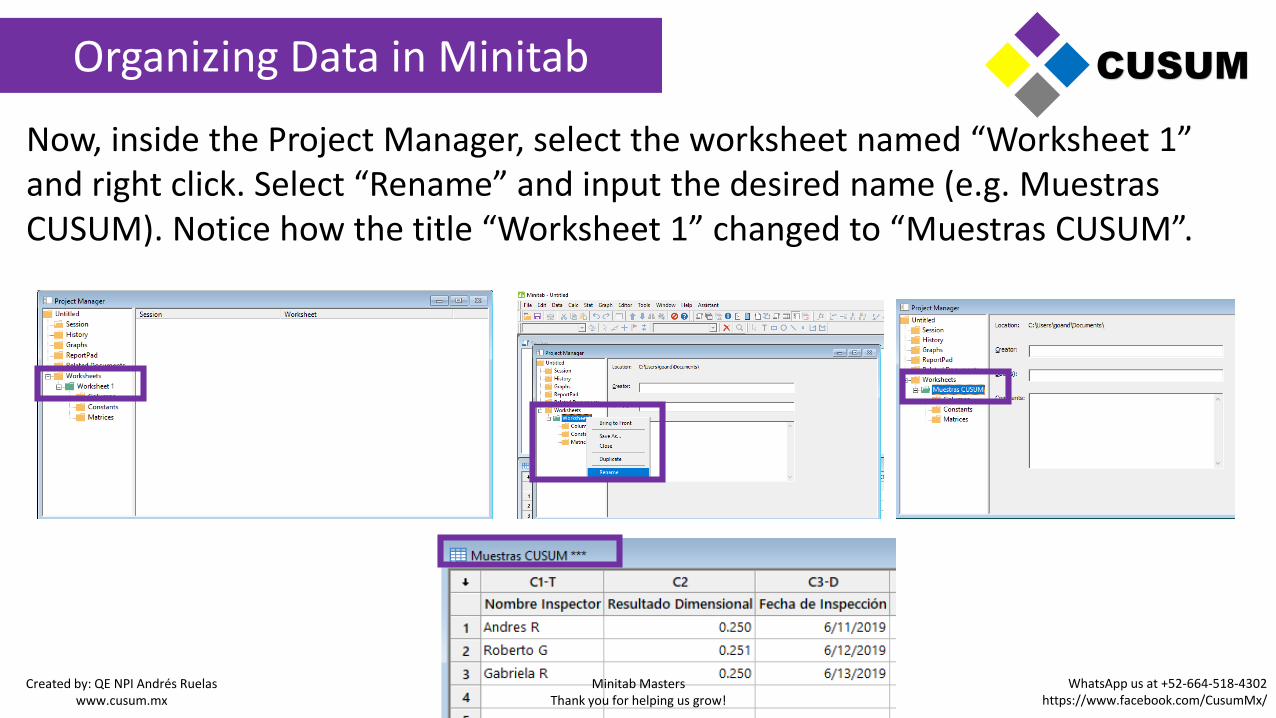
Now, inside the Project Manager, select the worksheet named “Worksheet 1” and right click. Select “Rename” and input the desired name (e.g. MuestrasCUSUM). Notice how the title “Worksheet 1” changed to “Muestras CUSUM”.
CUSUM
Created by: QE NPI Andrés Ruelaswww.cusum.mx
Minitab MastersThank you for helping us grow!
WhatsApp us at +52-664-518-4302https://www.facebook.com/CusumMx/

Organizing Data in Minitab
This is important, since Minitab doesn’t allow for two or more columns, on a same worksheet, to have the same name. Try to write the name “Inspector” in C4 and notice that Minitab shows an error.If you’re interested in capturing information with the same column name again, it is preferred to create a new worksheet and name it in a different manner. (e.g. “Order #”, “Product #”, etc.)
CUSUM
Created by: QE NPI Andrés Ruelaswww.cusum.mx
Minitab MastersThank you for helping us grow!
WhatsApp us at +52-664-518-4302https://www.facebook.com/CusumMx/

Understanding Basic Analyses
Minitab is a program designed to perform statistical analyses. The top menu includes all analyses available in Minitab, grouped in categories.
CUSUM
The main menus to run analyses in Minitab are Stat and Graph.In summary, the menus contain the following options:• File and Edit: Tools to open and configure files• Data and Calc: Tools to configure columns• Stat: Tools to run statistical analyses• Graph: Tools to create visual graphs• Editor and Tools: Seldom used, mainly for macros• Window and Help: If a window minimizes and you can’t
find it, you can select it by using “Window”.• Assistant: It’s a tool that guides you, step by step, to
create basic analyses (DOE, ANOVA, Regression), it is limited, but useful in case of doubt.
Created by: QE NPI Andrés Ruelaswww.cusum.mx
Minitab MastersThank you for helping us grow!
WhatsApp us at +52-664-518-4302https://www.facebook.com/CusumMx/
Understanding Basic Analyses
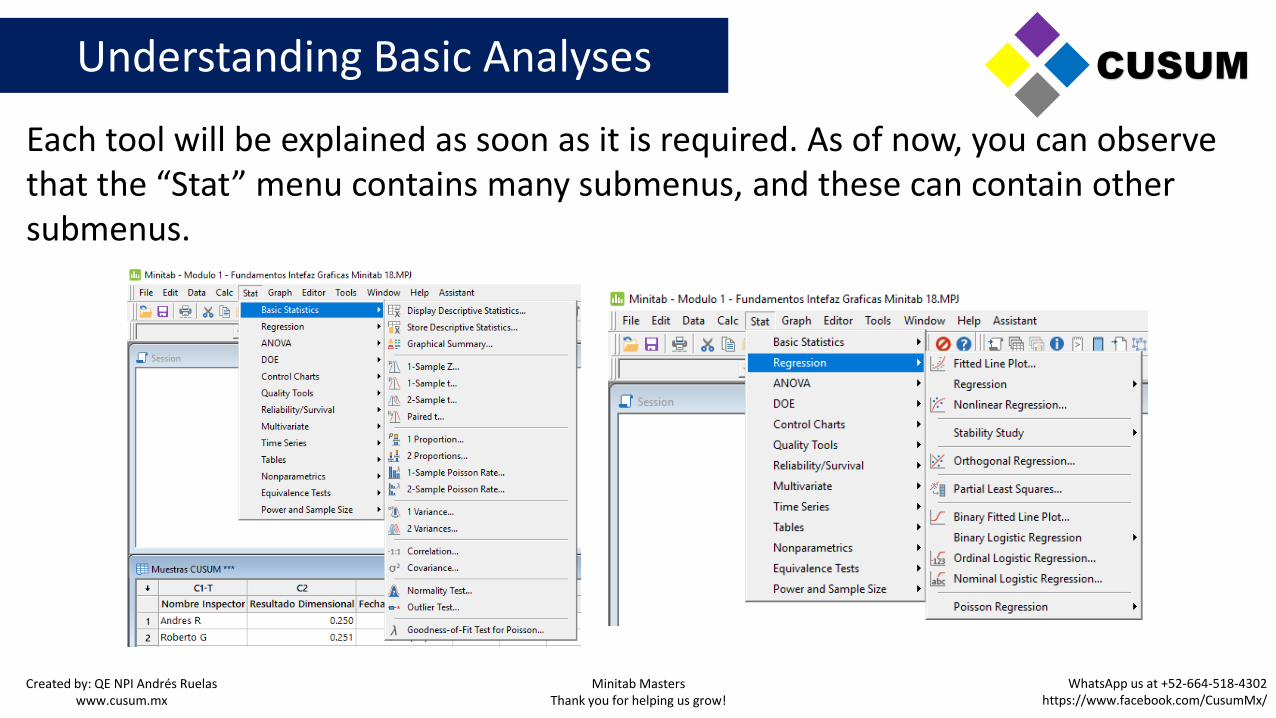
Each tool will be explained as soon as it is required. As of now, you can observe that the “Stat” menu contains many submenus, and these can contain other submenus.
CUSUM
Created by: QE NPI Andrés Ruelaswww.cusum.mx
Minitab MastersThank you for helping us grow!
WhatsApp us at +52-664-518-4302https://www.facebook.com/CusumMx/
Understanding Basic Analyses
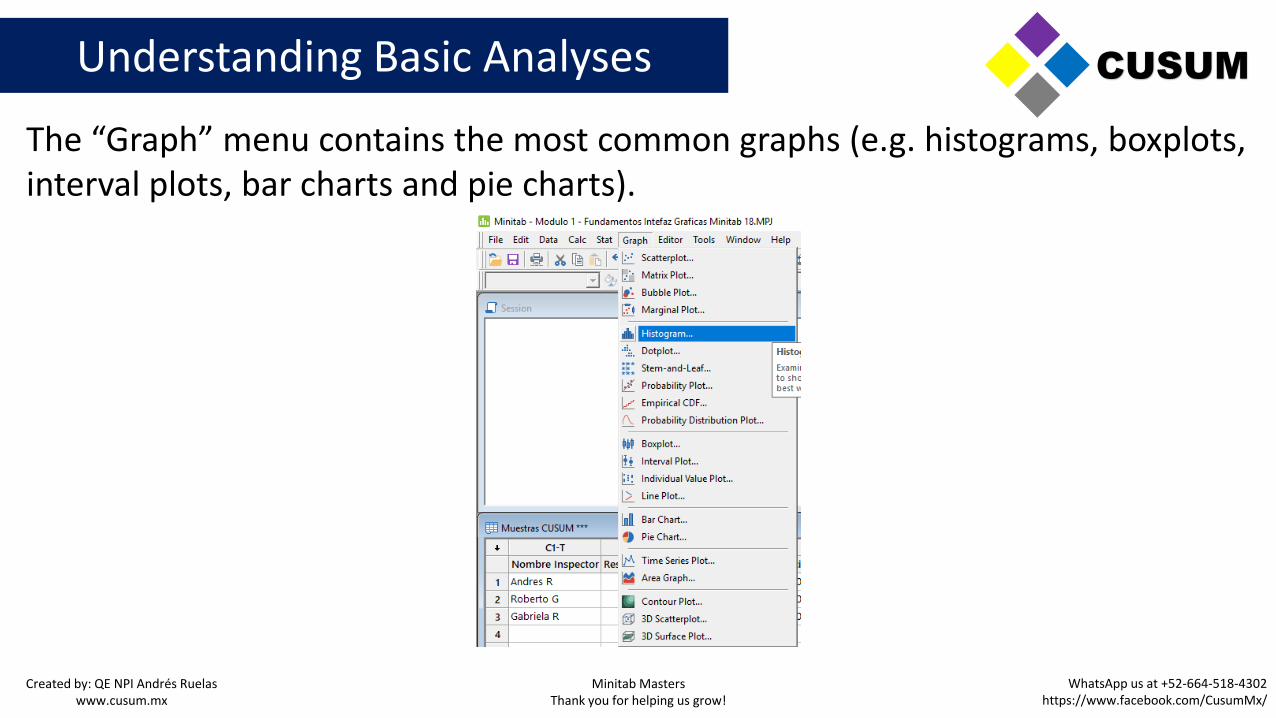
The “Graph” menu contains the most common graphs (e.g. histograms, boxplots, interval plots, bar charts and pie charts).
CUSUM
Created by: QE NPI Andrés Ruelaswww.cusum.mx
Minitab MastersThank you for helping us grow!
WhatsApp us at +52-664-518-4302https://www.facebook.com/CusumMx/
Creating Graphs - Histogram
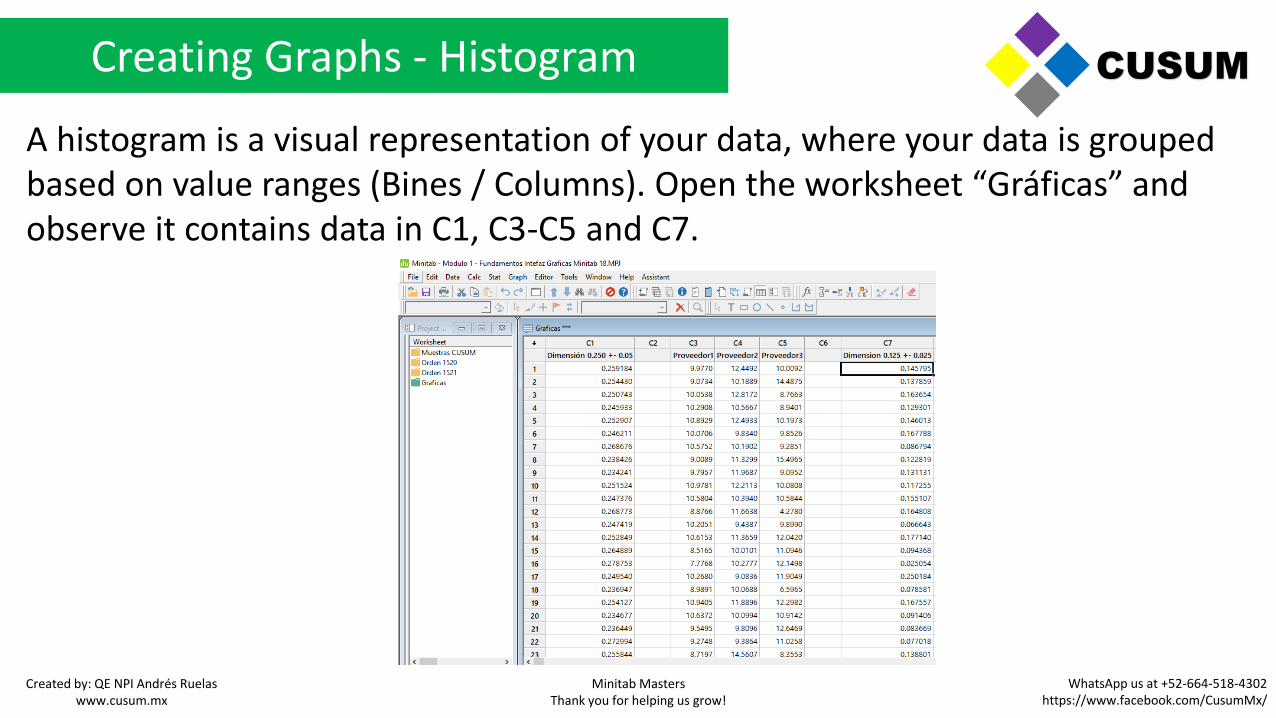
A histogram is a visual representation of your data, where your data is grouped based on value ranges (Bines / Columns). Open the worksheet “Gráficas” and observe it contains data in C1, C3-C5 and C7.
CUSUM
Created by: QE NPI Andrés Ruelaswww.cusum.mx
Minitab MastersThank you for helping us grow!
WhatsApp us at +52-664-518-4302https://www.facebook.com/CusumMx/
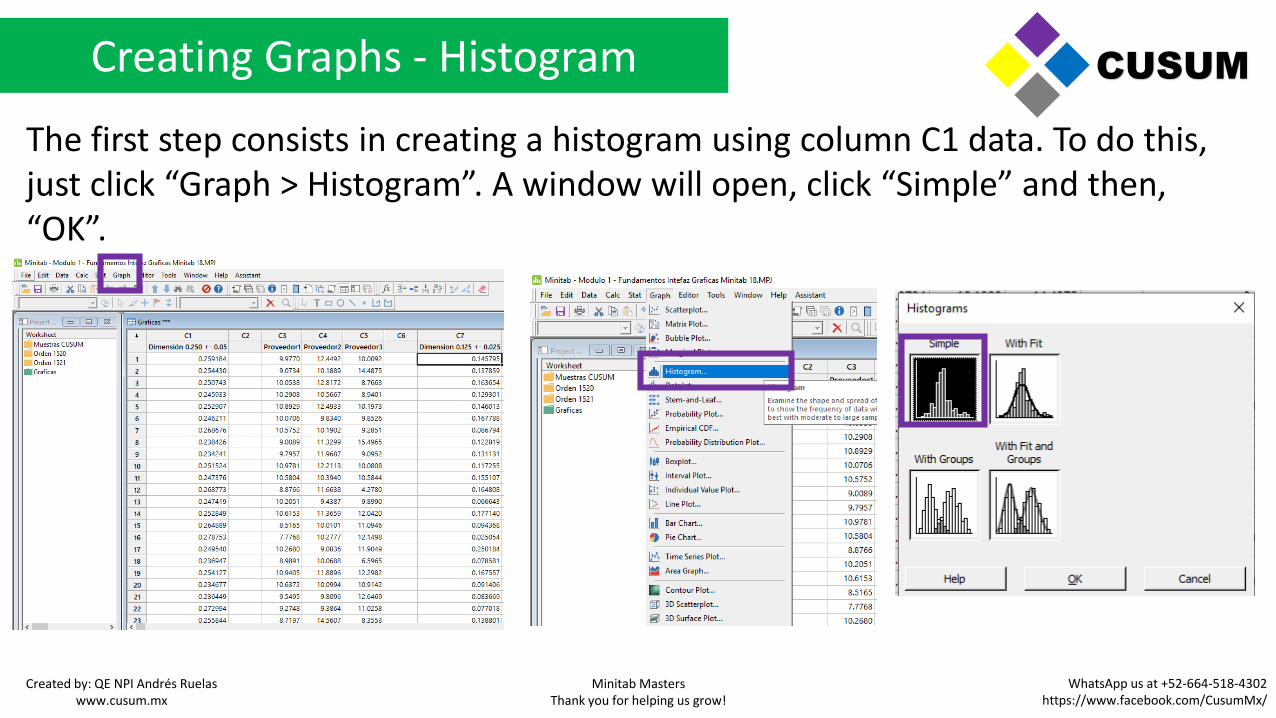
Creating Graphs - Histogram
The first step consists in creating a histogram using column C1 data. To do this, just click “Graph > Histogram”. A window will open, click “Simple” and then, “OK”.
CUSUM
Created by: QE NPI Andrés Ruelaswww.cusum.mx
Minitab MastersThank you for helping us grow!
WhatsApp us at +52-664-518-4302https://www.facebook.com/CusumMx/

Creating Graphs - Histogram
Now, Minitab will show a settings window. All of these windows follow the same format. The information can change slightly, but they are very similar to each other.
CUSUM
The left section shows the columns with data that can be analyzed.
The right section shows the variable that willbe analyzed.
Created by: QE NPI Andrés Ruelaswww.cusum.mx
Minitab MastersThank you for helping us grow!
WhatsApp us at +52-664-518-4302https://www.facebook.com/CusumMx/
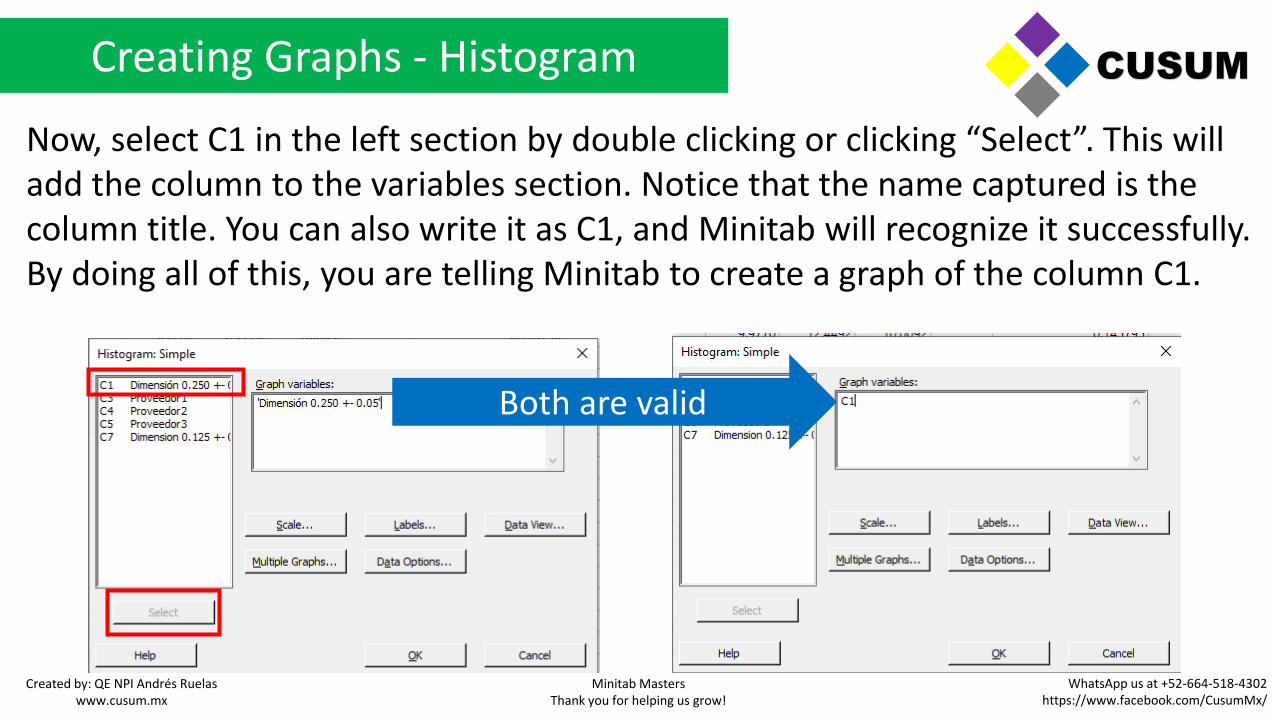
Creating Graphs - Histogram
Now, select C1 in the left section by double clicking or clicking “Select”. This will add the column to the variables section. Notice that the name captured is the column title. You can also write it as C1, and Minitab will recognize it successfully. By doing all of this, you are telling Minitab to create a graph of the column C1.
CUSUM
Both are valid
Created by: QE NPI Andrés Ruelaswww.cusum.mx
Minitab MastersThank you for helping us grow!
WhatsApp us at +52-664-518-4302https://www.facebook.com/CusumMx/
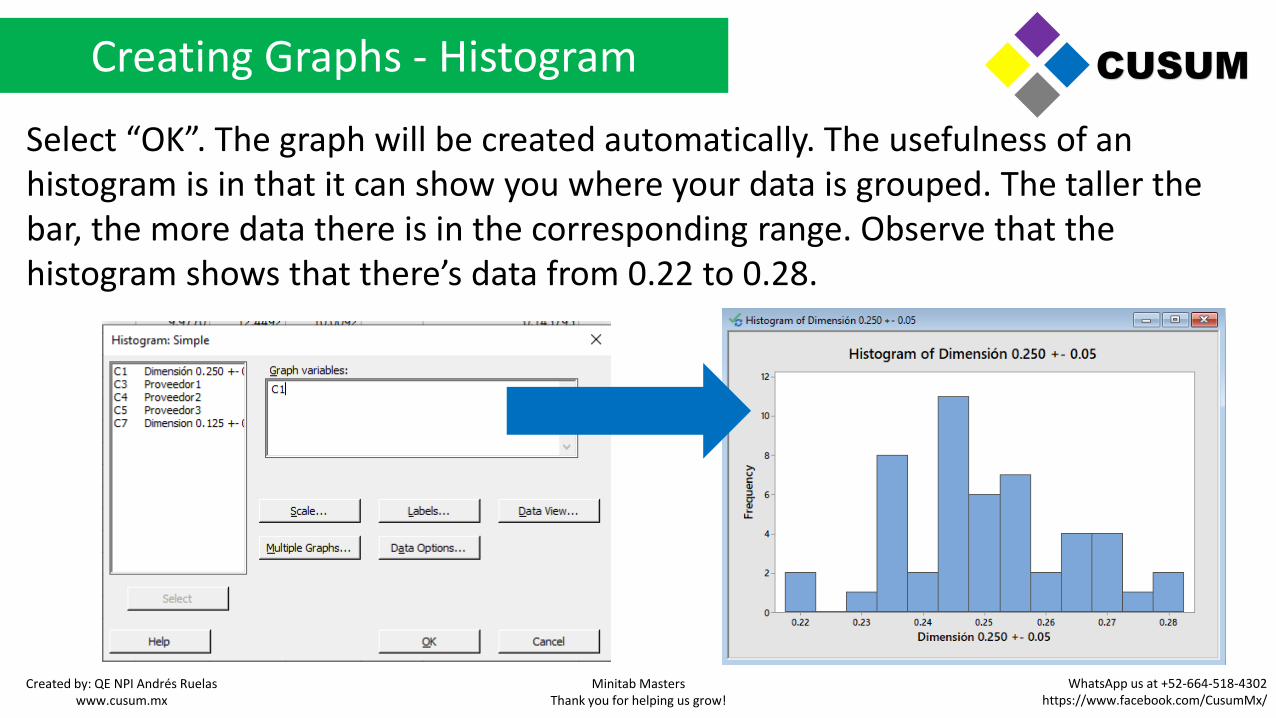
Creating Graphs - Histogram
Select “OK”. The graph will be created automatically. The usefulness of an histogram is in that it can show you where your data is grouped. The taller the bar, the more data there is in the corresponding range. Observe that the histogram shows that there’s data from 0.22 to 0.28.
CUSUM
Created by: QE NPI Andrés Ruelaswww.cusum.mx
Minitab MastersThank you for helping us grow!
WhatsApp us at +52-664-518-4302https://www.facebook.com/CusumMx/
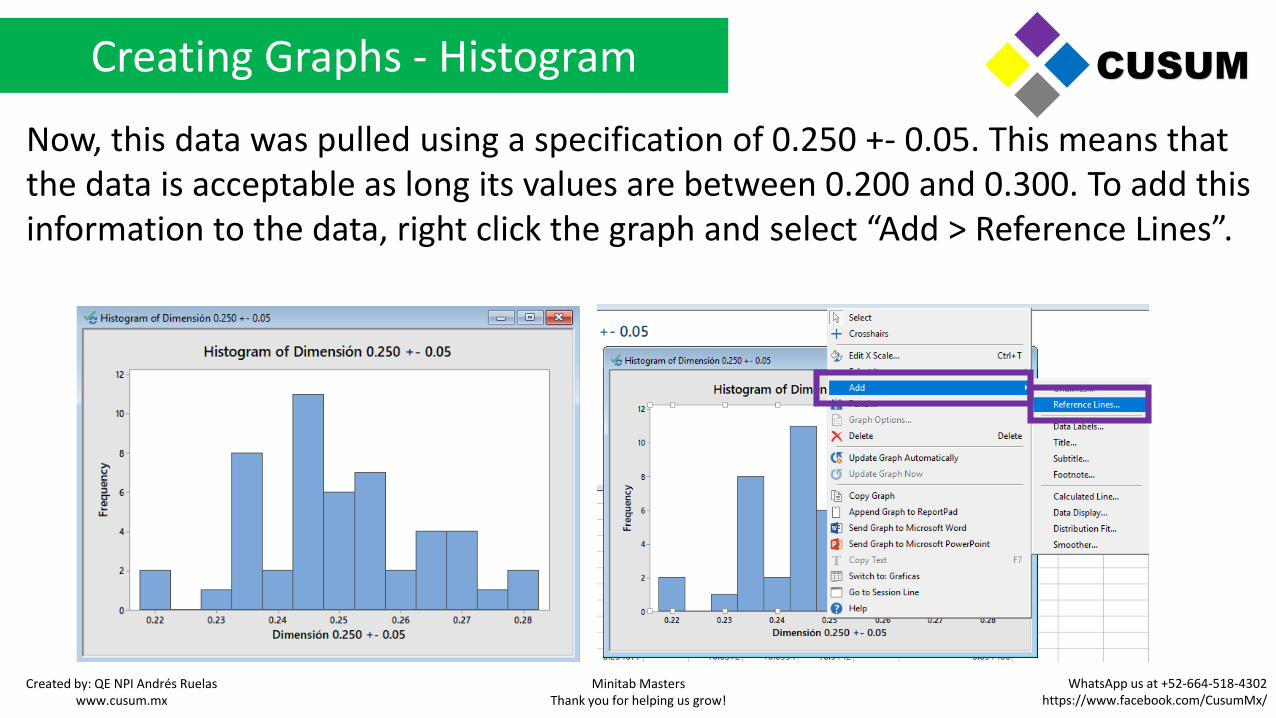
Creating Graphs - Histogram
Now, this data was pulled using a specification of 0.250 +- 0.05. This means that the data is acceptable as long its values are between 0.200 and 0.300. To add this information to the data, right click the graph and select “Add > Reference Lines”.
CUSUM
Created by: QE NPI Andrés Ruelaswww.cusum.mx
Minitab MastersThank you for helping us grow!
WhatsApp us at +52-664-518-4302https://www.facebook.com/CusumMx/
Creating Graphs - Histogram
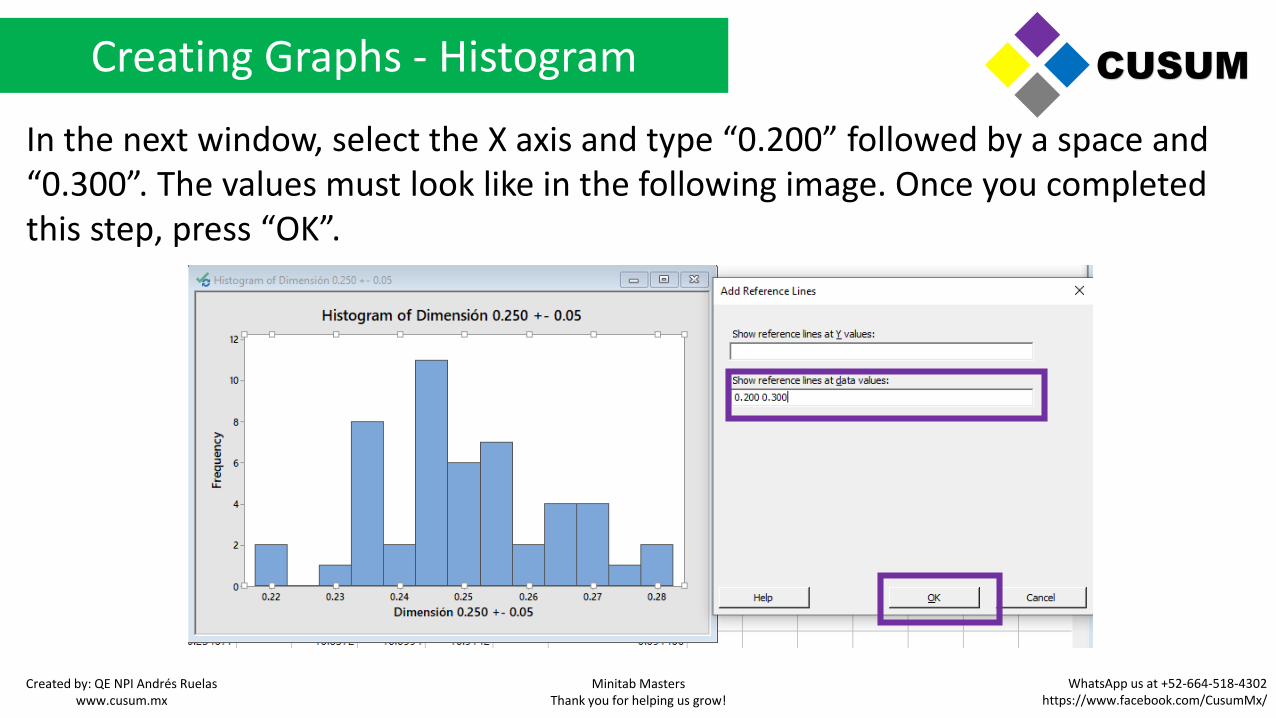
In the next window, select the X axis and type “0.200” followed by a space and “0.300”. The values must look like in the following image. Once you completed this step, press “OK”.
CUSUM
Created by: QE NPI Andrés Ruelaswww.cusum.mx
Minitab MastersThank you for helping us grow!
WhatsApp us at +52-664-518-4302https://www.facebook.com/CusumMx/
Creating Graphs - Histogram
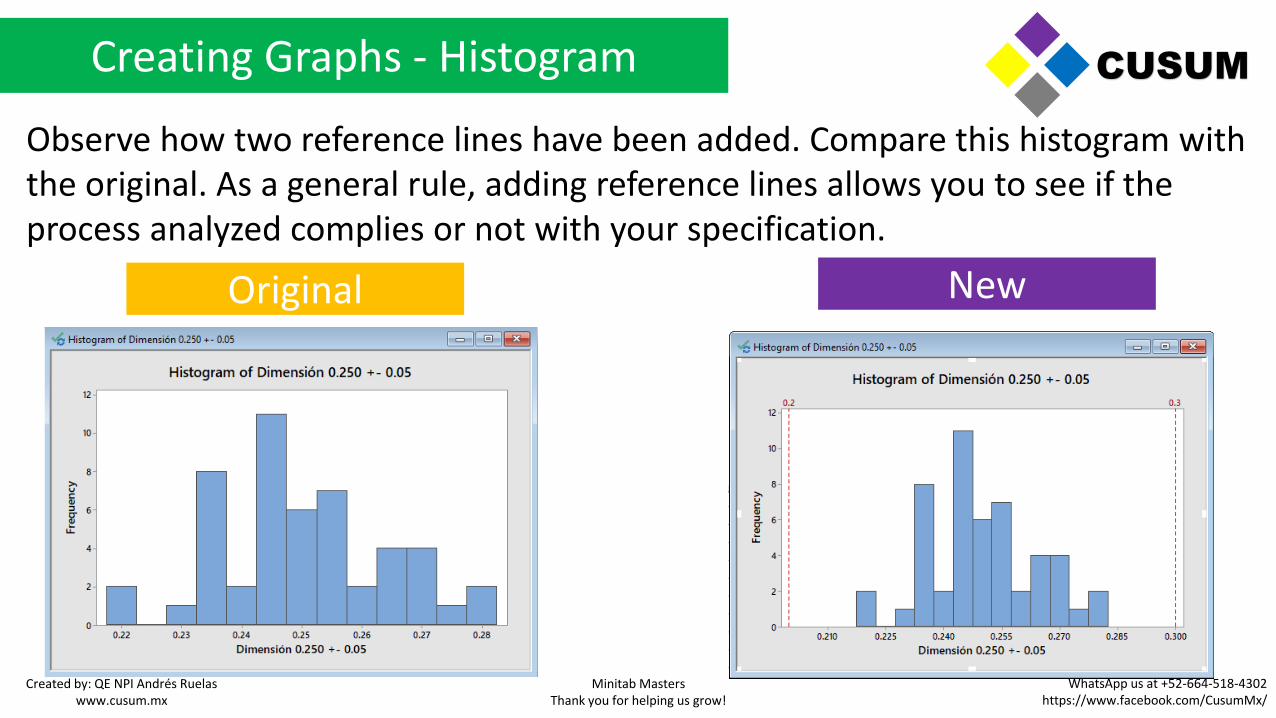
Observe how two reference lines have been added. Compare this histogram with the original. As a general rule, adding reference lines allows you to see if the process analyzed complies or not with your specification.
CUSUM
Original New
Created by: QE NPI Andrés Ruelaswww.cusum.mx
Minitab MastersThank you for helping us grow!
WhatsApp us at +52-664-518-4302https://www.facebook.com/CusumMx/
Creating Graphs - Histogram
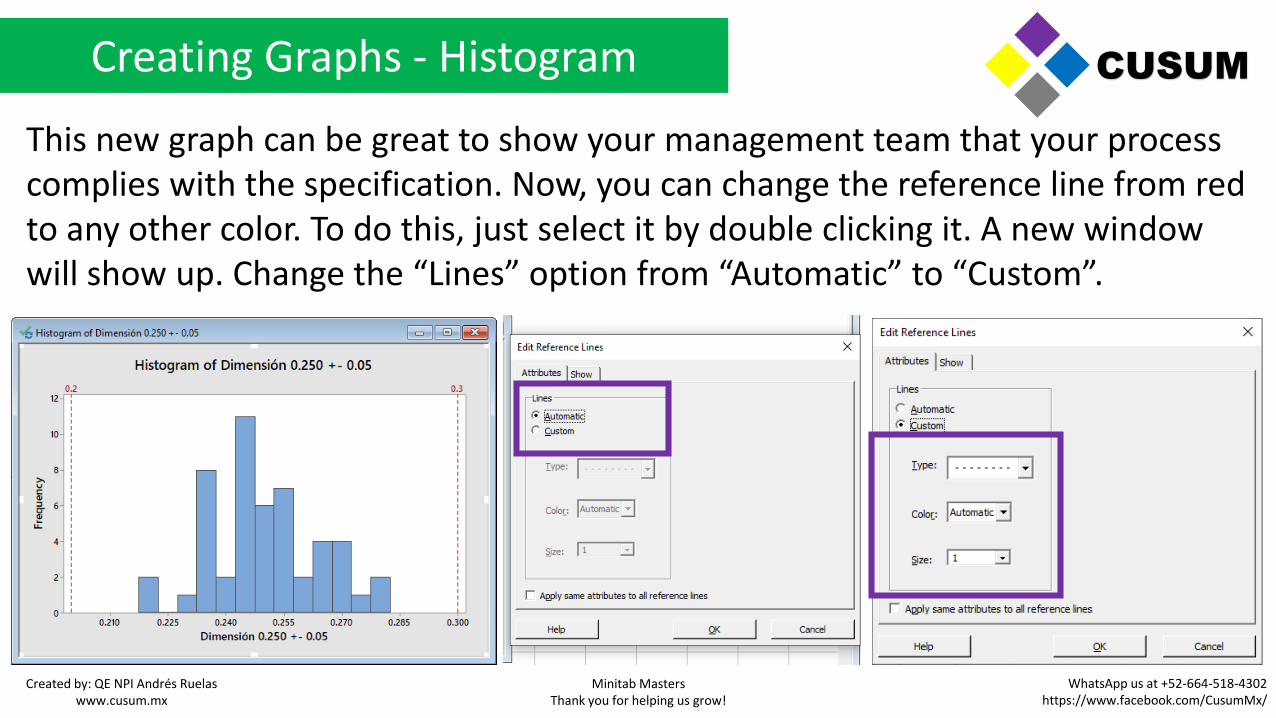
This new graph can be great to show your management team that your process complies with the specification. Now, you can change the reference line from red to any other color. To do this, just select it by double clicking it. A new window will show up. Change the “Lines” option from “Automatic” to “Custom”.
CUSUM
Created by: QE NPI Andrés Ruelaswww.cusum.mx
Minitab MastersThank you for helping us grow!
WhatsApp us at +52-664-518-4302https://www.facebook.com/CusumMx/
Creating Graphs - Histogram
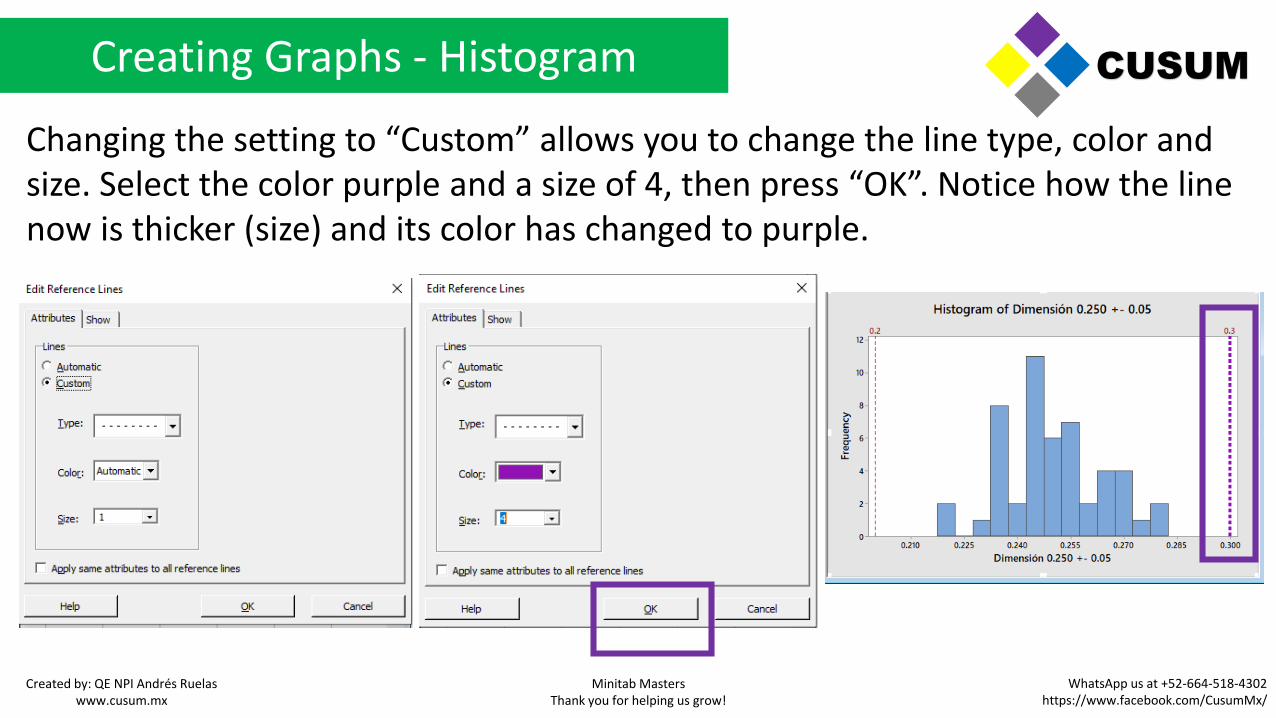
Changing the setting to “Custom” allows you to change the line type, color and size. Select the color purple and a size of 4, then press “OK”. Notice how the line now is thicker (size) and its color has changed to purple.
CUSUM
Created by: QE NPI Andrés Ruelaswww.cusum.mx
Minitab MastersThank you for helping us grow!
WhatsApp us at +52-664-518-4302https://www.facebook.com/CusumMx/
Creating Graphs - Histogram
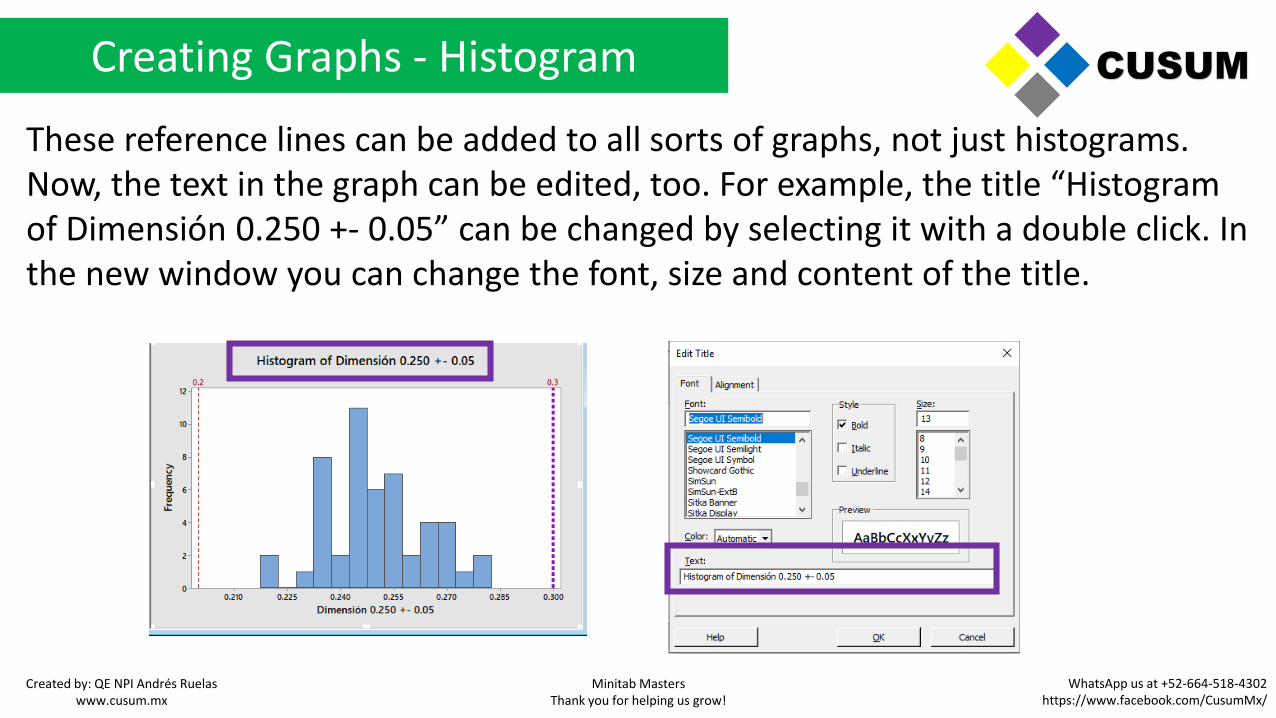
These reference lines can be added to all sorts of graphs, not just histograms. Now, the text in the graph can be edited, too. For example, the title “Histogram of Dimensión 0.250 +- 0.05” can be changed by selecting it with a double click. In the new window you can change the font, size and content of the title.
CUSUM
Created by: QE NPI Andrés Ruelaswww.cusum.mx
Minitab MastersThank you for helping us grow!
WhatsApp us at +52-664-518-4302https://www.facebook.com/CusumMx/

Creating Graphs - Histogram
Once you’re done making the necessary changes, just select “OK” and observe the result. You can repeat this process for any of the text in the graph. Just select it by double clicking it.
CUSUM
Created by: QE NPI Andrés Ruelaswww.cusum.mx
Minitab MastersThank you for helping us grow!
WhatsApp us at +52-664-518-4302https://www.facebook.com/CusumMx/
Creating Graphs - Histogram
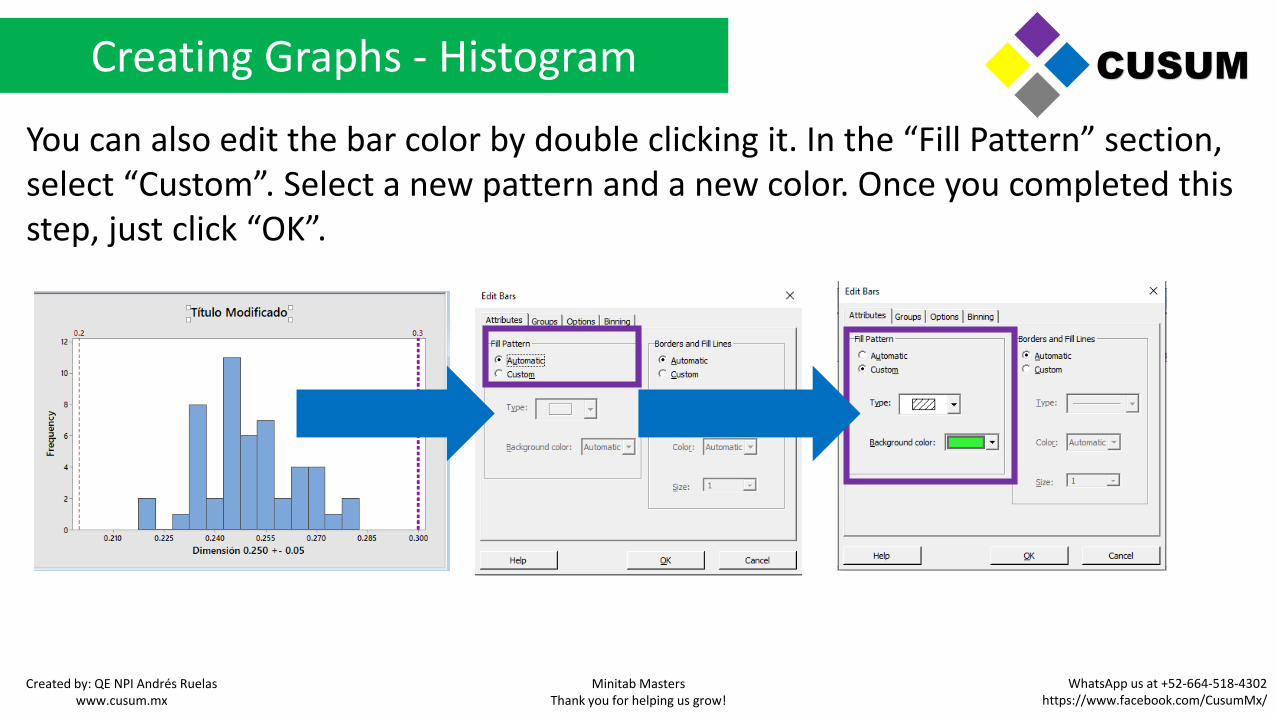
You can also edit the bar color by double clicking it. In the “Fill Pattern” section, select “Custom”. Select a new pattern and a new color. Once you completed this step, just click “OK”.
CUSUM
Created by: QE NPI Andrés Ruelaswww.cusum.mx
Minitab MastersThank you for helping us grow!
WhatsApp us at +52-664-518-4302https://www.facebook.com/CusumMx/
Creating Graphs - Histogram
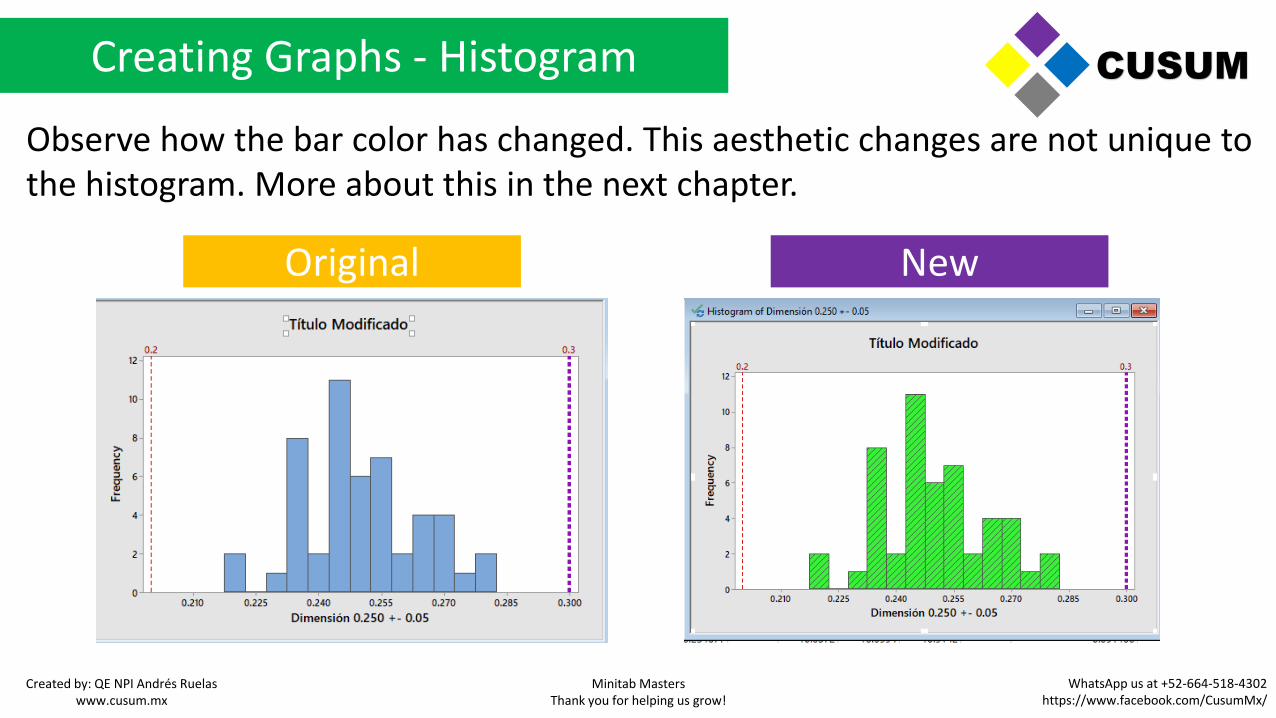
Observe how the bar color has changed. This aesthetic changes are not unique to the histogram. More about this in the next chapter.
CUSUM
Original New
Created by: QE NPI Andrés Ruelaswww.cusum.mx
Minitab MastersThank you for helping us grow!
WhatsApp us at +52-664-518-4302https://www.facebook.com/CusumMx/
Creating Graphs - Boxplots
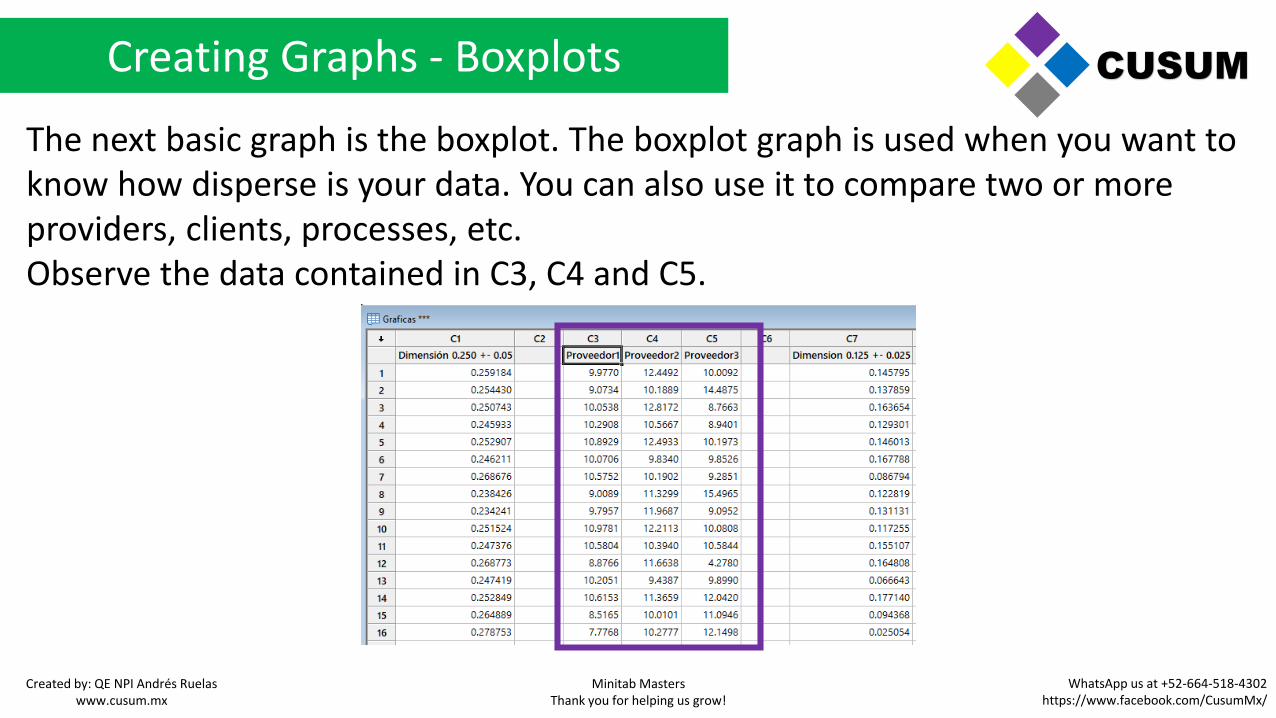
The next basic graph is the boxplot. The boxplot graph is used when you want to know how disperse is your data. You can also use it to compare two or more providers, clients, processes, etc.Observe the data contained in C3, C4 and C5.
CUSUM
Created by: QE NPI Andrés Ruelaswww.cusum.mx
Minitab MastersThank you for helping us grow!
WhatsApp us at +52-664-518-4302https://www.facebook.com/CusumMx/
Creating Graphs - Boxplots
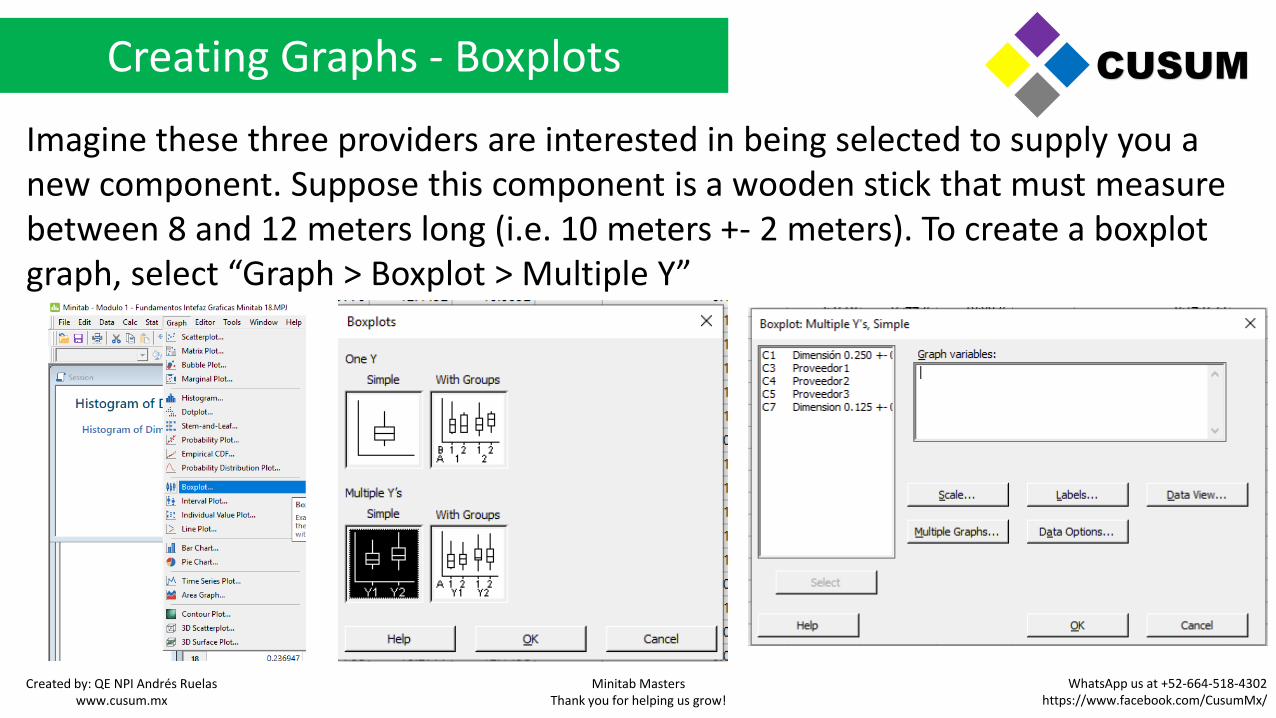
Imagine these three providers are interested in being selected to supply you a new component. Suppose this component is a wooden stick that must measure between 8 and 12 meters long (i.e. 10 meters +- 2 meters). To create a boxplot graph, select “Graph > Boxplot > Multiple Y”
CUSUM
Created by: QE NPI Andrés Ruelaswww.cusum.mx
Minitab MastersThank you for helping us grow!
WhatsApp us at +52-664-518-4302https://www.facebook.com/CusumMx/
Creating Graphs - Boxplots
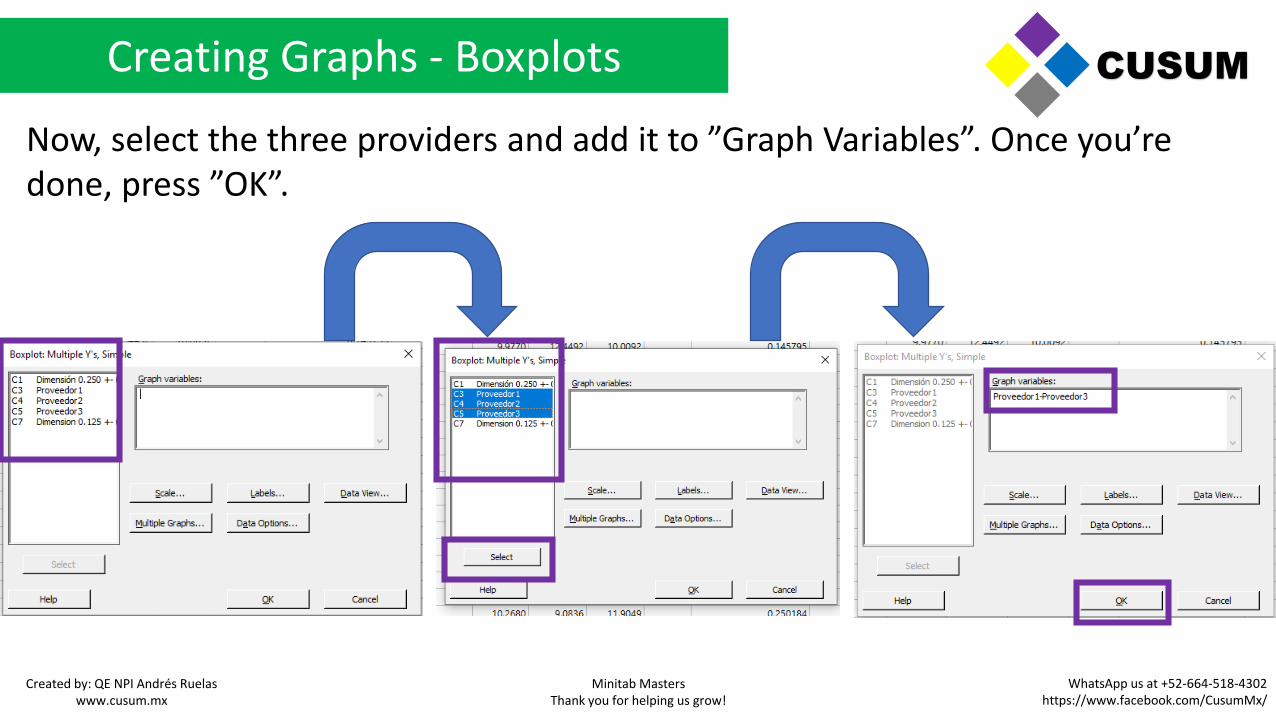
Now, select the three providers and add it to ”Graph Variables”. Once you’redone, press ”OK”.
CUSUM
Created by: QE NPI Andrés Ruelaswww.cusum.mx
Minitab MastersThank you for helping us grow!
WhatsApp us at +52-664-518-4302https://www.facebook.com/CusumMx/
Creating Graphs - Boxplots
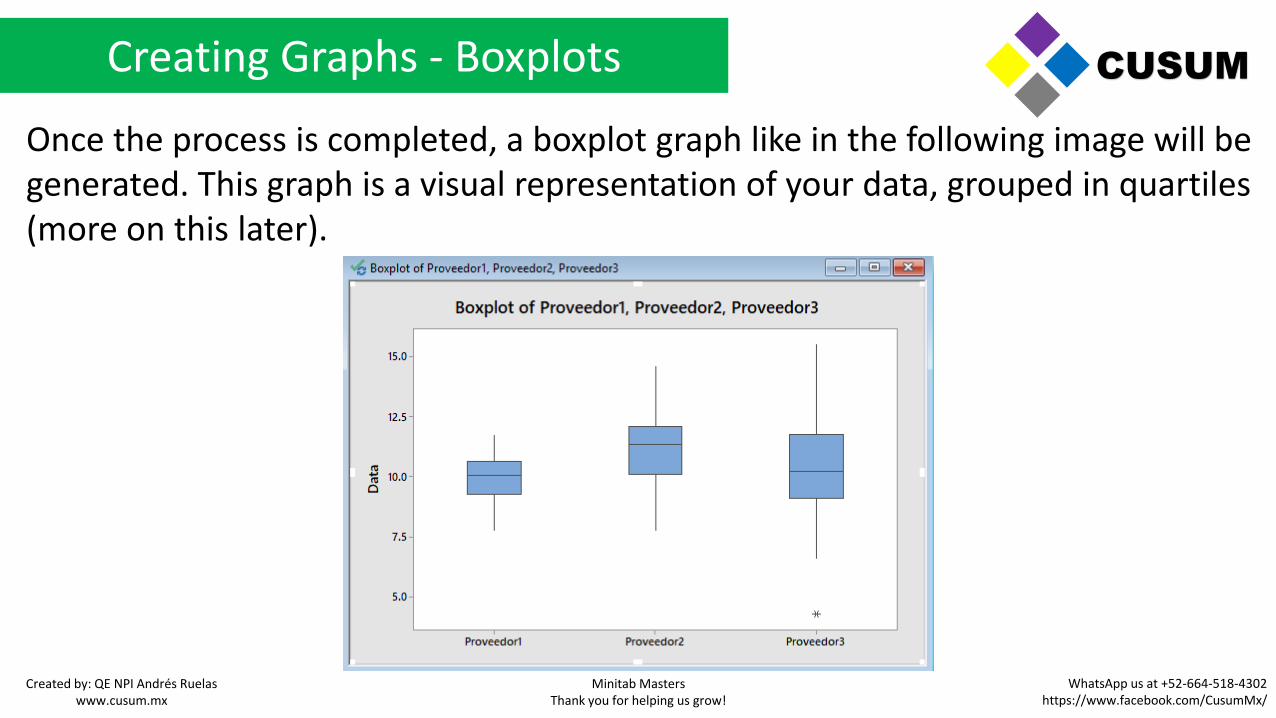
Once the process is completed, a boxplot graph like in the following image will be generated. This graph is a visual representation of your data, grouped in quartiles (more on this later).
CUSUM
Created by: QE NPI Andrés Ruelaswww.cusum.mx
Minitab MastersThank you for helping us grow!
WhatsApp us at +52-664-518-4302https://www.facebook.com/CusumMx/
Creating Graphs - Boxplots
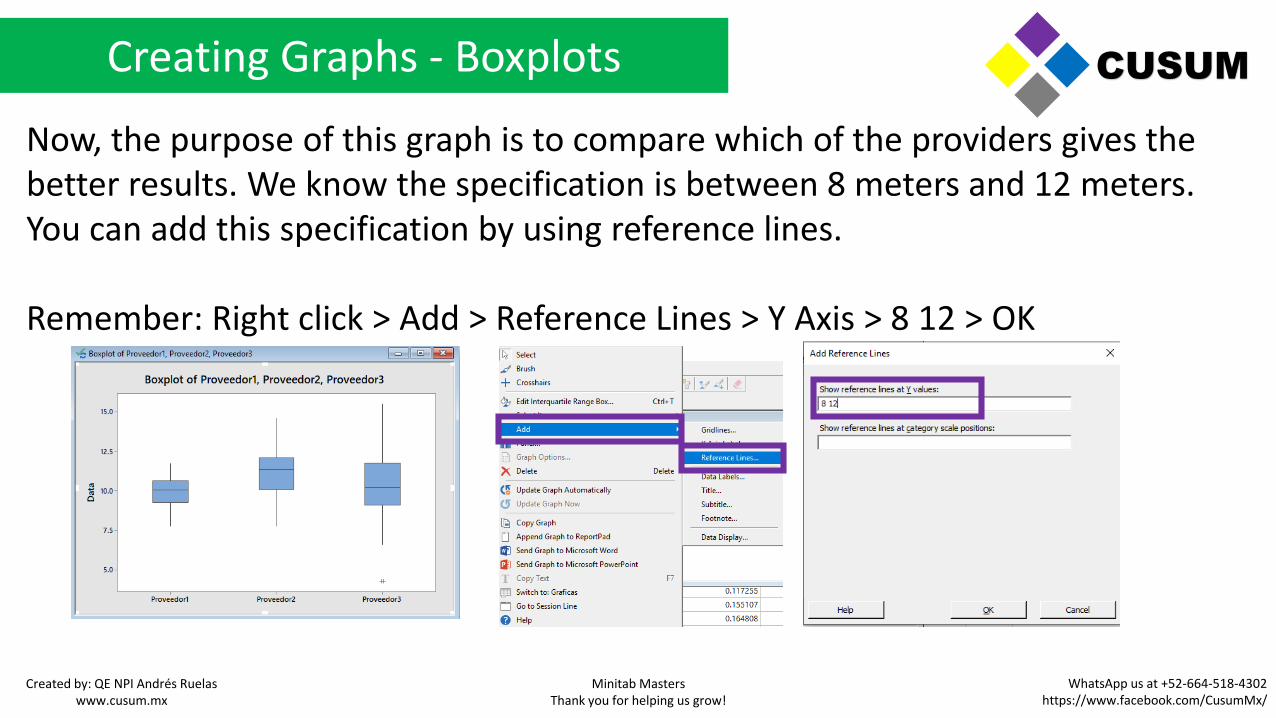
Now, the purpose of this graph is to compare which of the providers gives the better results. We know the specification is between 8 meters and 12 meters. You can add this specification by using reference lines.
Remember: Right click > Add > Reference Lines > Y Axis > 8 12 > OK
CUSUM
Created by: QE NPI Andrés Ruelaswww.cusum.mx
Minitab MastersThank you for helping us grow!
WhatsApp us at +52-664-518-4302https://www.facebook.com/CusumMx/

Creating Graphs - Boxplots
Observe how the reference lines quickly show how the provider “Proveedor 2” and “Proveedor 3” exceed the specification limits whereas the provider “Proveedor 1” supplies most of its product within this specification, with a little portion touching the lower limit.
CUSUM
Created by: QE NPI Andrés Ruelaswww.cusum.mx
Minitab MastersThank you for helping us grow!
WhatsApp us at +52-664-518-4302https://www.facebook.com/CusumMx/
Creating Graphs - Boxplots
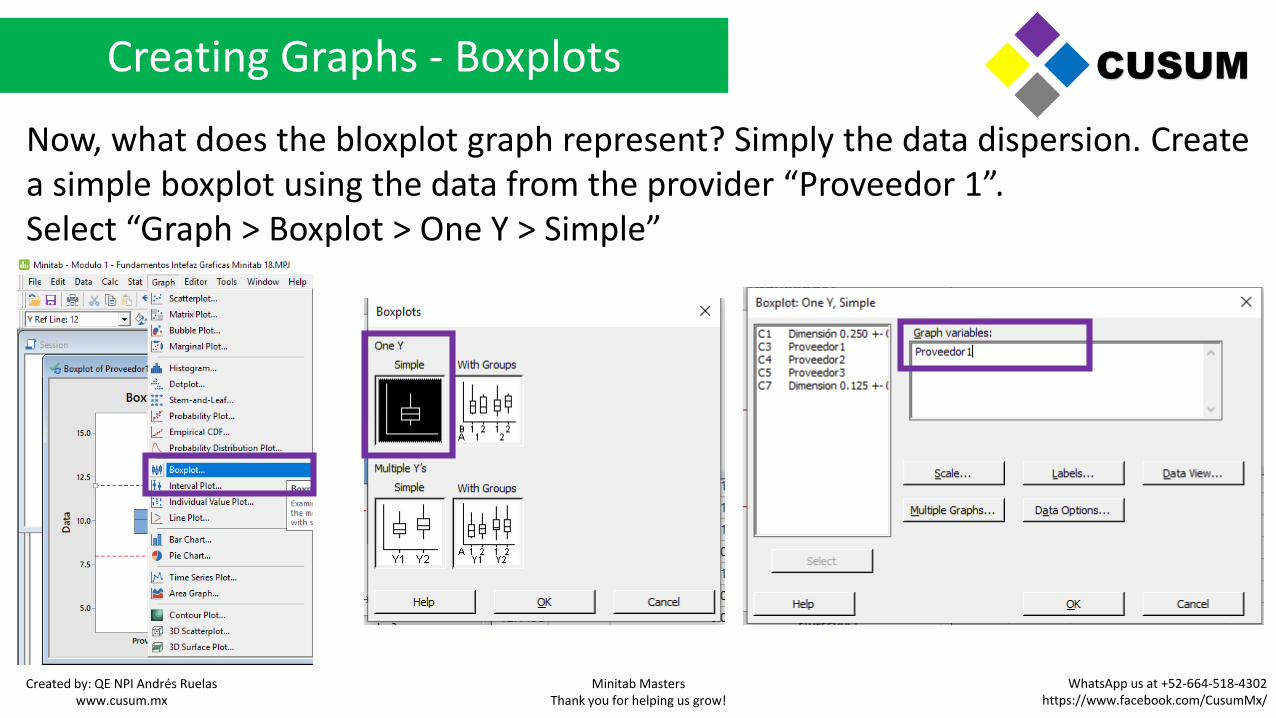
Now, what does the bloxplot graph represent? Simply the data dispersion. Create a simple boxplot using the data from the provider “Proveedor 1”.Select “Graph > Boxplot > One Y > Simple”
CUSUM
Created by: QE NPI Andrés Ruelaswww.cusum.mx
Minitab MastersThank you for helping us grow!
WhatsApp us at +52-664-518-4302https://www.facebook.com/CusumMx/
Creating Graphs - Boxplots
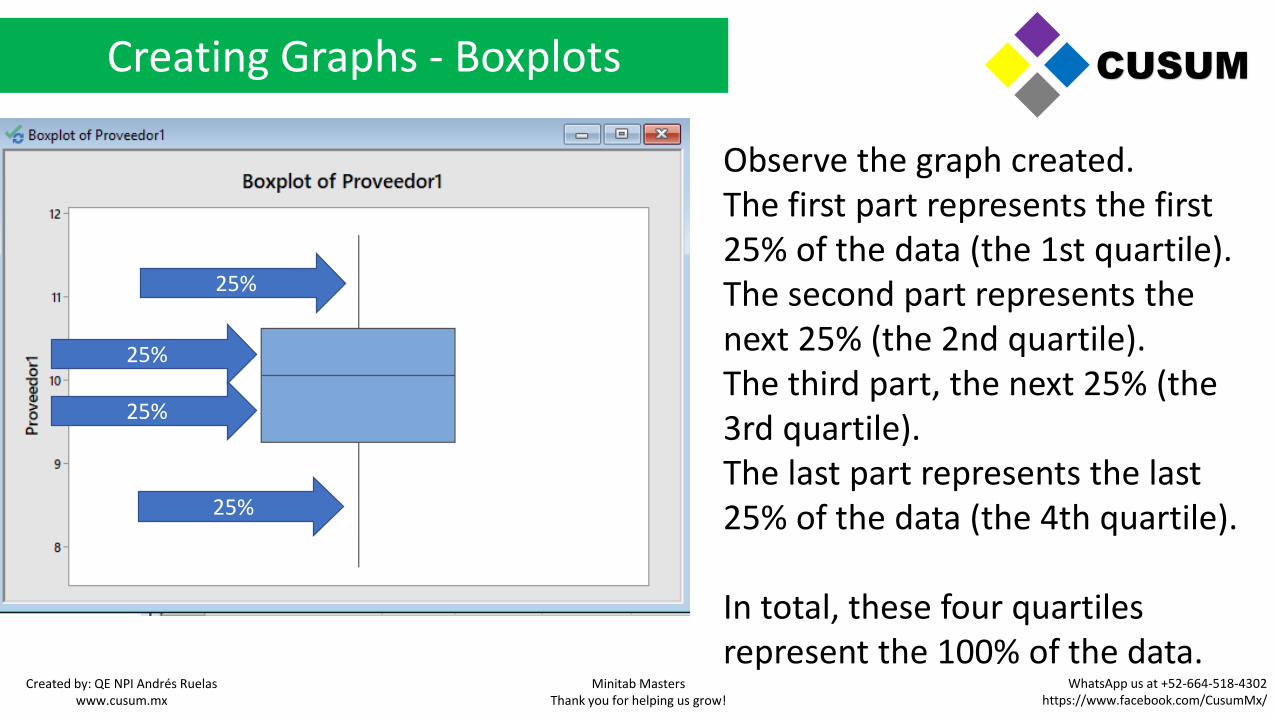
Observe the graph created. The first part represents the first 25% of the data (the 1st quartile). The second part represents the next 25% (the 2nd quartile).The third part, the next 25% (the 3rd quartile).The last part represents the last 25% of the data (the 4th quartile).
In total, these four quartiles represent the 100% of the data.
CUSUM
25%
25%
25%
25%
Created by: QE NPI Andrés Ruelaswww.cusum.mx
Minitab MastersThank you for helping us grow!
WhatsApp us at +52-664-518-4302https://www.facebook.com/CusumMx/
Creating Graphs - Boxplots
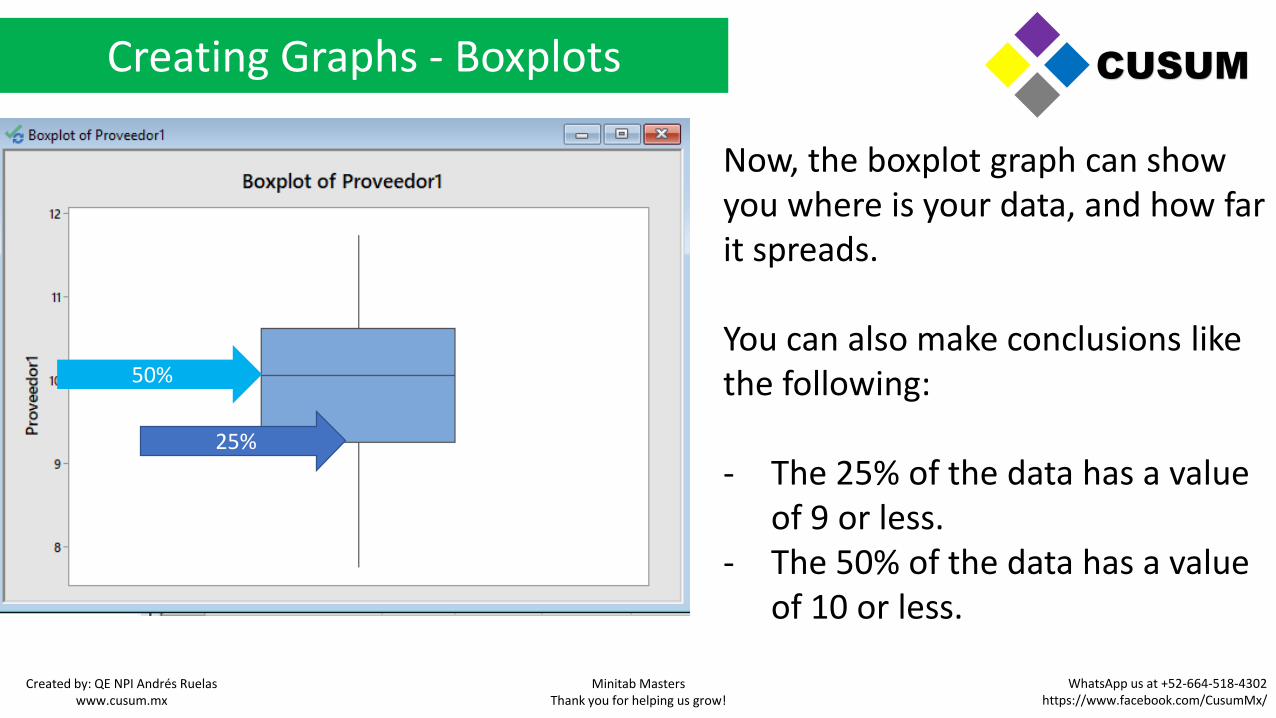
Now, the boxplot graph can show you where is your data, and how far it spreads.
You can also make conclusions like the following:
- The 25% of the data has a value of 9 or less.
- The 50% of the data has a value of 10 or less.
CUSUM
25%
50%
Created by: QE NPI Andrés Ruelaswww.cusum.mx
Minitab MastersThank you for helping us grow!
WhatsApp us at +52-664-518-4302https://www.facebook.com/CusumMx/
Creating Graphs – Individual Value Plot
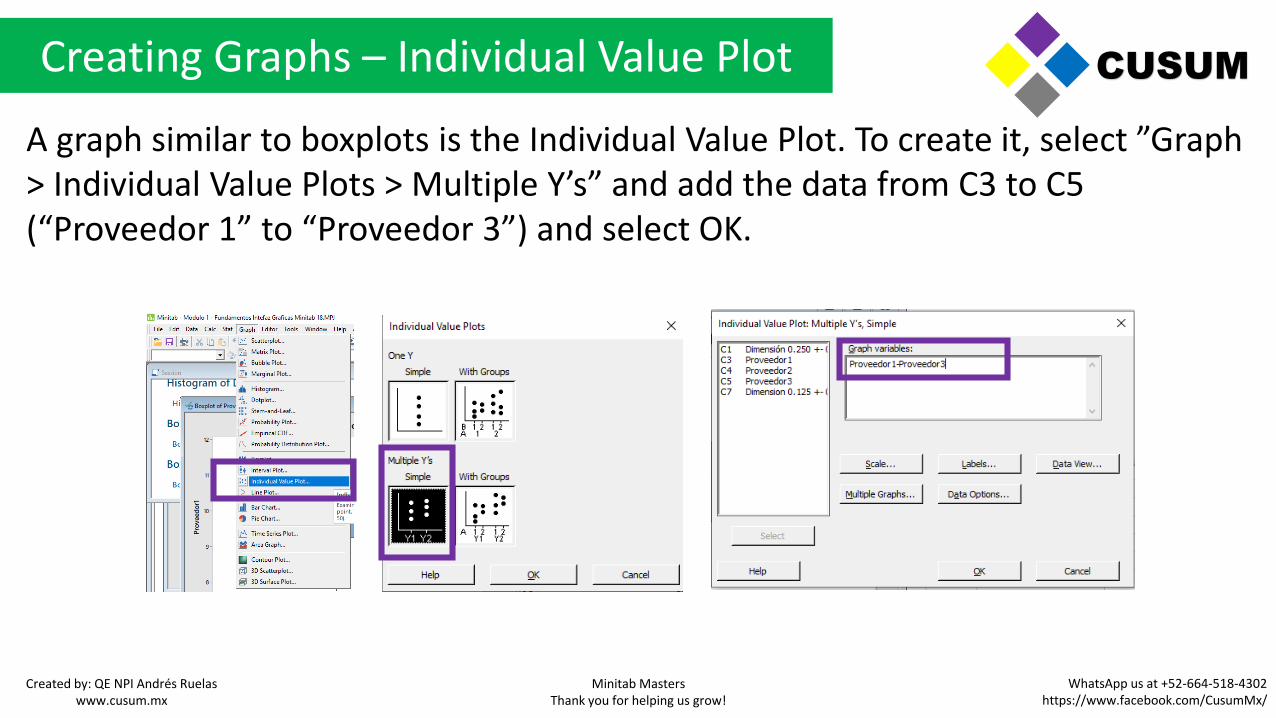
A graph similar to boxplots is the Individual Value Plot. To create it, select ”Graph > Individual Value Plots > Multiple Y’s” and add the data from C3 to C5 (“Proveedor 1” to “Proveedor 3”) and select OK.
CUSUM
Created by: QE NPI Andrés Ruelaswww.cusum.mx
Minitab MastersThank you for helping us grow!
WhatsApp us at +52-664-518-4302https://www.facebook.com/CusumMx/
Creating Graphs – Individual Value Plot
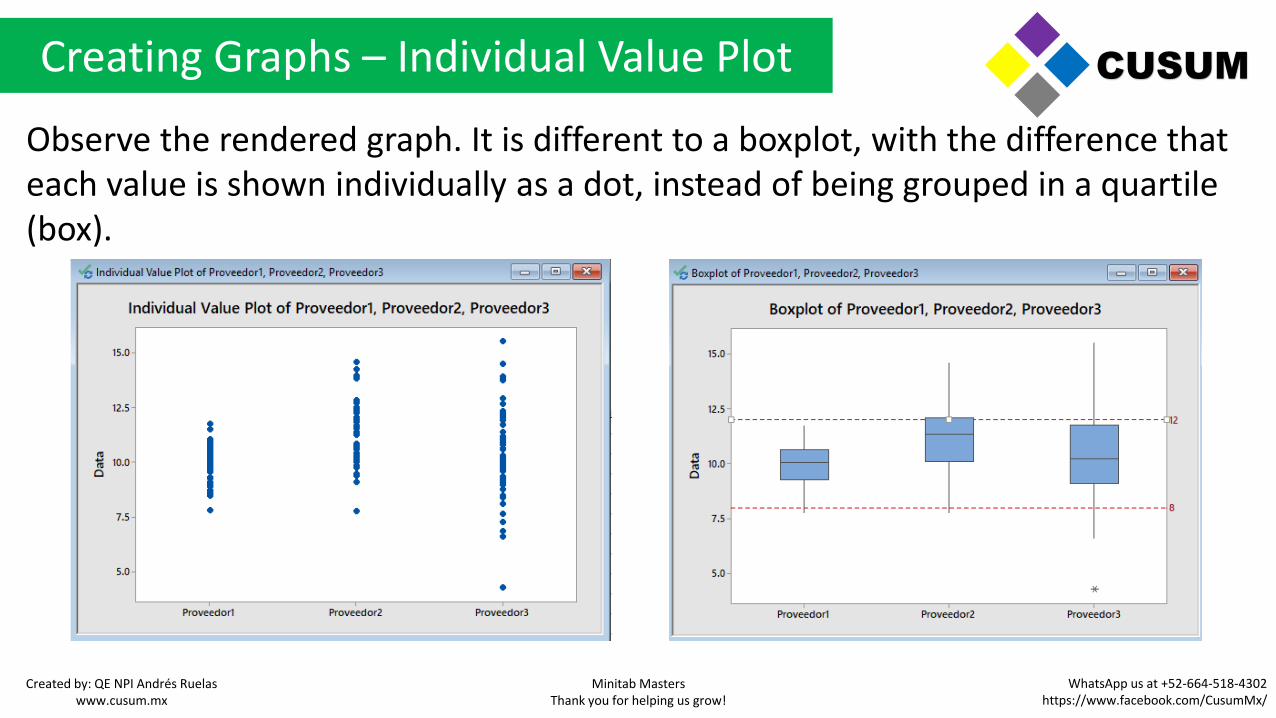
Observe the rendered graph. It is different to a boxplot, with the difference that each value is shown individually as a dot, instead of being grouped in a quartile (box).
CUSUM
Created by: QE NPI Andrés Ruelaswww.cusum.mx
Minitab MastersThank you for helping us grow!
WhatsApp us at +52-664-518-4302https://www.facebook.com/CusumMx/
Creating Graphs – Individual Value Plot
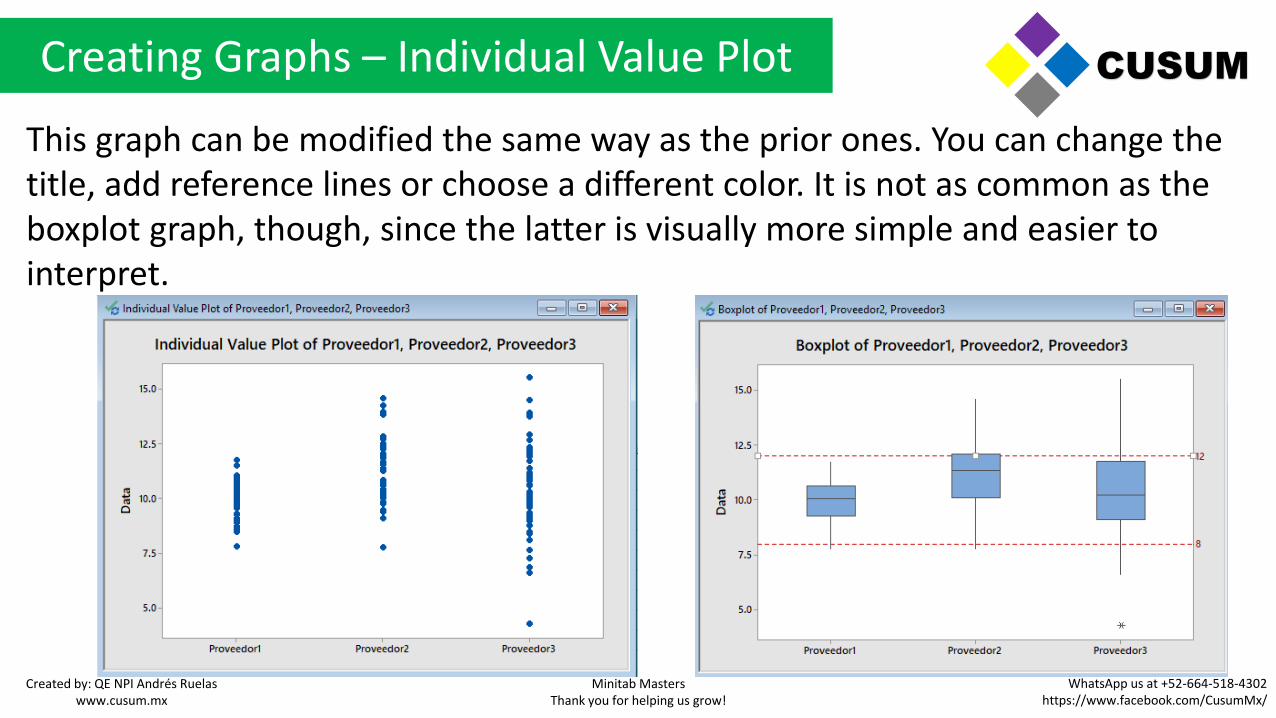
This graph can be modified the same way as the prior ones. You can change the title, add reference lines or choose a different color. It is not as common as the boxplot graph, though, since the latter is visually more simple and easier to interpret.
CUSUM
Created by: QE NPI Andrés Ruelaswww.cusum.mx
Minitab MastersThank you for helping us grow!
WhatsApp us at +52-664-518-4302https://www.facebook.com/CusumMx/
Creating Graphs – Dot Plot
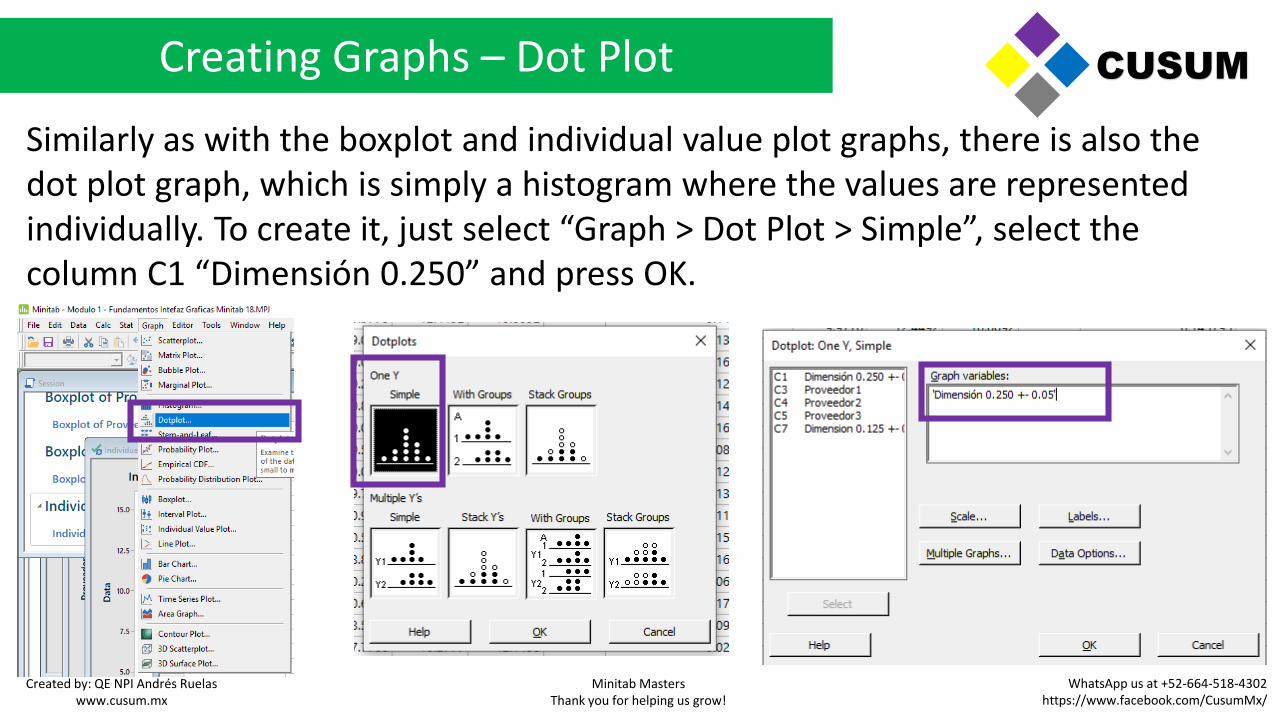
Similarly as with the boxplot and individual value plot graphs, there is also the dot plot graph, which is simply a histogram where the values are represented individually. To create it, just select “Graph > Dot Plot > Simple”, select the column C1 “Dimensión 0.250” and press OK.
CUSUM
Created by: QE NPI Andrés Ruelaswww.cusum.mx
Minitab MastersThank you for helping us grow!
WhatsApp us at +52-664-518-4302https://www.facebook.com/CusumMx/
Creating Graphs – Dot Plot
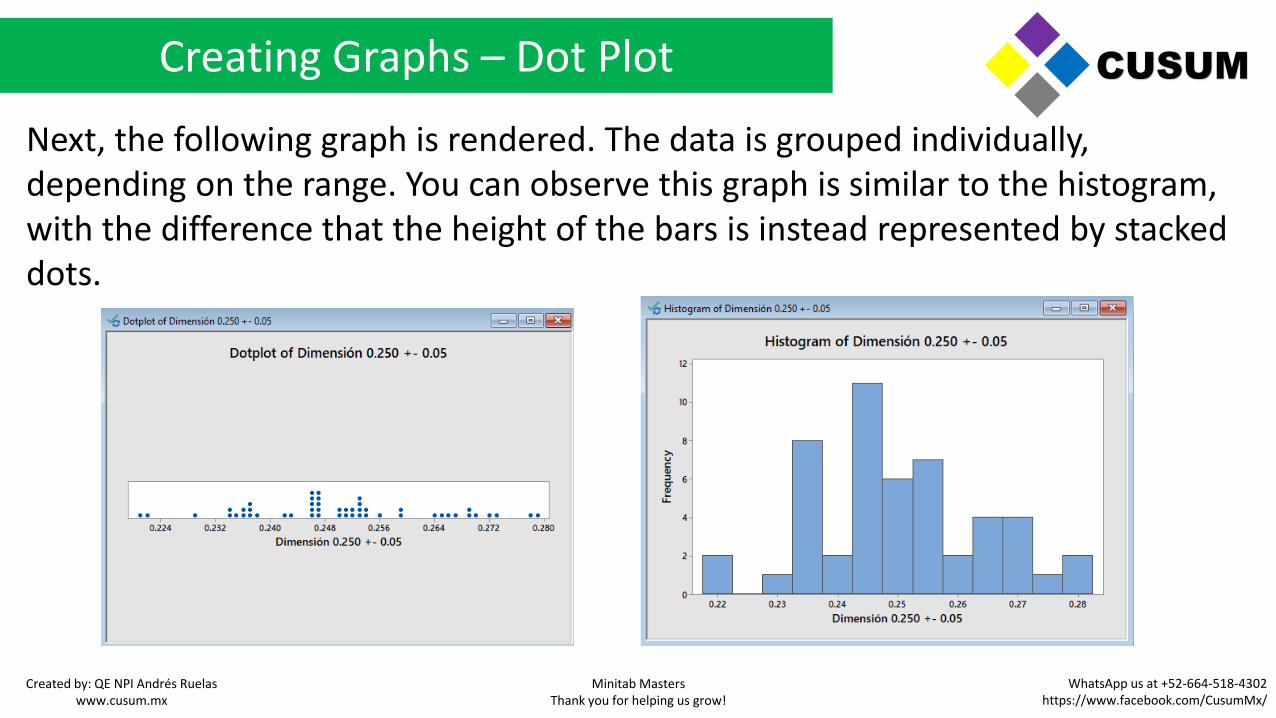
Next, the following graph is rendered. The data is grouped individually, depending on the range. You can observe this graph is similar to the histogram, with the difference that the height of the bars is instead represented by stacked dots.
CUSUM
Created by: QE NPI Andrés Ruelaswww.cusum.mx
Minitab MastersThank you for helping us grow!
WhatsApp us at +52-664-518-4302https://www.facebook.com/CusumMx/
Basic Data Analysis
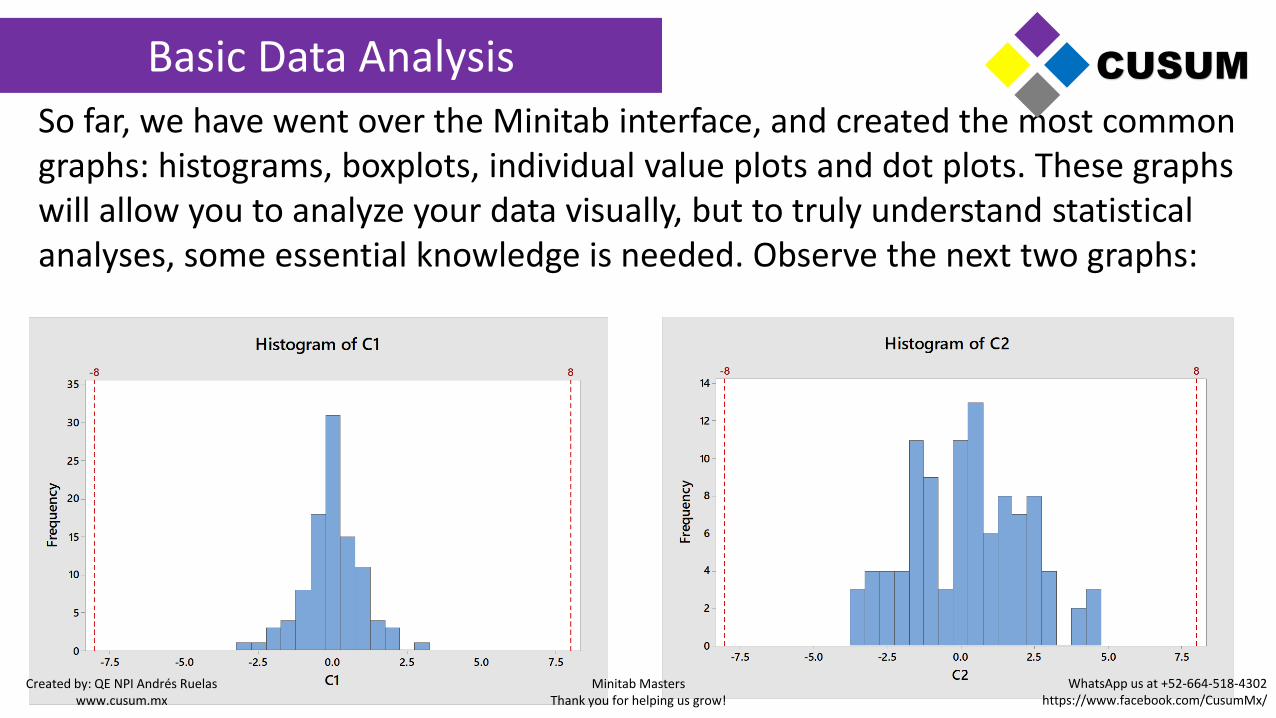
So far, we have went over the Minitab interface, and created the most common graphs: histograms, boxplots, individual value plots and dot plots. These graphs will allow you to analyze your data visually, but to truly understand statistical analyses, some essential knowledge is needed. Observe the next two graphs:
CUSUM
Created by: QE NPI Andrés Ruelaswww.cusum.mx
Minitab MastersThank you for helping us grow!
WhatsApp us at +52-664-518-4302https://www.facebook.com/CusumMx/
Basic Data Analysis
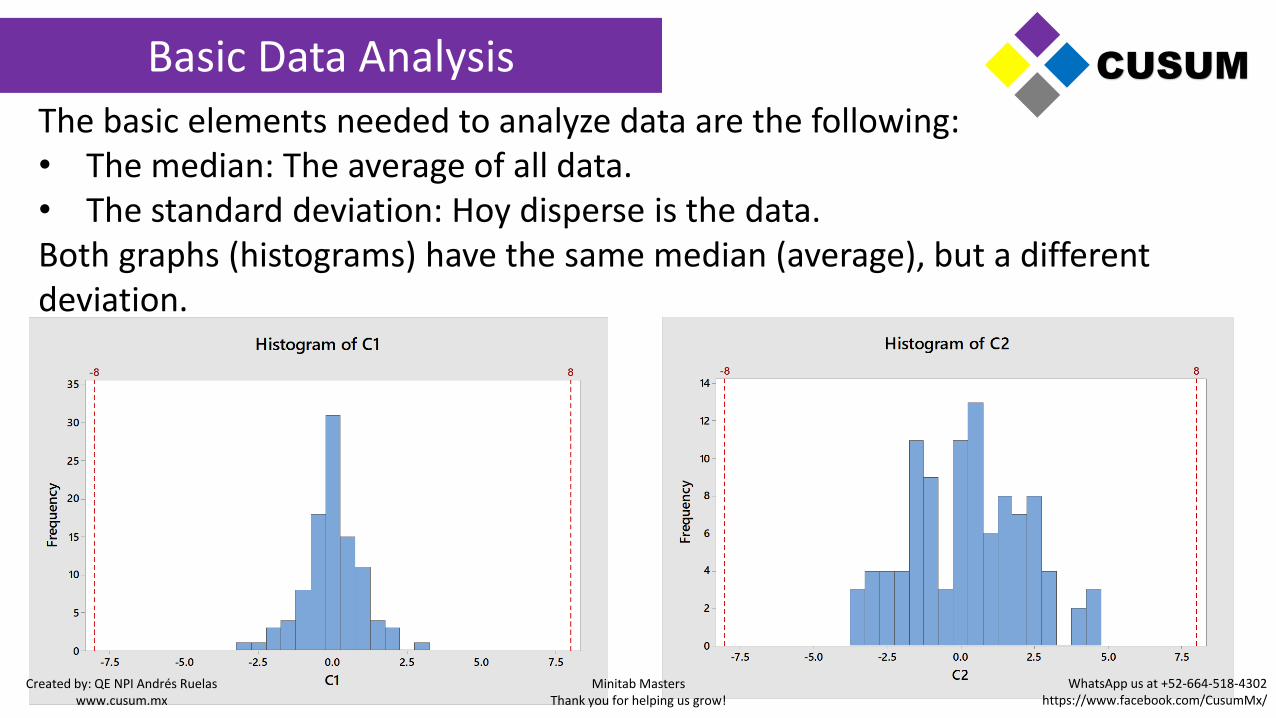
The basic elements needed to analyze data are the following:• The median: The average of all data.• The standard deviation: Hoy disperse is the data.Both graphs (histograms) have the same median (average), but a different deviation.
CUSUM
Created by: QE NPI Andrés Ruelaswww.cusum.mx
Minitab MastersThank you for helping us grow!
WhatsApp us at +52-664-518-4302https://www.facebook.com/CusumMx/
The Importance of the Deviation
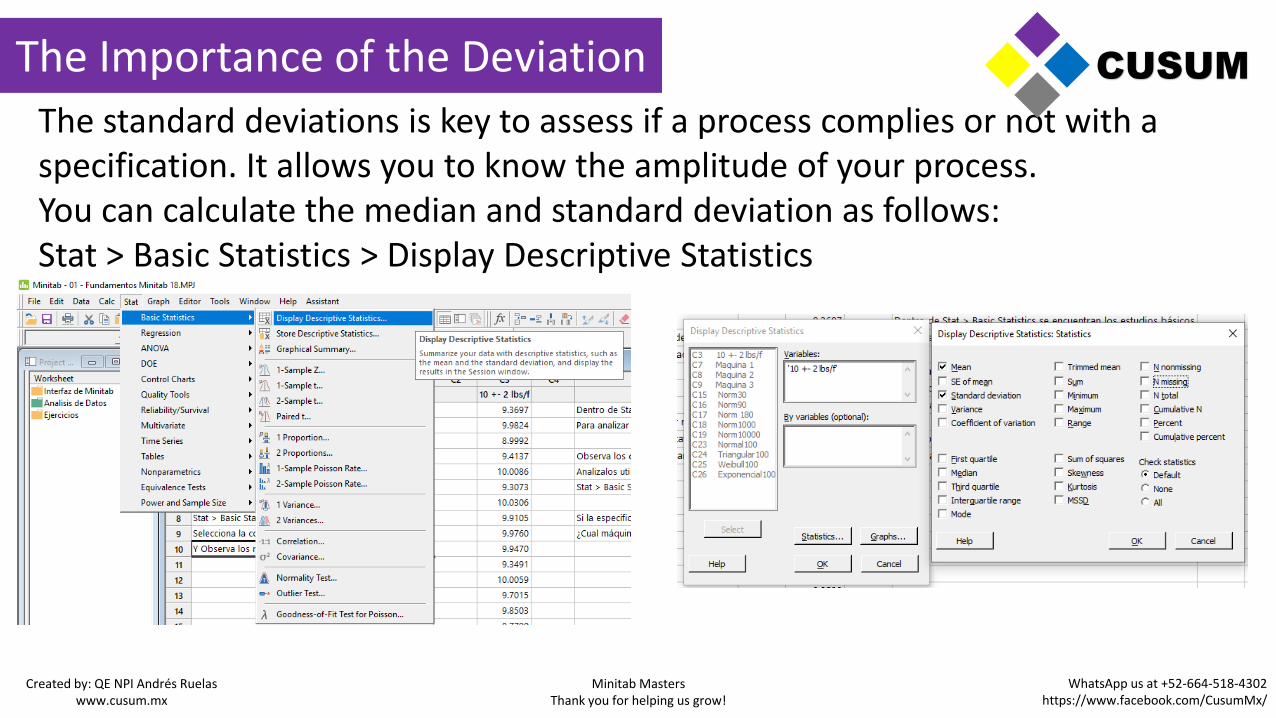
The standard deviations is key to assess if a process complies or not with a specification. It allows you to know the amplitude of your process.You can calculate the median and standard deviation as follows:Stat > Basic Statistics > Display Descriptive Statistics
CUSUM
Created by: QE NPI Andrés Ruelaswww.cusum.mx
Minitab MastersThank you for helping us grow!
WhatsApp us at +52-664-518-4302https://www.facebook.com/CusumMx/

The Importance of the Deviation
By clicking OK, the session window will display the requested information about the process.
CUSUM
Created by: QE NPI Andrés Ruelaswww.cusum.mx
Minitab MastersThank you for helping us grow!
WhatsApp us at +52-664-518-4302https://www.facebook.com/CusumMx/

The Importance of the Deviation
The standard deviation is used to know the breadth of data that follows a normal distribution. Commonly, it is said that the median +- 3 σ (standard deviations) groups almost all of the data.
0.4
0.3
0.2
0.1
0.0
X
Den
sity
-1 10
0.6827
Distribution PlotNormal, Mean=0, StDev=1
0.4
0.3
0.2
0.1
0.0
X
Den
sity
-2 20
0.9545
Distribution PlotNormal, Mean=0, StDev=1
0.4
0.3
0.2
0.1
0.0
X
Den
sity
-3 30
0.9973
Distribution PlotNormal, Mean=0, StDev=1
Median +- 1 deviation = 68.27% of the data
Median +- 2 deviations= 95.45% of the data
Median +- 3 deviations = 99.73% of the data
CUSUM
Created by: QE NPI Andrés Ruelaswww.cusum.mx
Minitab MastersThank you for helping us grow!
WhatsApp us at +52-664-518-4302https://www.facebook.com/CusumMx/
Probability Distribution Plots
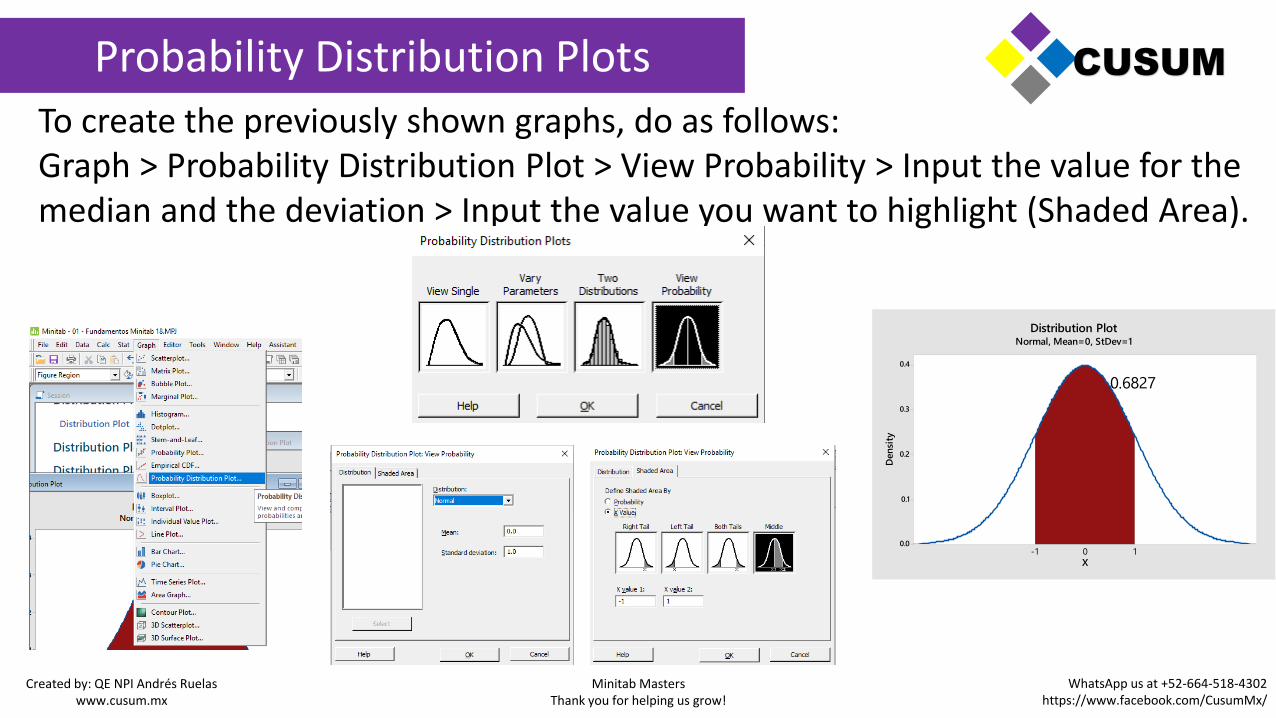
To create the previously shown graphs, do as follows:Graph > Probability Distribution Plot > View Probability > Input the value for the median and the deviation > Input the value you want to highlight (Shaded Area).
0.4
0.3
0.2
0.1
0.0
X
Den
sity
-1 10
0.6827
Distribution PlotNormal, Mean=0, StDev=1
CUSUM
Created by: QE NPI Andrés Ruelaswww.cusum.mx
Minitab MastersThank you for helping us grow!
WhatsApp us at +52-664-518-4302https://www.facebook.com/CusumMx/
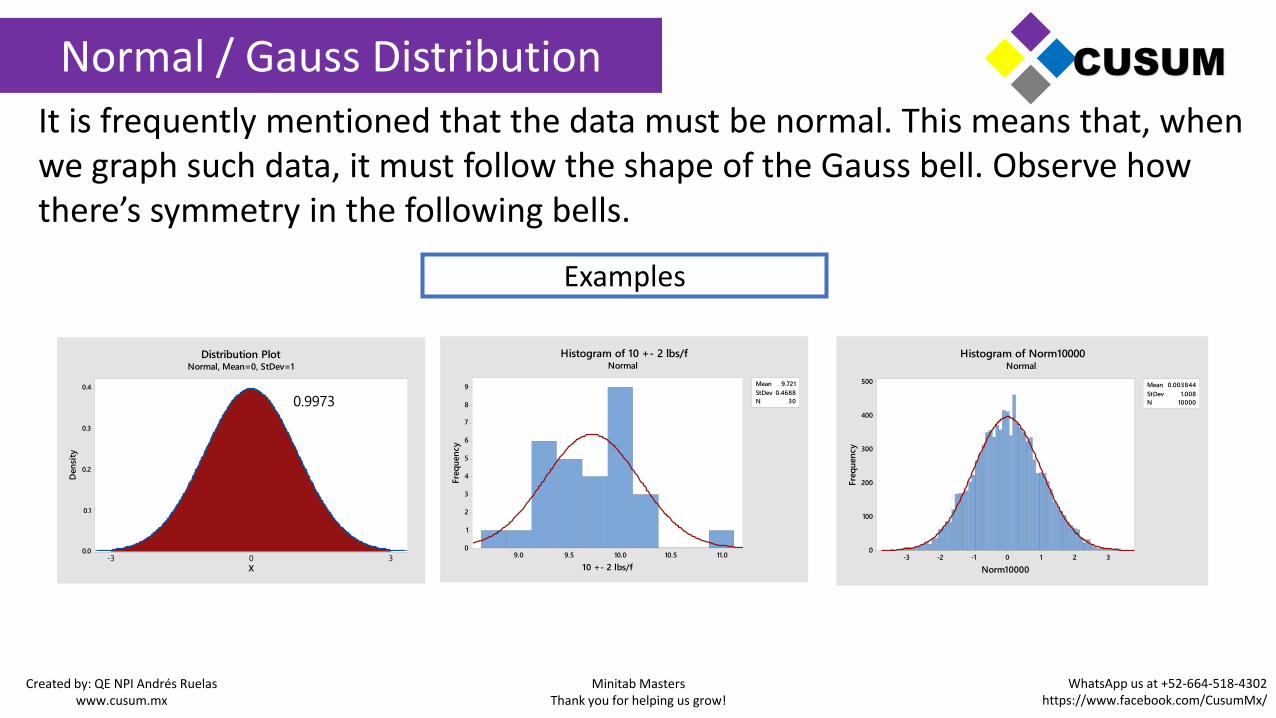
Normal / Gauss Distribution
It is frequently mentioned that the data must be normal. This means that, when we graph such data, it must follow the shape of the Gauss bell. Observe how there’s symmetry in the following bells.
0.4
0.3
0.2
0.1
0.0
X
Den
sity
-3 30
0.9973
Distribution PlotNormal, Mean=0, StDev=1
Examples
11.010.510.09.59.0
9
8
7
6
5
4
3
2
1
0
Mean 9.721
StDev 0.4688
N 30
10 +- 2 lbs/f
Fre
qu
en
cy
Histogram of 10 +- 2 lbs/fNormal
3210-1-2-3
500
400
300
200
100
0
Mean 0.003844
StDev 1.008
N 10000
Norm10000
Fre
qu
en
cy
Histogram of Norm10000Normal
CUSUM
Created by: QE NPI Andrés Ruelaswww.cusum.mx
Minitab MastersThank you for helping us grow!
WhatsApp us at +52-664-518-4302https://www.facebook.com/CusumMx/

Normal / Gauss Distribution
Normal data follows the shape of a bell, regardless the value of the standard deviation, or the median. To demonstrate this, select: Graph > Probability Distribution Plot > Vary Parameters > Select Normal > Valor Media = 0, Standard deviation = 1, 2
CUSUM
Created by: QE NPI Andrés Ruelaswww.cusum.mx
Minitab MastersThank you for helping us grow!
WhatsApp us at +52-664-518-4302https://www.facebook.com/CusumMx/

Normal / Gauss Distribution
By selecting OK, the following graph will be created. Notice how the blue curve is slimmer than the red curve. This means that the red curve (standard deviation of 2) is more disperse than the blue on (standard deviation of 1). In conclusion, standard deviation is a value that tells us how disperse is the data. Your data will be less disperse when most of the values are similar (e.g. 1.1, 1.2, 1.1) and will be more disperse when your values are very different (e.g. 1, 5, 25).
CUSUM
Created by: QE NPI Andrés Ruelaswww.cusum.mx
Minitab MastersThank you for helping us grow!
WhatsApp us at +52-664-518-4302https://www.facebook.com/CusumMx/

Normal / Gauss Distribution
We have created additional normal distribution graphs, so you can observe how, as the standard deviation is smaller, the data is more grouped together (the median being 0).
CUSUM
Created by: QE NPI Andrés Ruelaswww.cusum.mx
Minitab MastersThank you for helping us grow!
WhatsApp us at +52-664-518-4302https://www.facebook.com/CusumMx/

CUSUM
Module 1. Minitab basics
Presented by: QE NPI Andrés Ruelas
Created by: QE NPI Andrés Ruelaswww.cusum.mx
Minitab MastersThank you for helping us grow!
WhatsApp us at +52-664-518-4302https://www.facebook.com/CusumMx/
Related Documents


